trademarks' relatedness to product and service innovation_ a
TRANSCRIPT
VU Research Portal
Trademarks’ relatedness to product and service innovation
Flikkema, Meindert; Castaldi, Carolina; de Man, Ard Pieter; Seip, Marcel
published inResearch Policy2019
DOI (link to publisher)10.1016/j.respol.2019.01.018
document versionPublisher's PDF, also known as Version of record
document licenseArticle 25fa Dutch Copyright Act
Link to publication in VU Research Portal
citation for published version (APA)Flikkema, M., Castaldi, C., de Man, A. P., & Seip, M. (2019). Trademarks’ relatedness to product and serviceinnovation: A branding strategy approach. Research Policy, 48(6), 1340-1353.https://doi.org/10.1016/j.respol.2019.01.018
General rightsCopyright and moral rights for the publications made accessible in the public portal are retained by the authors and/or other copyright ownersand it is a condition of accessing publications that users recognise and abide by the legal requirements associated with these rights.
• Users may download and print one copy of any publication from the public portal for the purpose of private study or research. • You may not further distribute the material or use it for any profit-making activity or commercial gain • You may freely distribute the URL identifying the publication in the public portal ?
Take down policyIf you believe that this document breaches copyright please contact us providing details, and we will remove access to the work immediatelyand investigate your claim.
E-mail address:[email protected]
Download date: 20. Apr. 2022
Contents lists available at ScienceDirect
Research Policy
journal homepage: www.elsevier.com/locate/respol
Trademarks’ relatedness to product and service innovation: A brandingstrategy approachMeindert Flikkemaa,⁎, Carolina Castaldib, Ard-Pieter de Mana, Marcel Seipa,c
a Vrije Universiteit Amsterdam, School of Business & Economics, Department of Management & Organization, the Netherlandsb Eindhoven University of Technology, Department of Industrial Engineering & Innovation Sciences, the Netherlandsc Rijksdienst voor Ondernemend Nederland (RVO.nl), The Hague, the Netherlands
A R T I C L E I N F O
JEL classifications:O34O39
Keywords:TrademarksInnovationPatentsBrand creationBrand scope
A B S T R A C T
The use of trademark data in innovation studies is still limited because as yet no guidelines exist to ascertainwhich trademarks relate to innovation. This paper proposes that a branding strategy approach may help toidentify innovation related trademarks. Companies use distinctive branding strategies for innovation and thesebranding strategies have important consequences for the design of new trademarks and their application scope.Based on a sample of Benelux and Community trademarks, we find that trademarks for brand creation relatemore often to product innovation. In addition, we find negative effects of a trademark’s industry scope on itsrelatedness to product innovation, and of a trademark’s geographic scope on its relatedness to service innova-tion. Our findings bear several key implications for further research towards identifying innovation-relatedtrademarks from a branding strategy perspective.
1. Introduction
Research on the relationship between trademark activity and in-novation is in its infancy (Schautschick and Greenhalgh, 2016; Grahamand Hancock, 2014). Results from empirical studies so far, however, arepromising. They show positive correlations between the firm-level useof trademarks and firm-level proxies of innovation (Allegrezza andGuarda-Rauchs, 1999; Schmoch, 2003; Jennewein, 2005; Jensen andWebster, 2009; Götsch and Hipp, 2012). They also support the viewthat trademarks may be relevant for measuring innovation, as discussedin the pioneering paper by Mendonöa et al. (2004) and acknowledgedby the recent inclusion of trademark counts in rankings such as the EUInnovation Scoreboard (European Commission, 2015).
Most innovation studies, however, still use patent statistics and R&Dinvestments as preferred innovation indicators (Malecki, 2014). Themajor bottleneck preventing a wider use of trademark-based indicatorsdoes not seem to be that only a limited share of trademarks relates toinnovation, but even more critically, that no rules of thumb exist toestablish which ones. We contend that innovation research can benefitfrom the information stored in new trademark records and firm-leveltrademark portfolios for a more systematic understanding of trade-marks related to innovation. A trademark portfolio is the result of allchoices made by firms regarding trademark filing at national and in-ternational offices for intellectual property rights (Sandner, 2009).
Trademark similarity to other firm-owned trademarks in terms ofwords, symbols and aesthetics as well as a trademark’s geographic andindustry scope are the most important choices and are fundamentallyintertwined with the focal applicant’s branding strategy (Block et al.,2014).
A quite natural strategy for signaling technological advances orflagging product innovation is brand creation. New brands signal thedistinctiveness of firm offers (Aaker, 2007). However, new trademarksin a firm’s trademark portfolio may also have been filed for differentbranding purposes, such as brand modernizing or extension (Sandner,2009; Block et al., 2014), or as a preemptive registration (Rui, 2013).This paper therefore serves the call from Brexendorf et al. (2015) whomake a plea for a better understanding of the relationship betweenbranding and innovation. Hence, our main contribution is to spell outhow a branding strategy approach can help to predict a trademark’srelatedness to innovation. This approach allows us to interpret in-formation from trademark records in light of the underlying choices oftrademark applicants regarding the branding of their innovation.
Our key results are two. Firstly, we studied whether brand creations,in the form of both first trademarks from start-ups and dissimilar sub-sequent trademarks from all firms related more often to innovation. Wefind that first trademarks by startups relate most strongly to productinnovation. Trademarks mark the start of a business (Vries et al., 2017),hence our results indicate that trademarks are particularly relevant to
https://doi.org/10.1016/j.respol.2019.01.018Received 20 November 2017; Received in revised form 22 January 2019; Accepted 26 January 2019
⁎ Corresponding author.E-mail address: [email protected] (M. Flikkema).
Research Policy 48 (2019) 1340–1353
Available online 27 March 20190048-7333/ © 2019 Published by Elsevier B.V.
T

study brand creation for innovation in startups. As Seip et al. (2018)rightfully address, startups are underrepresented in innovation surveys,such as the CIS survey. We also find that dissimilar subsequent trade-marks filed for brand creation purposes relate more often to productinnovation.
Secondly, we considered the various scope choices a firm made atthe time of trademark application, in particular concerning thegeographies and industries to be covered. We find that trademarksregistered to protect brands with a narrow industry scope relate moreoften to product innovation, while trademarks protecting brandswith a narrower geographic scope related more often to service in-novation.
The remainder of this paper is structured as follows. Section 2reviews the key studies exploring the relatedness between trademarkactivity and innovation to show the current state of thinking. Section3 presents hypotheses about the relationship between innovation,branding strategies and trademark application. Section 4 describesour research approach, matched data sources and sample char-acteristics, while Section 5 presents the results of multivariate re-gression analyses to test our hypotheses. We end with conclusions,limitations and an agenda for future research into the relatednessbetween trademarks and innovation while pursuing a brandingstrategy approach.
2. Studies on trademarks and innovation
Trademark law gives economic agents the opportunity to protectbrand names and symbols against imitation. Trademarks identify theorigin of goods and services, thereby offering protection to both sellersand buyers (Greer, 1979). They protect against deception and fraud tobuyers, and to some extent they protect sellers’ monopolies. Strictlyspeaking, however, trademarks do not protect inventions as patents do,since an inventive step and non-obviousness are not required to suc-cessfully apply for trademarks. The primary purpose of trademarkprotection is to provide incentives for firms to invest in both quality andreputation (Nam and Barnett, 2011). From case studies, we know firmssometimes apply for new trademarks in cases of meaningless or nildifferentiation, for exchange reasons (Block et al., 2014), to prolongother Intellectual Property Rights (IPRs) (Statman and Tyebjee, 1981;Rujas, 1999; Jain and Conley, 2014), to leverage brand equity (Kocyigitand Ringle, 2011; Block et al., 2014), to avoid trademark squatting(Helmers et al., 2013), to pack product spaces (Reitzig, 2004), to con-trol franchisees (Ramello, 2006), to support low risk entry in foreignmarkets (Giarratana and Torrisi, 2010), to enable ingredient marketing(Reitzig, 2004), to protect slogans, or for advertising purposes (Fosfuriand Giarratana, 2009). We can therefore conclude that the use of rawtrademark counts in innovation studies has several potential drawbacksin particular for micro-level research.
Nevertheless, trademark data’s potential for innovation research hasbeen claimed in a seminal paper by Mendonça et al. (2004), for severalreasons. Firstly, trademarks are widely used across all industries ofeconomic activity (WIPO, 2013) and firm sizes (Rogers et al., 2007;Seip et al., 2019). Trademark registration is less costly than patent re-gistration and registration requirements are easier to fulfill. For the UK,Rogers et al. (2007) show that in all industries, the number of SMEsowning trademarks is always higher than those owning patents, with aparticularly striking difference in service industries. Secondly, whilepatents are related to inventions, trademarks capture inventions beingcommercialized (Nam and Barnett, 2011; Castaldi and Dosso, 2018),because commercial use is a precondition for registration. In this sense,they complement patents as innovation output indicators (Somayaet al., 2007). Thirdly, trademarks also capture non-technological typesof innovation, in particular new marketing solutions (Millot, 2009) andservice innovation, to make the intangible tangible (Schmoch, 2003).Hence, trademark-based indicators could even substitute patent-basedones in these contexts. Finally, trademarks can be collected
systematically from trademark offices1 and are classified as protecting agood, service or a combination thereof with a detailed classificationsystem: the Nice classification (Economides, 1998; Schmoch and Gauch,2009). They also represent a meaningful indicator at different levels ofaggregation: firm, industry or country.
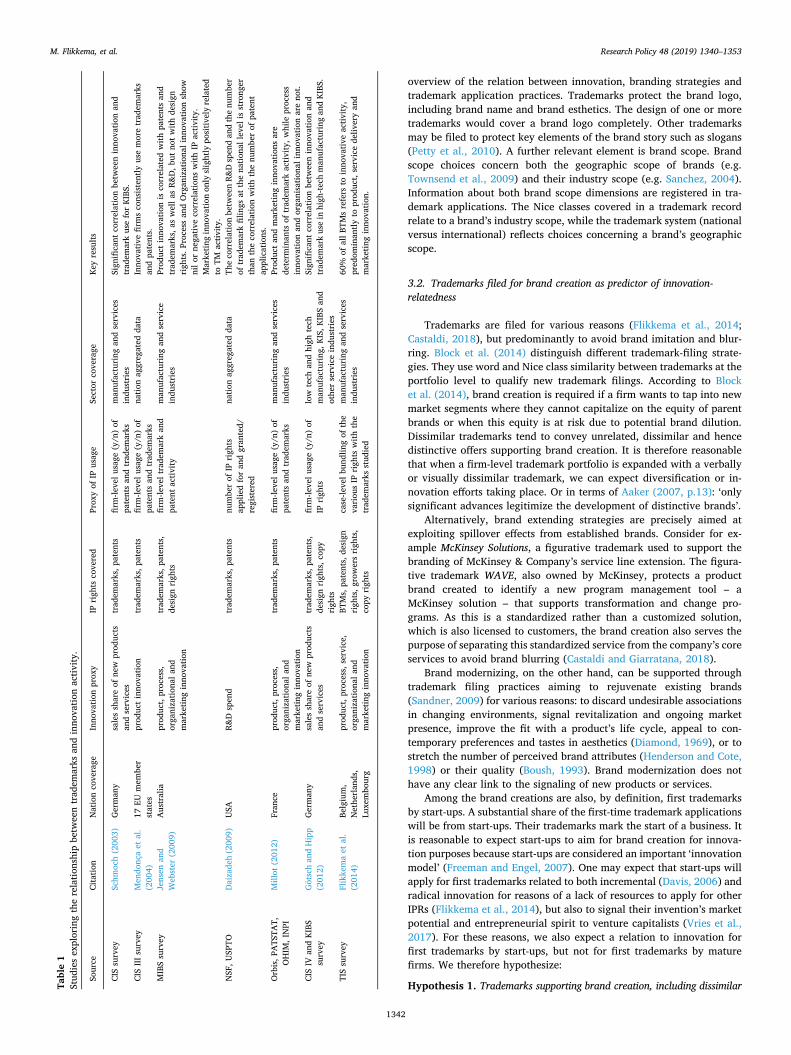
So far, a few studies have offered empirical evidence that trade-marks relate to innovation. As rightly noted by Schautschick andGreenhalgh (2016), establishing a link between trademarks and in-novation is challenging, given that it is difficult to measure innovationin the first place. Any test of whether trademarks relate to innovation isbound to rely on proxies. Studies mainly use information from theCommunity Innovation Survey (CIS), for example Schmoch (2003);Millot (2012) and Götsch and Hipp (2012). Thus, most studies reportindirect evidence in the form of firm-level or industry-level correlationsbetween trademarking activities and innovation (see Table 1). In ad-dition, studies typically use raw trademark counts or dichotomies likethe firm-level (yes/no) usage of trademarks. Remarkably, hardly anystudy in this area has exploited information from trademark recordsbeyond this basic information. Two empirical studies report directevidence at the trademark level. In a longitudinal case study Malmberg(2005) focuses on the firm-level propensity to trademark product in-novations and distinguishes between general trademarks (companyname or marketing slogans) and trademarks signaling new products andservices. Flikkema et al. (2014) look at the motives behind the regis-tration of a sample of Benelux trademarks and the trademark-level re-latedness to innovative activity and output. The preliminary conclusionof these studies is that the relationship between trademark activity andinnovation is highly dependent on the industry, market and innovationtype (see also Jensen and Webster, 2009).
Finally, conceptual work by Davis (2006) offers insights on firm-level strategies behind trademark application for innovation purposes:“Most incremental innovations represent only very small changes overexisting goods, or new combinations of existing goods, neither of whichrepresent the kind of ‘inventive step’ necessary to qualify for patentprotection” (Davis, 2006, p. 11). That is why the ‘standalone’ use ofnew trademarks makes particular sense for incremental innovations, tosignal newness and to enhance the perceived differentiation of newoffers (Flikkema et al., 2014).
We can conclude that although there is evidently a relationshipbetween trademark registration and innovation, we need to better un-derstand when trademarks are related to innovation, and to which in-novation types. In the following section, we therefore propose abranding strategy approach to identify trademarks related to product orservice innovation. The basic idea is that distinctive branding strategiesfor innovation lead to specific trademark application choices.
3. Branding strategies as predictor of innovation-relatedness
3.1. Innovation, branding and trademark application: a conceptualframework
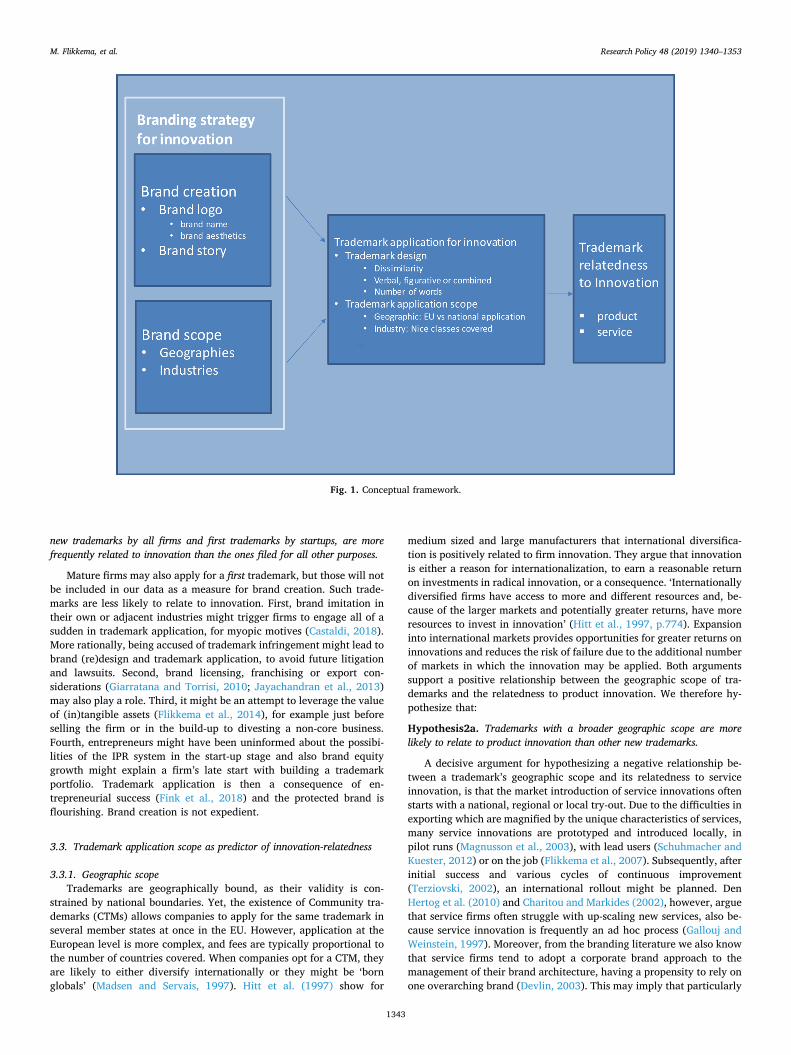
Successful brands communicate with consumers through brandstories (Chiu et al., 2012). The brand story plays an important part inhelping consumers make sense of the brand. We therefore conceptualizebrand creation strategies as ‘the creation of new, distinctive brand logosand the crafting of compelling brand stories’. According to the leadingbranding scholar David Aaker (2007) an innovation should be brandeddistinctively when it is a significant advance, when customers care andwhen it will merit investment over time. If companies act this way, thenone may expect that brand creation strategies for innovations translateinto the filing of new, dissimilar trademarks. Fig. 1 gives a general
1 Since 1996, European firms can apply for Community Trademarks at theEUIPO and an online database enables to search all registered or pendingmarks.
M. Flikkema, et al. Research Policy 48 (2019) 1340–1353
1341
overview of the relation between innovation, branding strategies andtrademark application practices. Trademarks protect the brand logo,including brand name and brand esthetics. The design of one or moretrademarks would cover a brand logo completely. Other trademarksmay be filed to protect key elements of the brand story such as slogans(Petty et al., 2010). A further relevant element is brand scope. Brandscope choices concern both the geographic scope of brands (e.g.Townsend et al., 2009) and their industry scope (e.g. Sanchez, 2004).Information about both brand scope dimensions are registered in tra-demark applications. The Nice classes covered in a trademark recordrelate to a brand’s industry scope, while the trademark system (nationalversus international) reflects choices concerning a brand’s geographicscope.
3.2. Trademarks filed for brand creation as predictor of innovation-relatedness
Trademarks are filed for various reasons (Flikkema et al., 2014;Castaldi, 2018), but predominantly to avoid brand imitation and blur-ring. Block et al. (2014) distinguish different trademark-filing strate-gies. They use word and Nice class similarity between trademarks at theportfolio level to qualify new trademark filings. According to Blocket al. (2014), brand creation is required if a firm wants to tap into newmarket segments where they cannot capitalize on the equity of parentbrands or when this equity is at risk due to potential brand dilution.Dissimilar trademarks tend to convey unrelated, dissimilar and hencedistinctive offers supporting brand creation. It is therefore reasonablethat when a firm-level trademark portfolio is expanded with a verballyor visually dissimilar trademark, we can expect diversification or in-novation efforts taking place. Or in terms of Aaker (2007, p.13): ‘onlysignificant advances legitimize the development of distinctive brands’.
Alternatively, brand extending strategies are precisely aimed atexploiting spillover effects from established brands. Consider for ex-ample McKinsey Solutions, a figurative trademark used to support thebranding of McKinsey & Company’s service line extension. The figura-tive trademark WAVE, also owned by McKinsey, protects a productbrand created to identify a new program management tool – aMcKinsey solution ‒ that supports transformation and change pro-grams. As this is a standardized rather than a customized solution,which is also licensed to customers, the brand creation also serves thepurpose of separating this standardized service from the company’s coreservices to avoid brand blurring (Castaldi and Giarratana, 2018).
Brand modernizing, on the other hand, can be supported throughtrademark filing practices aiming to rejuvenate existing brands(Sandner, 2009) for various reasons: to discard undesirable associationsin changing environments, signal revitalization and ongoing marketpresence, improve the fit with a product’s life cycle, appeal to con-temporary preferences and tastes in aesthetics (Diamond, 1969), or tostretch the number of perceived brand attributes (Henderson and Cote,1998) or their quality (Boush, 1993). Brand modernization does nothave any clear link to the signaling of new products or services.
Among the brand creations are also, by definition, first trademarksby start-ups. A substantial share of the first-time trademark applicationswill be from start-ups. Their trademarks mark the start of a business. Itis reasonable to expect start-ups to aim for brand creation for innova-tion purposes because start-ups are considered an important ‘innovationmodel’ (Freeman and Engel, 2007). One may expect that start-ups willapply for first trademarks related to both incremental (Davis, 2006) andradical innovation for reasons of a lack of resources to apply for otherIPRs (Flikkema et al., 2014), but also to signal their invention’s marketpotential and entrepreneurial spirit to venture capitalists (Vries et al.,2017). For these reasons, we also expect a relation to innovation forfirst trademarks by start-ups, but not for first trademarks by maturefirms. We therefore hypothesize:
Hypothesis 1. Trademarks supporting brand creation, including dissimilarTable1
Stud
ies
expl
orin
gth
ere
latio
nshi
pbe
twee
ntr
adem
arks
and
inno
vatio
nac
tivity
.
Sour
ceCi
tatio
nN
atio
nco
vera
geIn
nova
tion
prox
yIP
righ
tsco
vere
dPr
oxy
ofIP
usag
eSe
ctor
cove
rage
Key
resu
lts
CIS
surv
eySc
hmoc
h(2
003)
Ger
man
ysa
les
shar
eof
new
prod
ucts
and
serv
ices
trad
emar
ks,p
aten
tsfir
m-le
velu
sage
(y/n
)of
pate
nts
and
trad
emar
ksm
anuf
actu
ring
and
serv
ices
indu
stri
esSi
gnifi
cant
corr
elat
ion
betw
een
inno
vatio
nan
dtr
adem
ark
use
for
KIBS
.CI
SIII
surv
eyM
endo
nça
etal
.(2
004)
17EU
mem
ber
stat
espr
oduc
tinn
ovat
ion
trad
emar
ks,p
aten
tsfir
m-le
velu
sage
(y/n
)of
pate
nts
and
trad
emar
ksna
tion
aggr
egat
edda
taIn
nova
tive
firm
sco
nsis
tent
lyus
em
ore
trad
emar
ksan
dpa
tent
s.M
IBS
surv
eyJe
nsen
and
Web
ster
(200
9)A
ustr
alia
prod
uct,
proc
ess,
orga
niza
tiona
land
mar
ketin
gin
nova
tion
trad
emar
ks,p
aten
ts,
desi
gnri
ghts
firm
-leve
ltra
dem
ark
and
pate
ntac
tivity
man
ufac
turi
ngan
dse
rvic
ein
dust
ries
Prod
uct
inno
vatio
nis
corr
elat
edw
ithpa
tent
san
dtr
adem
arks
,as
wel
las
R&D
,but
notw
ithde
sign
righ
ts.P
roce
ssan
dO
rgan
izat
iona
linn
ovat
ion
show
nilo
rne
gativ
eco
rrel
atio
nsw
ithIP
activ
ity.
Mar
ketin
gin
nova
tion
only
slig
htly
posi
tivel
yre
late
dto
TMac
tivity
.N
SF,U
SPTO
Dai
zade
h(2
009)
USA
R&D
spen
dtr
adem
arks
,pat
ents
num
ber
ofIP
righ
tsap
plie
dfo
ran
dgr
ante
d/re
gist
ered
natio
nag
greg
ated
data
The
corr
elat
ion
betw
een
R&D
spen
dan
dth
enu
mbe
rof
trad
emar
kfil
ings
atth
ena
tiona
llev
elis
stro
nger
than
the
corr
elat
ion
with
the
num
ber
ofpa
tent
appl
icat
ions
.O
rbis
,PA
TSTA
T,O
HIM
,IN
PIM
illot
(201
2)Fr
ance
prod
uct,
proc
ess,
orga
niza
tiona
land
mar
ketin
gin
nova
tion
trad
emar
ks,p
aten
tsfir
m-le
velu
sage
(y/n
)of
pate
nts
and
trad
emar
ksm
anuf
actu
ring
and
serv
ices
indu
stri
esPr
oduc
tan
dm
arke
ting
inno
vatio
nsar
ede
term
inan
tsof
trad
emar
kac
tivity
,whi
lepr
oces
sin
nova
tion
and
orga
nisa
tiona
linn
ovat
ion
are
not.
CIS
IVan
dKI
BSsu
rvey
Göt
sch
and
Hip
p(2
012)
Ger
man
ysa
les
shar
eof
new
prod
ucts
and
serv
ices
trad
emar
ks,p
aten
ts,
desi
gnri
ghts
,cop
yri
ghts
firm
-leve
lusa
ge(y
/n)
ofIP
righ
tslo
wte
chan
dhi
ghte
chm
anuf
actu
ring
,KIS
,KIB
San
dot
her
serv
ice
indu
stri
es
Sign
ifica
ntco
rrel
atio
nbe
twee
nin
nova
tion
and
trad
emar
kus
ein
high
-tech
man
ufac
turi
ngan
dKI
BS.
TIS
surv
eyFl
ikke
ma
etal
.(2
014)
Belg
ium
,N
ethe
rlan
ds,
Luxe
mbo
urg
prod
uct,
proc
ess,
serv
ice,
orga
niza
tiona
land
mar
ketin
gin
nova
tion
BTM
s,pa
tent
s,de
sign
righ
ts,g
row
ers
righ
ts,
copy
righ
ts
case
-leve
lbun
dlin
gof
the
vari
ous
IPri
ghts
with
the
trad
emar
ksst
udie
d
man
ufac
turi
ngan
dse
rvic
esin
dust
ries
60%
ofal
lBTM
sre
fers
toin
nova
tive
activ
ity,
pred
omin
antly
topr
oduc
t,se
rvic
ede
liver
yan
dm
arke
ting
inno
vatio
n.
M. Flikkema, et al. Research Policy 48 (2019) 1340–1353
1342
new trademarks by all firms and first trademarks by startups, are morefrequently related to innovation than the ones filed for all other purposes.
Mature firms may also apply for a first trademark, but those will notbe included in our data as a measure for brand creation. Such trade-marks are less likely to relate to innovation. First, brand imitation intheir own or adjacent industries might trigger firms to engage all of asudden in trademark application, for myopic motives (Castaldi, 2018).More rationally, being accused of trademark infringement might lead tobrand (re)design and trademark application, to avoid future litigationand lawsuits. Second, brand licensing, franchising or export con-siderations (Giarratana and Torrisi, 2010; Jayachandran et al., 2013)may also play a role. Third, it might be an attempt to leverage the valueof (in)tangible assets (Flikkema et al., 2014), for example just beforeselling the firm or in the build-up to divesting a non-core business.Fourth, entrepreneurs might have been uninformed about the possibi-lities of the IPR system in the start-up stage and also brand equitygrowth might explain a firm’s late start with building a trademarkportfolio. Trademark application is then a consequence of en-trepreneurial success (Fink et al., 2018) and the protected brand isflourishing. Brand creation is not expedient.
3.3. Trademark application scope as predictor of innovation-relatedness
3.3.1. Geographic scopeTrademarks are geographically bound, as their validity is con-
strained by national boundaries. Yet, the existence of Community tra-demarks (CTMs) allows companies to apply for the same trademark inseveral member states at once in the EU. However, application at theEuropean level is more complex, and fees are typically proportional tothe number of countries covered. When companies opt for a CTM, theyare likely to either diversify internationally or they might be ‘bornglobals’ (Madsen and Servais, 1997). Hitt et al. (1997) show for
medium sized and large manufacturers that international diversifica-tion is positively related to firm innovation. They argue that innovationis either a reason for internationalization, to earn a reasonable returnon investments in radical innovation, or a consequence. ‘Internationallydiversified firms have access to more and different resources and, be-cause of the larger markets and potentially greater returns, have moreresources to invest in innovation’ (Hitt et al., 1997, p.774). Expansioninto international markets provides opportunities for greater returns oninnovations and reduces the risk of failure due to the additional numberof markets in which the innovation may be applied. Both argumentssupport a positive relationship between the geographic scope of tra-demarks and the relatedness to product innovation. We therefore hy-pothesize that:
Hypothesis2a. Trademarks with a broader geographic scope are morelikely to relate to product innovation than other new trademarks.
A decisive argument for hypothesizing a negative relationship be-tween a trademark’s geographic scope and its relatedness to serviceinnovation, is that the market introduction of service innovations oftenstarts with a national, regional or local try-out. Due to the difficulties inexporting which are magnified by the unique characteristics of services,many service innovations are prototyped and introduced locally, inpilot runs (Magnusson et al., 2003), with lead users (Schuhmacher andKuester, 2012) or on the job (Flikkema et al., 2007). Subsequently, afterinitial success and various cycles of continuous improvement(Terziovski, 2002), an international rollout might be planned. DenHertog et al. (2010) and Charitou and Markides (2002), however, arguethat service firms often struggle with up-scaling new services, also be-cause service innovation is frequently an ad hoc process (Gallouj andWeinstein, 1997). Moreover, from the branding literature we also knowthat service firms tend to adopt a corporate brand approach to themanagement of their brand architecture, having a propensity to rely onone overarching brand (Devlin, 2003). This may imply that particularly
Fig. 1. Conceptual framework.
M. Flikkema, et al. Research Policy 48 (2019) 1340–1353
1343
subsequent trademarks with a higher geographic scope are less likely torelate to service innovation. One may argue that in these cases newtrademarks ‘just’ signal geographic expansion or the applicant’s inten-tion to adapt to local needs, peculiarities or habits (Pike, 2013). Theapplicant may also try to benefit from positive attributes of city, regionor nation ‘brands’, i.e. associations to certain geographies. Conse-quently, we hypothesize that:
Hypothesis 2b. Trademarks with a broader geographic scope are less likelyto relate to service innovation than other new trademarks.
3.3.2. Industry scope: trademark breadth and Nice class typesA trademark is also characterized by a certain industry scope. With
industry scope, we mean the number -typically referred to as ‘breadth’-and type of Nice classes covered by a single trademark (Sandner andBlock, 2011). Note that the 45 Nice classes aim to cover all economicactivities: 34 Nice classes cover goods, while Nice classes 35–45 coverservices. Sandner and Block (2011) and Melnyk et al. (2014) use Nicebreadth as an indicator of the value of trademarks, which might beassociated with a higher likelihood of relating to innovation. Sandnerand Block (2011, p. 973), however, describe their doubts on the latter:“Assessing the words or signs that trademark rights protect reveals thatthose trademarks associated with few classes tend to protect brands forsingle products or narrow product lines, for example Microsoft Office2000 or iPod. By contrast, trademarks like Daimler or PlayStation areawarded to many classes and seem to protect wider product lines or so-called umbrella brands.”
Due to the pricing policy at IPR offices in Europe2 and for myopicme-too reasons (Flikkema et al., 2014), many trademark applicantsseem to select three Nice classes. To avoid trademark opposition, orbecause a trademark covers a very specific and distinctive offer, someapplicants may decide to file their trademark in fewer classes or morespecific (product or service only) classes. Some applicants might also beuninformed about the ‘three for one’ pricing policy of trademark offices.However, firms may also choose to apply for trademarks in more thanthree Nice classes in order to avoid trademark dilution, anticipate fu-ture entry in adjacent markets, or to license a brand name in otherindustries. These are non-innovative activities. We therefore hypothe-size that:
Hypothesis 3a. Trademarks with a lower breadth are more likely to beinnovation related than other trademarks.
In addition, one may expect that trademark applications filed inproduct or service Nice classes only are related more frequently toproduct or service innovation than trademarks filed in both product andservice Nice classes. We know from case studies (e.g. BTM applicationno.1201961) that for some service innovations trademarks are filed incombinations of software (Nice 9), business services (Nice 35) andsoftware licensing (Nice 42) classes. However, we did not find evidence,neither in case studies nor in the servitization literature that manu-facturers tend to redesign their brand(s) significantly, when they startoffering product-service-combinations. We therefore expect that com-binations of product and service classes are predominantly used toemphasize brand attributes, are related to new slogans, or a con-sequence of the pricing policies of IP offices. We illustrate this withexamples from the trademark portfolio owned by Miele, a Germanprovider of high-end domestic appliances and commercial equipment.Consider for example theMiele Professional trademark (CTM applicationno. 0053282232) emphasizing professionalism in both products (Nice 7and 11) and services (Nice 37) and the Miele immer besser slogan (CTMapplication no. 011998408), which is filed in Nice 7,8,11 and 37
(Repair and Maintenance services), while Miele trademarks evidentlyrelated to innovations such as Intelligent Steam (CTM application no.005501499) or NoSmell (CTM application no. 005862941), are all justfiled in Nice classes 7,9 and 11. We therefore hypothesize:
Hypothesis 3b. Trademarks filed in product (service) Nice classes only aremore likely to relate to product (service) innovation than other trademarks.
4. Research design
4.1. Data collection methods
To test the hypotheses we collected a sample of registered trade-marks for which the relatedness to innovation can be assessed andpredicted. Therefore we first selected all −28,960- unique BTM andCTM applicants, starting from all 19,348 BTM and 88,200 CTM appli-cations in 2009, on the condition that at least one of their trademarkswas ultimately registered within two years after the initial filing.Second, we distributed an on-line survey based on the availability ofapplicants’ e-mail addresses. The list contained 12,688 unique e-mailaddresses of pro se filers and e-mail addresses provided by trademarkattorneys, who registered the 2009 BTMs and CTMs on behalf of clients.Our sample contained 1015 trademark applications, either for a BTM(n= 456) or a CTM (n= 559) filed in 2009. In the Benelux, Novagraaf,by far the largest firm providing trademark services, with an overallmarket share of 15.3% in 2009, provided nearly all the e-mail addressesof the 2009 BTM applicants in their client base, which partly explainsthe overrepresentation of BTMs. We also tested for a Novagraaf effectwith a Novagraaf dummy and found that their trademarks more fre-quently related to product innovation. However, in multivariate ana-lyses we did not find significant Novagraaf effects, hence we droppedthe respective dummy.
If an email address of a 2009 BTM or CTM applicant related to morethan one trademark, we randomly selected the trademark for which therespondent had to answer the survey questions. This potentially implieda selection bias if trademark application by frequent filers more or lessfrequently related to innovation efforts. Though it is a potential sourceof bias, we have no reason to believe that the trademarks of applicantswho did not register their email address in the trademark databases ofEuropean Union Intellectual Property Office (EUIPO) or the BeneluxOffice for Intellectual Property (BOIP), had a structurally different re-lation to innovation than other trademarks in the 2009 population.Trademark law does not dictate e-mail registration, this is probablywhy the availability of email addresses is limited to about 40%.
We compiled a survey including questions on the respondent’sstructural characteristics (e.g. firm size & maturity, industry), on theprocess of trademark application (motives, timing, strategies of com-bining trademarks with other IPRs), and on the relatedness of trade-marks to innovation, largely based on the innovation definitions in theOECD Oslo manual (OECD, 2005). The survey was sent by EUIPO andBOIP, and was available online between July 18, 2012 and January 16,2013. It was electronically linked with the IPR offices’ databases, whichenabled the respondents to inspect the details of their trademark filingswhile answering the survey. Overall, 8 percent of the 2009 trademarkapplicants (= 1015/12,688) which could be contacted by e-mail com-pleted our survey. Although the response rate was limited, the samplesize is substantial, compared to previous survey studies into the motivesfor trademark application (Flikkema et al., 2014; Block et al., 2015).Nishimura et al. (2016) propose not to discuss sample sizes, but to testwhether responders and non-responders differ on fully observed char-acteristics, which we did for firm size, volumes in Nice classes, in-dustries and trademark types. We present the results in subsection 4.2.For the trademarks in our final sample, we complemented our primarydata with secondary data on each trademark. We retrieved the fulltrademark portfolios at BOIP and EUIPO. Each trademark record con-tained several pieces of information, of which we exploited: the
2 Note that pricing schemes at trademark offices make registration in threeNice classes as costly as in only one class. This explains why the number of Niceclasses only makes sense when higher or lower than three.
M. Flikkema, et al. Research Policy 48 (2019) 1340–1353
1344
applicant name, and date of filing, the trademark description in wordsand/or graphics, the trademark type and the Nice classes covered.
4.2. Validity checks
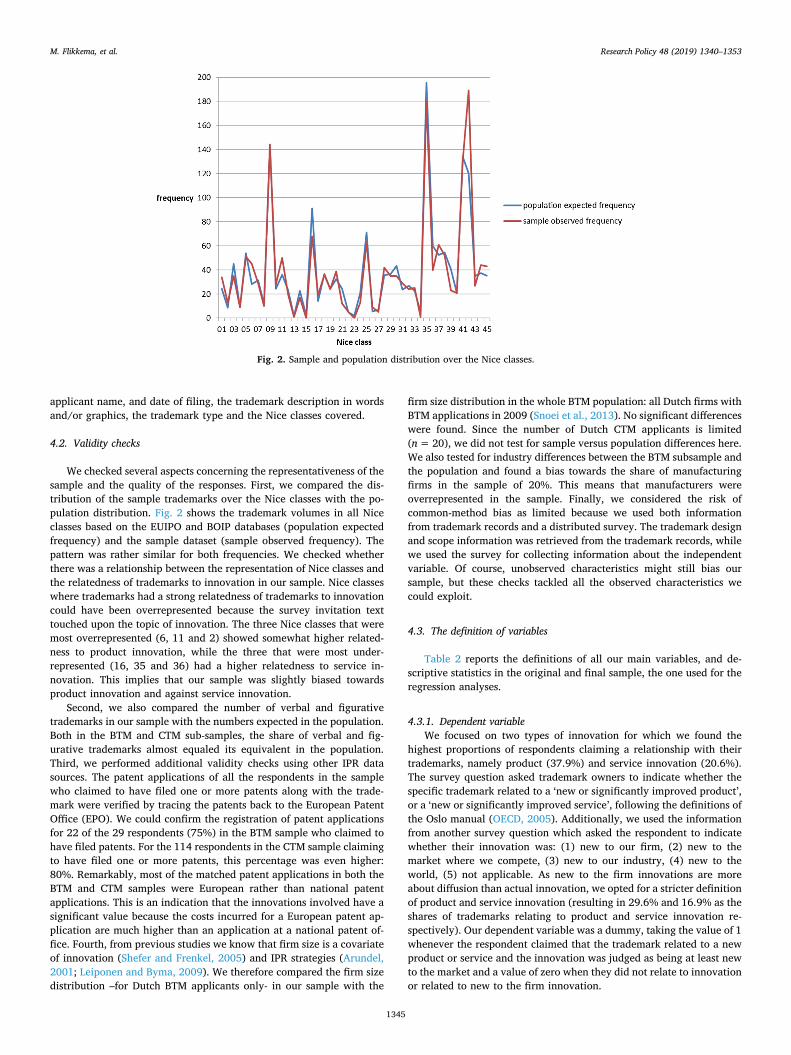
We checked several aspects concerning the representativeness of thesample and the quality of the responses. First, we compared the dis-tribution of the sample trademarks over the Nice classes with the po-pulation distribution. Fig. 2 shows the trademark volumes in all Niceclasses based on the EUIPO and BOIP databases (population expectedfrequency) and the sample dataset (sample observed frequency). Thepattern was rather similar for both frequencies. We checked whetherthere was a relationship between the representation of Nice classes andthe relatedness of trademarks to innovation in our sample. Nice classeswhere trademarks had a strong relatedness of trademarks to innovationcould have been overrepresented because the survey invitation texttouched upon the topic of innovation. The three Nice classes that weremost overrepresented (6, 11 and 2) showed somewhat higher related-ness to product innovation, while the three that were most under-represented (16, 35 and 36) had a higher relatedness to service in-novation. This implies that our sample was slightly biased towardsproduct innovation and against service innovation.
Second, we also compared the number of verbal and figurativetrademarks in our sample with the numbers expected in the population.Both in the BTM and CTM sub-samples, the share of verbal and fig-urative trademarks almost equaled its equivalent in the population.Third, we performed additional validity checks using other IPR datasources. The patent applications of all the respondents in the samplewho claimed to have filed one or more patents along with the trade-mark were verified by tracing the patents back to the European PatentOffice (EPO). We could confirm the registration of patent applicationsfor 22 of the 29 respondents (75%) in the BTM sample who claimed tohave filed patents. For the 114 respondents in the CTM sample claimingto have filed one or more patents, this percentage was even higher:80%. Remarkably, most of the matched patent applications in both theBTM and CTM samples were European rather than national patentapplications. This is an indication that the innovations involved have asignificant value because the costs incurred for a European patent ap-plication are much higher than an application at a national patent of-fice. Fourth, from previous studies we know that firm size is a covariateof innovation (Shefer and Frenkel, 2005) and IPR strategies (Arundel,2001; Leiponen and Byma, 2009). We therefore compared the firm sizedistribution –for Dutch BTM applicants only- in our sample with the
firm size distribution in the whole BTM population: all Dutch firms withBTM applications in 2009 (Snoei et al., 2013). No significant differenceswere found. Since the number of Dutch CTM applicants is limited(n= 20), we did not test for sample versus population differences here.We also tested for industry differences between the BTM subsample andthe population and found a bias towards the share of manufacturingfirms in the sample of 20%. This means that manufacturers wereoverrepresented in the sample. Finally, we considered the risk ofcommon-method bias as limited because we used both informationfrom trademark records and a distributed survey. The trademark designand scope information was retrieved from the trademark records, whilewe used the survey for collecting information about the independentvariable. Of course, unobserved characteristics might still bias oursample, but these checks tackled all the observed characteristics wecould exploit.
4.3. The definition of variables
Table 2 reports the definitions of all our main variables, and de-scriptive statistics in the original and final sample, the one used for theregression analyses.
4.3.1. Dependent variableWe focused on two types of innovation for which we found the
highest proportions of respondents claiming a relationship with theirtrademarks, namely product (37.9%) and service innovation (20.6%).The survey question asked trademark owners to indicate whether thespecific trademark related to a ‘new or significantly improved product’,or a ‘new or significantly improved service’, following the definitions ofthe Oslo manual (OECD, 2005). Additionally, we used the informationfrom another survey question which asked the respondent to indicatewhether their innovation was: (1) new to our firm, (2) new to themarket where we compete, (3) new to our industry, (4) new to theworld, (5) not applicable. As new to the firm innovations are moreabout diffusion than actual innovation, we opted for a stricter definitionof product and service innovation (resulting in 29.6% and 16.9% as theshares of trademarks relating to product and service innovation re-spectively). Our dependent variable was a dummy, taking the value of 1whenever the respondent claimed that the trademark related to a newproduct or service and the innovation was judged as being at least newto the market and a value of zero when they did not relate to innovationor related to new to the firm innovation.
Fig. 2. Sample and population distribution over the Nice classes.
M. Flikkema, et al. Research Policy 48 (2019) 1340–1353
1345
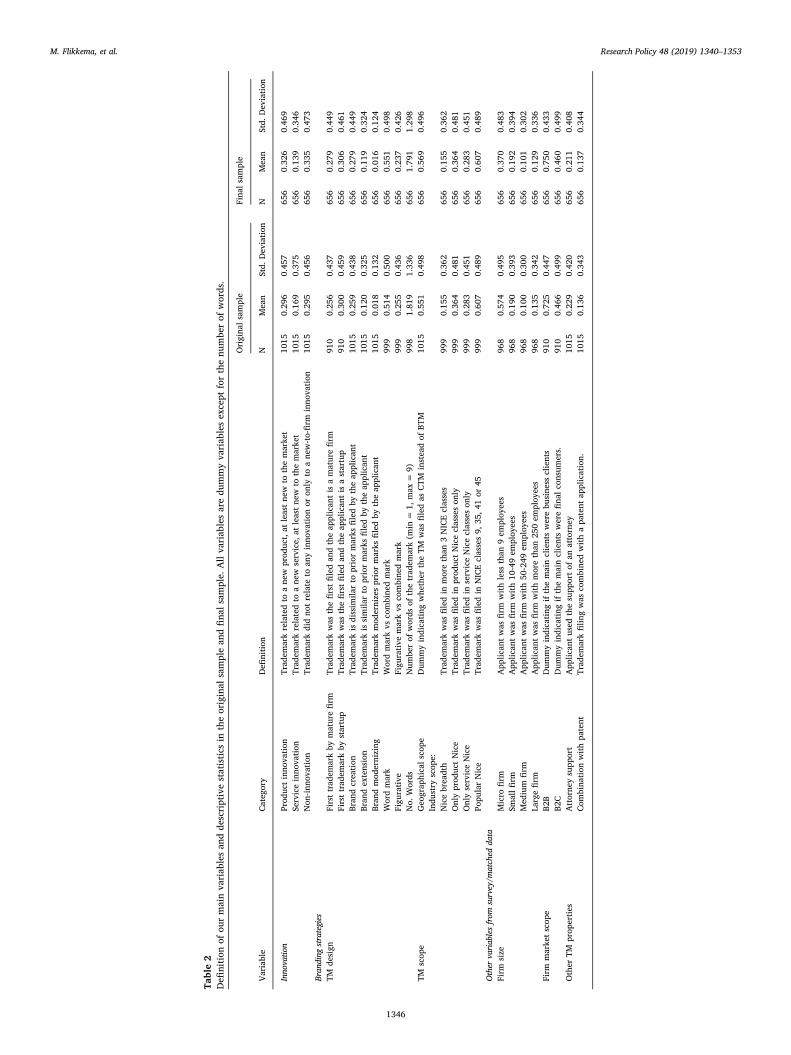
Table2
Defi
nitio
nof
our
mai
nva
riab
les
and
desc
ript
ive
stat
istic
sin
the
orig
inal
sam
ple
and
final
sam
ple.
All
vari
able
sar
edu
mm
yva
riab
les
exce
ptfo
rth
enu
mbe
rof
wor
ds.
Ori
gina
lsam
ple
Fina
lsam
ple
Vari
able
Cate
gory
Defi
nitio
nN
Mea
nSt
d.D
evia
tion
NM
ean
Std.
Dev
iatio
n
Innovation
Prod
ucti
nnov
atio
nTr
adem
ark
rela
ted
toa
new
prod
uct,
atle
ast
new
toth
em
arke
t10
150.
296
0.45
765
60.
326
0.46
9Se
rvic
ein
nova
tion
Trad
emar
kre
late
dto
ane
wse
rvic
e,at
leas
tne
wto
the
mar
ket
1015
0.16
90.
375
656
0.13
90.
346
Non
-inno
vatio
nTr
adem
ark
did
not
rela
teto
any
inno
vatio
nor
only
toa
new
-to-fi
rmin
nova
tion
1015
0.29
50.
456
656
0.33
50.
473
Brandingstrategies
TMde
sign
Firs
ttra
dem
ark
bym
atur
efir
mTr
adem
ark
was
the
first
filed
and
the
appl
ican
tis
am
atur
efir
m91
00.
256
0.43
765
60.
279
0.44
9Fi
rstt
rade
mar
kby
star
tup
Trad
emar
kw
asth
efir
stfil
edan
dth
eap
plic
ant
isa
star
tup
910
0.30
00.
459
656
0.30
60.
461
Bran
dcr
eatio
nTr
adem
ark
isdi
ssim
ilar
topr
ior
mar
ksfil
edby
the
appl
ican
t10
150.
259
0.43
865
60.
279
0.44
9Br
and
exte
nsio
nTr
adem
ark
issi
mila
rto
prio
rm
arks
filed
byth
eap
plic
ant
1015
0.12
00.
325
656
0.11
90.
324
Bran
dm
oder
nizi
ngTr
adem
ark
mod
erni
zes
prio
rm
arks
filed
byth
eap
plic
ant
1015
0.01
80.
132
656
0.01
60.
124
Wor
dm
ark
Wor
dm
ark
vsco
mbi
ned
mar
k99
90.
514
0.50
065
60.
551
0.49
8Fi
gura
tive
Figu
rativ
em
ark
vsco
mbi
ned
mar
k99
90.
255
0.43
665
60.
237
0.42
6N
o.W
ords
Num
ber
ofw
ords
ofth
etr
adem
ark
(min
=1,
max
=9)
998
1.81
91.
336
656
1.79
11.
298
TMsc
ope
Geo
grap
hica
lsco
peD
umm
yin
dica
ting
whe
ther
the
TMw
asfil
edas
CTM
inst
ead
ofBT
M10
150.
551
0.49
865
60.
569
0.49
6In
dust
rysc
ope:
Nic
ebr
eadt
hTr
adem
ark
was
filed
inm
ore
than
3N
ICE
clas
ses
999
0.15
50.
362
656
0.15
50.
362
Onl
ypr
oduc
tN
ice
Trad
emar
kw
asfil
edin
prod
uctN
ice
clas
ses
only
999
0.36
40.
481
656
0.36
40.
481
Onl
yse
rvic
eN
ice
Trad
emar
kw
asfil
edin
serv
ice
Nic
ecl
asse
son
ly99
90.
283
0.45
165
60.
283
0.45
1Po
pula
rN
ice
Trad
emar
kw
asfil
edin
NIC
Ecl
asse
s9,
35,4
1or
4599
90.
607
0.48
965
60.
607
0.48
9Othervariablesfrom
survey/matcheddata
Firm
size
Mic
rofir
mA
pplic
ant
was
firm
with
less
than
9em
ploy
ees
968
0.57
40.
495
656
0.37
00.
483
Smal
lfirm
App
lican
tw
asfir
mw
ith10
-49
empl
oyee
s96
80.
190
0.39
365
60.
192
0.39
4M
ediu
mfir
mA
pplic
ant
was
firm
with
50-2
49em
ploy
ees
968
0.10
00.
300
656
0.10
10.
302
Larg
efir
mA
pplic
ant
was
firm
with
mor
eth
an25
0em
ploy
ees
968
0.13
50.
342
656
0.12
90.
336
Firm
mar
ket
scop
eB2
BD
umm
yin
dica
ting
ifth
em
ain
clie
nts
wer
ebu
sine
sscl
ient
s91
00.
725
0.44
765
60.
750
0.43
3B2
CD
umm
yin
dica
ting
ifth
em
ain
clie
nts
wer
efin
alco
nsum
ers.
910
0.46
60.
499
656
0.46
00.
499
Oth
erTM
prop
ertie
sA
ttor
ney
supp
ort
App
lican
tus
edth
esu
ppor
tofa
nat
torn
ey10
150.
229
0.42
065
60.
211
0.40
8Co
mbi
natio
nw
ithpa
tent
Trad
emar
kfil
ing
was
com
bine
dw
itha
pate
ntap
plic
atio
n.10
150.
136
0.34
365
60.
137
0.34
4
M. Flikkema, et al. Research Policy 48 (2019) 1340–1353
1346
4.3.2. Branding strategiesWe started from the procedure proposed by Sandner (2009) and
used in Block et al. (2014) to classify new trademark filings. The pro-cedure considered two independent dimensions: industry scope referredto the Nice classes covered by the trademark and linkage referred to thedegree of verbal or visual similarity between the focal trademark andthose already in the applicant’s portfolio. Both dimensions could becaptured using information from trademark records after collecting allprior trademarks registered by the firm. We followed Sandner’s proce-dure when individually inspecting all trademarks in each applicant’sportfolio. All trademarks were assigned to one category from Sandner’sclassification of filing strategies.
If the focal trademark had no similarity to any other trademarkowned by the applicant, we classified its filing as brand creating. Brandextensions were instances where the new trademark had some re-cognizable degree of similarity, i.e. sharing the root or evident con-nection, but where the industry scope differed. Instances where the newtrademark almost overlapped with an existing one, or had at least avery strong degree of word similarity and the same industry scope asprior trademarks, were considered as brand modernizing. We deviatedfrom Sandner’s procedure in two ways. Firstly, we also consideredfigurative trademarks, whereas Sandner’s automated procedure onlydealt with word marks. Secondly, we left brand-hedging strategies asideand did not distinguish between brand creation with multiple filings onthe same date and brand creation with a single trademark filing.Moreover, Sandner’s procedure cannot be applied to first trademarks,for which no prior reference exists. We distinguished between firsttrademarks by startups and by mature firms, taking the latter as ourbaseline category. We make this distinction between startups and ma-ture firms only for Hypothesis 1, since we have arguments from priorresearch to expect differences.
Trademarks can be any kind of symbols, the most common beingword, figurative and combined word and figurative marks. We classi-fied the trademarks in our sample also according to these three typesand for word marks we also counted the number of words included(number of words ranged from 1 to 9).
4.3.3. Trademark application scopeWe distinguished two scope dimensions of trademarks: 1) geo-
graphic scope and 2) industry scope. The geographic scope was a di-chotomy with two possible values, representing two different trade-mark jurisdictions: BTM or CTM. Evidently, the geographic scope ofCTMs exceeded the BTM scope, because CTMs provide trademarkprotection in all EU member states, while BTMs just cover the Beneluxregion. The industry scope captured both the number and type of Niceclasses covered by a trademark (= trademark breadth). Given thepricing policy, we operationalized breadth as a dummy equal to one ifthe trademark covered more than 3 classes. We also defined dummies toindicate whether the trademark covered either product only, servicesonly Nice classes, as opposed to both product and services. For bothscope dimensions, in line with our hypothesis development, we esti-mate effects regarding all firms, without separating startups and maturefirms.
4.3.4. Control variablesOther explanatory variables included variables stemming from
survey questions. We controlled for firm size, measured as a categoricalvariable based on the number of employees. We defined dummies forthe main size categories as indicated in Table 2. We also knew whetherthe applicant considered itself a start-up or a mature firm. Additionally,controlling for a B2B or B2C market orientation has been proposed byMalmberg (2005), who stated that brand management is a differentchallenge in end markets compared to intermediate markets. Oursurvey, therefore, included a question to capture a firm’s market scope:respondents could indicate ‘delivering products and/or services tocommercial organizations: business to business’ and/or ‘to customers in
end-markets: business to consumer’, next to ‘non-profit organizations’(B2NP).
The survey also asked respondents whether they applied for a patentfor the same object covered by the focal trademark. When investigatingthe trademark-innovation relatedness, we could not ignore the role ofpatents. Flikkema et al. (2014) already demonstrated that the combi-nation of trademarks and patents is more likely to relate to innovation.Trademarks are often used as complements to patents (e.g. Conleyet al., 2013; Zhou et al., 2016): patents protect the inventive compo-nent, while trademarks protect a commercialized product/service in themarketplace (Nam and Barnett, 2011) or trademarks allow patentprolongation. Notice that trademark and patent matching at the projectlevel is not information that is typically available. Hence, we werespecifically looking for predictors that could act as alternatives for thatinformation.
4.4. Methods of analysis
The aim of our analysis was to investigate trademark and applicantcharacteristics with a higher explanatory power to disentangle trade-marks related to innovation from trademarks not related to innovation.Given this aim and our focus on both new products and new services,we opted for estimating multinomial logistic regressions (Hosmer et al.,2013) where the dependent variable could take three distinct values:(1) relatedness to product innovation, (2) relatedness to service in-novation, (3) no relatedness to innovation. Estimation of a multinomialmodel requires observations to be categorized in only one of the pos-sible categories. As our sample included trademarks referring to moretypes of innovation and also trademarks referring to both service andproduct innovation, we selected all the observations correspondingwith the three independent categories defined in our dependent vari-able. Hence, we excluded cases where the respondent indicated that theinnovation related to both product and service innovation and weidentified the ‘no innovation’ category as those trademarks where therespondent reported that the trademark did not refer to any innovationor only referred to new-to-firm innovations of any type. We used the ‘noinnovation’ category as our baseline for the multinomial regression andpresented estimated coefficients for the product and service innovationcategories. To gauge the models’ goodness of fit, we reported the Na-gelkerke R2 measure and the prediction rates from the classificationtable underlying the estimated model (Hosmer et al., 2013).
5. Empirical results
5.1. Descriptive analysis
Along with the descriptive statistics reported in Table 2, we checkedthe pairwise correlation among all variables in the same sample usedfor the multivariate regression, (see Table 3). The relatedness of a tra-demark to product and service innovation was significantly correlatedto most of the indicators of trademark application choices. Interest-ingly, the sign of the correlation was often opposite for product vsservice innovation. This was also the case for the variable capturingpatent combination. As expected, joint trademark and patent applica-tion positively correlated with product innovation, while there was asignificant negative correlation in the case of service innovation. Suc-cessful patenting in services might be predominantly a consequence ofexpanding a firm’s technological options (Hertog, 2000; Blind et al.,2003). These technological options might predominantly lead to pro-cess innovations, e.g. the digitalization of delivery processes. The geo-graphic and industry scope dimension significantly correlated, again inopposite directions for a product focus vs a service focus. As for attorneysupport, the correlation coefficients indicated that companies filingtrademarks for brand extensions or modernizing were very likely to useattorneys, while small firms and startups were very likely not to. Thecorrelation was instead not significant for first trademarks by mature
M. Flikkema, et al. Research Policy 48 (2019) 1340–1353
1347
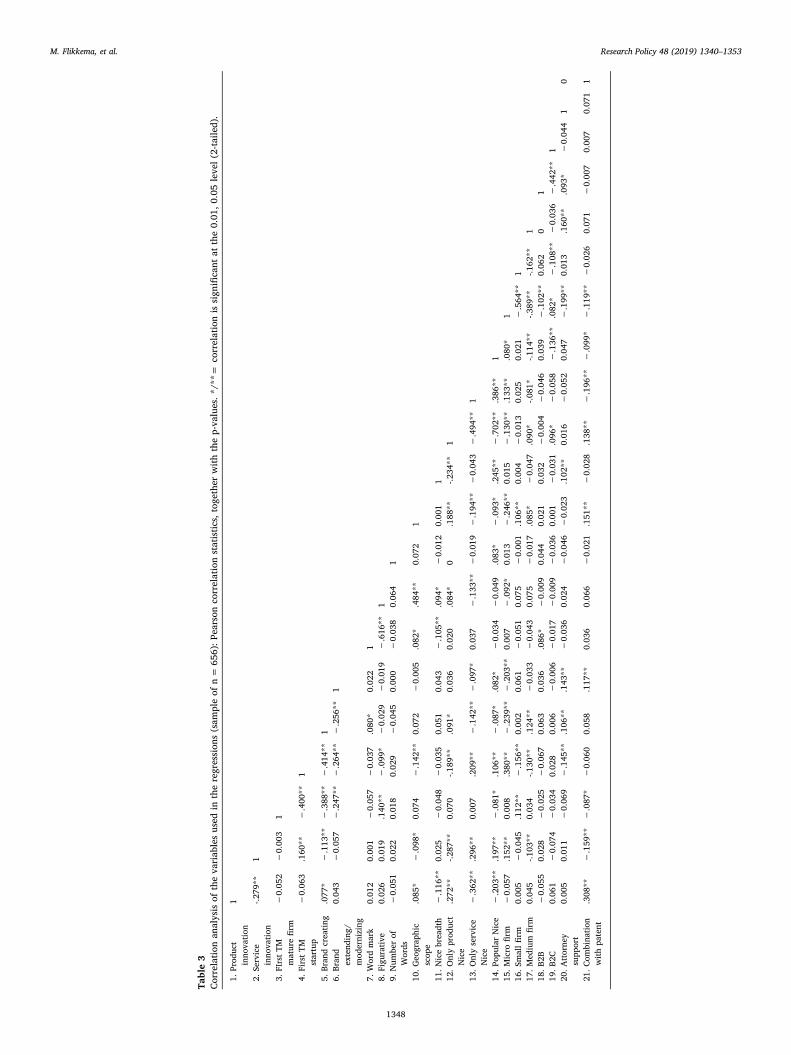
Table3
Corr
elat
ion
anal
ysis
ofth
eva
riab
les
used
inth
ere
gres
sion
s(s
ampl
eof
n=
656)
:Pea
rson
corr
elat
ion
stat
istic
s,to
geth
erw
ithth
ep-
valu
es.*
/**=
corr
elat
ion
issi
gnifi
cant
atth
e0.
01,0
.05
leve
l(2-
taile
d).
1.Pr
oduc
tin
nova
tion
1
2.Se
rvic
ein
nova
tion
-.279
**1
3.FI
rstT
Mm
atur
efir
m−
0.05
2−
0.00
31
4.Fi
rstT
Mst
artu
p−
0.06
3.1
60**
−.4
00**
1
5.Br
and
crea
ting
.077
*−
.113
**−
.388
**−
.414
**1
6.Br
and
exte
ndin
g/m
oder
nizi
ng
0.04
3−
0.05
7−
.247
**−
.264
**−
.256
**1
7.W
ord
mar
k0.
012
0.00
1−
0.05
7−
0.03
7.0
80*
0.02
21
8.Fi
gura
tive
0.02
60.
019
.140
**−
.099
*−
0.02
9−
0.01
9−
.616
**1
9.N
umbe
rof
Wor
ds−
0.05
10.
022
0.01
80.
029
−0.
045
0.00
0−
0.03
80.
064
1
10.G
eogr
aphi
csc
ope
.085
*−
.098
*0.
074
−.1
42**
0.07
2−
0.00
5.0
82*
.484
**0.
072
1
11.N
ice
brea
dth
−.1
16**
0.02
5−
0.04
8−
0.03
50.
051
0.04
3−
.105
**.0
94*
−0.
012
0.00
11
12.O
nly
prod
uct
Nic
e.2
72**
-.287
**0.
070
-.189
**.0
91*
0.03
60.
020
.084
*0
.188
**-.2
34**
1
13.O
nly
serv
ice
Nic
e−
.362
**.2
96**
0.00
7.2
09**
−.1
42**
−.0
97*
0.03
7−
.133
**−
0.01
9−
.194
**−
0.04
3−
.494
**1
14.P
opul
arN
ice
−.2
03**
.197
**−
.081
*.1
06**
−.0
87*
.082
*−
0.03
4−
0.04
9.0
83*
−.0
93*
.245
**−
.702
**.3
86**
115
.Mic
rofir
m−
0.05
7.1
52**
0.00
8.3
80**
−.2
39**
−.2
03**
0.00
7−
.092
*0.
013
−.2
46**
0.01
5−
.130
**.1
33**
.080
*1
16.S
mal
lfirm
0.00
5−
0.04
5.1
12**
−.1
56**
0.00
20.
061
−0.
051
0.07
5−
0.00
1.1
06**
0.00
4−
0.01
30.
025
0.02
1−
.564
**1
17.M
ediu
mfir
m0.
045
-.103
**0.
034
-.130
**.1
24**
−0.
033
−0.
043
0.07
5−
0.01
7.0
85*
−0.
047
.090
*-.0
81*
-.114
**-.3
89**
-.162
**1
18.B
2B−
0.05
50.
028
−0.
025
−0.
067
0.06
30.
036
.086
*−
0.00
90.
044
0.02
10.
032
−0.
004
−0.
046
0.03
9−
.102
**0.
062
01
19.B
2C0.
061
−0.
074
−0.
034
0.02
80.
006
−0.
006
−0.
017
−0.
009
−0.
036
0.00
1−
0.03
1.0
96*
−0.
058
−.1
36**
.082
*−
.108
**−
0.03
6−
.442
**1
20.A
ttor
ney
supp
ort
0.00
50.
011
−0.
069
−.1
45**
.106
**.1
43**
−0.
036
0.02
4−
0.04
6−
0.02
3.1
02**
0.01
6−
0.05
20.
047
−.1
99**
0.01
3.1
60**
.093
*−
0.04
41
0
21.C
ombi
natio
nw
ithpa
tent
.308
**−
.159
**−
.087
*−
0.06
00.
058
.117
**0.
036
0.06
6−
0.02
1.1
51**
−0.
028
.138
**−
.196
**−
.099
*−
.119
**−
0.02
60.
071
−0.
007
0.00
70.
071
1
M. Flikkema, et al. Research Policy 48 (2019) 1340–1353
1348
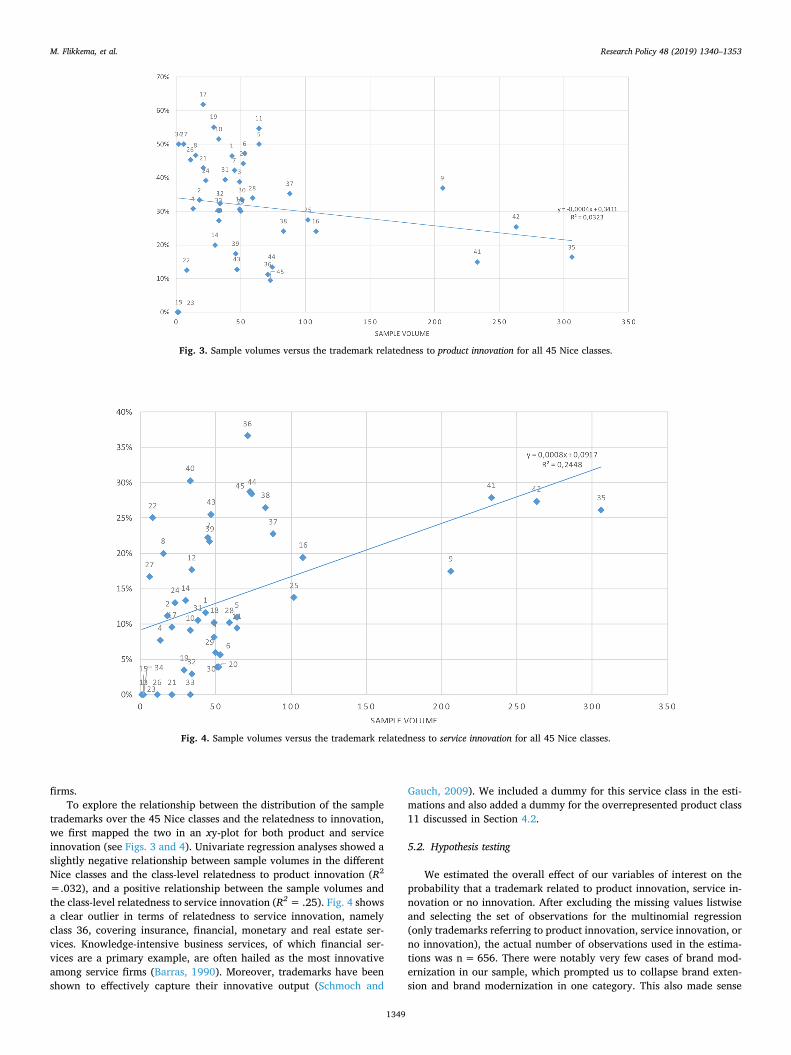
firms.To explore the relationship between the distribution of the sample
trademarks over the 45 Nice classes and the relatedness to innovation,we first mapped the two in an xy-plot for both product and serviceinnovation (see Figs. 3 and 4). Univariate regression analyses showed aslightly negative relationship between sample volumes in the differentNice classes and the class-level relatedness to product innovation (R2
=.032), and a positive relationship between the sample volumes andthe class-level relatedness to service innovation (R2= .25). Fig. 4 showsa clear outlier in terms of relatedness to service innovation, namelyclass 36, covering insurance, financial, monetary and real estate ser-vices. Knowledge-intensive business services, of which financial ser-vices are a primary example, are often hailed as the most innovativeamong service firms (Barras, 1990). Moreover, trademarks have beenshown to effectively capture their innovative output (Schmoch and
Gauch, 2009). We included a dummy for this service class in the esti-mations and also added a dummy for the overrepresented product class11 discussed in Section 4.2.
5.2. Hypothesis testing
We estimated the overall effect of our variables of interest on theprobability that a trademark related to product innovation, service in-novation or no innovation. After excluding the missing values listwiseand selecting the set of observations for the multinomial regression(only trademarks referring to product innovation, service innovation, orno innovation), the actual number of observations used in the estima-tions was n = 656. There were notably very few cases of brand mod-ernization in our sample, which prompted us to collapse brand exten-sion and brand modernization in one category. This also made sense
Fig. 3. Sample volumes versus the trademark relatedness to product innovation for all 45 Nice classes.
Fig. 4. Sample volumes versus the trademark relatedness to service innovation for all 45 Nice classes.
M. Flikkema, et al. Research Policy 48 (2019) 1340–1353
1349
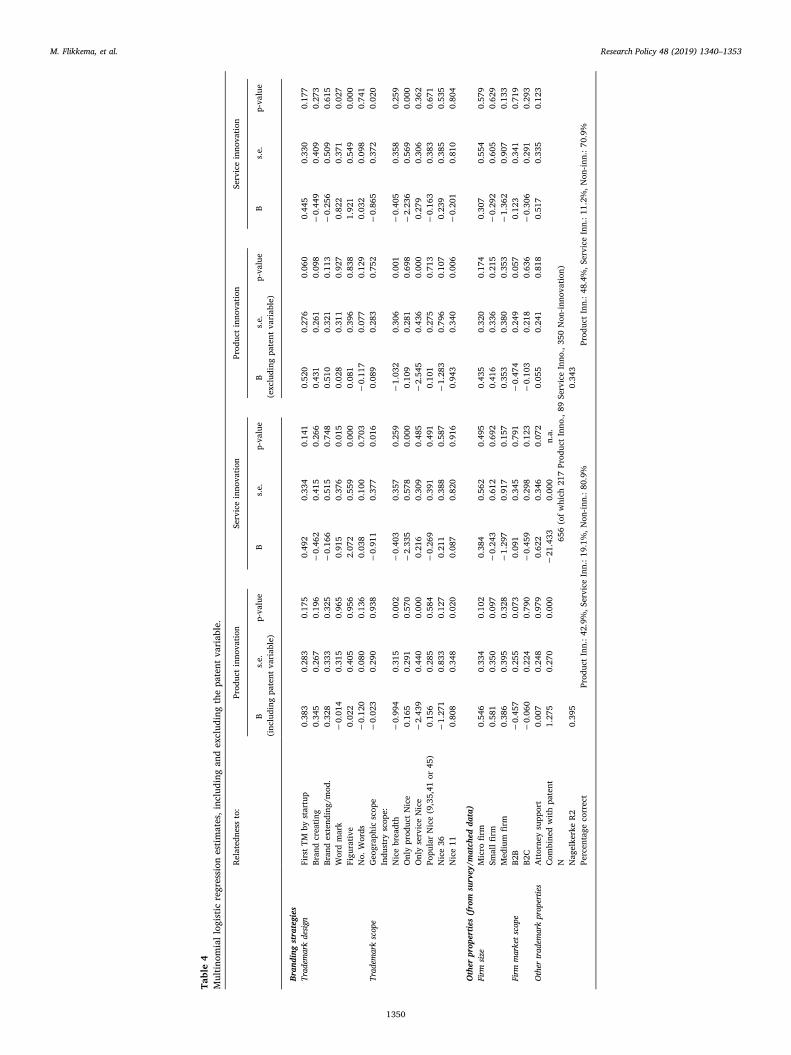
Table4
Mul
tinom
iall
ogis
ticre
gres
sion
estim
ates
,inc
ludi
ngan
dex
clud
ing
the
pate
ntva
riab
le.
Rela
tedn
ess
to:
Prod
uct
inno
vatio
nSe
rvic
ein
nova
tion
Prod
uct
inno
vatio
nSe
rvic
ein
nova
tion
Bs.
e.p-
valu
eB
s.e.
p-va
lue
Bs.
e.p-
valu
eB
s.e.
p-va
lue
(inc
ludi
ngpa
tent
vari
able
)(e
xclu
ding
pate
ntva
riab
le)
Branding
strategies
Trademarkdesign
Firs
tTM
byst
artu
p0.
383
0.28
30.
175
0.49
20.
334
0.14
10.
520
0.27
60.
060
0.44
50.
330
0.17
7Br
and
crea
ting
0.34
50.
267
0.19
6−
0.46
20.
415
0.26
60.
431
0.26
10.
098
−0.
449
0.40
90.
273
Bran
dex
tend
ing/
mod
.0.
328
0.33
30.
325
−0.
166
0.51
50.
748
0.51
00.
321
0.11
3−
0.25
60.
509
0.61
5W
ord
mar
k−
0.01
40.
315
0.96
50.
915
0.37
60.
015
0.02
80.
311
0.92
70.
822
0.37
10.
027
Figu
rativ
e0.
022
0.40
50.
956
2.07
20.
559
0.00
00.
081
0.39
60.
838
1.92
10.
549
0.00
0N
o.W
ords
−0.
120
0.08
00.
136
0.03
80.
100
0.70
3−
0.11
70.
077
0.12
90.
032
0.09
80.
741
Trademarkscope
Geo
grap
hic
scop
e−
0.02
30.
290
0.93
8−
0.91
10.
377
0.01
60.
089
0.28
30.
752
−0.
865
0.37
20.
020
Indu
stry
scop
e:N
ice
brea
dth
−0.
994
0.31
50.
002
−0.
403
0.35
70.
259
−1.
032
0.30
60.
001
−0.
405
0.35
80.
259
Onl
ypr
oduc
tN
ice
0.16
50.
291
0.57
0−
2.33
50.
578
0.00
00.
109
0.28
10.
698
−2.
236
0.56
90.
000
Onl
yse
rvic
eN
ice
−2.
439
0.44
00.
000
0.21
60.
309
0.48
5−
2.54
50.
436
0.00
00.
279
0.30
60.
362
Popu
lar
Nic
e(9
,35,
41or
45)
0.15
60.
285
0.58
4−
0.26
90.
391
0.49
10.
101
0.27
50.
713
−0.
163
0.38
30.
671
Nic
e36
−1.
271
0.83
30.
127
0.21
10.
388
0.58
7−
1.28
30.
796
0.10
70.
239
0.38
50.
535
Nic
e11
0.80
80.
348
0.02
00.
087
0.82
00.
916
0.94
30.
340
0.00
6−
0.20
10.
810
0.80
4
Otherproperties(fromsurvey/matched
data)
Firm
size
Mic
rofir
m0.
546
0.33
40.
102
0.38
40.
562
0.49
50.
435
0.32
00.
174
0.30
70.
554
0.57
9Sm
allfi
rm0.
581
0.35
00.
097
−0.
243
0.61
20.
692
0.41
60.
336
0.21
5−
0.29
20.
605
0.62
9M
ediu
mfir
m0.
386
0.39
50.
328
−1.
297
0.91
70.
157
0.35
30.
380
0.35
3−
1.36
20.
907
0.13
3Firm
marketscope
B2B
−0.
457
0.25
50.
073
0.09
10.
345
0.79
1−
0.47
40.
249
0.05
70.
123
0.34
10.
719
B2C
−0.
060
0.22
40.
790
−0.
459
0.29
80.
123
−0.
103
0.21
80.
636
−0.
306
0.29
10.
293
Othertrademarkproperties
Att
orne
ysu
ppor
t0.
007
0.24
80.
979
0.62
20.
346
0.07
20.
055
0.24
10.
818
0.51
70.
335
0.12
3Co
mbi
ned
with
pate
nt1.
275
0.27
00.
000
−21
.433
0.00
0n.
a.N
656
(ofw
hich
217
Prod
uct
Inno
.,89
Serv
ice
Inno
.,35
0N
on-in
nova
tion)
Nag
elke
rke
R20.
395
0.34
3Pe
rcen
tage
corr
ect
Prod
uct
Inn.
:42.
9%,S
ervi
ceIn
n.:1
9.1%
,Non
-inn.
:80.
9%Pr
oduc
tIn
n.:4
8.4%
,Ser
vice
Inn.
:11.
2%,N
on-in
n.:7
0.9%
M. Flikkema, et al. Research Policy 48 (2019) 1340–1353
1350
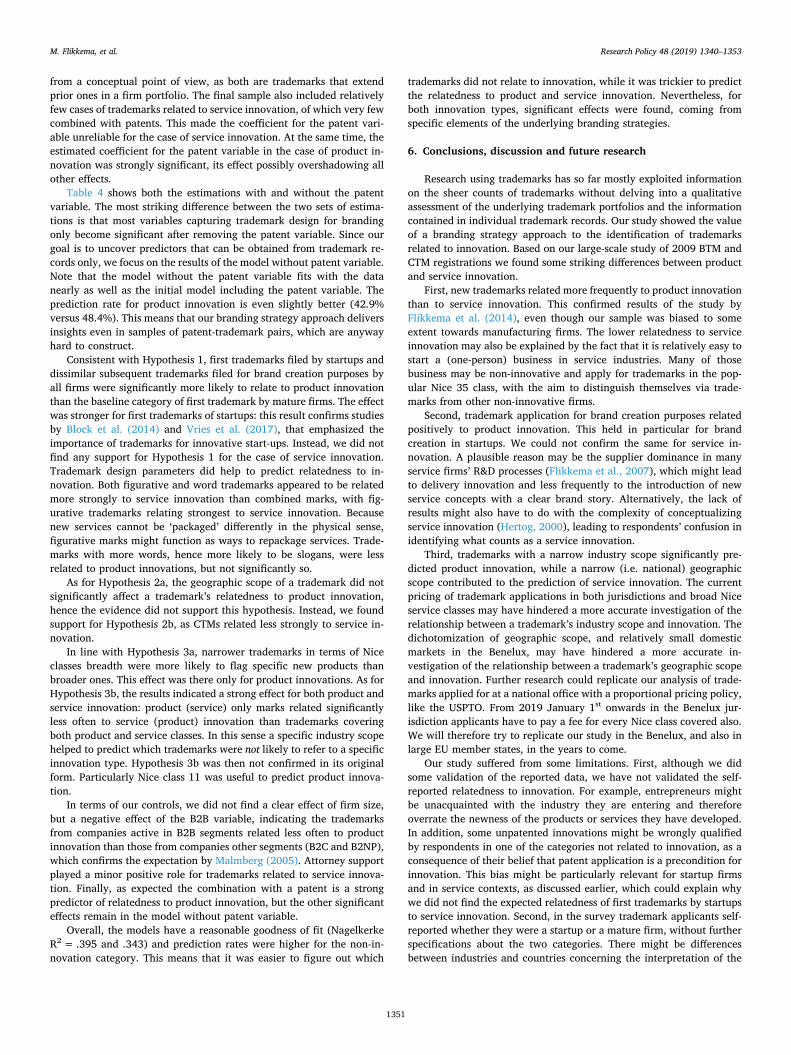
from a conceptual point of view, as both are trademarks that extendprior ones in a firm portfolio. The final sample also included relativelyfew cases of trademarks related to service innovation, of which very fewcombined with patents. This made the coefficient for the patent vari-able unreliable for the case of service innovation. At the same time, theestimated coefficient for the patent variable in the case of product in-novation was strongly significant, its effect possibly overshadowing allother effects.
Table 4 shows both the estimations with and without the patentvariable. The most striking difference between the two sets of estima-tions is that most variables capturing trademark design for brandingonly become significant after removing the patent variable. Since ourgoal is to uncover predictors that can be obtained from trademark re-cords only, we focus on the results of the model without patent variable.Note that the model without the patent variable fits with the datanearly as well as the initial model including the patent variable. Theprediction rate for product innovation is even slightly better (42.9%versus 48.4%). This means that our branding strategy approach deliversinsights even in samples of patent-trademark pairs, which are anywayhard to construct.
Consistent with Hypothesis 1, first trademarks filed by startups anddissimilar subsequent trademarks filed for brand creation purposes byall firms were significantly more likely to relate to product innovationthan the baseline category of first trademark by mature firms. The effectwas stronger for first trademarks of startups: this result confirms studiesby Block et al. (2014) and Vries et al. (2017), that emphasized theimportance of trademarks for innovative start-ups. Instead, we did notfind any support for Hypothesis 1 for the case of service innovation.Trademark design parameters did help to predict relatedness to in-novation. Both figurative and word trademarks appeared to be relatedmore strongly to service innovation than combined marks, with fig-urative trademarks relating strongest to service innovation. Becausenew services cannot be ‘packaged’ differently in the physical sense,figurative marks might function as ways to repackage services. Trade-marks with more words, hence more likely to be slogans, were lessrelated to product innovations, but not significantly so.
As for Hypothesis 2a, the geographic scope of a trademark did notsignificantly affect a trademark’s relatedness to product innovation,hence the evidence did not support this hypothesis. Instead, we foundsupport for Hypothesis 2b, as CTMs related less strongly to service in-novation.
In line with Hypothesis 3a, narrower trademarks in terms of Niceclasses breadth were more likely to flag specific new products thanbroader ones. This effect was there only for product innovations. As forHypothesis 3b, the results indicated a strong effect for both product andservice innovation: product (service) only marks related significantlyless often to service (product) innovation than trademarks coveringboth product and service classes. In this sense a specific industry scopehelped to predict which trademarks were not likely to refer to a specificinnovation type. Hypothesis 3b was then not confirmed in its originalform. Particularly Nice class 11 was useful to predict product innova-tion.
In terms of our controls, we did not find a clear effect of firm size,but a negative effect of the B2B variable, indicating the trademarksfrom companies active in B2B segments related less often to productinnovation than those from companies other segments (B2C and B2NP),which confirms the expectation by Malmberg (2005). Attorney supportplayed a minor positive role for trademarks related to service innova-tion. Finally, as expected the combination with a patent is a strongpredictor of relatedness to product innovation, but the other significanteffects remain in the model without patent variable.
Overall, the models have a reasonable goodness of fit (NagelkerkeR2 = .395 and .343) and prediction rates were higher for the non-in-novation category. This means that it was easier to figure out which
trademarks did not relate to innovation, while it was trickier to predictthe relatedness to product and service innovation. Nevertheless, forboth innovation types, significant effects were found, coming fromspecific elements of the underlying branding strategies.
6. Conclusions, discussion and future research
Research using trademarks has so far mostly exploited informationon the sheer counts of trademarks without delving into a qualitativeassessment of the underlying trademark portfolios and the informationcontained in individual trademark records. Our study showed the valueof a branding strategy approach to the identification of trademarksrelated to innovation. Based on our large-scale study of 2009 BTM andCTM registrations we found some striking differences between productand service innovation.
First, new trademarks related more frequently to product innovationthan to service innovation. This confirmed results of the study byFlikkema et al. (2014), even though our sample was biased to someextent towards manufacturing firms. The lower relatedness to serviceinnovation may also be explained by the fact that it is relatively easy tostart a (one-person) business in service industries. Many of thosebusiness may be non-innovative and apply for trademarks in the pop-ular Nice 35 class, with the aim to distinguish themselves via trade-marks from other non-innovative firms.
Second, trademark application for brand creation purposes relatedpositively to product innovation. This held in particular for brandcreation in startups. We could not confirm the same for service in-novation. A plausible reason may be the supplier dominance in manyservice firms’ R&D processes (Flikkema et al., 2007), which might leadto delivery innovation and less frequently to the introduction of newservice concepts with a clear brand story. Alternatively, the lack ofresults might also have to do with the complexity of conceptualizingservice innovation (Hertog, 2000), leading to respondents’ confusion inidentifying what counts as a service innovation.
Third, trademarks with a narrow industry scope significantly pre-dicted product innovation, while a narrow (i.e. national) geographicscope contributed to the prediction of service innovation. The currentpricing of trademark applications in both jurisdictions and broad Niceservice classes may have hindered a more accurate investigation of therelationship between a trademark’s industry scope and innovation. Thedichotomization of geographic scope, and relatively small domesticmarkets in the Benelux, may have hindered a more accurate in-vestigation of the relationship between a trademark’s geographic scopeand innovation. Further research could replicate our analysis of trade-marks applied for at a national office with a proportional pricing policy,like the USPTO. From 2019 January 1st onwards in the Benelux jur-isdiction applicants have to pay a fee for every Nice class covered also.We will therefore try to replicate our study in the Benelux, and also inlarge EU member states, in the years to come.
Our study suffered from some limitations. First, although we didsome validation of the reported data, we have not validated the self-reported relatedness to innovation. For example, entrepreneurs mightbe unacquainted with the industry they are entering and thereforeoverrate the newness of the products or services they have developed.In addition, some unpatented innovations might be wrongly qualifiedby respondents in one of the categories not related to innovation, as aconsequence of their belief that patent application is a precondition forinnovation. This bias might be particularly relevant for startup firmsand in service contexts, as discussed earlier, which could explain whywe did not find the expected relatedness of first trademarks by startupsto service innovation. Second, in the survey trademark applicants self-reported whether they were a startup or a mature firm, without furtherspecifications about the two categories. There might be differencesbetween industries and countries concerning the interpretation of the
M. Flikkema, et al. Research Policy 48 (2019) 1340–1353
1351
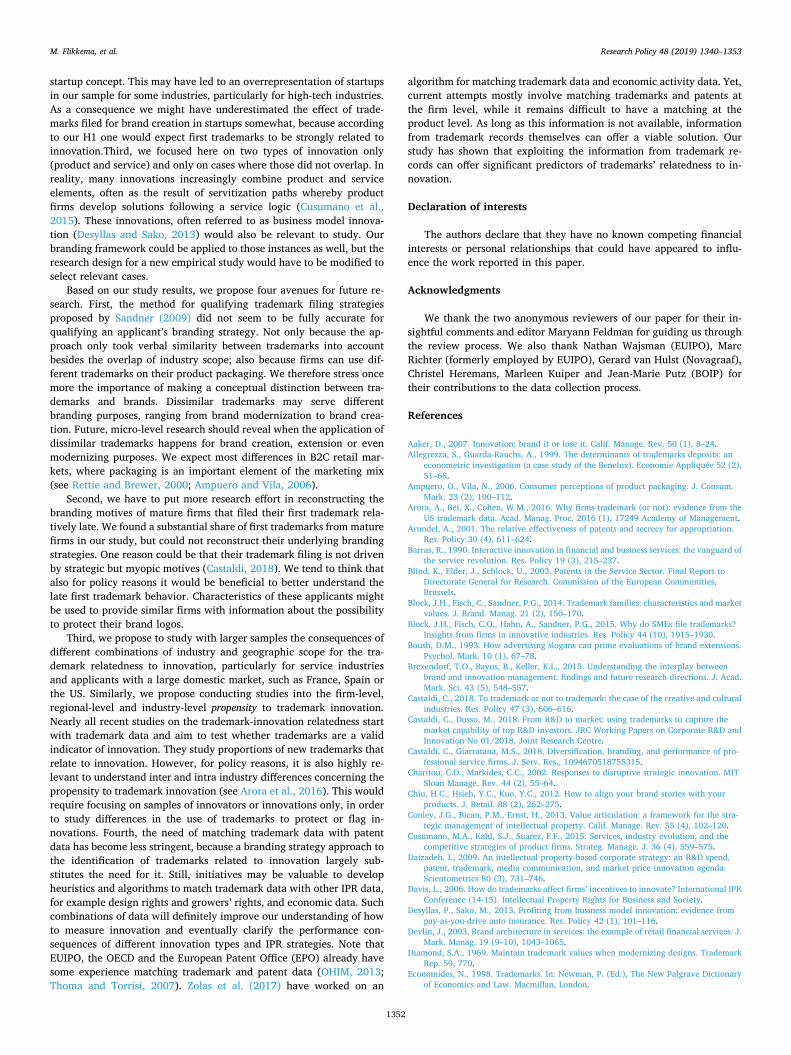
startup concept. This may have led to an overrepresentation of startupsin our sample for some industries, particularly for high-tech industries.As a consequence we might have underestimated the effect of trade-marks filed for brand creation in startups somewhat, because accordingto our H1 one would expect first trademarks to be strongly related toinnovation.Third, we focused here on two types of innovation only(product and service) and only on cases where those did not overlap. Inreality, many innovations increasingly combine product and serviceelements, often as the result of servitization paths whereby productfirms develop solutions following a service logic (Cusumano et al.,2015). These innovations, often referred to as business model innova-tion (Desyllas and Sako, 2013) would also be relevant to study. Ourbranding framework could be applied to those instances as well, but theresearch design for a new empirical study would have to be modified toselect relevant cases.
Based on our study results, we propose four avenues for future re-search. First, the method for qualifying trademark filing strategiesproposed by Sandner (2009) did not seem to be fully accurate forqualifying an applicant’s branding strategy. Not only because the ap-proach only took verbal similarity between trademarks into accountbesides the overlap of industry scope; also because firms can use dif-ferent trademarks on their product packaging. We therefore stress oncemore the importance of making a conceptual distinction between tra-demarks and brands. Dissimilar trademarks may serve differentbranding purposes, ranging from brand modernization to brand crea-tion. Future, micro-level research should reveal when the application ofdissimilar trademarks happens for brand creation, extension or evenmodernizing purposes. We expect most differences in B2C retail mar-kets, where packaging is an important element of the marketing mix(see Rettie and Brewer, 2000; Ampuero and Vila, 2006).
Second, we have to put more research effort in reconstructing thebranding motives of mature firms that filed their first trademark rela-tively late. We found a substantial share of first trademarks from maturefirms in our study, but could not reconstruct their underlying brandingstrategies. One reason could be that their trademark filing is not drivenby strategic but myopic motives (Castaldi, 2018). We tend to think thatalso for policy reasons it would be beneficial to better understand thelate first trademark behavior. Characteristics of these applicants mightbe used to provide similar firms with information about the possibilityto protect their brand logos.
Third, we propose to study with larger samples the consequences ofdifferent combinations of industry and geographic scope for the tra-demark relatedness to innovation, particularly for service industriesand applicants with a large domestic market, such as France, Spain orthe US. Similarly, we propose conducting studies into the firm-level,regional-level and industry-level propensity to trademark innovation.Nearly all recent studies on the trademark-innovation relatedness startwith trademark data and aim to test whether trademarks are a validindicator of innovation. They study proportions of new trademarks thatrelate to innovation. However, for policy reasons, it is also highly re-levant to understand inter and intra industry differences concerning thepropensity to trademark innovation (see Arora et al., 2016). This wouldrequire focusing on samples of innovators or innovations only, in orderto study differences in the use of trademarks to protect or flag in-novations. Fourth, the need of matching trademark data with patentdata has become less stringent, because a branding strategy approach tothe identification of trademarks related to innovation largely sub-stitutes the need for it. Still, initiatives may be valuable to developheuristics and algorithms to match trademark data with other IPR data,for example design rights and growers’ rights, and economic data. Suchcombinations of data will definitely improve our understanding of howto measure innovation and eventually clarify the performance con-sequences of different innovation types and IPR strategies. Note thatEUIPO, the OECD and the European Patent Office (EPO) already havesome experience matching trademark and patent data (OHIM, 2013;Thoma and Torrisi, 2007). Zolas et al. (2017) have worked on an
algorithm for matching trademark data and economic activity data. Yet,current attempts mostly involve matching trademarks and patents atthe firm level, while it remains difficult to have a matching at theproduct level. As long as this information is not available, informationfrom trademark records themselves can offer a viable solution. Ourstudy has shown that exploiting the information from trademark re-cords can offer significant predictors of trademarks’ relatedness to in-novation.
Declaration of interests
The authors declare that they have no known competing financialinterests or personal relationships that could have appeared to influ-ence the work reported in this paper.
Acknowledgments
We thank the two anonymous reviewers of our paper for their in-sightful comments and editor Maryann Feldman for guiding us throughthe review process. We also thank Nathan Wajsman (EUIPO), MarcRichter (formerly employed by EUIPO), Gerard van Hulst (Novagraaf),Christel Heremans, Marleen Kuiper and Jean-Marie Putz (BOIP) fortheir contributions to the data collection process.
References
Aaker, D., 2007. Innovation: brand it or lose it. Calif. Manage. Rev. 50 (1), 8–24.Allegrezza, S., Guarda-Rauchs, A., 1999. The determinants of trademarks deposits: an
econometric investigation (a case study of the Benelux). Economie Appliquée 52 (2),51–68.
Ampuero, O., Vila, N., 2006. Consumer perceptions of product packaging. J. Consum.Mark. 23 (2), 100–112.
Arora, A., Bei, X., Cohen, W.M., 2016. Why firms trademark (or not): evidence from theUS trademark data. Acad. Manag. Proc. 2016 (1), 17249 Academy of Management.
Arundel, A., 2001. The relative effectiveness of patents and secrecy for appropriation.Res. Policy 30 (4), 611–624.
Barras, R., 1990. Interactive innovation in financial and business services: the vanguard ofthe service revolution. Res. Policy 19 (3), 215–237.
Blind, K., Elder, J., Schlock, U., 2003. Patents in the Service Sector. Final Report toDirectorate General for Research. Commission of the European Communities,Brussels.
Block, J.H., Fisch, C., Sandner, P.G., 2014. Trademark families: characteristics and marketvalues. J. Brand. Manag. 21 (2), 150–170.
Block, J.H., Fisch, C.O., Hahn, A., Sandner, P.G., 2015. Why do SMEs file trademarks?Insights from firms in innovative industries. Res. Policy 44 (10), 1915–1930.
Boush, D.M., 1993. How advertising slogans can prime evaluations of brand extensions.Psychol. Mark. 10 (1), 67–78.
Brexendorf, T.O., Bayus, B., Keller, K.L., 2015. Understanding the interplay betweenbrand and innovation management: findings and future research directions. J. Acad.Mark. Sci. 43 (5), 548–557.
Castaldi, C., 2018. To trademark or not to trademark: the case of the creative and culturalindustries. Res. Policy 47 (3), 606–616.
Castaldi, C., Dosso, M., 2018. From R&D to market: using trademarks to capture themarket capability of top R&D investors. JRC Working Papers on Corporate R&D andInnovation No 01/2018. Joint Research Centre.
Castaldi, C., Giarratana, M.S., 2018. Diversification, branding, and performance of pro-fessional service firms. J. Serv. Res., 1094670518755315.
Charitou, C.D., Markides, C.C., 2002. Responses to disruptive strategic innovation. MITSloan Manage. Rev. 44 (2), 55–64.
Chiu, H.C., Hsieh, Y.C., Kuo, Y.C., 2012. How to align your brand stories with yourproducts. J. Retail. 88 (2), 262–275.
Conley, J.G., Bican, P.M., Ernst, H., 2013. Value articulation: a framework for the stra-tegic management of intellectual property. Calif. Manage. Rev. 55 (4), 102–120.
Cusumano, M.A., Kahl, S.J., Suarez, F.F., 2015. Services, industry evolution, and thecompetitive strategies of product firms. Strateg. Manage. J. 36 (4), 559–575.
Daizadeh, I., 2009. An intellectual property-based corporate strategy: an R&D spend,patent, trademark, media communication, and market price innovation agenda.Scientometrics 80 (3), 731–746.
Davis, L., 2006. How do trademarks affect firms’ incentives to innovate? International IPRConference (14-15). Intellectual Property Rights for Business and Society.
Desyllas, P., Sako, M., 2013. Profiting from business model innovation: evidence frompay-as-you-drive auto insurance. Res. Policy 42 (1), 101–116.
Devlin, J., 2003. Brand architecture in services: the example of retail financial services. J.Mark. Manag. 19 (9–10), 1043–1065.
Diamond, S.A., 1969. Maintain trademark values when modernizing designs. TrademarkRep. 59, 770.
Economides, N., 1998. Trademarks. In: Newman, P. (Ed.), The New Palgrave Dictionaryof Economics and Law. Macmillan, London.
M. Flikkema, et al. Research Policy 48 (2019) 1340–1353
1352
European Commission, 2015. Innovation Union Scoreboard 2015, European Commission,Directorate-General for Internal Market. Industry, Entrepreneurship and SMEs.
Fink, C., Hall, B.H., Helmers, C., 2018. Intellectual Property Use in Middle IncomeCountries: The Case of Chile(No. w24348). National Bureau of Economic Research.
Flikkema, M., Jansen, P., Van Der Sluis, L., 2007. Identifying neo-Schumpeterian in-novation in service firms: a conceptual essay with a novel classification. Econ. Innov.New Technol. 16 (7), 541–558.
Flikkema, M.J., de Man, A.-P., Castaldi, C., 2014. Are trademark counts a valid indicatorof innovation? Results of an in-depth study of New Benelux trademarks filed by SMEs.Ind. Innov. 21 (4), 310–331.
Fosfuri, A., Giarratana, M.S., 2009. Masters of war: rivals’ product innovation and newadvertising in mature product markets. Manage. Sci. 55 (2), 181–191.
Freeman, J., Engel, J.S., 2007. Models of innovation: startups and mature corporations.Calif. Manage. Rev. 50 (1), 94–119.
Gallouj, F., Weinstein, O., 1997. Innovation in services. Res. Policy 26 (4-5), 537–556.Giarratana, M.S., Torrisi, S., 2010. Foreign entry and survival in a knowledge-intensive
market: emerging economy countries’ international linkages, technology compe-tences, and firm experience. Strateg. Entrep. J. 4 (1), 85–104.
Götsch, M., Hipp, C., 2012. Measurement of innovation activities in the knowledge-in-tensive services industry: a trademark approach. Serv. Ind. J. 32 (13), 2167–2184.
Graham, S.J., Hancock, G., 2014. The USPTO economics research agenda. J. Technol.Transf. 39 (3), 335–344.
Greer, D.F., 1979. The economic benefits and costs of trademarks: lessons for the de-veloping countries. World Dev. 7 (7), 683–704.
Helmers, C., Abud, M.J., Fink, C., 2013. Trademark squatters: evidence from Chile.Presentation at the EPIP Association 8th Annual Conference, 2013.
Henderson, P.W., Cote, J.A., 1998. Guidelines for selecting or modifying logos. J. Mark.14–30.
Hertog, P. den, 2000. Knowledge-intensive business services as co-producers of innova-tion. Int. J. Innov. Manag. 4, 491–528.
Hertog, den, P., Van der Aa, W., De Jong, M.W., 2010. Capabilities for managing serviceinnovation: towards a conceptual framework. J. Serv. Manag. 21 (4), 490–514.
Hitt, M.A., Hoskisson, R.E., Kim, H., 1997. International diversification: effects on in-novation and firm performance in product-diversified firms. Acad. Manag. J. 40 (4),767–798.
Hosmer Jr, D.W., Lemeshow, S., Sturdivant, R.X., 2013. Applied Logistic Regression.Wiley.com.
Jain, D.C., Conley, J.G., 2014. Patent expiry and pharmaceutical market opportunities atthe nexus of pricing and innovation policy. Innovation and Marketing in thePharmaceutical Industry. Springer, New York, pp. 255–285.
Jayachandran, S., Kaufman, P., Kumar, V., Hewett, K., 2013. Brand licensing: what drivesroyalty rates? J. Mark. 77 (5), 108–122.
Jennewein, K., 2005. Intellectual Property Management: The Role of Technology-Brandsin the Appropriation of Technological Innovation. Physica-Verlag, Heidelberg.
Jensen, P.H., Webster, E., 2009. Another look at the relationship between innovationproxies. Aust. Econ. Pap. 48 (3), 252–269.
Kocyigit, O., Ringle, C.M., 2011. The impact of brand confusion on sustainable brandsatisfaction and private label proneness: a subtle decay of brand equity. J. Brand.Manag. 19 (3), 195–212.
Leiponen, A., Byma, J., 2009. If you cannot block, you better run: small firms, cooperativeinnovation, and appropriation strategies. Res. Policy 38 (9), 1478–1488.
Madsen, T.K., Servais, P., 1997. The internationalization of born globals: an evolutionaryprocess? Int. Bus. Rev. 6 (6), 561–583.
Magnusson, P.R., Matthing, J., Kristensson, P., 2003. Managing user involvement inservice innovation: experiments with innovating end users. J. Serv. Res. 6 (2),111–124.
Malecki, E.J., 2014. The geography of innovation. Handbook of Regional Science.Springer, Berlin Heidelberg, pp. 375–389.
Malmberg, C., 2005. Trademark Statistics as Innovation Indicator? A Micro Study.CIRCLE, WP 2005/17.
Melnyk, V., Giarratana, M., Torres, A., 2014. Marking your trade: cultural factors in theprolongation of trademarks. J. Bus. Res. 67 (4), 478–485.
Mendonça, S., Pereira, T.S., Godinho, M.M., 2004. Trademarks as an indicator of in-novation and industrial change. Res. Policy 33, 1385–1404.
Millot, V., 2009. Trademarks as an Indicator of Product and Marketing Innovations (No.2009/6). OECD Publishing.
Millot, V., 2012. Trademark Strategies and Innovative Activities. Ph.D. thesis. Universitéde Strasbourg.
Nam, Y., Barnett, G.A., 2011. Globalization of technology: network analysis of globalpatents and trademarks. Technol. Forecast. Soc. Change 78 (8), 1471–1485.
Nishimura, R., Wagner, J., Elliott, M., 2016. Alternative indicators for the risk of non‐-response bias: a simulation study. Int. Stat. Rev. 84 (1), 43–62.
OECD, 2005. Proposed Guidelines for Collecting and Interpreting TechnologicalInnovation Data (Oslo Manual), 3rd Version. OECD, Paris.
OHIM, 2013. Intellectual property rights intensive industries: contribution to economicperformance and employment in the European Union. Industry-Level AnalysisReport, September 2013.
Petty, R.D., Leong, S.H., Lwin, M.O., 2010. Slogans: US and EU legal protection for slo-gans that identify and promote the brand. Int. J. Advert. 29 (3), 473–500.
Pike, A., 2013. Economic geographies of brands and branding. Econ. Geogr. 89 (4),317–339.
Ramello, G.B., 2006. What’s in a sign? Trademark law and economic theory. J. Econ.Surv. 20 (4), 547–565.
Reitzig, M., 2004. Strategic management of intellectual property. Sloan ManagementReview (Spring), 35–40.
Rettie, R., Brewer, C., 2000. The verbal and visual components of package design. J. Prod.Brand. Manag. 9 (1), 56–70.
Rogers, M., Greenhalgh, C., Helmers, C., 2007. An Analysis of the Association Betweenthe Use of Intellectual Property by UK SMEs and Subsequent Performance. UKIntellectual Property Office, UK.
Rui, T., 2013. The concept definition of the trademark preemptive registration and itscorrection. Chongqing Social Sci. 1, 005.
Rujas, J., 1999. Trade marks: complementary to patents. World Pat. Inf. 21, 35–39.Sanchez, R., 2004. Conceptual analysis of brand architecture and relationships within
product categories. J. Brand. Manag. 11 (3), 233–247.Sandner, P.G., 2009. Identification of trademark filing strategies: creating, hedging,
modernizing, and extending brands. Trademark Reporter 99, 1257.Sandner, P.G., Block, J., 2011. The market value of R&D, patents, and trademarks. Res.
Policy 40 (7), 969–985.Schautschick, P., Greenhalgh, C., 2016. Empirical studies of trademarks–the existing
economic literature. Econ. Innov. New Technol. 25 (4), 358–390.Schmoch, U., 2003. Service marks as novel innovation indicator. Res. Eval. 12, 149–156.Schmoch, U., Gauch, S., 2009. Service marks as indicators for innovation in knowledge-
based services. Res. Eval. 18 (4), 323–335.Schuhmacher, M.C., Kuester, S., 2012. Identification of lead user characteristics driving
the quality of service innovation ideas. Creat. Innov. Manag. 21 (4), 427–442.Seip, M., Castaldi, C., Flikkema, M.J., de Man, A.-P., 2018. The timing of trademark
application in innovation processes. Technovation 72–73, 34–45.Seip, M., Castaldi, C., Flikkema, M.J., de Man, A.-P., 2019. A taxonomy of firm-level IPR
application practices to inform policy debates. LEM working paper series 2019/3.Institute of Economics. Scuola Superiore Sant’Anna Pisa.
Shefer, D., Frenkel, A., 2005. R&D, firm size and innovation: an empirical analysis.Technovation 25 (1), 25–32.
Snoei, J., van der Linden, B., Seip, M., 2013. Intellectueel eigendom topsectoren -Octrooien, merken en modellen in de topsectoren naar provincie (No. A201316).Panteia. available at:. http://www.rvo.nl/sites/default/files/octrooiportal/2014/01/Intellectueel%20eigendom%20Topsectoren.
Somaya, D., Williamson, I.O., Zhang, X., 2007. Combining Patent Law Expertise with R&Dfor Patenting Performance. Organ. Sci. 18 (6), 922–937.
Statman, M., Tyebjee, T.T., 1981. Trademarks, patents, and innovation in the ethical drugindustry. J. Mark. 71–81.
Terziovski, M., 2002. Achieving performance excellence through an integrated strategy ofradical innovation and continuous improvement. Meas. Bus. Excell. 6 (2), 5–14.
Thoma, G., Torrisi, S., 2007. Creating powerful indicators for innovation studies withapproximate matching algorithms. A Test Based on PATSTAT and AmadeusDatabases. epip.eu/datacentre.php.
Townsend, J.D., Yeniyurt, S., Talay, M.B., 2009. Getting to global: an evolutionary per-spective of brand expansion in international markets. J. Int. Bus. Stud. 40 (4),539–558.
Vries, G. de, Pennings, E., Block, J.H., Fisch, C., 2017. Trademark or patent? The effects ofmarket concentration, customer type and venture capital financing on start-ups’ in-itial IP applications. Ind. Innov. 24 (4), 325–345.
WIPO, 2013. World Intellectual Property Report 2013 Brands – Reputation and Image inthe Global Marketplace.
Zhou, H., Sandner, P.G., Martinelli, S.L., Block, J.H., 2016. Patents, trademarks, and theircomplementarity in venture capital funding. Technovation 47, 14–22.
Zolas, N., Lybbert, T.J., Bhattacharyya, P., 2017. An ‘Algorithmic Links with Probabilities’Concordance for Trademarks with an Application Towards Bilateral IP Flows. WorldEcon. 40 (6), 1184–1213.
M. Flikkema, et al. Research Policy 48 (2019) 1340–1353
1353