trade-induced pollution transfers and implications for japan's investment and assistance
TRANSCRIPT

TRADE-INDUCED POLLUTION TRANSFERS 123[Asian Economic Journal 1998, Vol. 12 No. 3] 123[Asian Economic Journal 2000, Vol. 14 No. 2] 123
Trade-Induced Pollution Transfers andImplications for Japan’s Investment andAssistance *
Hiro LeeKobe University
David Roland-HolstMills College and CEPR
Traded commodities embody an environmental service, namely the amount ofpollution emitted domestically when goods are produced for export. Japan’s exten-sive economic ties with its Asian Pacific trading partners necessitate special con-sideration of trade and environment linkages. The data presented in this paperindicate that bilateral trade with Japan has resulted in substantial net transfers ofeffluent loads during the period 1981–95. To remedy environmental inequalityof this kind, we recommend the promotion of technology transfer from Japan todeveloping countries through foreign direct investment and development assistance.In a related context, results in the Appendix show how coordinating multilateraltrade liberalization with cost-effective environmental policy can achieve the twinobjectives of higher national income and environmental quality improvement.
I. Introduction
Greater environmental awareness has altered our perceptions of economicactivity in general and international trade in particular. Trade relations are nowroutinely scrutinized for their environmental implications, particularly when trad-ing partners are at different levels of development. Most commonly, these con-siderations have arisen in the contexts of standards for multilateral tradeagreements and secondary criteria for foreign direct investment and internationallending. A vast analytical and empirical literature has arisen around these issues,and they have emerged as an important component of global policy dialogue(e.g., Anderson, 1992, 1996; Bhagwati and Srinivasan, 1996; Low, 1992).
* We thank an anonymous referee for helpful comments. Any remaining errors are the soleresponsibility of the authors.
asej105 9/4/00, 4:34 PM123
ASIAN ECONOMIC JOURNAL 124
This paper elucidates another environmental dimension of trade, one that is byno means new but upon which we cast new light. By looking at an old environ-mental problem in a new way, we hope to stimulate more constructive policysolutions. In particular, we propose a new collaborative basis for foreign directinvestment (FDI) and official development assistance (ODA) that can confergreater benefits on both the origin and destination countries.
When exporters ship their goods abroad, they also ship an embodied environ-mental service, namely retention of the pollution caused by manufacturing theirproducts. Conversely, an importing country can transfer domestic pollution tothe exporter. Thus a dual perspective on trade flows emerges: every traded goodcorresponds to an embodied pollution service. As in the case of embodied factorservices, this dualism opens up a large area for theoretical work on implicit andexplicit environmental markets, resource, effluent, and environmental damagecost convergence, but this is not the focus of the present paper.
Using detailed trade statistics, we use this new perspective to examine theenvironmental implications of Japan’s bilateral trade. Not surprisingly, signifi-cant asymmetries emerge in the pollution content of this country’s imports andexports, particularly with respect to large natural resource/energy exporters.Although this does not appear to be the result of any deliberate policy, Japaneseconsumption is much more pollution-intensive than its production, the mainreason being imbalances in the effluent content of its imports and exports. Ulti-mately, then, Japanese consumers are contributing much more to global pollu-tion than their environmental conditions at home would indicate.
While Japanese consumption (particularly intermediate use) patterns bear sig-nificant responsibility for these imbalances, so does the advanced state of theeconomy and its industry, and herein lies a means to redress bilateral pollutionimbalances. Japan’s developing-country trading partners generally have morepollution-intensive exports and domestic production for two reasons. Firstly,their economies are at an earlier stage of development, and primary and indus-trial activities represent a larger share of GDP than in OECD countries. Sec-ondly, their technology is likely to be more pollution-intensive, and externalmarkets are simply leveraging these environmentally inferior techniques to thedetriment of everyone.
The more advanced countries generally, like Japan in the present discussion,can make an important contribution to global pollution levels and pollutioninequality. They can do this by promoting economic development generallyand technology transfer in particular. The former will inexorably shift thecomposition of GDP towards tertiary activities, while the latter will achieveflatter pollution trajectories for industrial expansion. More importantly, therole advanced countries play in this process can be beneficial to themselvesas well as to the emerging economies. Countries like Japan can promote tech-nology transfer in both FDI and ODA policy, securing new markets for greenertechnologies while facilitating overseas development and new investment
asej105 9/4/00, 4:34 PM124

TRADE-INDUCED POLLUTION TRANSFERS 125
opportunities.1 In this way, redressing bilateral pollution imbalances becomes acollaborative, win-win basis for development and international lending/invest-ment policy.
In Section II, we provide an overview of historical bilateral trade patterns forJapan. This information is then combined with pollution data to elucidate theunderlying trade in pollution services. With this empirical information, SectionIII then discusses how Japan can more effectively coordinate its developmentassistance and foreign investment policies to achieve the dual objectives ofeconomic expansion and environmental mitigation. Section IV is devoted toconclusions and discussion of extensions to this methodology. The Appendixprovides general equilibrium results of the effects of multilateral trade liberaliza-tion and cost-effective environmental policy on welfare and environmental quality.
II. International Trade in Pollution Services
In the context of international trade, linkages between economic activity and theenvironment become more complex. This is especially the case when trade ingoods and embodied pollution services are seen as dual to each other. Conven-tional notions of national welfare can be overturned, for example. A trade sur-plus might correspond to domestic pollution retention on behalf of millions offoreign consumers, while a deficit might arise from imports of environmentallyrisky goods produced elsewhere.2 Thus simple mercantilist notions of exportpromotion seem environmentally retrograde while excessive import dependencemight be promoted by green interests. Of course these ideas are still subject tothe usual fallacies, both in terms of inconsistent behavioural aggregation andnegative environmental externalities.
Although many economic activities occasion some negative environmentalconsequences through the uses of exhaustible resources and/or emissions ofpollution, the net effect of trade on the domestic environment depends upon thecomposition of trade and the pollution intensity of the goods under considera-tion. Thus a country can have a trade surplus or deficit and, depending uponthe composition of imports and exports, a surplus or deficit in services arisingfrom domestically retained pollution or other environmental degradation. In thiscontext, a winning country would be one that sustains a trade surplus and apollution service deficit, accumulating net income from abroad while transferring
1. In a somewhat different context, Hayami (2000) proposes that developed countries shouldprovide financial assistance to developing countries which implement anti-pollution policies. Havingfound that developing countries’ participation in achieving a given CO2 abatement target would leadto global efficiency gains and substantial reductions in abatement costs for the industrialized coun-tries, both the OECD (1995) and Coppel and Lee (1996) also recommend transfer payments todeveloping countries to encourage participation.2. Examples of the former are mining, forestry and other primary products. The latter wouldinclude, for example, Swiss imports of French nuclear energy.
asej105 9/4/00, 4:34 PM125

ASIAN ECONOMIC JOURNAL 126
more pollution to its trading partners than it retains at home. As we shall see inthis section, Japan is just such a country.
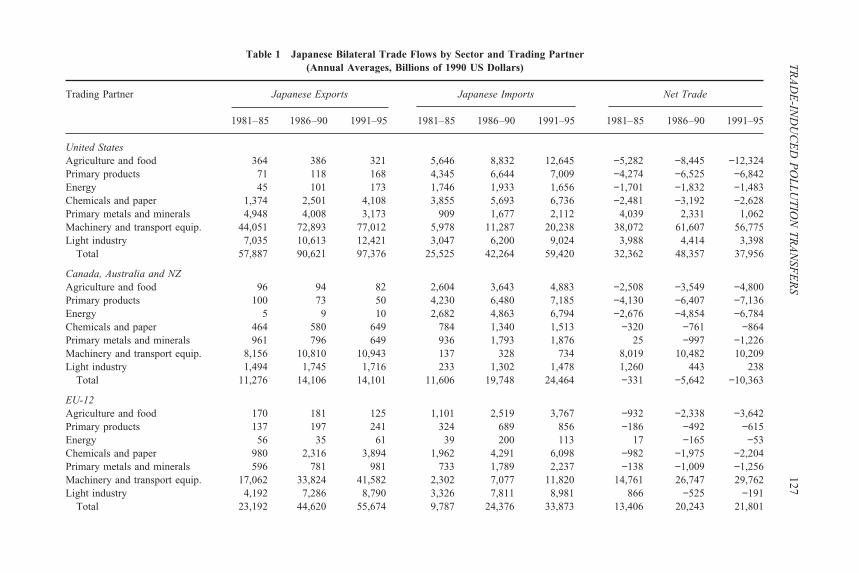
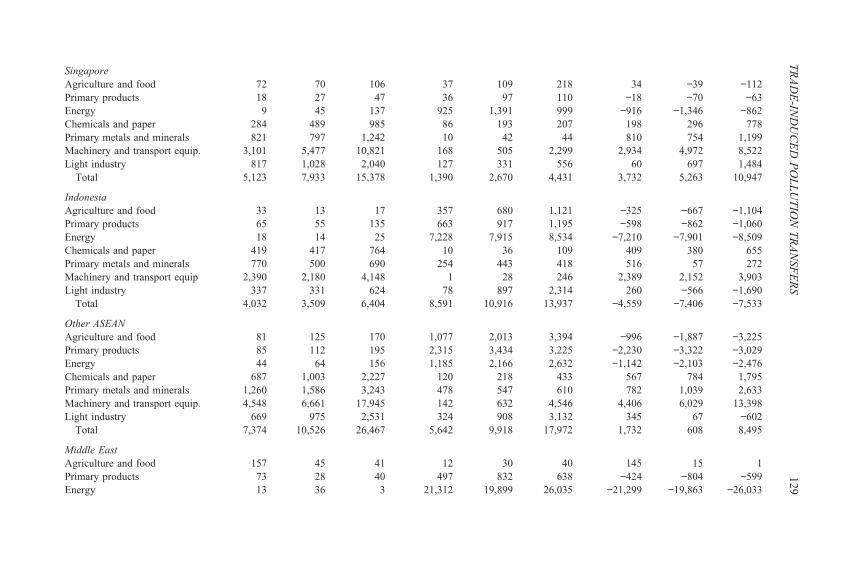
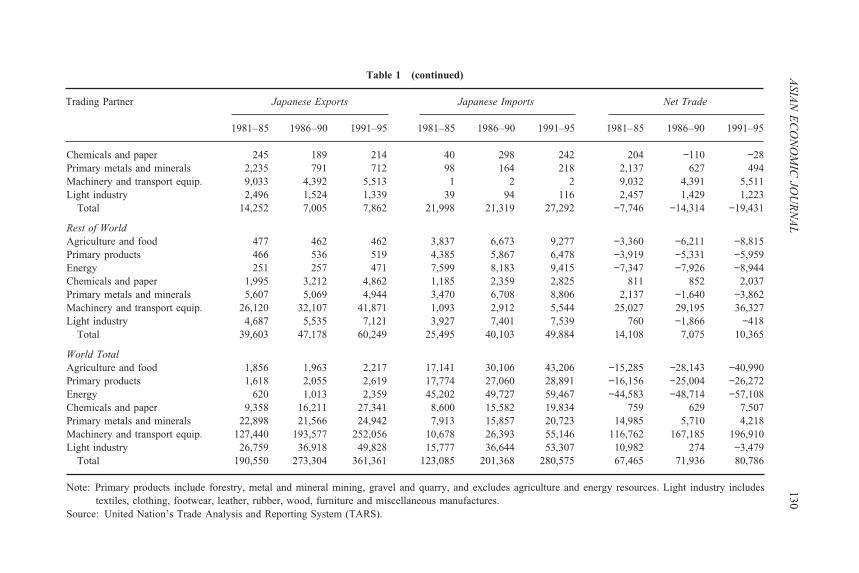
To improve understanding of Japan’s situation, it is useful to review detailedpatterns of its bilateral trade. Table 1 summarizes Japan’s trade flows, by sectorand trading partner, over the period 1981–95. Trade is disaggregated amongseven sectors and eleven individual and aggregated trading partners. All figuresare expressed in constant, 1990 US dollars. The patterns that emerge here arewell known to empirical trade economists and regional experts and do not re-quire much elaboration. It is enough to emphasize that, during this period, Japanwas a very successful export-oriented economy. Japan and most of the partnersconsidered here are relatively diversified, and patterns of comparative advantageare evident in persistent sectoral deficits with respect to some partners. Despitethis, however, Japan sustained growing surpluses in high value-added products,and the result has been consistent aggregate surpluses and prodigious long-termwealth accumulation.
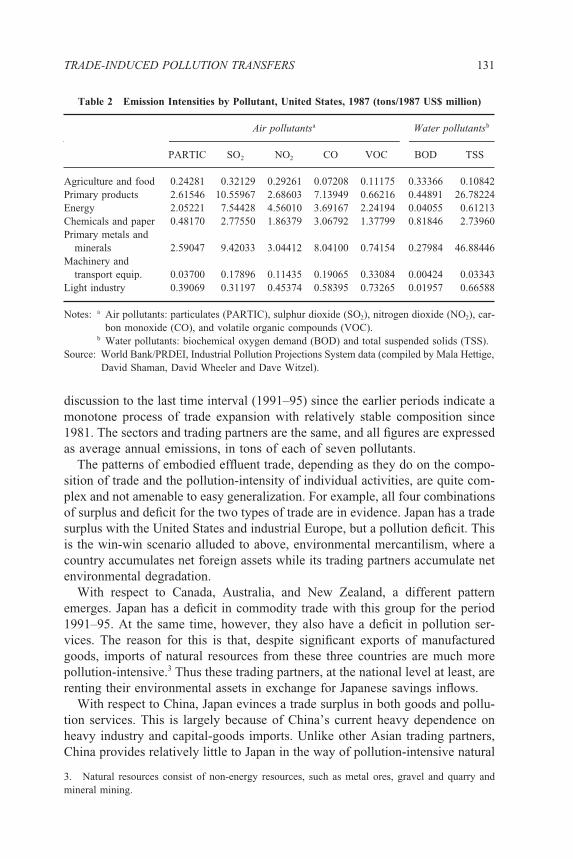
To examine the environmental implications of this trade pattern, we estimatethe pollution associated with production of the imports and exports representedin Table 1. More specifically, coefficients for effluent production per unit ofoutput were obtained from the Industrial Pollution Projection System (IPPS)database developed and maintained by the World Bank (see Hettige et al., 1994).These were in turn applied to the import and export data to determine inducedpollution in the country of origin.
Let εr,i,h, Xr,i, and Mr,s,i denote country r’s sectoral effluent intensities ofpollutant h, its exports of commodity i, and its imports of commodity i fromcountry s, respectively. Then the net embodied effluent content of traded com-modities (NEET) in country r is given by
NEETr,i,h = εr,i,hXr,i − Σsεs,i,hMr,s,i (1)
Because of the data constraint, we relied exclusively on pollution coefficientsfor the United States, thereby assuming that Japan and all its trading partnerswere using the same production technologies, i.e.,
εr,i,h = εUS,i,h ∀r (2)
The pollution coefficients in question are given in Table 2.While this approach simplified the present estimations, the likely result is that
environmental asymmetries have been underestimated. This is to be expectedbecause many Japanese technologies are significantly less pollution-intensivethan those of its developing-country trading partners. While such an approachcannot yield the most precise quantitative results, the qualitative support for ourconclusions would in most cases be even stronger if country-specific pollutioncoefficients were used.
Given the history of Japan’s bilateral trade and he conservative parameterestimates we have obtained, what are the induced patterns of trade in embodiedeffluents or pollution services? These are summarized in Table 3, confining
asej105 9/4/00, 4:34 PM126
TR
AD
E-IN
DU
CE
D P
OL
LU
TIO
N T
RA
NSF
ER
S127
Table 1 Japanese Bilateral Trade Flows by Sector and Trading Partner(Annual Averages, Billions of 1990 US Dollars)
Trading Partner Japanese Exports Japanese Imports Net Trade
1981–85 1986–90 1991–95 1981–85 1986–90 1991–95 1981–85 1986–90 1991–95
United StatesAgriculture and food 364 386 321 5,646 8,832 12,645 −5,282 −8,445 −12,324Primary products 71 118 168 4,345 6,644 7,009 −4,274 −6,525 −6,842Energy 45 101 173 1,746 1,933 1,656 −1,701 −1,832 −1,483Chemicals and paper 1,374 2,501 4,108 3,855 5,693 6,736 −2,481 −3,192 −2,628Primary metals and minerals 4,948 4,008 3,173 909 1,677 2,112 4,039 2,331 1,062Machinery and transport equip. 44,051 72,893 77,012 5,978 11,287 20,238 38,072 61,607 56,775Light industry 7,035 10,613 12,421 3,047 6,200 9,024 3,988 4,414 3,398
Total 57,887 90,621 97,376 25,525 42,264 59,420 32,362 48,357 37,956
Canada, Australia and NZAgriculture and food 96 94 82 2,604 3,643 4,883 −2,508 −3,549 −4,800Primary products 100 73 50 4,230 6,480 7,185 −4,130 −6,407 −7,136Energy 5 9 10 2,682 4,863 6,794 −2,676 −4,854 −6,784Chemicals and paper 464 580 649 784 1,340 1,513 −320 −761 −864Primary metals and minerals 961 796 649 936 1,793 1,876 25 −997 −1,226Machinery and transport equip. 8,156 10,810 10,943 137 328 734 8,019 10,482 10,209Light industry 1,494 1,745 1,716 233 1,302 1,478 1,260 443 238
Total 11,276 14,106 14,101 11,606 19,748 24,464 −331 −5,642 −10,363
EU-12Agriculture and food 170 181 125 1,101 2,519 3,767 −932 −2,338 −3,642Primary products 137 197 241 324 689 856 −186 −492 −615Energy 56 35 61 39 200 113 17 −165 −53Chemicals and paper 980 2,316 3,894 1,962 4,291 6,098 −982 −1,975 −2,204Primary metals and minerals 596 781 981 733 1,789 2,237 −138 −1,009 −1,256Machinery and transport equip. 17,062 33,824 41,582 2,302 7,077 11,820 14,761 26,747 29,762Light industry 4,192 7,286 8,790 3,326 7,811 8,981 866 −525 −191
Total 23,192 44,620 55,674 9,787 24,376 33,873 13,406 20,243 21,801
asej1059/4/00, 4:34 P
M127

ASIA
N E
CO
NO
MIC
JOU
RN
AL
128Table 1 (continued)
Trading Partner Japanese Exports Japanese Imports Net Trade
1981–85 1986–90 1991–95 1981–85 1986–90 1991–95 1981–85 1986–90 1991–95
China (including Hong Kong)Agriculture and food 189 289 490 741 1,837 3,542 −552 −1,547 −3,052Primary products 268 300 561 665 1,362 1,420 −397 −1,062 −859Energy 20 84 450 2,163 2,547 2,540 −2,142 −2,463 −2,090Chemicals and paper 1,191 1,832 3,385 253 516 757 938 1,316 2,628Primary metals and minerals 3,391 3,356 4,025 216 583 1,437 3,175 2,773 2,588Machinery and transport equip. 6,458 9,531 19,461 88 475 2,872 6,370 9,056 16,589Light industry 3,035 4,214 7,153 1,771 4,418 12,591 1,264 −204 −5,439
Total 14,552 19,605 35,525 5,897 11,737 25,158 8,656 7,868 10,366
KoreaAgriculture and food 97 42 144 760 1,538 1,471 −663 −1,496 −1,327Primary products 192 329 375 116 328 369 77 2 6Energy 103 266 554 275 557 724 −172 −291 −170Chemicals and paper 1,009 2,028 3,143 170 362 562 840 1,666 2,581Primary metals and minerals 1,257 1,971 2,488 629 1,620 2,159 628 351 328Machinery and transport equip. 3,341 8,288 11,089 391 1,601 3,594 2,949 6,687 7,495Light industry 1,219 2,095 3,201 1,688 4,375 4,571 −469 −2,280 −1,371
Total 7,219 15,020 20,993 4,028 10,381 13,451 3,191 4,639 7,542
TaiwanAgriculture and food 122 256 260 969 2,234 2,848 −847 −1,978 −2,588Primary products 142 280 289 199 411 405 −57 −131 −116Energy 55 101 318 48 71 22 6 30 295Chemicals and paper 710 1,646 3,108 134 274 352 575 1,372 2,756Primary metals and minerals 1,053 1,913 2,794 179 490 807 874 1,423 1,987Machinery and transport equip. 3,181 7,414 11,669 378 1,548 3,251 2,803 5,866 8,418Light industry 777 1,570 2,894 1,217 2,906 3,006 −440 −1,336 −112
Total 6,040 13,180 21,331 3,125 7,935 10,691 2,915 5,245 10,640
asej1059/4/00, 4:34 P
M128
TR
AD
E-IN
DU
CE
D P
OL
LU
TIO
N T
RA
NSF
ER
S129
SingaporeAgriculture and food 72 70 106 37 109 218 34 −39 −112Primary products 18 27 47 36 97 110 −18 −70 −63Energy 9 45 137 925 1,391 999 −916 −1,346 −862Chemicals and paper 284 489 985 86 193 207 198 296 778Primary metals and minerals 821 797 1,242 10 42 44 810 754 1,199Machinery and transport equip. 3,101 5,477 10,821 168 505 2,299 2,934 4,972 8,522Light industry 817 1,028 2,040 127 331 556 60 697 1,484
Total 5,123 7,933 15,378 1,390 2,670 4,431 3,732 5,263 10,947
IndonesiaAgriculture and food 33 13 17 357 680 1,121 −325 −667 −1,104Primary products 65 55 135 663 917 1,195 −598 −862 −1,060Energy 18 14 25 7,228 7,915 8,534 −7,210 −7,901 −8,509Chemicals and paper 419 417 764 10 36 109 409 380 655Primary metals and minerals 770 500 690 254 443 418 516 57 272Machinery and transport equip 2,390 2,180 4,148 1 28 246 2,389 2,152 3,903Light industry 337 331 624 78 897 2,314 260 −566 −1,690
Total 4,032 3,509 6,404 8,591 10,916 13,937 −4,559 −7,406 −7,533
Other ASEANAgriculture and food 81 125 170 1,077 2,013 3,394 −996 −1,887 −3,225Primary products 85 112 195 2,315 3,434 3,225 −2,230 −3,322 −3,029Energy 44 64 156 1,185 2,166 2,632 −1,142 −2,103 −2,476Chemicals and paper 687 1,003 2,227 120 218 433 567 784 1,795Primary metals and minerals 1,260 1,586 3,243 478 547 610 782 1,039 2,633Machinery and transport equip. 4,548 6,661 17,945 142 632 4,546 4,406 6,029 13,398Light industry 669 975 2,531 324 908 3,132 345 67 −602
Total 7,374 10,526 26,467 5,642 9,918 17,972 1,732 608 8,495
Middle EastAgriculture and food 157 45 41 12 30 40 145 15 1Primary products 73 28 40 497 832 638 −424 −804 −599Energy 13 36 3 21,312 19,899 26,035 −21,299 −19,863 −26,033
asej1059/4/00, 4:35 P
M129
ASIA
N E
CO
NO
MIC
JOU
RN
AL
130
Chemicals and paper 245 189 214 40 298 242 204 −110 −28Primary metals and minerals 2,235 791 712 98 164 218 2,137 627 494Machinery and transport equip. 9,033 4,392 5,513 1 2 2 9,032 4,391 5,511Light industry 2,496 1,524 1,339 39 94 116 2,457 1,429 1,223
Total 14,252 7,005 7,862 21,998 21,319 27,292 −7,746 −14,314 −19,431
Rest of WorldAgriculture and food 477 462 462 3,837 6,673 9,277 −3,360 −6,211 −8,815Primary products 466 536 519 4,385 5,867 6,478 −3,919 −5,331 −5,959Energy 251 257 471 7,599 8,183 9,415 −7,347 −7,926 −8,944Chemicals and paper 1,995 3,212 4,862 1,185 2,359 2,825 811 852 2,037Primary metals and minerals 5,607 5,069 4,944 3,470 6,708 8,806 2,137 −1,640 −3,862Machinery and transport equip. 26,120 32,107 41,871 1,093 2,912 5,544 25,027 29,195 36,327Light industry 4,687 5,535 7,121 3,927 7,401 7,539 760 −1,866 −418
Total 39,603 47,178 60,249 25,495 40,103 49,884 14,108 7,075 10,365
World TotalAgriculture and food 1,856 1,963 2,217 17,141 30,106 43,206 −15,285 −28,143 −40,990Primary products 1,618 2,055 2,619 17,774 27,060 28,891 −16,156 −25,004 −26,272Energy 620 1,013 2,359 45,202 49,727 59,467 −44,583 −48,714 −57,108Chemicals and paper 9,358 16,211 27,341 8,600 15,582 19,834 759 629 7,507Primary metals and minerals 22,898 21,566 24,942 7,913 15,857 20,723 14,985 5,710 4,218Machinery and transport equip. 127,440 193,577 252,056 10,678 26,393 55,146 116,762 167,185 196,910Light industry 26,759 36,918 49,828 15,777 36,644 53,307 10,982 274 −3,479
Total 190,550 273,304 361,361 123,085 201,368 280,575 67,465 71,936 80,786
Note: Primary products include forestry, metal and mineral mining, gravel and quarry, and excludes agriculture and energy resources. Light industry includestextiles, clothing, footwear, leather, rubber, wood, furniture and miscellaneous manufactures.
Source: United Nation’s Trade Analysis and Reporting System (TARS).
Table 1 (continued)
Trading Partner Japanese Exports Japanese Imports Net Trade
1981–85 1986–90 1991–95 1981–85 1986–90 1991–95 1981–85 1986–90 1991–95
asej1059/4/00, 4:35 P
M130
TRADE-INDUCED POLLUTION TRANSFERS 131
Table 2 Emission Intensities by Pollutant, United States, 1987 (tons/1987 US$ million)
Air pollutantsa Water pollutantsb
PARTIC SO2 NO2 CO VOC BOD TSS
Agriculture and food 0.24281 0.32129 0.29261 0.07208 0.11175 0.33366 0.10842Primary products 2.61546 10.55967 2.68603 7.13949 0.66216 0.44891 26.78224Energy 2.05221 7.54428 4.56010 3.69167 2.24194 0.04055 0.61213Chemicals and paper 0.48170 2.77550 1.86379 3.06792 1.37799 0.81846 2.73960Primary metals and
minerals 2.59047 9.42033 3.04412 8.04100 0.74154 0.27984 46.88446Machinery and
transport equip. 0.03700 0.17896 0.11435 0.19065 0.33084 0.00424 0.03343Light industry 0.39069 0.31197 0.45374 0.58395 0.73265 0.01957 0.66588
Notes: a Air pollutants: particulates (PARTIC), sulphur dioxide (SO2), nitrogen dioxide (NO2), car-bon monoxide (CO), and volatile organic compounds (VOC).
b Water pollutants: biochemical oxygen demand (BOD) and total suspended solids (TSS).Source: World Bank/PRDEI, Industrial Pollution Projections System data (compiled by Mala Hettige,
David Shaman, David Wheeler and Dave Witzel).
3. Natural resources consist of non-energy resources, such as metal ores, gravel and quarry andmineral mining.
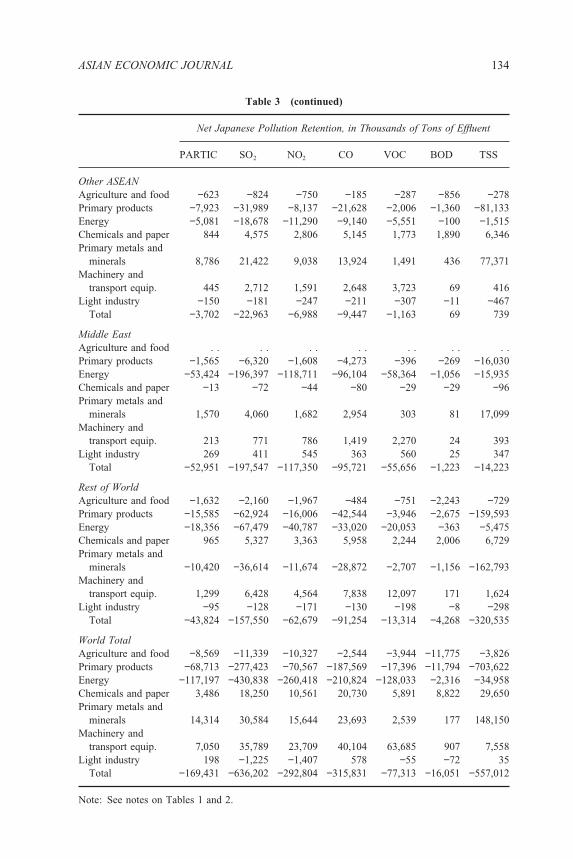
discussion to the last time interval (1991–95) since the earlier periods indicate amonotone process of trade expansion with relatively stable composition since1981. The sectors and trading partners are the same, and all figures are expressedas average annual emissions, in tons of each of seven pollutants.
The patterns of embodied effluent trade, depending as they do on the compo-sition of trade and the pollution-intensity of individual activities, are quite com-plex and not amenable to easy generalization. For example, all four combinationsof surplus and deficit for the two types of trade are in evidence. Japan has a tradesurplus with the United States and industrial Europe, but a pollution deficit. Thisis the win-win scenario alluded to above, environmental mercantilism, where acountry accumulates net foreign assets while its trading partners accumulate netenvironmental degradation.
With respect to Canada, Australia, and New Zealand, a different patternemerges. Japan has a deficit in commodity trade with this group for the period1991–95. At the same time, however, they also have a deficit in pollution ser-vices. The reason for this is that, despite significant exports of manufacturedgoods, imports of natural resources from these three countries are much morepollution-intensive.3 Thus these trading partners, at the national level at least, arerenting their environmental assets in exchange for Japanese savings inflows.
With respect to China, Japan evinces a trade surplus in both goods and pollu-tion services. This is largely because of China’s current heavy dependence onheavy industry and capital-goods imports. Unlike other Asian trading partners,China provides relatively little to Japan in the way of pollution-intensive natural
asej105 9/4/00, 4:35 PM131

ASIAN ECONOMIC JOURNAL 132
Table 3 Japanese Bilateral Trade in Pollution Services by Sector and Trading Partner(Annual Averages for 1991−95)
Net Japanese Pollution Retention, in Thousands of Tons of Effluent
PARTIC SO2 NO2 CO VOC BOD TSS
United StatesAgriculture and food −2,993 −3,960 −3,606 −888 −1,377 −4,112 −1,336Primary products −17,895 −72,249 −18,378 −48,848 −4,530 −3,071 −183,243Energy −3,044 −11,189 −6,763 −5,475 −3,325 −60 −908Chemicals and paper −1,266 −7,295 −4,898 −8,063 −3,622 −2,151 −7,200Primary metals and
minerals 2,750 10,002 3,232 8,537 787 297 49,778Machinery and
transport equip. 2,100 10,160 6,492 10,824 18,783 241 1,898Light industry 1,327 1,060 1,542 1,984 2,489 66 2,262
Total −19,019 −73,471 −22,380 −41,930 9,205 −8,791 −138,749
Canada, Australia and NZAgriculture and food −1,011 −1,338 −1,218 −300 −465 −1,389 −451Primary products −18,663 −75,350 −19,167 −50,945 −4,725 −3,203 −191,108Energy −13,922 −51,181 −30,936 −25,044 −15,209 −275 −4,153Chemicals and paper −416 −2,394 −1,605 −2,647 −1,184 −710 −2,378Primary metals and
minerals −2,961 −13,481 −3,132 −9,589 −863 −604 −48,544Machinery and
transport equip. 417 1,573 1,134 1,902 3,949 34 381Light industry 103 71 106 156 190 4 208
Total −36,453 −142,100 −54,818 −86,467 −18,308 −6,144 −246,046
EU-12Agriculture and food −937 −1,240 −1,129 −278 −431 −1,287 −418Primary products −1,609 −6,495 −1,652 −4,391 −407 −276 −16,472Energy −108 −398 −241 −195 −118 −2 −32Chemicals and paper −1,045 −5,795 −3,680 −6,475 −2,482 −2,138 −7,170Primary metals and
minerals −3,085 −12,103 −3,744 −10,744 −973 −374 −63,090Machinery and
transport equip. 1,103 5,081 3,643 6,231 10,343 130 1,291Light industry −65 −62 −87 −95 −125 −4 −91
Total −5,747 −21,012 −6,890 −15,947 5,807 −3,951 −85,984
China (including Hong Kong)Agriculture and food −330 −436 −397 −98 −152 −453 −147Primary products −2,248 −9,075 −2,308 −6,135 −569 −386 −23,016Energy −4,289 −15,767 −9,530 −7,715 −4,686 −85 −1,279Chemicals and paper 1,240 6,772 4,205 7,598 2,721 2,693 9,038Primary metals and
minerals 8,531 20,139 9,172 14,818 1,558 285 88,311Machinery and
transport equip. 537 3,283 2,146 3,675 4,741 92 702Light industry −681 −1,655 −2,098 −783 −1,699 −99 −3,833
Total 2,762 3,261 1,190 11,359 1,914 2,047 69,776
asej105 9/4/00, 4:35 PM132

TRADE-INDUCED POLLUTION TRANSFERS 133
Table 3 (continued)
Net Japanese Pollution Retention, in Thousands of Tons of Effluent
PARTIC SO2 NO2 CO VOC BOD TSS
KoreaAgriculture and food −296 −392 −357 −88 −136 −407 −132Primary products 15 60 15 41 4 3 152Energy −349 −1,283 −775 −628 −381 −7 −104Chemicals and paper 1,211 6,529 3,969 7,354 2,464 2,769 9,298Primary metals and
minerals 814 2,813 1,088 3,007 273 47 19,307Machinery and
transport equip. 264 1,454 845 1,388 2,232 35 207Light industry −218 −430 −555 −273 −500 −26 −790
Total 1,441 8,752 4,229 10,801 3,956 2,414 27,939
TaiwanAgriculture and food −552 −731 −665 −164 −254 −759 −247Primary products −304 −1,228 −312 −830 −77 −52 −3,115Energy 606 2,229 1,347 1,091 662 12 181Chemicals and paper 1,295 6,999 4,273 7,876 2,677 2,930 9,839Primary metals and
minerals 4,910 17,600 6,404 17,896 1,624 369 112,430Machinery and
transport equip. 275 1,692 1,045 1,764 2,356 45 307Light industry −20 −33 −43 −27 −45 −2 −94
Total 6,209 26,528 12,048 27,606 6,943 2,544 119,301
SingaporeAgriculture and food −25 −33 −30 −7 −12 −35 −11Primary products −164 −663 −169 −448 −42 −28 −1,681Energy −1,768 −6,500 −3,929 −3,181 −1,932 −35 −527Chemicals and paper 366 1,979 1,210 2,226 760 825 2,769Primary metals and
minerals 2,551 14,264 2,729 10,312 894 715 51,150Machinery and
transport equip. 260 1,897 1,004 1,646 1,988 49 208Light industry 309 298 410 444 685 18 3,232
Total 1,529 11,241 1,225 10,991 2,342 1,508 55,139
IndonesiaAgriculture and food −171 −226 −206 −51 −79 −235 −76Primary products −2,772 −11,191 −2,847 −7,567 −702 −476 −28,385Energy −17,462 −64,194 −38,802 −31,412 −19,077 −345 −5,209Chemicals and paper 306 1,625 964 1,838 569 737 2,476Primary metals and
minerals 867 2,482 849 1,449 151 81 7,131Machinery and
transport equip. 137 738 459 768 1,202 18 132Light industry −581 −575 −808 −848 −1,105 −36 −439
Total −19,676 −71,341 −40,390 −35,823 −19,040 −256 −24,371
asej105 9/4/00, 4:35 PM133
ASIAN ECONOMIC JOURNAL 134
Table 3 (continued)
Net Japanese Pollution Retention, in Thousands of Tons of Effluent
PARTIC SO2 NO2 CO VOC BOD TSS
Other ASEANAgriculture and food −623 −824 −750 −185 −287 −856 −278Primary products −7,923 −31,989 −8,137 −21,628 −2,006 −1,360 −81,133Energy −5,081 −18,678 −11,290 −9,140 −5,551 −100 −1,515Chemicals and paper 844 4,575 2,806 5,145 1,773 1,890 6,346Primary metals and
minerals 8,786 21,422 9,038 13,924 1,491 436 77,371Machinery and
transport equip. 445 2,712 1,591 2,648 3,723 69 416Light industry −150 −181 −247 −211 −307 −11 −467
Total −3,702 −22,963 −6,988 −9,447 −1,163 69 739
Middle EastAgriculture and food . . . . . . . . . . . . . .Primary products −1,565 −6,320 −1,608 −4,273 −396 −269 −16,030Energy −53,424 −196,397 −118,711 −96,104 −58,364 −1,056 −15,935Chemicals and paper −13 −72 −44 −80 −29 −29 −96Primary metals and
minerals 1,570 4,060 1,682 2,954 303 81 17,099Machinery and
transport equip. 213 771 786 1,419 2,270 24 393Light industry 269 411 545 363 560 25 347
Total −52,951 −197,547 −117,350 −95,721 −55,656 −1,223 −14,223
Rest of WorldAgriculture and food −1,632 −2,160 −1,967 −484 −751 −2,243 −729Primary products −15,585 −62,924 −16,006 −42,544 −3,946 −2,675 −159,593Energy −18,356 −67,479 −40,787 −33,020 −20,053 −363 −5,475Chemicals and paper 965 5,327 3,363 5,958 2,244 2,006 6,729Primary metals and
minerals −10,420 −36,614 −11,674 −28,872 −2,707 −1,156 −162,793Machinery and
transport equip. 1,299 6,428 4,564 7,838 12,097 171 1,624Light industry −95 −128 −171 −130 −198 −8 −298
Total −43,824 −157,550 −62,679 −91,254 −13,314 −4,268 −320,535
World TotalAgriculture and food −8,569 −11,339 −10,327 −2,544 −3,944 −11,775 −3,826Primary products −68,713 −277,423 −70,567 −187,569 −17,396 −11,794 −703,622Energy −117,197 −430,838 −260,418 −210,824 −128,033 −2,316 −34,958Chemicals and paper 3,486 18,250 10,561 20,730 5,891 8,822 29,650Primary metals and
minerals 14,314 30,584 15,644 23,693 2,539 177 148,150Machinery and
transport equip. 7,050 35,789 23,709 40,104 63,685 907 7,558Light industry 198 −1,225 −1,407 578 −55 −72 35
Total −169,431 −636,202 −292,804 −315,831 −77,313 −16,051 −557,012
Note: See notes on Tables 1 and 2.
asej105 9/4/00, 4:35 PM134
TRADE-INDUCED POLLUTION TRANSFERS 135
resources. Recently, Japan has increased imports of Chinese light industrialproducts, but these are relatively low pollution activities. In this way, Japan isrenting its environmental assets while it is accumulating direct investment stocksin China. This result, however, is one that might well be contradicted in twoways. Firstly, the use of US coefficients for China probably underestimated thepollution-intensity of its exports and this could reverse the balances in Table 3.Secondly, it is reasonable to expect that Chinese exports to Japan will shift tomore heavy industry over time, and thus greater pollution-intensity, again re-versing the bilateral balance of trade in embodied effluents.
The situation for Korea, Taiwan, and Singapore appears analogous to Chinaat first sight, but different forces are at work here. All three of these countriesare quite advanced, and their exports to Japan are less pollution-intensive thannatural resources emanating from developing countries. Thus these three appearto be enjoying a net transfer of pollution to Japan, at the expense of individualtrade deficits. The former estimate, however, could be reversed if export indus-tries in any of the three were sufficiently dirtier than their counterparts in theUnited States.
Indonesia and Other ASEAN economies (Malaysia, Thailand and the Philip-pines) represent an especially important group.4 From the perspective of com-modity trade, the two trading partners differ, i.e., Indonesia enjoys a trade surpluswith Japan while Other ASEAN has a bilateral deficit. On the other hand, bothtrading partners are creating vastly more pollution at home on behalf of Japaneseconsumers than arises in Japanese production for exports to these countries. Thereason for this is not difficult to ascertain − despite significant demand forJapanese manufactures in both regions, exports by them of natural resources aremuch more pollution-intensive. We shall have more to say about these importanttrading partners in the next section.
The last two trading partners represented are the Middle East and a Rest-of-World composite residual group. The former consists, from a Japanese tradeperspective, mainly of energy exporters and this leads to predictable outcomes inboth contexts. Japan is exceptionally import dependent in energy, and this leadsto big trade deficits but also to a lot of transferred domestic pollution problems.The Rest-of-World group consists mainly of primary-dependent developing coun-tries, and its balances behave accordingly – commodity surplus and pollutionservice deficit for Japan.
Perhaps most telling among the estimates presented are the world totals.Here we see the win-win strategy of environmental mercantilism in high relief.Japan’s legendary trade surplus is clearly in evidence, yielding equally legen-dary net capital outflows to the rest of the world. The corresponding deficit inpollution service trade is not so well known, but it is an inevitable consequenceof the existing patterns of specialization. The figures at the bottom of Table 3 are
4. Because of many missing values in their commodity trade data, Brunei, Laos, Myanmar, andVietnam are not included in Other ASEAN.
asej105 9/4/00, 4:35 PM135
ASIAN ECONOMIC JOURNAL 136
particularly arresting in their absolute magnitudes. According to these estimates,Japanese consumption annually induces net emissions of several hundred thou-sand tons of toxic pollutants in other countries. In the light of these results, it isreasonable to ask if there are incentive-compatible policies that could mitigatethese effects.
III. A Collaborative Agenda for Japanese Foreign Direct Investment
How does today’s global trade regime deal with environmental inequality of thetype observed above? It is most obviously dealt by market forces, but these areas imperfect as many domestic markets for environmental amenities and com-mons. It is sufficiently difficult to achieve market valuation of these goods andservices even in the most advanced economies, so there is little hope in the nearfuture for implicit international market coordination that might equalize domes-tic resource costs.5
Another approach has been more interventionist, the stipulation of explicitenvironmental standards or conditionality in trade agreements.6 While thisapproach gives clear voice to environmental interests, it is not congruent withconventional understanding of market forces and is likely to lead to greaterinefficiency and unforeseen welfare costs.7 Indeed, most environmental side agree-ments have exerted their primary market influence via induced rent-seeking andother distortionary effects. We are concerned that this ad hoc approach to theenvironmental incidence of economic activity ignores several essential realities.One of these is economic hierarchy, which is essentially the sequence of indi-vidual economies in a historical continuum of economic development.
The situation portrayed in the previous section for Indonesia, Other ASEANeconomies and, probably, China (given more accurate data) represents a di-lemma familiar to most developing countries. When embarking on the road tomodernization, one must often barter resources, and even environmental amen-ities, in exchange for the imported implements of industrialization and modernconsumerism. To ignore these facts in multilateral policy dialogue is not onlypaternalistic, but it threatens to impose debilitating distortions on already strug-gling economies.
While such a growth-environment tradeoff might seem an inevitable resultof international economic hierarchy, the extent of environmental damage it
5. If domestic markets for environmental resources were more complete, one might envisage linksbetween trade in goods and domestic relative prices of their embodied resources, as with embodiedlabour in Stolper-Samuelson theory.6. Esty (1994) provides a detailed assessment of trade and environment disputes.7. Anderson (1992) shows that even if a country has comparative advantage in the production ofpollution-intensive goods, free trade would still raise welfare unambiguously, so long as an optimalpollution tax is introduced. Devising such a tax may not be a simple matter, however, but Beghin,Roland-Holst, and van der Mensbrugghe (1997) show how simpler, piecemeal measures can achievemost of the desired benefits.
asej105 9/4/00, 4:35 PM136
TRADE-INDUCED POLLUTION TRANSFERS 137
occasions is by no means inevitable. Although most developing countries wantto experience industrialization, there is no need to experience the same environ-mental damage that occurred in the last two centuries of Western industrializa-tion. Better technologies can reduce the rate of environmental degradation alongany given growth path, and new patterns of industrialization (i.e., informationtechnology) may be greener than their precursors.
Better technologies are also marketable exports for the more advancedcountries, and herein lies the potential for a market-based, incentive-compatiblereconciliation of growth and environmental objectives. Ultimately, it is theresponsibility of the developing countries to adopt cleaner technology, but thiswill contribute to increased efficiency and greater environmental sustainability.Thus it should not be difficult to make a case for trade and investment in thesemore advanced techniques and, given the kind of environmental inequitiesobserved above, it is reasonable to expect countries like Japan to take the leadin this regard.
We suggest two ways for pollution debtors, like Japan, to facilitate globalenvironmental mitigation. The first is simple export promotion, with specialemphasis on innovative sectors that are leaders in producing clean technology.The second is more indirect, but probably more important in the long run. Indollar terms, Japan is now the world’s largest player in ODA and one of theleaders in FDI. Both activities have an important influence on recipient-countrytechnology adoption, and the Japanese government can advance its moreinnovative sectors by promoting technology transfer in both contexts. In thelong run, this will not only enhance the Japan’s stature as a trading partner, butpromote innovation and exports.8
IV. Conclusions and Extensions
When seen from the perspective of trade in embodied pollution services, a newrelationship emerges between market forces and global environmental condi-tions. Depending upon their domestic technologies and patterns of import andexport concentration, countries can be net importers or exporters of pollutionservices. Examination of detailed trade data, with reference to the pollutionintensity of production for the tradables, reveals an elaborate and quite asym-metric system of induced pollution transfers.
In this paper, we have examined the effluent content of Japan’s bilateral tradeand find it to be a significant debtor country in terms of global pollution. Our
8. Formally, this can be modelled by treating emissions per unit of output endogenously; e.g.,
ε∂
∂∂
∂∂
∂r i h J r i J r i J r iJ r i J r i J r i
f XK FDI ODAf
XK
f
FDI
f
ODA, , , , , , , ,, , , , , ,
( , , ), ( )
, ( )
, ( )
=⋅
<⋅
<⋅
<0 0 0
where XKJ ,r,i, FDIJ ,r,i and ODAJ,r,i are Japan’s capital-goods exports, foreign direct investment, andofficial development assistance, respectively, to sector i of its developing-country trading partner r.
asej105 9/4/00, 4:35 PM137
ASIAN ECONOMIC JOURNAL 138
estimates indicate that, despite its perennial trade surplus, Japanese consumersconfer net transfers of thousands of tons of toxic pollutants onto the country’strading partners. This is especially the case for developing and developed naturalresource exporters, including countries as different as Indonesia and the UnitedStates. Japan has made significant progress with domestic environmental im-provement over the last few decades, but our estimates indicate that its netconsumption habits are still imposing heavy environmental burdens elsewhere inthe world.
Thus Japan and other environmental debtor nations have a special responsibil-ity to foster pollution mitigation internationally, and there may be no better wayto do this than to promote technology transfer within the framework of their(extensive) FDI and ODA programs. Such an approach, much less ad hoc thannegotiated environmental standards, would improve economic welfare in bothrecipient and donor countries, while setting a progressive example for collabora-tive reconciliation of growth and environmental objectives.
There are four main directions in which we would like to see this workextended. First, we believe this is a very rich area for theoretical research. Theenvironmental content of trade has only begun to be understood, and many ofthe tools used to understand other implicit trade (e.g., factor content) remain tobe applied and could be quite enlightening. Beyond this, the subtle interplay ofcommodity, resource, and ‘environmental’ markets at both the domestic andinternational level is only just now being examined seriously and is very invit-ing. Problems of incomplete markets are difficult enough in the domestic con-text, but their implications for multilateral trade and comparative advantage arefar more complex. Finally, more rigorous comparative domestic environmentalanalysis may ultimately yield the tools needed for a better understanding ofglobal commons.
A second important area for further work is on environmental data. To moreclearly delineate patterns of global environmental inequality and to ultimatelymeasure the opportunity cost of more homogeneous technologies, country-specific emissions data are essential. Fortunately, the Economics of IndustrialPollution Control Project at the World Bank, which produced the emission dataused in this paper, has also obtained estimates for a few other countries, andthis database is growing gradually. It would be useful for any country to moreclearly understand the environmental dimension of its bilateral trade relations.
Third, it would be useful to move our empirical approach beyond static sharetabulations to a more sophisticated simulation framework. Such an approach,typified by calibrated general equilibrium (CGE) models, would enable us toappraise the costs and benefits of alternative policy responses to the issues raisedhere. Preliminary results from a ten-country CGE model are reported in theAppendix, but we have not yet incorporated several important features into themodel.
Finally, an idea of the type put forth here will ultimately be of limited interestunless it is incorporated into the domestic and international policy agenda. By
asej105 9/4/00, 4:35 PM138
TRADE-INDUCED POLLUTION TRANSFERS 139
fostering a new way of looking at the environmental incidence of trade, we hopeto stimulate policy dialogue. By advocating linkage between FDI, ODA, andtechnology transfer, we hope to facilitate a collaborative approach to reconcilingtwo modern aspirations, economic growth and a better environment.
Appendix: General Equilibrium Estimates of the Impact of Trade andTax Policies on Welfare and the Environment in the Pacific Basin
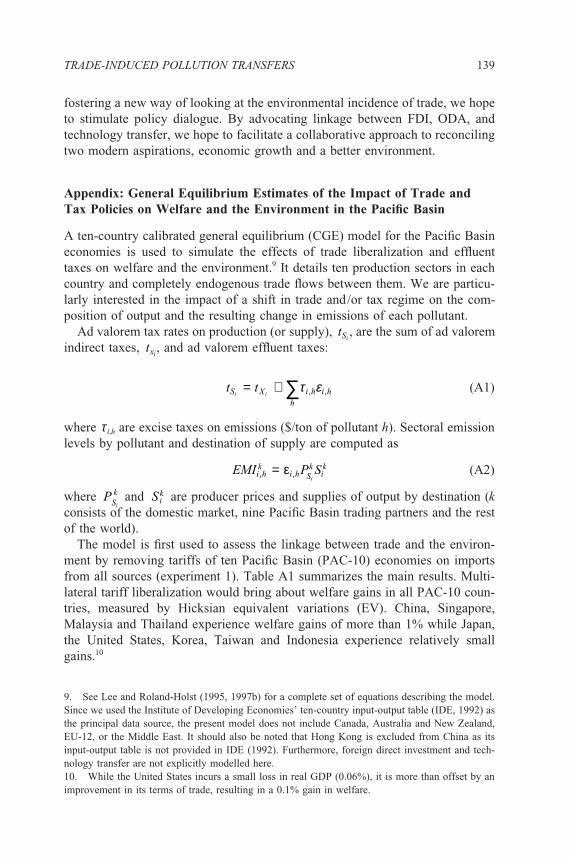
A ten-country calibrated general equilibrium (CGE) model for the Pacific Basineconomies is used to simulate the effects of trade liberalization and effluenttaxes on welfare and the environment.9 It details ten production sectors in eachcountry and completely endogenous trade flows between them. We are particu-larly interested in the impact of a shift in trade and/or tax regime on the com-position of output and the resulting change in emissions of each pollutant.
Ad valorem tax rates on production (or supply), tSi, are the sum of ad valorem
indirect taxes, txi, and ad valorem effluent taxes:
t tS X i h i h
hi i , ,= + ∑τ ε (A1)
where τ i,h are excise taxes on emissions ($/ton of pollutant h). Sectoral emissionlevels by pollutant and destination of supply are computed as
EMI P Si h
ki h S
kik
i, , = ε (A2)
where P
Sk
i and Si
k are producer prices and supplies of output by destination (kconsists of the domestic market, nine Pacific Basin trading partners and the restof the world).
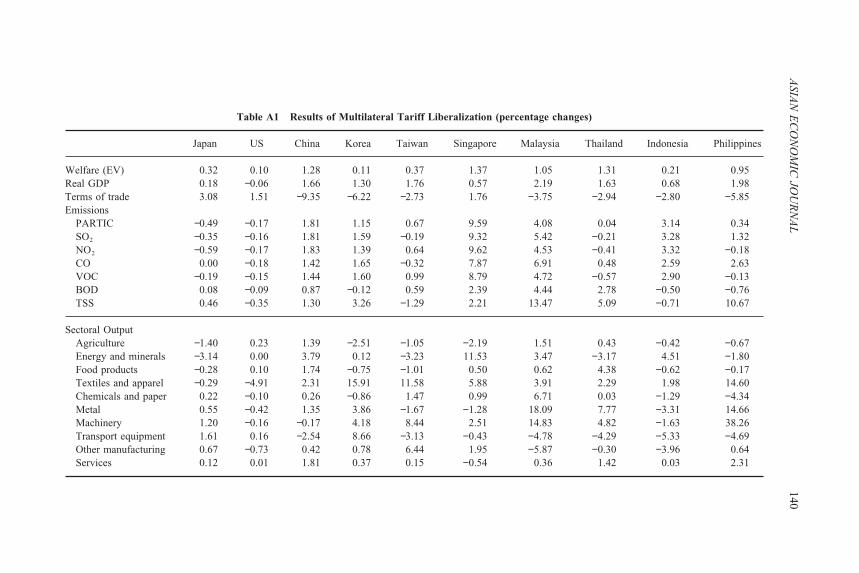
The model is first used to assess the linkage between trade and the environ-ment by removing tariffs of ten Pacific Basin (PAC-10) economies on importsfrom all sources (experiment 1). Table A1 summarizes the main results. Multi-lateral tariff liberalization would bring about welfare gains in all PAC-10 coun-tries, measured by Hicksian equivalent variations (EV). China, Singapore,Malaysia and Thailand experience welfare gains of more than 1% while Japan,the United States, Korea, Taiwan and Indonesia experience relatively smallgains.10
9. See Lee and Roland-Holst (1995, 1997b) for a complete set of equations describing the model.Since we used the Institute of Developing Economies’ ten-country input-output table (IDE, 1992) asthe principal data source, the present model does not include Canada, Australia and New Zealand,EU-12, or the Middle East. It should also be noted that Hong Kong is excluded from China as itsinput-output table is not provided in IDE (1992). Furthermore, foreign direct investment and tech-nology transfer are not explicitly modelled here.10. While the United States incurs a small loss in real GDP (0.06%), it is more than offset by animprovement in its terms of trade, resulting in a 0.1% gain in welfare.
asej105 9/4/00, 4:35 PM139
ASIA
N E
CO
NO
MIC
JOU
RN
AL
140
Table A1 Results of Multilateral Tariff Liberalization (percentage changes)
Japan US China Korea Taiwan Singapore Malaysia Thailand Indonesia Philippines
Welfare (EV) 0.32 0.10 1.28 0.11 0.37 1.37 1.05 1.31 0.21 0.95Real GDP 0.18 −0.06 1.66 1.30 1.76 0.57 2.19 1.63 0.68 1.98Terms of trade 3.08 1.51 −9.35 −6.22 −2.73 1.76 −3.75 −2.94 −2.80 −5.85Emissions
PARTIC −0.49 −0.17 1.81 1.15 0.67 9.59 4.08 0.04 3.14 0.34SO2 −0.35 −0.16 1.81 1.59 −0.19 9.32 5.42 −0.21 3.28 1.32NO2 −0.59 −0.17 1.83 1.39 0.64 9.62 4.53 −0.41 3.32 −0.18CO 0.00 −0.18 1.42 1.65 −0.32 7.87 6.91 0.48 2.59 2.63VOC −0.19 −0.15 1.44 1.60 0.99 8.79 4.72 −0.57 2.90 −0.13BOD 0.08 −0.09 0.87 −0.12 0.59 2.39 4.44 2.78 −0.50 −0.76TSS 0.46 −0.35 1.30 3.26 −1.29 2.21 13.47 5.09 −0.71 10.67
Sectoral OutputAgriculture −1.40 0.23 1.39 −2.51 −1.05 −2.19 1.51 0.43 −0.42 −0.67Energy and minerals −3.14 0.00 3.79 0.12 −3.23 11.53 3.47 −3.17 4.51 −1.80Food products −0.28 0.10 1.74 −0.75 −1.01 0.50 0.62 4.38 −0.62 −0.17Textiles and apparel −0.29 −4.91 2.31 15.91 11.58 5.88 3.91 2.29 1.98 14.60Chemicals and paper 0.22 −0.10 0.26 −0.86 1.47 0.99 6.71 0.03 −1.29 −4.34Metal 0.55 −0.42 1.35 3.86 −1.67 −1.28 18.09 7.77 −3.31 14.66Machinery 1.20 −0.16 −0.17 4.18 8.44 2.51 14.83 4.82 −1.63 38.26Transport equipment 1.61 0.16 −2.54 8.66 −3.13 −0.43 −4.78 −4.29 −5.33 −4.69Other manufacturing 0.67 −0.73 0.42 0.78 6.44 1.95 −5.87 −0.30 −3.96 0.64Services 0.12 0.01 1.81 0.37 0.15 −0.54 0.36 1.42 0.03 2.31
asej1059/4/00, 4:35 P
M140
TRADE-INDUCED POLLUTION TRANSFERS 141
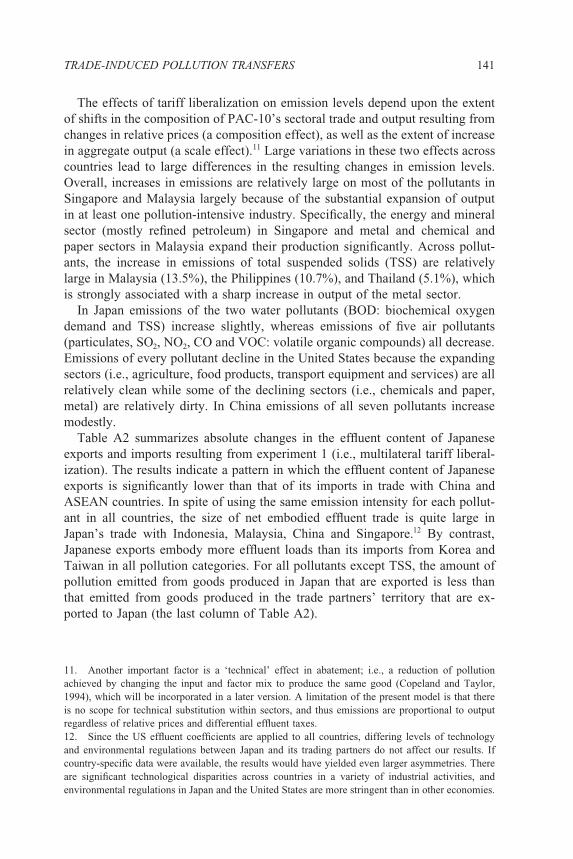
The effects of tariff liberalization on emission levels depend upon the extentof shifts in the composition of PAC-10’s sectoral trade and output resulting fromchanges in relative prices (a composition effect), as well as the extent of increasein aggregate output (a scale effect).11 Large variations in these two effects acrosscountries lead to large differences in the resulting changes in emission levels.Overall, increases in emissions are relatively large on most of the pollutants inSingapore and Malaysia largely because of the substantial expansion of outputin at least one pollution-intensive industry. Specifically, the energy and mineralsector (mostly refined petroleum) in Singapore and metal and chemical andpaper sectors in Malaysia expand their production significantly. Across pollut-ants, the increase in emissions of total suspended solids (TSS) are relativelylarge in Malaysia (13.5%), the Philippines (10.7%), and Thailand (5.1%), whichis strongly associated with a sharp increase in output of the metal sector.
In Japan emissions of the two water pollutants (BOD: biochemical oxygendemand and TSS) increase slightly, whereas emissions of five air pollutants(particulates, SO2, NO2, CO and VOC: volatile organic compounds) all decrease.Emissions of every pollutant decline in the United States because the expandingsectors (i.e., agriculture, food products, transport equipment and services) are allrelatively clean while some of the declining sectors (i.e., chemicals and paper,metal) are relatively dirty. In China emissions of all seven pollutants increasemodestly.
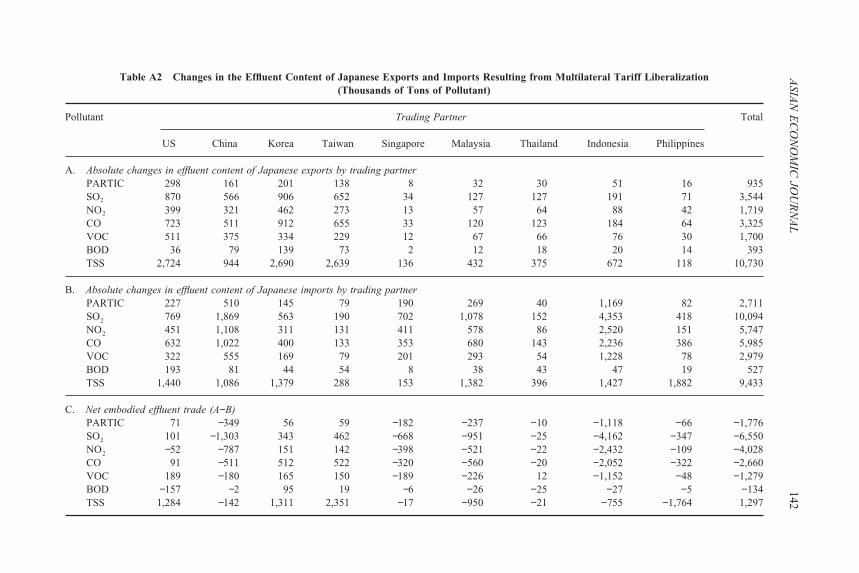
Table A2 summarizes absolute changes in the effluent content of Japaneseexports and imports resulting from experiment 1 (i.e., multilateral tariff liberal-ization). The results indicate a pattern in which the effluent content of Japaneseexports is significantly lower than that of its imports in trade with China andASEAN countries. In spite of using the same emission intensity for each pollut-ant in all countries, the size of net embodied effluent trade is quite large inJapan’s trade with Indonesia, Malaysia, China and Singapore.12 By contrast,Japanese exports embody more effluent loads than its imports from Korea andTaiwan in all pollution categories. For all pollutants except TSS, the amount ofpollution emitted from goods produced in Japan that are exported is less thanthat emitted from goods produced in the trade partners’ territory that are ex-ported to Japan (the last column of Table A2).
11. Another important factor is a ‘technical’ effect in abatement; i.e., a reduction of pollutionachieved by changing the input and factor mix to produce the same good (Copeland and Taylor,1994), which will be incorporated in a later version. A limitation of the present model is that thereis no scope for technical substitution within sectors, and thus emissions are proportional to outputregardless of relative prices and differential effluent taxes.12. Since the US effluent coefficients are applied to all countries, differing levels of technologyand environmental regulations between Japan and its trading partners do not affect our results. Ifcountry-specific data were available, the results would have yielded even larger asymmetries. Thereare significant technological disparities across countries in a variety of industrial activities, andenvironmental regulations in Japan and the United States are more stringent than in other economies.
asej105 9/4/00, 4:35 PM141
ASIA
N E
CO
NO
MIC
JOU
RN
AL
142Table A2 Changes in the Effluent Content of Japanese Exports and Imports Resulting from Multilateral Tariff Liberalization
(Thousands of Tons of Pollutant)
Pollutant Trading Partner Total
US China Korea Taiwan Singapore Malaysia Thailand Indonesia Philippines
A. Absolute changes in effluent content of Japanese exports by trading partnerPARTIC 298 161 201 138 8 32 30 51 16 935SO2 870 566 906 652 34 127 127 191 71 3,544NO2 399 321 462 273 13 57 64 88 42 1,719CO 723 511 912 655 33 120 123 184 64 3,325VOC 511 375 334 229 12 67 66 76 30 1,700BOD 36 79 139 73 2 12 18 20 14 393TSS 2,724 944 2,690 2,639 136 432 375 672 118 10,730
B. Absolute changes in effluent content of Japanese imports by trading partnerPARTIC 227 510 145 79 190 269 40 1,169 82 2,711SO2 769 1,869 563 190 702 1,078 152 4,353 418 10,094NO2 451 1,108 311 131 411 578 86 2,520 151 5,747CO 632 1,022 400 133 353 680 143 2,236 386 5,985VOC 322 555 169 79 201 293 54 1,228 78 2,979BOD 193 81 44 54 8 38 43 47 19 527TSS 1,440 1,086 1,379 288 153 1,382 396 1,427 1,882 9,433
C. Net embodied effluent trade (A−B)PARTIC 71 −349 56 59 −182 −237 −10 −1,118 −66 −1,776SO2 101 −1,303 343 462 −668 −951 −25 −4,162 −347 −6,550NO2 −52 −787 151 142 −398 −521 −22 −2,432 −109 −4,028CO 91 −511 512 522 −320 −560 −20 −2,052 −322 −2,660VOC 189 −180 165 150 −189 −226 12 −1,152 −48 −1,279BOD −157 −2 95 19 −6 −26 −25 −27 −5 −134TSS 1,284 −142 1,311 2,351 −17 −950 −21 −755 −1,764 1,297
asej1059/4/00, 4:35 P
M142

TRADE-INDUCED POLLUTION TRANSFERS 143
For a number of East Asian countries the effects of trade liberalization onemission levels lead to the policy challenge of addressing the environmentalconsequences of trade-based economic growth. In the second experiment, auniform effluent tax is levied in each country with the exception of the UnitedStates to mitigate a particular pollutant to achieve a given abatement target. Weemploy a uniform effluent tax because it is more cost-effective than other formsof taxes (Lee and Roland-Holst, 1997a,b).13 Under this scheme each sector wouldabate emissions until the marginal abatement cost equals the uniform tax rate.In each country, we selected the pollutant that showed the largest percentageincrease in emissions induced by tariff liberalization. In addition, the abatementtarget was chosen to exactly offset the magnitude of increase in emissions.Accordingly, the targets were set as follows: 1%, 4%, 6%, 11% and 14% reduc-tions in TSS emissions for Japan, Korea, Thailand, the Philippines and Malay-sia, respectively; 2%, 4% and 10% reductions in NO2 for China, Indonesia andSingapore, respectively; and 1% reduction in VOC for Taiwan.
The results of achieving the curtailment targets by uniform effluent taxes arepresented in Table A3. Emissions for the selected pollutant are reduced by thechosen target in each country. Since abatement of one emission necessitatesoutput reductions in several dirty industries, emissions of other pollutants alsotend to decrease.14 Real GDP and the welfare level generally decline, but thereare some exceptions.15 First, while Singapore incurs a 0.6% loss in real GDP, itsterms of trade improves sufficiently to result in a 0.6% gain in welfare. Second,Malaysia’s real GDP increases slightly despite the imposition of effluent taxbecause a large output contraction in the metal sector is more than offset byoutput expansion in other manufacturing sectors.
In the final experiment, the same uniform tax scheme implemented in thesecond experiment is combined with multilateral tariff liberalization. This ex-periment is conducted to illustrate a critical point that the combination of tradeliberalization and a cost-effective emission abatement instrument can lead toboth an improvement in welfare and a reduction in pollution. The results arepresented in Table A4.
The combination of tax and trade policies leads to a welfare gain in everycountry. In Malaysia, Korea, and Taiwan, however, setting the abatement targetfor one pollutant was not adequate to reduce some other pollutants sufficiently tooffset pollution generated by trade liberalization. For other countries, the bene-fits of tariff removal are greater than the cost of cutting pollution by an amountwhich more than counterbalances pollution brought about by tariff removals.
13. A system of tradable emission permits is an alternative cost-effective instrument to a uniformtax, but may be more difficult to implement in developing countries.14. The only exception is BOD in Malaysia.15. The present model does not incorporate the benefits of reduced pollution in the utility functionor EV calculation, but their inclusion should increase the social welfare level for a small effluent tax.
asej105 9/4/00, 4:35 PM143

ASIA
N E
CO
NO
MIC
JOU
RN
AL
144
Table A3 Results of Effluent Taxes (percentage changes)
Japan US China Korea Taiwan Singapore Malaysia Thailand Indonesia Philippines
Welfare (EV) −0.06 −0.00 −0.83 −0.07 −0.17 0.60 −0.34 −0.16 −0.03 −0.29Real GDP −0.08 0.01 −0.92 −0.09 −0.19 −0.60 0.02 −0.07 −0.90 −0.57Terms of trade −0.07 −0.20 0.98 0.07 0.02 2.21 −1.61 −0.78 5.68 1.78Emissions
PARTIC −0.27 0.07 −1.93 −0.99 −0.94 −9.93 −1.40 −0.41 −3.84 −2.94SO2 −0.43 0.08 −2.09 −1.53 −0.92 −9.71 −2.28 −0.93 −4.02 −4.20NO2 −0.19 0.06 −2.00 −0.69 −1.07 −10.00 −0.92 −0.28 −4.00 −2.82CO −0.56 0.08 −2.07 −2.04 −0.71 −8.23 −3.55 −1.73 −3.65 −5.38VOC −0.19 0.05 −1.94 −0.64 −1.00 −9.04 −0.72 −0.29 −3.80 −2.75BOD −0.17 0.02 −1.46 −0.28 −0.63 −2.53 0.03 −0.12 −0.68 −0.82TSS −1.00 0.14 −2.03 −4.00 −0.12 −2.35 −14.00 −6.00 −1.51 −11.00
Sectoral OutputAgriculture 0.04 −0.04 −0.24 0.37 0.04 0.59 1.00 0.16 0.50 0.04Energy and minerals 0.34 0.08 −2.75 −0.12 −2.50 −12.03 −0.31 0.28 −4.84 −2.93Food products −0.01 −0.01 −0.55 0.15 −0.06 0.36 0.49 0.19 0.27 0.04Textiles and apparel 0.08 −0.05 −0.70 1.17 −0.14 0.57 2.13 0.28 −0.10 1.42Chemicals and paper −0.03 0.01 −1.82 0.28 −0.95 −1.41 1.38 0.06 −1.30 −0.68Metal −1.12 0.17 −2.04 −4.61 0.06 1.32 −21.10 −8.56 0.19 −13.45Machinery −0.29 0.01 −1.35 −0.94 −0.08 0.52 1.24 −0.26 0.63 −4.75Transport equipment −0.23 0.01 −1.18 −1.17 −0.79 1.17 0.35 −0.50 0.15 −0.77Other manufactures −0.05 0.01 −1.37 −0.05 −0.48 0.06 0.42 0.01 −0.55 −0.49Services −0.02 0.00 −0.90 0.02 0.05 0.00 −0.01 −0.07 −0.06 −0.31
Note: For each country except the United States, a uniform effluent tax is levied to achieve a given abatement target: Japan – 1% in TSS, China – 2% in NO2,Korea – 4% in TSS, Taiwan – 1% in VOC, Singapore – 10% in NO2, Malaysia – 14% in TSS, Thailand – 6% in TSS, Indonesia – 4% in NO2, and thePhilippines – 11% in TSS.
asej1059/4/00, 4:35 P
M144

TR
AD
E-IN
DU
CE
D P
OL
LU
TIO
N T
RA
NSF
ER
S145
Table A4 Results of Effluent Taxes and Multilateral Tariff Liberalization (percentage changes)
Japan US China Korea Taiwan Singapore Malaysia Thailand Indonesia Philippines
Welfare (EV) 0.26 0.10 0.50 0.07 0.26 2.31 0.73 1.16 0.21 0.70Real GDP 0.11 −0.05 0.78 1.26 1.71 −0.19 2.32 1.58 −0.18 1.35Terms of trade 2.99 1.33 −8.63 −6.28 −2.97 4.74 −5.55 −3.77 2.17 −4.05Emissions
PARTIC −0.75 −0.11 −0.13 0.46 0.49 −3.62 2.16 −0.29 −0.67 −3.30SO2 −0.79 −0.09 −0.27 0.51 −0.30 −3.62 2.41 −1.05 −0.71 −3.96NO2 −0.78 −0.11 −0.18 0.93 0.39 −3.67 3.26 −0.61 −0.65 −3.63CO −0.58 −0.11 −0.60 0.19 −0.32 −3.14 2.38 −1.16 −1.00 −4.21VOC −0.38 −0.10 −0.49 1.18 0.75 −3.22 3.78 −0.78 −0.86 −3.49BOD −0.09 −0.07 −0.52 −0.30 0.44 −0.92 4.73 2.69 −1.11 −1.73TSS −0.56 −0.23 −0.62 0.34 −0.89 −1.36 −4.36 −0.82 −2.06 −3.65
Sectoral OutputAgriculture −1.35 0.19 1.22 −2.25 −1.10 −1.33 2.81 0.60 0.12 −0.58Energy and minerals −2.80 0.08 0.77 0.09 −4.03 −4.51 2.76 −2.76 −0.37 −5.30Food products −0.28 0.10 1.27 −0.64 −1.08 1.09 1.29 4.59 −0.33 −0.08Textiles and apparel −0.19 −4.96 1.72 17.01 11.55 6.66 6.62 2.61 1.99 16.89Chemicals and paper 0.19 −0.09 −1.49 −0.60 1.20 −0.74 9.01 0.13 −2.43 −4.98Metal −0.59 −0.27 −0.56 0.45 −1.15 −0.26 −9.32 −0.83 −2.84 −3.42Machinery 0.92 −0.16 −1.41 3.51 8.40 3.21 16.69 4.66 −0.87 31.09Transport equipment 1.38 0.17 −3.59 7.71 −3.44 1.13 −4.30 −4.70 −5.10 −5.32Other manufactures 0.62 −0.72 −0.87 0.77 6.33 2.14 −5.26 −0.28 −4.42 0.24Services 0.11 0.01 0.98 0.40 0.18 −0.55 0.41 1.36 0.02 2.06
asej1059/4/00, 4:35 P
M145
ASIAN ECONOMIC JOURNAL 146
ReferencesAnderson, Kym, 1992, Effects of trade and environmental policies on the environment and welfare.
In K. Anderson and R. Blackhurst, Eds., The Greening of World Trade Issues. University ofMichigan Press, Ann Arbor.
Anderson, Kym, 1996, The intrusion of environmental and labor standards into trade policy. In W.Martin and L. A. Winters, Eds., The Uruguay Round and the Developing Countries. CambridgeUniversity Press, Cambridge.
Beghin, John, David Roland-Holst and Dominique van der Mensbrugghe, 1997, Trade and pollutionlinkages: Piecemeal reform and optimal intervention. Canadian Journal of Economics, 30(2), pp.442–455.
Bhagwati, Jagdish and T. N. Srinivasan, 1996, Trade and the environment: Does environmentaldiversity detract from the case for free trade? In J. N. Bhagwati and R. E. Hudec, Eds., FairTrade and Harmonization: Prerequisites for Free Trade? Volume 1. MIT Press, Cambridge,MA.
Copeland, Brian R. and M. Scott Taylor, 1994, North-South trade and the environment. QuarterlyJournal of Economics, 109(3), pp. 755–787.
Coppel, Jonathan and Hiro Lee, 1996, The Framework Convention and climate change policy inAsia. In R. Mendelsohn and D. Shaw, Eds., The Economics of Pollution Control in the AsiaPacific. Edward Elgar, Cheltenham.
Esty, Daniel C., 1994, Greening the GATT: Trade, Environment, and the Future. Institute forInternational Economics, Washington, DC.
Hayami, Yujiro, 2000, From confrontation to cooperation on the conservation of global environ-ment. Asian Economic Journal, 14(2), pp. 109–122.
Hettige, H., P. Martin, M. Singh and D. Wheeler, 1994, The Industrial Pollution Projection System.World Bank Policy Research Working Paper No. 1431, World Bank, Washington, DC.
Institute of Developing Economies (IDE), 1992, Asian International Input-Output Table 1985. Insti-tute of Developing Economies, Tokyo.
Lee, Hiro and David Roland-Holst, 1995, Trade liberalization and employment linkages in thePacific Basin. Developing Economies, 33(2), pp. 155–184.
Lee, Hiro and David Roland-Holst, 1997a, The environment and welfare implications of trade andtax policy. Journal of Development Economics, 52(1), pp. 65–82.
Lee, Hiro and David Roland-Holst, 1997b, Trade and the environment. In J. F. Francois and K. A.Reinert, Eds., Applied Methods for Trade Policy Analysis: A Handbook. Cambridge UniversityPress, Cambridge.
Low, Patrick, Ed., 1992, International Trade and the Environment. World Bank Discussion Paper159, World Bank, Washington, DC.
Organization for Economic Cooperation and Development (OECD), 1995, Global Warming: Eco-nomic Dimensions and Policy Responses. OECD, Paris.
asej105 9/4/00, 4:35 PM146