track: accounting - citeseerx
TRANSCRIPT

TTRRAACCKK :: AAccccoouunntt iinngg
"" TThhee BBaallaanncceedd SSccoorr eeccaarr dd AApppprr ooaacchh ttoo PPeerr ssoonnaall GGrr oowwtthh aanndd AAsssseessssmmeenntt""JJ.. LLoowweell ll MMoooonneeyy,, GGeeoorrggiiaa SSoouutthheerrnn UUnniivveerrssii ttyyJJ.. HHaarrrr iissoonn MMccCCrraaww,, TThhee SSttaattee UUnniivveerrssii ttyy ooff WWeesstt GGeeoorrggiiaa
"" TThhee II ddeenntt ii ff iiccaatt iioonn ooff II nnff lluueenntt iiaall DDaattaa PPooiinnttss aanndd TThheeii rr II mmppaacctt oonn CCoosstt VVaarr iiaannccee--II nnvveesstt iiggaatt iioonn DDeecciissiioonnss""DDaarryyll MM.. GGuuffffeeyy,, EEaasstt CCaarrooll iinnaa UUnniivveerrssii ttyyMMaarrkk WW.. MMccCCaarrttnneeyy,, EEaasstt CCaarrooll iinnaa UUnniivveerrssii ttyy
"" II mmpplleemmeenntt iinngg AAcctt iivvii ttyy--BBaasseedd CCoosstt iinngg SSyysstteemmss:: AAnn EExxpplloorr aattoorr yy SSuurr vveeyy ooff II ssssuueess,, BBeenneeff ii ttss,, aanndd EEff ffeecctt oonnOOvveerr aall ll PPeerr ffoorr mmaannccee""
CChhaarr lloottttee TT.. HHoouukkee,, TThhee BBuussiinneessss CCoonnssuull ttiinngg GGrroouupp IInncc..NNaabbii ll AA.. IIbbrraahhiimm,, AAuugguussttaa SSttaattee UUnniivveerrssii ttyyPPaammeellaa JJaacckkssoonn,, AAuugguussttaa SSttaattee UUnniivveerrssii ttyy
"" TThhee RReellaatt iioonnsshhiipp BBeettwweeeenn RReell iiggiioouuss DDeennoommiinnaatt iioonn aanndd CChhuurr cchh SSiizzee UUppoonn II nntteerr nnaall CCoonnttrr ooll PPrr aacctt iicceess""AAll llaann DD.. UUnnsseetthh,, NNoorrffoollkk SSttaattee UUnniivveerrssii ttyyRRaayymmoonndd GG.. LLaavveerrddiieerree,, NNoorrffoollkk SSttaattee UUnniivveerrssii ttyyMMiicchhaaeell CC.. CChheesstteerr,, NNoorrffoollkk SSttaattee UUnniivveerrssii ttyy
"" II RRSS:: DDoo TThheeyy PPrr aacctt iiccee WWhhaatt TThheeyy PPrr eeaacchh??""CChhaarr llaa RR.. CCaammppbbeell ll ,, MMccEEllrrooyy MMeettaall IInncc..
CCllyyddee LL.. PPoosseeyy,, LLoouuiissiiaannaa TTeecchh UUnniivveerrssii ttyy
THE BALANCED SCORECARD APPROACH TO PERSONAL GROWTH AND ASSESSMENT
J. Lowell Mooney, Georgia Southern University, Statesboro, GA 30460J. Harrison McCraw, The State University of West Georgia, Carrollton, GA 30118
ABSTRACT
There is an adage in management accounting that goes like this: What gets measured, gets done. Manyfirms are now re-evaluating their performance measurement systems to ensure that performance measuresare tied to critical success factors. Kaplan and Norton have proposed a balanced scorecard approach totracking the key elements of a firms strategy. The balanced scorecard requires management to evaluateperformance from four specific perspectives: financial, customer, internal business, and innovation andlearning. This paper suggests that business professionals would do well to identify those success factorscritical to their own personal and career objectives and apply a balanced scorecard approach tomonitoring their personal performance and progress toward achieving their goals.
INTRODUCTION
The bookstores are chocked full of self-help books all claiming to provide the key to personal growth,happiness, and success. However, a cursory review of many of these books reveals a noticeabledeficiency. Most take a one-dimensional approach. For example, financial self-help books focusexclusively on finances while physical, spiritual, and emotional books concentrate on those individualdimensions. Thus, there is a tendency to focus on a single dimension, or at best, on only one dimension ata time. Clearly what is needed is the ability to monitor and enhance improvements in several areassimultaneously. So how does a person integrate all of the wonderful, but disparate, advice available tobecome a well-rounded individual? The purpose of this paper is to suggest a multi-dimensionalframework which can be used to accomplish this objective. That is, we describe a framework which canbe used for personal growth and assessment.
The framework was developed by Kaplan and Norton [1] during a year-long research project with a dozencompanies generally thought to be on the leading edge of performance measurement. The researchersobjective was to develop in a single management report a set of measures that would give topmanagement a comprehensive, yet succinct, view of the business. Kaplan and Norton called theirmethodology the balanced scorecard.
The balanced scorecard approach is growing in popularity for at least two reasons. First, manyorganizations have traditionally utilized only financial measures to evaluate their performance. Unfortunately, many of the commonly used measures, such as return on investment, are not tied directlyto the firms critical success factors. We believe individuals have this same tendency when engaging inself-evaluation. Secondly, over time, the performance appraisal system of many firms has grownincreasingly complex and even confusing. This is due in part to the tendency to add new performancemeasures to the system each time some new management directive is implemented without removing anyof the existing measures. We believe that the opposite behavior is probably true for most individuals. That is, they tend to focus on one, or just a few performance measures (e.g., gross pay, total amount insavings, etc.).
It is important to note that the balanced scorecard does not eliminate financial performance measures. The financial perspective is very important and cannot be ignored by businesses or individuals. Instead,the approach supplements the financial measures with operational measures which more directly focus on

the drivers of future financial performance. According to Kaplan and Norton, these drivers are customersatisfaction, internal business processes, and the organizations innovation and improvement activities. Specifically, the researchers note that the balanced scorecard provides answers to four basic questions:
How do customers see us? (Customer perspective); What must we excel at? (Internal business perspective); Can we continue to improve and create value? (Innovation/learning perspective); and How do we look to shareholders? (Financial perspective).
Thus, the scorecard brings together the various elements of a companys competitive agenda (e.g.,becoming customer focused, improving quality, and shortening response times) and guards against sub-optimization. Kaplan and Norton note that the balanced scorecard is designed to focus the attention oftop management on a short list of critical indicators of current and future performance. The premise ofthis study is that this same approach can be applied on a personal level.
DESIGNING A PERSONAL BALANCED SCORECARD
It is true that those organizations desiring to adopt the balanced scorecard approach must identify theirown critical success factors and then devise performance measures that reflect the four perspectivesincluded in the framework. It is possible, however, that when classified, the measures, will cluster alongcommon dimensions. For example, Kaplan and Nortons research suggests that the financial measuresused by the firms participating in the study tended to focus on profitability, growth, and shareholdervalue.
The four perspectives are described and illustrated in the sections which follow. For each perspective,several performance measures are suggested which might be utilized to assess ones personal growth. Theresearch objective then is to construct a survey instrument which can be used to determine whether or notthe proposed measures cluster along the four perspectives identified in the Kaplan and Norton research. This survey instrument is still under construction. Because the list of possible measures which might beincluded is so extensive, it is our desire to present the questionnaire at the SE InfORMS meeting in orderto obtain valuable input from our colleagues across multiple disciplines. This will enhance the likelihoodthat the survey will provide usable results.
The Customer Perspective
For a business organization, the concept of customer is very straightforward. An organizations customeris the person or group that receives the organizations outputs-whether goods or services. The typicalcritical success factors for customer performance are service, quality, and cost. Customer satisfactionsurveys are a popular means of assessing a firms performance on each of these factors. But who are anindividuals customers? One possible interpretation is that an individuals customers include his or herspouse, family, friends, and associates, and, to a lesser extent, his or her community, profession, or otheraffinity.
It has been advocated in some circles that individuals would do well to establish their own personal boardof directors. This board would be a close network of key advisors and/or mentors. For example, theboard would include influential family members and all of the individuals current mentors. The boardmight also include a physician, lawyer, spiritual advisor, accountant or other financial advisor, banker,and a teacher who had had a significant influence on the individual. The idea is that individuals wouldobtain from their personal boards of directors important information and feedback about their relationshipwith and service to others in the same way that businesses use customer surveys. The members of theboard should be available on a regular basis for consultation and support when the individual facesimportant decisions or milestones in life.
The research issue is how to measure the individuals relationships with customers and level of service toothers. Some possible measures include the number of times an individual participates in a charitableactivity (e.g., assisting Habitat for Humanity construct low-cost housing ), the number of hours spent inperforming some activity (e.g., time spent with children during the period), and the number of specialoccasions the individual celebrated with his or her spouse or significant other. It might also be helpfulfor individuals to engage in some bench marking activities to compare their performance against that ofother acquaintances. Input and feedback from our colleagues are needed on this issue.
The Internal Business Perspective
The internal business perspective of the balanced scorecard is designed to assess the infrastructure a firmhas in place to meet its customers expectations. Firms which provide excellent customer service tend tohave efficient and well focused internal operations. Kaplan and Norton suggest that firms identify andmeasure their core competencies (the critical technologies needed to ensure continued market leadership)and design performance measures to assess each one. In other words, firms must decide what processesand competencies they must excel at if they hope to stay competitive.
Likewise, individuals must identify their own personal core competencies. For example, several yearsago, a C.P.A. we know spent literally weeks agonizing over a new tax reform act on his own time in orderto become the office expert in that area. Computer skills might be another area where one could excel onthe job. A potential performance measure might then be the number of times business associates soughtout this persons assistance over some period of time.
Other potential performance measures might include the percentage of billable hours to total hours for aconsultant, the number of deadlines successfully met, the number of sick days taken, the number ofcustomer complaints lodged against the individuals work, the amount of time devoted to charitableactivities, time spent on social and recreational activities and so forth. Again, input and feedback fromour colleagues are needed on this issue.
The Innovation and Learning Perspective
The customer-based and internal business process measures on the balanced scorecard identify theparameters that the company considers most important for competitive success. But the targets forsuccess keep changing. Intense global competition requires that companies make continual improvementsto their existing products and processes ... (Kaplan and Norton) The researchers go on to argue that acompanys ability to innovate, improve, and learn ties directly to its overall value.
Individuals should also adopt a continuous improvement mind set. They should strive to learn new skillsand sharpen existing skills. Furthermore, they should set stretch targets for key skills so that theymaintain any positions of leadership they may currently occupy. Performance measures for thisscorecard perspective might include the number of continuing professional education credits earnedduring the period, number of new skills developed (or the number of hours required to master a newskill), number of training classes attended, number of suggestions which were approved andimplemented, and the number of errors or defects reported in the individuals work. It is possible that ourcolleagues will be able to identify other relevant innovation/learning related performance measures.
The Financial Perspective
As one would expect, financial performance measures are designed to assess how the firms strategy,

implementation, and execution contribute to improvements in the firms financial condition. As notedearlier, typical financial measures attempt to assess profitability, growth, and shareholder value.For individuals this is likely the perspective in which they are most interested and for which they are mostaccustomed to setting formal goals and objectives. Some possible performance measures might include apersons pay level, percentage increases in pay over some period of time, number of pay increasesreceived, amount of funds held in various retirement plans, amount added to savings and investmentaccounts during the period, level of expenses incurred during the period, and percentage reduction inspecified expenses. Again, our colleagues may be able to assist us in identifying other important financialperformance measures.
Once the survey instrument is completed, it will be administered to a selected sample of businessprofessionals (likely accountants). Factor analysis will then be used to determine whether the variablesincluded in the study do in fact cluster along the four perspectives included in Kaplan and Nortonsbalanced scorecard. If so, we would encourage individuals to adopt the balanced scorecard approach as atool for personal growth and assessment.
CONCLUSION
According to Kaplan and Norton, the balanced scorecard is particularly useful for firms wishing to initiateorganizational change by putting strategy and vision, not control, at the center of attention. In applyingthe balanced scorecard methodology, management establishes goals and assumes that employees willembrace change, if necessary, to achieve those goals. That is, the measures included in the scorecard aredesigned to pull people toward the firms overall vision or mission. This logic applies equally at theindividual level. A personal scorecard should be designed to help its owner focus on the person he or shewants to become and discourage acceptance of the status quo. Thus, it is important to maintain an up-to-date scorecard. In the spirit of continuous improvement, once a target on the scorecard has been reached,a new stretch target should be set.
Perhaps it should be noted that the adoption of the balanced scorecard approach does not guarantee awinning strategy. This possibility is reminiscent of the effectiveness versus efficiency contention. It isnot particularly profitable to become very efficient at doing the wrong thing. For this reason, individualsshould continually evaluate their personal goals and objectives via discussions with customers or benchmarking procedures.
In conclusion, by combining the traditional financial perspective with customer, internal process andinnovation, and organizational learning perspectives, the balanced scorecard helps individuals understandand exploit the many interrelationships that are responsible for their overall level of self-fulfillment. Toput it into Kaplan and Nortons vernacular, the balanced scorecard will keep individuals looking andmoving forward instead of backward.
REFERENCES
[1] Kaplan, R.S., and D.P. Norton, The Balanced Scorecard-Measures That Drive Performance,Harvard Business Review, (January-February 1992): pp. 71-79.
THE IDENTIFICATION OF INFLUENTIAL DATA POINTS AND THEIR IMPACT ON COSTVARIANCE-INVESTIGATION DECISIONS
Daryl M. Guffey, Department of Accounting, School of Business, East Carolina University, Greenville,NC 27858, (919) 328-6592
Mark W. McCartney, Department of Accounting, School of Business, East Carolina University,Greenville, NC 27858, (919) 328-6619
ABSTRACT
Regression analysis is often used to build models for standard costing purposes. This analysis is usuallydone based on a relatively small data set [8]. It is widely acknowledged that small sample models areparticularly vulnerable to the effects of high influence observations. In this paper we demonstrate severalstatistical procedures useful in diagnosing high influence observations when ordinary least-squaresregression is used. The need for applying these diagnostic devices is highlighted by using a hypotheticaldata set with both an outlier and an influential observation. We review statistical procedures for detectingand classifying outliers from influential observations. We also illustrate that the use of models containinginfluential data points can lead to suboptimal variance-investigation decisions.
INTRODUCTION
Cost control is a critical element of any managerial accounting system. For many companies the answerto cost control problems lies in standard costs. Cost standards indicate what the cost of a process shouldbe at given levels of activity. Variance reports compare actual costs with these standards to determinewhether operations are proceeding within the limits that management has established. If actual costsexceed the bounds that management has set, attention may be directed to the difference.
Linear regression is a technique that can be effectively used to derive cost estimates and to aid indetermining the significance of variances from such standards. An advantage of using this approach isthat more than one independent variable may be used to determine standard costs. This will inevitablyoffer a more precise measurement of standards, since few costs are the product of a single cause. Asecond advantage of linear regression is that t- or F-ratios may be derived to statistically determine thesignificance of cost variances. For example, a t-ratio of three would indicate that given the sample usedto derive the standard, the probability of the variance in question randomly differing from the standard isless than five percent. This probability may be used to supplement or supplant decision rules such asinvestigating all variances differing from the standard by greater than ten percent or an absolute dollaramount. The widespread availability of computer programs for statistical analysis has put regressionwithin reach of anyone who has the rudimentary skills required to process data by computer. In fact,some hand held calculators now have the regression subroutines, with instructions making the subroutinesquite easy to use.
A potential problem with regression analysis is the influence of aberrant observations on regressionresults. This is especially problematic with small samples. The influence of these observations can leadto suboptimal variance investigation decisions. These erroneous judgments are of two types: (1) toinvestigate variances that do not warrant investigation and (2) not to investigate variances that do warrantinvestigation.
This paper merges the work of [9] and [3] and has three purposes. First, two types of aberrantobservations are described, outliers and influential points, as well as their effect on a "standard costing"regression equation. A hypothetical data set which includes both types of observations is used todemonstrate their effect on a regression equation. Second, the cost-investigation implications of aberrantobservations are discussed. Third, diagnostic procedures are illustrated which may be used to identifythese highly influential observations.
We could find no literature which discussed the frequency of outlier problems in cost settings. However,examination of a number of new and revised editions of basic cost and management accounting textbooksfound that all included a limited discussion of linear regression in the context of cost behavior, withusually a mention of outliers in the material. Academic research that uses regression often is forced todeal with the problem of outliers, illustrating the frequency of such observations in various types of datasets. Given these facts, it is prudent to assume that outlier problems are not uncommon to cost andmanagement accountants who use linear regression.
There is little agreement about what to do with outliers and influential observations that are not simplydata-entry or measurement errors. The most conservative rule is to leave the observation. Regardless ofthe decision, analysis of outlying and influential observations is a necessary component of good analysis[7, p. 409]. Outliers and influential data points should be identified and investigated so the analyst canexercise good judgment in making variance investigation decisions. This paper provides cost managerswith a step-by-step framework for identifying outliers and influential observations.
REFERENCES
[1] Brandon, Charles H. & Ralph E. Drtina. Management Accounting: Strategy and Control, FirstEdition. New York: The McGraw-Hill Companies, Inc., 1997.
[2] Cohen, Jeffrey R. & Laurence Paquette. Management accounting practices: Perceptions ofcontrollers. Journal of Cost Management, 1991, 5 (Fall), 73-83.
[3] Deis, Donald R., Jr., Daryl M. Guffey & William T. Moore. Regression diagnostics: A caseinvolving high leverage and extreme influential data points. Accounting Educators' Journal,1994, 10 (Spring), 54-77.
[4] Gaumnitz, Bruce R. & Felix P. Kollaritsch. Manufacturing cost variances: Current practices andtrends. Journal of Cost Management, 1991, 5 (Spring), 58-64.
[5] Horngren, Charles T., George Foster, & Srikant M. Datar. Cost Accounting: A ManagerialEmphasis, Ninth Edition. Englewood Cliffs, NJ: Prentice-Hall, 1997.
[6] Horngren, Charles T., Gary L. Sundem, & William O. Stratton. Introduction to ManagementAccounting, Tenth Edition. Upper Saddle River, NJ:Prentice-Hall, 1996.
[7] Neter, John, William Wasserman, & Michael H. Kutner. Applied Linear Statistical Models:Regression, Analysis of Variance, and Experimental Designs, Second Edition. Homewood,Illinois: Richard D. Irwin Inc., 1985.
[8] Rayburn, L. Gayle. Cost Accounting: Using a Cost Management Approach, Sixth Edition.Boston, MA: Richard D. Irwin Inc., 1996
[9] Tomczyk, Stephen & Sangit Chatterjee. The impact of outliers and influential points on the costvariance investigation decision. Issues in Accounting Education, 1986, 1 (Fall): 293-301.
IMPLEMENTING ACTIVITY-BASED COSTING SYSTEMS: AN EXPLORATORYSURVEY OF ISSUES, BENEFITS, AND EFFECT ON OVERALL PERFORMANCE
Charlotte T. Houke, The Business Consulting Group Inc., Augusta, GA 30903, (706) 722-3900Nabil A. Ibrahim, Augusta State University, Augusta, Georgia 30904-2200, (706) 737-1560Pamela Jackson, Augusta State University, Augusta, Georgia 30904-2200, (706) 737-1560
ABSTRACT
Activity-Based Costing (ABC) concepts and the associated tools and techniques provide a richand varied tool box for vastly improving the management decision making process. A survey ofpractitioners representing 49 firms in the southeast was conducted to determine the major factorsthat influence a firm’s decision to implement or not to implement ABC, and the extent to whichABC techniques are being used to support managerial decision making. In addition, therelationship between a firm’s use of ABC and (a) whether it is local, regional, national, orinternational and (b) its overall performance are analyzed. Some expanations as well as limitedgeneralizations and implications are developed.
INTRODUCTION
ABC began as a process for determining product cost for manufacturers by calculating the cost ofoverhead activities and materials consumed in the process of producing a product. This processcontrasts with the traditional product costing process which identifies direct costs and applies anarbitrary overhead allocation. Further, ABC associates cost and activity information to helpillustrate how activities affect costs.
In the late 1980s and early 1990s, many organizations began to change their businessphilosophies to process-orientated approaches. Total Quality Management (TQM) is probablythe best known of these. TQM emphasizes managing processes, or the way work is done,whereas older approaches focused on post-production inspection, individual or work unitperformance, budget variances, or simple efficiency. Like TQM, ABC focuses on processes byproviding information on how they work and on their cost and efficiency. As organizationsgained experience with TQM and ABC, many found the two were highly compatible [8].
REVIEW OF THE LITERATURE
A review of the literature reveals an increasing trend for companies to implement ABC [2] [5] [9][10] [12] [13]. The reported percentages of firms using and/or implementing ABC ranged from16 percent to 63 percent in the studies reviewed.
While some companies chose not to implement ABC and some began implementation butabandoned the process, most companies who implemented ABC were satisfied with the results.The benefits of ABC often exceeded their expectations and the implementation costs [1] [9] [12].The company members most satisfied with ABC tended to be the end users and/or managers ofthe information. The least satisfied tended to be the financial accountants who still must generatereports for external sources. Firms that are experiencing severe price competition and are undergreat pressure to reduce costs have the highest level of satisfaction with the operational dimensionof their ABC systems [14].
Of the companies that have not implemented ABC, a growing number are considering or
planning to implement ABC in the future [2] [9] [12] [13]. The reported percentages of thosesurveyed who plan to implement ABC or are considering it ranged from 26 percent to 57 percentin the studies reviewed. Significant growth is expected in the number of firms adopting ABC dueto the large number of companies/firms who are planning/considering an ABC implementation.
Another trend noted in the literature is the progression in how ABC information is used. The useof ABC information began primarily as a costing methodology and has evolved to broader, moreencompassing applications in cost management and applications of the ABC approach. Onestudy confirmed that a firm’ s industry influences the way it uses ABC information [14]. Mostcompanies implementing ABC are using it for several purposes. ABC information is used forsuch purposes as cost reduction and cost management, activity performance measurement andimprovement, cost modeling, product or service output decisions, product or service costing,budgeting, customer profitability analysis, stock valuation, and new product or service design [4].
The major reason cited for implementing ABC is more accurate information for cost managementpurposes [5]. In one study, the majority of respondents indicated the use of ABC information intheir budgeting and strategic planning process. In budgeting, ABC acted as a baseline forprojecting changes in activity costs. Applications in strategic planning focused primarily onidentifying areas for process reengineering or for strategic positioning. Most firms implementingABC plan to extend their application of ABC information to include other areas within their firm[12]. However, unless ABC is used to support decision making, the information is of marginalvalue.
The other side of the ABC issue presented in the literature are those companies who choose not toimplement ABC. The most common reasons given for deciding not to implement ABC is relatedto one or more of the following factors: operational and design costs, staff time, difficulty, and/orlack of internal commitment/organizational politics [5] [7] [10] [11].
Many of the same factors that comprised the barriers to ABC implementation were cited assignificant issues among those undergoing ABC implementation [1] [12] [14]. A 1994 IMAsurvey reported that very few companies who had implemented ABC were dissatisfied. Amongthose dissatisfied, three main reasons were given for their dissatisfaction. For some, the programemphasis died out and nothing was done with the results. For others, the link to improvedfinancial performance was not clear. In some instances, the users of ABC were slow to accessthe information for decision making purposes [7].
Despite these efforts and the great interest on the part of practitioners in ABC, there is a dearth ofempirical research in this area. Specifically, as mentioned earlier, very few studies haveinvestigated the reasons for not implementing ABC, and only one study has examined thereasons for implementing ABC. In addition, only one study has attempted to determine theextent to which ABC information is being used to support managerial decision making.
It is interesting that all of the research on the reasons for implementing or not implementingABC, with the exception of Jayson [7], was conducted in the United Kingdom. Also, it isimportant to note that one major flaw in these studies is the use of non-metric (i.e., categorical)scales to measure many of the variables. Such scales require an individual simply to agree ordisagree with a statement. This limits the type of analysis that may be utilized and does notpermit the use of more powerful statistical techniques to analyze the data. Interval scales,however, allow respondents to indicate the magnitude of differences or degree of agreement.Consequently, the actual strength of attributes or respondents’ attitudes can be measured moreaccurately thus permitting the use of more complex statistical procedures [15]. Finally, to date no
attempt has been made to determine whether a relationship exists between a firm’s use of ABCand its overall performance.
The present study is designed to address these gaps. Specifically, its purpose is to determine thefollowing:1. What are the factors that influence a firm’s decision to implement or not to implement
ABC?2. To what extent are ABC techniques being used to support managerial decision making?3. Is there a relationship between a firm’s use of ABC and (a) whether it is local, regional,
national, or international? and (b) its overall performance?
METHODOLOGY
The data for this study were collected from two sources. The first was a questionnaire distributedto members of the Institute of Management Accountants (IMA) attending a regional conferencein the southeast. A total of 24 accountants participated in this part of the study. The secondsource consisted of telephone interviews of members of the local IMA chapter in a largemetropolitan area in the southeast. Twenty-five of the 68 eligible members were interviewed.Therefore, a total of 49 accountants took part in the study. A questionnaire was developed as ameans of gathering data for this study. It was field tested for readability, interpretation, andcompleteness.
RESULTS
With respect to the factors which had influenced their firms’ decisions to implement ABC,support from upper level management was cited as the most critical factor. This is followed bydifficulty in collecting detailed activity data, the additional time involved in running two systems,the additional cost of running two systems, the additional time in generating additional reports,and the initial time in implementing an ABC system. Other reasons that are cited include thecosts in implementing an ABC system, the difficulty in running two systems, and organizationalpolitics. Finally, the difficulty in determining cost drivers is the least influential.
Among those who had not implemented ABC, the most important factor is the lack of supportfrom upper level management. This is followed by organizational politics, the initial time inimplementing an ABC system, the initial costs in implementing an ABC system, and thedifficulty in collecting detailed activity data. Other reasons that are cited include the cost ofrunning two systems and the time in running these systems. This is followed by the difficulty inrunning two systems, the difficulty in determining cost drivers, and the additional time involvedin generating additional reports.
Concerning the extent to which ABC techniques are being used to support various managerialdecisions, product or service pricing was cited as the most important area. This is followed bybusiness process improvements, product or service mix, product or service design, pursuingcustomer types and/or markets, budgeting, and make or buy decisions.
Respondents rated the accuracy of the product and/or service cost information generated by theircompanies as about average (mean = 3.14, s.d. = 1.94). Finally, 11 percent of the respondentsindicated that their companies’ performance was below industry average over the past three years,63 percent reported average performance, and 26 percent reported better-than-averageperformance.
The statistical analysis was performed as follows. First, a chi-squared test was conducted todetermine whether a relationship exists between whether or not a firm is using ABC and itsclassification (local, regional, national, or international). The results show a significantrelationship between these two variables ( 2 = 9.28578, d.f. = 3, p = .0257). Specifically, amonglocal companies, 80 percent reported that they did not use ABC. Among the regional firms, 82percent did not use ABC while 78 percent of the national ones did not use ABC. However, only36 percent of the international companies reported that they did not use ABC. Alternatively,among those companies that used ABC, 5 percent were local, 11 percent were regional, 11percent were national, and 74 percent were international.
Finally, to determine whether a relationship exists between a firm’s use of ABC and itsperformance vis-à-vis its industry, a chi squared test was deemed to be the appropriate statisticaltechnique. Although this test could not be conducted due to the relatively small expectedfrequencies in some of the cells [15, p. 520], the data show some interesting results. Specifically,whereas only 17 percent of the firms not using ABC outperformed their respective industries,fully one-half of those using ABC were in this category. Alternatively, whereas 60 percent of thefirms that outperformed their industry were using ABC, 77 percent of those that performed at orbelow their industry average were not using ABC.
DISCUSSION
Not surprisingly, the factor which ranked most significant both in influencing a firm to implementand to not implement ABC was the degree of support from upper level management. ABCrepresents a pervasive change to a firm’s information system processes since most systems aredesigned around the informational needs for required external reports [3]. A greater level of detailis needed to produce ABC information. It involves the identification and tracking of activitiesand/or businesses processes within the firm, their associated costs, and the drivers of cost. IfABC is implemented firm wide few, if any, employees of the firm are unaffected by itsinstallation. Without top management support, the effort required to successfully make such adramatic change in operational processing can quickly diminish, and employees will begin to slipback into the more comfortable, more predictable processes of the traditional system. Thus,top management must not only be supportive of ABC, but must clearly communicate theircommitment to successful implementation of ABC.
Additionally, financial accountants generally play a key role in the design and implementation ofaccounting system changes. As indicated by earlier studies, ABC is frequently integrated into afirm’s primary financial system. Consequently, the support of key financial management(Controller, CFO) is critical. Without endorsement of the benefits of ABC by this group, othermembers of upper level management will likely be reluctant to support ABC, thus thwarting itsimplementation. This observation is consistent with prior research [6] suggesting thatorganizations are likely to encounter major implementation problems unless the top executivesactively support the proper implementation of the process.
Further comparison of firms who implemented ABC with firms who chose not to implementABC reveals some insights into strategic considerations by the two groups. Firms whoimplemented ABC cited the factors of additional time and additional cost of running two systemsas having a significant influence on their decision. They were also concerned about the amountof time involved to generate additional reports inherent in ABC system design and purpose. Incontrast, firms who chose not to implement ABC ranked initial time and initial cost factors assignificantly influential to their decision. Additional time involved to generate additional reportswas ranked last among this group.

These results suggest a strategic vs. operational perspective in the decision to implement or not toimplement ABC. The significant ranking of issues related to ABC implementation as opposed toABC installation by the group choosing to implement ABC indicates an acknowledgment of thebenefits of ABC early in the decision-making process. Recognition and acceptance of the long-run benefits of ABC is implied by this group’s focus on actual implementation costs in terms ofdollars, time and efficiency. On the other hand, the group choosing not to implement ABC wasmore influenced by the cost and time necessary for the initial installation of ABC with much lessconcern regarding issues related to actual implementation. Their concern with start-up costssuggests that this group was probably not convinced of the long-term cost benefit of ABC fortheir firms.
The results of this exploratory study suggest that top management must be convinced of the long-term benefits of ABC before implementation can be successful. Companies who are easilydiscouraged by the initial cost of implementing ABC probably perceive that the cost of installingABC outweighs the benefit of the improved information. This lack of confidence in ABCbenefits reduces upper level management commitment and support and results in a decision not toimplement the system.
Examination of the extent to which ABC techniques are used to support managerial decisionsfurther reiterates the importance of a strategic focus when considering the ABC decision. Theeffectiveness of improved product or service pricing (ranked #1) can generally only be measuredafter an extended period of performance. Improvement of business processes, one possibleoutcome of an ABC implementation also arises from the long-term benefits of improved costtracking and measurement of value-added processes.
This study also has examined the ABC techniques being used to formulate various managerialdecisions. The specific areas impacted by these decisions may provide some explanation for therelationship between a firm’s classification (local, regional, national or international) and whetheror not it is using ABC. Our survey results indicate that a large number of local (80%), regional(82%) and national (78%) companies did not use ABC, while only 36% of internationalcompanies reported that they did not use ABC. This may be attributable to the more pricecompetitive environment of international markets. Additionally, factors such as product quality,product diversity, and improved processes, such as Just-In-Time manufacturing, are often criticalto survival in a global market. Smaller firms with more concentrated product/service lines, andan established penetration of smaller target markets are likely to find the additional costinformation provided by ABC less critical. In fact, given that ABC has many more uses in amulti-product environment, it is not surprising that the ABC decision did not get past the issue ofinitial cost for firms choosing not to implement ABC. For smaller, less diverse firms with anestablished market, the benefits of ABC, when weighted against the cost, are not as substantial.

REFERENCES
[1] Evans, Hugh and Gary Ashworth. “Survey Conclusion: Wake up to the competition.”Management Accounting - London 74 (May 1996): 16-18.
[2] Global Business Research, Ltd. “Executive summary: Cost management Congress reportfrom 1995 proceedings.” CMC 2000.
[3] Houke, Charlotte. “Improve your competitive position with Activity Based CostManagement.” The BCG Advantage 1 (Summer 1995): 3-4.
[4] Innes, John and Falconer Mitchell. “ABC: A survey of CIMA members.” ManagementAccounting - London 66 (October 1991): 28-30.
[5] Innes, John and Falconer Mitchell. “ABC: A follow-up survey of CIMA members.”Management Accounting - London 69 (July/August 1995): 50-51.
[6] Jackson, Pamela and Nabil Ibrahim. “Behavioral problems encountered in implementing anActivity-Based Costing information system” The Institute of Management SciencesSoutheastern Chapter (October 1992): 637-641.
[7] Jayson, Susan. “Fax survey results: ABC is it worth the investment?” ManagementAccounting 75 (April 1994): 27.
[8] Kehoe, Joseph, William Dodson, Robert Reeve, and Gustav Plato. Activity BasedManagement in Government. Washington, DC: Coopers & Lybrand L.L.P., 1995.
[9] Krumwiede, Kip. “Survey reveals factors affecting use and implementation success.” CostManagement Update Issue 62 (April 1996): 1-5.
[10] Mitchell, Mike. “Activity-Based Costing in UK universities.” Public Money andManagement 16 (Jan - Mar 1996): 51-57.
[11] Nicholls, Brent. “ABC in the UK: A status report.” Management Accounting - London 70(May 1992): 22-28.
[12] Pohlen, Terrence L and Bernard J. La Londe. “Implementing Activity Based Costing(ABC) in logistics.” Journal of Business Logistics 15 (1994): 1-23.
[13] Shim, Eunsys and Ephrain F. Sudit. “How manufacturers price products.” ManagementAccounting 76 (Feb 1995): 37-39.
[14] Swenson, Dan W. and Dale L. Flesher. “Are you satisfied with your cost managementsystem?” Management Accounting 77 (March 1996): 49-53.
[15] Zigmund, William G. Business Research Methods 4th Edition , The Dryden Press 1994.

THE RELATIONSHIP BETWEEN RELIGIOUS DENOMINATION AND CHURCH SIZE UPONINTERNAL CONTROL PRACTICES
Allan Unseth, Raymond Laverdiere, Michael Chester, Norfolk State University, Norfolk, VA 23504(757) 683-8217
ABSTRACT
A survey questionnaire was mailed to a stratified random sample of 500 churches selected fromthe Mid-Atlantic region of the United States. The sample was stratified to reflect the five largest religiousdenominations, based upon total membership, in the United States. The questionnaire contained 31questions designed to ascertain the internal control practices and church size, in terms of membership andannual budget, of the individual churches surveyed. A response rate of 38% was obtained. One wayanalysis of variance using the Scheffe test was performed to determine significant differences indenomination and church size on internal control practices. The results of the analysis indicate thatreligious denomination and church size do influence internal control procedures for churches.
INTRODUCTION
According to Keister [5] it appears that the utilization of internal controls in churches has notreceived much attention. One reason may be that many church financial systems have been designed andare run by persons with little or no knowledge of what constitutes an effective internal control system.Another factor could be that the need for internal control can sometimes be a sensitive topic in anorganization that operates with a lot of mutual trust, such as a church [1].
Prentice [7] purports that oftentimes when church officers take on the financial responsibility ofthe congregation their duties are not always taken seriously. Thus, Jordan [4] maintains that there is apotential for financial abuse in church organizations. Every so often the media reports an embezzlementof church monies. One of the most interesting, as related by Lackey [6], involved a person who wascharged with embezzling church funds by forging checks on the church account. This person had beenthe church treasurer for twenty-five years. Goodstein [3] described one of the largest church-relateddefalcations ($2.2 million), which was perpetrated by the treasurer of a large denomination. The personwas able to divert the money in part because she had control over the auditing function.
Burkel [2] avers that no one accounting system is best for a specific church. Differences in thesize of membership, amount of the budget, denomination, and other factors certainly play a part in thesetting up of internal controls. However, a poorly designed internal control system could lead toinaccurate financial reporting and to other potential problems and abuses. Smith [8] states that a well-designed system of internal control reduces the temptation for embezzlement and can relieve the possibleconcern of church members that others might be misappropriating church funds. It is customary with for-profit businesses that the type and degree of internal procedures can depend upon the size and type of thecompany. This paper is an attempt to determine the relationship between religious denomination andchurch size upon internal control practices of churches in the Mid-Atlantic region of the United States.
METHODOLOGY
A survey questionnaire was mailed to a stratified random sample of 500 churches selected fromthe 1996 Select Phone Directory for the Mid-Atlantic region of the United States. The sample wasstratified to reflect the five largest religious denominations, based upon total membership, in the UnitedStates. One hundred churches were selected from each of the following denominations: Catholic,Lutheran, Baptist, Methodist, and Church of God.

The questionnaire contained 28 questions (Table 1) on internal control procedures, as adaptedfrom Vargo [9], designed to ascertain the internal control practices of the individual churches surveyed.Each question required a response using a five point Likert scale: never, seldom, sometimes, usually,always. The instrument also had questions asking for the size of the church in terms of annual budget andmembership. An overall response rate of 38% was obtained with at least 30 responses from eachdenomination.
One way analysis of variance was performed to determine significant differences, at the .05 level,in the denomination and church size as relates to the specific internal control practices contained in thequestionnaire. In addition, multiple comparison tests were performed using the Scheffe test to determinewhich population means were different from each other. Multiple comparison tests use more stringentcriteria for declaring differences significant than does the usual t test. The Scheffe test is one of the moreconservative of these tests in that it requires larger differences between means for significance.
RESULTS AND CONCLUSIONS
The summary of the survey results will be organized according to the size of the annual budget,size of membership and type of denomination.
Annual Budget
When looking at the survey results as regards the size of the annual budget there were three areaswith significant differences. The first was concerned with the use of a written list of procedures for thecounting of collections (Question 5). Churches with annual budgets of over $300,000 utilized writtenprocedures to a much greater extent than those with budgets less than $100,000.
The second area dealt with the use of an after-hours bank depository system (Question 9). Hereagain the churches with budgets over $200,000 used the night depository to a much greater degree thanchurches with budgets under $50,000. The last area of difference pertained to whether a Petty Cash fundwas in use for small payments(Question 23). Not surprisingly, churches with budgets over $100,000 hadset up Petty Cash funds in a much greater magnitude than churches with budgets under $100,000.
Membership Size
The survey results dealing with size of church membership highlighted three areas withsignificant differences. The responses to Question Number 5 dealing with the utilization of a written listof collection counting procedures yielded results similar to the budget section. The larger churches (thosewith memberships of over 300) used this internal control procedure to a much greater extent than thesmaller churches.
Not unexpectedly, the replies to Question Number 9 dealing with the use of a night depositorysystem also produced outcomes comparable to the budget segment. The churches with over 500members used this control to a much greater magnitude than the churches with less than 50 members.When compared to the budget variable, the membership independent variable provided a new area with ameaningful difference. One area of difference was whether invoices were checked for accuracy beforebeing paid (Question 15). Those churches with memberships of over 300 used this internal controlprocedure to a much greater degree than those churches with smaller memberships.
At this point it appeared that the churches in our survey were comparable to for-profit businessesin their use of internal control procedures. The larger churches, in terms of both membership and budget,
TABLE 1Mean Responses to Survey Questionnaire Concerning Church Internal Controls
1 = Never, 2 = Seldom, 3 = Sometimes, 4 = Usually, 5 = Always
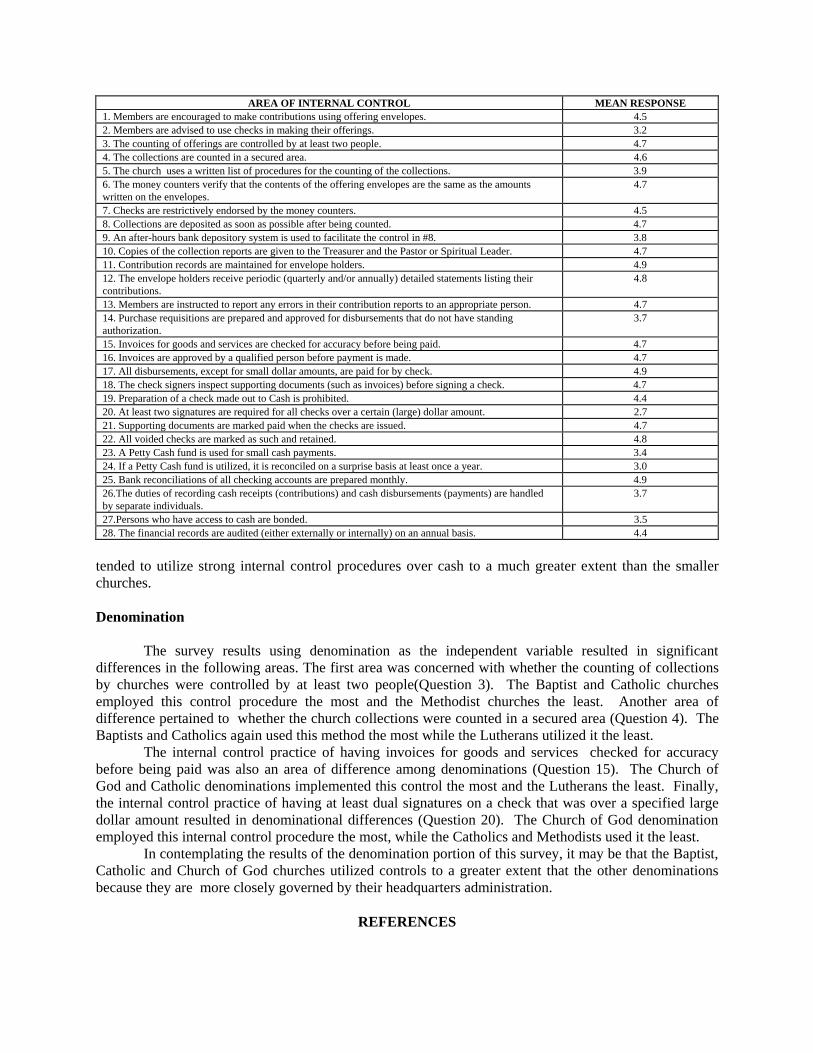
AREA OF INTERNAL CONTROL MEAN RESPONSE1. Members are encouraged to make contributions using offering envelopes. 4.52. Members are advised to use checks in making their offerings. 3.23. The counting of offerings are controlled by at least two people. 4.74. The collections are counted in a secured area. 4.65. The church uses a written list of procedures for the counting of the collections. 3.96. The money counters verify that the contents of the offering envelopes are the same as the amountswritten on the envelopes.
4.7
7. Checks are restrictively endorsed by the money counters. 4.58. Collections are deposited as soon as possible after being counted. 4.79. An after-hours bank depository system is used to facilitate the control in #8. 3.810. Copies of the collection reports are given to the Treasurer and the Pastor or Spiritual Leader. 4.711. Contribution records are maintained for envelope holders. 4.912. The envelope holders receive periodic (quarterly and/or annually) detailed statements listing theircontributions.
4.8
13. Members are instructed to report any errors in their contribution reports to an appropriate person. 4.714. Purchase requisitions are prepared and approved for disbursements that do not have standingauthorization.
3.7
15. Invoices for goods and services are checked for accuracy before being paid. 4.716. Invoices are approved by a qualified person before payment is made. 4.717. All disbursements, except for small dollar amounts, are paid for by check. 4.918. The check signers inspect supporting documents (such as invoices) before signing a check. 4.719. Preparation of a check made out to Cash is prohibited. 4.420. At least two signatures are required for all checks over a certain (large) dollar amount. 2.721. Supporting documents are marked paid when the checks are issued. 4.722. All voided checks are marked as such and retained. 4.823. A Petty Cash fund is used for small cash payments. 3.424. If a Petty Cash fund is utilized, it is reconciled on a surprise basis at least once a year. 3.025. Bank reconciliations of all checking accounts are prepared monthly. 4.926.The duties of recording cash receipts (contributions) and cash disbursements (payments) are handledby separate individuals.
3.7
27.Persons who have access to cash are bonded. 3.528. The financial records are audited (either externally or internally) on an annual basis. 4.4
tended to utilize strong internal control procedures over cash to a much greater extent than the smallerchurches.
Denomination
The survey results using denomination as the independent variable resulted in significantdifferences in the following areas. The first area was concerned with whether the counting of collectionsby churches were controlled by at least two people(Question 3). The Baptist and Catholic churchesemployed this control procedure the most and the Methodist churches the least. Another area ofdifference pertained to whether the church collections were counted in a secured area (Question 4). TheBaptists and Catholics again used this method the most while the Lutherans utilized it the least.
The internal control practice of having invoices for goods and services checked for accuracybefore being paid was also an area of difference among denominations (Question 15). The Church ofGod and Catholic denominations implemented this control the most and the Lutherans the least. Finally,the internal control practice of having at least dual signatures on a check that was over a specified largedollar amount resulted in denominational differences (Question 20). The Church of God denominationemployed this internal control procedure the most, while the Catholics and Methodists used it the least.
In contemplating the results of the denomination portion of this survey, it may be that the Baptist,Catholic and Church of God churches utilized controls to a greater extent that the other denominationsbecause they are more closely governed by their headquarters administration.
REFERENCES
[1] Boyce, L. Fred, Jr., “Accounting for Churches,” Journal of Accountancy, February, 1984,157(2), 96-102.
[2] Burkel, Daryl V. and Swindle, Bruce, “Church Accounting: Is There Only One Way?,” WomanCPA, July, 1988, 50(3), 27-31.
[3] Goodstein, Laurie, “Episcopal Church accuses ex-treasurer of embezzling,” The WashingtonPost, May 2, 1995, A-1.
[4] Jordan, Robert E., Thompson, James H. And Malley, John C., “Church Stewardship EvaluationInformation Requirements: A Pilot Study,” Public Budgeting & Finance, Fall, 1991, 11(3), 56-67.
[5] Keister, Orville R., “Internal Control for Churches,” Management Accounting, January, 1974,55(7), 40-42.
[6] Lackey, Patrick K., “Member accused of torching church,” The Virginian-Pilot, March 22, 1992,B-1.
[7] Prentice, Karol Beth, “Church Accounting,” Woman CPA, April, 1981, 43(2), 8-14.[8] Smith, L. Murphy and Miller, Jeffrey R., “An Internal Audit of a Church,” Internal Auditing,
Summer, 1989, 42. [9] Vargo, Richard J., Effective Church Accounting, New York: Harper Collins, 1989.
IRS: DO THEY PRACTICE WHAT THEY PREACH?
Clyde L. Posey, Louisiana Tech University, P. O. Box 10318, Ruston, LA 71272, (318) 257-3948Charla R. Campbell,.McElroy Metal Mill, Inc.,Bossier City, LA
ABSTRACT
In 1993, the GAO was unable to express an opinion on the reliability of the Internal Revenue Service’sfiscal 1993 financial statements because “critical supporting information” was unavailable. The purposeof the GAO report was to evaluate the IRS’ controls over the use of its operating funds to determine ifthey provided reasonable assurance that these funds were managed and expended in accordance with thelimitations and purposes specified by Congress in addition to being properly reported. The GAOidentified vital weaknesses in the IRS’ systems and procedures used to control, spend, account for, andreport on its operating funds. “The GAO was unable to audit approximately sixty-four percent of theoperating funds that the IRS reported spending during the fiscal year 1992 because the IRS could notaccount for all of the funds.”
INTRODUCTION
Many taxpayers find this very disturbing. The GAO could not issue an audit opinion on the IRS financialstatements because the IRS didn’t keep their own records properly. It is unfair and hypocritical of theIRS to report information about its own finances in such a slipshod manner. Each year, the IRS expectsall taxpayers to have virtually flawless financial records. If the taxpayer does not, the IRS may penalizethe taxpayer in an audit. If supporting documentation were not found in a taxpayer’s records, the IRSwould likely assess additional taxes, penalties, interest, and possibly litigation. If the IRS expects andrequires almost perfect records from taxpayers, shouldn’t the IRS be expected to practice what theypreach?
It would definitely be interesting to see what the IRS’s position would be if the situation were reversed.What would happen to a taxpayer in a similar position? This article will discuss some of the financial andmanagement deficiencies the GAO found and look at what the IRS would require of the taxpayer in thesame situation. The IRS rarely gives taxpayers a break, so why should Congress accept grossly deficientperformance from the IRS?
In fairness to the IRS, they have made some progress. According to congressional testimony of Gene L.Dodaro, Assistant Comptroller General of Accounting & Information Management Division of GAD onSeptember 19, 1996, the IRS still has “substantial problems in accounting for over $1 trillion in moniescollected from American taxpayers and billions of dollars in delinquent taxes owed to the government.”Of the 59 recommendations made by the GAD, 17 have been implemented and “efforts are underway toaddress the remaining areas.”
SUBSTANTIATION OF EXPENSES
The Internal Revenue Code allows taxpayers a deduction for “ordinary and necessary” business expenses.The term “ordinary and necessary” business expenses means only those expenses which are ordinary andnecessary in the conduct of the taxpayer’s business and are directly attributable to such business.
In order to claim the deduction, the Internal Revenue Code and related documents provide rules forsubstantiation. The Code states that:

. . . a taxpayer must substantiate each element of an expenditure by adequate records orby sufficient evidence corroborating his own statement, such as the amount, timing,place, and business purpose of the expenditure, except as otherwise provided.
To evaluate the effectiveness of IRS’ systems and internal controls over its payments for goods andservices, the GAO reviewed 280 out of 378 payments to vendors. The GAO noted:
. . . about 1.5 percent were duplicate payments, and 40 percent were not supported bycomplete documentation, and therefore, may have been inappropriate.
In addition, the IRS did not promptly analyze and correctly record certain expenditures for whichsupporting documentation was originally unavailable. This is a very important issue. To obtainassurance that funds supplied to the IRS are actually used for the purposes for which they wereappropriated, agencies are required by law to match promptly disbursements against the appropriateobligations. Because the IRS had no supporting documentation, they could not perform the match.
The importance of keeping appropriate records of business expenses by the taxpayer cannot beoveremphasized. When the taxpayer who fails to substantiate expenditures, the IRS and the Tax Courtscan be quite rigid. In Schmoutey vs. Commissioner, the courts were not at all lenient to the taxpayer.
. . . the taxpayer’s written lists, which were prepared for purposes of trial and whichcontained the names and business relationships of about 74 people and the name of about35 places of entertainment, were found to be insufficient to substantiate the claimeddeductions, in the absence of any additional corroborating evidence.
When the Service fails to substantiate expenditures, they are not penalized as a taxpayer would be. It isinherently unfair that the Internal Revenue Service can be allowed to operate under a double standard.
The Internal Revenue Code provides that a negligence penalty of 20 percent may be imposed on theamount of any underpayment of tax that is attributable to negligence. Negligence is defined as anycareless, reckless or intentional disregard of rules or regulations, any failure to make a reasonable attemptto comply with the provisions of the law, and any failure to exercise ordinary and reasonable care in thepreparation of a tax return, including failure to keep adequate records or substantiation. In proceedingsinvolving the issue of negligence, the burden is on the taxpayer to prove the penalty is erroneous.
In Rosanova vs. Commissioner, the taxpayers were assessed a negligence penalty for failure to produceevidence of the amounts, dates, business purposes, or any other details substantiating claimed businessdeductions. In the case of the IRS and their failure to produce supporting documentation for expenses,they were assessed no penalty. It is hypocritical and unfair that the same agency which assesses penaltieson taxpayers has no one to assess penalties on them for their errors.
INADEQUATE RECORD-KEEPING
Taxpayers are required by the IRS to keep records in the event the IRS decides an audit should beperformed. Those records have to be accurate or the IRS may assess an accuracy-related penalty.However, the IRS does not keep its own records in compliance with its own rules and regulations. TheGAO stated in their report that:

IRS reported spending was unreliable because it did not promptly: (1) resolvedifferences between its own records and cash transactions reported by the treasury, (2)investigate and properly record expenditures for which sufficient information wasinitially unavailable, and (3) review and adjust obligations to appropriate amounts.Without accurate information on spending, the IRS cannot determine if it exceeds itsbudget authority or provide reliable reports.
In June 1991, the IRS’ Internal Audit Division recommended in their Review of the Reconciliation ofAdministrative Accounts that the Controller provide additional instructions and oversight to ensure thatcash reconciliations were properly executed. The Controller responded by giving technical assistance tothe regional offices on how to perform reconciliations properly. By looking at the audit report of theGAO, it can be seen that the problem still exists almost two years later. In its report, the GAO stated:
Until the IRS establishes a reliable means for periodically resolving its cash differenceswith the Treasury and promptly adjusting its accounting records, it will not be able toproduce reliable budgetary data and reports.
Treasury regulations require the IRS to reconcile its cash accounts to Treasury balances monthly.However, the national office reported to its regional offices that they had found about 7,000 differencesbetween its records and the Treasury’s. These problems were not properly corrected because the IRS didnot have a system to ensure that these differences were corrected within a reasonable amount of time.Thirty-two percent of the cash differences were over one year old and twenty-nine percent were at leastsix months old. Furthermore, the GAO stated in its report:
At the end of fiscal year 1992, the IRS had not resolved differences of $63 millionbetween the Treasury’s cash balances and the General Services Administration’s (GSA)allocation account to the IRS. Although appropriated to GSA, the IRS is allowed toobligate and expend from this GSA account for the cost of maintaining GSA buildingswhich the IRS uses. Because the IRS failed to maintain adequate records of this accountand reconcile these differences, it had no assurance that its reports to the GSA wereaccurate.
Therefore, the GAO stated in their report that the IRS did not properly record expenditures againstappropriations.
Taxpayers each year are required to keep records impeccably if they want to avoid disallowed deductionsand retribution by the IRS. The burden of proof is on the taxpayer. In Holland vs. Commissioner, apipefitter who incurred travel expenses while away from home on some temporary jobs was denied adeduction because inadequate records were kept. Similarly, in Gantner vs. Commissioner, a 50 percentshareholder of a driving school was not allowed a deduction because he submitted only canceled checksin a certain amount. The IRS contended these checks did not adequately substantiate his claims becausehe could provide no other records.
INAPPROPRIATE CLASSIFICATION
The Internal Revenue Code states that to fulfill adequate records requirements, the account, book,statement of expense, or other similar record shall be maintained with respect to each separate
expenditure and not with respect to aggregate amounts for two or more expenditures. During the audit,the GAO found that certain IRS expenditures were charged to inappropriate accounts due to lack ofadequate controls over the assignment of accounting information to its transactions. In the sample of 280vendor payments, they found 12 instances in which the IRS inappropriately classified expenditures. Oneof the misclassifications involved a $46,694 invoice for both maintenance and a lease of computerequipment classified entirely as maintenance expense when it should have been $19,662 and $27,032,respectively. In this case, the IRS obviously carelessly disregarded its own rules and regulations. If thetaxpayer doesn’t properly classify expenditures, the deduction will be disallowed. In Jenkins vs.Commissioner, the taxpayer classified certain expenditures as repairs and was denied the deductionbecause the IRS maintained that they were capital expenditures which must be capitalized and depreciatedover the remaining useful life.
AUTOMATIC DATA PROCESSING
The Service specifies standards that must be met when a taxpayer maintains records using an AutomaticData Processing (ADP) system. Revenue Procedure 91-59 updates Revenue Procedure 86-19 andspecifies the basic requirements that the IRS considers essential in cases where taxpayer’s records aremaintained within an ADP system. Revenue Procedure 85-19 provides guidelines for recordrequirements to be followed in cases where all or part of the accounting records are maintained withinan ADP system. References to ADP include:
. . . all accounting and/or financial systems and subsystems that process all or part of ataxpayer’s transactions, records, or data by other than manual means.
Any procedures built into a computer’s accounting program must include a method of producing legibleand accurate (emphasis added) records that provide the necessary information to verify the taxpayer’s taxliability.
When looking into a taxpayer’s ADP records and systems, the District Director may issue a Notice ofInadequate Records pursuant to section 1.6001-1(d) of the regulations if machine-sensitive records are notproperly kept as required by Revenue Procedure 91-59. Failure to comply with the provisions of theprocedure may also result in the imposition of an accuracy-related penalty under Section 6662(a) of theCode that is related to negligence or a disregard of the rules and regulations as provided under section6662(b)(1). A criminal penalty may also apply under Code Section 7203 if the person willfully fails tokeep records or supply adequate information at the time as required by law. In addition to other penalties,the taxpayer may be guilty of a misdemeanor and, upon conviction, shall be fined not more than $10,000or imprisoned not more than one year, or both, along with the costs of prosecution.
Prior to October 1, 1992, the IRS used the Automated Accounting and Budget Execution System(AABES) to record detail spending. The records of detailed spending information for operating expensesin the six IRS regions that used AABES for its administrative accounting functions did not supportsummary records. As a result, the IRS did not have reasonable assurance that its AABES general ledgerbalances for operating expenses were complete and accurate. This information is very important becauseit is used to provide information to management, the Treasury, the Office of Management and Budget,and Congress.Since the IRS did not reconcile its detailed records to summary records, it was not aware of thediscrepancy until the GAO brought it to their attention. This limited the scope of the audit in six regionsbecause of the inability of the IRS to resolve differences ranging from $9 to $18 million. As of October1, 1992, the IRS had implemented a new administrative accounting system, the Automated FinancialSystem (AFS). Only the national office and central region used the new system during the fiscal year

1992. AFS was selected to replace AABES because the IRS stated that AABES was outdated and did notconform to current standards for financial management systems. However, when the GAO audited theAFS system, they noted that “the IRS’ effectiveness in preventing and detecting improper payments andproperly timing its payments was hampered because AFS and the procurement system were not fullyintegrated or reconciled, and important features of AFS were not fully used.” For example, the IRS couldhave used the AFS system to identify possible duplicate payments and to properly time payments. Thereis a feature of the system which allows employees to review all prior payments related to a specificpurchase order. If the employees had used this feature, many of the duplicate payments could have beenavoided. In addition, the GAO stated that:
Integration of the payment and procurement systems could allow payments to be madewithin required time frames. In the short term, periodic reconciliations of the twosystems’ data and identify (1) payments made for invoices that were not certified forpayment and (2) invoices which were certified for payment but not properly paid.
The IRS obviously has some problems with its automatic record-keeping process. What if the taxpayerhad these same problems? In one case, the taxpayer was required to pay a negligence penalty for failureto maintain adequate records. The Revenue Ruling covering the case states:
Where a taxpayer maintained only worksheets from which the difference in depreciationfor book and tax purposes may be reconciled, there has been a failure to comply with theregulations and with Code Section 6001. The taxpayer is required to keep such“auxiliary” records as are permanent in nature, and are maintained with the regular booksof account, and in themselves recognize the difference in depreciation for book and taxpurposes.
TIMING OF PAYMENTS
The Prompt Payment Act requires federal entities to make payments on time, to pay interest whenpayments are late, and to take discounts when payments are made on or before the discount date. OMBCircular A-125, “Prompt Payment,” which implements the act, also states that vendor invoices should notbe paid too early. In the GAO’s sample review of 280 national office and central region payments tovendors, they found that 81 payments were late and 83 payments were made earlier than required. Thesepayments totaled $31 million. They concluded that “the IRS either incorrectly computed and underpaidinterest or did not pay any interest for 56 of the 81 late payments.” This indicates ineffective IRS cashmanagement practices which resulted in costs to the federal government due to lost interest earnings onearly payments and additional interest expenses for the late ones.
In elaborating on the late payments, the GAO noted that they were paid on an average of 34 days afterthey were due. The IRS contends that its late payments were “due to delays in the payment officesobtaining the receiving reports.” How would the IRS accept such a lame excuse from a taxpayer? It isvery likely that a number of dire consequences would result. In fact, every year taxpayers race to postoffices around the country to meet the midnight deadline on April 15. If you have not filed an extension,and your return is not postmarked by the deadline, you will pay additional interest and penalties for latefiling.
Regulation 301.6651-1(f) of the Code states that a taxpayer is required to file a tax return and pay any taxowed by the applicable due date. If the return is not timely filed or if the tax is not timely paid, a penaltyunder Code Section 6651 is imposed unless the taxpayer shows reasonable cause. The taxpayer has theburden of proof to provide “reasonable cause” for failure to pay tax on time.
In Jenkins vs. Commissioner, the taxpayer, a delegate of the U.S. Embassy, was in a “sensitive position”and out of the country when the tax return became due. He did not attach a statement showing that hewas eligible for an automatic extension of two months which is allowed for U.S. taxpayers residing ortraveling outside of the U.S. He could produce no records showing that he filed an extension for theremaining period. Based on these circumstances, he failed to provide reasonable cause and was assessedan addition to his tax due to late filing.
Also, in Rasmussen vs. Commissioner, a pastor who failed to present evidence that he obtained anextension to file his return was liable for the penalty to file a timely return. The pastor’s tax returnpreparer testified to the fact that he had never filed late. This evidence alone was not sufficient to showthat an extension was granted when neither the pastor nor his return preparer could produce a copy of theextension request. The fact that the notice of deficiency for the tax year in question was sent pursuant toan extention agreement after the regular three-year statute of limitations period had expired did not shiftthe burden to the IRS to prove there was a failure to file a timely return. Based on the Service’s reasonfor the late payments, do you believe they proved “reasonable cause”? The IRS blames “significantdelays” in obtaining reports for their late recordings and payments. If the taxpayer tried to use thisdefense, the Service would generally disregard the taxpayer’s position and likely impose a penalty.
Even incarceration is not considered “reasonable cause” not to file a timely return. In Llorente vs.Commissioner, the taxpayer was in jail at the time he was supposed to file his tax return. The courtsfound in favor of the IRS and imposed a late filing penalty. Lost records is another defense tried bytaxpayers to show reasonable cause. In Cook vs. Commissioner, the taxpayers, who operated a truckingbusiness, were required to substantiate deductions and an investment tax credit. The taxpayers contendedthat the IRS lost part of their records during an audit. The courts found in favor of the IRS and imposed afailure to file penalty.
The GAO also found that of the late payments on which the IRS was required to pay interest, 56 of the 81interest payments were underpaid. In total, the IRS paid $673,000 in interest attributable to latepayments. In addition, the GAO also noted instances where interest was miscalculated. For example,they found that a $22,223 interest payment was understated by $974 because interest was not properlycompounded every 30 days as required during the payments 145-day late period. If a taxpayer had beenin this position, the IRS would have charged interest and accuracy-related penalties.
On the issue of early payment, the GAO found that over 93,100 early payments had been made. This is adirect violation of OMB Circular A-125 which states that unless vendor discounts are cost-effective, aninvoice should not be paid more than 7 days before its due date. The payments are only allowed when theagency head or designee has determined that the early payment is necessary. None of the 93,100 earlypayments were authorized or approved.
It is clear that the IRS does not adhere to its own strict standards and regulations. When a taxpayer doesnot keep the records or follow the regulations which the IRS requires, penalties and additional tax may beassessed. Most of the infractions discussed in this article give way to civil penalties. Civil penalties areimposed when the tax statues are violated without reasonable cause, as the result of negligence orintentional disregard, or through willful disobedience or outright fraud. Ad valorem penalties are a typeof civil penalty and are the type used in most taxpayer infractions. Ad valorem penalties are additions totax that are based upon a percentage of the tax. Accuracy-related penalties are also imposed in manysimilar cases. The accuracy-related penalty amounts to 20 percent of the portion of the tax underpaymentresulting from inaccuracy of return data, including the existing negligence penalty, or failure to showreasonable cause. When the accuracy-related penalty applies, interest on the penalty accrues from the
date of the return, rather than merely from the date on which the penalty was imposed. The negligencepenalty is equal to 5 percent of the underpayment of tax.
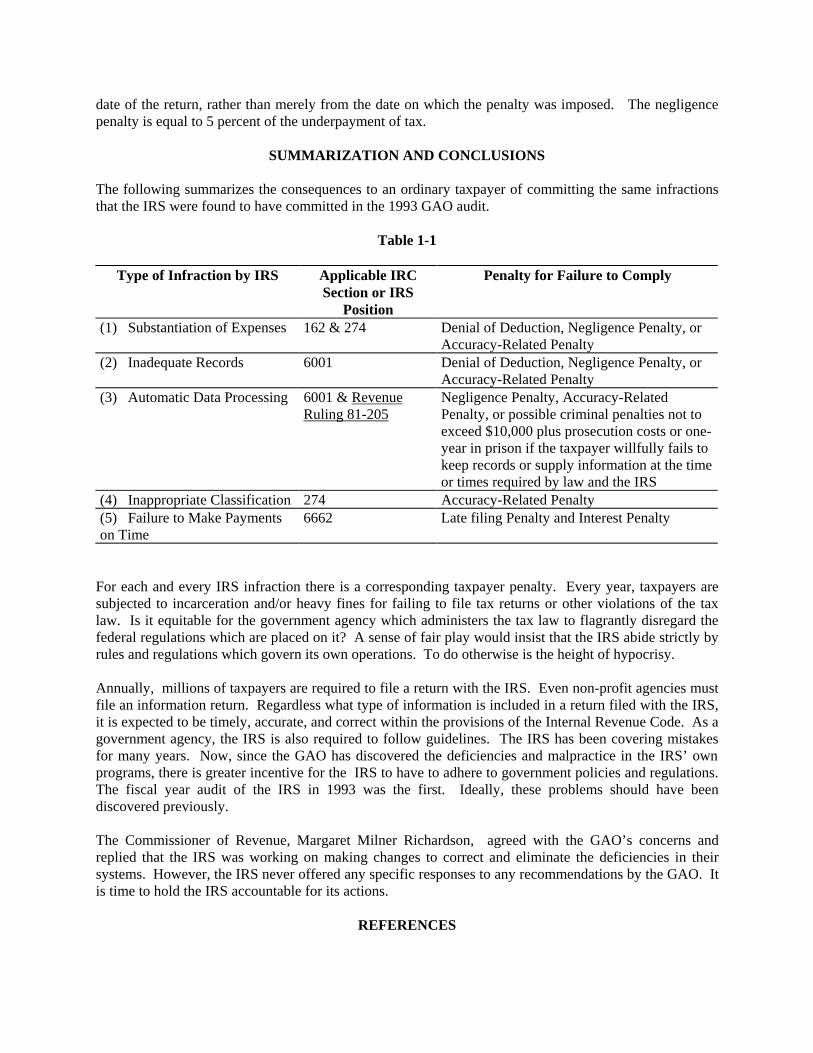
SUMMARIZATION AND CONCLUSIONS
The following summarizes the consequences to an ordinary taxpayer of committing the same infractionsthat the IRS were found to have committed in the 1993 GAO audit.
Table 1-1
Type of Infraction by IRS Applicable IRCSection or IRS
Position
Penalty for Failure to Comply
(1) Substantiation of Expenses 162 & 274 Denial of Deduction, Negligence Penalty, orAccuracy-Related Penalty
(2) Inadequate Records 6001 Denial of Deduction, Negligence Penalty, orAccuracy-Related Penalty
(3) Automatic Data Processing 6001 & RevenueRuling 81-205
Negligence Penalty, Accuracy-RelatedPenalty, or possible criminal penalties not toexceed $10,000 plus prosecution costs or one-year in prison if the taxpayer willfully fails tokeep records or supply information at the timeor times required by law and the IRS
(4) Inappropriate Classification 274 Accuracy-Related Penalty(5) Failure to Make Paymentson Time
6662 Late filing Penalty and Interest Penalty
For each and every IRS infraction there is a corresponding taxpayer penalty. Every year, taxpayers aresubjected to incarceration and/or heavy fines for failing to file tax returns or other violations of the taxlaw. Is it equitable for the government agency which administers the tax law to flagrantly disregard thefederal regulations which are placed on it? A sense of fair play would insist that the IRS abide strictly byrules and regulations which govern its own operations. To do otherwise is the height of hypocrisy.
Annually, millions of taxpayers are required to file a return with the IRS. Even non-profit agencies mustfile an information return. Regardless what type of information is included in a return filed with the IRS,it is expected to be timely, accurate, and correct within the provisions of the Internal Revenue Code. As agovernment agency, the IRS is also required to follow guidelines. The IRS has been covering mistakesfor many years. Now, since the GAO has discovered the deficiencies and malpractice in the IRS’ ownprograms, there is greater incentive for the IRS to have to adhere to government policies and regulations.The fiscal year audit of the IRS in 1993 was the first. Ideally, these problems should have beendiscovered previously.
The Commissioner of Revenue, Margaret Milner Richardson, agreed with the GAO’s concerns andreplied that the IRS was working on making changes to correct and eliminate the deficiencies in theirsystems. However, the IRS never offered any specific responses to any recommendations by the GAO. Itis time to hold the IRS accountable for its actions.
REFERENCES

[1] Financial Management: IRS Does Not Adequately Manage Its Operating Funds, General Accounting Office report (GAO/AIMD-94-33).
[2] Internal Revenue Code, as amended, 1986.
[3] Revenue Procedure 91-59, 1991-2 CB 841.
[4] Revenue Ruling 81-205, 1981-2 CB 205.
[5] Revenue Ruling 58-306, 1958-1 CB 123, modified by Revenue Ruling 58-601, 1958-2 CB 81.
[6] “GAO Continues to Criticize the IRS,” The CPA Journal July 1994, pp. 13-14.
[7] “IRS Flunks Audit, says GAO,” The Journal of Taxation v81, n4, p. 263.
[8] Raabe, William A., Whittenburg, Gerald E., and Bost, John C. West’s Federal Tax Research (thirdedition 1994). West’s Publishing Company, St. Paul, Minnesota.
[9] Schmoutey v Commr, TC Memo 1979-142, 38 TCM 637.
[10] Enoch v Commr, 57 TC 781 (1972).
[11] Rosavova v Commr, TC Memo 1985-306.
[12] Holland v Commr, TC Memo 1988-51, 55 TCM 93, paragraph 88,051 P-H Memo.
[13] Gantner v Commr, 91 TC 713 (1988), affd 905 F2d 241 (8th Cir., 1990).
[14] Jenkins v Commr, TC Memo 1982-407.
[15] Jenkins v Commr, TC Memo 1982-408.
[16] Rasmussen v Commr, 68 TCM 30, Dec. 49,949(M), TC Memo 1994-311.
[17] R. Llorente v Commr, 74 TC 260, Dec. 36,955 (Acq.).
[18] E. N. Cook v Commr, 62 TCM 1339, Dec. 47,776(M).

TRACK: Educational Innovation
"" II nnssttrr uucctt iioonnaall UUssee ooff LL II SSTTSSEERRVV""MMeellvviinn JJoohhnnssoonn,, NNoorrtthh CCaarrooll iinnaa AA && TT SSttaattee UUnniivveerrssii ttyyMMaarrccyy EE.. JJoohhnnssoonn,, VVii rrggiinniiaa TTeecchh
"" TThhee EEff ffeecctt iivveenneessss ooff aa TTeeaamm--BBaasseedd LL eeaarr nniinngg AApppprr ooaacchh iinn aann UUnnddeerr ggrr aadduuaattee CCoouurr ssee""DDiinneesshh SS.. DDaavvee,, AAppppaallaacchhiiaann SSttaattee UUnniivveerrssii ttyyDDaavviidd PP.. CCooookk,, AAppppaallaacchhiiaann SSttaattee UUnniivveerrssii ttyy
"" TThhee SSeelleecctt iioonn aanndd AAsssseessssmmeenntt ooff TTeeaacchhiinngg MM eetthhooddss iinn BBuussiinneessss SScchhoooollss""Richard J. Stapleton, Georgia Southern UniversityGGeennee MMuurrkkiissoonn,, GGeeoorrggiiaa SSoouutthheerrnn UUnniivveerrssii ttyyDDeebboorraahh CC.. SSttaapplleettoonn,, GGeeoorrggiiaa SSoouutthheerrnn UUnniivveerrssii ttyy
"" II mmppll iiccaatt iioonnss ooff tthhee TThheeoorr yy ooff AAnnddrr ooggooggyy ffoorr DDii ff ffeerr eenntt TTeeaacchhiinngg MM eetthhooddoollooggiieess iinn tthhee AArr eeaa ooffMM aannaaggeemmeenntt SScciieennccee""
BBrraadd RR.. JJoohhnnssoonn,, GGoovveerrnnoorrss SSttaattee UUnniivveerrssii ttyy
"" DDiissttaannccee LL eeaarr nniinngg:: II ss ii tt ffoorr EEvveerr yybbooddyy??""BBrraadd RR.. JJoohhnnssoonn,, GGoovveerrnnoorrss SSttaattee UUnniivveerrssii ttyy
"" CCllaassssrr oooomm EEdduuccaatt iioonn WWii tthh NNoo BBooookkss""MMoohhaann PP.. RRaaoo,, TTeexxaass AA&&MM UUnniivveerrssii ttyy -- KKiinnggssvvii ll llee
"" SSoollvviinngg tthhee UUnniivveerr ssii ttyy'' ss NNeeeedd ffoorr SSoolluutt iioonnss ttoo II nnffoorr mmaatt iioonn TTeecchhnnoollooggyy PPrr oobblleemmss aanndd tthhee NNeeeedd ffoorrII nnnnoovvaatt iioonn iinn tthhee CCllaassssrr oooomm SSiimmuull ttaanneeoouussllyy""
TToommmmiiee SSiinngglleettoonn,, UUnniivveerrssii ttyy ooff NNoorrtthh AAllaabbaammaaRRoobbeerrtt SSwweeeenneeyy,, UUnniivveerrssii ttyy ooff NNoorrtthh AAllaabbaammaaKKeerrrryy PP.. GGaattll iinn,, UUnniivveerrssii ttyy ooff NNoorrtthh AAllaabbaammaa
"" CCuurr rr iiccuulluumm RReevviissiioonn:: AA SSttaakkeehhoollddeerr AApppprr ooaacchh""KKaatthhlleeeenn WW.. WWaatteess,, UUnniivveerrssii ttyy ooff SSoouutthh CCaarrooll iinnaa -- AAiikkeennPPaattssyy LLeewweell llyynn,, UUnniivveerrssii ttyy ooff SSoouutthh CCaarrooll iinnaa -- AAiikkeenn
"" DDeessiiggnniinngg tthhee DDeessiiggnn EExxppeerr iieennccee""JJoohhnn LL.. EEaattmmaann,, UUnniivveerrssii ttyy ooff NNoorrtthh CCaarrooll iinnaa -- GGrreeeennssbboorroo

INSTRUCTIONAL USE OF LISTSERV
Melvin N. Johnson, North Carolina A&T State UniversityMarcelite Dingle Johnson, Virginia Polytechnic Institute & State University
ABSTRACT
This paper describes the instructional use of LISTSERV in an undergraduate course in money and banking. The instructionalprocess would be useful to instructors planning to teach similar material. Having the LISTSERV dedicated to the class encouragesthe students to begin using computer-mediated communication.
Background
To successfully complete the requirements for this course, astudent must have access to a computer that can use emailand the World Wide Web. A student also must have accessto an email client application program such as Eudora orMicrosoft Exchange. There are should be severalnetworked student computer labs on campus which areavailable to students with direct access to the Internet.
Starting The List
The first step is to create a classroom E-mail discussiongroup. With the information provided, the Registrar’s officecan generate a class roll. The Computing Center uses thisclass roll to generate a list of student names who haveUSERIDs (e-mail addresses). The entire list is thensubscribed to a new LISTSERV list. The list isautomatically deleted one week after the semester ends.
Keeping Archives
The instructor must decide whether to use LISTSERV tomaintain archives of all mail sent to the list. LISTSERVcan automatically store a copy of each e-mail note sent tothe list in a monthly archive file. LISTSERV then starts anew archive each month. This will allow the instructor andstudents to retrieve a monthly log of discussions on the listfor the current month (or any part thereof), or a previousmonth.
Owners of the list:
Multiple owners can be specified and error reports aredelivered to the owner’s address. Errors primarily consist ofe-mail that cannot be delivered (i.e., bounced mail).
Using The LISTSERV
Using the LISTSERV for the class will substantiallyincrease students’ interaction with each other and the facultymember, but rules have to be established for the discussions.The LISTSERV must provide the following: 1) postings ofall assignments, 2) focused discussions conducted on at leasta weekly basis, 3) responses to student questions abouthomework and class readings, 4) student critiques of otherstudent’s work.
Homework Example:
In accordance with the provisions of the Humphry-HawkinsFull Employment and Balanced Growth Act of 1978, FEDChairperson Alan Greenspan testified before Congress onFebruary 20, 1996. An executive summary of histestimony can be found at:(http://woodrow.mpls.frb.fed.us/info/policy/mpo/mp962.html).
Access this address, read and analyze the summary andanswer the following:
Week 1a. According to Chairperson Greenspan, what wasthe overall performance of theU.S. economy in 1995?
Week 2b. What is the economic growth forecast for 1996?
Week 3c. What does the FOMC expect with regard toinflation in 1996?
Week 4d. What is the FOMC’s stance on monetary policy for1996? What recommendations (i.e. policy directives)are made to support this stance?
Please engage your LISTSERV to discuss your responses tothe above questions.
Conclusion
The LISTSERV is considered one of the basic forms ofnetworked enhancement to teaching and learning. Theradical potential of e-mail for changing our teaching canalmost be overlooked because of its familiarity.Additionally, student-faculty interaction can be easilytracked for evaluation purposes. Finally, LISTSERVsoperate continuously, and therefore provide a substantialincrease in the time within which students can learntogether.
REFERENCES
http://email.listserve.com/Discussions/

Karayan, Silva S., “Student perceptions of electronicdiscussion groups,” T H E Journal, v24(9), Apr 1997, p. 69.
Pardee, M. H. (June, 1996), “Using E-Mail, Web Sites &Newsgroups to Enhance Traditional Classroom Instruction,”T.H.E. Journal, 23(11), pp. 79-82.
Williams, Nancy S., Owens, Roxanne F., “Benefits of usingLiterature Discussion Groups in Teacher Education,”Education, v117(1), Spring 2019-1997, p. 415.
Ng, Sik, Brooke, Mark, et al., “Interruption and Influence inDiscussion Groups,” Journal of Language & SocialPsychology, v14(4), Dec 1995, p. 369.
THE EFFECTIVENESS OF A TEAM-BASED LEARNING APPROACHIN AN UNDERGRADUATE COURSE
Dinesh S. Dave, John A. Walker College of Business, Appalachian State University, Boone, NC 28608David P. Cook, College of Business & Public Administration, Old Dominion University, Norfolk, VA23529
ABSTRACT
Teams are found at all levels in organizations and it is needed throughout the company. Also, it requiresthat team members compensate for one anothers weaknesses and capitalize one anothers skills throughthe exchange of ideas. Research studies showed that the success of every organization fully rests on theeffectiveness of each team, therefore, it is important for students to gain experience in participating inteams and in team-building activities. This paper assesses the effectiveness of a team-based learningapproach through an empirical investigation. The attitudes of undergraduate students toward their teamexperiences and their difficulties in functioning as a team are investigated. Furthermore, studentperceptions of their learning outcomes via this pedagogy are examined. The findings will provideinstructors with information regarding the successful implementation of a team-based learning approachin the classroom.
INTRODUCTION
According to Norman Augustine, CEO of Lockheed Martin Corporation, there cannot be a successfulorganization in America today that doesnt depend upon teamwork for superior performance and growth. Many executives are convinced that good teamwork can make their companies more competitive (Glaceland Robert, 1996). Teamwork is important in a wide variety of organizational activities. In countriessuch as Germany and Japan, not only is work accomplished in teams, but the planning and design ofwork, introduction of new technologies, etc. are accomplished in teams. Teamwork and team-buildingare important. While organizations have traditionally been formed around tasks or work groups, theconcept of teams and teamwork has become important in the last two decades. Recently, it has beenrecognized that the traditional focus on tasks or work groups has contributed to intra-organizationalrivalries, competition, and self-centeredness which collectively counter the focus on the two mostimportant functions of any organization: accomplishing the mission and service to customers (Lewis andSmith, 1994). It is well known that, in most cases, teams can outperform the efforts of individuals. Ateam is not just a group of people when certain conditions are met: a common mission exists, membersadhere to certain ground rules, there is a fair distribution of responsibility, and people are able to adapt tochange (Goetsch and Davis, 1997).
Teams are found at all levels in organizations. Teamwork is needed throughout the company. It requiresthat team members compensate for one anothers weaknesses and sharpen one anothers skills through theexchange of ideas (Deming, 1992). The success of every organization fully rests on the effectiveness ofeach team (Lewis and Smith, 1994). Therefore, it is important for students to gain experience inparticipating in teams and in team-building activities. Individuals have inherent limitations. They onlyhave 24 hours in a day, they are occasionally ill, and, perhaps most importantly, they only have their ownexperiences to draw on when trying to solve a problem. Complex problems require solutions thatconverge from many directions to solve all aspects of the problem. It takes a combination of experiencesand capabilities to solve these problems. It requires teams (Christopher and Thor, 1995).

Because teams play an important role for the potential success of organizations, it is crucial for students toobtain the necessary skills to function in this environment. It is the responsibility of business schools toprovide their students with such skills by encouraging them to work on projects and assignments in teams. Evidence suggests team-work can be successfully employed in the classroom. It leads to positive studentoutcomes and valuable training for the real world. Walker (1996) indicates in team situations studentstend to make better decisions, are more likely to reject unfavorable solutions, and tend to have a moreaccurate memory of events. Baloche (1994) finds cooperation can create an environment conducive tocreative thinking.
In this paper, an empirical analysis is conducted to assess the effectiveness of a team-based learningapproach. The attitudes of undergraduate students toward their team experiences and their difficulties infunctioning as a team are investigated. Furthermore, student perceptions of their learning outcomes viathis pedagogy are examined. The findings will provide instructors with information regarding thesuccessful implementation of a team-based learning approach in the classroom.
RESEARCH METHODOLOGY
The research methodology for the present study consists of the research instrument, data collection, andstatistical methods.
Research Instrument
In this study, a survey instrument was developed to measure the effectiveness of team-based learning.Variables included in the instrument were student views of the leaning experience, improvement in thequality of the project, improvement in communication skills, improvement in the completion of theproject, and whether they enjoyed working in the team. Additionally, the instrument measured studentviews of the team environment -- the team understood agreed upon its mission, whether tem followed theground rules, selection of the team members, etc. In addition to the questions related to tem-basedlearning, demographic information (respondents age, gender, academic class, major, and whether or notworked on tem project) was collected.
Data Collection and Statistical Methods
In order to eliminate survey instrument ambiguity and to ensure accurate and consistent understanding ofthe questions and conciseness of the instrument, it was pilot tested on a few students in the college ofbusiness. These students were not included as sampling units. The survey was modified according to thefeedback received during the pilot test. A seven-point Likert-type scale was used to measure respondentsdegree of agreement or disagreement with the statements posed to them (1=strongly disagree and7=strongly agree). The survey instrument was distributed in two sections of an introductory informationsystems class at an accredited business school in the southeastern U. S. The survey instrument did notrequire that respondents reveal their identity. Various statistical methodologies such as the univariate andt-test procedures were applied using SAS [7].
RESULTS
The questionnaire was administered to a sample of 52 students. The following descriptive statisticsregarding the sample were calculated and are presented in Table 1.
The overall reliability of the survey instrument was demonstrated by a Cronbachs Alpha value of 0.8636. The sampling units were composed of 61.5% males and 38.5% females. Sophomores (67%) constituted
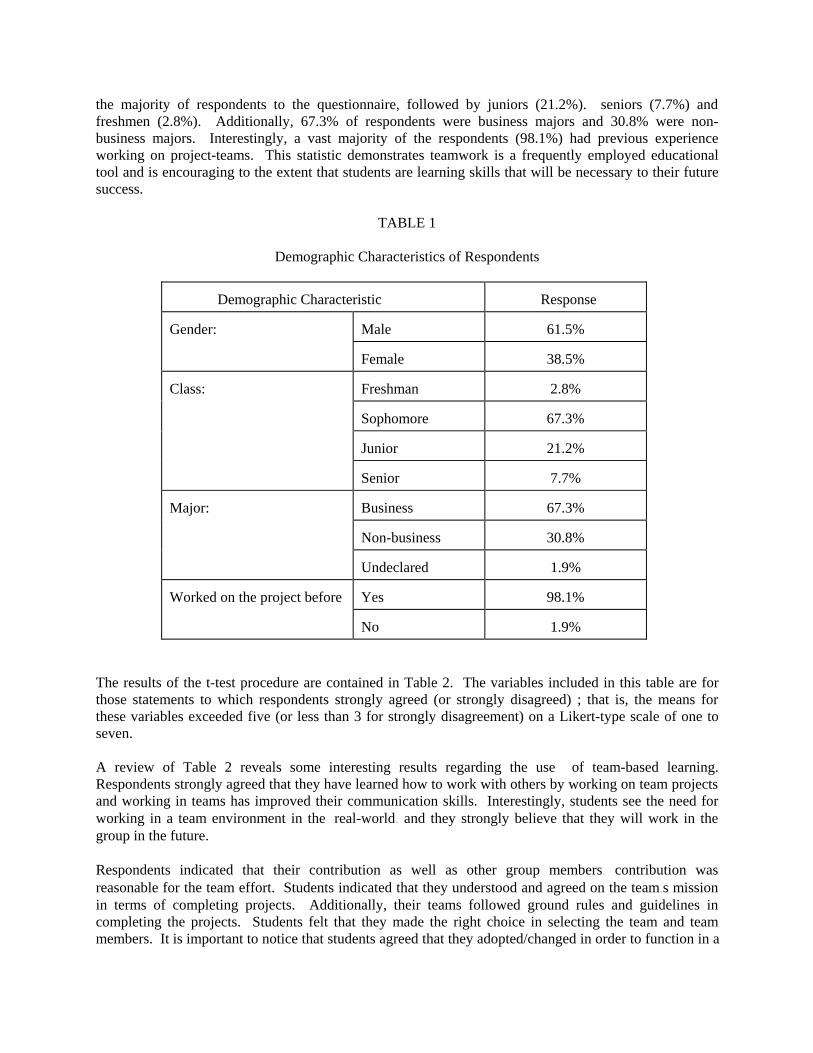
the majority of respondents to the questionnaire, followed by juniors (21.2%). seniors (7.7%) andfreshmen (2.8%). Additionally, 67.3% of respondents were business majors and 30.8% were non-business majors. Interestingly, a vast majority of the respondents (98.1%) had previous experienceworking on project-teams. This statistic demonstrates teamwork is a frequently employed educationaltool and is encouraging to the extent that students are learning skills that will be necessary to their futuresuccess.
TABLE 1
Demographic Characteristics of Respondents
Demographic Characteristic Response
Gender: Male 61.5%
Female 38.5%
Class: Freshman 2.8%
Sophomore 67.3%
Junior 21.2%
Senior 7.7%
Major: Business 67.3%
Non-business 30.8%
Undeclared 1.9%
Worked on the project before Yes 98.1%
No 1.9%
The results of the t-test procedure are contained in Table 2. The variables included in this table are forthose statements to which respondents strongly agreed (or strongly disagreed) ; that is, the means forthese variables exceeded five (or less than 3 for strongly disagreement) on a Likert-type scale of one toseven.
A review of Table 2 reveals some interesting results regarding the use of team-based learning.Respondents strongly agreed that they have learned how to work with others by working on team projectsand working in teams has improved their communication skills. Interestingly, students see the need forworking in a team environment in the real-world and they strongly believe that they will work in thegroup in the future.
Respondents indicated that their contribution as well as other group members contribution wasreasonable for the team effort. Students indicated that they understood and agreed on the teams missionin terms of completing projects. Additionally, their teams followed ground rules and guidelines incompleting the projects. Students felt that they made the right choice in selecting the team and teammembers. It is important to notice that students agreed that they adopted/changed in order to function in a

team environment. Finally, the results suggest that the respondents did not have difficulty working in ateam.

TABLE 2
Results of t-test Procedure
Variable Mean Result
SA/SD t-value
Learned how to work with others 5.44 SA 2.34
Working in teams has improved my communicationsskills
5.42 SA 2.75
I see the need for working in teams in real world 5.94 SA 7.79
I contributed reasonably to the team effort 6.06 SA 6.77
Other group members contributed reasonably to the team 6.02 SA 7.08
I learned from other team members 5.33 SA 1.94
I believe I will work in teams in the future 5.94 SA 6.81
My team understood its mission 6.00 SA 7.76
My team agreed on its mission 6.04 SA 7.57
My team followed ground rules 5.88 SA 5.64
I made the right choice in selecting my team 5.90 SA 4.84
Adopted/changed to function in a team environment 5.37 SA 2.05
I had difficulty working in a team 2.33 SD -13.28
SA = Strongly Agree SD = Strongly Disagree
CONCLUSIONS
Teamwork and team-building are important and teams are found at all levels in organizations. Sinceteams play important role for the potential success of organization, it is critical for students to obtain thenecessary skills to function in this environment. As a result, it becomes the responsibility of businessschools to provide their students with such skills by encouraging them to work on projects andassignments in teams.
In this paper, through an empirical investigation, the effectiveness of team-based learning approached wasstudied. Two sections of a sophomore level course at an accredited business school were surveyed. Theresults of the study indicated that students see the need for working in a team environment in the real-world and they believe they will work in teams in the future. Additionally, the findings suggested thatworking in a team in the classroom improves students communication skills. Furthermore, the studentslearn from other team members and they learned to change in order to function in a team environment. It
is important to note that results of the study are based upon students from a sophomore course. Futureresearch will be necessary to survey junior, senior, and graduate courses.
REFERENCES
[1] Baroche, L. (1994) Breaking Down the Walls: Integrating Creative Questioning and CooperativeLearning into Social Studies. The Social Studies. Vol. 85, No. 1, pp. 25-30.
[2] Christopher, W.F. and Thor, C.G. (1995) The 16-Point Strategy for Productivity and TotalQuality. Productivity Press: Portland, Oregon.
[3] Deming, W. E. (1992) Out of the Crisis. MIT Cases: Cambridge, MA.
[4] Glacel, B.P. and Robert, E. A. (1996) Light Bulbs for Leaders. John Wiley and Sons: New York,NY.
[5] Goetsch, D. L. and Davis, S.B. (1997) Introduction to Total Quality, Second Edition. PrenticeHall: Upper Saddle River, NJ.
[6] Lewis, R. G. and Smith, D.H. (1994) Total Quality in Higher Education. St. Lucie Press: DelrayBeach, FL.
[7] SAS/STAT Users Guide, (1993) Version 6, Fourth Edition, SAS Institute, Cary, NC.
[8] Walker, A. J. (1996) Cooperative Learning in the College Classroom. Family Relations. July,Vol. 45, No. 3, pp. 327-335.

THE SELECTION AND ASSESSMENT OF TEACHING METHODS IN BUSINESS SCHOOLS
Richard J. Stapleton, Georgia Southern University, Statesboro, GA 30461 (912) 681-5799Gene Murkison, Georgia Southern University
Deborah C. Stapleton, Georgia Southern University
ABSTRACT
This paper discusses some issues regarding the selection of teaching methods in business schools andproblems involved in assessing the success of business and management teaching. A major issue is howto develop relevant and valid criteria for measuring the success of not only the instructing of teachers butalso the total learning experience provided for students in various courses, taking into account theteaching methods used in the course as well as the books, testing procedures, and homework. The paperpresents the results of a small survey of AACSB deans regarding teaching method usage in their schools.
INTRODUCTION
Those of us who, for whatever reasons, chose to become business professors must select a method ofteaching, since all professors have to do at least some teaching, in addition to conducting research,providing service to the institution and community, and engaging in professional development activities.While some business professors escape teaching in business schools by becoming administrators, mostspend their careers in the classroom with students, sometimes 30 or more years.
Most business teaching is done via the lecture method, which in recent years has increasingly beenreferred to as "presenting." The term presenting has probably gained currency and favor because of theincreased usage of computers and video-audio systems in classrooms, fostered by computermanufacturers and textbook publishers providing packages replete with color transparencies, notes ondiscs, and even videos, not to mention computer software packages. The power-point teacher presentingmaterial in the classroom with multi-media hardware is somewhat analgous to a television stationprogram director presenting material to mass audiences. Distance learning teachers with such hardwarereally are in the television business. This system is made to order for today's business students who havebeen reared on television, having spent several hours most of their days watching television.
Basic Business Teaching Methods
There are four basic types of teaching methods used in business: the lecture method, the seminar method,the computer game method, and the case method. The lecture method entails presenting and instructingand generally entails students memorizing presented concepts, ideas, techniques, and the like for tests,often true-false and multiple-choice. The student is primarily a passive receiver of transmittedinformation, which may result in information overload, with little knowledge acquired. The seminarmethod requires more action in class for students than the lecture method. Students have to discussarticles and other material they have read outside of class and demonstrate some interest in andcomprehension of the material. The computer game method is a learning by doing method in whichstudents act out what are presumed to be be typical managerial roles, making what are considered to betypical management decisions in a particular industry. Students meet in teams and make decisions aboutinventories, work force levels, advertising outlays, and financing packages. These decisions are thenconverted to numbers and are fed into a computer game program that calculates, based on algorithmsprogrammed in the program by the game designer, what sort of results the decisions "produced" for thefirm in competition with other firms, i.e., other student teams making the same decisions. The casemethod [2]; [3]; [8]; [15] entails students studying the facts of cases, which are samples of business
reality, to diagnose, identify, and discuss problems, issues, and opportunities. Critics call this the blindleading the blind.
Teaching/Learning Strategies
How should any business teacher craft a strategy for producing learning – taking into account theselection of content, a teaching method, and a system for grading? A rational approach would entailcrafting a configuration of teaching methods, content, and testing procedures that would maximize theeffective learning of students. Defining effective learning is a problem, but, for most business disciplines,Gagne's definition [4] is appropriate: learning is "a change in human disposition or capability, whichpersists for some period of time, and which is not simply ascribable to processes of growth." A problemconfounding the rational design and choice of a teaching/learning strategy for business is the existence ofmany alternatives – at least 40 or more alternative configurations considering the combinations among asfew as three variables, for example 4 teaching methods X 4 or so testing procedures X 3 or 4 alternativetextbooks or casebooks.
This teaching/learning production possibilities problem theoretically fits the linear programming matrix,with its objective function (effective learning in this case), alternative variables to produce (eachcombinatory configuration above), and resource requirements and availabilities for the variables. Fewiterations of the matrix occur. Most business teachers have no idea whether they are maximizing learningwith the teaching/learning system they use, but, in most cases, continue to use pretty much the sameteaching/learning system throughout their careers. Their rationality is bounded [7], and they "satisfice."Over time teachers develop teaching schemata [5]; [6]; [14]. Schemata are cognitive structuresdeveloped through experience stored in memory that determine the selection and organization of currentexternal information.
Almost nothing has been published regarding the relative efficacy of business teaching methods. It seemsthe business education establishment assumes that alternative teaching/learning strategies have"equipotentiality" [1] – i..e., any teaching/learning system can produce as much effective long termlearning as any other. Given the difficulty proving that effective learning has been produced for the longhaul, most schools ignore the problem of measuring or estimating learning produced by teachers andinstead focus on immediate consumer gratification. If students are satisfied with the "instructor," asmeasured by student evaluations, then all is well and good. Students are graded only while they are inschool, but most teachers today will be graded by students in every course they teach for the rest of theirworking lives. Those grades, right or wrong, fair or unfair, cumulate through the years in a teacher'spermanent file in an administrator's office, affecting promotions, tenure, salary raises, and, mostimportant, the teacher’s long-term reputation.
Excellent Instructing and Excellent Teaching
Our recent research [12], shows that some instructors who score relatively high as excellent instructorsdo not produce relatively high learning among students, as estimated by students, and some teachers notconsidered good "instructors" by students do produce high learning, as estimated by students. Accordingto our research, there was a significant correlation (.75) between student evaluations of the quality of theinstructor in a course and how much they thought they learned in the course, but there were exceptionsamong the ranks comparing instructing and learning. We found there was a significant positivecorrelation between excellent instructor scores and expected grades. While there was not a significantcorrelation between ratings of the instructor and how much work was assigned in the course, teachersrated highly as instructors generally required less outside study than teachers rated poorly as instructors,based on ranks of means for instructing and work. While there have been scores of studies showingstudent evaluations of teachers are generally valid, there is also significant evidence in the published

literature, and in our study, that expected grades often bias the evaluations of students, irrespective of theeffects of coincidental little or much homework. Some teachers in some classes are severely punished bystudents on student evaluations for requiring too much work in the opinions of students and creating anexpectation among students that final grades will be low. Teachers with integrity cannot be expected tolead their students to expect high grades when student performance, relative to challenging standards, hasnot been high. To then brand such teachers as poor teachers when their student evaluations are low as aconsequence is a gross injustice. Doing so will inevitably lead to a further lowering of standards, moregrade inflation, and less effective learning.Do Teaching Methods Matter?
The Economist magazine [13], in their lead article, "Education and the Wealth of Nations," assertedteaching methods do matter. According to the Economist, students in different countries that excellearning mathematics and science are not necessarily taught by better teachers in schools with lowstudent-pupil ratios with the most and best computers, books, school buildings, desks, or anything elsethat can be bought with money for schools. What distinguishes the top systems from the lower systemsare teaching methods. According to our ex-students from 1972-1987 [9]; [10], over 70 percent (N=199)ranked the case method the best teaching method. In this study the case method business policy coursewas ranked the most valuable course in the business curriculum by students who had chosen case methodcourses, whereas students avoiding case method courses ranked the non-case policy courses 5th. Askedwhat they would recommend to improve the business curriculum, these students overwhelminglyrecommended that more case method teaching be added to the curriculum.
FURTHER RESEARCH
This research entails surveying deans of accredited AACSB schools regarding teaching methods used intheir schools and how they assess the effectiveness of teaching methods, if they assess them at all. Ourmain hypothesis is that most business schools have few processes for assessing the effectiveness ofteaching methods. We suspected that the case method is used very little outside of the businesspolicy/strategic management courses. A few deans said their responses were little more than wildguesses, since they had no way of knowing for sure what methods were used in all courses. Weresponded that this was permissible, that they could use the SWAG method if necessary, since theseestimates would provide more information than now exists. Some 290 questionnaires were mailed andwe received a total of 39 returned questionnaires, for an overall 13 percent response rate. Some of thesequestionnaires did not contain useable information for all questions; therefore N varied from question toquestion. We asked the deans to estimate what percent of all their courses entailed the lecture method,the seminar method, the case method, the computer game method, and "other" methods. Thirty-sevendeans responded to this question. We averaged their estimated percentages, and the result is presented inTable l.
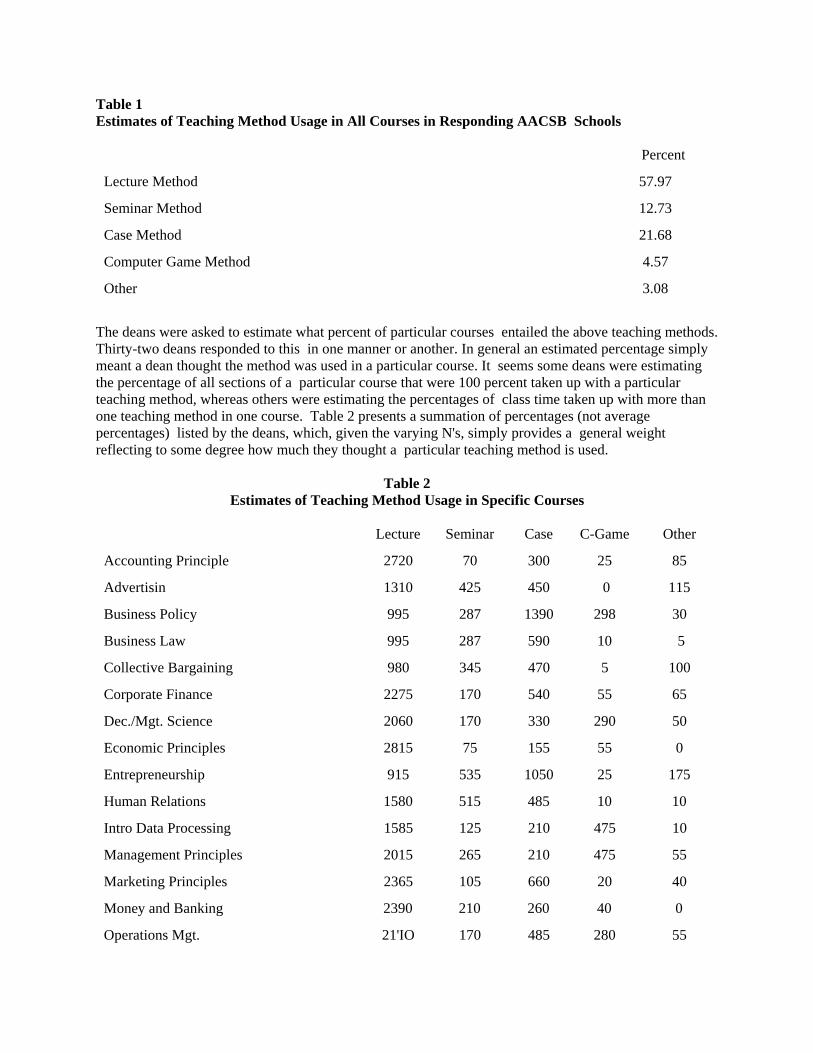
Table 1Estimates of Teaching Method Usage in All Courses in Responding AACSB Schools
Percent
Lecture Method 57.97
Seminar Method 12.73
Case Method 21.68
Computer Game Method 4.57
Other 3.08
The deans were asked to estimate what percent of particular courses entailed the above teaching methods.Thirty-two deans responded to this in one manner or another. In general an estimated percentage simplymeant a dean thought the method was used in a particular course. It seems some deans were estimatingthe percentage of all sections of a particular course that were 100 percent taken up with a particularteaching method, whereas others were estimating the percentages of class time taken up with more thanone teaching method in one course. Table 2 presents a summation of percentages (not averagepercentages) listed by the deans, which, given the varying N's, simply provides a general weightreflecting to some degree how much they thought a particular teaching method is used.
Table 2Estimates of Teaching Method Usage in Specific Courses
Lecture Seminar Case C-Game Other
Accounting Principle 2720 70 300 25 85
Advertisin 1310 425 450 0 115
Business Policy 995 287 1390 298 30
Business Law 995 287 590 10 5
Collective Bargaining 980 345 470 5 100
Corporate Finance 2275 170 540 55 65
Dec./Mgt. Science 2060 170 330 290 50
Economic Principles 2815 75 155 55 0
Entrepreneurship 915 535 1050 25 175
Human Relations 1580 515 485 10 10
Intro Data Processing 1585 125 210 475 10
Management Principles 2015 265 210 475 55
Marketing Principles 2365 105 660 20 40
Money and Banking 2390 210 260 40 0
Operations Mgt. 21'IO 170 485 280 55
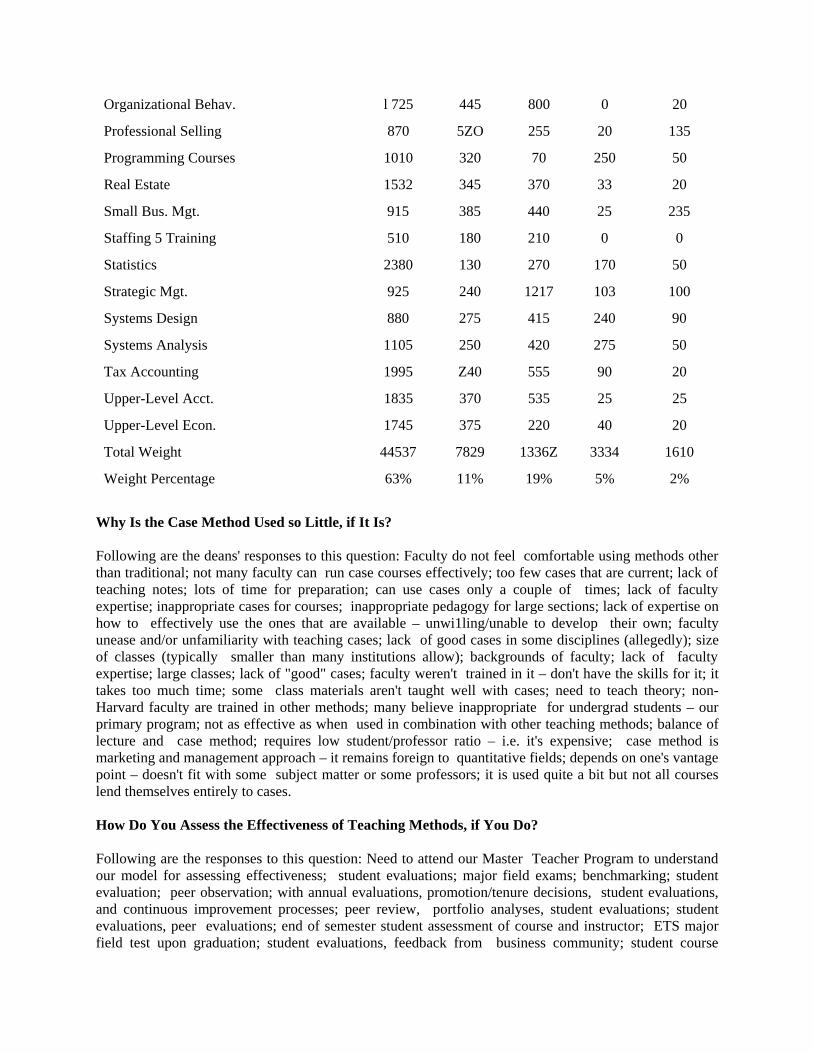
Organizational Behav. l 725 445 800 0 20
Professional Selling 870 5ZO 255 20 135
Programming Courses 1010 320 70 250 50
Real Estate 1532 345 370 33 20
Small Bus. Mgt. 915 385 440 25 235
Staffing 5 Training 510 180 210 0 0
Statistics 2380 130 270 170 50
Strategic Mgt. 925 240 1217 103 100
Systems Design 880 275 415 240 90
Systems Analysis 1105 250 420 275 50
Tax Accounting 1995 Z40 555 90 20
Upper-Level Acct. 1835 370 535 25 25
Upper-Level Econ. 1745 375 220 40 20
Total Weight 44537 7829 1336Z 3334 1610
Weight Percentage 63% 11% 19% 5% 2%
Why Is the Case Method Used so Little, if It Is?
Following are the deans' responses to this question: Faculty do not feel comfortable using methods otherthan traditional; not many faculty can run case courses effectively; too few cases that are current; lack ofteaching notes; lots of time for preparation; can use cases only a couple of times; lack of facultyexpertise; inappropriate cases for courses; inappropriate pedagogy for large sections; lack of expertise onhow to effectively use the ones that are available – unwi1ling/unable to develop their own; facultyunease and/or unfamiliarity with teaching cases; lack of good cases in some disciplines (allegedly); sizeof classes (typically smaller than many institutions allow); backgrounds of faculty; lack of facultyexpertise; large classes; lack of "good" cases; faculty weren't trained in it – don't have the skills for it; ittakes too much time; some class materials aren't taught well with cases; need to teach theory; non-Harvard faculty are trained in other methods; many believe inappropriate for undergrad students – ourprimary program; not as effective as when used in combination with other teaching methods; balance oflecture and case method; requires low student/professor ratio – i.e. it's expensive; case method ismarketing and management approach – it remains foreign to quantitative fields; depends on one's vantagepoint – doesn't fit with some subject matter or some professors; it is used quite a bit but not all courseslend themselves entirely to cases.
How Do You Assess the Effectiveness of Teaching Methods, if You Do?
Following are the responses to this question: Need to attend our Master Teacher Program to understandour model for assessing effectiveness; student evaluations; major field exams; benchmarking; studentevaluation; peer observation; with annual evaluations, promotion/tenure decisions, student evaluations,and continuous improvement processes; peer review, portfolio analyses, student evaluations; studentevaluations, peer evaluations; end of semester student assessment of course and instructor; ETS majorfield test upon graduation; student evaluations, feedback from business community; student course
evaluations, faculty observations, student satisfaction benchmarking study of graduates (EBI); studentsurveys, teaching portfolios; student evaluation, peer evaluation of syllabi, exit interviews; each class hasmandatory student evaluation and we have peer reviews; student evaluations, portfolio analysis, peerevaluation, chair evaluation; student evaluation, peer review, individual preparation; student ratings,innovations in classrooms, student complaints; we don't, other than through class evaluations; self-reporting to peer review groups of faculty, exit interviews, alumni surveys, student evaluations; peerreview, chair review of syllabi, student evaluations; faculty teaching evaluation form, system looks atmethods; student evaluations, some peer evaluation, now beginning outcomes assessment; studentevaluations, final survey, peer evaluations; extensive evaluations of courses by students each term;student evaluations, peer review; student surveys; every student evaluates every course/instructor everyterm, no attribution to methods, just course/instructor; class visitations, student evaluation of teaching,preparation of students for subsequent courses; student teaching evaluations.
What Do You Call Your Capstone Course?
The case method has been extensively used in the business capstone course, which traditionally has beencalled Business Policy. Here of late some business teachers and administrators have decided that thename of the capstone course should be Strategic Management. We became curious about what thiscourse is called at other schools. Following are the deans' responses.
Table 3The Name of the Capstone Course at Responding AACSB Schools
NumberSchools
Business Policy 21
Strategic Management 14
Business Policy & Strategy 2
Administrative Policy 1
Managing Strategic Performance 1
DISCUSSION AND RECOMMENDATIONS
It appears about 20 percent of business teaching in AACSB schools is accomplished with the casemethod. The case method is used predominantly in two courses: the capstone course, whether calledBusiness Policy or Strategic Management, and Entrepreneurship. Whether these data have any statisticalvalidity is another matter. What we have here is at best an exploratory study. The case method may ormay not be used too little. Were the deans thinking about the case method or teachers using cases? Thereare many variations of the case method [3]. More longitudinal studies are needed to prove whether thecase method is used too little. Questions can be added to student evaluation forms asking students toevaluate the teaching methods used in the course. Students should always be asked how much theylearned in the course on evaluation forms, so administrators can at least give credit to teachers forproducing learning with different teaching methods. Assuming more case method teaching is called for,case method training programs will be needed to impart the necessary skills and expertise to somebusiness teachers. Business schools should focus on their mission, and really see how relatively welleach teacher is accomplishing the mission in the classroom.
REFERENCES

[1] Anderson, R. C. (1977). The Notion of Schemata and the Educational Enterprise: GeneralDiscussion of the Conference, in Schooling and the Acquisition of Knowledge, Anderson, R. C.,Spiro, W. E., and Montague, W. E., (Eds.). Hillsdale, NJ: Lawrence Erlbaum Associates,Publishers.
[2] Christensen, C. R. (1992). Education for Judgment: The Artistry of Discussion Leadership. NewYork: Mc-graw-hill.
[3] Dooley, A. R. and Skinner, W. (1977). Casing Case Method Methods. Academy of ManagementReview, Vol. 2, No. 2, Pp. 277-289.
[4] Gagne, R. M. (1977). The Conditions of Learning. New York: Holt, Rinehart & Winston.
[5] Neisser, U. (1976). Cognition and Reality: Principles and Implications of Cognitive Psychology.W. H. Freeman and Company: San Francisco.
[6] Piaget, J. (1971). The Grasp of Consciousness. Cambridge, Mass.: Harvard University Press.
[7] Simon, H.a. (1957) Administrative Behavior. New York: The Free Press, 1 957.
[8] Stapleton, R. J. (1990). Academic Entrepreneurship: Using the Case Method to SimulateCompetitive Business Markets. The Organizational Behavior Teaching Review, Vol. Xiv, IssueIv, Pp. 88-104.
[9] Stapleton, R. J., Murkison, G., and Stapleton, D.c. (1993). Feedback Regarding a Game-freeCase Method Process Used to Educate General Management and Entrepreneurship Students.Proceedings of the 1993 Annual Meeting of the Southeast Chapter of the Institute forManagement Science.
[10] Stapleton, R. J., Murkison, G., and Stapleton, D. C. (1996). The Significance of Schemata andScripts in Entrepreneurship Education and Development. The Art & Science of EntrepreneurshipEducation: Volume Iv, Center for Enterprise and Leadership Development, Berea, Ohio.
[11] Stapleton, R. J. and Stapleton, D. C. (1996). Randomly Selecting Students to Lead Case MethodDiscussions: Problems and Pitfalls in Performance Appraisal. Proceedings of the 1996 AnnualMeeting of Se Informs, Myrtle Beach, Sc, October, 1996.
[12] Stapleton, R. J.; Price, B.; Randall, C.; Murkison, G. (1997). Business Faculty Evaluations in theAge of Tqm and Zero Defects. Manuscript. Georgia Southern University.
[13] The Economist (1997). Education and the Wealth of Nations. Vol. 352, No. 8010, Pp. 15-16.
[14] Thorndyke, P. W. and Hayes-Roth, B. (1979). The Use of Schemata in the Acquisition andTransfer of Knowledge. Cognitive Psychology, Vol. 11, Pp. 82-106.
[15] Towl, A.R. (1969). To Study Administration by Cases. Boston: Harvard University Press.
IMPLICATIONS OF THE THEORY OF ANDRAGOGYFOR DIFFERENT TEACHING METHODOLOGIES
IN THE AREA OF MANAGEMENT SCIENCE
Brad R. Johnson; Governors State University, University Park, IL
ABSTRACT
Theories of learning and theories of teaching incorporate systematic statements of principles that formulateapparent relationships. Apriori, the learning theory advanced or implicitly assumed by the instructornecessarily influences his theory of teaching. The purpose of the current research is to identify implications ofthe theory of andragogy (a theory of learning) for theories of teaching. More specifically, the primaryobjective of the current research is to apply the andragogical/pedagogical theoretical framework toundergraduate education to identify implications of the theory of andragogy for different teachingmethodologies in the area of management science.
The theoretical framework of the current research is presented in terms a discussion of two learningtheory models (the Pedagogical Model and the Andragogical Model). The models are discussed in termsof their alternative assumptions that give rise to theoretical implications for theories of teaching. Multiplelinear regression procedures are employed to empirically examine the operationalized research model.Consistent with the purpose and objective of the current research, statistical analysis provides evidence of theexistence and nature of a relation between the dependent variable (learning product) and the first degreeinteraction group of independent variables (student understanding and teaching methodology). Specifically,test results show that variation in this group of variables is significant in explaining variation in the dependentvariable, after accounting for the effects of covariables on the dependent variable. These results suggest thatthe relation between learning product and understanding is different across paradigms when paradigms areassigned randomly to a particular learning situation. Further, these results support the hypothesis that thetheory of teaching is situation specific as follows: Differences in teaching methodology significantly explaindifferences in learning product. Moreover, the theory of teaching is situation specific. When a teachingmethods strategy is assigned to a learning situation on a random basis, the relation between learning productand understanding becomes dysfunctional. Here, the dysfunctional condition is operationally defined as theexistence of a statistically significant first-degree interaction term between the independent variables (studentunderstanding and teaching methodology). Hence, there is not one universally best teaching methods strategyin the management science area. Rather, such strategy depends on determining the most realistic set oflearning theory model assumptions with respect to a particular learner group for a specific learning goal.
INTRODUCTION
Theories of learning and theories of teaching incorporate systematic statements of principles that formulateapparent relationships. Theories of learning and theories of teaching are similar in that both are advanced toexplain and predict phenomena. However, the two sets of theories are different in that each makesgeneralizations about a different set of variables and the corresponding relations among them. For example,theories of learning make generalizations about the ways in which the individual learns. In contrast, theoriesof teaching make generalizations about the ways in which the instructor influences the individual to learn. Apriori, the learning theory advanced or implicitly assumed by the instructor necessarily influences his theoryof teaching.

PURPOSE AND OBJECTIVE
The purpose of the current research is to identify implications of the theory of andragogy (a theory oflearning) for theories of teaching. More specifically, the primary objective of the current research is to applythe andragogical/pedagogical theoretical framework to undergraduate education to identify implications of thetheory of andragogy for different teaching methodologies in the area of management science.
THEORETICAL FRAMEWORK DEVELOPMENT
The theoretical framework of the current research is presented in terms a discussion of two learning theorymodels (the Pedagogical Model and the Andragogical Model). The models are discussed in terms of theiralternative assumptions that give rise to theoretical implications for theories of teaching.
The Pedagogical Model
In conventional education (the Pedagogical Model), the student is required to adjust himself to an establishedcurriculum. Under the Pedagogical Model (where pedagogy is defined as the art and science of teachingchildren) the teacher is assigned full responsibility for making all decisions about:(1) what the student will learn;(2) how the student will learn; and(3) when the student will learn.Accordingly, regimented groups characterize the Pedagogical Model where authoritarian figures demandobedient conformity to patterns of conduct by group members. Under this model, behavior is expected to bepredictable and standardized. From this characterization of conventional education, the followingassumptions of the Pedagogical Model are identified:1. Student learners need to know only what the teacher teaches if they want to succeed (pass).2. The student's self-concept becomes that of a dependent personality (which is consistent with the teacher's
concept of the learner as a dependent personality).3. The learner's experience is of little import as a resource for learning. Thus, transmittal techniques (such as
lectures and assigned readings) reflect the backbone of pedagogical methodology.4. Learners are ready to learn only what the teacher tells them to learn.5. Learners have a subject-centered orientation where learning reflects the acquisition of subject matter
content. Thus, learning experiences are framed by reference to subject matter content.6. Learners are motivated to learn by external forces (grades or teacher approval) rather than by being self-
motivated.
The Andragogical Model
The Andragogical Model is a systematic theory of adult learning that represents an alternative set ofassumptions to the Pedagogical Model. In adult education (in contrast to conventional education) thecurriculum is developed around the students’ needs and interests. Authoritative teaching, examinations thatpreclude original thought and rigid pedagogical formulae are inappropriate in adult education. Moreover,facts and information are relevant for problem solving (not for the mere purpose of accumulation). Adulteducation is a process. Within the adult education setting, adults begin to learn by confronting relevantsituations in a problem-solving manner that first accesses their reservoir of experience (before resorting totexts). Within this context, they are encouraged in their quest for knowledge by teachers who are searchers ofwisdom (not oracles). From this characterization of adult education, the following alternate assumptions ofthe Andragogical Model are identified:

1. All education is self-education. Thus, teachers may help define procedure and indicate the mostpropitious routes, but the climber (the learner) must use his own head and legs to reach the mountaintop.
2. The adult is motivated to learn only to the extent that he presumes that his needs and interests will besatisfied by the learning process. Thus, the learning process requires a shift in focus from what the teacherdoes to what is relevant to the student so that the adult student becomes aware of the need to know. Adults are responsive to external motivators only to the extent that internal pressures (increased jobsatisfaction, self-esteem and quality of life) result from such external pressures.
3. As depicted with the context of field theory, the adult learns within his life space. Accordingly, adulteducation should be oriented toward life situations (not subjects). Adults will be motivated to learn wherethey perceive that the learning of subject-matter content will help them deal with problems that theyconfront in their life situations.
4. Adults learn by relating transmitted information to experience. Thus, the analysis of experience should beat the core of teaching methods in the adult education process.
5. Adults have a deep need to be self-directing. Therefore, the role of the teacher is to engage the adult in aprocess of mutual inquiry and cooperation (rather than to merely transmit information).
CONCEPTUAL RESEARCH HYPOTHESIS DEVELOPMENT
Throughout the discussion of the Andragogical Model, one theme predominates. That is, adult learning is anindividually self-directed internal process controlled by the learner where the individual engages his wholebeing in interaction with his environment (as he perceives it). However, as the individual accumulatesexperience, the individual may tend to develop mental habits, biases, and presuppositions that cause theindividual to become closed-minded to new ideas, fresh perceptions and alternative ways of thinking. Accordingly, potential motivational or blocking influences on learning behavior may occur in the form ofanxiety, repression, fixation, regression, or aggression. The degree to which an individual (or group) isexperiencing these influences must be considered by the learning theorist in formulating the teachingmethodology that is best suited for the particular instructional situation.
More specifically, the learning theorist must be responsible for assessing which set of alternative assumptionsare more realistic for a particular learner (or learner group) given a specific goal of an instructional setting. Ifthe Pedagogical Model assumptions are more realistic with respect to a particular learner group for a specificlearning goal, then a Pedagogical-based teaching methods strategy is most appropriate. For example, learnersare in fact dependent when they:(1) enter a totally strange content area,(2) do not understand the relevance of a content area to their life space,(3) do need to accumulate a given body of subject matter in order to accomplish a required performance,
or(4) feel no internal need to learn that content.Within these contexts, a Pedagogical-based teaching methods strategy is most appropriate. In these cases, thedidactic instructor using a Pedagogical-based teaching method transmits subject-content information relatingto: (1) how the subject is organized, special terminology, and (3) resources from which to learn about thesubject.
Research Hypothesis
If the Andragogical Model assumptions are more realistic with respect to a particular learner group for aspecific learning goal, then an Andragogical Model-based teaching methods strategy is most appropriate. Accordingly, the best teaching methods strategy is situationally specific. That is, determining the mostrealistic set of learning theory model assumptions with respect to a particular learner group for a specific

learning goal necessarily determines the best teaching methods strategy.
RESEARCH DESIGN AND METHODOLOGY
In Fall, 1994, three sections of the accounting course (Federal Individual Income Taxation) was taught byrandomly selecting one of the following 3 different teaching methods:1. Case Method (an Andragogical Model-based teaching method).2. Traditional Text Method (a Pedagogical-based teaching method approach).3. Code and Regulations (an Andragogical Model-based teaching method approach).
Operationalization of the Research Hypothesis
To test the research hypothesis, the effects of teaching methodology and student understanding on learningproduct were examined. Within this context, an objective measure of learning product was employed as thedependent variable. Learning product (DIFF) was operationally defined as the raw difference between pretestand posttest scores on a tax exam. Independent variables of significance included teaching methodology andstudent understanding. Teaching methodology was operationally defined as a class variable (PARADIGM)with 3 different teaching methods as the class set. Student understanding was operationally defined as acontinuous variable (UNDERSTAND). The variable UNDERSTANDING was arithmetically calculated asthe sum of self assessed measures of a student’s theoretical and applied understanding with respect to thecourse material. In addition, the effects of (1) intelligence (GPA) and (2) being a graduate (GRADUATE)were controlled.
The operationalized research model (the full model) associated with the research hypothesis is a well-formulated Hierarchical Polynomial Regression Model and is stated as follows:
DIFF = a + b1*GPA +b2*GRADUATE(1) + b3*UNDERSTANDING + b4*PARADIGM(1) +b5*PARADIGM(2) + b6*PARA(1)*UNDER + b7*PARA(2)*UNDER + e
Consistent with the purpose and objective of the current research (to apply the andragogical/pedagogicaltheoretical framework to undergraduate education to identify implications of the theory of andragogy fordifferent teaching methodologies), the relation between the dependent variable (DIFF) and the first degreeinteraction group of independent variables (PARA*UNDER) is examined. More specifically, theoperationalized research hypotheses are stated as follows:
Ho: b6 = b7 = 0
Ha: There is at least one coefficient bi (I = 6,7) that is not zero.
Data Results and Analysis
Multiple linear regression procedures were employed to empirically examine the operationalized researchmodel. This analysis provides evidence of the existence and nature of a relation between the dependentvariable (DIFF) and the independent variables (PARADIGM and UNDERSTAND). Specifically, a groupvariable F test was employed to statistically evaluate this relation. As shown in the Appendix, with an F valueof 1.96 and a p-value of .1577 while using .2 level of significance, the null hypothesis is rejected in favor ofthe alternative hypothesis.
Significance Implications

Consistent with the purpose and objective of the current research, statistical analysis provides evidence of theexistence and nature of a relation between the dependent variable (DIFF) and the first degree interaction groupof independent variables (PARA*UNDER). Specifically, test results show that variation in this group ofvariables is significant in explaining variation in the dependent variable (DIFF), after accounting for theeffects of the covariables (GPA and GRADUATE) on the dependent variable. These results suggest that therelation between learning product and understanding is different across paradigms when the paradigms areassigned randomly to a particular learning situation. Further, these results support the hypothesis that thetheory of teaching is situation specific as follows:
When a teaching methods strategy is assigned to a learning situation on a random basis, the relation betweenlearning product and understanding becomes dysfunctional. Here, the dysfunctional condition is operationallydefined as the existence of a statistically significant first-degree interaction term (PARA*UNDER)
CONCLUSIONS
Differences in teaching methodology significantly explain differences in learning product. Moreover, thetheory of teaching is situation specific. Hence, there is not one universally best teaching methods strategy inthe management science area. Rather, such strategy depends on determining the most realistic set of learningtheory model assumptions with respect to a particular learner group for a specific learning goal.

+---------------------------------------------------------------+| APPENDIX || || DIFF MODEL I || GENERAL LINEAR MODELS [GLM] PROCEDURE || ANALYSIS OF VARIANCE TABLE || ||_______________________________________________________________|| Source of || Variation DF Sum of Squares Mean Square F Value Prob>F ||---------------------------------------------------------------|| || Model 7 611.4429881 87.3489983 5.23 0.0005 || || Error 32 534.4570119 16.70178162 || || C Total 39 1145.90000000 || ||---------------------------------------------------------------|| || Root MSE 4.08678133 R-Square 0.533592 || || Dep Mean 7.95000000 || || C.V. 51.40605 || ||---------------------------------------------------------------|| Class Level Information ||---------------------------------------------------------------|| Class | Levels | Values ||---------------------------------------------------------------|| PARADIGM 3 1 2 3 || || GRADUATE 2 0 1 || || || || || Number of Observations in Data Set = 40 ||---------------------------------------------------------------|| Source of Type IV F || Variation DF Sum of Squares Mean Square Value Prob>F|---------------------------------------------------------------|| GPA 1 343.032966140 343.03296614 20.54 0.0001 || GRADUATE 1 120.579792180 120.57979218 7.22 0.0113 || PARADIGM 2 71.088611880 35.54430594 2.13 0.1356 |

| UNDERSTAND 1 96.660301980 96.66030198 5.79 0.0221 || PARA*UNDER 2 65.389653890 32.69482694 1.96 0.1577 || || |+---------------------------------------------------------------+
DISTANCE LEARNING: IS IT FOR EVERYBODY
Brad R. Johnson; Governors State University, University Park, IL
ABSTRACT
Theories of learning and theories of teaching incorporate systematic statements of principles that formulateapparent relationships. These two sets of theories are different in that each makes generalizations about adifferent set of variables and the corresponding relations among them. Apriori, the learning theory advancedor implicitly assumed by the instructor necessarily influences his theory of teaching.
As an example of teaching methodology, distance independent learning has the potential for a fundamentaland beneficial transformation of higher education. The purpose of the current research is to identifyimplications of the theory of andragogy (a theory of learning) for distance independent learning (a theory ofteaching). To this end, an andragogical framework is applied to undergraduate education for the purpose ofidentifying what implications the theory of andragogy has for distance learning in the area of managementscience. Multiple linear regression procedures were employed to empirically examine the operationalizedresearch model. Consistent with the purpose and objective of the current research, statistical analysis providesevidence of the existence and nature of a relation between the dependent variable (learning product) and thefirst degree interaction group of independent variables (intelligence and distance learning). Specifically, testresults show that variation in this group of variables is significant in explaining variation in the dependentvariable, after accounting for the effects of the covariables on the dependent variable. These results suggestthat the relation between learning product and distance learning is different across students with varyingintelligence levels.
The condition of the remoteness of the campus significantly explains differences in learning product. Moreover, if remoteness of the instructional setting significantly explains differences in learning product, thenthe theory of teaching is situation specific. Hence, in the management science area, distance independentlearning (a theoretical teaching model) is not universally best suited for all areas management science in whichan Andragogical Model-based teaching methods strategy is most appropriate.
INTRODUCTION
Theories of learning and theories of teaching incorporate systematic statements of principles that formulateapparent relationships. Theories of learning and theories of teaching are similar in that both are advanced toexplain and predict phenomena. However, the two sets of theories are different in that each makesgeneralizations about a different set of variables and the corresponding relations among them. For example,theories of learning make generalizations about the ways in which the individual learns. In contrast, theoriesof teaching make generalizations about the ways in which the instructor influences the individual to learn. Apriori, the learning theory advanced or implicitly assumed by the instructor necessarily influences his theoryof teaching.
As an example of teaching methodology, distance independent learning has the potential for a fundamentaland beneficial transformation of higher education. Distance independent learning employs the use ofteleconferencing with Internet access to allow students to take courses at a remote site without the need to goto a base campus. However, is distance independent learning appropriate for all types of instructionalsituations? According to a survey of students participating in an experimental, intercontinental class hosted byMIT, the off-campus students were substantially less likely to positively identify with their peers or teachers. Interviews with students revealed students' (1) frustration with the lack of give-and-take in the electronic

classroom and (2) regrets at missing the rest of campus life.
PURPOSE AND OBJECTIVE
The purpose of the current research is to identify implications of the theory of andragogy (a theory oflearning) for distance independent learning (a theory of teaching). To this end, an andragogical framework isapplied to undergraduate education for the purpose of identifying what implications the theory of andragogyhas for distance learning in the area of management science.
THEORETICAL FRAMEWORK DEVELOPMENT
The best teaching methods strategy is situationally specific. That is, determining the most realistic set oflearning theory model assumptions with respect to a particular learner group for a specific learning goalnecessarily determines the best teaching methods strategy. Assuming the Andragogical Model assumptionsare more realistic with respect to a particular learner group for a specific learning goal, then an AndragogicalModel-based teaching methods strategy is most appropriate.
The theoretical framework of the current research is presented in terms a discussion of the AndragogicalModel (a learning theory model). This model is discussed in terms of its assumptions and its theoreticalimplications for theories of teaching (distance independent learning).
The Andragogical Model
The Andragogical Model is a systematic theory of adult learning that represents an alternative set ofassumptions to the Pedagogical Model. In adult education (in contrast to conventional education) thecurriculum is developed around the student's needs and interests. Authoritative teaching, examinations thatpreclude original thought and rigid pedagogical formulae are inappropriate in adult education. Moreover,facts and information are relevant for problem solving (not for the mere purpose of accumulation). Adulteducation is a process. Within the adult education setting, adults begin to learn by confronting relevantsituations in a problem-solving manner that first accesses their reservoir of experience (before resorting totexts) where they are led in their quest for knowledge by teachers who are searchers after wisdom (notoracles). From this characterization of adult education, the following alternate assumptions of theAndragogical Model are identified:1. All education is self-education. Thus, teachers may help define procedure and indicate the most
propitious routes, but the climber (the learner) must use his own head and legs to reach the mountaintop.2. Adults are motivated to learn only to the extent that they presume that their needs and interests will be
satisfied by the learning process. Thus, the learning process requires a shift in focus from what theteacher does to what is relevant to the student so that the adult student becomes aware of the need toknow. Adults are responsive to external motivators only to the extent that internal pressures (increasedjob satisfaction, self-esteem and quality of life) result from such external pressures.
3. As depicted with the context of field theory, the adult learns within his life space. Accordingly, adulteducation should be oriented toward life situations (not subjects). Adults will be motivated to learnwhere they perceive that the learning of subject-matter content will help them deal with problems thatthey confront in their life situations.
4. Adults learn by relating transmitted information to experience. Thus, the analysis of experience shouldbe at the core of teaching methods in the adult education process.
5. Adults have a deep need to be self-directing. Therefore, the role of the teacher is to engage the adult ina process of mutual inquiry and cooperation (rather than to merely transmit information).
Implications of the Andragogical Model for Theories of Teaching

Given the Andragogical Model assumptions are more realistic with respect to a particular learner group for aspecific learning goal, then an Andragogical Model-based teaching methods strategy is the best teachingmethods strategy. Under this strategy, the best method of teaching adults is group discussion. At theminimum, straight lectures should be replaced by class exercises where there is a large share of studentparticipation. In addition extracurricular activities should become a recognized part of the educationalprocess.
The educator who uses the group method of education takes ordinary adults for what they are, searches out thegroups in which they move and have their being, and then helps them to make their group life yieldeducational values. To master the methods of group work and study, the teacher must learn how to:(1) lead a group without dominating;(2) provide the group with democratic participation;(3) motivate students to increasingly accept responsibility for planning their own programs of study;(4) incite students to broaden their interests; and(5) conduct the work of the group so that it will be reflected in the life of the community.
If the educational culture does not nurture the talents required for self-direction (in a situation where theindividual perceives a need to be self-directing), a growing gap may exist between the need and the ability tobe self-directing. As a consequence, the existence of this gap may produce adverse responses in the individualsuch as tension, resistance, resentment, and rebellion. In addition, adults as a group are heterogeneous in termsof background, learning style, motivation, needs, interests, and goals. Thus, the teacher must recognize thatstudents differ in terms of the purposes and values that they associate with the educational process. As aconsequence, the teacher should place great emphasis on experiential techniques. Experiential techniques arelearning methodologies that tap into the experience of the learners including group discussion, simulationexercises, problem-solving activities, and case method approaches.
Individual differences among people increase with age. As the individual accumulates experience, theindividual may tend to develop mental habits, biases, and presuppositions that cause the individual to becomeclosed-minded to new ideas, fresh perceptions and alternative ways of thinking. Potential motivational orblocking influences on learning behavior may occur in the form of anxiety, repression, fixation, regression, oraggression. For example, a significant learning experience that involves a change in the organization of selfmay be perceived as inconsistent with self. If this inconsistency is perceived as a threat, the structure andorganization of self may become more rigid where the individual views experience in absolute andunconditional terms so that his reactions are anchored in space and time. In this case, learning may be resistedthrough denial or distortion of fact and evaluation. Accordingly, it is important for the teacher to provide anacceptant and supportive climate, with heavy reliance on student responsibility to allow students to examinetheir habits and biases for the purpose of opening their minds to new approaches.
CONCEPTUAL RESEARCH HYPOTHESIS DEVELOPMENT
Throughout the discussion of the Andragogical Model, one theme predominates. That is, adult learning is anindividually, self-directed, internal process controlled by the learner where the individual engages his wholebeing in interaction with his environment (as he perceives it). Within this context, the learning theorist mustbe responsible for assessing which set of alternative assumptions are more realistic for a particular learner (orlearner group) given a specific goal of an instructional setting.
If the Andragogical Model assumptions are more realistic with respect to a particular learner group for aspecific learning goal, then an Andragogical Model-based teaching methods strategy is most appropriate. The

theory of teaching as manifested in distance independent learning assumes students to be self-directing (anAndragogical Model assumption) to the extent that the instructional setting take place at a remote site withoutaccess to a base campus where subject content is transmitted by means of teleconferencing with Internetaccess. However, is distance independent learning applicable to all types of instructional situations?
Research Hypothesis
If the distance independent learning educational setting does not nurture the development of the abilitiesrequired for self-direction (where the individual perceives a need to be self-directing), a growing gap existsbetween the need and the ability to be self-directing. Accordingly, this gap may produce adverse responses inthe individual such as tension, resistance, resentment, and rebellion (which will have a negative effect on thelearning product).
RESEARCH METHODOLOGY
In Fall 1994, three sections of the accounting course (Federal Individual Income Taxation) were taught. Twosections were taught in remote sites. One section was taught at the main campus.
Operationalization of the Research Hypothesis
To test the research hypothesis, the effects of distance and intelligence on learning product were examined. Within this context, an objective measure of learning product was employed as the dependent variable.Learning product (DIFFPCT) was operationally defined as the raw difference between pretest and posttestscores on a tax exam, divided by the pretest score. Independent variables of significance included intelligenceand the condition of remoteness of the campus. Intelligence was operationally defined as a continuous variable(GPA). The condition of remoteness of the campus was operationally defined as a nominal variable(DISTANCE). The variable GPA was the student’s self-assessed cumulative grade point average. Inaddition, the effects of (1) the condition of being married (MARRIED), (2) being a graduate (GRADUATE), astudent’s age (AGE), and the condition of having children (CHILDREN) were controlled.
The operationalized research model (the full model) associated with the research hypothesis is a well-formulated Hierarchical Polynomial Regression Model and is stated as follows:
DIFF = a + b1*MARRIED(1) +b2*GRADUATE(1) + b3*AGE + b4*CHILDREN(1) +b5*GPA + b6*DISTANCE(1) + b7*GPA*DISTANCE(1) + e
Consistent with the purpose and objective of the current research (to identify implications of the theory ofandragogy (a theory of learning) for distance independent learning (a theory of teaching)), the relationbetween the dependent variable (DIFFPCT) and the first degree interaction group of independent variables(GPA*DIST) is examined. More specifically, the operationalized research hypotheses are stated as follows:
Ho: b7 = 0
Ha: b7 is not zero.
Data Results and Analysis
Multiple linear regression procedures were employed to empirically examine the operationalized researchmodel. This analysis provides evidence of the existence and nature of a relation between the dependentvariable (DIFFPCT) and the independent variables (GPA and DISTANCE). Specifically, a group variable F

test was employed to statistically evaluate this relation. As shown in the Appendix, with an F value of 3.14and a p-value of .0861 while using .1 level of significance, the null hypothesis is rejected in favor of thealternative hypothesis.
Significance Implications
Consistent with the purpose and objective of the current research, statistical analysis provides evidence of theexistence and nature of a relation between the dependent variable (DIFFPCT) and the first degree interactiongroup of independent variables (GPA*DISTANCE). Specifically, test results show that variation in this groupof variables is significant in explaining variation in the dependent variable (DIFFPCT), after accounting forthe effects of the covariables (MARRIED, CHILDREN, AGE and GRADUATE) on the dependent variable. These results suggest that the relation between learning product and distance learning is different acrossstudents with varying intelligence levels. Further, these results support the hypothesis that if the distanceindependent learning educational setting does not nurture the development of the abilities required for self-direction (where the individual perceives a need to be self-directing), the individual may be adversely affectedin terms of increased tension, resistance, resentment, and rebellion, which in turn will have a negative effecton the student’s learning product.
CONCLUSIONS
The condition of the remoteness of the campus significantly explains differences in learning product. Moreover, if remoteness of the instructional setting significantly explains differences in learning product, thenthe theory of teaching is situation specific. Hence, in the management science area, distance independentlearning (a theoretical teaching model) is not universally best suited for all areas management science in whichan Andragogical Model-based teaching methods strategy is most appropriate. One explanation is that thedistance independent learning educational setting does not nurture the development of the abilities required forself-direction (where the individual perceives a need to be self-directing) for less intelligent students. Forthese students, a growing gap may exist between the need and the ability to be self-directing thus producingadverse responses in the individual such as tension, resistance, resentment, and rebellion that has a negativeeffect on learning product.
+---------------------------------------------------------------+

| APPENDIX || || DIFFPCT MODEL I || GENERAL LINEAR MODELS [GLM] PROCEDURE || ANALYSIS OF VARIANCE TABLE || ||_______________________________________________________________|| Source of || Variation DF Sum of Squares Mean Square F Value Prob>F ||---------------------------------------------------------------|| || Model 7 6.6271796400 0.94673995 3.88 0.0036 || || Error 32 7.8041600900 0.24388000 || || C Total 39 14.4313397300 || ||---------------------------------------------------------------|| || Root MSE 0.49384208 R-Square 0.459221 || || Dep Mean 0.75125359 || || C.V. 65.73574 || ||---------------------------------------------------------------|| Class Level Information ||---------------------------------------------------------------|| Class | Levels | Values ||---------------------------------------------------------------|| DISTANCE 2 0 1 || || GRADUATE 2 0 1 || || MARRIED 2 0 1 || || CHILDREN 2 0 1 || || Number of Observations in Data Set = 40 ||---------------------------------------------------------------|| Source of Type IV F || Variation DF Sum of Squares Mean Square Value Prob>F ||---------------------------------------------------------------|| MARRIED 1 0.91584432000 0.9158443200 3.76 0.0615 || CHILDREN 1 1.22047330000 1.2204733000 5.00 0.0324 || AGE 1 0.57195167000 0.7719516700 2.35 0.1355 |

| GRADUATE 2 1.60388619000 1.6038861900 6.58 0.0152 || DISTANCE 2 0.51066160000 0.5106616000 2.09 0.1576 || GPA 2 3.38246869000 3.3824686900 13.87 0.0008 || GPA*DIST 3 0.76471829000 0.7647182900 3.14 0.0861 | |

CLASSROOM EDUCATION WITH NO BOOKS
Mohan P. Rao, Texas A&M University-Kingsville, Kingsville, TX 78363 (512) 593-3933 [email protected]
ABSTRACT
This paper proposes an Internet-based curriculum material to replace textbooks. The paper will examine thisalternative for its feasibility, management, costs and benefits.
INTRODUCTION
As the power is rising and the prices are falling of information technologies, the Information Superhighway isfast becoming a reality. Currently World Wide Web (WWW) is the most popular method of access to theInternet because of its graphical user interface and multimedia presentation of information and entertainment. Internet is currently being used worldwide [1] for training by several organizations including Microsoft [7]and Novell [2][3]. K-12 educational material being developed and put on the Internet [5][9][11]. Colleges aredeveloping Internet-based courses [4]. Internet promises to be a perfect channel for global distance learning[6]. Current US administration’s vision is to link all schools in the nation to the Information Superhighwayand give them access to the Library of Congress [10]. That means the holdings of the library must bedigitized and made accessible on the Internet. On the other hand, students, parents, school districts, andstates now spend millions, if not billions, of dollars on text books for education starting with elementarythrough post-secondary education. When the schools and colleges are linked to the informationsuperhighway, curriculum material could be an integral part of that information, which means bye bye books[8]. This paper examines this Internet-based alternative to textbooks for its feasibility, management, costsand benefits.
THE ALTERNATIVE TO TEXT BOOKS
The proposed alternative is to use the Internet as the source of curriculum material for a given course. Thisworks for only those institutions that are connected to the Internet. Already some professors put their classmaterial on the Internet for their student use, so this alternative is not a radically new concept. What's new ismaintaining the quality of the content consistently high, and making it widely available.
MANAGEMENT
Committees of non-profit academic organizations would be responsible for developing and maintaining thematerial. The management could be similar to that of an academic journal publication, but without thepublishing company’s involvement. There would be a professional team responsible for each coursematerial. The team may include an editor-in-chief, editors, and an advisory board. Contributing authors andthe team members will get recognition for their work and may also be compensated. The contributionsinclude not only the text material, but also the support material such as testing and presentation material.

HOW DOES IT WORK?
An individual instructor will have the flexibility to use the material as is or omit parts of it. The instructorsmay choose to use it directly from the Internet or download the chosen material, add their own material,customize it, and manage it on their local net. The supporting material can be received from the committee oreditor-in-chief of the course material.
When it is time to read the class material, students get on the net and read it from there. If they do not want toread it off the monitor, they can print the relevant pages for later reading and reference.
COSTS AND BENEFITS
Text books cost a lot of money, some of them close to $100 a piece. A college student may spend about a$1,000 a year on text books. Publishers are coming up with newer editions more frequently, which makes theold text books obsolete, and not reusable. It leads to higher costs to students, and a lot of waste in paper. Thenet-based class material may not completely eliminate waste of paper, but it can reduce it significantly. Theprinting of the chosen material would lead to increased costs on campuses and at homes. Campuses maychoose to impose printing costs on students on a per page basis, so it is not completely free for students, butcan be considerably less expensive. Students also do not have to carry around a heavy load of books, whichis an important factor to consider for younger school children. School districts can save a lot of money inbuying books, which could be diverted to other important needs like buying better computer equipment orreducing burden on tax payers. Poorer school districts, which are strapped for money, may see a lot of reliefbecause of this alternative assuming that they are connected to the net.
Besides cost, waste and weight there are other benefits. The information available is more up to date. Itsvalue is more significant particularly in the rapidly changing fields such as computer information systems. This alternative could also enable increased standardization: standard vocabulary, standard curriculum, andstandard testing. These standards could be not only national but global. In turn, it can motivate instructorsand students to raise and meet these standards. This could also create problems in some school districtswhich do not agree with these standards, particularly the content. In such cases, they (the instructor, theschool district) will have the flexibility not to download those contents and teach them.
LIMITATIONS
Most course materials may be appropriate and effective to be put on the net. For instance, the course materialon Introduction to Information Technology is highly appropriate and effective to put on the net. However,some course materials such as a science lab manual that should be handy while working may not be directlyuseful, but could still be made available on the net and printed before its usage.
Still, not every course material may be accessed and used electronically, and free of charge. Copyrightmaterial published by for-profit companies may not be accessible on the net, and will not be for free. Currently available text books by established authors may not be accessible on the net, and even if they arethey would not be free. So it raises the question whether any well-known author would be interested incontributing to the material to put on the net. If well-known authors don't, would the contributed material beof same quality? Would anybody be interested in contributing to this in the first place? The answer isprobably yes, and the overall quality of the material will not be inferior. It will be superior in some waysbecause of multimedia (audio, video,and animation) content. Overall it will be different simply becausedifferent authors have different writing styles and view points.

SUMMARY AND CONCLUSIONS
Professionally maintained course material on the Internet that is widely available for instructors and studentscan be a significant benefit to individuals, school districts, states and nations in terms of cost savings,environment, and the quality and the currency of information. Losers would be those that currently benefitfrom text book publication. The benefits, of course, far out weigh the losses. The benefits could be inhundreds of millions of dollars.
To make it a reality, the non-profit academic associations must take the charge, establish teams or committeesand assign them the responsibility of each course material. Since this alternative could reap so many benefitsfor the country, the association should get grant money from the National Science Foundation or other federalagencies to fund this effort for its development and maintenance.
REFERENCES
[1] Basch, Reva. "Impressions of the Swedish information scene," Information Today. 10(8): 45-46. 1993Sep.
[2] Burns, Christine "Novell's directory service gains support," Network World. 13(51): 23. 1996 Dec 16.[3] Glener, Doug "The promise of Internet-based training," Training & Development. 50(9): 57-58, 1996
Sep. [4] Goubil-Gambrell, Patricia "Designing effective Internet assignments in introductory technical
communication courses," IEEE Transactions on Professional Communication. 39(4): 224-231. 1996Dec.
[5] Grace, Tim "Jostens introduces K-12 Internet access system," Computer Reseller News. (620): 131,134. 1995 Mar 6.
[6] Information Today. "Live video link on the Internet makes global learning a reality," Information Today. 10(6): 20-21. 1993 Jun.
[7] Merrill, Kevin "Microsoft shifts its training strategy," Computer Reseller News. (696): 64. 1996 Aug12.
[8] Meyers, Jason "The Internet hits the books," Telephony. 229(15): 28. 1995 Oct 9. [9] Murray, Janet "K-12 educational teleconnectivity: A grassroots model," Bulletin of the American
Society for Information Science. 20(2): 18-19. 1994 Dec 1993/Jan. [10] Soloway, Elliot "Beware, techies bearing gifts," Communications of the ACM. 38(1): 17-24. 1995 Jan.[11] Ward, Greta "Scholastic launches new Internet service," Information Today. 11(7): 34. 1994 Jul/Aug.
CURRICULUM REVISION: A STAKEHOLDER APPROACH
Kathleen W. Wates, University of South Carolina -Aiken, 171 University Parkway, Aiken, SC 29801Patsy G. Lewellyn, University of South Carolina-Aiken, 171 University Parkway, Aiken, SC 29801
ABSTRACT
Over the past two years, the University of South Carolina-Aiken has made some rather extensive changesin its accounting curriculum. These changes were made in response to information gathered from localbusinesses, accounting alumni, and other accounting programs. One of the most important changes wasthe creation of a separate track for management accounting. This program change evolved with therealization that many of our students do not aspire to become Certified Public Accountants, nor do theypursue public accounting careers. In a survey we conducted of local businesses, various skills andcompetencies were identified as needed by entry-level accountants [1]. We believe these needs can bestbe met through a strengthened cost/management curriculum and by allowing students to select areas forspecialization. Changes have also been made in course design and content in response to an alumnisurvey and a survey of other accounting programs. This paper addresses changes made in our accountingprogram and justification for allowing students to select a financial or management accounting track.
INTRODUCTION TO OUR STAKEHOLDERS
With the belief that any accounting curriculum revision must meet the needs of all our stakeholders localbusinesses were surveyed in 1995 to determine how well new accounting hires met their expectations. [1]The most critical weaknesses cited were not directly related to technical accounting skills. The mostimportant weaknesses cited for financial and management hires were communication skills. Specificcommunication skills reported lacking were oral, written, collaborative, persuasive, conflict management,and interpersonal. Skills not meeting expectations relating to technical proficiency for financialaccounting hires included product costing, preparation of financial statements, asset management,finance, and ethics. The skills for management accounting hires included strategic cost management,information systems design, management skills, entrepreneurship, budgeting, and business law.
A follow-up survey of another important stakeholder group, our alumni, was completed in 1996. [2]Alumni were asked to rate their preparation for employment on the same skills employers were asked toevaluate in the earlier survey. Alumni also listed several communication skills as deficiencies but theydid not perceive them to be as much a negative gap as did employers. Technical accounting skills cited asdeficient by alumni were general ledger software, budgeting, preparation of financial statements,control/performance evaluation, asset management, external auditing, internal auditing, and corporateincome taxes.
A survey of other accounting programs in 1996 gave us the opportunity to compare our accountingcurriculum with our peer institutions. [3] There was no general consensus among institutions as tocourses that should be required in the accounting curriculum. There was much diversity in coursesoffered and also in those required for a degree. Some of the differences were related to size of theinstitution, with larger institutions offering a greater number of specialized courses. The greatestdifference in our curriculum and that of our peer institutions was in the design of our principles courses.A greater number of institutions had a 50/50 split between financial and managerial principles than anyother combination. Previously we used Principles II to complete the financial accounting curriculum andthis gave us less focus in the management area for our principles students.
Another stakeholder group, perhaps the most important, is our current students. We strive to meet theirneeds regarding courses offered and to give them a long-range plan regarding when they may expectspecific courses to be offered. We have a responsibility to prepare them with not only technicalproficiency but also other skills they will need to be successful in their chosen areas. We gatheredinformation from our current students by informal surveys in various accounting classes and from inputthrough our Student Advisory Board.
ACCOUNTING CURRICULUM CHANGES
To be accountable to all stakeholder groups and responsive to their needs, major changes have been madein the accounting concentration requirements. Of accounting alumni responding to the survey in 1996,62% reported their first job in accounting was in management accounting. Only 11% reported a first jobin financial accounting. At the time of the survey, 50% were still in management accounting and only13% were in financial accounting. Another reason for considering change in our accounting majorrequirements was the concern many of our students expressed over the 150-hour requirement to beeligible to sit for the Certified Public Accountant examination. With the Certified ManagementAccountant examination requiring only a four year degree, many students began asking questions aboutthe CMA certification. Although alumni placed greater importance on CPA certification at graduation,the reported importance of CMA certification had become much greater than CPA certification at the timeof the survey. Our accounting curriculum previously was geared to accounting students who wished towork in public accounting or become Certified Public Accountants. With the realization that so few ofour students actually became employed in public accounting we undertook a revision of our accountingcurriculum so we could better serve the majority of our accounting majors.
Changing degree requirements in accounting resulted in the choice of a financial or management/costtrack. The only specific courses required of all accounting majors are Intermediate I, AccountingInformation Systems, and Cost I. Students then choose four additional courses from Intermediate II, CostII, Governmental, Individual Tax, Corporate Tax, Auditing, Advanced, or Financial Statement Analysis.Accounting majors also have one upper level business elective. Most accounting majors select anotheraccounting course to fulfill this requirement. In the core, all business majors may choose betweenFinancial Statement Analysis and Business Research Methods. With careful planning and good advising,an accounting major can take up to nine accounting courses. Our accounting faculty are careful inadvising students to make prudent choices. We have compiled a list of suggested courses for financialand management emphasis, but they are suggestions only and a student may opt to select from both areas.
As a result of our benchmarking process, two new accounting courses have been added, FinancialStatement Analysis and Corporate Tax, in addition to concentration requirement revisions. Governmentalaccounting and CPA problems are now offered every other year.
ACCOUNTING COURSE CONTENT CHANGES
The most significant change in course content has been in the principles and cost courses. A truefinancial/managerial split in principles was adopted to best serve the management track option. The splitallows more extensive coverage of cost/managerial topics in Cost I, which addresses the deficiencies inbudgeting and product costing reported by employers and alumni. Cost II addresses the strategic costmanagement, and control/performance evaluation deficiencies. In addition, quantitative methods used bymanagement accountants are now covered in Cost II.
Only minor changes have been made in Intermediate I and Intermediate II. A comprehensive problemrequired in Intermediate I now includes preparation of source documents in completing the accountingcycle. We believe this will reinforce understanding of the accounting process and will enhance an
understanding of the audit process. Written communication skills are being developed through essayquestions on all exams in Intermediate I. Written communication skills are being addressed inIntermediate II by requiring a paper relating individual topics covered to actual financial statements of acompany.
Advanced accounting has been restructured in response to the deficiency reported by businesses andalumni in financial statement preparation. A review of the accounting process and preparation offinancial statements, including statement of cash flows, is required in the first week of class. A requiredcomprehensive problem includes preparing financial statements for a parent and subsidiary. Anotherchange in advanced accounting has been to decrease the amount of time spent on consolidations and tointroduce the basics of governmental accounting. Accounting students do not usually get a full semesterof governmental accounting and requested coverage of the fundamentals in advanced. Since nodeficiency was reported by alumni or businesses in consolidations, that section has been streamlined,allowing coverage of governmental accounting.
In response to the deficiencies in accounting graduates from our surveys of alumni and area businesses,the most important changes to the Accounting Information Systems and Auditing courses were to enhancecommunication skills. AIS, required of all accounting majors, requires completion of team projectswhich include both written and oral components. Each team makes at least one in-class presentation.Written assignments are reviewed and returned for revision and re-submission. The review includes formand content suggestions. While not a formal term paper, the shorter written assignments seem toreinforce writing skills more effectively.
The Auditing course requires the preparation of fourteen cases, which parallel theory being covered inclass. The cases are prepared in “audit teams”. Cases involve several written components. Each case issubmitted, one per team, for review at various due dates during the semester, is reviewed for form andcontent, and is returned for re-work. All cases are re-submitted in a completed portfolio at the end of thesemester for a grade. The purpose of the case assignments is to reinforce collaborative and writtencommunication skills. Regular briefings between the professor and team leaders provide opportunities todiscuss collaboration challenges and strategies for solutions to problems inevitable in team projects.Results have been encouraging, and students report significant value perceived in the exercise.
To be sure our changes are consistent across sections, we meet regularly as an accounting faculty todiscuss coverage of specific topics, level of coverage, and requirements for classes. We have learningobjectives for each accounting class and the same objectives are included on the syllabi of each section.We are striving to require the same amount of work in each section so students will not be able to select asection that requires less work. We believe consistency is important.
OTHER CURRICULUM CHANGES
In addition to accounting concentration revisions, the entire School of Business curriculum was evaluatedand revised in response to stakeholder feedback and peer institution benchmarking. The evaluationresulted in changes in core course requirements and course content. Some deficiencies includingcommunication skills, management skills, and ethics are being addressed in revised core courses. Thebusiness writing course, now called business communications, will include written and oralcommunication skills. A new course, Business and Society, will provide a context for socialresponsibility, ethics, and the legal environment of business. Also, a course in entrepreneurship hasbeen added to our core. This course will integrate the four concentrations: accounting, management,finance, and marketing, and prepare students to venture into their own business. These changesstrengthen both the business core and the accounting concentration.
EVALUATION OF CHANGES
We will continuously monitor and evaluate the curriculum and course content changes to ascertain if theyhave been successful in addressing the deficiencies noted. The assessment process will include ongoingfeedback from the School of Business Advisory Board and the Student Advisory Board. The BusinessAdvisory Board consists of 20 members who are representative of all areas of concentration in the Schoolof Business. They meet regularly to provide guidance regarding the needs of regional businesses andskills required in new hires. Several board members are USCA graduates and have been especiallyhelpful in evaluation of our programs. The Student Advisory Board, comprised of six juniors and sixseniors, meet regularly. They conduct “listening sessions” with other students and provide a neutralconduit for student feedback to faculty, positive and negative. Alumni surveys will continue as anassessment tool. The School of Business surveys alumni three years after graduation. In future surveyswe will be able to determine if our curriculum revisions are better preparing our graduates and identifyfurther opportunities for improvement.
OTHER CHANGES TO BE ADDRESSED
One deficiency noted by our alumni – use of a general ledger software package- has not been addressedyet. Other than in Accounting Information Systems, no general ledger software package is consistentlyused. We hope that in the future we can acquire a package that can be used in all accounting classes fromprinciples to advanced. In the survey of our peer institutions, only a few reported using such a package.The package most often used by those who did was Peachtree. Since we now have a fairly up to datecomputer room that is networked for teaching and student usage, installation of a package should becomea reality.
Another deficiency we have yet to address is coverage of internal auditing. We question the efficacy of anew course dedicated to internal auditing, but adding a module to an existing course is a possibility weare exploring. We believe with the increased focus on cost/management accounting, this topic begsadditional coverage. We now are evaluating where to place it.
CONCLUSION
We believe our curriculum is much better for the changes made. We are attempting to incorporateimportant information from all stakeholders in our process of program development. Accountability to allconstituencies will, we believe, create a win-win outcome for everyone.
REFERENCES
[1] Lewellyn, Patsy G. and Wates, Kathleen W. “Relevance in Accounting Education: A Local Study.”SETIMS, 1995.[2] Lewlllyn, Patsy G. and Wates, Kathleen W. “Relevance in Accounting Education: An AlumniResponse.” SEAAA, 1996.[3] Wates, Kathleen W. and McGrath, Leanne C. “Flexibility in Accounting: The Ideal Curriculum.”SE Informs, 1996.
DESIGNING THE DESIGN EXPERIENCE
John Eatman, ISOM Dept., University of North Carolina at Greensboro, Greensboro, NC 27412 (910) 334-5666
ABSTRACT
In information systems (IS) curricula, it is common to find a course which deals with information systems designand implementation. The model curricula proposed by organizations such as ACM, AIS, and DPMA all include
some type of system design and system implementation coursework. In this paper, a particular systemsdevelopment course model is presented which has proven useful in preparing IS students. Specifically, therationale, goals, and operational format of a one semester course in system design and implementation are
discussed.
COURSE DESIGN AND GOALS
In many organizations, the complexity of the enterprise information systems requires that systems be developedcollaboratively by teams of people. Many educational programs provide students with preparation in producingindividual solutions to highly structured problems. In the actual enterprise, the IS developer must be able toprovide collaborative solutions to vaguely structured problems. This difference is significant because it raisesquestions concerning the transition from an academic experience to the real world. In order for students to makethis transition successfully, it would appear advantageous for the students to be prepared for the aspects of thesystems development that they will actually experience.
The course design process discussed in this paper has evolved over a fifteen year period and is based on feedbackfrom graduates of the IS curriculum and employers of graduates of the curriculum. Ongoing assessment of thecourse by graduates has shown that the design of the course and the experiences gained from completing thecourse project are generally considered to be one of the most beneficial aspects of the IS curriculum.
The approach that is used is based on a project oriented course in information system design and implementationin terms of a set of learning objectives that are derived from real world development experience. Mapping of realworld based learning objectives into a specific course project format allows the students to be exposed to a wideset of relevant real world work experiences while allowing an adequate course structure for a manageable onesemester course. Developing a one semester, project based course in this manner has proven to be an effectivemechanism for training students to enter the work force with the knowledge and skills important to performingsuccessfully as members of IS development teams. The emphasis in the course on collaborative work activitieshas proven to be the key ingredient in making a course project an appropriate simulation of real worldinformation systems development work.
Course Experience Goals
Detailed specification of company specific information system requirements
Project plan development and plan monitoring
Organization and management of collaborative work team
Resolution of conflicts among team members
Design of database to meet specific workplace requirements and support for an audit trail

Design of integrated, modular information system for specific transaction and management informationrequirementsSpecification and application of system standards
Coding of integrated, modular information system
Test procedure development, test data creation, and testing
Creation of system maintenance documentation
Creation of system user documentation
Detailed individual assessment of project team and team member performance
DESIGN PROJECT GUIDELINES
In order to create an appropriate real world project that can be finished in a single semester, consistent projectguidelines need to be followed so that the desired course experiences may be achieved. The guidelines shouldcover the tasks assigned to the project team, the nature of the project, and the administration of the project.
Experience has shown that the best size for a project team is 3 or 4 persons. If teams have 2 persons, the issuesrelating to teamwork and project management are substantially diminished and do not provide an adequatecollaborative work experience. In addition, teams of two persons require scaling back the project size such that itis no longer adequately challenging from a development perspective. Project teams of more than four personsmay create too many management challenges for a student team operating on a strict deadline. With largerteams, it is also clear that scaling up the project size may create a project that may not be completed within thesemester.
The projects that are chosen are always based on a specific company which requires the students to grasp thelanguage and special conditions that exist in a specific firm. Although the general purpose of the project ispredefined for the teams, each team must develop a clear, detailed view of the project. Depending on the project,this may or may not involve interviews with representatives of the firm that is the basis for the project. It isimportant that teams be forced to “discover” some key elements of the system requirements for themselves. Thedefinition of specific system requirements should provide adequate opportunity for students of confront systemambiguities and missing information relevant to the design. The following table lists some projects which havebe used effectively.
Firm System
Apparel Manufacturer Human resource and payroll system
Bulk Chemical Manufacturer Inventory (raw material and finished product) and production monitoringsystem
Business Uniform Manufacturer Inventory control (raw material and finished product) and productionplanning and monitoring system
Construction Firm Job accounting system
Mail Order Distributor Order processing, billing, and inventory system
Sales Agency Direct mail marketing, order processing, and billing system
The selection of a project topic requires that the instructor become familiar with the target company. This

familiarity requires learning specific company terminology, discovering transaction practices that are unique tothe specific company, and defining the key management information needs of the company. Since the project isaligned to a specific company, understanding of the target organization is essential to creating a realistic projectfor the student teams.
Once a project is identified, the scope of the project must be made consistent with the time limits of the courseand the size of the project team. In general, all projects should include both transaction processing and reportgeneration. The project scope is best designed in terms of the project team size so that each team will face asimilar challenge. The following table presents the guidelines that have proven useful in designing a semesterlong, information system project that begins with specification of requirements and follows through toimplementation.
Project Characteristic Scope
Required data tables Approximately 3 to 4 per team member including both master andtransaction tables
Number of transactions 3 to 4 per team member
Number of printed reports 1 status report and 1 transaction report per team member
Number of user selectable status screens At least 1 per team member
Data entry, deletion, and edit screens At least 1 of each per team member
Number of system modules Approximately 4 to 6 per team member
Transaction rollbacks Generally not required
Input data verification Required for indexed elements
General system design Menu driven system with separate modules for specific activities
The project represents a capstone systems development experience and enables the students to learn byexperience how to apply their knowledge to systems development. The course is an extremely work intensiveclass and students generally find that each will need between 125 and 250 hours of work outside of class tocomplete the project.
DESIGN PROJECT ADMINISTRATION
The faculty member must assume a somewhat different role than that typically found in a classroom. The facultymember essentially becomes a manager who is responsible for overseeing the work of a systems developmentproject team. In this role, the instructor’s goal is to keep the project team on track while not actually doing thedevelopment. The instructor must allow the project team to “wander through the wilderness” while assuring thatthe team is ultimately headed in the right direction. In order to accomplish this, several mechanisms areemployed to monitor the teams.
Each team is required at the start of the project to document its concept of the project. This is an iterative processfor the team and the instructor. The initial documentation that is currently required includes a detailed businessprocess diagram, a detailed specification of the data requirements and how the data is to be organized, aspecification of systems standards, and a detailed project development plan. This initial documentation ismodified and supplemented during the semester as required to produce the final project documentation.
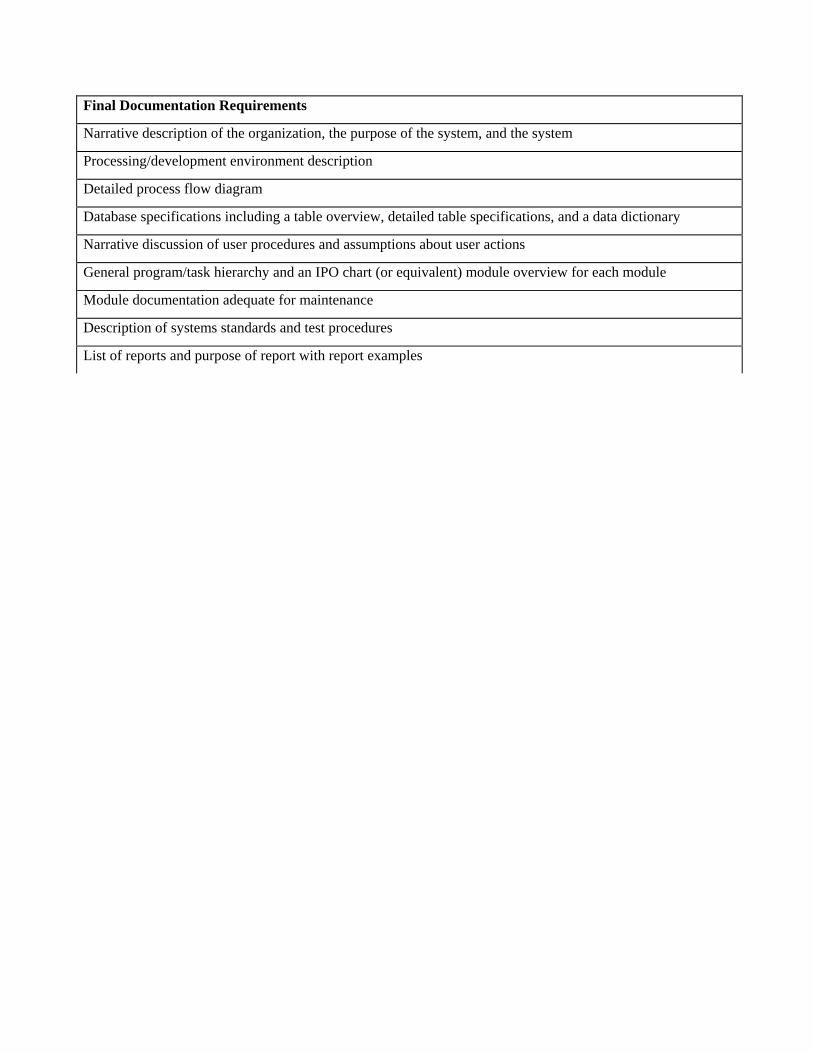
Final Documentation Requirements
Narrative description of the organization, the purpose of the system, and the system
Processing/development environment description
Detailed process flow diagram
Database specifications including a table overview, detailed table specifications, and a data dictionary
Narrative discussion of user procedures and assumptions about user actions
General program/task hierarchy and an IPO chart (or equivalent) module overview for each module
Module documentation adequate for maintenance
Description of systems standards and test procedures
List of reports and purpose of report with report examples

User operation manual and user training plan
The project development plan is updated and modified as needed on a weekly basis. The project plan is designedto not only guide the project but to keep a historical record of the project. Over the course of the project, the plan“grows” from about 10 general activities to perhaps 60 specific activities showing expected/actual completiondates and responsible team members.
The instructor must critically review the allocation of responsibilities within the team. It is essential that theworkload be balanced and allocated so that each team member is required to fully participate in all aspects of theproject. During the implementation stage of the project, each team member will have clearly defined specificresponsibilities for module development and for maintenance and user documentation. While it is important thatthe team members be supportive of the work of other team members, they do not replace or redo the work ofanother team member. This is currently accomplished by means of a written weekly work report preparedindividually by each team member listing in detail individual and joint work accomplished during the week anddiscussing any issues that are facing the team. The instructor meets individually each week with each team todiscuss team progress and facilitate resolution of any unresolved team issues.
It may also be necessary to meet individually with specific individuals to address issues that are specific to thatindividual. In this role, the instructor is functioning as a both an advisor and/or consultant. Experience hasshown that some teams have difficulty resolving personal issues affecting the team and that the instructor mustbe pro-active in forcing the team to confront and resolve this issues.
PROJECT ASSESSMENT
The assessment of the project is critical to the class since the project is the culmination of the semester’s work. Aspecific process for evaluating each project is employed. At the beginning of the semester, a target projectdemonstration date is announced. This becomes the project deadline. Each team is expected to have completed afully functional system and to have produced all required documentation by that date. Each team schedules aproject demonstration for a specific 2 hour period. Approximately four days prior to the scheduleddemonstration, a team is given a set of test data that is to be loaded into the system for the system demonstration.At the start of the demonstration, the team turns in all system documentation and a copy of their system with onlythe test data. At this time, each individual is also required to turn in a confidential, written assessment of thework of the team and each team member.
At the demonstration the instructor presents the team with a list of tasks that the system is to perform. As each ofthe tasks is performed, the instructor assesses the accuracy and effectiveness of the processing of that task. Afterthe completion of the project demonstration, the instructor reviews the system, the system documentation, andthe confidential assessments to assign individual grades to each team member. Team members do notnecessarily receive the same grades.
The assessment of the student work is conducted in 4 stages. Stage 1 is an assessment of the capability of thesystem in performing all required transactions. Since accurate transaction processing is the basis for much of therest of the system, problems in transaction processing are considered to be major system errors. Stage 2 is anassessment of the capability of the system to meet all required management information requirements. Problemsin meeting these are considered to be serious system weaknesses. A project grade of B to F is assigned at thispoint based on the results of this analysis. These grades are assigned individually to account for variations in thedevelopment of the specific modules by each student. Stage 3 involves a review of the basic systemdocumentation for completeness and compliance with the actual system. At this point, the individual grades maybe adjusted up or down based on the quality of the system documentation. Finally, in Stage 4, the user manual isevaluated and an a final grade is assigned.

For an individual student, there are four project grade outcomes which affect the student and the class exam.These are shown in the following table:
Grade Exam Requirement
Project grade of A Exempt from exam
Project grade of C- to B+ Exam optional
Project grade of D- to D+ Exam required
Project grade of F Exam irrelevant
STUDENT REACTION TO THE COURSE DESIGN
The course is subjected to end-of-term course assessments by the students. The reactions of the individualstudents vary but the most frequent views of the course are that it has had the following effects:
improved student understanding of the importance of good design practices,improved student understanding of the difficulties and importance of good teamwork,alerted students to their own collaborative work weaknesses and strengths,enhanced the confidence of students in their ability to do systems development,increased student perceptions of the importance of understanding the business environment, andimproved student understanding of the difficulty and importance of personal time management.

TRACK: Educational Practice
"" II nntteerr nnaatt iioonnaall iizziinngg tthhee BBuussiinneessss SScchhooooll CCuurr rr iiccuulluumm iinn aa SSmmaall ll SSttaattee--SSuuppppoorr tteedd SScchhooooll :: LL eevveerr aaggiinnggRReessoouurr cceess""
MMaarryy AA.. FFllaanniiggaann,, LLoonnggwwoooodd CCooll lleeggeeCCyynntthhiiaa NN.. WWoooodd,, LLoonnggwwoooodd CCooll lleeggee
"" YYoouu CCaann DDoo II tt :: FFooccuuss GGrr oouupp TTrr aaiinniinngg aanndd II mmpplleemmeennttaatt iioonn ffoorr UUnnddeerr ggrr aadduuaatteess""MMaarrggaarreett AA.. KKllaayyttoonn,, MMaarryy WWaasshhiinnggttoonn CCooll lleeggee
"" SSttuuddeenntt PPeerr cceepptt iioonnss oonn TTeeaacchhiinngg MM eetthhooddss ooff PPCC AAppppll iiccaatt iioonn SSooff ttwwaarr ee""MMoohhaann PP.. RRaaoo,, TTeexxaass AA&&MM UUnniivveerrssii ttyy -- KKiinnggssvvii ll llee
"" SSuurr vveeyy RReessuull ttss ooff SSttuuddeennttss iinn aa CCoouurr ssee UUssiinngg PPoowweerr PPooiinntt aass aa TTeeaacchhiinngg AAiidd""TTiimm CC.. MMccKKeeee,, OOlldd DDoommiinniioonn UUnniivveerrssii ttyy
"" TTuuttoorr iiaall :: TThhee MM aakkiinngg ooff aann II nntteerr ddiisscciippll iinnaarr yy MM aarr kkeett iinngg RReesseeaarr cchh MM aasstteerr '' ss PPrr ooggrr aamm:: CCoommppoonneennttss ooff aaCCoommpprr eehheennssiivvee PPrr ooppoossaall""
AAllaann DD.. SSmmii tthh,, RRoobbeerrtt MMoorrrr iiss CCooll lleeggeeDean R. Manna, Robert Morris CollegeWWii ll ll iiaamm RRuupppp,, RRoobbeerrtt MMoorrrr iiss CCooll lleeggee
"" AA CCooll llaabboorr aatt iivvee PPrr oocceessss ffoorr SSttuuddeenntt AAddvviissiinngg""SSaall llyy WW.. GGii ll ffii ll llaann,, LLoonnggwwoooodd CCooll lleeggeeMMaarryy AA.. FFllaanniiggaann,, LLoonnggwwoooodd CCooll lleeggeeCCyynntthhiiaa NN.. WWoooodd,, LLoonnggwwoooodd CCooll lleeggeeBBeerrkkwwoooodd FFaarrmmeerr,, LLoonnggwwoooodd CCooll lleeggee
"" LL oonnggii ttuuddiinnaall SSttuuddyy ooff BBuussiinneessss LL aaww SSeecctt iioonn ooff tthhee UUnnii ffoorr mm CCPPAA EExxaamm""JJoohhnn PP.. GGeeaarryy,, AAppppaallaacchhiiaann SSttaattee UUnniivveerrssii ttyyDDiinneesshh SS.. DDaavvee,, AAppppaallaacchhiiaann SSttaattee UUnniivveerrssii ttyy
"" AAnn AAsssseessssmmeenntt ooff tthhee QQuuaall ii ttyy ooff CCooll lleeggee GGrr aadduuaatteess:: AA SSuurr vveeyy ooff BBuussiinneessss EEmmppllooyyeerr ss""TT.. HHii ll llmmaann WWii ll ll iiss,, LLoouuiissiiaannaa TTeecchh UUnniivveerrssii ttyyAAllbbeerrtt JJ.. TTaayylloorr,, AAuussttiinn PPeeaayy SSttaattee UUnniivveerrssii ttyyLLaawwrreennccee EE.. BBaaggggeetttt,, AAuussttiinn PPeeaayy SSttaattee UUnniivveerrssii ttyy
"" WWhhaatt TTrr aaii ttss AArr ee EEmmppllooyyeerr ss LL ooookkiinngg FFoorr II nn BBuussiinneessss GGrr aadduuaatteess??""AAllbbeerrtt LL.. HHaarrrr iiss,, AAppppaallaacchhiiaann SSttaattee UUnniivveerrssii ttyyJJaaccqquueell iinnee MM.. HHaarrrr iiss,, AAppppaallaacchhiiaann SSttaattee UUnniivveerrssii ttyy
"" TThhee SSttuuddeenntt EEvvaalluuaatt iioonn ooff TTeeaacchhiinngg PPrr oocceessss RReevviissii tteedd""RRiicchhaarrdd JJ.. SSttaapplleettoonn,, GGeeoorrggiiaa SSoouutthheerrnn UUnniivveerrssii ttyyBBaarrbbaarraa AA.. PPrr iiccee,, GGeeoorrggiiaa SSoouutthheerrnn UUnniivveerrssii ttyyCCiinnddyy RRaannddaall ll ,, GGeeoorrggiiaa SSoouutthheerrnn UUnniivveerrssii ttyyGGeennee MMuurrkkiissoonn,, GGeeoorrggiiaa SSoouutthheerrnn UUnniivveerrssii ttyy
"" RReemmoovviinngg BBaarr rr iieerr ss--ttoo--EEnnttrr yy ffoorr DDiissttaannccee LL eeaarr nniinngg:: PPooll iiccyy RReeccoommmmeennddaatt iioonnss ffoorr EElleeccttrr oonniicc CCoouurr sseess""DDoonn PP.. HHoollddrreenn,, MMaarrsshhaall ll UUnniivveerrssii ttyy
RRaayy JJ.. BBllaannkkeennsshhiipp,, MMaarrsshhaall ll UUnniivveerrssii ttyy
“Student Perceptions Of What Factors Create A Quality College Course” Tim C. McKee, Old Dominion University
Walter W. Berry, Old Dominion University

INTERNATIONALIZING THE BUSINESS SCHOOL CURRICULUM IN A SMALL STATE-SUPPORTED SCHOOL: LEVERAGING RESOURCES
Cynthia Wood, Longwood College, Farmville, Virginia, 23909, 804-395-2383Mary A. Flanigan, Longwood College, Farmville, Virginia, 23909, 804-395-2364
ABSTRACT
The purpose of this paper is to discuss various strategies thatbusiness schools can use to internationalize their curricula.Information is provided on determining the business community’s needs,providing developmental activities for students and faculty, modifyingthe curriculum, establishing study abroad programs, and evaluating theresults of all activities.
INTRODUCTION
Globalization of the economy has become so pervasive that even small schools can no longer afford notto include international dimensions throughout their curriculum. To prepare graduates tocompete successfully in this new marketplace, even small businessschools must revamp their curricula to place considerably moreemphasis on the international aspects of business. As Johnstonreported, “ Globalization is here to stay, and its pace in theforeseeable future will only accelerate. Increasingly, the expansionof the international dimension of higher education is not so much anoption as a responsibility.” (Johnston and Edelstein, 1993, 2)Students need to learn about other cultures and customs; study asecond language; interact with individuals from another country; andgenerally understand management practices in an international businessenvironment.
Unfortunately small state-supported schools often face economic obstacles that inhibit the development ofthe international curriculum. These schools tend to have fewer discretionary funds allocated by the state,a smaller network of independent funding sources (endowments), fewer information retrieval andinformation technology resources, and fewer contacts in organizations actively pursuing internationalactivities. In addition, small schools may be less likely to have a cadre of faculty who would becomfortable teaching the international aspects of business.
These small schools can benefit from making the internationalization of the curriculum a two stepprocess. The first, and perhaps easiest, step is to establish strategic alliances or partnerships with foreignschools (sister schools). Through these alliances small schools can offer both their faculty and studentsopportunities to study abroad as well as exposure to the social and business practices of other cultures.This initial step is critical for laying the foundation of a school-wide global perspective. The experiencesof those involved in the international exchange programs tend to allay misapprehension and promoteenthusiasm on the part of faculty, students, and parents.
The second step involves either (1) the gradual infusion of international content throughout thecurriculum or (2) the introduction of a comprehensive upper-level course in international business. Thislatter option, however, requires a knowledgeable faculty member who is willing and capable of teachingan international course.
This paper will relate the “internationalization” experiences of one school. Included in the paper will bespecific suggestions for establishing alliances with foreign schools. The steps described should be ofinterest to other school facing the same process.
ASSESSING BUSINESS NEEDS AND RESOURCES
Business schools are under increasing pressure from stakeholders, suchas administrators, trustees, legislatures, the business community, andaccrediting bodies to internationalize their programs. While inputfrom all of these constituents is essential, perhaps the mostimportant is that of regional businesses. Since they hire graduatesand can provide a wealth of practical information and resources, thebusiness school should establish a collaborative working relationshipwith the business community. To be successful, the revised businesscurriculum must consider their unique needs, interests, and resourcesand have strong proponents in the business community.
The first step, then, that a business school should take is to learnabout the international business activities in the region it serves.Particular emphasis should be placed on:
The number of international companies in the region served by theschool . Information should be collected on the countries wherebusiness is conducted; the types of employment and internshipopportunities that might be available; the skills and knowledgeconsidered essential for international assignments; and potentialtypes of assistance that the companies might be able to offer.
The needs of regional businesses that want to globalize theiroperations . Regional businesses are finding that foreign competitorsare encroaching on their domestic market share. To remain competitivein their traditional markets and also expand, they are being forced tolook to overseas markets. For example, in the late 1980s, traditionalUS family businesses, such as tool and die manufacturers, found thatthey had to enter the global market in order to survive. Other small,traditionally domestic businesses are facing similar challenges todayand need employees with the ability to function in an internationalenvironment.
Shifts in the demographics of the region served by the school .Discussions with local government officials may indicate that the areahas unexpectedly large numbers of new immigrants from several specificcountries. Today, even banks in small towns are discovering that they
are serving a much more diverse customer group and need employees withnew types of skills.
When Longwood’s Business School met with regional business and civicleaders, it discovered that there were significant numbers of workingrelationships with French and British companies, as well as increasingnumbers of immigrants from Hispanic countries, the Asia Pacificregion, and Russia. Some international companies indicated that theywould be interested in offering internships and other onsite learningopportunities. Nearly all regional businesses indicated that theywere being forced to deal with a more demographically diverse customerbase and, therefore, were eager to hire new employees with a basicunderstanding of other cultures and languages. Consequently, theLongwood Business School initially concentrated on establishingexchange programs in those countries in which stakeholders expressedthe most interest.
IDENTIFYING COLLEGE-RELATED RESOURCES
Most colleges and universities have access to specialized resourcesthat can facilitate the internationalization process. There arenumerous professional organizations that offer practical advice onidentifying resources related to internationalization and evaluatingpartners for exchange programs. For example, colleges anduniversities in Virginia can join the Virginia Consortium onInternational Education (VACIE), which meets twice annually toprioritize issues and help members eliminate duplication of effort.The Worldwide Web is also an excellent resource. Many colleges anduniversities have home pages describing their curricula, the benefitsof international study, and study abroad opportunities. Some evenprovide syllabi and applications for their exchange programs.Numerous consortia, professional associations, and government agenciesalso have related information on their home pages.
A school’s internal resources should also be assessed. Even smallschools find that there are numerous resources available. A campus-wide survey should be conducted to identify:
� Foreign language programs� Study abroad and exchange opportunities that have already been
established� International studies programs that can provide specialized
international courses� General education courses dealing with other cultures and
social systems� Faculty who have international business experience, unique
language skills, and extensive travel experience� Individual willing to lead the change process

Many schools find that the foreign language department is an importantally in the internationalization process. At Longwood, for example,the Business School worked with the Modern Language Department toencourage business students to minor in languages and languagestudents to minor in business. As a result, approximately 20 percentof last year’s incoming freshmen took an advanced foreign languageclass. To provide study abroad opportunities for business students,the College’s existing programs were reviewed, and new opportunitieswere identified so that students could study business at universitiesoverseas.
The Business School also sought opportunities to form partnershipswith other parts of the College. For example, the Business andEducation Schools agreed to work together in the Cooperative AmericanRussian Education (CARE) initiative, an exchange program with aRussian university. New exchanges specifically for business studentswere established in Ghana and France. In addition, the InternationalStudies Office agreed to offer assistance with visa applications,negotiations with foreign universities, and the orientation ofinternational students to the Longwood campus. Consequently, theBusiness School found that it could complete the initial steps in theinternationalization process relatively easily.
BUILDING ALLIANCES WITH OTHER UNIVERSITIES: STUDY ABROAD
Although alliances with other institutions are one of the first stepsthat many schools take in internationalizing their curricula, theresulting opportunities to study abroad are still underutilized.Recent studies show that only approximately one-half of one percent ofall students enrolled at the baccalaureate level study abroad in anygiven year. Of these, 11 percent are business majors. (AdvisoryCouncil for International Exchange, 1990, 7 - 10)
Perhaps the easiest way to begin a study abroad program is toparticipate in one that has already been established by anotherinstitution. Such an arrangement helps the school learn about theexchange process while also offering some protection frominexperience. After a partner institution has been selected, the twoinstitutions should prepare a written agreement that specifies theterms of the exchange, such as length of stays abroad, participants,types of educational experiences to be included, the support servicesto be provided, and provisions for cancellation of the agreement.
The Longwood Business School has found that exchange agreements can bestructured in several different ways:
� Open ended . This approach allows each institution to send asmany participants overseas desired

� Even or one-for-one exchanges . This approach is often moreappropriate when one partner has a non-convertible currency orhigher costs.� Agents . In this case, a third party is engaged to handle all
the arrangements.
Both Longwood College and the Business School use a mix of thesearrangements. The College now has agreements with 22 countries.
In all disciplines, including business, there is also stillconsiderable faculty suspicion of the quality and value of studyabroad programs. By involving faculty in the design andimplementation of study abroad programs, however, potential oppositioncan often be converted into support. Faculty representatives shouldbe encouraged to visit exchange partners; meet with their counterpartsto discuss how classes are taught; and learn about differences andsimilarities in the two educational systems. Faculty can then usethis information to more effectively advise and help students plantheir programs of study.
The Longwood Business School’s experience has shown that studentsplanning to study abroad need detailed information at the beginning oftheir freshman year so that they can coordinate their programs ofstudy at both institutions; take additional foreign language classes,if needed; and receive a proper orientation to life abroad. Evenafter they are enrolled in foreign institutions, they may need ongoingsupport from their home campus. For several weeks, some students willbe concerned about communication in a foreign language, while otherswill need reassurance about course work.
Returning students need similar help making the transition back totheir home institutions. While they may have found that their studyabroad resulted in considerable personal growth, these students oftenreport that faculty see little connection between what was studiedabroad and their “ real” academic programs. They are not encouragedto share what they learned or to recruit other students. Facultyassistance in all of these areas is essential.
MODIFYING THE CURRICULUM
While study abroad programs, foreign languages, and the presence ofinternational students are all important, internationalizing thecurriculum is the heart of the process. To be relevant for today’sbusiness environment, most courses should transcend nationalboundaries. Overcoming ethnocentrism means that faculty must ask newquestions, collect different types of data, and provide differentillustrations of key points. The process is daunting. Faculty mayfind that long-held assumptions and conclusions no longer apply.
There are two basic approaches that business schools can take tochanging their curricula: infusion of international topics in existingcourses and the development of entirely new courses. The LongwoodBusiness School has chosen to combine both approaches. Facultyreviewed all core business courses and agreed on the fundamentalconcepts that should be covered in each one. To ensure that infusionof international issues actually occurs, faculty have been asked todocument coverage of these issues in their syllabi and tests. Theyare also encouraged to use enrichment activities, such as casestudies, guest speakers, and Internet communications with students inforeign schools.
The Longwood Business School also requires all students to selectseveral general education courses involving international issues.Options include the history of western civilization, the history ofChina, comparative religious studies, and various philosophy courses.In addition, all students are required to take an internationaleconomics course or another approved international course within theirarea of specialization. Courses are available in internationalmarketing, management, and accounting. While not required, study of aforeign language and study abroad are both encouraged. Consequently,students are exposed to international business and cultural issuesthroughout their program of study.
PREPARING STUDENTS AND FACULTY
To counter natural resistance to change, the business school shouldstrive to create an international ethos or atmosphere in whichconsiderable value is placed on international activities. Newinternational classes and study abroad programs, special speakers, andforeign exchange students should all receive considerable publicity,as well as the endorsement of school leaders. Many schools have foundthat it is important to have symbols of change, such as:
� Publicity concerning new courses� Special titles for individuals leading internationalization
initiatives� New brochures, videos, and other public relations materials� Special meetings to inform the public of new programs and
course offerings� High profile conferences for companies conducting international
business� Community activities involving faculty and students from other
countries� Opportunities for learning about other cultures and business
systems
The Longwood Business School has effectively used a number of thesesymbols of change. After completing its initial assessment of thelocal business community, the Business School sponsored a conference

for businesses wishing to sell products and services in Russia. Afterthe conference, faculty worked with several companies who neededspecific assistance in pursuing their goals.
In related activities, the Business School arranged for visitingRussian students, business leaders, and faculty to interact with thelocal community. They met with public and private school students,business leaders, and interested town residents. The Business Schoolalso offered a course on economic changes in the former Soviet Unionthat was open to the public. Press coverage was arranged for all ofthese events and included newspaper articles, features on the eveningnews, and panel discussions on local cable television channels.
Students from other countries are another potentially importantelement in the creation of an international ethos. The United States,which hosts approximately 30 percent of all students studying outsidetheir native countries, leads all other countries in the enrollment offoreign students. Even small schools, such as Longwood, areexperiencing dramatic growth in their international student body. Asthe number of international students at the Business School hasincreased, the School’s domestic students have had opportunities toattend classes with and work on project teams with students fromGhana, Tanzania, Bulgaria, Romania, the Czech Republic, El Salvador,Honduras, France, and Sweden. The presence of international studentshas broadened classroom discussions and enabled faculty to more easilyillustrate critical points about cultural differences. All of theseactivities have increased students’ awareness of other cultures andopenness to international business.
Throughout its internationalization process, the Business School hasemphasized related developmental opportunities for both faculty andstudents. A curriculum transformation workshop was held to explaintechniques for including more culturally diverse viewpoints in thecurriculum. Faculty have been encouraged conduct more research oninternational topics and to travel abroad. They have traveled toChina, Hong Kong, Singapore, Mexico, Ghana, Egypt, Tanzania, Russia,and various European countries. One individual currently has aFulbright Fellowship to teach in Ghana, and another is scheduled tospend the Fall 1997 semester on a faculty exchange in Russia. ARussian economist will teach at the Business School. Research hasfocused on a variety of topics, including international mergers andacquisitions, the role of women in the emerging Russian economy, Cocoaproduction in Ghana, the application of Hofstede’s variables, andmultinational companies’ globalization strategies.
Students have studied at business schools in England and France andtraveled to Russia. Several have completed internships abroad. Theyhave also used the Internet to communicate with and work on projectswith students in Japan.

Finally, as internationalization of the curriculum has proceeded, theBusiness School has changed the way it recruits new students. A newmulti-media presentation has been developed that highlights:
� The increasing emphasis being placed by Virginia businesses onforeign language skills and knowledge of other cultures� The advantages of study abroad opportunities and internships� The cultural diversity of the Longwood Business School’s
faculty and student body
MEASURING PROGRESS
As internationalization proceeds, it is important to establish bothquantitative and qualitative measures of success. Typicalquantitative measures include:
� Number of faculty with international expertise and interests� Number of new courses solely dedicated to international issues� Number of core courses and electives revised to include
international topics� Percent of international coverage in core courses and electives� Students’ performance on the international component of
nationally normed achievement tests� Changes in enrollment in new courses, courses revised to
include an international component study abroad programs, and new majors/minors� Outside funds raised for internationalization initiatives� Student evaluations of new and revised courses� Number of faculty research projects related to international
topics
While these quantitative measures highlight one dimension of aschool’s success in internationalizing the curriculum, other lessquantitative measures provide equally important information aboutsatisfaction with the changes. Other less quantitative measuresinclude changes in:
� Faculty attitudes toward internationalization� Student attitudes toward internationalization� Business community’s satisfaction with internationalization
The Longwood Business School has found that the most important overallmeasure of success, however, is the satisfaction of employers andalumni who have been in the workforce for several years.
CONCLUSION AND RECOMMENDATIONS
Both large and small business schools are under increasing pressure tointernationalize their curricula. While there is no one bestapproach, successful schools consider their unique cultures,

organizational structures, educational philosophies, and the needs ofthe local business community. Effective planning, creativity, andshepherding of new initiatives are all essential. Even then theprocess can be long and complicated. Because the typical college oruniversity is a complex mix of disciplinary interests, there will beresistance to change from many different areas of the institution.
Business schools must anticipate such resistance to change and educateboth faculty and students on the advantages of internationalization.The creation of a strong international ethos within the businessschool is essential. Champions of internationalization should also beidentified and encouraged to play leadership roles during the changeprocess. They should include faculty, administrators, students,trustees, and local business leaders. Finally, the business schoolshould conduct a regular assessment of its internationalizationactivities to determine their effectiveness and efficiency. Theultimate test of a school’s internationalization efforts is a trulymarket-driven curriculum that prepares graduates to obtain jobs andwork in today’s increasingly complex market.
REFERENCES
Advisory Council on International Educational Exchange. Educating forGlobal Competence. New York: Council on International EducationalExchange, 1988, 7 - 10.
El-Khawas, Campus Trends, 1992, Higher Education Panel Report 82,American Council on Education, July 1992, 13.
Groennings, S. and David S. Wiley (eds.) Group Portrait:Internationalizing the Disciplines. New York: The American Forum,1990.
Johnston, J. S. and Richard J. Edelstein. Beyond Borders.Washington, D.C.: Association of American Colleges and the AmericanAssembly of Collegiate Schools of Business, 1993.
Pickert, S. and Barbara Turlington. Internationalizing theUndergraduate Curriculum: A Handbook for Campus Leaders. Washington,D.C.: American Council on Education, 1992.

YOU CAN DO IT: FOCUS GROUP TRAINING AND IMPLEMENTATION FORUNDERGRADUATES
Margaret A. Klayton, Mary Washington College, Fredericksburg, VA 22401 (540) 654-1451,[email protected]
ABSTRACT
Undergraduate students can perform focus group interviews if trained properly. A credit union engaged amarketing research class at a small southern college to perform focus groups to ascertain the effectivenessof its promotional efforts. In particular, the credit union wanted to recruit faculty and staff who were notusing or underutilizing its services. Because focus group application projects are not normally performedat the undergraduate level, this project became a challenge to the instructor to train students throughsupplemental instruction. The instructor-created steps introduced in this paper will enable otheracademicians to replicate this successful experience in their classrooms.
INTRODUCTION
Focus groups are the most popular form of qualitative research as evidenced by client firms which spendmore than $378 million a year on focus group research [3]. In fact, Zikmund states that focus groupinterviews . . . are so popular that many advertising and research agencies consider them the onlyqualitative research tool [2]. With these practitioner-related results in mind, the credit union elected touse exploratory focus groups to define the problem. The immediate challenge was whether undergraduatestudents would be capable of undertaking focus group administration. Though this is an ambitiousundertaking, it can yield remarkable results when guided correctly.
First, the instructor must supplement the textbook with specific, current literature about focus groupadministration. Secondly, students must rehearse and assume roles in groups to add reality to the situationbefore the actual focus groups meet. Ongoing telephone screening for focus group participants should beimplemented concurrently with these rehearsals. Of course, the instructor is still charged with filling thecourse requirements which usually consist of other methods of research and a large statistics component.Thirdly, the instructor must modify traditional report writing guidelines to accommodate the qualitativenature of the focus group transcripts. The following discussion presents a background and methodologyof the research project and the three steps that the instructor implemented to achieve successful results.
Background
The credit union which had a student-run office and ATM machine on campus engaged the marketingresearch course at the college to perform focus groups to meet three objectives. The first was todetermine how to recruit faculty and staff to utilize its services. A secondary objective was to learn howto better serve the needs of incoming freshmen. The final objective was to ascertain the effectiveness ofits promotional efforts.
Methodology
The research design consisted of two stratifications of focus groups: member and nonmember. Thesegroups were further stratified into faculty/staff, freshmen, and other students for a total of six groups. Thecredit union had targeted freshmen because they wanted to meet their special needs as incoming studentsin order to establish loyalty. Students were divided into six teams and assigned to each of the six groups.

The sample frame incorporated a listing of credit union members and the college campus phone directory.Participants were selected through random sampling. They were first screened to fit the variousstratification levels and asked a series of questions pertaining to their banking history. The results of thesesurveys were condensed into spreadsheets as a reference guide for each moderator. Participants werecompensated by the credit union for their time.
The final group size ranged from 7-8 participants and was limited by room size. Two students from eachteam were moderators. One moderator introduced the project and gleaned general information aboutbanking services in general and, then, asked more specific questions concerning the credit union. Thesecond moderator read a series of six promotional themes from large posters and asked the group to voteon the effectiveness of each theme.
Focus groups were audiotaped and videotaped in the psychology observation lab on campus. Transcriptsof the tapes were included in the six client reports. Student speakers from each team presented thesignificant findings of their focus group to the credit union President, Vice-President of Marketing,Collegiate Marketing Director, and the Collegiate Director. Students utilized Microsoft Power Point fortheir formal presentations. The session was videotaped for viewing in successive courses.
The next section explains the three basic steps developed by the instructor to aid in training students toperform a sophisticated process: focus group administration.
THE THREE LEARNING STEPS
Step One: Present Current Literature
Most marketing research texts lack specific and thorough information about current focus group trainingand administration. Instructor background experience and secondary research provide a basis for studentsto begin the focus group process. In this project, after viewing a videotape of a mock session of a focusgroup, students were given a packet of supplemental readings and two weeks were spent discussing thesereadings.
Once students envisioned how a focus group was administered, they felt more comfortable with the ideathat they had the capability to conduct one. The instructor gradually introduced the focus group literatureand lectures along with other course topics to help reduce anxiety.
Step Two: Role-Playing Exercises and Rehearsal
Role-playing techniques are used in classroom settings to allow students to act out someone elsesbehavior. In this case, students who were not moderators were asked to behave as a typical participant inthe focus group rehearsal. Prior to this role-playing excise and after students were assigned to the sixfocus group teams, they performed various course exercises in order to develop group cohesiveness.Questions were provided by the credit union and refined by the instructor and students before being usedin a role-playing exercise. Students in each team were assigned roles for the role-playing exercise thatthey would have in the actual setting. Two members of each team were selected as moderators becausethe credit union wanted a series of six promotional benefits which were on large cards shown participantsin order to gauge their reactions. Thus, one moderator opened the focus group, led the introductions andpresented questions while the other moderator exhibited and read the promotional benefits cards andasked the group for agreement or nonagreement with the statements.
Another student was in charge of the audiotape backup while the fourth student was assigned to the video

control room to aid the technician in case any problem should occur. Both students were responsible fortaking notes. The fifth student became the greeter who prepared participants name tags, checked them in,introduced them to each other, and gave them their checks at the termination of the session. Thesestudents also were assigned the additional duty of note taking in the event both audio-and videotapesfailed or were inaudible. A second role-playing rehearsal was performed in the psychology observationallab using the audio and video equipment.
Students had the additional responsibility of screening potential participants through phone calls.Originally ten participants were invited to each of the six group sessions to accommodate last minutecancellations.
Step Three: Modifying Research Report Guidelines
Guidelines for preparing the results of focus group interviews in a report format are nearly non-existent inmarketing research textbooks. In particular, textbooks do not address the issue of preparing the transcriptsfor inclusion into the document nor how to interject the actual information into the report. Students andinstructors are confused about how many statements to quote in the main body of the report since theseresponses are qualitative. Most focus group reports concentrate on grouping the majority of similarresponses to designate a trend of thought or a position statement from the participants in regard to aquestion presented by the moderator. According to Hannah, A good moderator conducts the groups andthen writes a report which includes not only what was said, but more importantly, includes implications tothe client of what was said or left unsaid. . . a good report must go beyond what was said and analyzewhat was meant by respondents comments [1].
Besides interpreting implied behavior, moderators must analyze nonverbal behavior. Body language, howparticipants dress, the intensity of their voices, their self presentation, and their emotions, all form aprofile of the group and their corresponding individual participants which may aid in determining aclients persuasive power [5]. These characteristics, of course, are more observable from a trainedmoderator, although, surprisingly some students perceive these nuances and do address them in theirwritten report.
Focus group videotaping is useful to clients so they can repeatedly view the focus groups, but Youngstates that video summaries should be used instead [4]. Video summaries begin with the moderatorsquestions and are followed by a sampling of respondent answers.
Student teams transcribed the audio and videotapes into detailed transcripts. Not all guttural responsesare transferred into a written document though the entire transcript is included in the appendix of theclient report. Again, the major insights should be reported. Clients need viable information on while tobase their future decisions. Of course, the report must include a disclaimer stating that qualitative researchis not mathematically projectable and any results noted in the analysis should be viewed as tentative andlater documented in a quantitative study.
CONCLUSION
The successful implementation of this undergraduate project led to viable solutions that addressed thecredit unions major concerns. Although using extensive supplemental materials and lectures were time-consuming, the results were well worth the efforts. Even though students were apprehensive at first, theysoon grasped the challenge to reach beyond the textbook and become professional researchers. Theirexperiences aided them in securing marketing positions upon graduation.

REFERENCES
[1] Hannah, Maggie. A Perspective in Focus Groups. in James B. Higginbotham and Keith K. Cox [eds.] Focus Group Interviews: A Reader. Chicago: American Marketing Association, 1979, 78.[2] Langer, Judith. Getting to Know the Customer Through Qualitative Research, Management Review, April 1987, 44.[3] Winters, Lewis. Whats New in Focus Group Research. Marketing Research, December 1990, 69-70.[4] Young, Donna. Focus Group Summaries Should Be Seen and Heard. Marketing News, 1989, 23(19), 40.[5] Zikmund, William. Exploring Marketing Research, 6th ed. Fort Worth, TX: Dryden-Harcourt Brace, 1997.

.

STUDENT PERCEPTIONS ONTEACHING METHODS OF PC APPLICATION SOFTWARE
Mohan P. Rao, Texas A&M University-Kingsville, Kingsville, TX 78363 (512) [email protected]
ABSTRACT
This paper will present the results of a student survey concerning the effectiveness of different teachingmethods in a course on PC Application Software. The results show that the hands-on learning in acomputer lab with the help of an instructor was their best choice, and the hands-on learning withoutanybody’s help was the worst. These results are a warning for those institutions thinking aboutimplementing a course such as PC Applications with total dependence on CD-ROM and video tutors andno instructor.
INTRODUCTION
Most universities require that freshman students learn PC Application Software if they didn’t have thatbackground. On the other hand, there is a shortage of instructors [10][11] who can teach Windows-basedApplication software such as Microsoft Office, and who are willing to deal with large classes offreshmen. Consequently some universities are using alternate ways to deliver the course. One of theways is a self-study method, where students depend either exclusively or largely on CD-ROMs and videotutor tapes [11]. The results seem to be disappointing: 50% of students either drop out or fail. Anothermethod is to have an instructor lecture and demonstrate the features of the software by going through thebook step-by-step. This method can be boring and frustrating for those students who already knew someof the material. It is not uncommon in such a class that a third of the class is absent, another third is onlyphysically present, and the other third shows some interest.
It is obvious that teachers want their classes to be interesting to their students. They are, however,“discovering that traditional learning methods are not as effective as once thought” [1]. Teachers “mustcontinually integrate new techniques into their teaching methods in order to keep the competitive edge”[26]. “Regardless of the techniques used during the class,” Keller and Chuvala [25] suggest that theteacher “must make the most of the first 20 minutes because students’ attention may be lost.” Furtherthey suggest that the teachers “should also familiarize themselves with obstacles that may preventstudents from learning.” There have been several surveys to learn about different teaching methods andtools, and their effectiveness: Accounting [7][12][16][33], Economics [4][5][36], Entrepreneurship[17][18], Management [3][13][19], Marketing [23], MIS [6][28][38], Public Administration [40], Science[8][9], Statistics [37], and Transportation [24]. There are so many positive reports about the effectivenessof new techniques and technologies for teaching, which includes computer-aided instruction (CAI)[2][14][29], CD-ROMs [27][31], videos, Internet/Hypermedia [39], TQM [20][21], Electronic classrooms[30], Outdoor learning [22], Accelerated learning [32], Experiential learning [9][15][19][34][35].
This paper will discuss the results of a student survey on twelve different methods including lecture andcomputer lab for learning PC Application Software. The results can be very useful in designing anddelivering a course such as PC Application Software. This paper will also describe an effective method of

delivering a classroom presentation with the concurrent use of a presentation software for slides andactual software for demonstration of keys and concepts. This method was one of the top choices in thesurvey. Following is a brief description of the survey method, the survey questionnaire, analysis anddiscussion of the results.
SURVEY METHOD
Survey was conducted in two different sections of the course. There were a total of 36 respondents. After thesurvey was distributed, each teaching method was clearly explained so that they know the difference betweeneach of them. They not only rated each method, but also wrote comments explaining their rating.
SURVEY QUESTIONNAIRE
Following is a list of alternate methods of teaching PC Application Software. On a scale of 1 to 10 (10 beingthe best), rate each method. Write pros and cons for each as much as you can. Please read all the alternativesbefore rating any.
1. Instructor explains the keys to be used for each competency/task by writing on the blackboard.2. Instructor explains the keys to be used for each competency/task with the use of overhead
transparencies. Some transparencies show the pictures of software screens.3. Same as #2, but with a presentation software such as PowerPoint. That is, the Instructor explains the
keys to be used for each competency/task with the use of electronic (PowerPoint) slides. Some slidesshow the pictures of software screens.
4. Instructor explains the keys to be used for each competency/task with the simultaneous use of (that is,going back and forth between) electronic (PowerPoint) slides and the actual software demonstration.(Concurrent)
5. Instructor explains the material by doing the lab (step by step) in the class using the computeroverhead projection system.
6. Instructor asks one or two students on a rotation basis to step forward and do a section of the lab (stepby step) in the class using the computer overhead projection system.
7. Students are taken to a computer lab where they are assigned to do a lab. Instructor monitors thestudent work, and helps those in need.
8. Students are assigned to do the lab work and home work on their own. There will be no class, and nohuman instructor. If they need help, they can get it through Self-teaching software CD-ROMs orVideo tutor tapes.
9. Combination of #2 and 7 (Transparencies plus Computer lab).10. Combination of #3 and 7 (Electronic slides plus Computer lab).11. Combination of #4 and 7 (Concurrent method plus Computer lab).12. Combination of #5 and 7 (Step-by-step by instructor plus Computer lab).
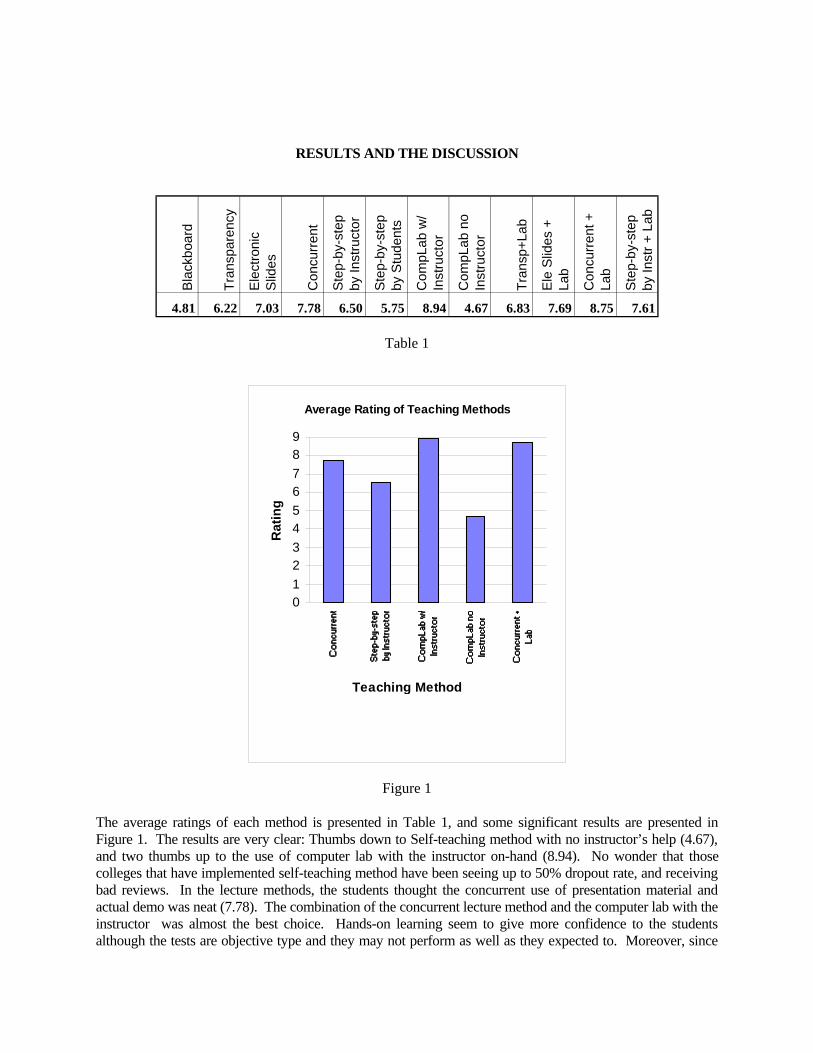
RESULTS AND THE DISCUSSION
Bla
ckbo
ard
Tra
nspa
renc
y
Ele
ctro
nic
Slid
es
Con
curr
ent
Ste
p-by
-ste
p by
Inst
ruct
or
Ste
p-by
-ste
p by
Stu
dent
s
Com
pLab
w/
Inst
ruct
or
Com
pLab
no
Inst
ruct
or
Tra
nsp+
Lab
Ele
Slid
es +
La
b
Con
curr
ent +
La
b
Ste
p-by
-ste
p by
Inst
r +
Lab
4.81 6.22 7.03 7.78 6.50 5.75 8.94 4.67 6.83 7.69 8.75 7.61
Table 1
The average ratings of each method is presented in Table 1, and some significant results are presented inFigure 1. The results are very clear: Thumbs down to Self-teaching method with no instructor’s help (4.67),and two thumbs up to the use of computer lab with the instructor on-hand (8.94). No wonder that thosecolleges that have implemented self-teaching method have been seeing up to 50% dropout rate, and receivingbad reviews. In the lecture methods, the students thought the concurrent use of presentation material andactual demo was neat (7.78). The combination of the concurrent lecture method and the computer lab with theinstructor was almost the best choice. Hands-on learning seem to give more confidence to the studentsalthough the tests are objective type and they may not perform as well as they expected to. Moreover, since
Average Rating of Teaching Methods
01
23
45
67
89
Teachin g Method
Rat
ing
Figure 1

each computer is shared by two students to do the class work, the cooperative learning and social interactionseem to add another dimension to their satisfaction with the computer lab. This was an exploratory study, andfurther studies should include classes taught by different professors using different teaching methods. Usingpretests and posttests in those classes may show actual learning improvements as opposed to their perceptionsof learning methods.
REFERENCES
1. Aaron, Kris. "Dodging drudgery," Credit Union Management. 18(11): 27-29. 1995 Nov.2. Ambler, Scott. " CAI tool caters to budding Ada programmers," Computing Canada. 19(22): 20-21.
1993 Oct 25.3. Anonymous. ""Management 5325" takes on marketplace perspective," Baylor Business Review.
14(1): 10-11. 1996 Spring.4. Becker, William E. Watts, Michael. "Chalk and talk: A national survey on teaching undergraduate
economics," American Economic Review. 86(2): 448-453. 1996 May.5. Becker, William E. Watts, Michael. "Teaching tools: Teaching methods in undergraduate economics,"
Economic Inquiry. 33(4): 692-700. 1995 Oct.6. Bellardo, Trudi. "Options and Trends in the Training of Information Professionals," Journal of the
American Society for Information Science. 39(5): 348-350. 1988 Sep.7. Berg, Joyce. Dickhaut, John. Hughes, John. McCabe, Kevin. Rayburn, Judy. "Capital market
experience for financial accounting students," Contemporary Accounting Research. 11(2): 941-958.1995 Spring.
8. Brennan, Mairin. "Precollege science education: U.S. standards set for students, teachers," Chemical &Engineering News. 73(50): 6-7. 1995 Dec 11.
9. Brennan, Mairin. "Survey backs hands-on science teaching," Chemical & Engineering News. 74(18):12. 1996 Apr 29.
10. Cetron, Marvin J. Gayle, Margaret Evans. "Educational Renaissance: 43 Trends for U.S. Schools,"Futurist. 24(5): 33-40. 1990 Sep/Oct.
11. Creighton, Walter Kilcoyne, Margaret. “Designing and Implementing a Self-Paced MicrocomputerCourse: An Update,” A presentation at 1997 SWFAD - Southwestern Administrative SystemsConference, March 13, 1997.
12. Crockett, James R. "The dynamics of accounting education and their effects on internal auditing,"Managerial Auditing Journal. 8(4): 27-32. 1993.
13. Daley, Dennis M. "Teaching methods used in the personnel and human resources management generalcourse - How public and business administration programs plant the seed of learning," Review of PublicPersonnel Administration. 14(4): 39-51. 1994 Fall.
14. Eisma, Teri Lyn. "User-Friendly, Interactive Software Successfully Trains Workers in Safety,"Occupational Health & Safety. 60(5): 30-36. 1991 May.
15. Felder, Richard M. Huvard, Gary S. "Technical training: Hit the ground running," ChemicalEngineering. 100(6): 133-136. 1993 Jun.
16. Friedlan, John. "Steeped in tradition," CA Magazine. 128(7): 44-47. 1995 Sep.17. Garavan, Thomas N. O Cinneide, Barra. "Entrepreneurship education and training programmes: A
review and evaluation - Part 1," Journal of European Industrial Training. 18(8): 3-12. 1994.18. Garavan, Thomas N. O Cinneide, Barra. "Entrepreneurship education and training programmes: A
review and evaluation - Part 2," Journal of European Industrial Training. 18(11): 13-21. 1994.19. Hogan, Christine. ""You Are Not Studying Alone" - Introducing Experiential Learning into the
Teaching of Organizational Behaviour," Education & Training. 34(4): 14-19. 1992.20. Horine, Julie E. Hailey, William A. Rubach, Laura. "Transforming schools," Quality Progress.
26(10): 31-38. 1993 Oct.

21. Horine, Julie E. Hailey, William A. Rubach, Laura. "Shaping America's future," Quality Progress.26(10): 41-60. 1993 Oct.
22. Irvine, Dominic. Wilson, John P. "Outdoor management development - Reality or Illusion?," Journalof Management Development. 13(5): 25-37. 1994.
23. Katzenstein, Herbert. Kavil, Sreedhar. Mummalaneni, Venkat. Dubas, Khalid M. "Design of an idealdirect marketing course from the students' perspective," Journal of Direct Marketing. 8(2): 66-72. 1994Spring.
24. Kellar, Gregory M. Jennings, Barton E. Sink, Harry L. Mundy, Ray A. "Teaching transportation withan interactive method," Journal of Business Logistics. 16(1): 251-279. 1995.
25. Keller, Steve. Chuvala, John. "Training: Tricks of the Trade," Security Management. 36(7): 101-105.1992 Jul.
26. Kelly, David A. "Trainer's corner," Computerworld. 28(40): 109. 1994 Oct 3.27. Kern, Gary M. Matta, Khalil F. "The Role of Interactive Videodiscs in Computer Aided Instruction,"
Computers & Industrial Engineering. 11(1-4): 288-292. 1986.28. Kleinschrod, Walter A. "A Multisensory Approach to PC Training," Today's Office. 23(12): 66-70.
1989 May.29. Lecht, Charles P. "Building a Computer Teacher," Computerworld. 24(32): 107. 1990 Aug 6.30. Leidner, Dorothy E. Jarvenpaa, Sirkka L. "The information age confronts education: Case studies on
electronic classrooms," Information Systems Research. 4(1): 24-54. 1993 Mar.31. Littell, Robert S. "CD-ROM for training is wave of the future," Best's Review (Life/Health). 95(10):
92-93. 1995 Feb.32. McKeon, Kevin J. "What is this thing called accelerated learning?," Training & Development. 49(6):
64-66. 1995 Jun.33. McNair, Frances. Milam, Edward E. "Ethics in accounting education: What is really being done,"
Journal of Business Ethics. 12(10): 797-809. 1993 Oct.34. Parkinson, Gerald. "Hands on learning: The new wave in Ch.E. education," Chemical Engineering.
101(10): 45-48B. 1994 Oct.35. Peterson, Robin. "Experiential techniques impart practical skills," Marketing News. 30(17): 9. 1996
Aug 12.36. Siegfried, John J. Saunders, Phillip. Stinar, Ethan. Hao Zhang. "Teaching tools: How is introductory
economics taught in America?," Economic Inquiry. 34(1): 182-192. 1996 Jan.37. Strasser, Sandra E. Ozgur, Ceyhun. "Undergraduate business statistics: A survey of topics and teaching
methods," Interfaces. 25(3): 95-103. 1995 May/Jun.38. Sweeney, M T. Oram, I. "Information technology for management education: The benefits and
barriers," International Journal of Information Management. 12(4): 294-309. 1992 Dec.39. Ward, Margaret. "Hypermedia learning," Information Today. 11(8): 15-16. 1994 Sep.40. Yeager, Samuel J. "Trends in Teaching Public Administration: A View from the Proceedings of the
National Conferences on Teaching Public Administration," International Journal of PublicAdministration. 13(1,2): 279-303. 1990.

SURVEY RESULTS OF STUDENTS IN A COURSEUSING POWER POINT AS A TEACHING AID
Tim C. McKee, 2045 Hughes Hall, Old Dominion University, Norfolk, VA 23529-0229 (757) 547-3457
ABSTRACT
The use of "Power Point" or "Presentations" to aid in the instructionof college/university courses is becoming more popular. Thepurpose of this paper is twofold. The first was to evaluate studentperceptions of courses which have been taught with the use of"Power Point" or "Presentations". The second was to assistinstructors/professors who are preparing to teach a course using theaid of "Power Point" or "Presentations". In order to accomplish thistask students who had recently completed a courses using "PowerPoint" were mailed a survey. Eighty-four surveys were mailed andforty-four responses were received. Four professors wereinterviewed to determine their preparation time and their opinions ofthe effectiveness of the "Power Point" presentations.
STUDENT SURVEY
Students who had recently taken a course where the professor used"Power Point" were surveyed by mail. It was the opinion of theauthor that a mail survey would be more effective than a surveyhanded out at the end of a course. The letter accompanying thesurvey stated that the survey was completely anonymous.
Of the forty-four students who responded to the survey, 80% agreedor strongly agreed that “The use of power point increased the valueof the course”. Given a choice, 82% of the students would take acourse that uses “Power Point” rather than without “Power Point”.
Interest in the course material was enhanced by the use of “PowerPoint” according to 76% of the students. However, when it came toretention of the knowledge of the course material, only 39% felt thatthe use of “Power Point” helped them to retain the course materiallonger.
The complete survey and responses is on the last page.
INTERVIEWS OF INSTRUCTORSWHO HAVE USED "POWER POINT"
Preparation Time
Four professors were interviewed who had used "Power Point" intheir courses. Preparation time was their biggest concern. It wasreported that it took them about four hours to prepare for eachfifty minutes of in class time. And this was for courses they hadalready taught in the past.
When a course was taught a second time (after they had prepareda "Power Point" presentation) it still took about 1 1/2 hours torevise and improve their "Power Point" presentation for eachfifty minutes of in class time. One professor had taught a coursefor the third time and his preparation time was minimal.
Therefore, if you plan to incorporate "Power Point" or"Presentations" to aid in your instruction of a course plan tospend a considerable amount of time during the first two courses.
Equipment Required To Make "Power Point" Presentations
Another consideration is the equipment required for use in a"Power Point" or "Presentations" course. If the classroom is notset up for computer presentations you will have to "lug" heavyequipment to each class. One professor at Old DominionUniversity currently takes a large footlocker, with his projector,to each class (he uses one of those airline tote carts, made forsuitcases).
One can get by with just a laptop computer with a speciallightweight projector to use "Power Point" or "Presentations" butusually this will require a dark classroom. As noted in studentinterviews a dark classroom is not conducive to student notetaking.
If one is planning to use "Power Point" or "Presentations" theyneed to inquire about the type of equipment they will need.
Failure Of Equipment
Regardless of how much prior testing of the equipment before apresentation is done there are bound to be some equipmentfailures. One should be prepared for these occurrences. A baddisk, failure of equipment, a virus, any of these could cause thepresenter to be heartburn.
Probably the best preparation for one of these occurrences is tohave all your slides on hard copy and have enough of them topass out to the class or to the group to which you are presenting. Six to nine slides can be put on each 8 1/2 by 11 inch paper. Enough handouts need to be copied in case of one of thesefailures. One advantage to this is that you only need to do thisonce for each presentation. If no failure occurs you can keepthese hard copies for backup use at a future date. Of course anychange you make in your slides will require changes in yourbackup pages. This may be a small price to pay should anequipment failure occur.
Presentations To Professional Groups
Professional groups now expect computer generatedpresentations. This not only includes groups which are in myfield (tax, law, and accounting) but also in education, science,health, history etc. The President of Old Dominion Universityhas dictated that no overhead projectors are to be used inpresentations, only computer generated presentations will beallowed (i.e. "Power Point" or "Presentations").

INTERVIEWS OF STUDENTS WHO TOOKA COURSE WHICH USED "POWER POINT"
The Good
By far the students who were interviewed preferred the courses thatthey had taken which used "Power Point". This was also confirmedby the mail survey. These results should send a strong message toinstructors/professors who have not yet used "Power Point" or"Presentations". As a side point, the author of this paper has notused "Power Point".
It should be noted that in the future, student evaluations of courseswill probably be higher for courses using "Power Point" or"Presentations". Therefore, instructors/professors not using thismethod of instruction will probably see their student evaluationsdecrease. This is a powerful message to instructors/professors (andto the author).
� The use of the Power Point slides, I thought, grabbed people’sattention and allowed them to concentrate more on the materialbeing presented.
� Power Point better facilitated remote learning (telecourses). � Power Point is preferred over the use of individual slides made
by professors. Power Point slides are clear, easy to read, andeasy to understand. All professors should be required to usePower Point slides.
� Using Power Point made the class flow smoother because the
instructor did not have to fumble with slides!! � I believe Power Point was useful.
� The use of Power Point slides was particularly helpful inillustrating practical examples of account entries. Seeing theactual entries was very useful.
� Power Point should be used in concert with lectures. Power
Point is a general introduction and is useful as a tool oflearning.
� Power Point is a strong teaching tool which for many
presentations is effective.
The Bad
Without the use of "Power Notes" many students did not like the"Power Point" presentation. "Power Notes" are hard copies of the"Power Point" slides. "Power Notes" allow the students to fill intheir own notes of the lecture with taking down all the informationon the "Power Point" slides. This saves time and allows moreinformation to be conveyed by the instructor/professor.
� The use of Power Notes and Power Point was great. Butwithout the Power Notes, the positive effect would have beenlost!
� We had Power Point notes with a copy of each slide. At timesclass seemed like a waste of time - the professor going fromone slide to the next reading aloud what we’ve perfectlycapable of reading with notes. Power Point should be used toexpand on and provide examples for the material.
This additional feature in the classroom presentation requires littletime but can be expensive due to copying costs. One way to avoidthis is to require the students to by a "course pak" which has drawbacks due to the cost to the students. Each instructor/professor hasto make this decision depending upon the circumstances involved.
The Ugly
The use of too many "gadgets," which "Power Point" and"Presentations" have really detracted from the class and professionalpresentations. I watched in awe as one presenter brought in eachnew point with the point flashing in from the side to the sound ofsquealing brakes. The first one was good but by the fourth and fifththe audience was completely turned off.
Both "Power Point" and "Presentations" have these features. Thenext slide or point can be brought in by tumbling in from the side ortop and with various noises. Doing this once or twice can heightenaudience awareness but overuse of these methods causes totaldissatisfaction. When one uses these features they should be usedsparingly.
Reading the slides is also bad. When a new slide is presented theinstructor/professor should allow the audience to read it on their ownand be quiet during sufficient time for them to read it.
SUMMARY
“Power Point or “Presentations” seems to be in the future forclassroom teaching. This survey indicated that students highly favorit. However, the use of “Power Point” or “Presentations” will causeinstructors/professors to spend more time in preparing for eachcourse.
This survey was conducted only at Old Dominion University. It isthe author’s intention to develop a better survey, to increase thesurvey size, and to survey at additional colleges/universities.
SURVEY INSTRUMENT
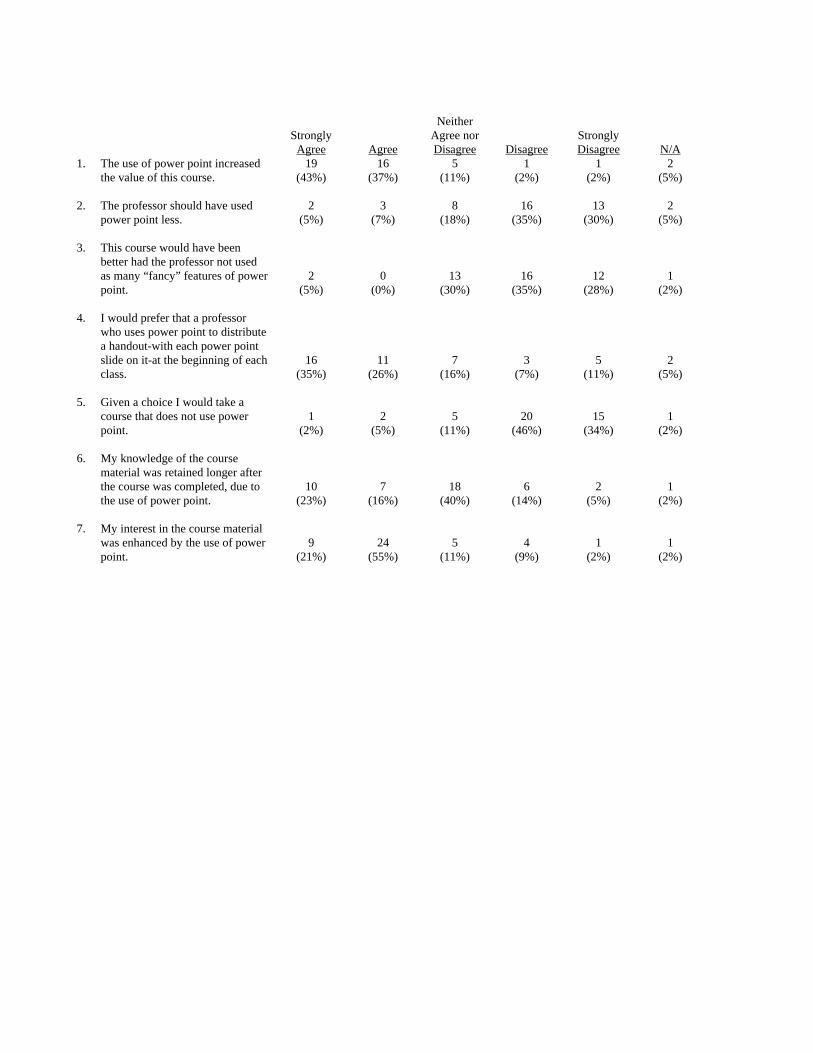
StronglyAgree Agree
NeitherAgree norDisagree Disagree
StronglyDisagree N/A
1. The use of power point increasedthe value of this course.
19(43%)
16(37%)
5(11%)
1(2%)
1(2%)
2(5%)
2. The professor should have usedpower point less.
2(5%)
3(7%)
8(18%)
16(35%)
13(30%)
2(5%)
3. This course would have beenbetter had the professor not usedas many “fancy” features of powerpoint.
2(5%)
0(0%)
13(30%)
16(35%)
12(28%)
1(2%)
4. I would prefer that a professorwho uses power point to distributea handout-with each power pointslide on it-at the beginning of eachclass.
16(35%)
11(26%)
7(16%)
3(7%)
5(11%)
2(5%)
5. Given a choice I would take acourse that does not use powerpoint.
1(2%)
2(5%)
5(11%)
20(46%)
15(34%)
1(2%)
6. My knowledge of the coursematerial was retained longer afterthe course was completed, due tothe use of power point.
10(23%)
7(16%)
18(40%)
6(14%)
2(5%)
1(2%)
7. My interest in the course materialwas enhanced by the use of powerpoint.
9(21%)
24(55%)
5(11%)
4(9%)
1(2%)
1(2%)

THE MAKING OF AN INTERDISCIPLINARY MARKETING RESEARCH MASTER’SPROGRAM: COMPONENTS OF A COMPREHENSIVE PROPOSAL
Alan D. Smith, Department of Quantitative Science, Robert Morris College, Moon Township, PA 15108(412) 262-8496Dean A. Manna, Department of Marketing, Robert Morris College, Moon Township, PA 15108 (412) 262-8278William R. Rupp, Department of Management, Robert Morris College, Moon Township, PA 15108 (412)262-8458
ABSTRACT
Many colleges are competing for new students and dealing with cost containment; thus, program developmentwith interdisciplinary teams are now commonplace. The purpose of this special session is to document onesuch interdisciplinary effort from members of three different departments -- namely, Quantitative Sciences,Marketing, and Management -- to generate a comprehensive and acceptable proposal for a graduate programin marketing research. An interdisciplinary approach in marketing research is logical since it requires a soundcombination of computer literacy and quantitative decision-making tools with business and marketingeducation in the industrial and service sectors. Students attracted to a marketing research program prefer amore quantitative approach and computer-driven solution to highly complex as well as routine businessproblems that may require expertise outside more traditionally oriented marketing departments, especiallythose departments that cannot afford to have marketing research specialists on staff. An interdisciplinaryapproach is the way to go, especially on experimental program development. This session will concentrateon how three different departments collaborate on a 125-page marketing research program proposal thatutilizes the talents of several departments. During the session, individuals from the departments concernedwill outline the various components of the proposal -- namely: overview, rationale, technical skills needed,need analysis surveys from internal and external sources, objectives of the degree, program objectives,occupational outlook, proposed curriculum, advantages of the curriculum, implementation plans, and thenumerous attachments of the proposal, outline time frame, academic check sheets, survey instruments, andcourse sequencing that should be required in a comprehensive proposal. This session will illustrate the “how-to-do-it” steps in a marketing research proposal. In addition, a number of electronic copies of the proposalwill be available to the special session participants.
OBJECTIVES OF THE B.S.B.A. DEGREE MR PROGRAM
In terms of the proposed MR program leading to a B.S.B.A. at RMC, the program is business-based,marketing specific, quantitative-oriented, computer intensive, communication intensive, and supported bya solid foundation of liberal arts study. Further, the proposed MR program will enable the college to meetthe following published objectives:
1. To provide an effective undergraduate program in a business-related area that enables students to initiateand advance their careers.
2. To provide an academic environment that integrates liberal and professional learning, promotes theacquisition of both general and specialized knowledge, and helps students develop abilities and skills inproblem-solving and in generalizing , analyzing, and synthesizing knowledge.
3. To provide students with practical experience in business in order to enhance their studies in the majorthat they have selected.

OCCUPATIONAL OUTLOOK FOR MARKETING RESEARCH (MR) GRADUATES )
Upon a survey of occupational literature, both the private and public sectors of the U.S. economy providenumerous opportunities for employment and career advancement for graduates of the Marketing Research(MR) Program. Quantitative reasoning and computer literacy skills, combined with business education andcommunications skills acquired upon completion of an RMC B.S.B.A. degree in MR, should provide astudent with a competitive advantage over other business counterparts from general business disciplines. Forexample, the MMR (Master of Marketing Research) at the University of Georgia has had 100 percent internplacement. Ninety three percent of all program graduates are still in the field. Although the University ofGeorgia’s program is at the graduate level, many of the program’s features parallel the RMC’s proposedB.S.B.A. program in MR. As Dr. Bill Rupp, one author of this program and a recent graduate of the business Ph.D. program at the University of Georgia can attest, the MMR program is nationally noted as a leadingintegrated program of graduate education in the county. Obviously, if the MR B.S.B.A. program is approvedand successfully accepted in the business community, a graduate program in MR would be forthcoming.
There are several trends in the 1990's and beyond that would make a more technically-oriented marketingdegree favorable in today’s business climate. According to Kleiman (1992) in her book, The 100 Best Jobsfor the 1990's and Beyond, some of these tends are:
1. By the 21st Century, 90 percent of the 21 million jobs expected to be created will be in the service-producing sector of the economy. This is a dramatic shift that began in the 1970's away from the dominantrole that manufacturing jobs have played in the United States. Changes in the Pittsburgh SMSA in recentyears verify this trend. The proposed program in MR will take advantage of this trend by producinggraduates with skills to complete successfully in a service-oriented marketplace.
2. In an economy characterized by automation and high-tech, engineers, scientists, and mathematicians willbe professionals in heavy demand. A combination of the service education found in marketing with soughtafter mathematical and computer literacy skills found in the proposed MR program would be propitious.
3. A college degree or technical training credentials beyond high school will be a basic requirement for mostjobs with a future. “The service-producing sector of the economy will need workers who have specializedskills, are computer literate, intelligent, and good communications” (p.xv). Students with the MR educationenhanced by effective communications skills will produce a graduate with the above criteria for success infuture jobs.
4. Specialty niche occupations will in more demand and should provide employees with far greaterresponsibilities, including self-scheduling and management. This statement describes the overall goal of thisproposed MR program and others that have already been approved at RMC, such as the OperationsManagement/Decision Sciences (OM/DS) B.S,B.A. program and others currently under review such as theBSBA in Real Estate. The proposed MR program is another step in producing graduates who meet this need.
5. According to Kleiman (p.xv): American job seekers will be competing with workers from all over theworld to create the best goods and services in a global economy that will become more internationaleveryday. But the United States will suffer from a critical lack of skilled employees and will actively recruittrained workers from all over the world.
6. It is projected by the year 2000, three out of every four workers currently employed will need retrainingfor the new jobs of the next century. The training and learning experiences should provide these workers inthe job market a chance to gain the skills necessary to compete for these jobs. The MR program described
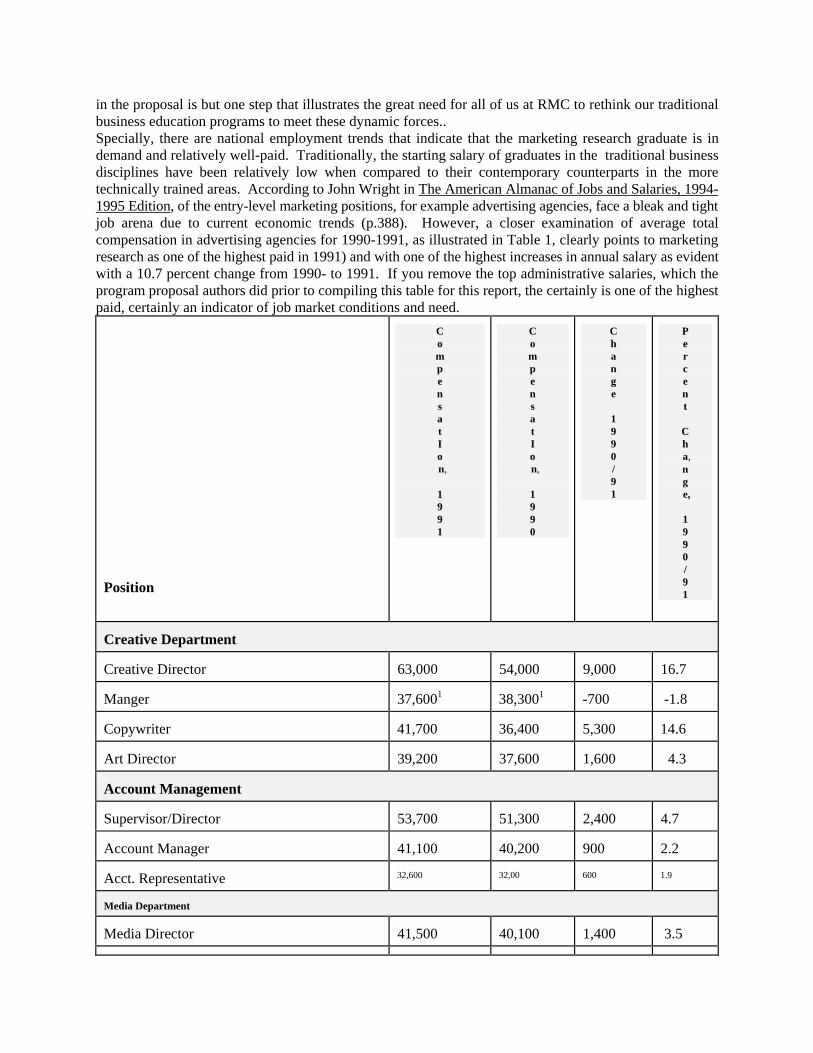
in the proposal is but one step that illustrates the great need for all of us at RMC to rethink our traditionalbusiness education programs to meet these dynamic forces..Specially, there are national employment trends that indicate that the marketing research graduate is indemand and relatively well-paid. Traditionally, the starting salary of graduates in the traditional businessdisciplines have been relatively low when compared to their contemporary counterparts in the moretechnically trained areas. According to John Wright in The American Almanac of Jobs and Salaries, 1994-1995 Edition, of the entry-level marketing positions, for example advertising agencies, face a bleak and tightjob arena due to current economic trends (p.388). However, a closer examination of average totalcompensation in advertising agencies for 1990-1991, as illustrated in Table 1, clearly points to marketingresearch as one of the highest paid in 1991) and with one of the highest increases in annual salary as evidentwith a 10.7 percent change from 1990- to 1991. If you remove the top administrative salaries, which theprogram proposal authors did prior to compiling this table for this report, the certainly is one of the highestpaid, certainly an indicator of job market conditions and need.
Position
CompensatIo
n,
1991
CompensatIo
n,
1990
Change
1990/91
Percent
Ch a,ng e,
1990/91
Creative Department
Creative Director 63,000 54,000 9,000 16.7
Manger 37,6001 38,3001 -700 -1.8
Copywriter 41,700 36,400 5,300 14.6
Art Director 39,200 37,600 1,600 4.3
Account Management
Supervisor/Director 53,700 51,300 2,400 4.7
Account Manager 41,100 40,200 900 2.2
Acct. Representative 32,600 32,00 600 1.9
Media Department
Media Director 41,500 40,100 1,400 3.5
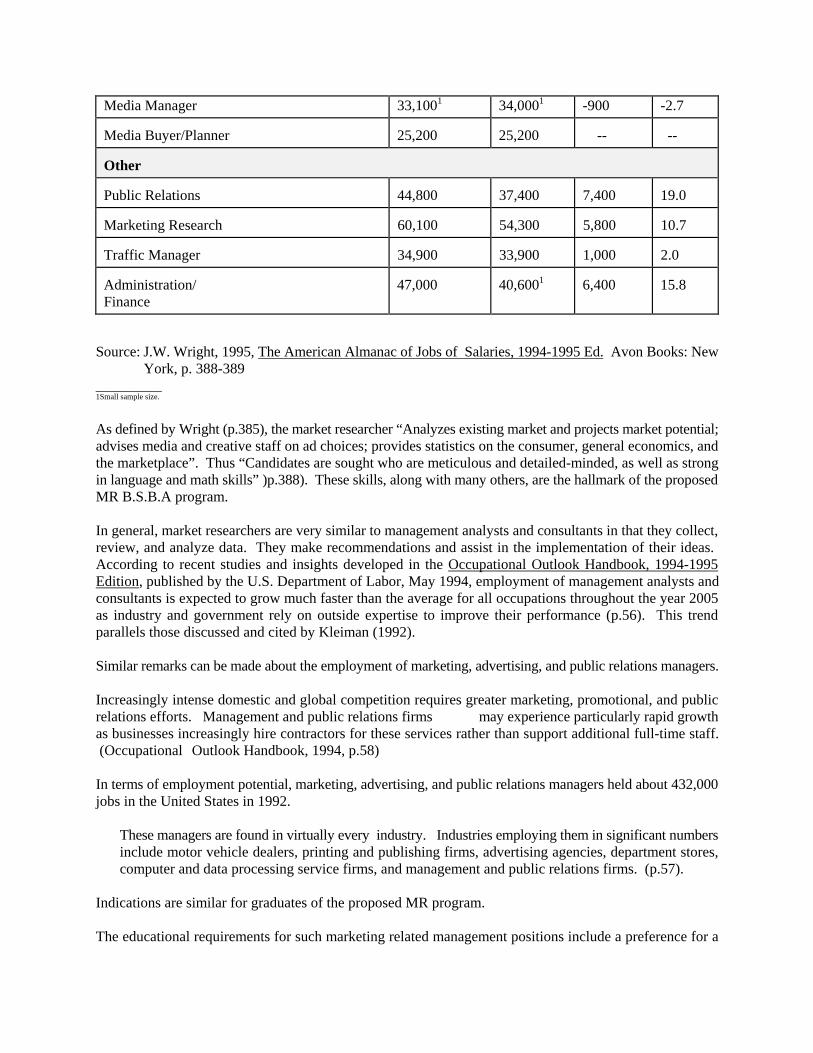
Media Manager 33,1001 34,0001 -900 -2.7
Media Buyer/Planner 25,200 25,200 -- --
Other
Public Relations 44,800 37,400 7,400 19.0
Marketing Research 60,100 54,300 5,800 10.7
Traffic Manager 34,900 33,900 1,000 2.0
Administration/Finance
47,000 40,6001 6,400 15.8
Source: J.W. Wright, 1995, The American Almanac of Jobs of Salaries, 1994-1995 Ed. Avon Books: NewYork, p. 388-389
_________1Small sample size.
As defined by Wright (p.385), the market researcher “Analyzes existing market and projects market potential;advises media and creative staff on ad choices; provides statistics on the consumer, general economics, andthe marketplace”. Thus “Candidates are sought who are meticulous and detailed-minded, as well as strongin language and math skills” )p.388). These skills, along with many others, are the hallmark of the proposedMR B.S.B.A program.
In general, market researchers are very similar to management analysts and consultants in that they collect,review, and analyze data. They make recommendations and assist in the implementation of their ideas. According to recent studies and insights developed in the Occupational Outlook Handbook, 1994-1995Edition, published by the U.S. Department of Labor, May 1994, employment of management analysts andconsultants is expected to grow much faster than the average for all occupations throughout the year 2005as industry and government rely on outside expertise to improve their performance (p.56). This trendparallels those discussed and cited by Kleiman (1992).
Similar remarks can be made about the employment of marketing, advertising, and public relations managers.
Increasingly intense domestic and global competition requires greater marketing, promotional, and publicrelations efforts. Management and public relations firms may experience particularly rapid growthas businesses increasingly hire contractors for these services rather than support additional full-time staff. (Occupational Outlook Handbook, 1994, p.58)
In terms of employment potential, marketing, advertising, and public relations managers held about 432,000jobs in the United States in 1992.
These managers are found in virtually every industry. Industries employing them in significant numbersinclude motor vehicle dealers, printing and publishing firms, advertising agencies, department stores,computer and data processing service firms, and management and public relations firms. (p.57).
Indications are similar for graduates of the proposed MR program.
The educational requirements for such marketing related management positions include a preference for a

bachelor’s or master’s degree in business administration with an emphasis in marketing. Courses that areparticularly sought include business law, economics, accounting, finance, mathematics, and statistics. (p.57). For advertising management positions, courses in consumer behavior, marketing research, sales,communications methods and technology, and visual arts are useful. (p.58)
Another interesting publication, The Jobs Rated Almanac reduced the filed of jobs to 250 of the most rapidlygrowing that “represent the wave of the future” (p.1). These jobs included many engineering and computerpositions, jobs in medical professions, technical, and sales positions. The editors extensively researched andrated these 250 jobs based on six criteria: work environment, security, stress, income, outlook, and physicaldemands. Interestingly, the editors ranked the jobs within their job cluster as well as cumulative scores forall 250 jobs. Much of the information used to provide the rankings came from government sources as wellas labor unions, trade associations, and management consulting firms. The market researcher was listedamong this group of jobs. Specially, in terms of physical demands, the ranking the marketing researcher received was 5 out of 250, witha basic working day of 9.1 hours.
Strong quantitative reasoning skills and general communication skills are required for students interested inentering the demanding market researcher profession. These skills are required to be developed in theproposed MR program at the B.S.B.A. level. This also illustrates that it is a very demanding occupation andrequires a thoughtful and well-planned curriculum.
Additional data is available upon request.

A COLLABORATIVE PROCESS FOR STUDENT ADVISING
Mary A. Flanigan, Longwood College, Farmville, VA 23909Sally W. Gilfillan, Longwood College, Farmville, VA 23909Cynthia N. Wood, Longwood College, Farmville, VA 23909Berkwood Farmer, Longwood College, Farmville, VA 23909
ABSTRACT
This paper describes the concept of a collaborative advising relationship in which both the student and thefaculty member have defined responsibilities. It further describes the results of two surveys administeredto the faculty and students of the Longwood College School of Business and Economics. The purposes ofthe surveys are to identify attitudes and opinions concerning the advising process and to serve as the basisfor ongoing assessment and improvement of the advising process.
INTRODUCTION
Longwood College is a medium-sized, public, comprehensive college in Virginia. In its mission thecollege describes itself as primarily a teaching institution providing an “environment in which exceptionalteaching fosters student learning, scholarship, and achievement.” The School of Business and Economics(SOBE) mission statement reiterates this position. Both the college and the SOBE believe that competentacademic advising is an integral element of effective teaching and thus essential to fulfill their missions.Therefore, the SOBE has targeted the advising process as a critical area for continuous improvement. Thecurrent advising process, therefore, is being examined to determine what constitutes effective advising.The intention is for this study to assist in the formulation of an advising process that will be continuouslyassessed and improved. A short term goal of this study is to determine if dissatisfaction with the currentadvising process within the SOBE has reached a level that mandates immediate change. A long term goalof this study is to achieve college-wide consensus that a critical component of “exceptional teaching” is acollaborative advising relationship between student and faculty.
Longwood has used the ACT senior surveys, as well as sample exit interviews, to assess student attitudesabout the advising process. While the results of these surveys have indicated that students were generallysatisfied with the advising process in the School of Business, anecdotal evidence and observations ofstudent behavior seemed to contradict, to some extent, the survey findings. Further, there was reason tobelieve that the faculty may not have been satisfied with the current process. Observed indications ofstudent dissatisfaction included an unacceptably high number of students requesting changes from theircurrent advisor to a new advisor and comments made to other students and faculty that indicated agrowing frustration with the process. Faculty members expressed concerns about the ability of studentsto register without prior advising, the particular advising needs of transfer and non-traditional students, aperceived disproportionate advising burden across the faculty, and the failure of students to acceptresponsibility in the advising process. Existing problems were further exacerbated by curriculum changesin recent years.
To address these concerns, several procedures have been implemented or are planned. First, the SOBEdefined the advising process as a collaboration between the student and faculty member. A facultycommittee has been charged to formulate a statement of advising goals and the respective responsibilities

of students and faculty. Second, a pilot sample of students was surveyed in the Fall, 1996. The objectiveof the survey was to identify students’ attitudes, concerns, and levels of satisfaction with their advisors.The survey contained Likert-scale evaluations of the advisor as well as open-ended questions for studentcomments. The results of the survey identified problem areas and indicated the need for a clarification ofthe respective roles and responsibilities of the student and faculty member in the advising process. Third,a survey of faculty attitudes and concerns was completed in August, 1997. One objective of this surveywas to assess if the attitudes of faculty and students coincided. The two survey instruments will bemodified based on the initial results and re-administered within the SOBE. Additionally, the otherschools within the college will be surveyed. Finally, a survey of other schools of business is planned toenable Longwood’s SOBE and participating institutions to benchmark its advising process against that ofother institutions. (Schools wishing to participate should contact the author. Participating schools willbe provided with the results for their institution and total results for all other schools for comparativepurposes.)
THE COLLABORATIVE ADVISING RELATIONSHIP
The collaborative advising relationship extends teaching and learning beyond the classroom. Forexample, advising can be designed to enhance students’ communication skills, to stress earlyidentification of academic problems, and to motivate students to achieve academically. In addition, aneffective relationship enables the advisor to: (1) help students learn to analyze problems and seeksolutions; (2) assist students in developing strategies to maximize their potential and mitigate weaknesses;(3) encourage students to analyze career issues and develop career plans; (4) encourage students to fullyutilize the academic and personal services available to them within the institution; and (5) encourage life-long learning.
A frequent faculty complaint is that students view the advising process as unilateral: one in whichstudents feel they bear no responsibility. However, a successful collaborative relationship imposesresponsibilities on both the student and the faculty member. The primary duties of the faculty memberinclude: (1) being reasonably available for consultation; (2) being knowledgeable about degreerequirements and course prerequisites; (3) clarifying student responsibilities in the advising process; (4)assisting the student in planning an efficient academic career and regularly monitoring implementation ofthe plan; (5) identifying academic problems; and (6) being knowledgeable of college resources andwilling to refer students appropriately.
In the collaborative process, the student must accept the responsibility to: (1) know the requirements fortheir degree; (2) consider and plan courses of study for the immediate upcoming semester and for theremaining academic career; (3) seek out career information and opportunities; (4) understand collegeGPA requirements and consequences for academic standing; and (5) identify their weaknesses and seeksolutions.
THE STUDENT SURVEY
In the Fall of 1996, a pilot study was conducted to assess student satisfaction with advising within theSOBE. A survey instrument containing 14 questions was administered to 175 students. All studentssurveyed acknowledged that they had met with their advisor at least once during the academic year, andninety-five percent (95%) said they were very satisfied with the amount of contact with their advisor.However, eight percent (8%) felt the advisor was not generally available when help was needed. Onlyfifty percent (50%) felt enough time was consistently allowed for advising meetings, while thirty-twopercent (32%) felt sometimes there was sufficient time. Sixteen percent (16%) did not feel they hadsufficient time to discuss concerns or problems in meetings.

When asked to assess the advising atmosphere, students were less supportive of faculty attitudes: sixty-eight percent (68%) felt their advisors definitely liked to advise, fourteen percent (14%) felt the advisor“somewhat” liked to advise, eight percent (8%) were undecided, and ten percent (10%) felt their advisordid not like to advise. Eighty-two percent (82%) reported that the advisor provided a supportiveatmosphere, ten percent (10%) responded “somewhat supportive”, and eight percent (8%) felt theadvising atmosphere was not supportive. However, only four percent (4%) did not agree that theiradvisor was interested in them as an individual.
The survey asked if the students felt they were given correct information about courses and degreerequirements. Eighty percent (80%) responded “yes, generally”, nineteen percent (19%) answered“sometimes” and one percent (1%) said “no.” Only sixty-seven percent (67%) thought their advisor wasfamiliar with their academic records, twenty-one percent (21%) felt the advisor was “somewhat” familiar,seven percent (7%) were undecided, and five percent (5%) believed their advisor was unfamiliar withtheir academic record.
While some faculty contend that students do not take a sufficiently active role in planning their courseschedules, only forty-seven percent (47%) of the students reported being encouraged to take a “veryactive” role in the advising process, sixteen percent (16%) answered “somewhat active” role, twenty-fivepercent (25%) were undecided, and twelve percent (12%) felt they were not at all encouraged to partakein the planning process.
As a final question students were asked to give an overall assessment of the effectiveness of their advisor.Seventy-five percent (75%) felt their advisor was very effective, fifteen percent (15%) somewhateffective, three percent (3%) undecided, and ten percent (10%) did not feel the advisor was effective.This ten percent level of dissatisfaction was deemed to be unacceptable and was a primary impetus for thefaculty survey.
THE FACULTY SURVEY
The purpose of the faculty survey was to identify the attitudes of the faculty and elicit opinions on whatconstitutes effective advising. The survey consisted of four sections: (1) elements of effective advising;(2) experiences with advisees; (3) evaluation of the current advising process; and (4) self-evaluation as anadvisor. In the first three sections, faculty were asked to respond on five-point Likert scales, while thequestions in the last section were multiple choice. Included in the survey were questions that addressedthe six primary duties of faculty members in a collaborative advising process described in the sectionabove.
Ninety-five percent (95%) of the faculty felt they were generally available for advising, with theremaining five percent (5%) stating they were sometimes available. No faculty member responded thatthey were not available. Likewise ninety-five percent (95%) stated that information concerning theprocess for making an advising appointment was clearly stated and readily available to students. Whenquestioned about office hours, only fourteen percent (14%) felt that they should hold office hours devotedexclusively to advising, but over forty percent (40%) felt that faculty should maintain more than six officehours per week.
Ninety percent (90%) of the faculty agreed with the statements that students should assume responsibilityfor (1) understanding and complying with catalog requirements and (2) planning courses and activities forthe next semester. Eighty-one percent (81%) agreed that students should assume responsibility forplanning their four year curriculum. Only slightly more than half (57%) felt that students should be

required to meet with faculty each semester prior to registration. Yet seventy-six percent (76%) agreedthat they should assist students in selecting alternatives when courses close during registration.
Ninety-five percent (95%) of the faculty felt that they should discuss career plans with advisees early intheir academic careers and two-thirds responded that these discussions should occur frequently. Ninetypercent (90%) felt that they always allowed sufficient time during advising meetings to discuss academicconcerns or problems. An additional ten percent (10%) stated “sometimes” sufficient time was allottedfor these discussions. Although only fifty-seven percent (57%) felt that students should be required tomeet with the advisor to discuss academic difficulties and plan to correct them, ninety percent (90%)stated they encouraged students to discuss such problems during advising sessions. All facultyacknowledged that they referred students to other sources when they were unable to provide neededassistance.
CONCLUSION
Although the student and faculty surveys were not intended to evaluate the advising process per se, theresults did indicate problems that require immediate attention. First, it appears that faculty and studentsdo not have the same perceptions of their respective responsibilities. Second, ten percent of the studentsresponded that their advisor does not like to advise and that the advisor is not effective. Lastly, it appearsthat a small portion of both the student and faculty do not consider advising an integral part of ameaningful learning experience.
To address these concerns in both the long and short term, several procedures have been implemented orare planned. First, the SOBE defined the advising process as a collaboration between the student andfaculty member. The goals of the process and the responsibilities of both the student and faculty memberare being formulated. The SOBE must now undertake an education program for students and faculty thatcommunicates these roles in the collaborative advising process. One proposed suggestion is that duringthe first advising meeting, a “contract” be signed by both the advisor and the student that clearly definesexpectations for both parties.
Second, the ten percent level of student dissatisfaction with the advising process is unacceptably high.The student survey instrument will be modified based on the results of the pilot study and re-administeredto the entire student body of the SOBE. The revised version of the survey will contain more precisequestions in hopes of identifying the specific reasons for this dissatisfaction. Analysis of the results ofthis second survey will provide major input in determining the steps that must be taken to increase theoverall level of student satisfaction with the advising process.
A revised version of the faculty survey will be administered to SOBE faculty. The results of this surveywill be used in concert with the student results to formulate an overall program to improve advising.Since the missions of the SOBE and Longwood College both emphasize the critical importance ofadvising to effective teaching, the survey instruments will be made available to the other schools withinthe college to institute similar programs. It is hoped that this process will produce a college-widedialogue leading to a consensual definition of what constitutes effective advising and will result in theacceptance of the collaborative advising relationship across campus. Within the SOBE it is hoped thatthis consensual definition will become the foundation of an advising process that enhances studentlearning, scholarship, and achievement. Continuous efforts must be undertaken to assess attitudes and tocreate within the SOBE a culture in which the critical importance of the advising process in the overallacademic experience is an accepted and supported concept.
LONGITUDINAL STUDY OF BUSINESS LAW SECTION OF THE UNIFORM CPA EXAM
John P. Geary, Dept. of Finance, Insurance & Real Estate, Appalachian State Univ., Boone, NC 28608Dinesh S. Dave, Center for Business Research, Appalachian State University, Boone, NC 28608
ABSTRACT
The purpose of the Uniform CPA examination is to measure the technical competence of CPA candidates. The American Institute of Certified Public Accountants (AICPA) designs and administers the exam. Business Law is one of four topics tested on the exam which candidates must successfully completebefore receiving certification to practice in their respective jurisdictions. According to the AICPA, theobjective of the Business Law examination is to test the candidates knowledge of legal problems inherentin business transactions and the accounting and auditing implications of such problems. This paperanalyzes the subject matter content of the 1970-1993 Business Law section of the CPA exam. Therelative strength of each subject area is determined for each Business law section of the exam. Additionally, this time period is subdivided into three units to reflect changes in the exam mandated bythe AICPA in their Content Specification Outlines.
INTRODUCTION
The Uniform Certified Public Accountant (CPA) exam measures the technical competence of CPAcandidates. The Board of Examiners of the American Institute of Certified Public Accountants (AICPA)uses this examination as the primary means of certifying an accountants proficiency in four designatedareas. The exam is administered in May and November of each year in fifty four jurisdictions [8]. Business Law is one of four topics which must be passed by all CPA candidates prior to licenser by theirrespective jurisdictions. According to the AICPA [3], ...the objective of the Business Law examination isto test the candidates knowledge of legal problems inherent in business transactions and the accountingand auditing implications of such problems.
Most of the prospective candidates for the CPA exam are exposed to one or more Business Law courses[6]. Because of variations in curriculum and requirements, students receive inconsistent exposure to legalsubject areas. In 1983, the AICPA adopted content specifications for the CPA exam. The specificationsfor the Business Law section are quite specific and indicate [4] ...the approximate percentage of the totaltest score devoted to each area. These content specifications were revised in 1986 to reflect moreaccurately the areas that CPAs encounter in everyday practice [5]. The 1986 revisions were in effect until1993.
Jentz [7] conducted a ten-year review of the Business Law section of the CPA exam for the years 1957 to1966 and reported scope and methods of coverage (e.g., multiple choice or essay) by topic area. Laken[8] used the findings of the Jentz study as the basis for a discussion of procedures used in preparing andgrading the exam, without undertaking any original analysis. Blackburn [8] refined the approach used byJentz, and in the first comprehensive study in this area, reported the relative strength of each topic interms of point value for the 1970-1979 decade. The present study analyzes the content of the 1970-1993Business Law section of the CPA exam. The content remained relatively constant with some minorsubject matter deletions that occurred during this time period. Subject areas are classified using theAICPA s subject list and content specification outlines. The relative strength of each subject isdetermined for each exam.
RESEARCH METHODOLOGY
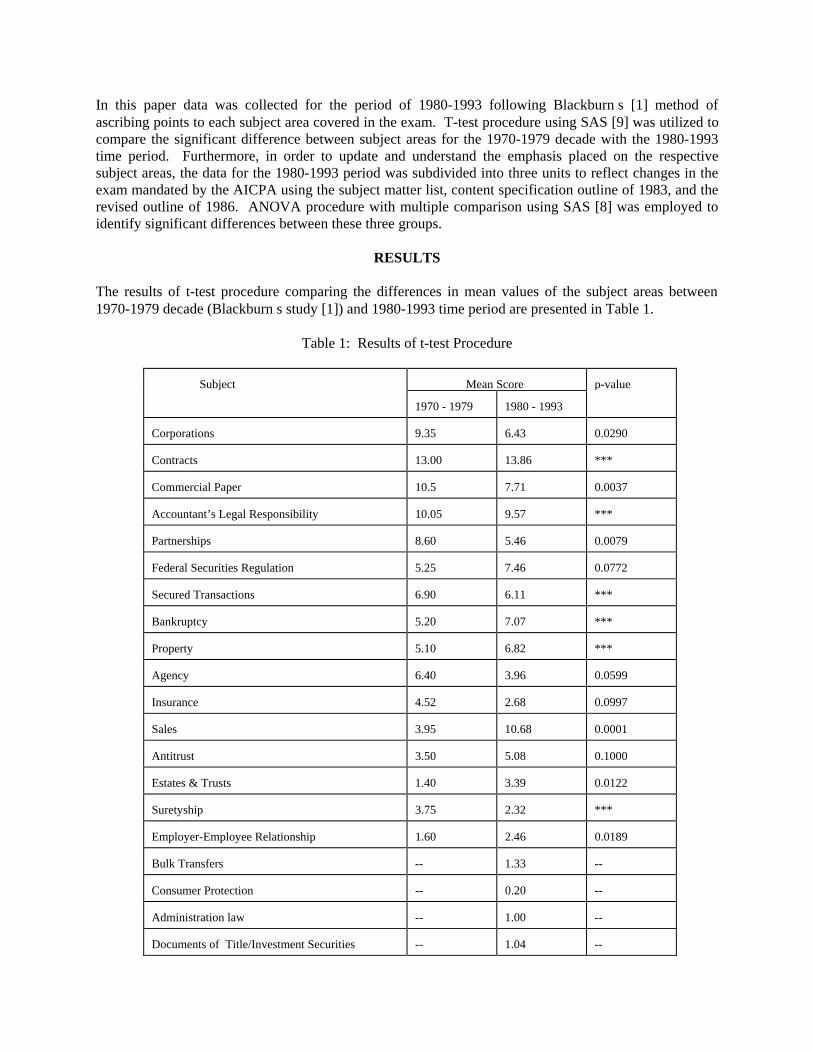
In this paper data was collected for the period of 1980-1993 following Blackburns [1] method ofascribing points to each subject area covered in the exam. T-test procedure using SAS [9] was utilized tocompare the significant difference between subject areas for the 1970-1979 decade with the 1980-1993time period. Furthermore, in order to update and understand the emphasis placed on the respectivesubject areas, the data for the 1980-1993 period was subdivided into three units to reflect changes in theexam mandated by the AICPA using the subject matter list, content specification outline of 1983, and therevised outline of 1986. ANOVA procedure with multiple comparison using SAS [8] was employed toidentify significant differences between these three groups.
RESULTS
The results of t-test procedure comparing the differences in mean values of the subject areas between1970-1979 decade (Blackburns study [1]) and 1980-1993 time period are presented in Table 1.
Table 1: Results of t-test Procedure
Subject Mean Score p-value
1970 - 1979 1980 - 1993
Corporations 9.35 6.43 0.0290
Contracts 13.00 13.86 ***
Commercial Paper 10.5 7.71 0.0037
Accountant’s Legal Responsibility 10.05 9.57 ***
Partnerships 8.60 5.46 0.0079
Federal Securities Regulation 5.25 7.46 0.0772
Secured Transactions 6.90 6.11 ***
Bankruptcy 5.20 7.07 ***
Property 5.10 6.82 ***
Agency 6.40 3.96 0.0599
Insurance 4.52 2.68 0.0997
Sales 3.95 10.68 0.0001
Antitrust 3.50 5.08 0.1000
Estates & Trusts 1.40 3.39 0.0122
Suretyship 3.75 2.32 ***
Employer-Employee Relationship 1.60 2.46 0.0189
Bulk Transfers -- 1.33 --
Consumer Protection -- 0.20 --
Administration law -- 1.00 --
Documents of Title/Investment Securities -- 1.04 --

A***@ = No significant difference observed at 90% level. A--@ = Subject was not available
The review of Table 1 indicates that the mean score decreased for the following subject areas:Corporations, Commercial Paper, Partnerships, Agency, and Insurance. However, there was a significantincrease in the mean score of Federal Securities Regulation (SEC), Law of Sales, Antitrust, Estates andTrusts, and Employer-Employee Relationship. Interestingly, Contracts, Accountants LegalResponsibility, Secured Transactions, Bankruptcy, Property, and Suretyship did not show a significantdifference. Please note that the areas of Bulk Transfers, Consumer Protection, and Administrative Lawwere deleted from the exam in May 1986. Note that Documents of Title/Investment Securities weretested only in the 1980-1993 time period.
Statistical analysis was further performed on the data during 1980-1993 time period. Three groups: May1980 to May 1983 time period (N1), November 1983 to November 1985 time period (N2), and May 1986to November 1993 time period (N3) were compared using ANOVA procedure with comparison. Thesethree groups represent revisions of the exam by the AICPA. The results of this analysis are presented inTable 2.
Table 2Results of ANOVA with Multiple Comparison
Subject p-value or (Pr > F)** Differences in Groups Mean Score Points
Contracts 0.0249 N1 - N2 N1 = 12.00
N2 = 16.00
Bankruptcy 0.0001 N1 - N3N2 - N3
N1 = 4.43
N2 = 5.40
N3 = 8.75
Insurance 0.0773 N1 - N2 N1 = 4.29
N2 = 0.80
Sales 0.0213 N1 - N3 N1 = 7.86
N3 = 12.06
Suretyship 0.0006 N1 - N2N1 - N3
N1 = 4.43
N2 = 2.20
N3 = 1.44
** = Ho: Group means are equal v/s Ha: At least one of is not equal
N1 = May 1980 to May 1983 Time Period. N2 = Nov. 1983 to Nov. 1985 Time PeriodN3 = May 1986 to Nov. 1993 Time Period
The ANOVA procedure identified the subject areas of Contracts, Bankruptcy, Insurance, Sales, andSuretyship to be statistically significant at the 90% level. Furthermore, the multiple comparison testindicated that the mean score for Contracts increased from N1 to N2. Bankruptcy increased from N1 toN3 and also increased from N2 to N3. The treatment of Insurance decreased from N1 to N2. Salesmarkedly increased from N1 to N3. Finally, Suretyship decreased from N1 to N2 and N1 to N3.
CONCLUSIONS
This paper discusses the emphasis placed on different legal subject areas by the AICPA on the CPAexam. The findings suggest that the exam reflects the increasing importance of public law andconsequently decreased emphasis on private law with the exception of the Law of Sales. This is notsurprising since public law includes government regulation and federal statutes that affect not only theaccounting profession but also individual clients of accountants and accounting firms. The increasedemphasis on Sales indicates that most contracts today deal with the sale of goods or merchandise whichis covered by Article II of the Uniform Commercial Code, not land or services which are the subjectmatter of traditional contracts.
REFERENCES
[1] Blackburn, John, Ten-Year Review of the CPA Law Examination Revisited, American BusinessLaw Association Journal, Fall 1980, pp. 391-398.
[2] Board of Examiners of the American Institute of Certified Public Accountants, Exposure Draft:proposed Changes in the Uniform CPA Examination, American Institute of CertifiedAccountants, Inc., New York, 1987.
[3] Board of Examiners of the American Institute of Certified Public Accountants, Information forCPA Candidates, American Institute of Certified Accountants, Inc., New York, 1978.
[4] Board of Examiners of the American Institute of Certified Public Accountants, ContentSpecification Outlines for the Uniform Certified Public Accountant Examination, AmericanInstitute of Certified Accountants, Inc., New York, 1981.
[5] Board of Examiners of the American Institute of Certified Public Accountants, Revised ContentSpecification Outlines for the Uniform Certified Public Accountant Examination, AmericanInstitute of Certified Accountants, Inc., New York, 1984.
[6] Henkel, Jan The Uniform CPA Examination -- Factors in Achieving Success in the BusinessLaw Section, American Business Law Journal, Vol. 14, Winter 1977, pp. 371-391.
[7] Jentz, Gaylord, Ten Year Review of the CPA Law Examination, The Accounting Review, April1967, pp. 362-365.
[8] Lakin, Leonard, An Analysis of the Business Law Examination Part of the Uniform CPAExamination, American Business Law Association Journal, Winter 1971, pp. 65-72.
[9] SAS/STAT Users Guide, Version 6, Fourth Edition, SAS Institute, Cary, NC.

AN ASSESSMENT OF THE QUALITY OF COLLEGE GRADUATES: A SURVEY OFBUSINESS EMPLOYERS
T. Hillman Willis, Louisiana Tech University, P. O. Box 10318, T.S., Ruston, LA 71272Albert J. Taylor, Austin Peay State University, P. O. Box 4426, Clarksville, TN 37044
Lawrence E. Baggett, Austin Peay State University, P. O. Box 4415, Clarksville, TN 37044
ABSTRACT
This paper presents the results of a survey of how company employers rate the quality of recent collegegraduates. The results indicate that many employers perceive a difference in the quality of universitiesbased on the work related abilities of former students. The ability to perform certain job skills and anoverall assessment of quality are also measured.
INTRODUCTION
Quality concerns have spread from manufacturing and service businesses to the public sector. Thisincludes federal, state, and local tax-supported educational systems. An increasing number of institutionsof higher education are adopting total quality management (TQM) to better serve their broad spectrum ofcustomers. An annual survey of the number of colleges and universities that use TQM conducted byQuality Progress [4][15], has shown an increase from 78 institutions in 1991 to 216 in 1996. Eventhough TQM “usage” can be interpreted as anything from “implementing quality practices inadministration” to offering TQM courses in various disciplines, the results reflect an expanding awarenessof the desire, if not necessity, to improve the quality of the educational process. But, it is important todifferentiate between the institutions that claim to be for quality and those that do quality.
The purpose of this study is to look at the quality issue from the perspective of one of the most importantcustomers of the university -- the business firms that hire its graduates. First, the role of TQM in highereducation is discussed. This is followed by an assessment of the skills that businesses desire in new hiresand the ability of universities to fulfill those needs. Finally the results of a survey of businessorganizations that routinely employ graduates of four-year colleges is presented. The survey was taken todetermine: (1) how companies measure the quality of graduates, (2) whether or not they are able toidentify the institutions that consistently produce superior or inferior employee candidates, (3) how wellskill requirements match skill preparedness, and (4) the overall quality of recent college graduates? Inother words, do companies that hire college graduates perceive a difference in the quality of colleges anduniversities? If the answer is yes, the implications for colleges and universities are significant.
ROLE OF TQM IN HIGHER EDUCATION
The ideal manifestation of TQM is the continual pursuit of perfection in every aspect of operation. Inrecent years, there have been increased efforts to bring TQM to academia and make academics moreaccountable for the quality of their products [11]. Students are both the end product and the customerwhich creates a unique dilemma for the educational server. Many experts feel that U.S. educationalinstitutions cater too much to customer (student)-satisfaction and should be more demanding in teaching adiscipline rigor [14].
Customer satisfaction is the central goal of TQM. Institutions of higher learning serve a wide assortmentof customers, e.g., alumni, faculty, taxpayers, benefactors, governing boards, administrators, students,
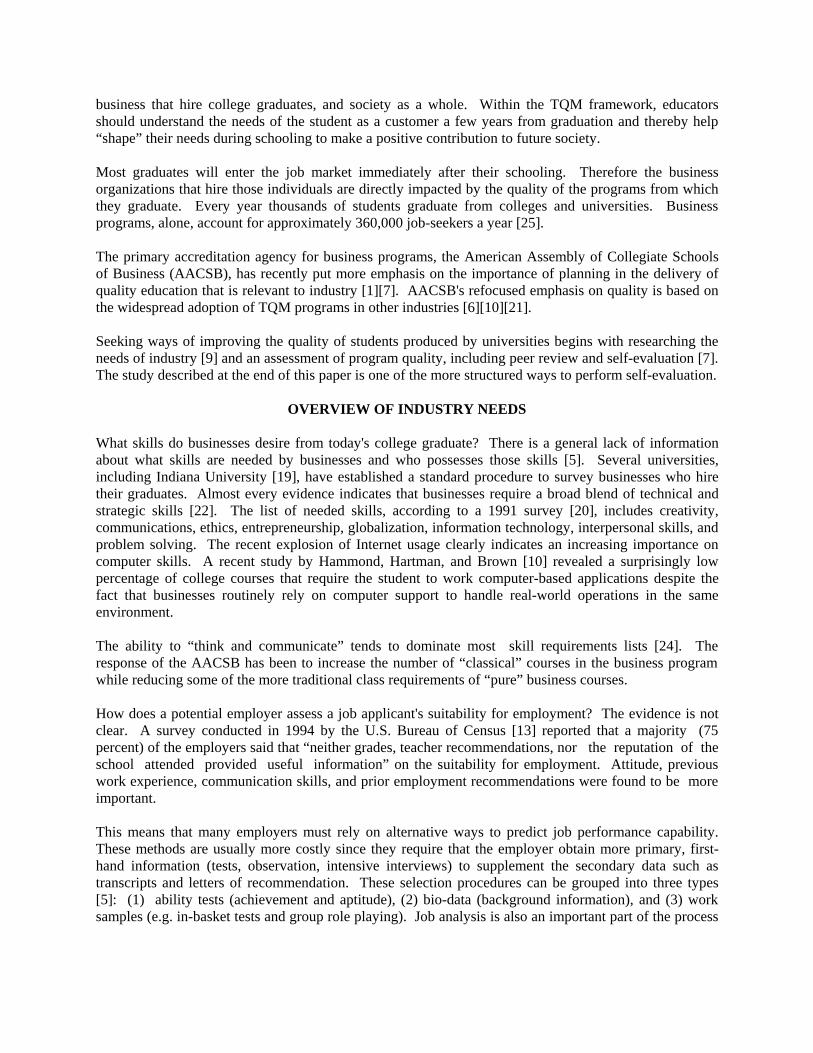
business that hire college graduates, and society as a whole. Within the TQM framework, educatorsshould understand the needs of the student as a customer a few years from graduation and thereby help“shape” their needs during schooling to make a positive contribution to future society.
Most graduates will enter the job market immediately after their schooling. Therefore the businessorganizations that hire those individuals are directly impacted by the quality of the programs from whichthey graduate. Every year thousands of students graduate from colleges and universities. Businessprograms, alone, account for approximately 360,000 job-seekers a year [25].
The primary accreditation agency for business programs, the American Assembly of Collegiate Schoolsof Business (AACSB), has recently put more emphasis on the importance of planning in the delivery ofquality education that is relevant to industry [1][7]. AACSB's refocused emphasis on quality is based onthe widespread adoption of TQM programs in other industries [6][10][21].
Seeking ways of improving the quality of students produced by universities begins with researching theneeds of industry [9] and an assessment of program quality, including peer review and self-evaluation [7].The study described at the end of this paper is one of the more structured ways to perform self-evaluation.
OVERVIEW OF INDUSTRY NEEDS
What skills do businesses desire from today's college graduate? There is a general lack of informationabout what skills are needed by businesses and who possesses those skills [5]. Several universities,including Indiana University [19], have established a standard procedure to survey businesses who hiretheir graduates. Almost every evidence indicates that businesses require a broad blend of technical andstrategic skills [22]. The list of needed skills, according to a 1991 survey [20], includes creativity,communications, ethics, entrepreneurship, globalization, information technology, interpersonal skills, andproblem solving. The recent explosion of Internet usage clearly indicates an increasing importance oncomputer skills. A recent study by Hammond, Hartman, and Brown [10] revealed a surprisingly lowpercentage of college courses that require the student to work computer-based applications despite thefact that businesses routinely rely on computer support to handle real-world operations in the sameenvironment.
The ability to “think and communicate” tends to dominate most skill requirements lists [24]. Theresponse of the AACSB has been to increase the number of “classical” courses in the business programwhile reducing some of the more traditional class requirements of “pure” business courses.
How does a potential employer assess a job applicant's suitability for employment? The evidence is notclear. A survey conducted in 1994 by the U.S. Bureau of Census [13] reported that a majority (75percent) of the employers said that “neither grades, teacher recommendations, nor the reputation of theschool attended provided useful information” on the suitability for employment. Attitude, previouswork experience, communication skills, and prior employment recommendations were found to be moreimportant.
This means that many employers must rely on alternative ways to predict job performance capability.These methods are usually more costly since they require that the employer obtain more primary, first-hand information (tests, observation, intensive interviews) to supplement the secondary data such astranscripts and letters of recommendation. These selection procedures can be grouped into three types[5]: (1) ability tests (achievement and aptitude), (2) bio-data (background information), and (3) worksamples (e.g. in-basket tests and group role playing). Job analysis is also an important part of the process

since laws require that hiring be based on the knowledge, skills, and abilities that the job positionrequires.
UNIVERSITIES' RESPONSE TO INDUSTRY NEEDS
Many critics contend that higher education falls short in meeting the job force requirements of industry[18]. Therefore, from a quality standpoint, one of higher education's more important customers could bebetter served. Colleges and universities have been criticized for several shortcomings. A major criticismis that business schools put too much emphasis on analytical problem solving without regard to thepractical implications of managerial actions and decisions. Livingston [16] explains that schools require a“respondent behavior” for the student to get high grades on exams. However, success in businessrequires an “operant behavior” to find problems and opportunities, initiate action, and follow-up toobtain the desired results. An example of this anomaly is that the university grading system does notpromote team work nor does the business curriculum teach team work, one of the important skills mostbusinesses require [12]. The program structure encourages competition instead of cooperation.Academic institutions tend to become creatures of habit and are slow to change, making it difficult toconnect with the social and environmental challenges of the real world [17][2].
Businesses complain that college graduates tend to have unrealistic expectations about organizational life,job responsibility, and pay [3][12][18]. Businesses have also been critical of the lack of curriculumbreadth and teaching quality. Maybe an even more important criticism is that too many colleges anduniversities have shifted from teaching students how to think, to teaching what to think. Teaching theskills of logical analysis and systematic use of evidence so that students are able to examine ideascritically with factual information has been replaced by emotional interpretation constructs that are notbased on reality [23]. As a result, college graduates who enter the job market may have unrealisticexpectations about the level of performance required by industry. Specifically, businesses complain thattoo many students put their personal career before the goals of the organization [12].
Richard Cosier, former dean of the School of Business at Indiana University [12] says that schoolsshould continually seek feedback from corporate friends to know how to adjust academic programs tomeet changing job market requirements. Schools need to create a niche that exploits a unique strength toachieve a regional, if not a national, reputation. This type of focusing is fundamental to every qualitymanagement program. Some of the better-known examples of highly regarded business programreputations include the following universities [17]: University of South Carolina - international business,Michigan State University - manufacturing strategy, University of Tennessee - TQM, University ofSouthern California - entrepreneurship, and Indiana University - leadership and team building.
SURVEY METHODOLOGY AND RESULTS
An empirical study was undertaken to assess the opinion of business firms concerning the quality ofcollege graduates. Several questions pertained to the issue of whether colleges and universitiesadequately prepare their graduates with the job skills businesses require for success in today's competitiveenvironment. Four specific areas of inquiry included: (1) What procedures do businesses use to evaluateemployee performance?, (2) Can businesses detect a difference in the quality of graduates from variousinstitutions of higher learning?, (3) Are colleges and universities adequately providing graduates with theskills businesses desire?, and (4) How do businesses rate the quality of today's college graduate?
A survey was administered to a target population of businesses in the southeast and southwest regions ofthe U.S. Ninety-eight (98) usable questionnaires were returned. Firms representing a wide range of sizeswere included in the study. The survey included an international engineering consulting firm, a major
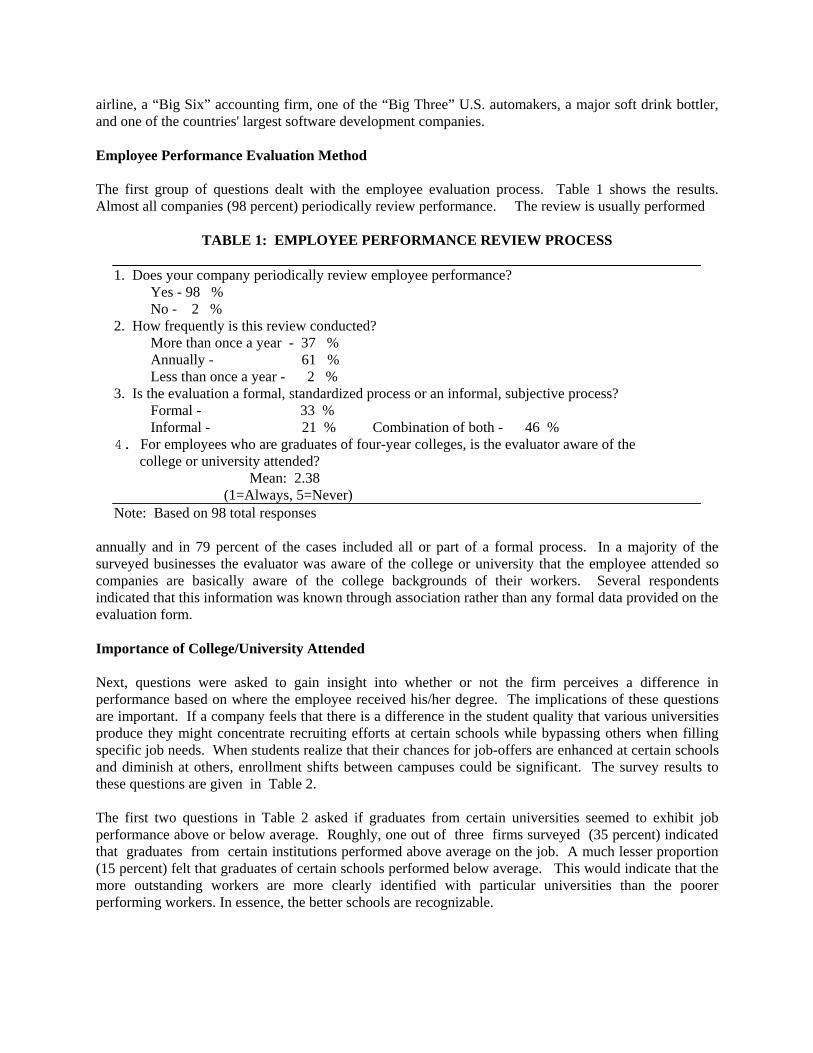
airline, a “Big Six” accounting firm, one of the “Big Three” U.S. automakers, a major soft drink bottler,and one of the countries' largest software development companies.
Employee Performance Evaluation Method
The first group of questions dealt with the employee evaluation process. Table 1 shows the results.Almost all companies (98 percent) periodically review performance. The review is usually performed
TABLE 1: EMPLOYEE PERFORMANCE REVIEW PROCESS
1. Does your company periodically review employee performance? Yes - 98 % No - 2 %2. How frequently is this review conducted? More than once a year - 37 % Annually - 61 % Less than once a year - 2 %3. Is the evaluation a formal, standardized process or an informal, subjective process? Formal - 33 % Informal - 21 % Combination of both - 46 %4. For employees who are graduates of four-year colleges, is the evaluator aware of the college or university attended? Mean: 2.38 (1=Always, 5=Never)Note: Based on 98 total responses
annually and in 79 percent of the cases included all or part of a formal process. In a majority of thesurveyed businesses the evaluator was aware of the college or university that the employee attended socompanies are basically aware of the college backgrounds of their workers. Several respondentsindicated that this information was known through association rather than any formal data provided on theevaluation form.
Importance of College/University Attended
Next, questions were asked to gain insight into whether or not the firm perceives a difference inperformance based on where the employee received his/her degree. The implications of these questionsare important. If a company feels that there is a difference in the student quality that various universitiesproduce they might concentrate recruiting efforts at certain schools while bypassing others when fillingspecific job needs. When students realize that their chances for job-offers are enhanced at certain schoolsand diminish at others, enrollment shifts between campuses could be significant. The survey results tothese questions are given in Table 2.
The first two questions in Table 2 asked if graduates from certain universities seemed to exhibit jobperformance above or below average. Roughly, one out of three firms surveyed (35 percent) indicatedthat graduates from certain institutions performed above average on the job. A much lesser proportion(15 percent) felt that graduates of certain schools performed below average. This would indicate that themore outstanding workers are more clearly identified with particular universities than the poorerperforming workers. In essence, the better schools are recognizable.
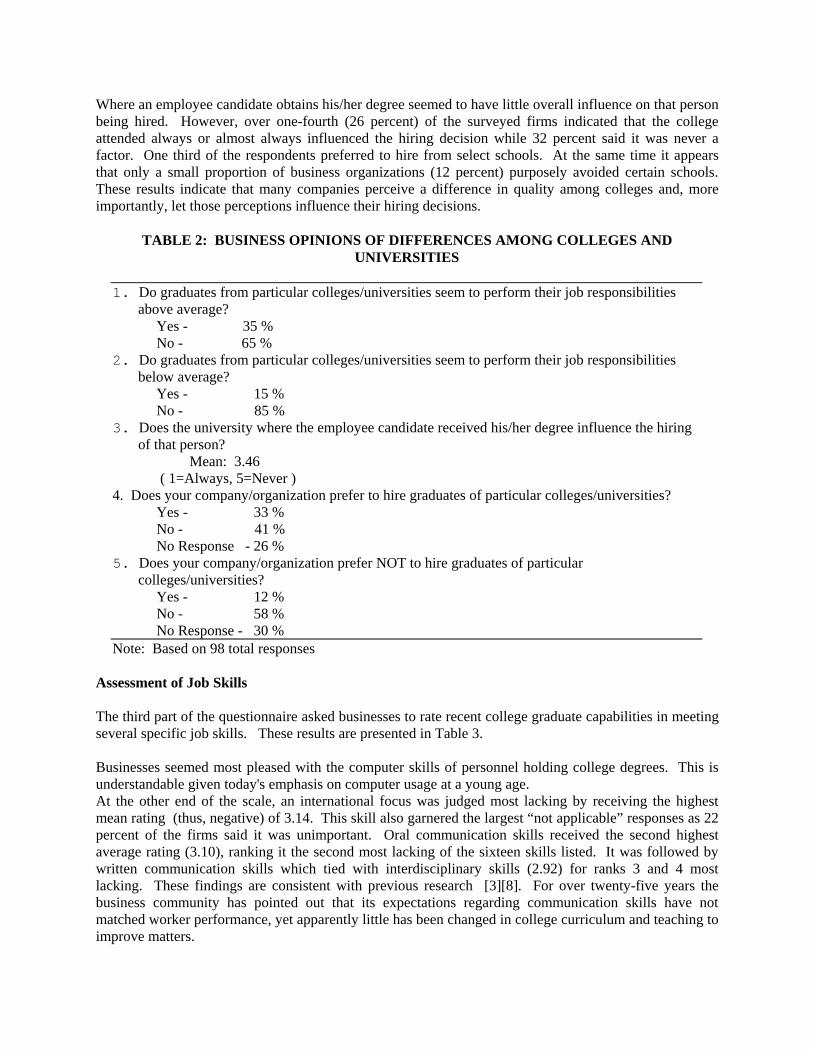
Where an employee candidate obtains his/her degree seemed to have little overall influence on that personbeing hired. However, over one-fourth (26 percent) of the surveyed firms indicated that the collegeattended always or almost always influenced the hiring decision while 32 percent said it was never afactor. One third of the respondents preferred to hire from select schools. At the same time it appearsthat only a small proportion of business organizations (12 percent) purposely avoided certain schools.These results indicate that many companies perceive a difference in quality among colleges and, moreimportantly, let those perceptions influence their hiring decisions.
TABLE 2: BUSINESS OPINIONS OF DIFFERENCES AMONG COLLEGES ANDUNIVERSITIES
1. Do graduates from particular colleges/universities seem to perform their job responsibilities above average? Yes - 35 % No - 65 %2. Do graduates from particular colleges/universities seem to perform their job responsibilities below average? Yes - 15 % No - 85 %3. Does the university where the employee candidate received his/her degree influence the hiring of that person? Mean: 3.46 ( 1=Always, 5=Never )4. Does your company/organization prefer to hire graduates of particular colleges/universities? Yes - 33 % No - 41 % No Response - 26 %5. Does your company/organization prefer NOT to hire graduates of particular colleges/universities? Yes - 12 % No - 58 % No Response - 30 %Note: Based on 98 total responses
Assessment of Job Skills
The third part of the questionnaire asked businesses to rate recent college graduate capabilities in meetingseveral specific job skills. These results are presented in Table 3.
Businesses seemed most pleased with the computer skills of personnel holding college degrees. This isunderstandable given today's emphasis on computer usage at a young age.At the other end of the scale, an international focus was judged most lacking by receiving the highestmean rating (thus, negative) of 3.14. This skill also garnered the largest “not applicable” responses as 22percent of the firms said it was unimportant. Oral communication skills received the second highestaverage rating (3.10), ranking it the second most lacking of the sixteen skills listed. It was followed bywritten communication skills which tied with interdisciplinary skills (2.92) for ranks 3 and 4 mostlacking. These findings are consistent with previous research [3][8]. For over twenty-five years thebusiness community has pointed out that its expectations regarding communication skills have notmatched worker performance, yet apparently little has been changed in college curriculum and teaching toimprove matters.
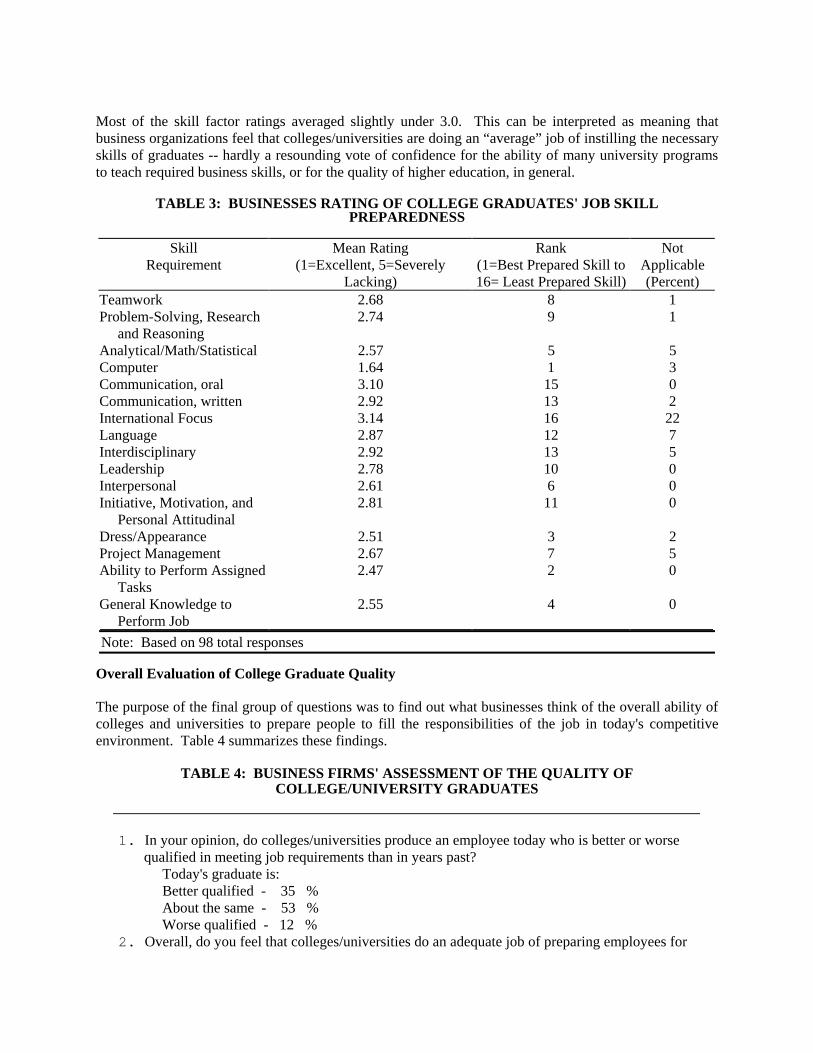
Most of the skill factor ratings averaged slightly under 3.0. This can be interpreted as meaning thatbusiness organizations feel that colleges/universities are doing an “average” job of instilling the necessaryskills of graduates -- hardly a resounding vote of confidence for the ability of many university programsto teach required business skills, or for the quality of higher education, in general.
TABLE 3: BUSINESSES RATING OF COLLEGE GRADUATES' JOB SKILLPREPAREDNESS
SkillRequirement
Mean Rating(1=Excellent, 5=Severely
Lacking)
Rank(1=Best Prepared Skill to16= Least Prepared Skill)
NotApplicable(Percent)
Teamwork 2.68 8 1Problem-Solving, Research and Reasoning
2.74 9 1
Analytical/Math/Statistical 2.57 5 5Computer 1.64 1 3Communication, oral 3.10 15 0Communication, written 2.92 13 2International Focus 3.14 16 22Language 2.87 12 7Interdisciplinary 2.92 13 5Leadership 2.78 10 0Interpersonal 2.61 6 0Initiative, Motivation, and Personal Attitudinal
2.81 11 0
Dress/Appearance 2.51 3 2Project Management 2.67 7 5Ability to Perform Assigned Tasks
2.47 2 0
General Knowledge to Perform Job
2.55 4 0
Note: Based on 98 total responses
Overall Evaluation of College Graduate Quality
The purpose of the final group of questions was to find out what businesses think of the overall ability ofcolleges and universities to prepare people to fill the responsibilities of the job in today's competitiveenvironment. Table 4 summarizes these findings.
TABLE 4: BUSINESS FIRMS' ASSESSMENT OF THE QUALITY OFCOLLEGE/UNIVERSITY GRADUATES
1. In your opinion, do colleges/universities produce an employee today who is better or worse qualified in meeting job requirements than in years past? Today's graduate is: Better qualified - 35 % About the same - 53 % Worse qualified - 12 %2. Overall, do you feel that colleges/universities do an adequate job of preparing employees for
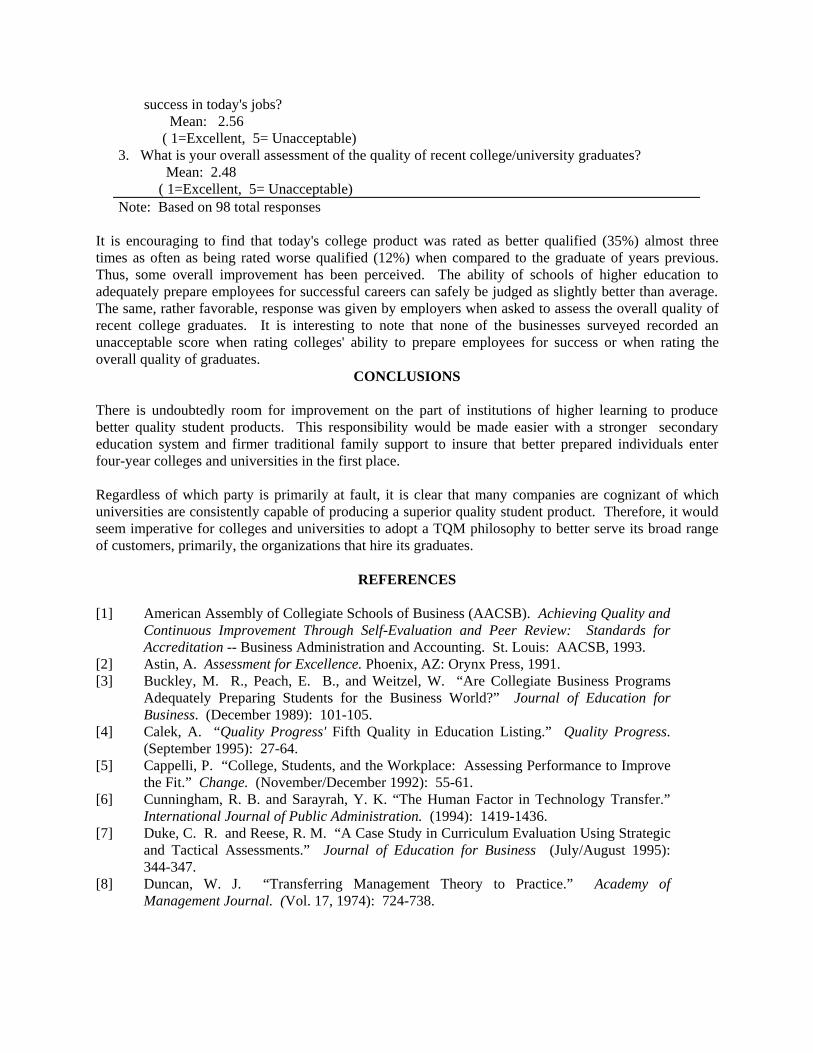
success in today's jobs? Mean: 2.56 ( 1=Excellent, 5= Unacceptable)3. What is your overall assessment of the quality of recent college/university graduates? Mean: 2.48 ( 1=Excellent, 5= Unacceptable)Note: Based on 98 total responses
It is encouraging to find that today's college product was rated as better qualified (35%) almost threetimes as often as being rated worse qualified (12%) when compared to the graduate of years previous.Thus, some overall improvement has been perceived. The ability of schools of higher education toadequately prepare employees for successful careers can safely be judged as slightly better than average.The same, rather favorable, response was given by employers when asked to assess the overall quality ofrecent college graduates. It is interesting to note that none of the businesses surveyed recorded anunacceptable score when rating colleges' ability to prepare employees for success or when rating theoverall quality of graduates.
CONCLUSIONS
There is undoubtedly room for improvement on the part of institutions of higher learning to producebetter quality student products. This responsibility would be made easier with a stronger secondaryeducation system and firmer traditional family support to insure that better prepared individuals enterfour-year colleges and universities in the first place.
Regardless of which party is primarily at fault, it is clear that many companies are cognizant of whichuniversities are consistently capable of producing a superior quality student product. Therefore, it wouldseem imperative for colleges and universities to adopt a TQM philosophy to better serve its broad rangeof customers, primarily, the organizations that hire its graduates.
REFERENCES
[1] American Assembly of Collegiate Schools of Business (AACSB). Achieving Quality andContinuous Improvement Through Self-Evaluation and Peer Review: Standards forAccreditation -- Business Administration and Accounting. St. Louis: AACSB, 1993.
[2] Astin, A. Assessment for Excellence. Phoenix, AZ: Orynx Press, 1991.[3] Buckley, M. R., Peach, E. B., and Weitzel, W. “Are Collegiate Business Programs
Adequately Preparing Students for the Business World?” Journal of Education forBusiness. (December 1989): 101-105.
[4] Calek, A. “Quality Progress' Fifth Quality in Education Listing.” Quality Progress.(September 1995): 27-64.
[5] Cappelli, P. “College, Students, and the Workplace: Assessing Performance to Improvethe Fit.” Change. (November/December 1992): 55-61.
[6] Cunningham, R. B. and Sarayrah, Y. K. “The Human Factor in Technology Transfer.”International Journal of Public Administration. (1994): 1419-1436.
[7] Duke, C. R. and Reese, R. M. “A Case Study in Curriculum Evaluation Using Strategicand Tactical Assessments.” Journal of Education for Business (July/August 1995):344-347.
[8] Duncan, W. J. “Transferring Management Theory to Practice.” Academy ofManagement Journal. (Vol. 17, 1974): 724-738.

[9] Gomes, R., Pickett, G. M., and Duke, C. R.. “Broadening the Marketing Curriculum withHigh Technology: An Academic Response to World Class Industrial Evolution.”Journal of Marketing Education. (Vol. 14, No. 3, 1992): 15-22.
[10] Hammond, D. H., Hartman, S. J. and Brown, R. A. “The Match Between UndergraduateAcademic Instruction and Actual Field Practices in Production/Operations Management.”Journal of Education for Business. (May/June 1996): 263-266.
[11] Higgins, R. C., and Johnson, M. L. “Total Quality Enhances Education of U.S. ArmyEngineers.” National Productivity Review. (Vol. 11, No. 1, 1992): 41-49.
[12] Hotch, R. “This Is Not Your Father's MBA.” Nation's Business. (February 1992): 51-52.
[13] Institute for Research on Higher Education at the University of Pennsylvania. “Weighingthe Benefits: Incentives for Connecting Schools and Employers.” Change. (March/April1996): 63-66.
[14] Keller, G. “Increasing Quality on Campus: What Should Colleges Do About the TQMMania.” Change. ( Vol. 24, No. 3, 1992): 48-51.
[15] Klaus, L. A. “Quality Progress' Sixth Quality in Education Listing.” Quality Progress.(August 1996): 29-69.
[16] Livingston, J. S. “Myth of the Well-Educated Manager.” Harvard Business Review.(Vol. 49, 1973): 79-88.
[17] McNeil, J. D. Designing and Improving Courses and Curricula in Higher Education.San Francisco, CA: Jossey-Bass, 1990.
[18] Parry, L. E., Rutherford, L., and Merrier, P. A.. “Too Little, Too Late: Are BusinessSchools Falling Behind the Times?” Journal of Education for Business. (May/June1996): 293-299.
[19] Rau, J. “A Business School Seeks Customer Opinions.” HR Focus. (February 1995): 8-10.
[20] Schmidt, S. “Marketing Alumni Perspectives on the Educational Challenges for the1990s.” Marketing Education Review. (Vol. 1, No. 2, 1991): 24-33.
[21] Seymour, D. T. “TQM Campus: What the Pioneers are Finding.” American Associationfor Higher Education Bulletin. (Vol. 44, No. 3, 1991): 10-13.
[22] Sheridan, J. H. “Manufacturing Gets a Boost.” Industry Week. (November 1, 1993): 43.
[23] Sowell, T. “Cult Education Ridiculous Idea.” The News-Star. Monroe, LA; (April 3,1997): 15A.
[24] Subcommittee on Technology and Competitiveness. “Quality in Education. ReportTransmitted to the Committee on Science, Space, and Technology.” U.S. House ofRepresentatives. 102nd Congress (1992): 13.
[25] U.S. Department of Education. Digest of Education Statistics (Office of Education andImprovement). Washington, DC : U.S. Department of Education, 1994.
WHAT TRAITS ARE EMPLOYERS LOOKING FOR IN BUSINESS GRADUATES?
Albert L. Harris, Department of Information Technology & Operations ManagementJacqueline M. Harris, Department of Mathematical Sciences
Appalachian State University, Boone, NC 28608
ABSTRACT
This paper presents the results and findings from an introductory study of those traits of business collegegraduates that employers consider most important. Twenty personal and skill traits were rated by 45people who had hired business graduates. The results indicate what traits were highly valued withincompanies that hire college graduates.
INTRODUCTION
There is always some debate in colleges and universities about the personal skills and traits of newlygraduating business majors and which skills are more desired by recruiters. However, the reality is thatonce a student graduates, he or she needs to be able to find a job. Employers recruit entry-level businessgraduates to find employees that will fill a need. More often than not, it is the “soft” skills that actuallylands a job for a graduate. Employers recruit graduates that will fit into their organizational culture. If thestudent has the skills desired by the organization and the “cultural fit” then they are considered for theposition. If they do not have the skills, then they usually are not considered for the position.
Colleges and universities are continually revising their curricula to keep up with what they believe are theneeds of potential employers. Specifically, skills like oral communications, written communications, andproblem solving have been decried for years. Does the variety and range of curricula that students areexperiencing effectively prepare them for the job market?
This paper is an initial effort to look at the job market from the employers’ viewpoint and try to determinewhat soft or non-major skills employers are seeking in the candidates for entry-level positions in theircompany. It is believed that this study will provide one look at the job market for business graduates andcan provide college and university business faculty with some insight into qualities that they shouldnurture in their students.
METHODOLOGY
The basic methodology for this study was to administer a questionnaire to managers from company thatrecruited business students from Appalachian State University soliciting the relative importance of aseries of skills, abilities, or competencies. Managers were asked to rate the importance of each skill totheir organization using a four point scale - Not Important; Somewhat Important; Important; and VeryImportant.
The questionnaire was administered in two ways. First, each company that sent a recruiter to campus tointerview college graduates in the Spring 1997 was asked to complete the survey. A mail survey was alsoused. Survey questionnaires were sent to graduates of the Appalachian State University College ofBusiness. Graduates were asked to give the survey to their direct supervisor, who was asked to fill it outand mail it directly to the College.

The skills, abilities, and competencies were taken from an analysis of traits generally desired by collegegraduates. The list was reviewed by members of the College of Business Advisory Council. The traitswere meant to be skills, abilities, and competencies that were required by all business graduates,therefore, specific skills and competencies required by any major were not listed or examined. The skills,abilities, and competencies examined in this study are shown in Exhibit 1.
It was recognized that there would be some limitations to using data from on-campus recruiters. First, thesample is not random. Because the sample included a wide variety of organizations and industriesrecruiting business students of all majors, they should be somewhat representative of the industry’s needsfor college graduates. Second, the sample does not necessarily reflect the job market in any onediscipline or section of the country. They do represent overall desires of recruiters and employers thathire Appalachian State University graduates. Each educational institution must be aware of the skills andeducational needs of their graduates and of the needs of the recruiters that recruit their graduates.
RESULTS
The results of the survey show some interesting preferences by recruiters and employers of recent collegegraduates. As far as number of responses that listed a trait as “Very Important,” three distinctive tiersappeared. Traits that fell in the first tier included teamwork (127), reliability (125), persistence (125), andhonesty (124). They were all closely bunched at the top. The second tier included listening (112), oralcommunication (111), decision making (103) and problem analysis (102). The third tier includedleadership (78), written communications (69), applied computer skills (64), presentation (60), andunderstanding technology (59). Average scores showed the same tiers, but the order in the first tier wassomewhat different. The number of responses that listed a trait as “Very Important” and the average andstandard deviation (StdDev) for each of the 20 traits measured are presented in Exhibit 1.
Additional analysis is being performed on the data and will be available for the proceedings and for thepaper presentation at the conference.
CONCLUSIONS
Several conclusions can be made from the results of this study regarding the skills, abilities, andcompetencies that are desired by employers for college graduates. First, managers believe interpersonaland ethical traits are very important in today’s business world. Teamwork, persistence, honesty andreliability were the four highest rated traits, based on both the number of times rated “Very Important”and the average response. Recruiters and managers seem to be emphasizing interpersonal and ethicaltraits highest. The placement of teamwork as the trait with the most “Very Important” responses seems toemphasize the trends toward teams and the need for workers to interact and function in a team setting.Businesses and managers are placing a premium on traditional values - honesty, reliability and persistence- in the business workplace. This might suggest that recruiters and managers believe college graduates aremoving away from these personal traits and this is there way of telling colleges and universities toemphasize them more.
The next tier of responses consisted of listening, oral communications, problem analysis and decisionmaking. These traits seem to center around verbal communications and problem solving, two criticalskills in today’s business world.Surprisingly, the bottom tier contained (from the lowest) knowledge about global cultural differences,global business awareness, multimedia presentation, and technical writing. It is known that many of thebusiness that responded have global operations. For that reason, it is surprising that global awareness was
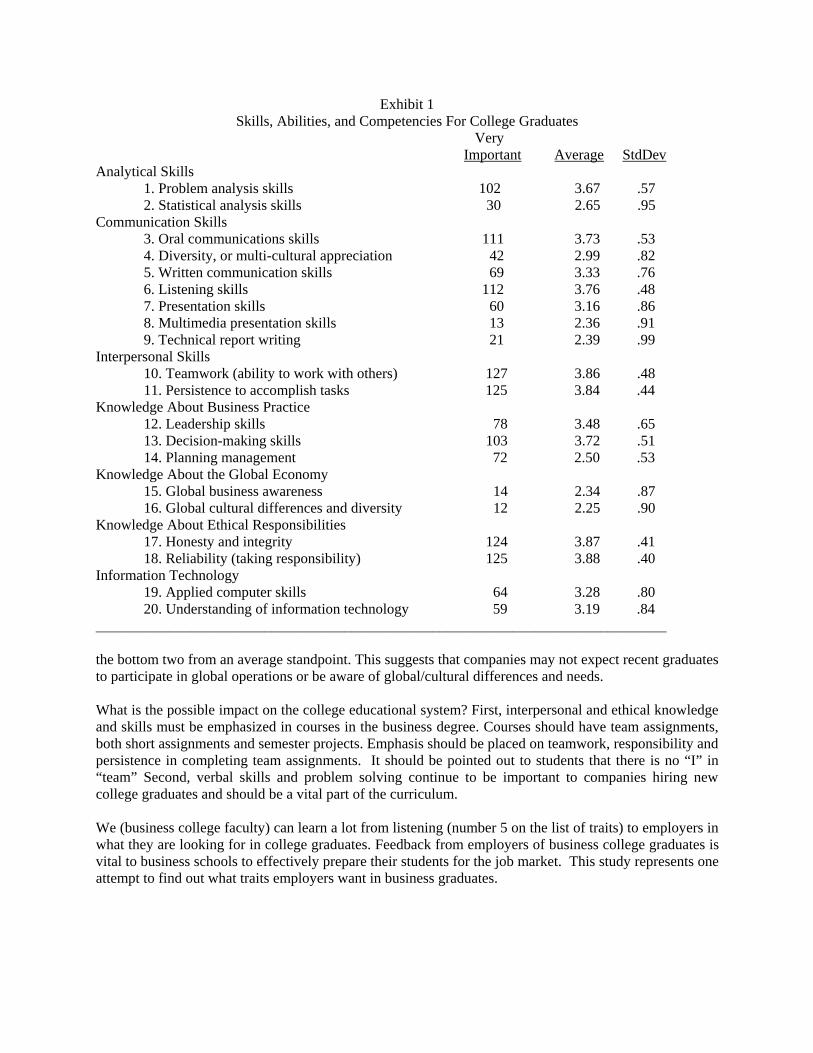
Exhibit 1Skills, Abilities, and Competencies For College Graduates
Very Important Average StdDev
Analytical Skills1. Problem analysis skills 102 3.67 .572. Statistical analysis skills 30 2.65 .95
Communication Skills3. Oral communications skills 111 3.73 .534. Diversity, or multi-cultural appreciation 42 2.99 .825. Written communication skills 69 3.33 .766. Listening skills 112 3.76 .487. Presentation skills 60 3.16 .868. Multimedia presentation skills 13 2.36 .919. Technical report writing 21 2.39 .99
Interpersonal Skills10. Teamwork (ability to work with others) 127 3.86 .4811. Persistence to accomplish tasks 125 3.84 .44
Knowledge About Business Practice12. Leadership skills 78 3.48 .6513. Decision-making skills 103 3.72 .5114. Planning management 72 2.50 .53
Knowledge About the Global Economy15. Global business awareness 14 2.34 .8716. Global cultural differences and diversity 12 2.25 .90
Knowledge About Ethical Responsibilities17. Honesty and integrity 124 3.87 .4118. Reliability (taking responsibility) 125 3.88 .40
Information Technology19. Applied computer skills 64 3.28 .8020. Understanding of information technology 59 3.19 .84
______________________________________________________________________________
the bottom two from an average standpoint. This suggests that companies may not expect recent graduatesto participate in global operations or be aware of global/cultural differences and needs.
What is the possible impact on the college educational system? First, interpersonal and ethical knowledgeand skills must be emphasized in courses in the business degree. Courses should have team assignments,both short assignments and semester projects. Emphasis should be placed on teamwork, responsibility andpersistence in completing team assignments. It should be pointed out to students that there is no “I” in“team” Second, verbal skills and problem solving continue to be important to companies hiring newcollege graduates and should be a vital part of the curriculum.
We (business college faculty) can learn a lot from listening (number 5 on the list of traits) to employers inwhat they are looking for in college graduates. Feedback from employers of business college graduates isvital to business schools to effectively prepare their students for the job market. This study represents oneattempt to find out what traits employers want in business graduates.

THE STUDENT EVALUATION OF TEACHING PROCESS REVISITED
Richard J. Stapleton, Dept of Mgt, Georgia Southern University, PO Box 8152, Statesboro, GA 30460-8152Barbara Price, Dept of Mgt, Georgia Southern University, PO Box 8152, Statesboro, GA 30460-8152Cindy Randall, Dept of Mgt, Georgia Southern University, PO Box 8152, Statesboro, GA 30460-8152Gene Murkison, Dept of Mgt, Georgia Southern University, PO Box 8152, Statesboro, GA 30460-8152
Student evaluations have become a permanent part of the faculty evaluation process in most college anduniversity systems. For many years, institutions had ignored such methods of feedback, believing that the valueof higher education was self evident and did not have to be measured or verified. [3] Now, as legislatorsstruggle to support these institutions and as parents struggle to afford higher education for their children,universities are being forced to prove that they are in fact educating students. In an effort to quantify the valueof faculty as well as to assess learning outcomes, student evaluation forms are being administered world-wide.By 1977, 90 percent of all U.S. campuses used student evaluations (SREB, 1977).
In general, research studies have shown that student evaluations are statistically valid, which means theymeasure what the instruments are designed to measure. In an exhaustive review of 41 validity studies of studentevaluations, Cohen [2] concluded the overall correlation between instructor ratings and student achievement was.43 and the overall correlation between course ratings and student achievement was .47. As Cohen pointed outthere is a problem defining teaching effectiveness, but generally it entails facilitating student achievement, i.e.,learning.
STUDENT EVALUATION VALIDITY RESEARCH
Marsh [5], after analyzing student evaluation data collected at UCLA in over 20,000 courses using 500,000student evaluation forms, reported positive factor analysis correlations among teaching/learning categories suchas learning/value of the course, enthusiasm of the teacher, organization, group interaction, individual rapport,breadth of coverage, and exams/grading. All were significantly positively correlated except workload/difficulty.
In the Marsh [5] study, one of the most comprehensive ever conducted to determine whether student evaluationsare valid, workload/difficulty, which included the number of hours spent studying for the course outside ofclass, was not significantly positively correlated with anything except breadth of coverage. The correlationcoefficient between workload/difficulty and perceived learning was .06, and the correlations betweenworkload/difficulty and enthusiasm, organization, group interaction, and individual rapport were .02, -.05, -.05,and .08 respectively, all insignificant. On the other hand, there were significant correlations among enthusiasm,organization, group interaction, and individual rapport.
GRADE EXPECTATIONS
In a study involving a data base of 200,000 students and 8,551 courses at Kansas State University using theIDEA questionnaire, there was a substantial correlation between student satisfaction with the instructor and/orcourse, and expected grades [4]. The authors concluded that superior instructing can lead to more learning,which, if exams were fair, should lead to higher grades. Brown [1], based on a 1973 study of 30,000 ratingforms and 2,360 courses at the University of Connecticut, found what he called an extremely significant .35correlation between grades and ratings of the instructor.
Marsh [6] studied several variables, such as reason for taking the course, learning/overall value, organization,
workload/difficulty, group interaction, teacher rank (such as assistant or full professor), prior interest in thesubject, and expected grades, to determine how these variables might affect instructor and course ratings. Hefound that only expected grades might be a source of bias. Prior subject interest, workload/ difficulty, andexpected grades were found to be the most significant predictors of learning/value, group interaction, andoverall course rating. Full professors were found to produce broader coverage, better assignments, but poorerquality of group interaction.
STUDENT EVALUATION IN THIS BUSINESS SCHOOL
During the last 27 years, the student evaluation process in the management department at the authors’ universityhas taken many twists and turns. Several processes, forms, and procedures have been used.
In 1970 there was no student evaluation process. Student evaluation forms were first administered in 1974,resulting in a list ranking the instructing excellence. In 1976 various departments created and administered theirown forms, including questions thought to be discipline appropriate. In the mid-1980's the managementdepartment added a peer rating to the process as well as questions to the student evaluation form asking studentsto estimate how many hours per week they spent studying for the course and how much the students thoughtthey had learned. These questions were stricken from the form in the early 1990's when a common form wasadopted college-wide. The committee in charge of drafting questions chose not to include student work andlearning questions, and the business faculty voted to adopt this form. It was used until the fall of 1996, at whichtime the university decided to administer 8 standard questions throughout all colleges, with permission grantedto each department to add questions.
DEPARTMENTAL STUDENT EVALUATION RESEARCH
There have been concerns voiced in this department and elsewhere on biasing influences on student evaluations,i.e., grades, difficulty of the material, amount of work required. These concerns have produced three paperspublished by department members [8]; [7]; [9]. Pickett [8], using management department student evaluationdata, found no significant correlation between grades assigned by instructors and their student evaluations.Murkison [7] using departmental data also found no significant correlation between grades and studentevaluations.
Murkison was also concerned about the influence of student work loads on student evaluations. He found someinstructors who required much outside study were rated highly while some others who did not were also ratedhighly. On the other hand, Murkison concluded that outside study loads were negatively correlated with studentevaluations when the course was composed of many students who were initially misinformed about the quantityof work required.
Stapleton and Stapleton [9] reported on student evaluation data for one professor of the department and learningeffectiveness data gathered by forms administered individually by the same professor. This study showed thisprofessor since 1994 had been ranked relatively low on student evaluation forms but was rated highly by thesame students when asked how much they had studied and learned in his courses, using student work andlearning questions. This study also included data showing this professor had been rated highly in terms of studyand learning production in a study spanning 15 years.
At the urging of the senior author of this paper, the management department again added student work andlearning questions to the management department form in the fall of 1996. A copy is available upon request.The first 8 questions on the form were used campus-wide, and the remaining 7 were adopted by the managementdepartment. The management faculty voted to include the student work and learning questions for research

purposes only. In addition, an alternative procedure was employed to analyze evaluation data.
RESEARCH QUESTIONS
The goal of this project was to either confirm or deny strong opinions of the researchers and other members ofthe department concerning the relationships between student opinion of a professor and factors such as workloadand perceived learning. As noted earlier, the eight campus-wide questions were designed to measure studentopinion on the quality of the professor’s performance in each course he/she “instructs.” The factors used todefine quality include ability to motivate the students to do their best work, level of enthusiasm for the subjectmatter, ability to convey material clearly, fairness in evaluation, and preparedness for class; however, theopinion measure considered by most to be the summarizing component is Question 1. That is, “Overall theinstructor is an excellent teacher.” The authors decided to use the student responses to Question 1 as themeasure of instructor quality.
The questions added by the management faculty at the request of the authors were designed to measure factorssuch as course workload requirements, student grade expectations, and perceived learning. Many facultybelieve that if they require a lot of work from their students relative to other courses and if they are rigorousevaluators of student work, their student evaluations will be low. In an attempt to substantiate these beliefs, thefollowing hypotheses were developed:
The responses to Question 1: Overall, the instructor is an excellent teacher and Question 12: On average, thenumber of hours studied per week outside of class for this course were
1. less than 1 hour 2. 1-3 hours 3. 4-6 hours 4. 7-9 hours 5. 10 or more hours
are positively correlated. That is, the more strongly the students agree that the instructor is excellent, thelower the amount of time studied outside of class.
The responses to Question 1: Overall, the instructor is an excellent teacher and Question 13: Compared toother courses I have taken at Georgia Southern University, in this course I have learned:
1. much more 2. more 3. no more or less 4. less 5. much less
are positively correlated. The more strongly students agree that the instructor is excellent, the more likely thestudents are to feel that they learned much more in the class relative to other courses taken at the university.
The responses to Question 1: Overall, the instructor is an excellent teacher and Question 14: Given my effortsin this course, the grade I expect to receive may not be the same as I think I deserve. It will be
1. much lower 2. lower 3. the same 4. higher 5. much higher
are negatively correlated. The more strongly students agree that the instructor is excellent, the less likely thestudents are to be receiving a grade that is less than what they feel is deserved.
The responses to Question 12: On average, the number of hours studied per week outside of class for thiscourse were
1. less than 1 hour 2. 1-3 hours 3. 4-6 hours 4. 7-9 hours 5. 10 or more hoursand Question 13: Compared to other courses I have taken at Georgia Southern University, in this course I

have learned:
1. much more 2. more 3. no more or less 4. less 5. much less
are negatively correlated. The more hours spent engaged in course related work outside of class lead studentsto believe that more learning had taken place.
METHODOLOGY
The faculty of the department were asked to participate in this study during the fall quarter of 1996. Theyagreed to the inclusion of questions 9 through 15 with the responses to be analyzed for research purposes only.Data were collected for all courses taught by faculty within the department during the fall, winter, and springquarters. At the time this paper was drafted, only the fall quarter data had been analyzed.
Clearly the responses are ordinal data. The researchers calculated the relative frequency of each response, themedian, and the mean for each question by faculty member and for the entire department. The analysis preparedfor each faculty member included a summary of the results for the department, theindividual’s results, agraphical comparison of the relative frequency results for the faculty member versus the department, and a chi-square goodness-of-fit analysis for each of the 15 questions. In addition, each faculty member received a typedreport of all student comments. It should be noted that the evaluations were administered at the beginning ofeach class during the last few weeks of the quarter. No faculty member administered his/her own evaluationprocess; rather another faculty member or a graduate assistant or staff person conducted the process. It wasobserved that students wrote many more comments with the evaluations conducted at the beginning of the class.
To address the research questions, SPSS was employed to calculate the correlation matrix for the means andmedians of the first 14 questions. Since the same relationships were observed using medians and means, themedians were eliminated from further study.
RESULTS
As was expected, all of the factors measured with questions 2-8 are strongly, positively correlated with question1. It is interesting to note the ordering of the questions from highest to lowest positive correlation with theexcellent factor.
The instructor presents course material clearly and effectively. (0.8587 - significant at the 0.01 level)
The instructor motivates me to do my best work. (0.8558 - significant at the 0.01 level)
I would recommend this instructor to a friend. (0.8416 - significant at the 0.01 level)
The instructor showed genuine concern for the students. (0.6996 - significant at the 0.01 level)
The instructor is enthusiastic about the subject matter. (0.6128 - significant at the 0.01 level)
The instructor seems well prepared for each class. (0.6074 - significant at the 0.01 level)The instructor evaluates in a fair manner. (0.2955 - significant at the 0.05 level)
The faculty member’s perceived enthusiasm and ability to motivate are very strongly related with the rating of

excellence, while fairness in evaluation does not seem nearly as important.
With regard to the research questions, the results are mixed. There is no significant linear correlation betweenthe excellence rating and the number of hours of outside work. However, a strong positive correlation wasobserved between the excellence rating and the perceived learning (0.7500 - significant at the 0.01 level). Inaddition, a significant negative linear correlation was noted between the excellence rating and perceived grade (-0.2604 - significant at the 0.1 level) and between the number of hours of outside work and perceived learning (-0.3466 - significant at the 0.05 level).
CONCLUSIONS
If it is the intent of student evaluations to measure whether or not an instructor is perceived to be an excellentteacher by his/her class, questions concerning the ability to motivate, concern, enthusiasm, clearness ofpresentation, fairness, and preparedness appear to be appropriate. All of these had mean responses that weresignificantly positively correlated with the ranking of instructor quality. Therefore, if an instructor ranked highin these areas, it would support the rating of this instructor as an excellent teacher, as perceived by his/herstudents.
However, these questions do not address learning. A teacher can motivate, be concerned, fair, enthusiastic,prepared, and present material clearly, and students still may not learn much in a class. Additionally, many fearthat student perception of learning may be positively or negatively swayed by the amount of work required for acourse. The intent of this paper was not simply to examine measures of instructor quality, but to see if workloadand learning also had strong relationships with the rating of a faculty member as being excellent in theclassroom. This would allow evaluation of additional, and hopefully meaningful, dimensions of the class andthe instructor.
A strong positive correlation was found between perceived learning and the rating of excellent. Therefore, if ateacher does rate excellent, one could draw the conclusion that students did feel that they learned more in thecourse on average than in other classes. This supports the idea that an excellent teacher does actually teach andthat students are in fact being educated in the process.
It does not appear that faculty in general who require a greater work load outside of class are negativelyevaluated as a result of the required work. In fact, there was a significant correlation between learning andwork and study. The more work the students did, the more the students felt they learned. It does appear thatthe evaluation of the teacher is influenced significantly by the grade a student perceives he/she has earnedrelative to the grade he/she believes will be rewarded. There are some exceptions to all general conclusions thatmay be derived from these data. For example, some teachers who rank highly as instructors rank poorly asproducers of student study and learning, whereas some teachers who rank poorly as instructors rank highly asproducers of study and learning.
Student evaluations are constructive instruments; they provide invaluable feedback to both administrators andfaculty. These evaluations may be able to rank quality of instruction, but questions concerning learning, courseworkload, and perceived grades add deeper insight. For example, students are influenced negatively byperceived grades. One could explain poor rankings of a good faculty member by responses implying thatstudents anticipated lower grades than they felt were warranted given how much they had studied and learned inthe course. As theseevaluation forms are administered and refined, further research needs to be conducted onhow learning can be measured. This would give more meaning to the process, possibly explain some of thevariations observed among faculty and classes, and lend more credibility to the evaluation itself.

References, Tables, and Figures Are Available upon Request from the First Author.

REMOVING BARRIERS-TO-ENTRY FOR DISTANCE LEARNING:POLICY RECOMMENDATIONS FOR ELECTRONIC COURSES
Don P. Holdren, Marshall University, Huntington, WV, 25755, (304) 696-2668Ray J. Blankenship, Marshall University, Huntington, WV, 25755, (304) 696-2668
ABSTRACT
Advances in technology continue to increase our capacity to communicate greater quantities of informationto our students in a manner which both increases their chances of learning and makes more efficient use oftheir time. Recent advances have even removed physical barriers of time and space, allowing students toacquire skills and knowledge even while temporally separated from their instructors. The purpose of thispaper is not to review research into the effectiveness of distance learning technologies. However, this paperdoes assume that distance education technologies are effective methods of instruction.
INTRODUCTION
In an educational marketplace which is becoming increasingly competitive, a university's ability to eliminatestudents' barriers-to-entry will predict its long-term fiscal viability. So-called "distance education" technologyhas overcome several of the physical barriers already. Higher education itself has been relatively successfulin overcoming financial barriers by securing funding for the acquisition of "distance education" enablingtechnology. Faculty around the world are mastering distance education techniques and strategies, andproducing online course content. So why isn't electronic course delivery taking off? Policy, or the lackthereof, may be the reason.. Even with hardware, software, bandwidth, experienced teachers and completedcourses ready for the offering, nothing can happen until higher education establishes policies that can governthis new medium.
Few people want to make mistakes. And even fewer want to make them in public. Because this is true, manyinstitutions of higher learning are "standing around," waiting for other institutions to implement electroniccourse delivery policies and work the bugs out. They're waiting to see what mistakes are made so that theydon't make them themselves. As a result, there has developed a lethargic, rather than a dynamic motion inthe direction of implementing "distance education" technology. Colleges and universities seem to be gingerlydipping their toes in the pool waiting for someone else to jump in and tell them "the water's fine."
An excellent example this hesitance is the policy issue of faculty compensation. More than any other policy,this one stands firmly between the new technology and the students. Because this issue seems so complex,and no one wants to make a mistake in implementation, efforts to create policy simply die in committee, andbecause these important compensation issues are not aggressively pursued, very few online courses areoffered. It may be said that the online course offerings at institutions of higher learning around the worldexist for one of two reasons: (1) the responsible faculty member received a grant or (2) is highlyself-motivated and forward-thinking. It appears that the institutions themselves are doing very little, with theexception of asking faculty to do extra work for free, or at best provide grant writing support, to promoteonline delivery of course materials. The reason may well be because they refuse to deal with issues of policy.
Eventually universities must realize that as the number of methods by which a potential student can obtainknowledge and skills increases, and as the number of students in each freshman class decreases, the universitymust be pro-active, not re-active in an increasingly competitive environment. The institution of higher

education that does not enter the on-line course competitive market with aggressiveness, enthusiasm andcreativity, will stand little chance of survival.
Our university began its on-line web-based course development in January 1996 in the college of business. The authors presented a proposal to the Dean and he gave us $20,000 and two notebook computers and onecourse reassignment time to develop the first course. While that course was being developed, many policyissues were encountered. We resolved many of them and included them in the syllabus for the course. Whenthat course was about 75 percent completed, an opportunity for grant funding presented itself and ourapplication was submitted. In the application the Dean committed the college to a technology-based degreeprogram if the funding to develop the courses was provided. The Board of Trustees granted us $143,000 todevelop four additional courses. They go on-line in September 1997. As these courses are being developed,additional policy issues are being encountered.
This paper presents an abridgment of the policies of several universities around the world which offerelectronic courses. The bibliography identifies some of the sources we reviewed, and in some instances, inour effort to recommend policy statements for our university. The policy statements presented here representMarshall University's effort to "adopt, adapt, and improve" the policy of other institutions of higher learningand to create new policy where none existent. Many of Marshalls policies were first stated in the syllabusfor the first web-based course we developed. Perhaps most significant, however, is the degree of integrationachieved between these "new" policies and the university's current administrative practice. In the course-development stage the authors closely coordinated their ideas with the appropriate administrators and wereable to make recommendations which required minimum effort of the administration system of the universityto incorporate, as a result these policies work in almost perfect concert with existing administrativemechanisms.
In addition to the policies recommendations of the authors a committee was formed by the Provost for thepurpose of developing a well-rounded set of policies that would encompass the universitys electronic coursesinitiative. The early results of this effort are the policy statements presented here. They arrange themselvesinto broad categories (Curriculum and Instruction, Faculty Support, Student Support, and Administration),however, they are presented here in alphabetical order. References to V classes refer to those web-basedcourses that are offered entirely over the Internet and are the content equivalent of the same course taught inthe conventional class room. Electronic courses are courses which apply some electronic delivery technologyas a part of the total course presentation. All V courses are electronic courses, however, all electroniccourses are not V courses.
POLICY ISSUES
The following is a draft of Marshall University policy statements currently being considered for adoption.Many of these statements draw heavily on the authors recommendations and the recommendations of theuniversity committee mentioned above.
Admissions
Students taking V-classes will be admitted to the University as regular students. Information, advice, and theopportunity to ask questions and receive answers regarding admissions requirements and procedures will beavailable to students applying for electronic courses, synchronously via telephone and asynchronously viathe world wide web and e-mail. A space for the potential student's e-mail address will be added to onlineadmission forms for electronic courses.

Advising
Comparable advising services, as determined by the college and/or department, will be available to studentsboth on and off campus. This will be accomplished synchronously by telephone at specified, published times,and asynchronously by e-mail. Frequently requested advising information will be made available via theworld wide web.
Authentication
Students registering for electronic courses will be required to designate a proctor who will administer theirexaminations. The student will also be responsible for paying any fees required by the proctor. Before takingthe first exam, the student will put the instructor in contact with the proctor, who must be approved by theinstructor. Proctors must not be related to students whose exams they proctor. Exams will be sent directlyfrom instructors to proctors, and individual instructors and proctors will determine the method of deliveryof the exams (e-mail, fax, standard mail) back and forth. Proctors will be required to initial and then sign asheet stating that 1) they were presented with a photo id by the student taking the exam at the time of theexam, 2) the student finished the exam in the allotted amount of time (equal to at least the amount of time astudent would have in a traditional class room examination period), and 3) the proctor was physically presentduring the entire time the student had the exam in their possession, and (4) to the best of the proctor'sknowledge the student finished the exam without cheating.
Computer Accounts
Students taking electronic courses will be entitled to standard Marshall University student computer accountson systems such as Hobbit. All students taking V-classes must have access to a computer with Internet access,Netscape Navigator or Internet Explorer 3.0 or higher, and an e-mail account.
Computer Literacy Requirements
Courses will be made available to provide the skills students need to utilize electronic courses (such ascomputing fundamentals, Internet fundamentals, and distance learning techniques). Students registering forelectronic courses will be encouraged to complete the fundamentals courses before registering for any coursesdelivered electronically. Students will be made aware that faculty teaching courses electronically will notprovide support or help time with topics covered in the fundamental courses (such as using Netscape).
Course Completion Timetable
Students will have one year from the end of the semester during which they enroll to complete a Year-longElectronic Course. At the end of the first semester students will be given a grade of I, Incomplete. At theend of the one year period, the student will be assigned a grade of "F" if the course is still uncompleted.Courses offered under the traditional semester calendar will have the same drop, completion, and other datesas those in the traditional calendar.
Course Content
The only difference in the curriculum of an electronic course as compared to the comparable on-campuscourse will be the delivery mode. The electronic course content will meet the same standards as courses
offered on-campus. Courses will go through the same review and approval process through which traditional,on-campus courses must go. Competency and content are reviewed by the college curriculum committeebefore the course is offered and each time it is changed. That committee assures that the competency matrixfor each course is complied with.
Course Enrollment
Faculty members administering electronic courses designated "writing intensive" will be limited to 24students. The next 24 students registering will be assigned to another faculty member, and so on. Themaximum number of students which faculty administering other courses can manage will be determined bythe faculty members college / department. There will be no minimum number of registered students requiredfor a class to "make."
Courses Offered
Only courses approved as V-classes will be offered electronically.
Course Schedule
A new Virtual Classes section will be created in the main course listing which will list all virtual classesoffered. Virtual classes will also appear in the discipline appropriate section of the listing, as well as the Adultand Extended Education section.
Credit Hours
Courses offered electronically will carry the same number of credit hours as sections of the same course /equivalent courses delivered traditionally.
Distribution of Tuition and Fees
Money not paid directly to faculty for teaching V-classes will be divided equally between the college ordepartment and the Marshall University Research Corporation (MURC). Your university may have anothermechanism. Compensation of faculty teaching Year-long Virtual Classes will be paid in two halves, the firstupon registration of a student for the course, and the second half upon student completion of the course. Ifstudents are carried over from one instructor (see Expiration of Year-long Virtual Course Agreements) toanother, the instructor picking up the carry over students will be compensated when the carry-over studentcompletes the course.
Evaluations
Student evaluation of instructors should include "use of technology" as an area of evaluation, and beconsistent with University policies.
Exams
V-class exams will have content and coverage comparable to similar courses taught on campus. Exams willbe monitored by a proctor, which will be designated by the student at the beginning of the course. Once astudent has begun an exam, they must finish it within the allotted time period. (See Authentication).

External Program
The Virtual classes will be offered as contract classes through the MURC. Adult and Extended Education(AEE) will facilitate the admission, registration, and fee payment process. Students will pay fees to theMURC which will disperse fees as stipulated in Distribution of Tuition and Fees. Your university may haveanother method.
Expiration of Year-long Electronic Course Agreements
If a faculty member's Year-long Electronic Course agreement expires while there are still students who havenot completed the course and he/she decides not to teach the course again, and another faculty member doesnot volunteer to pick up the course for overload compensation as outlined in Compensation, the course willbe pulled from the Year-long Electronic Course section of the main course listing, and the course will beassigned to an instructor until the remaining students have completed the course. These faculty will becompensated the remaining one half of the total compensation when the students complete the course as perCompensation.
Faculty Compensation for V-class Development
In order to encourage the development and delivery of quality electronic courses, faculty will be paidseparately for the development and teaching of electronic courses. Development will be compensated at a ratebetween $3000 and $5000 per course. The faculty member who develops the class does not have to be thefaculty member who teaches the class. (See Distribution of Tuition and Fees and Tuition and Fees.)
Faculty Compensation for Teaching a V-class
In order to encourage the development and delivery of quality electronic courses, faculty will be paidseparately for the delivery and administration of electronic courses. Teaching of V-classes will becompensated on a per student basis. This per student money will come from the tuition paid by studentsregistering for electronic courses. The final decision regarding compensation of the faculty member for theoverload or part-time pay remains the decision of the college/department. (See Distribution of Tuition andFees, Tuition and Fees and Year-long Electronic Course Agreement.)
Faculty Load Time
Electronic courses will be offered either as overload or by adjunct faculty.
Financial Aid
Students registering for V-classes will be eligible for financial aid just as traditional, on-campus students are.Information, advice, and the opportunity to ask questions and receive answers regarding financial aidopportunities will be made available to students registering for electronic courses. Frequently requestedfinancial aid information will be made available via the world-wide web.
Hardware/Software

As part of the registration process, students signing up for electronic courses will be required to attest thatthey have sufficient access to equipment and software necessary to complete the course for which they areregistering. Requirements will necessarily vary by electronic course.
Hiring Policies
Possession of skills in the delivery of course content using distance technologies may be considered as acriteria in the hiring of new faculty.
Intellectual Property/Ownership of Course Content
Electronic course content will be treated as an invention or discovery as set forth in Executive Policy BulletinNo. 9 Section 4 Part A (effective date June, 1995). "All inventions or discoveries shall be deemed to be aproprietary interest of Marshall University if the inventor was employed or otherwise financially supportedby the university, and if he/she used university facilities, materials, or time to conceive and develop thediscovery or invention."
Library
Specific library/staff resources will be designated to support distance learning students. Distance learningstudents will also be granted access to library resources, such as the ability to request interlibrary loans, aswell as access to online catalogs and materials.
Prerequisites
Information regarding prerequisites will be included in course descriptions, and completion of such will berequired of students taking V-classes in the same manner it is required of on-campus students. Students whohave not completed prerequisites for a virtual class will not be permitted to register for the V-class.
Registration
A student may register for an electronic course at any time during the calendar year. (See Course CompletionTimetable.) For administrative purposes, students registering after July 15 but before October 25 will becounted in the Fall semester. The number of electronic course credit hours for which they register will becounted toward total credit hours for the Fall semester only. Likewise, those electronic course credits willonly influence full or part-time student standing during the Fall semester. Students registering after October25 but before March 25 will be counted in the Spring semester. Students registering after March 25 but beforeJuly 15 will be counted in the Summer C session. (Also see Hardware/Software.)
Recognition
Compensation and recognition processes will encourage excellence in distance education. The university willestablish a system of incentives and rewards to encourage activity, recognize achievement, and fostercontinuing accomplishment in distance education. This will include (but not be limited to) adding recognitionof distance education activities as being co-equal with traditional teaching in faculty evaluations.

Review and Update of V-Class Content
The department or college will be responsible for the annual review of both the academic content and thetechnical content of Virtual Classes, and will update both academic content and technical content asappropriate.
Student Load Time
Electronic course credits count only for the Fall, Spring, or Summer C term as determined in the timetablelisted under Registration. A student cannot sign up for 12 hours of Year-long Electronic Courses and claimfull-time status for the full 12 months. University policies regarding overloads for students wishing to takeover 18 hours apply to students registering for V-classes.
Support Staff
A faculty support staff will provide support and training to faculty developing electronic coursecontent. This group will be headed by the full-time Instructional Technologist.
Syllabi and Course Documentation
Electronic course syllabi will clearly spell out the following information in addition to meeting the samerequirements as syllabi for on-campus courses: necessary hardware, software, technological competencies,and the nature and expected frequency of faculty and student interaction necessary for success in the course.
Training
A full-time Instructional Technologist will provide formal training and just-in-time support tofaculty who develop electronic course content.
Tuition and Fees
Students who register for electronic courses will pay the same tuition as students attending courses on-campusand will be subject to either the in-state or metro [by another name] fee. Students who register for electroniccourses will be required to pay a V-class Fee equivalent in amount to the Student Activities Fee. This fee issubject to annual review. Monies collected from the V-class fee will be divided between the Computer Centerand Adult and Extended Education for specific support of the V-class program. Students registering forelectronic courses only will be exempt from the Student Activities fee. Special fees imposed by colleges (e.g.the College of Business) are applicable to students registering for V-classes.(See Compensation.)
Withdrawal Timetable
A student who registers for an electronic course will receive a letter grade upon completion of the course, asdescribed in the syllabus. Students who allow the allotted time for the class to expire without completing thecourse work will be assigned a letter grade of "F" as of the expiration date. Students may withdraw from acourse within three (3) months of registering for the course will be assigned a grade of "W." Studentswithdrawing from a course within thirty (30) days of registering will receive a 66% tuition refund. Those

withdrawing past the 30 day time limit will receive no refund. Refunds will not be granted for other fees paidby the distance learning student.
Year-long Electronic Course Agreement
Instructors who wish to offer a Year-long Electronic Course will be required to sign a Year-long ElectronicCourse Agreement, which obligates them to perform their duties as instructor of the course throughout thetwelve (12) month period. The per student compensation will be pro-rated across the twelve months.

BIBLIOGRAPHY
(Author Unknown). Executive Summary of Recommendations. (n.d.)<http://www.eece.maine.edu/techf/bates/exec.html#F> (13 February 1997).
(Author Unknown). Executive Summary - Report of the Systemwide Task Force onTelecommunications and Information Technology. (n.d.)<http://www.eece.maine.edu/techf/summary.html#B> (21 February 1997).
(Author Unknown). "Northwest Technical College/Distance Education FAQ." (n. d.) <http://www.ntconline.com/ntc/de/faq.html> (17 February 1997).
(Author Unknown). "Oregon State System of Higher Education Distance Education Policy Framework." (n. d.) <http://www.osshe.edu/dist-learn/dist-pol.htm> (17 February 1997).
(Author Unknown). What is Distance Learning? <http://shemp.bucks.edu/~spielp/dis-learn/what.htm>(30 April 1997).
(Author Unknown). Distance Learning at Champlain College - SuccessNet General Information. (1996).<http://ias.champlain.edu/success/dl1.htm> (30 April 1997).
(Author Unknown). What Does Distance Learning Mean? <http://www.cnuas.edu/what.htm> (30 April1997).
(Author Unknown). Individualized Distance Learning - General Information and FAQs<http://www.fuller.edu/cce/dist.htm> (30 April 1997).
(Author Unknown). Frequently Asked Questions. <http://www.wcc-eun.com/eun/faq.html> (30 April1997).
Holdren, Don, and Blankenship, Ray. Course Syllabus. "Finance 480 V, Fundamentals ofFinance, Internet Course." (22 November 1996).
Holdren, Don, and Blankenship, Ray. MGT3000V Syllabus. (n. d.)
Kelly, William, et al. "PSU's Report on the Task Force on DE." The Report of the TaskForce on Distance Education. (November 1992). <http://www.cde.psu.edu/de/DE_TF.html> (22February 1997).
Manning, Charles W. Memo regarding SREB document on electronic courses. (28 October1996).
Marshall University Faculty Personnel Committee and Research Committee. Jointrecommendation regarding patent and invention policy for Marshall University. (21 May1996).
Peters, Pamela P. Syllabus and Outline for FIN3403, Sections 2 and 5, Spring 1997.<http://garnet.acns.fsu.edu/~ppeters/fin3403/syl197.html> (30 April 1997).

Thomas, Bill. "Principles of Good Practice for Academic Degree and Certificate ProgramsOffered Electronically." (n. d.) <http://www.peach.net/sreb/sreb/guide_principles.html> (1March 1997).
Mingle, James R., Epper, Rhonda, and Ruppert Sandra. "Access to Information Technology:A Statewide Vision for Colorado." (3 June 1996).
Reid, John E. "What Every Student Should Know About Online Learning." (n. d.)<http://www.caso.com/iu/articles/reid01.html> (5 March 1997).
Spears, Keith. "Internet course admission and registration procedures." (11 November 1996).
Spears, Keith. "Registration Procedures for Fin 480 V, Spring 1997." (30 September 1996).
TRACK: Finance and Economics
"" TThhee RReellaatt iioonnsshhiipp BBeettwweeeenn SSppll ii tt BBoonndd RRaatt iinnggss aanndd UUnnddeerr wwrr ii tteerr SSpprr eeaadd""WWeesslleeyy MM.. JJoonneess,, GGeeoorrggiiaa SSoouutthheerrnn UUnniivveerrssii ttyy
"" SSttuuddeenntt PPeerr cceepptt iioonnss ooff tthhee RRoollee ooff PPrr ooffeessssiioonnaall CCeerr tt ii ff iiccaatt iioonnss iinn tthhee MM aannaaggeerr iiaall JJoobb MM aarr kkeett""JJaammeess JJ.. BBaarrddsslleeyy,, UUnniivv.. ooff NNoorrtthh CCaarrooll iinnaa -- PPeemmbbrrookkeeRRoobbeerrtt BB.. BBuurrnneeyy,, CCooaassttaall CCaarrooll iinnaa UUnniivveerrssii ttyyGGeerraalldd VV.. BBooyylleess,, CCooaassttaall CCaarrooll iinnaa UUnniivveerrssii ttyy
"" CCoouunnttyy II nnccoommee CChhaannggeess iinn SSoouutthh CCaarr ooll iinnaa 11996600--11999955""WW.. RRooyyccee CCaaiinneess,, LLaannddeerr UUnniivveerrssii ttyyMMiicchhaaeell CC.. SShhuurrddeenn,, LLaannddeerr UUnniivveerrssii ttyy
"" TThhee MM oorr ttggaaggee II nndduussttrr yy NNeeeeddss EEDDII ""EEmmii llyy SSmmii tthh,, HHoommeelleennddeerrss ooff tthhee SShhooaallss ooff tthhee SShhooaallssTToommmmiiee SSiinngglleettoonn,, UUnniivveerrssii ttyy ooff NNoorrtthh AAllaabbaammaaKKeeii tthh AAbbsshheerr,, UUnniivveerrssii ttyy ooff NNoorrtthh AAllaabbaammaa
"" TThhee RRoollee ooff II nnffoorr mmaatt iioonn SSyysstteemmss iinn EExxppeerr iimmeennttaall EEccoonnoommiicc MM aarr kkeettss""EEii lleeeenn KKeerrnnss,, PPuurrdduuee UUnniivveerrssii ttyyCChhaarr lleess LL.. GGaarrddnneerr,, JJrr..,, EEaasstteerrnn KKeennttuucckkyy UUnniivveerrssii ttyy
"" NNoonn--FFiinnaanncciiaall FFaaccttoorr ss TThhaatt AAff ffeecctt HHoossppii ttaall PPrr ooff ii ttaabbii ll ii ttyy""CC.. LLaannkkffoorrdd WWaallkkeerr,, EEaasstteerrnn II ll ll iinnooiiss UUnniivveerrssii ttyy
““ TThhee AAuuddii tt AAnndd PPrr eevveenntt iioonn ooff CCrr eeddii tt CCaarr dd FFrr aauudd”” Doug Haskett, Old Dominion University Doug Ziegenfuss, Old Dominion University

THE RELATIONSHIP BETWEEN SPLIT BOND RATINGS AND UNDERWRITER SPREAD
Wesley M. Jones, Jr., Georgia Southern University, Statesboro, GA 30460 (912) 681-5432
ABSTRACT
Whenever a firm seeks to raise new capital through the use of debt, it will often do so by issuing bonds.The value of the bond to the market and by extension the cost of the debt to the firm is determined by howthe various constituents to the bond issue interpret the information set surrounding the issue.
The overall interest cost of a new debt issue to an issuing firm can be decomposed into two distinctelements, the offering yield and the underwriter spread. This study examines the underwriter spreadportion of the cost of new debt. Specifically, this study examines whether or not split rated issues have anunderwriter spread different from the underwriter spread on similar dually rated issues. This study alsoexamines whether underwriters have a preference for the opinion of one rating agency over the other.
As part of the process of issuing new debt, the issuing firm will solicit the opinion of an impartial thirdparty to certify the credit quality of the issue and by extension the issuer. These impartial rating agencieswill review the issuing firm’s financial performance and position and assign a rating to the issue thatindicates their assessment of the credit worthiness of the issuer. The two main credit rating agencies areMoody’s Investor’s Service and Standard and Poor’s Rating Services. Most of the time the two agencieswill agree on the credit quality of an issuer; however, on some occasions the rating agencies will differ intheir assessment of the issuer’s credit worthiness. This divergence of opinion, which is reflected in eachagency’s rating, is termed a split rating.
REVIEW OF RELATED LITERATURE
Prior research has suggested that while market participants partially base their evaluations of creditquality on recent financial statistics, they do place some value on the opinion of the rating agencies [3]
Ederington [2] suggests three reasons that split ratings might occur: 1) different standards for a particularrating, 2) systematic differences in rating procedures, and 3) non systematic variations in judgement ofthe raters. His general findings are that split ratings occur because of random variations in judgement onthe part of the raters regarding issues that are marginal with respect to a particular level ofcreditworthiness. Billingsley, Lamy, Marr and Thompson [1] examined the relationship between splitbond ratings and offering yields and found that issues with a split rating have a significantly higheroffering yield than similar, dually-rated issues at the higher rating of the split. These results are supportedby Liu and Moore [5] who note that “the market appears to weigh ‘bad’ news more than ‘good’ news.”Reiter and Ziebart [7] in a study of 320 public utility issues, found contradictory results. Their resultsshow that offering yields on split rated issues are significantly lower than the lower rating of the split.
Few studies have examined the relationship between an issue’s offering yield and underwriter spread.One such study by Marr and Thompson [6] found that offering yield and underwriter spread wereinversely related. In a study of 127 investment grade issues, they found that as an issue’s yield increases,the underwriter spread decreases. This result suggests that in order to entice the underwriter distributingthe issue to price the issue aggressively in the market, lowering the offering yield, issuers will offer ahigher underwriter spread.
Based on the results of prior research, which largely suggests that split rated issues are associated withhigher offering yields and higher yields are associated with lower underwriter’s spreads, it seems that split

rated issues should be associated with lower underwriter spreads. This study undertakes to examine thisrelationship.
DATA AND METHODOLOGY
A model similar to the model specified by Marr and Thompson [6] is used to test the relationship betweensplit ratings and underwriter spread.
(1)
The bulk of the data on each issue was obtained from the data files of the Capital Markets Division of theFederal Reserve Board of Governors. This data source provided information on each issue’s yield, callfeatures, size, and term to maturity. In addition, this source indicated the rating of the issue and from thisone could determine if the issue was generally graded as investment grade or speculative grade. Also,this source also provided the rating assigned by each of the two major rating agencies and from this onecould determine whether a split rating was present.
Recent work by Jones [4] has suggested that, because of the competition to be “first among many” in thesecurities underwriting business, the rank of the underwriter relative to peers influences spread. Thiscompetition results in a self selection bias where, in order to be first, the underwriter must manage thegreatest volume of business; and to attract the greatest volume of business, the underwriter will reduce theprice for their services which is the underwriter spread. Therefore the model will also include a dataelement reflecting the rank of the underwriter of the issue. The rank of the underwriter was determinedfrom two sources. First, the issue’s managing underwriter was obtained by referring to Moody’s BondSurvey. When the issue’s managing underwriter was determined, their rank was obtained by referring tothe Scoreboard of underwriter activity published in early January each year in The Wall Street Journal.
This initial data set from the Federal Reserve Board of Governors comprised essentially all debt issuesbetween January 1983 and June 1993. From this data set, all short term issues were removed becausethey were beyond the scope of this study. All issues for which the managing underwriter could not bedetermined were dropped because prior work by Jones [4] suggests that the identity of the managingunderwriter does influence the issue’s spread. Issues which did not receive a rating from both ratingagencies were dropped because a split rating cannot be determined if one of the ratings is missing.Finally all issues prior to January 1987 were dropped because the Wall Street Journal scoreboard ofunderwriting was unavailable for issues prior to that time.
RESULTS
The model was analyzed using multiple regression methodology. The results are presented in Table 1.
Spread Yield Callable
Callprot Sizedev Sizedev
UWRank Var Term
Spec split
i i
i
� � �
� � �
� � �
� � �
� � �
� � �
� � �
� � �
1 2
3 4 52
6 7 8
9 10
30

TABLE 1Regression Results of Model 1
Variable Coefficient t-statistic p-value
Constant -0.25 -2.90 0.00
Yield 0.11 10.83 0.00
Callable 0.06 1.31 0.19
Callprot -0.0005 -0.18 0.86
Sizedev -0.0008 -4.66 0.00
Sizedev² 0.0000008 1.55 0.12
UwRank -0.02 -3.54 0.00
Var30 0.27 0.29 0.77
Term 0.006 1.90 0.06
Spec 1.43 25.95 0.00
Split -0.06 -1.42 0.16
R² 0.80137
First, it should be noted that these results contradict the work of Marr and Thompson [6] which suggestsan inverse relationship between yield and spread. These results indicate that a one percentage pointchange in yield is accompanied by approximately an eleven basis point change in spread in the samedirection. Secondly, the amount to which an issue deviates in size from “average” also influences theissue’s spread. Table one indicates that larger issues will have a lower spread and smaller issues willhave a higher spread. One possible explanation for this is that underwriters realize economies of scale onlarger issues which they pass through to the issuer. Third, consistent with the prior work of Jones [4]issues managed by higher ranking underwriters are associated with lower spreads. As the underwriter’srank increases, each step up in the ranking leads to a two basis point reduction in spread. This supportsthe theory that underwriters value being higher in the rankings and will lower their price to attract morebusiness. Fourth, speculative rated issues are associated with higher spreads. According to table one,issues that are rated below investment grade have a 143 basis point higher spread than investment gradeissues. Finally, at the margin, longer term issues have a higher spread than shorter term issues.
It should also be noted here that when a simple binary indicator of whether or not an issue is split rated isused, such an indication is not significant. Because of the inherent limitations of indicator variables, asecond model is specified which improves the explanatory power of the split rating situation. Prior workby Liu and Moore [5] suggests that not only does the market pay attention to split ratings, but also to howthe ratings are split. Based on this work, the single binary indicator of split ratings is replaced by a twoindicator variable system that also captures the direction of the split. The resulting model is presentedbelow.

(2)
All of the variables for this model correspond to the variables in model 1 except that the split ratingindicator of model 1 is replaced by two indicators. The SPhigher indicator equals one when the higherrating of the split belongs to Standard and Poor’s and the Moodyhigher indicator equals one when thehigher rating belongs to Moody’s. If the issues are rated equally by both agencies, then both variablesequal zero.
The results of the multiple regression of this model are presented in table 2.
TABLE 2Regression Results of Model 2
Variable Coefficient t-statistic p-value
Constant -0.23 -2.69 0.01
Yield 0.11 10.72 0.00
Callable 0.06 1.15 0.25
Callprot -0.0003 -0.11 0.92
Sizedev -0.0008 -4.53 0.00
Sizedev² 0.0000009 1.67 0.09
UwRank -0.02 -3.70 0.00
Var30 0.24 0.26 0.79
Term 0.01 1.91 0.06
Spec 1.42 26.02 0.00
SPhigher -0.19 -3.70 0.00
Moodyhigher 0.11 1.92 0.05
R² 0.80543
The results of the regression of model two are consistent with the results of the regression of model onewith one exception. The results of the regression of model one failed to reject the hypothesis that splitratings do not affect spread. When the split rating event is decomposed into the components of whichagency gives the higher rating of the split, then the results clearly reject the hypothesis that split ratings donot affect spread. When the split rating event is decomposed as in model two, then a higher rating byStandard and Poor’s (and a lower rating by Moody’s) results in a nineteen basis point lower spread and ahigher rating by Moody’s (and a lower rating by Standard and Poor’s) results in an eleven point higherspread.
Spread Yield Callable
Callprot Sizedev
Sizedev UWRank Var
Term Spec SPhigher
Moodyhigher
i i
i
� �
� �
� � �
� � �
� �
� � �
� �
� � �
� � �
� �
1 2
3 4
52
6 7
8 9 10
11
30
CONCLUSIONS AND IMPLICATIONS
To the extent that the demand function in the market for debt issues incorporates rating agency creditquality assessments as evidenced by the fact that lower rated issues pay a higher yield, the level of effortrequired to market a lower rated issue will likely be greater than that required of a higher rated issue.Further, if a difference of opinion between the rating agencies with respect to credit quality indicateshigher risk [1] then one could assume that the effort required to market such issues would be greater andtherefore require an even greater underwriter cost. The results of this study indicate that while the splitrating event can have a negative impact on spread, it can also have a positive impact depending on thedirection of the split.
The implications for businesses issuing new debt are twofold. First, if they have any influence over thedirection of a split rating should one occur, they should try to achieve a higher Standard and Poor’s rating.Secondly, if they cannot influence the direction of a split rating, it might be to their advantage to pursueonly one rating from Standard and Poor’s as the evidence suggests that underwriters may have apreference for their rating over Moody’s.
REFERENCES
[1] Billingsley, Randall S., Robert E. Lamy, M. Wayne Marr, and G. Rodney Thompson. “SplitRatings and bond Reoffering Yields.” Financial Management. Summer 1985. pp. 59-65.
[2] Ederington, Louis H. “Why Split Ratings Occur.” Financial Management. Spring 1986. pp. 37-47.
[3] Ederington, Louis H., Jess B. Yawitz, and Brian E. Roberts. “The Informational Content of BondRatings.” The Journal of Financial Research. Vol. 10. No. 3. Fall 1987. pp 211-226.
[4] Jones, Wesley M. Jr. “The Relationship Between Underwriter Experience Excess Offering Yieldand Underwriter Compensation In the Market for Corporate Debt.” (Ph. D. diss., Florida AtlanticUniversity, 1997)
[5] Liu, Pu, and William T. Moore. “The Impact of Split Bond Ratings on Risk Premia.” TheFinancial Review. Vol. 22. No. 1. February 1987. pp. 71-85.
[6] Marr, M. Wayne, and G. Rodney Thompson. “The Influence of Offering Yield on UnderwritingSpread.” The Journal of Financial Research. Vol. 7. No. 4. Winter 1984. pp. 323-327.
[7] Reiter, Sara, A., and David A. Ziebart. “Bond Yields, Ratings, and Financial Information:Evidence from Public Utility Issues.” The Financial Review. Vol. 26. No. 1. February 1991. pp.45-73.

Student Perceptions of the Role of Professional Certifications in the Managerial Job Market
James J. BardsleyUniversity of North Carolina at Pembroke, Pembroke, NC 28372
Robert B. Burney and Gerald V. BoylesWall School of Business, Coastal Carolina University, Conway, SC 29526
ABSTRACT
This paper examines the role of professional certifications in the jobmarket for business school graduates. Professional certificationsprovide job seekers with a means of differentiating themselves fromother applicants. This paper presents the results of a survey ofundergraduate business students' knowledge of, and attitudestoward various professional certifications.
OVERVIEW
The continuing output of business schools and the streamlining ofcorporate management has resulted in an ever increasinglycompetitive managerial job market . Naturally, applicants areconcerned with their ability to differentiate themselves from othersin the applicant pool. One method of accomplishing this is theacquisition of a professional certification.
The past two decades have seen a substantial increase in thenumber of different professional certifications available in theaccounting and financial services industry. As with any rapidgrowth sector, a great deal of variation exists in the quality of thevarious certification programs. More significantly, the impetus forthe creation of the various certifications vary widely. Somecertifications are clearly legitimate attempts to defineprofessionalism, while others appear to be driven by the profitmotive
There can be no doubt that the rapid increase in the number andnature of professional certifications has lead to confusion amongboth job seekers and employers. Surely, with time the market willaccurately access the validity and value of the various certifications. This adjustment will nonetheless be made more difficulty by theongoing changes in the relative importance of various sectors of thebusiness management profession.
This paper expands the similar work of Burney and Boyles (1996). In this study, a survey instrument was used to collect dataconcerning student knowledge of, and attitudes toward, variousfinance and accounting professional certifications. Thequestionnaire measures the respondent's relative rankings of theimportance of attaining professional certifications, and explores therespondent's knowledge of various finance and accountingcertifications. The sample was drawn from the student bodies oftwo Southern public universities.
METHODOLOGY
The questionnaire was administered to 280 business students at the
University of North Carolina at Pembroke (UNCP) and CoastalCarolina University (CCU).The respondents were asked to identify their major, gender, age,employment status, and intentions concerning attaining professionalcertification. Then the respondents were asked to rate theimportance (in general) of professional certification in findingemployment, career advancement, and the public's differentiationbetween potential providers of financial services and financialadvice. Finally, the respondents were asked to match sixaccounting or finance professional certifications, identified only byacronym, with a short description of the role the certification playsin the finance and accounting professions.
HYPOTHESES
It was hypothesized that accounting and finance majors would findcertification more important than other students due to the importance of certification in the accounting and financeprofessions. In addition, it was thought that work experience,which would bring the student into contact with practicingprofessional managers, would increase the importance whichstudents placed on certification. Age, being correlated withexperience, was expected to be related to student attitudes, as wasthe students intention to seek certification.
RESULTS
In total 280 students filled out the survey. Accounting,management, marketing, finance, and computer science majorsmade up 34.8%, 30.1%, 14.0%, 12.9%, and 5.4% of the sample,respectively. The remaining percentage of respondents werecomprised of various majors, none of which was represented bymore than two respondents.
Females made up 51.4% of the sample. Of the respondents, 36.5%worked full-time, 39.4% worked part-time, and 24.2% did notwork.
Of the respondents, 44.6% intended to seek professionalcertification. The certification most frequently being sought wasthe CPA. In keeping with the nature of the student bodies at thetwo universities, only 65% the respondents were of traditionalcollege age, 24 years or less.
Table One presents the mean ratings, on a scale of one to five,assigned by the respondents to the importance of professionalcertification in finding employment, career advancement, and thepublic's differentiation between various providers of financialservices. These ratings are differentiated by major, nature of
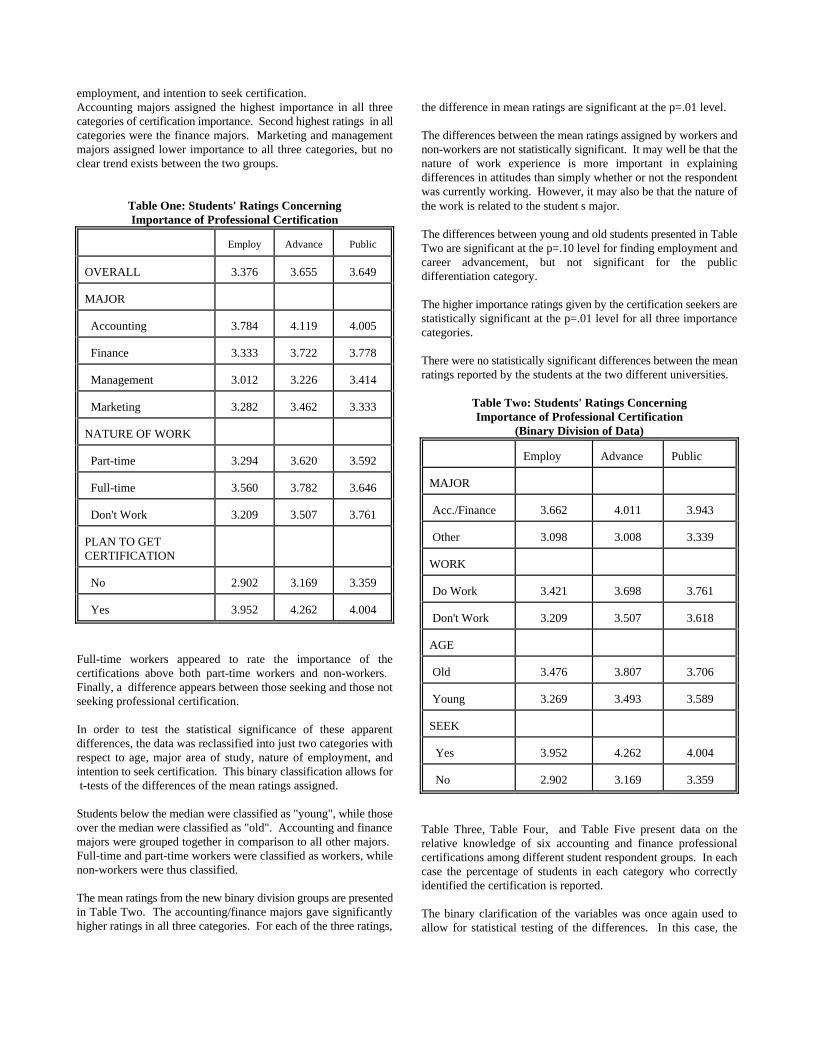
employment, and intention to seek certification.Accounting majors assigned the highest importance in all threecategories of certification importance. Second highest ratings in allcategories were the finance majors. Marketing and managementmajors assigned lower importance to all three categories, but noclear trend exists between the two groups.
Table One: Students' Ratings ConcerningImportance of Professional Certification
Employ Advance Public
OVERALL 3.376 3.655 3.649
MAJOR
Accounting 3.784 4.119 4.005
Finance 3.333 3.722 3.778
Management 3.012 3.226 3.414
Marketing 3.282 3.462 3.333
NATURE OF WORK
Part-time 3.294 3.620 3.592
Full-time 3.560 3.782 3.646
Don't Work 3.209 3.507 3.761
PLAN TO GETCERTIFICATION
No 2.902 3.169 3.359
Yes 3.952 4.262 4.004
Full-time workers appeared to rate the importance of thecertifications above both part-time workers and non-workers. Finally, a difference appears between those seeking and those notseeking professional certification.
In order to test the statistical significance of these apparentdifferences, the data was reclassified into just two categories withrespect to age, major area of study, nature of employment, andintention to seek certification. This binary classification allows for t-tests of the differences of the mean ratings assigned.
Students below the median were classified as "young", while thoseover the median were classified as "old". Accounting and financemajors were grouped together in comparison to all other majors. Full-time and part-time workers were classified as workers, whilenon-workers were thus classified.
The mean ratings from the new binary division groups are presentedin Table Two. The accounting/finance majors gave significantlyhigher ratings in all three categories. For each of the three ratings,
the difference in mean ratings are significant at the p=.01 level.
The differences between the mean ratings assigned by workers andnon-workers are not statistically significant. It may well be that thenature of work experience is more important in explainingdifferences in attitudes than simply whether or not the respondentwas currently working. However, it may also be that the nature ofthe work is related to the students major.
The differences between young and old students presented in TableTwo are significant at the p=.10 level for finding employment andcareer advancement, but not significant for the publicdifferentiation category.
The higher importance ratings given by the certification seekers arestatistically significant at the p=.01 level for all three importancecategories.
There were no statistically significant differences between the meanratings reported by the students at the two different universities.
Table Two: Students' Ratings ConcerningImportance of Professional Certification
(Binary Division of Data)
Employ Advance Public
MAJOR
Acc./Finance 3.662 4.011 3.943
Other 3.098 3.008 3.339
WORK
Do Work 3.421 3.698 3.761
Don't Work 3.209 3.507 3.618
AGE
Old 3.476 3.807 3.706
Young 3.269 3.493 3.589
SEEK
Yes 3.952 4.262 4.004
No 2.902 3.169 3.359
Table Three, Table Four, and Table Five present data on therelative knowledge of six accounting and finance professionalcertifications among different student respondent groups. In eachcase the percentage of students in each category who correctlyidentified the certification is reported.
The binary clarification of the variables was once again used toallow for statistical testing of the differences. In this case, the
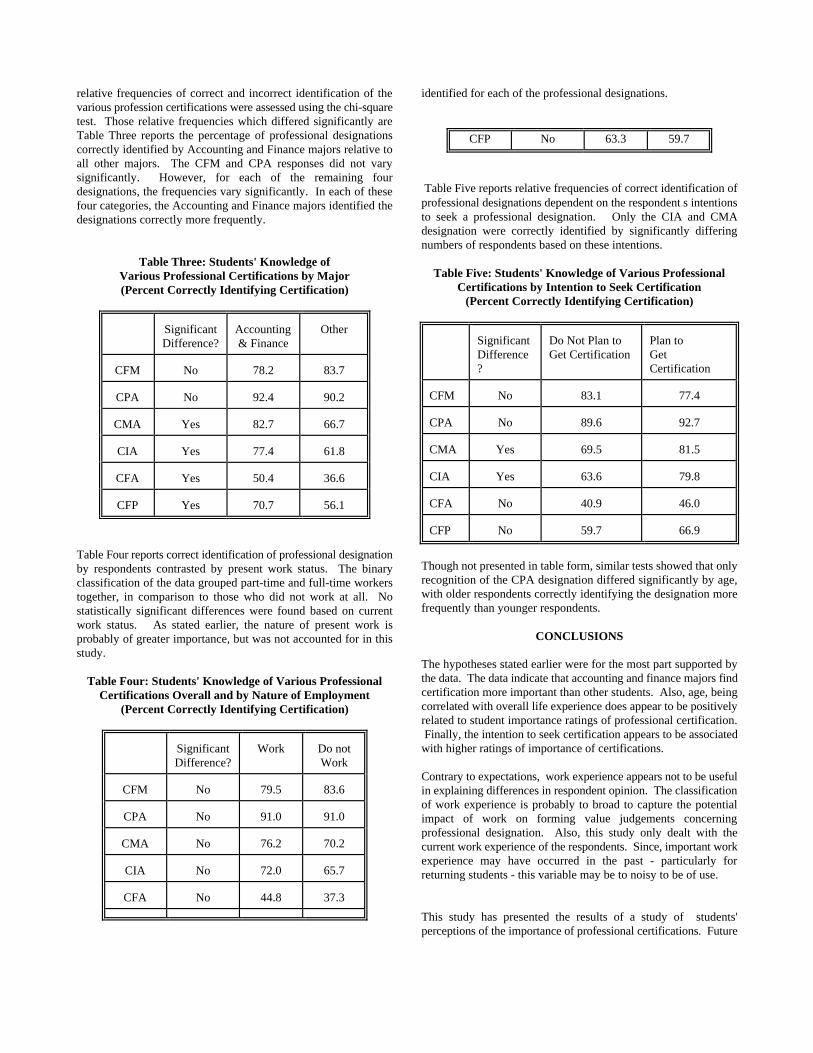
relative frequencies of correct and incorrect identification of thevarious profession certifications were assessed using the chi-squaretest. Those relative frequencies which differed significantly are
identified for each of the professional designations.
Table Three reports the percentage of professional designationscorrectly identified by Accounting and Finance majors relative toall other majors. The CFM and CPA responses did not varysignificantly. However, for each of the remaining fourdesignations, the frequencies vary significantly. In each of thesefour categories, the Accounting and Finance majors identified thedesignations correctly more frequently.
Table Three: Students' Knowledge ofVarious Professional Certifications by Major(Percent Correctly Identifying Certification)
SignificantDifference?
Accounting& Finance
Other
CFM No 78.2 83.7
CPA No 92.4 90.2
CMA Yes 82.7 66.7
CIA Yes 77.4 61.8
CFA Yes 50.4 36.6
CFP Yes 70.7 56.1
Table Four reports correct identification of professional designationby respondents contrasted by present work status. The binaryclassification of the data grouped part-time and full-time workerstogether, in comparison to those who did not work at all. Nostatistically significant differences were found based on currentwork status. As stated earlier, the nature of present work isprobably of greater importance, but was not accounted for in thisstudy.
Table Four: Students' Knowledge of Various ProfessionalCertifications Overall and by Nature of Employment
(Percent Correctly Identifying Certification)
SignificantDifference?
Work Do notWork
CFM No 79.5 83.6
CPA No 91.0 91.0
CMA No 76.2 70.2
CIA No 72.0 65.7
CFA No 44.8 37.3
CFP No 63.3 59.7
Table Five reports relative frequencies of correct identification ofprofessional designations dependent on the respondents intentionsto seek a professional designation. Only the CIA and CMAdesignation were correctly identified by significantly differingnumbers of respondents based on these intentions.
Table Five: Students' Knowledge of Various ProfessionalCertifications by Intention to Seek Certification
(Percent Correctly Identifying Certification)
SignificantDifference?
Do Not Plan toGet Certification
Plan toGetCertification
CFM No 83.1 77.4
CPA No 89.6 92.7
CMA Yes 69.5 81.5
CIA Yes 63.6 79.8
CFA No 40.9 46.0
CFP No 59.7 66.9
Though not presented in table form, similar tests showed that onlyrecognition of the CPA designation differed significantly by age,with older respondents correctly identifying the designation morefrequently than younger respondents.
CONCLUSIONS
The hypotheses stated earlier were for the most part supported bythe data. The data indicate that accounting and finance majors findcertification more important than other students. Also, age, beingcorrelated with overall life experience does appear to be positivelyrelated to student importance ratings of professional certification. Finally, the intention to seek certification appears to be associatedwith higher ratings of importance of certifications.
Contrary to expectations, work experience appears not to be usefulin explaining differences in respondent opinion. The classificationof work experience is probably to broad to capture the potentialimpact of work on forming value judgements concerningprofessional designation. Also, this study only dealt with thecurrent work experience of the respondents. Since, important workexperience may have occurred in the past - particularly forreturning students - this variable may be to noisy to be of use.
This study has presented the results of a study of students'perceptions of the importance of professional certifications. Future

research should include a more comprehensive treatment ofpotential factors in the formation of value judgements ofprofessional designations. Specifically, the work experiencecriteria should be expanded to include past work experience, typeof work experience, and other experiences - such as family businessparticipation or parents occupation - which would cause therespondent to be more familiar with professional designations.

***The paper has now been revised to this point.***Required Additional Computer Work:
1. Importance ratings must be done By Major . Theexisting SAS code in the papers directory on the office machine.
TABLE 2
2. Proc Frequency must be run by the binary variablescreated which describe major, age, work status, and intention topursue professional certification.
TABLES Aeneid 5
3. Proc Frequency should also be run by Major , Work ,and Intention to seek certification in order to allow for Directcomparison to last years study.
CONSIDER USING ONLY BINARY VARIABLES IN TABLES3, 4, AND TO MAXIMIZE DIFFERENCE IN PRINTEDARTICLES.

COUNTY INCOME CHANGES IN SOUTH CAROLINA 1960 - 1995
W. Royce Caines, Lander University, Greenwood, SC 29649 (864) 388-8732Mike C. Shurden, Lander University, Greenwood, SC 29649 (864) 388-8732
ABSTRACT
The purpose of this paper is to examine the changes in per capita income across the counties of SouthCarolina during the 1960 through 1995 time period. Much attention has been focused on the disparateincome growth of different regions in South Carolina. Measurement of the changes in per capita incomeprovides a measure of whether growth has been unequal and also allows an analysis of the relativeposition of the counties of the state. Based on this analysis, the state appears to have made progress inimproving income equality in the state.
BACKGROUND
During the 1980s, several articles were written to highlight the relative position of various parts of theUnited States relative to economic development [2,3]. Attention was focused on certain areas thatappeared to be in danger of being left behind as the overall economy expanded. The implication was thatsome areas within the Southern states were likely to fall further behind as other areas became moreadvanced.
At least at the state level, there exists a pragmatic reason to examine such circumstances. During the lastthirty or so years, state governments have taken a very proactive role in attempting to lead economicdevelopment. At times, such efforts have resulted in competition between different areas of the samestate when industry is being courted. And if a large share of the new development appears to bechoosing certain sites and leaving other areas behind, then citizens of the areas left behind question if theyare being well served by the political leadership.
In the case of South Carolina, there has been a perception that the upstate region, particularly theInterstate highway I-85 corridor has been particularly successful in attracting new development. The I-85corridor in South Carolina cuts across five counties of the state as a link between the major metropolitanareas of Charlotte, NC and Atlanta, GA. Several major industries have located along the interstate,particularly in the Greenville and Spartanburg county sections. The highlight of the economicdevelopment in those areas has been the selection of Spartanburg County as the site for BMW to build itsNorth American manufacturing facilities. Also, for sixteen consecutive years, the governor (two differentadministrations) of South Carolina was a resident of Greenville which is the major city on the I-85corridor. Perhaps understandably, other areas of the state had questions as to whether the economicdevelopment was being led to some areas at the expense of others.
MEASURING INCOME INEQUALITY
The measure of income inequality used in this paper is the coefficient of variation of annual county percapita income across the 46 counties of the state. The coefficient of variation is calculated by dividing thestandard deviation of a series by the mean of the series. The coefficient of variation thus reflectsdispersion relative to the mean and can be used as a measure of variation for different years with differentmeans. A larger value for the coefficient of variation indicates more inequality as compared to a smallercoefficient of variation for another time period [1].

CHANGES IN INEQUALITY
From 1940 to 1960, county per capita income exhibited a consistent trend toward less inequality, i.e.,more equality of income. That pattern continued through the political and social upheavals of the 1960sand the oil crisis of the 1970s until 1979. However from 1979 to 1989, the trend reversed and county percapita income inequality increased. Then from 1989 to 1995, the trend in equality reversed again andreached the almost identical level that it had been in 1979, Table 1.
Table 1. Coefficient of Variation for County Per Capita Income. 1940 - 1995.
Year Coefficient of variation
1940 40.051950 33.281959 26.361969 22.331979 16.511989 19.031995 16.61
THE SITUATION IN 1960
In 1960, the lowest per capita income was found in Lee County where the result was only 51% of thestate per capita income. Lee County was and remains a small rural county with an economy dominatedby agriculture. On the other end of the income scale was Aiken County with a per capita income that was154% of the state per capita income. That result was likely due to the tremendous influence ofgovernment spending at the Savannah River Plant during the 1950s.
The poorest ten counties had an average per capita income that was only 72% of the state figure while therichest ten counties had an average per capita income that was 137% of the figure for the entire state.Thus there were substantial differences across the counties of the state.
GROWING INEQUALITY IN 1980s
The change in trend during the 1980s is puzzling since it appears to be an aberration in the long run trendtowards more equality. This trend is similar to the national trend for state per capita incomes as shown byCoughlin and Mandelbaum [1]. Based on their analysis, they concluded that the impact of falling energyprices was a primary cause of the trend on the national level, but there appears little reason to believe thatenergy prices affected South Carolina counties in a differential manner.
Using the methodology of Coughlin and Mandelbaum, the effect of each county on inequality can beexamined. If a county has a change of per capita income such that the relative standing changes by atleast five percentage points and leaves the county per capita income further from the mean than in theprevious time period, then the county is characterized as being divergent and contributing to growinginequality.
In Table 2 below, the counties that meet the above criteria for the 1979 to 1989 period are shown. Thosedownwardly divergent and those with incomes greater than 100% are listed as upwardly convergent.
Table 2. Counties Contributing to Increasing

Income Inequality 1979- 1989.
County 1979 1989
Dorchester 108 113Lancaster 99 105Pickens 100 109York 117 126Horry 106 118Beaufort 131 144Lexington 117 135Oconee 103 127
Downwardly Divergent
Fairfield 103 86Hampton 98 81Marion 87 78Orangeburg 93 86Chesterfield 95 90
Bamberg 85 80
The counties identified as upwardly divergent improved their relative position in the state during the 1979to 1989 period. There is no clearly identified characteristic. Two of the counties (Horry and Beaufort)are coastal counties that continued to develop tourist activities. Four counties (Dorchester, Pickens,Lexington and York) are adjacent to larger metropolitan areas and likely benefited from spillover effectsas those areas expanded.
On the other hand, all of the counties that are in the downwardly divergent category are mainly rural witha significant share of the economy based on agriculture and/or forestry. Coughlin and Mandelbaum didnot find an effect of the agricultural economy in the national data; however, the agriculture economyunderwent several strong shocks during the 1980s and that was likely a factor in those counties fallingfurther behind.
RETURN TO LONG RUN TREND
The reversal of trend that showed up in the 1980s did not continue into the 1990s. Rather the inequalityreturned to its long term trend and almost reached the same level as the 1979 figure by 1995. Aninteresting comparison is to look at those counties that contributed to growing inequality in the 1980s tosee if their particular circumstances changed, Table 3. The results indicate that every county thatcontributed to growing inequality in the 1980s has reversed that position and has contributed to a return toless inequality in the 1990s.
If long term policies favor the poor getting poorer and the rich getting richer, we should have expectedthat those counties listed as upwardly divergent in Table 2 would have continued to improve their relativepositions. In fact none of them did.
By the same reasoning, we might reach the conclusion that those counties listed as downwardly divergentmight have continued to lose relative position in the state if those places were truly lacking in the capacity
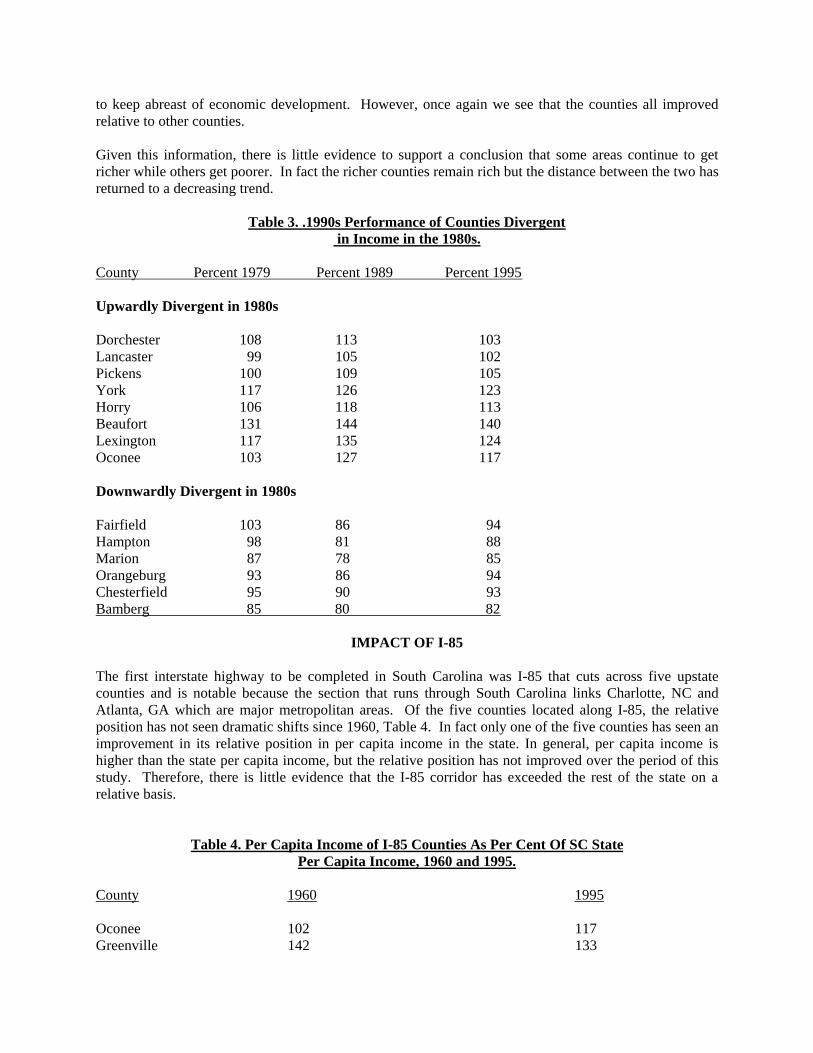
to keep abreast of economic development. However, once again we see that the counties all improvedrelative to other counties.
Given this information, there is little evidence to support a conclusion that some areas continue to getricher while others get poorer. In fact the richer counties remain rich but the distance between the two hasreturned to a decreasing trend.
Table 3. .1990s Performance of Counties Divergent in Income in the 1980s.
County Percent 1979 Percent 1989 Percent 1995
Upwardly Divergent in 1980s
Dorchester 108 113 103Lancaster 99 105 102Pickens 100 109 105York 117 126 123Horry 106 118 113Beaufort 131 144 140Lexington 117 135 124Oconee 103 127 117
Downwardly Divergent in 1980s
Fairfield 103 86 94Hampton 98 81 88Marion 87 78 85Orangeburg 93 86 94Chesterfield 95 90 93Bamberg 85 80 82
IMPACT OF I-85
The first interstate highway to be completed in South Carolina was I-85 that cuts across five upstatecounties and is notable because the section that runs through South Carolina links Charlotte, NC andAtlanta, GA which are major metropolitan areas. Of the five counties located along I-85, the relativeposition has not seen dramatic shifts since 1960, Table 4. In fact only one of the five counties has seen animprovement in its relative position in per capita income in the state. In general, per capita income ishigher than the state per capita income, but the relative position has not improved over the period of thisstudy. Therefore, there is little evidence that the I-85 corridor has exceeded the rest of the state on arelative basis.
Table 4. Per Capita Income of I-85 Counties As Per Cent Of SC StatePer Capita Income, 1960 and 1995.
County 1960 1995
Oconee 102 117Greenville 142 133
Spartanburg 133 117Anderson 137 110Cherokee 105 96
THE COASTAL EFFECT
Another factor in economic growth can be seen in the geographic differences in the state. South Carolinahas six counties that border the Atlantic Ocean, though four of those have the vast majority of access.During the period of this study, tourism in the state increased tremendously. The result was a largeincrease in economic activity in the coastal centers and resulting increases in income in those regions,Table 5. Every county that borders the Atlantic Ocean has had an increase in its relative position of percapita income. The two coastal counties that have not yet reached 100% of the state per capita income arethe two counties that have very limited coastal resources.
Table 5. Per Capita Income of Coastal Counties as Per Cent of South Carolina State Per Capita Income, 1960 and 1995.
County 1960 1995
Charleston 123 127Horry 100 113Georgetown 87 110Beaufort 119 140Jasper 61 92Colleton 82 87
CONCLUSIONS
Based on the analysis of the long term trends in county per capita income, it appears that there is littleevidence that poorer areas are falling further behind. While the richer counties have tended to remainrich, the other counties are improving their relative position. It can be argued that the economicdevelopment policies of the state have over the long run yielded a society that is more egalitarian on acounty per capita income basis.
While it is understandable that concerns would have been raised after the 1980s when it appeared that thelong run trend towards more equality had reversed, this analysis indicates that those poorer counties thatlost relative position in the 1980s have all reversed that circumstance during the 1990s. It is beyond thescope of this paper to investigate any development policy changes that may have contributed to thatresult, but it does appear that concerns about economic development policy are not supported by theresults.
REFERENCES
[1] Coughlin, Cletus C. and Thomas B. Mandelbaum. “Why Have State Per Capita Incomes DivergedRecently?”. Federal Reserve Bank of St. Louis Review. Volume 70, No. 5. September-October 1988.
[2] Halfway Home and a Long Way to Go. Southern Growth Policies Board. 1986.

[3] Shadows in the Sunbelt. A Report of the MDC Panel on Rural Economic Development. Chapel Hill,NC. May 1986.

THE MORTGAGE INDUSTRY NEEDS EDI
Emily Smith, Homelenders, 120 Tombigbee, Florence, AL 35630Tommie Singleton, Keith Absher, University of North Alabama, Florence, Alabama 35632
ABSTRACT
For many years, the mortgage industry has had to generate enormous amounts of paper documents tosubmit loan packages to underwriters. Mailing, faxing, and using express couriers have long been theoptions for sending these documents where they need to go. However, the development of technologythrough electronic data interchange (EDI) and via the Internet have been able to reduce the costsassociated with generating these paper documents, the costs associated with sending these documents, andthe costs associated with the time it takes to generate these documents.
COSTS OF NOT USING EDI
One of the costs of not using EDI to send mortgage documents is the cost of generating paper documents.The cost of generating paper documents not only includes the cost of the paper, but also the cost ofprinting the paper and the cost of copying the paper. Embedded in the costs of printing and copying thepaper are such things as the cost of a printer or copier, the cost of maintenance to the printer or copier,the cost of electricity to run the printer or copier, and the cost of toner or ribbons.
Another cost to mortgage companies who do not use EDI is the cost of document submission. Perhaps ofone the oldest means of sending mortgage documents from one place to another is by mail. One of thebiggest disadvantages of using the mail to submit mortgage packages to underwriters is the delay in thereceipt of the packages. Often mortgage companies need an approval on a loan as soon as possible sothey can close the loan within a designated time frame, The use of the mail in sending a package maydelay this answer longer than necessary.
Mortgage companies often use the technology of a fax machine to submit loan documents to underwriters,too. However, only a limited amount of information can be transmitted via this mode becauseunderwriters often require original documents for most information. Documents sent to an underwritersuch as appraisals, monitoring statements, verifications, mortgages, assignments of mortgages, notes, andinspections, usually must be signed, original documents that cannot be accepted over the fax machine.Therefore, some other means must be used to submit these documents.
The use of express couriers also allows mortgage companies to submit loans. While their use allows forquick submission of original documents, the biggest drawback of express couriers is the monetary cost.Borrowers wishing to obtain a mortgage often feel that they are bombarded with costs to close a loan. Anexpress courier fee is yet another cost that is often quite expensive, and borrowers often do not thinkabout this cost until the time of the closing--when they must pay it.
Time is also a cost to companies not using EDI. For example, the amount of time spent printingdocuments, the amount of time spent copying documents, and the amount of time spent assemblingdocuments in packages is reduced through the use of EDI. Eliminating printing time is especially helpfulif employees must wait for documents to print on a network or if there is a problem with the printer.Employees also spend much time copying the many documents for submission in mortgage packages.Depending on the number of documents necessary in a particular loan package, employees may spendanywhere from 15 to 30 minutes just copying a loan package--not including the amount of time spent

assembling the package. The cost of time spent for assembly would probably be one of the greatestreductions. Personnel would no longer have to stack mounds of paper documents to be submitted to anunderwriter in a particular order. Nor would they have to spend time preparing the packages for shipping.Therefore, this time could be spent more efficiently by inputting the extra mortgages that could beprocessed.
INTRODUCTION TO EDI
EDI is more than just using computer. Schultz offers one definition of EDI:
"EDI is the alternative many kinds of companies are applying to reduce the need for printedforms. EDI automates the generations, processing, storage and retrieval of information thatotherwise accrues on forms" (Schultz, 89).
EDI can be used via a modem, or it can be used through the Internet which is more commonly becomingthe case. According to William Horton, "Several publication departments I know are under executivemandates to get everything online by a certain date" (Horton, 90). The same is true in the mortgageindustry. For example, the Department of Veterans Affairs (VA) is planing to mandate the use of theAutomated Clearing House (ACH) program by June 1997 for funding fees that lenders must remit to VA.This ruling is to be published in the Federal Register. ACH will be activated by electronic funds transfer(EFT) through Mellon Bank. This program will eliminate the use of VA Form 26-8986, which is theLoan Guaranty Funding Fee Transmittal (U.S. Department of Veterans Affairs, 1996). By using thisprogram, these transmittals and a check for the amount of the VA Funding Fee no longer have to be sentby mail, and lenders no longer have to wait for a response to be sent back by mail.
The reasons for using the online documentation that can be provided by EDI go beyond just eliminatingpaper documentation or trying to keep up with your competitors (Horton, 90). In the race to use lesspaper and to get online, competition often must be put aside. For example, as Dan McLaughlin said: "Wemust include [business partners] in our redesign plans, even if that means sharing some of the benefits ofour efforts with competitors" (McLaughlin, 94).
TYPES OF TECHNOLOGY
One of the major agencies pushing for the implementation of EDI to reduce the amount of paperwork thatit must handle is the U.S. Department of Housing and Urban Development (HUD) . In 1994, thePaperwork Reduction Working Group was established within HUD (HUD, 1996). The group's first stepin this process was to reduce "... the paperwork involved with closing packages and the insuringprocess" (HUD, 1996). However, through the use of such software systems as ECHO, HUD is promotingthe use of EDI to make its work more efficient. Single family mortgage insurance claims, mortgage loandefault reporting, and mortgage record changes and terminations are provided through EDI filingprovided by HUD (http://www.hud.gov/edi/edi.html, 96). HUD even provides a newsletter on the Internettitled, "HUD EDI Updates" to keep users of EDI programs provided by HUD abreast of HUD's latestservices (http://www.hud.gov/edi/edinews.html 95).
Another type of EDI technology used by the mortgage industry is the ECHO network software. In mypersonal work environment, our company uses the CHUMS' Lender Access System (CLAS) element ofthis software to order and receive FHA Case Numbers and Appraiser Assignments. This softwarenetwork is primarily used by the Department of Housing and Urban Development (HUD). However,there are many other uses for this system.

In addition to my company using the ECHO software to order FHACase Numbers and AppraiserAssignments, we can now receive HUD's Credit Alert Interactive Voice Response System (CAIVRS)Authorizations, which confirm any bad debts on government loans, through EDI. Previously, we had tocall on the telephone to receive a CAIVRS Authorization. Now, we can receive a CAIVRS Authorizationat the same time that we receive a FHA Case Number and Appraiser Assignment. Since we no longermust twice fill out separate paperwork on forms that both require the same basic information, much timeis saved.
For those systems with the additional capabilities, ECHO can also do many other things. For example, itcan check the status of loans; check the status of mortgage insurance certificates (MICs), which are thelast step in completing a FHA loan; request duplicate MICS; check the amount of mortgage insurancepremium (MIP) due on a FHA loan; and request an insurance endorsement, which replaces the formHUD-54111 ("Process FHA Loans Faster with the CLAS 8.OB Software", 96). In addition to thesecapabilities, there are many other capabilities of this software network. However, they are too numerousto be listed herein.
Another type of EDI tool is the Mortgage Electronic Registration System (MERS). This system is "...aproposed mortgage promises to streamline today's paper-intensive mortgage assignment process"(Cocheo, 96). MERS is a database project in the works by the Mortgage Bankers Association of Americathat can electronically transfer recorded assignments. The way this project works is that an assignment ofmortgage is recorded into the MERS database at the county courthouse of the mortgage origination, and itis given a permanent Mortgage Identification Number (MIN) to use throughout the life of the loan. Whenthe mortgage is subsequently sold, the selling information will be entered into the database with MERS ".. .[remaining] the mortgage of record on the local books for the life of the loan". Anyone needing toretrieve information concerning the sale of a loan will then be able to receive it through the EDIcomponent of MERS.
The use of EDI automation in the mortgage industry has gone beyond just using it in processing.Originators are using EDI to take mortgage applications in person and over the Internet. The use of EDIby originators in the initial mortgage application process eliminates originators having to take paperapplications and then give them to processors to be inputted into the computer to thus generate more(typed) paper applications for submission to underwriters. By using EDI, some originators are now ableto send the initial application directly to underwriters for pre-approval via the Internet.
Contour Software, Inc., a mortgage software company that offers many different types of mortgageprocessing applications, has created a software program called "The Homebuyer's Guide" ("TheHomebuyer's Guide", 96). This program was created to be primarily a marketing tool for mortgagebankers to give a copy to prospective clients to take with them to help the clients understand the mortgageprocess. The disk has the name, address, and telephone number of the mortgage company encrypted intoit for constant display on the screen during use. There is a two-fold benefit to mortgage bankers who usethis program. Included in this program is the FNMA 1003 (the loan application). The mortgage bankingcompany can use the disk to load the already completed loan application into its database. The mortgagecompany benefits from using a cutting edge marketing tool and by saving the time and paper used in thetraditional application process. EDI can be incorporated into this disk method by the Internet. It isespecially useful for those who have trouble getting to a mortgage company during normal businesshours.
One other way EDI is being used to automate mortgage processing is by using it to file hazard insurancerenewals. The process of paying for hazard insurance renewals has been deemed "... one of the mostpeople-intensive processes in mortgage banking. . . " (Mechan, 94) .This process involves at a minimum
the client, the mortgage company, the attorney closing the loan, the insurance company, and theunderwriter. The process also involves many papers changing hands.
The Mortgage Bankers Association of America's Technology Committee currently has a proposal beforeit to adopt the use of existing EDI technology in the hazard insurance renewal process. However, thereare no existing means to do this. An initiative toward "nationally accepted standards" is beingundertaken to help implement this process. Types of existing EDI technology, such as ASC X12, havebeen proposed to help achieve this task.
Credit reporting agencies, such as Chase Credit Research, have made their software compatible with otherloan processing programs in the effort to further EDI, For example, Chase Credit Research teamed upwith Contour Software in 1991 by "... [introducing] a software system that could read Contour borrowerdata and update that same data file with current credit report information on the user's computer"("Seamless", 96) . Being able to transfer a file rather than having to re-enter credit information is a majortime saver for loan processors who previously had to key in a borrower's credit information by handinitially and then change the information after the credit report was updated. Through EDI, the updatedcredit information that is retrieved via a modem from the credit agency can be directly imported into theexisting file of a borrower.
ADVANTAGES
With such a wealth of technological advances in the mortgage industry, it is almost senseless not to use asmuch of the available technology as a business can afford. Competition is now not only based on theservice that a mortgage company can provide but perhaps more on the speed at which it can complete themortgage process. By being able to provide more speed, EDI can provide the competitive edge that acompany needs.
In the long run, it is less expensive to use the technology. Economies of scale exist from automating--especially for mortgage companies that do a large volume of business. EDI reduces loan origination timeand loan processing time (Propper and Furino, 94). The use of EDI can also reduce the need foradditional personnel by allowing fewer employees to originate and process more loans in less time.
By linking the many different parts of the loan process together employees are able to do their job moreefficiently and in less time because they can input information once and distribute it to many differentplaces through the use of EDI. By having to input information only once, the number errors that used tobe made by having to recopy information many times are reduced.
Despite the extensive availability of EDI software, many mortgage companies still have not automatedtheir systems. According to MORTECH (a biannual study of technology in the mortgage industry), in1994, 78.8 percent of mortgage companies reported having automated loan production. At the same time,only 53. 9 percent had automated their secondary marketing operations (Lebowitz, 96).
DISADVANTAGES
Believing that there can be total elimination of the use of paper from the mortgage industry is unrealistic(Hershkowitz, 92). Paper will probably always be used in the mortgage industry to some extent, if for noother reason than the fact that some people are uncomfortable with the use of EDI and would rather signon a line that they can see on paper. A concerted effort of management and employees in a company willbe needed to implement the use of EDI. However, there will still be those who may fall by the waysideby not being receptive to this changing technology and by still preferring to use paper documentation.

Implementation of a standardized means of mortgage document recording will take time because manymortgage companies, as well as other participants in the mortgage process, lack the means to install theEDI systems needed to streamline the mortgage process. Mortgage companies must select from manydifferent EDI systems. Although "...the [Mortgage Bankers Association] is working to develop standardsthat will simplify communications and meet demands for information," it could take a long time until thestandards are established (Hershkowitz, 92). Until then, mortgage companies will have to pick andchoose which EDI systems they will use.
RECOMMENDATIONS
In order for a mortgage company to administer an EDI system, it must have the support and input ofemployees on all levels. For example, "...NationsBanc, BancBoston [now HomeSide Lending, Inc.], andShelter were asked to share the lessons they learned from implementing and operating their systems".These mortgage companies identified three basic elements for implementation: (1) an interdepartmentaltask force with the authority to select a system, (2) a project manager who knows the underwritingbusiness; and (3) a shakeout period to identify and correct problems (Panchura, 96).
NationsBanc Mortgage Corporation even provided "a comprehensive training program" consisting of " ...five days of classroom training, hands-on experience with the system and one-on-one mentoring at thework site", NationsBanc Mortgage Corporation's system of EDI implementation is perhaps one of the bestexamples of how to provide the necessary training and support for a new EDT system.
CONCLUSIONS
In general, most of the literature written concerning the use of EDI in the mortgage industry favors itsuse. However, there will still be obstacles to overcome to implement EDI. When the use of paper in themortgage process is compared to the use of EDI in the mortgage process, the solution is obvious. Afterreviewing the different types of EDI technology available, it is apparent that a business should implementas much of the use of EDI as it possibly can in order to save time and money. By implementing the use ofEDI, a mortgage company is also able to stay competitive with other companies in the industry. EDI is nolonger an option--it is a means of survival for a company in the mortgage industry.

REFERENCES
Cocheo, Steve. "Moving from Paper to Blips."ABA Banking Journal 88 (January 1996): 48, 50.
Hershkowitz,Brian."Technology: Mortgage Bankers Association of America's Paperless DeliverySystem" Mortgage Banking 52 (June 1992), 91.
Hershkowitz, Brian. "Cutting Edge Solutions (Standards for Mortgage Bank Interaction with FannieMae, Freddie Mac, and GNMA)" Mortgage Banking 52 (March 1992), 33.
Horton, William, "Death, Taxes, and Online Documentation." Technical Communication 37 (August1990): 290-291.
Lebowitz, Jeff. "The Dawning of a New Era." Mortgage Banking 56 (June 1996): 54, 60-61.
McLaughlin, Dan. "The Year of the Wake-Up Call." Mortgage Banking 55 (November 1994): 127.
Mechan, Tom. "A New Technological Era for Hazard Insurance Renewals." Mortgage Banking 54(February 1994): 89.
Panchura, Stanley M. "Up and Running." Mortgage Banking 56 (May 1996): 22-24.
"Process FHA Loans Faster with the CLAS 8.OB Software." United Communications Group. (ECHOInformational Advertising Pamphlet, Rockville, Maryland, 1996).
Propper, Mindy S., and Richard D. Furino. "The Revolution in Mortgage Origination." MortgageBanking 54 (June 1994): 66.
Schultz, Brad, "Echo--only a Beginning." United States Banker 98 (March 1989): 59.
"Seamless ' Windows Mortgage Solutions." Contour Software, Inc. (Informational Advertising Pamphlet,Campbell, California, 1996), 5.
"The Homebuyer's Guide." Contour Software, Inc. (Informational Advertising Pamphlet, Campbell,California, 1996), 2.
U.S. Department of Housing and Urban Development Home Page: "Electronic Data Interchange(EDI)." http://www.hud.gov/edi/ edi.html (17 November 1996).
U.S. Department of Housing and Urban Development Home Page: "HUD EDI Updates." October 1995.http://www.hud.gov/edi/edinews.html (17 November 1996).
U.S. Department of Housing and Urban Development. Mortgage Letter 96-29. Washington, D.C.: Officeof the Assistant Secretary for Housing-Federal Housing Commissioner, June 19, 1996.
U.S. Department of Veterans Affairs. "In Reply Refer to: 264." Washington, D.C.: Veterans BenefitsAdministration, February 21, 1996.
1
THE ROLE OF INFORMATION SYSTEMS IN EXPERIMENTAL ECONOMIC MARKETS
Eileen Kerns, Purdue University, West Lafayette, INCharles L. Gardner, Jr., Eastern Kentucky University, Richmond, KY 40475
ABSTRACT
Historically, the field of economics has centered on the idea that a market will stabilize at someequilibrium price where the costs to the producer match the benefits to the consumer. That is, producers'actions are driven by an upward-sloping supply curve and consumers' actions by a downward-slopingdemand curve, and the mutually beneficial intersection of these curves will eventually be attained with thehelp of the invisible hand. In reality, however, supply and demand curves are not directly observable, sothe understanding of such markets has been largely theoretical. Advances in computer technology havemade it possible to perform controlled laboratory experiments that imitate actual markets, thus making itpossible to understand if, how, and why market equilibrium is attained under various circumstances.
There are many reasons that economists perform laboratory experiments. Experiments can be used to testor discriminate between theories, as well as to investigate the causes of the failure of a theory. Forexample, the producer-consumer relationship can be simulated, where participants are designated as eitherproducers or consumers, each facing a realistic set of costs, needs, and situations. The experimenter thenobserves how the subjects behave and whether market equilibrium is attained. Experiments are also usedto compare environments using identical institutions or compare institutions using identical environments.This allows economists to observe the stability of various environments and institutions in a controlledenvironment. While most environments and institutions can be observed in practice somewhere in theworld today, such observations cannot be objectively compared because the wide variety of surroundingconditions. In a laboratory experiment, the ceteris paribus contingency is feasible. Experiments can beused to evaluate policy proposals and test new institutional designs. That is, the feasibility of a proposedmarket regulation, as well as the complications that can be expected, can be directly observed in alaboratory experiment, and the results of the experiment can be used to help shape new markets.
The field of experimental economics is a large and rapidly growing one. Therefore, this paperwill focus only on one aspect of it. Specifically, it will explore the area of experimental markets, wherefree trade markets, such as stock markets and retail markets, are mimicked in an effort to betterunderstand how such markets operate. In these experiments, the "rules" can be changed during the courseof the exercise, a research concept that is not possible when observing real-world transactions. Thus, it ispossible to examine whether a market might operate more efficiently under different constraints, and totest economic theories that have never been observable in the real world.
History of Experimental Economics
The first market experiment was conducted in 1948 by Edward Chamberlin. In this exercise, studentstook on the roles of buyers and sellers who paired off in an attempt to negotiate mutually agreeable prices.If a transaction was successful, the price was posted. Otherwise, traders would regroup into new buyer-seller pairs and negotiation would resume. In Chamberlin's experiments, prices did not converge to thetheoretical equilibrium price. Many economists believe that the main reasons Chamberlin's experimentsfailed were that the traders had no incentive to attain equilibrium, and that the setup of the experiment,where traders paired off to negotiate prices, was not ideal.
In 1956, Vernon Smith attempted to develop a more realistic market environment for such experiments.
2
Smith overcame the incentive problem by offering a cash bonus to participants. Here, subjects were givencards indicating the value of purchasing or cost of providing one unit of a hypothetical commodity. Thebuyers and sellers only knew their own values and costs (as indicated on their cards) and not what thetheoretical equilibrium price was. Participants were informed that cash bonuses would be paid equal tothe difference between their costs or values and the prices they negotiated in the experiment.
Smith also altered the setup of the experiment, replacing the pair wise negotiation setting with a doublecontinuous auction. Here, any trader can announce a bid or offer to the group, and a trade occurswhenever a buyer accepts an offer or a seller accepts a bid. This setup is preferable to the pair wisenegotiations because it is believed that knowledge of the bids and offers of other traders helps each traderto guide the market toward equilibrium. Also, traders are not constrained to simply being "buyers" or"sellers"; buyers can buy shares and then turn around and sell them and vice versa. In Smith'sexperiments, prices converged to the theoretical equilibrium quickly and dependably, thus affirming thetheories of why Chamberlin's experiments were unsuccessful.
Information Systems in Experimental Economics
Early experimental markets were chaotic and difficult to control. Subjects were gathered in a room toexchange bids and offers while the experimenter attempted to record all of the trades that took place.Advances in information systems have helped the field of experimental economics tremendously. Now,computers are the intermediaries between the buyers and sellers, and data is automatically recorded.
This improvement has numerous advantages over the non-computerized tests that were performed earlier.First, more control over the information provided to subjects is possible. This includes the instructionsgiven at the beginning of the experiment, additional help during the course of the experiment, andinformation about trades that have already taken place. Before, the quality of this information wasdependent upon the consistency of the experimenter. The experimenter could give incomplete instructionsor may have been unavailable to answer questions during the experiment. Also, the large volume ofinformation that was exchanged may have been difficult for the subjects to follow, thus giving themincomplete information about past trades. With computerized market experiments, instructions areprovided through a series of instructional screens that subjects can read at their own pace and refer backto if necessary. Furthermore, relevant information about past trades is always available to the subjects inan organized format; thus making it possible for them to make informed trading decisions. The fact thatthe experiments can be better controlled through computerization makes it possible to conduct parallelexperiments, altering only one variable and keeping all other variables constant. This allows economiststo compare the effects of market variables, all other things being equal.
Another advantage of the computerized market experiments is that extra information can be tracked that isnot necessarily relevant to the current experiment. This makes it possible to re-analyze the results of pastexperiments using new theories. This was not possible in the past because the large volume ofinformation that was being exchanged made it difficult to even record the data that was needed foranalysis, thus making it impractical to bother with additional information that might be useful in thefuture.
Next, computerized market experiments are automated, and thus are more efficient than their obsoletepredecessors. The data-entry phase of the analysis is eliminated, thus removing a typical source of errorsin the analysis of the data. Also, advances in computer software provide experimenters with the means toexamine the data on their own. While a computerized analysis of the data in the past would have requiredadvanced programming skills to coax the desired information out of the computer, fourth generation

3
programming languages make computer programming more accessible to the general public. This make itpossible for the experimenter to design and change the specifications of his or her data queries withoutany outside assistance.
Finally, the expansion of experimental economics into the world of computers makes it possible toconduct longer-term experiments, as they do not require the subjects to be present. While mostexperiments are still conducted with the subjects in the laboratory and only last a day or two, some allowparticipants to trade from their homes or offices by having their computer dial into the testing center andconducting trades via communications lines. These experiments generally run over a longer period oftime, which is why the experimenters do not attempt to keep the subjects in the lab throughout theprocedure. This is true of the experimental election markets, which will be discussed in more detail later.
Results of Market Experiments
When well modeled, experimental markets have been rather accurate in mimicking their real worldcounterparts. Even phenomena that were illogical and could not be explained by theorists have beenduplicated in experimental markets. One example of this is the speculative bubble, where market pricesrise to unbelievable levels then crash without warning. This was the case when the US stock marketcrashed in 1987, and when the price of tulip bulbs in Holland crashed in the 17th century. Theoccurrences of speculative bubbles are contrary to the theory of rational expectations, though, soeconomists did not believe they would occur in properly modeled experiments.
The rational expectation model indicates that the market price of an asset is governed by thereturn that the investment is expected to produce. If all market participants have the same expectations ofan asset's return, they should all have the same opinion of the asset's worth, and therefore speculativebubbles should not occur. However, when this situation was simulated in an experimental market, thebubbles still occurred. Here, subjects were given complete information about the inherent value of theshares before the trading began, and the experiment was run with the same subjects on three separatedays.
On the first two days of the experiment, prices began far below the fundamental value of the shares, roserapidly to levels far above it, and remained inflated until they crashed during the last few trading periods.Thus, the speculative bubble occurred on both of these days, although it did not last as long on the secondday. By the third day, prices reflected the intrinsic value from the start, and the bubbles were virtuallynonexistent. However, the fact that economists were able to duplicate the speculative bubbles in anexperimental market does not necessarily mean that they understand these occurrences. In fact, theexperimenters made numerous adjustments to the experiment in an effort to eliminate and/or explain theseoccurrences, but were unsuccessful. The bubbles persisted within various institutional settings, withsubjects of all backgrounds, and with subjects possessing varying amounts of market information,although some experimental situations produced less severe bubbles than others.
Employment markets have also been simulated in the laboratory in order to test a theory. Ronald Coase, aNobel Prize winner, believed that employees were hired on long-term contracts because it would beexpensive and inefficient for the hiring company to negotiate salaries on a per-unit basis, particularlywhen the employee's responsibilities were widespread. Per-unit contracts are only efficient when thevalue of the task being negotiated is clearly defined for both negotiating parties. In the simulation, tradershad to decide whether they wanted to negotiate long-term or one-shot contracts in each round of trading.The amount of information provided to traders was varied in each round to examine whether theybehaved rationally under different circumstances. As Coase predicted, long-term contracts werenegotiated when traders had limited information about each other’s costs and benefits, while one-shot
4
contracts resulted when complete information was available to both parties.
Finally, various market institutions have been simulated in an effort to determine which are most efficientat achieving market equilibrium. The double continuous auction setting, which was described earlier, istypical of today's commodity and stock markets. In this setting, prices tend to fluctuate drastically untilthe final few trading periods, at which time they would settle astonishingly near the expected equilibriumprice. Also, trading volume conformed to competitive price theory, increasing when prices increased anddecreasing when prices fell. Even when the experimenter changed the equilibrium price, the markettracked it very well.
Posted-offer pricing is a market setting where sellers set a price and buyers decide how many units theywant to purchase at that price. This setting is typical of many retail and service markets in the UnitedStates. This market setting proved to be extremely inefficient at achieving equilibrium, and tended tocontradict competitive price theory, yet it is still a widely used market institution. The fact thatnegotiating costs do not exist here make it the ideal setting for large, stable markets where the value of theitem being traded is fairly small. Thus, the posted-offer-pricing model is appropriate for retail markets,where it would be inefficient to negotiate prices for every item during every trip to the grocery store.However, this is not an appropriate trading model for unstable markets, such as commodity markets,where the cost to traders can be large when equilibrium is not attained.
In the double-sealed auction institution, bids or offers submitted by traders are matched and executed by athird party. Here, traders submit their bids and offers via computer, then the computer finds matching bidsaccording to the rules that it has been programmed to execute, and the trades are either completed orrejected. That is, when a bid and offer for the same price exist, the two are matched and the trade iscompleted. However, when a submitted bid falls outside the range of order prices or vice versa, the tradeis rejected and traders are informed of current market prices. In this setting, equilibrium prices wereattained just as effectively as in the double-continuous auction setting. However, this institution hadseveral advantages over the double-continuous auction. First, the variance of prices was far lower in thedouble-sealed auction. Second, price discrimination was eliminated. Finally, the transaction costs aremuch lower in this setting. These findings imply that, as the US stock and commodity markets moveaway from face-to-face transactions toward computerized trading procedures, there may be benefits inmoving from the double-continuous auction toward the double-sealed auction institution.
There are numerous other market institutions, most of which can be simulated in laboratory experiments.This includes English auctions, where each tick of the auction clock sends the price higher until only onebidder is left, and Dutch auctions, where the ticking clock lowers the price until a bid is made.Theoretically, these two markets should achieve the same results, but subjects in laboratory experimentstend to make more mutually profitable decisions under the English auction rules, and the two neverconverged on the same price. This is a good example of how experiments can contradict long-acceptedtheories. This does not necessarily mean the theory is wrong or the experiment was poorly modeled; itmerely means that experimenters and theorists should both re-examine the premises of their models inorder to explain this discrepancy.
Applications
Beyond providing a controlled environment for developing, testing, and comparing theories, experimentalmarkets are also a valuable tool for shaping real markets, for teaching people how to participate in tradingmarkets, and for examining and predicting the behavior of non-economic fields. In some of these cases,laboratory experiments are performed as described above. In other cases, however, such as using these

5
markets as a teaching tool, it is merely the technology of the experimental markets that is utilized, ratherthan the experimental setting.
A growing area of experimental economics is the development of new markets in a controlled setting.This is becoming a valuable mechanism for allocating scarce resources among companies in an industryor departments within a single company. For example, pollution control in Southern California is aserious issue, as there are many industries, which pollute the environment, and few equitable ways toregulate emissions. Experimental markets were used to evaluate a variety of ways to allocate pollutionrights. As a result, tradable emission permits are now issued to firms in this area. A firm that is able tokeep its emissions lower than what he is allotted can sell his extra permits to a firm that cannot stay withinits allowed limits. Thus, the total amount of pollution that is delivered into the environment is controlledin the manner that is most cost-effective for everybody involved.
Experimental markets are also being used to develop an equitable way to allocate scarce resources amongvarious projects at the National Aeronautics and Space Administration (NASA). Here, researchersworking in different departments or on different aspects of a project can trade allocations for powerconsumption, funding, data-transmission requirements, and mass among themselves in order to achieveoptimal spacecraft performance. After experimenting with a variety of trading environments, a "smartbarter" system was developed. With this system, multi-way trades are possible, so one department with afunding surplus but not enough power can simultaneously trade its extra funding for mass with onedepartment and the mass for power with another department. As a result, optimal allocation of theseresources can be achieved.
The technology of experimental economics has been useful in educating people who have neverexperienced trading in free markets. For example, when the former Soviet Union disbanded, manynations, that had never experienced trading, were suddenly faced with such prospects. The computerizedmarket simulations that are used in experimental economics are ideal for providing these nations with theinformation and experience that they need if they are to succeed in developing a non-socialist economy.Therefore, experimental markets have been set up in Hungary, Poland, and Czechoslovakia wheregovernment officials and utility managers are given the opportunity to learn about and experiment withthese environments.
One other application of experimental economics is the formation of election markets. Here, "shares" ofeach candidate in a political race are traded in an experimental market. For example, for the upcomingpresidential election, market participants could purchase portfolios consisting of one share each ofClinton, Dole, Perot, and "rest of field" for $2.50. After the election takes place, each share would beworth $2.50 times the fraction of the popular vote that the candidate received, so the value of the originalportfolios will still be $2.50. However, subjects are allowed to trade their shares of the candidatesseparately, thus breaking up the portfolios and allowing for profits and losses. Trades are made on thebasis of which candidate each subject believes is most likely to win the race, rather than which candidatea subject prefers. As a result, these markets have proven to be extremely accurate in predicting theoutcome of political races.
Conclusion
The variety of factors that influence the supply and demand for goods, services, and commodities is sowide that the supply curve or demand curve for a particular good can never be directly observed, so it isnever possible to determine whether a market has attained its equilibrium price. The field of experimentaleconomics cannot help in this regard. However, this field is useful in evaluating the mechanisms that

6
govern these markets, thus providing economists with information about which mechanisms are mosteffective in a given market. Therefore, while we may never know if a particular market is in equilibrium,we can at least be assured that the market is operating under rules that make equilibrium probable.

7
REFERENCES
Forsythe, Robert and Nelson, Forrest, "Anatomy of an Experimental Political Stock Market," AmericanEconomic Review, v82 n6, December 1992, 1142-1162.
Porter, David and Smith, Vernon, "Futures Contracts and Dividend Uncertainty in Experimental AssetMarkets," The Journal of Business, v68 n4, October 1995, 509-543.
Smith, Vernon, "Economics in the Laboratory," Journal of Economic Perspectives, v8 n1, winter 1994,113-132.
Smith, Vernon and Williams, Arlington, "Experimental Market Economics," Scientific American, v267n6, December 1992, 116-121.
Wallich, Paul, "Experimenting with the Invisible Hand," Scientific American, v267 n4, August 1992,121.

NONFINANCIAL FACTORS THAT AFFECT HOSPITAL PROFITABILITY
C. Lankford Walker, Eastern Illinois University, Charleston, IL 61920 (217) 581-6009
ABSTRACT
This study shows PPS to have two general effects on hospitals: ashort-term effect and a long-term effect. The short-term effectrequires that, in general, hospitals at least attempt to model businessbehavior. The long-term effect is more complex in that survivaldepends on the use of debt in the capital structure and onmanagement’s ability to adopt a strategic management orientation. This new orientation will embody both financial and nonfinancialfactors.
INTRODUCTION
During the period 1960-1982, hospital expenditures grew rapidly. The average cost per admission increased from $245 in 1960 to$2,885 in 1982 [Feldstein, 1993]. During that same period, total costsincreased from $5.6 billion to $105.1 million [Feldstein, 1993].
Hospitals were protected from these cost increases because they werereimbursed for the full costs of the services they provided. Thisreimbursement procedure provided no incentive for hospitals tocontain the costs of the services they provided, and it may haveprovided an incentive to increase the charges to selected patientgroups. By 1980 serious concerns were raised among policymakers,employers, and insurance companies as to whether affordable healthcare for the public could be maintained.
To meet this concern, the Health Care Financing Administration(HCFA) changed its reimbursement mechanism for Medicare patientsin 1983 from traditional, cost-based rates to fixed, predeterminedrates. This new prospective payment system (PPS) was designed toincrease control over federal expenditures on Medicare (andMedicaid) and to improve hospital efficiency. The basis for PPS waspredetermined fixed payments for 468 diagnostic-related groups(DRGs).
Under PPS, hospitals are allowed to keep any savings that accrue iftheir costs are below the reimbursement rate. However, hospitalsmust absorb any loss incurred as a result of costs exceeding thereimbursement rate. The focus of PPS is operating costs, althoughthere are adjustments for medical education and capital expenditures. PPS is also adjusted periodically for differences in wage levels indifferent markets.
Previous studies ([Russell, 1989], [Shortell, Morrison, and Friedman,1990], and [Walker and Humphreys, 1993]) have established that PPShas resulted in greater emphasis being given to the business aspects ofoperating a hospital relative the traditional medical aspects. Underthis scenario, the hospital’s profit margin, efficiency, and capitalstructure are expected to be significant components of its return onequity.
HOSPITAL CONTROL AND OWNERSHIP STRUCTURE
As with any organization, hospitals have alternative forms ofownership structure, and these are reflected in its control category. The hospital’s control category is important because it is indicative ofthe organization’s ability to adjust to changing economic conditionsand to take advantage of strategic opportunities. Several categories ofhospital control have been specified by the HCFA. These includeinvestor-owned hospitals, voluntary hospitals, and governmenthospitals.
Investor-owned hospitals are operated to make a profit for theirinvestor-owners. This traditional objective may lead investor-ownedhospitals to be more efficient in the delivery of medical services, toprice their services more aggressively than other ownership structures,and to market their services to selected patients. Investor-ownedhospitals have been criticized for not treating the medically indigentand the poor. Investor-owned hospitals are like any other private firmin that continued operation is a function of profitability. Whileinvestor-owned hospitals may be organized as proprietorships andpartnerships, the predominant organizational structure in terms ofmarket share is the corporation. For this reason, those investor-ownedhospitals organized as proprietorships and partnerships are notincluded in the study.
Voluntary hospitals do not receive direct government funding, andconsequently, cannot operate indefinitely at a loss. Those that do arecandidates for closure. Although voluntary hospitals enjoy a tax-exempt status, they are subject to a nondistribution constraint, i. e.,they cannot distribute their profits to outside parties. A commoncriticism of voluntary hospitals is that they are inefficient providers ofmedical services. HCFA identifies two sub-categories of voluntaryhospitals: those with religious affiliations and those without religiousaffiliations. Hospitals in the latter group are also referred to as secularhospitals. Secular hospitals dominate the hospital industry in bothnumber and market share.
Government hospitals differ from voluntary hospitals in that theyreceive direct support from a federal, state, or local government. Unlike investor-owned hospitals and voluntary hospitals, governmenthospitals can and often do operate at a loss. For government hospitals,closure is not a consideration. VA hospitals are an example of thishospital category.
The reimbursement rates imposed under PPS do not directly reflecthospital control. That is, they do not reflect the way in which hospitalresources are used by management to generate outputs that contributeto the organization's goals. They also do not reflect whether thehospital’s goals are short-term goals or long-term goals.

OBJECTIVES
This study is designed to identify nonfinancial factors that affecthospital profitability. In doing so, however, it is also necessary todetermine the extent to which financial factors influence profitability. For this reason, the first objective is to test the hypothesis thathospitals, in general, operate in a business-like manner.
The remaining objectives focus on nonfinancial factors affectingprofitability. These factors include (1) the age of the hospital’s plantand equipment; (2) the hospital’s commitment to the community asreflected by the amount of charity care provided to the medicallyindigent and the poor, i. e., uncompensated care; (3) the presence of anapproved program for interns and residents; (4) the severity of illnessof the patient population; and (5) the hospital’s ownership structure.
METHODOLOGY AND VARIABLES
Multiple regression analysis is used with the dependent variable beingthe hospital’s return on equity (ROE). In addition to being a measureof the cash flow to owners, ROE is a measure of the extent to whichthe hospital employs debt to enhance its return on assets. It is also anafter-tax measure. For voluntary hospitals, equity will be measuredusing the fund balance concept.
Two groups of independent variables will be used in this study:traditional financial variables and nontraditional variables. Thetraditional financial variables reflect the decomposition of the ROEinto the total asset turnover (TAT), the operating profit margin(OPMARG), and the ratio of long-term debt to equity (LTD2EQ).Together, these variables are used to test the hypothesis that hospitalstend to model business operations.
Six nonfinancial ratios will be incorporated into the model. Two ofthe variables are dichotomous dummy variables that relate toownership structure of the hospital. These dummy variables representthose voluntary hospitals with religious affiliation (RVOL) andinvestor-owned hospitals (IO). The reference structure is the secularhospital. These variables indicate the extent to which form ofownership affects profitability. The mission of the religious voluntaryhospital is generally more altruistic than that of the secular hospital. Traditional financial theory suggests that investor-owned hospitalswill be more efficiently managed than voluntary hospitals since theyare subject to the discipline of the financial markets. There is,however, evidence that investor-owned hospitals are coming underincreased criticism because they fail to provide adequate levels of careto the poor and medically indigent.
The ratio of fixed assets to total assets (FIXED) reflects the age of thehospital’s plant and equipment. Prior to PPS, hospitals acted aspassive recipients of patients provided by physicians, and hospitalmanagers attempted to keep their product market (physicians) happyby expanding plant and equipment. PPS caused the focus to shiftaway from passively accepting physicians’ patients to proactivelyexpanding the patient revenue base and taking a broader, morestrategic, approach to management. For this reason, the sign of thisvariable is expected to be negative.
The fourth nonfinancial variable, NONPAT, is designed to measurethe hospital’s commitment to the community as reflected by theamount of charity care provided to the medically indigent and thepoor, i. e., uncompensated care. Patients receiving uncompensatedcare tend to receive fewer and/or less appropriate medical servicesthan other, insured patients [Freeman, et al., 1987]. Prior to PPS,uncompensated care was paid for through a system of cross-subsidization in which hospitals used patient revenues derived, in part,from third-party payors, to support the costs of uncompensatedmedical care. The proportion of net income accounted for by gifts,bequests, and charitable donations, i. e., other income, is used tocapture the effect of uncompensated care.
The ratio of the number of interns and residents in approved programsto the number of full-time employees (IR) is used to measure theeffect of medical education on the hospital’s ROE. Since the salariesof interns and residents typically exceeds the salaries of other hospitalemployees, the expectation is that as this ratio increases, operatingexpenses will increase and net income will decrease.
A case-mix variable, the ratio of the number of intensive care unitdays to the number of routine care days (IC), is also included in themodel.. This ratio is used as an index of severity of illness of thehospital’s patient population. As this ratio rises, the patient severityindex increases along with the cost of treating the patients. Theexpectation is that as this index increases, ROE will fall sincehospitals will have to absorb a higher proportion of the cost of careprovided.
DATA
Data for this cross-sectional analysis are derived from PPS-XIMinimum Data Set files published by HCFA. This data file includesall hospitals filing cost reports with HCFA during FY1994.
The data were screened in several ways. First, only short-term,general-service hospitals were included in the sample. Second,hospitals with a cost reporting period of less than 365 days weredropped from the sample. Third, each variable was visually screenedfor outliers.
Voluntary hospitals accounted for almost 88 percent of the totalsample, with secular hospitals and voluntary hospitals with religiousaffiliations accounting for 66 percent and 22 percent, respectively.Investor-owned hospitals accounted for the remaining 12 percent ofthe sample.
After the final sample of hospitals was selected, the independentvariables were screened to determine whether autocorrelation existedamong them. None of the continuous variables exhibited a correlationcoefficient in excess of �0.18.
RESULTS
The results of the regression analysis are shown in Table 1. First, thehypothesized equation accounts for almost 40 percent of the variationin the ROE, and its F statistic is significant.

TABLE 1Regression Resultsa
(Dependent Variable: ROE)
Beta Standard
Variable DF Estimate Error Intercept 1 –1.077 0.246
(–4.380)**
TAT 1 0.384 0.049 (7.869)**
OPMARG 1 1.032 0.230 (4.482)**
LTD2EQ 1 0.167 0.006(29.659)**
FIXED 1 –0.993 0.143(–6.969)**
NONPAT 1 –0.012 0.006(–1.875)
IR 1 –0.272 0.370(–0.736)
IC 1 0.212 0.273( 0.766)
IO 1 0.131 0.065(2.011)*
RVOL 1 0.038 0.047 (0.801) F VALUE 117.499** a Numbers in parentheses are t statistics.* Significant at 0.05.** Significant at 0.01.
Each of the three traditional financial variables is significant and hasthe expected positive sign. This supports the hypothesis that hospitalsare systematically trying to follow a business model by emphasizing(1) efficiencies in operations, (2) pricing strategies, and (3) financialleverage.
The ratio of fixed assets to total assets (FIXED) is significant and hasa negative sign. This indicates that hospital managers have discardedthe notion that they should act as caretakers in favor of taking aproactive posture to increase the patient revenue base. This result alsoindicates that hospital managers have adopted a broader, strategicapproach to managing.
The dummy variable for investor-owned hospitals (IO) is significantand has a positive sign which indicates that, all factors being the same,investor-owned hospitals are expected to generate a higher return onequity than secular hospitals. This result supports the hypothesis thatin spite of their shortcoming with respect to the provision of care tothe medically indigent and the poor, investor-owned hospitals aremore profitable than secular hospitals.
Four variables are not significant: NONPAT, IR, IC, and RVOL. These factors, especially NONPAT, may still be important with theproblem being specification of the variable.
CONCLUSIONS
There are several important conclusions that can be drawn from theresults of this analysis. First, hospitals as a group continue to modelbusiness behavior. However, the size of R2 clearly indicates thatvariables other than those suggested by traditional financial theory areimportant determinants of hospital profitability. Second, the focus ofmanagement has changed from passively accepting patients toproactively increasing patient revenues and from internal, short-termmanagement to strategic management. Third, ownership structure is asignificant factor in hospital profitability. More specifically, investor-owned hospitals enjoy a positive return with respect to secularhospitals, probably due to differences in missions. This difference inmissions probably includes the effect of uncompensated care.
In summary, this study has shown PPS to have two general effects onhospitals: a short-term effect and a long-term effect. The short term isthe cleanest. Specifically, the cost constraints imposed under PPSrequire that, in general, hospitals at least attempt to model businessbehavior. The short-term effect mirrors traditional financial theorywith respect to the decomposition of the return on assets. The long-term effect is more complex in that survival depends on the use ofdebt in the capital structure and on management’s ability to adopt astrategic management orientation. This new orientation will embodyboth financial and nonfinancial factors.
REFERENCES
Note: References available up request from C. Lankford Walker.

TABLE 1Sample Composition and
Means of Continuous Independent Variables,by Ownership Structurea
Ownership Structure RVOL Secular IO
SampleNumber 366 1,088 200
(22.1) (65.8) (12.1)VariableTAT 0.977 1.021 1.341OPMARG 1.017 1.012 1.083LTD2EQ1.126 1.465 3.119FIXED 0.458 0.458 0.546NONPAT 0.660 0.215 0.283IR 0.013 0.012 0.004IC 0.095 0.083 0.103a Numbers in parentheses are percent of total.
TABLE 2Regression Results
(Dependent Variable: ROE)
Beta Standard
Variable DF Estimate Error Intercept 1 -1.077 0.246
(-4.380)* *
TAT 1 0.384 0.049( 7.869)* *
OPMARG 1 1.032 0.230( 4.482) * *
LTD2EQ 1 0.167 0.006(29.659) * *
FIXED 1 -0.993 0.143(-6.969) * *
NONPAT 1 -0.012 0.006(-1.875)
IR 1 -0.272 0.370(-0.736)
IC 1 0.212 0.273( 0.766)
IO 1 0.131 0.065( 2.011) *
RVOL 1 0.038 0.047( 0.801)
F Value 117.499* * R2 0.392 a Numbers in parentheses are t statistics.* Significant at 0.05.** Significant at 0.01.

REFERENCES
[1] Altman E. I., et al. Application of ClassificationTechniques in Business, Banking and Finance. Greenwich, CT: JAI Press, 1981.
[2] Anderson, G. F., et al. Providing Hospital Services: The
Changing Financial Environment. Baltimore, MD: TheJohns Hopkins University Press, 1989.
[3] Choate, G. M. and Tanaka, K. "Using Financial Ratio
Analysis to Compare Hospitals Performance." HospitalProgress. Vol. 60, No. 12 (December 1979): 43-58.
[4] Cohodes, D. R. "The Loss of Innocence: Health Care
Under Siege." In Health Care and Its Costs, New York: W. W. Norton & Co., 1986: 64-104.
[5] Conrad, D. "Returns on Equity to Not-for-Profit
Hospitals: Theory and Implementation." Health ServicesResearch. Vol. 19, No. 1 (April 1984): 41-63.
[6] Feldstein, P. J. Health Care Economics, 4th ed. Ann
Arbor, MI: Health Administration Press, 1993.
[7] Freeman, H., et al. "Americans Report on Their Accessto Health Care." Health Affairs, (Spring 1987).
[8] Friedman, B. and Shortell, S. "The Financial
Performance of Selected Investor-Owned and Not-For-Profit Hospitals Before and After Medicare ProspectivePayment." Health Services Research. Vol. 23, No. 2(June 1988): 237-67.
[9] Kelly, J. V. and O'Brien, J. J. Characteristics of
Financially Distressed Hospitals, Hospital Cost andUtilization Project, Research Note. Washington, D. C.: U.S., Department of Health and Human Services,National Center for Health Services Research, 1983.
[10] Lazenby, H. C. and Letsch, S. W. "National Health
Expenditures." Health Care Financing Review. Vol. 12,No. 2 (Winter 1990): 1-26.
[11] Renn, S.C., et al. "The Effects of Ownership and System
Affiliation on the Economic Performance of Hospitals." Inquiry. Vol. 22, (Fall 1985): 21-36.
[12] Russell, L. B. Medicare's New Hospital Payment
System: Is It Working? Washington, DC: TheBrookings Institution, 1989.
[13] Shortell, S. M.; Morrison, E. M.; Friedman, B. Strategic
Choices for America's Hospitals: Managing Change inTurbulent Times. San Francisco, CA: Jossey-BassPublishers, 1990.
[14] Thorpe, K. E. "Health Care Cost Containment:
Results and Lessons From the Past 20 Years. In
Improving Health Policy and Management: NineCritical Research Issues for the 1990s, edited by S. M.Shortell and U. E. Reinhardt, pp.227-274. Ann Arbor,MI: Health Administration Press, 1992.
Walker, C. L. and Humphreys, L. W. "Hospital Controland Decision Making: A Financial Perspective." Healthcare Financial Management, 1993, June, 90ff.[15] [16]

TTRRAACCKK :: HHeeaalltthh CCaarr ee II ssssuueess
"" RReeeennggiinneeeerr iinngg II mmpprr oovveess HHeeaall tthh CCaarr ee SSeerr vviiccee DDeell iivveerr yy:: AA MM ooddeell aanndd aa FFiieelldd SSttuuddyy""WWaall tteerr JJooeell NNoorrrr iiss,, EEaasstt TTeennnneesssseeee SSttaattee UUnniivveerrssii ttyySStteevvee HHaaii llee,,WWaattaauuggaa MMeennttaall HHeeaall tthh SSeerrvviicceess IInncc..AAnnddrreeww JJ.. CCzzuucchhrryy,, EEaasstt TTeennnneesssseeee SSttaattee UUnniivveerrssii ttyy
"" DDeessiiggnn ooff aann II nnttuuii tt iivvee VViissuuaall EElleeccttrr oonniicc PPaatt iieenntt RReeccoorr dd SSyysstteemm:: ffoorr PPrr iimmaarr yy CCaarr ee PPhhyyssiicciiaannss""EE.. SSoonnnnyy BBuuttlleerr,, EEaasstteerrnn KKeennttuucckkyy UUnniivveerrssii ttyy
"" AA MM eetthhoodd ttoo CCoonnttrr ooll PPhhaarr mmaacceeuutt iiccaall CCoosstt iinn OOppeerr aatt iinngg RRoooomm""FFrreeddeerr iicckk HH.. DDuunnccaann,, WWiinntthhrroopp UUnniivveerrssii ttyyWWii ll ll iiaamm LLaammbb,, MMoouunnttaaiinn MMeeddiiccaall CCeenntteerr

REENGINEERING IMPROVES HEALTH CARE SERVICE DELIVERY:A MODEL AND A FIELD STUDY
Walter Joel Norris, East Tennessee State University, Johnson City TN 37614 (423) 929-5807Steve Haile, Watauga Mental Health Center, Johnson City TN 37614 (423) 928-6545
Andrew J. Czuchry, College of Business and College of Applied Science and TechnologyEast Tennessee State University, Johnson City TN 37614 (423) 929-5807
ABSTRACT
The introduction of managed care has proven to be a challenging shift for many health careestablishments. The transition from a fee-for-service structure to one of fixed price contracts is especiallydifficult in the mental health arena. The purpose of this paper is to examine the implications of processreengineering in a health care service delivery system. Process reengineering implies “the fundamentalrethinking and radical redesign of business processes to achieve dramatic improvements in critical,contemporary measures of performance, such as cost, quality, service, and speed [1].” The need for thisphilosophy in health care service delivery is established and an example introduced using processanalysis. An open system model is presented to evaluate, redesign, and implement improved processeswith metrics applied to demonstrate the effectiveness of reengineering. The model has been successfullyapplied in a mental health care operational setting.
INTRODUCTION
In the United States today health care costs total approximately $425 billion per year and the segmentwhich is expanding most rapidly is that of mental health [3]. Mitchell and Reaghard state that “with therising cost of health care, the health care system is being reshaped, placing greater emphasis on costcontrol and less expensive outpatient services [3].” Presently approximately 6 of every 10 people havesome form of managed care and within the next decade nearly all of the insured population will beincluded [3].” In most health care systems, payment is based on a fee-for-service structure, whereprofitability is based on providing more services [2]. In a managed care system, revenues are fixed and anew philosophy must be adopted. More emphasis must be placed on cost management where servicesand cost per unit are reduced while quality and customer satisfaction is maintained [2].
What is needed is a model or framework to help physicians, clinicians, and administrators change from afee-for-service culture to a fixed price environment. This change will not come easy and will requiredramatic redesign of the entire health care service delivery system. The purpose of this paper is to tailorthe reengineering discipline and apply it to the health care service delivery system. The resultingframework or model is then tested through applications in an actual operational setting.
OPEN SYSTEM MODEL
The open system view is a new way to examine health care service delivery because it analyzes thedynamic environment by considering the external forces that influence performance. These externalforces include the patient or client, family, funding sources, and other stakeholders. Understandinginfluences of these external forces are vital to reengineering the fundamental service delivery processes.
FIGURE 1 - OPEN SYSTEM MODEL: CLINICAL PRACTICES IN A MANAGED CAREENVIRONMENT
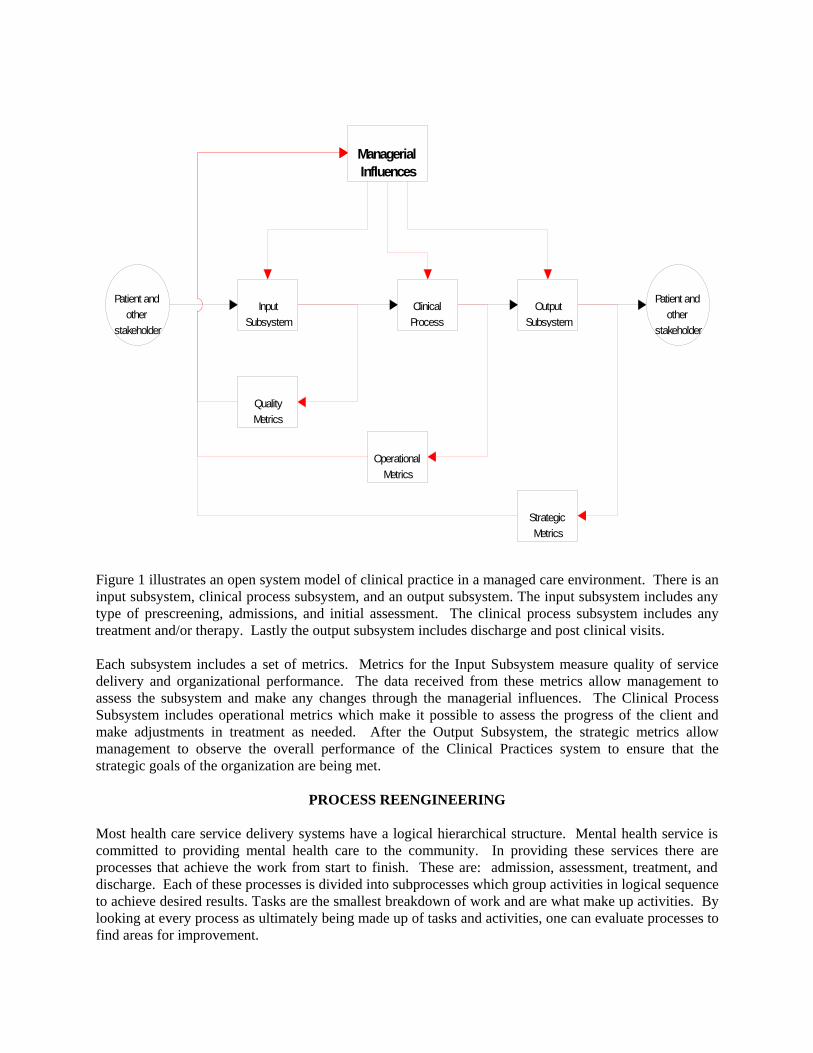
Managerial Influences
Input Subsystem
Clinical Process
Output Subsystem
Quality Metrics
Operational Metrics
Strategic Metrics
Patient and other
stakeholder
Patient and other
stakeholder
Figure 1 illustrates an open system model of clinical practice in a managed care environment. There is aninput subsystem, clinical process subsystem, and an output subsystem. The input subsystem includes anytype of prescreening, admissions, and initial assessment. The clinical process subsystem includes anytreatment and/or therapy. Lastly the output subsystem includes discharge and post clinical visits.
Each subsystem includes a set of metrics. Metrics for the Input Subsystem measure quality of servicedelivery and organizational performance. The data received from these metrics allow management toassess the subsystem and make any changes through the managerial influences. The Clinical ProcessSubsystem includes operational metrics which make it possible to assess the progress of the client andmake adjustments in treatment as needed. After the Output Subsystem, the strategic metrics allowmanagement to observe the overall performance of the Clinical Practices system to ensure that thestrategic goals of the organization are being met.
PROCESS REENGINEERING
Most health care service delivery systems have a logical hierarchical structure. Mental health service iscommitted to providing mental health care to the community. In providing these services there areprocesses that achieve the work from start to finish. These are: admission, assessment, treatment, anddischarge. Each of these processes is divided into subprocesses which group activities in logical sequenceto achieve desired results. Tasks are the smallest breakdown of work and are what make up activities. Bylooking at every process as ultimately being made up of tasks and activities, one can evaluate processes tofind areas for improvement.

The first step is to map out or flow chart the existing or current process. This allows for easyidentification of flow or sequence of events that the process follows. Times and measures of each activityare added for quantifying where improvement opportunities exist. When looking at any process, threequestions are helpful in assessing the potential for improvement: 1) Does the patient or other stakeholderderive measurable benefit from this step? 2) Does the step change any significant paperwork or necessarydocumentation? 3) Is the step needed to correct mistakes, improve patient care, or obtain approval? If theanswer to any of these questions is no, then the activity is evaluated in detail. When conducting theanalysis, improvement opportunities are divided into near term, medium range, or long term. Near termimprovements can often be implemented immediately to improve the process.
After the evaluation is complete, a new or “reengineered” process is designed. The same times andmeasures are evaluated to determine how much the new design improves the process. Afterimplementation of these changes, any minor problems can be worked out and continuous improvementcan take place in a similar manner.
The model, or framework suggested is this paper consists of systematically applying the reengineeringdiscipline, on a process by process basis, to the entire open system illustrated in Figure 1. This approachis discussed for a specific operational setting in the following section.
FIELD STUDY
Watauga Mental Health Services, Inc. (Watauga) is a private not-for-profit corporation headquartered inJohnson City, Tennessee. Established in 1957, Watauga serves the Northeast Tennessee, North Carolinaand Southwest Virginia regions by providing a continuum of quality mental health and chemicaldependency programs. The professionals at Watauga have helped thousands of clients meet their needsby providing professional psychiatric and chemical dependency services, while helping them recognizethe value and importance of self-reliance and responsibility.
Watauga employees approximately 300 professional and staff personnel. Both inpatient (at WoodridgeHospital) and outpatient services are provided. Individual, Group, and Family therapy are provided atthree locations, and Alcohol and Drug rehabilitation services are available as both inpatient and intensiveoutpatient treatments. Also, there are a number of programs for certain age groups which includeAdolescent Day Programs to Geriatric Day Treatments. Watauga participates in counseling programs atlocal school systems, area employers, and correctional facilities. Approximately 25% of Watauga’sfunding is derived from Tenn Care and Medicaid with the balance coming form private insurance.Watauga also provides comprehensive employee assistance programs. More than 55,000 lives arecovered by the services that Watauga provides.
By applying the open system model to Watauga and identifying the processes that correspond with eachsubsystem, implications of reengineering were identified. The patient first enters the process at the inputsubsystem. This includes the admission and assessment subprocesses. As the client proceeds throughthe system, the quality metrics of timeliness, safety, respect, and appropriateness are addressed. From theorganizations point of view, efficiency and effectiveness are evaluated. These metrics serve as indicatorswhen management intervention is necessary. The patient then proceeds through treatment and dischargein a similar manner with each of these processes having their own set of metrics.In Watauga’s intake system prior to managed care, the client entered the system through one of threesites. These were located in Johnson City, Elizabethton, or Erwin. The initial contact would takeapproximately 10 minutes and was either by phone or walk-in. Appointments were made for a social andfinancial history. The social history would take approximately 30 minutes and the appointment for an

intake was made. There was then a delay of four to six weeks for the intake appointment. The intakewould take approximately one hour to complete and then the patient would be ready to enter the clinicalprocess subsystem for treatment. The intake subsystem, prior to managed care, was analyzed using thePareto Chart technique to determine steps that consumed the most time. This analysis focused on themetric of timeliness, which is important to the patient. The delay between the appointment and the intakewas the largest time consumption. Also, the number of staff for all three sites was 24 people.
Centralized intake is the resulting reengineered process to replace this prior intake system. Now oneoffice handles appointments, utilization management reviews, and one full time employee travels to eachsite to complete the intake.
Usually an organization will develop a set of care standards which will be used as requirements fortreatment. Through a preadmission certification, utilization management can assess the medicalcondition, psychiatric condition, and level of functioning of the client and determine admissions basedupon the care standard that applies. Utilization management also has the role of continuously monitoringthe patients progress from admission through discharge in an attempt to insure quality and decrease costs.It is a third party that is inserted between the patient and the provider which becomes the final arbiter oftreatment [3].
Mitchell and Reaghard state that “although managed care and competition may be effective in promptinga more efficient delivery system, they do not ensure the quality of care and availability of services thatideally would make this an effective system [3].” But through the use of reengineering and processthinking, quality can be upheld and customer satisfaction maintained.
The client enters the reengineered, or centralized intake process through a phone call or walk-in.Decisions are made concerning crisis intervention. If there is none, the pre-screen is done andappointment is set for a WASH (social history). Before the appointment, utilization management reviewsthe WASH to assess the possibility of community referral. The patient then enters the system for WASHand financial paperwork. The appointment is then set for the intake. Utilization management performs areview and the initial intake. Within this activity, the client is assessed utilizing Clinical Care Standardsof the organization. These Clinical Care Standards are based on the Diagnoses and Statistical Manual ofMental Disorders 4th Edition (DSM-4) and use of the Global Assessment of Functioning (GAF) as anindicator of a level of wellness. After the intake, utilization management authorizes an adequate numberof sessions and the client moves to the treatment subsystem.
There were several problems addressed in the Prior Intake system. These include the delay of four to sixweeks between appointment and intake, the large number of staff scattered over three areas, and the lackof third party opinion. The significant reduction in process time from four to six weeks, to seven days is amajor benefit. The standardization of individual tasks in the process provides more rapid entry into thesystem. The standardization of different activities allows the entire process to take place in a centralizedlocation therefore reducing staff from 24 to seven. Utilization management provides the third partyopinion. By assessing the client with the clinical care standards, a clearer picture of wellness is captured.Also, crisis intervention and community referral are provided systematically to help the patient with theappropriate levels of care. Actual survey data indicates that quality of care is maintained with thereengineering or Centralized intake process. With this process, Watauga Mental Health ranks favorablyin comparison to peer organizations.
Favorable results are also realized when reengineering is applied to the clinical process subsystem. In theprior system the client entered from the intake subprocess and treatment was provided. The same
clinician that performed the intake provided treatment. Then the same clinician assessed the patientscondition and determined if additional treatment was required.
The disadvantage of the “fee-for-service” clinical process subsystem was that there were severalindividual clinicians making decisions of whether more sessions were needed. Although clinicians wereguided by the desire to provide quality therapy to all patients, a total system view of the process was notalways available. As a consequence the “fee-for-service” environment tends to reward based upon thenumber of patient hours. The incentive to define acceptable levels of wellness was masked by thecommunity’s culture. Managed care forces this culture to be re-examined. This examination has pros andcons. Under managed care, cost is fixed and the motivation lies in an organization’s ability to move theclient to an acceptable level of wellness in the shortest possible time frame. Therefore there is the needfor a third party to review the patients condition and authorize visits when needed. In order to overcomethe potential concerns with quality of care, an open system perspective must be employed to quantify andevaluate the impacts of these revolutionary changes. The model or framework presented in this paper is asignificant step towards this end.
In the new fixed price, or reengineered clinical process subsystem the client enters treatment from theintake subprocess. Utilization management reviews the patient’s progress. This review is based upon theClinical Care Standards. The purpose of the review is to determine when the patient has achieved theacceptable level of wellness. From this assessment, the final decision for additional treatment is made.The potential for involving the patient and other stakeholders in this process is currently under evaluation.
The advantages of the reengineered process over that of the “fee-for-service” are (1) utilizationmanagement provides a single point of contact for the Managed Care Organization, (2) a third partyopinion of client wellness is provided, (3) clinician workload is reduced, (4) the organization is able tooperate with financial responsibility, and (5) the quality of care can be maintained at the desired level.
The remaining Clinical process subsystem, therapy, requires further investigation. Factors to beconsidered include the possibility of group versus individual therapy. This area is one that is debated byall therapist and requires a sound technical, fact-based approach before the full benefits of reengineeringcan be evaluated.
SUMMARY
Reengineering can be applied in a health care service delivery environment. An open system model ofclinical practices in a managed care environment was developed and applied in an operational setting. Byapplying process analysis and reengineering techniques to the open system model, existing processeswere developed and documented for the input and clinical process subsystems. After analysis of theseprocesses, reengineered processes were developed. Benefits of reengineering were quantified for thesereengineered processes and included: (1) more timely delivery of service for the client, (2) more efficientuse of personnel for the organization, and (3) consistent quality of care as measured by independentsurveys comparing performance with similar organizations.
REFERENCES
[1] Hammer, Michael and Champy, James. Reengineering the Corporation: A Manifesto for BusinessRevolution. New York: Harper Business, 1993.
[2] Kolb, Deborah S. and Horowitz, Judith L. “Managing the Transition to Capitation.” HealthcareFinancial Management: Journal of the Healthcare Financial Management Association, 1995, 49(2),64 - 69.

[3] Mitchell, Ann and Reaghard, Deborah A. “Managed Care and Psychiatric-Mental Health NursingServices: Implications for Practice.” Issues in Mental Health Nursing, 1996, 17(1), 1 - 9.
DESIGN OF AN INTUITIVE VISUAL ELECTRONIC PATIENT RECORD SYSTEM FORPRIMARY CARE PHYSICIANS
E. Sonny Butler, Eastern Kentucky University, Richmond, KY 40475
ABSTRACT
This paper describes the development of an Intuitive Visual Electronic Patient Record System for PrimaryCare Physicians; evaluates the current state of medical record systems for primary care physicians; andidentifies impediments prevalent in the use of electronic (computerized) patient record systems andstrategies to overcome them. Aspects of the intuitive visual features build on previous work done in theareas of Concept Graphics (Preiss, 1992) and Metaphor Graphics (Cole, 1990). The Electronic PatientRecord System for Primary Care Physicians incorporates the functional requirements for computerizedpatient records as outlined by the Institute of Medicine (IOM) (Ball, 1992). The intuitive visual featuresof the electronic patient record include icons to access data in the patient record such as problems list,health status, functional level, surgeries, immunization history, and medication history. The developmentof this project is focusing on specific ways to overcome the impediments to the implementation of anelectronic patient record (EPR) by:
a) Designing the electronic patient record around the primary care physician's work style. The PCP shouldnot have to adjust significantly his/her daily routine; the system is being designed to emulate the way thephysician uses and records information in the patient record.
b) Using specifications determined by a primary care physician and other researchers and conducting weeklyreview sessions of the development of the project with the primary care physician;
c) Using a single level button bar to access data of the patient record;d) Using intuitive icons to represent aspects of the medical record;e) Using visual images to represent anatomical descriptions of complaints, chronic problems, surgeries;f) Using metaphor/concept graphics to represent categories of results;g) Designing security measures to include passwords and encryption for physicians and the health care staff
to have authorized access to the patient record. h) Designing a graphic subsystem to display an overlay graphical analysis of each patient's health care cost
information (lab, medication, radiology, visits, etc.).I) Designing a timing feature to automatically track the amount of time spent with the patient.
Introduction
Automation is common in physicians' offices. However, computerized systems that integrate clinicalpatient records and include visual representation of diagnoses, graphical vital statistics tracking,longitudinal medication records, concept/metaphor graphic laboratory results, visual radiology reports,and iconic/graphic patient histories are rare (Tierney, 1990). Automated physician's systems are generallylimited to expediting management aspects of a medical practice-patient billing, accounting reports,insurance claim submission, and patient reminder systems (Rector, 1991). A patient record system thatintegrates clinical data into visual information is feasible and demonstrated in this project through the useof computer technology that can display images, play sound, animate processes, electronically transferand display laboratory reports and other health care information. While technology can aid in access timefor patient record retrieval, organization, and display of information the method in which physiciansreview patient information and use it to solve problems is unique and to the extent possible has beenincorporated into the electronic patient record (EPR) system for primary care physicians as described in
this paper. Primary care physicians (PCP) such as family practitioners, pediatricians, and generalinternists provide the preponderance of medical care in the United States. In addition to treating 80% ormore of the medical problems of the average patient, they serve as "gatekeepers", or if you preferorchestra conductors, to other specialists and act as guides to the patient in health care decisions (Butler,1993). The primary care physician's practice differs from that of a specialist and the patient records in thephysician's office reflect several unique issues:
• A large number of patients are seen daily,• A wide variety of problems are addressed,• Patient-physician encounters tend to be relatively brief, • Activity is high volume,• Care is wide-range,• Health problems require immediate treatment,• Records are longitudinal, for the lifetime of the patient,• Data is entered quickly and volume is high,• Care is comprehensive,• Care is community based with associated multiple providers (Bernstein, 1993).
Issues involved in a primary care physician's office include: accessibility to records, ease of data entry,convenient location of records, legibility of records, organization of data in records, retrieval of relevantinformation from records in a logical and timely manner. Currently most charting in physician offices issequential, paper-based and hand-written. Physicians need to access and enter data quickly in patientrecords (McDonald, 1988) and experience time savings from the use of a system (Rind, 1993). Points ofaccess to the patient record include the physician's office, examining room, nurse's station, laboratory andoffice staff. Data entry appears to be the major bottleneck in the use of automated systems (Bernstein,1993). To facilitate various work styles, voice recognition, scanning, electronic transfer of laboratoryreports, touch screens, and light pen data entry capabilities are being provided to facilitate data entry bythe physician and staff.
Sequential text-based or written records do not allow fast access to and analysis of large amounts ofchronological data. Manual records contain patient clinical information in isolated entries recorded foreach office visit. Visualization of longitudinal trends or patterns, for example, vital statistics, medication,and/or diagnoses, are not part of the paper patient record. The electronic patient record is a system thatintegrates information from laboratory reports, radiology reports, and diagnostic results. It can support thecare of patients (Nowlan, 1993), and organize and reorganize, with the touch of a button the patient datainto visual metaphors, visual images, graphic displays of lab results and a variety of other depictions asneeded by the physician. This ability to reorganize the data into visual metaphors or concepts is apractical implementation of Cole's research in the area of problem solving using pattern recognition andmental models emphasizing visualization (Cole, 1988). Cole's research indicates that digitalrepresentation of analog information is inadequate for physician needs, and the use of visual metaphors asan alternative to standard graphics can create useful pictures of information which correspond withphysicians' mental models. Physicians can easily interpret and retain large amounts of data presented ingraphic form (Cole, 1988).
Design
The purpose of this system is to assist the primary care physician and perform more efficiently andeffectively than the traditional manual system. The electronic patient record for primary care physiciansaddresses the needs of physicians and accommodates the way primary care physicians think and work
[11]. It provides a graphical interface which allows the physician to request a comprehensive picture ofthe patient's history, treatments, and problems, as well as individual graphical and visual metaphors thatillustrate specific types of information (e.g. medical history, current visit diagnoses, laboratory results,prescriptions, radiology reports, and/or vital statistics).
The PCP Patient Record System features easily accessible clinical information, a patient problem list,patient photos on selected screens, patient's medical history, surgeries, medication history, family medicalhistory, immunization records, social habits, laboratory test results, and x-ray history in text andiconic/symbolic images. The user interface is designed specifically to emulate the daily activities of aprimary care physician. The graphical, button driven interface provides for a more intuitive design, easeof data entry and access, the ability to track trends, and integrate information with visual images andsymbols. Computerized health care records will have the advantage of quick retrieval of information andlegible printouts for patients and health care providers and staff (e.g., prescriptions, patient medicationinstructions, preventive care information, disease information, etc.).
In addition to organizing the patient history, physical findings, medications, and laboratory results, theelectronic patient record provides a gateway, using networks such as the Internet, to electronic databasessuch as Medline, Cancer Literature, etc. and other information providers. The primary care physician willreceive current information on health care and health research on a regular and systematic basis throughelectronic "clip" services. The ease of access to this type of information will save the primary carephysician time and effort and provide timely access to information, which should assist in improving theoverall quality of health care. Discussions are under way to complete the initial development and alphaand beta test the proposed EPR primary care physician system in a major university primary care clinicduring the next six to twelve months. During the testing phase these questions will be answered:
a) Does the electronic patient record save the primary care physician time in accessing patient information?b) Is data entry into the system practical?c) Is data entry into the system quicker, slower, or the same as the handwritten patient record?d) Do the visual/graphical/metaphors facilitate physician decision making?e) Can physician and staff use the system effectively and efficiently?f) Does the system improve the quality of care and information given to the patient?g) Does the system improve physician access to health care information?h) Does the system reduce the time involved in information searching and repetitive tasks performed by the
physician and staff, e.g. providing immunization history, periodic reminders for annual exams andimmunizations, writing prescriptions, and requesting lab and radiology results?
i) Does the system affect the quantity of patient care and provide an effective way to monitor the quality ofhealth care?
Using the Electronic Patient Record, a future scenario of a typical patient visit is as follows:
• The physician's assistant shows the patient into the exam room and takes his/her temperature, bloodpressure, height and weight. The assistant signs onto the EPR system using their unique password,retrieves the patient's record and enters this information using the appropriate device/technologies (e.g.,light pen, touch screen, voice recognition).
• This information updates the patient's record and displays the patient blood pressure, temperature, andweight longitudinally.

• The physician arrives after having viewed the patient's chief complaint and vital statistics on hisdesktop computer or Personal Data Assistant (PDA). Once in the exam room, the physician questionsand takes the patient's history, performs a pertinent physical examination, and enters this informationinto the current visit screen under the appropriate sections for physician's description of the problem,subjective, objective, analysis/diagnosis, and treatment/plan sections using the appropriate technology.If necessary, previous medication and visit information is available as part of the EPR. Thisinformation may be retrieved quickly and easily using icon buttons.
• The physician then selects the prescription button, lab report button, or radiology button to order theprescription or ancillary test. The order for the prescription, laboratory test or radiology request isautomatically sent to the appropriate laboratory or pharmacy or printed in the exam room and given to thepatient. The patient record is then updated. The physician reviews the billing form (CPT) displayed bythe system. This information is automatically transmitted to the front desk if verified as correct by thephysician. As the patient leaves, they stop at the front desk to complete the visit.
Standards and Security
The needs of the primary care physician for an intuitive patient record system outweigh the advantages ofwaiting for universal standards. As technical constraints on the development of electronic health carerecords disappear, uniform and international standards are being developed, but a definitive standard doesnot yet exist. Some of the agencies that are currently involved are: the IEEE P1157 Committee, theInstitute of Medicine, the European Workshop on Open Systems (Rector, 1991), and the ComputerPatient Record Institute. A multitude of standards for vocabularies already exist: UMLS (UnifiedMedical Language System), Read Codes, ICHPPC (International Classification of Health Problems inPrimary Care), and ICD-9 or ICD-10. Until a definitive standard is developed, the software will utilize theICD-9. Usability and an immediate fulfillment of a critical need are of primary importance. Security isincorporated into the PCP Electronic Patient Record system at different levels: the basic passwordidentification level, security classification by user type (physician, nurse, etc.), and encryption for datatransmission.
Contribution to Health Care
National concern is centered on ways to improve health care while cutting costs. A desktop patient recordsystem for PCPs can contribute to the quality of health care, improve the efficiency of clinical processes,decrease health care costs, and enhance patient education (Bartlett, 1993). Electronic health care recordsmay improve outcome-based research (McDonald, 1986). The ability to track and visualize relationshipsfor a patient's diagnoses, treatments, and medications; the ability to access this aggregate information ingraphical form; and the ability to cumulate information for specific patient populations leads to decreasedcosts in health care institutions by encouraging the elimination of unnecessary tests and medications(Tierney, 1990). A better connection to the patient care processes and integration of systems and data hasalso been recommended as an important part of the CQI (Continuous Quality Improvement) process(Cuddeback, 1993). This electronic patient record system brings those capabilities to the physicians and,in addition, provides an interface that will help overcome the serious problem of getting medicalprofessionals to use online systems (Lumsdon, 1993). The graphical/visual metaphor interface allowseasy visualization of longitudinal data, e.g. vital statistics tracking or medication histories, for improvedlong-term patient care.

The Future - Telemedicine, Internet, and Electronic Data Interchange
Future research involves connection of this system to existing office practice management systems, tohospitals, telemedicine networks, and Electronic Data Interchange (EDI) systems. As the practice oftelemedicine grows, possibilities will exist for incorporation of remote data into the local patient record. Several states have telecommunication projects involving rural primary care physicians (Miller, 1993). Pennsylvania is piloting the Rural Health Telecommunications Network, which will have three parts: two-way audio/video consultation; teleradiology of digitized images; and health care conferencing on personalcomputers via the Internet. Software designed to incorporate digitized graphical images, promote off-sitelinkages, and integrate data will facilitate physicians' participation in these telecommunication networks.Desktop access to laboratory results, radiology reports, and orders is considered especially important andcan be of immense value to traveling doctors, remote site clinicians, and rural health providers. With alaptop computer and modem connection, the physician can have the full health care record available.
Internet resource for physicians is another growing aspect of telecommunications. The graphical patientrecord system can serve as an information gateway. As availability of graphical resources increases,images can be downloaded via the Internet for use in the system. One example is the National Library ofMedicine's Visible Human Project. NLM has made digital cross-sectional images from the visible humandata set available via the Internet.
Changes are also taking place in EDI. Predictions for growth of EDI networks include all-payor systemsincorporating communication via e-mail, electronic remittance advice, referral authorizations, and onlinemedical charts. Vendors are working on clinical information in real-time to provide physicians withinstant online lab or diagnostic results in addition to the "superhighway" of automated financial andclinical networks (O’Connor, 1993).
Conclusion The PCP patient record system will eventually replace hard-copy patient records and place the system atthe desktop and in the examining room. The system will enhance the value of the patient data byproviding quickly accessible, integrated information using relational database technology. Informationwill be displayed in a more intuitive visual format designed in the way primary care physicians’ work.Future research will involve the linkage of this system to other sub-specialty health care systems,hospitals, insurance companies or the appropriate billing entity, the Internet, and electronic datainterchange (EDI) systems. The proposed system has the potential to reduce costs, improve quality andquantity of health care, as well as connect the physician's office with other national health care resources.

References
1.Preiss B, Kaltenbach M, Zanazaka J, EchaveV. Concept Graphics: A Language for MedicalKnowledge. Proceedings of the SixteenthAnnual Symposium on Computer Applicationsin Medical Care. Washington, DC, McGraw-HillInc. 1992: 515-519.
2. Cole WG. Quick and Accurate Monitoringvia Metaphor Graphics. Proceedings of theFourteenth Annual Symposium on ComputerApplications in Medical Care. Washington, DC,IEEE Computer Society Press, 1990: 425-429.
3.Ball, Marion & Collen, Morris, Ed. Aspects ofthe Computer-based Patient Record. Springer-Verlag, 1992.
4.Tierney WM, Miller ME, Overhage JM,McDonald CJ. Physician Inpatient OrderWriting on Microcomputer Work Stations:Effects on Resource Utilization. JAMA 1990Jul 26; 269(3)379-83.
5.Rector AL, Nowlan WA, Kay S. Foundationsfor an ElectronicMedical Record Medical Record. Meth InformMed 1991; 30:179-86.
6.Butler, ES, The Role of Information in theSelection Process of A Primary Care Physician,Doctoral Dissertation, University of NorthTexas, Denton, Texas: 1993
7.Bernstein RM, Hollingworth GR, Viner G,Lemelin J. Family Practice Informatics: Research Issues in Computerized MedicalRecords. Proceedings of the Seventeenth AnnualSymposium on Computer Applications inMedical Care. Washington, DC, McGraw-HillInc. 1993: 93-97.
8.McDonald CJ, Tierney WM. Computer-StoredMedical Records: Their Future Role in MedicalPractice. JAMA 1988; 259: 3433-3440.
9.McDonald CJ, Blevins L, Tierney WM,Martin DK. The Regenstrief Medical Records.Medical Computing 1988; 5(5):34-47.
10. Rind DM, Safran MD. Real and ImaginedBarriers to an Electronic Medical Record.Proceedings of the Seventeenth AnnualSymposium on Computer Applications inMedical Care. Washington, DC, McGraw-HillInc. 1993: 74-78.
11. Shelton, John MD. Personal Interviews,September - December 1993.
12. Nowlan WA. Synopsis: Patient RecordSystems. In: Yearbook of Medical Informatics1993. Rotterdam: IMIA Publications, 1993.
13. Cole WC. Metaphor Graphics and VisualAnalogy for Medical Data. Copyright 1988 byWG Cole, Department of Medical Education,University of Washington, Seattle WA 98195.
14. Computer-based Patient Record Institute. AnImperative for Healthcare: The Computer-Based Patient Record (CPR). Chicago: CPRI,1993.
15. Bartlett, EE. Patient-Centered Computing:Can It Curb Malpractice Risk? Proceedings ofthe Seventeenth Annual Symposium onComputer Applications in Medical Care.Washington, DC, McGraw-Hill Inc. 1993:69-73.
16. McDonald CJ, Tierney WM. Research Uses
of Computer-Stored Practice Records in GeneralMedicine. Journal of General Internal Medicine.1986;1(4kSuppl): S19-24.
17. Cuddeback JK. Integration of Health CareInformation Systems. Radiographics 1993 Mar;13(2): 445-46.
18. Kennedy OG, Davis GM, Heda S. ClinicalInformation Systems: 25-Year History and theFuture. Journal Soc Health System 1992;3(4):49-60.
19. Lumsdon K. The Clinical Connection:Hospitals Work to Design Information SystemsThat Physicians Will Use. Hospitals, 1993 May5; 67(9): 16.
20. O'Dell DV, Tape TG, Campbell JR.Increasing Physician Acceptance and Use of theComputerized Ambulatory Medical Record.Proceedings of the Fifteenth Annual Symposiumon Computer Applications in Medical Care.Washington, DC, McGraw-Hill Inc. 1991:848-852.
21. Miller B. Telecommunications:Telecommunications Meets the Doctor. 1993Aug;6(8):34-6.
22. Telemedicine: How to Get Started and GrowYour Program. Healthcare Telecom Report1993. Nov 8; 1(17): 6-7.
23. National Institutes of Health, NationalLibrary of Medicine. Fact Sheet: The VisibleHuman Project. Bethesda: USDHHS-NTH,April 1993.
24. O'Connor K. The Battle for Doctors' Desks:On-Ramps for EDI Superhighways. HealthcareInform, 1993. Oct:27-28.
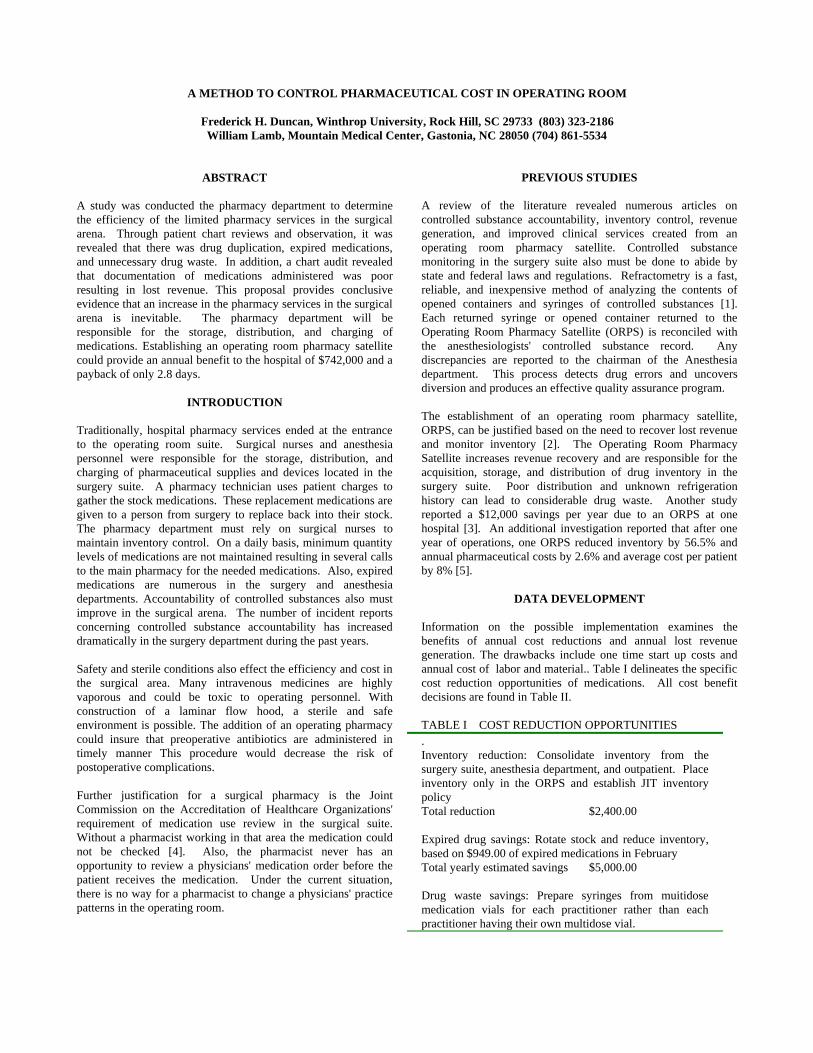
A METHOD TO CONTROL PHARMACEUTICAL COST IN OPERATING ROOM
Frederick H. Duncan, Winthrop University, Rock Hill, SC 29733 (803) 323-2186William Lamb, Mountain Medical Center, Gastonia, NC 28050 (704) 861-5534
ABSTRACT
A study was conducted the pharmacy department to determinethe efficiency of the limited pharmacy services in the surgicalarena. Through patient chart reviews and observation, it wasrevealed that there was drug duplication, expired medications,and unnecessary drug waste. In addition, a chart audit revealedthat documentation of medications administered was poorresulting in lost revenue. This proposal provides conclusiveevidence that an increase in the pharmacy services in the surgicalarena is inevitable. The pharmacy department will beresponsible for the storage, distribution, and charging ofmedications. Establishing an operating room pharmacy satellitecould provide an annual benefit to the hospital of $742,000 and apayback of only 2.8 days.
INTRODUCTION
Traditionally, hospital pharmacy services ended at the entranceto the operating room suite. Surgical nurses and anesthesiapersonnel were responsible for the storage, distribution, andcharging of pharmaceutical supplies and devices located in thesurgery suite. A pharmacy technician uses patient charges togather the stock medications. These replacement medications aregiven to a person from surgery to replace back into their stock.The pharmacy department must rely on surgical nurses tomaintain inventory control. On a daily basis, minimum quantitylevels of medications are not maintained resulting in several callsto the main pharmacy for the needed medications. Also, expiredmedications are numerous in the surgery and anesthesiadepartments. Accountability of controlled substances also mustimprove in the surgical arena. The number of incident reportsconcerning controlled substance accountability has increaseddramatically in the surgery department during the past years.
Safety and sterile conditions also effect the efficiency and cost inthe surgical area. Many intravenous medicines are highlyvaporous and could be toxic to operating personnel. Withconstruction of a laminar flow hood, a sterile and safeenvironment is possible. The addition of an operating pharmacycould insure that preoperative antibiotics are administered intimely manner This procedure would decrease the risk ofpostoperative complications.
Further justification for a surgical pharmacy is the JointCommission on the Accreditation of Healthcare Organizations'requirement of medication use review in the surgical suite.Without a pharmacist working in that area the medication couldnot be checked [4]. Also, the pharmacist never has anopportunity to review a physicians' medication order before thepatient receives the medication. Under the current situation,there is no way for a pharmacist to change a physicians' practicepatterns in the operating room.
PREVIOUS STUDIES
A review of the literature revealed numerous articles oncontrolled substance accountability, inventory control, revenuegeneration, and improved clinical services created from anoperating room pharmacy satellite. Controlled substancemonitoring in the surgery suite also must be done to abide bystate and federal laws and regulations. Refractometry is a fast,reliable, and inexpensive method of analyzing the contents ofopened containers and syringes of controlled substances [1].Each returned syringe or opened container returned to theOperating Room Pharmacy Satellite (ORPS) is reconciled withthe anesthesiologists' controlled substance record. Anydiscrepancies are reported to the chairman of the Anesthesiadepartment. This process detects drug errors and uncoversdiversion and produces an effective quality assurance program.
The establishment of an operating room pharmacy satellite,ORPS, can be justified based on the need to recover lost revenueand monitor inventory [2]. The Operating Room PharmacySatellite increases revenue recovery and are responsible for theacquisition, storage, and distribution of drug inventory in thesurgery suite. Poor distribution and unknown refrigerationhistory can lead to considerable drug waste. Another studyreported a $12,000 savings per year due to an ORPS at onehospital [3]. An additional investigation reported that after oneyear of operations, one ORPS reduced inventory by 56.5% andannual pharmaceutical costs by 2.6% and average cost per patientby 8% [5].
DATA DEVELOPMENT
Information on the possible implementation examines thebenefits of annual cost reductions and annual lost revenuegeneration. The drawbacks include one time start up costs andannual cost of labor and material.. Table I delineates the specificcost reduction opportunities of medications. All cost benefitdecisions are found in Table II.
TABLE I COST REDUCTION OPPORTUNITIES.Inventory reduction: Consolidate inventory from thesurgery suite, anesthesia department, and outpatient. Placeinventory only in the ORPS and establish JIT inventorypolicyTotal reduction $2,400.00
Expired drug savings: Rotate stock and reduce inventory,based on $949.00 of expired medications in FebruaryTotal yearly estimated savings $5,000.00
Drug waste savings: Prepare syringes from muitidosemedication vials for each practitioner rather than eachpractitioner having their own multidose vial.

Estimated yearly savings $15,000.00
Pentothal Preparation: use Bulk container to preparesyringes rather than the currently used unit dosemanufactured syringes.Estimated yearly savings $5,200.00
Conversion of Versed: Switch from 10mg prefilledsyringes to 5 mg vialsEstimated yearly savings $80,200.00
Shift Pharmacist to the ORPS Consolidate currentworkload and use pharmacist from current staff. Will nothire for new positionYearly cost savings $62,000.00
Total cost reductions $169,800.00
Costs involve establishing facilities and the labor of pharmacypersonnel in the surgical suite. Additional revenue comes fromerroneous billing to customers.
TABLE II COST BENEFIT ANALYSISCOSTSStart up costs
Renovation costs $3,500Laminar flow hood $1,850Refrigerator $ 650CRT/printer $ 800Equipment/furniture $1,200
Total start up costs $8,000
Annual costsLabor $80,000Materials/supplies $ 2,500
Total annual costs $82,500
BENEFITS
Annual Cost ReductionsTotal cost reductions Table I $169,800
Annual Revenue GenerationEstimated yearly increase incharge capture
Total increased revenue $662,500
Total benefit from costReductions and increasedrevenue generation $832,500
Net Cash Inflow 1stYear$750,000
In summary, one can conclude that the initial start-up cost of$8,000 with the annual labor and supply cost of $82,500 is smallcompared to the net yearly benefit of $750,000. The paybacktime is only 2.8 days ($8000 � $750,000 x 360 days). PiedmontMedical Center can start reaping the rewards of the operatingroom satellite pharmacy in as little as four months.
CONCLUSION
The ORPS allows the pharmacy department to become moresensitive to the needs of the surgery and anesthesia departments.Communication and coordination between the departments willbe essential for the development of a successful ORPS. Not onlywill the relationships between the pharmacy, surgery, andanesthesia personnel improve, but also inventory control andrevenue generation will also improve. Also, better patientoutcomes will be expected as a result of the pharmacy servicesprovided to the surgical arena. The major benefit of the ORPSinclude:� Inventory control with a strong emphasis on efficiency and
cost reductions� Controlled substance accountability� Improved safety� Increased patient services
The expected results from the improved inventory control willresult in the elimination of drug duplication, expired drugs, andunnecessary waste. The projected hospital savings as a result ofthe cost reduction will be approximately $107,800. Since theORPS will be responsible for the storage, distribution, andcharging of all medications dispensed to the surgery suite, therewill be improved documentation of the medications chargeddecreasing the discrepancies associated with chart audits. Theadditional annual revenue generation as a result of the increase incharge capture should be approximately $662,500, and thepayback will be only 2.8 days. Also, the pharmacy will audit theamount of charges of medications in the surgery area during thefirst six months of operations and compare those results with thecharges received during previous six months before opening thesatellite.
REFERENCES
[1] Bardas, S. L , Gill, D. L., and Klein R. L. “RefactometricScreening of Controlled Substances Used in Operating Rooms. “American Journal of Hospital Pharmacy. 1992, 49, 2779-81.[2] Buchanan, E. G. and NW Gaither, N. W. “Development ofan operating room pharmacy substation on a restricted budget.”American Journal of Hospital Pharmacy. 1986, 43, 1719-1722.[3] Fiala, D., Grady, K. P., and Smigla, R. “Continued costjustification of an operating room satellite pharmacy.” AmericanJournal of Hospital Pharmacy. 1993, 50, 467-469.[4] Greeley, Hugh. “The JCAHO and Medication Use.” OpusCommunication. 1996, 1, 7-19.[5] Stroup, J.W., and Iglar, A. M. “Implementation and financialanalysis of an operating room satellite pharmacy.” AmericanJournal of Hospital Pharmacy. 1992, 49, 2196-2202.

TRACK: Information Technology and Systems and AI
"" II nntteerr nneett CCoommmmeerr ccee:: CCuurr rr eenntt II ssssuueess aanndd RReesseeaarr cchh DDiirr eecctt iioonnss""JJoohhnn OO''MMaall lleeyy,, VVii rrggiinniiaa TTeecchhLLaannccee AA.. MMaatthheessoonn,, VVii rrggiinniiaa TTeecchh
"" AA DDeecciissiioonn MM aakkiinngg MM ooddeell ffoorr II nntteerr nneett SSeeccuurr ii ttyy ffoorr tthhee SSmmaall ll ttoo MM eeddiiuumm SSiizzee EEnntteerr pprr iissee""AAlleexxaannddeerr DD.. KKoorrzzyykk,, SSrr..,, VVii rrggiinniiaa CCoommmmoonnwweeaall tthh UUnniivveerrssii ttyy
"" FFrr oomm CCOOBBOOLL ttoo tthhee II nntteerr nneett II nn CCll iieenntt SSeerr vveerr CCoommppuutt iinngg EEnnvvii rr oonnmmeennttss""DDoonnaalldd EE.. CCaarrrr,, EEaasstteerrnn KKeennttuucckkyy UUnniivveerrssii ttyyVViirrggii ll LL.. BBrreewweerr,, EEaasstteerrnn KKeennttuucckkyy UUnniivveerrssii ttyy
"" UUssiinngg GGrr oouupp DDeecciissiioonn SSuuppppoorr tt SSyysstteemmss ttoo FFaaccii ll ii ttaattee OOrr ggaanniizzaatt iioonn DDeevveellooppmmeenntt""SShheerrrr ii WWoooodd,, IInncc.. PPhhii llaanntthhrrooppiicc RReesseeaarrcchhJJaammeess PP.. CClleemmeennttss,, TToowwssoonn SSttaattee UUnniivveerrssii ttyy
"" AA SSttuuddyy ooff DDiissttrr iibbuutteedd RRuullee LL eeaarr nniinngg UUssiinngg AAnn OObbjj eecctt--OOrr iieenntteedd LL ooccaall AArr eeaa NNeettwwoorr kk""Raymond L. Major, Virginia Tech
"" TTrr iiaallss aanndd TTrr iibbuullaatt iioonnss ooff NNeeuurr aall NNeettwwoorr kkss DDeevveellooppmmeenntt""SStteevveenn DD.. TTrraavveerrss,, UUnniivveerrssii ttyy ooff MMiissssiissssiippppii MMeeddiiccaall CCeenntteerrAAjjaayy KK.. AAggggaarrwwaall,, MMii ll llssaappss CCooll lleeggee
"" AAnn EExxppeerr tt SSyysstteemm ffoorr CCoolloorr SSeelleecctt iioonn""BBeetthhaannyy DDeelluuddee,, JJoohhnnss HHooppkkiinnss UUnniivveerrssii ttyyMMaarryy HHaacckklleeyy,, JJoohhnnss HHooppkkiinnss UUnniivveerrssii ttyyJJaammeess PP.. CClleemmeennttss,, TToowwssoonn SSttaattee UUnniivveerrssii ttyyCCoonncceettttaa MMii ttssooss,, PPHHHH IInnccoorrppoorraatteeddSSuuee BBuunnggeerrtt,, BBeell ll AAttll llaannttiicc CCoorrppoorraattiioonn
"" AA RReessoouurr ccee--BBaasseedd VViieeww ooff II nnffoorr mmaatt iioonn TTeecchhnnoollooggyy'' ss II nnff lluueennccee oonn CCoommppeett ii tt iivvee AAddvvaannttaaggee""WWoonnaaee CChhoo,, UUnniivveerrssii ttyy ooff KKeennttuucckkyyRRoobbeerrtt TT.. SSuummiicchhrraasstt,, VVii rrggiinniiaa TTeecchh
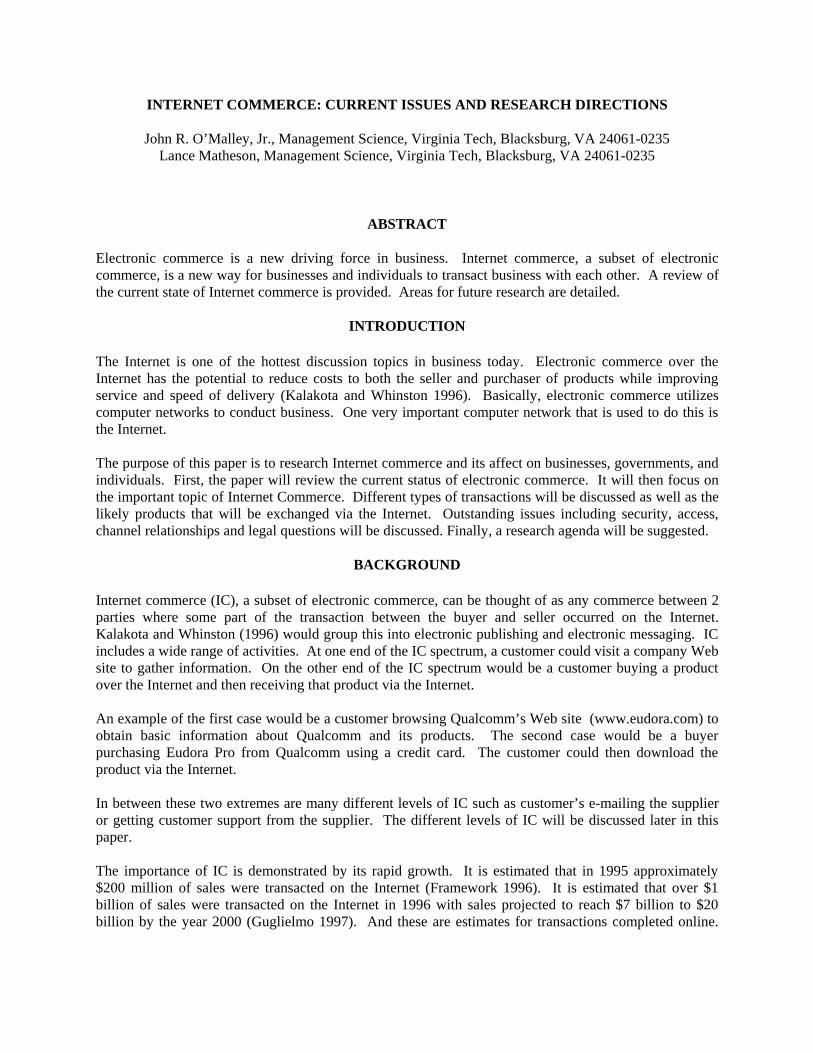
INTERNET COMMERCE: CURRENT ISSUES AND RESEARCH DIRECTIONS
John R. O’Malley, Jr., Management Science, Virginia Tech, Blacksburg, VA 24061-0235Lance Matheson, Management Science, Virginia Tech, Blacksburg, VA 24061-0235
ABSTRACT
Electronic commerce is a new driving force in business. Internet commerce, a subset of electroniccommerce, is a new way for businesses and individuals to transact business with each other. A review ofthe current state of Internet commerce is provided. Areas for future research are detailed.
INTRODUCTION
The Internet is one of the hottest discussion topics in business today. Electronic commerce over theInternet has the potential to reduce costs to both the seller and purchaser of products while improvingservice and speed of delivery (Kalakota and Whinston 1996). Basically, electronic commerce utilizescomputer networks to conduct business. One very important computer network that is used to do this isthe Internet.
The purpose of this paper is to research Internet commerce and its affect on businesses, governments, andindividuals. First, the paper will review the current status of electronic commerce. It will then focus onthe important topic of Internet Commerce. Different types of transactions will be discussed as well as thelikely products that will be exchanged via the Internet. Outstanding issues including security, access,channel relationships and legal questions will be discussed. Finally, a research agenda will be suggested.
BACKGROUND
Internet commerce (IC), a subset of electronic commerce, can be thought of as any commerce between 2parties where some part of the transaction between the buyer and seller occurred on the Internet.Kalakota and Whinston (1996) would group this into electronic publishing and electronic messaging. ICincludes a wide range of activities. At one end of the IC spectrum, a customer could visit a company Website to gather information. On the other end of the IC spectrum would be a customer buying a productover the Internet and then receiving that product via the Internet.
An example of the first case would be a customer browsing Qualcomm’s Web site (www.eudora.com) toobtain basic information about Qualcomm and its products. The second case would be a buyerpurchasing Eudora Pro from Qualcomm using a credit card. The customer could then download theproduct via the Internet.
In between these two extremes are many different levels of IC such as customer’s e-mailing the supplieror getting customer support from the supplier. The different levels of IC will be discussed later in thispaper.
The importance of IC is demonstrated by its rapid growth. It is estimated that in 1995 approximately$200 million of sales were transacted on the Internet (Framework 1996). It is estimated that over $1billion of sales were transacted on the Internet in 1996 with sales projected to reach $7 billion to $20billion by the year 2000 (Guglielmo 1997). And these are estimates for transactions completed online.

One estimate has grocery product sales of $80 billion by 2005 (Dorgan 1997). Including all ICtransactions would likely increase these numbers substantially.
For some manufacturers IC is becoming an avenue to new markets. Dell Computers in an effort toincrease sales in Japan, has started an IC service for Japan (Dell 1997) in an effort to grow their marketshare at 2 to 3 times the growth rate of the overall market.
For other suppliers IC is a way to increase its existing sales. Wal-Mart launched an ambitious IC Web siteand plans to have 80,000 products available this year through its Web site (Guglielmo 1997). Includedare products that are not in the typical retail product mix such as $5,000 20 page per minute scanners.Dell Computer is reportedly doing over $1 million per day in sales through IC with a growth rate of 20%per month (Dell 1997, DellI 1997).
With major suppliers like Dell already doing IC at the rate of $500 million per year and Wal-Martexpending great resources to create an Internet presence, it is obvious that IC will continue to grow at avery rapid pace. And while it appears that much of IC is retail sales, some experts predict that the realvolume is going to be in business to business transactions (Electronic 1997). Obviously, Wal-Mart isplanning on business customers and Dell has sold $30,000 servers used in businesses via IC (DellI 1997).
IC is different from traditional commerce in several respects in regards to the buyer. One of the primarydifferences is in the way customer contact is made with the supplier. Typically, in other forms ofcommerce the customer will have as a minimum telephone contact with a supplier. In most cases, there isactual face to face contact with the supplier. The customer knows where the supplier is located andwhom they are dealing with. With IC, it is possible for the customer to never directly interface with asingle individual at the supplier. The customer may not even know the physical location of the supplier.
Another difference is in the equipment required to complete a transaction. For IC to occur the buyer musthave a computer (or access to a computer) with a modem or Internet connection. Additionally, thecustomer must have some type of browser software. This requires a customer with at least a basicunderstanding of computers. The customer needs to have some understanding of the Internet and how toconnect. While this is common for many customers especially business customer, there are manyconsumers that lack this basic knowledge.
Also, the Internet is open 24 hours a day, 7 days a week. Customers can choose to shop at any time of theday and any day of the year. IC does not take holidays. This provides the customer with more optionsand flexibility. While in many places grocery stores are open 24 hours, other types of stores such ascomputer stores, furniture stores, and apparel stores tend to have more restricted hours.
Finally, unlike television, billboards, and radio, companies have to rely on customers to find their Internetsite. The customer must initiate the request to browse a Web site. Companies can advertise the site'slocation, but the consumer must initiate the connection.
In many ways, IC is similar to catalog shopping which allows access from any place where there is aphone. Also, IC has similarities to mail order shopping in that there may be minimal or no physicalcontact between the customer and the supplier. Like ATM’s it is open 24 hours a day. Thus IC maybeconsidered a combination of attributes typical of different types of shopping.

IC BASICS
IC is a relatively new phenomenon with a history of only a few years. While the Internet has been aroundsince the mid 1960’s, it was the advent of Web browsers such as Mosaic in 1993 and Netscape Navigator(1994) that made commerce over the Internet possible (Kalakota and Whinston 1996). Previously, theonly users effectively able to use the Internet were the military and researchers with extensive computernetworking knowledge. Additionally, the implementation of HTML (Hypertext Markup Language) as thestandard language for the Web enabled many firms to develop Web sites that could be viewed by millionsof customers worldwide. Software developers built HTML editors to enable businesses of any size todevelop Web pages.
As indicated previously, the growth of IC has been remarkable. In just 2 to 3 years, IC has grown to over$1 billion in sales with projections of sales in the 10’s of billions of dollars by the year 2005.
Many different items are transacted over the Internet. In some cases it is information about products orcompanies, in other cases it is products. And finally, service is exchanged. Information transactionsregarding companies, suppliers and products are more than likely the most common occurrences of IC. Acustomer can potentially gather quite a bit of information simply by pointing a Web browser to acompany’s site.
Another major source of IC is customer service. This is especially true regarding computer software.Many software suppliers provide software fixes and upgrades on their Web sites. Many hardwaremanufacturers provide device drivers to customers over the Internet. It is now very common for acompany to state in the hardware instructions that new or improved device drivers are available from thesuppliers Web site and to use those in place of the supplied disk if the Web site drivers are more current.This feature has enabled many suppliers to reduce the number of replacement floppy disks being sent outto fix problems. Other software suppliers such as Semantic use their Web site to provide regular softwareupgrades. Semantic, which supplies Norton Antivirus, includes free upgrades of the virus information for12 months. Customers can access Semantic’s site to easily upgrade their Norton Antivirus program.
As has been discussed, much of the commerce conducted on the Internet is retail. However, it is not theonly type of IC. Businesses are buying products over the Internet. Dell is selling expensive servers tobusinesses over the Internet. Companies without retail products such as Square D Company(http://www.industry.net/c/mn/03th9) have a presence on the Internet. Approximately 50% of the currentbusiness transacted on the Internet is business-to-business (Guglielmo 1997) and its share is expected togrow in the future. In the future, it may be possible to receive Federal Government benefits via theInternet (Machlis 1997). Testing is being done on services such as food stamps, Medicaid, and postalsales.
IC COMMUNICATIONS
In order for IC to occur three parties are needed. First, the customer must have an access ramp onto theInternet. Often this is a local or nation Internet Service Provider (ISP). For over 5 million people, this isan online service such as America Online or CompuServe. On the other end, the supplier must also havean access ramp onto the Internet. This can be an online service or an ISP. The third critical party is thedata intermediary. For IC conducted locally this could be an ISP that both the supplier and customer use.In other cases it could be the online service. For remote transactions where each party to the transactionhas a different ramp onto the Internet, it is a data intermediary that provides a transparent connectionbetween the online services and ISP’s. These data intermediaries are companies like MCI that providethe backbone to the Internet.

PRODUCTS
Suppliers interested in IC need to know whether their particular products will fit the needs of buyersutilizing the Internet. Many of the firms actively involved in IC are computer related. Dell Computers(http://www.dell.com/index.htm) is a prime example with projected IC sales in 1997 of close to $500million. Other computer manufacturers such as Gateway 2000 Inc. (http://www.gateway2000.com/) andIBM (http://www.ibm.com/) are also heavily invested in IC. Computer supply houses such as IntolComputers, Inc. (http://www.intol.com/) and MicroWarehouse (http://www.warehouse.com/) haveestablished IC sites for customers. Finally, computer software manufacturers such as Microsoft(http://www.microsoft.com/) and Qualcomm (http://www.eudora.com/) have large IC sites.
These sites indicate one trend in IC. The customer innovators in IC have personal computers and arelikely to look for computer related items on the Internet. Thus one of the first major successes in IC hasbeen in the personal computer area including hardware and software. Manufacturers like Dell andGateway 2000 are actively selling not only information but computers as well through IC. Qualcommand other software vendors now sell software via IC. Not only are the manufacturers providing softwaresales with downloads over the Internet, computer supply houses have the same capability.
Other types of products with IC potential in the short term include flowers(http://www.1stinflowers.com/), books (http://www.amazon.com/), and music CD’s (http://www.wal-mart.com/). In the case of flowers, IC is a natural extension of calling a florist to have flowers delivered.The same level of service is possible with IC. IC offers an additional benefit that enables customers toview images of products before making the purchase. Also, orders can be placed 24 hours a day withouthaving to wait for a clerk to take an order via the phone. One of the major advantages of IC is that thecustomer and supplier do not need to coordinate their parts of the transaction. The customer does notneed to coordinate their trip to the store or phone call with the supplier. The IC customer can place theirorder or inquiry when it is convenient for them. The supplier can then handle the order or answer thequery when they are open.
In the case of books and music CD’s, IC makes it possible to search for specific categories of productsthat match the customer’s tastes. With music CD’s it is also possible to listen to part of the CD prior topurchase to determine if you will like the music. Both of these products are easily shipped at relativelylow cost which minimizes the cost to the customer.
In the near future, it is likely that items that are sold by catalog will be sold over the Internet. Already,LL Bean (http://www.llbean.com/) and Land’s End (http://www.landsend.com/) have IC sites. Customerswishing to shop from the convenience of their home that have computers can now use IC instead of acatalog. An additional benefit for IC customers is the ability to check for specially priced items before acatalog is published and mailed. Although this is not a major source of IC, it is expected to growsubstantially in the future.
In the long run one can envision that most products will be available on the Internet. Wal-Mart has aWeb site with over 20,000 computer items and 2000 music titles. In the future, Wal-Mart plans to haveover 80,000 items for sale on the Internet (Guglielmo 1997) which is more items than a Wal-Mart storehas in stock. Peapod (http://www.peapod.com/) is selling groceries over the Internet. There are estimatesthat by the year 2005 up to $80 billion in grocery products will be sold via IC (Dorgan 1997).
Thus, it appears that many products will be sold via IC in the future. There are product categories that areless likely to be sold via IC as well. Impulse goods, which are purchased with out planning or searching

would be one group (Kotler 1994). These are products that one commonly sees near the checkout countersuch as candy and tabloids. It is hard to image that one would order gum via the Internet. Conveniencegoods, which are purchase frequently without a lot of thought, will probably be purchased throughtraditional retail channels. Perishable and fragile grocery products are also unlikely to be big IC products.Also, emergency goods, which are purchased when a need arises, will continue to be purchased throughtraditional retail sites. Finally, products with a high transportation cost relative to their purchase pricewill be more likely to continue to be purchased through retail centers which can distribute the shippingcost across multiple customers and provide the products at lower costs.
UNRESOLVED ISSUES
There are a variety of issues that remain unresolved regarding IC. These include how to get customers tovisit a site, security, universal access, channels, and legal questions. Each of these will now be discussed.
How to get customers to visit a site
One of the most difficult issues facing IC suppliers is how to get customers to browse their Web sites. Toaddress this problem some companies provide their URL (uniform resource locators) address on theirprint or television advertisements. Other companies like Wal-Mart put their URL on their customers’cash register receipts. Another option is to advertise on popular Web sites. Yahoo(http://www.yahoo.com/) sells advertising on its Web site. According to one estimate, Internetadvertising revenues were over $267 million in 1996 with over 40% of that coming in the 4th quarter (Ad1997). In 1996 Internet advertising revenue increased on a 45% per quarter basis, which indicates thatInternet advertising revenue should grow rapidly in the future. For suppliers, the introduction of ICmeans that new decisions must be made as to the distribution of advertising money across the differentmedia.
Security
Security is undoubtedly the most newsworthy issue facing IC. The widely publicized security problemswith Microsoft’s Internet Explorer as well as the break-in at the FBI’s Web server computer haveheightened public concerns about the security of the Internet. As a result many customers are unwillingto pass credit card information via the Internet (Cook and Hess 1995). Security is needed to assure thatonly the parties involved in a transaction are aware of the transaction details. To do this, the data that istransferred between the customer and the supplier and between the supplier and the credit agency (e.g.credit card company) must not be available to other parties. The difficulty results from the openness ofthe Internet, basically anyone with a computer can gain access to the Internet. Sniffer programs thatwatch for network traffic are capable of capturing transaction information including passwords andaccount information (Kalakota and Whinston 1996). Software literate thieves write sniffer programs thatcapture the passwords and account numbers of customers. This information can then be used to purchaseproducts illegally.
There is not the only security issue. Companies have to deal with extortion. Although exact figures arenot available for obvious reasons, software hackers have discovered holes in company security systems.The hacker then notifies the company that for a certain fee, the hacker will describe the hole so that thecompany can fix it. Companies, afraid of customer response if the hole were publicized, will often paythe extortion fee and quietly fix the hole.
For customers and suppliers alike, data damage is a major concern. Malicious hackers write programsthat take advantage of holes in security to write programs that will damage data on a customer’s hard

drive. This is the problem that Microsoft had with Internet Explorer 3.0. Software writers were able towrite a code that would damage data on the customer’s computer while the computer was connected tothe Internet using Internet Explorer 3.0.
Finally, customer privacy is another major security concern. Confidential, private data can be interceptedas well as commercial transaction data. Recently, the Social Security Administration established a Website that enables individuals to view their earnings and benefit estimate statements. Concern hasdeveloped on how secure this information is which has resulted in several congress members asking theSocial Security Administration to shut down the site until security can be verified.
Solutions to the security problems exist. Netscape’s Commerce Server has a protocol called SecureSockets Layer (SSL) which provides advanced security features for data communications. This utilizesauthentication to confirm that customers are communicating with the correct server, encryption of thedata, and data integrity to confirm that the data was not altered during transfer. Secure ElectronicTransaction (SET) is being introduced to provide security when customers use credit cards for IC(O’Sullivan 1997). SET utilizes encryption and two keys, private and public, to enable securetransactions over the Internet. Microsoft has made available (on its Web site) fixes for the security holesin Internet Explorer 3.0. While no transaction can ever be made 100% safe, using the Internet forcommerce is probably no more insecure than giving credit card numbers over the phone.
Social Issues
One major concern of IC is that there is not universal access to the Internet. Presently it is estimated thatless than 15 million users have Internet access (Guglielmo 1997). Even with the fast growth of Internetaccess there will not be universal access. There is the danger that those with the means to buy a computerand software and afford monthly connection charges will become “haves” and that many people willbecome “have-nots” (Kalakota and Whinston 1996). If IC becomes a standard way to buy products, andit appears likely that this will happen, it could be considered immoral to only have part of the populationable to enjoy the advantages of IC. It appears that most politicians and the US Federal Government haveendorsed the concept of equal access without determining how to achieve equal access.
The primary difficulty of achieving equal access appears to be both initial expenses of buying a computerand software to be able to connect to the Internet and the monthly charges that are required to maintainaccess to the Internet. Presently, the computer would cost over $1000 and the access fee averages about$20.00 per month. All of this assumes that the person has a telephone, which is an additional expense.For those consumers without significant capital or credit these expenses are too high to bear. Anotherproblem for many low-income people is the threat of theft of the computer. For IC to reach its potential away must be found to avoid leaving people behind in the electronic age.
Channel Issues
For many products, IC allows suppliers to reach customers without using traditional channels to themarket. Dell can sell computers directly to customers without needing to sell through computer stores orsupply houses. Qualcomm can sell Eudora directly to customers without having to go through anintermediary or a shipping company. The manufacturer can now compete nationally and worldwide withits wholesalers and distributors. This ability may mean a change in the market channel structure for manyindustries. The role of the wholesaler and retailer may change.
With the growth of IC there will be winners and losers in the market place. The customer may be thebiggest winner. IC should reduce the cost of transactions. The customer should see a reduction in their

costs due to the reduction in transaction costs. Small package transportation companies like FedEx(http://www.fedex.com/) and UPS (http://www.ups.com/) should be winners. Instead of making largebulk shipments to wholesalers, retailers, or outlets, smaller packages will be shipped directly to thecustomer. FedEx has already developed an Internet product to enable shippers to quickly print labelsusing laser printers. The program then notifies FedEx to pick up the package. There is no need to callFedEx; it is all done automatically. FedEx also allows customers to track their packages via the Internet.
Bulk transportation companies and market intermediaries may be the big losers. As manufacturers takeorders directly from customers, retailers and wholesalers may see a decrease in their sales. Manufacturerswill have access to more and better market information directly without going to intermediaries with aresulting loss of power for the intermediaries. Those retailers that develop strong brand loyalties on theInternet should not see the type of losses that other retailers will. Perhaps this is why Wal-Mart is makingsuch a big investment in IC. If the small package shipping companies are winners, the large bulk shipperswill also be losers. More shipments will go by way of the small package shippers and less by the bulkshippers.
Legal Issues
There are many legal issues regarding IC that will need to be addressed. The uncertainty of these issueswill slow down IC until they are resolved. An important issue is the question of which laws apply. Dothe laws in the buyer’s location, seller’s location or some other location apply? If the company selling aproduct is in a state where the legal age to buy it is 18 and the customer is located in a state with a legalage of 21, is it legal to sell the product to a 19 year old in that state? Virtual Vineyards(http://www.virtualvin.com/) sells wine and food over the Internet. Which state should receive the liquortaxes on the wine sold by Virtual Vineyards?
Other legal issues include what can be advertised and what can be shown on Web sites. There aredifferent laws regarding advertising in different states. Determining who has jurisdiction will be adifficult problem. Finally, methods and terms of payment need to be determined. These unansweredquestions will need to be answered before IC can reach its potential.
Future Research
There are many questions that need to be answered in regards to IC. Research is needed to determine ifand how the governments can utilize the Internet to provide benefits to citizens. Potentially, thetransaction savings could be very large. Unfortunately, it is very likely that the people receiving thebenefits may be the least likely to be able to use the Internet. Research is also needed to determine how toachieve universal access to IC. In the past, to achieve universal access authorities were established tohelp provide access such as with electricity. How this will be done with IC is unknown.
For suppliers, research is needed on optimal ways to reach customers. The combinations of hardware andsoftware need to help companies achieve their corporate objectives needs to be determined. Additionalresearch is needed to determine the best ways to advertise a Web site to the target market and how toconvince customers to fully utilize Internet commerce’s capabilities. For both suppliers and customers,research is needed to improve security.
There are many there are many issues regarding customer usage of IC. Ways to help customers to utilizeIC without abusing it or being abused by it need to be researched. Finally, without secure transactions, ICwill not grow and the benefits that it promises will not be achieved. For both suppliers and customers,research is needed to improve security.
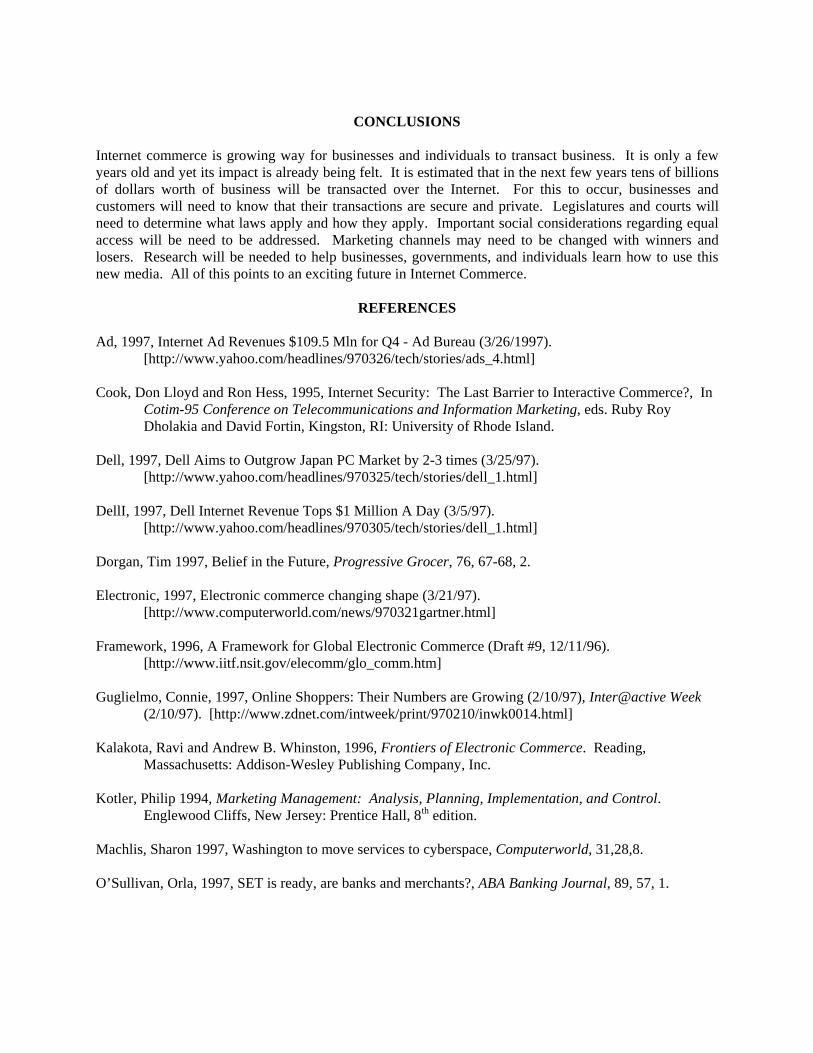
CONCLUSIONS
Internet commerce is growing way for businesses and individuals to transact business. It is only a fewyears old and yet its impact is already being felt. It is estimated that in the next few years tens of billionsof dollars worth of business will be transacted over the Internet. For this to occur, businesses andcustomers will need to know that their transactions are secure and private. Legislatures and courts willneed to determine what laws apply and how they apply. Important social considerations regarding equalaccess will be need to be addressed. Marketing channels may need to be changed with winners andlosers. Research will be needed to help businesses, governments, and individuals learn how to use thisnew media. All of this points to an exciting future in Internet Commerce.
REFERENCES
Ad, 1997, Internet Ad Revenues $109.5 Mln for Q4 - Ad Bureau (3/26/1997).[http://www.yahoo.com/headlines/970326/tech/stories/ads_4.html]
Cook, Don Lloyd and Ron Hess, 1995, Internet Security: The Last Barrier to Interactive Commerce?, InCotim-95 Conference on Telecommunications and Information Marketing, eds. Ruby RoyDholakia and David Fortin, Kingston, RI: University of Rhode Island.
Dell, 1997, Dell Aims to Outgrow Japan PC Market by 2-3 times (3/25/97).[http://www.yahoo.com/headlines/970325/tech/stories/dell_1.html]
DellI, 1997, Dell Internet Revenue Tops $1 Million A Day (3/5/97).[http://www.yahoo.com/headlines/970305/tech/stories/dell_1.html]
Dorgan, Tim 1997, Belief in the Future, Progressive Grocer, 76, 67-68, 2.
Electronic, 1997, Electronic commerce changing shape (3/21/97).[http://www.computerworld.com/news/970321gartner.html]
Framework, 1996, A Framework for Global Electronic Commerce (Draft #9, 12/11/96).[http://www.iitf.nsit.gov/elecomm/glo_comm.htm]
Guglielmo, Connie, 1997, Online Shoppers: Their Numbers are Growing (2/10/97), Inter@active Week(2/10/97). [http://www.zdnet.com/intweek/print/970210/inwk0014.html]
Kalakota, Ravi and Andrew B. Whinston, 1996, Frontiers of Electronic Commerce. Reading,Massachusetts: Addison-Wesley Publishing Company, Inc.
Kotler, Philip 1994, Marketing Management: Analysis, Planning, Implementation, and Control.Englewood Cliffs, New Jersey: Prentice Hall, 8th edition.
Machlis, Sharon 1997, Washington to move services to cyberspace, Computerworld, 31,28,8.
O’Sullivan, Orla, 1997, SET is ready, are banks and merchants?, ABA Banking Journal, 89, 57, 1.
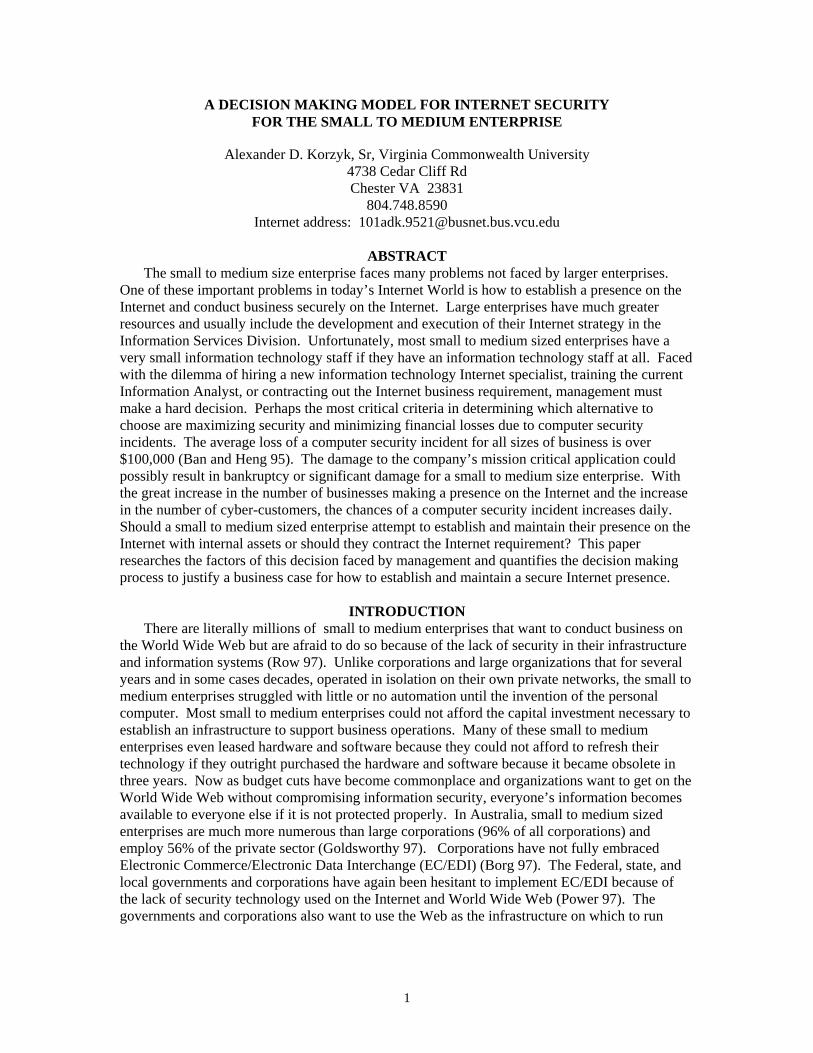
1
A DECISION MAKING MODEL FOR INTERNET SECURITYFOR THE SMALL TO MEDIUM ENTERPRISE
Alexander D. Korzyk, Sr, Virginia Commonwealth University4738 Cedar Cliff RdChester VA 23831
804.748.8590Internet address: [email protected]
ABSTRACTThe small to medium size enterprise faces many problems not faced by larger enterprises.
One of these important problems in today’s Internet World is how to establish a presence on theInternet and conduct business securely on the Internet. Large enterprises have much greaterresources and usually include the development and execution of their Internet strategy in theInformation Services Division. Unfortunately, most small to medium sized enterprises have avery small information technology staff if they have an information technology staff at all. Facedwith the dilemma of hiring a new information technology Internet specialist, training the currentInformation Analyst, or contracting out the Internet business requirement, management mustmake a hard decision. Perhaps the most critical criteria in determining which alternative tochoose are maximizing security and minimizing financial losses due to computer securityincidents. The average loss of a computer security incident for all sizes of business is over$100,000 (Ban and Heng 95). The damage to the company’s mission critical application couldpossibly result in bankruptcy or significant damage for a small to medium size enterprise. Withthe great increase in the number of businesses making a presence on the Internet and the increasein the number of cyber-customers, the chances of a computer security incident increases daily.Should a small to medium sized enterprise attempt to establish and maintain their presence on theInternet with internal assets or should they contract the Internet requirement? This paperresearches the factors of this decision faced by management and quantifies the decision makingprocess to justify a business case for how to establish and maintain a secure Internet presence.
INTRODUCTIONThere are literally millions of small to medium enterprises that want to conduct business on
the World Wide Web but are afraid to do so because of the lack of security in their infrastructureand information systems (Row 97). Unlike corporations and large organizations that for severalyears and in some cases decades, operated in isolation on their own private networks, the small tomedium enterprises struggled with little or no automation until the invention of the personalcomputer. Most small to medium enterprises could not afford the capital investment necessary toestablish an infrastructure to support business operations. Many of these small to mediumenterprises even leased hardware and software because they could not afford to refresh theirtechnology if they outright purchased the hardware and software because it became obsolete inthree years. Now as budget cuts have become commonplace and organizations want to get on theWorld Wide Web without compromising information security, everyone’s information becomesavailable to everyone else if it is not protected properly. In Australia, small to medium sizedenterprises are much more numerous than large corporations (96% of all corporations) andemploy 56% of the private sector (Goldsworthy 97). Corporations have not fully embracedElectronic Commerce/Electronic Data Interchange (EC/EDI) (Borg 97). The Federal, state, andlocal governments and corporations have again been hesitant to implement EC/EDI because ofthe lack of security technology used on the Internet and World Wide Web (Power 97). Thegovernments and corporations also want to use the Web as the infrastructure on which to run
2
EC/EDI. But what about the small to medium enterprises that also want to conduct business onthe web securely?
Many small companies wish to have the opportunity to expand should new business becomeavailable. One of the problems that most small companies face is how to afford getting newbusiness? Preparing cost proposals take up much time and resources with a small chance ofgetting the new business. Advertising in local papers may have gotten only a handful ofresponses. Current business may have been obtained by personal networking. The trend formany small companies is to now advertise on the WWW just like the large companies. With keyword searches, not only will the big corporations appear in the prospects search but smallcompanies would also appear. Perhaps some local firms may be willing to do business with asmall company and possibly get a better product faster than with a large company and possiblyget a worse product. The WWW could give companies the capability to transfer files and documents for a lowmonthly unlimited access fee to the WWW. The majority of data transfer in small companies iscurrently done by dialing up point to point and paying for each minute of phone line usage or bysnail mail (the term for regular postage mail). The web would also allow access to the companypublic database for product information. One course of action would be to outsource a web pagefrom companies that specialize in running web servers. This Internet service provider would beresponsible for making sure that the web server was secure. The Internet solution provider shoulduse a firewall and other web security products to greatly reduce the chances of an attack fromboth the outside and inside of the small to medium enterprise. The Internet service providerwould pay for the expensive software that may be required to secure the web server. A secondcourse of action would be for the company to purchase, set up, and maintain their own webserver. The company would bear the expense of securing the web server. They would still haveto support non-web users as well. This course of action would require a decision between thecompany hiring an Internet specialist to set up their own web server or train a current Informationtechnology specialist to set up their own web server. The chance of losing data or suffering afinancial loss due to an outside attack increases dramatically with the personnel lack of securityexpertise.
RESEARCH QUESTIONThe primary purpose of this research was to develop a decision making model for how to conductbusiness on the Web based on security threats. The research question concerning businessesincluded the following:
Should a small to medium enterprise outsource to conduct business on the web based onsecurity threats?
Should the enterprise hire an Internet specialist to conduct business on the web based onsecurity threats?
Should the enterprise train a current Information technology specialist to conductbusiness on the web based on security threats?
RESEARCH METHODSThis research uses decision analysis methodology to develop a decision making model for how toconduct business on the Web based on security threats was to follow decision analysismethodology. Many small to medium enterprises cannot afford to even develop a business casefor conducting business on the Web or they may even know the options available to them. Thisresearch will enable any small to medium enterprise to decide if they should outsource their
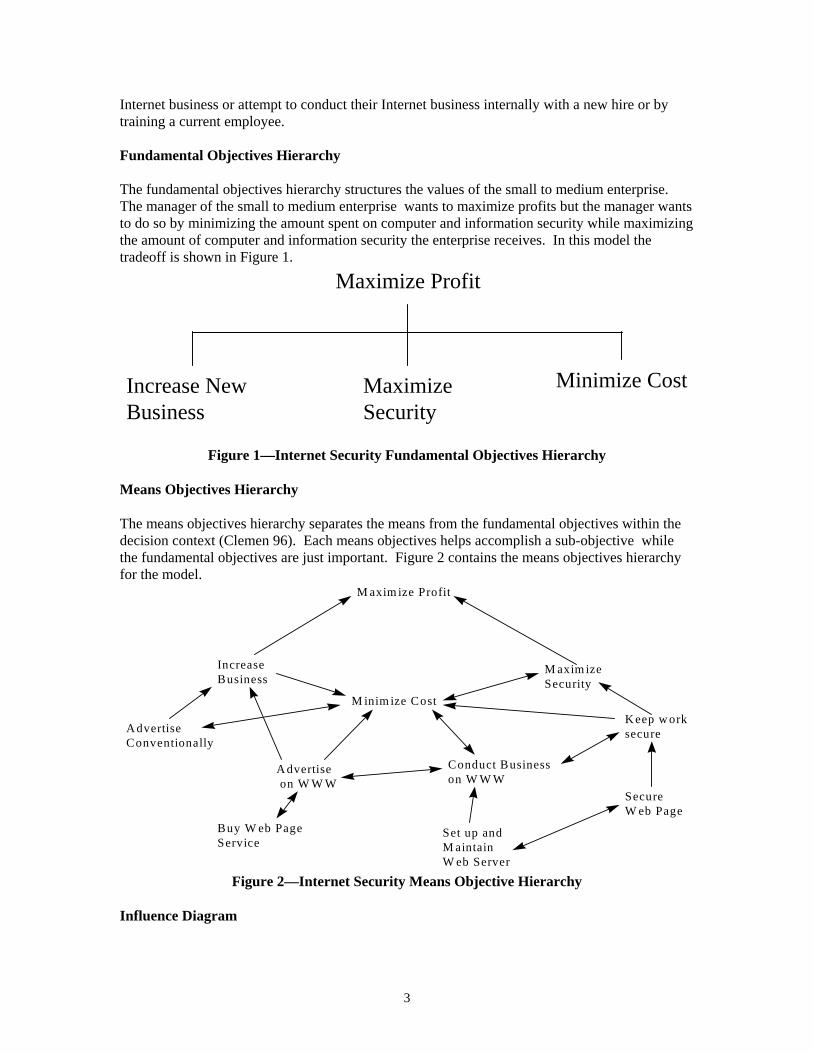
3
Internet business or attempt to conduct their Internet business internally with a new hire or bytraining a current employee.
Fundamental Objectives Hierarchy
The fundamental objectives hierarchy structures the values of the small to medium enterprise.The manager of the small to medium enterprise wants to maximize profits but the manager wantsto do so by minimizing the amount spent on computer and information security while maximizingthe amount of computer and information security the enterprise receives. In this model thetradeoff is shown in Figure 1.
Maximize Profit
Increase NewBusiness
MaximizeSecurity
Minimize Cost
Figure 1—Internet Security Fundamental Objectives Hierarchy
Means Objectives Hierarchy
The means objectives hierarchy separates the means from the fundamental objectives within thedecision context (Clemen 96). Each means objectives helps accomplish a sub-objective whilethe fundamental objectives are just important. Figure 2 contains the means objectives hierarchyfor the model.
M axim ize Profit
AdvertiseConventionally
IncreaseBusiness
Advertise on W W W
Buy W eb PageService
M inim ize Cost
M axim izeSecurity
Conduct Businesson W W W
Keep worksecure
SecureW eb Page
Set up andM aintainW eb Server
Figure 2—Internet Security Means Objective Hierarchy
Influence Diagram
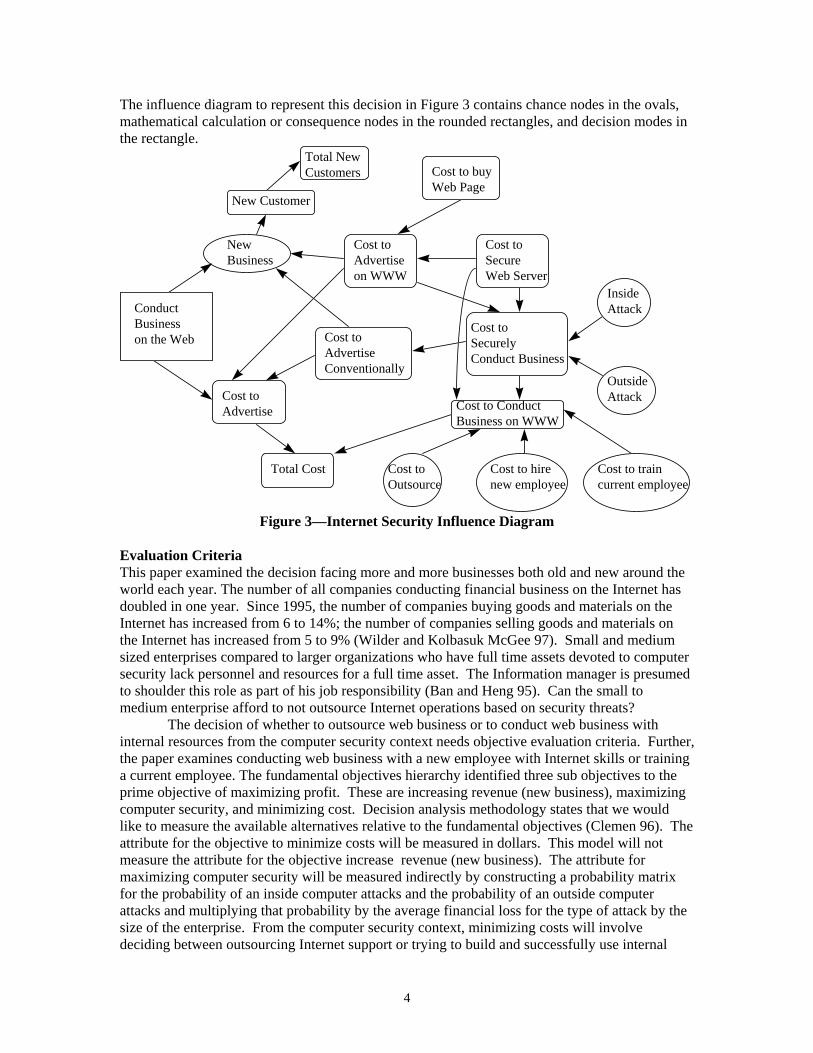
4
The influence diagram to represent this decision in Figure 3 contains chance nodes in the ovals,mathematical calculation or consequence nodes in the rounded rectangles, and decision modes inthe rectangle.
ConductBusinesson the Web
NewBusiness
Cost to buyWeb Page
Cost to Advertiseon WWW
Cost to SecureWeb Server
Cost to Advertise
Cost toAdvertiseConventionally
Total Cost
Cost toSecurelyConduct Business
Cost to ConductBusiness on WWW
Cost toOutsource
Cost to hirenew employee
Cost to traincurrent employee
InsideAttack
OutsideAttack
New Customer
Total New Customers
Figure 3—Internet Security Influence Diagram
Evaluation CriteriaThis paper examined the decision facing more and more businesses both old and new around theworld each year. The number of all companies conducting financial business on the Internet hasdoubled in one year. Since 1995, the number of companies buying goods and materials on theInternet has increased from 6 to 14%; the number of companies selling goods and materials onthe Internet has increased from 5 to 9% (Wilder and Kolbasuk McGee 97). Small and mediumsized enterprises compared to larger organizations who have full time assets devoted to computersecurity lack personnel and resources for a full time asset. The Information manager is presumedto shoulder this role as part of his job responsibility (Ban and Heng 95). Can the small tomedium enterprise afford to not outsource Internet operations based on security threats?
The decision of whether to outsource web business or to conduct web business withinternal resources from the computer security context needs objective evaluation criteria. Further,the paper examines conducting web business with a new employee with Internet skills or traininga current employee. The fundamental objectives hierarchy identified three sub objectives to theprime objective of maximizing profit. These are increasing revenue (new business), maximizingcomputer security, and minimizing cost. Decision analysis methodology states that we wouldlike to measure the available alternatives relative to the fundamental objectives (Clemen 96). Theattribute for the objective to minimize costs will be measured in dollars. This model will notmeasure the attribute for the objective increase revenue (new business). The attribute formaximizing computer security will be measured indirectly by constructing a probability matrixfor the probability of an inside computer attacks and the probability of an outside computerattacks and multiplying that probability by the average financial loss for the type of attack by thesize of the enterprise. From the computer security context, minimizing costs will involvedeciding between outsourcing Internet support or trying to build and successfully use internal
5
Internet support. For example, in the Richmond area, there are three sources which provideInternet service. Old Dominion Express Internet Solutions provides web site design, hosting,and access consultation for $19.95 per month. WWW.247ad.com provides advertising on theInternet for $25 per month. VisiNet provides high speed Internet access, web site design, andweb hosting for varied amounts up to $80.00 per month for a non-virtual Internet address. VisionInteractive advertises that it provides interactive net-based business solutions, designing websites and providing secure hosting and superior access services for an unadvertised amount.Media Connection advertises that they provide complete turnkey web sites at an unadvertisedamount. Professional Web Creations also has an unadvertised amount. Susie Q Interactive,offers web site development, web access and networking services for an unadvertised amount.Monumental Network Systems advertises that it provides a free web page, and technical supportfor only $10 per month. Internet Creations advertised that their pages get noticed for anunadvertised amount. These very low advertised amounts normally do not include any Interneton-line ordering or selling capability. The author was unable to determine at this time if theseInternet Providers would guarantee against financial loss due to an attack by an outsider orinsider. There have been several recent articles citing the unreliability of Internet providers. Thealternative for outsourcing is to provide your own web host. Companies such as Video DirectCorporation advertises that you do not need a computer or training. They advertise that for$39.95 you receive their business manual & forms, ad slicks & press releases, instant use of theirInternet catalog, and regular Internet web site updates to become an independent consultantpromoting their catalog. MacGraw-Hill Internet Training Manual gives the user a step-by-step instructional guide to building and running a business on the web for $32.95. MacGraw-Hillalso publishes Making More Money on the Internet by Emily Glossbrenner to help yourbusiness begin to sell products or services including guidelines for encryption and security.
The first criterion of maximizing security is addressed by the quantitative variable of thefinancial loss associated with the attack on the information system. The financial loss isindependent of whether the attack came from within the company or outside the company. AnErnst and Young survey of all size enterprises conducted in 1996 (Violino 96), revealed thatcompanies attacked had a probability of .05 for a financial loss of over $1,000,000 per attack;companies attacked had a probability of .25 for a financial loss of over $250,000 per attack; andthe remaining companies had a probability of .7 for an undetermined amount of financial loss.The Ernst and Young survey further discovered that financial losses come from several causeslisted in Table 1 (Violino 96).Security Problem resulting in financial lossessited above.
Probability of companies with loss from thissecurity problem (independent).
Industrial espionage .09Attacks from outside the company .23Natural disasters .29Attacks from inside the company .41Downtime from non-disasters .6Accidental errors .72Computer viruses .75Unknown sources .2
Table 1--Probability of Financial Losses
This paper focused on two of the security problems caused by the Internet dealing with attacks.The Attacks from outside the company has a probability of .23 and the attacks from inside thecompany has a probability of .41. Another source sited the estimates for inside attacks as high as.80 back in 1991 (Bresnahan 97). Government agencies and organizations experience only .54probability of an inside attack costing the government about $72,000 for each security incident
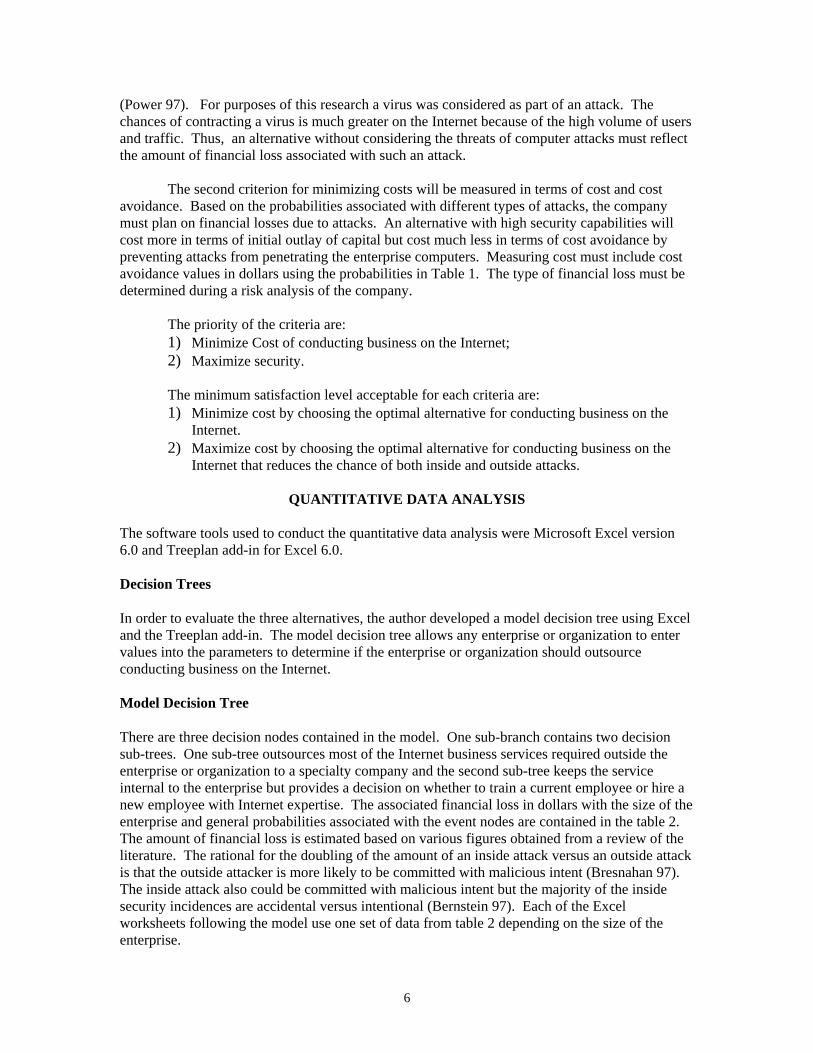
6
(Power 97). For purposes of this research a virus was considered as part of an attack. Thechances of contracting a virus is much greater on the Internet because of the high volume of usersand traffic. Thus, an alternative without considering the threats of computer attacks must reflectthe amount of financial loss associated with such an attack.
The second criterion for minimizing costs will be measured in terms of cost and costavoidance. Based on the probabilities associated with different types of attacks, the companymust plan on financial losses due to attacks. An alternative with high security capabilities willcost more in terms of initial outlay of capital but cost much less in terms of cost avoidance bypreventing attacks from penetrating the enterprise computers. Measuring cost must include costavoidance values in dollars using the probabilities in Table 1. The type of financial loss must bedetermined during a risk analysis of the company.
The priority of the criteria are:1) Minimize Cost of conducting business on the Internet;2) Maximize security.
The minimum satisfaction level acceptable for each criteria are:1) Minimize cost by choosing the optimal alternative for conducting business on the
Internet.2) Maximize cost by choosing the optimal alternative for conducting business on the
Internet that reduces the chance of both inside and outside attacks.
QUANTITATIVE DATA ANALYSIS
The software tools used to conduct the quantitative data analysis were Microsoft Excel version6.0 and Treeplan add-in for Excel 6.0.
Decision Trees
In order to evaluate the three alternatives, the author developed a model decision tree using Exceland the Treeplan add-in. The model decision tree allows any enterprise or organization to entervalues into the parameters to determine if the enterprise or organization should outsourceconducting business on the Internet.
Model Decision Tree
There are three decision nodes contained in the model. One sub-branch contains two decisionsub-trees. One sub-tree outsources most of the Internet business services required outside theenterprise or organization to a specialty company and the second sub-tree keeps the serviceinternal to the enterprise but provides a decision on whether to train a current employee or hire anew employee with Internet expertise. The associated financial loss in dollars with the size of theenterprise and general probabilities associated with the event nodes are contained in the table 2.The amount of financial loss is estimated based on various figures obtained from a review of theliterature. The rational for the doubling of the amount of an inside attack versus an outside attackis that the outside attacker is more likely to be committed with malicious intent (Bresnahan 97).The inside attack also could be committed with malicious intent but the majority of the insidesecurity incidences are accidental versus intentional (Bernstein 97). Each of the Excelworksheets following the model use one set of data from table 2 depending on the size of theenterprise.

7
SecurityIncidents
Small CompanyLoss per attack
MediumCompany Lossper attack
Large CompanyLoss per attack
Corporation Lossper attack
Inside Attack 10,000 50,000 100,000 1,000,000Outside Attack 20,000 100,000 200,000 2,000,000
Table 2. Financial Loss by Type of Attack and Size of Enterprise
The probabilities in the model come from the table 3. Outsourcing to a reputable InternetProvider which has high security capabilities increases the chances that no attack will occur, thusreducing the chance of an outside attack and slightly reducing the chance of an inside attack. Onthe other hand outsourcing to an irreputable Internet Provider could raise risks (Caldwell 97).Hiring an Internet specialist may also increase the chances that no attack will occur but theenterprise hiring the Internet specialist may not have the capital to purchase the necessary securitysoftware to adequately protect the enterprise. Thus the chances of an outside attack are stillhigher than outsourcing but less likely than training a current employee. The chance of an insideattack remains the same since the Internet specialist is primarily concerned with outside theenterprise. Training a current employee poses the most risk of a successful outside attack.Although the employee may be very proficient in their current position, the chances are thatwithin the first year something will happen that the employee just did not realize was possiblebecause of lack of knowledge. Thus, the probability of no attack is very small compared to theprobability of an outside attack, while the probability of an inside attack remains the same.
Decision Inside Attack Outside Attack No AttackOutsource .33 .33 .33Internal Hire .4 .4 .2Internal Train .4 .5 .1Table 3. Probabilities of Attacks by Type of Attack by Decision
Using the information provided by Table 3, the model is constructed. The information fromTable 2 provides data for the four decision trees that follow the model decision tree.
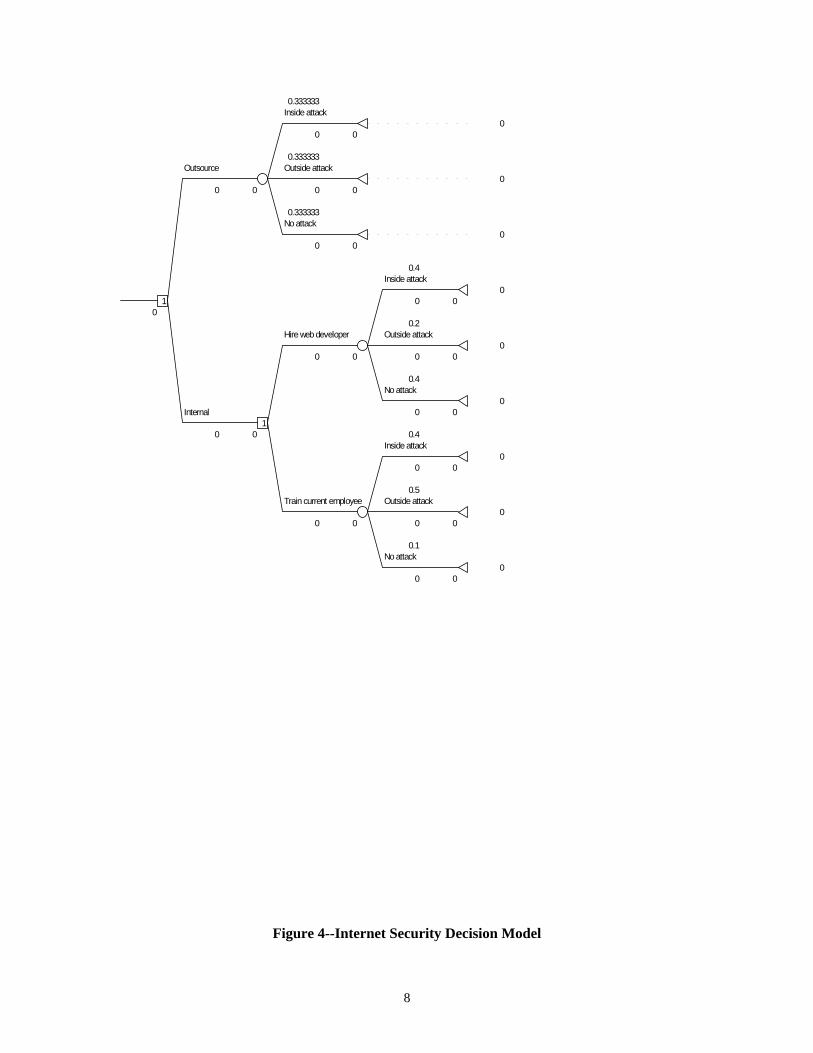
8
0.333333Inside attack
00 0
0.333333Outsource Outside attack
00 0 0 0
0.333333No attack
00 0
0.4Inside attack
01 0 0
00.2
Hire web developer Outside attack0
0 0 0 0
0.4No attack
0Internal 0 0
10 0 0.4
Inside attack0
0 0
0.5Train current employee Outside attack
00 0 0 0
0.1No attack
00 0
Figure 4--Internet Security Decision Model

9
Corporation
This section considers the corporation as an enterprise grossing over $100,000,000 revenue peryear. Not surprisingly, the optimal solution for the corporation is to keep the function internal tothe company. However, the optimal solution for how to keep the Internet function in thecompany is to hire an Internet specialist rather than try to train a current employee and faceadditional risks. The costs for an Internet web developer is estimated at an industry average of$70,000 per year in the United States. The costs for training a current employee in webdevelopment, web security, etc. is approximately $30,000. This cost of training is in addition to abase salary industry average of $60,000 per year in the United States. The Outsource alternativeincurred a cost of $36,000 per year based on using various services from the Internet ServiceProvider with the capability to handle electronic commerce, secured with a firewall, and dynamicweb page development costing approximately $2,000 per month. The web hardware platform,maintenance support, and telecommunications charges cost approximately $1,000 per month.These figures were compiled from a recent market survey conducted by the author.
0 . 3 3 3 3 3 3I n s id e a t t a c k
1 0 3 6 0 0 01 0 0 0 0 0 0 1 0 3 6 0 0 0
0 . 3 3 3 3 3 3O u t s o u r c e O u t s i d e a t t a c k
2 0 3 6 0 0 03 6 0 0 0 1 0 3 6 0 0 0 2 0 0 0 0 0 0 2 0 3 6 0 0 0
0 . 3 3 3 3 3 3N o a t t a c k
3 6 0 0 00 3 6 0 0 0
0 . 4I n s id e a t t a c k
1 0 7 0 0 0 02 1 0 0 0 0 0 0 1 0 7 0 0 0 0
8 7 0 0 0 00 . 2
H i r e w e b d e v e lo p e r O u t s i d e a t t a c k2 0 7 0 0 0 0
7 0 0 0 0 8 7 0 0 0 0 2 0 0 0 0 0 0 2 0 7 0 0 0 0
0 . 4N o a t t a c k
7 0 0 0 0I n t e r n a l 0 7 0 0 0 0
10 8 7 0 0 0 0 0 . 4
I n s id e a t t a c k1 0 9 0 0 0 0
1 0 0 0 0 0 0 1 0 9 0 0 0 0
0 . 5T r a in c u r r e n t e m p lo y e e O u t s i d e a t t a c k
2 0 9 0 0 0 09 0 0 0 0 1 4 9 0 0 0 0 2 0 0 0 0 0 0 2 0 9 0 0 0 0
0 . 1N o a t t a c k
9 0 0 0 00 9 0 0 0 0
Figure 5--Corporate Internet Security Model
Large Enterprise

10
This section considers a large enterprise as one grossing between one million and one hundredmillion dollars per year. The optimal decision for the large enterprise is to outsource the Internetrequirement. The costs for an Internet web developer is estimated at an industry average of$70,000 per year in the United States. The costs for training a current employee in webdevelopment, web security, etc. is approximately $30,000. This cost of training is in addition to abase salary industry average of $60,000 per year in the United States. The Outsource alternativeincurred a cost of $36,000 per year based on using various services from the Internet ServiceProvider with the capability to handle electronic commerce, secured with a firewall, and dynamicweb page development costing approximately $2,000 per month. The web hardware platform,maintenance support, and telecommunications charges cost approximately $1,000 per month.These figures were compiled from a recent market survey conducted by the author.
0 .3 3 3 3 3 3In s id e a tta c k
1 3 6 0 0 01 0 0 0 0 0 1 3 6 0 0 0
0 .3 3 3 3 3 3O u tso u rc e O u ts id e a tta c k
2 3 6 0 0 03 6 0 0 0 1 3 6 0 0 0 2 0 0 0 0 0 2 3 6 0 0 0
0 .3 3 3 3 3 3N o a tta c k
3 6 0 0 00 3 6 0 0 0
0 .4In s id e a tta c k
1 7 0 0 0 01 1 0 0 0 0 0 1 7 0 0 0 0
1 3 6 0 0 00 .2
H ire w e b d e v e lo p e r O u ts id e a tta c k2 7 0 0 0 0
7 0 0 0 0 1 5 0 0 0 0 2 0 0 0 0 0 2 7 0 0 0 0
0 .4N o a tta c k
7 0 0 0 0In te rn a l 0 7 0 0 0 0
10 1 5 0 0 0 0 0 .4
In s id e a tta c k1 9 0 0 0 0
1 0 0 0 0 0 1 9 0 0 0 0
0 .5T ra in c u rre n t e m p lo y e e O u ts id e a tta c k
2 9 0 0 0 09 0 0 0 0 2 3 0 0 0 0 2 0 0 0 0 0 2 9 0 0 0 0
0 .1N o a tta c k
9 0 0 0 00 9 0 0 0 0
Figure 6--Large Enterprise Internet Security Model
Medium Enterprise

11
This section considers a medium enterprise to have between two hundred fifty thousand dollarsand one million dollars of gross revenue per year. The optimal alternative for the mediumenterprise is to outsource the Internet requirement. The costs for an Internet web developer isestimated at an industry average of $70,000 per year in the United States. The costs for training acurrent employee in web development, web security, etc. is approximately $30,000. This cost oftraining is in addition to a base salary industry average of $60,000 per year in the United States.The Outsource alternative incurred a cost of $36,000 per year based on using various servicesfrom the Internet Service Provider with the capability to handle electronic commerce, securedwith a firewall, and dynamic web page development costing approximately $2,000 per month.The web hardware platform, maintenance support, and telecommunications charges costapproximately $1,000 per month. These figures were compiled from a recent market surveyconducted by the author.
0.333333Inside a ttack
8600050000 86000
0.333333O utsource O utside a ttack
13600036000 86000 100000 136000
0.333333N o a ttack
360000 36000
0.4Inside a ttack
1200001 50000 120000
860000.2
H ire web dev e loper O utside a ttack170000
70000 110000 100000 170000
0.4N o a ttack
70000In terna l 0 70000
10 110000 0.4
Inside a ttack140000
50000 140000
0.5T ra in curren t em ployee O utside a ttack
19000090000 160000 100000 190000
0.1N o a ttack
900000 90000
Figure 7--Medium Enterprise Internet Security Model
Small Enterprise

12
This section considers a small enterprise to have less than two hundred fifty thousand dollars ofgross revenue per year. The optimal alternative for the small enterprise is to outsource theInternet requirement. The costs for an Internet web developer is estimated at an industry averageof $70,000 per year in the United States. The costs for training a current employee in webdevelopment, web security, etc. is approximately $30,000. This cost of training is in addition to abase salary industry average of $60,000 per year in the United States. The Outsource alternativeincurred a cost of $36,000 per year based on using various services from the Internet ServiceProvider with the capability to handle electronic commerce, secured with a firewall, and dynamicweb page development costing approximately $2,000 per month. The web hardware platform,maintenance support, and telecommunications charges cost approximately $1,000 per month.These figures were compiled from a recent market survey conducted by the author.
0 .3 3 3 3 3 3In s id e a t ta c k
2 2 0 0 01 0 0 0 0 2 2 0 0 0
0 .3 3 3 3 3 3O u ts o u rc e O u ts id e a t ta c k
3 2 0 0 01 2 0 0 0 2 2 0 0 0 2 0 0 0 0 3 2 0 0 0
0 .3 3 3 3 3 3N o a t ta c k
1 2 0 0 00 1 2 0 0 0
0 .4In s id e a t ta c k
8 0 0 0 01 1 0 0 0 0 8 0 0 0 0
2 2 0 0 00 .2
H ire w e b d e v e lo p e r O u ts id e a t ta c k9 0 0 0 0
7 0 0 0 0 7 8 0 0 0 2 0 0 0 0 9 0 0 0 0
0 .4N o a t ta c k
7 0 0 0 0In te rn a l 0 7 0 0 0 0
10 7 8 0 0 0 0 .4
In s id e a t ta c k1 0 0 0 0 0
1 0 0 0 0 1 0 0 0 0 0
0 .5T ra in c u r re n t e m p lo y e e O u ts id e a t ta c k
1 1 0 0 0 09 0 0 0 0 1 0 4 0 0 0 2 0 0 0 0 1 1 0 0 0 0
0 .1N o a t ta c k
9 0 0 0 00 9 0 0 0 0
Figure 8--Small Enterprise Internet Security Model
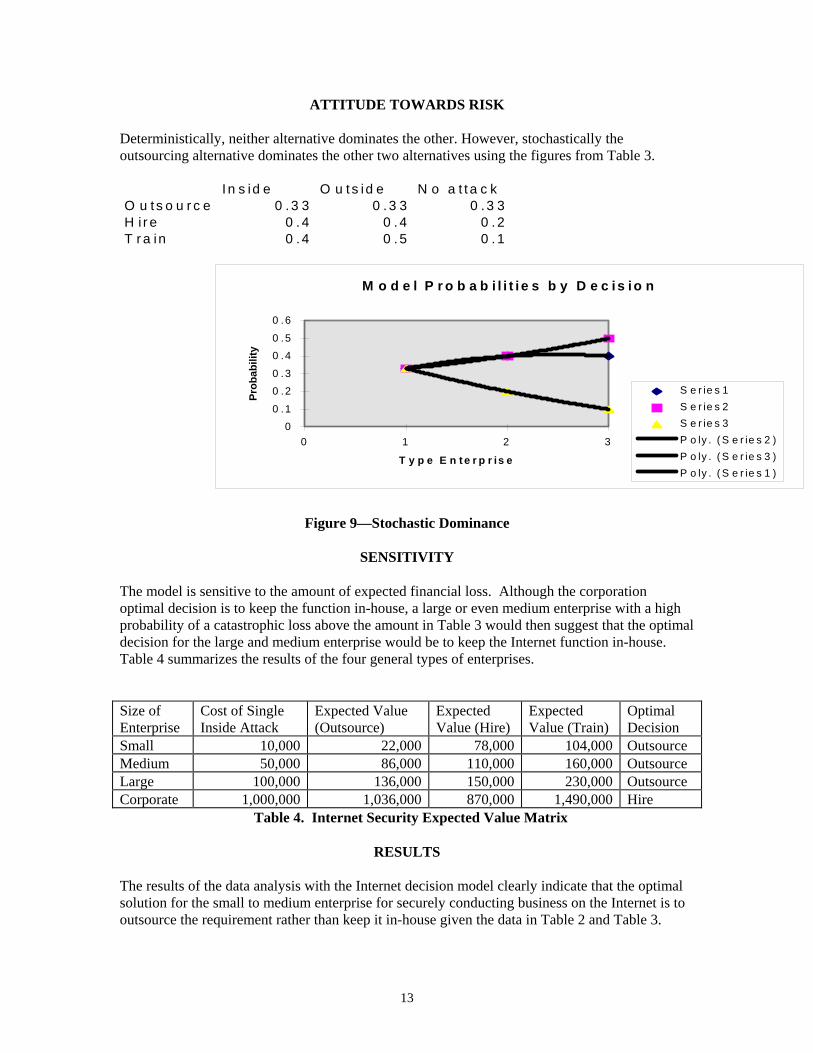
13
ATTITUDE TOWARDS RISK
Deterministically, neither alternative dominates the other. However, stochastically theoutsourcing alternative dominates the other two alternatives using the figures from Table 3.
I n s id e O u t s id e N o a t t a c kO u t s o u r c e 0 . 3 3 0 . 3 3 0 . 3 3H i r e 0 . 4 0 . 4 0 . 2T r a in 0 . 4 0 . 5 0 . 1
M o d e l P r o b a b i l i t i e s b y D e c i s i o n
0
0 .1
0 .2
0 .3
0 .4
0 .5
0 .6
0 1 2 3
T y p e E n t e r p r i s e
Pro
babi
lity
S e r ie s 1
S e r ie s 2
S e r ie s 3
P o ly . ( S e r ie s 2 )
P o ly . ( S e r ie s 3 )
P o ly . ( S e r ie s 1 )
Figure 9—Stochastic Dominance
SENSITIVITY
The model is sensitive to the amount of expected financial loss. Although the corporationoptimal decision is to keep the function in-house, a large or even medium enterprise with a highprobability of a catastrophic loss above the amount in Table 3 would then suggest that the optimaldecision for the large and medium enterprise would be to keep the Internet function in-house.Table 4 summarizes the results of the four general types of enterprises.
Size ofEnterprise
Cost of SingleInside Attack
Expected Value(Outsource)
ExpectedValue (Hire)
ExpectedValue (Train)
OptimalDecision
Small 10,000 22,000 78,000 104,000 OutsourceMedium 50,000 86,000 110,000 160,000 OutsourceLarge 100,000 136,000 150,000 230,000 OutsourceCorporate 1,000,000 1,036,000 870,000 1,490,000 Hire
Table 4. Internet Security Expected Value Matrix
RESULTS
The results of the data analysis with the Internet decision model clearly indicate that the optimalsolution for the small to medium enterprise for securely conducting business on the Internet is tooutsource the requirement rather than keep it in-house given the data in Table 2 and Table 3.

14
Further break-even analysis may be conducted by the user of the model by varying theprobabilities in Table 3 and the financial loss for the type of attack in Table 2.
RECOMMENDATIONS FOR FURTHER RESEARCH
Further research using empirical data to validate the Internet decision model is needed. As moresmall to medium enterprises begin to conduct business on the Internet, researchers should conductsurveys specifically asking for the number of inside and outside attacks and the amount offinancial loss associated with the type of attack.
REFERENCESBan, Lim Yew and Heng, Goh Moh, Computer Security Issues in Small and Medium-sized
Enterprises, Singapore Management Review, Vol. 17, No. 1, Jan 1995, pp. 15-29.
Bernstein, David S., Infosecurity News industry survey, Infosecurity News, Vol. 8, No. 3, May1997, pp. 20-27.
Borg, Kim, Web Readies Wares for Online “Shopholics” But security concerns keep them turnedoff, Computer Technology Review, Vol. 17, No. 3, March 1997, p. 1, 6-8.
Bresnahan, Jennifer, To Catch a Thief, CIO Magazine, March 1, 1997, pp. 68-72.
Caldwell, Bruce, Violino, Bob, and Kolbasuk McGee, Marianne, Hidden Partners, HiddenDangers, Information Week, January 20, 1997, pp. 38-52.
Clemen, Robert T., Making Hard Decisions: An Introduction to Decision Analysis, 2nd edition,Duxbury Press at Wadsworth Publishing Company, New York, New York, 1996.
Goldsworthy, Mary-Anne, Electronic Commerce for Small to Medium Sized Enterprises,URL:http//www.arraydev.com/commerce/JIBC/9702-19.htm.
Power, Kevin, FBI finds hackers can’t resist a government agency, GovernmentComputing News, April 14, 1997, p. 60.
Row, Heath, The electric handshake, CIO Magazine, January 1, 1997, pp. 48-63.
Violino, Bob, The Security Facade, Information Week, October 21, 1996, pp. 36-48.
Wilder, Clinton and Kolbasuk McGee, Marianne, GE The Net Pays Off, January 27, 1997, pp.14-16.
FROM COBOL TO THE INTERNET IN CLIENT-SERVER COMPUTING ENVIRONMENTS
Donald E. Carr, Virgil L. BrewerCollege of Business, Eastern Kentucky University, Richmond, KY 40475 Phone (606) 622-1574
[email protected]; [email protected]
ABSTRACT
Many ‘pundits’ over the last few years have forecasted a rapid demise of the Cobol language in the developmentof modern business applications. Yet, Cobol continues to be extremely important and relevant in mainstreambusiness computing environments. Recent inclusion of object-oriented technology into the constructs of thenew COBOL 9x proposed language standard give new ‘life’ to the Cobol language. CGI programs written inCobol using extensions to the COBOL 9x standard allow the embedding of HTML and Active-X input or outputforms into the Cobol CGI program. Provision of this new integrated development environment for Cobol allowsinclusion and reuse of existing legacy code into new Internet/Intranet Web application deployment withoutmajor retraining effort. The purpose of this paper explores the integration of Cobol code and programmingconstructs that allow dynamic web program development and data interaction through use of embeddedHTML/Active-X forms that use ‘overloaded’ ACCEPT/DISPLAY Cobol statements.
INTRODUCTION
Current object-oriented computer language development has historically evolved from two distinct paths. Onepath, code –oriented, flows from Fortran, Algol, Pascal, Ada, and C programming languages. The other pathhas been the data-oriented path that has evolved primarily through the standardization of COBOL, COBOL-74,and COBOL-85. Both paths were constrained by technology from viewing business applications as sets ofobjects that actually exist in the real world.
With the major computer and communication networking advances occurring in recent years, these two distinctpaths are now merging into one object-oriented application development environment. The code-oriented pathhas resulted in the emergence of C++, Ada-95, and Smalltalk. Presently, Java is emerging from both the C++and Smalltalk development languages. On the data-oriented path, the current Object-Oriented COBOL hasevolved from COBOL-85 and the COBOL-89 extensions. The elements of object orientation contained in thenew proposed COBOL 9x standard implement the four major constructs often associated with object theory[ISO/IEC/WG4, 1996]. The concepts of data encapsulation, data and method definition inheritance, objectpersistence, and polymorphism are present in Object-Oriented Cobol [Obin, 1993].
The Garner Group has estimated that currently more than 700 billion lines of legacy Cobol code continue todrive major business applications throughout the world [Gartner Group, 1996]. The required resolution of theYear 2000 (Y2K) problem in legacy Cobol applications has created a great resurgence in the demand for Cobolprogrammers. There is an emerging acceptance that object technology integrated into business applicationprogram development will yield higher future reusability and reduced code maintenance costs therebydemonstrating an acceptable return on current development investment.
Increased Cobol programmer demand indicates the continued relevance of the Cobol language in thedevelopment and deployment of mainstream worldwide business applications. Cobol applications andmainframe computing continues to dominant a large segment of the business community where majorapplications are still driven by data and transaction processing requirements. The ‘mainframe’ mentality hasreturned, albeit in smaller containers, as large-scale Cobol applications often containing millions of lines oftested, working code must be integrated with object technology. The future lies in the ability to extend the lifeof current Cobol applications by ‘wrapping’ the code as components within the object-oriented Cobol paradigm.
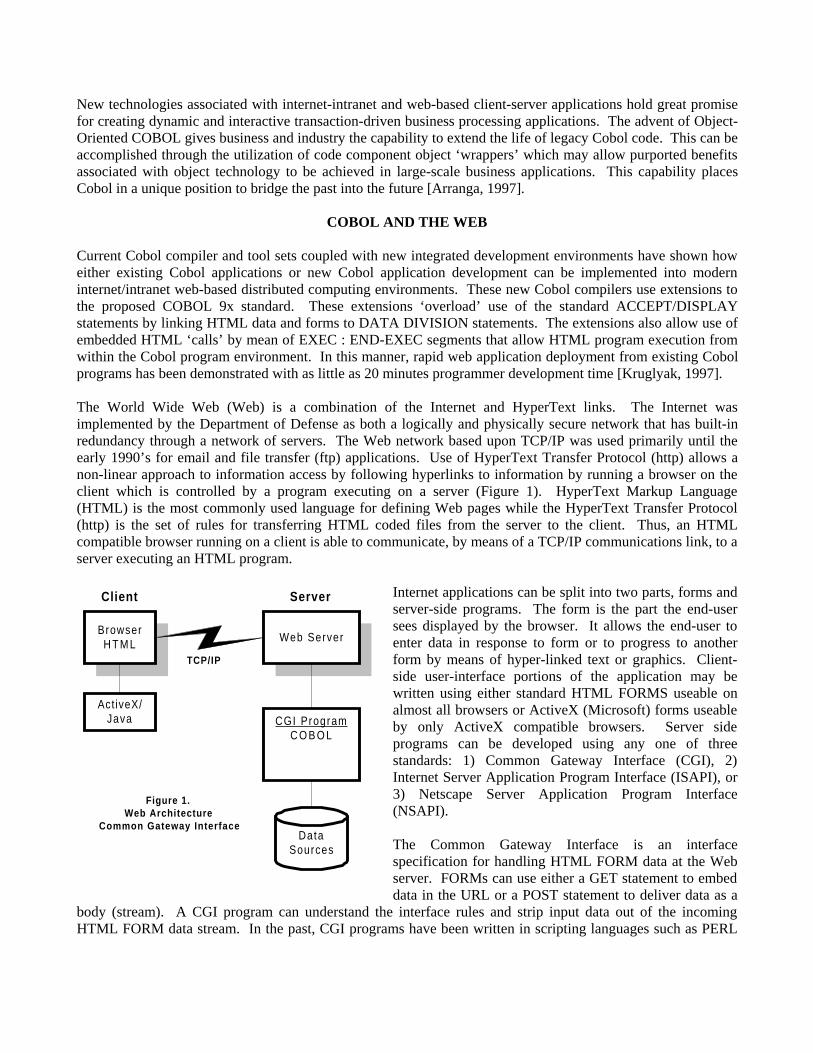
New technologies associated with internet-intranet and web-based client-server applications hold great promisefor creating dynamic and interactive transaction-driven business processing applications. The advent of Object-Oriented COBOL gives business and industry the capability to extend the life of legacy Cobol code. This can beaccomplished through the utilization of code component object ‘wrappers’ which may allow purported benefitsassociated with object technology to be achieved in large-scale business applications. This capability placesCobol in a unique position to bridge the past into the future [Arranga, 1997].
COBOL AND THE WEB
Current Cobol compiler and tool sets coupled with new integrated development environments have shown howeither existing Cobol applications or new Cobol application development can be implemented into moderninternet/intranet web-based distributed computing environments. These new Cobol compilers use extensions tothe proposed COBOL 9x standard. These extensions ‘overload’ use of the standard ACCEPT/DISPLAYstatements by linking HTML data and forms to DATA DIVISION statements. The extensions also allow use ofembedded HTML ‘calls’ by mean of EXEC : END-EXEC segments that allow HTML program execution fromwithin the Cobol program environment. In this manner, rapid web application deployment from existing Cobolprograms has been demonstrated with as little as 20 minutes programmer development time [Kruglyak, 1997].
The World Wide Web (Web) is a combination of the Internet and HyperText links. The Internet wasimplemented by the Department of Defense as both a logically and physically secure network that has built-inredundancy through a network of servers. The Web network based upon TCP/IP was used primarily until theearly 1990’s for email and file transfer (ftp) applications. Use of HyperText Transfer Protocol (http) allows anon-linear approach to information access by following hyperlinks to information by running a browser on theclient which is controlled by a program executing on a server (Figure 1). HyperText Markup Language(HTML) is the most commonly used language for defining Web pages while the HyperText Transfer Protocol(http) is the set of rules for transferring HTML coded files from the server to the client. Thus, an HTMLcompatible browser running on a client is able to communicate, by means of a TCP/IP communications link, to aserver executing an HTML program.
Internet applications can be split into two parts, forms andserver-side programs. The form is the part the end-usersees displayed by the browser. It allows the end-user toenter data in response to form or to progress to anotherform by means of hyper-linked text or graphics. Client-side user-interface portions of the application may bewritten using either standard HTML FORMS useable onalmost all browsers or ActiveX (Microsoft) forms useableby only ActiveX compatible browsers. Server sideprograms can be developed using any one of threestandards: 1) Common Gateway Interface (CGI), 2)Internet Server Application Program Interface (ISAPI), or3) Netscape Server Application Program Interface(NSAPI).
The Common Gateway Interface is an interfacespecification for handling HTML FORM data at the Webserver. FORMs can use either a GET statement to embeddata in the URL or a POST statement to deliver data as a
body (stream). A CGI program can understand the interface rules and strip input data out of the incomingHTML FORM data stream. In the past, CGI programs have been written in scripting languages such as PERL
BrowserH T M L
Client
Web Server
Server
DataSources
Figure 1.Web Architecture
Common Gateway Interface
CGI ProgramC O B O L
Act iveX/Java
TCP/IP

or AWK. But, CGI programs can be written in ANY language! What language would IS managers withmillions of lines of Cobol code to maintain like to use to develop Web applications? Yes, existing legacyapplication can be integrated into the Cobol CGI program. With the large amount of legacy Cobol codecontinuing in production and with the Y2K problem to be resolved and the shortage of Cobol programmers whynot use existing trained Cobol programmers to develop Cobol CGI Web applications.
A NEW COBOL-WEB DEVELEOPMENT ENVIRONMENT
A new Cobol program development environment (Figure 2) is available which integrates object orientation andinternet/intranet-web features to allow building Cobol-Web applications using extensions to the Cobol 9xproposed standard [ISO/IEC/WG4, 1996].
The NetExpress COBOL interactive developmentenvironment (IDE) contains a full Windows 95 look-and-feel that allows project-based development using bothprocedural and object-oriented tools [Micro Focus, 1997].Object-oriented support includes class libraries andvocabularies. Advanced debugging support and just-in-time animation (program tracking) allow highly productivedebug capability. The high performance compiler supportsmulti-threading, OLE automation, direct SQL server access,ODBC data access, Win32 API support, and raw 32bitperformance while also providing broad syntax support forOS/VS, COBOLII, and COBOL/370. The Cobol-Inter/Internet application development system containssupport for project development building and build (make)files. The IDE consists of a Cobol compiler and run timesystem.
A Form Express tool can be used to examine existing legacy Cobol code. It analyzes the Linkage Section of aCobol program and generates the HTML form with an entry field for each selected data item. It then generates aCobol CGI program to call a Cobol program that uses the HTML input/output data stream. This tool providesthe means for reusing and porting existing code into Cobol-Web applications.
The IDE also supports an editor and debugger that can be used to debug and test Cobol-Web applications. Apersonal Web Server that acts as a single user Web server is provided to assist CGI debugging. The ‘SOLO’server is integrated with the development environment and includes logging and statistics. The personal Webserver also allows easy sharing of other directories via context menus in Explorer.
An HTML Form Designer tool or painter is used to build HTML input and output forms. From one definitionthe Form Designer tool creates either a Windows GUI or HTML/ActiveX Web page. The scripting for theWindows GUI is Cobol using a screen Dialog System tool. Scripting for HTML is JavaScript. The tool alsosupports use of licensed ActiveX/Java controls. A build project command then generates the required HTMLcode along with the executable Cobol CGI program.
A COBOL-WEB PROGRAM EXTRACT
A Cobol-Web simplified skeleton program illustrates the relationship between HTML forms displayed by thebrowser running on the client. The CGI program is executed on the Web server after a project build and compile
NetExpress Interact ive Development Environment
Editor,Debugger
PersonalW e b
Server
FormDesigner
DialogSystem
FormExpress
(LegacyReuse)
COBOL Compi ler and Run Time System
Figure 2.Cobol-Web Development Environment
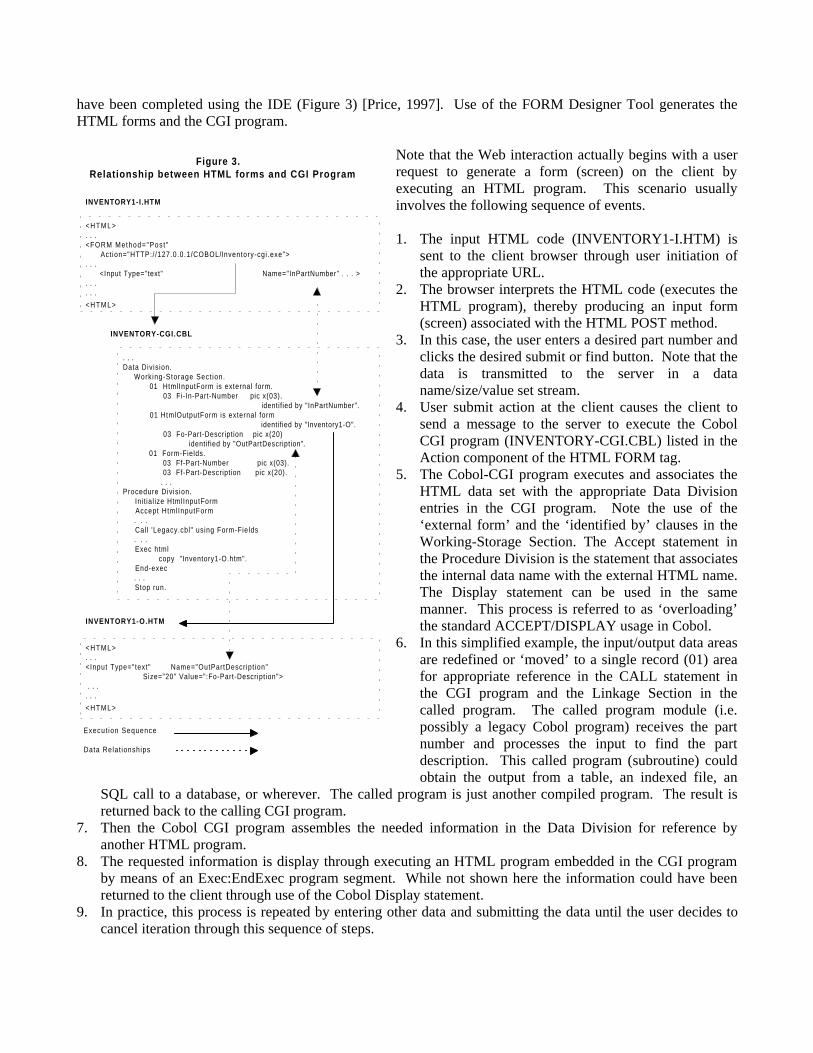
have been completed using the IDE (Figure 3) [Price, 1997]. Use of the FORM Designer Tool generates theHTML forms and the CGI program.
Note that the Web interaction actually begins with a userrequest to generate a form (screen) on the client byexecuting an HTML program. This scenario usuallyinvolves the following sequence of events.
1. The input HTML code (INVENTORY1-I.HTM) issent to the client browser through user initiation ofthe appropriate URL.
2. The browser interprets the HTML code (executes theHTML program), thereby producing an input form(screen) associated with the HTML POST method.
3. In this case, the user enters a desired part number andclicks the desired submit or find button. Note that thedata is transmitted to the server in a dataname/size/value set stream.
4. User submit action at the client causes the client tosend a message to the server to execute the CobolCGI program (INVENTORY-CGI.CBL) listed in theAction component of the HTML FORM tag.
5. The Cobol-CGI program executes and associates theHTML data set with the appropriate Data Divisionentries in the CGI program. Note the use of the‘external form’ and the ‘identified by’ clauses in theWorking-Storage Section. The Accept statement inthe Procedure Division is the statement that associatesthe internal data name with the external HTML name.The Display statement can be used in the samemanner. This process is referred to as ‘overloading’the standard ACCEPT/DISPLAY usage in Cobol.
6. In this simplified example, the input/output data areasare redefined or ‘moved’ to a single record (01) areafor appropriate reference in the CALL statement inthe CGI program and the Linkage Section in thecalled program. The called program module (i.e.possibly a legacy Cobol program) receives the partnumber and processes the input to find the partdescription. This called program (subroutine) couldobtain the output from a table, an indexed file, an
SQL call to a database, or wherever. The called program is just another compiled program. The result isreturned back to the calling CGI program.
7. Then the Cobol CGI program assembles the needed information in the Data Division for reference byanother HTML program.
8. The requested information is display through executing an HTML program embedded in the CGI programby means of an Exec:EndExec program segment. While not shown here the information could have beenreturned to the client through use of the Cobol Display statement.
9. In practice, this process is repeated by entering other data and submitting the data until the user decides tocancel iteration through this sequence of steps.
< H T M L >. . .<Input Type="text" Name="OutPartDescr ipt ion" Size="20" Value=":Fo-Part-Descript ion"> . . .. . .
< H T M L >
INVENTORY-CGI.CBL
INVENTORY1-I.HTM
< H T M L >. . .<FORM Method="Pos t " Act ion="HTTP:/ /127.0.0.1/COBOL/Inventory-cgi .exe">. . . <Input Type="text" Name="InPartNumber" . . . >. . .. . .
< H T M L >
Figure 3. Relationship between HTML forms and CGI Program
INVENTORY1-O.HTM
. . .Data Divis ion. Work ing-Storage Sect ion. 01 HtmlInputForm is external form. 03 Fi-In-Part-Number pic x(03). identified by "InPartNumber". 01 HtmlOutputForm is external form identified by "Inventory1-O". 03 Fo-Part-Description pic x(20) identif ied by "OutPartDescription". 01 Form-Fields. 03 Ff-Part-Number pic x(03). 03 Ff-Part-Description pic x(20). . . .Procedure Div is ion. Ini t ial ize HtmlInputForm Accept HtmlInputForm . . . Cal l 'Legacy.cbl" using Form-Fields . . . Exec html copy "Inventory1-O.htm". End-exec . . . Stop run.
Execut ion Sequence
Data Relat ionships
SUMMARY
In summary, Cobol has several distinct advantages. Use of the Cobol-Web IDE makes the Web applicationdevelopment easy. Both HTML forms and the CGI program may be generated interactively. The Web providesa new role for Cobol. It is the key to reuse of legacy applications. The Web provides a new front-end forlongstanding Cobol applications. The Cobol-Web IDE offers new and stimulating learning opportunities forstudents in CIS/CS curriculums. Employers desire students who have knowledge of Cobol so that they canmaintain existing code. This programming environment allows Cobol to continue to perform a major role innew application development as applications transition from purely data driven models to new object-orientedand visual models in client-server environments.
REFERENCES
Working Group ISO/IEC JTC 1/SC22/WG4 and Technical Committee X3J4; Information Technology –Programming languages, their environments and system software interfaces – Programming language COBOL;Working Draft 1.4; Jun, 1996.Obin, Raymond; “Object Orientation: An Introduction for COBOL Programmers”; Micro Focus Publishing;Palo Alto, CA; 1993.Gartner Group; Presentation/Proceedings; Micro Focus User Conference, Orlando, FL; 1996.Arranga, Edmund and Frank Coyle; “Object-Oriented COBOL: An Introduction”; Journal of Object-OrientedProgramming; Jan 1997.Kruglyak, Igor; “Creating Distributed Applications with NetExpress”; Proceedings; Micro Focus IT Forums;Chicago, New York, and San Francisco; 1997.Micro Focus; “NetExpress: Getting Started”; NetExpress Documentation Guide; Micro Focus; Palo Alto, CA;1997.Price, Wilson; “Cobol Web Programming Course Notes”; Object-Z, Inc; Orinda, CA; 1997.

USING GROUP DECISION SUPPORT SYSTEMS TO FACILITATE ORGANIZATIONDEVELOPMENT
Sherri Wood, Philanthropic Research, Williamsburg, VA 23185 (757) 229-4631James P. Clements, Towson University, Towson, MD 21252 (410) 830-3701
ABSTRACT
Planning and managing change in organizations in order to increase their effectiveness and health reliesheavily on group process. Groups often are seen as the primary medium for change in organizations.However, group interaction is complex and dynamic and often complicates consensus-building and decision-making, both of which are necessary to ensure group members’ commitment to change. One might assumethat computer-based group decision support systems (GDSS), which are designed to facilitate group problemsolving and decision-making, would enhance the effectiveness of organization development (OD) activitiesby reducing the impact of group dynamics on the decision-making process. GDSS research supports thisassumption in some cases and refutes it in others. The failure of research results to agree on the effectivenessof GDSS can be attributed to a number of factors, including group size, group task, whether or not afacilitator is used, and which GDSS is used.
This paper will examine the implications of conflicting GDSS research results for OD activities. It willprovide a brief overview of OD, including OD methodology. It will then describe GDSS and GDSSresearch, noting especially those factors that contribute to contradictory findings. It will present threeexamples from the literature that describe situations in which GDSS have been used effectively in OD-typeinterventions. It will draw conclusions from those examples and the research, identify and describe otherOD intervention techniques which could be enhanced or hindered by GDSS, and describe how GDSS couldsupport those interventions. Finally, it will suggest opportunities for further research.
ORGANIZATION DEVELOPMENT
Leaders in a complex and rapidly changing work environment must implement a variety of strategies toensure the survival of their organizations. One strategy, called organization development (OD), is defined as“a planned, organization-wide effort, managed from the top, to increase organization effectiveness andhealth, through interventions in the organization’s processes using behavioral science [3]. The primarypurpose of OD is to make the organization more effective by helping the organization’s managers,employees, work groups and teams learn how to plan for and manage change. Groups can influence thebehaviors of their members by inducing conformity, compliance, and obedience [15] and are believed to beeffective conduits for change in organizations. Therefore, many OD activities are focused on teams andwork groups.
GROUP DECISION SUPPORT SYSTEMS
A GDSS is defined as a set of software, hardware, and language components and procedures that support agroup of people engaged in a decision related meeting [12]. Other researchers suggest that “a GDSScombines communication, computing, and decision support technologies to facilitate formulation andsolution of unstructured problems by a group of people to improve the process of group decision making byremoving common communication barriers, providing techniques for structuring decision analysis, andsystematically directing the pattern, timing, or content of discussion [4].
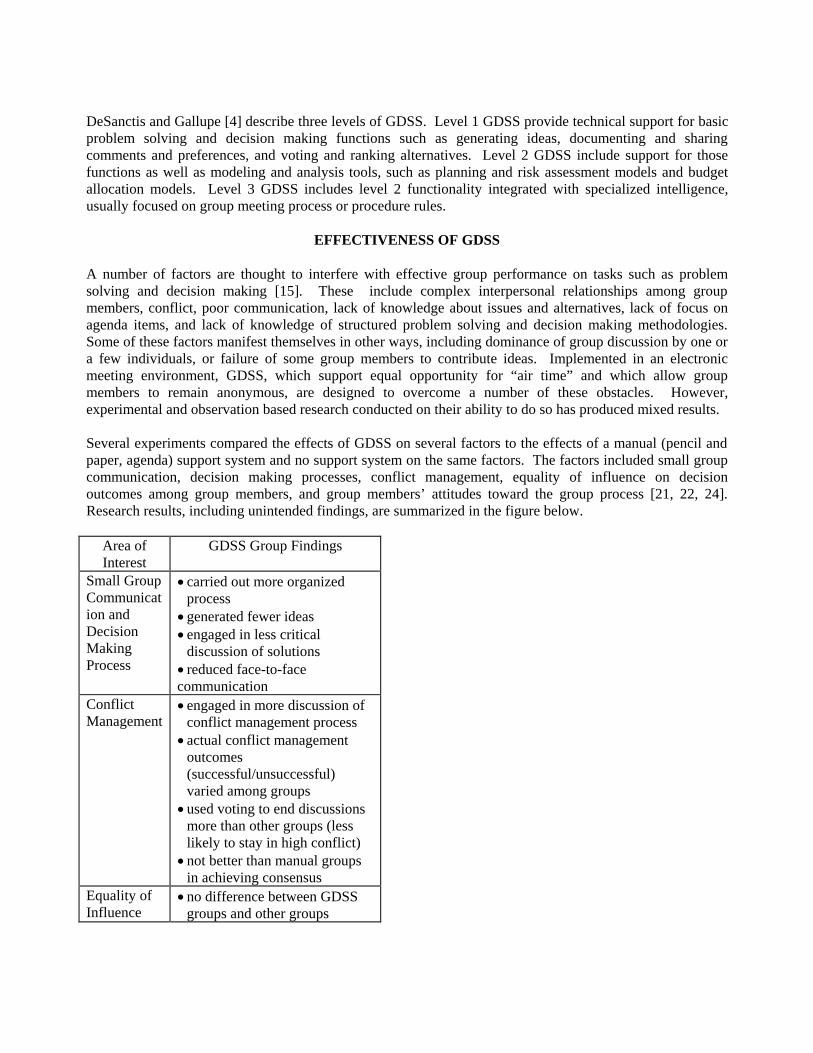
DeSanctis and Gallupe [4] describe three levels of GDSS. Level 1 GDSS provide technical support for basicproblem solving and decision making functions such as generating ideas, documenting and sharingcomments and preferences, and voting and ranking alternatives. Level 2 GDSS include support for thosefunctions as well as modeling and analysis tools, such as planning and risk assessment models and budgetallocation models. Level 3 GDSS includes level 2 functionality integrated with specialized intelligence,usually focused on group meeting process or procedure rules.
EFFECTIVENESS OF GDSS
A number of factors are thought to interfere with effective group performance on tasks such as problemsolving and decision making [15]. These include complex interpersonal relationships among groupmembers, conflict, poor communication, lack of knowledge about issues and alternatives, lack of focus onagenda items, and lack of knowledge of structured problem solving and decision making methodologies.Some of these factors manifest themselves in other ways, including dominance of group discussion by one ora few individuals, or failure of some group members to contribute ideas. Implemented in an electronicmeeting environment, GDSS, which support equal opportunity for “air time” and which allow groupmembers to remain anonymous, are designed to overcome a number of these obstacles. However,experimental and observation based research conducted on their ability to do so has produced mixed results.
Several experiments compared the effects of GDSS on several factors to the effects of a manual (pencil andpaper, agenda) support system and no support system on the same factors. The factors included small groupcommunication, decision making processes, conflict management, equality of influence on decisionoutcomes among group members, and group members’ attitudes toward the group process [21, 22, 24].Research results, including unintended findings, are summarized in the figure below.
Area ofInterest
GDSS Group Findings
Small GroupCommunication andDecisionMakingProcess
� carried out more organizedprocess
� generated fewer ideas� engaged in less critical
discussion of solutions� reduced face-to-facecommunication
ConflictManagement
� engaged in more discussion ofconflict management process
� actual conflict managementoutcomes(successful/unsuccessful)varied among groups
� used voting to end discussionsmore than other groups (lesslikely to stay in high conflict)
� not better than manual groupsin achieving consensus
Equality ofInfluence
� no difference between GDSSgroups and other groups

Attitudes ofMembersTowardGroupProcess
� experienced more start-up andmechanical friction
� perceived problem solvingprocess to be lessunderstandable
� perceived issues discussed tobe more trivial
Summary of GDSS Research Findings
Other articles describing the effectiveness, or lack thereof, of GDSS are primarily thought and/or observationbased. Nunamaker et al., suggests that GDSS, improves group processes and outcomes because it: (1)supports simultaneous input and viewing by all participants; (2) allows anonymity; (3) discourages negativebehavior; (4) provides support for a variety of strategies and techniques; and (5) creates “organizationalmemory” [17, 18].
Finally, from their review of a number of aspects of GDSS design, including management of groupdynamics, data capture, location of decision support facilities, and client control, Ackerman and Eden [1]suggest that the most effective decision support mechanism would feature both computerized and non-computerized support.
CASES OF GDSS TO FACILITATE OD
Group decision support systems have been used successfully to support strategic planning in largeorganizations [13]. The CEO and 31 senior managers of Burr-Brown Corporation participated in a three-dayplanning session conducted in the University of Arizona’s decision laboratory. Executives agreed theyaccomplished in three days what would have taken months without the aid of technology. The company’sprevious strategic planning activities had involved only 8-10 participants. The CEO felt that having so manyexecutives participate with the GDSS supported much more interaction. The need to work in larger groupsin order to effect change in increasingly complex organizations has been suggest by several researchers [8].A second case of using a GDSS to support the planning process was demonstrated by IBM [13]. IBM feltthe anonymity allowed by GDSS contributed to the free exchange and questioning of ideas, and that usingthe GDSS led to more effective and efficient planning.
GDSS have also been shown to be effective with labor negotiations [11]. With a GDSS to support thebargaining process, the actual bargaining process took significantly less time with a GDSS and thoseinvolved believed the GDSS improved the outcome of their agreement. Trained meeting facilitators played asignificant role in the negotiations.
Group decision support systems have also been shown to help with quality improvement teams at the InternalRevenue Service [5]. The quality teams reported that the GDSS:
� helped team members explore multiple viewpoints,� provided needed structure for complex tasks,� helped groups move forward when progress stagnated,� enhanced meeting efficiency, and� facilitated participation and conflict management.
POTENTIAL APPLICATION AREAS

OF GDSS TO OD
Despite some mixed reviews of GDSS effectiveness [21,22,24], the cases stated above show that GDSS canbe effective in certain situations. Whether they are more effective than well facilitated, non-computersupported decision making scenarios remains a research question. However, though attention must be givento a few issues, including use of a facilitator, the need for leadership support, and task/intervention selection,there is sufficient evidence that GDSS could facilitate some OD intervention techniques. The following aresome potential application areas for GDSS to facilitate OD.
OD Technique: Role Negotiation
Role negotiation is an OD technique designed to improve team performance. The purpose of role negotiationis to clarify roles among team members (or between groups) whose work depends on one another. Harveyand Brown [10] suggest that an effective role negotiation intervention involves four steps:
1. Contract setting: Team members prepare lists for one another that outline activities of which theyshould be doing more, less, or the same amount.
2. Issue diagnosis: Participants summarize lists given to them and post the summaries. They thenclarify for one another items that need explanation.
3. Role negotiation: Team members sit down in pairs, usually with a third party to facilitate, anddiscuss which items are most wanted.
4. Written role negotiation agreement: Results of the negotiations are summarized and documented forall participants [10].
Role negotiation, like labor negotiation, could generate a great deal of conflict. If parties agreed torespective roles, there would likely be no need for negotiation. With appropriate facilitation, GDSS couldcreate an environment in which team members could focus on the roles themselves, rather than onpersonalities and conflicts.
OD Technique: Organization Mirror
While role negotiation interventions often are focused on individual work teams, organization mirror is usedto improve intergroup relationships by allowing work groups to learn how they are viewed by other groupswith which they interact. An organization mirror intervention often is intended to address conflict amonggroups and consists of the following steps:
1. The group desiring feedback (host) invites the other group to a feedback session.2. Prior to the feedback session, a third party (consultant) collects data from the other group, usually by
survey or interview, about how the host group is viewed and/or any problems that exist.3. At the feedback session, the consultant and the outside group discuss the data, while the host group
observes. Host group members may ask questions, but they may not offer remarks or refute the data.4. After the feedback session, the host group works with the consultant to identify problems from data
collected from the other group.5. Members of the host group and the other group meet and generate solutions to the problems that
would result in process improvements or better intergroup relationships [10].
Organization mirror is an example of an OD technique that could be partially supported by GDSS, but wouldrequire some interaction between the parties involved. Steps one and two would perhaps benefit from theanonymity and time savings afforded by a GDSS. Anonymity is particularly important early on, because this

exercise often requires participants to hear information about themselves that could be negative [10]. AGDSS would help to de-personalize that experience. In addition, step four, which involves the identificationof problems, and step five, which involves the identification and generation of potential solutions, also seemto be perfect matches for a GDSS. Step three, however, is one that might be carried out without the GDSS,or with the GDSS playing a minimal role.
OD Technique: Goal Setting
Research shows that setting goals is one way managers can ensure increased productivity, provided that thegoals are measurable and attainable. Furthermore, participative goal setting, where the manager and theemployees or work group determine goals together, often results in higher goals. An OD interventioninvolving participative goal setting, designed to increase productivity and therefore effectiveness, involvesthree steps: (1) deciding challenging, specific, and achievable goals; (2) ensuring commitment to goals; and(3) determining systems and resources required to accomplish goals [14].
A GDSS could facilitate goal setting for work groups. Just as executives used GDSS to generate ideas andset priorities in strategic planning exercises [11], work groups and managers could use GDSS to identify andrank goals. Involving work groups in the goal setting process helps ensure they are aware of and committedto goals. Finally, the anonymity afforded by a GDSS could be used to create an open and non-threateningenvironment in which to identify and negotiate for needed resources.
OD Technique: Process Consultation
Process consultation is a range of interventions that focus on the organization’s processes. Specifically, thefocus is on the ways in which the organization communicates, solves problems and make decisions, definesand assigns roles and functions, exercises leadership and authority, and establishes group norms and carriesout group activities. The goal of process consultation is to help the organization improve its owneffectiveness by being more aware of how it functions and by learning to identify and resolve problems ineach of these areas.
Process consultation involves a significant amount of time observing organizational activities, such asmeetings and informal encounters among employees, as well as analyzing the organization’s structure,reward systems, and communication mechanisms [23]. Each of these could benefit from the tools availablein a GDSS. For example, there is often argument over how reward systems should be handled with anorganization and a GDSS would allow for an open, anonymous discussion of ideas. The same can be saidfor the structure of an organization and its channels of communication.
CONCLUSION
The findings presented here suggest that further research of GDSS and OD is warranted in a number of areas.In addition to these areas, special attention should be given to how the group size, the use of facilitators, andthe specific task being investigated effect the results of any GDSS sessions.
REFERENCES
A complete list of references for this paper will be provided at the conference.
A STUDY OF DISTRIBUTED RULE LEARNING USING AN OBJECT-ORIENTED LOCALAREA NETWORK
Raymond L. Major, Department of Management Science and Information Technology,Virginia Polytechnic Institute and State University, Blacksburg, VA 24061-0235 (540) 231-3163
ABSTRACT
A group approach to solving problems often produces better solutions to complex problems especiallywhen the problem can be decomposed into smaller problems. Rule learning is a method used byinformation analysts to create useful knowledge (from data) which can improve the performance ofdecision makers. This research describes a problem-solving approach for the problem of rule learningwhere a group of objects is used to create a set of classification rules and each object in the group mayhave a specific expertise such as intelligence, creativity, or preference. This approach uses an ArtificialIntelligence method which is also capable of modeling problems that cannot be represented numerically.
Some researchers describe group performance by simulating the actions of a group using a singleprogram, however, it is preferable to actually use multiple programs where each program models a singlecomponent of the group’s behavior. The focus of this research is to use object-oriented modeling alongwith a data communication network to examine a group approach to problem solving. Using a datacommunication network is appealing because we can store separate or identical algorithms on eachworkstation (connected to the network) which governs the behavior of objects the workstations represent.Also, each workstation can process information independently of the other workstations or be allowed tocommunicate with the other workstations as problem solutions are created.
A communication network will be established for studying group learning using primarily artificial datasets. The group’s performance will be evaluated based on the quality of the decision tree (orclassification rules) generated by the group. This approach to examining group behavior allows theresearcher more flexibility than that provided by using a single program.
INTRODUCTION
The problem of rule learning or knowledge acquisition is a widely studied problem in the area of machinelearning. Algorithms like ID3 (Quinlan 1986) and PLS1 (Rendell 1990) are examples of successfulinductive methods that uses examples and counterexamples of a concept to develop rules for classifyingthe observations in a sample based on values of their respective attributes. Examples illustrating theimportance of rule learning methods for information management, because of their ability to generateuseful decision knowledge out of the data, include generating credit-granting rules out of a database ofpast application cases, and, learning consumer profiles and purchasing behaviors based on point-of-saledata collected by retailers (Currin et al. 1988; Shaw and Gentry 1988; Ing and Mitchell 1994). Credibleapproaches to rule learning using a single program (or single agent) include Decision-Tree Induction,Neural Networks, and Genetic Algorithms.
Sikora and Shaw (1996) demonstrate that, compared to the single-agent approach, the group problem-solving (GPS) approach, (where the examples are distributed to different learning programs), can be verybeneficial in terms of producing more accurate rules. The GPS technique has been well studied in theareas of Distributed Artificial Intelligence (Huhns 1987; Bond and Gasser 1988) and Group DecisionSupport Systems (GDSS) (Nunamaker et al. 1988; Kramer and King 1988; DeSanctis and Gallupe 1987).The literature shows that a GPS approach, where a problem is decomposed into smaller and manageable
2
subproblems, improves a decision maker’s performance in certain problem domains. A drawback toSikora and Shaw’s (1996) approach, however, is that essentially, they use just one agent that decomposesthe data, goes through iteratively working on each of the subsets of data separately, and then synthesizesthe different results it has generated. In other words, their results are based on a simulation of adistributed learning system. One way to extend their model is to actually use different learning programsas different agents and this can be accomplished by using a data communication network like, forexample, a local area network (LAN). A GPS approach using a LAN is more suitable for certainapplications. For example, a problem faced by air traffic controllers is to determine the flight path of anairplane and it is difficult to collect all of the necessary data to do this in one location. Using a distributedapproach, the final solution (a flight path) can be synthesized by using local agents to process the dataresiding at their location and then subsequently processing the information these agents supply.
A LAN is a group of computers at one location that share hardware an/or software resources. Since thelate 1960’s, LAN users have witnessed rapidly changing technologies of devices and systems, increasedperformance requirements, and the increasing reliance of organizations on the use of computer facilities inall aspects of business. LAN’s have become an integral part of our computer and informationmanagement technologies. The literature describes several tools available for modeling a variety of LANtopologies as well as the details of the underlying mechanisms that govern their operations (Fortier andDesrochers 1990; Bapat 1994; Schatt 1994; Ghosal et al. 1995; Gaiti and Pujolle 1996).
RESEARCH METHODOLOGY
The initial activities for this research revolve around creating an Ethernet LAN suitable for use as adistributed learning system. Considering the learning program used by the individual workstations, wewill use a variant of a popular symbolic AI method, ID3/C4.5 (Quinlan 1993), and a feature constructionmethod developed by this researcher. Feature construction is a technique for creating new features orattributes which are combinations of an initial set of primitive attributes. In a previous research effort weshowed that feature construction may improve the performance of a decision tree for certain problemdomains (Major 1994). ID3/C4.5 represents a well-understood approach to the classification problem andhas been implemented through computer-based tools available to most researchers.
REFERENCES
Bapat, Subodh, Object-Oriented Networks: Models for Architecture,Operations, and Management. Prentice Hall, New Jersey, 1994.
Bond, A. and L. Gasser, Readings in Distributed ArtificialIntelligence. Morgan Kaufmann Publishers, San Mateo, CA, 1988.
Currin, I. S., R. J. Meyer, and N. T. Le, “ Disaggregate Tree-Structured Modeling of Consumer Choice Data.” J. MarketingResearch 25, 1988: 253-265.
DeSanctis, G. and R. B. Gallupe, “ A Foundation for the Study of GroupDecision Support Systems.” Management Sci. 5, 1987: 497-509.
Fortier, P. and G. R. Desrochers, Modeling and Analysis of Local AreaNetworks. CRC Press, FL, 1990.
3
Gaiti, D. and G. Pujolle, “ Performance Management Issues in ATMNetworks: Traffic and Congestion Control.” IEEE/ACM Transactionson Networking 4, 1996: 249-257.
Ghosal, D., T. V. Lakshman, and Y. Huang, “ Parallel Architectures forProcessing High Speed Network Signaling Protocols.” IEEE/ACMTransactions on Networking 3, 1995: 716-728.
Huhns, M. N. (Ed.), Distributed Artificial Intelligence. Pitman,London, 1987.
Ing, D. and A. Mitchell, “ Point-of-Sale Data for Consumer GoodsMarketing: Transforming the Art of Marketing into the Science ofMarketing.” Marketing Information Revolution Blattberg, Glacer,and Little (Eds), Harvard Business School Press, Cambridge, MS,1994.
Kraemer, K. L. and J. L. King, “ Computer-Based Systems forCooperative Work and Group Decision Making.” ACM ComputerSurvey 20, 1988: 329-380.
Major, Raymond L., "Using Decision Trees and Feature Construction toDescribe Changing Consumer Life-Styles and Expectations." Diss.University of Florida, 1994.
Nunamaker, J., L. Applegate, and B. Konsynski, “ Computer-AidedDeliberation: Model Management and Group Decision Support.”Operations Res. 6, 1988: 826-848.
Quinlan, J. R., “ Induction of Decision Trees.” Machine Learning 1,1986: 81-106.
Quinlan, J. Ross, C4.5: Programs For Machine Learning. San Mateo,CA: Morgan Kaufmann Inc., 1993.
Rendell, L. A., “Induction as Optimization.” IEEE Trans. Systems, Man, and Cybernetics 2 1990: 326-328.
Schatt, S., Data Communications For Business. Prentice Hall, New Jersey, 1994.
Shaw, M. J., and J. Gentry, “An Expert System with Inductive Learning for Business Loan Evaluation.”Financial Management 1988: 45-55.
Sikora, R. and M. J. Shaw, “A Computational Study of Distributed Rule Learning.” InformationSystems Research 7, 1996: 189-197.
TRIALS AND TRIBULATIONS OF NEURAL NETWORKS DEVELOPMENT
Steven D. Travers, University of Mississippi Med Ctr, 2500 North State St, Jackson, MS 39216Ajay K. Aggarwal, Else School of Management, Millsaps College, Jackson, MS 39210-0742
ABSTRACT
The ability of neural networks to examine non-linear relationships with high noise levels has seen their useescalate. As the number of variables in neural network models becomes large (exceeds 50), there areseveral issues a novice developer should be aware of for successful network development. This paperpresents some relevant issues for discussion. The issues discussed include suggestions for using literaturesearch, data accuracy and completeness, qualitative and quantitative data handling tips, training variables,and use of optimizer package. The paper concludes with the opinion that neural network training continuesto be an art, ruled by hunches and gut-feelings.
INTRODUCTION
Typical statistical models use linear models to characterize the relationship between input and outputvariables. Their inability to handle missing values, mixtures of qualitative and quantitative data, complexnon-linear relationships, high noise levels or fuzziness, et cetera, takes a strong case for neural networks[3][4][5]. Backward propagation neural networks, in particular, are helpful in modeling complexrelationships where traditional methods fail. This includes the modeling of biological and pathophysiologicalprocesses that are characterized by chaotic behavior[2]. As researchers try to model complex relationshipsacross large numbers of variables, they should be cognizant of several technical and personal issues. Thispaper is an attempt to provide guidance to the novice developer of large neural networks. The issuesdiscussed include using literature search, data accuracy and completeness, quantitative and qualitative datahandling tips, training variables, optimizer package, and conclusion.
Using Literature Search
Awareness of the research work in the application area significantly aids the training process. The maincontributions are in the areas of variable selection and proposed or tested models. A master list of all relevantvariables, captured across different models can be potentially considered for neural network training[6].Existing models can help immensely by feeding pattern values for existing input data. For instance,dependent variable value from regression models, or mahalanabis distances from discriminant analysismodels may be fed as input variables for backward propagation neural networks. In addition, well-testedempirical models may provide valuable insights into restructuring input data to make it more receptive totraining (e.g. the output may sensitive to product of three input variables). While the notion that neuralnetworks can deal with large number of variables is true, any knowledgeable insight that can help promotetraining efficiency or effectiveness or both. Neural networks offer the advantage of examining non-linearrelationships include missing data, mixture of qualitative and quantitative variables and highly non-uniformnoise.
Data Accuracy and Completeness
The garbage-in garbage-out philosophy holds true for neural networks. It is critically important to check thedata to ensure accuracy and completeness prior to commencement of training, or else the results would bemeaningless. This becomes especially important for large data sets. To avoid the manual testing of each

record, simple tests for blank cells, minimum and maximum values (assuming spreadsheet data) can helpensure data integrity. If completed values are not acceptable for training purposes, the records containingthem should be removed.
Quantitative and Qualitative Data Handling Tips
For quantitative data it is desirable to present neural network a range of values to aid its learning. If avariable varies from 1 to 10,000, it is not necessary to feed it data for all 10,000 occurrences. That would callfor an extraordinary data collection effort, with a training time to match. Instead, the data can scaled to varyfrom 1 to 10, where every unit corresponds to 1000 units on the old scale. This greatly reduces the need fortraining data, without losing effectiveness. In the example cited the scales were all of equal length. Thisdoesnt necessarily have to be the case. It is best to look at a dispersion plot of each variable, and decide thedifferent behaviors that need to be captured (e.g. number of modes or valleys).
Qualitative variables are best distinguished by a 1/0 designation. If several states exist, the number of suchvariables should be increased. For instance, if a color can be green, amber, or red. Three 1/0 variables cancapture this effect (e.g. 1 0 0, 0 1 0, and 0 0 1 may represent green, amber, and red respectively.
Training Variables
The choice of training variables can be quite exhaustive in neural network training. For instance, some of thevariables a trainer has to contend with include:1. Number of hidden layers2. Number of neurons/layer3. Learning rate per layer4. Starting tolerance5. Ending tolerance6. Cascading effect in tolerances7. Consideration of big weights8. Noise factors
Optimizer Package
This package allows a user to test different combinations of variables (listed above) for a specified numberof runs to determine their effectiveness. The winning model is ranked based upon the user- suggested criteria(e.g MSE, R-square, number of bad facts, RMSE, etc.). Considering only three possible values for each ofthe 8 factors listed results in 38 or 6561 models. Running each for just one hundred runs results in 656100total runs, which for large models (50 or more variables) can last for 3.795 days, assuming one-half secondper run. It is not unusual to have several optimizer runs, in order to determine the best training parameters forthe model. This has several implications for the novice trainer of neural networks[1].
Having a computer with a high FLOPS rating (number of floating point operations per second) is helpful.Higher RAM rating (32 MB or better) is recommended. Since several interim models and related files aresaved prior to arriving at the best model, room needs to be available on the hard drive to store all the work.Hard drive space of at least a gigabyte is recommended for large models.

In addition to the data file, every neural network run can produce 11 or more additional files (e.g. a data file,fact file, testing file, running statistics file, testing statistics file, etc. ) for every training. If the network isperiodically saved, this number can increase manifold. Since it is not unusual to process scores of modelsthrough the training process prior to selecting the best one, the number of files in the directory may numberin the thousands. To avoid frustration, a good file management system is essential. The system provesinvaluable for preparing reports.
The old adage - research is 1% inspiration, 99% perspiration holds true when dealing with large neuralnetworks. Sometimes months can pass without a significant breakthrough - i.e. the testing results are notencouraging. It is particularly disconcerting when the trained network shows a high R-square (e.g. 0.99+)and low RMSE (e.g. 0.001), yet when tested the R-square barely crosses 0.05 and the RMSE escalatesremorselessly[7]. The authors would caution the faint hearted and the easily discouraged to refrain from suchundertakings. It can be, and generally is, an exercise in patience and good planning.
Conclusion
Despite the increasing number of publications in the field, neural networks continue to be regarded by mostas a black box, and by some as a cure to all modeling problems. The truth lies somewhere in the middle.Despite the scientific logic in their creation, the ability to train and develop reliable neural networks remainsan art, where gut feelings, intuition, and heuristics play a significant role in the final outcome.
REFERENCES
[1.] Anonymous, More in a Cockroachs Brain than Your Computers Dream of The Economist, 1995, Vol. 335, No. 7910, pages 75-78.[2.] Baxt, W.G. Application of Neural Networks to Clinical Medicine The Lancet, 1995, Vol. 346, No. 8983, pages 1135-1142.[3.] Etheridge, H.L., Brooks, R.C., Neural Networks: A New Technology The CPA Journal, 1994, Vol. 64, No. 3, pages 36-40.[4.] Gonnatilake, S., Risk Assessment Using Intelligent Systems Insurance Systems bulletin, 1996, Vol 11, No. 10, pages 2-7.[5.] Jordan, M. I., Bishop, C.M., Neural Networks ACM Computing Surveys, 1996, Vol 28, No. 1, pages 73- 75.[6.] Perry, W.G. Jr., What is Neural Network Software ? Journal of Systems Management, 1994, Vol. 45, No. 9, pages 12-19.[7.] Wyatt, J., Nervous about Artificial Neural Networks ?, The Lancet, 1995, Vol. 346, Nov 4, 1995, pages 1175-1177.
AN EXPERT SYSTEM FOR COLOR SELECTION
Bethany DeLude, Johns Hopkins University, Baltimore, Maryland 21201Mary Hackley, Johns Hopkins University, Baltimore, Maryland 21201
James P. Clements, Towson University, Towson, Maryland 21252 (410) 830-3701Concetta Mitsos, PHH Incorporated, Baltimore, Maryland 21201
Sue Bungert, Bell Atlantic Corporation, Greenbelt, Maryland 20770
ABSTRACT
Expert systems are software systems which capture human expertise or experience and apply it to data toautomate analysis, decisions, and recommendations. These systems use this knowledge and experience tosimulate the performance of a human expert in a narrow field or domain. Activities such as problem solving,diagnosis, troubleshooting, scheduling and planning can be carried out by these systems with remarkablesuccess [2, 11]. In this paper we argue that in the future retail organizations will begin to use intelligenttechnology, such as expert systems, to support customer-centered interactions. Specifically, we discuss thedevelopment of a customer-oriented expert system that can be used in a retail setting to help a customerchoose which specific shades of coloring and clothing best compliment his or her skin tone, hair color, eyecolor, and other physical attributes.
EXPERT SYSTEMS
In many real-world situations, decision makers need vary specialized, problem specific knowledge in orderto solve a decision task effectively. However, in many cases, the decision maker usually does not possess thespecific knowledge that he or she needs and must, therefore, rely on a professional with that expertise. Theconcept of an expert system (ES) was created by researchers in the field of artificial intelligence in order toovercome this problem. Expert systems act as electronic counselors to decision makers, by organizingprofessional insights and judgments as a set of rules, frames, or semantic networks and then translating theknowledge into advice with explanations.
In the U.S. alone, Ovum Ltd., an English research firm, predicted a 31% compounded growth rate between1989 and 1995 for artificial intelligence and expert systems products [4]. Examples from several businessarenas benefiting from expert system technology are given below.
� In the medical field, several applications have been developed to perform diagnostic functions. Forexample, the ACI-TIPI expert system helps emergency room physicians quickly determine theprobability that a suspected heart attack is real. A follow-up study of the system found that it reducedunnecessary coronary-care admissions by 30% [6].
� In the insurance field, expert systems are valuable tools for flagging risks, moving applications through
the policy delivery process, and facilitating point-of-sale policy issuance in a single client visit. Expertsystem users, such as Lincoln National, Aetna, and Travelers have experienced significant time saving intheir underwriting process [16].
� Expert systems are also being used to help with the decision making process required to perform sales
functions [17]. They are beneficial to managers in this case, because they reduce training costs for newsales persons and can also be customized to suit the needs of different users and the customer base. Theselling scripts from multiple experts are available when needed to assist in the sales process.

COLOR ME BEAUTIFUL
In her book, Color Me Beautiful, Carole Jackson prescribes a methodology to help individuals select clothingby assessing their skin tone, hair color, and eye color [10]. Based on these factors, it is possible to determinethe palette of color which is most suitable for an individual’s natural coloring. According to Jackson, wearingthe colors in one’s palette is of paramount importance to looking one’s best. The ColorFind System capturesthese principles in an expert system.
Using these principles results in the determination of a palette of color which is represented by a seasonalname – Winter, Spring, Summer, or Autumn. These seasonal palettes can be viewed in two broad categories– warm or cold. Warm palettes, such as Autumn and Spring, have golden undertones where as cool palettes,such as Winter and Summer, have blue undertones. Basically, all palettes contain the same categories ofcolor, namely, beiges, blues, greens, pinks, and reds. They differ, however, with respect to shade andintensity.
Occasionally, trait combinations will result in a choice between two seasons. When this event occurs, theindividual will carefully look at the competing palettes and select the best one based on personal experiencewith the colors. Jackson cautions that no person is more than one season, although most people tend toconsider themselves equally attractive in a variety of seasonal palettes [10].
According to Procter and Gambles’ color specialist, Ann Martin-Vachon, the easiest way to determine ifone’s skin has either warm or cold undertones is by answering the following simple question: Does yourskin burn easily? People who respond positively to this question have cold palettes where as people whorespond negatively have warm palettes. In the ColorFind System, we used this information to make ourscreens more user-friendly and attractive. Specifically, we only display the skin tone choices appropriate tothe resultant palette. In this manner, the screen is less cluttered and the user is not overwhelmed with toomany selections.
AN OVERVIEW OF THE DEVELOPMENT PROCESS
For this project, we opted to use a methodology for specific expert system development by end users [1].This methodology is ideally suited for this project because it was developed to save money, save time, and toencourage the maintenance of data integrity through the elimination of several intermediaries in theknowledge acquisition and knowledge representation phases of expert system development [1].
This methodology is founded on the concept that users, themselves, may simultaneously serve as the expert,the knowledge engineer, and the end user in very specific, uncomplicated expert system developments. Inaddition, with the advent of user-friendly expert system shells, like the EXSYS product we used, it isreasonable for end users to undertake the development process as well. For our purposes, even though therewere no color experts in our team composition, we felt qualified to illicit, to interpret, and to translate intocode, the principles for color selection contained in Jackson’s book. Furthermore, our selection of this systemdevelopment arose from a desire, as shoppers, a.k.a, probable end users, to use a color system to facilitatewiser clothing selections.
Specifically, the methodology for specific expert system development by end users is a five-step process. Alisting and brief discussion of the steps, as well as, how they relate to our project follows [1].

Step 1: Identification of Goal. Since it is presumed that the end users know the problem (or opportunity)that the system is to address, this step is limited to identifying the goal of the system. Our goal was todevelop a system which would prescribe the most flattering palette of colors for any individual based on skintone, eye color, and hair color.
Step 2: Definition of Attributes and Values. During step 2, it is necessary to determine the data itemsnecessary to produce the specific outcome identified by the goal. For our system, this consisted of extractingthe specific physical traits which combine in a unique manner to produce a seasonal palette which isappropriate for the individual. These physical traits fit into three broad categories: skin tone, eye color, haircolor.
Step 3: Derivation of Rules. Rules can be derived based on the data items identified in step 2 and theoutcome produced in attainment of the goal. To organize this information, we developed a decision table.Our team identified the unique combinations of all the elements within the three broad categories of physicaltraits and from this combination, identified the seasonal palette for each set of input. Using the informationpresented in the decision table, we developed a box diagram to further assist in code development.
Step 4: Building a Prototype. After building the decision table, and discussing screen displays, EXSYS, anexpert system shell, was used to build the prototype.
Step 5: Testing the Prototype. Testing consists of three distinct activities: inputting the rules, inputting thefacts, and executing the rules. To test our system, we used examples from Carole Jackson’s book ofindividuals who possessed the attributes of Winter, Spring, Summer, and Autumn. If our systemrecommended the same seasonal palette as the book, the test was considered a success.
CONSTRUCTION OF THE COLORFIND SYSTEM
Using EXSYS for developing the prototype demonstration proved to be a successful yet challengingexercise. To begin with, since the software was designed to make building an expert system do-able by anovice, it was easy to work with the point-and-click style of EXSYS. Next, coding the prototype flowedeasily from the decision table and the box chart created in Step 3 of our chosen methodology. Finally, sincethis shell operates within a windows environment, it was conducive for constructing an attractive, user-friendly human interface that provided for many colors and image choices.
Since we decided to build ColorFind with an easy-to-use expert system shell, the amount of time invested tobuild the prototype was minimal. Specifically, we expended 8 hours identifying the opportunity we wantedto exploit and planning our project, 25 hours performing a literature research and review of expert systems,40 hours generating documentation (i.e., technical paper, project schedule, user guide, decision table, andbox diagram), 2 hours performing the knowledge acquisition function, 30 hours developing our prototypedemonstration, and 9 hours testing the system. Overall, approximately 114 person-hours were required tocomplete the research, document the findings, and develop and test the ColorFind System.
A SAMPLE SESSION
Developed to be user-friendly, the ColorFind System opens with an introduction to the system. Next, theuser is asked for a response to various subject areas, such as:
1. Do you burn easily?2. Select your skin tone

3. Choose your eye color, and4. Select your hair color.
For each, the user is provided a selection of responses. The user clicks on whichever one he or she feels isthe most appropriate response.
After responding to the complete list of subject areas, the user is presented with the name of the seasonalpalette which is most suitable to their skin tone, eye color, and hair color.
BENEFITS OF THE COLORFIND SYSTEM
Because it is difficult to view oneself objectively, this system combines observable physical attributes toprescribe specific shades of color which are complimentary to one’s coloring. Often, a person may wear acolor because it is their favorite color and not because it is an appropriate color. Based on the CaroleJackson’s status as a color expert, this system is designed to encourage the use of more flattering colors.
Within a department store, this system could prove to be a valuable marketing tool that has the potential toexcite and educate the consumer. After implementation, if the system receives positive feedback fromshoppers, it may provide a basis for organizing the store around the seasons or, minimally, adding a seasonalcode to the item’s price tag. In this manner, consumers can easily choose from an assortment of garments intheir palette. By enhancing a consumer’s opportunity for a positive shopping experience, it follows that thestore might experience a consequent increase in sales and customer satisfaction.
FUTURE ENHANCEMENTS
It would be helpful to maintain a history of users of the system. It would be of value to a store buyer toknow, for example, that a large percentage of its consumers are Winters. This information could be used tohelp determine the number of garments to purchase in a particular seasonal color range. A history wouldalso be valuable to a personal shopper or a salesperson who could access a client’s file and locate suitablegarments for the client. These items could be pulled and placed on hold before the client arrives at the store.
It would also be helpful to have the system take a picture of the individual in order to discern and accuratelycharacterize one’s physical traits. Since these traits are the basis for determining one’s season, it is ofparamount importance that they be captured accurately. This would increase the effectiveness of the systemand improves the accuracy of the results when used by a consumer acting alone as compared to when thesystem is used with the aid of a personal buyer.
WRAP UP
Expert systems are an effective mechanism for capturing and disseminating expert knowledge within arestricted domain. While there are benefits and challenges to using and to constructing expert systems, theyare increasing in popularity which indicates that the benefits are surpassing the challenges in an increasingnumber of applications. Using the methodology for expert system development by end users, we were ableto develop an expert system for color selection within a few weeks time frame. Overall, we feel that withproper modification, it could be a valuable tool to aid consumers in their color selections.
REFERENCES

1. Athappilly, Kuriakose, Sivakumar Natarajan, and Jogiyanto Hartono, “The Triune Expert: ExpertSystem Development by End Users in the Changing IS Environment”, Journal of Computer InformationSystems, Spring 1993, v33 n3, p.31-34.
2. Bielawski, Larry and Robert Lewand, Intelligent Systems Design, New York, NY: John Wiley & Sons,Inc., 1991.
3. Byrd, Terry Anthony, “Expert Systems Implementation: Interviews with Knowledge Engineers”, InIndustrial Management & Data Systems, 1995, v95n10, p.3-7.
4. Chong, John K. S. and Bo K. Wong, “Averting Development Problems: Rules for Better Planning”,Information Systems Management, Winter 1992, v9n1, p.15-20.
5. Gorney, David J. and Kevin G. Coleman, “Expert Systems Development Standards”, Expert SystemsWith Applications, 1191, v2n4, p.239-243.
6. Grossman, Jerome Hl, “Plugged-In Medicine”, Technology Review, January 1994, p.23-29.7. Gupta, Uma G., “Successful Deployment Strategies: Moving to an Operational Environment”,
Information Systems Management, Winter 1992, v0n1, p.21-27.8. Hebert, Frederic J. and John H. Bradley, “Expert System Development in Small Business: A Managerial
Perspective”, Journal of Small Business Management, July 1993, v31n3, p.23-33.9. Hicks, Richard C., “Deriving Appropriate Rule Modules for Rule-Based Expert Systems”, Journal of
Computer Information Systems, Winter 1994-1995, v35, p.20-35.10. Jackson, Carole, Color Me Beautiful, New York, NY: Ballantine Books, 1981.11. Knightly, John. “Intelligent Systems”, In Mortgage Banking, May 1996, v56n8, p.30-38.12. Medsker, Larry, Margaret Tan and Efraim Turban, “Knowledge Acquisition from Multiple Experts:
Problems and Issues”, Expert Systems With Applications, 1995, v9n1, p.35-40.13. Patent, Dorothy H., The Quest for Artificial Intelligence, New York, NY: Harcourt Brace Jovanovich,
1986.14. Philip, George C., “Guidelines on Improving the Maintainability and Consultation of Rule-Based Expert
Systems”, Expert Systems with Applications, 1993, v6, p.169-179.15. Turban, Efraim, Decision Support and Expert Systems Management Support Systems, Englewood Cliffs,
New Jersey: Prentice Hall, 1995, p.638-639, 661, 654.16. West, Diane, “Expert Systems Undergo Renaissance”, In National Underwriter (Life/Health/Financial
Services), July 29, 1996, v100n31, p.2,12.17. Ainscough, T., DeCarlo, T., and Leigh, T., “Building Expert Systems from Selling Scripts of Multiple
Experts, Journal of Services Marketing, July/August, v10n4, p. 23-40.
A RESOURCE-BASED VIEW OF INFORMATION TECHNOLOGY’S INFLUENCE ONCOMPETITIVE ADVANTAGE
Wonae Cho, HTM, University of Kentucky, Lexington, KY 40506, (606) 257-4332 [email protected] T. Sumichrast, MSCI, Virginia Tech, Blacksburg, VA 24061-0235, (540) 231-4535
ABSTRACT
This study investigates how firms in the lodging industry can achieve and sustain competitive advantage(CA) using information technology (IT). A framework is proposed which incorporates the resource basedview of the firm. Evidence is gathered using a multiple-case study approach. Competitive advantage ismeasured using seven dimensions defined by Sethi and King (1994). Analysis of the findings lead to arevision of the original framework and several conclusions. There is evidence that lodging firms improvethe efficiency of their primary activities and achieve synergy through the use of IT. Asset holding firmswith their characteristic centralization and conservativeness also use IT to achieve efficiency in supportactivities. Franchising firms, with the greater degree of freedom and distributed control use IT to achievepreemptiveness.
INTRODUCTION
Brynjolfsson (1993) states that the mismanagement of information and IT is one of the reasons why somefirms cannot obtain benefits from IT. Benefits from IT cannot be realized unless organizationalcharacteristics are aligned with the IT applications and use by the firm. This alignment may allow a firmto sustain its competitive advantage, which is more important and more difficult than simply achieving it.Clemons and Row (1991) state that a firm is able to sustain its created competitive advantage through ITonly when its IT application is well interconnected with the firm’s unique resources and capabilitiesbecause its competitors cannot easily copy the interaction of the firm’s IT with its resources andcapabilities. Thus, this study focuses on how a firm’s unique resources and capabilities influencecompetitive advantage resulting only from IT.
Traditionally, the lodging industry has lagged most other industries in adopting advanced technologies.However, this is changing rapidly. Today, approximately $1.5 billion is spent on technological productsfor the global lodging industry annually. According to a survey in 1994, 95 percent of all U.S. lodgingproperties use IT in their business. This is a dramatic and significant change from 1980, when fewer than10 percent of the properties surveyed were using computers for only a few areas of their propertyoperations, such as reservation and rooms management. It is not difficult to predict that in the next severalyears, the lodging industry will significantly increase its investment efforts in IT and expand the areas inwhich IT can be applied. Although investment in IT is rapidly increasing in the lodging industry, manylodging firms appear to base their IT investment decisions on vendor solicitations or reactions tocompetitors’ decisions, rather than on formal assessments of their need for, and conditions necessary forthe successful implementation of IT. This further indicates the need for a study investigating why andhow a lodging firm achieve competitive advantage through IT.
For this purpose, lodging firms’ resources and capabilities were identified based on an emerging strategicmanagement theory, Resource Based View (RBV) of the firm. The study examines how these identifiedresources and capabilities influence competitive advantage through IT. Secondly, this study is needed tomeasure the construct “competitive advantage” accurately by employing a statistically validatedinstrument to measure competitive advantage resulting only from IT. Previous studies used different types

of generic indicators to measure IT’s effects on competitive advantage, which resulted in inconclusiveresults. Third, rapid investment in IT in the lodging industry requires a study to investigate how a firmcan achieve competitive advantage through an IT application in the lodging industry.
RESOURCE BASED VIEW (RBV) OF THE FIRM
The principles of Industrial Organizational (IO) economics, which dominated the strategy discipline in the1980s focus on the relationship between strategy and the external environment. In contrast, the ResourceBased View (RBV) of the Firm focuses on a firm’s internal factors i.e. its unique resources andcapabilities. In the view of RBV of the Firm, the source of competitive advantage is internal to firm. Inother words, firms accumulate unique combinations of resources and capabilities which allow them toobtain competitive advantage based on their distinctive competencies. The RBV of the Firm suggests thatstrategy formulation start from assessing a firm’s resources and capabilities because the firm’s internalresources and capabilities affect a firm’s performance. For this theory, two assumptions are established:1) firms within an industry may be heterogeneous in terms of their resources; and 2) these resources maybe imperfectly mobile across firms.
METHODOLOGY
As indicated previously, this study attempts to examine: Why and how can (or cannot) a lodging firmcreate and sustain competitive advantage? To answer this question, a case study approach has beenselected. Benbasat et al. (1987) contend that a case study is an appropriate methodology in the area of ITbecause it enables researchers to understand current phenomena. Researchers in the area of IT are oftenfar behind practitioners in terms of understanding a phenomenon in their field because IT is constantlychanging. One of the ways to resolve this problem is for researchers to gather information in naturalsettings. It is a valuable experience for the researcher to learn from practitioners and understand the issueon IT’s impact on competitive advantage in a natural setting. A case study enables a researcher toaccumulate knowledge from practitioners, formalize phenomena, and then test them. Furthermore, a caseapproach is well suited for this study because the study investigates “how” or “why” questions. Toexamine these types of questions, a study needs to investigate a contextual phenomena from in-depthinformation obtained in natural settings. Finally, the case study is a suitable methodology because thisstudy is examining interaction between an IT application and organizations rather than simplyinvestigating an IT application.
Research Questions: The research question for this study -- How do a lodging firm’s resources andcapabilities influence competitive advantage through an IT application? -- can be answered by explainingthe following sub-questions:
How do a firm’s organizational resources and capabilities influence the impact of an IT application oncompetitive advantage (which are measured by the seven dimensions: primary activity efficiency, supportactivity efficiency, resource management functionality, resource acquisition functionality, threats,preemptiveness, synergy)?
How do a firm’s human resources and capabilities influence the impact of an IT application oncompetitive advantage?
How do a firm’s technical resources and capabilities influence the impact of an IT application oncompetitive advantage?
Proposed Basic Framework: The proposed framework suggests that a lodging firm can createcompetitive advantage from an IT application, which is measured by seven dimensions, only when its

unique resources and capabilities, which are measured by three dimensions are well allocated andmatched with the IT application. The created competitive advantage will likely be sustainable competitiveadvantage since this alignment or interconnectedness can hardly be duplicated by competitors. Figure 1(available from the authors) illustrates the proposed basic framework for this study.
Units of Analysis: The proposed primary research question suggests that the unit of analysis for this studybe lodging organizations at the corporate level. In addition to this main unit of analysis, this studyincludes embedded units of analysis: an IT application and a firm’s resources and capabilities. Toinvestigate the units of analysis for this study, the researcher interviewed key managers in the ITdepartments at the corporate level in three lodging firms to investigate how the firms’ resources andcapabilities influence the impact of IT on competitive advantage.
RESULTS
Company A is one of the largest lodging companies in the world. A major number of its properties arecompany-owned or management contracted. The company has adopted technology to improve itsefficiency by cutting response or development time and to help employees automate routine tasks so theycan devote more time to serving customers. The company’s lodging technology focuses on overallorganization structure and fundamental business processes, rather than on traditional departmental andfunctional perspectives. The IT department of Company A is currently working on developing anintegrated suite of applications to enhance its ability to drive down costs, increase the quality of customerservice, and reduce time to market.
Company B is an international hotel company operating luxury and first-class hotels around the world. Itsbusiness objective is to maintain a leading position among international travelers by consistentlyoperating quality hotels with personalized service. The objective of the IT function in Company B was toinsure that the information necessary for each entity of the business to achieve their strategic goals wasreadily available, and a financial plan was made available in a quality, timely, and cost-efficient manner.Since Company B is geographically wide-spread, communication is a unique challenge to this company.
Company C is operating its franchising lodging business. The company’s missions are exceedingexpectations for service and profitability by providing competitive advantage, superior value, and acontinuum of opportunities for all their stockholders. One of the strategies the company has adopted isaggressively investing in the future through technology. The company has embraced technologicalinnovation and intends to lead the transition from a limited-service to a self-service lodging environment.The IT department believes that the computer services are directed at establishing a clear, sustainablecompetitive advantage in the marketplace. The company’s IT strategic plan for the next five yearsindicates that technology will help the company maintain its competitive position. Also, the company willexpand its franchise business by emphasizing IT development, which is centered on the creation of astate-of-the-art reservations system with a low-cost dial-up communications network.
CONCLUSIONS
The research addressed two main objectives. First, this research examined the impact of an IT applicationon competitive advantage. Second, the research identified and investigated resources and capabilitieswhich influence the relationship between an IT application and competitive advantage. For the firstobjective, the impact of an IT application on competitive advantage was measured by seven dimensions.Of the seven dimensions, the results of the research indicate that overall, the lodging companies areachieving high degrees of primary and support activity efficiencies through an IT application, while thefirms are achieving moderate degrees of resource management and acquisition functionality, threats,preemptiveness, and synergy through an IT application. However, differences in some dimensions such as

primary and support activity efficiencies, and preemptiveness exist depending upon the function of thetype of company in the cases. The asset holding and managing companies clearly indicate a higher degreeof primary and support activity efficiencies than a franchising lodging firm, whereas the franchisinglodging firm shows a higher degree of preemptiveness than the asset holding and managing companies.
Even if the franchising lodging firm is taking greater preemptive strikes than the asset holding andmanaging lodging firms, the results of this study appear to indicate that the lodging companies generallyuse IT applications to improve efficiencies rather than to use a strategic weapon to surpass theircompetitors. To achieve competitive advantage through an IT application beyond efficiencies, lodgingfirms may need to take more aggressive postures toward IT. Currently, the lodging firms do not appear toimplement IT applications for the purpose of competitive advantage. Although the firms are well aware ofthe importance of IT for their business, they adopt IT applications more to improve their operationalefficiencies or to reduce cost than to incur threats against their suppliers or customers, or to takepreemptive strikes over their competitors. These latter types of competitive advantage should be exploredmore extensively by lodging firms. Since a few lodging companies implement an IT applicationspecifically for the purpose of competitive advantage, a firm that plans to implement IT applications morestrategically than others is likely to achieve competitive advantage through IT.
As indicated previously, lodging firms’ resources and capabilities were investigated for the secondobjective of the study. The results of the study indicate that some of the resources and capabilitiesidentified from the previous studies appear to moderate the impact of IT on competitive advantage. Sincemost of the lodging firms use similar IT applications, one of the ways a lodging firm achieves advantagesthrough an IT application is to match its unique resources and capabilities with the application by whichthe firm could more easily create and sustain competitive advantage through an IT application. Therefore,it is more important for a lodging firm to allocate appropriately or match its resources and capabilitieswith its IT applications when it attempts to create and sustain competitive advantage through an ITapplication.
Since centralized, formalized, and complex organizational structure appears to control whether or not anIT application is used effectively, an asset holding and managing company will be able to improveefficiencies and reduce costs through an IT application. Therefore, if an asset holding and managinglodging firm is a very structured organization, the firm will be better to focus on efficiencies through anIT application. Conversely, if a franchising lodging firm is a less structured organization, the firm is ableto take preemptive strikes more easily than its competitors that are structured organizations. Therefore, afranchising lodging firm that is a less structured organization will be better able to focus onpreemptiveness through an IT application.
In addition, management competencies influence the impact of an IT application on competitiveadvantage. For asset holding and managing companies, management’s conservative attitude helps the firmimprove efficiencies through an IT application, while for a franchising company, management’s proactiveattitude helps the firm take preemptive strikes through an IT application. This indicates thatmanagement’s attitude and business philosophy conditions lodging firms’ strategic view of IT. That is, ifmanagement is willing to take risks and has a proactive business style, the firm is likely to view an ITapplication strategically and take an aggressive action toward IT. As a result, the firm is likely to use anIT application to compete with others, rather than to improve internal efficiencies. In addition,management’s background influences the firm’s strategy toward IT. Most of the managers who haveprevious experience in other industries appear to be different from those who have experiences in only thelodging industry in terms of their strategic view of IT. The former tend to have a more proactive attitudetoward IT and use IT more for a strategic purpose than the latter who view IT more for the improvementof internal operation efficiencies.
As Porter (1985) stated that technology is embedded into every business activity, when an IT applicationis tightly matched with an organization’s resources and capabilities, the application hardly would becopied by competitors, and the competitive advantage obtained from an IT application is more likely to besustained. Hence, managers in lodging firms must assess their firms’ organizational, human, and technicalresources and capabilities before they implement an IT application to achieve competitive advantage.Moreover, they need to allocate appropriate resources and capabilities to an IT application and matchthem with the application to create and sustain competitive advantage.
REFERENCES
Benbasat, I., Goldstein, D.K., & Mead, M. (1987). The case research strategy in studies of informationsystems. MIS Quarterly, 11 (3), 369-386.
Brynjolfsson, E. (1993). The Productivity paradox of information technology. Communications of theACM. 36(12), 67-77.
Clemons, E.K. (1991). Investment in information technology. Communications of the ACM, 34(1), 22-36.
Porter, M.E. (1985). Creating and sustaining superior performance. The Free Press, New York.
Sethi, V. & King, W.R. (1994). Development of measures to assess the extent to which an informationtechnology application provides competitive advantage. Management Science, 40(12), 1601-1627.

TRACK: International Issues
"" PPrr iivvaatt iizzaatt iioonn ooff PPeennssiioonn FFuunnddss aanndd EEccoonnoommiicc WWeell ll --BBeeiinngg iinn FFoouurr LL aatt iinn AAmmeerr iiccaann CCoouunnttrr iieess""GGoonnzzaalloo EE.. RReeyynnaa,, RRaaddffoorrdd UUnniivveerrssii ttyyJJoosseettttaa SS.. MMccLLaauugghhll iinn,, RRaaddffoorrdd UUnniivveerrssii ttyy
"" UU..SS.. II nnvveessttmmeenntt iinn RRoommaanniiaa""FFrreeddeerr iicckk HH.. DDuunnccaann,, WWiinntthhrroopp UUnniivveerrssii ttyyBBeerrnnaarrdd SSccootttt,, AAvveerryy DDeennnniissoonn CCoorrpp..
"" TThhee II mmppaacctt ooff aa CCrr oossss--ccuull ttuurr aall FFaaccuull ttyy oonn II nntteerr nnaatt iioonnaall TTooppiiccss iinn BBuussiinneessss EEdduuccaatt iioonn EExxpplloorr iinngg SSttuuddeennttss PPeerr cceepptt iioonnss""
JJuuaann SSaannttaannddrreeuu RR,, LLaannddeerr UUnniivveerrssii ttyySStteepphhaanniiee CC.. SSmmiitthh,, LLaannddeerr UUnniivveerrssii ttyyCChhaann SSuupp CChhaanngg,, LLaannddeerr UUnniivveerrssii ttyy
PRIVATIZATION OF PENSION FUNDS AND ECONOMIC WELL-BEING IN FOURLATIN AMERICAN COUNTRIES
Gonzalo E. Reyna, Radford University. PO Box 6956, Radford, VA 24142J. S. McLaughlin, Radford University. PO Box 6954, Radford, VA 24142
ABSTRACT
This paper examines data on privatized pension plans (as expressed through private savings) fromfour Latin American countries – Argentina, Chile, Mexico, and Venezuela. We demonstrate howinformation on pension funds management can be combined with other economic indicators todescribe a potential host country’s economic well-being. This paper represents a step inexamining the role of pension plans as a key factor in the economic vitality of the four LatinAmerican countries.
The evidence suggests that encouraging private savings through privatized pension plans willpositively impact the economic well-being of Latin American countries. The influx of resourcesfrom domestic sources can stimulate economies, thus enhancing the attractiveness of LatinAmerica as a site location for industry.
INTRODUCTION
Traditional factors rated by companies in evaluating location alternatives include labor costs,transportation systems, education and health, tax structures, and natural resources. We suggestthat economic health or well-being of the country of interest should be included as an importantfactor in any model used by companies planning to locate in, or export to, countries outside theUnited States. Furthermore, we believe that the presence of privatized pension plans indeveloping countries should be utilized as one indicator of economic well-being.
This paper examines data on privatized pension plans (as expressed through private savings) fromfour Latin American countries – Argentina, Chile, Mexico, and Venezuela. We demonstrate howinformation on pension funds management can be combined with other economic indicators todescribe a potential host country’s economic well-being. This paper represents a step inexamining the role of pension plans as a key factor in the economic vitality of the four LatinAmerican countries.
BACKGROUND
Pension funds are intended to protect individuals and families from drastic reductions in theirincomes when they retire by setting aside and investing a part of the individual’s current incomes(Rose, 1997). A potential side benefit is the role of pension funds as an effective tool forstrengthening national economies, especially when management of funds is privatized. Thisbenefit has been demonstrated in studies on such countries as Chile. Following privatization ofChile’s pension plans in 1981, national savings as a percent of GDP rose substantially (TheEconomist, 1996). Implementation of the privatization policy has subsequently been cited as afactor in improvements in other indicators of well-being for the Chilean economy.
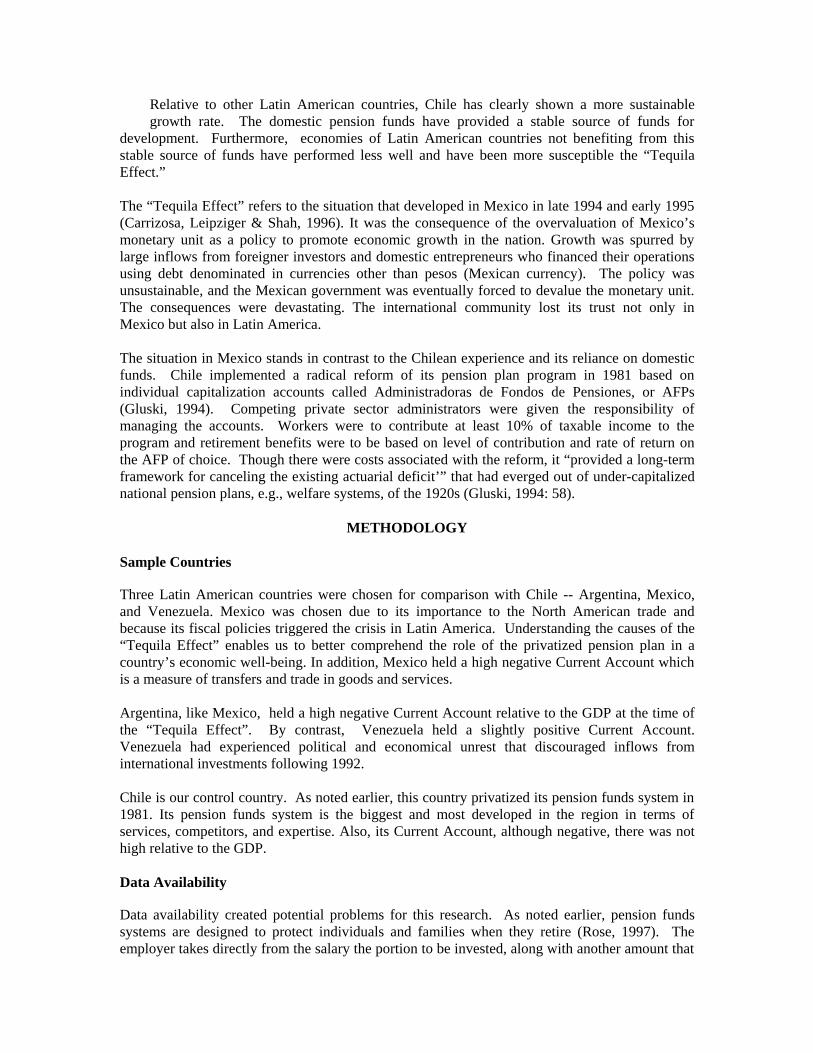
Relative to other Latin American countries, Chile has clearly shown a more sustainablegrowth rate. The domestic pension funds have provided a stable source of funds for
development. Furthermore, economies of Latin American countries not benefiting from thisstable source of funds have performed less well and have been more susceptible the “TequilaEffect.”
The “Tequila Effect” refers to the situation that developed in Mexico in late 1994 and early 1995(Carrizosa, Leipziger & Shah, 1996). It was the consequence of the overvaluation of Mexico’smonetary unit as a policy to promote economic growth in the nation. Growth was spurred bylarge inflows from foreigner investors and domestic entrepreneurs who financed their operationsusing debt denominated in currencies other than pesos (Mexican currency). The policy wasunsustainable, and the Mexican government was eventually forced to devalue the monetary unit.The consequences were devastating. The international community lost its trust not only inMexico but also in Latin America.
The situation in Mexico stands in contrast to the Chilean experience and its reliance on domesticfunds. Chile implemented a radical reform of its pension plan program in 1981 based onindividual capitalization accounts called Administradoras de Fondos de Pensiones, or AFPs(Gluski, 1994). Competing private sector administrators were given the responsibility ofmanaging the accounts. Workers were to contribute at least 10% of taxable income to theprogram and retirement benefits were to be based on level of contribution and rate of return onthe AFP of choice. Though there were costs associated with the reform, it “provided a long-termframework for canceling the existing actuarial deficit’” that had everged out of under-capitalizednational pension plans, e.g., welfare systems, of the 1920s (Gluski, 1994: 58).
METHODOLOGY
Sample Countries
Three Latin American countries were chosen for comparison with Chile -- Argentina, Mexico,and Venezuela. Mexico was chosen due to its importance to the North American trade andbecause its fiscal policies triggered the crisis in Latin America. Understanding the causes of the“Tequila Effect” enables us to better comprehend the role of the privatized pension plan in acountry’s economic well-being. In addition, Mexico held a high negative Current Account whichis a measure of transfers and trade in goods and services.
Argentina, like Mexico, held a high negative Current Account relative to the GDP at the time ofthe “Tequila Effect”. By contrast, Venezuela held a slightly positive Current Account.Venezuela had experienced political and economical unrest that discouraged inflows frominternational investments following 1992.
Chile is our control country. As noted earlier, this country privatized its pension funds system in1981. Its pension funds system is the biggest and most developed in the region in terms ofservices, competitors, and expertise. Also, its Current Account, although negative, there was nothigh relative to the GDP.
Data Availability
Data availability created potential problems for this research. As noted earlier, pension fundssystems are designed to protect individuals and families when they retire (Rose, 1997). Theemployer takes directly from the salary the portion to be invested, along with another amount that

the employer contributes on behalf of his employer, and places it in a fund that is investedon behalf of the employee. Unfortunately, available data sources generally do not report
these funds separately from private savings. Therefore, the total private savings per country isused by researchers as a determinant variable.
Private savings is defined as the money in deposits of the deposits money banks and deposits ofother residents, apart from the central government (International Monetary Fund (IMF), 1996).The money invested in mutual funds or pension funds is considered part of the private savings;the main difference is with regard to the kind of institution and the objective of this investments.The International Financial Statistics data (IMF, 1996) add funds together unless the pension fundindustry is relevant in the country. That is the case only for Chile. The remaining three countriesin this study -- Argentina, Mexico, and Venezuela -- do not show the amount of money in pensionfunds, although this industry exists in those countries
Measures
Andrés R. Gluski (1994) used the variable “private savings” in his study on pension plans inLatin America capital markets. He provided substantial evidence of the linkage between pensionfunds and levels of domestic savings. Following Gluski’s lead, the first step in this study was tofind data on the amount of domestic private savings for the four countries – Argentina, Chile,Mexico, and Venezuela. Each country handles different exchange rates and currencies; therefore,values were converted to U.S. dollars. This is standard practice. Many researchers haveconverted all the figures from countries sampled to the United States dollar. This currency hasbeen informally adopted as the standard by which to compare different economies. (SeeDeFusco, Geppert, and Tsetsekos, 1996.)
A second measure was necessary due to differences in the size of the economies in the four LatinAmerican countries. To adjust for these differences, a new measure was constructed by dividingthe Total Private Savings by the Gross Domestic Product (GDP). This index allows us to measurethe relative level of private savings with respect to the economy as a whole.
Macroeconomic indexes are utilized to establish comparison of the economies before and afterthe so-called “Tequila Effect”. The most important variable in this analysis is the CurrentAccount. This factor measures transfers and trades in goods and services (Byrns, 1993). Thedefinitions and descriptions of each variable used in the analysis are given in Table 1.
TABLE 1: VARIABLE DEFINITIONS AND DESCRIPTIONSVariable Definition DescriptionPrivate Savings Deposit of the deposit money bank
and deposits of their residents otherthan the central government
Amount of money saved
Gross Domestic Produc(GDP)
The total value of all productionthat takes place annually
Size of the economies
Private Savings/GDP Relative level of private savings Meaningful measure ofpension fund industryadjusted for size of economy
Growth Rates Percentage annual variations inGDP
Country’s Performance
Current Account Transfers and trade in goods andservices
Transfers of good andservices

Data Collection
Yearly national account figures from each of the countries in this study were taken from the 1996International Monetary Fund Statistical Series. The data, shown in Tables A - D in the Appendix,correspond to years 1989 through 1995. This period covers the years prior to the “Tequila Effect”and the first year after this phenomenon occurred. While data for year 1996 are not available atthis time, it would be useful to look at the subsequent performance of these economies. Theaccount Total Savings represents the total of Time, Savings, and Currency Deposit (line 25 in theseries) which belong to the group of Deposit Money Bank accounts and the same account (line 45in the series) belonging to Other Banking Institutions accounts group. In the specific case ofChile, we included in Total Savings the amount of Claims on Private Sector (line 42d.p) andClaims on Deposit Money Banks (line 42e.p), which are part of the Nonbank FinancialInstitutions. These accounts do not exist in the profile of the other three countries because theyare not relevant to those economies. The Real GDP Growth Percentage per country wascalculated on the basis of the GDP in 1990 dollars.
CATALYSTS FOR CHANGE
The conditions prevailing in Latin America during the decade preceding the events leading to the“Tequila Effect” can best be understood relative to CEPAL (Comité Económico para AméricaLatina y el Caribe / Economic Commission for Latin America and the Caribbean (ECLAC)). Latein the 1960’s and the early 1970’s, CEPAL dictated the economic rules for Latin Americancountries. Unfortunately, in the 1980’s, the CEPAL model proved to be ineffective. As a result,the 1980s was called “the lost decade” for Latin America (Weisman, 1996). Around 1990, thedifferent nations reacted by reformulating their economic policies, this time more oriented towardfree markets. Change has not been easy.
The earlier CEPAL economic model was named the Inside Growing Process, which meant theclosing of all boundaries among nations. The basic idea was that every country would substitutefor imports by producing the goods in their own territory. This substitution was technology,knowledge, and other resources that might help avoid reliance on imports. The boundariesremained open only to those things that could not be replaced (Iglesias, 1976).
At the time, embracing the CEPAL model was not necessarily irrational. The major LatinAmerican economies were in a growth phase. Governments tried to protect this growth by closingtheir economic borders and by turning to very protective and regulated economies. Unfortunately,Latin America did not have the necessary resources and levels of development to thrive undersuch policies.
At the same time, the development of global markets accelerated. This worldwide trend towardthe global village would prevail. Latin America was left isolated (Weisman, 1996). Governmentleaders found that their countries were lagging behind the world both in technological advantagesand wealth. The countries also had enormous amounts of debt that created a fiscal deficit whichplaced future growth at risk (Calcagno & Sáinz, 1992). This debt was aggravated by operationallosses of national social security pension plans (Gluski, 1994).
At the beginning of the 1990’s, the Latin American governments reviewed their fiscal policies(Bradford, 1991) and set as major goals the transforming of their economies, the controlling ofinflation, and the refocusing of their country’s fiscal policies. This was not an easy process.There were many signs of turbulence even though governments appeared to be moving in the

right direction. The poorest classes were hurt badly by the reforms. They voiced theirconcerns and demands for correction in their personal circumstance through various means,
e.g., military rebellions in Argentina, Uruguay, and Venezuela; guerrillas in Mexico, CentralAmerica, Colombia, and Peru; and riots. Nevertheless, despite all disruptions, the policy changescontinued and positive effects began to take place.
Recent economic liberalization programs have not yet led to large increases in the rates ofdomestic investment in most Latin America nations. Though large inflows have made it possibleto finance the corresponding account deficits, concern exists for raising the domestic rates ofsavings in order to increase the stock of national wealth (Gluski, 1994). Also, stock markets inthis region have tended to be small compared with the GDP, although this has changed a littlerecently.
COMPARISONS FOR YEARS 1989-1995
Data for the four countries for the years 1989 to 1995 are found in Table A - D in the Appendix.Private savings as a percent of GDP increased from 1989 to 1995 in three countries – Chile(35.77% to 53.41%), Mexico (13.37% to 28.39%), and Argentina (11.84% to 12.61%). Privatesavings as a percent of GDP was more variable in Venezuela, increasing from 27% in 1989 to31.66% in 1991 and then decreasing to 19.88% by 1995.
As a consequence of the enormous economic transformation at the beginning of this decade inLatin American countries, a sharp increase in the growth rate as measured by GDP would beexpected. Latin America began well behind other economies in the world, but capital inflowsoccurred in massive amounts. The economy reacted rapidly and vigorously, with increased inGDP as measured in current dollars increasing annually from 7% (Chile, 1989-1990) to morethan 30% ( Argentina, 1989-1990, 1990-1991) before showing substantial slowing beginning inyear 1992 (Tables A - D, Appendix). Chile experienced the largest increases in GDP as measuredby current dollars when compared to Mexico and Venezuela.
Comparisons on changes in GDP as measured by current dollars are complicated for Argentina bythe substantial impact of inflation in that country during the late 1980s and early 1990s.Comparisons on changes in GDP as measured by constant dollars, i.e., real GDP, thus providesuseful information. Figure 1 plots performance of the four countries before and following the“Tequila Crisis”.
FIGURE 1: PERCENT GROWTH IN REAL GDP 1989-1995
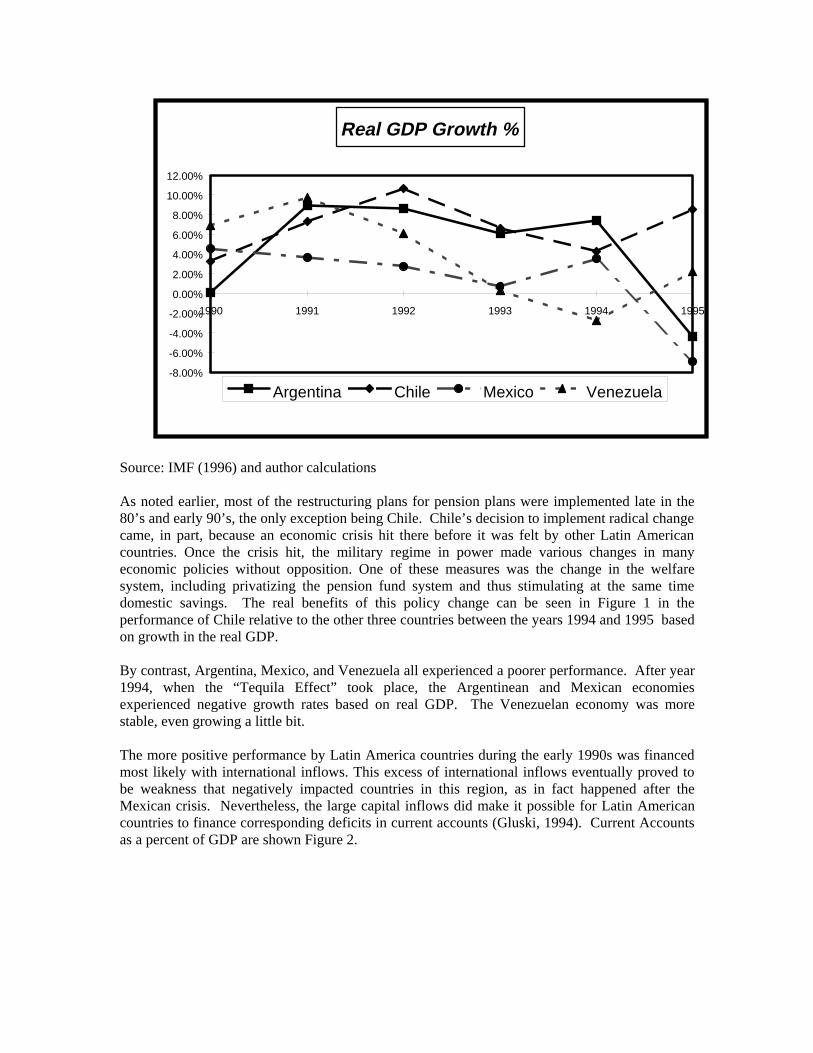
Real GDP Growth %
-8.00%
-6.00%
-4.00%
-2.00%
0.00%
2.00%
4.00%
6.00%
8.00%
10.00%
12.00%
1990 1991 1992 1993 1994 1995
Argentina Chile Mexico Venezuela
Source: IMF (1996) and author calculations
As noted earlier, most of the restructuring plans for pension plans were implemented late in the80’s and early 90’s, the only exception being Chile. Chile’s decision to implement radical changecame, in part, because an economic crisis hit there before it was felt by other Latin Americancountries. Once the crisis hit, the military regime in power made various changes in manyeconomic policies without opposition. One of these measures was the change in the welfaresystem, including privatizing the pension fund system and thus stimulating at the same timedomestic savings. The real benefits of this policy change can be seen in Figure 1 in theperformance of Chile relative to the other three countries between the years 1994 and 1995 basedon growth in the real GDP.
By contrast, Argentina, Mexico, and Venezuela all experienced a poorer performance. After year1994, when the “Tequila Effect” took place, the Argentinean and Mexican economiesexperienced negative growth rates based on real GDP. The Venezuelan economy was morestable, even growing a little bit.
The more positive performance by Latin America countries during the early 1990s was financedmost likely with international inflows. This excess of international inflows eventually proved tobe weakness that negatively impacted countries in this region, as in fact happened after theMexican crisis. Nevertheless, the large capital inflows did make it possible for Latin Americancountries to finance corresponding deficits in current accounts (Gluski, 1994). Current Accountsas a percent of GDP are shown Figure 2.
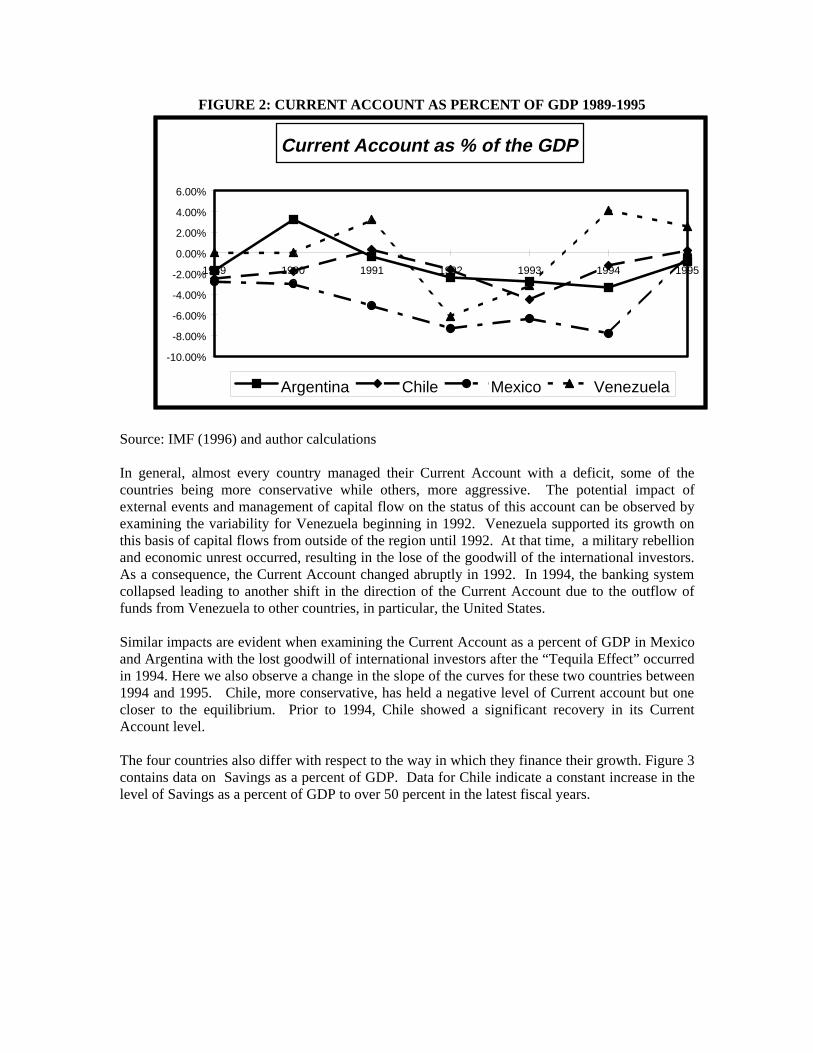
FIGURE 2: CURRENT ACCOUNT AS PERCENT OF GDP 1989-1995
Current Account as % of the GDP
-10.00%
-8.00%
-6.00%
-4.00%
-2.00%
0.00%
2.00%
4.00%
6.00%
1989 1990 1991 1992 1993 1994 1995
Argentina Chile Mexico Venezuela
Source: IMF (1996) and author calculations
In general, almost every country managed their Current Account with a deficit, some of thecountries being more conservative while others, more aggressive. The potential impact ofexternal events and management of capital flow on the status of this account can be observed byexamining the variability for Venezuela beginning in 1992. Venezuela supported its growth onthis basis of capital flows from outside of the region until 1992. At that time, a military rebellionand economic unrest occurred, resulting in the lose of the goodwill of the international investors.As a consequence, the Current Account changed abruptly in 1992. In 1994, the banking systemcollapsed leading to another shift in the direction of the Current Account due to the outflow offunds from Venezuela to other countries, in particular, the United States.
Similar impacts are evident when examining the Current Account as a percent of GDP in Mexicoand Argentina with the lost goodwill of international investors after the “Tequila Effect” occurredin 1994. Here we also observe a change in the slope of the curves for these two countries between1994 and 1995. Chile, more conservative, has held a negative level of Current account but onecloser to the equilibrium. Prior to 1994, Chile showed a significant recovery in its CurrentAccount level.
The four countries also differ with respect to the way in which they finance their growth. Figure 3contains data on Savings as a percent of GDP. Data for Chile indicate a constant increase in thelevel of Savings as a percent of GDP to over 50 percent in the latest fiscal years.
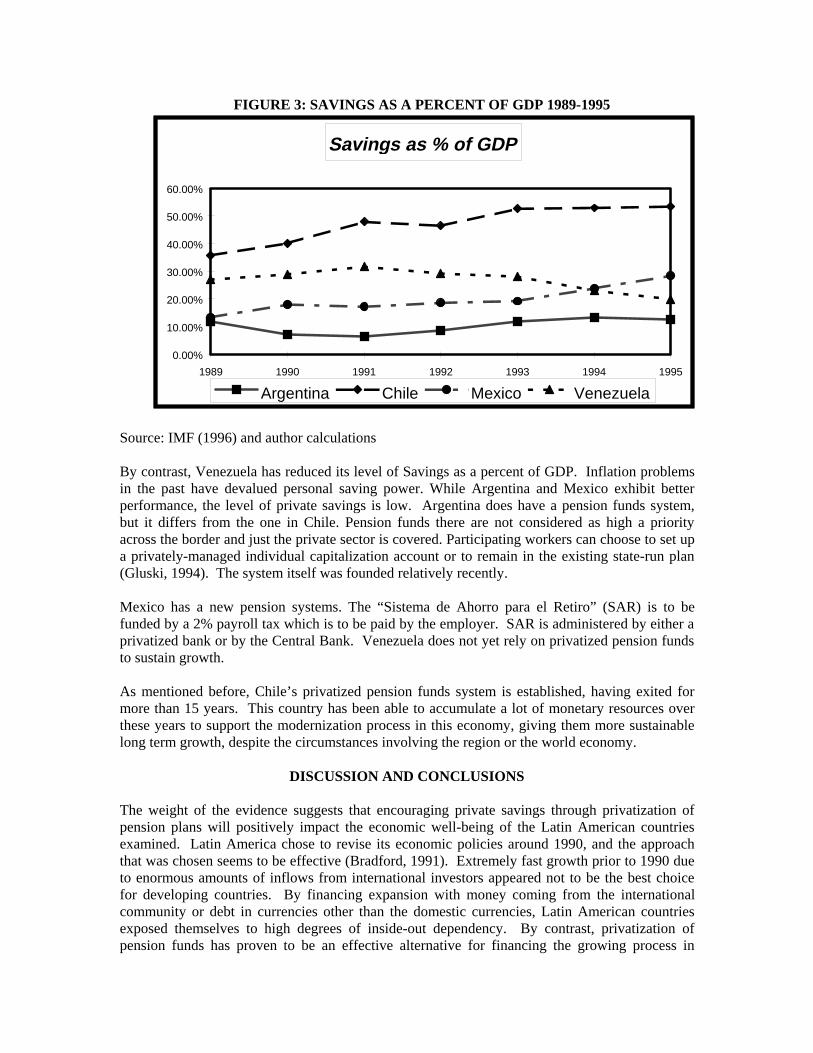
FIGURE 3: SAVINGS AS A PERCENT OF GDP 1989-1995
Savin gs as % of GDP
0.00%
10.00%
20.00%
30.00%
40.00%
50.00%
60.00%
1989 1990 1991 1992 1993 1994 1995
Argentina Chile Mexico Venezuela
Source: IMF (1996) and author calculations
By contrast, Venezuela has reduced its level of Savings as a percent of GDP. Inflation problemsin the past have devalued personal saving power. While Argentina and Mexico exhibit betterperformance, the level of private savings is low. Argentina does have a pension funds system,but it differs from the one in Chile. Pension funds there are not considered as high a priorityacross the border and just the private sector is covered. Participating workers can choose to set upa privately-managed individual capitalization account or to remain in the existing state-run plan(Gluski, 1994). The system itself was founded relatively recently.
Mexico has a new pension systems. The “Sistema de Ahorro para el Retiro” (SAR) is to befunded by a 2% payroll tax which is to be paid by the employer. SAR is administered by either aprivatized bank or by the Central Bank. Venezuela does not yet rely on privatized pension fundsto sustain growth.
As mentioned before, Chile’s privatized pension funds system is established, having exited formore than 15 years. This country has been able to accumulate a lot of monetary resources overthese years to support the modernization process in this economy, giving them more sustainablelong term growth, despite the circumstances involving the region or the world economy.
DISCUSSION AND CONCLUSIONS
The weight of the evidence suggests that encouraging private savings through privatization ofpension plans will positively impact the economic well-being of the Latin American countriesexamined. Latin America chose to revise its economic policies around 1990, and the approachthat was chosen seems to be effective (Bradford, 1991). Extremely fast growth prior to 1990 dueto enormous amounts of inflows from international investors appeared not to be the best choicefor developing countries. By financing expansion with money coming from the internationalcommunity or debt in currencies other than the domestic currencies, Latin American countriesexposed themselves to high degrees of inside-out dependency. By contrast, privatization ofpension funds has proven to be an effective alternative for financing the growing process in

developing nations and for strengthening the economy. The system brings the necessarystability and reliability for entrepreneurs initiating new businesses, which is the determining
factor in this transformation (Freer, 1995).
However, growth in privatized pension fund systems also poses some threats. Over time, thepension fund industry (e.g., mutual fund industry) can become an enormous giant capable ofdetermining the direction of the economy (Whitehouse, 1992). According to Whitehouse, thefuture of the American economy is in the hand of the pension fiduciaries and institutionalinvestors because the investment funds are extremely concentrated. This situation wouldundermine the main purpose of the marketplace, encouraging a lack of creativity in production.However, at this time, Latin America’s major problems differ from those in developed nationsand under current circumstances, the countries can benefit from the promotions of this economicsector.
Latin American countries have learned hard lessons. Venezuela was struck early after the militaryrebellion. The “Tequila Effect” that affected Latin America as whole was especially harmful forMexico and Argentina (Dudley, 1995). When the government was forced to devalue themonetary unit (peso), it represented a major blow to the economy that brought many companiesto bankruptcy. Others (primarily multinationals) simply closed their operations in the country,while the remaining companies are still struggling to overcome its impact.
The Mexican and Argentinean experiences contrast sharply with the Chilean experience. Chilehad made better decisions concerning how to provide a strong domestic source of funds and howto provide for their institutions. This led to a low dependency on external factors and to greaterdependency on pension funds that now account for more than 40 percent of the GDP (Sanchez,1996). The record of the Chilean funds has been impressive, averaging 14 percent annually over aperiod of 15 years (Freer, 1995). The support from this reliance on a pension funds has assisteddomestic industries in financing their operations and has led several Chilean companies (evenmid-sized ones) to consider the option of expanding their operations abroad. Capital market hasgrown in tandem with the pension system: the number of companies listed on the stock marketexpanded from 228 in 1985 to 279 in 1994. Market Capitalization rose from US$ 2 billion to US$68 billion in the same time frame. The privatized pension fund system is clearly one of theChile’s strengths, providing substantial funds at a low cost (Sanchez, 1996;Freer, 1995).
Chile has built safeguards into its pension fund system (Sanchez, 1996). The funds are allow toinvest no more than 3 percent of their assets abroad, thus keeping the money contributed to thepension plan system inside the country. This requirement has significant implications fordomestic and multinational companies entering this market. The Chilean system also limits theproportion of investments in specific types of instruments in order to reduce riskiness of thepension fund portfolio (Gluski, 1994). The distribution of the assets is shown in Figure 4.
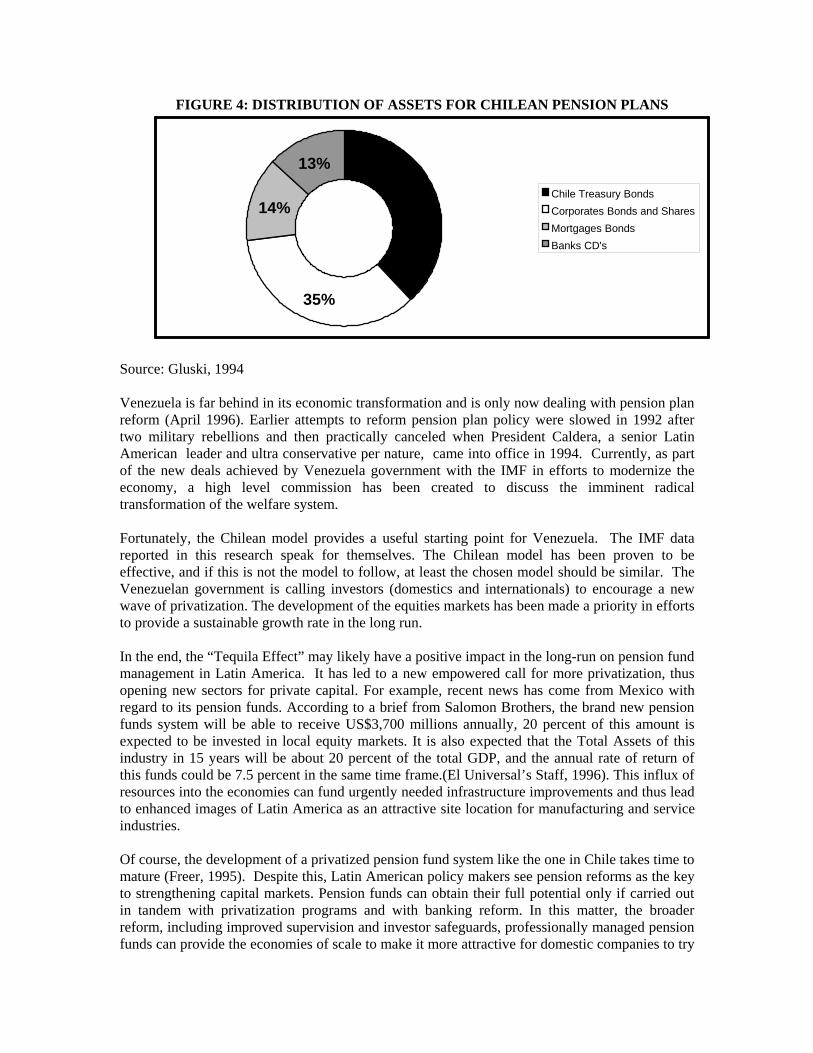
FIGURE 4: DISTRIBUTION OF ASSETS FOR CHILEAN PENSION PLANS
38%
35%
14%
13%
Chile Treasury Bonds
Corporates Bonds and Shares
Mortgages Bonds
Banks CD's
Source: Gluski, 1994
Venezuela is far behind in its economic transformation and is only now dealing with pension planreform (April 1996). Earlier attempts to reform pension plan policy were slowed in 1992 aftertwo military rebellions and then practically canceled when President Caldera, a senior LatinAmerican leader and ultra conservative per nature, came into office in 1994. Currently, as partof the new deals achieved by Venezuela government with the IMF in efforts to modernize theeconomy, a high level commission has been created to discuss the imminent radicaltransformation of the welfare system.
Fortunately, the Chilean model provides a useful starting point for Venezuela. The IMF datareported in this research speak for themselves. The Chilean model has been proven to beeffective, and if this is not the model to follow, at least the chosen model should be similar. TheVenezuelan government is calling investors (domestics and internationals) to encourage a newwave of privatization. The development of the equities markets has been made a priority in effortsto provide a sustainable growth rate in the long run.
In the end, the “Tequila Effect” may likely have a positive impact in the long-run on pension fundmanagement in Latin America. It has led to a new empowered call for more privatization, thusopening new sectors for private capital. For example, recent news has come from Mexico withregard to its pension funds. According to a brief from Salomon Brothers, the brand new pensionfunds system will be able to receive US$3,700 millions annually, 20 percent of this amount isexpected to be invested in local equity markets. It is also expected that the Total Assets of thisindustry in 15 years will be about 20 percent of the total GDP, and the annual rate of return ofthis funds could be 7.5 percent in the same time frame.(El Universal’s Staff, 1996). This influx ofresources into the economies can fund urgently needed infrastructure improvements and thus leadto enhanced images of Latin America as an attractive site location for manufacturing and serviceindustries.
Of course, the development of a privatized pension fund system like the one in Chile takes time tomature (Freer, 1995). Despite this, Latin American policy makers see pension reforms as the keyto strengthening capital markets. Pension funds can obtain their full potential only if carried outin tandem with privatization programs and with banking reform. In this matter, the broaderreform, including improved supervision and investor safeguards, professionally managed pensionfunds can provide the economies of scale to make it more attractive for domestic companies to try

and successfully access local capital markets (Gluski, 1994). The popular support ofprivatization programs would increase in Mexico, Venezuela, and Argentina, as it has in
Chile, to the extent that individuals can participate in the capital gains realized by the reformprograms.
In the end, tight prudent regulations for the pension funds and improvement in supervision ofdomestic capital market must go hand in hand in countries planning to implement reforms basedon the Chilean model. The expected benefits are substantial and can ultimately impact theattractiveness of Latin America in global markets.
APPENDIX
Appendix A: Argentina Data
1989 1990 1991 1992 1993 1994 1995Millions of Pesos
Private Savings (1) 379 4,845 11,471 19,666 30,334 37,109 35,377Private Savings (2) 5 43 121 272 412 501 284
384 4,888 11,592 19,938 30,746 37,610 35,661Millions of Dollars
Private Savings (3) 9,072 10,025 12,157 20,126 30,778 37,647 35,670As GDP % (3) 11.84% 7.09% 6.41% 8.79% 11.94% 13.35% 12.61%
Current Account -1,305 4,552 -647 -5,403 -7,047 -9,366 -2,399As GDP % (3) -1.70% 3.22% -0.34% -2.36% -2.73% -3.32% -0.85%
Millions
GDP (in Pesos) 3,244 68,922 180,898 226,847 257,570 281,645 282,700GDP (in Dollars) 76,636 141,352 189,710 228,990 257,841 281,924 282,771
Exchange Rate 0.042 0.488 0.954 0.991 0.999 0.999 1.000
(1) Time, Savings, and Foreign Currency Deposits in Deposits Money Banks(2) Time, Savings, and Foreign Currency Deposits in Other Banking Institutions(3) Calculations: Author
Source: IMF (1996) and authors calculations
Appendix B: Chile Data
1989 1990 1991 1992 1993 1994 1995Billions of Pesos
Private Savings (1) 1,852 2,392 3,306 4,192 5,291 5,872 7,673Private Savings (2) 62 75 120 212 313 379 348
1,914 2,467 3,426 4,404 5,604 6,250 8,021Non BankPrivate Sector 256 505 1,320 1,602 2,694 3,537 3,848Dpt. Money Bank 523 752 1,007 1,196 1,416 1,807 2,392
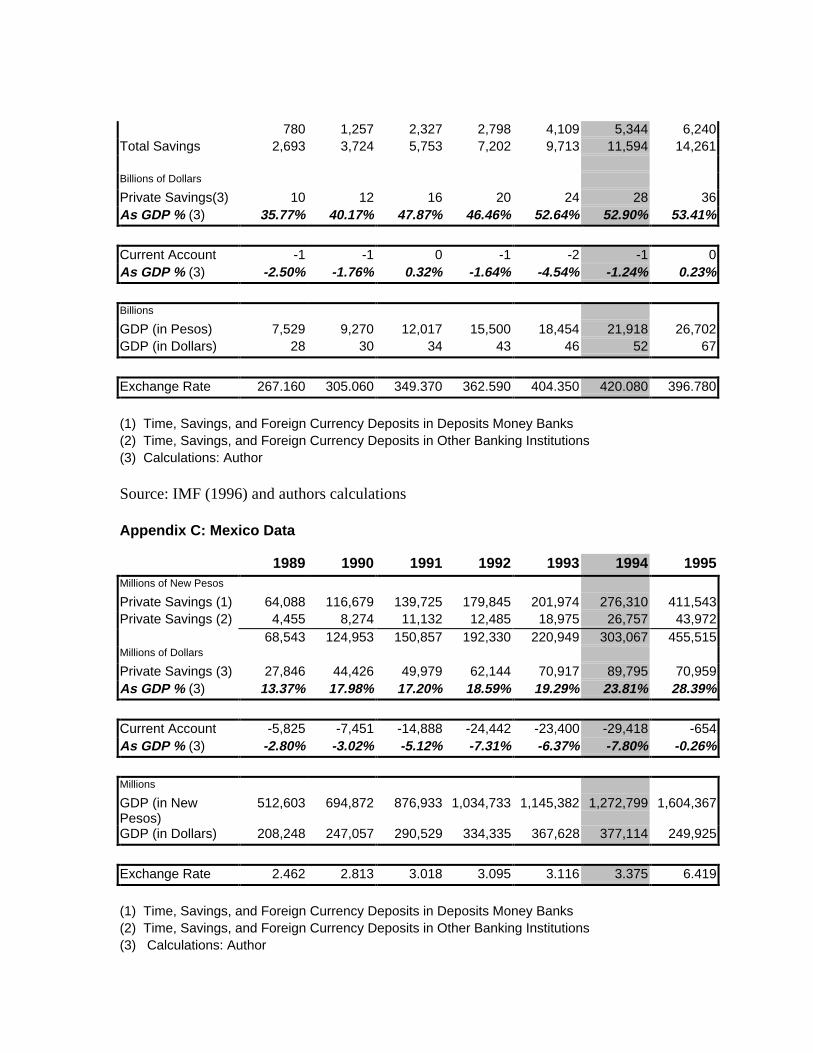
780 1,257 2,327 2,798 4,109 5,344 6,240Total Savings 2,693 3,724 5,753 7,202 9,713 11,594 14,261
Billions of Dollars
Private Savings(3) 10 12 16 20 24 28 36As GDP % (3) 35.77% 40.17% 47.87% 46.46% 52.64% 52.90% 53.41%
Current Account -1 -1 0 -1 -2 -1 0As GDP % (3) -2.50% -1.76% 0.32% -1.64% -4.54% -1.24% 0.23%
Billions
GDP (in Pesos) 7,529 9,270 12,017 15,500 18,454 21,918 26,702GDP (in Dollars) 28 30 34 43 46 52 67
Exchange Rate 267.160 305.060 349.370 362.590 404.350 420.080 396.780
(1) Time, Savings, and Foreign Currency Deposits in Deposits Money Banks(2) Time, Savings, and Foreign Currency Deposits in Other Banking Institutions(3) Calculations: Author
Source: IMF (1996) and authors calculations
Appendix C: Mexico Data
1989 1990 1991 1992 1993 1994 1995Millions of New Pesos
Private Savings (1) 64,088 116,679 139,725 179,845 201,974 276,310 411,543Private Savings (2) 4,455 8,274 11,132 12,485 18,975 26,757 43,972
68,543 124,953 150,857 192,330 220,949 303,067 455,515Millions of Dollars
Private Savings (3) 27,846 44,426 49,979 62,144 70,917 89,795 70,959As GDP % (3) 13.37% 17.98% 17.20% 18.59% 19.29% 23.81% 28.39%
Current Account -5,825 -7,451 -14,888 -24,442 -23,400 -29,418 -654As GDP % (3) -2.80% -3.02% -5.12% -7.31% -6.37% -7.80% -0.26%
Millions
GDP (in NewPesos)
512,603 694,872 876,933 1,034,733 1,145,382 1,272,799 1,604,367
GDP (in Dollars) 208,248 247,057 290,529 334,335 367,628 377,114 249,925
Exchange Rate 2.462 2.813 3.018 3.095 3.116 3.375 6.419
(1) Time, Savings, and Foreign Currency Deposits in Deposits Money Banks(2) Time, Savings, and Foreign Currency Deposits in Other Banking Institutions(3) Calculations: Author
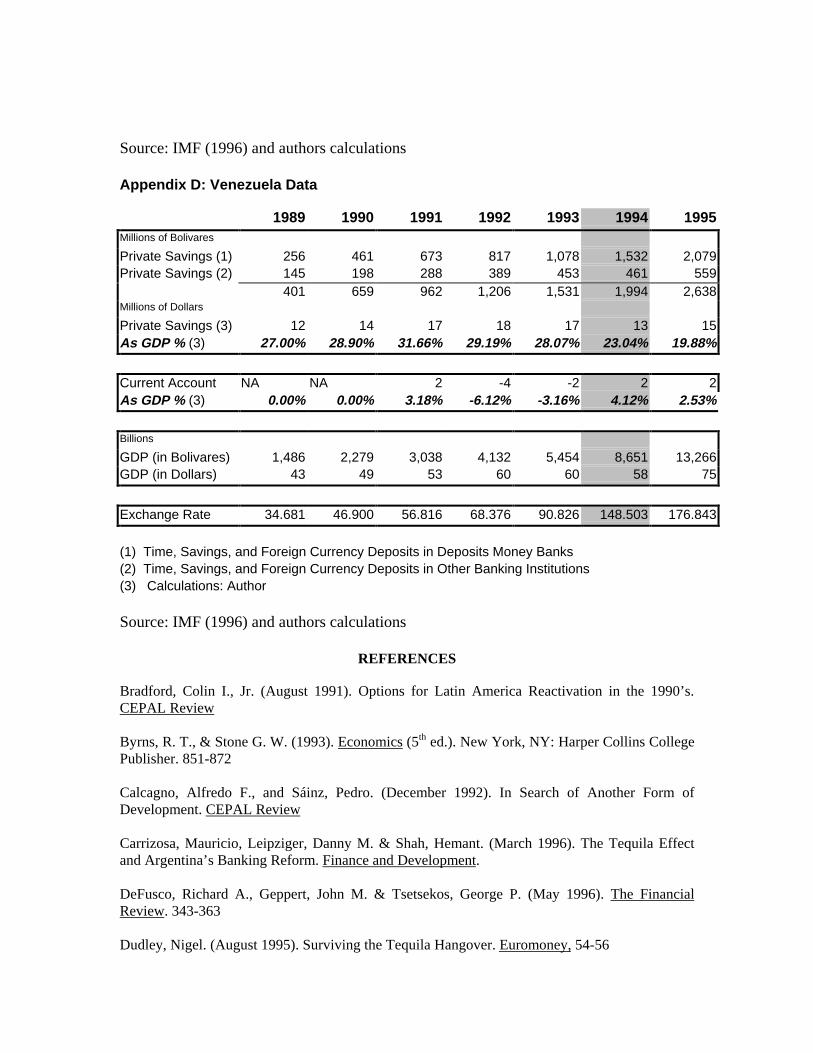
Source: IMF (1996) and authors calculations
Appendix D: Venezuela Data
1989 1990 1991 1992 1993 1994 1995Millions of Bolivares
Private Savings (1) 256 461 673 817 1,078 1,532 2,079Private Savings (2) 145 198 288 389 453 461 559
401 659 962 1,206 1,531 1,994 2,638Millions of Dollars
Private Savings (3) 12 14 17 18 17 13 15As GDP % (3) 27.00% 28.90% 31.66% 29.19% 28.07% 23.04% 19.88%
Current Account NA NA 2 -4 -2 2 2As GDP % (3) 0.00% 0.00% 3.18% -6.12% -3.16% 4.12% 2.53%
Billions
GDP (in Bolivares) 1,486 2,279 3,038 4,132 5,454 8,651 13,266GDP (in Dollars) 43 49 53 60 60 58 75
Exchange Rate 34.681 46.900 56.816 68.376 90.826 148.503 176.843
(1) Time, Savings, and Foreign Currency Deposits in Deposits Money Banks(2) Time, Savings, and Foreign Currency Deposits in Other Banking Institutions(3) Calculations: Author
Source: IMF (1996) and authors calculations
REFERENCES
Bradford, Colin I., Jr. (August 1991). Options for Latin America Reactivation in the 1990’s.CEPAL Review
Byrns, R. T., & Stone G. W. (1993). Economics (5th ed.). New York, NY: Harper Collins CollegePublisher. 851-872
Calcagno, Alfredo F., and Sáinz, Pedro. (December 1992). In Search of Another Form ofDevelopment. CEPAL Review
Carrizosa, Mauricio, Leipziger, Danny M. & Shah, Hemant. (March 1996). The Tequila Effectand Argentina’s Banking Reform. Finance and Development.
DeFusco, Richard A., Geppert, John M. & Tsetsekos, George P. (May 1996). The FinancialReview. 343-363
Dudley, Nigel. (August 1995). Surviving the Tequila Hangover. Euromoney, 54-56
El Universal’s Staff. (1996, November 13). México: Fondos de Retiro equivaldrán a 6% delPIB. El Universal. Caracas, Venezuela. Available: http://www.el-universal.com
Escalante, L.E. (1996, November 12). Acuerdo sobre Seguridad Social Incrementa PoderAdquisitivo. El Universal. Caracas, Venezuela. Available: http://www.el-universal.com
Freer, Jim. (July-August 1995) The Private Pension Path. LatinFinance, 69. 36-38
Gluski, Andres R. (Summer 1994). Recent Reforms of National Pension Plans and the FutureDevelopment of Latin American Capital Markets. Columbia Journal of World Business, 54 - 65
Iglesias, Enrique V. (Half of 1976). Situation and Prospects of the Latin America Economy in1975. CEPAL Review.
International Monetary Fund (IMF). (October 1996). International Financial Statistics. IMFPublication Service. Washington, D.C.
Leon, E. (1996, November 12). Urge Reforma a Régimen de Cálculo de Prestaciones Sociales. ElUniversal. Caracas, Venezuela. Available: http://www.el-universal.com
Rose, P.S. (1997). Money and Capital Markets: Financial Institutions and Instruments in GlobalMarketplace. (6th. ed.). Chicago, IL: Irwin. 143-149
Sanchez, Enrique P. (July 1996). Capital Flows Into Latin America: Stronger Than Ever.Business and Economics. 27-31
The Economist. (November 1996). Retirement revolution. 95
Weisman, Lorenzo. (Spring 1996). The Advent of Private Equity in Latin America. ColumbiaJournal of World Business, 60-68
Whitehouse, Dan. (Spring 1992). How Pension Investment Policy Drains American EconomicsStrength. . Columbia Journal of World Business, 22-36

U.S. INVESTMENT IN ROMANIA
Frederick H. Duncan, Winthrop University, Rock Hill, SC 29733 (803) 323-2186Bernard Scott, Avery Dennison, Charlotte, NC 28277 (704) 542-7403
ABSTRACT
The upheaval in Eastern Europe has created a new market potential for established investors. In Romania,the development of this market has not progressed along with its former trading partners. Direct Foreigninvestment in Romania is low compared to the Eastern European NATO entrants. In the total Romanianinvestment picture, the United States has ranked sixth since 1990. Much higher direct foreign investmenthas been made by Western Europe and the Far East.
INTRODUCTION
Since 1989, much attention has focused on the progress of the former communist controlled countriestowards democracy and free market integration. The recent NATO summit points to the level of successof the new Europe towards this union. Hungary, Czechia, and Poland have demonstrated a continuousand persistent conversion to western economic and political ideals, and were overwhelming voted formembership. Besides the three new admissions, two other countries have also applied. Romania andSlovenia were also aspiring to join the alliance. Both were delayed membership, but were encouraged tojoin in two years. Romania in particular was a crucial part of this alliance, because of its strategic rightflank position and its economic potential. So important was the desire not to dishearten the Romanianpopulation, that President Clinton visited Romania immediately after the NATO summit. One of thereasons for Romania’s delay was related to the democratic reforms. But economic rationales wereimportant as well. Privatization, Direct Foreign Investment, and free market reforms were the deficientareas. Much has been written about privatization and market reforms, but direct foreign investment hasreceived little attention. In our paper we wish to look at Romania’s position and progress in direct foreigninvestment [3]. We will compare Romania to its former central and Eastern Europe partners. Further wewill look at the major participants in Romania’s outside investment.
DIRECT FOREIGN INVESTMENT CLIMATE
Economic Profiles are an important means to analyze a country’s potential for investment. Changes inoutput, trade activity, inflation, and deficits are some of the useful indicators. Although inflation isgenerally higher than optimal for some of these Eastern European countries, Romania’s inflation isapproximately 27% higher than Poland, the next highest figure. A look at exchange rates for the period1992-1995 indicates that Romania suffers from a radically declining currency. The other EasternEuropean currencies are relatively stable. Romania’s private sector accounts for 40% of GDP, which iswell below the other countries. Private sector percentages of GDP for the other countries range from60%, for Poland and Hungary, to 66% for Slovakia, and 79% for the Czech Republic.
The Romanian economy has been slow to develop as compared to other Eastern European countries formany reasons. One factor is that the post-Ceausescu government, until the 1996 elections, was lead byCeausescu deputies and others from the previous communist government. The post revolutiongovernment was conservative in its implementation of a market driven economy [3]. With only 40% ofstate run businesses being privatized initially, it is clear to see that Romania resisted the change.Much of the blame for the poor economic state in Romania can be laid on direct foreign investmentuncertainty and the status of investment legislation. Comparison with investment activity in other Eastern

European countries would show that Romania, although the second largest market in Eastern Europe, iswell behind the pace. Hungary experienced much larger foreign capital investment, for example a $120float glass plant facility owned by Guardian Industries [5]. Hungary and other Eastern Europeancountries had instituted more open, cooperative investment opportunities. Romania’s foreign investmentnumbers could have been swayed greatly if any large investments had occurred, but most foreigninvestment in Romania has, and continues to be, mid size or smaller investments.
Since the 1990 Revolution, Direct Foreign has increased year by year but not at an increasing rate. TableOne shows the total Investment, the year by increases, and percent changes [1]. Since investmentamounts are so small any major investment project will have a major impart on the investment picture. In1993, South Korea was not in the top ten. With Daewoo’s automotive and service investment, Koreareached the top ten in 1994. Netherlands’s Shell Oil and Agricultural Equipment capital input bumpedSouth Korea to number 3 in 1996 [6]. One consistent investor has been Germany. Cultural ties withTransylvania, Germany’s proximity, and aggressive foreign investment policy have propelled Germany tothe top three investors in dollars and number of firms. As a region, Western Europe amounted to 59% ofthe total dollar investment.
TABLE ONEFOREIGN DIRECT INVESTMENT (US$m)IN ROMANIA FROM 1990 TO 1996
Year CumulativeInvestment
YearlyInvestment
% CumulativeIncrease
% ChangeInvestment
1990 106.7 - - -1991 255.4 148.7 139.4% -1992 562.8 307.4 120.4% 106.7%1993 719.2 156.4 27.8% -49.1%1994 1,287.4 568.2 79.0% 263.3%1995 1,600.2 312.8 24.3% -45.0%1996 2,208.7 608.5 38.0% 94.5%Average % Yearly Growth Since 1990 to 1996 - 65.7%
Based on the number of companies, the middle east had the biggest contribution. But on a total dollarinvestment the middle east is only six percent. Considering the level of Romania Direct ForeignInvestment, who are the major contributors?
Because of the small yearly investments, countries can change rankings from year to year in totalinvestment. For 1996, The Netherlands was the top investor. But the advantage of the Netherlands overGermany was only by 50 Million dollars and South Korea by about 60 Million dollars. The United Stateswas sixth and about 100 Million dollars below the Netherlands.
On the number of companies basis, Italy was the leader. The middle east was well represented by Turkey,Syria, Jordan, Iraq, and Lebanon. Ninth place was reserved for the United States. It seems the middle eastinvestment is by small companies in retailing and no major capital influx is made. Romania’s proximityto the Middle East and its previous relations have continued in the democratic economic environment.
The United States investments have been in consumer items and some aircraft related joint ventures.Coke, Pepsi, McDonalds, and Proctor and Gamble are well know brands. These companies aretraditionally risk takers and have large capital reserves. Another factor for the American lower investment

picture is the long gap in the most favored nations treaty. Ceaucescu regime dropped the treaty in the mideighties. It was a long time before it was reiinstituted.
TABLE TWOCOUNTRIES INVESTING IN ROMANIA, 1990-1997 (July)RANKED BY CAPITAL AND BY NUMBER OF FIRMS
No. Country Capital ($1,000) No. Country Number of Firms1 Netherlands 294,624.15 1 Italy 5,9132 Germany 242,656.96 2 Germany 5,7563 South Korea 235,036.68 3 Turkey 4,7324 France 225,120.66 4 Syria 4,5075 Italy 197,152.84 5 China 3.9046 United States 193,764.49 6 Iraq 2,8837 Britain 133,966.08 7 Lebanon 2,6498 Turkey 124,389.12 8 Jordan 2,5389 Luxembourg 94,861.30 9 United States 2,33310 Austria 87,414.85 10 Iran 2,296Total Investment 2,578,493.00 Number of Firms 55,694
CONCLUSIONS
America’s investment in Romania lags behind Western Europe in total investment and behind The MiddleEast in the number of companies. Interest in Romania has increased with the change in government. WithPresident Clinton’s visit and the favorable Investment laws, America’s investment will increase. In a fewshort years America should be near the top in total Investment.
REFERENCES
[1] “Annual Report 1997,” Internet, www.rda.ro, 1997.
[2] “Exchange Rates." Internet, www.romaniabusiness.corr4 1997.
[3] "Foreign Direct Investments." Internet, www.romaniabusiness.com. 1997.
[4] "Foreign Investment in Romania at the End of 1995." Internet, www.rda, 1996.
[5] Johnson, Russell. "Hungary: New Investment Frontier." Business America, Oct. 7, 1991, 2.
[6] “Shell to strengthen presence in Romania." Reuters’s Limited , 1995.
THE IMPACT OF A CROSS-CULTURAL FACULTY ON INTERNATIONAL TOPICS IN BUSINESSEDUCATION: EXPLORING STUDENTS’ PERCEPTIONS
Juan Santandreu, Lander University, Greenwood, SC 29649 [email protected] Sup Chang, Lander University, Greenwood, SC 29649 [email protected]
Stephanie C. Smith, Lander University, Greenwood, SC 29649 [email protected]
ABSTRACT
Graduate business students of American universities must be prepared to conduct business in a globaleconomy; consequently, universities are changing curricula and approaches in teaching to meet this chal-lenge. The purpose of this exploratory study is to investigate the impact of faculty members’ culturalbackgrounds on American business students’ perceptions and understanding of international issues pre-sented in classes. The findings indicate that students do have an overall positive perception and under-standing of international issues presented in business-related classes by faculty of varied cultural back-grounds.
INTRODUCTION
American businesses must develop strategies for survival and prosperity in the extremely competitiveglobal economy, and businesspersons must comprehend clearly the complications and procedures of con-ducting business internationally. “Knowledge of other cultures is a vital component of managementjudgment in international business.”[2] To prepare university business students for the global workplace,educators now stress the importance of international business through requirements by accrediting organi-zations, such as the AACSB; through curriculum offerings; and through the integration of internationalmaterial into existing classes.
These writers believe that in addition to the formal methods, faculty members with different culturalbackgrounds informally convey knowledge and understanding of their particular cultures and of their per-spectives on international material to students through official and unofficial interactions. Terpstra notesthat “Socialization is cultural learning,” and that some socialization is explicit, verbal, and intended by theinstructor. “Other socialization is latent: implicit, often nonverbal, often unintended by the professor.”[3]Yoshida and Brislin propose four basic components of good cross-cultural training: “(1) awareness, (2)knowledge, (3) emotional challenges, and (4) skill/behaviors.”[4] Through interactions in and out ofclasses, students enhance their understanding of the environment of international business, includingbusiness practices, cultures, value systems, behavioral patterns, religions, ethics, and life styles.
Three faculty members with different cultural backgrounds were part of this study. Professor A, origi-nally from South Korea, has an Oriental cultural background. Professor B, originally from Venezuela,has a Latin American or Hispanic cultural background. Professor C is an eighth-generation American.
The Silent Language
Edward Hall urged American businesspersons in international business to use the silent language, the lan-guage of culture.[1] He indicated that this approach was the only way to survive and prosper in the envi-ronment of international business.
The use of the silent language is important today because of the intensive process of globalization of theworld economy. The silent language will help American businesspersons overcome their ethnocentrism,

a critical issue in the global economy. Ethnocentrism restricts the flexibility that American businessper-sons have in the global economy and is a clear hindrance to promoting international business by Ameri-can businesspersons.
Some American college students refuse to learn the silent language by sticking to their ethnocentrism.Faculty members in American higher educational institutions function as catalysts for this silent languageto the American college students. Faculty can help students rise above ethnocentrism, learn to use thesilent language, and gain a better understanding of various cultures.
METHODOLOGY
A questionnaire was designed to investigate the students’ perceptions on international topics, the impactthat professors with different cultural backgrounds exert on international topics, and how this cultural mixoffer students a unique, broad perspective of international business. The questionnaire included five dif-ferent sections of interest.
The first section included questions intended to uncover student perceptions concerning learning interna-tional topics from faculty of different cultural backgrounds (foreign as well as those of national origin).This section would provide a vision into the silent influence that faculty with different cultural back-grounds exert in the internationalization process.
The second section of the questionnaire examined the extent of relevance or importance students assign tointernational perspectives related to each particular business topic. This section would investigate in whatbusiness topics (i.e., accounting, marketing) students consider more relevant to learning the internationalcomponent.
The third section concentrates on identifying the relevance that students attach to international issues asthey relate to particular subjects. This section would provide information on the significance that interna-tional issues have on specific subjects (i.e., ethics, behavioral issues) that permeate all business topics anddifferent disciplines.
The fourth section of the instrument included questions intended to examine the students’ level of interestin learning about different business environments (i.e., socio-cultural, economic, political) in other coun-tries. In addition, this section included items intended to measure the level of students’ interest in learn-ing another language as a second language, and a more challenging scenario—in moving to anothercountry to learn directly from the source. This section would provide information on the relevance ofbusiness environments as perceived by students, as well as their interest in foreign languages and foreignexperience. Finally, the fifth section of the instrument includes a brief demographic profile identifyingspecific student characteristics.
The classical five-point Likert scale was used for the first three sections to indicate levels of agreement ordisagreement with each of the items. A five-point scale was also used for the fourth section to denotevarious degrees of student interest. The last section included multiple choice and dichotomous questionson general demographic information.
Sampling
Because of the exploratory nature of the present study, a convenience sample of three undergraduatebusiness classes (two of them with two sections) was selected. These five sections were selected becausethey were taught by faculty with three different cultural backgrounds: American, Korean, and LatinAmerican. At this exploratory stage the main interest was twofold: first, to be able to test and refine the
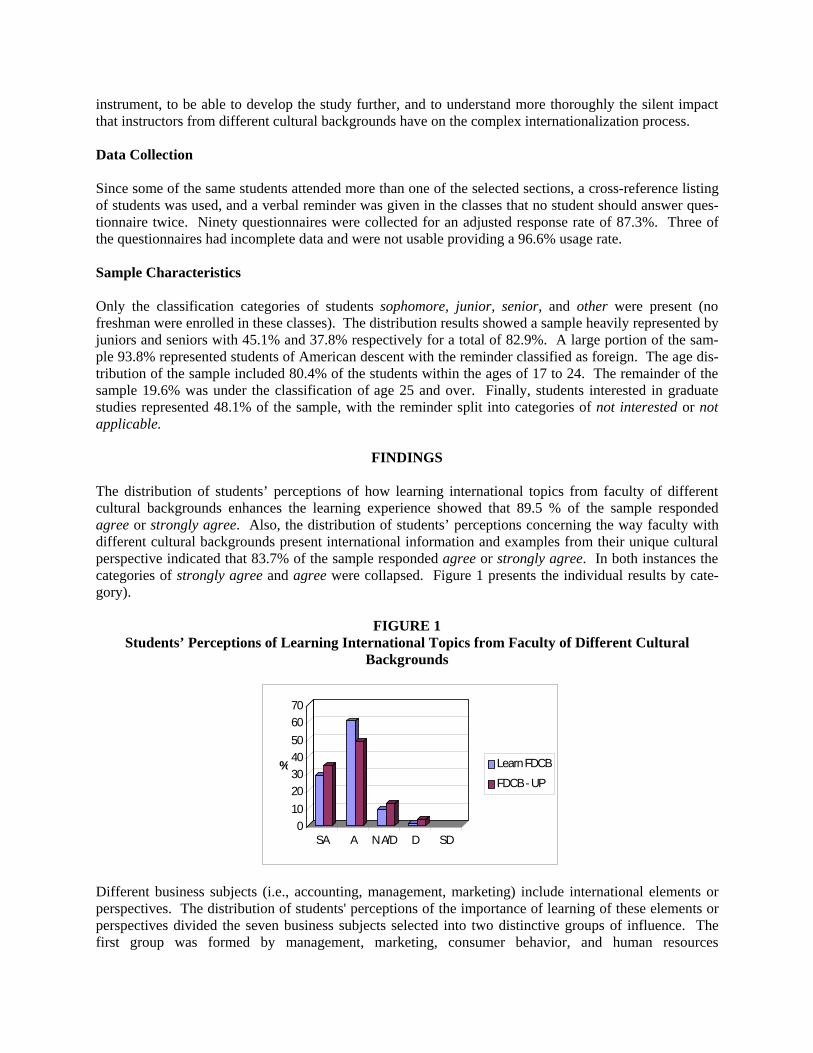
instrument, to be able to develop the study further, and to understand more thoroughly the silent impactthat instructors from different cultural backgrounds have on the complex internationalization process.
Data Collection
Since some of the same students attended more than one of the selected sections, a cross-reference listingof students was used, and a verbal reminder was given in the classes that no student should answer ques-tionnaire twice. Ninety questionnaires were collected for an adjusted response rate of 87.3%. Three ofthe questionnaires had incomplete data and were not usable providing a 96.6% usage rate.
Sample Characteristics
Only the classification categories of students sophomore, junior, senior, and other were present (nofreshman were enrolled in these classes). The distribution results showed a sample heavily represented byjuniors and seniors with 45.1% and 37.8% respectively for a total of 82.9%. A large portion of the sam-ple 93.8% represented students of American descent with the reminder classified as foreign. The age dis-tribution of the sample included 80.4% of the students within the ages of 17 to 24. The remainder of thesample 19.6% was under the classification of age 25 and over. Finally, students interested in graduatestudies represented 48.1% of the sample, with the reminder split into categories of not interested or notapplicable.
FINDINGS
The distribution of students’ perceptions of how learning international topics from faculty of differentcultural backgrounds enhances the learning experience showed that 89.5 % of the sample respondedagree or strongly agree. Also, the distribution of students’ perceptions concerning the way faculty withdifferent cultural backgrounds present international information and examples from their unique culturalperspective indicated that 83.7% of the sample responded agree or strongly agree. In both instances thecategories of strongly agree and agree were collapsed. Figure 1 presents the individual results by cate-gory).
FIGURE 1Students’ Perceptions of Learning International Topics from Faculty of Different Cultural
Backgrounds
Different business subjects (i.e., accounting, management, marketing) include international elements orperspectives. The distribution of students' perceptions of the importance of learning of these elements orperspectives divided the seven business subjects selected into two distinctive groups of influence. Thefirst group was formed by management, marketing, consumer behavior, and human resources
010
20304050
6070
%
SA A N A/D D SD
Learn FDCB
FDCB - UP
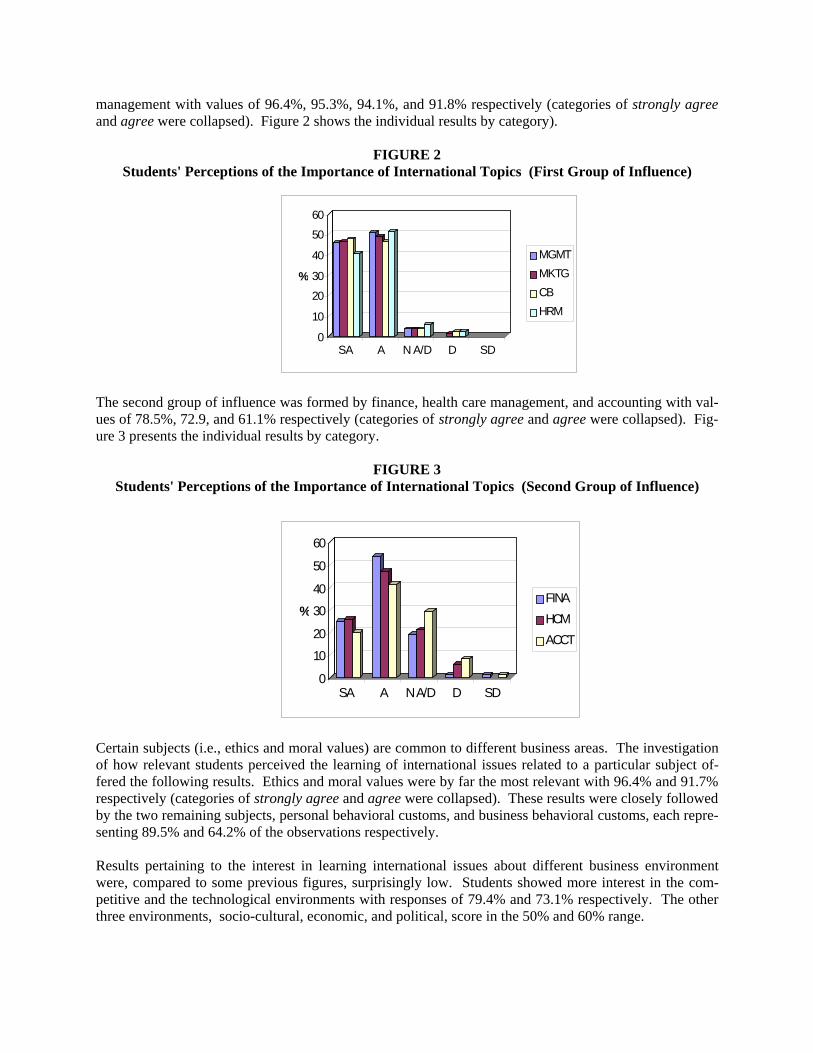
management with values of 96.4%, 95.3%, 94.1%, and 91.8% respectively (categories of strongly agreeand agree were collapsed). Figure 2 shows the individual results by category).
FIGURE 2Students' Perceptions of the Importance of International Topics (First Group of Influence)
The second group of influence was formed by finance, health care management, and accounting with val-ues of 78.5%, 72.9, and 61.1% respectively (categories of strongly agree and agree were collapsed). Fig-ure 3 presents the individual results by category.
FIGURE 3Students' Perceptions of the Importance of International Topics (Second Group of Influence)
Certain subjects (i.e., ethics and moral values) are common to different business areas. The investigationof how relevant students perceived the learning of international issues related to a particular subject of-fered the following results. Ethics and moral values were by far the most relevant with 96.4% and 91.7%respectively (categories of strongly agree and agree were collapsed). These results were closely followedby the two remaining subjects, personal behavioral customs, and business behavioral customs, each repre-senting 89.5% and 64.2% of the observations respectively.
Results pertaining to the interest in learning international issues about different business environmentwere, compared to some previous figures, surprisingly low. Students showed more interest in the com-petitive and the technological environments with responses of 79.4% and 73.1% respectively. The otherthree environments, socio-cultural, economic, and political, score in the 50% and 60% range.
0
10
20
30
40
50
60
%
SA A N A/D D SD
FINA
HCM
ACCT
0
10
20
30
40
50
60
%
SA A N A/D D SD
MGMT
MKTG
CB
HRM

CONCLUSIONS AND RECOMMENDATIONS
Students have a relatively high positive perception of the importance of learning international topics fromfaculty of different cultural background because their learning experiences are enhanced by the faculty’sunique cultural perspectives in presenting such topics. Educators in international and global topics shouldkeep in mind the positive silent influences that faculty of different cultural backgrounds have in develop-ing sound international knowledge that will serve the students in this new and more difficult environment.
A clear division is apparent among the students’ perceptions of the importance of international aspects inrelation to specific business topics. Students assign a high relevance to subjects such as management,marketing, consumer behavior, and human resource management while considering less pertinent thesubjects of finance, health care management, and accounting. This finding provides an indication that theperceived high relevant subjects should continue to emphasize international aspects to preserve the link ofthe topic with the appropriate international issues. Accordingly, faculty from the perceived low relevantsubjects should reinforce their efforts of linking their respective topics to international issues. This effortwould make students more aware of the way various international topics relate to particular areas of busi-ness.
Results related to the relevance of international issues as it refers to particular subjects provide a clearpoint of reference to faculty when dealing with ethical issues and moral values in their respective areas.Faculty should make a strong effort in showing the connection of international issues to the above sub-jects. More importantly, it becomes even more relevant to establish stronger international links with thesubjects of personal behavioral customs and business behavioral customs since these two subjects arepredominant in the understanding of international issues that could significantly affect business.
On the issue of importance attributed to the learning of international issues as they relate to a particularbusiness environment, the results demonstrate the need of emphasizing the significance of business envi-ronments and the impact of international issues affecting them.
The findings indicate that students do have an overall positive perception of the way faculty with differentcultural backgrounds address international issues in business related classes. Students recognize the valueof presenting international issues from the unique perspective that reflects each faculty’s cultural diver-sity. The silent influence that cross-cultural faculty exerts helps to extend the international knowledge tothose that would have to survive in the more complex global environment; nevertheless, much work muststill be accomplished. Business faculty must continue to strive for the creation of the appropriate links ofsubject matter with the international issues that surround their respective disciplines. More emphasis isalso necessary to make business students more aware of the relevance of international issues as they per-tain to the different areas of study. In addition, more work is necessary to assure that the different busi-ness environments receive proper attention. Business faculty should increase efforts to provide strongcoverage of the business environments, highlighting the importance that each one has in the businessscheme and the way international issues affect them.
This exploration should lead to a more in-depth evaluation of the role that cross-cultural faculty play assilent leaders of the process of internationalization. Future research could take a sectional approach toeach one of the issues to provide a better understanding of the internationalization process and how toprepare students for the dramatic changes still to occur.

REFERENCES
[1] Hall, E. T. The Silent Language. New York: Doubleday & Company, Inc., 1959.[2] Lane, H. W. and DiStefano, J. J. International Management Behavior Scarborough, Ontario, Can-
ada: Nelson Canada, 1988.[3] Terpstra, V. and David, K. The Cultural Environment of International Business, 2nd ed. Cincinnati,
OH: South-Western Publishing Co., 1985.[4] Yoshida, T. and Brislin, R. W. "Intercultural Skills and Recommended Behaviors: The Psychologi-
cal Perspective for Training Programs," in Shenkar, O. Global Perspectives of Human ResourceManagement. Englewood Cliffs, NJ: Prentice Hall, 1995, 112-131.

TRACK: Manag ement and Strategy
"" BBeehhiinndd SSmmii ll iinngg FFaacceess:: WWoommeenn aanndd RRaacciiaall //EEtthhnniicc MM iinnoorr ii tt iieess'' EExxppeerr iieenncceess ooff II nnsstt ii ttuutt iioonnaall aanndd SSoocciiaallII ssoollaatt iioonn""
JJaanniiccee WWii tttt SSmmii tthh,, NNoorrtthh CCaarrooll iinnaa AA && TT SSttaattee UUnniivveerrssii ttyyTToonnii CCaallaassaannttii ,, VVii rrggiinniiaa TTeecchh
"" SSeeaarr ss iinn tthhee 11993300'' ss:: TThhee GGrr eeaatt DDeepprr eessssiioonn aanndd MM aannaaggiinngg SSttaakkeehhoollddeerr II nntteerr eessttss""WWii ll ll iiaamm PP.. DDaarrrrooww,, TToowwssoonn SSttaattee UUnniivveerrssii ttyyRRaayymmoonndd DD.. SSmmii tthh,, HHoowwaarrdd UUnniivveerrssii ttyy
"" MM eennttoorr iinngg:: DDooeess II tt HHaavvee AAnn EEqquuaall II mmppaacctt AAccrr oossss TThhee RRaacceess AAnndd GGeennddeerr ss??""JJaanniiccee WWii tttt SSmmii tthh,, NNoorrtthh CCaarrooll iinnaa AA && TT SSttaattee UUnniivveerrssii ttyySStteevveenn EE.. MMaarrkkhhaamm,, VVii rrggiinniiaa TTeecchh
"" RReeffooccuusseedd aanndd RReessttrr uuccttuurr eedd:: UUssiinngg MM aannaaggeerr --ttoo--MM aannaaggeerr MM eennttoorr iinngg TTeeaammss ttoo II nnff ii ll tt rr aattee aa NNeewwCCoorr ppoorr aattee Mission"
MDDeebboorraahh WWrriigghhtt BBrroowwnn,, LLoonngg IIssllaanndd UUnniivveerrssii ttyyGGrreeggoorryy MM.. KKeell llaarr,, LLoonngg IIssllaanndd UUnniivveerrssii ttyy
"" TThhee YYeeaarr 22000000 PPrr oobblleemm:: II nnsstt ii ttuutt iioonnaall aanndd OOrr ggaanniizzaatt iioonnaall EEccoollooggyy PPeerr ssppeecctt iivveess""AAllaann RR.. CCaannnnoonn,, CClleemmssoonn UUnniivveerrssii ttyyAAmmyy BB.. WWoosszzcczzyynnsskkii ,, CClleemmssoonn UUnniivveerrssii ttyy
Behind Smiling Faces: Institutional and Social Isolation
1
BEHIND SMILING FACES: WOMEN AND RACIAL/ETHNIC MINORITIES’EXPERIENCE OF INSTITUTIONAL AND SOCIAL ISOLATION
Janice Witt Smith, Department of Business Administration, North Carolina Agricultural and TechnicalState University, Greensboro, North Carolina 27411
Toni Calasanti, Department of Sociology, Virginia Tech, Blacksburg, VA 24061
ABSTRACT
Racial/ethnic minorities have numerous organizational and societal barriers to their success; and theirobjective outcomes continue to lag behind their Caucasian counterparts. Even objectively successfulindividuals subjectively experience the organization differently based on their race/ethnicity and/or gender.These results confirming the experience of institutional and social isolation suggest this as a fruitful line offurther inquiry into differential work experiences.
BACKGROUND
While the context and dynamics have changed over time, the United States has faced the challenges ofdealing with a culturally diverse society and workforce. At present, business organizations especiallyneed to address diversity because (1) it makes good business sense to fully utilize the capabilities of allorganizational members; and (2) a myriad of governmental regulations have serious consequences,financially and otherwise, if one demonstrates that there is differential treatment of individuals inorganizations based on immutable characteristics such as race and gender (i.e., Civil Rights Act of l991).Furthermore, the organization must also address the needs of its incumbents whose attitudes and behaviorsimpact and may also be impacted by the influx of minorities and women into the organization. Thepopular press has recently reported on a number of major national corporations who have failed toadequately ensure equitable treatment of their minority (racial/ethnic and gender) population and havefound themselves enmeshed in litigation and public boycotts of their products (e.g., State Farm Insurance,gender discrimination, costing $52 million in settlement; Texaco, race discrimination, resulting in $176million settlement; Circuit City, "glass ceiling", settlement pending). Occurring simultaneously is themovement by city governments (in Louisiana) and voters in California (and elsewhere) to end affirmativeaction, via "Proposition 209", resulting in a number of lawsuits by civil rights groups. While the objectiveevidence indicates that discrimination does exist in organizations, the subjective notion of a number ofindividuals (such as the California voters) is that race and gender discrimination have been eradicated. It iswithin this tumultuous and oftentimes contradictory environment that organizations find themselvesoperating.
A number of studies indicate that while more women and minorities are hired, their relative standing inbusiness organizations (Final Report on the Glass Ceiling, DOL: 1995; Initiative on the Glass Ceiling,DOL: 1991) and government or educational institutions has changed little [Morrison & Von Glinow(1990), cf. U.S. Office of Personnel Management, 1989]. For African-Americans, Asian-Americans andHispanic-Americans, the results are equally dismal (Cabezas, Tan, Lowe, Wong & Turner, 1989; Cho,1995; Greenhaus, Parasuraman & Wormley, 1990; Lan, 1988). These studies indicate that women andminorities are encountering a number of impediments to their upward career mobility, despite their job-related qualifications and preparation for successful organizational experiences. These impediments mayinclude limited access to sources of power within the organization; not being privy to the same informationnetwork as their male (and/or Caucasian) counterparts; or having their performance perceived differentlybecause of their race and gender.

Behind Smiling Faces: Institutional and Social Isolation
2
Importantly, it appears as if even those who do "achieve" still experience workplace difficulties. Nkomoand Cox (1991) examined the experiences of African-American MBAs and found that while they hadattained some objective measures of success within their organizations, these MBAs did not feel,subjectively, as if they belonged in the organization. Their entree into the organization, even theirinvolvement in informal interracial social activities, availed them little in terms of their perceptions ofbeing a part of the organization. Similarly, Ibarra (1992) found that minorities who engage in informalsocial interaction with their Caucasian counterparts reap little career or psychosocial benefit from theinteraction and may even find themselves worse off than before. Thus, it may also be that, subjectively,racial/ethnic minorities find that "more" is needed for them to be considered full-fledged organizationalmembers. What the nature of the "more" is, however, is not clear. To be sure, women and racial/ethnicminorities do not reap the same objective rewards as their male Caucasian counterparts, for their capitalinvestments, such as education, training, and prior experience (Higginbotham, 1987).
It is this contradictory context that provides the impetus for our study, where the experience of making thenecessary capital investment to be a success in organizations conflict with the subjective reality of theorganizational experience. Specifically, we want to examine an "objectively successful" group ofindividuals - university faculty - to explore what effect, if any, race and gender have on an individual'ssense of institutional and social isolation.
Isolation
Isolation, as conceptualized in this research, expands on prior conceptualizations of general isolation(Seeman, 1959) and Srole's (1956) definition of anomie [commonly thought to be social isolation] byexamining whether isolation has two separate dimensions, institutional isolation and social isolation.Unlike Srole's and Seeman's conceptualizations of isolation, however, the thesis of this work is not thatindividuals experience valuelessness of work nor ignorance of nor lack of adherence to group standards.Rather, it applies Durkheim's (1951) concept of psychological isolation to individuals within anorganizational framework. Alienation looks at individuals in a broader societal sense, in which therelationship is considered less voluntary and more permanent than an employment relationship, since onecannot easily remove oneself as a societal member. The focus of institutional and social isolation looks ata more voluntary relationship of the individual with the organization, where members and the organizationhave selected each other and co-exist in a relatively at-will relationship. The constraints upon behavior areorganization-specific and may or may not be consistent with broader societal expectations or constraints.The examination of this study considers the fundamental issue of how individuals interact withorganizations so that certain individuals experience the organization differently from others and feelseparate and apart from his or her peers and superiors on both institutional and social bases. Furthermore,this paper posits that these feelings of inclusion and/or exclusion can be measured.
Institutional Isolation
The construct of institutional isolation has not previously been specifically defined in the literature.However, a number of studies examining the upward mobility of women in organizations and those thatcall for improved socialization prac6ces such as mentoring suggest that women suggest that institutionalisolation does exist. In addition, a studies by Smith and Markham (1997) and Smith, Markham, Madigan& Gustafson (1996) provide support for this conceptualization.
Institutional isolation is defined as (1) the belief one has regarding one's lack of knowledge about, accessto, interaction with and/or utilization of organizational sources of power, prestige, support, and informationcritical to one's success, and (2) the belief that, regardless of one's position, training or educationalbackground, others significant to one's success discount one's opinion unless it is validated by member(s)of the dominant culture. Individuals who experience institutional isolation believe that they are (1)excluded from the decision-making process, (2) have little input into matters which have an impact onthem, and (3) are kept out of the "inner circle" where the power, prestige and influence within theorganization resides.
Behind Smiling Faces: Institutional and Social Isolation
3
Social Isolation
Seeman's (1967) conceptualization of social isolation has been modified to reflect Durkheim's (1951)concept of psychological isolation to individuals within an organizational framework and voluntary at-willemployment relationship. Social isolation refers to a feeling of exclusion that can be manifested in avariety of ways: (1) feeling that one is always singled out, on display, on the fringe, tolerated but notaccepted because of one's racial or gender identity; (2) feeling that one experiences superficiality ofrelationships because others cannot relate to one's experiences; having to be a bridge between cultures andof being required to be bicultural, a translator of one's experiences to other-race/other-gender individuals;feeling representative of entire race or gender; and (3) feeling of being alone; of lacking a social supportnetwork.
Critical to this conceptualization, individuals who feel socially isolated feel that they are cut off fromsources of psychosocial support within the organization. Supportive acts, such as those conceptualized byHouse (1981) in defining a social support network are lacking. In addition, the informal ties within theorganization which might facilitate their success in the organization are also deficient or nonexistent. Thisconceptualization of institutional isolation and social isolation is consistent with alienation literature(Durkheim, 1947; Dean, 1961) which suggests that individuals who are not the owners of the factors ofproduction feel attitudinally and structurally separate and apart within the organization.
Institutional and Social Isolation as Distinct Constructs
Smith and Markham’s (1997) study on institutional isolation presents preliminary evidence that indicatesthat individuals do experience isolation on two dimensions: institutional and social isolation. In addition,the view that institutional and social isolation are two distinct constructs is consistent with Weiss's (1973,1975) work on loneliness. Weiss suggests that an emotionally lonely person is not changed when one addsties to a social group, nor is the presence of an attachment figure helpful for a socially lonely person.These needs are relatively independent and are satisfied differently; therefore, these constructs are onseparate continua. Similarly, it is possible for an organizational member to have numerous friends withinboth the majority and minority friendship cliques, but still feel a sense of isolation from the bases of powerand information that are central to issues of power and control in the organization.
RACE, ETHNICITY, GENDER AND ISOLATION
Race/Ethnicity
According to Cox (1990), two factors limit the amount of research on racial/ethnic groups (which hetermed "racioethnic"). First, there are few scholars who are actively working on these issues, since "whiteAmericans generally do not consider racioethnicity a topic of universal importance. Many still treat it as 'aminority issue'--that is, a matter relevant only to minority group members (190: 6)". Secondly, there aremethodological issues (i.e., small sample sizes, need for non-traditional research designs, social desirabilityeffects in data collection, absence of field cooperation, and the influence of the researcher's racioethnicidentity on the research process) which make this work particularly difficult to pursue. Alderfer andThomas (1988) pointed out that in predominantly white settings, members of racioethnic groups have todeal with race differences which whites choose to overlook or feel are insignificant on their lives. Thus,they argued that just asking a white person to complete a questionnaire in which race issues are coveredcreates discomfort and a negative response to the questionnaire. Still, what research that does exist issuggestive of the impact of race/ethnicity on both dimensions of isolation.
Greenhaus, Parasuraman and Wormley (1990) found that African-American managers felt less accepted intheir organizations (i.e., in terms of this study, experienced social isolation), perceived themselves ashaving less discretion on their jobs, received lower ratings from their supervisors on their job performanceand promotability, were more likely to have reached career plateaus (i.e.. to have encounteredorganizational barriers to advancement; and, thus, in terms of this study, to have experienced institutionalisolation) and to have experienced lower levels of career satisfaction.

Behind Smiling Faces: Institutional and Social Isolation
4
Studies such as those by Ilgen and Youtz (1986) in which they applied in-group, out-group membership toworkplace experiences of Blacks indicated that the individual's minority group status makes it more likelyfor them to be out-group members, thus experiencing the workplace differently than Caucasians. Anexplanation for how this may occur may be found in Messick and Mackie's (1989) discussion of aversiveracism, in which they assert the majority may hold negative views of the minority, but overt racistbehaviors are shunned. The majority group member may psychologically withdraw from the minoritygroup member, which may create an environment in which the minority member is securely placed in anout-group position, leaving him or her institutionally and socially isolated. Indeed, research has found thatminorities, as outgroup members, may not feel accepted as organizational members (African-Americans:Irons & Moore, 1985; Nixon, 1985; Thomas 1990; Asian-Americans: Cho, 1995; women and African-Americans: Rosen, Templeton & Kichline, 1981; Thomas & Alderfer, 1989; Asian-Americans: Cabezas,Tan, Lowe, Wong & Turner, 1989). They may not feel accepted into their organization's informal orformal networks (Ilgen & Youtz, 1986; Fernandez, 1981), which can, in turn, impede their organizationaladvancement and promotion (Tsui, 1984). Barriers to their success include their exclusion frominformation sources or the informal network and a lack of mentors and role models (Irons & Moore, 1985;Cabezas et al., 1989) -- institutional isolation.
As we noted, Nkomo and Cox (1990) found that African-Americans experienced social rejection in theworkplace, regardless of how successful their career outcomes were. This feeling of rejection would leadto them feeling socially isolated. Braddock and McPartland (1987) further suggested that African--Americans have been denied equal access to the most valuable informal sources of job information, thusthey feel institutionally isolated. Social and political networks in organizations provide faculty withinformation and resources for getting their jobs done, knowing when research and consulting opportunitiesare available, and providing support when choices are made about tenure. However, African-Americansrely on the formal system, rather than informal networks (Dickens & Dickens, 1987; Tsui, 1984). Becausethey are usually tied to social networks composed of other African-Americans who, on average, are not aswell placed as Caucasians in the workplace, they have limited information, which results in their feelinginstitutionally isolated.
In general, African-Americans, Hispanic-Americans and Asian-Americans feel they have less access toorganizational information, power, influence and prestige; have less psychosocial support; and do not feelthey fit into the organization to the same extent as their Caucasian-American counterparts. The way thatthis study differs is that here we are interested in not just lumping minorities and nonminorities as a group,but also to focus on groups that seem objectively the same. Do we still see these differences in feelings ofisolation; do they fall along these two dimensions; and do they exist among a variety of minority groups?This study frames these experiences in the context of institutional and social isolation, for those individualswho have "done the right things" but who still do not feel a part of the organization. This study posits thatinstitutional and social isolation exist and are experienced differently by minorities than by Caucasians.Therefore,
HI: African-Americans, Hispanic-Americans, and Asian-Americans feel more institutionally and socially isolated than their Caucasian counterparts.
Gender
Mentoring literature and socialization research document that women have more barriers to theirorganizational entry and success than their male counterparts (Ilgen & Youtz, 1986; Kram, 1985; Noe,1988a, 1988b; Ragins, 1989; Ragins & Sundstrum, 1989). Because of such organizational obstacles totheir success and lack of promotional opportunity, women may experience the organization differently andmay thus develop different attitudes toward the organization than men (Gomez-Mejia, 1983; Jones, 1983;1986; Louis, 1980; Van Maanen & Schein, 1979). Women may feel that they have less neededinformation, less access to decisionmakers and more barriers to their success than their male counterparts.Indeed, while women experience a glass ceiling, men experience a glass escalator which serves toaccelerate their career mobility when they are located in female-dominated occupations Williams (1992).Even when men and women have made the same preparations for their careers, through educational andcareer training experiences, their subjective and objective outcomes are not the same. Human capitalinvestments for women do not yield the same return as those same investments for men (Brett, Stroh &

Behind Smiling Faces: Institutional and Social Isolation
5
Reilly, 1990). Therefore, within the organizational context, we will explore whether or not women, onaverage, feel more institutionally and socially isolated than do men.
H2: Women experience higher levels of institutional and social isolation than men.
Race and Gender
Importantly, the past study of race or gender did not allow for the examination of the joint experiences ofindividuals who belong to both minority groups and may be simultaneously oppressed. In general, thefailure to examine the interaction of race and gender may render the examination of organizationalexperiences and, in particular, socialization practices ineffectual (Betters-Moore & Reed, 1992a and1992b; Hull, Scott & Smith, 1982), because the combination of race and gender may have a different effectthan either of them alone. For example, as Spelman (1988) succinctly notes, if we view an African-American woman as "merely" African-American or female, we unintentionally exclude her. As a result,our understanding of her experiences and that of "others" is severely limited. In Bell's (1986, 1990)examination of bicultural stress, for example, she found that African-American women experience it to agreater extent than do Caucasian women. In fact, the combination of race and gender appears to have agreater effect on stress than does the gender alone. The experience of women, when women are seen asCaucasian women, may be very different from the experience of African-American, Asian-American orHispanic-American women. In fact, the experiences of each of the minority group's women may alsodiffer from one another. importantly, even when objective outcomes such as wages are similarlyexperienced among different groups of racial/ethnic women, this does not mean that the sources of theseare the same or that similar sources or outcomes are experienced the same.
Historically, there have been two approaches used to understand the impact of race and sex on African-American women (Smith and Stewart 1987). One model is the cumulative effect model, which views raceand sex as additive variables (the "two-fer theory", which argued that the combination of the two variablesis positive; and the "double-whammy" theory, which argued that the resultant effect is negative). Thesecond model is that race and gender are parallel processes and operate in the same way. In this study, theeffects of race and gender were not the same; thus, there is little support that they operate in the samefashion (Fulbright, 1986; Higginbotham, 1987; Nkomo & Cox, 1990). Therefore, one cannot examineonly race or gender or make assumptions about double minorities based on the experiences of womenalone. Secondly, Higginbotham (1987) has demonstrated that, counter to the two-fer theory, the capitalinvestments of African-Americans and Caucasians -- and between Asian-Americans and Caucasians(Cabezas et al., 1989) -- do not yield the same return. Moreover, the investments of Caucasian womenversus African-American women result in different returns, with Caucasian women reaping higherbenefits. Thus, there is no support for the two-fer theory.
H3: African-American women experience higher levels of institutional and social isolation than any otherracial/ethnic minority or gender group.
If individuals experience institutional and social isolation differently because of their racial or genderidentities, then organizations may need to develop interventions which ameliorate these feelings. Theremay be a relationship between the individual's perception of belonging and his or her desire to remain loyalto and a member of the organization. It is not only the individual's race and gender which are salient,however, since the individual interacts with the organizational environment. If there are differences basedon racial/ethnic identity or gender, the organizational context in which the individual is working may itselfbe racialized and gendered. Exploring the social and institutional isolation might illuminate some of theexperiences which disenfranchise organizational members. If individuals experience isolation at the samelevels, irrespective of race or gender, then further examination of the organization's culture may need to beconducted and appropriate organizational development designed.
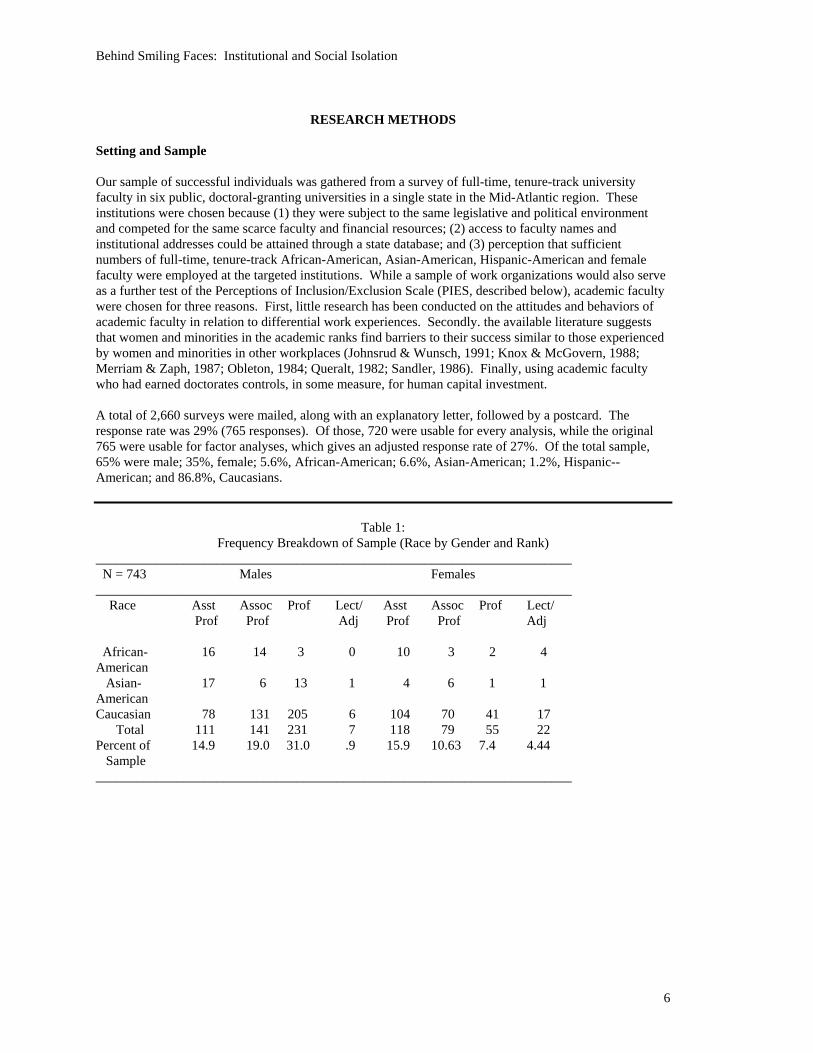
Behind Smiling Faces: Institutional and Social Isolation
6
RESEARCH METHODS
Setting and Sample
Our sample of successful individuals was gathered from a survey of full-time, tenure-track universityfaculty in six public, doctoral-granting universities in a single state in the Mid-Atlantic region. Theseinstitutions were chosen because (1) they were subject to the same legislative and political environmentand competed for the same scarce faculty and financial resources; (2) access to faculty names andinstitutional addresses could be attained through a state database; and (3) perception that sufficientnumbers of full-time, tenure-track African-American, Asian-American, Hispanic-American and femalefaculty were employed at the targeted institutions. While a sample of work organizations would also serveas a further test of the Perceptions of Inclusion/Exclusion Scale (PIES, described below), academic facultywere chosen for three reasons. First, little research has been conducted on the attitudes and behaviors ofacademic faculty in relation to differential work experiences. Secondly. the available literature suggeststhat women and minorities in the academic ranks find barriers to their success similar to those experiencedby women and minorities in other workplaces (Johnsrud & Wunsch, 1991; Knox & McGovern, 1988;Merriam & Zaph, 1987; Obleton, 1984; Queralt, 1982; Sandler, 1986). Finally, using academic facultywho had earned doctorates controls, in some measure, for human capital investment.
A total of 2,660 surveys were mailed, along with an explanatory letter, followed by a postcard. Theresponse rate was 29% (765 responses). Of those, 720 were usable for every analysis, while the original765 were usable for factor analyses, which gives an adjusted response rate of 27%. Of the total sample,65% were male; 35%, female; 5.6%, African-American; 6.6%, Asian-American; 1.2%, Hispanic--American; and 86.8%, Caucasians.
Table 1:Frequency Breakdown of Sample (Race by Gender and Rank)
_______________________________________________________________________ N = 743 Males Females_______________________________________________________________________ Race Asst Assoc Prof Lect/ Asst Assoc Prof Lect/
Prof Prof Adj Prof Prof Adj
African- 16 14 3 0 10 3 2 4American Asian- 17 6 13 1 4 6 1 1AmericanCaucasian 78 131 205 6 104 70 41 17 Total 111 141 231 7 118 79 55 22Percent of 14.9 19.0 31.0 .9 15.9 10.63 7.4 4.44 Sample_______________________________________________________________________
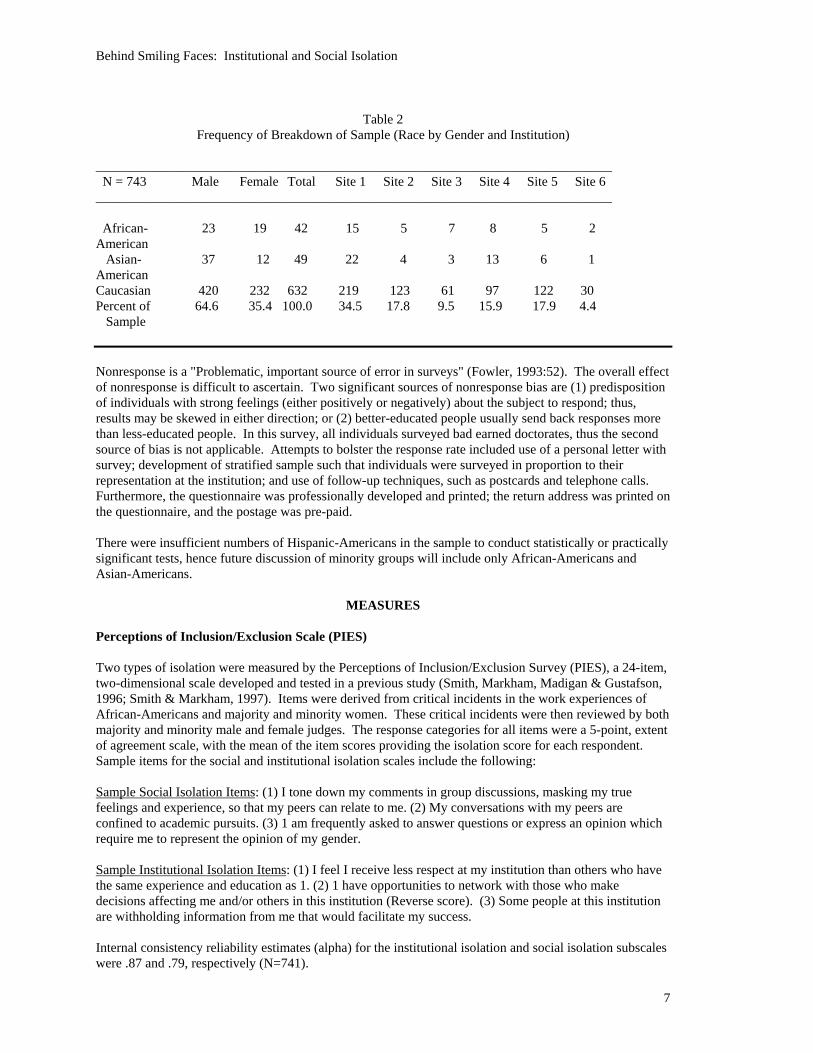
Behind Smiling Faces: Institutional and Social Isolation
7
Table 2Frequency of Breakdown of Sample (Race by Gender and Institution)
_____________________________________________________________________________ N = 743 Male Female Total Site 1 Site 2 Site 3 Site 4 Site 5 Site 6_____________________________________________________________________________
African- 23 19 42 15 5 7 8 5 2American Asian- 37 12 49 22 4 3 13 6 1AmericanCaucasian 420 232 632 219 123 61 97 122 30Percent of 64.6 35.4 100.0 34.5 17.8 9.5 15.9 17.9 4.4 Sample
Nonresponse is a "Problematic, important source of error in surveys" (Fowler, 1993:52). The overall effectof nonresponse is difficult to ascertain. Two significant sources of nonresponse bias are (1) predispositionof individuals with strong feelings (either positively or negatively) about the subject to respond; thus,results may be skewed in either direction; or (2) better-educated people usually send back responses morethan less-educated people. In this survey, all individuals surveyed bad earned doctorates, thus the secondsource of bias is not applicable. Attempts to bolster the response rate included use of a personal letter withsurvey; development of stratified sample such that individuals were surveyed in proportion to theirrepresentation at the institution; and use of follow-up techniques, such as postcards and telephone calls.Furthermore, the questionnaire was professionally developed and printed; the return address was printed onthe questionnaire, and the postage was pre-paid.
There were insufficient numbers of Hispanic-Americans in the sample to conduct statistically or practicallysignificant tests, hence future discussion of minority groups will include only African-Americans andAsian-Americans.
MEASURES
Perceptions of Inclusion/Exclusion Scale (PIES)
Two types of isolation were measured by the Perceptions of Inclusion/Exclusion Survey (PIES), a 24-item,two-dimensional scale developed and tested in a previous study (Smith, Markham, Madigan & Gustafson,1996; Smith & Markham, 1997). Items were derived from critical incidents in the work experiences ofAfrican-Americans and majority and minority women. These critical incidents were then reviewed by bothmajority and minority male and female judges. The response categories for all items were a 5-point, extentof agreement scale, with the mean of the item scores providing the isolation score for each respondent.Sample items for the social and institutional isolation scales include the following:
Sample Social Isolation Items: (1) I tone down my comments in group discussions, masking my truefeelings and experience, so that my peers can relate to me. (2) My conversations with my peers areconfined to academic pursuits. (3) 1 am frequently asked to answer questions or express an opinion whichrequire me to represent the opinion of my gender.
Sample Institutional Isolation Items: (1) I feel I receive less respect at my institution than others who havethe same experience and education as 1. (2) 1 have opportunities to network with those who makedecisions affecting me and/or others in this institution (Reverse score). (3) Some people at this institutionare withholding information from me that would facilitate my success.
Internal consistency reliability estimates (alpha) for the institutional isolation and social isolation subscaleswere .87 and .79, respectively (N=741).

Behind Smiling Faces: Institutional and Social Isolation
8
To analyze hypotheses calling for tests of mean differences on the institutional isolation and socialisolation (PIE) subscales, a general linear model analysis of variance procedure (GLM ANOVA) wasemployed, followed by Tukey's HSD or Dunnett's post hoc analyses. Because a number of hypotheses aretested, the researchers needed to ensure that they maintained the probability of making any Type I errors atalpha, thus controlling the experiment-wise or analysis-wise alpha level. After a complete set ofcomparisons among the group means, the probability that this family of conclusions will contain at leastone Type I error is called the family-wise error rate (FW). In general, the family-wise error rate is less thanthe error rate per experiment. Three post hoc procedures were considered in this research to control alphalevels: (1) Duncan's New Multiple Range Test; (2) Tukey's Honestly Significant Difference (HSD) Test;and (3) Dunnett's Test. Only in those cases where the results differ will there be distinctions made betweenthe tests.
Duncan's test allows means that are farther apart in an ordered series to have a larger significance level andresults in a high family-wise error rate. Tukey's Honestly Significant Difference (HSD) Test fixes theexperiment-wise error rate at alpha against all possible null hypotheses, not just the complete nullhypothesis. This test is generally regarded as the best procedure for controlling the familywise error ratewhen one makes all pairwise comparisons among many group means. The Tukey HSD allows one to keepthe maximum FW at alpha no matter how many means are compared. Dunnett's Test allows one tocompare one control treatment and each of several experimental treatments. This test is more powerfulthan Tukey's in that the family-wise error rate is held at or below alpha. However, one is comparing allgroups, individually, against a single mean. It does not reflect whether or not the "treatment" groups aredifferent from one another.
RESULTSRace
The first hypothesis in this set (HI) was tested by mean differences on the institutional isolation and socialisolation (PIE) subscales between the Caucasian, African-American and Asian-American subsamples. Ashypothesized, there was a statistically significant difference, by race, in the level of institutional isolationfelt. Asian-Americans felt more institutionally isolated than Caucasians (2.61 and 2.35, respectively).However, contrary to prediction, African-Americans' level of institutional isolation (2.56) was notsignificantly different from that experienced by Caucasians (2.35).
Table 3:Means, Standard Deviations and Intercorrelations of Scales,
with Cronbach’s Alpha on the Diagonal
_____________________________________________________Variables Mean S. D. N 1 2_____________________________________________________
1. Inscore 2.38 .62 720 [.89]2. Socscore 1.88 .53 725 .53* [.79]______________________________________________________p < .05

Behind Smiling Faces: Institutional and Social Isolation
9
Table 4:Mean Values of Subscales, By Race and Gender
_________________________________________________________________________________ Total African- Asian- P P
Scales Sample Caucasians Americans Americans Value Males Females Value__________________________________________________________________________________
Institutional 2.38 2.35 2.56 2.61* .0024 2.35 2.42 .1755 Isolation Social 1.88 1.83 2.36** 2.07** .0001 1.79 2.03* .0001 Isolation___________________________________________________________________________________p < .05** p < .05 with significant Tukey’s
In general, racial/ethnic groups differed significantly in the level of social isolation felt. As predicted,African-Americans felt more socially isolated (2.36) than Caucasians (1.83); they also differedsignificantly from their Asian-American counterparts (2.07). In addition, Asian-Americans feltsignificantly more socially isolated than Caucasians.
Gender
The second hypothesis was tested by mean differences on the institutional and social isolation (PIES)subscales between the male and female sub-samples, utilizing a simple t-test. As depicted inTable 4, contrary to the prediction, a statistically significant difference in the levels of institutional isolationdid not emerge. However, as predicted, there was a significant difference in the level of social isolation,with females experiencing greater social isolation than males (2.03, 1.79, respectively).
Race and Gender
To test the third hypothesis, a GLM ANOVA was utilized to determine whether African-American womenexperienced higher levels of institutional and social isolation than any other race and gender subgroup.This procedure measured the extent to which there were differences between the other groups and wasfollowed by use of both Tukey's t-test and Duncan's post-hoc analyses, both of which compared all groupsagainst each other. There was a significant difference, by subgroup in the overall model; Duncan's post-hoc test indicated that Asian-American women and African-American women were significantly higher oninstitutional isolation than Caucasian men (2.75, 2.69, and 2.33, respectively). However, the moreconservative Tukey's HSD did not differentiate between Asian-American and African-American womenand any other racial-gender subgroup.
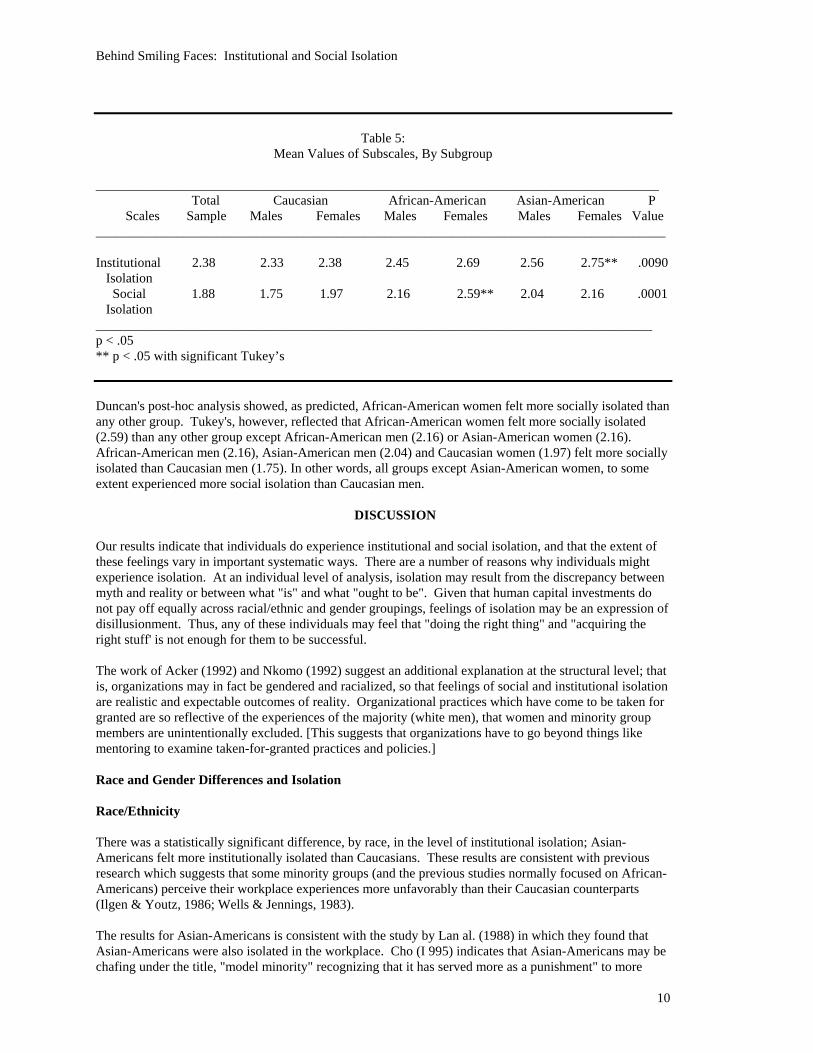
Behind Smiling Faces: Institutional and Social Isolation
10
Table 5:Mean Values of Subscales, By Subgroup
____________________________________________________________________________________ Total Caucasian African-American Asian-American P
Scales Sample Males Females Males Females Males Females Value_____________________________________________________________________________________
Institutional 2.38 2.33 2.38 2.45 2.69 2.56 2.75** .0090 Isolation Social 1.88 1.75 1.97 2.16 2.59** 2.04 2.16 .0001 Isolation___________________________________________________________________________________p < .05** p < .05 with significant Tukey’s
Duncan's post-hoc analysis showed, as predicted, African-American women felt more socially isolated thanany other group. Tukey's, however, reflected that African-American women felt more socially isolated(2.59) than any other group except African-American men (2.16) or Asian-American women (2.16).African-American men (2.16), Asian-American men (2.04) and Caucasian women (1.97) felt more sociallyisolated than Caucasian men (1.75). In other words, all groups except Asian-American women, to someextent experienced more social isolation than Caucasian men.
DISCUSSION
Our results indicate that individuals do experience institutional and social isolation, and that the extent ofthese feelings vary in important systematic ways. There are a number of reasons why individuals mightexperience isolation. At an individual level of analysis, isolation may result from the discrepancy betweenmyth and reality or between what "is" and what "ought to be". Given that human capital investments donot pay off equally across racial/ethnic and gender groupings, feelings of isolation may be an expression ofdisillusionment. Thus, any of these individuals may feel that "doing the right thing" and "acquiring theright stuff' is not enough for them to be successful.
The work of Acker (1992) and Nkomo (1992) suggest an additional explanation at the structural level; thatis, organizations may in fact be gendered and racialized, so that feelings of social and institutional isolationare realistic and expectable outcomes of reality. Organizational practices which have come to be taken forgranted are so reflective of the experiences of the majority (white men), that women and minority groupmembers are unintentionally excluded. [This suggests that organizations have to go beyond things likementoring to examine taken-for-granted practices and policies.]
Race and Gender Differences and Isolation
Race/Ethnicity
There was a statistically significant difference, by race, in the level of institutional isolation; Asian-Americans felt more institutionally isolated than Caucasians. These results are consistent with previousresearch which suggests that some minority groups (and the previous studies normally focused on African-Americans) perceive their workplace experiences more unfavorably than their Caucasian counterparts(Ilgen & Youtz, 1986; Wells & Jennings, 1983).
The results for Asian-Americans is consistent with the study by Lan al. (1988) in which they found thatAsian-Americans were also isolated in the workplace. Cho (I 995) indicates that Asian-Americans may bechafing under the title, "model minority" recognizing that it has served more as a punishment" to more

Behind Smiling Faces: Institutional and Social Isolation
11
disadvantaged minority groups, rather than as a "reward" to Asian-Americans. This label may also createmore pressure for Asian-Americans to be successful in organizations, setting up the expectation that theywill succeed without providing the corresponding support. This contradiction between the pressure tosucceed and the lack of help to get there may result in their feeling institutionally isolated.
While African-Americans did not differ significantly from Caucasians in this study, their score was closeenough to that of Asian-Americans to suggest that it is practically and theoretically significant and worthfurther examination.
Gender
Despite popular cultural beliefs regarding women's social nature, in this study women, on average, feelmore institutionally and socially isolated than do males. This is consistent with a myriad of previousfindings (Kram, 1985; Ragins, 1989; Ragins & Sundstrum, 1989; Noe, 1988b; DOL's Final Report on theGlass Ceiling, 1995), and socialization literature (Gomez-Mejia, 1983; Jones, 1983; 1986; Louis, 1980;Van Maanen & Schein, 1979) in which women and men differed on both particular attitudes and objectiveoutcomes, thus necessitating organizational socialization interventions such as mentoring. The variety ofobstacles and lack of promotional opportunity that women encounter may manifest itself in their feelingboth institutionally and socially isolated.
The difference, by gender, in the perceptions of institutional and social isolation is consistent with the workon the "glass escalator" by Williams (1992). If this glass escalator exists, women who view the success oftheir male counterparts may experience institutional and social isolation because they help but are nothelped by others. Those women who facilitate the success of the males are not correspondingly assistedwith attaining their own success. Because the groups usually are not physically separated within theworkplace and may have some knowledge of or witness each other's experiences, the differentialexperience and outcomes of males may create an environment in which women feel institutionally andsocially isolated.
The data only partially supported the hypothesis that African-American women experience higher levels ofinstitutional and social isolation than any other racial minority or gender group. Asian-American femalesexperienced greater institutional isolation than any other group; African-American females experiencedgreater social isolation than Caucasian males and females and Asian-American males. Because African-American women and Asian-American women and men have generally not been included in the same dataset, the finding that Asian-American females experience similar levels of institutional isolation as African-American women should not be surprising. Their isolation exceeds that of any other racial/gendercombination. Existing literature supports Asian-Americans' feelings of isolation within the workplace,despite their "successful" career outcomes.
FUTURE DIRECTIONS
This study was conducted with white collar professionals, some of the most desirable occupations in U.S.society (Sokoloff, 1992). In fact, access to these types of jobs has "defined" the middle-class, since theyhave offered rewards, autonomy, power and influence not generally offered to nonprofessionals. Sokoloff(1992) has argued that in such elite occupations, members expect greater rewards for their services andhigher returns on their capital investments. However, race and gender differences do exist (1) in thereceipt of doctoral degrees, (2) the extent to which individuals with doctorates are tenured, and (3) theattainment of faculty rank. While racial and ethnic minorities have made some gains in obtainingemployment in academe, their entry is far less than their representation in the general population (Magner1993). The attainment of this elite status, however, is likely to be greater than corresponding attainmentsin other workplaces. Furthermore, university faculty may not be representative of the general public interms of human capital investment, autonomy, and perceptions of organization (rather than profession) towhich one may be effectively committed. One might expect the effect to be intensified in the generalpopulation. Thus, future research is needed to determine the generalizability of our findings. Further, alongitudinal study would allow a greater exploration of the complex relationships between race and gender,and social and institutional isolation.

Behind Smiling Faces: Institutional and Social Isolation
12
The analysis of race differences is a good example of one of the problems Cox (1990) identified. Becausethere were insufficient numbers of Hispanic-Americans in the sample (less than 10), no statistical analyseswere conducted on this portion of the sample. Most statistical procedures require a sample size of 30 ormore for interpretable results. Thus, this group of individuals was deleted from the analysis. Because onecannot expect that their experiences are the same, the Hispanic-American group could not be merged withAfrican-Americans, Asian-Americans, or Caucasians (Andersen & Collins, 1995). In the future, researchutilizing a small sample such of this must be conducted and modified as necessary, so that valuable insightcan be gained about this ethnic group's work experiences.
In this regard, the smaller sample sizes, by race, must be included in analysis of the total study. Researchdesigns which would allow analyses. quantitatively and qualitatively, of those relationships are critical.The institutions in this geographical location had very low numbers of African-American, Asian-Americanand Hispanic-American faculty. Thus, their small N sizes might obfuscate very real differences inorganizational experiences. A critical element in continuing this stream of research is the ability to capturequalitative data which will provide more depth in describing the variety of experiences of the targetedgroups, as well as categorizing the types of experiences and practices which contribute to one's feelings ofisolation.
CONCLUSIONS
In general, this study did support conceptualizations of institutional isolation and social isolation in termsof workplace experiences in academe. While some of the race and gender difference predictions did notbear out, there were enough of them to suggest that race and gender differences do, in fact, exist inattitudes and workplace experiences.
On the surface, organizations seem to be "doing the right things" and attempting to facilitate the success ofindividuals. However, they may be doing these things at the wrong level. An extension of this studyshould include a research design that will examine both quantitatively and qualitatively, the experiences ofgroups and at the structural level, those processes, policies, and attitudes that may be imbedded.
These results confirming the existence of institutional and social isolation suggest that this component ofindividuals' workplace experiences should be examined at organizational entry and at intervals duringorganizational membership--before and after interventions have been conducted to socialize individuals.In this way, the organization may better be able to determine the type of intervention, if any, needed toobtain individual and organizational goals.
REFERENCES
Acker, J. (1992). Gendering organizational theory. Gendering organizational analysis, edited by A. J. Mills and P. Tancred: 248-290. Newbury Park: Sage Publications.
Alderfer, C. & Thomas, D.A. (1988). The significance of race and ethnicity for understanding organizational behavior. International Review of Industrial and Organizational Psychology, 1-41.
Andersen, M. L. and Collins, P. H. (1995). Race, class, and gender: An anthology. Belmont:Wadsworth Publishing Company.
Bardwick, J. (1979). In transition. London: Holt, Rinehart and Winston.
Bell, E.L. (1990). The bicultural life experience of career-oriented black women. Journal ofOrganizational Behavior, Vol. 11, 459-477.
Bell, E.L. (1986). The power within: Bicultural life structures and stress among black women.Unpublished doctoral dissertation. Case Western Reserve University.

Behind Smiling Faces: Institutional and Social Isolation
13
Betters-Reed, B. L. and Moore, L. L. (1992a). Managing diversity: Focusing on women and thewhitewash dilemma. In U. Sekaran and F. T. L. Leong (Eds.), Womanpower: Managing in times of demographic turbulence. Newbury Park, CA: Sage Publications.
Betters-Reed, B. L. and Moore, L. L. (1992b). The technicolor workplace. Ms, 3(3), 84-85.
Braddock, J.H. II and McPartland, J.M. (1987). How minorities continue to be excluded from equal employment opportunities: Research on labor market and institutional barriers. Journal of Social Sciences, Vol. 43, No. 1, 5-39.
Cabezas, A., Tan, T., Lowe, B., Wong, A. and Turner, K. (1989). Empirical study of barriers to upwardmobility of Asian Americans in the San Francisco Bay area. In G. Nomura, R. Endo, R. Leong & S.Sumida (Eds.) Frontiers of Asian-American studies. Pullman: Washington State University Press.
Cho, S. K. (1995). Korean Americans vs. African Americans: Conflict and construction. In Andersen,M. L. and Collins, P.H. (Eds.). Race, class and gender.-- An anthology, 2d edition, pp. 461-70.
Cox, T., Jr. (1990). Problems with research by organizational scholars on issues of race and ethnicity.Journal of Applied Behavioral Science, 26, 1, 5-23.
Dansereau, F., Jr., G. Graen & Haga, W.J. (1975). A vertical dyad linkage approach to leadership within formal organizations: A longitudinal investigation of the role making process. Organizational Behavior and Human Performance, 46-78.
Dean, D. (October 1961). Alienation: Its meaning and measurement. American Sociological Review,753-77.
Dickens, F., Jr. and Dickens, J. B., (1987). The Black Manager: Making it in the corporate world. NewYork: AMACOM.
Durkheim, E. (1951). The division of labor in society (translated by G. Simpson). Glencoe, EL: TheFree Press.
Fernandez, J. P. (1981). Racism and sexism in corporate life. Lexington, MA: Lexington Books.
Fowler, F.J., Jr. (1993). Survey research methods. Newbury Park, California: Sage Publications.
Fulbright, K. (1986). The myth of the double-advantage: Black women in management. Unpublisheddoctoral dissertation, MIT.
Gilligan, C. (1982). In a different voice: Psychological theory and women's development. Harvard: Harvard University Press.
Gomez-Mejia, L. R. (1983). Sex differences during occupational socialization. Academy of Management Journal, 26, 492-499.
Greenhaus, J., Parasuraman, S. & Wormley, W. (1990). Effects of race on organizational experiences, job performance evaluations and career outcomes. Academy of Management Journal, 33, 64-86.
Higginbotham, E. (1987). Black professional women: Job ceilings and employment sectors. In Women of color in U.S. society, 113-131.
House, J. S. (1981). Work stress and social support. Reading, MA: Addison-Wesley.
Hull, G. T., Scott, P. B. and Smith B. (Eds.). (1982). All the women are white, all the blacks are men, but some of us are brave. Old Westbury, NY: Feminist Press.

Behind Smiling Faces: Institutional and Social Isolation
14
Ibarra, H. (1993). Personal networks of women and minorities and women in management: A conceptual framework, Academy of Management Review, 18, 1, 56-87.
Ilgen, D. R. and Youtz, M.A. (1986). Factors affecting the evaluation and development of minorities in organizations. Research in Personnel and Human Resources Management, Vol. 4, 307-337.
Irons, E. D. and Moore, G. W. (1985). Black managers: The case of the banking industry. New York: Praeger.
Johnsrud, L. and Wunsch, M. (1991). Junior and senior faculty women: Commonalities and differences in perceptions of academic life. Psychological Reports, 69:879-886.
Jones, G. R. (1983). Psychological orientation and the process of organizational socialization: An interactionist perspective. Academy of Management Review, 8, 464-474.
Jones, G. R. (1986). Socialization tactics, self-efficacy, and newcomers’ adjustments to organizations. Academy of Management Review, 33, 847-858.
Knox, P. L. and McGovern, T. V. (1988). Mentoring women in academia. Teaching of Psychology, Vol. 15, No. 1, 39-41.
Kram, K. E. (1985). Mentoring at Work: Developmental Relationships in Organizational Life. Glenview, IL: Scott, Foresman.
Lan, D. (1988, September 7). Information bearing on Asian, Filipino, Pacific Islander (AFPI) demographics and employment. Memo presented to the California State Personnel Board.
Louis, M. R. (1980). Surprise and sense-making: What newcomers experience in entering unfamiliar organizational settings. Administrative Science Quarterly, 25, 226-251.
Magner, D. K. (1993, September 29). Blacks earned fewer doctorates in 1992 than in 1991, study finds. The Chronicle of Higher Education, A18.
McGhee, G. W. and Ford, R.C. (1987). Two (or More?) dimensions of organizational commitment: Re- examination of the affective and continuance commitment scales. Journal of Applied Psychology, 72, 4:638-642.
Merriam, T. and Zaph, D (1987, Winter). Mentoring in higher education: What we know now. The Review of Higher Education, Vol. 11, No. 2, 199-210.
Messick & Mackie (1989).
Meyer, J. P. and Allen, N. J. (1988). Links between work experiences and organizational commitment during the first year of employment: A longitudinal analysis. Journal of Occupational Psychology, 61, 195-209.
Meyer, J. P. and Allen, N. J. (1984). Treating the ‘side-bet theory’ of organizational commitment: Some methodological considerations. Journal of Applied Psychology, 69, 372-378.
Morrison, A. M. and Von Glinow, M. A. (1990). Women and minorities in management. American Psychologist, 200-208.
Nixon, R. (1985). Black managers in corporate America: Alienation or integration. Washington, DC: National Urban League.
Nkomo, S. M. (1992). The emperor has no clothes: Rewriting “race in organizations.” Academy of

Behind Smiling Faces: Institutional and Social Isolation
15
Management Review, 17(3), 487-513.
Nkomo, S. M. and Cox, T., Jr. (1990). Factors affecting the upward mobility of Black managers in private sector organizations. The Review of the Black Political Economy, Winter, 1990, Vol. 18, No. 3, 39-57.
Noe, R. A. (1988a). Women and mentoring: A review and research agenda. Academy of Management Review, 13, 65-78.
Noe, R. A. (1988b). An investigation of the determinants of successful assigned mentoring relationships. Personnel Psychology, 41-457-479.
Obleton, N. B. (1984). Career counseling black women in a predominantly white coeducational university. Personnel and Guidance Journal, 64, 365-368.
Queralt, M. (1982). The role of the mentor in the career development of university faculty members and academic administrators. Presented at the annual meeting of the National Association of Women Deans, Administrators and Counselors, 3 April 1982, Indianapolis, IN. ERIC Document Reproduction Service, ED 216 614.
Ragins, B. R. (1989). Barriers to mentoring: The female managers dilemma. Human Relations, 42:1-22.
Ragins, B. R. and Sundstrum, E. (1989). Gender and power in organizations: A longitudinal perspective. Psychological Bulletin, 105:51-88.
Rosen, B., Templeton, N. C., and Kichline, K. (1981, December). First few years on the job: Women in management. Business Horizons, 24, 26-29.
Sandler, B. R. (October 1986). The campus climate revisited: Chilly for women faculty, administrators, and graduate students. Washington, DC: The Project on the Status of Women, Association of Colleges.
Seeman, M. (December 1959). On the meaning of alienation. American Sociological Review, 783-89.
Smith, A. and Stewart, A. (1983). Approaches to studying racism and sexism in black women’s lives. Journal of Social Issues, 39, 1-15.
Smith, J. W. and Markham, S. E. (1997). Dual construct of isolation: Institutional and social forms. Presentation and Proceedings, Academy of Management Meeting, August 1997, Boston, MA.
Smith, J. W., Markham, S. E., Madigan, R. and Gustafson, S. (1997). Alternative perspective to view workplace experiences: Institutional isolation construct. (Under review, Southern Academy of Management meeting, November 1997).
Sokoloff, N. J. (1992). Black women and white women in the professions. New York: Routledge.
Spelman, E. V. (1988). Inessential woman: Problems of exclusion in feminist thought. Boston: Beacon Press.
Srole, L. (1956). Social integration and certain corollaries: An exploratory study. American Sociological Review, 21:709-16.
Stroh, L. K., Brett, J. M. and Reilly, A. H. (1992). All the right stuff: A comparison of female and male managers’ career progression. Journal of Applied Psychology, 77:51-260.
Behind Smiling Faces: Institutional and Social Isolation
16
Thomas, D. A. (1990). The impact of race on managers’ experiences of developmental relationships (mentoring and sponsorship): An intra-organizational study. Journal of Occupational Behavior, 11, 479-492.
Thomas, D. A. & Alderfer, C. P. (1989). The influence of race on career dynamics: Theory and research on minority career experiences. In M. Arthur, D. Hall and B. Lawrence (Eds.). Handbook of career theory. Cambridge, England: Cambridge University Press.
Tsui, A. (1984). A role set analysis of managerial reputation. Organizational Behavior and Human Performance, Vol. 34, 64-96.
U.S. Department of Labor (1995). Final Report on the Glass Ceiling. Washington, DC: U. S. Government Printing Office.
U.S. Department of Labor (1991). Initiative on the Glass Ceiling. Washington, DC: U. S. Government Printing Office.
U.S. Department of Labor (1986). Meeting the challenges of the 1980s. Washington DC: Employment and Training Administration. U. S. Department of Labor.
U.S. Office of Personnel Management (1989). Report on minority group and sex by pay plan and appointing authority. (EPMD Report No. 40, March 31, 1989). Washington, DC: Office of Personnel Management.
Van Maanen, J. and Schein, E. (1979). Toward a theory of organizational socialization. In B. Staw (Ed.) Research in Organizations, Vol. 2, Greenwich, CT: JAI Press.
Weiss, R. S. (1975). Marital separation. New York: Basic Books.
Weiss, R. S. (1973). Loneliness: The experience of emotional and social isolation. Cambridge, MA: MIT Press.
Wells, L. & Jennings, C. L. (1983). Black career advances and white reactions: Remnants of Herrenvolk democracy and the scandalous paradox. In D. Vails-Webber and W. N. Potts (Eds.), Sunrise seminars, 41-47. Arlington, VA: NTL Institute.
Williams, C. L. (1992). The glass escalator: Hidden advantages for men in the “female” professions. Social Problems, Vol. 39, No. 3, 253-67.
1
SEARS IN THE 1930’S: THE GREAT DEPRESSION AND MANAGING STAKEHOLDERINTERESTS
William P. Darrow, Towson University, Towson MD 21252 (410) 830-3875
Raymond D. Smith, Howard University, Washington DC 20059 (202) 806-1520
ABSTRACT
This paper looks at the success of Sears Inc. in the hostile business environment of the 1930’s during theGreat Depression. This period is characterized by Sears’ rapid expansion of its retail store operationsbegun in 1925. Sears was not only able to maintain its position of being the world’s leading retailer, itmore than doubled its business during the decade, in an extremely hostile business environment. Sears’strategies and policies during this period were far ahead of their business contemporaries in terms of thetheir understanding (and exploiting) the business environment, and in terms of their enlightenedtreatment of stakeholder interests.
THE GREAT DEPRESSION AND THE BUSINESS ENVIRONMENT OF THE 1930’S
Economy
The 1930’s were a time of economic devastation. National output declined 30% between 1929 and 1933.Personal income fell 45% in the same period. The economic collapse of the 30’s was to many the mostpainful and devastating phenomenon of the century for the United States. For farmers, the mainstay ofSears early years, income decreased 70% ! This created an extremely threatening environment forbusiness. Yet amazingly, Sears’ sales only declines once during the entire decade (1932). Sears’ amazingsuccess even in the Depression is a testament to the genius of its management and it’s dealing withstakeholders’ interests and the dedication of its employees.
Political/Legal
Many believe the effects of the depression were mitigated by the federal government and its economicstimulus programs. The role of government in business greatly expanded in 1933 with the NationalIndustrial Recovery Act. Anti-trust laws were suspended. Industry associations were encouraged to setminimum prices, wages, production quotas, and maximum work hours - all subject to governmentapproval. This legislation was intended to reverse the depression by raising prices and wages. Smallbusiness complained that the codes favored the larger firms in the industry. Workers complained thatemployers did not live up to their promises. The Supreme Court declared the National IndustrialRecovery Act unconstitutional in 1935. So it was never fully implemented. The main benefit of the actwas to instill confidence in the country during the depths of the depression, helping to prevent an evengreater decline.
Technology
A key technological change in the 1930’s was electrification. By the start of the decade, electricity stillhad not reached many rural areas. The TVA and other government programs helped to extend theelectrical grid to rural America. Along with electrification came the radio and a wide range of house hold

2
appliances. Many appliances were labor saving devices The radio first became wide-spread in the 1930’s.Radio broadcasts were available throughout the entire nation.. This served as a catalyst to massproduction and mass distribution by cementing together a national market. National advertising helped tocreate the demand for a wide range of consumer goods. Another communications technology that hadsignificant impact was the motion picture. Movies presented images of life styles to many ruralAmericans that they had not previously imagined.
SEARS IN THE 1930’S
The Sears of the 1930’s were defined in large part by the accomplishments, visions and strategies of itsearly leaders. Three of them stand out. First, there was the entrepreneurial Richard Warren Sears, theoriginal founder and marketing genius, who used catalog sales to reach rural America.. Then JuliusRosenwald who gained control of the high volume mass distribution operations of Sears. Equallyimportant were his executive qualities, which served Sears well in trying times. One of Rosenwald’senduring contributions was his strong customer orientation. This provided a firm foundation fordeveloping an enlightened corporate culture that has defined Sears and lead to its dominance ofAmerican retailing for most of the twentieth century. General Robert E. Wood, CEO for 29 years, built onthe solid foundation provided by Rosenwald. Wood expanded Sears beyond catalog sales into storeoperations that lead to the company becoming America’s (and the world’s) leading retailer. UnderWood’s leadership, Sears served as the model for the retail industry, and helped to define the role of themodern corporation. Wood’s skill in addressing diverse stakeholder’s needs long before most managerseven thought in terms of so broad a constituency was key to Sears’ success.
Growth of Retail Store Operations
On February 2, 1925 Wood opened Sears first retail store on the first floor of the Chicago mail-orderplant. Seven more stores were opened in 1925. by 1929 Sears had a total of 268 retail stores. Ward’s,Sears main competitor, had 532 by the end of 1929. The numbers are somewhat misleading becauseSears, the dominant retailer, opened fewer but larger stores in more densely populated cities and towns. Inthe 1920’s Wards had a strategy of having many small stores in small towns. This reflected Ward’scontinuing customer focus on rural America. Sears’ focus was geared more to larger suburban and urbanlocations that could support the larger stores needed to display the broad product assortment carried bySears. It is fair to say that General Wood was responsible for the expansion of Sears from a catalogbusiness to becoming the nation’s leading retailer. In 1929 retail sales accounted for 1275 million, 40%of Sears total business. In 1931 retail sales moved ahead of catalog sales. Sears success during the 1930’sis reflected by the fact that only once in 1932 did retail sales volume suffer a year-to-year drop. However,the Depression did slow the rapid pace of new store openings. In 1929 108 new stores were opened, in1930 only 19 new stores were opened (Worthy p. 110). Stores that were not profitable were closed. Lesscompetent people were let go. Overhead costs were slashed. Product mix was given a sharper focus. Inaddition improvements in store layout, appearance, and in customer service occurred in this period. Thenet result was a massive restructuring that created a leaner, cleaner, and significantly efficient operation.In spite of the restructuring, and the hardships brought on by the depression, Sears continued to grow. By1939 retail sales represented two-thirds of total sales.
Location Strategies

3
A key element in Sears retailing strategy was location. Sears initially favored the urban central businessdistricts. However, they quickly switched to a move away from the central business districts and towardsthe newly emerging suburbs. In 1927, their third year of retailing, all but one of the thirteen storesopened were outside the central business district. This shift anticipated the rapid growth in the suburbsthat occurred in the post World War II era. There was also a marked shift in location strategy thatoccurred in 1928 in response to competitive moves by Wards. Ward’s targeted small (under 25,000 inpopulation) and medium size cities (between 25,000 and 100,000). These were the same largely ruralmarkets served by their catalog business. This focus avoided competition with urban department stores.Sears saw this as a threat, as Ward’s presence in the smaller cities threatened Sears catalog sales. By 1928Sears broadened its focus to include small and medium cities. They had a highly structured approachdefining class A, B1, B2, B3, and class C, stores each with a different target mix, staffing, and layout ,and each tailored to serve the needs of their target markets.
A key aspect of Sears location strategy was in seeing the attractiveness of the newly emerging suburbs.As early as 1927 Sears was locating stores in the suburbs, twelve of thirteen stores opened that year werein suburban locations. General Woods articulated this strategy in 1937 (Wood, 9/20/37):
“The automobile made shopping mobile, and this mobility now created an opportunity for theoutlying store, which with lower land values, could give parking space; with lower overhead, rents,and taxes, could lower operating costs, and could with its enlarged clientele created by the automobileoffer effective competition to the down-town store.”
Geographic focus was also an important element of Sears location strategy. General Wood favored theSouth, Southwest, and Western US, as those were the regions in which population was growing rapidly.During this period growth in states in New England, the Middle Atlantic, and Upper Midwest had leveledoff or suffered modest declines. The Western states benefited from population shifts and economicdevelopment. The Southern states were the most backward in terms of economic development, and thushad greater growth potential than other regions. Sears also faced less competition in the Western andSouthern states, particularly from their arch-rival, Wards. Ward’s geographic focus strategy does notappear to have considered future population growth, as it differed significantly from Sears.
In the 1930’s Sears faced both rapid growth, vast geographic expansion, and great economic challengesfrom the Depression. Sears went through a complete cycle of reorganization which eventually lead to anappropriate structure with a high degree of decentralization at the territorial level. The depressionprobably accelerated the learning process, hastening the demise of the original cumbersome andduplicative structure.
SEARS STAKEHOLDER STRATEGIES
General Wood viewed business interests in the following order of importance:
1) customers, 2 ) employees, 3) the community, and 4) stockholders (Worthy p63, 64). These businessinterests include key elements of what we have come to regard as stakeholders. The order of importancefor the business interests, and the inclusion of the community provides an enlightened framework fordeveloping business strategy. This view was ahead of its time. For example, as late as the 1950’s ThomasJ. Wastson, Sr. Chairman and CEO of IBM described management’s role as that of balancing a three-legged stool consisting of employees, customers, and shareholders (Frederick, p.9). Sears, as did allbusiness of the period, dealt with what we today view as a variety of stakeholder groups. The fact thatthey did not have the contemporary view of explicitly examining stakeholder interests does not mean thattheir strategies were incomplete. In the case of Sears we will show that they were effective in dealingwith a variety of stakeholder interests in the 1930’s.

4
Customers
Sears business from its outset depended upon finding more efficient methods for satisfying customerneeds than its competitors. In the early days this meant forming a bridge between the manufacturer andconsumer through catalog sales. Sears created mass distribution based upon its successful catalog sales. Itcreated highly efficient state-of-the-art physical distribution centers to support catalog sales. Sears thenworked with its suppliers to eliminate costs, improve manufacturing methods, and add product designfeatures that customers valued. In every instance the customer shared in the savings. Customers benefitedfrom Sears “money-back guarantee” on everything it sold, and from the assurance that they were buyingquality goods. Sears offered private label products that provided added features and exceptional value.Sears responded to the Depression by sacrificing profits and putting the customer first. Prices werereduced, essential items such as underwear, shoes, and textiles were priced close to production costs.(Worthy p. 62)
Farmers, the initial customer focus for Sears, remained very loyal - and were a key customer group. In1936 Sears began a program of scholarships for needing farm boys who wanted to go to college and studyagriculture. The awards were very small, about $125.00 in the late 1930’s. The amount of the award wasdetermined by the Dean of Agriculture at The University of Georgia at Athens. It was considered athreshold amount that would enable many students to enter college. There were 11,000 recipients in thefirst 20 years of the program. The award program was expanded to other areas of the country. It was alsoexpanded to include women interested in studying home economics.
Management and Workers
Store and mail order plant managers worked under contracts that were individually negotiated each year.There were strong financial incentives linked to profits. Base pay was modest, $6,000.00 per year for thelarger “A” stores in 1946, a respectable income at that time. However, a manager could earn four to sixtimes his base pay through incentives in a good year. Other personnel, whose contribution to profits wasmore difficult to measure, received a smaller portion of their compensation as bonus. Upper levelexecutives also had stock option incentives. The net result was that Sears managers were well paid. Inreturn they were not only expected to be committed to Sears, they were expected to represent Sears to thecommunity on and off the job. Managers were expected to assume leadership roles in the community.They were expected to maintain the proper image in terms of living in the appropriate neighborhood,belonging to the right clubs and civic groups, driving the appropriate model of car, professional dress andbehavior.
Profit sharing was also available to all employees.. Through the profit sharing plan, employees owned asubstantial share of Sears stock. This provided a strong performance incentive for all employees. It wasnot unheard of for employees to draw more from the profit sharing plan after retirement than they earnedin salary during all of their working years. Sears was unquestionably at the forefront of the retail industryin wages and benefits.
General Public

5
Sears’ store managers were frequently transferred until they reached the level of store manager. At thatpoint the often stayed with the same store for the rest of their career. This enabled the store managers tobuild long term relationships with key people and groups in the local community. It was tacitlyunderstood that the store managers were expected to take an active role in community affairs. Theybecame presidents of chambers of commerce; chairman of the board for YMCA’s; Boy & Girl Scoutleaders; they chaired hospital drives, and served on boards of education. Sears stores were expected togive liberally to charities. Sears store managers had the authority to decide how much to give.
Suppliers
Sears, under Wood, was unique in its efforts to integrate production and distribution into a single process.Sears developed strong supplier relations that have only recently (1980’s) become widely adopted as USfirms modeled their supplier relations on Japanese models.
Wood established close relationships with suppliers and thus \made it so that there were virtually noselling expenses. There were often no advertising costs, as Sears handled all advertising for its brandedproducts. There were large volume contracts, and long term relationships for suppliers who performed.Sears often insulated its suppliers from commodities price swings by contracting directly for cotton,rubber, copper, leather hides, silk and similar raw materials. The supplier was then contracted to convertthe raw materials into product - being fully insulated from raw materials price swings and the associatedrisks. As a consequence of this close relationship with suppliers, Sears became the supplier’s mostimportant customer.
Sears would often invest in their suppliers. One famous example of this is General Woods investment inan under-utilized railroad parts plant. Woods called the head of the company and offered to invest in thecompany if they would convert the plant to refrigerator manufacturing. The company was later mergedwith another manufacturer of Sears appliances to eventually become the Whirlpool Corporation (Worthy,p. 71).
CONCLUSION
Sears became the most successful retailer in the 20th century by refining (if not creating) mass distributionto link the products of American industry with rapidly expanding markets. Sears, along with Americanindustry helped to create the modern standard of living that we now take for granted. This did not happenby accident. Sears was fortunate in having leaders of vision. Richard W. Sears the original entrepreneur;Julius Rosenwald, an enlightened executive who redefined Sears mission as one of serving the customer;and General Robert E. Wood, who served the company from 1924 to 1954. Wood developed thestrategies and policies that moved Sears into retailing, managed the company through the Depression,and its extraordinary growth through mid-century. Sears developed strategies policies, and a corporateculture that were based upon creating efficiencies in distribution and in product manufacturing anddesign. The savings were shared with customers, employees, and suppliers. Many other stakeholdergroups benefited from their relationship with Sears. Their enlightened management policies wereexemplary, and a key element of their success.
REFERENCES

6
References available upon request from the William Darrow
Mentoring’s Impact Across Races and Genders
mentor11.doc 4-28-97
1
MENTORING: DOES IT HAVE AN EQUAL IMPACT ACROSS THE RACES AND GENDERS?
Janice Witt Smith, School of Business and Economics, Department of Business Administration,North Carolina Agricultural and Technical State University, Greensboro, North Carolina 27411Steven E. Markham, Department of Management, R. B. Pamplin College of Business, Virginia
Polytechnic Institute and State University, Blacksburg, Virginia 24061
ABSTRACT
Mentoring has been cited as an effective method for assisting qualified individuals in overcomingorganizational barriers to their success. This research examines whether the effect of mentoring onindividuals is the same, irrespective of race and gender. In a sample of 226 university faculty, womenwere more likely to be mentored than men regardless of formal vs. informal types of mentoringprograms. Racial minorities and Caucasians were more likely to be in informal rather than formalmentoring programs. There were no race or gender differences in amounts of career or psychosocialattention. Cross-cultural composition of the dyadic relationship did not have an impact.
BACKGROUND
Many organizations are reeling from the competitive and turbulent environment in which they arenow enmeshed, with record numbers of downsizings, mergers and acquisitions (Lublin, 1994). Civilrights legislation and discrimination laws, as well as the backlash against these laws and affirmativeaction, are also a critical component of the business environment (Blankenship, 1993). As a result ofthese sometimes conflicting demands and expectations, some organizations are having difficultydetermining what is fair in their treatment of all groups, but especially in retaining women andminorities. And, even when these organizations are successful, there may be conflict within theorganization concerning the way these groups of individuals experience the workplace. Someorganizations are attempting to ameliorate these difficulties by designing interventions such asmentoring programs to assist individuals in overcoming the organizational barriers to their success.Other organizations are being caught by the courts (e.g., Texaco for racial discrimination; Circuit Cityfor glass ceiling; State Farm Insurance for gender discrimination).
Women and minorities in organizations continue to lag behind their Caucasian male counterparts interms of objective outcomes as well as subjective experiences (Stroh, Brett & Reilly, 1992;Greenhaus, Parasuraman, & Wormley, 1990). Organizations may attempt to ameliorate the impact ofpast covert and overt, intended and unintended, discriminatory practices against women andminorities by providing assistance through socialization practices [defined by Van Maanen & Schein,1979, as “the process by which people learn the norms and roles that are necessary to function in agroup organization”]. Socialization practices may include (among others) orientation programs,training modules, or mentoring relationships, which are hypothesized to increase organizationaltenure, decrease turnover, increase affective organizational commitment and, improve individual andcorporate performance (Kram, 1985; Scandura, 1992). However, particular race and gender groupsare encountering significant difficulties in obtaining these outcomes.
This study tests the assumption that the presence of mentoring relationships has an equal impactacross the races and genders. In particular, this study examines whether individuals in this samplehave equal access to a mentoring relationship, and if the type of mentoring roles enacted differ byprotégés’ race and gender.
Mentoring’s Impact Across Races and Genders
mentor11.doc 4-28-97
2
Mentoring
Mentoring is defined as “a set of roles and role activities including coaching, support andsponsorship” (Kram, 1985). In the sponsorship role, the mentors actively intervene, attempting toprovide maximum exposure and visibility for their protégés, in an attempt to facilitate theirpromotability. Kram identified career coaching and psychosocial functions as the two dimensions ofthe developmental relationship; these have been supported by other researchers (Burke, 1984;Schockett & Haring-Hidore, 1985; Noe, 1988; Olain, Carroll, Giannantonio & Feren, 1988). Careercoaching includes the roles of sponsorship, exposure, visibility, coaching, protection, and providingchallenging assignments. Psychosocial functions include serving as role models, providingfriendship, counseling, acceptance and confirmation.
Examples of mentoring outcomes include higher levels of career development and success formentored faculty than for unmentored faculty (Queralt, 1982); mentors help protégés feel closer to theorganization (Collins, 1983; Zey, 1984); mentoring can decrease turnover (Levinson, 1978; Kram,1985); provide special organizational information (Kozlowski & Ostroff, 1987); increase power(Fagenson, 1988); enhance work effectiveness (Kram, 1985) and job success (Roche, 1979; Stumpf &London, 1981; Hunt & Michael, 1983; Fagenson, 1989); increase salaries (Roche, 1979); openpromotion (Stumpf & London, 1981; Hunt & Michael, 1983); and enhance career mobility (Scandura,1992).
Correlates of Mentoring: Individual Characteristics
Race. Thomas (1990) noted that while Caucasian protégés have almost no developmentalrelationships with persons of other races, African-American protégés form 63% of theirdevelopmental relationships with Caucasians. Further, African-Americans are more likely thanCaucasians to form relationships outside formal lines of authority and outside their departments.Same-race relationships were found to provide more psychosocial support than cross-racerelationships. Greenhaus, Parasuraman and Wormley (1990) found that sponsorship was associatedwith favorable assessments of promotability, low incident of career plateauing, and high levels ofcareer satisfaction. However, they also found that, consistent with Kraiger and Ford's (1985) meta-analysis of race effects on performance ratings, that African-Americans may be excluded fromopportunities for power and integration within organizations, which may then be detrimental to theirjob performance ratings (and thus promotability, etc.). In summary, past research suggests that racialgroup has an impact on access to mentoring relationships and the type and level of mentoringreceived, and it is hypothesized to work in the following ways:
H1a: Racial minorities are less likely to be involved in mentoring relationships than Caucasians.H1b: Mentored minorities receive more psychosocial support when the mentor is of the same race
and/or gender than when they are in a cross-cultural relationship.H1c: Mentored racial minorities receive less psychosocial support and less career mentoring
than mentored Caucasians.
Gender. Mentoring relationships are particularly important for women, since they face substantialgender-related barriers to promotion (Ragins & Sundstrom, 1989). Mentors can buffer women fromvarious types of discrimination, assisting them in becoming "fast-tracked" for advancement (Collins,1983; George & Kummerow, 1981; Halcomb, 1980; Vertz, 1985). Mentors can provide support,advice, and career guidance; confer legitimacy and alter stereotypic perceptions; provide reflectedpower; build self-confidence; train in the intricacies of corporate politics; provide inside information

Mentoring’s Impact Across Races and Genders
mentor11.doc 4-28-97
3
usually obtained through the "good old boys' network"; provide feedback important in overcomingthe "male managerial model," and provide a role model (Ragins, 1989). Not surprisingly, womenencounter barriers to obtaining a mentor (Kram, 1985; Hunt & Michael, 1983; Noe, 1988; Ragins,1989; Ragins & Cotton, 1991) for many reasons, two of which are the perceptions of sexualmisconduct when there are cross-gender relationships and because of the lack of women in upper-level managerial positions who can serve as mentor to other women.
In the research literature, there were no significant differences, by gender, in the level of careerdevelopment mentoring received (Dreher & Ash, 1990; Gaskill, 1991; Whitely, Dougherty & Dreher,1992). However, Ragins and McFarlin (1990) found that in cross-gender relationships, whencontrolling for differences in prior experience with mentors and with organizational level and otherdemographic variables, perceived mentor roles for role modeling and social roles had significantgender interactions. In fact, cross-gender protégés were less likely than same-gender protégés toreport engaging in after-work, social activities with their mentors.
In summary, gender status has an impact on access to mentoring relationships, the type of mentoringreceived, and the perceptions of mentoring roles, and it is hypothesized to work in the followingways:
H2a: Females are less likely to be in a mentoring relationship than males.H2b: Mentored females receive less psychosocial mentoring than mentored males.H2c: Mentored females receive less career mentoring than mentored males.
If we can show that (1) racial minorities are less mentored (both formally and informally) and (2) lesssupported (both through psychosocial support and career-oriented support), then serious questionswill be raised about the efficacy of mentoring programs in addressing the fundamental organizationalissue of isolation vis a vis racialized and gendered subcultures. On the other hand, should we detectno differences between the mentoring experiences of these groups, then it may well be the case thatauthentic mentoring efforts have been made by organizations, and the lack of significant differencescould be viewed in a positive light. But we are then faced with identifying other causes that mightexplain why the ultimate outcomes have still not been ameliorated for the problems associated withrace and gender.
RESEARCH METHODS
Setting
This study was a self-reported survey of university faculty, consisting of 226 male and femalementored faculty. The sample was part of a larger sample for a parallel study consisting of 765individuals. Of the total sample, 65% were male; 35%, female; 5.6%, African-American; 6.6%,Asian-American; 1.2%, Hispanic-American; and 86.8%, Caucasian-Americans [referred to as“Caucasians”]. Within the mentoring subsample, 105 were mentored men; 121 were mentoredwomen; 195 were Caucasian, 18 were African-Americans, and 13 were Asian-Americans. Smallsample sizes of Asian-Americans and African-Americans made it statistically unfeasible to analyzegender while holding constant race.

Mentoring’s Impact Across Races and Genders
mentor11.doc 4-28-97
4
Measures
All variables are operationalized from survey responses. Respondents were asked to indicate theirrace, gender, and type of mentoring relationship; other variables are measured by multiple-itemscales.
Mentoring Roles Questionnaire. Perceived mentoring roles and actual mentoring received weremeasured by Noe's (1988b) Mentoring Role Instrument (MRI). This is a 21-item, 5-point Likert-typescale which measures the extent to which the statement describes the relationship between the protégéand the mentor. The range of response categories are "from a very slight extent" (1) "to a very largeextent" (5), with the average score for each subscale used for the analyses. The psychosocialfunctions subscale consists of 14 items, while the career-related functions subscale consists of 7items. Reliability estimates (alpha) for the psychosocial and career-related functions are .84 and .79,respectively. These reliabilities are within acceptable limits, and because better measurements ofthese constructs were not available, these measures were used. Ragins and McFarlin (1992)suggested that this scale was deficient because it uses 1 or 2 items to measure some of the roles, thusrestricting the reliability estimates. They also argued that Noe's exploratory factor analysis suggestedsome conceptual ambiguity where several of the career development items loaded on the psychosocialfactor function. However, Chao et al. (1992) tested Noe's (1988) scale and obtained similar reliabilitycoefficients. Because the 21-item measure has reasonable reliabilities, the Noe measure was utilizedin this study; the items are provided in Table 1. Means and standard deviations are included as Table2.
------------------------------------------------Insert Tables 1 and 2 About Here
------------------------------------------------
TABLE 1 Noe's Mentoring Roles Instrument (MRI)
________________________________________________________________________ Coach1: My mentor has shared the history of his/her career with me. Coach2: Mentor has encouraged me to prepare for advancement. Accept1: Mentor has encouraged me to try new ways of behaving in my job. Accept2: My mentor has conveyed feelings of respect for me as an individual. Role1: I try to imitate the work behavior of my mentor. Role2: I agree with my mentor's attitudes and values regarding education. Role3: I respect and admire my mentor. Role4: I will try to be like my mentor when I reach a similar position in my
career. Counsel1: My mentor demonstrates good listening skills in our conversations. Counsel2: My mentor discusses my questions or concerns regarding feelings of competence, commitment to advancement, relationships with peers and supervisors or work/family conflicts. Counsel3: My mentor has shared personal experiences as an alternative perspective to my problems. Counsel4: My mentor encourages me to talk openly about anxiety and fears that
detract from my work. Counsel5: My mentor has conveyed empathy for the concerns and feelings I have
Mentoring’s Impact Across Races and Genders
mentor11.doc 4-28-97
5
discussed with him/her. Counsel6: My mentor keeps feelings and doubts I shared with him/her in strictest
confidence. Protect1: My mentor reduces unnecessary risks that could threaten the possibility
of becoming an associate or full professor (or administrator). Protect2: My mentor helps me finish assignments/tasks or meet deadlines that otherwise would have been difficult to complete. Expose1: Mentor helps me to meet new colleagues. Expose2: Mentor gives me (or makes me aware of) assignments that increased
written and personal contact with university administrators. Expose3: My mentor assigns (or requests the assignment of) responsibilities to
me that have increased my contact with peoplein academe who may judge my potential for potential advancement.
Sponsor1: My mentor gives (or requests others to give) me assignments or tasks in my work that prepare me for full professor or tenure.
Challenge1: My mentor gives (or requests others to give) me assignments that present opportunities to learn new skills.
TABLE 2 Descriptive Statistics for Overall Mentoring (Career Mentoring and Psychosocial Mentoring
Combined), Career Mentoring, and Psychosocial Mentoring Subscales
Type ofMentoring
Mean S.D.
OverallMeasure ofMentoring
28.88 5.37
Careermentoring
17.24 4.09
PsychosocialMentoring
11.66 1.81
Cronbach’s Alpha for Noe’s Mentoring Roles Instrument = .89
Analytical Techniques
For hypotheses H1b, H1c, H2b, and H2c, calling for tests of mean differences on the revisedMentoring Roles Instrument (MRI), a general linear model analysis of variance procedure (PROCGLM ANOVA) was employed because of unequal sample sizes. Hypotheses H1a, H2a, H3b, andH3c were tested utilizing proportions through chi-square analysis. This statistic indicates whether theexpected frequency of individuals in mentoring relationships was significantly different than theproportion of minorities and/or Caucasians actually in mentoring relationships.
RESULTS
The impact of mentoring was examined in two ways: (1) the extent to which access to mentoring isrelated to race/ethnicity and gender, examining proportions of individuals, by race and by gender, in
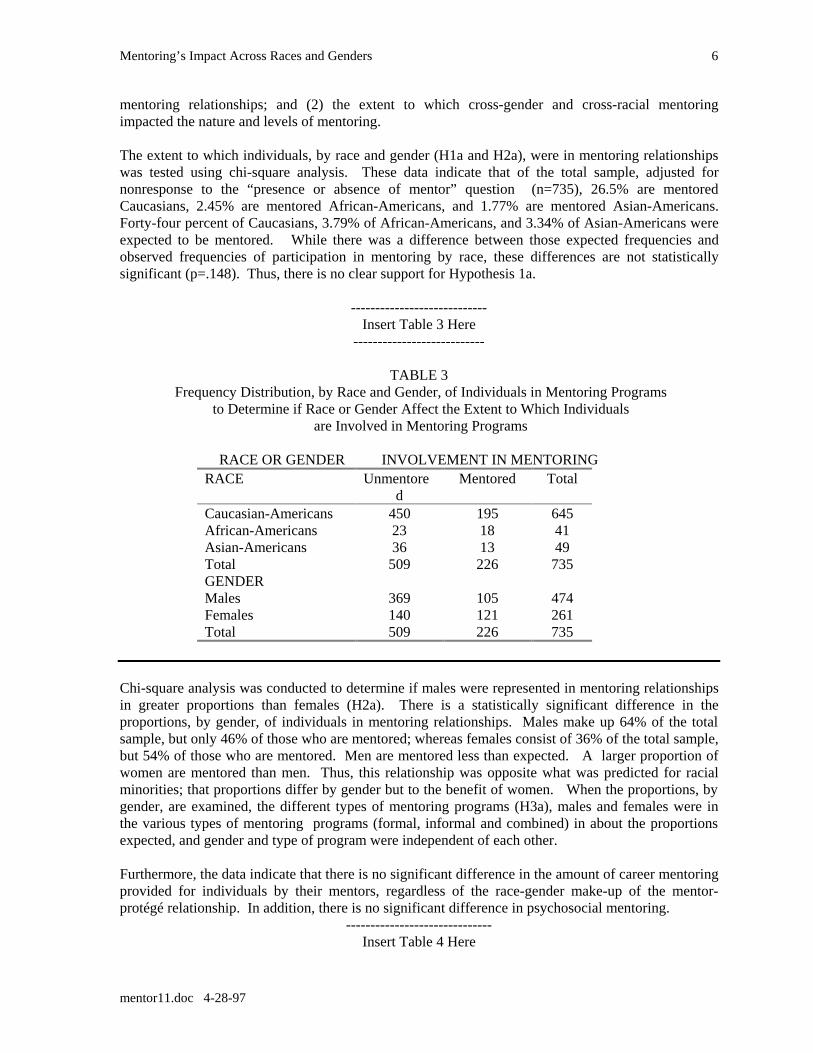
Mentoring’s Impact Across Races and Genders
mentor11.doc 4-28-97
6
mentoring relationships; and (2) the extent to which cross-gender and cross-racial mentoringimpacted the nature and levels of mentoring.
The extent to which individuals, by race and gender (H1a and H2a), were in mentoring relationshipswas tested using chi-square analysis. These data indicate that of the total sample, adjusted fornonresponse to the “presence or absence of mentor” question (n=735), 26.5% are mentoredCaucasians, 2.45% are mentored African-Americans, and 1.77% are mentored Asian-Americans.Forty-four percent of Caucasians, 3.79% of African-Americans, and 3.34% of Asian-Americans wereexpected to be mentored. While there was a difference between those expected frequencies andobserved frequencies of participation in mentoring by race, these differences are not statisticallysignificant (p=.148). Thus, there is no clear support for Hypothesis 1a.
----------------------------Insert Table 3 Here
---------------------------
TABLE 3 Frequency Distribution, by Race and Gender, of Individuals in Mentoring Programs
to Determine if Race or Gender Affect the Extent to Which Individuals are Involved in Mentoring Programs
RACE OR GENDER INVOLVEMENT IN MENTORINGRACE Unmentore
dMentored Total
Caucasian-Americans 450 195 645African-Americans 23 18 41Asian-Americans 36 13 49Total 509 226 735GENDERMales 369 105 474Females 140 121 261Total 509 226 735
Chi-square analysis was conducted to determine if males were represented in mentoring relationshipsin greater proportions than females (H2a). There is a statistically significant difference in theproportions, by gender, of individuals in mentoring relationships. Males make up 64% of the totalsample, but only 46% of those who are mentored; whereas females consist of 36% of the total sample,but 54% of those who are mentored. Men are mentored less than expected. A larger proportion ofwomen are mentored than men. Thus, this relationship was opposite what was predicted for racialminorities; that proportions differ by gender but to the benefit of women. When the proportions, bygender, are examined, the different types of mentoring programs (H3a), males and females were inthe various types of mentoring programs (formal, informal and combined) in about the proportionsexpected, and gender and type of program were independent of each other.
Furthermore, the data indicate that there is no significant difference in the amount of career mentoringprovided for individuals by their mentors, regardless of the race-gender make-up of the mentor-protégé relationship. In addition, there is no significant difference in psychosocial mentoring.
------------------------------Insert Table 4 Here
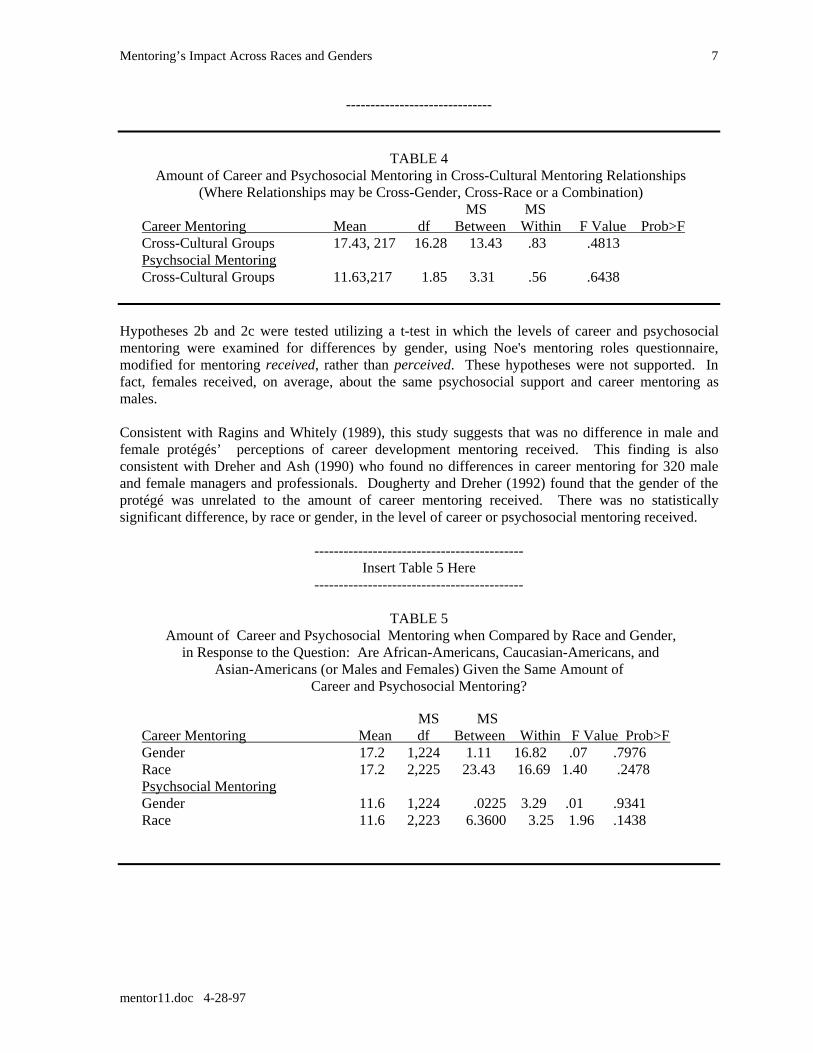
Mentoring’s Impact Across Races and Genders
mentor11.doc 4-28-97
7
------------------------------
TABLE 4 Amount of Career and Psychosocial Mentoring in Cross-Cultural Mentoring Relationships
(Where Relationships may be Cross-Gender, Cross-Race or a Combination) MS MS
Career Mentoring Mean df Between Within F Value Prob>F Cross-Cultural Groups 17.43, 217 16.28 13.43 .83 .4813 Psychsocial Mentoring Cross-Cultural Groups 11.63,217 1.85 3.31 .56 .6438
Hypotheses 2b and 2c were tested utilizing a t-test in which the levels of career and psychosocialmentoring were examined for differences by gender, using Noe's mentoring roles questionnaire,modified for mentoring received, rather than perceived. These hypotheses were not supported. Infact, females received, on average, about the same psychosocial support and career mentoring asmales.
Consistent with Ragins and Whitely (1989), this study suggests that was no difference in male andfemale protégés’ perceptions of career development mentoring received. This finding is alsoconsistent with Dreher and Ash (1990) who found no differences in career mentoring for 320 maleand female managers and professionals. Dougherty and Dreher (1992) found that the gender of theprotégé was unrelated to the amount of career mentoring received. There was no statisticallysignificant difference, by race or gender, in the level of career or psychosocial mentoring received.
-------------------------------------------Insert Table 5 Here
-------------------------------------------
TABLE 5 Amount of Career and Psychosocial Mentoring when Compared by Race and Gender,
in Response to the Question: Are African-Americans, Caucasian-Americans, andAsian-Americans (or Males and Females) Given the Same Amount of
Career and Psychosocial Mentoring?
MS MS Career Mentoring Mean df Between Within F Value Prob>F Gender 17.2 1,224 1.11 16.82 .07 .7976 Race 17.2 2,225 23.43 16.69 1.40 .2478 Psychsocial Mentoring Gender 11.6 1,224 .0225 3.29 .01 .9341 Race 11.6 2,223 6.3600 3.25 1.96 .1438
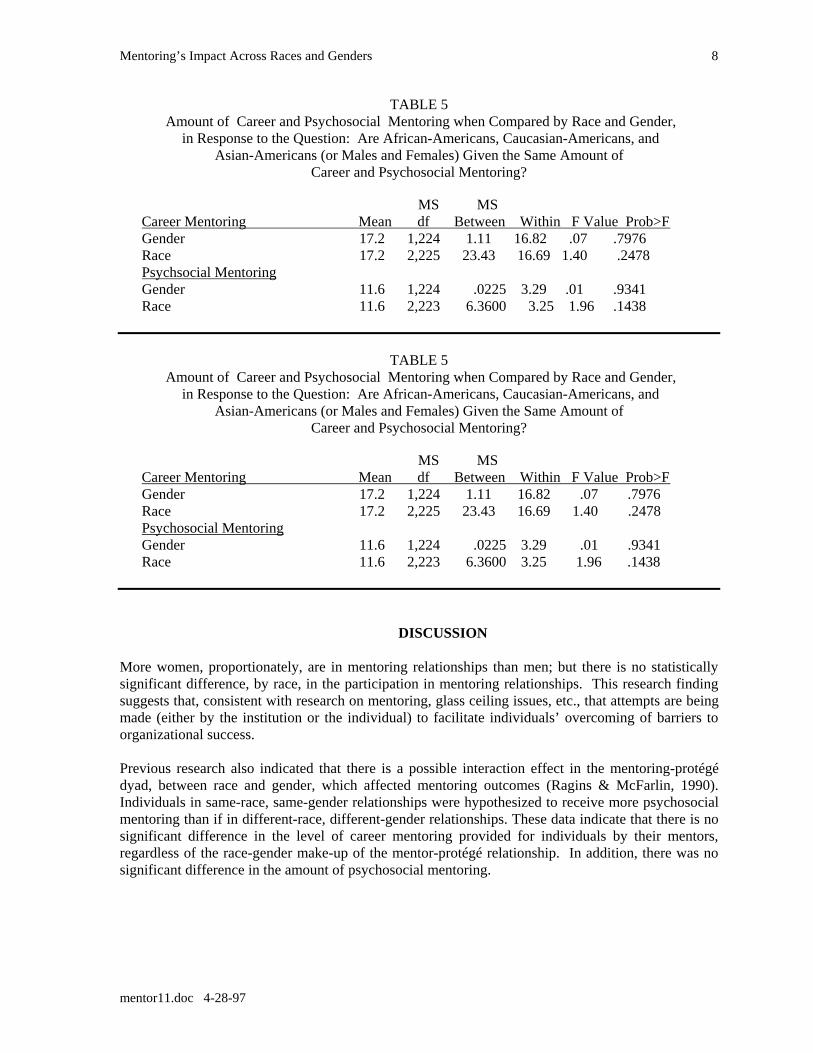
Mentoring’s Impact Across Races and Genders
mentor11.doc 4-28-97
8
TABLE 5 Amount of Career and Psychosocial Mentoring when Compared by Race and Gender,
in Response to the Question: Are African-Americans, Caucasian-Americans, andAsian-Americans (or Males and Females) Given the Same Amount of
Career and Psychosocial Mentoring?
MS MS Career Mentoring Mean df Between Within F Value Prob>F Gender 17.2 1,224 1.11 16.82 .07 .7976 Race 17.2 2,225 23.43 16.69 1.40 .2478 Psychsocial Mentoring Gender 11.6 1,224 .0225 3.29 .01 .9341 Race 11.6 2,223 6.3600 3.25 1.96 .1438
TABLE 5 Amount of Career and Psychosocial Mentoring when Compared by Race and Gender,
in Response to the Question: Are African-Americans, Caucasian-Americans, andAsian-Americans (or Males and Females) Given the Same Amount of
Career and Psychosocial Mentoring?
MS MS Career Mentoring Mean df Between Within F Value Prob>F Gender 17.2 1,224 1.11 16.82 .07 .7976 Race 17.2 2,225 23.43 16.69 1.40 .2478 Psychosocial Mentoring Gender 11.6 1,224 .0225 3.29 .01 .9341 Race 11.6 2,223 6.3600 3.25 1.96 .1438
DISCUSSION
More women, proportionately, are in mentoring relationships than men; but there is no statisticallysignificant difference, by race, in the participation in mentoring relationships. This research findingsuggests that, consistent with research on mentoring, glass ceiling issues, etc., that attempts are beingmade (either by the institution or the individual) to facilitate individuals’ overcoming of barriers toorganizational success.
Previous research also indicated that there is a possible interaction effect in the mentoring-protégédyad, between race and gender, which affected mentoring outcomes (Ragins & McFarlin, 1990).Individuals in same-race, same-gender relationships were hypothesized to receive more psychosocialmentoring than if in different-race, different-gender relationships. These data indicate that there is nosignificant difference in the level of career mentoring provided for individuals by their mentors,regardless of the race-gender make-up of the mentor-protégé relationship. In addition, there was nosignificant difference in the amount of psychosocial mentoring.
Mentoring’s Impact Across Races and Genders
mentor11.doc 4-28-97
9
CONCLUSIONS
Even when minorities and women are provided with the same access to mentors; when they receivesubstantially the same levels of career and psychosocial mentoring; and when they feel as affectivelycommitted to the organization, and with as little intention to turnover as Caucasian males (Smith,Little, & Markham, 1997a, 1997b), they still experience the workplace differently. If the purpose ofmentoring is to help them overcome problems in accessing organizational rewards, perhaps they needsignificantly more career and psychosocial mentoring than their Caucasian male counterparts. It isconceivable that maintaining the same levels across races and genders merely perpetuates the statusquo. This notion also supports the argument that changing the individual through mentoring does notchange the organization or the environment in which the individual works. If practices and policiesare imbedded in the organization such that race and gender matter, then the experiences of individualsas a group may not change unless the organization’s structure and underlying processes also change.
Organizations seem to be “doing the right things” and attempting to facilitate the success ofindividuals. However, they may be doing these things to “change” the individual, which has little orno effect on the possible underlying tensions embedded in the organizational structure. Therefore, anextension of this study should include a research design that will examine, both quantitatively andqualitatively, the experiences of individuals as group members but also those processes, policies, andattitudes that may be embedded within the organizational structure itself. For example, one mightexamine the division of labor, of allowed behaviors, locations in physical space, choice ofappropriate work, language use, clothing and presentation of self, which are part of the processeswhich help produce gendered and racialized components of the division of labor and of individualidentity. The two views may better inform about what is occurring within the organization so thatproper interventions can be designed and implemented.
In addition, the beliefs of individuals regarding their organizational experiences are critical in understandingthe processes through which they go from feeling as if they do not belong to feeling accepted and a part of theorganization. An approach which begins to examine this phenomenon is to view the individual’s experiencethrough institutional isolation and social isolation lenses. These constructs attempt to examine the wayindividuals encounter, experience, and are changed by the organizational environment. This approach, alongwith an organizational-level examination of policies and structures, may provide valuable insight into theemployment relationship and the extent to which race and gender matter within the organization. Theorganization may then be able to appropriately intervene and ameliorate the effect on the individual andoverall organizational effectiveness.
FUTURE RESEARCH
This study has demonstrated that continued research in this area is necessary. In addition, there maybe a missing link between mentoring and individual and organizational outcomes that explains howthese programs impact organizational outcomes. Perhaps continued exploration of newly developedconstructs such as institutional isolation, social isolation, and perceived organizational support couldprove fruitful in explaining differential work experiences of women, minorities and Caucasian males.A critical element in continuing this stream of research is the ability to capture qualitative data whichwill provide more depth in describing the variety of experiences of the targeted groups, as well ascategorizing the types of experiences and practices which contribute to one’s feelings of isolation.Furthermore, a longitudinal design which examines the effect of mentoring on the qualitativeexperiences of individuals would also enhance the understanding of organizational experiences. In
Mentoring’s Impact Across Races and Genders
mentor11.doc 4-28-97
10
the future, also, research utilizing small sample sizes of racial/ethnic minorities will be modified, perCox (1990), so that valuable insight can be gained about these groups’ work experiences.
This study has demonstrated that race and gender do matter within the organization. Women aremore likely than men to experience mentoring relationships and the type of program one is in may beaffected by one’s race. It is not only an individual’s race and gender that have an impact, however,since individuals with similar mentoring experiences do not reap the same organizational benefits.There may be racialized and gendered processes within the organization that counteract the benefit oforganizational interventions such as mentoring. If this is the case, organizations are “doing the rightthing” but at the wrong organizational level than work with discreet individuals, rather the structures,polices and practices should be examined. More detailed exploration of this possibility is needed iforganizations are going to be able to effectively utilize the abilities and talents ofall groups within the organization.
SELECTED REFERENCES
Chao, G., O'Leary, A.M., Walz, P.M., Klein, H.J., and Gardner, P.D. (1989, April). The content and process of organizational socialization. Paper presented at the Fourth Annual Conference for the Society of Industrial and Organizational Psychology, Inc., Boston, MA.
Collins, N.W. (1983). Professional women and their mentors. Englewood Cliffs, NJ: Prentice-Hall.
Dreher, G.F. and Ash, R.A. (1990). A comparative study of mentoring among men and women in managerial, professional and technical positions. Journal of Applied Psychology, 75, 539-546.
Fagen, M. and Walters, G. (1982). Mentoring among teachers. Journal of Educational Research, 76:113-118.
Fagenson, E.A. (1989). The mentor advantage: Perceived career/job experiences of protégés vs. nonprotégés. Journal of Organizational Behavior, 10, 309-320.
Fagenson, E.A. (1988). The power of a mentor. Groups & Organization Studies, 13, 182-194.
Gaskill, L.R. (1991). Same-sex and cross-sex mentoring of female protégés: A comparative analysis. The Career Development Quarterly, September 1991, Vol. 40, 48:63.
George, P. and Kummerow, J. (1981). Mentoring for career women. Training, 18(2):44-49.
Halcomb, R. (1980). Mentors and the successful woman. Across the Board, 17(2):13-18.
Hunt, D.M. & Michael, C. (1983). Mentorship: A career training and development tool. Academy of Management Review, 8, 475-485.
Kram, K.E. (1985). Mentoring at work: Developmental relationships in organizational life. Glenview, IL: Scott, Foresman.
Noe, R. A. (1988a). Women and mentoring: A review and research agenda. Academy of Management Review, 13, 65-78.
Noe, R.A. (1988b). An investigation of the determinants of successful assigned mentoring

Mentoring’s Impact Across Races and Genders
mentor11.doc 4-28-97
11
relationships. Personnel Psychology, 41, 457-479.
Olain, J.D., Carroll, S.J., Giannantonio, C.M. and Feren, D.B. (1988). What do protégés look for in a mentor: Results of three experimental studies. Journal of Vocational Behavior, 33, 15-37.
Queralt, M. (1982). The role of the mentor in the career development of university faculty members and academic administrators. Presented at the annual meeting of the National Association of Women Deans, Administrators and Counselors, 3 April 1982, Indianapolis, IN. ERIC Document Reproduction Service, ED 216 614.
Ragins, B.R. (1989). Barriers to mentoring: The female manager's dilemma. Human Relations, 42:1-22.
Ragins, B. R. and Cotton, J. L. (1991). Easier said than done: Gender differences in perceived barriers to gaining a mentor. Academy of Management Journal, 34, 939-951.
Ragins, B.R. and McFarlin, D.B. (1990). Perceptions of mentor roles in cross-gender mentoring relationships. Journal of Vocational Behavior, 37, 321-339.
Ragins, B.R. and Sundstrom, E. (1989). Gender and power in organizations: A longitudinal perspective. Psychological Bulletin, 105:51-88.
Scandura, T. (1992). Mentorship and career mobility: An empirical investigation. Journal of Vocational Behavior, 13, 169-174.
Schockett, M.R. and Haring-Hidore, M. (1985). Factor-analytic support for psychosocial and vocational mentoring functions. Psychological Reports, 47, 637-630.
Thomas, D.A. (1990). The impact of race on managers' experiences of developmental relationships (mentoring and sponsorship): An intra-organizational study. Journal of Organizational Behavior, 11, 479-492.
Vertz, L.L. (1985). Women, occupational advancement and mentoring: An analysis of one public organization. Public Administration Review, 45(3), 415-423.
Whitely, W., Dougherty, T. and Dreher, G. (1992). Correlates of career-oriented mentoring for early career managers and professionals. Journal of Organizational Behavior, Vol. 13, 141-154.
Zey, M.G. (1984). The mentor connection. Homewood, IL: Dow Jones-Irwin.
REFOCUSED AND RESTRUCTURED: USING MANAGER-TO-MANAGERMENTORING TEAMS TO INFILTRATE A NEW CORPORATE MISSION
Deborah W. Brown, Long Island University, Brookville, NY 11548 (516) 299–4232Gregory M. Kellar, Long Island University, Brookville, NY 11548 (516) 299–3914
ABSTRACT
Advantage, Inc. is an established international firm conducting business in the life insurance and financialservices industries. Advantage recently redefined its corporate mission to emphasize its goal of becominga “know-how” organization. This article discusses the intervention that was used by the firm to invoke thetransition from a production to a knowledge-based orientation. Drawing on the mentoring, organizationallearning, and Total Quality Management (TQM) literatures, this article presents a general model ofmentoring and the process used to tailor a mentoring program designed to meet the specific needs ofAdvantage. Managers, consultants, and others dealing with cultural change and intraorganizationaldynamics should benefit from this focus on the management of knowledge through the establishment ofmanager-to-manager mentoring teams.
INTRODUCTION
Over the past five years, the concept of the “learning organization” has come to the forefront of businessacademic and top-level management interest. The evolutionary process of becoming a learningorganization begins with a reevaluation of the organization’s objectives and values with an eye towardschanging the corporate culture [6]. Top management’s challenge in the creation of a learningorganization, therefore, becomes the fostering of an environment which encourages innovation, openness,and sharing of information by the firm’s employees [4].
Advantage, Inc. (fictitious name of actual company) is an established international firm conductingbusiness in the life insurance and financial services industries. In the Spring of 1997 senior-levelmanagement redefined the company’s mission to emphasize its transition to a “know-how” organization.There were several external and internal factors which compelled the company to redefine its corporatemission. The external factors included: 1) increasing public scrutiny over unethical business practices;and 2) interindustry competition as a result of multi-line product offerings from firms outside the financialservices industry. The internal factors included: 1) the firm’s historical emphasis on productionrequirements; 2) a “fly-paper” approach to recruiting and selecting account representatives; 3) focus onquantity not quality of business; and 4) a highly political environment encouraging “secrecy” of bestpractices.
In an effort to support the new mission Advantage initially redesigned its business-level structures. Thisincluded the consolidation of territories and the enhanced empowerment of general managers at thebusiness-unit level. The consolidation of Advantage had a substantial impact on management personnel atthe agency level. Prior to the consolidation, the hierarchical structure was comprised of a home office(corporate), territories, regions and agencies in descending order. Operating decisions at the agency levelwere centralized at the regional level. The consolidation resulted in fewer territorial and regional officesand approximately 50 percent fewer agencies. One objective of the consolidation was to create largermarketing sites, fostering perceptions of increased business volume. This type of environment wasanticipated to have a positive impact on productivity levels. We note that the consolidation at the agencylevel resulted in the demotion of approximately half of the organization’s general managers to associategeneral managers.

Following the consolidation, top-level management began to emphasize the importance of teamwork,learning through collaboration, and the acquisition of “know how” from the pool of talented and skilledgeneral and associate general managers. In addition, steps were taken to provide general managers with agreat deal more decision making autonomy over business-level decisions. These initiatives were to beachieved by: 1) Decentralization of business-level decisions to agency-level general managers. Generalmanagers were, therefore, empowered to run their agencies like an owner-operated business. Associategeneral managers, many of whom were formerly general managers, also had some autonomy to run theirsegment of the agency, however, within the operating business plan of the general manager. 2) Solicitinggeneral and associate general managers to informally engage in mentoring activities. This is the point atwhich we met with top-level management to discuss the feasibility of implementing a formal mentoringprogram.
THE MENTORING MODEL
Managers mentoring managers is a progressive and visionary concept. The traditional mentoring programassumes a power/dependency framework for the matching of mentoring teams. Seasoned executives,empowered by the wealth of resources they wield, are coupled with company fledglings who have beendeemed to possess management potential and who desire to acquire skills, expertise, and know how oftheir esteemed partners. The flattening of the corporate hierarchy, limited vertical career progressionopportunities, and the decentralization of decision making have forced reconsideration of the mentoringmodel under the power-dependency perspective. Alternatively, we draw upon the literatures on TotalQuality Management, organizational learning, and systems thinking as a framework for designingmentoring programs where both parties possess various strengths and weaknesses. In addition, we brieflydiscuss the proposed mentoring model and the process by which managers were matched up with eachother in an effort to begin the learning process.
Total Quality Management (TQM)
Total Quality Management is an organizational strategy that compels all members of the organization tobe involved in the process. The process is unique from other quality approaches because it emphasizesboth external (end users) and internal (co-workers, other departments) customers. Employees’ efforts inproviding “customer” service, therefore, are focused on the customer that will subsequently use theproduct and anyone inside the company with whom the employee interacts [2]. The success of a TQMprogram depends upon the degree to which employees equally address the needs of their internal andexternal customers. The TQM perspective asserts that success is derived through the success of all. A unitor department that is not achieving its goals impacts the ability of other customers (external and internal)to achieve and/or succeed their stipulated goals. We utilized the TQM focus on internal and externalcustomers to emphasize the importance of collaboration and shared knowledge among branch managers.
Organizational Learning & Systemic Thinking
Advancements in information technology and strategic focus on total quality have placed additionalcompetitive pressures on contemporary organizations. Gaining a competitive advantage has compelledorganizations to become learning organizations. According to Senge [5], “superior performance dependson superior learning.” The true learning organization is committed to rethinking its values and objectives.These activities, however, are not reserved for top-level management. All organizational participants areencouraged to examine and improve business processes, promote constructive discord, and to engage inteaching and learning initiatives that result in continuous and open dialogue [3]. One way to direct thelearning process is to develop a systemic way of thinking among managers. Similar to the TQM approach,this involves detailing the interconnectedness of organizational activities and events. The objective of this
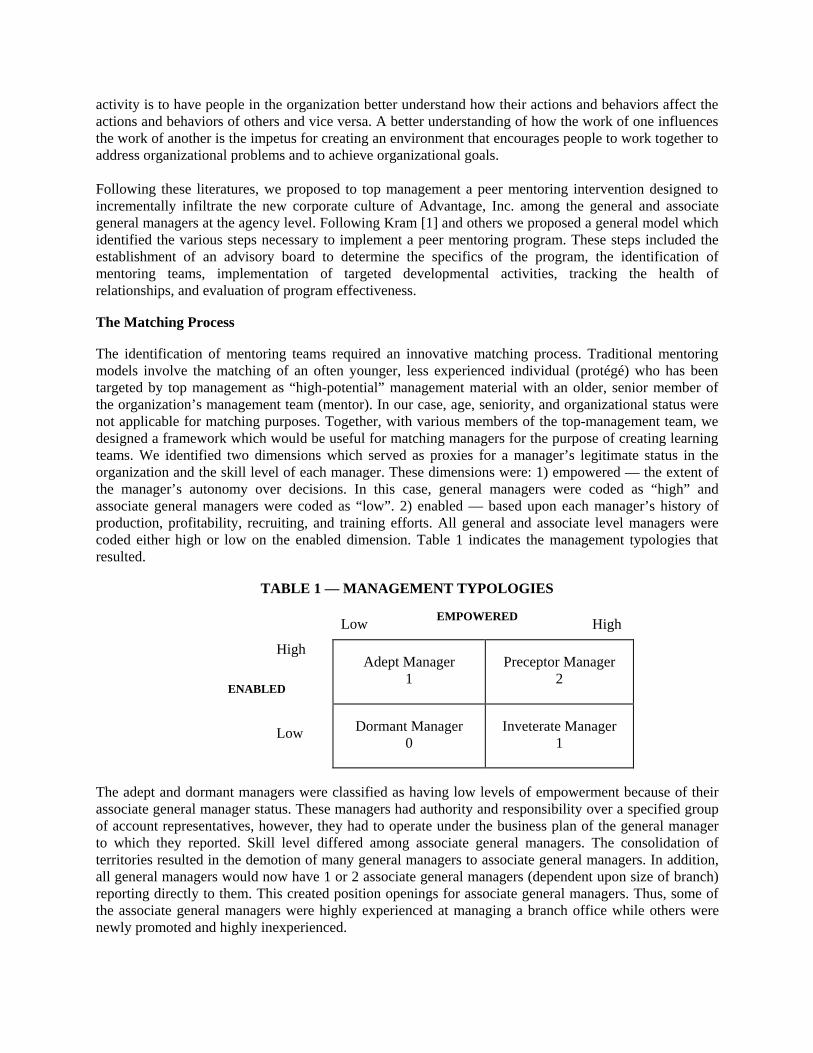
activity is to have people in the organization better understand how their actions and behaviors affect theactions and behaviors of others and vice versa. A better understanding of how the work of one influencesthe work of another is the impetus for creating an environment that encourages people to work together toaddress organizational problems and to achieve organizational goals.
Following these literatures, we proposed to top management a peer mentoring intervention designed toincrementally infiltrate the new corporate culture of Advantage, Inc. among the general and associategeneral managers at the agency level. Following Kram [1] and others we proposed a general model whichidentified the various steps necessary to implement a peer mentoring program. These steps included theestablishment of an advisory board to determine the specifics of the program, the identification ofmentoring teams, implementation of targeted developmental activities, tracking the health ofrelationships, and evaluation of program effectiveness.
The Matching Process
The identification of mentoring teams required an innovative matching process. Traditional mentoringmodels involve the matching of an often younger, less experienced individual (protégé) who has beentargeted by top management as “high-potential” management material with an older, senior member ofthe organization’s management team (mentor). In our case, age, seniority, and organizational status werenot applicable for matching purposes. Together, with various members of the top-management team, wedesigned a framework which would be useful for matching managers for the purpose of creating learningteams. We identified two dimensions which served as proxies for a manager’s legitimate status in theorganization and the skill level of each manager. These dimensions were: 1) empowered — the extent ofthe manager’s autonomy over decisions. In this case, general managers were coded as “high” andassociate general managers were coded as “low”. 2) enabled — based upon each manager’s history ofproduction, profitability, recruiting, and training efforts. All general and associate level managers werecoded either high or low on the enabled dimension. Table 1 indicates the management typologies thatresulted.
TABLE 1 — MANAGEMENT TYPOLOGIES
LowEMPOWERED
High
Adept Manager1
Preceptor Manager2
High
ENABLED
Low Dormant Manager0
Inveterate Manager1
The adept and dormant managers were classified as having low levels of empowerment because of theirassociate general manager status. These managers had authority and responsibility over a specified groupof account representatives, however, they had to operate under the business plan of the general managerto which they reported. Skill level differed among associate general managers. The consolidation ofterritories resulted in the demotion of many general managers to associate general managers. In addition,all general managers would now have 1 or 2 associate general managers (dependent upon size of branch)reporting directly to them. This created position openings for associate general managers. Thus, some ofthe associate general managers were highly experienced at managing a branch office while others werenewly promoted and highly inexperienced.
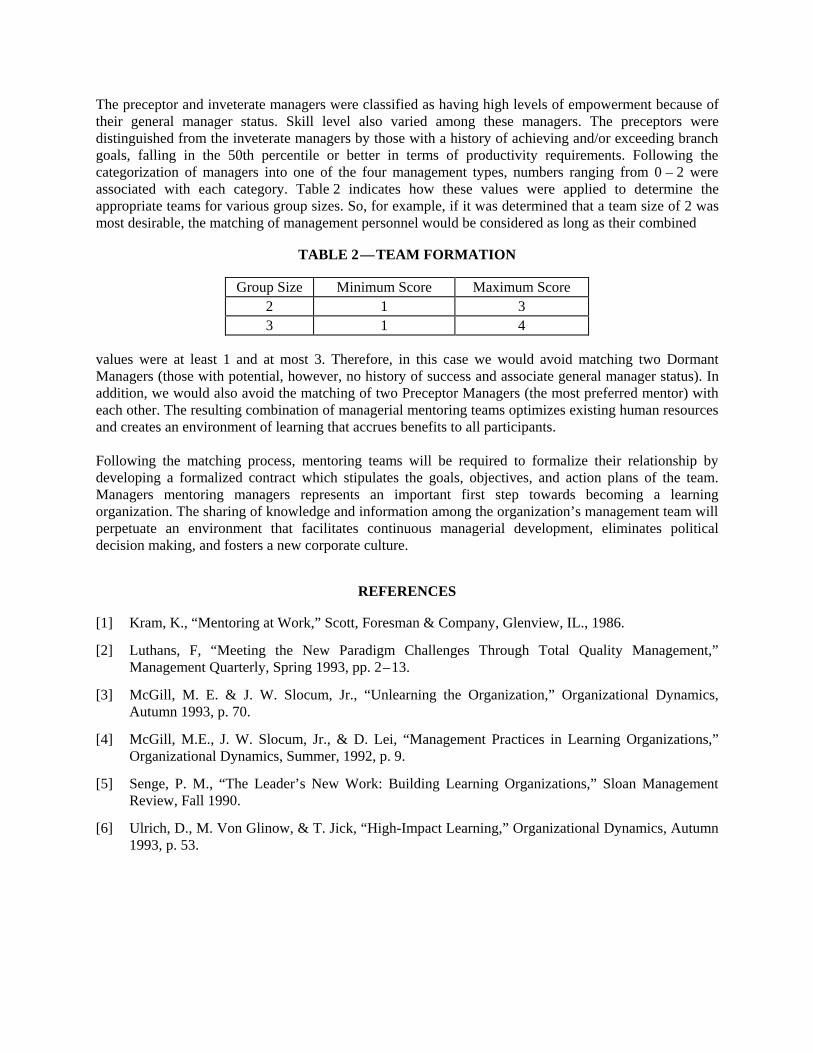
The preceptor and inveterate managers were classified as having high levels of empowerment because oftheir general manager status. Skill level also varied among these managers. The preceptors weredistinguished from the inveterate managers by those with a history of achieving and/or exceeding branchgoals, falling in the 50th percentile or better in terms of productivity requirements. Following thecategorization of managers into one of the four management types, numbers ranging from 0 – 2 wereassociated with each category. Table 2 indicates how these values were applied to determine theappropriate teams for various group sizes. So, for example, if it was determined that a team size of 2 wasmost desirable, the matching of management personnel would be considered as long as their combined
TABLE 2 — TEAM FORMATION
Group Size Minimum Score Maximum Score2 1 33 1 4
values were at least 1 and at most 3. Therefore, in this case we would avoid matching two DormantManagers (those with potential, however, no history of success and associate general manager status). Inaddition, we would also avoid the matching of two Preceptor Managers (the most preferred mentor) witheach other. The resulting combination of managerial mentoring teams optimizes existing human resourcesand creates an environment of learning that accrues benefits to all participants.
Following the matching process, mentoring teams will be required to formalize their relationship bydeveloping a formalized contract which stipulates the goals, objectives, and action plans of the team.Managers mentoring managers represents an important first step towards becoming a learningorganization. The sharing of knowledge and information among the organization’s management team willperpetuate an environment that facilitates continuous managerial development, eliminates politicaldecision making, and fosters a new corporate culture.
REFERENCES
[1] Kram, K., “Mentoring at Work,” Scott, Foresman & Company, Glenview, IL., 1986.
[2] Luthans, F, “Meeting the New Paradigm Challenges Through Total Quality Management,”Management Quarterly, Spring 1993, pp. 2 – 13.
[3] McGill, M. E. & J. W. Slocum, Jr., “Unlearning the Organization,” Organizational Dynamics,Autumn 1993, p. 70.
[4] McGill, M.E., J. W. Slocum, Jr., & D. Lei, “Management Practices in Learning Organizations,”Organizational Dynamics, Summer, 1992, p. 9.
[5] Senge, P. M., “The Leader’s New Work: Building Learning Organizations,” Sloan ManagementReview, Fall 1990.
[6] Ulrich, D., M. Von Glinow, & T. Jick, “High-Impact Learning,” Organizational Dynamics, Autumn1993, p. 53.

THE YEAR 2000 PROBLEM: INSTITUTIONAL AND ORGANIZATIONAL ECOLOGYPERSPECTIVES
Alan Cannon, Department of Management, Clemson University, Clemson, SC 29634 (864) 656-7418
Amy Woszczynski, Department of Management, Clemson University, Clemson, SC 29634 (864) 656-7418
ABSTRACT
The Year 2000 problem arises from the presence in modern systems of older computer code whichtruncates a calendar year to two digits. This truncation procedure, written into early computer software tominimize memory needs, could lead to devastating results at the turn of the century if a computer isconfronted with a calendar date of 00: Is it 1900 or 2000? While the effects of vestigial computer codeappear to be particular to this point in industrial history, we argue that at least two established schools oforganizational thought offer surprisingly elegant perspectives on this problem.
In particular, the literatures of organizational ecology and institutional theory explain not only thedifficulties firms had in recognizing and reacting to the Year 2000 problem, but also the constituentpressures placed on them by this phenomenon. We argue further that concepts such as punctuatedequilibrium (Tushman & Romanelli, 1985) and mimetic/coercive/normative isomorphism (DiMaggio &Powell, 1983) will be valuable in understanding how and why firms have responded to this issue.
THE YEAR 2000 PROBLEM
Much software written in the 1970s and 1980s used two-digit year codes to conserve precious space, yetas the turn of the century approaches, companies find themselves scrambling to update systems. Evencompanies without mainframes may be affected by the need to upgrade PCs and work with businesspartners to ensure compliance.
Estimates of the costs to repair the problem range from $30 billion (Wolpoff, 1996) to $300 billion(Nation's Business, 1997) to $600 billion (Vistica, 1997). Regardless of the final cost, however, theimpact on businesses, particularly large Fortune 500 businesses that rely heavily on mainframe data, willbe substantial.
Bruce Hall, research director at Gartner Group, a prominent marketing research firm, estimates that halfof all organizations won't finish on time, with 30% of mission-critical applications still vulnerable atdecade’s end (Malloy, 1997).
For some companies, the Year 2000 issue already has become a problem. Credit card companies, forexample, typically have expiration horizons on their cards that are three years long, impacting their abilityto serve their customers immediately. Visa and MasterCard, however, already have begun providing testcards to merchants to test the ability of point of sale systems to handle '00' expiration dates (Murphy,1997).
Other companies, such as investment firms, face further problems with potential lawsuits files byinvestors over failed trades, unpaid interest, etc. (Spiro, 1996). Even with potential legal action, securityfirms are not anxious to fund effective Year 2000 solutions. This reluctance stems in part from the factthat, unlike most other information systems (IS) projects, the Year 2000 Problem offers difficult-to-

quantify cash flows, and managers have not been able to justify the needed expense with traditionalmethods of financial analysis.
Even when informed of the need to update systems to avoid potential disaster, top management hasnevertheless been slow to direct resources toward the Year 2000 problem, in part because Year 2000projects offer no potential return on investment. According to a survey by RHI Consulting, only 35% ofChief Information Officers (CIOs) from companies with more than 100 employees thought their systemswould be affected. Moreover, less than half of those who did think they would be affected have startedworking on a solution (Anonymous, 1996).
Since de Jager's (1993) seminal article on the Year 2000 problem, however, IS personnel have begun topush management toward resolving the issue. Moreover, questions of legal liability if managers do notupdate the computer systems have added further impetus to fund Year 2000 projects (Weiss and Palenski,1996).
It appears that management’s response to the Year 2000 threat offers researchers a unique opportunity totest theories from organizational ecology and institutional sociology. Specifically, pressures fromcustomers, suppliers, investors and others seem to fit sociological models of organizational isomorphismin which firms are legitimized through mimetic, normative and coercive processes (DiMaggio & Powell,1983). Further, struggles firms have had in formulating effective and efficient responses to the Year 2000problem appear to validate organization ecological models in which success is contingent upon changingenvironmental conditions (Tushman & Romanelli, 1985).
ORGANIZATIONAL ECOLOGY
Organizational ecologists (e.g., Hannan & Freeman, 1977) focus on collectivities of organizations whichshare many characteristics. These characteristics can be thought of as constraints, and the organizationsplotted along their resource dependencies. As Hannan & Freeman (1977) argue, competition withinresource space for scarce resources serves to select out those organizations which are least efficient.
Environmental conditions, therefore, are the critical foci of analysis within this school, which posits thatfor a given set of environmental conditions (i.e., resource set) there is one “best” or most-efficient set oforganizational structures and activities.
Adaptive/learning theorists within this literature argue that although environments do constrain and selectout inefficient organizations, organizations are not without recourse and can survive in fundamentallydifferent environmental conditions. Not only is learning and adaptation possible, it occurs on multiplelevels (i.e., within organizations and/or within industries) and in multiple ways (i.e., incremental orrevolutionary) (Van de Ven & Poole, 1995).
As Meyer, Brooks, & Goes (1990) argue, organizations both anticipate and survive radically transformedcompetitive landscapes. During relatively placid periods of environmental change, learning/adaptation isincremental in nature and is oriented toward greater efficiency in terms of resource and output flows(Gersick, 1991).
During revolutionary periods, however, organizations must endure protracted confusion and loweredperformance before they emerge successfully into the next placid period (Tushman & Romanelli, 1985).Inasmuch as the end of this decade and the looming Year 2000 problem could well be such arevolutionary (i.e., divergent) period, decision-making patterns vis-à-vis information systems that wereestablished during convergent years may not yield adequate responses. Indeed, organizations which were

most effective in information systems decision making during relatively placid years likely endured themost confusion during their early attempts at formulating a Year 2000 response.
Proposition Ia: Organizations’ responses to the Year 2000 problem represent substantial departures frompatterns established in earlier IS decision-making.
Proposition Ib: Organizations with well-established IS decision-making patterns endured more earlyconfusion and less early effectiveness than those with less-established IS patterns.
INSTITUTIONAL THEORY
Institutional theory shares with organizational ecology “a convergent focus on the collective organizationof environments” (Baum & Oliver, 1996). Yet from organizational ecology perspectives, homogeneitywithin industries or “populations” is not supportable; generalized throughout ecological analysis is anassumption that as two organizations become more similar, each becomes singly more susceptible tobeing selected out (Hannan & Freeman, 1977).
Institutional theory posits, however, that at least some selection pressure flows from social collectivitieswhich define both what is proper and desirable in organizational structure and strategies (Zucker, 1983).Unless a given organization can ultimately reorient its institutional environment, withdrawal or restrictionof resource flows and the organization’s demise will follow (Baum & Oliver, 1991).
Rather than emphasizing organizations’ resource usage and output flows, the institutional school focuseson legitimacy, organizations’ creation and maintenance of positive perceptions among influential actors(Oliver, 1991). Institutional theory also attempts to account for organizations’ tendencies to adoptstructures and activities that already are in use by other organizations (Palmer, Jennings & Zhou, 1993).The literature often refers to three broad types of institutional pressure – mimetic, coercive and normative– that lead to increased homogeneity among organizations.
Mimetic pressure, the urging to adopt structures and activities because others already have adopted them,has been described as analogous to “a contagion process” in which features are passed from a feworganizations to many (Haveman, 1993). Coercive pressure results in both stated and unstated demandsmade on organizations by stakeholders who have at least some degree of influence over the organizations’decision-making process (DiMaggio & Powell, 1983). Finally, normative pressure emerges from internalstakeholders who share cultural, professional or educational backgrounds with similar stakeholders inother organizations (Palmer, Jennings & Zhou, 1993). The net outcomes of these pressures, as argued byinstitutional theorists, are spheres of legitimacy which serve as boundaries for organizational actions andstructures.
Clearly institutional forces play a role in shaping organizations’ responses to the Year 2000 problem.From pressures from investors to threats of legal responsibility, IS decision-makers have been spurred inpart by forces similar to those described by institutional theorists. Indeed, the explosive growth in themarket value of companies specializing in Year 2000 solutions echoes assertions made by bandwagontheorists (Abrahamson & Rosenkopf, 1993).
Proposition 2a: Organizations responding to the Year 2000 threat have shown sensitivity to the efforts ofother, similar organizations (mimetic isomorphism).
Proposition 2b: Organizations’ sensitivities to the Year 2000 threat are dependent in part on the degreeto which their IS professionals are active participants in the IS profession (normative isomorphism).

Proposition 2c: Organizational stakeholders such as investors or customers have had substantial roles instimulating responses to the Year 2000 threat.
CONCLUSION
While the process of testing the propositions set forth in this paper is ongoing, it seems clear that the Year2000 threat is a rare opportunity to evaluate the relative efficacy of a pair of theoretical streams. Further,we believe, extensive study of this phenomenon should increase the field’s understanding ofenvironmental forces and their effects on organizational decision-making.
REFERENCES
Abrahamson, E. & Rosenkopf, L. (1993). “Institutional and competitive bandwagons: Usingmathematical modeling as a tool to explore innovation diffusion.” Academy of Management Review. 3:487-517.
Anonymous (1996). "Millennium bug: Pending disaster or hype?" Business Communications Review.26(12): 12.
Baum, J.A.C. & Oliver, C. (1996). “Toward an institutional ecology of organizational founding,”Academy of Management Journal. 39: 1378-1427.
de Jager, P. (1993). "Doomsday 2000." Computerworld. 27(36): 105-109.
DiMaggio, P. & Powell, W.W. (1983). “The iron cage revisited: Institutional isomorphism and collectiverationality in organizational fields.” American Sociological Review. 48: 147-160.
Gersick, C.J.G. (1991). “Revolutionary change theories: A multilevel exploration of the punctuatedequilibrium paradigm.” Academy of Management Review. 16: 10-36.
Hannan, M.T. & Freeman, J. (1977). “The population ecology of organizations.” American Journal ofSociology. 32: 929-964.
Haveman, H.A. 1993. “Follow the leader: Mimetic isomorphism and entry into new markets.”Administrative Science Quarterly. 38: 593-627.
Malloy, A. (1997). "Beat the clock!" Computerworld. 31(1): 67-70.
Murphy, P. (1997). "Year 2000 problem arrives early for credit card industry." Stores. 79(2): 59-60.
Meyer, A.D., Brooks, G.R. & Goes, J.B. (1990). “Environmental jolts and industry revolutions:Organizational responses to discontinuous change,” Strategic Management Journal. 11: 93-110.
Oliver, C. (1991). “Strategic responses to institutional processes.” Academy of Management Review.16(1): 145-179.
Palmer, D.A., Jennings, P.D. & Zhou, X. (1993). “Late adoption of the multidivisional form by large U.S.corporations: Institutional, political and economic accounts.” Administrative Science Quarterly. 38: 100-131.

"Preventing time from marching backward." (1997). Nation's Business. 85(1): 44.
Spiro, L.N. (1996). "Panic in the year zero zero." Business Week.
Tushman, M.L. & Romanelli, E. (1985). “Organizational evolution: A metamorphosis model ofconvergence and reorientation.” Research in Organizational Behavior. 7: 171-222.
Vistica, G. L. (1997). "I'm sorry, sir, but the 20th Century just disappeared." Newsweek. 129(4): 18.
Weiss, B., and Palenski, R.J. (1996). "Who shall be answerable for software apocalypse? Millennium-related computing glitches will bring judgment day for vendors and users." The National Law Journal.19(11): B9.
Wolpoff, C.R. (1996). "Looming computer problem worries Congress, experts." Congressional QuarterlyWeekly Report. 54(37): 2595.

TRACK: Marketing and Logistics
"" BBaannkk MM aarr kkeett iinngg oonn tthhee II nntteerr nneett aanndd EEnnttrr eepprr eenneeuurr ss""MMaarrsshhaall ll MM.. FFrr iieeddmmaann,, NNoorrffoollkk SSttaattee UUnniivveerrssii ttyySSaannttoosshh CChhoouuddhhuurryy,, NNoorrffoollkk SSttaattee UUnniivveerrssii ttyy
"" AA CCllaassss PPrr oojj eecctt ffoorr CCoonnssiiddeerr aatt iioonn:: TThhee MM aarr kkeett iinngg ooff OOnn--CCaammppuuss DDiinniinngg SSeerr vviicceess""MMaarrkk AAnnddrreeww MMii ttcchheell ll ,, UUnniivveerrssii ttyy SSoouutthh CCaarrooll iinnaa -- SSppaarrttaannbbuurrggSStteevvee EEddwwaarrddss,, UUnniivveerrssii ttyy ooff SSoouutthh CCaarrooll iinnaa -- SSppaarrttaannbbuurrggGGrreeggoorryy BB.. TTuurrnneerr,, CCooll lleeggee ooff CChhaarr lleessttoonn
"" AA SSyynntthheessiizzeedd AApppprr ooaacchh ttoo MM aarr kkeett RReessppoonnssee MM ooddeell iinngg""PPiinngg WWaanngg,, JJaammeess MMaaddiissoonn UUnniivveerrssii ttyyFFaayyee TTeeeerr,, JJaammeess MMaaddiissoonn UUnniivveerrssii ttyyHHaarroolldd TTeeeerr,, JJaammeess MMaaddiissoonn UUnniivveerrssii ttyyXXuueeyyaann SSuu,, JJaammeess MMaaddiissoonn UUnniivveerrssii ttyy
"" AAffrr iiccaann--AAmmeerr iiccaann SSttuuddeennttss'' EEtthhnnoocceennttrr iissmm:: AAnn AAppppll iiccaatt iioonn ooff CCEETTSSCCAALL EE""AAll iiccaann KKaavvaass,, WWiinnssttoonn SSaalleemm SSttaattee UUnniivveerrssii ttyyMMaakk KKhhoojjaasstteehh,, WWiinnssttoonn -- SSaalleemm SSttaattee UUnniivveerrssii ttyy
"" PPoossttmmooddeerr nn aanndd PPoossii tt iivviisstt LL iinnkkss iinn CCoonnssuummeerr BBeehhaavviioorr RReesseeaarr cchh""AAllaann JJ.. GGrreeccoo,, NNoorrtthh CCaarrooll iinnaa AA&&TT SSttaattee UUnniivveerrssii ttyy
"" AAnn EExxpplloorr aatt iioonn ooff tthhee SSiimmii llaarr ii tt iieess aanndd DDii ff ffeerr eenncceess BBeettwweeeenn SSaalleess MM aannaaggeerr ss'' aanndd SSaalleessppeeoopplleess''PPeerr cceepptt iioonnss ooff SSaalleess MM aannaaggeerr ss'' CCoonnttrr ooll OOvveerr TTrr aaddii tt iioonnaall SSaalleess MM aannaaggeerr --RReellaatteedd AAcctt iivvii tteess""
TThheerreessaa BB.. FFllaahheerrttyy,, OOlldd DDoommiinniioonn UUnniivveerrssii ttyyMMyyrroonn GGllaassssmmaann,, OOlldd DDoommiinniioonn UUnniivveerrssii ttyy
"" AAppppll iiccaatt iioonn ooff OOppeerr aatt iioonnss RReesseeaarr cchh ttoo II mmpprr oovvee DDeeffeennssee DDiissttrr iibbuutt iioonn PPrr aacctt iicceess""KKuurrtt FF.. SScchhwwaarrzz,, DDeeffeennssee LLooggiissttiiccss AAggeennccyy
"" PPrr ooff ii ttaabbii ll ii ttyy PPootteenntt iiaall AAllggoorr ii tthhmm ffoorr SSiimmppllyy--SSttrr uuccttuurr eedd AAiirr CCaarr rr iieerr ss""SSaammuueell KK.. GGyyaappoonngg,, LLoonnggwwoooodd CCooll lleeggeeNNeeii ll JJ.. HHuummpphhrreeyyss,, LLoonnggwwoooodd CCooll lleeggeeMMaabbeell QQiiuu,, LLoonnggwwoooodd CCooll lleeggee
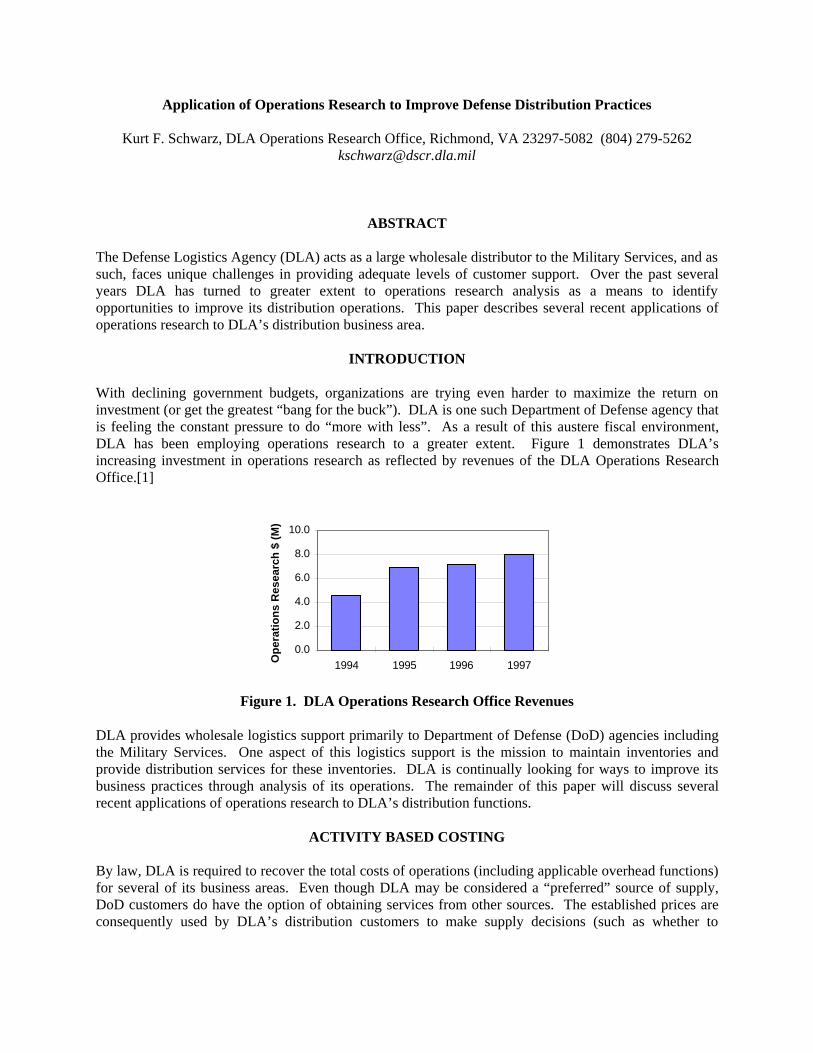
Application of Operations Research to Improve Defense Distribution Practices
Kurt F. Schwarz, DLA Operations Research Office, Richmond, VA 23297-5082 (804) [email protected]
ABSTRACT
The Defense Logistics Agency (DLA) acts as a large wholesale distributor to the Military Services, and assuch, faces unique challenges in providing adequate levels of customer support. Over the past severalyears DLA has turned to greater extent to operations research analysis as a means to identifyopportunities to improve its distribution operations. This paper describes several recent applications ofoperations research to DLA’s distribution business area.
INTRODUCTION
With declining government budgets, organizations are trying even harder to maximize the return oninvestment (or get the greatest “bang for the buck”). DLA is one such Department of Defense agency thatis feeling the constant pressure to do “more with less”. As a result of this austere fiscal environment,DLA has been employing operations research to a greater extent. Figure 1 demonstrates DLA’sincreasing investment in operations research as reflected by revenues of the DLA Operations ResearchOffice.[1]
0.0
2.0
4.0
6.0
8.0
10.0
1994 1995 1996 1997Ope
ratio
ns R
esea
rch
$ (M
)
Figure 1. DLA Operations Research Office Revenues
DLA provides wholesale logistics support primarily to Department of Defense (DoD) agencies includingthe Military Services. One aspect of this logistics support is the mission to maintain inventories andprovide distribution services for these inventories. DLA is continually looking for ways to improve itsbusiness practices through analysis of its operations. The remainder of this paper will discuss severalrecent applications of operations research to DLA’s distribution functions.
ACTIVITY BASED COSTING
By law, DLA is required to recover the total costs of operations (including applicable overhead functions)for several of its business areas. Even though DLA may be considered a “preferred” source of supply,DoD customers do have the option of obtaining services from other sources. The established prices areconsequently used by DLA’s distribution customers to make supply decisions (such as whether to
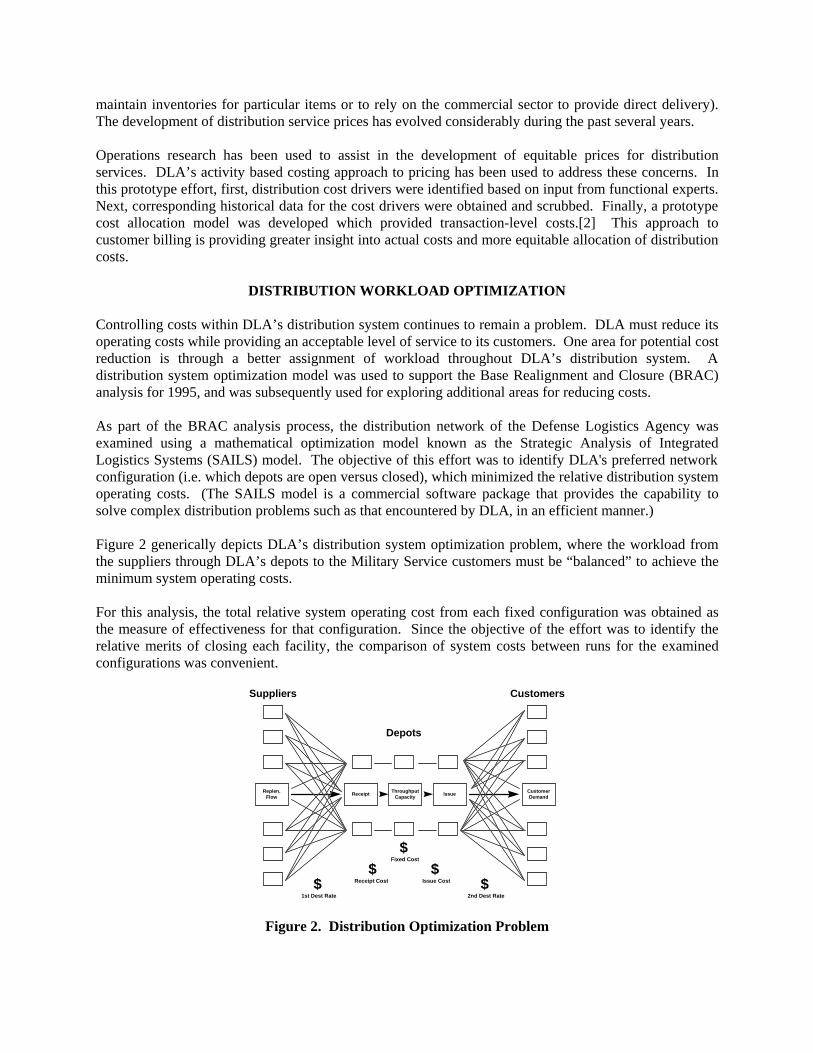
maintain inventories for particular items or to rely on the commercial sector to provide direct delivery).The development of distribution service prices has evolved considerably during the past several years.
Operations research has been used to assist in the development of equitable prices for distributionservices. DLA’s activity based costing approach to pricing has been used to address these concerns. Inthis prototype effort, first, distribution cost drivers were identified based on input from functional experts.Next, corresponding historical data for the cost drivers were obtained and scrubbed. Finally, a prototypecost allocation model was developed which provided transaction-level costs.[2] This approach tocustomer billing is providing greater insight into actual costs and more equitable allocation of distributioncosts.
DISTRIBUTION WORKLOAD OPTIMIZATION
Controlling costs within DLA’s distribution system continues to remain a problem. DLA must reduce itsoperating costs while providing an acceptable level of service to its customers. One area for potential costreduction is through a better assignment of workload throughout DLA’s distribution system. Adistribution system optimization model was used to support the Base Realignment and Closure (BRAC)analysis for 1995, and was subsequently used for exploring additional areas for reducing costs.
As part of the BRAC analysis process, the distribution network of the Defense Logistics Agency wasexamined using a mathematical optimization model known as the Strategic Analysis of IntegratedLogistics Systems (SAILS) model. The objective of this effort was to identify DLA's preferred networkconfiguration (i.e. which depots are open versus closed), which minimized the relative distribution systemoperating costs. (The SAILS model is a commercial software package that provides the capability tosolve complex distribution problems such as that encountered by DLA, in an efficient manner.)
Figure 2 generically depicts DLA’s distribution system optimization problem, where the workload fromthe suppliers through DLA’s depots to the Military Service customers must be “balanced” to achieve theminimum system operating costs.
For this analysis, the total relative system operating cost from each fixed configuration was obtained asthe measure of effectiveness for that configuration. Since the objective of the effort was to identify therelative merits of closing each facility, the comparison of system costs between runs for the examinedconfigurations was convenient.
ThroughputCapacity
Receipt Issue CustomerDemand
Replen.Flow
Suppliers Customers
Depots
$1st Dest Rate
$2nd Dest Rate
$Receipt Cost
$Issue Cost
$Fixed Cost
Figure 2. Distribution Optimization Problem

Because the optimization analysis addressed only relative operating costs, it was imperative that resultsfrom it be used with other information in the development of closure recommendations. This analysisprovided an important operational cost perspective on DLA's distribution system, but it was only one partof the overall decision-making process.
The optimization model application to the analysis of DLA's distribution system found that most depotclosure alternatives had the potential for significant savings when compared to the baseline of keeping allfacilities open. Generally, the bulk of savings were realized from the elimination of fixed infrastructurecosts. The differences in annual system costs among alternatives was found to be relatively smallcompared to the overall annual distribution budget (and projected savings), however, when accrued overtime these differences may be significant.
More recently, this workload optimization approach was used to examine if there were any additionalopportunities for cost reduction following the closure of several facilities as a result of BRAC actions.Not surprisingly, this analysis found that most excess capabilities were eliminated through plannedBRAC actions, and that only relatively modest savings were likely to be realized through additionalrealignment of workload.
TRANSSHIPMENT ANALYSIS
In an attempt to reduce costs while maintaining reasonable levels of customer service, a “transshipment”mode of distribution operations was considered for several of DLA’s depots. Under this concept,wholesale inventories at these depots would be relocated to regional locations, and demands would besatisfied via “satellite” operations. These satellite depots would serve as cross-docking or transshipmentpoints, with corresponding reduced staffs and infrastructures.
An analysis was conducted to examine the feasibility and cost effectiveness of utilizing five DLA depotsas transshipment points for wholesale supplies. The analysis quantified the effects on relevant costs(infrastructure, personnel, transportation), as well as any impact to the customers (such as increasedresponse time), and also considered any efficiencies which could be achieved as a result of consolidatingoperations.
The transshipment mode of operations was found to have the potential to provide some significantsavings (on the order of $100 million over a five year period, largely due to the avoidance of plannedconstruction projects at the satellite sites), although there would be some degradation of customer service.Despite the economic benefits of this approach, storage space requirements at the “centralized” depotsappear to be a limiting factor in the effective implementation of this concept.
HAZARDOUS MATERIAL (HAZMAT)
DLA currently provides HAZMAT distribution support from over 30 sites. The requirement to complywith numerous federal and state regulations and laws regarding the storage, handling and transportation ofHAZMAT significantly increases costs compared to non-hazardous material. Consolidation of operationshas the potential to reduce costs.
A study was undertaken to examine the feasibility of consolidating DLA’s HAZMAT operations to alesser number of sites. This study found that annual recurring savings of over $3 million could beachieved through the consolidation of existing workload, but at the expense of some degradation ofcustomer service.[3]
While this analysis showed the feasibility of relocating DLA’s HAZMAT mission to one primary site, itdid not address some potentially important issues. Alternate ways to support the hazardous mission werebeyond the scope of this effort. For example, contractor support (direct vendor delivery) arrangementscould be an alternative which could significantly reduce storage space requirements on DLA’s depots.
A follow-on analysis has been initiated which will use available vendor cost and performance datacompared with current DLA depot cost and performance on similar items to determine the economicfeasibility of changing to alternative methods of support. The comparison will consider the impact ofoutsourcing selected HAZMAT items on customer support and DLA transportation, distribution andcompliance costs.
SUMMARY
Analyses utilizing operations research techniques have been used to assist DLA’s distribution businessarea in the improvement of operations. This paper has described but a few efforts where analysis hasbeen applied within DLA. The insights gained from analysis have been instrumental in shaping a leanerand more responsive organization.
REFERENCES
[1]DLA Operations Research Office (DORO) 1996 Annual Report, 29 November 1996.
[2]Schwarz, K. F. and J. E. Inglett, Jr., "Using Landed Cost to Improve Business Practices," Proceedingsof the 32nd Annual Meeting, Southeastern Chapter of INFORMS, October 1996.
[3]Lasswell, B. E., Feasibility Analysis of DLA Hazardous Material Consolidation, DLA OperationsResearch Office Report, Richmond, VA, April 1997.

BANK MARKETING ON THE INTERNET AND ENTREPRENEURS
Marshall M. Friedman, Norfolk State University, Norfolk, VA 23504 Santosh Choudhury, Norfolk State University, Norfolk VA 23504
ABSTRACT
This paper is a review of the content of a sample of bank Internet Sites. The paper looks at the servicesoffered by banks by bank size, by community size, and by provider. The study seems to indicate that big citybanks offer more online banking services than small town community banks and that larger banks offer moreservices than small banks. There is a variation in the types and the number of services offered. Many banksare not taking full advantage of the Internet as a source of business. INTRODUCTION
Banking sites on the Internet provide an important area for study. Many banks are pushing their PC bankingservices. Other banks use the Internet as public relations and advertising media. The Apollo Trust Companyin Pennsylvania has used the Internet and banking on the Information superhighway as a way of surviving[1, p.16]. The authors believe that when the public accepts banking over the Internet, the Internet will reachits potential as an important source of business.
The authors have reviewed Internet bank sites to determine how different banks utilize their Internet sites.We want to determine such questions as does bank size make a difference what services a bank offers overthe Internet and how a bank utilizes its Internet site. The authors want to determine whether or not there aredifferences in the way big city banks utilize the Internet as opposed to rural and small city banks.
Site Utilization
Banks that have Sites on the Internet use them in different ways. Some utilize them only for advertising thebank and the services offered. For instance, the Kaw Valley State Bank and Trust Company in Topeka,Kansas offers no online banking services, but does advertise its Visa debit card with an online applicationand its certificates of deposit. It offers no online services or products. Some banks offer nontraditional bankproducts such as Internet Service Provider services, Appollo Trust Company of Appollo, PA and Bank Onewhich does business in several states. Appollo Trust uses its site as a way of providing Internet services tocommunity organizations such as the Appollo library, the school district. Its site also provides links to othersites for area entities. According to an article in a banking journal, there were no local Internet ServiceProviders (ISP) [1, p.13]. Therefore, it felt that it had to be the local ISP, if online banking would be adoptedon a big enough scale. Citibank sells stock over the Internet. Star Bank with several locations in Ohio andNorthern Kentucky offers small businesses overnight investing of funds. In this type of account, all funds thatare above a specified amount are invested overnight. This relieves the businesses from having to continuouslymonitoring its balances for investable funds. According to the bank this prevents problems of overdrafts thatoccur by investing too large an amount of the company funds. Like most other banks with small businessonline accounts, Star Bank provides an online cash management system that is typical of banks offering smallbusiness online banking. “It includes a ledger and collected balances, one and two day float amounts, totalcredit and debit amounts, the number of debits and credits, deposit transactions, check and other debittransactions” [9] Star Bank provides a transfer of funds service that permits businesses to transfer funds fromseveral locations to a central deposit account, bill payment, payment of taxes, and the direct deposit of anemployee payroll.

Some of the big banks offer online banking services to both households and small businesses. CitiBank, FirstUnion are examples of this. Others offer their online banking services only to households. The latter aremostly small banks. First Security Bank (Arkansas) is an example of that. Wells Fargo Bank places emphaseson providing services to students. Besides offering student loans it has a section on applying for jobs,preparing resumes.
Some banks that do nothing else with PC banking, have bill paying services which usually carry a fee. TheBank of Kearney in Nebraska is an example of that.
Provider
At least one bank felt that it had to become Internet service providers. The Appollo Trust Company which is a small town bank located in a small Pennsylvania town which at the time it decided that it had to establisha presence on the Internet and offer online banking had no local ISP. That is anyone accessing the Internethad to make a long distance call. This can become expensive and keep down the number of people from thearea who accessed the Internet. Of the other banks in the sample, Bank One also is an ISP. The bank sayson its site that the reason it is an ISP is that “we have the unique opportunity of being able to pass it alongto you as a convenience and to help fulfill all of your online needs” [4]. Bank Size.It appears that, in general, the extent to which banks utilize the Internet varies with the size of the bank. Thebiggest banks such as the Mellon Bank, CitiBank, Wells Fargo Bank, First Union Bank, Bank of America, Chase Manhattan Bank, and NationsBank make full use of online banking. This includes both householdand small business online banking. For both this includes both checking and saving accounts for householdsand small businesses. It also includes bill paying, application for loans of various types, transfer of fundsbetween accounts, and credit card information. For business it includes cash management and for householdsthe ability to use the online information in household financial programs such as Quicken and Managing YourMoney. They offer online services. CitiBank actually has a site that is in several languages. They offeronline banking in some other countries such as Brazil but not in other countries such as Argentina and Japan. On the other hand, many small banks do not offer any online banking services or offer only a limited amountof online services. The First National Bank of Kearney (Nebraska) offers only an online bill paying service.First Security Bank (Searcy, Arkansas) online checking and savings account registers, bill paying, fundtransfers from one account to another, loan payments, tax reporting, and budget reporting. Like most of thesmall banks included in the sample, no online services to small businesses.
City Banks, Small City Banks, and Rural Banks
The bigger city banks all tend to offer or are in the process of developing comprehensive online bankingservices for both households and small business. These services include ability to view savings and checkingaccount information, apply for checking accounts, apply for credit cards, apply for consumer loans, mortgageloans, bill paying services, transfer funds between accounts, and see if checks have cleared. Some banks offermortgage loan calculators. There are some exceptions, the Harris Bank in Chicago does have a household andsmall business online banking. However, it does not offer as extensive online services as other banks its sizein large cities. It does not offer different cash management online than it offers offline. It does offer onlinecurrent checking and savings account balances, transfer of funds between accounts, check on the clearanceof a check, and make an installment payment on a line of credit, and stop payment on a check. It does notoffer an online bill payment service, online loan applications, and online credit card applications as do otherbig city banks. Even many small town banks offers this service, usually for a fee. The Wells Fargo Bank

has an extensive Student section at their site. Wells Fargo offers advice on looking for a job. Its site alsooffers information on various types of financial aid and student loans. However its site does offer a summaryof problem solving documents which are available only in the Chicago area and as hard copies from the bank.These can be ordered by e-mail from the bank.
Small city and town banks generally offer fewer services and several use them only for advertising,information, and community service. Examples of the latter are the First National Bank of Laramie,Wyoming and the Jackson (Hole, Wyoming) State Bank. As pointed out above, many small city and smalltown banks do offer online banking, offer online household but do not offer online small business banking.Some small town banks provide only online bill paying services (First National Bank of Kearney, Nebraska)while others offer online applications for loans and certificates of deposit (Bank of Bellevue in Nebrsaka).According to an article in a banking journal, the Appollo Bank is one small city, community bank that seesthe Internet as a way to survive the competition against big city banks.
Discussion
This brief survey of banking sites on the information super highway, provides several observations. TheInternet permits banks to compete for business which they would not normally have a chance to get. Like theATM, the Internet offers the bank to save the cost of the services of tellers and the ability to offer 24 hourservice with the convenience of banking from anywhere a customer can access the Web. Many banks takeadvantage of giving their customers the ability to access account information that must be accessed over thetelephone. Thus, the Internet permits banks to offer their services at a lower cost with more convenience tothe customers who are willing to take advantage of it. With the coming of better security with the SETstandard, which is currently being tested by businesses such as Mellon Bank. The improved security methodand the availability of 128 bit encryption techniques should result in more public confidence in the securityof information transmitted over the Internet. This confidence is necessary if banking and commerce, ingeneral, on the Internet is to achieve its potential.
It is obvious from the review of the bank sites that not all of banks are taking full advantage of the Internetas a source of business. It may be that online banking costs too much for the business that it might generate.However, it seems reasonable that the most expensive way to provide banking services is those that involvedirect human contact. Thus, those banks that are not taking full advantage of online banking is losing out ona cost effective way and therefore a competitive way of doing business. It also permits banks to go after thebusiness of persons and small businesses that they otherwise might not be able to get because they wouldoperate in an area where these people or businesses live or operate. Thus a person who lives in Norfolk,Virginia, an area where Wells Fargo Bank does not operate, may obtain a student loan from that bank andhave a Wells Fargo credit card. Conclusion
This study demonstrates that different banks have utilized the Internet to different degrees. The bigger citybanks and larger banks appear to utilize the Internet to a greater extent than small community banks. Thereare some exceptions such as the Appolo Bank which looks at the Internet as a way to survive given the factthat it expects the big banks to dominate online banking [1 p16].
This is a pilot study. A more complete project that will include more banks and statistical analysis of therelationships examined in this paper. Banking on the Internet is developing and thus provides researchopportunities.
The conclusions drawn in this paper are tentative because the sample is small and there is no statistical

analysis.
References
[1.] Muth, Raymond, “Becoming Internet Access Provider Expands Horizons for Appollo Trust,.” Journal of Retail Banking Services, Spring, 1997, 19(1), 11-16.
Web Sites
[2] www.appolobank.com[3] www.bankamerica.com[4] www.bankone.com[5] www.citibank.com[6] www.firstunion.com[7] www.nationsbank.com[8] www.harrisbank.com [9] www.starbank.com[10] www.wellsfargo.com

A CLASS PROJECT FOR CONSIDERATION:THE MARKETING OF ON-CAMPUS DINING SERVICES
Mark Andrew Mitchell, University of South Carolina Spartanburg, Spartanburg, SC 29303Gregory Turner, College of Charleston, Charleston, SC 29424
Steve Edwards, University of South Carolina Spartanburg, Spartanburg, SC 29303
ABSTRACT
Marketing scholars recognize the benefit of a coordinated plan for instructional innovation, intellectualcontributions and development, and university service. This manuscript presents an action plan forconsideration: The marketing of on-campus dining services. The project outlined in this manuscriptreviews (a) consumer expectations of institutional dining service providers, and (b) customer satisfactionwith existing providers. The replication of this project allows the marketing scholar to his/her fulfillprofessional expectations, as well as providing a valuable experiential learning experience for the student.
INTRODUCTION
As marketing scholars, we’re in a unique position to combine our responsibilities for instructionalinnovation, intellectual contributions and development, and university service. A university is anintegrated community. Increasingly, experiential- or application-based learning exercises are beingincorporated into course offerings. By tackling university-related research projects, you can effectivelycombine these three important professional responsibilities.
In this period of flat (to declining) budgets, a public call for increased accountability, and identification ofthe student as the consumer, the commitment to continuous improvement is taking hold at many collegesand universities. As such, administrative personnel at all levels have an increased need to “speak withdata.” They need information to benchmark current performance, to identify consumer preferences, andto plan future marketing strategies.
The purpose of this manuscript is to outline a recently designed and implemented class project for yourconsideration. Specifically, undergraduate students designed and implemented a research project to assistthe On-campus Dining Services in identifying the needs of their consumers. First, the organization of theproject is presented. Next, the methodology and research results are presented. Finally, the implicationsof the study are outlined.
INSTITUTIONAL BACKGROUND AND NEED FOR STUDY
The University of South Carolina - Spartanburg is committed to a doctrine of continuous qualityimprovement. As such, we are willing to evaluate all units of the University to determine how we canprovide greater value for the consumer. Further, the University values stakeholder input as it continuesto strive to improve the effectiveness and efficiency of our operation.
The Fall of 1995 witnessed the addition of the Campus Life Center (CLC) to the University of SouthCarolina - Spartanburg. At that time, the University critically reviewed the existing dining serviceoperation and determined it to be inadequate. The decision was made to develop an internal diningservice. The Director of Dining Services convened a committee of university personnel to assist in the
2
marketing of the USCS Dining Service. At that time, the possibility of including an experiential learningexercise into the fall course offerings was discussed. The decision was made to use the USCS DiningServices as the focal point of analysis for the Consumer Behavior course.
PURPOSE OF THE STUDY
Students enrolled in Consumer Behavior worked directly with the Office of Dining Services to identifythe needs of the student body. By developing survey instruments, administering the instruments, andevaluating the results, the students sought to improve our collective understanding of the institutionaldining needs of the undergraduate student body.
The inclusion of this project in the Consumer Behavior class permits the following outcomes: (1) therealization of the University’s stated commitment to operational and management effectiveness; (2) theprovision of experiential learning outcomes; and (3) the realization of the learning objectives for the class.
METHODOLOGY
In the interest of better understanding the institutional dining needs of the USCS undergraduate studentpopulation, two areas of analysis were identified: (1) to determine the student’s expectations andpreferences of an institutional dining service; and (2) to determine the relative level of satisfaction ofcurrent students with the existing Dining Services operation.
Identifying Focus Areas
The students enrolled in Consumer Behavior dedicated class time toward improving their understandingof the institutional dining needs of the undergraduate student population. A series of discussions (andsubsequent interations) led to the identification of six focus areas for further study:
1. Access to Facilities2. Dining Atmosphere3. Awareness and Promotion4. Food and Nutrition5. Price and Value6. Service and Support
Division Into Teams
The class was divided into six teams to address the six focus areas outlined above. Each team wasresponsible for finalizing a list of variables believed to be effective in identifying the institutional diningneeds and preferences of the undergraduate student population. Further, each team would be solelyresponsible for offering recommendations for their focus area. While the division of the class into teamsprovided for specialization of effort, the in-class deliberations were very open in order to ensure thecompleteness or thoroughness of our efforts.
Developing Survey Instruments
Two survey instruments were developed during class discussions. The first instrument was designed toidentify the items of relative importance when one assesses any institutional dining service. Further, itcontained questions designed to identify the student’s level of awareness of the existing USCS Dining
3
Service operation and selected demographic questions to permit a profiling of respondents. A copy ofthis questionnaire is provided in Appendix A.
The second instrument was designed to assess the level of satisfaction with the current USCS DiningService operation. It contained questions regarding the services’ performance for a particular diningexperience or meal in addition to requested demographic information. Please note that the Office ofDining Services was involved in the development of the survey instruments in order to improve thethoroughness of our efforts. A copy of each instrument is provided in Appendix B.
Data Collection - Institutional Dining Service Preferences
The students served as the personal interviewers for data collection. Given time and financial constraints,a convenience sampling method was utilized. Following a discussion of the need to identify a pool ofrespondents representative of the student population, each student had the responsibility of gathering apredetermined number of completed questionnaires. Additionally, selected School of Business classesparticipated in the study to ensure representativeness. In order to avoid redundancy of response, thefollowing statement appeared at the top of the front of the survey instrument:
“If you have previously completed this questionnaire, STOP HERE and inform theinterviewer.”
Data Collection - Customer Satisfaction
The students served as the personal interviewers for data collection. Given time and financial constraints,a convenience sampling method was utilized. For this part of the study, the students administered thesurvey instrument on site in the Dining Facility. The timing of data collection was approved by theOffice of Dining Services. Again, following a discussion regarding the need for a representativesampling of the student population, each student, had the responsibility of gathering a predeterminednumber of completed questionnaires.
Data Analysis
The completed survey instruments were put into spreadsheet- worksheet form for easy analysis andmanipulation. The statistical package SPSS/PC+ was used for all computations. All computer runs weredone by the instructor and a designated assistant. The printed output from the statistical package was thenshared with the six teams for their interpretation and recommendations.
For both instruments, the decision was made to use Likert-type data scales. This very common scale (1-5) permits easy interpretation of results. The respondents simply provided the appropriate response to thequestions/statements included on the survey instruments.
For ease of data analysis, the 1-5 scaled data was treated as Interval Data. This permits the researchers tocalculate mean responses to each statement or question. These mean values can then be compared to theresponses for other variables or statements. Further, the calculation of group means allows forcomparing the responses of multiple groups, such as male versus female.
Group Findings and Recommendations
As noted earlier, the class was divided into six teams to address the six focus areas:

4
1. Access to Facilities2. Dining Atmosphere3. Awareness and Promotion4. Food and Nutrition5. Price and Value6. Service and Support
The recommendations of the six teams were developed and consolidated into the research report. Thecompleted document was distributed to the Director of Dining Services. This required the student toaccurately interpret the data and to use critical reasoning skills in developing their recommendations. Theteam interaction exposed the students to the dynamics of group activity. Finally, the recommendationsprovided an outside perspective on problems/opportunities facing the Office of Dining Services. It mustbe noted that a formal student oral presentation would be very valuable if time permits.
Limitations of the Study
An important part of doing “good science” is critically evaluating the process for possible limitations andopportunities to improve future studies. That said, some of the limitations of the study are addressed inthe sections that follow.
The marketplace is very dynamic. As such, information collected today may not be relevant for otheroperating periods or locations. Replication of this study provides your foodservice professionals theperceptions of their consumers. Further, later replications provide time-series data for trend analysis.
The two survey instruments developed in this study were used to assess student attitudes toward diningservices (in general) and their relative level of satisfaction with current USCS Dining Services. Aconcern any time attitudinal research is conducted in the validity of the output: did we measure what wedesired to measure? Another concern is the social desirability of response: did respondents give theirtrue feelings or what they believed was the appropriate or desired response of the researchers? These twoareas deserve consideration as the results are interpreted and utilized for decision-making purposes.
Convenience sampling methods were used for data collection. The effort was made to ensure adequaterepresentation of the USCS campus community. As such, the results are believed to be generalizable overthe USCS undergraduate student population. It is possible, however, that the sample respondents do notadequately reflect the views of the campus community.
Summary and Conclusions
The inclusion of this project in the Consumer Behavior class provided the following outcomes: (1) therealization of the University’s stated commitment to operational and management effectiveness; (2) theprovision of experiential learning outcomes; and (3) the realization of the learning objectives for the class.As such, this project is a success in and of itself.
The development and implementation of the project displays the Dining Services’ commitment tocontinuous quality improvement and a willingness to critically evaluate operations and consumer needsin the interest of better serving the food and nutritional needs of the campus community. Finally, it showshow the Academic Division and Auxiliary Services Division of a campus community can work togetherto provide outcomes beneficial to each group.

5
Students designed research instruments, collected consumer information, interpreted the responses, andoffered recommendations for consideration. As such, they have had the opportunity to participate in theplanning processes of their institution.
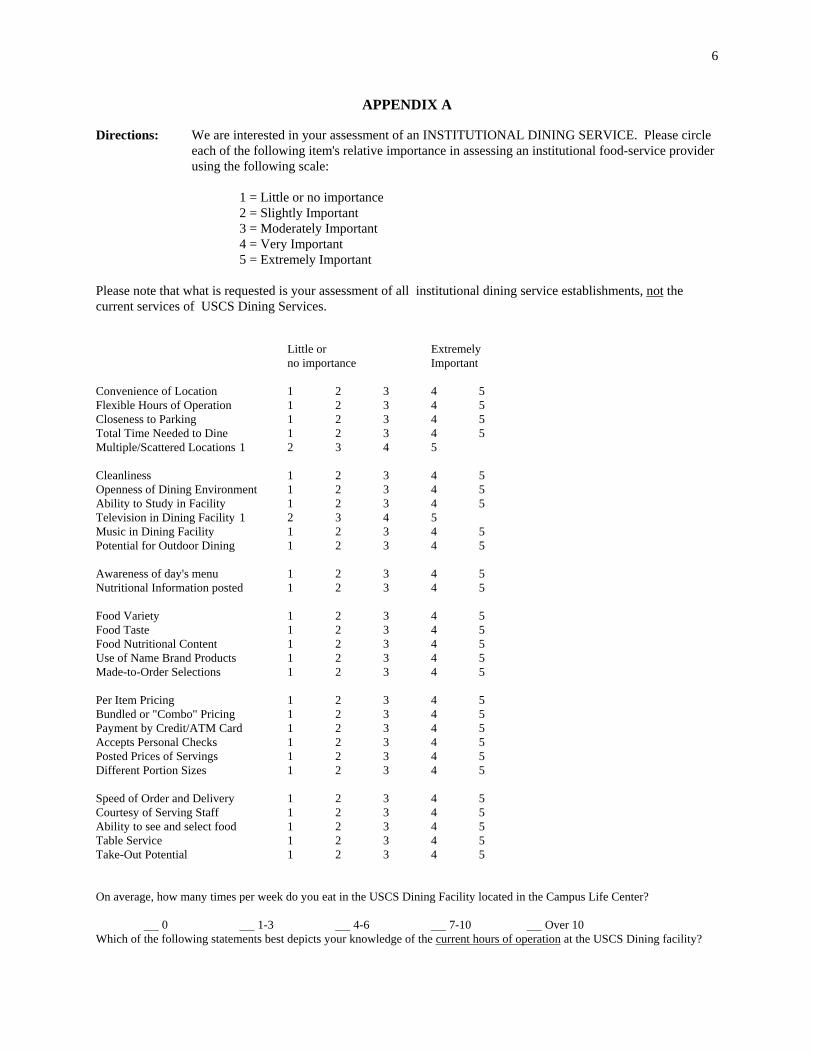
6
APPENDIX A
Directions: We are interested in your assessment of an INSTITUTIONAL DINING SERVICE. Please circleeach of the following item's relative importance in assessing an institutional food-service providerusing the following scale:
1 = Little or no importance2 = Slightly Important3 = Moderately Important4 = Very Important5 = Extremely Important
Please note that what is requested is your assessment of all institutional dining service establishments, not thecurrent services of USCS Dining Services.
Little or Extremelyno importance Important
Convenience of Location 1 2 3 4 5Flexible Hours of Operation 1 2 3 4 5Closeness to Parking 1 2 3 4 5Total Time Needed to Dine 1 2 3 4 5Multiple/Scattered Locations 1 2 3 4 5
Cleanliness 1 2 3 4 5Openness of Dining Environment 1 2 3 4 5Ability to Study in Facility 1 2 3 4 5Television in Dining Facility 1 2 3 4 5Music in Dining Facility 1 2 3 4 5Potential for Outdoor Dining 1 2 3 4 5
Awareness of day's menu 1 2 3 4 5Nutritional Information posted 1 2 3 4 5
Food Variety 1 2 3 4 5Food Taste 1 2 3 4 5Food Nutritional Content 1 2 3 4 5Use of Name Brand Products 1 2 3 4 5Made-to-Order Selections 1 2 3 4 5
Per Item Pricing 1 2 3 4 5Bundled or "Combo" Pricing 1 2 3 4 5Payment by Credit/ATM Card 1 2 3 4 5Accepts Personal Checks 1 2 3 4 5Posted Prices of Servings 1 2 3 4 5Different Portion Sizes 1 2 3 4 5
Speed of Order and Delivery 1 2 3 4 5Courtesy of Serving Staff 1 2 3 4 5Ability to see and select food 1 2 3 4 5Table Service 1 2 3 4 5Take-Out Potential 1 2 3 4 5
On average, how many times per week do you eat in the USCS Dining Facility located in the Campus Life Center?
0 1-3 4-6 7-10 Over 10Which of the following statements best depicts your knowledge of the current hours of operation at the USCS Dining facility?

7
I have no awareness of the subject. I have limited awareness of the subject. I have a good understanding of the subject.
Which of the following statements best depicts your knowledge of the types of foods and services currently available at theUSCS Dining facility?
I have no awareness of the subject. I have limited awareness of the subject. I have a good understanding of the subject.
Which of the following statements best depicts your knowledge of the relative pricing structure and payment plans available atthe USCS Dining facility?
I have no awareness of the subject. I have limited awareness of the subject. I have a good understanding of the subject.
DEMOGRAPHIC INFORMATION
Gender: Male Female
Age: Under 21 22-27 28-35 Over 35
Ethnic Group: Caucasian African American Asian American Latin American Native American
Other (Please Specify )
Credit Hours Earned to date: 0-30 61-90 31-60 91-120
Do you live? on-campus off-campus
How long have you been a student at USCS?
Less than One Year Two Years Three Years Four or More Years
Did you transfer to USCS from another higher education institution?
Yes No
Area of Study: College of Arts and Sciences School of Business Administration School of Education School of Nursing I.D.S. Undecided Other (Please Specify )
Thank you for your cooperation!
APPENDIX B

8
HOW DID WE DO TODAY?
Directions: At USCS Dining Services, we are committed to continuous improvement and to meeting the foodand nutritional needs of our students. As such, we ask for your input. Please rate your experience(circling the appropriate response) by showing your level of agreement or disagreement with thestatements below using the following scale:
1 = Strongly Disagree2 = Disagree3 = Neutral n/a = not applicable4 = Agree5 = Strongly Agree
Strongly StronglyDisagree Agree
The serving area was clean. 1 2 3 4 5 n/a
The dining area was clean.1 2 3 4 5 n/a
I enjoyed the taste of my food. 1 2 3 4 5 n/a
My food was fresh. 1 2 3 4 5 n/a
My food was served at the 1 2 3 4 5 n/aappropriate serving temperature.
I found a wide variety of foods 1 2 3 4 5 n/ato choose from.
I was able to find low-fat items. 1 2 3 4 5 n/a
I believe my meal was a good 1 2 3 4 5 n/avalue (price for servings).
I was served in a reasonable 1 2 3 4 5 n/aamount of time.
The Dining Services staff was 1 2 3 4 5 n/afriendly and courteous.
Please feel free to comment on items not addressed on this survey in the space below.
On average, how many times per week do you eat in the USCS Dining Facility located in the Campus Life Center?
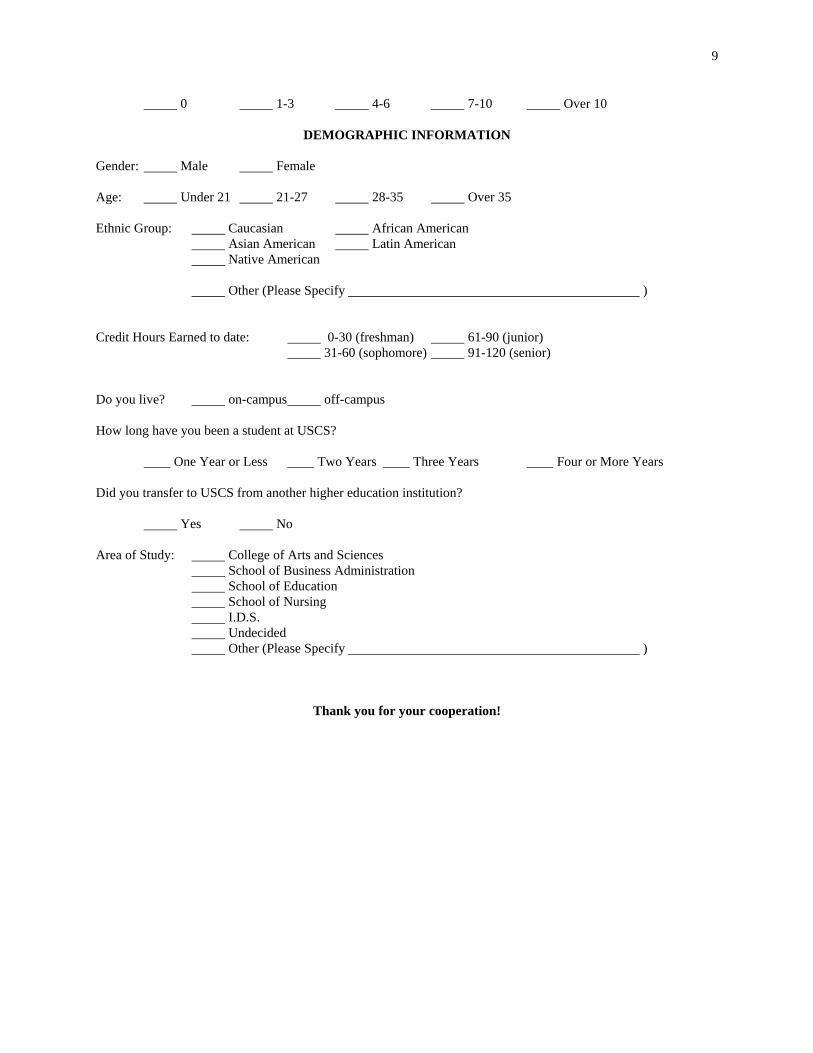
9
0 1-3 4-6 7-10 Over 10
DEMOGRAPHIC INFORMATION
Gender: Male Female
Age: Under 21 21-27 28-35 Over 35
Ethnic Group: Caucasian African American Asian American Latin American Native American
Other (Please Specify )
Credit Hours Earned to date: 0-30 (freshman) 61-90 (junior) 31-60 (sophomore) 91-120 (senior)
Do you live? on-campus off-campus
How long have you been a student at USCS?
One Year or Less Two Years Three Years Four or More Years
Did you transfer to USCS from another higher education institution?
Yes No
Area of Study: College of Arts and Sciences School of Business Administration School of Education School of Nursing I.D.S. Undecided Other (Please Specify )
Thank you for your cooperation!
A SYNTHESIZED APPROACH TO MARKET RESPONSE MODELING
Ping Wang, Faye Teer, Harold Teer and Xueyan Su
College of Business, James Madison University, Harrisonburg, VA 22807
ABSTRACTTo profit from direct market promotions, marketers need to analyze test results and developmarket response models. Effective market response models can help direct marketers minimizetheir mailing cost and at the same time maximize their profit from mailings. Since regressionbased and neural network based market response models each have their strengths andweaknesses for direct marketing applications, a synthesized model is proposed in order to takeadvantage of the particular strength of each of the models. The synthesized model proposed inthis paper combines logistic regression and artificial neural network models in developingmarket response functions. The proposed synthesized model is tested to compare itsperformance with the stand-alone models. The test results are included to show the effectivenessof the synthesized market response models.
INTRODUCTIONTo be more effective in their product promotions more and more marketers are utilizingknowledge gained from their house list or customer database to build market response models.Customer databases, containing customers’ demographic data and buying history measures frompast promotions, provide valuable information on numerous variables that may be used todescribe each customer in the house list. Pertinent variables that are useful in response modelinginclude things such as age, gender, family income, total money spent, total number of purchases,the time when the last purchase was made, type of product purchased, etc.
Since a specific product may appeal to certain customers and not to others, it is highly desirablefor marketers to be able to identify customers with a high probability of buying. This wouldallow marketers to focus their promotion efforts on the higher profitable customers. Oneobjective of market response modeling is to aid the marketer in minimizing their mailing costand maximizing their profit.
There are three classifications of market response models: statistical models, tree generatingmodels, and neural network models. Statistical models include techniques such as multipleregression, logistic regression, and discriminate analysis. Tree generating models include the useof tools such as Automatic Interaction Detector (AID), Chi-Square Automatic InteractionDetector (CHAID) (Kass, 1980, Magidson, 1988, 1989), Classification and Regression Trees(CART) (Briman, Friedman, Olghem, and Stone, 1984, Thrasher, 1991). Neural network modelscan utilize neural network software such as ModelMAX.
The three classifications of market response models have one common feature: the estimation ofa single response model for the whole house list. In multiple regression, logistic regression anddiscriminate analysis models, a single set of regression (discriminate) coefficients is estimatedfor all customers in the house list. In an AID analysis (AID, CHAID, and CART), one obtains a

11
single mean response for a particular categorization of background variables. In an artificialneural network model, a single set of parameters (connection weights) is provided for everycustomer in the house list.
The process of applying these models to direct market promotions involves developing aresponse model, calibrating the response model with the test mailing and scoring the house listcustomers. Customers with higher scores are viewed as having a higher probability of buying. Statistical models, tree generating models, and neural network models are each suitable forcertain direct marketing applications. However, each has its own strengths and weaknesses. Asynthesized approach is proposed to combine two or more of these models in order to takeadvantage of the particular strength of each of the separate models. The proposed synthesizedapproach combines logistic regression and artificial neural network models in developing marketresponse functions.
The proposed synthesized model is tested to compare its performance with the stand-alonemodels. The test results are included to show the effectiveness of the synthesized marketresponse models.
The remaining sections of this paper include a brief description of the sample house list used inthe test, descriptions of two stand-alone models (logistic regression and neural network models,)the proposed synthesized model, the test results, and comparisons. The paper concludes withremarks on future research.
THE BOOKBINDER BOOK (BBB) CLUB DATAThe BBB data set was contributed to the Direct Marketing Association by Zahavi and Levin(1995). These authors provided a detailed description of the data in their database marketingcase study on the BBB club data.
The BBB club was established at the end of 1986 to sell specialty books through directmarketing and was later expanded to offer non-book products to its members. The managers ofthe BBB had an objective of running simultaneously targeted campaigns where each targetcustomer would receive appropriate solo mailings. The BBB data has 50,000 customer names.Besides the account number, the following sixteen variables are used to describe a customer andhis/her buying history: gender (G = 0 for female and G = 1 for male), total money spent (M),months since last purchase (R), total number of purchases (F), months since first purchase (R2),number of children books purchased (F1), number of youth books purchased (F2), number ofcook books purchased (F3), number of do-it-yourself books purchased (F4), number of referencebooks purchased (F5), number of art books purchased (F6), number of geography bookspurchased (F7), purchase/did not purchase “Secrets of Italian Cooking” (SIC = 1 if bought and 0otherwise), purchase/ did not purchase “Historical Atlas of Italy" (HAI = 1 if bought and 0otherwise), purchase/did not purchase “Italian Art” (IA = 1 if bought and 0 otherwise), andpurchase/did not purchase “The Art History of Florence” (AHF = 1 if bought and 0 otherwise).
TEST RESULTS WITH LOGISTIC REGRESSION AND NEURAL NETWORKS

22
REFERENCES 1. Babinec, T. (1990), “CHAID Response Modeling and Segmentation,” Quirck’s Marketing
Research Review, (June-July), 12-15.
2. Breiman, L., Friedman, J., Olshen, R., and Stone, C. (1984), Classification and RegressionTrees, Monterey, CA: Wadsworth.
3. Kass, G. V. (1980), “An Exploratory Technique for Investigating Large Quantities ofCategorical Data,” Applied Statistics, 29 (2), 119-127.
4. Magidson, J. (1988), "New Statistical Techniques in Direct Marketing: Progression BeyondRegression," Journal of Direct Marketing, 2 (4), 6-18.
5. Magidson, J. (1989), “CHAID, Logit, and Log-linear Modeling,” Marketing ResearchSystems, Vol. 11-130, 101-114.
6. Magidson, J. (1991), “Letter to the Editor,” Journal of Direct Marketing, 5 (2), 57-58.
7. Thrasher, R. P. (1991), "CART: A Recent Advance in Tree Structured List SegmentationMethodology," Journal of Direct Marketing, 5 (1), 34-47.
AFRICAN-AMERICAN STUDENTS’ ETHNOCENTRISM:AN APPLICATION OF CETSCALE
Alican Kavas, Winston-Salem State University, Winston-Salem, NC 27110Mak Khojasteh, Winston-Salem State University, Winston-Salem, NC 27110
ABSTRACT
The CETSCALE has been an important contribution to consumer research. This study investigatedethnocentric tendencies of African-Americans who constitute the largest ethnic group in the U.S.Consumer ethnocentric tendencies were measured via CETSCALE which is reported to be a reliable andvalid scale. The mean CETSCALE scores of the respondents were higher when compared with otherstudies. The scale scores and mean values of scale items were evaluated. Implications and future researchsuggestions were provided.
INTRODUCTION
With the greater availability of foreign brands, consumers face an ever-expanding choice of purchaseoptions. From the marketers’ perspective, it is important to assess consumers’ attitudes and preferencesfor both domestic and foreign products.
Consumer research so far indicated that consumption patterns can differ substantially across cultures andsubcultures. At 12% of the population, African-Americans constitute the largest racial minorityconsumers in the U.S. (Schiffman and Kanuk, 1997). This group of almost 30 million have an estimated$400 billion income annually (Whigham-Desir, 1996). In terms of product preferences and brand namepatterns, African-American consumers tend to prefer popular or leading brands, are brand loyal andunlikely to purchase private and generic brands (Wilkes and Valenica, 1986).
Research is needed in order to understand and determine ethnocentric attitudes or tendencies of thisimportant segment in the U.S. market. Our study of consumer ethnocentrism is, to our knowledge, thefirst to be conducted on African-Americans. The objectives of the study can be stated as: a) to determinethe overall tendencies of African-American students toward foreign-made products, b) to determineattitudinal differences based on socio-economic variables.
This paper is organized as follows: First, we begin with a brief review of the construct of consumerethnocentrism, along with a discussion of the development and application of its associated CETSCALE.Then, we describe the methodology. Next, we present mean values and comparison of mean values basedon gender and the field of study. Finally, we discuss implications for future research.
BACKGROUND
The term “Consumer Ethnocentrism” is actually rooted in the studies of general ethnocentrism found insociology, anthropology and social psychology. As first introduced and applied by Summer (1906),“ethnocentrism” possessed a general connotation of cultural narrowness. As indicated by Summer (1906,p.12), “ethnocentrism” is the technical name for the view of things in which one’s own group is the centerof everything, and all others are scaled and rated with reference to it. In some cultures, ethnocentrism ismore prevalent than in others. For example, Americans are proud of their political and economicinstitutions and consistently seek to have other nations adopt them. The term “consumer ethnocentrism” is

derived from the general concept of ethnocentrism which represents the tendency for individuals to viewtheir own group as omnipotent, to view other groups from their own perspective, and to reject culturallydissimilar ideas while blindly accepting similar ideas and people (Shimp and Sharma, 1987).
From this general trait, the term “consumer ethnocentrism” was developed to represent “ the beliefs heldby American Consumers about the appropriateness, indeed morality, of purchasing foreign madeproducts” (Shimp and Sharma 1978, p. 280). People who are highly consumer ethnocentric feel thatpurchasing foreign products is wrong because it hurts the domestic economy, results in loss of jobs, and isunpatriotic. They also feel a sense of belonging to their consumer ethnocentric in group, which results inan understanding of what purchase behaviors are acceptable to the in-group. In contrast, thenonethnocentric individual evaluates products more objectively, regardless of country of origin.
Research conducted on the scale indicated the following conclusions (Shimp, 1984; Sharma, Shimp andShin, 1995; Wall and Heslop, 1986):. Those who are high in consumer ethnocentrism are more prone to accentuate the positive aspects ofdomestic products and discount the virtue of foreign made items.. Consumer demographics (i.e., education, income, social class) are considered to have an impact onconsumer ethnocentrism. Consumers with relatively high levels of income and education were morelikely to be nonethnocentric.. Nonethnocentrics had more favorable evaluation of imports and unfavorable evaluation of domesticproducts.. Consumer ethnocentrics were found to have significantly lower educational achievements, income andsocial class attainments than nonethnocentrics.. Attitudes toward home country had a significant impact on consumer ethnocentrism. People who hadstrong positive attitudes toward their home country are more likely to exhibit higher levels of consumerethnocentric tendencies toward imports than others.
On the basis of the preceding conceptual definition, Shimp and Sharma (1987) developed and validatedthe CETSCALE, to measure Consumers’ Ethnocentric Tendencies related to purchasing foreign versusAmerican-made products. The CETSCALE was originally created to evaluate American consumerethnocentrism.
The CETSCALE has been used in other international studies. Netemeyer, Durvasula and Lichtenstein(1991) conducted a cross national study to determine the reliability and validity of the CETSCALE.Usingthe long form of 18 items, they examined the “cross-national psychometric properties of the CETSCALEwith a sample of the U.S., France, Japan and Germany” (Netemeyer, et.al. 1991, p.321). They foundstrong support for the CETSCALE’s factor structure across the four sample countries. They alsodetermined the CETSCALE to be a reliable construct in these nations. The reliability estimates of .94 to.96 was reported by Shimp and Sharma (1987) in their original scale development study. Netemeyer et.al. (1991) reported the coefficient alpha estimates for the U.S., French, Japanese and West Germansamples as .95, .92, .91 and .94, respectively.
Durvasula, Andrews and Netemeyer (1997) compared the CETSCALE’s psychometric properties andmean values between the U.S. and Russia. Results from both countries support the scale’s reliability andvalidity. They indicated that the U.S. had a significantly greater mean value on the CETSCALE than theRussian sample. The Russians had significantly more favorable beliefs and attitudes toward foreignproducts than Americans.
As stated by Shimp and Sharma (1987, p.288), “It is not known whether the scale is applicable toconsumers of high school age and younger or blacks, Hispanics, and other ethnic groups”. Netemeyer,

Durvasula and Lichtenstein (1991, p.326) indicated that “the CETSCALE should be administered tosamples….. across countries and within countries”. Therefore, it was our aim to measure African-American consumers’ ethnocentric tendencies via the CETSCALE.
METHODOLOGY
Sample selection
Data were collected from 233 students at one of the Historically Black Universities in the U.S. Thestudents are members of African-American subculture and are expected to have variations in theirfeelings of ethnocentrism. Therefore, students are a relevant sample for the purposes of our study. Itshould be cautioned, however, that students may not be representative of the general population at large.The sample of the student population is one of convenience (i.e., those classes for which professors werewilling to allow class time for administration of the data collection instrument).
Data collection device
Data were collected by a self-administered questionnaire consisting of two parts. In the first part, studentsresponded to the 17-item CETSCALE (Shimp and Sharma 1987). The scale consists of 7-point Likerttype statements (strongly agree=7, strongly disagree=1). The range of scores is from 17 to 119.
In the second part of the questionnaire, questions about the socio-demographic characteristics of therespondents were included. Before the whole questionnaire was administered on a full-scale, thequestionnaire was pretested and refined.
The questionnaire was administered during class-time and took approximately 10 minutes to complete.All data were collected on March of 1997. Out of 233, 46 questionnaires were eliminated because ofrespondents’ ethnic background, or heavy item non-response and position-bias. Therefore, 187 usablequestionnaires filled out only by African-American students were used for data analysis purposes.
Data Analysis
In the data analysis, the profile of respondents and mean values of the tendencies and mean CETSCALEscores of students about ethnocentrism were reported. In addition, differences in mean values of attitudesfor gender and the field of study were presented.
RESULTS
Sample characteristics of the respondents are given in Table 1. Of the participants, 51 percent were male,72 percent were at the age of 18-22, 73 percent were Business and Economics students, 84 percent spenttheir childhood in the South and East part of the States. A large number (69%) indicated that they nevertraveled outside the U.S. and 47% of the respondents spoke no language besides English.
The mean ethnocentrism scores of the respondents by various socio-economic variables is shown in Table2. Female students and non-business majors were found to have more consumer ethnocentrism than theircounterparts. Table 2 also shows that the students who have had an experience of residing at the East andthe South have higher ethnocentrism scores than the students from other parts of the country. Likewise,students with outside the U.S. travel experience and those with other language skills had higher

ethnocentrism scores than their counterparts. However, none of the differences were statisticallysignificant.
Table 1PROFILE OF THE RESPONDENTS
Variable Frequency(n) Percent(%)
GenderFemale 92 49Male 95 51
Age18-22 135 72.223-27 36 19.328-32 10 5.333 and above 6 3.2
Field of StudyNon-Business 50 26.7Business 137 73.3
Childhood ResidenceSouth 112 59.9East 45 24.1North East 17 9.0North 13 7.0
Travel Outside USAYes 58 31.0 No 129 69.0
Other LanguagesYes 99 53.0 No 89 47.0
Table 2MEAN CETSCALE SCORES WITH SEVERAL SOCIO-ECONOMIC VARIABLES
Variable Mean Score * Standard Deviation t value**
GenderFemale (n=92) 63.43 17.95 0.55Male (n=95) 61.08 17.37
Field of StudyNon-Business (n=50) 63.92 18.27 0.43Business (n=137) 61.62 17.44
Childhood ResidenceEast and South (n=157) 64.13 17.62 1.89Other (n=30) 57.48 17.63
Travel Outside the U.SYes(n=58) 63.79 16.31 0.42No (n=129) 61.54 18.24
Speak Other LanguagesYes (n=99) 63.41 17.61 0.37No ( n=88) 60.92 18.25
* Range of scores from 17 to 119.** Two-tailed test, not significant
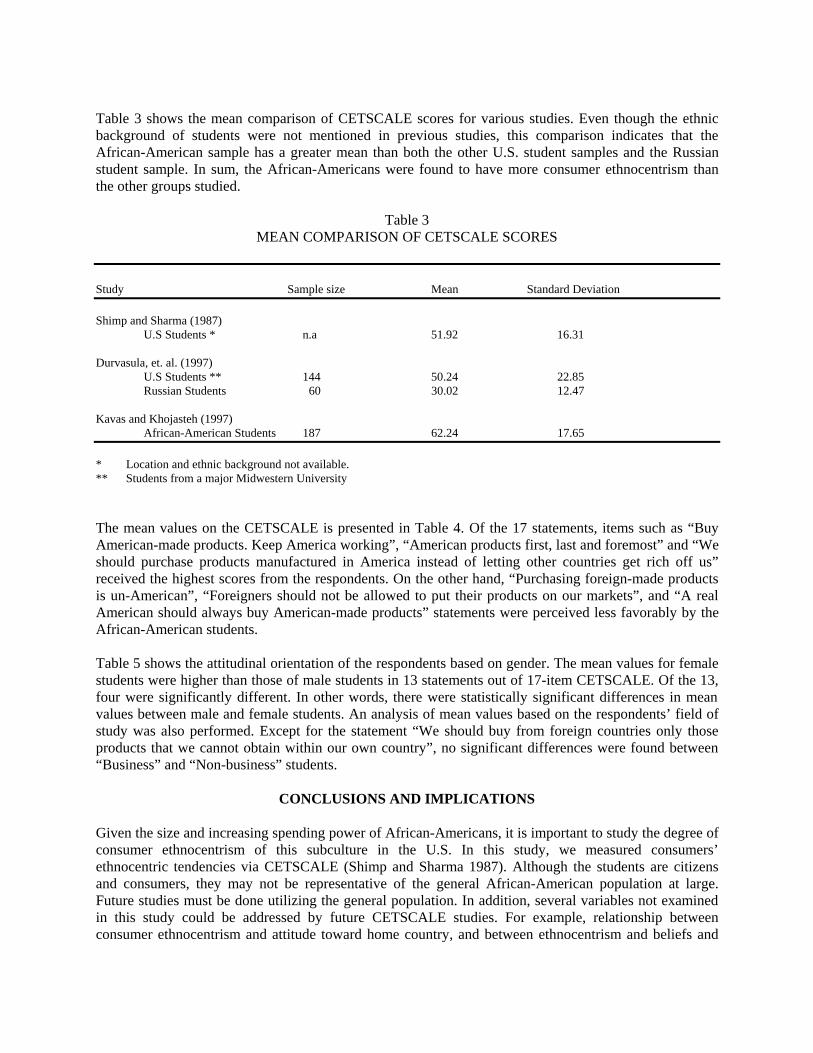
Table 3 shows the mean comparison of CETSCALE scores for various studies. Even though the ethnicbackground of students were not mentioned in previous studies, this comparison indicates that theAfrican-American sample has a greater mean than both the other U.S. student samples and the Russianstudent sample. In sum, the African-Americans were found to have more consumer ethnocentrism thanthe other groups studied.
Table 3MEAN COMPARISON OF CETSCALE SCORES
Study Sample size Mean Standard Deviation
Shimp and Sharma (1987)U.S Students * n.a 51.92 16.31
Durvasula, et. al. (1997)U.S Students ** 144 50.24 22.85Russian Students 60 30.02 12.47
Kavas and Khojasteh (1997)African-American Students 187 62.24 17.65
* Location and ethnic background not available.** Students from a major Midwestern University
The mean values on the CETSCALE is presented in Table 4. Of the 17 statements, items such as “BuyAmerican-made products. Keep America working”, “American products first, last and foremost” and “Weshould purchase products manufactured in America instead of letting other countries get rich off us”received the highest scores from the respondents. On the other hand, “Purchasing foreign-made productsis un-American”, “Foreigners should not be allowed to put their products on our markets”, and “A realAmerican should always buy American-made products” statements were perceived less favorably by theAfrican-American students.
Table 5 shows the attitudinal orientation of the respondents based on gender. The mean values for femalestudents were higher than those of male students in 13 statements out of 17-item CETSCALE. Of the 13,four were significantly different. In other words, there were statistically significant differences in meanvalues between male and female students. An analysis of mean values based on the respondents’ field ofstudy was also performed. Except for the statement “We should buy from foreign countries only thoseproducts that we cannot obtain within our own country”, no significant differences were found between“Business” and “Non-business” students.
CONCLUSIONS AND IMPLICATIONS
Given the size and increasing spending power of African-Americans, it is important to study the degree ofconsumer ethnocentrism of this subculture in the U.S. In this study, we measured consumers’ethnocentric tendencies via CETSCALE (Shimp and Sharma 1987). Although the students are citizensand consumers, they may not be representative of the general African-American population at large.Future studies must be done utilizing the general population. In addition, several variables not examinedin this study could be addressed by future CETSCALE studies. For example, relationship betweenconsumer ethnocentrism and attitude toward home country, and between ethnocentrism and beliefs and
attitudes about home country and other countries’ products should be examined. As suggested byDurvasula et. al. (1997), examining the relationship between the degree of cultural openness andconsumer ethnocentrism would help us gain a better understanding of the role of consumer ethnocentrism.Furthermore, the comparison of different subcultures’ ethnocentrism (i.e., Hispanics, Asian-Americans)must be performed.
An application of CETSCALE would help a management determine which subcultures or groups exhibitethnocentric or nonethnocentric tendencies. Along with other identifying characteristics, this type ofinformation can be used to decide which target market(s) to select and how best to adopt marketingstrategies to various markets. Media, segmentation and positioning strategies and plans might be adjustedin light of differing ethnocentric tendencies of the markets. For example, domestic marketers can appealethnocentric consumers by stressing a nationalistic theme in their promotional campaigns.
From the international marketing student perspective, to transcend ethnocentric tendencies and culturalmyopia, future managers must be trained to appreciate and internalize cultural differences. The successfulmanager in the 21st century will be globally aware and have a frame of reference that goes beyond aregion or even a country and encompasses the world. As Cateora (1996, p.24) indicated, to be globallyaware is to have objectivity, tolerance toward cultural differences and knowledge about cultures andglobal trends.
REFERENCES
Cateora, P. International Marketing, 9th ed., Chicago, IL:Irwin, 1996.Gaier, E. and Bass, B.M. “Regional Differences in Interrelations among Authoritarianism, Acquiescence and Ethnocentrism”, Journal of Social Psychology, 1959, 49, 47-51.Netemeyer, R.G., Durvasula, S. and Lichtenstein, D.R. “A Cross-National Assessment of the Reliability and Validity of the CETSCALE”, Journal of Marketing Research,1991,28 (August),320-327.Schiffman, L.G. and Kanuk,L.L.Consumer Behavior, 6th ed., NJ: Prentice Hall, 1997.Shimp, T. A. “Consumer Ethnocentrism: The Concept and a Preliminary Empirical Test.”, in T. G. Kinnear (ed) Advances in Consumer Research (Vol.11, pp.285-290) Provo, UT:Association for Consumer Research, 1984.Shimp, T. A. and Sharma, S. “Consumer Ethnocentrism: Construction and Validation of the CETSCALE,” Journal of Marketing Research, 1987 , 24(August), 280-289.Sharma, S. , Shimp, T.A., and Shin, J. “Consumer Ethnocentrism: A Test of Antecedents and Moderators,” Journal of the Academy of Marketing Science, 1995, 23(1), 26-37.Summer, W. G. Folkways. Boston, MA: Ginn & Company, 1906Wall, M. and Heslop, L. A. “Consumer Attitudes Toward Canadian-Made versus Imported Products,” Journal of Academy of Marketing Science, 1986, 14(Summer), 27-36.Whighan-Desir, M. “The New Black Power,” Black Enterprise, 1996, 26(12), 60-68.Wilkes, R.E. and Valenica, H. “Shopping-related Characteristics of Mexican-Americans and Blacks,” Psychology and Marketing, 1986, 3, 247-259.
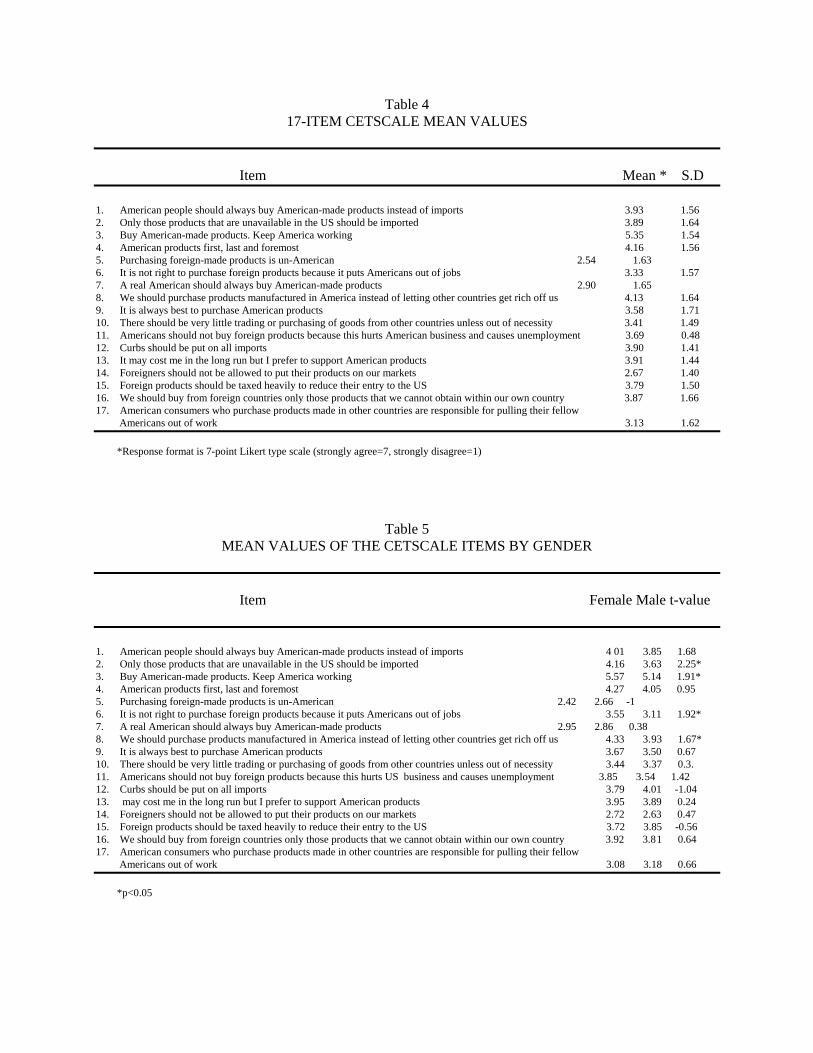
Table 417-ITEM CETSCALE MEAN VALUES
Item Mean * S.D
1. American people should always buy American-made products instead of imports 3.93 1.562. Only those products that are unavailable in the US should be imported 3.89 1.643. Buy American-made products. Keep America working 5.35 1.544. American products first, last and foremost 4.16 1.565. Purchasing foreign-made products is un-American 2.54 1.636. It is not right to purchase foreign products because it puts Americans out of jobs 3.33 1.577. A real American should always buy American-made products 2.90 1.658. We should purchase products manufactured in America instead of letting other countries get rich off us 4.13 1.649. It is always best to purchase American products 3.58 1.7110. There should be very little trading or purchasing of goods from other countries unless out of necessity 3.41 1.4911. Americans should not buy foreign products because this hurts American business and causes unemployment 3.69 0.4812. Curbs should be put on all imports 3.90 1.4113. It may cost me in the long run but I prefer to support American products 3.91 1.4414. Foreigners should not be allowed to put their products on our markets 2.67 1.4015. Foreign products should be taxed heavily to reduce their entry to the US 3.79 1.5016. We should buy from foreign countries only those products that we cannot obtain within our own country 3.87 1.6617. American consumers who purchase products made in other countries are responsible for pulling their fellow Americans out of work 3.13 1.62
*Response format is 7-point Likert type scale (strongly agree=7, strongly disagree=1)
Table 5MEAN VALUES OF THE CETSCALE ITEMS BY GENDER
Item Female Male t-value
1. American people should always buy American-made products instead of imports 4 01 3.85 1.682. Only those products that are unavailable in the US should be imported 4.16 3.63 2.25*3. Buy American-made products. Keep America working 5.57 5.14 1.91*4. American products first, last and foremost 4.27 4.05 0.955. Purchasing foreign-made products is un-American 2.42 2.66 -16. It is not right to purchase foreign products because it puts Americans out of jobs 3.55 3.11 1.92*7. A real American should always buy American-made products 2.95 2.86 0.388. We should purchase products manufactured in America instead of letting other countries get rich off us 4.33 3.93 1.67*9. It is always best to purchase American products 3.67 3.50 0.6710. There should be very little trading or purchasing of goods from other countries unless out of necessity 3.44 3.37 0.3.11. Americans should not buy foreign products because this hurts US business and causes unemployment 3.85 3.54 1.4212. Curbs should be put on all imports 3.79 4.01 -1.0413. may cost me in the long run but I prefer to support American products 3.95 3.89 0.2414. Foreigners should not be allowed to put their products on our markets 2.72 2.63 0.4715. Foreign products should be taxed heavily to reduce their entry to the US 3.72 3.85 -0.5616. We should buy from foreign countries only those products that we cannot obtain within our own country 3.92 3.81 0.6417. American consumers who purchase products made in other countries are responsible for pulling their fellow Americans out of work 3.08 3.18 0.66
*p<0.05
1
POSTMODERN AND POSITIVIST LINKS IN CONSUMERBEHAVIOR RESEARCH
Alan J. Greco, North Carolina A&T State University, Greensboro, NC 27411, (910) 334-7656 Ext. 4027
INTRODUCTION
From faltering steps in the early 1980s, the postmodern approach to consumer behavior slowly quickenedits pace to join logical positivism in the quest for knowledge and understanding of consumer behavior.With a genetic lineage from anthropology, hermeneutics, and semiotics, it aspired to recognition andacceptance by the established community of positivist researchers. Nurtured by Hirschman and Holbrook(1992), postmodernism is beginning to influence the consumer behavior field. Although its literature ispresently relatively small, there appears to be a growing interest in supplementing positivism withpostmodernism to enrich and expand consumer research (Holbrook 1987).
The postmodern approach to consumer behavior seeks to understand the consumption process and what itmeans to the consumer. An important dimension of this field of inquiry is the interpretation ofconsumption related institutions and symbols.
The mainstream positivist school has criticized the postmodern perspective, which questions theconnection of knowledge to anchors in the real world, as opening the flood gates to extreme relativismwhere intersubjective certifiableness and consensus among scholars becomes impossible (Calder andTybout 1987, 1989; Hunt 1989; Muncy and Fisk 1987). The postmodern proponents point to a broadenedmode of interpretative inquiry and understanding of consumption (Hirschman 1986; Holbrook andHirschman 1982; Hirschman and Holbrook 1992; Holbrook 1987; Holbrook and O’Shaughnessy 1988).
The consumer behavior literature has treated postmodernism and positivism as divergent schools ofthought. But instead of viewing the two perspectives as separate and competing modes of explanation, itis useful to view the two synergistically. Is postmodernism a competing epistemology as suggested byHirschman and Holbrook (1992, p. Vii)? Or, is it an alternative research methodology? Or, a set ofinformation gathering techniques? One way to resolve the issue is through the “contexts” of discoveryand justification (Hunt 1983, pp. 21-25). This paper’s objective is to briefly trace the outlines ofepistemic philosophy to demonstrate a linkage of the postmodern and positivist perspectives. Anapplication of a postmodern interpretative paradigm to a popular ad campaign is presented to show howone might perform postmodern research and to stimulate consumer research discourse.
DISCOVERY VS. JUSTIFICATION
As Hunt (1983, p. 19) suggests, the conceptual and physical techniques of a science should not beconfused with the scientific method. The methodology of science lies in its logic of justification--including the testing of hypotheses and constructing theory on which a science bases its acceptance orrejection of its body of knowledge. The question of how one discovers scientific hypotheses orknowledge is another issue loosely called the context of discovery.
Several processes and techniques reside in the realm of discovery (Bergman 1957, p. 51; Hunt 1983, pp.21-23; Zaltman, Pinson, and Anglemar 1973, p. 12): (1) assessment of relevant existing knowledge, (2)concept formulation and specification of hypotheses; (3) acquisition of meaningful data; (4) analyzingdata in relevant ways; and (5) evaluation and learning from results. The sources of these activities canrange from observation, reading, speculation, flashes of perceptual insight (serendipity or “eureka”experiences), to dreams. Observation and speculation, respectively, follow the inductive and deductive
2
routes to scientific discovery. Each approach, or some combination, can lead to the discovery ofempirically-based generalizations, laws, or theories that dwell in the “context” of justification.Hunt (1983, p. 25) cogently argues that “there is no set of procedures guaranteed to lead to the discoveryof laws and theories. Therefore, there is no single “logic of discovery.” However, the belief that there aremany scientific methods does not necessarily follow because the scientific method dwells in the contextof justification--not in the house of discovery. The context of justification is the domain for empiricalgeneralizations, laws, and theories that seek to understand, explain, and predict consumer behavior.
POSTMODERNISM
Hirschman and Holbrook (1992), in the main, characterize positivism and postmodernism as competingepistemologies, but occasionally as a set of “methods” (p.2) and as a “philosophic perspective” (p. 3).Does postmodernism belong in the context of discovery or justification? Salmon (1961) and Hunt (1983,p. 21) observed that dividing issues into discovery and justification is often difficult. Citing Bergman(1957, p. 51), Hunt maintains that “many philosophers of science, including Hegel and John Dewey, haveconfused the discovery of scientific knowledge with its justification. The confusion of discovery withjustification seems widespread, and marketing is no exception.”
It is suggested here that the postmodern perspective, with its focus on interpretation of signs, symbols,and text, is not one to be disparaged or rejected by mainstream researchers. Rather, it should be seen as asource of new and different insights and experiences, ready to sow new seeds of inquiry into the house ofdiscovery’s landscape.
Hirschman and Holbrook (1992) have taken great care in their monograph to set forth an epistemologicalcontinuum (p. 8) outlining accompanying research methods, underlying metaphysical assumptions, andexamples from consumer behavior research in a thought-provoking volume where consumption is the“text” (p. 55). They propose that postmodernism resides between the epistemic extremes of empiricism(or material determinism, e.g., Hume) and rationalism (mental determinism, e.g., Descartes). In so doing,they maintain that these anchor points represent “competing” epistemologies with unique methods ofinquiry. To appreciate Hirschman and Holbrook’s (1992) approach, it is necessary to briefly consider theepistemologies of two representative philosophers, Descartes and Hume.
Mental Determinism - Descartes
Descartes is best known for “dualism,” the separation of mind and matter. He believed that a humanbeing belongs to both worlds; first, as part of a physical world that does not depend on thought andsecond, as a being with a Mind that perceives, wills, feels, and imagines. Descartes espoused the idea thatnothing can be without a cause (Rader 1969, p. 260).
For Decartes the rationalist, intuition derives from reason and deduction. Reason, he initially believed, isthe source of genuine knowledge. However, in practice, Rader (1969, p. 57) suggests that Descartes’s“method was not so extreme and one sided as is often supposed.” Instead, Descartes recognized twoways of achieving knowledge--by pure reason and by experience. He fell back on empirical methods andhe strongly recommended to others that such observations and experiments be conducted.
In his “Rules for Direction of the Mind,” Descartes wrote that men have distinguished the sciences “fromone another according to their subject matter (and) they have imagined that they ought to be studiedseparately, each in isolation from all the rest. But this is certainly wrong.”Knowing one truth, like the acquisition of one skill, does not prevent learning another, but “rather aids usto do so . . . Hence we must believe that all the sciences are so inter-connected, that it is much easier tostudy them all together than to isolate one from all the others (Descartes in Rader 1969, p. 47). Thus,Descartes seems to suggest that multiple methods can be used in the logic of discovery.
3
Material Determinism - Hume
Hume the empiricist, shared with Descartes the idea that scientific knowledge is based on the idea ofcausation (Rader 1969, p. 410). Hume traced all knowledge to some original basis in experience. Hecontended that the stream of experience is made up of perceptions that include impressions and ideas.Impressions are gathered from the senses and are the original sensations and feelings. Ideas are images orrepresentations of the original impressions. Thus, impressions are the cause or source of ideas.
Hume writes, “The only connection or relation of objects which can lead us beyond the immediateimpressions of our memory and senses, is that of cause and effect; and that because it is the only one onwhich we can found a just inference from one object to another.” Essentially external objects are inferredbecause they are believed to be the causes of the immediate data of experience. Only perceptions Areknown directly; everything else is based on inference. Therefore, Hume reduced reality to a “stream ofperceptions” (Rader 1969, p. 412). Postmodern researchers remind the empiricists that perception isculturally anchored and subject to change over time (Stock 1990, p. 122).
A LINKAGE?
The brief review of the key tenets of the purportedly opposing ends of the epistemic continuum as positedby Hirschman and Holbrook (1992, p. 8) suggests that the differences between the two anchors are not assharp as they are often represented. Even Hirschman and Holbrook (1992, p. 120) concede that the“bases for commentary and criticism are (a) conceptually distinct and (b) empirically related.”
As discussed earlier in the paper, the postmodern and positivist perspectives can find common ground inthe context of discovery. Interpretative methods of anthropology, hermeneutics, and semiotics can lead toscientific knowledge in the context of discovery. The discovery process contains many paths toknowledge. Hunt, the mainstream positivist, maintains that there is no single logic of discovery. EvenHirschman and Holbrook’s (1992, p. 8) epistemic opposites, Descartes and Hume, call for an integrationof the sciences, suggesting a singularity of the logic of justification as promulgated by Hunt (1983, pp.21-25).
It is unfortunate that proponents of postmodernism had initially been criticized for their approach tounderstanding consumption (e.g., Calder and Tybout 1987, 1989; Hunt 1989; Muncy and Fisk 1987). Asfor the question of whether postmodernism is a competing epistemology or a set of techniques forgathering interpretative information, one answer is “It doesn’t matter,” if the postmodern school’scontributions are cast in the realm of discovery. The latter assumes that positivists and postmodernitescan live with the idea that there is but one logic of justification--the so-called scientific method which iscommon to all science (Hunt 1983, p. 25). The scientific method involves the assumption that there areunderlying uniformities and regularities among some subject matter which science seeks to discover. Thegoals of the scientific method are the development of generalizations, laws, and theories that can lead tounderstanding, explanation, and prediction within the context or logic of justification.
There should be no quarrel among consumer behavior researchers about postmodern interpretivetechniques joining the other avenues of dreams, eureka, speculation, reading, and observation as multipleroutes to the discovery process in the context of discovery. Selected findings and interpretations frompostmodern inquiry can serve as springboards for empirical testing in the context of justification. In thisway postmodernism can offer fresh insights to the pursuit of scientific knowledge in consumer behaviorresearch.
4
A POSTMODERN STRATEGY IN ACTION
To demonstrate a linkage of postmodern and positivist perspectives in consumer research, consider thefollowing example in advertising. First, one postmodern paradigm--deconstructionism-- is brieflydescribed. Second, the method is used to interpret possible meanings of the well-known Joe Cameladvertising campaign character. Finally, the contribution of deconstruction to consumer research isdiscussed.
Stern (1996) introduced the deconstructionist literary criticism paradigm, originated by the Frenchphilosopher Derrida (Kamf 1991), to the consumer research literature by using applications-orientedcriticism (e.g., Hartman 1981) to map deconstructive ideas from the literary domain onto consumerbehavior. Earlier, deconstructive criticism had been adapted to contexts ranging from political science tophysics. In a business setting, Gephart (1996, p. 42) commented that deconstructive criticism is useful foruncovering the detached and hidden implications of symbols of various types.
Derrida maintains that the deconstructive locus of reality is the “text.” As used here, “text” is conceivedas a linguist construct of anything that exists, be it a word, an idea, or a relationship. The historical andinstitutional structures commonly accepted as reality are all reproduced and communicated in linguisticforms (Calas and Smircich 1992). From this point of view, the realities of institutions such asconsumption, marketing, and advertising are displayed in text.
In deconstruction, the objective is to discover (c.f., Hunt 1983, p. 21) in a text--such as an advertisement--what is unsaid or what might be viewed as a “space” or a “blind spot” between what is articulated (thesignifier) and what meaning is mentally constructed (what is signified). This approach deviates from thetraditional preference for unity, certainty, and objectivity in critical interpretation. The rationale is that atext of, say, words and symbols, is a cultural construct with ascribed meanings rather than natural oruniversal representations of reality (Stock 1990, p. 121). Unlike structural analysis which identifies andexamines binaries or oppositions such as male/female, human/animal, or blind/sighted ( Levy 1981), andachieves closure by reconciling the conflicts through mediation where the opposites are fused into asocially constructed gestalt-like entity, deconstruction rejects the goal of convergence. Derrida’s methodof deconstruction begins with (1) a “close reading” or sourcing of key parts of a text to expose what thestarting point conceals, then continues with (2) a structural analysis of the key binaries, and (3) concludesby deconstructing the results of the structural analysis by identifying gaps or absences in the text that canlead one to question a singular truth or to deny closure (Stern 1996).
Deconstruction of Joe Camel
Stern (1996) performed a detailed deconstruction of Joe Camel using Derrita’s three-step procedureoutlined above. The interested reader is referred to her article for a complete description of the technique.Since the goal here is simply to illustrate how a postmodern technique can be useful to consumer behaviorresearch, only selected portions of her analysis are presented.
A deconstructive analysis seeks to discover multiple and divergent interpretations of the text. It avoidsreconciliation or closure. For example, a deconstructive reading reveals that “Joe” is a bisexual nameindistinguishable in pronunciation from “Jo.” In addition, girls in France have been christened with amale saint’s name, “Joseph.” The word “camel” can be traced to dual meanings relating to obedience andlust.
The deconstructionist’s disregard of borders raises the question of what is true in the ad. The adencourages product consumption, yet it contains a warning against consumption. According to Derrida, it
5
is impossible to determine the “true” meaning of the ad. So, too, Joe Camel’s sexuality may beindeterminate, if gaps or spaces in the text are analyzed. Is he a dominant heterosexual male? Arepressed homosexual who travels with the “Hard Pack,” a group of all-male jazz players? Do theexaggerated male power artifacts such as mirrored sunglasses and leather jackets (c.f., The VillagePeople), too, suggest homosexuality? Stern (1996, p. 143) believes the implications of such findings are:“If the borders between inside and outside and male and female do not hold, neither do those betweenblack and white, middle and lower class, Euro-American and Egyptian . . . Joe’s polymorphoussignification enfolds race, class, and country of origin . . . He is both white and nonwhite, middle andlower class . . . fantastic and realistic.” “Natural oppositions are shown to be neither natural nor opposed(Gherardi 1995).
IMPLICATIONS FOR CONSUMER RESEARCH AND MARKETING
The deconstruction of text highlights how some dominant or established voices drown out less dominantothers. Lack of awareness of the deconstruction point of view can lead to classifying research inquiryinto dichotomous and unrelated techniques of positivistism and postmodern interpretation. As mentionedearlier in the paper, the postmodern methods of inquiry can be viewed in the context of discovery (Hunt1983, p. 22-25; Messer et al. 1988, p.12). The context of discovery enfolds the context of justification andvice versa. If postmodern consumer research techniques can amplify the long silenced voices of African-Americans, Asian-Americans, lower social classes, and other “under-researched” subjects, then it willhave made a significant contribution to marketing and to consumer behavior research.
REFERENCES
Bergman, Gustav. 1957. Philisophy of Science. Madison, WI: University of Wisconsin Press.
Calas, Marta B. And Linda Smircich. 1992. “Using the ‘F’ Word: Feminist Theories and the SocialConsequences of Organizational Research.” In Gendering Organizational Analysis. Eds. Albeert J. Millsand Peta Tancred, Newbury Park, CA:Sage: 222-234.
Calder, Bobby J. and Alice M. Tybout. 1987. “What Consumer Research Is . . .” Journal of ConsumerResearch. 14 (June): 136-140.
___________. 1989. “Interpretative, Qualitative, and Traditional Scientific Empirical Consumer BehaviorResearch.” in Interpretive Consumer Research. Ed. Elizabeth C. Hirschman. Provo, UT: Association forConsumer Research: 199-208.
Gephart, Robert P., Jr. 1996. “Management, Social Issues, and the Postmodern Era.” In PostmodernManagement and Organization Theory. Eds. David M. Boje et al. Thousand Oakes, CA: Sage: 21-44.
Gherardi, Silvia. 1995.Gender, Symbolism and Organizational Cultures. London: Sage.
Hartman, Geoffrey. 1981. Saving the Text: Literature/Philosophy/Derrida. Baltimore: The Johns HopkinsUniversity Press.
Hirschman, Elizabeth C. 1986. “Humanistic Inquiry in Marketing Research: Philosophy, Method, andCriteria.” Journal of Marketing Research. 21 (August): 237-249.

6
__________ and Morris B. Holbrook. 1992. Postmodern Consumer Research: The Study of Consumptionas Text. Newbury Park, CA: Sage Publications.
Holbrook, Morris C. And Elizabeth C. Hirschman. 1982. “The Experiential Aspects of Consumption:Consumer Fantasies, Feelings, and Fun.” Journal of Consumer Research. 9 (September): 132-140.
__________ . 1987. “What Is Consumer Research?” Journal of Consumer Research. 14 (June): 128-132.
__________ and John O’Shaughnessy. 1988. “On the Scientific Status of Consumer Research and theNeed for an Interpretive Approach to Studying Consumer Behavior.” Journal of Consumer Research. 15:398-402.
Hunt, Shelby D. 1983. Marketing Theory: The Philosophy of Marketing Science. Homewood, IL:RichardD. Irwin, Inc.
__________. 1989. “Naturalistic, Humanistic, and Interpretive Inquiry: Challenges and UltimatePotential.” In Interpretive Consumer Research. Ed. Elizabeth C. Hirschman. Provo, UT: Association forConsumer Research: 185-198.
Kanuf, Peggy, ed. 1991. A Derrida Reader: Between the Blinds. New York: Columbia University Press.
Kopytoff, Igor. 1986. “The Cultural Biography of Things.” In The Social Life of Things: Commodities inCultural Perspective. Ed. Arjun Appadurai. Cambridge: Cambridge University Press: 64-91.
Levy, Sydney J. 1981. “Interpreting Consumer Mythology: A Structural Approach to ConsumerBehavior.” Journal of Marketing. 45 (Summer): 49-61.
Messer, Stanley B., Louis A. Sass, and Robert L. Woolfolk, eds. 1988. Hermeneutics and PsychologicalTheory. New Brunswick, NJ: Rutgers University Press.
Muncy, J. A. And R. P. Fisk. 1987. “Cognitive Relativism and the Practice of Marketing Science.”Journal of Marketing. 51 (January): 20-33.
Rader, Melvin. 1969. The Enduring Questions: Main Problems of Philosophy. New York: Holt, Rinehartand Winston.
Salmon, Wesley C. 1963. Logic. Englewood Cliffs, NJ: Prentice-Hall, Inc.
Stern, Barbara B. 1996. “Deconstructive Strategy and Consumer Research: Concepts and IllustrativeExemplar.” Journal of Consumer Research. 23 (September): 136-147.
Stock, Brian. 1990. Listening for the Text. Baltimore: The Johns Hopkins University Press.
Zaltman, Gerald, Christian R. A. Pinson, and Reinhard Angelmar. 1973. Metatheory and ConsumerResearch. New York: Holt, Rinehart and Winston.

7
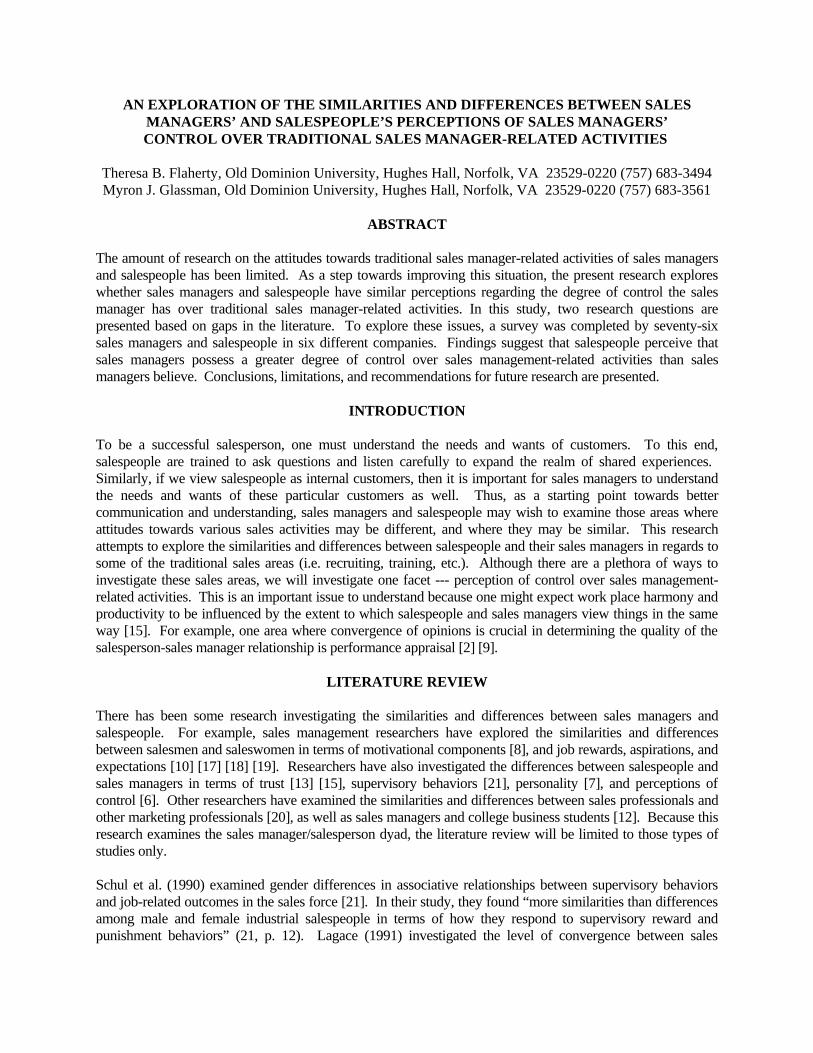
AN EXPLORATION OF THE SIMILARITIES AND DIFFERENCES BETWEEN SALESMANAGERS’ AND SALESPEOPLE’S PERCEPTIONS OF SALES MANAGERS’CONTROL OVER TRADITIONAL SALES MANAGER-RELATED ACTIVITIES
Theresa B. Flaherty, Old Dominion University, Hughes Hall, Norfolk, VA 23529-0220 (757) 683-3494Myron J. Glassman, Old Dominion University, Hughes Hall, Norfolk, VA 23529-0220 (757) 683-3561
ABSTRACT
The amount of research on the attitudes towards traditional sales manager-related activities of sales managersand salespeople has been limited. As a step towards improving this situation, the present research exploreswhether sales managers and salespeople have similar perceptions regarding the degree of control the salesmanager has over traditional sales manager-related activities. In this study, two research questions arepresented based on gaps in the literature. To explore these issues, a survey was completed by seventy-sixsales managers and salespeople in six different companies. Findings suggest that salespeople perceive thatsales managers possess a greater degree of control over sales management-related activities than salesmanagers believe. Conclusions, limitations, and recommendations for future research are presented.
INTRODUCTION
To be a successful salesperson, one must understand the needs and wants of customers. To this end,salespeople are trained to ask questions and listen carefully to expand the realm of shared experiences. Similarly, if we view salespeople as internal customers, then it is important for sales managers to understandthe needs and wants of these particular customers as well. Thus, as a starting point towards bettercommunication and understanding, sales managers and salespeople may wish to examine those areas whereattitudes towards various sales activities may be different, and where they may be similar. This researchattempts to explore the similarities and differences between salespeople and their sales managers in regards tosome of the traditional sales areas (i.e. recruiting, training, etc.). Although there are a plethora of ways toinvestigate these sales areas, we will investigate one facet --- perception of control over sales management-related activities. This is an important issue to understand because one might expect work place harmony andproductivity to be influenced by the extent to which salespeople and sales managers view things in the sameway [15]. For example, one area where convergence of opinions is crucial in determining the quality of thesalesperson-sales manager relationship is performance appraisal [2] [9].
LITERATURE REVIEW
There has been some research investigating the similarities and differences between sales managers andsalespeople. For example, sales management researchers have explored the similarities and differencesbetween salesmen and saleswomen in terms of motivational components [8], and job rewards, aspirations, andexpectations [10] [17] [18] [19]. Researchers have also investigated the differences between salespeople andsales managers in terms of trust [13] [15], supervisory behaviors [21], personality [7], and perceptions ofcontrol [6]. Other researchers have examined the similarities and differences between sales professionals andother marketing professionals [20], as well as sales managers and college business students [12]. Because thisresearch examines the sales manager/salesperson dyad, the literature review will be limited to those types ofstudies only.
Schul et al. (1990) examined gender differences in associative relationships between supervisory behaviorsand job-related outcomes in the sales force [21]. In their study, they found “more similarities than differencesamong male and female industrial salespeople in terms of how they respond to supervisory reward andpunishment behaviors” (21, p. 12). Lagace (1991) investigated the level of convergence between sales
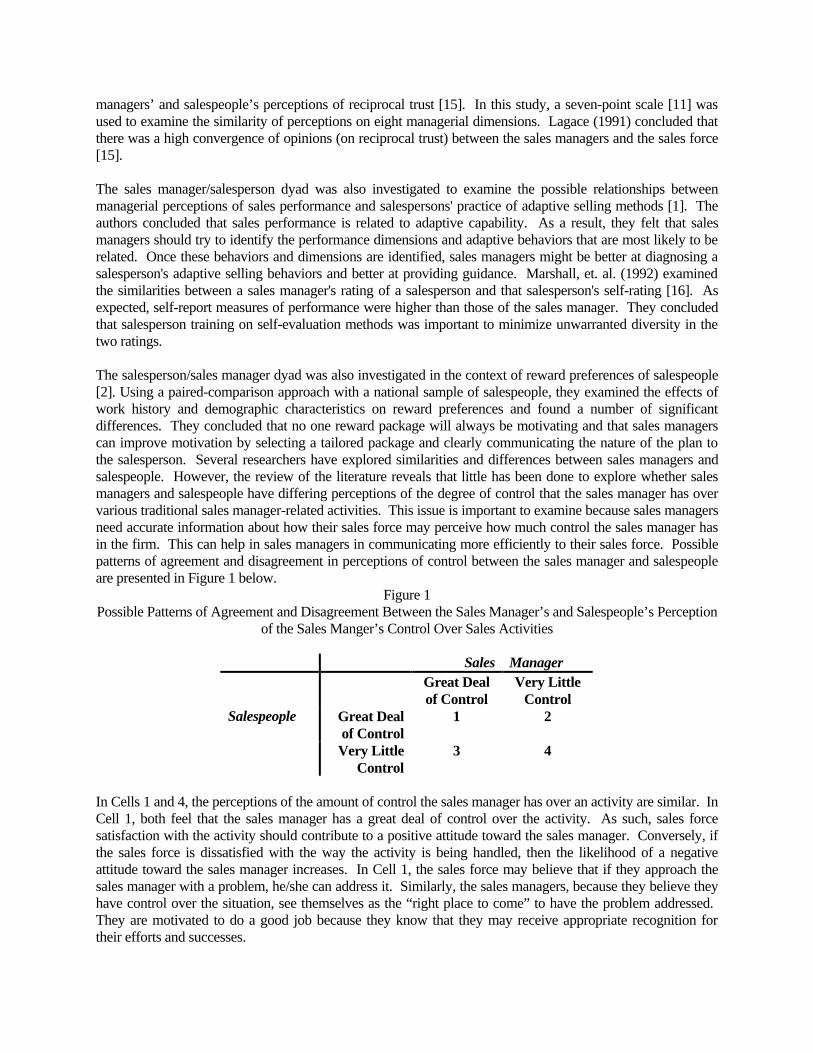
managers’ and salespeople’s perceptions of reciprocal trust [15]. In this study, a seven-point scale [11] wasused to examine the similarity of perceptions on eight managerial dimensions. Lagace (1991) concluded thatthere was a high convergence of opinions (on reciprocal trust) between the sales managers and the sales force[15].
The sales manager/salesperson dyad was also investigated to examine the possible relationships betweenmanagerial perceptions of sales performance and salespersons' practice of adaptive selling methods [1]. Theauthors concluded that sales performance is related to adaptive capability. As a result, they felt that salesmanagers should try to identify the performance dimensions and adaptive behaviors that are most likely to berelated. Once these behaviors and dimensions are identified, sales managers might be better at diagnosing asalesperson's adaptive selling behaviors and better at providing guidance. Marshall, et. al. (1992) examinedthe similarities between a sales manager's rating of a salesperson and that salesperson's self-rating [16]. Asexpected, self-report measures of performance were higher than those of the sales manager. They concludedthat salesperson training on self-evaluation methods was important to minimize unwarranted diversity in thetwo ratings.
The salesperson/sales manager dyad was also investigated in the context of reward preferences of salespeople[2]. Using a paired-comparison approach with a national sample of salespeople, they examined the effects ofwork history and demographic characteristics on reward preferences and found a number of significantdifferences. They concluded that no one reward package will always be motivating and that sales managerscan improve motivation by selecting a tailored package and clearly communicating the nature of the plan tothe salesperson. Several researchers have explored similarities and differences between sales managers andsalespeople. However, the review of the literature reveals that little has been done to explore whether salesmanagers and salespeople have differing perceptions of the degree of control that the sales manager has overvarious traditional sales manager-related activities. This issue is important to examine because sales managersneed accurate information about how their sales force may perceive how much control the sales manager hasin the firm. This can help in sales managers in communicating more efficiently to their sales force. Possiblepatterns of agreement and disagreement in perceptions of control between the sales manager and salespeopleare presented in Figure 1 below.
Figure 1Possible Patterns of Agreement and Disagreement Between the Sales Manager’s and Salespeople’s Perception
of the Sales Manger’s Control Over Sales Activities
Sales ManagerGreat Dealof Control
Very LittleControl
Salespeople Great Dealof Control
1 2
Very LittleControl
3 4
In Cells 1 and 4, the perceptions of the amount of control the sales manager has over an activity are similar. InCell 1, both feel that the sales manager has a great deal of control over the activity. As such, sales forcesatisfaction with the activity should contribute to a positive attitude toward the sales manager. Conversely, ifthe sales force is dissatisfied with the way the activity is being handled, then the likelihood of a negativeattitude toward the sales manager increases. In Cell 1, the sales force may believe that if they approach thesales manager with a problem, he/she can address it. Similarly, the sales managers, because they believe theyhave control over the situation, see themselves as the “right place to come” to have the problem addressed. They are motivated to do a good job because they know that they may receive appropriate recognition fortheir efforts and successes.

In Cell 4, both feel that the sales manager has little control over the activity. Here, sales force satisfaction withthe activity is expected to have little bearing on the relationship with the sales manager. The sales managersdo not accrue any benefits of high levels of satisfaction with an activity, nor are they likely to suffer anynegative consequences if the sales force is dissatisfied because they see the problem as being out of the salesmanager’s control. If there is a problem, the sales force doesn’t take it to the sales manager because theybelieve there is nothing that can be done about it. Similarly, the sales managers are pleased that salespeopledo not bring problems to them because they feel powerless to make any changes.
In Cells 2 and 4, the perceptions of the amount of control the sales manager has over an activity are different. In Cell 2, the sales manager has very little control over an activity while the sales force believes that the salesmanager has a great deal of control. While the sales managers will accrue unwarranted benefits of anysuccesses, they also must take the unjustified blame for any failures. Here, the sales force will likely take aproblem to the sales manager. However, the sales managers are likely to be frustrated because they feel thatthey can’t initiate any changes. Because nothing is likely to change, the sales manager feels unjustly criticizedby the sales force. In Cell 4, the sales manager perceives a great deal of control while the sales force feels thatthe sales manager has very little control. This means that the sales managers will not accrue any benefits ofsuccess, nor will they experience any consequences of failure. Here, the sales managers may wonder why thesales force didn’t give them an opportunity to make changes and they will resent the fact that they were “side-stepped” by the sales force.
Given the need to understand these issues, we propose two exploratory research questions which are followedby the methodology and results of a study to examine these issues: Research Question 1: Are there significant differences between sales manager’s and salespeople’sperception of how much control the sales manager has over sales manager-related activities in theircompany?Research Question 2: If differences do indeed exist, in what areas are they?
METHODOLOGY
The data were collected as part of a senior-level class project in sales management. Students, working ingroups, were required to contact a company with the following criteria: 1) there is one sales manager whomanages at least six salespeople at the company, 2) the sales manager must have direct, regular, and closesupervision over the salespeople, and 3) the salespeople’s compensation is primarily based on commission. Although convenience sampling was used, a 100% response rate was achieved at each company participating. The sample included the following types of companies: a car dealership (9 salespeople), an insurancecompany (6 salespeople), a stock brokerage firm (16 salespeople), a radio station (17 salespeople), a cosmeticscompany (11 salespeople), and a real estate firm (17 salespeople). A total of six sales managers and seventysalespeople participated in this research. While a convenience sample does pose certain limitations, it isbelieved that the general methodology used is adequate in light of the exploratory nature of the two researchquestions presented above.
After making the necessary contacts, the students conducted interviews with sales managers and salespeoplefor their course requirements. When the interview was complete, the students gave the sales manager a set ofquestionnaires. The sales manager was asked to complete one of these questionnaires (specifically tailored forthe sales manager) and distribute the remainder to their sales force (designed for the salespeople). All surveysincluded a cover letter outlining the purpose of the study. Subjects also received a postage-paid envelopeaddressed to the researchers in order to preserve anonymity and encourage a higher response rate. Eachquestionnaire was divided into four major areas. This paper only reports results from the second area of thesurvey (those items dealing with control issues).

In the second area of the survey, both the salespeople and their sales managers received surveys that addressedeach of eleven activities traditionally engaged in by sales managers [22] as well as a question about overallperception of control. Specifically, sales managers were asked to rate “how much control do you have overthe following activities?” and the salespeople were asked to rate “how much control do you believe your salesmanager has over the following activities?” where “1” meant “very little control” and “5” meant “very muchcontrol.” Salespeople were also given the option of rating the question as a “6” which indicated that they“didn’t know” how much control their sales manager had over the activities. The eleven sales managementactivities on the scale were: the way salespeople are recruited, the way salespeople are selected/hired, trainingprograms for salespeople, motivational programs for salespeople, the way sales quotas are set, the way thesales force is evaluated, the way the salesforce is supervised, the way salesforce activities are planned, and theway salesforce expenses are handled. These are very common sales force categories typically found in mostsales management textbooks [5] and sales-related journals [14]. At the end of the first section, sales managerswere asked “Overall, how much control do you have over sales management-related activities?” andsalespeople were asked “Overall, how much control do you believe your sales manager has over sales-management related activities?”
Although not included in this paper, the first and third sections of the survey also used the same eleven salesmanagement-related activities as the basis for examination. The first part asked both the sales managers andsalespeople to evaluate “How satisfied are you with the way that each of the following sales activities arehandled in your company?” The third section asked the sales manager “Do you think that your salesforcewould like to see things handled differently or the same way they are handled now?” and the salespeople wereasked “In general, would you manage it (your company’s sales force) differently or the same way that it ismanaged now?” A four-point scale, ranging from “very differently” to “the same way as now” was used. Thefourth part of the survey contained a series of questions about overall job satisfaction and demographicinformation. This questionnaire was pre-tested on 20 sales managers and salespeople prior to use for thepresent study.
RESULTS
To answer the first research question (Are there significant differences between sales managers’ andsalespeople’s satisfaction with how traditional sales-related activities are handled in their company?) werefer to Table 1 below. Column 1 lists each of the eleven sales manager-related activities and the overallperception of control. The second column contains the sales managers’ average score, column three identifiesthe salespeople’s average scores, and column four shows the difference between sales managers’ andsalespeople’s perceptions of the sales managers’ control over sales management-related activities. To arrive atthis difference score, the salesperson’s score (in column 3) was subtracted from his or her sales manager’sscore (column 2). The fifth column contains the standard error of the mean, and the final column contains theZ-score for each value. The Z-score was based on the absolute value of the difference between eachsalesperson’s score and his/her sales manager’s score.
As seen in Table 1, salespeople generally perceived that sales managers have more control over activitiescompared to the sales managers’ views of their own degree of control. Despite the salespeople havinghigher perceptions of the degree of control, there is considerable variability in both groups’ scores. Thesales managers’ scores ranged from a high of 4.667 (on a five-point scale) for supervision to a low of2.000 for the way the sales force is compensated. The sales force’s ratings ranged from 3.00 for the waythe sales force is compensated to a 4.449 for the way salespeople are hired. Despite the considerablerange, the majority of the ratings for both the sales managers and the salespeople were, on average,approximately at the midpoint of “very much control” and “very little control.” The salespeople’s ratingswere higher for ten of the twelve comparisons. With respect to statistical significance, the differences in
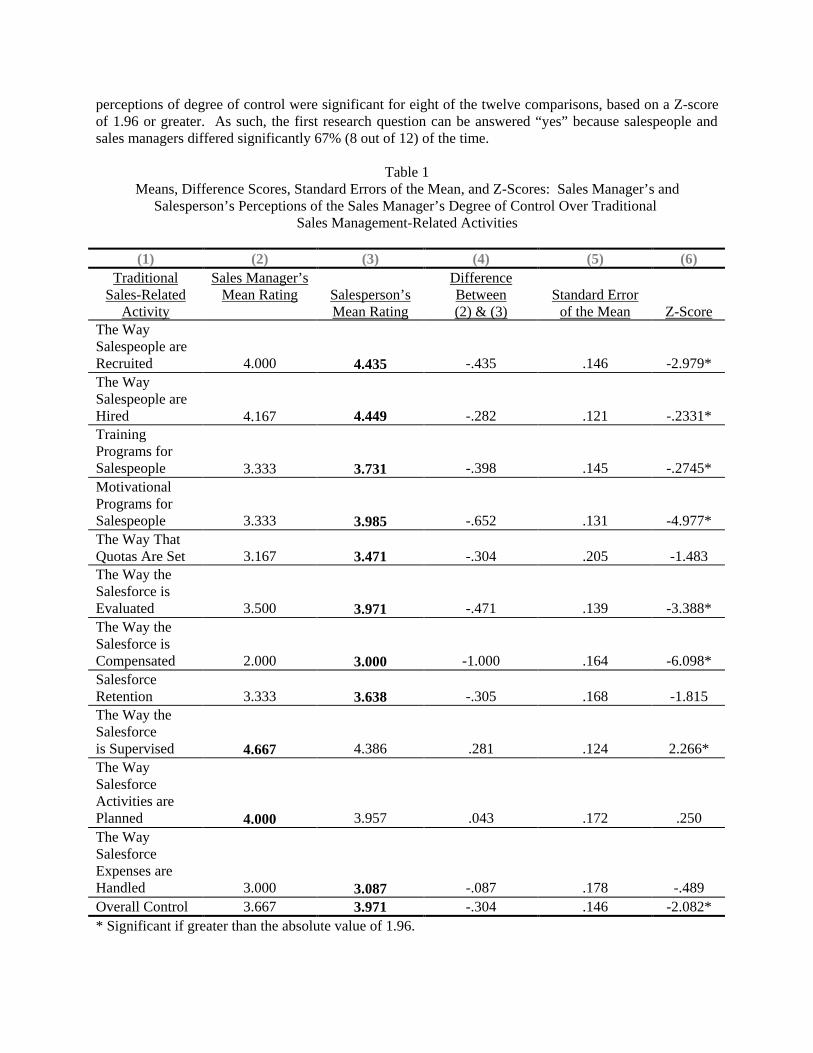
perceptions of degree of control were significant for eight of the twelve comparisons, based on a Z-scoreof 1.96 or greater. As such, the first research question can be answered “yes” because salespeople andsales managers differed significantly 67% (8 out of 12) of the time.
Table 1Means, Difference Scores, Standard Errors of the Mean, and Z-Scores: Sales Manager’s and
Salesperson’s Perceptions of the Sales Manager’s Degree of Control Over Traditional Sales Management-Related Activities
(1) (2) (3) (4) (5) (6)Traditional
Sales-RelatedActivity
Sales Manager’sMean Rating Salesperson’s
Mean Rating
DifferenceBetween(2) & (3)
Standard Errorof the Mean Z-Score
The WaySalespeople areRecruited 4.000 4.435 -.435 .146 -2.979*The WaySalespeople areHired 4.167 4.449 -.282 .121 -.2331*TrainingPrograms forSalespeople 3.333 3.731 -.398 .145 -.2745*MotivationalPrograms forSalespeople 3.333 3.985 -.652 .131 -4.977*The Way ThatQuotas Are Set 3.167 3.471 -.304 .205 -1.483The Way theSalesforce isEvaluated 3.500 3.971 -.471 .139 -3.388*The Way theSalesforce isCompensated 2.000 3.000 -1.000 .164 -6.098*SalesforceRetention 3.333 3.638 -.305 .168 -1.815The Way theSalesforceis Supervised 4.667 4.386 .281 .124 2.266*The WaySalesforceActivities arePlanned 4.000 3.957 .043 .172 .250The WaySalesforceExpenses areHandled 3.000 3.087 -.087 .178 -.489Overall Control 3.667 3.971 -.304 .146 -2.082** Significant if greater than the absolute value of 1.96.

To address the second research question (If differences do indeed exist, in what areas are they?) we referto Table 2. To shed insight into the nature of the differences, the eleven traditional sales manager-relatedactivities and the overall perception of control score were grouped according to whether or not thedifferences between the sales managers and the salespeople were significant.
Table 2Summary of Significant and Non-Significant Differences: Sales Managers’ and Salespersons’ Perception of
the Sales Manager’s Control Over Traditional Sales-Related Activities
(1) (2) (3)Sales Manager Significantly Higher than the Salesperson
Salesperson Significantly Higherthan the Sales Manager
No Significant Differences inControl Ratings
Supervision Recruiting Setting QuotasHiring/Selection Salesforce RetentionTraining Programs PlanningMotivational Programs Handling ExpensesSalesforce EvaluationSalesforce CompensationOverall Perception of Control
Column (1) identifies supervision as the only area where the sales manager perceived a greater degree ofcontrol than the salespeople’s perception of control. It is interesting to note that the sales manager’s rating ofhis/her perception of control over supervision was much higher than the other 11 areas that were evaluated. Column (2) identifies seven sales-related activities where the salespeople perceive that the sales manager hasmore control than the sales manager’s own perception of control. These areas include: recruiting,hiring/selection, training programs, motivational programs, salesforce evaluation, salesforce compensation,and overall perception of control. Column (3) summarizes those activities where the sales managers andsalespeople did not have significantly different perceptions of control. These four areas include: settingquotas, salesforce retention, planning, and handling expenses.
DISCUSSION
The overall results of this research suggest that sales managers and salespeople do demonstrate somedifferences in perceptions of how much control the sales manager has over traditional sales-related activities. In the world of selling, putting yourself into your customer's shoes is very important. It is also importantwithin the context of a sales organization. To that extent, if sales managers and salespeople have similarperceptions of how much control the sales manager has over traditional sales-related activities in the company,then one might expect a more productive and more well-run sales organization. If, as this study revealed, theydo not have similar perceptions, then one might expect conflict and an unhealthy sales organization that isdistracted from a goal of profitable sales.
On a practical level, the differences presented here imply that salespeople do not have a clear understanding ofthe sales managers’ span of control. Generally, salespeople believe that the sales manager has more controlthan the sales manager believes. Returning to Figure 1, the perceptions for most activities fall in Cell 2. Thisimplies that, in general, sales managers receive both unwarranted praise and blame for their actions.
For all the activities listed in Column 2 in Table 2, sales managers may be viewed by the sales force as beingable to correct problems in these areas while the sales managers may not feel they have the ability to solvethem. If the problems are not solved, the sales force may wonder about the caring and competency of thesales manager. To resolve this problem, the sales managers should explain to the sales force why the solutionto the problem is beyond their control. This may involve explaining the firm’s organizational chart, policies,

and/or procedures to the sales force. Or, it might involve bringing a higher level sales or marketing executiveto a sales meeting to explain the situation.
Whether or not action to reduce the discrepancy in perceptions is warranted depends upon a number offactors. The first, is the absolute magnitude of the difference. In this research, a difference in perception of.281 was statistically significant. While significant, it is uncertain whether a difference of approximately one-quarter of a point on a five-point scale warrants any action. A second factor that may affect whether action isnecessary is whether both groups are on the same side of the midpoint (that is, they both see the sales manageras having or not having control). If they are on the same side, then action is less likely to be necessarybecause little is likely to be gained by trying to bridge the gap between a significantly different 4.20 and 4.50. However, when the sales force and the sales manager are on different sides of the mid-point, then correctiveaction is more likely to help the relationship between the sales manager and sales force.
In this research, there is one area where corrective action seems necessary. That area is with respect to theway the sales force is compensated. On average, the sales managers feel they have little control over this area(2.000). While the 3.000 average is the lowest control score given by the salespeople, it suggests that the sales force feels that the sales manager has some degree (albeit a small one) over compensation. Higher levelexecutives should determine whose perception is correct. If the sales managers’ perceptions are correct, thenthey should communicate this fact to the sales force so that the sales manager is not viewed as incompetentand uncaring. If the executive determines that the sales force’s perception is correct, then the sales managersshould be made aware of the fact that they have more control over this area.
LIMITATIONS AND SUGGESTIONS FOR FUTURE RESEARCH
An obvious limitation pertains to the small convenience sample used in this study. This limits thegeneralizability to sales managers with direct contact with six or more salespeople who work on commission. Much larger random samples should be used in future research in order to confirm or deny these findings. Asecond limitation is that the measures used in this study were very general in nature and were not subject tomore stringent development such as the paradigm for developing measures [4]. Finally, although collegestudents were involved in this study, it should be noted that they were not the subjects; their role was todistribute the surveys. Follow-up calls with some sales managers suggested that the students followedinstructions, and as such, the data should not be suspected.
In addition to replicating this study using improved methodologies, it would also be interesting to investigatethe relationship between satisfaction and degree of control. Additionally, the relationships betweendemographic characteristics such as the age, gender, and race of the sales manager and salespeople onsatisfaction scores would provide useful information about this phenomenon. A multi-cultural or cross-cultural examination of differences between sales managers and salespeople would also seem warranted giventhe growing importance of global salesforce management. Finally, a longitudinal study of differencesbetween sales managers and salespeople may provide interesting insights regarding how satisfaction withsales-related activities changes over time.
REFERENCES
[1] Anglin, Kenneth A., Jeffrey J. Stoltman, and James W. Gentry (1990), “The Congruence of Manager Perceptions of Salesperson Performance and Knowledge-Based Measures of Adaptive Selling, Journal of Personal Selling & Sales Management, (Fall) 81-90.[2] Chonko, Lawrence B., Roy D. Howell, and Danny N. Bellenger, (1986), “Congruence in Sales Force Evaluations: Relation to Sales Force Perceptions of Conflict and Ambiguity,” Journal of Personal Selling & Sales Management, (May), 35-48.[3] Chonko, Lawrence, B., John F. Tanner, and William A. Weeks (1992), “Selling and Sales

Management in Action: Reward Preferences of Salespeople,” Journal of Personal Selling & Sales Management, (Summer), 67-76.[4] Churchill, Gilbert A. Jr. (1979), “A Paradigm for Developing Better Measures for Marketing Constructs,” Journal of Marketing Research,” 16 (November), 64-73.[5] __________, Neil M. Ford, and Orville C. Walker, Jr. (1990), Sales Force Management, Boston, MA: Irwin Publishing.[6] DelVecchio, Susan K. (1995), “Salesperson and Manager Perceptions of Control: Exploring Perceptual Differences,” in Marketing: Foundations for a Changing World, Proceedings of the Annual Meeting of the Southern Marketing Association, Brain T. Engelland and Denise T. Smart (eds.), 128-131.[7] Dion, Paul, Debbie Easterling, and Janet DiLorenzo-Aiss (1994), “Buyer and Seller Personality Similarity: A New Look at an Old Topic,” Marketing: Advances in Theory and Thought, Proceedings of the Annual Meeting of the Southern Marketing Association, Brian T. Engelland and Alan J. Bush (eds.), 396-402.[8] Dubinsky, Alan J., Marvin A. Jolson, Ronald E. Michaels, Masaaki Kotable, and Chae Un Lim (1993), “Perceptions of Motivational Components: Salesmen and Saleswomen Revisited,” Journal of Personal Selling & Sales Management, 13 (Fall), 25-37.[9] Gentry, James W., John C. Mowen, and Lori Tasaki, (1991), “Salesperson Evaluation: A Systematic Structure for Reducing Judgmental Biases,” Journal of Personal Selling & Sales Management, 11 (Spring) 27-38.[10] Gibson, C. Kendrick and John E. Swan (1981-82), “Sex Roles and the Desirability of Job Rewards, Expectations and Aspirations of Male versus Female Salespeople,” Journal of Personal Selling & Sales Management, (Fall/Winter), 39-45.[11] Graen, G.B., F. Dansereau, and T. Minami (1972), “Dysfunctional Leadership Styles,” Organizational Behavior and Human Performance, 7, 216-236.[12] Haley, Debra A. (1991). “Sales Management Students vs. Business Practitioners: Ethical Dilemmas and Perceptual Differences,” Journal of Personal Selling & Sales Management, 11 (Spring), 59-63.[13] Hawes, Jon M., Kenneth E. Mast, and John E. Swan (1989), “Trust Earning Perceptions of Sellers and Buyers,” Journal of Personal Selling & Sales Management, 9 (Spring), 1-8.[14] Journal of Personal Selling & Sales Management (1995), “JPSSM Fifteen-Year Index: Volumes I-XIV,” 15 (Winter ), 87-112.[15] Lagace, Rosemary R. (1991), “An Exploratory Study of Reciprocal Trust Between Sales Mangers and Salespersons,” Journal of Personal Selling & Sales Management, 11 (Spring), 49-58.[16] Marshall, Greg W., John C. Mowen, and Keith J. Fabes (1992), “The Impact of Territory Difficulty and Self Versus Other Ratings on Managerial Evaluations of Sales Personnel,” Journal of Personal Selling & Sales Management, (Fall), 35-48.[17] Morgan, Fred W. (1980-81), “Relationship of Job Performance to Job Perceptions of Salesperson,” Journal of Personal Selling & Sales Management, (Fall/Winter), 11-47.[18] Ramsey, Rosemary, Theresa L. Bilitski, and Jule B. Gassenheimer (1995), “Motivational Differences Between Salesmen and Saleswomen: Actual or Perceptual?” in Developments in Marketing Science, Roger Gomes, ed., Proceedings of the Annual Conference of the Academy of Marketing Science, 133-138.[19] Russ, Frederick A. and Kevin M. McNeilly, (1988), “Has Sex Stereotyping Disappeared? A Study of Perceptions of Women and Men in Sales,” Journal of Personal Selling & Sales Management, (November), 43-54.[20] Schul, Patrick L., Steven Remington, and Robert L. Berl (1990), “Assessing Gender Differences in Relationships Between Supervisory Behaviors and Job-Related Outcomes in the Industrial Sales Force.” Journal of Personal Selling & Sales Management, 10 (Summer), 1-16.[21] Singhapakdi, Anusorn and Scott Vitell (1992), “Marketing Ethics: Sales Professionals Versus

Other Marketing Professionals,” Journal of Personal Selling & Sales Management, (Spring), 27-38.[22] Stanton, William J., Richard H. Buskirk, and Rosann L. Spiro (1995), Management of a Sales Force, ninth edition, Irwin: Chicago.

PROFITABILITY POTENTIAL ALGORITHM FOR SIMPLY-STRUCTURED AIR CARRIERS
Samuel K. Gyapong, Longwood College, Farmville, VA 23909 (804) 395-2460Neil Humphreys, Longwood College, Farmville, VA 23909 (804) 395-2778
Mabel M Qiu, Longwood College, Farmville, VA 23909 (804) 395-2381
ABSTRACT
A mathematical model is derived, based on break-evenanalysis, to determine the potential profitability of smallairlines. The key is how to define the fixed costs and variablecosts in order to use the break-even analysis. Actual data areused to verify the model.
INTRODUCTION
This research aims at developing and testing a mathematicalmodel for determining the profitability potential of simplystructured air carriers. A simply-structured air carrier is anairline with the following characteristics (Carter et al, 1984;Straszheim, 1969): a) It has a simple route structure; i.e. fewerthan ten unduplicated routes. b) It has a simple aircraft fleetcomposition; i.e. a small mix of airplane types of no more thanfive varieties. c) Its fleet composition and route structure donot change much over time. d) It operates only normalscheduled passenger service. It does not operate supplementalservices such as cargo or charter service. These limitations arenecessary to reduce the number of factors and variables thatmay have to be considered when developing the proposedmodel. Most flag air carriers of the developing countries andsome commuter airlines of the US and other industrializednations do have these characteristics. In the 1996 World AirTransport Statistics, nineteen airlines, such as Air Botswana,Air Marshall Islands, Malaysian Airline System, Royal Swazi(Swaziland) and Virgin Atlantic Airways (United Kingdom),can be classified as simply-structured air carriers.
In carrying out their yearly planning functions, themanagement of airlines in general, and simply structures aircarriers in particular, may find a simple but reliable model fordetermining the profitability potential of the air carrier veryuseful. The profitability potential will assist management indetermining whether certain changes in operational plans orcarrier cost elements are necessary to reach the airline’sprofitability objectives. Additionally there is a great need formanagerial tools to assist the developing nations’ airlinemanagement in performing their planning functions. This needhas been expressed repeatedly by aviation experts atconferences and seminars organized by the International AirTransport Association (IATA) to assist member airlines ofdeveloping countries. It is this need that prompted the IATA toset up a Task Force for developing nations’ airlines in late1979 (IATA, 1984). Very little research has been done,however, in this area since then.
This research seeks to serve this need by developing andtesting a mathematical model using data that the developingcountries’ air carriers management compiles and reports
annually to the International Civil Aviation Organization(ICAO) and the IATA.
RESEARCH OBJECTIVES
The objectives of this research are twofold: (a) To use theconcept of simple break-even analysis to develop amathematical model for determining the profitability potentialof a simply structured air carrier based on the cost structure andrevenue base of the carrier. (b) To test the model for itsreliability in predicting air carrier profitability potential usingfinancial and performance data on a number of air carriers withthe listed characteristics, that reported their data of 1989 toICAO and IATA.
LITERATURE REVIEW
The first step in applying a break-even analysis to any systemis to identify the fixed and the variable cost elements of thesystem’s costs. This can best be attempted by first definingclearly what fixed costs and variable costs are. It is generallyaccepted that fixed costs are costs which do not change withthe number of units produced and that variable costs are costswhich change with the number of units produced (Locklin,1972; Wheatcroft, 1956). In aviation, applying thesedefinitions to costs can be very problematic since the units ofservice are provided in batches, so the costs are often identifiedas joint costs.
It is important to mention here, that none of the current systemsof airline financial reporting identifies fixed costs or variablecosts. Taneja (1983) reports that the defunct Civil AeronauticsBoard’s (CAB’s) uniform system of accounts and reportsidentifies airline costs as direct and indirect operating costs.Taneja (1978) indicates that Professor Robert W Simpson ofMassachusetts Institute of Technology (MIT) has developed aslightly different classification to calculate the TFC (TotalFixed Cost) and the TVC (Total Variable Cost) for fiveairlines. Simpson’s system of cost classification also does notidentify fixed costs and variable costs, but the classes of costscan be grouped into fixed and variable costs. According toTaneja (1969), Professor Simpson uses that system ofclassification as a basis for his conceptual framework forprofitability analysis of aircraft types, not for airlines.
William E O’Connor (1982) also refers to the CAB’s UniformSystem of Accounts with the same cost elements and accountnumbers reported by Taneja. He categorizes airline costs ascommon versus separable costs, out-of-pocket costs, constantand fully allocated costs, line costs and terminal costs, but doesnot discuss airline costs in terms of fixed and variable costs.Ballou (1973), however, arbitrarily divides airline costs into

fixed and variable costs. He defines airline variable costs asthose costs that vary with the level of service or volume, andfixed costs as those costs that do not. The working definitionused in this investigation is that given by Alexander Wells(1984). Wells defines variable costs as those costs thatincrease with the level of output or available seat miles that anairline produces, such as flight crew expenses, fuel costs,landing fees and cost of in-flight services such as meals,beverages or entertainment costs are elements of variable cost.Wells defines fixed costs as those costs that in total do not varywith changes in available seat miles, such that generaladministrative expenses, systemwide marketing activities suchas advertising, reservations and sales expenses are examples offixed cost.
The annual financial results reported to ICAO by its membercommercial airlines use the ICAO standard format. The ICAOformat breaks the financial information into Revenues,Expenses and Non-operating expenses. This form of reportingalso does not identify fixed and variable costs. The firstcontribution of this research paper is to identify the fixed andvariable cost elements of the airline expenses reported in theICAO standard format, so that break-even model can beapplied to predict profit potential for a simply structured aircarrier.
MODEL DEVELOPMENT
Conceptual Framework
The proposed mathematical model developed in this paper isbased on air carrier cost structure and revenue base. Theexpenses of producing transportation service are carefullydivided into variable costs and fixed costs. If the fixed cost ofthe operation for a given year is known, if the variable cost perunit of airline passenger service is known and if the revenuederived per unit of passenger service is also known, arelationship can be established to determine how many units ofthe service must be performed and sold to break even. Then bycomparing this break-even service level to the (forecasted)service level, it is possible to determine whether the air carrieris going to be profitable or not. If the units of the serviceexpected to be sold is more than the units required to breakeven, then the air carrier has the potential to realize someprofit. The converse to this is also true; i.e. if the units ofservice to be sold is less than the break even service level, thenthe air carrier has the potential to realize a loss.
It was on this basis that the research was conducted. Theavailable units of service that the air carrier is going to provide,based on its route structure, the stage length of each route, thefrequency of operation on each route and its aircraft capacity,can be determined. The variable cost per unit of service canalso be determined using historical data. The amount ofservice that would be sold should be estimated by a forecastperiod and the fixed costs estimated for a period of one year.Then a break-even equation can be established and solved forbreak-even service level.
Model Assumptions
The analysis used to derive the conceptual model is based onthe following assumptions: (1) The airline’s fleet compositionwill not change during the planning year. Any change indemand will be accommodated through changes in load factor.(2) Variable costs, such as the price of aviation fuel, will notchange much during the planning year. (3) The carrier will notretire or invest in fixed assets during the planning year. (4)Route structure will remain the same under existing bilateralagreements. (5) There is no price elasticity of demand in themarkets served by the carrier. The fifth assumption is realisticas far as the developing countries are concerned. Air travelersin these countries travel as a necessity and cost of the air faredoes not affect air travel demand sufficiently.
Determination of Variable Cost Per Seat Kilometer
The variable cost per seat kilometer is determined by dividingTotal Variable Cost by available seat kilometers in anyplanning year. Available seat kilometer figures are publishedfor each airline by IATA in its annual World Air TransportStatistics. This value can be estimated as follow:For each route operated, Available Seat Kilometers
(ASKms) = 2W x f x LS x N (1)
Kane and Vose (1979) define stage length and average lengthof haul in their book Air Transportation. Stage length involvesnon-stop flights and average length of haul results when thereare stops on a route. In this research paper each route is takenas a non-stop flight. A route is completed when a flight stops.If the number of routes flown is n, then n ASKms = � 2 Wi fi LSi Ni (2) i =1
Variable cost per seat kilometer (VC/SKm) is equal to the totalvariable cost (TVC) for the year divided by the available seatkilometers. i.e.
VC/SKm = TVC / ASKms (3)
Determination of Revenue Per Passenger Kilometer
To determine the revenue per passenger kilometer (R/PKm) thetotal revenue earned per year is divided by the number ofpassenger kilometers performed. The number of passengerkilometers performed by each carrier is reported annually byIATA in its Statistical Report. This value can be determinedby the following formula:
n f TPKms = � [ LS �(Xj + Yj )] (4)
i=1 j=1Then revenue per passenger kilometer is obtained by dividingtotal revenue by the total passenger kilometers flown, i.e.
R / PKm = R / TPKms (5)
Passenger Load Factor

Passenger load factor (PLF) is defined as the ratio of revenuepassenger kilometers generated divided by the available seatkilometers provided (Kane et al. 1979; Wood et al. 1989;Coyle et al. 1990).___ ____PLF = Pkms / ASKms i.e. ASKms = Pkms / PLF (6)
Profitability Model
For a carrier to break even, revenues must equal the sum offixed costs and the total variable costs; i.e.
Rev. = TFC + TVC Revenue = TPKm x (R/TPKms) . Since TVC = (VC/SKm) x ASKms
Pkm x (R/PKm) = TFC + (VC/SKm) x ASKm (7)
Substituting equation (6) in equation (7) ___Pkms x (R/PKm) = TFC + (VC/SKm) x (Pkms / PLF)By transposition,Pkms x [(R / PKm) - 1 (VC / Skm)] = TFC PLF
Since the revenues received from the passenger kilometersgenerated just covers the costs, the Pkms in this equationresults in a break even. Therefore, it can be changed to breakeven passenger kilometers, (BEPKms).
TFCTherefore, BEPKms = (8) [R/PKm - 1 (VC/SKm)] PLF
This model can be used to determine how many passengerkilometers the airline must perform before it can hope to breakeven. If the actual or forecast passenger kilometers exceed theBEPKms then the airline has the potential to make profit. Ifthe passenger kilometers fall short of the BEPKms it is anindication that the airline may operate at a loss, unless certainmeasures are taken.
TEST RESULTS AND MODEL VALIDATION
To test the model’s ability to predict profitability potential, anumber of air carriers that fit the subject description, and whichreported their 1989 performance statistics to IATA and theirfinancial performance to ICAO, were selected. The airlinechosen are Ethiopian Airlines, Air Malawi, Air Zaire, Aeroperuand Austrian Airline.
The Break Even Passenger Kilometers for each carrier werecalculated. The Performed Passenger Kilometers and thefinancial results of the carriers reported in the 1989 Financialstatistics are collected. All three values are compiled. The testis to validate the proposed conceptual model that an air carrierwhose passenger kilometers performance exceed its break-evenpassenger kilometers will be profitable and that an air carrierwhose performance falls short of the break even passengerkilometers will operate at a loss.
The results of the model test support the hypothesis. Three ofthe air carriers studied, Ethiopian Airlines, Aeroperu andAustrian AUA, which performed above their break-evenperformance level, realized profit. The other two, Air Malawiand Air Zaire, which performed below break-even, on the otherhand, realized losses for 1989. Furthermore, it was clearlydetermnied that the higher the performance is above the break-even level, the higher the profit realized. For example,Ethiopian Airlines and Austrian Airlines, which performedmuch higher above their break-even, realized much higherprofits than Aeroperu whose performance was only slightlyhigher than break-even.
DISCUSSION AND FURTHER RESEARCH
The model testing results proved that the Break-even PassengerKilometers model is good for predicting the profitabilitypotential of any simply structured air carrier. In anunpublished dissertation by one of the authors, the model wassuccessfully tested for four airlines: Ethiopian Airlines, AirMalawi, Zambia Airways and Air Zimbabwe. Its reliability,however, depends on accurate determination of the modelvariables.
Even though the model was developed and tested for simplystructured air carriers, it is believed that it can be used bybigger airlines to evaluate segments of their operations, such asroute by route, region by region, foreign and domestic or anyidentifiable profit centers, if the carrier’s fixed costs can beallocated equitably. This model may help air carriermanagement to identify which particular segment of theirsystem may be in trouble so that efforts could be made toimprove performance on that segment or plans made toabandon that segment if that is the only alternative and sizereduction is part of the strategy of the carrier.
A spreadsheet can be set up to do all the computations so thatshould any cost elements change, the dependent values can bedetermined by merely changing those cost elements. For an aircarrier with a complex structure which wishes to use the modelto evaluate various segments of its service, the spreadsheet willreduce the workload considerably.
The authors have received the World Air Transport Statisticsand the Civil Aviation Statistics of the World for 1994 and1995. We are in the process of acquiring the Digest ofStatistics Financial Data: Commercial Air Carriers for 1994and 1995. Once all the information is available, we will testthe model on a multiple period basis, i.e. use previous year’sfinancial performance data to predict current year’s profitpotential of a particular air carrier.
Tables, references, and other information will be madeavailable upon request.

TRACK: Production and Operations Management
"" OOnn tthhee UUssee ooff FFii ll ll --RRaattee CCrr ii tteerr iioonn ttoo DDeetteerr mmiinnee tthhee OOpptt iimmaall OOrr ddeerr --PPooiinntt--OOrr ddeerr --QQuuaanntt ii ttyy II nnvveennttoorr yyCCoonntt rr ooll PPooll iiccyy:: AA TThheeoorr eett iiccaall PPeerr ssppeecctt iivvee aanndd AA CCaassee SSttuuddyy""
AAmmyy ZZ.. ZZeenngg,, UUnniivveerrssii ttyy ooff NNoorrtthh CCaarrooll iinnaa -- WWii llmmiinnggttoonn
"" AA SSiimmuullaatt iioonn MM ooddeell ttoo II mmpprr oovvee WWaarr eehhoouussee PPrr oodduucctt iivvii ttyy""PPiinngg WWaanngg,, JJaammeess MMaaddiissoonn UUnniivveerrssii ttyyMMiicchhaaeell EE.. BBuussiinngg,, JJaammeess MMaaddiissoonn UUnniivveerrssii ttyy
"" SSeennssii tt iivvii ttyy AAnnaallyyssiiss ooff aa SSttoocchhaasstt iicc II nnvveennttoorr yy MM ooddeell""KKaall NNaammiitt,, WWiinnssttoonn--SSaalleemm SSttaattee UUnniivveerrssii ttyyFFiiddeell iiss MM.. IIkkeemm,, VVii rrggiinniiaa SSttaattee UUnniivveerrssii ttyyJJiimm CChheenn,, NNoorrffoollkk SSttaattee UUnniivveerrssii ttyy
"" SSuuppppllyy CChhaaiinn MM aannaaggeemmeenntt aanndd II ttss SSeerr vviiccee MM eeaassuurr eess iinn tthhee FFoooodd II nndduusstt rr yy""Xin X. He, South Carolina State University
"" DDii ff ffeerr eenncceess iinn QQuuaall ii ttyy MM aannaaggeemmeenntt AAssppeeccttss AAmmoonngg UUsseerr ss aanndd NNoonn--UUsseerr ss ooff FFlleexxiibbllee MM aannuuffaaccttuurr iinnggSSyysstteemmss""
Mohamed A. Youssef, Norfolk State UniversityJJoonn CC.. SSttuuaarrtt,, NNoorrffoollkk SSttaattee UUnniivveerrssii ttyyBBaassssaamm AAll --AAhhmmaaddyy,, UUnniivveerrssii ttyy ooff EEiinn SShhaammss
"" EEff ff iicciieennccyy vvss.. FFlleexxiibbii ll ii ttyy:: AA CCoommppaarr iissoonn ooff GGrr oouupp TTeecchhnnoollooggyy aanndd VVii rr ttuuaall CCeell lluullaarr MM aannuuffaaccttuurr iinnggSSyysstteemmss""
VVii jjaayy RR.. KKaannnnaann,, JJaammeess MMaaddiissoonn UUnniivveerrssii ttyy
"" AA HHeeuurr iisstt iicc MM eetthhoodd BBaasseedd oonn BBoouunnddeedd RRaannddoomm SSaammppll iinngg ffoorr tthhee RReesscchheedduull iinngg ooff OOppeerr aatt iioonnss iinn aa JJoobbSShhoopp""
AAhhmmeett SS.. OOzzkkuull ,, CClleemmssoonn UUnniivveerrssii ttyy
1
ON THE USE OF FILL-RATE CRITERION TO DETERMINE THE OPTIMALORDER-POINT-ORDER-QUANTITY INVENTORY CONTROL POLICY:
A THEORETICAL PERSPECTIVE AND A CASE STUDY
Amy Z. Zeng, University of North Carolina at Wilmington, Wilmington, NC 28403
ABSTRACT
The efficiency of an inventory policy can be measured or controlled by service levels. While there are anumber of service measures available for use, this paper focuses on the most popular measure, namely fillrate. We investigate the theoretical effects of this measure on the optimal order point and order quantity ina context of stationary stochastic demand during lead time. Particular attention is given to the tractabilityand complexity of the solution procedure. Finally, we turn to a case study in Nabisco Food Group toexamine how industrial practitioners utilize fill rate to determine the inventory policy.
INTRODCUTION
The major functions of inventory are twofold: (1) to support and provide necessary physical inputs formanufacturing; and (2) to protect companies against uncertainties that may arise from such cases asdiscrepancy between demand and production, machine deterioration, and human errors. Inventory is alsoimportant for maintaining good customer service, and since service quality is the major competitive factorfor companies standing in today’s global market, it has inevitably become the driving force fordetermining the efficient inventory control policy, especially in the situations where customer demandand replenishment lead time are uncertain.
While there exist a number of service level measures in inventory control theory, (see Zeng, 1996, for acomprehensive review), this paper examines the consequences of using fill rate, which is defined as thepercentage of demand satisfied directly from the shelves during replenishment lead time. Apart from itspopularity in both academic research and industrial practice, the mathematical simplicity and tractabilityof this service measure in cooperation with various distributions of demand and lead time are alsonoticeable. In particular, we investigate the role of fill rate in determining the optimal order-point-orderquantity policy. This policy is operated as follows: whenever the inventory position (on hand plus onorder) drops at or below the order point during continuous review, a fixed amount of quantity isimmediately placed. This controlling policy has been proven efficient and simple for implementation byboth academicians and practitioners, and has also served as a building block for studying morecomplicated inventory strategies. Determining the optimal values of the two variables, order point andorder quantity, has been the major concern.
This paper will discuss the effects of using fill rate on the determination of the optimal inventory controlpolicy from both theoretical and practical aspects. As seen in the existing literature, service-levelinventory decisions are made in two ways. An inventory manager may rely on a specified level of serviceas a constraint to determine economic order point and order quantity, or alternatively, he/she can considermaximizing a service level as an objective when a limited operating budget is imposed. This paper willfollow these two decision alternatives with the main objectives as follows: (1) to examine mathematicallythe tractability and degree of difficulty of the solution procedures for a few representative distributions oflead-time demand; (2) to compare the approximated solutions suggested in the literature; and (3) toinvestigate how industrial practitioners utilize fill rate for their organizations by means of a case study inNabisco Food Group. The rest of the paper following a list of nation used herein is organized as follows:

2
Section 2 studies the consequences of using the fill rate as a constraint; Section 3 compares the results iffill rate is used as a management objective, specifically, the duality of the two models is examined;Section 4 presents our case study; and finally, conclusions are summarized in Section 5.Notation:
A: ordering cost, in $/order;D: demand per unit time; in units/year;k: safety factor, for normal distribution;K: a specified operating budget;Q: order quantity, a continuous variable;r: holding cost, in $/unit/year;s: order point, a continuous variable;v: unit product value;f(.): probability density function;F(.): distribution function;Gu(k): unit normal loss function;SL: service level, measured by fill rate, in percentage;1-�: a specified service level;�: mean lead-time demand (LTD);�: standard deviation of LTD.
Under continuous (s, Q) system, a number of authors have provided the mathematical expression of fillrate (e.g. Silver and Peterson, 1985, or Tersine, 1994) as
SLb s
Q� �1
( ), (1)
where b s( ) is the expected number of shortages during replenishment lead time, and is calculated by
b s x s f x dxs
( ) ( ) ( )� ��� , (2)
and f(x) is the probability density function of demand during lead time.
USING FILL RATE AS A CONSTRAINT
According to its formulation in Eq. (1), the fill rate is determined by both policy variables. When adesired service level is considered as a constraint, we follow the conventional cost-minimization model tostudy the effect of a desired service level. The model is given as follows:
Minimize TC = AD/Q + vr[Q/2+s-�], (3)subject to: b s Q( ) / � � , (4)
where the first term in Eq. (3) represents the ordering cost per year and the second is the total holding costper year. Das (1975) examined the same model and his research focuses on the properties of resultant (s*,Q*). Yano (1985) considered a similar problem but her model is more complicated than Eq. (3). Silverand Wilson (1975) gave one expression of the solutions as

3
Q QF s
F s
b s Q
w��
� �
�
�
��
��
11 2
( )( )
( )
�
�
(5)
Alternatively, the optimal solutions can be written as
Q R s R s Q
b s Q
w�
�
���
��
( ) ( ) ,
( ) ,
2 2
� (6)
where
R sb s
F s( )
( )
( ),�
�1 (7)
is the “mean residual life function” as used in reliability theory and Q AD vrw � 2 is Wilson’s formula
for order quantity in deterministic case.
A number of probability distributions are assumed for demand during lead time (Interested readers canrefer to Zeng, 1996, for a comprehensive review). In this paper, we concentrate on the followingcontinuous distributions: the uniform, the exponential, the normal, the Weibull, and the gamma. Theexpressions of R(s) for these distributions are derived and reported in Table 1. Their example plots of R(s)are depicted in Figure 1 and Figure 2. Specifically, Figure 1 illustrates the case when the fourdistributions have the same mean (� = 500) and also gives a plot of R(k) for the unit normal. Figure 2demonstrates the situation where the four distributions share the same standard deviation (� = 100). It isseen clearly that except that of Weibull, the R(s) of all the other distributions are monotonically non-increasing functions. Moreover, the values of R(s) are not small enough to be ignored in Eq. (6)regardless of the distribution. The presence of R(s) in the solutions would complicate the computation,and either a search technique or an iterative method needs to be employed. Since the uniform, theexponential, and the normal possess some special characteristics, we shall take a closer look at theirsolution procedures in the next subsections.
Uniform LTD
The uniform may be the simplest distribution of LTD; however, its optimal solutions for (s, Q) are notsimple at all. Based on Table 1, Eq. (6) for the uniform can be written as
Qa s
a s Qw��
� 22
2 2
24( ) , (8)
( )
( )
a s
a aQ2
2
2 12
�
�� � . (9)
If substituting Q in Eq. (9) to Eq. (8) and solving for s, we notice that this is actually equivalent to solvinga fourth-order polynomial function of s:
a s
a a
Q
a sw2
2 1
2
2
2
205 05
�
��
��
�� �
�
��
��
�( ). . . (10)

4
Hence, an efficient search method must be employed. However, careful inspection indicates that if (a2 -s)/2 is far less than Qw, then Eq. (10) can be simplified to
Qa s
Qw��
2
2. (11)
The explicit approximate optimal (s, Q) can then be found as
� �
� �
s a a a a a a a Q
Q a a a a a a Q Q
w
w w
*
*
. ( ) ( ) ( )
. ( ) . ( ) ( )
� � � � � �
� � � �
�
��
��
2 2 1 2 12
2 1
2 1 2 12
2 1
05 2 2
0 25 05 2 2
� � �
� � �
. (12)
It is seen that there is no need for iterative or search methods for obtaining the approximate solutions forthe uniform LTD.
Exponential LTD
In Table 1, it is evident that the function, R(s), for the exponential LTD is simply a constant, 1/�. Thisconstancy of R(s) greatly simplifies the optimal solutions, which are
Q Qw* ( ) ,� 1 1 2 2� � (13)
s Q* ( ) ln( )� � 1 � �� . (14)
Normal LTD
Normally-distributed LTD is a commonly-used assumption in both research and practice, and hence hasreceived wide study. With the associated functions for normal, such as its density, cdf, and unit lossfunction, being well-tabulated for use, the solution procedure for the normal has become much lesscumbersome. Nevertheless, the pursuit for easier and quicker optimal solutions has attracted a number ofresearchers. We shall discuss two major approximations, of which others are just special cases.
The first approximation is suggested by Brown (1967, p. 209-219). He expresses the order quantity, Q, ina dimensionless form, Q/�, as
QT k T k Qw
��� ( ) ( ) ( ) ,2 2 (15)
where
T kR k G k
F ku( )
( ) ( )( )
� ��� 1
. (16)
He then suggests using the limiting value of T(k) instead of the simultaneous determination of Q and k ifthe desired service level is high, such as greater than 90%. The limiting T(k) is obtained such that ksatisfies the following equation
1 - F(k) = 2(1 - P2). (17)

5
Thus, for a given service level, T(k) can be found easily. We follow Brown's suggestions and calculateT(k) for service levels from 90% to 99% in Table 2. For example, if the desired service level is 90%, theapproximate Q* would be
QQw
��� 05585 055852 2. . ( ) , (18)
for an input value of (Qw/�)2. It can be further observed that the value of T(k) decreases as the servicelevel increases and in turn, the optimal lot size, Q*, also decreases. This fact has been proven to be true byDas (1975). After attaining Qw/�, the optimal k is determined such that it satisfies
Gu(k) = (1 - P2)(Q/�). (19)
The second approximation is provided by Schroeder (1974). By using an exponential to approximate thenormal tail
f kab
e bk( ) � �
�, and 1� � �F k ae bk( ) , (20)
b ka
be bk( ) � ��
, (21)
where a and b are constants chosen to fit the distribution curve. Schroeder (1974) has given that a = 2.88,b = 2.49. The optimal (s, Q) can now be written
� �Q
b b a Q�
� �� ( ) ln ( )(1 , (22)
� �k b b a Q� �( ) ln ( )( )1 � � . (23)
It is worth mentioning that Schroeder's approximation is appropriate for only high levels of desiredservice (such as 1 < k < 4).
To compare the performance of these two approximations, we first change the total cost function to adimensionless format:
TC
vrQ k
Q
Qw
��
�
�� 05
05 2
. ( / ). ( / )
/. (24)
For ease and clarity of comparison, we summarize the ideas of the two approximations in Table 3. Then,we use the input values of (Qw/�)2 used in Brown (1967, p. 219) to test the effect of the twoapproximations on the total cost. The calculations and the results for two service levels (P2 = 90% and P2
= 99%) are reported in Table 4. Note that the exact dimensionless total cost is also obtained for thepurpose of comparison. It can be observed from Table 4 that for both service levels, Brown'sapproximation performs better than does Schroeder's, but both are excellent approximations for extremelyhigh service level, such as 99%, in terms of the accuracy of the minimum total cost.
USING FILL RATE AS AN OBJECTIVE

6
The Model and the Solutions
When a limited budget for ordering and holding inventory is imposed, an alternative managementobjective would be to maximize the potential service level. The associated mathematical model isformulated as
Maximize SL = 1� b s Q( ) /subject to: AD/Q + vr(Q/2 + s - �) = K.
Schroeder (1974) also studied a similar model. This model is equivalent to
Minimize SL b s Qc � ( ) /subject to: AD/Q + vr(Q/2 + s - �) = K. (25)
The decision variables are s and Q for a given level of budget, K. Solving this model by the Lagrangianmethod gives
Q R s R s Qw� ( ) ( ) ,2 2 (26)
s K vr Q Q Qw� � � 05 2. ( ). (27)
One sees again the appearance of the mean residual life function, R(s), in the solutions. For nonnegativesafety stock, i.e., for s - � > 0, it implies that
� �K vr Q Q Qw� 05 2. . (28)
Under the current model and a general probability density function of LTD, the optimal values of s and Qsatisfy two nonlinear equations simultaneously, and an iterative method must be used. However, aremarkably simple and closed-form expression of Q* can be obtained if the function R(s) is independentof s, and, in turn, the optimal service level can be expressed as an explicit function of the budget. Basedon the study in the preceding section, we notice that the exponential LTD offers a constant R(s). Thus, weshall follow the hints provided by the exponential distribution to investigate the effect of budget on theservice level.
A Special Class of Lead-time Demand Distributions
Two Special Cases
Recall that for an exponential distribution with parameter �, R(s) = 1/�. The optimal s and Q can besimplified to
� �Q Q
s K vr Q Q Q
w
w
*
* * *
/
.
�
� �
�
��
��
1 1
05
2 2
2
� �
� (29)
The resulting optimal service level for a given budget K can be obtained as
SL Kb s
QE*
*
*( )( )
� �1

7
= � �� �� �11
05 2� � � �
�eQ
K vr Q Q Qw** *exp . / . (30)
Using Schroeder's approximation, which approximates the normal LTD tail by an exponential, we haveobserved previously that its R(k) also reduces to a constant, �/b. Hence, the Q* and k* can be written as
� �� �Q b b Q
k K vr Q Q Q
w
w
*
* * *
/ ( / ) ;
( / ) / . / ,
�
� �
�
��
��
� �
�
2 2
21 05 (31)
The resulting optimal service level for a given K is
SL Ka
bQeN
bk**
( )*
� � �1�
= � �� �� �1 05 2� � � a
bQb K vr Q Q Qw
��
** *exp ( / ) / . / . (32)
Therefore, one can use Equations (31) and (32) to compute the optimal fill rate for exponential andnormal LTDs. Furthermore, it is seen that the optimal service level is a negative exponential function withrespect to the budget, K, implying that as the budget increases, the optimal service level increases.
A Class of Distributions with Constant R(s)
The previous two special cases imply that when the distribution of LTD can be described or approximatedby a form of exponential, R(s) usually reduces to a constant, which greatly simplifies the analysis of therelationship between service level and budget. Suppose that the distribution of the LTD can be formulatedas a truncated exponential,
� �f x x( ) exp ,� �� �2 1 and x > c > 0,
where �1 and �2 are positive parameters depending on the range of x, such that f(x) is a proper probabilitydensity. Then it is easy to verify that
F s s
b s s
R s
( ) ( / )exp( );
/ ;
( ) ( / )exp( );
( ) / .
� �
�
� �
�
�
�
��
�
��
� � �
� � �
� � �
�
2 1 1
2 12
2 12
1
11
(33)
Hence,
� �Q Q
s K vr Q Q Q
w
w
*
* * *
/ ( / ) ;
/ . / .
�
� �
�
��
��
1 1
05
1 12 2
2
� �
� (34)
Similarly, the optimal service level is obtained as
SL KQ
K
vr
Q
QQw( ) exp .* *
*� � � � �
��
�
��
���
���
���
��
���
��1 052
12 1
2
12
2�
��
�
�, (35)

8
Therefore, the level of service for any given budget can be computed from Eq. (35) and no computationof the optimal s is needed.
The Duality of the Service- and Budget-Constrained Models
The optimal solutions given by the service-constrained and the budget-constrained models provideremarkable similarity, particularly, the optimal order quantities remain identical. Is there a mirror effectbehind these two models? Can one model be used to infer the other? We begin the investigation byconsidering the exponential and normal LTDs, since they supply explicit solutions. We first summarizethe formulas of the optimal reorder point and order quantity for the two distributions in Table 5. For thesake of clarity, we use subscript S to indicate results based on the service-constrained model, andsubscript B for the budget-constrained model. In equating sS = sB for the exponential, we find thefollowing duality equation for K and �:
� �� �K vr Q Q Q Qw� � �05 12. / ( / ) ln( )* * *� � �� . (36)
Similarly, for the normal,
� �K vr Q Q Q bb Q
aw� ��
��
�
��
���
���
05 2. / ( / ) ln* **
��
�. (37)
A Numerical Illustration for Exponential LTD
For the purpose of illustration, we use the following input parameters: A = 100; D = 10,000; v = 10; r =0.2; � = 0.001. Some immediate results can be found: Qw = 1000 and QS = QB = 2414, based on either Eq.(13) or Eq. (29).
We plot Eq. (36) as seen in Figure 3. Then we compute two cases: (1) � = 0.05: by using Eq. (14), sS* =
2114.45, and then, TC(�) = 5057.15; (2) K = 4000: by Eq. (29), sB* = 1585.87, then, SL(K) = 0.085.
These two points are also illustrated on the graph of Figure 3. Substituting � = 0.05 in the dualityequation (36), we notice that the resulting TC(�) = 5057.14 is equal to the result obtained by first solvingfor s* and Q* and then computing the minimum total cost. Similarly, substituting K = 4000 in Eq. (36),we arrive at SL(K) = 0.085, which is equal to what we obtained before. Therefore, these two casesindicate that (1) the duality equation actually implies the relationship of service levels and budget, bywhich one can ignore two steps in computation: calculating s* and then the objective function, TC(�) orSL(K); and (2) When a given � and the resulting TC(�) are known, if a budget K is less than TC(�) onecan immediately conclude that the resulting service level for this budget will be worse than (1 - �) . Forinstance, in the numerical example, K = 4000 < TC(�) = 5057.15, then SL(K) = 0.085 > � = 0.05.
A Numerical Illustration for Normal LTD
A similar analysis is conducted for normal LTD. The input parameters are A = 100; D = 10,000; v = 10; r
= 0.2, with � = 1000 and � = 250. The immediate results include Qw = 1000 and QS* = QB
* = 1105. Agraph for the duality equation is plotted in Figure 4. Two points on the graph are also obtained by twoways of computation as described for the exponential case. One point is � = 0.10, the resulting TC(�) =2203, which is the same for both routes of computation. The other point is when K = 2500, the optimal

9
service SL(K) = 0.0228. Thus, the same conclusions as those in exponential case can be drawn for thenormal LTD.
A CASE STUDY AT NABISCO FOOD GROUP
The preceding sections discuss the theoretical effects of using fill rate as a service criterion to determinethe optimal order point and order quantity. The complexity and tractability of the solution procedures arestudied. But how do industrial practitioners utilize this measure? We attempt to provide a practicalperspective by using a case study in Nabisco in this section.
Nabisco is a major food manufacturer as well as a distributor. It has 12 distribution centers, 13 plants andco-packers, and about 2,500 products with $2.6 billion annual sales. The success of this company lies inits forecasting system, distribution resource planning, and inventory management. Their productionsystem follows a multi-echelon network and the entire distribution is operated by a push system. Aforecasting and inventory management group located in Parsippany, New Jersey serves as a control centerthat makes centralized decisions and planning.
The major customer service measure is case fill, which is evaluated by cases of finished products shippedas a percentage of cases ordered. This service measure is comparable to fill rate studied in this paper. Theservice objective, along with the other three business concerns: inventory investment, inventory turns, andobsolescence of products, forms the quadruple crown that links the company’s every activities in itssupply chain. The company is striving to achieve the highest possible case fill rate for their A-products byefficient demand forecast and determination of safety stock. Table 6 depicts the safety stock calculationwithin their distribution resource planning system. The four blocks of computational procedure integratesthe features of mathematical modeling and empirical adjustment. The procedure has been utilized for overfive years and has been proven successful. In this paper, the details of decision rule to select the safetyfactor, k (block 1) and the computation of safety stock (block 3) are described.
Decision Rule to Select the Safety Factor, k
Before the procedure is introduced, we compare the key idea adopted by Nabisco with that found intheory in Table 7. It is seen that the practice in Nabisco has some resemblance to the theory, for example,both assume that the demand follows a normal distribution. But in Nabisco, only the variable, k, needs tobe determined. By doing so, the solution procedure is greatly simplified and is illustrated as follows: inorder to incorporate the computation of k easily into their computer system, for every input LT/ROQ, theplausible values of k are approximated by power functions as shown in Table 8 and Figure 5. To show theuse of these curves, let us look at an example: assume LT/ROQ = 1.53 and target service level is 99%,then, by the power functionK LT ROQ0 990
01164 0116419321 19321 153.. .. ( ) . ( . )� � = 2.03, and this K value will be
used to calculate the safety stock.
Computation of Safety Stock
In theory, once the service factor is chosen the safety stock (SS) is computed as
SS G ku� � ( ) , in unitsIn Nabisco,
SS k LT LT MDF LT t� � �2 2* ( * ) , in weeks of coverage
where�F
2 = the variance of the actual demand around the average demand,

10
�LT2 = the variance of the replenishment lead time,
MDt = the smoothed bias (mean error) of demand forecast error,
and these parameters are outputs from their forecast system. Finally, the amount of safety stock should beadjusted based on the following limits on the value of safety stock:
SSmin (a week of supply) < SS < SSmax (4 weeks of supply)
CONCLUDING REMARKS
Because of unpredictable fluctuations of demand and uncertainty of lead time, decisions regardinginventory control must be made on how to order economically so that a certain level of service can beachieved. Therefore, the measure of service plays an important role in decision making. This paperfocuses on fill rate as the primary measure to investigate the resultant optimal order-point-order-quantityinventory policy. In particular, a theoretical aspect regarding the complexity of solution procedure fordifferent distributions of lead-time demand is provided, and a practical aspect pertinent to how inventorymanagers in Nabisco Food Group utilize the service measure is also furnished.
The mechanism of the fill rate is studied by considering this measure as a constraint and an objective,respectively. We notice that the simplicity of solutions to the optimal policy variables heavily depend onthe mean residual life function, R(s). It is this function that complicates the solution procedure. However,the exponential LTD possesses constant R(s) that makes the analysis straightforward. Following thisattractive characteristic of the exponential, we notice that if any LTD distribution can be approximated byan exponential, a great deal of computational effort is eliminated and many explicit results can beobtained. The normal distribution serves as one of such examples.
It is interesting to observe that the duality of service- and budget-constrained models exists. We haveidentified the duality equations for both exponential and normal LTDs. These can be used to compute theminimum total cost for a given service, or the optimal service level for a given budget, withoutcalculating both the optimal reorder point, s*, and the optimal order quantity, Q* (In fact, only Q* need tobe obtained). This duality equation not only reduces the computational effort, but also serves as aguideline for selecting a proper service level or allocating a sufficient budget.
The Nabisco case suggests that there is a certain gap between theoretical and empirical applications, but agreat deal of resemblance also exists. The consensus is that a complicated solution procedure is notsuitable and attractive for industrial managers to integrate into their decision process, however, anefficient decision should stem from scientific modeling and analysis.
REFERENCES
[1] Brown, R. G. (1967), Decision Rules for Inventory Management, Holt, Rinehart and Wiston, Inc.[2] Das, C. (1975), “Sensitivity of the (Q, r) Inventory Model to Penalty Cost Parameter,” Naval Research Logistics Quarterly, 22(1), pp. 175-179.[3] Schroeder, R. G. (1974), “Managerial Inventory Formulations with Stockout Objectives and Fiscal Constraints,” Naval Research Logistics Quarterly, 21, pp. 375-388.[4] Silver, E. A. and Wilson, T. G. (1975), “Cost Penalties of Simplifies Procedures for Selecting

11
Reorder Points and Order Quantities,” American Production and Inventory Control Society Conference Proceedings, pp. 219-233.[5] Silver, E. A. and Peterson, R. (1985), Decision Systems for Invetnory management and Production Planning, 2nd edition, John Wiley & Sons, New York.[6] Tersine, R. J. (1994), Principles of Inventory and Materials Management, 4th edition, Prentice Hall, Englewood Cliffs, New Jersey.[7] Yano, C. A. (1985), “New Algorithm for (Q, r) Systems with Complete Backordering Using a Fill- Rate Criterion,” Naval Research Logistics Quarterly, 32, pp. 675-688.[8] Zeng, A. Z., (1996), Service Considerations in Replenishment Strategies, Ph.D. dissertation, Department of Management Science and Information Systems, The Pennsylvania State University.
ACKNOWLEDGEMENT
This research was support by Charles L. Cahill Awards for Faculty Research and Development from theUniversity of North Carolina at Wilmington, Wilmington, NC.

A SIMULATION MODEL TO IMPROVE WAREHOUSE PRODUCTIVITY
Ping Wang, James Madison University, Harrisonburg, VA 22807 (540) 568-3055Michael E. Busing, James Madison University, Harrisonburg, VA 22807 (540) 568-3058
ABSTRACT
Customer service has frequently been identified in the literature as an important source for competitiveadvantage in today’s business environment. One definition of good customer service involves makingcertain that orders are transported from warehouse to customer location when needed – neither early norlate. In light of this, one can argue that value-adding activities at the warehouse level entail only thoseitems that are necessary in delivering perfect quality products to the right place at the right time.
A manufacturing facility that is owned by a state agency exhibits significant inefficiency in its warehouseoperation. This inefficiency stems from its current procedure for shipping completed orders to customerdestinations. Currently, items are retrieved from aisles and moved to a centralized loading dock in noparticular sequence. Orders are then handled again for sorting based on final destination. Finally, ordersare loaded onto a delivery truck based on the desired unloading sequence and final destination. The resultof this inefficiency is average to poor customer service in terms of long and variable delivery lead times.
In this paper a simulation model is utilized to reduce non-value added material handling operations and tostreamline the operations for item retrieval, sorting and truck loading at the above described warehousefacility. The results of the simulation provide information and recommendations for a more highlycompetitive warehouse operation.
INTRODUCTION
In a recent paper, seven items were identified as trends for highly effective warehouses (Olson, 1996). Ingeneral, highly effective warehouses are those that are able to support a company’s desire to competebased on superb customer service. Customer service here is defined as the ability to accept specialcustomer requirements while consistently shipping the right order to the right place at the right time withshort and consistent order lead times. The potential to turn customer service into competitive advantageis dependent upon the efficiency of warehouse operations relative to that of competitors.
A warehouse facility owned by a state agency stores an inventory of furniture, office supplies, andbuilding materials. Typical operations include retrieval of specific items contained in a customer orderfrom warehouse aisles followed by movement to the loading dock. Periodically, items from the loadingdock are sorted based on their destinations and their sequence in the unloading process. Items are thenloaded onto an appropriate truck. In an ideal situation, an item that is to be unloaded last needs to beretrieved first and placed in the back of the truck directly in a last-in first-out sequence (LIFO). Currentwarehouse operation, however, involves inefficiencies such as picking and placing items on the loadingdock in no particular order, then handling items again for sorting based on their final destination andunloading sequence.
In this facility, warehouse personnel are grouped based on item type. For example, an employee incharge of furniture retrieves furniture orders from the warehouse aisles and brings the items to the loadingdock. The loading dock is separated into three regions or zones -- furniture, office supplies, and buildingmaterials. At the loading dock area, additional personnel are required to sort orders based on theirdestinations and unloading sequence. Trucks are then loaded in the pre-determined LIFO sequence.

Current warehouse operation exhibits waste in the form of non-value added handling time. Also theoperation is often quite chaotic as not all orders on the loading dock are destined for the same truck. As aresult, warehouse productivity is quite low and customers consistently complain about delivery leadtimes, damaged goods, and lost or misplaced orders.
In this paper, a simulation study is conducted to improve the warehouse productivity. The study beginswith estimating the distributions for quantity and timing of incoming orders. Orders will be grouped intowaves to describe all orders during a particular time period.
The results of this simulation study will provide decision-makers with better alternatives to improveproductivity and customer satisfaction level.
A detailed description of the warehouse facility and its current operations is given in the next section.That section is followed by a detailed description of the simulation model. Finally, generalizations andrecommendations to shop decision-makers are provided.
WAREHOUSE OPERATIONS
The following is a detailed description of the order fulfillment process at the warehouse.
1. Telephone operators, letter or fax openers, and email readers receive orders through telephone, USmail, fax or email. Each order contains customer specified items, prices, quantities, and check, moneyorder or credit card information. The time between customer order arrivals for items is assumed to beexponentially distributed with the mean of 20 minutes.
2. An order will be processed if all required information is clear. Otherwise, the order is logged to anorder verifier to call or write to the customer to clarify the situation. The order will either return to thesystem to be filled by a warehouse clerk or will be cancelled.
3. Warehouse clerks take one order at a time, walk through all the aisles to locate and pick up items in theorder, load items on a hand truck and move them to a central packaging area where each order ispackaged, labeled and sorted based on its customer destination.
4. The time for a clerk to travel to the warehouse, pick up items and bring them back to the loading dockis estimated to be normally distributed.
5. A warehouse clerk may decide to process more than one order since some common items may beordered by many customers and order fulfillment may be expedited.
6. When a warehouse clerk processes more than one order, a decision needs to be made regarding thenumber of orders to process at one time and this depends on the maximum size of the hand truck, and thesize, weight and quantities of the orders.
7. The warehouse clerk may want to process the order in such a way that orders far away from the centralpackaging area are picked up first and the ones near by the packaging area are picked up the last to avoidunnecessary movement of the order items.
8. The warehouse clerk may pick up the ordered items in such a way that his/her total walking distanceand repeated trips to the same or near by location is minimized.

9. In the packaging area, orders are packaged, labeled and sorted based on their destination beforeloading on the truck since the items loaded last need to be unloaded first.
10. The simulation study will provide information on the utilization of warehouse clerks, the number anddollar volume of orders processed and inventory levels of each product.
11. The simulation will perform what-if analysis. For example, it will inform warehouse managers whenand if the inventory for any product is equal to or lower than the specified reorder point. This will allowwarehouse managers to make better decisions with respect to size and timing of replenishment orders forparticular items.
12. The simulation studies the inventory replenishment process and has default options to order productswhen their inventories are below their reorder points. The warehouse managers, however, have authorityto override these system defaults. For example, in the case of hot-sold items, the warehouse manager maydecide to order more than the normal order quantity. On the other hand, if the item is rarely demanded,the warehouse manager needs to decide whether or not to discontinue the order.
13. The warehouse managers may want to review the performance of the warehouse operations and theperformance of each individual warehouse clerk from time to time. When such a request is issued, thesimulation should provide information on the total number of orders processed during the specified periodof time, the dollar amount of these orders, the number of orders processed by each clerk, and the averagebusy and idle times for each clerk.
14. The number and the dollar amount of orders processed may be divided by the total square footage ofthe warehouse to get the per square footage number and dollar amount of processed orders to help themanagers decide how large the warehouse capacity should be.
15. For the high-demand items, managers may decide to move their aisle locations to aisles near thecenter packaging area or even establish a special zone in or beside the center packaging area to reduce thetime to pick up those items.
SIMULATION MODEL
A basic warehouse facility was modeled using a SLAM II network on an IBM AS/EX 80 mainframecomputer. The basic network is the foundation for other networks, which differ with respect to howwarehouse personnel are assigned work (i.e., specialists versus generalists).
Statistics are based on 25 days worth of simulation time (12,000 minutes). This duration was necessaryto produce approximate steady state and to insure that statistics were based on steady state conditions.
Two models were developed and used as a basis of comparison between two distinct types of orderfulfillment operations. These models are described in the following sections.
Zone Picking Model
Currently, warehouse personnel are dedicated to the specific areas of furniture, office supplies, orbuilding products. Orders are checked by a clerk and sent to a queue based on their category. When

orders have been picked, they are then sent to the warehouse shipping dock to wait for loading onto theappropriate truck.
Order Picking Model
An alternative model that is being examined is to reallocate warehouse personnel so that all pickers aregeneralists. For this type of operation, orders are checked by a clerk and sent to a common queue wherethey wait for picking by the first available picking clerk. Similar to the current model, after orders havebeen picked, they are sent to the warehouse shipping dock to wait for loading onto the appropriate truck.
A hybrid approach involving zoning for small, hard-to-find items and order picking for bulky, oftenretrieved items will also be examined.
RESULTS
Preliminary results indicate that both the zone picking and order picking operations are able to processand fill approximately the same number of orders during a twenty-five day period. The zone pickingmodel completed 1,793 orders while the order picking model completed 1,789 orders.
Perhaps the most dramatic difference between the two models is mean order fulfillment time (the timebetween order arrival and the time picking is complete). The mean time for the zone picking model isapproximately 60 minutes while the mean time for the order picking model is only 42 minutes. Inaddition, variability in order fulfillment time with the order picking model is about half that of the zonepicking model. This suggests that the order picking model is better at providing short and dependableorder lead times.
In both models, the order picker personnel were busy about the same amount of time. However, thevariability of utilization was observed to be significantly greater in the zone picking model. This wouldimply that the zone picking model is subject to periods of customer order backlog along with otherperiods where there are no customer orders waiting to be picked. This is no doubt due to the fact thatwork is more evenly distributed in the order picking model operation. This also contributes to the greaterorder fulfillment time experienced by the zone picking model.
REFERENCES
Ahire, S.L. and Schmidt, C.P. A Model for a Mixed Continuous-Periodic Review One-Warehouse, N-Retailer Inventory System. European Journal of Operations Research, Vol. 92, No. 1, 1996. pp. 69-82
Cormier, G. and Gunn, E. A Review of Warehouse Models. European Journal of Operational Research,Vol. 58, No. 1, 1992. pp. 3-13.
Graff, G. Simulating the Factory. High Technology, Vol. 6, No. 9, 1986. pp. 61-63.
Gray, A.E., Karmarkar, U.S., and Seidmann, A. Design and Operation of an Order-ConsolidationWarehouse: Models and Application. European Journal of Operational Research, Vol. 58, No. 1, 1992.pp. 14-36.
Law, A.M. and Kelton, W.D. Simulation Modeling & Analysis, McGraw-Hill: New York, 1991.

Olson, D.R. Seven Trends of Highly Effective Warehouses, IIE Solutions, Vol. 28, No. 2, 1996. pp. 12-14.
Pritsker, A.A.B. Introduction to Simulation and SLAM II: Third Edition, John Wiley and Sons: NewYork, 1986.
Warrender, R. Warehouse management: the critical application of the 1990’s. Industrial Engineering,Vol. 26, No. 6, 1994. pp. 25-27.

SENSITIVITY ANALYSIS OF A STOCHASTIC INVENTORY MODEL
Kal Namit, Winston Salem State University, Winston Salem, NC 27110Fidelis Ikem, Virginia State University, Petersburg, VA 23806, and
Jim Chen, Norfolk State University, Norfolk, VA 23504
ABSTRACT
Uncertainty in the values of model parameters for a stochasticinventory model requires that sensitivity analysis be made anintegral component of the solution process. In this paper, wedemonstrate how Taguchi’s design of experiment can be usedto identify robust and sensitive sets of the parameters ofinterest in a stochastic inventory model whose derivativeexplicit form cannot be obtained.
Introduction
In developing the optimal policy of an inventory model weassume that the relevant parameters of the model, (S-orderingcost, IC-carrying charge, D-average demand, and G-stockoutcost) are known constants. In practice this assumption isseldom satisfied precisely due to difficulties of measurementsand accuracy of the input data. Therefore the parameter valuesused would be based on estimation under imperfectinformation in the data collection, which inevitably introducescertain degrees of uncertainty. For this reason, a sensitivityanalysis has to be an integral component of the solution processto determine the behavior of the model with respect touncertainties in the values of the system’s parameters. Twomajor vehicles of sensitivity analysis are calculus andcomputerized numerical methods. When the functions in themodel and equations for which the model is solved are easilydifferentiable, the signs and magnitudes of the derivatives canbe used to determine the subsequent effects upon decisionvariables of the optimum policy when the in values of modelparameters change. The sensitivity analysis of the of the EOQmodel is a case of point. Alternatively, one might simply testvarious numerical values, and combinations of values ofparameters, and study the subsequent effects on the variables ofinterest. This option is necessary when the functions are notdifferentiable, readily or otherwise. Thus in lieu of calculatingthe derivative of the decision variable with respect to a model’sparameter, one might study the subsequent effects on thevariables of interest within the estimated intervals of theparameters. The upper and lower limit values instead of thepoint estimate values of the parameters are being used indecision making. The statistical method called the factorial-analysis can be used effectively for the evaluation of the effectsof the parameter variations on the optimal policy values. Thismethod will also allow us to study the correlations between theparameters as well. Through the use of this approach, thoseparameters having the most effect on the optimal policy can beidentified and their effects can be quantified. The completeapproach, which is known as the full-factorial analysis of thedesign of experiments, requires several running experiments
with different combinations of parameter values, can be acomplicated, time-consuming process. For example, assumethat we have a model that is governed by four parameters,mean demand, ordering cost, carrying cost and back-order cost- each of which is specified at two levels, upper and lowerlimits, sixteen combinations of input settings would have to beexamined to run the full factorial design. Taguchi hassuggested a way around this problem by using a special subsetof the full-factorial analysis known as the orthogonal arrays,combinations that represent the main spectrum of outcome. Thepurpose of this research is to demonstrate how Taguchi’sdesign of experiment can be used to identify robust andsensitive sets of the parameters of interest of a stochasticinventory model, whose explicit form of the derivative can notbe obtained for the analysis the impact of the variation of theparameter values on the optimal policy.
The Analysis.
The parameters of interest are: the annual average demand
(� ), the setup cost (S), the unit holding cost (H), thebackorder cost (G). Each parameter is defined by upper andlower values. The actual parameter settings are required tosolve for the optimal policy decision making values Q* and r*,but the coded values +1 and -1 are used to set up and conductthe analysis of the experiment in order to obtain the responseequations for Q and r. The upper actual value is coded as +1and the lower value is coded as -1. The coding is to standardizethe units and scaling of all parameter inputs. To properly codethe actual parameter settings we use the following equation forthe transformation from actual parameter setting to codedsettings and vice versa.
ActualHi Lo Hi Lo
Coded��
��
[ ] .2 2
Converting all the actual parameter settings to coded valuesproduces the coded test matrix of the design table. Basicallythe high actual values are coded as +1 and the low actualvalues are coded as -1. The table shown below is called the Fractional Factorial Test
Matrix for k�12 Design, where k is the number of input
factors and k�12 is the number of runs. The technique usesa special subset of the full-factorial analysis known as theorthogonal array. Using orthogonal array would require muchless number of runs and provide a good average response overa number of runs, as opposed to one result for each treatmentcombination. It also provides for a direct comparison of thelevels for any factor. The technique is based on the variability

of the output result with respect to the changes in the parametervalues. Thus, the result can be used to identify whether theparameter is robust and sensitive in the given range of interest.The following is the template used for the analysis.
Factors and Interactions ResponseValues
Run A BABCD C
ACBD
BCAD D Q r
1 -1 -1 1 -1 1 1 -12 -1 -1 1 1 -1 -1 13 -1 1 -1 -1 1 -1 14 -1 1 -1 1 -1 1 -15 1 -1 -1 -1 -1 1 16 1 -1 -1 1 1 -1 -17 1 1 1 -1 -1 -1 -18 1 1 1 1 1 1 1
Table I. Fractional Factor Test Matrix for a 4 12 � Design
Note that the column AB, the interaction of factors A and B, isobtained from the product of the -1 and +1 elements in columnA and B. Column AB has the same pattern as column CD, thatis AB is aliased with CD. It can be easily verified that BD isaliased with AC and the column AD is aliased with BC. Theresponse values Q and r are the optimal values of the modelunder each treatment combination of parameter setting values.The average response equations for Q and r are the estimateregression equations using A, B, AB(CD), C, AC(BD),BC(AD), and D as the independent variables and Q or r as thedependent variables.To demonstrate application of experimental design, a set ofoptimal solutions were obtained from the following back- ordermodel:
Min K(Q,r) = � ���
QA IC Q r IC
QB r� � � � �[ . ] ( ) ( )05 (1)
where
B r x h x d x rH rr
( ) ( ) ( ) .� ��
�is the expected number of backorders per period. h x( ) is the
marginal distribution of lead time demand and H r( ) is the
complementary cumulative of h x( ) . For each run, the
actual parameter setting values are used to obtain the responsevalues Q and r from the following iterative equations:
QA G B r
IC�
� �2� ( ( )) (2)
QICG
QICrH
��
�)( (3)
For each parameter setting, use the following algorithm to findthe response values Q* and r*.
Step 0. For n = 0, 1, 2, ..., until satisfied, do:
Step I. Compute n
n
I C
I C G� �
, where 0
2Q A
IC�
� .
Step II. Compute the inverse n
n
n
r HQ
QIC
IC G�
�
�1( )
�
Step III. Compute n
nQ rA G B
I C�
� �2 � ( ( ) )
Go To Step 0.
The response equations for Q and r are determined using thelevel average analysis. The analysis gets its name fromdetermining the average response for factor and interactionlevels and analyzing the importance of factors and interactionsbased on these computed values. The goal behind level averageanalysis is to identify the strongest effects and determine thecombination of factors and interactions investigated. The firststep is to calculate the average experiment result for each levelor setting for each factor and iteration. The relative impact ofeach factor can be determined either tabularly or graphically.As a good self check, it has been recommended that theanalysis be performed both ways. Another technique toestablish the response equation is to use the experiment matrixas independent variables and Q or r as dependent variables andthen use the multiple regression routine in Excel to find theregression equations. The more details of the analysis can beseen in the following computational illustrations.
Computational Illustrations:
The following range settings of relevant parameters arebeing used to run the experiment.
Parameter LevelsA Ordering Cost 2000 8000IC Carrying Cost 5 20G Back-Order Cost 1000 4000D Annual Demand 800 3200
Table II. Parameter Settings
Run A IC G D Q* r*1 2000 5 1000 800 803.15 75.76.22 2000 5 4000 3200 1610.70 329.023 2000 20 1000 3200 812.67 302.894 2000 20 4000 800 402.97 78.055 8000 5 1000 3200 3212.58 303.056 8000 5 4000 800 1602.96 78.0737 8000 20 1000 800 803.60 70.6018 8000 20 4000 3200 884.31 312.22
Table III.Actual Parameter Value Settings and Response Values
The table below shows the calculation of the average Q foreach factor and interaction level. It is performed by groupingthe responses by factor level for each column in the array,taking the sum, and dividing by the number of responses. Thedelta of each column is the difference between Avg@+1 andAvg@-1. The Delta/2 is the measurement of the impact of eachfactor and interaction.
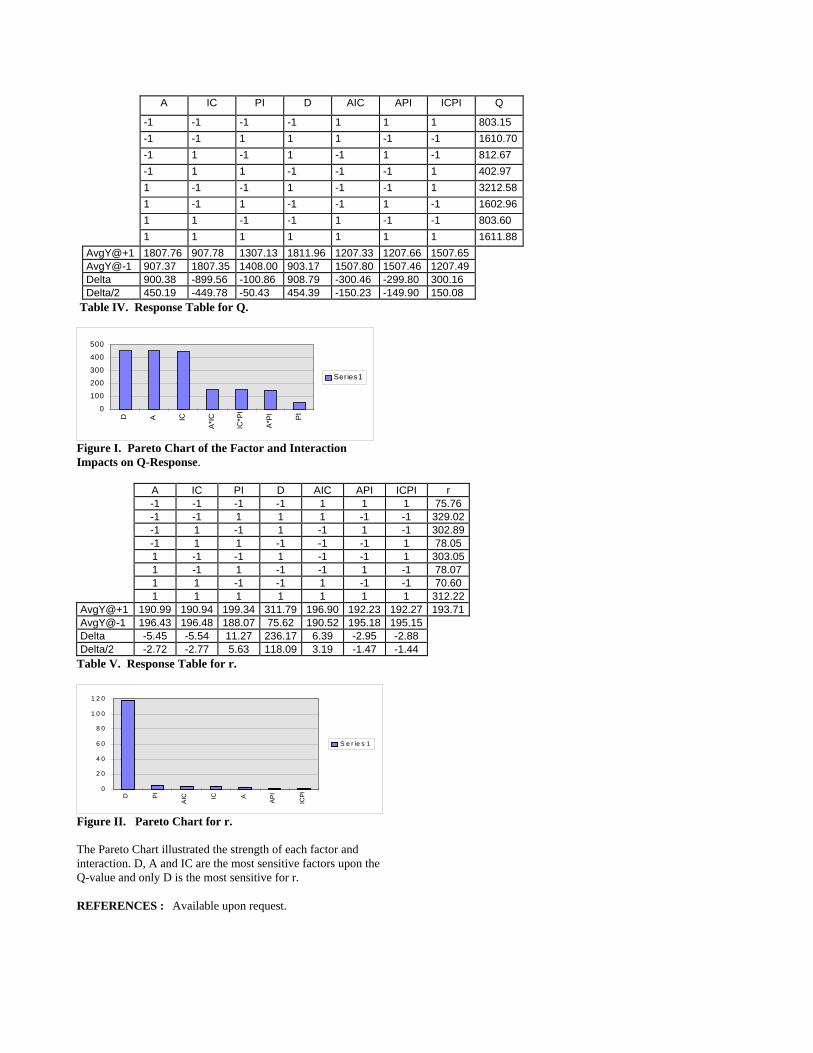
A IC PI D AIC API ICPI Q
-1 -1 -1 -1 1 1 1 803.15
-1 -1 1 1 1 -1 -1 1610.70
-1 1 -1 1 -1 1 -1 812.67
-1 1 1 -1 -1 -1 1 402.97
1 -1 -1 1 -1 -1 1 3212.58
1 -1 1 -1 -1 1 -1 1602.96
1 1 -1 -1 1 -1 -1 803.60
1 1 1 1 1 1 1 1611.88
AvgY@+1 1807.76 907.78 1307.13 1811.96 1207.33 1207.66 1507.65AvgY@-1 907.37 1807.35 1408.00 903.17 1507.80 1507.46 1207.49Delta 900.38 -899.56 -100.86 908.79 -300.46 -299.80 300.16Delta/2 450.19 -449.78 -50.43 454.39 -150.23 -149.90 150.08
Table IV. Response Table for Q.
0
100
200
300
400
500
D A IC
A*I
C
IC*P
I
A*P
I
PI
Ser ies1
Figure I. Pareto Chart of the Factor and InteractionImpacts on Q-Response.
A IC PI D AIC API ICPI r-1 -1 -1 -1 1 1 1 75.76-1 -1 1 1 1 -1 -1 329.02-1 1 -1 1 -1 1 -1 302.89-1 1 1 -1 -1 -1 1 78.051 -1 -1 1 -1 -1 1 303.051 -1 1 -1 -1 1 -1 78.071 1 -1 -1 1 -1 -1 70.601 1 1 1 1 1 1 312.22
AvgY@+1 190.99 190.94 199.34 311.79 196.90 192.23 192.27 193.71AvgY@-1 196.43 196.48 188.07 75.62 190.52 195.18 195.15Delta -5.45 -5.54 11.27 236.17 6.39 -2.95 -2.88Delta/2 -2.72 -2.77 5.63 118.09 3.19 -1.47 -1.44
Table V. Response Table for r.
0
2 0
4 0
6 0
8 0
1 0 0
1 2 0
D PI
AIC IC A
AP
I
ICP
I
S e r ie s 1
Figure II. Pareto Chart for r.
The Pareto Chart illustrated the strength of each factor andinteraction. D, A and IC are the most sensitive factors upon theQ-value and only D is the most sensitive for r.
REFERENCES : Available upon request.

SUPPLY CHIAN MANAGEMENT AND ITS SERVICE MEASURES IN THE FOOD INDUSTRY
Xin X. He, School of Business, South Carolina State University, Orangeburg, SC 29117, (803) 536-8454
ABSTRACT
This research investigates the supply chain management practices and its service measures in the food-processing industry. We findthat manufacturers in the food industry, like in durable goods industries, compete aggressively for limited resources with everincreasing customer demands. In order to be successful they have to be more effective and efficient in making such decisions assupplier selection, demand management, scheduling, inventory management, and market distribution. A comparison of supply chainmanagement practices and service measures between the food industry and the durable goods industries reveals some managerialimplications that are otherwise unrecognized from either one of the industries alone.
1. INTRODUCTION
Although most research in supply chain management focuses on such durable goods industries as automobile, machinery, andelectronic, this paper focuses mainly on the food industry. This is motivated by a study on just-in-time (JIT) in the food industry [4].The concept of JIT philosophy [3][5] fits what is known as perishability in the food industry perfectly, which translates into frequentpurchasing of perishable raw materials and on-time delivery of food products to consumers. It is reported that JIT production played asignificant role in the food industry and that supply chain management was the principal factor of JIT effectiveness in the foodcompanies studied. Moreover, the implementation of JIT practice had a positive impact on food quality. Consequently, it seems logicalto study in more details on the issues related to supply chain management and service measures in the food industry.
This paper investigates the supply chain management practices and its service measures in the food-processing industry in SouthCarolina. We find that manufacturers in the food industry, like in durable goods industries, compete aggressively for limited resourceswith very increasing customer demand for better service and quality. In order to be successful they have to be more effective andefficient in making such decisions as quality supplier selection, customer demand management, production scheduling, warehouseinventory management, market distribution, and on-time delivery. A comparison of supply chain management practices and servicemeasures between the food industry and the durable goods industries reveals professional insights and managerial implications that areotherwise unrecognized from either one of the industries alone.
Our study is based upon 198 food processors in South Carolina. They can be categorized into three groups: i) meat and poultryprocessors where inputs are perishable and outputs are perishable or frozen, ii) baking companies where inputs are usuallynonperishable but outputs are perishable, and iii) dairy products companies where both inputs and outputs are generally perishable. Ofthe companies studied, 48 were food processors with 100 or more employees, 66 with 25-99 employee, and the remaining were smallfood companies. Annual sales ranged from over $200 million to less than $1 million.
2. SUPPLY CHAIN MANAGEMENT
Supply chain management is a network of facilities and distribution options that perform the functions of procurement of materials,transformation of these materials into intermediate and finished products, and the distribution of the finished products to customers.Supply chains exist in both service and manufacturing organizations, and the complexity of the chain may vary greatly from industryto industry and from firm to firm. There are four major decision areas in supply chain management: location, production, inventory,and transportation and distribution. They can be both strategic and operational elements in each of the decision areas. The mainobjectives of supply chain management are to maximize total profits, to maximize customer service, and to improve quality.
Implementation of supply chain management can benefit in a wide variety of ways to companies seeking improved strategic alliances,faster and better product development, cost reduction, and reduced leadtimes. Production managers together with purchasing managersare on the front lines of trying to develop close, long-lasting relationships with key suppliers that result in mutual benefits. Facingworldwide competition, many companies are eager to develop quality new products to reach their markets as quickly as possible. Costreduction in supply chain management has its new meaning. Producers are working closely with suppliers in joint efforts to removecost from the system, instead of shifting costs from each other. Reducing leadtime can dramatically reduce production cost throughinventory reduction and improved quality. In addition, it helps to improve service levels and customer satisfaction.
Carter and Narasimhan on a study of 75 purchasing executives in North American [1] provided a list of supply chain managementtrends, from most significant to least significant. Of the executives studied, 75 percent were from manufacturing firms and the balancewas from various service industries.
1. Increased use of information technology2. Total cost of ownership for purchasing decisions
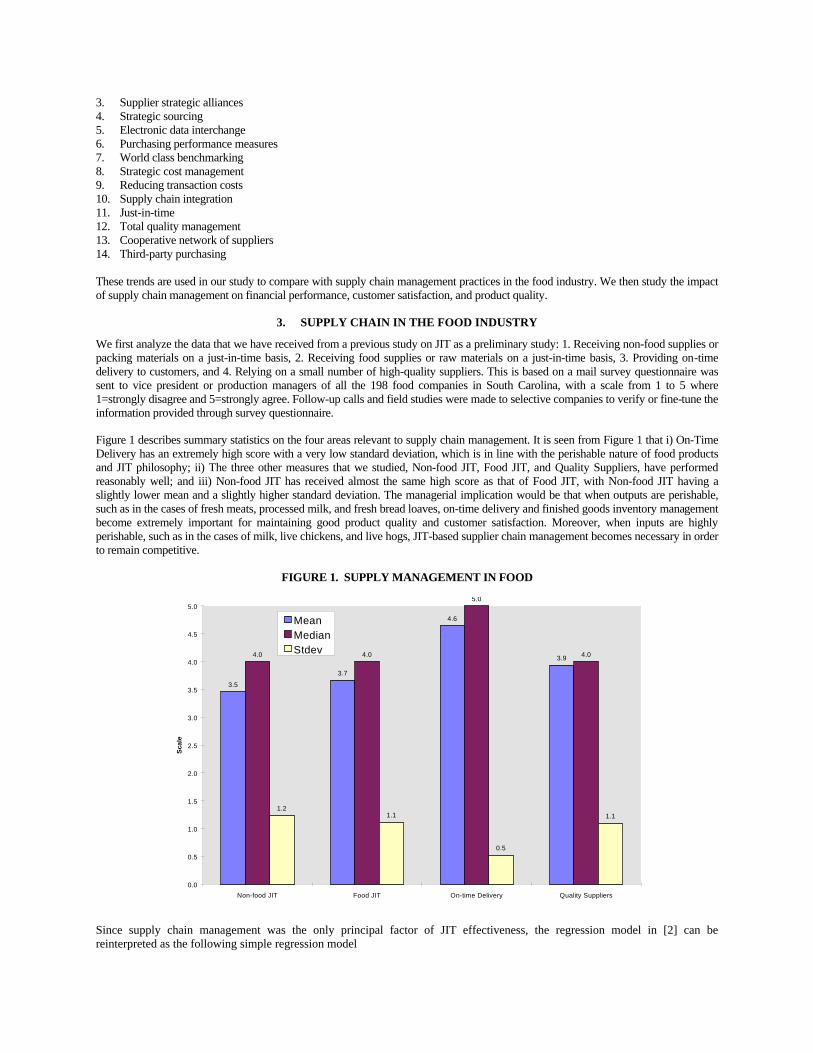
3. Supplier strategic alliances4. Strategic sourcing5. Electronic data interchange6. Purchasing performance measures7. World class benchmarking8. Strategic cost management9. Reducing transaction costs10. Supply chain integration11. Just-in-time12. Total quality management13. Cooperative network of suppliers14. Third-party purchasing
These trends are used in our study to compare with supply chain management practices in the food industry. We then study the impactof supply chain management on financial performance, customer satisfaction, and product quality.
3. SUPPLY CHAIN IN THE FOOD INDUSTRY
We first analyze the data that we have received from a previous study on JIT as a preliminary study: 1. Receiving non-food supplies orpacking materials on a just-in-time basis, 2. Receiving food supplies or raw materials on a just-in-time basis, 3. Providing on-timedelivery to customers, and 4. Relying on a small number of high-quality suppliers. This is based on a mail survey questionnaire wassent to vice president or production managers of all the 198 food companies in South Carolina, with a scale from 1 to 5 where1=strongly disagree and 5=strongly agree. Follow-up calls and field studies were made to selective companies to verify or fine-tune theinformation provided through survey questionnaire.
Figure 1 describes summary statistics on the four areas relevant to supply chain management. It is seen from Figure 1 that i) On-TimeDelivery has an extremely high score with a very low standard deviation, which is in line with the perishable nature of food productsand JIT philosophy; ii) The three other measures that we studied, Non-food JIT, Food JIT, and Quality Suppliers, have performedreasonably well; and iii) Non-food JIT has received almost the same high score as that of Food JIT, with Non-food JIT having aslightly lower mean and a slightly higher standard deviation. The managerial implication would be that when outputs are perishable,such as in the cases of fresh meats, processed milk, and fresh bread loaves, on-time delivery and finished goods inventory managementbecome extremely important for maintaining good product quality and customer satisfaction. Moreover, when inputs are highlyperishable, such as in the cases of milk, live chickens, and live hogs, JIT-based supplier chain management becomes necessary in orderto remain competitive.
FIGURE 1. SUPPLY MANAGEMENT IN FOOD
3.5
3.7
4.6
3.94.0 4.0
5.0
4.0
1.21.1
0.5
1.1
0.0
0.5
1.0
1.5
2.0
2.5
3.0
3.5
4.0
4.5
5.0
Non-food JIT Food JIT On-time Delivery Quality Suppliers
Sca
le
MeanMedianStdev
Since supply chain management was the only principal factor of JIT effectiveness, the regression model in [2] can bereinterpreted as the following simple regression model

Quality = 3.48 + 0.243 SupplyMgt(9.10) (2.55)
Numbers in the parentheses are t-test statistics for the constant and coefficient, respectively. Both of them are significant at the 95%confidence level. This regression model indicates that supply chain management has a positive linear relationship with food quality andsafety.
Field studies are then conducted to compare supply chain management practices in the food industry as opposed to these in the durablegoods industries. Two poultry processors are studied in order to obtain firsthand experience of supply chain management practices.We find that the food industry has been using supply chain management and JIT practice since its beginnings, because one of its majorgoals has always been the delivery of quality products on time. Thus, distribution is a key element, as customers have always wantedtheir orders to be complete and delivered within 24 hours. Food companies typically deliver to customers five to six times a week.According to Freeman [2], many food companies are encouraging partnerships, not only with suppliers, but also with the drivers ofperishable cargo. We find that improvements of customer satisfaction and product quality are quoted more frequently than financialperformance in the food industry. Thus, we try to stick with terms and definitions that are commonly used in the durable goodsindustries in order to be compatible. Section 4 is a brief description of service measures in the durable goods industries.
4. SERVICE MEASURES
In inventory models, shortage occurs when physical stock drops to zero or when inventory level is less than the incoming demand forinstant delivery. There are two different ways to evaluate the effect of shortage [6]: costs considerations and service considerations.There are three types of shortage costs: B1 – shortage cost per stockout occasion, B2 – shortage cost per unit short, and B3 – shortagecost per unit short per unit time. B1 is assumed the only cost associated with a stockout occasion. It is a fixed value, which isindependent of the magnitude or duration of the stockout. One possible interpretation would be the cost of an expediting action to avertan impending stockout. B2 is defined as the value to be charged for per unit short. An example would be the case where units short aresatisfied by overtime production. B3 is defined as the value to be charged for per unit short per unit time. An example would be the casewhere the item is a spare part and each unit short would result in a machine being idled.
There are three commonly used service measures in literature [6]: P1 – probability of non-stockout, P2 – the fill rate, and P3 – the readyrate. P1 is defined as the probability that no stockout occurs during the replenishment period. Equivalently, it is the fraction of cycles inwhich a stockout does not occur. A stockout is defined as an occasion when the on-hand inventory drops to zero. P2 is defined as thefraction of demand to be satisfied routinely from the shelf without lost or backordered. P3 is defined as the fraction of time duringwhich the net inventory is positive.
5. FIELD STUDIES
Consider Columbia Farms Inc. (CFI) and Carolina Golden Products (CGP) for example. CFI is a fresh meat plant, a chickenslaughtering processor with 450 employees. It processes 140,000 live birds daily and sells the raw meats, in the form of wholechickens and chicken parts, to fast food restaurants, supermarkets, and other large-volume customers, on a produce-to-order basis. Theremainder may be sold to other chicken processors for further processing in commodity markets or held in inventory. The companyruns two shifts daily, with a third shift only for cleaning. No fresh raw meats would be left overnight. The company very much relieson supply chain management, including JIT delivery of live chickens from suppliers, on-time delivery to customers, a formal qualitycontrol program, and a formal daily production schedule. The waiting time for a truck with live birds to be unloaded is no more 60minutes, and over 95% of raw meat packs are delivered to customers on the same day, with U.S. Department of Agriculture (USDA)veterinarians and inspectors assigned at the production lines to ensure safety and grading standards. Although the number of 140,000live birds processed daily is a constant due to a fixed production capacity and locked annual contracts with live-chicken suppliers, aformal daily production schedule of whole chickens and chicken parts is determined every morning based on demand and marketprices. But other measures of supply chain management implementation are not as tangible or measurable as those in the durable goodsindustries, for example in automobile manufacturing.
CGP is another poultry company, a full-scale chicken processor with 2200 employees. It consists of two plants under the same roof: afresh meat plant and a further process plant. The fresh meat plant is similar to that in the CFI Company, with a daily processingcapacity of 250,000 live chickens. The further process plant produces semi-cooked and ready-to-eat portions, with over 400 types offinished products. Since the further process plant provides more value-added than the fresh meat plant, it gets a high priority forreceiving raw meats from the fresh meat plant. About 40% of the products are further processed daily and sold to such companies asKentucky Fried Chicken and Burger King. The remaining 60% are sold as raw meats to supermarkets, other large-volume customers,or kept in raw meat inventory for further processing.
The CGP Company has a much higher level of supply chain management than the CFI Company does, for it has a higher degree ofproduction complexity and more value-added processes. The complexity at the further process plant is comparable to most durablegoods manufacturers, as CGP has to rely on a pull system with a weekly master schedule and a formal daily production schedule inorder to compete effectively.

In CGP, it is company policy to have a ten-day leadtime for each incoming order, and the on-time order fill rate is targeted at 99.5%.Even with a fixed daily production capacity of 250,000 chickens at the fresh meat plant, a good daily production schedule is absolutelynecessary. Table 1 represents an extremely simplified daily production schedule to highlight its importance.
Table 1. An Example of Production Schedule at CGP
Demand Cutting Purchasing Raw Meat
Whole 50,000 50,000 0 100,000Legs 500,000 200,000 300,000 0Breasts 100,000 100,000 0 0Thighs 100,000 200,000 0 100,000Wings 100,000 200,000 0 100,000
The demand at the further process plant on the particular day is listed in the first column of Table 1. Since the demand for chicken legsis large, the daily production from the fresh meat plant is insufficient for legs. The company may then purchase 300,000 chicken legsto meet the demand, as shown at Table 1. But there are many other alternative schedules to meet the same daily demand. Factors to beconsidered include the following: i) market prices of whole chickens vs. chicken parts, ii) weight requirements of the demand, iii)production capacity, iv) WIP inventory, and v) setup time and number of setups required.
A limited number of suppliers deliver perishable supplies to CGP on a JIT basis. The maximum waiting time for unloading for a truckwith live chickens is no more than 30 minutes. The 72 chicken farms contracted are just enough to provide year-round chicken suppliesfor the company. Transportation for fresh raw meats is provided by the corporate trucking fleets to ensure on-time delivery. Quality ofboth self-processed and purchased fresh raw meats is assured by USDA safety and grade standards.
Finished goods and WIP inventories are kept at a minimum due to effective weekly master schedules and detailed daily productionschedules at the further process plant. WIP inventory is held to balance uneven daily production or to avoid excessive setups. Setupreduction is achieved through a) proper sequencing, a) right timing at lunch break or shift changes, and c) the introduction of newprocess technology.
We find that both firms are using fill rate as their service measure and using cost per unit short as their shortage costs. Both of theyview supply chain management as a vehicle to improve food quality and safety. But only one of they uses information technology tofacilitate supply chain management implementation. None of them have a record of strategic cost management through theimplementation of supply chain management.
6. SUMMARY
Preliminary results from a mail survey on 198 food companies in South Carolina indicate that supply chain managementimplementation in the food industry has a significant impact on food quality and customer service levels, namely on-time delivery offinished products to customers and to receiving perishable supplies on a JIT basis. Since the quantitative inventory models are rare inthe food industry, they tend to use fill rate for service measures. We find that overall food quality is positively related to supply chainmanagement practices in the food industry by means of a simple egression analysis.
REFERENCES
[1] Carter, Joseph R. and Ram Narasimhan, “A Comparison of North American and European Future Purchasing Trends,”International Journal of Purchasing and Materials Management, Spring 1996, 12-22.
[2] Freeman, Linda K., “Meeting Just-in-Time delivery Parameters,” Food Engineering, July 1989, 61-63.[3] Hall, Robert. W. Attaining Manufacturing Excellence. Homewood, IL: Dow Jones-Irwin, 1987.[4] He, Xin X., “The Impact of JIT Production on Quality In the Food Industry,” Proceedings of SE Informs 32 nd Annual
Meeting, 1996, 295-297.[5] Schonberger, Richard J. Japanese Manufacturing Techniques. New York: Free Press, 1982.[6] Silver, E.A. and R. Peterson, Decision systems for Inventory Management and Production Planning, New York: Johns
Wiley & Sons, 1995.

DIFFERENCES IN QUALITY MANAGEMENT ASPECTSAMONG USERS AND NONE-USERS OF FLEXIBLE MANUFACTURING SYSTEMS
Mohamed A. Youssef, Norfolk State University, Norfolk, VA 23504Jon Stuart, Norfolk State University, Norfolk, VA 23504
Bassam Al-Ahmady, University of Ein Shams, Cairo, Egypt
ABSTRACT
The purpose of this paper is to examine how the use of FMS affects some aspects of quality management; an issue that has notbeen fully addressed in literature. The data used for this study were collected from the following industries: Aerospace,Electronics, Industrial and Farm Equipment, Metal product, and Motor Vehicle and Parts. Findings of this study indicate the usersof FMS outperform the none-users on most of the quality management aspects. The implications of this study are useful for bothacademics and practitioners.
INTRODUCTION
The intense competition in global markets has caused a major shift in the way companies respond to their customer needs. Qualityhas long been one of the major dimensions on which a manufacturing company may compete. Recently, many companies havecome to realize the strategic importance of quality on their survival in the business world. Customers in global markets are nolonger considering quality as a variable; they look at it as a given. In this paper, we argue that many facets of quality managementmay differ significantly among users and none-users of FMS.
There is a modest empirical relationship between Flexible Manufacturing System (FMS) and quality improvement (Chen andAdam, 1991 ). Chen and Adam demonstrated that quality improves somewhat with FMS implementation. Based on their findings,they recommended that FMSÆs impact on quality be fully explored to provide critical input into a company's strategic decision-making process. This paper is a forward step in this direction
Organization of the Paper
This paper is organized as follows. First, we provide an overview of the prior research on history, definition, components, andbenefits of both flexible manufacturing systems and Quality. Second, we state the research problem and research methodology indetails. Thirdly, we present the findings of the study and its implications for both academics and practitioners.
Because of the limitations on the number of pages for the proceedings, we opt to put more emphasis the second and the third partsoutlined above. We will provide the first part as well as tables, graphs upon request.
RESEARCH METHODOLOGY
Problem Statement And Research Objective:
The main objective of this study is to investigate differences in quality management aspects between the users and non-users ofFMS. The research problem of this paper is, therefore, stated as: Do FMS users differ from non-users in one or more of the qualitymanagement aspects?
To address this research problem, a questionnaire was sent to the Vice Presidents of manufacturing in five industries in USA.Among the questions asked are:
1. For how long has FMS been used in your facility?2. What percentage of your facility has been using FMS?3. What is the relative importance of the following strategic objectives to the business units?
ò public image,
ò market share,ò sales revenue,ò cost reduction,ò quality,ò productivity,ò profit.
4. To what extent has FMS affect each of the following aspects of product's quality:ò Marketing and customers,ò costs,ò measurements,ò total employees involvement.
RESEARCH HYPOTHESES
Based on the extensive literature review on quality management and Flexible Manufacturing Systems (FMS), we identified anddeveloped the following constructs:
1. Overall quality construct. 2. Quality Tools construct
3. Quality costs construct.4. Marketing and customer related quality construct.5. Total employee involvement. Construct.
For each of these constructs, we developed and tested a number of hypotheses.
The sample:
The sample was randomly drawn from following US industries:ò Aerospace,ò Electronics,ò Industrial and Farm Equipment,ò Metal products, andò Motor Vehicles and Parts.
Companies in this sample are among the Fortune 500. For the purpose of this study, a business unit is either an entire company,division, or a plant..
Data Collection Instrument
The data were collected through a mailed questionnaire. The questionnaire is divided into two main parts. The first part isdesigned to collect data pertinent to the existence and utilization of FMS in participating business units. The second part of thequestionnaire is designed to assess:
ò CompaniesÆ emphasis on quality and other strategic Objectives ,ò Cost of Quality,ò Quality Measurements,ò Quality ToolsÆò Total employment involvement.
The questionnaire was mailed to Vice Presidents of manufacturing. They were asked to fill it out or direct it to whom it mayconcern. Received questionnaires were filed and signed by:
ò Vice president of operations.ò Senior manufacturing engineer.ò Quality control manager.ò General director of quality assurance.ò Director of quality improvement and statistical methods.

ò Quality assurance and Manufacturing engineering manager.ò Quality manager.
Of the 490 questionnaire, one hundred and sixteen questionnaires were received, representing a 23% response rate. Fourteenquestionnaires were excluded from the analysis, for they were incomplete. The remaining 102 questionnaires were usedthroughout the analysis.
OPERATIONALIZATION OF VARIABLES
Independent Variable:
In this study, the independent variable is the use or none-use of FMS. Respondents were asked about the use of FMS in theirmanufacturing facilities. The independent variable was operationalized as a zero-one variable, where one signifies the existence ofan FMS and zero indicates the lack thereof.
Dependent variables:
The dependent variables are:ò CompaniesÆ emphasis on quality and other strategic Objectives , (Cronbach Alpha Coefficient 0.7114)ò Cost of Quality (Cronbach Alpha Coefficient 0.9567)ò Marketing and Consumer related Quality Aspects (Cronbach Alpha Coefficient 0.9803)ò Quality Tools (Cronbach Alpha Coefficient 0.9449)ò Total employment involvement (Cronbach Alpha Coefficient 0.9514)
Data Analysis:
This study seeks to explore whether or not there are differences in quality management aspects between the users and none-usersof FMS. To do so, we proceed with the analysis in two steps. First, we used simple descriptive statistics to examine the profiles ofthe respondents. Second, we used the t-test and one-way ANOVAÆs f-test to examine if there are differences in quality aspectsbetween the users and none-users of FMS. The two steps are explained below:
DESCRIPTIVE STATISTICS
Table 1Type of Industry
Industry Frequency Percent Cum. Percent
Electronics 31 30.4 30.4
Aerospace 13 12.7 43.1
Industrial Equipment 15 14.7 57.8
Metal Products 12 11.8 69.6
Automotive 31 30.4 100
Total 102 100
Table (1 ) shows that about 60% of the respondents are in electronics and automotive industry , while the remaining 40% of thecompanies are in aerospace, industrial equipment, and metal product industries respectively.
Table 2Yi: Existence of FMS

Value Frequency Percent Valid Percent Cum. Percent
0 52.0 51.0 51.0 51.0
1 50.0 49.0 49.0 100.0
Table (2 ) shows that 51% (52 respondents) of the sample donÆt use an FMS in their manufacturing facilities, while 49% (50respondents) do.
Table 3Ui: Utilization of FMS
Value Frequency Percent Valid Percent Cum. Percent
0 52.0 51.0 51.0 51.0
Less than 2 years 13.0 12.7 12.7 63.7
2 — 4 Years 18.0 17.6 17.6 81.4
More than 4 years 19.0 18.6 18.6 100.0
Total 102.0 100.0 100.0
Table (3 ) shows that of the 50 users of FMS, 26% (13 respondents) have used FMS for less than 2 years, 36% (18 respondents)have used it between two and four years, while 38% (19 respondents) have used it for more than 4 years.
Table 4Percentage of Business Using FMS
Percent Frequency Percent Cum. Percent
None 52.0 51.0 51.0
less than 25% 23.0 22.5 73.5
25% — 50% 14.0 13.7 87.3
51% — 75% 7.0 6.9 94.1
76% — 90% 4.0 3.9 98.0
More than 90% 2.0 2.0 100.0
Table ( 4 ) shows that 37% of the sample converted less than 50% of their facilities to using FMS. On the other hand, only 5.9% ofthe sample converted more than 75% of their facility to using FMS. It is obvious, at least from this sample, the use of FMS has notmatures in the five industries we studied.
T-TESTS & ONE-WAY ANOVA
A series of t-tests and One-Way ANOVA were used to examine the differences in quality aspects between the users and none-users of FMS. Levine, Ramsy, and Bernson (1995) indicated that when testing for the equality of means from two independentgroups (H
0: •
1 =•
2) against the generalized alternative that the two means are different (H
0: •
1 _•
2) it will not matter if we use either
the pooled-variance t test or the one-way ANOVA F test. In our analysis we opt to use both statistical techniques for the sake ofvalidating our findings.
Table ( 5 ) below shows the result of this analysis. As table ( 5 ) indicates, significant differences in almost all aspects of qualitymanagement do exist between the users and none-users of FMS. Users of FMS place heavy emphasis on the importance of quality

as one of the dimensions on which they compete. In addition, FMS users significantly differ from the none-users in their use ofquality tools, quality costs, and in all marketing and consumer related quality aspects.
Table 5T-TESTS
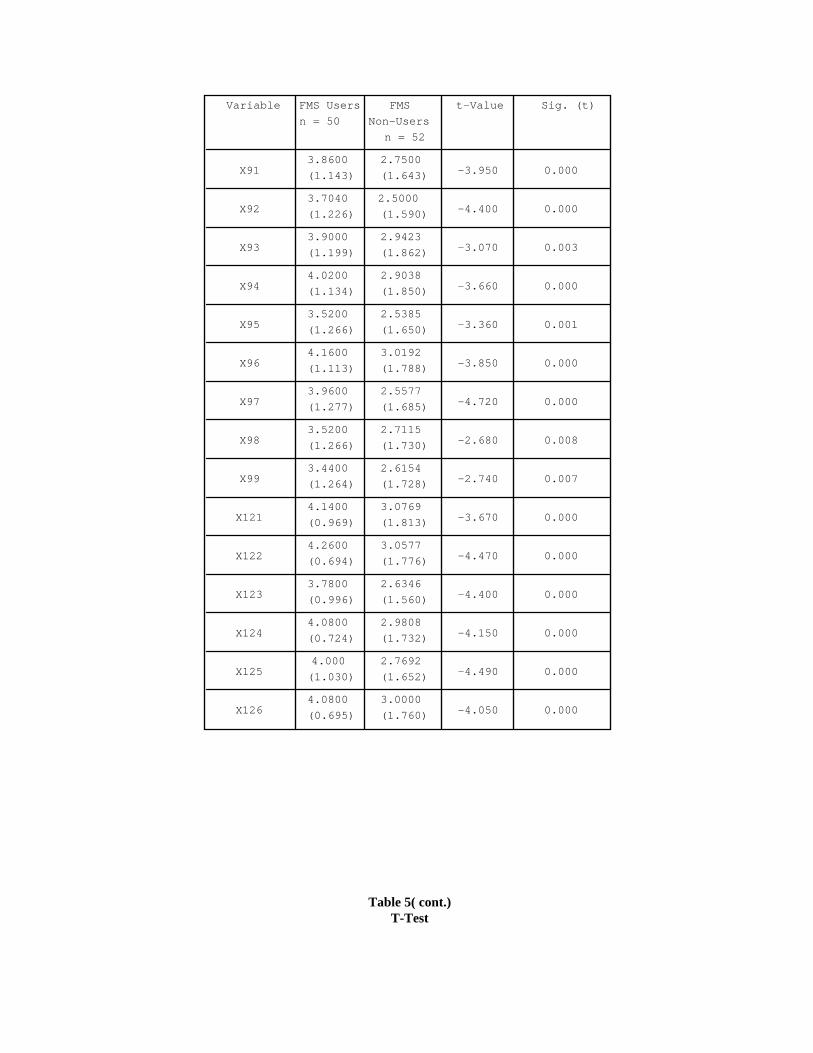
Variable FMS Users
n = 50
FMS
Non-Users
n = 52
t-Value Sig. (t)
X91 3.8600
(1.143)
2.7500
(1.643) -3.950 0.000
X92 3.7040
(1.226)
2.5000
(1.590) -4.400 0.000
X93 3.9000
(1.199)
2.9423
(1.862) -3.070 0.003
X94 4.0200
(1.134)
2.9038
(1.850) -3.660 0.000
X95 3.5200
(1.266)
2.5385
(1.650) -3.360 0.001
X96 4.1600
(1.113)
3.0192
(1.788) -3.850 0.000
X97 3.9600
(1.277)
2.5577
(1.685) -4.720 0.000
X98 3.5200
(1.266)
2.7115
(1.730) -2.680 0.008
X99 3.4400
(1.264)
2.6154
(1.728) -2.740 0.007
X1214.1400
(0.969)
3.0769
(1.813) -3.670 0.000
X1224.2600
(0.694)
3.0577
(1.776) -4.470 0.000
X1233.7800
(0.996)
2.6346
(1.560) -4.400 0.000
X1244.0800
(0.724)
2.9808
(1.732) -4.150 0.000
X1254.000
(1.030)
2.7692
(1.652) -4.490 0.000
X1264.0800
(0.695)
3.0000
(1.760) -4.050 0.000
Table 5( cont.)T-Test

Variable
FMS Users
n = 50
FMS
Non-User
s n = 52 t-Value Sig. (t)
X 314.8200
(.438)
4.54
(.753) -2.30 0.024
X1534.0000
(0.881)
2.4423
(2.071) -4.910 0.000
X1594.1400
(1.050)
2.7692
(2.092) -4.160 0.000
X1510 3.96
(1.049)
2.4231
(1.049) -4.960 0.000
X1511 3.1800
(1.453)
1.9615
1.760 -3.810 0.000
X1512 3.1200
(1.507
1.9615
(1.960) -3.340 0.001
X1513 2.8800
(1.649)
2.0192
(1.965) -2.390 0.019
X1014.1000
(0.909)
3.0768
(1.747) -3.690 0.000
X1024.22
(0.954)
3.0769
(1.800) -3.850 0.000
X1033.9200
(1.085)
2.8462
(1.661) -3.850 0.000
X1043.5200
(1.249)
2.8462
(1.626) -2.350 0.021
X1053.4800
(1.446)
2.6923
(1.566) -2.640 0.010
X1063.6600
(1.437)
2.6346
(1.547) -3.470 0.001
X1073.6400
(1.495)
2.2500
(1.412) -4.820 0.000
X1083.9400
(0.867)
2.9038
(1.660) -3.930 0.000
X1093.8400
(1.167)
2.9038
(1.729) -3.190 0.002
One-Way ANOVA
In this part of the analysis The null hypotheses are stated such that: (H0: •
1 =•
2) where 1, and 2 refer to the users and none-users of
FMS respectively and (j) refers to the dependent variables. ti: Time since FMS ImplementedTable 6
One Way ANOVA

As indicated in table ( 6 ) the results confirm our findings when a series of t-tests was used. Once again, significant difference inall aspects of quality management do exist between the users and none-users of FMS.
Variable Source D.F Sum of Squares Mean Squares F Ratio F Prob
X31 Between Groups 1 2.0205 2.0205 5.2749 0.0237
F Prob Between Groups 1 47.8963 47.8963 17.2754 0.0001
X1510 Between Groups 1 60.2112 60.2112 24.615 0.0000
X1511 Between Groups 1 37.844 37.844 14.4828 0.0002
X1512 Between Groups 1 34.2087 34.2087 11.1355 0.0012
X1513 Between Groups 1 18.8863 18.8863 5.7186 0.0187
X101 Between Groups 1 26.6802 26.6802 13.599 0.0004
X102 Between Groups 1 31.1025 31.1025 14.8186 0.0002
X103 Between Groups 1 29.3939 29.3939 14.8118 0.0002
X104 Between Groups 1 11.5743 11.5743 5.479 0.0212
X105 Between Groups 1 15.8156 15.8156 6.9502 0.0097
X106 Between Groups 1 26.8007 26.8007 12.0033 0.0008
X107 Between Groups 1 49.2496 49.2496 23.3112 0.0000
X108 Between Groups 1 27.3667 27.3667 15.4318 0.0002
X109 Between Groups 1 22.3392 22.3392 10.1894 0.0019
X91 Between Groups 1 31.4065 31.4065 15.5655 0.0001
X92 Between Groups 1 39.1937 39.1937 19.3435 0.0000
X93 Between Groups 1 23.379 23.379 9.4527 0.0027
X94 Between Groups 1 31.7557 31.7557 13.3709 0.0004
X95 Between Groups 1 24.5577 24.5577 11.2959 0.0011
X96 Between Groups 1 33.1718 33.1718 14.8286 0.0002
X97 Between Groups 1 50.1256 50.1256 22.3031 0.0000
X98 Between Groups 1 16.6606 16.6606 7.2076 0.0085
X99 Between Groups 1 17.3331 17.3331 7.5156 0.0072
X121 Between Groups 1 28.8073 28.8073 13.4795 0.0004
X122 Between Groups 1 36.8472 36.8472 19.9771 0.0000
X123 Between Groups 1 33.4407 33.4407 19.3705 0.0000
X124 Between Groups 1 30.8 30.8 17.2394 0.0001
X125 Between Groups 1 38.6124 38.6124 20.1915 0.0000
DISCUSSION AND CONCLUSION

The advent of recent manufacturing technologies such as FMS have caused manufacturing firms to rethink their productionstrategies. On one hand, many Western manufacturers have come to realize that automation is the solution to the flexibilityproblem. On the other hand, the management of these manufacturing companies also realize that the quality of their products is nolonger a variable; it is a given. In the 1990s customers have become more sophisticated and more demanding. To cope with thecustomersÆ demands and be flexible in responding to changes in the environments surrounding them, organizations must rethinktheir automation strategies. The existence of differences in most of the quality management aspects encourages the use of FMS.We realize that it takes time before the benefits of an FMS can be recognized. We, therefore, believe that companies shouldconsider time-since-implementation as a factor before assessing the success or failure of FMS. We also believe that integratingFMS with soft technologies such as JIT, TQM, and DFM will produce more synergistic results.
REFERENCES, TABLES AND GRAPHS ARE AVAILABLE FROM THE FIRST AUTHOR UPON REQUEST

EFFICIENCY VERSUS FLEXIBILITY: A COMPARISON OF GROUP TECHNOLOGY ANDVIRTUAL CELLULAR MANUFACTURING SYSTEMS
Vijay R. Kannan, College of Business, James Madison University, Harrisonburg, VA 22807(540) 568 3053
ABSTRACT
A limitation of Group Technology (GT) based cellular manufacturing systems is that their limited routingflexibility offsets the setup and material handling efficiencies they offer. Virtual Cellular Manufacturing (VCM)systems do not encounter the problem of limited routing flexibility but do not yield the same efficiencies as GTbased cellular systems. This study compares a GT based cellular manufacturing system that utilizes operationsoverlapping to further improve material flow efficiency with a virtual cellular manufacturing system. Resultssuggest that despite the use of operations overlapping in a GT based cellular manufacturing system, the shopcannot overcome the high flow time variance that results from the permanent dedication of machine resources.
INTRODUCTION
Several studies have highlighted the fact that by permanently and physically dedicating machine resources tospecific product families, the routing flexibility of Group Technology (GT) based cellular manufacturingsystems is compromised [2][7][12][13]. The result is that despite the setup and material handling efficienciesthey offer, cellular shops perform poorly compared to similar job shops. In Virtual Cellular Manufacturing(VCM) Systems [4] however, cells are logical structures created by scheduling jobs in a job shop using familybased scheduling mechanisms. Routing flexibility is therefore not compromised yet some of the setupefficiencies of GT based cells are retained. VCM was shown to yield significantly better throughput, work inprocess and due date performance than either a job shop or a GT based cellular manufacturing system over arange of shop conditions.
From a material flow standpoint, VCM systems are still limited by the fact that they physically resemble a jobshop. The proximity of machines, simplified flow patterns, and reduced complexity in production schedulingand control observed in GT based systems, are not observed in VCM systems. These characteristics of GT basedmanufacturing cells however provide opportunities to further improve the efficiency of material flow and topotentially offset their low routing flexibility. One way this can be accomplished is by using operationsoverlapping. The close proximity of machines makes it practical to split jobs into smaller transfer batches tofacilitate material flow and to simultaneously process batches on different machines. This has been shown toimprove the performance of manufacturing cells [8][10]. In one study [11], the use of operations overlappingenabled a GT based cellular shop to yield better mean flow time and work in process performance than a jobshop though under low shop load conditions.
While the limited evidence suggests that VCM may be a more effective means of batch manufacturing than GTbased systems, a ‘fair’ comparison of the two has not to date been carried out. VCM has not been compared witha GT based cellular manufacturing system that was implemented in a way that takes maximum advantage of itsmaterial handling efficiencies. This study fills this void, using simulation to examine the question of whethersetup/material handling efficiency is a substitute for routing flexibility in batch manufacturing systems. Theimplications are significant. While converting a job shop to a GT based cellular shop may be an option forcompanies seeking to improve manufacturing efficiency, it requires significant time and investment toaccomplish. This may preclude frequent shop reconfiguration. With shortening product life cycles and

increasing product variety, companies may not be willing to make the investment unless the efficiencies of GTbased cellular justify doing so.
VIRTUAL CELLULAR MANUFACTURING
Virtual cellular manufacturing [4] combines the routing flexibility of job shops with the setup efficiencies ofgroup technology manufacturing cells. It is based on the premise that the underlying principle of GT basedmanufacturing systems, that similarities in part processing requirements be recognized and exploited, can beseparated from the layout element of GT based systems. This can be accomplished by using family based(group) scheduling rules in a job shop. At any point in time, machines from different process departments willbe allocated to and setup for a given part family to form a virtual rather than a physical cell. This allows some ofthe setup efficiencies of GT cellular manufacturing systems to be realized without compromising routingflexibility or requiring changes in shop layout. As production requirements change, cells relinquish machines,and over time, new cells evolve while others dissolve. VCM thus supports equitable reallocation of machineresources in response to changes in demand and shop conditions.
To facilitate equitable machine allocation and to promote development of multiple cells, two constraints governmachine allocation. First, priority is given to families that do not currently have access to a machine of the typebeing allocated. Second, if multiple machines of the same type are allocated to a family, they remain allocated tothe family until they are no longer needed or until another family has jobs waiting to be processed on themachine type but has no machines of the type allocated to it. In the latter case, one of the machines in question isreallocated on completion of the current job.
EXPERIMENTAL DESIGN
This study compares two cellular manufacturing implementations, a virtual cellular manufacturing system(VCM) and a group technology based cellular manufacturing system (GTCM), under conditions likely to affecttheir relative performance. VCM is an eight department, thirty machine shop. Each department has three or fouridentical machines. Idle machines are assigned to the family with the most jobs in the current queue [4]. InGTCM, the thirty machines are allocated to five cells with no more than one machine of the same type in anycell. Cells contain between four and eight machines. Jobs are processed entirely within a single cell and have thesame routings as in VCM. Jobs are split into transfer batches on arrival at the shop. Four transfer batch sizes areconsidered such that the ratios of transfer batch size to batch size are 1 (GTCM-1), 0.5 (GTCM-2), 0.25(GTCM-3), and 0.125 (GTCM-4).
Three additional experimental factors are included in the simulation experiment. Shop load affects theperformance of both GTCM and VCM shop configurations though VCM is less sensitive to increases in shopload [4]. Prior studies [8][11] have also shown that the performance of a GT based cellular shop can beimproved by using operations overlapping but did not examine how this was affected by shop load. Two levelsof shop load are investigated in this study, a low level of 65% [11] and a high level of 75% [4].
Previous studies have also shown that setup frequency and thus shop congestion increase as batch size isreduced and can result in poor shop performance. By virtue of the fact that they do not incur time consumingmajor (inter family) setups, GT based systems should have an advantage over VCM as batch size is reduced. Ata shop load of 75%, a GT based cellular system performed poorly compared to VCM even with reductions inbatch size [4]. However, advantages due to small batch size may be realized when the shop is less congested.Two levels of the batch size factor are considered, large batches contain 120 units and small batches contain 40units.
The last factor, major setup time is included to evaluate the impact of setup time on the performance of the twoshops. High setup time will have a greater effect on VCM systems since they incur major as well as minor (intrafamily) setups. Two levels of this factor are included, at the high level, major setup time is 22.66 minutes and atthe low level, it is 11.33 minutes [4]. Minor setup time is one quarter of the major setup time.
SHOP ENVIRONMENT
The shop environment modeled in this study is the same as that used in [4]. Forty different parts are processedwithin the shops. Parts belong to one of five part families, each family containing between six and ten differentparts. Jobs arrive according to a Poisson process with exponentially distributed inter-arrival times. There is anequal probability that jobs are for a particular part. Jobs incur between two and six operations with no more thanone operation taking place on a given machine type. Processing time is normally distributed with mean 34.33minutes and standard deviation 3.433 minutes for a batch of one hundred units. Due dates are set using the totalwork content method [1] with an allowance of k = 3. In shop configuration VCM, jobs move between machinesat a rate of five miles per hour. Since the layout of GTCM is designed to minimize distances between machines,material handling time in this shop is assumed to be insignificant. Loading and unloading times in both shopsare uniformly distributed in the interval (1,5) minutes. Jobs are dispatched using the Repetitive Lots rule [3].Giving priority to transfer batches requiring the current machine setup before invoking a first come first servedpolicy compensates for the increased setup frequency that occurs when batches are split. Increased setupfrequency, if not addressed, can offset any advantages of small transfer batches [5].
For each of the forty treatments (5 * 2 * 2 * 2), thirty-one replications of two thousand jobs were carried out. Ineach case the first replication was deleted to eliminate initialization bias. Common random numbers were usedfor all but one input process to reduce variance while maintaining batch independence [6]. Data was collectedthe mean and standard deviation of flow time (�FT), and mean tardiness. The simulation model was written inSIMAN (Pegden 1987) and FORTRAN.
RESULTS
Analysis of Variance showed that for each performance measure, most if not all main and interaction effectswere significant (� = 0.05). To examine the impact of these effects, Tukey multiple comparisons of means werecarried out. Comparisons were carried out separately for each level of shop load. Treatment means for each shopconfiguration were then compared for all batch size/setup time scenarios.
When shop load is low, the use of operations overlapping in GTCM as expected allows the shop to outperformVCM with respect to mean flow time performance (Figure 1). For both batch sizes, GTCM-3 and GTCM-4consistently yield better performance than VCM. Transfer batch size and mean flow time are positivelycorrelated and further reductions in transfer batch size may yield additional reductions in mean flow time inGTCM particularly when batch size is large. When batch size is forty, GTCM-2 can also outperform VCM. Itshould however be noted that when setup time is high and batch size is small, even GTCM-1 outperforms VCM(i.e., when there is no lot splitting).
Results for �FT are less supportive of GTCM. For large batches, VCM yields values for �FT that are at least47.5% (low setup time) or 37% (high setup time) lower than those yielded by GTCM (Figure 2). As expected,the advantages of VCM are less pronounced when batch size is small. When setup time is low, VCM yields �FT
that is at least 28% lower than that yielded by GTCM. When setup time is high, the performance of VCM isstatistically equivalent to that of GTCM-2, GTCM-3, and GTCM-4. There is no statistically significant impacton �FT attributable to transfer batch size as long as operations overlapping is used in GTCM. Further reductions

in transfer batch size in GTCM are therefore unlikely to reduce flow time variance and may in fact increasevariance due to increased setup frequency.
The high flow time variance in GTCM translates to poorer due date performance than in VCM. With theexception of the small batch size, high setup time scenario, VCM always yields the best due date performance.For this exception, VCM yields the lowest mean tardiness but it is statistically similar to that yielded by GTCM-

3. Once again, the performance of GTCM improves as transfer batch size is reduced. However, furtherreductions in transfer batch size may not allow the GTCM shop to better VCM.
When shop load is increased, the advantages of VCM are even more pronounced. When batches are large, VCMconsistently outperforms GTCM by a significant margin despite the use of operations overlapping. VCM yieldsmean flow time that is at least 34% (low setup time) or 23% (high setup time) lower than yielded by GTCM(Figure 3). Although the performance of GTCM improves as transfer batch size decreases, additional reductions
in transfer batch size may not result in much additional reduction in mean flow time. Results for �FT are evenmore resounding, VCM yielding values of �FT that are a minimum of 76% or 66% lower than the values GTCMyields when setup time is low or high respectively (Figure 4). This translates to considerably better due dateperformance than in GTCM. There is no consistent relationship between transfer batch size and either �FT ormean tardiness in GTCM and although the lowest value for �FT is obtained when operations overlapping is used,there is no statistically significant difference compared with the value obtained when operations overlapping isnot used.
GTCM again fairs relatively better when batch size is small but even then, it cannot consistently outperformVCM. When setup time is low, mean flow time for GTCM is statistically equivalent to that yielded by VCM.When setup time is high, both GTCM-3 and GTCM-4 yield lower mean flow time than VCM and GTCM-2performs comparably to VCM. However, VCM consistently yields considerably lower values than GTCM for�FT and mean tardiness. VCM yields values for �FT that are at least 58% or 37% lower when setup time is low orhigh respectively. Transfer batch size again has no significant impact on the performance of GTCM though thehighest values for �FT are obtained when no batch splitting takes place. Mean tardiness in GTCM is poorestwhen operations overlapping is not used, but as long as batch splitting takes place, there is no significant effectattributable to transfer batch size. The margin by which VCM outperforms GTCM is again considerable,particularly when batch size is high.

REFERENCES
[1] Baker, K.R. “Sequencing and Due Date Assignments in a Job Shop.” Management Science, 1984, 30 (9),1093-1104.
[2] Flynn, B.B., and Jacobs, F.R. “An Experimental Comparison of Cellular (Group Technology) Layout withFunctional Layout.” Decision Sciences, 1987, 18 (4) 562-581.
[3] Jacobs, F.R., and Bragg, D.J. “Repetitive Lots: Flow Time Reductions Through Sequencing and DynamicBatch Sizing.” Decision Sciences, 1988, 19 (2), 284-291.
[4] Kannan, V.R., and Ghosh, S. “A Virtual Cellular Manufacturing Approach to Batch Production.”Decision Sciences, 1996, 27 (3), 519-539.
[6] Karmarkar, U., Kekre, S., Kekre, S., and Freeman, S. “Lot Sizing and Lead Time Performance in aManufacturing Cell.” Interfaces, 1985, 15 (2), 1-9.
[7] Mihram, G.A. “Blocking in Simular Experimental Designs.” Journal of Statistical Computer Simulation,1974, 3, 29-32.
[8] Morris, J.S., and Tersine, R.J. “A Simulation Analysis of Factors Influencing the Attractiveness of GroupTechnology Cellular Layouts. “Management Science, 1990, 36 (12), 1567-1578.
[9] Morris, J.S., and Tersine, R.J. “A Comparison of Cell Loading Practices in Group Technology.” Journalof Manufacturing Operations Management, 1989, 2, 299-313.
[10] Pegden, C.D. Introduction to SIMAN. Sewickley, PA: Systems Modeling Corporation, 1987.

[11] Sassani, F., “A Simulation Study on Performance Improvement of Group Technology Cells.”International Journal of Production Research, 1990, 28 (2), 293-300.
[12] Shafer, S., and Charnes, J.M. “Cellular Versus Functional Layouts Under a Variety of Shop OperatingConditions.” Decision Sciences, 1993, 24 (3), 665-682.
[13] Suresh, N. “Partitioning Work centers for Group Technology: Analytical Extension and Shop LevelInvestigation.” Decision Sciences, 1992, 23 (2), 267-290.
[14] Suresh, S., and Meredith, J.R. “Coping with the Loss of Pooling Synergy in Cellular ManufacturingSystems.” Management Science, 1994, 40 (4), 466-483.
N.B. A complete version of this paper is available on request.

A HEURISTIC METHOD BASED ON BOUNDED RANDOM SAMPLINGFOR THE RESCHEDULING OF OPERATIONS IN A JOB SHOP
Ahmet S. Ozkul, Clemson University, Clemson SC 29634-1305, (864) 656-3775
ABSTRACT
This paper proposes a new heuristic algorithm for the rescheduling of operations in a job shop. The heuristicmethod is primarily based on two earlier work. A heuristic developed for the single machine tardiness problem[Ozkul, 1996] is applied to operations scheduling problem using the 'scheduling graph' approach proposed by[Wu & Li, 1995].
INTRODUCTION
In a working paper on scheduling jobs on a single machine with the tardiness objective, [Ozkul, 1996] proposeda new heuristic for the single machine tardiness problem based on random sampling with bounds. The heuristicwas tested using Baker's sample problems [Baker, 1995], and simulation experiments provided evidence that theproposed heuristic performs significantly better than simple random sampling.
On the other hand, [Wu & Li, 1995] proposed a new method, called 'scheduling graph' (SG) for therepresentation and manipulation of operations scheduled on machines in a job shop. Using their algorithms, it ispossible to reflect changes to the schedule 'automatically'. Once a scheduler identifies the need for rescheduling,he or she can accommodate the change by manipulations such as adding, deleting or moving operations. Theeffect of the change is automatically reflected in the schedule. However, the scheduler is supposed to identifyand make the very first change. How the scheduler should schedule the change (e.g. how newly arrivedoperations should be placed in the schedule), is described as an iterative process, including evaluation, solutionand revision. They stated that 'how to determine the rescheduling solutions that enhance the performance of theexisting schedule still remains an open research issue.'
This paper addresses this research issue. The heuristic based on bounded sampling developed for the singlemachine is applied to operations scheduling in a job shop using the scheduling graph (SG) approach. Theheuristic method takes total tardiness as the performance measure of the shop, and tries to minimize it byrescheduling operations of the existing schedule. The resulting schedule is presented to the scheduler forevaluation and further manipulation. The proposed heuristic algorithm may have a value for practitioners,because it can be embedded in scheduling systems (particularly electronic Gantt chart based systems) for 'quickand dirty' rescheduling. It can be used for regeneration of the whole schedule, or in a 'net change' manner. Itconsiders the optimization of the whole system rather than local optimization (such as dispatching rules).
RESCHEDULING PROBLEM
Rescheduling is caused by factors such as machine breakdowns, new job releases, canceling, expediting ordelaying a job. The rescheduling problem is how to accommodate the change in the existing schedule whilemeeting the performance criteria of the shop. One approach is to regenerate the schedule that optimizes theperformance. However, this problem is not trivial, because multi machines in the job shop should be considered.Although some exact methods like dynamic programming and branch & bound techniques are availabletheoretically for the solution of this problem, heuristic algorithms are practical due to less computational costs.
On the other hand, changes can be reflected step by step as an iterative process including evaluation, solutionand revision. However, this time, the burden is on the scheduler. In this 'net change' approach, scheduler issupposed to locate the right place or right manipulation to accommodate the change.
SCHEDULING GRAPH
A scheduling graph is simply a network of operations scheduled to machines or work centers. In an existingschedule, operations are represented by nodes. Each node has information about operation characteristics suchas machine number, operation starting and ending times, and setup times. Nodes are linked in two differentways: One link connects nodes to ensure the proper ordering between operations of the same job defined in therouting. The other link connects nodes (operations) scheduled in the same machine. This link provides operationsequencing information on this particular machine. These links and nodes constitute the scheduling graph.
Basic Algorithms for SG
[Wu & Li, 1995] provides basic algorithms such as operation adding, deleting or moving in the SG for theschedulers so that they can quickly and easily react to inevitable rescheduling changes. For example, when a jobis cancelled, its operations are removed from the existing schedule, freeing scheduled time in some machines,and operations coming after the cancelled operations, should be scheduled earlier to avoid idle machine times.
Scheduling graph algorithms can be useful as standalone software or a part of a computer based schedulingsystem. It is good to see all the changes reflected immediately in the whole production schedule, allowing what-if analysis and fast rescheduling. However, these algorithms do not provide answers what and how the very firstoperations should be scheduled. They leave this to the experience of the scheduler.
A HEURISTIC PROPOSED
In a working paper [Ozkul, 1996], a heuristic approach for the minimization of the total tardiness of jobs on asingle machine is proposed. In the simple random sampling, jobs are selected randomly from the job pool, andare put in positions in the processing sequence. The simple random sampling algorithm determines randomlywhich job is processed first (first position in the sequence), second, third, and so on. Each time a job issequenced, this job is removed from the pool. After some iteration, jobs are sequenced and resulting schedule isready for evaluation.
Partial Sequences
The proposed heuristic also uses random selection, but it constructs partial sequences instead of one wholeschedule. A partial sequence is a sub set of a full sequence. It does not contain all the jobs. For example, if thereare 4 jobs to sequence, a partial sequence can be a sequence of only 3 jobs. Following this logic, 1-job, 2-job, 3-job and 4-job partial sequences can be constructed from a 4-job sequencing problem.
The basic idea of the heuristic is constructing partial sequences randomly, and rejecting the ones whosetardiness values are higher than the bound. Among the resulting sequences, the one with the best tardiness valueis kept as the best partial sequence for that level. Each level (Level-1 is 1-job partial sequences, Level-2 is 2-jobpartial sequences…) will have one best sequence. The neighborhood of these best partial sequences is furthersearched by means of constructing partial sequences around them. The following figure explains the operationof the heuristic applied to a 4-job scheduling problem.

Levels Partial Sequences Best Partial Sequences 1 R X 2 RR ,RX XX 3 RRR, RRX, RXX XXX 4 RRRR, RRRX, RRXX, RXXX XXXX
Figure-1. Partial sequences.
Sequencing Templates
In Figure-1, sequencing templates are shown. 'R' represents a job in a partial sequence that is randomly selectedfrom the pool for this position. 'X' represents a job in the 'best'' sequence of that level whose tardiness is lessthan the bound. For example, in the third level, three different types of partial sequences are constructed. UsingRRR template, first job, second job and third job to be processed are selected randomly from the job pool. Onthe other hand, using RXX template, partial sequences can also be constructed such that 'XX' portion of thesequence is copied from the best sequence previously found in level-2. The 'R' portion of the sequence israndomly selected from the unassigned jobs in the job pool. If a constructed partial sequence gives a lowertardiness value than the bound, then the sequence is kept in the memory. The number of partial sequencesgenerated this way for a given level must be externally given as repetition parameter. This number is critical,because the greater this parameter is, the more sequence will be generated and evaluated. For example, in a 4-job sequencing problem, if job numbers are represented as 1, 2, 3, 4; the repetition parameter is 6; and the partialsequence template is 'RRR', then 6 sequences may be constructed randomly such as '123', '132', '321', '213','123', and '132'. As seen in this example, construction of the same sequence again is allowed to avoid furthercomputational complexity.
In summary, this is a quick and dirty method for single machine tardiness problem. It is based on the idea ofgenerating sequences randomly that is lower than a bound, and give chance to the sequences in the whole searchspace to be picked up and be evaluated, meanwhile searching around the neighborhood of good partialsequences.
OBJECTIVE OF THE STUDY
The purpose of this study is 1) to propose and explain a new heuristic for the better performance of job shops.This heuristic is expected: a) to require less computational resources in terms of memory and speed, b) to behelpful to practitioners in fast and better rescheduling, c) to be applied to the whole, or part of the schedule, d) tooptimize performance by considering global measures of the shop. 2) To compare the relative performance ofthe heuristic to some local dispatching rules as well as a global heuristic like simple random sampling. 3) Toidentify potential directions for improvement.
RESCHEDULING OF OPERATIONS
This paper proposes the same heuristic described in the previous section for the rescheduling of operations in ajob shop. The heuristic not only permits regeneration of the entire schedule, but also permits the scheduler to fixsome operations or jobs in the existing schedule, so that optimization is applied in a 'net change' manner, only tothose desired operations that are not fixed.
The scheduling graph (SG) approach provides the means for applying the single machine heuristic to multimachines in a job shop. Using SG algorithms, particularly the algorithms for creating scheduling graph from an

existing schedule and adding new operations to the schedule, the single machine heuristic is adapted to multimachine operations scheduling.
By following the logic of the heuristic described in the previous section, partial sequences are created. However,when creating random components (R's), the operations are assigned to the particular machines given in therouting. Therefore, there will be groups of templates as many as number of machines.
The operations can be manipulated once all operations are tied to each other by the scheduling graph. If theheuristic adds a new operation to the schedule, this will be immediately reflected to the rest of the schedule bySG algorithms. These algorithms change the completion times and/or linking structure of all affected jobs.Therefore, the heuristic will be able to assign a performance measure (tardiness) to every partial schedule itcreates. It is important to see that this measure is not a local measure (i.e. based on one particular machine'squeue), it is a global measure showing the performance of the whole multi machine schedule.
MULTI MACHINE HEURISTIC ALGORITHM
The heuristic algorithm is modified for multi machine scheduling. The following shows the basic differencesfrom the single machine case.
A) As seen in Figure-2, in multi machine case, there are partial sequence groups. For a p-job partial sequencelevel, there are p groups. In each group, there are as many partial sequences as number of machines.
B) In the single machine case, partial schedules are created without an existing schedule. In multi machinecase, a schedule may be existed for ‘net change’ manipulation.
C) In single machine case, tardiness is based on the completion of a job. In multi machine case, tardiness isbased on the completion of the last operation of a job.
The algorithm provided in the next section is applied for the whole ‘regeneration’ of the schedule. The algorithmcan be extended to include net change manner handling. For example, the software system can be told that ‘bestpartial sequence’ is already given to start with, as opposed to starting with an empty sequence as representedX={} in the algorithm.
Levels Partial Sequences Best Partial Sequences 1 {R,R,R} {X,X,X} 2 {RR,RR,RR},{RX,RX,RX} {XX,XX,XX} 3 {RRR,RRR,RRR},{RRX,RRX,RRX},{RXX,RXX,RXX} {XXX,XXX,XXX} 4 …
Figure-2. Partial sequences for multi machines (m=3)
EXPERIMENTAL TESTING
Relative performance of the heuristic must be tested. To examine its performance, the algorithm is compared toother heuristics and exact methods found in the literature. For more comprehensive testing, computer simulationexperiments are used. At this time, the intent will not be to evaluate the performance of the heuristiccomprehensively under many factors, rather to identify whether it is a promising approach and worthy toelaborate on it for future research.

THE ALGORITHM FOR FULL REGENERATION
The heuristic algorithm adapted for the multi machine case is as follows:
Step-1:Given m machines and operations (of jobs released) scheduling,Create scheduling graph.Initialize bound to an arbitrary greater number.X(i) = {} for i=1, m
Step-2:k=1, where k is index for number of machines
Step-3:p=1, where p is index for p-job partial sequences.
Step 4:Create p-job partial sequence such that,d= 1, where d is index for number of operations in a partial schedule.R(i) = {} i=1,m where R is the random component of the partial schedule.
Step 5:r = random(A), where A is the set (pool) of available operations.R(i) = O(i,r) + R(i), i=1,m , where O(i,r) is all other operations of the job that includes operation r.d=d+1: if d>p go to Step 6, else go to Step 5.
Step 6:Construct the partial schedule such that,S(i)=R(i)+X(i) i=1,m, (random component + best partial schedule from the previous.)
Step 7:Apply SG ‘adding’ algorithm.Calculate total tardiness for S, if it is less than the bound, store S in memory, else go to Step 5.
Step 8:Repeat Step 4 – Step 7 for z times, where z is the search repetition parameter.
Step 9:Set X = SMIN, where SMIN is the S with minimum tardiness from S's in the memory.Store X in the memory for partial sequence p (level p).
Step 10:p = p+1, if there is still operations in A, go to Step 4, else go to 11.
Step 11:Set bound as the tardiness of X for the last partial (=full) sequence.
Step 12:Repeat Step 2 – Step 11 as many as desired for more accurate solution.
FUTURE RESEARCH
The future research related to the heuristic proposed in this study could be:
a) comparing the heuristic to other global scheduling methods such as branch and bound,b) studying the heuristic under a MRP based system,c) studying the heuristic under a wide variety of environmental factors such as under different uncertainties of
demand, safety stocks, etc.

d) studying the heuristic in combination with other MPC approaches such as theory of constraints, or orderrelease/review mechanisms.
e) studying the heuristic under different performance measures such as "forbidden early shipment" – E/T basedmeasures.
REFERENCES
[1] Baker, K. R. (1995) Elements of Sequencing and Scheduling. Dartmouth College, Hanover, NH.[2] Ozkul, A.S. (1996) "A heuristic method based on bounded random sampling for single machine tardinessproblem", Working Paper (unpublished), Clemson University, South Carolina.[3] Wu, H.H. & Li, R.K. (1995) "A new rescheduling method for computer based scheduling systems",International Journal of Production Research, v.33, No.8, p.2097-2110.

TRACK: Quality Issues
"" TThhee CCoosstt ooff QQuuaall ii ttyy aanndd NNoonnccoonnffoorr mmaannccee:: AA TToottaall QQuuaall ii ttyy SSyysstteemm AApppprr ooaacchh""GGrreeggoorryy SS.. LLii ttttllee,, AAFFGG IInndduussttrr iieess IInncc..RRoonnaalldd GG.. MMccMMaasstteerrss,, AAFFGG IInndduussttrr iieess IInncc..AAnnddrreeww JJ.. CCzzuucchhrryy,, EEaasstt TTeennnneesssseeee SSttaattee UUnniivveerrssii ttyy
"" SSttaattee QQuuaall ii ttyy AAwwaarr ddss""WWii ll ll iiaamm AA.. HHaaii lleeyy,, AAppppaallaacchhiiaann SSttaattee UUnniivveerrssii ttyySSttaannlleeyy AA.. BBrrooookkiinngg,, UUnniivveerrssii ttyy ooff SSoouutthheerrnn MMiissssiissssiippppii
“South Carolina’s Quality Award Program: A Look At The Common Threads And Quality Management Practices Of Awards Winning Organization” Stephen E. Berry, University of South Carolina-Spartanburg Lilly M. Lancaster, University of South Carolina-Spartanburg

THE COST OF QUALITY AND NONCONFORMANCE:A TOTAL QUALITY SYSTEM APPROACH
Gregory S. Little, AFG Industries, Inc., Kingsport, TN 37662 (423) 357-2472Ronald G. McMasters, AFG Industries, Inc., Kingsport, TN 37662 (423) 229-7454
Andrew J. Czuchry, College of Business and College of Applied Science and TechnologyEast Tennessee State University, Johnson City, TN 37614 (423) 929-5807
ABSTRACT
This case study presents a model designed to determine the Cost of Quality based on nonconformance toa set of quality standards. The framework is implemented in a manufacturing environment. The modelreflects an “open” system architecture based on customers’ perception of quality. The utility factor ofcustomer influence determines what is important in terms of quality. Standards are established for theseelements which are used to gauge the performance and efficiency of the manufacturing process. Poorperformance is then quantified on a relevant cost basis. The model is designed to go beyond conventionalcost of quality and nonconformance models as it offers a solution path using employees to improve areasof nonconformance with strategic implications on profitability and customer satisfaction.
INTRODUCTION
Today’s highly competitive and cyclical manufacturing environment finds customers consistentlydemanding higher and higher quality while suppliers strive to reduce operating cost to remain profitable.Often, companies respond to customers’ quality demands by implementing Total Quality Management orContinuous Improvement teams to identify ways to increase customer satisfaction. However,organizations have found that the cost for increased customer satisfaction is not always justified in termsof increased market share or profitability. In these cases, the economic feasibility of making the necessarycapital investment required to implement new ideas and/or equipment to improve quality are not readilyapparent. In addition, quality improvements are often hard for managers, and their employees, to acceptwhen the benefits are not apparent from a strategic and economic perspective. For a Cost of Qualitysystem to be effective in today’s manufacturing environment it must overcome the difficulties cited above,and result in increased market share, profitability and/or cost reductions. The importance of employeeinvolvement throughout this process is underscored.
RELEVANT LITERATURE
Company management in today’s business environment recognizes that quality is required for enhancedcompetitiveness. However, many organizations have not realized bottom line or market shareimprovements based upon their quality efforts. Shepherd cites manager’s failure to recognizeundiscovered opportunities [6], and suggests a cost of quality model that combines the economics ofquality with activity-based management. From this framework the benefits of quality and processimprovements can be evaluated. Although Shepherd suggests that his model helps restructure anenterprise for continuous improvement, the full feedback and corrective action steps that are vital toimplementation are not apparent.
The linkage between quality problems and profitable market share represents a paradigm shift from thetraditional view of quality cost. Schonberger and Knod challenged the traditional quality cost wherecompanies “play the odds” by comparing the liability of poor quality against the cost of preventing it [4].

Schneiderman has previously noted that infinite investment is not a prerequisite for continuous qualityimprovement [3]. He suggested that the quality cost function should be viewed on the basis ofincremental economics.
Economic justification of a cost of quality plan is utilized by Rust who proposed a cost-benefit analysisapproach to quality improvement [2]. She suggests a system that strives to eliminate deficiencies byseeking alternative solutions to quality problems. Rust points out that poor quality costs must be tracedto their source or root cause before these costs can be eliminated. She suggests a four step strategy thatattacks the price of nonconformance causes and drives them to zero. However, specific instructions onhow to achieve a zero price of nonconformance goal are not presented. Although Rust suggests investingin prevention measures and continuous improvement efforts, the steps for corrective action are notdiscussed. She concludes that the baseline for nonconformance costs is found in the manufacturingprocess. However, a total system, cross functional approach with consequential and corrective actionsteps is not discussed.
Corradi suggests that contemporary quality efforts lack a system for assigning cost data into meaningfulcategories [1]. He maintains that most management teams concentrate on fixing problems rather thanpreventing them. Consequently, Corradi introduces a six step plan for developing a cost of qualitysystem. The framework he suggests requires initial management “buy in” as well as concentratedmanagement involvement in development and implementation of the cost of quality system. He cites thepresentation of a quality program as a “management tool” that will contribute to its success. However,this philosophy downplays the value of employee participation which the authors have found to be vital tothe effectiveness of any quality program. According to Senge, many initial attempts to establish qualitysystems fail ultimately in U.S. firms, despite making some initial progress [5]. Employee “buy in” is themissing ingredient. Corradi concludes that every dollar saved from the cost of quality can be added to thebottom line as increased profit. However, front line employees will never accept the importance of thesecosts until the benefits become real to them.
The fundamental theme of current cost of quality efforts reflects the need for a total system approach.However, the detailed implementation path for corrective action and employee utilization has not beenidentified.
The objective of this study is to present an integrated system that addresses the Cost of Quality based onnonconformance to a set of internal manufacturing standards. By design, the system model provides adetailed corrective action path with employee participation. The model is subject to customer influencebecause it recognizes that it is the customer who determines what is important in terms of quality. Inaddition, employee involvement is critical to success. The value of this practical approach was proven byan application in a manufacturing environment.
THE MODEL
The authors suggest the model described in Figure 1 as the framework for assessing the cost of quality,and implementing corrective action that results in improved profitability, market share, and/or costreductions. Cost of quality is defined as 1) cost to prevent problems, 2) cost to detect problems, 3) cost tocorrect problems, 4) cost of uncorrected problems and 5) cost of lost customers. The total systemapproach advocated in Figure 1 provides a proactive means for achieving operational and strategic goals.
FIGURE 1 - COST OF QUALITY MODEL
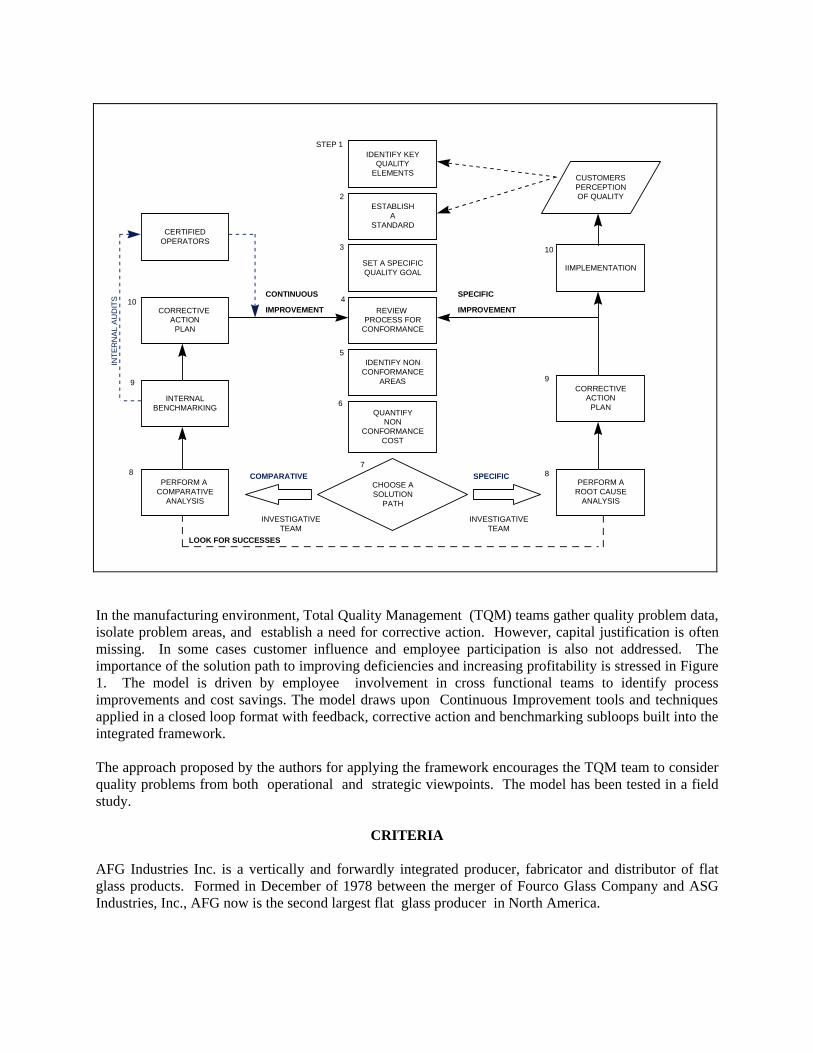
In the manufacturing environment, Total Quality Management (TQM) teams gather quality problem data,isolate problem areas, and establish a need for corrective action. However, capital justification is oftenmissing. In some cases customer influence and employee participation is also not addressed. Theimportance of the solution path to improving deficiencies and increasing profitability is stressed in Figure1. The model is driven by employee involvement in cross functional teams to identify processimprovements and cost savings. The model draws upon Continuous Improvement tools and techniquesapplied in a closed loop format with feedback, corrective action and benchmarking subloops built into theintegrated framework.
The approach proposed by the authors for applying the framework encourages the TQM team to considerquality problems from both operational and strategic viewpoints. The model has been tested in a fieldstudy.
CRITERIA
AFG Industries Inc. is a vertically and forwardly integrated producer, fabricator and distributor of flatglass products. Formed in December of 1978 between the merger of Fourco Glass Company and ASGIndustries, Inc., AFG now is the second largest flat glass producer in North America.
IDENTIFY KEYQUALITY
ELEMENTSCUSTOMERSPERCEPTIONOF QUALITY
CHOOSE ASOLUTION
PATH
ESTABLISHA
STANDARD
SET A SPECIFICQUALITY GOAL
REVIEW PROCESS FOR
CONFORMANCE
IDENTIFY NONCONFORMANCE
AREAS
QUANTIFYNON
CONFORMANCECOST
IIMPLEMENTATION
CORRECTIVEACTION
PLAN
PERFORM AROOT CAUSE
ANALYSIS
CERTIFIEDOPERATORS
CORRECTIVE ACTION
PLAN
INTERNALBENCHMARKING
PERFORM A COMPARATIVE
ANALYSIS
SPECIFICCOMPARATIVE
LOOK FOR SUCCESSES
CONTINUOUS
IMPROVEMENT
SPECIFIC
IMPROVEMENT
INVESTIGATIVETEAM
INVESTIGATIVETEAM
INT
ER
NA
L A
UD
ITS
STEP 1
2
3
4
5
6
78
9
8
9
10
10

Given the potential implications on manufacturing cost associated with product quality and customerservice, AFG invited the authors to apply the Cost of Quality model (Figure 1). The intent was toidentify the sources and contributing factors which can add to the cost of quality and determine theestimated cost of nonconformance to a manufacturing plant’s stated quality goals. Management’sconcern was not to label failures, but to call attention to the many opportunities for simultaneous qualityimprovement and cost reduction resulting in increased customer satisfaction and profitability. As a result,the authors developed objectives for the study: 1) Design a quality system that included concern for thecustomer; 2) Utilize the existing quality goals standards to gauge process performance and productquality; 3) Develop a set of metrics to quantify a nonconformance cost to the internal quality standards;and 4) Involve employees and utilize continuous improvement tools.
APPLYING THE PROPOSED MODEL
As a manufacturer , AFG is a quality conscious firm committed to the continuous quality improvementof products, processes and services. AFG’s management team has established quality goals for each ofthese manufacturing related activities. The standards for these goals are based on research, experienceand customer needs. The authors’ proposed framework allows management to quantify the impact ofchanges in these key quality indicators.
AFG considers manufacturing process goals to be the key to their quality commitment. The goals chart(Figure 2) lists examples of the manufacturing plant’s product, process and service goals.
FIGURE 2 - MANUFACTURING KEY QUALITY GOALS
These are identified as key “quality elements” in column 1. These elements can be subtitled “sources ofcost” to emphasize the economic impact of the stated quality goal. The chart lists the actual performance
QUALITY QUALITY GOAL ACTUAL VARIANCE COST of
ELEMENT STANDARD NONCONFORMANCE
(Manufacturing cost
I. PRODUCT per day )
A. Zero DefectsZero defects 0 0 0 $0
per shift / per day
II. PROCESS
B. Breaka ge loss must be 2.0 3.1 1.1 $2770 / day
</= 2.0%
III. SERVICE
C. On-time Scheduled deliv. 100 100 0 $0
Delivery on time 100 %
of the time.
Annualized Total Cost of Nonconformance: (Breaka ge) $ 1,011,050
versus goal by the plant for a specified time period. In this case, a sample month was used comparing the30 day average of results to the stated goal. The variance from goal is determined as well as itssubsequent cost, if any. This nonconformance cost is calculated and posted in terms of manufacturingcost per day and then annualized. The steps of the investigative and corrective action process are outlinedin the quality model framework as shown in Figure 1.
AFG management successfully implemented the model shown in Figure 1 to eliminate quality varianceand reduce cost. The model, or framework was also helpful in identifying a strategic direction linkingquality improvement to profits through cost savings and increased production efficiency. By design, themodel provides a mechanism for determining a return on quality investment. As a result, themethodology supplies a means for quantifying the cost of quality failures. In addition, cost reduction(s)realized from improvements, are translated into savings opportunities. The model is used to aggressivelymonitor quality related cost.
The cost of quality model (Figure 1) represents a total systems approach to quality improvement. Thesteps of the model implementation process have been presented using one key quality element as anexample. The actual case study performed by the authors included development of quantification metrics,variance identification, cost of nonconformance and corrective action plans for all of AFG’s key qualityelements (three examples shown in Figure 2). Upon successful completion of the analysis at one ofAFG’s manufacturing plants, the scope was changed by upper management to include all manufacturingfacilities.
This case study illustrates how the cost of quality model and open system perspective (Figure 1) can bestrategically and operationally applied. In this context, the proposed framework met AFG’s managementteam’s request to identify and list the sources and conditions which can add to the cost of quality. Also,the methodology to determine the estimated cost of nonconformance to the stated quality standards,guidelines, procedures and specifications was successfully applied. Results of the investigation revealedthat AFG’s manufacturing plant is very successful at producing a quality product. They consistently metmost of their quality goals. However, it is important to note the sensitivity in terms of variance from thestandards and the associated nonconformance cost for the sample parameter listed. Although seniormanagement suspected that opportunities existed for cost reduction, they were surprised at the magnitudeof the annualized impact of the associated nonconformance cost (Figure 2).
Based on the results of this investigation, the company decided to conduct cost of nonconformanceanalysis at all manufacturing facilities. In addition, the corrective action, feedback and employeeparticipation components of the author’s proposed total systems approach met upper management’scriteria for a new corporate quality policy.
CONCLUSION
The application of the Cost of Quality model (Figure 1) within a manufacturing environment provides asystematic, structured approach to quality problem identification and correction that focuses onunfavorable variances in operational performance. When the model’s open system philosophy isintegrated and applied with Continuous Improvement tools, a proactive managerial approach is achievedthat contributes to strategic effectiveness and operational efficiency. The approach provides AFG’sTQM teams, as well as all employees, a systematic way of viewing quality in the context of the totalorganization. While manufacturing was used to present a real world application of the proposedmethodology, AFG can extend this approach to other areas of the product based business environment.
The contribution of this study is twofold. First, a conceptual methodology has been developed anddescribed. Second, just as recognized by Shepherd [6], there are many undiscovered opportunities toconvert quality and process improvements into bottom line benefits. However, the details of theassessment of missed quality objectives and means for quantifying and implementing corrective actionwere previously missing. The research presented in this paper provides a significant step towardovercoming these difficulties and providing a total system implementation of the Cost of Quality.
REFERENCES
[1] Corradi, Peter R. “Is a Cost of Quality System for You?” National Productivity Review, 1990, 13(2),257-270.
[2] Rust, Kathleen G. “Measuring the Cost of Quality.” Management Accounting, 1995, 7(2), 33-37.[3] Schneiderman, Arthur M. “Optimum Quality Costs and Zero Defects: Are They Contradictory
Concepts?” Quality Progress, 1986, 19(11), 29.[4] Schonberger, Richard J. and Knod, Jr., Edward M. Operations Management (Fourth Edition).
Homewood, IL and Boston, MA: Richard D. Irwin, Inc., 1991.[5] Senge, Peter M. The Fifth Discipline (1st Edition). New York: Doubleday, Inc., 1990.[6] Shepherd, Nick. “Economics of Quality and Activity-Based Management: The Bridge to
Continuous Improvement.” CMA - The Management Accounting Magazine, 1995, 69(2), 29-32.
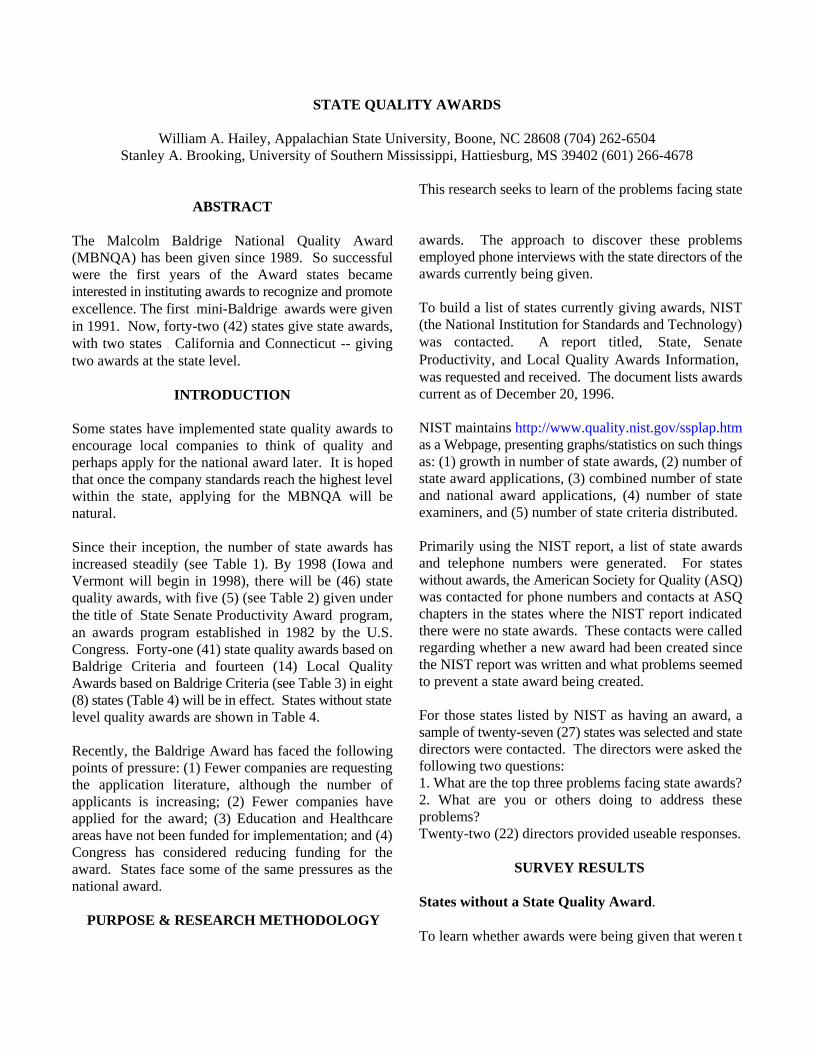
STATE QUALITY AWARDS
William A. Hailey, Appalachian State University, Boone, NC 28608 (704) 262-6504Stanley A. Brooking, University of Southern Mississippi, Hattiesburg, MS 39402 (601) 266-4678
ABSTRACT
The Malcolm Baldrige National Quality Award(MBNQA) has been given since 1989. So successfulwere the first years of the Award states becameinterested in instituting awards to recognize and promoteexcellence. The first mini-Baldrige awards were givenin 1991. Now, forty-two (42) states give state awards,with two states California and Connecticut -- givingtwo awards at the state level.
INTRODUCTION
Some states have implemented state quality awards toencourage local companies to think of quality andperhaps apply for the national award later. It is hopedthat once the company standards reach the highest levelwithin the state, applying for the MBNQA will benatural.
Since their inception, the number of state awards hasincreased steadily (see Table 1). By 1998 (Iowa andVermont will begin in 1998), there will be (46) statequality awards, with five (5) (see Table 2) given underthe title of State Senate Productivity Award program,an awards program established in 1982 by the U.S.Congress. Forty-one (41) state quality awards based onBaldrige Criteria and fourteen (14) Local QualityAwards based on Baldrige Criteria (see Table 3) in eight(8) states (Table 4) will be in effect. States without statelevel quality awards are shown in Table 4.
Recently, the Baldrige Award has faced the followingpoints of pressure: (1) Fewer companies are requestingthe application literature, although the number ofapplicants is increasing; (2) Fewer companies haveapplied for the award; (3) Education and Healthcareareas have not been funded for implementation; and (4)Congress has considered reducing funding for theaward. States face some of the same pressures as thenational award.
PURPOSE & RESEARCH METHODOLOGY
This research seeks to learn of the problems facing state
awards. The approach to discover these problemsemployed phone interviews with the state directors of theawards currently being given.
To build a list of states currently giving awards, NIST(the National Institution for Standards and Technology)was contacted. A report titled, State, SenateProductivity, and Local Quality Awards Information,was requested and received. The document lists awardscurrent as of December 20, 1996.
NIST maintains http://www.quality.nist.gov/ssplap.htmas a Webpage, presenting graphs/statistics on such thingsas: (1) growth in number of state awards, (2) number ofstate award applications, (3) combined number of stateand national award applications, (4) number of stateexaminers, and (5) number of state criteria distributed.
Primarily using the NIST report, a list of state awardsand telephone numbers were generated. For stateswithout awards, the American Society for Quality (ASQ)was contacted for phone numbers and contacts at ASQchapters in the states where the NIST report indicatedthere were no state awards. These contacts were calledregarding whether a new award had been created sincethe NIST report was written and what problems seemedto prevent a state award being created.
For those states listed by NIST as having an award, asample of twenty-seven (27) states was selected and statedirectors were contacted. The directors were asked thefollowing two questions:1. What are the top three problems facing state awards?2. What are you or others doing to address theseproblems?Twenty-two (22) directors provided useable responses.
SURVEY RESULTS
States without a State Quality Award.
To learn whether awards were being given that werent

listed in the NIST report, we attempted to locate anAmerican Society for quality (ASQ) chapter officer inthe state to verify that no award existed. Through this,we learned Kentucky began their award this year andIowa and Vermont will be offering an award in 1998. Several states are without ASQ sections thus we couldnot verify the lack of an award. Three problems seem toface those states that dont have an award: (1) Lack ofsupport by the governor, (2) financing and award, and(3) lack of ASQ chapter to generate initial support forthe award.
Problems Facing Directors of State Quality Awards.
State award directors were asked to identify the “topthree” problems facing their program. Table 5summarizes telephone conversations with 22 directors ofstate quality awards. The number of states providing thesame response is shown in parentheses.
Solutions Proposed.
State award directors were asked to identify measuresthey were using and/or planned to use to deal with their“top-three” problems. Table 6 summarizes solutionsproposed or now being used to deal with the aboveproblems.
SUMMARY
This paper presents the results of telephone interviewswith directors for state quality awards. Problems andpotential solutions are highlighted. Space limits, the listof potential solutions to the problems presented.
REFERENCES
Available on request from William A. Hailey
Table 1Growth in Number of State Award programs
Source: NIST report
Year 91 92 93 94 95 96
# Awards 8 12 19 29 37 42
Table 2States with Senate Productivity Awards
Alabama, California, Maryland, Nevada, andVirginia
Table 3States With Local Quality Awards
California (2), Michigan (1), North Carolina (1),Ohio (1), Pennsylvania (4), Tennessee (1), Texas (3),Washington (1)
Table 4States Without State Level Quality Awards
Alaska, Montana, North Dakota, Ohio, South Dakota,West Virginia, Wisconsin
Table 5“Top Three Problems” Identified byDirectors of State Quality Awards
(# of states with same responses in parentheses)
1. Obtaining long term funding. (15)2. Lack of public knowledge about the existence,purpose, and benefits of award.(10)3. Recruit and retain qualified examiners. (8)4. Increasing number of applicants. (7)5. Lack of administrative support. (5)6. Support lacking from business/political leaders. (2)7. Conflict between regional and state award and/orother state award. (2)8. Improving board. (1)9. Companies focus on ISO-9000 rather than TQM.(1)10. Keeping pool of applicants balanced betweenlarge/small and across various industries. (1)11. Expanding scope of award. (1)12. Quality of feedback provided applicants. (1)13. Training applicants to prepare self-assessmentreports. (1)14. Governor must approve criteria each year. (1)15. Valid criteria for health, education, andgovernment. (1)16. Maintaining rigor/motivation balance inapplication evaluation. (1)17. Changing mission from administering award tomission of educating business on value of award.(1)18. Getting business and political leaders in state toeffectively support program. (1)

Table 6Solutions Given by
Directors of State Quality Awards
• • 0• • • ò• • • • • 0• • • • • • • • • • • • •
• • 0• • • • • • • • • • • • • • • • °• • • +++

TRACK: Quantitative Theory and Methods
"" CCrr iimmiinnaall RReecciiddiivviissmm PPrr eeddiicctt iioonn UUssiinngg NNeeuurr aall NNeettwwoorr kkss""SSuussaann WW.. PPaallooccssaayy,, JJaammeess MMaaddiissoonn UUnniivveerrssii ttyyPPiinngg WWaanngg,, JJaammeess MMaaddiissoonn UUnniivveerrssii ttyyRRoobbeerrtt GG.. BBrrooookksshhii rree,, JJaammeess MMaaddiissoonn UUnniivveerrssii ttyyPPaammeellaa KK.. LLaattttiimmoorree,, NNaattiioonnaall IInnssttii ttuuttee ooff JJuussttiicceeJJooaannnnaa RR.. BBaakkeerr,, UUnniivveerrssii ttyy ooff NNoorrtthh CCaarrooll iinnaa -- CChhaarr lloottttee
"" DDii ff ffeerr eenntt iiaall EEvvoolluutt iioonn AAppppll iieedd ttoo tthhee TTwwoo GGrr oouupp CCllaassssii ff iiccaatt iioonn PPrr oobblleemm""PPaauull KK.. BBeerrggeeyy,, VVii rrggiinniiaa TTeecchh
“Issues in DSS Development for the Doe Hazardous Waste Cleanup Program” Laurence J. Moore, Virginia Tech
Tarun K. Sen, Virginia Tech
“A Sequential-Design Metamodeling Strategy Using Thin-Plate Splines For Multiobjective Simulation Optimization”
Anthony C. Keys, Marshall University, Huntington Loren Paul Rees, Virginia Polytechnic Institute and State University
"" SSiimmuullaatt iioonn:: AAnn AAppppll iiccaatt iioonn ttoo tthhee EEnnttrr eepprr eenneeuurr iiaall DDeecciissiioonn""MMoonncceeff BBeellhhaaddjjaall ii ,, NNoorrffoollkk SSttaattee UUnniivveerrssii ttyyBBeell GG.. RRaaggggaadd,, PPaaccee UUnniivveerrssii ttyy
CRIMINAL RECIDIVISM PREDICTION USING NEURAL NETWORKS
Susan W. Palocsay, Ping Wang, and Robert G. Brookshire, James Madison University,Harrisonburg, VA 22807
Pamela K. Lattimore, National Institute of Justice, Washington, DC 20531Joanna R. Baker, University of North Carolina at Charlotte, Charlotte, NC 28223
ABSTRACT
Prediction of criminal recidivism has been extensively studied in criminology with a variety of statisticalmodels. In this paper, we present the preliminary results from an empirical study of the classificationcapabilities of neural networks on a well-known recidivism data set. Our findings indicate that neuralnetwork models are competitive with and may offer some advantages over traditional statistical models inthis domain.
INTRODUCTION
The development of effective methods for predicting whether an individual released from prisoneventually returns or not is a major concern in criminology. A simple model for predicting paroleoutcomes was proposed as early as 1928 (Burgess), and was followed by the introduction of a variety ofstatistical models for classifying recidivists (Caulkins, et al., 1996). However, the performance of thesemodels has been considered weak, and researchers continue to look for new and/or improved predictivemethods.
Numerous studies have shown neural networks to be a viable alternative to conventional statistical modelsfor classification problems (see e.g., Sharda, 1994). Although multivariate statistical procedures are morecommonly used by social scientists, the use of neural network models for the analysis of social sciencedata is not a new application (Garson, 1991). We found reports on two studies in the literature thatspecifically address the problem of recidivism with neural networks.
In the most recent of these studies, Caulkins, et al. (1996) showed that, on a certain data set, neuralnetworks do not offer any improvements over multiple regression for predicting criminal recidivism.Additional analysis of their data set indicated that there was a lack of information in the predictorvariables that limited the performance of both models. In the other study, Brodzinski, Crable, and Scherer(1994) compared neural networks to discriminant analysis and obtained very impressive performanceresults on the test data (99% classification accuracy) with a neural network. However, they invested agreat deal of time and effort in developing the data sets for the study by using local court administratorsand probation officers to select the risk factors before carefully coding the data from case files.
Based on the recognized need for a robust model to aid in criminal justice decision-making, we believethat more research is needed to evaluate the potential contribution of neural networks. In this paper, weexamine the classification ability of neural networks in comparison to logistic regression for criminalrecidivism prediction. We obtained the same data set used by
Schmidt and Witte (1989, 1988) in the development of survival time models for analyzing the length oftime between release and return to prison. Then we performed a series of experiments with neuralnetworks on this data set and developed a neural network model that shows promising possibilities for

this problem. In this paper, we describe our study and present preliminary results obtained with neuralnetworks.
DATA
The data used by Schmidt and Witte (1989, 1988) for survival time analysis was obtained from the Inter-university Consortium for Political and Social Research (Schmidt & Witte, 1984). The Schmidt andWitte “split population” models estimate both the probability an individual returns to prison and theprobability distribution of the time until return for those who are expected to return. Note that we areonly addressing the problem of predicting whether or not a releasee eventually returns to prison in thispaper.
The criminal recidivism data originally contained information on a set of releasees from North Carolinaprisons: 9,457 individuals released from July 1, 1977 to June 30, 1978. For comparative purposes, weused the analysis and validation data sets in (Schmidt and Witte, 1984, 1989, 1988), where defective(130) and incomplete (4,709) records were removed, for neural network training and testing, respectively.A subset of the analysis data was randomly selected for monitoring the network training. The totalnumber of releasee records in each of these data sets is provided in Table 1.
For recidivism prediction, the output or dependent variable is equal to 1 if the individual returned to aNorth Carolina prison and equal to 0 if they did not. The input data consists of nine explanatory variablesas identified and defined in (Schmidt and Witte, 1984, 1989, 1988), where the sample sentence refers tothe prison sentence from which individuals were released. Six of the variables are coded as binary:WHITE indicates whether the individual is non-black (1) or black (0); ALCHY indicates whether theindividual had a past serious alcohol problem (1) or not (0); JUNKY indicates whether the individual hasa history of using hard drugs (1) or not (0); FELON indicates whether the sample sentence was for afelony (1) or misdemeanor (0); PROPTY indicates whether the sample sentence was for crime againstproperty (1) or not (0); MALE indicates whether the individual is male (1) or female (0). There are threenon-binary input variables: PRIORS is the number of previous incarcerations, not including the samplesentence; AGE is the age (in months) at the time of release; TSERVD is the time served (in months) forthe sample sentence.
NEURAL NETWORK MODEL DEVELOPMENT
The neural network model we selected for this study is the widely used multi-layer, feedforwardbackpropagation network. Nine input nodes corresponding to the nine explanatory variables in the dataare connected to a hidden layer of nodes. These, in turn, are connected to a single output node, whosevalue is used to classify the releasee as either an individual who returns to prison or one who does not.Logistic activation functions were used for all hidden and output nodes, and a linear scaling function wasapplied to the values of the non-binary input variables. All neural network models were built usingNeuroShell 2 from Ward Systems Group, Inc.
We initially trained the neural network model using a range of values for the learning rate and momentumparameters and several hidden layer sizes. Then we experimented with the TurboProp ™ option inNeuroShell 2. This is a proprietary method for updating network weights that dynamically adjusts thelearning rate and momentum during training. As a result, the user does not need to specify theseparameters. Turboprop TM training was relatively fast and consistently produced superior results, so allsubsequent training in our experiments was done with this method.
Next we created several versions of the original data where the age and time-served variables (AGE andTSERVD) were categorized so that the total number of input nodes was increased to either 13 or 14 and
all of the input values corresponding to these variables became binary. Our experiments with trainingneural networks on these data sets showed no improvement in performance on the test data.
After noting that the proportion of recidivists in the data is relatively small in comparison to theproportion of non-recidivists, we duplicated the records for recidivists in the training data. However, testresults were noticeably worse with networks trained on this data set. We also tested several differentactivation functions, including Gaussian functions, at the hidden layer, but this change did not improvethe model’s ability to predict recidivism on individuals in the test set.
Another set of experiments was performed to analyze the effects of different size data sets for monitoringthe network training process. Neuroshell 2 implements an option which creates an entirely separate set of“monitoring” data and uses it during training to evaluate how well the network is predicting. Neuroshell2 will automatically compute the optimum point to save the network based on its performance on thismonitoring data set. Several studies have provided strong support for this approach (Rumelhart, Widrow,and Lehr, 1994) to developing a neural network model with good generalization capabilities (see e.g.,Palocsay, et al., 1996, and Philipoom, Rees, and Wiegmann, 1994). We initially used a monitoring dataset that is approximately 12 percent of the size of the training set. Then we varied the size to 15 and 30percent to see if increasing the number of patterns in this set would improve the network’s performance.However, our observations indicated that, overall, the 10 percent set provided the best results.
EXPERIMENTAL RESULTS
After exploring the various training strategies described above, we focused on identifying the bestconfiguration for the neural network model. Using TurbopropTM training and the monitoring option inNeuroshell 2, we varied the number of nodes in the hidden layer from 5 to 50 and analyzed the trainingand test results for each network. For evaluation, individuals with neural network output values of 0.5 orgreater were predicted to be recidivists while those with values less than 0.5 were predicted to be non-recidivists. The results for all experiments were recorded in terms of the percentage of recidivistscorrectly classified as recidivists, the percentage of non-recidivists correctly classified as non-recidivists,and the total percentage of correct classifications.
Table 2 shows the results for training and testing for the ten best network configurations, based on overallaccuracy on the test data. Although the 39-hidden node network had the highest percentage of test setcorrect classifications (69.20%), the 26-node network performed almost as well (69.17% overall) with aconsiderably smaller network configuration. We selected this network for further experimentation.
Since the initial values for the weights on neural network connections are randomized, we trained the 26-hidden node network using fifty different random number seeds. The overall performance on the test setvaried from 66.44% to 69.23% with an average of 68.39%. The complete training and test results for theneural network with the highest percentage of correct classifications on the test set are reported in Table3. Schmidt and Witte (1989, 1988) found that the best split population model for this data was a logitlognormal model, where the probability of recidivism is assumed to follow a logit model and the timingof return is lognormally distributed. For comparison purposes, Table 3 also shows the results from fittinga logistic regression model to the combined training and monitoring data sets and using the coefficients topredict recidivism.
Table 4 presents measures of association which compare the ability of the 26-node neural network andlogistic regression to predict recidivism. The odds ratios (Reynolds, 1977) compare the odds of being arecidivist for those who were predicted to be recidivists versus those who were not. The odds ratio rangesfrom 0 to � with values close to one indicating no relationship, i.e., equivalent odds. Values higher than
one indicate more successful prediction. Yule’s Q (Reynolds, 1977) is a measure of association based onthe odds ratio which ranges between -1.00 and 1.00, with zero indicating no relationship and values closerto 1.00 indicating more successful prediction. Relative improvement over chance (RIOC, Loeber &Dishion, 1983), a measure frequently used in recidivism research, indicates “the percentage of personscorrectly predicted in relation to the maximum percentage of persons who could possibly have beencorrectly predicted” (Farrington and Loeber, 1989:202).
As Table 4 shows, although the logistic regression was slightly more successful in predicting recidivismin the training data, the neural network was more successful with the test data. Z tests for the differenceof two proportions show that the neural network had significantly higher overall proportion correct (Z =2.13, p<.05), and a significantly higher proportion correct among the recidivists (Z = 6.57, p<.05) for thetest data.
FUTURE RESEARCH
Our preliminary results provide support for further consideration of neural network models in the criminaljustice domain. We plan to repeat our neural network development procedures on a second, similar dataset containing information on 1980 releasees from North Carolina prisons which was also analyzed bySchmidt and Witte (1989, 1988). Then we will test the best-performing 1978 neural network model onthe 1980 test data, and vice versa. Additional statistical measures of predictive reliability, validity, anddifferences in proportions of successes will be performed. We are also interested in examining the effectof varying the 0.5 cutoff point on classification accuracy.
REFERENCES
[1] Brodzinski, J. D., Crable, E. A., and Scherer, R. F. 1994. Using Artificial Intelligence to ModelJuvenile Recidivism Patterns. Computers in Human Services. 10(4): 1-18.
[2] Burgess, E. W. 1928. Factors Determining Success or Failure on Parole. The Workings of theIndeterminate Sentence Law and the Parole System in Illinois. Illinois State Board of Parole,Springfield, Illinois.
[3] Caulkins, J., Cohen, J., Gorr, W., and Wei, J. 1996. Predicting Criminal Recidivism: AComparison of Neural Network Models with Statistical Methods. Journal of Criminal Justice.24(3): 227-240.
[4] Farrington, D. P. and Loeber, R. 1989. Relative improvement over chance (RIOC) and phi asmeasures of predictive efficiency and strength of association in 2x2 tables. Journal of QuantitativeCriminology. 5(3):201-213.
[5] Garson, G. D. 1991. A Comparison of Neural Network and Expert Systems Algorithms withCommon Multivariate Procedures for Analysis of Social Science Data. Social Science ComputerReview. 9(3): 399-434.
[6] Loeber, R. and Dishion, T. 1983. Early predictors of male delinquency: a review. PsychologicalBulletin. 94:68-99.
[7] Palocsay, S., Stevens, S., Brookshire, R., Sacco, W., Copes, W., Buckman, R., and Smith, J. 1996.Using Neural Networks for Trauma Outcome Evaluation. European Journal of OperationalResearch. 93(2): 369-386.

[8] Philipoom, P. R., Rees, L. P., and Wiegmann, L. 1994. Using Neural Networks to DetermineInternally-Set Due Date Assignments for Shop Scheduling. Decision Sciences. 25: 825-851.
[9] Reynolds, H. T. 1977. Analysis of Nominal Data. Beverly Hills: Sage Publications.
[10] Schmidt, P., and Witte, A. D. 1989. Predicting Criminal Recidivism Using “Split Population”Survival Time Models. Journal of Econometrics. 40: 141-159.
[11] Schmidt, P., and Witte, A. D. 1988. Predicting Recidivism Using Survival Models. Springer-Verlag, New York.
[12] Schmidt, P., and Witte, A.D. 1984. Predicting Recidivism in North Carolina, 1978 and 1980. ICPSRed. Ann Arbor, MI: Inter-university Consortium for Political and Social Research.
[13] Sharda, R. 1994. Neural Networks for the MS/OR Analyst: An Application Bibliography.Interfaces. 24(2): 116-130.
Table 1. Composition of data setsData set Total
recordsRecidivists/non-
recidivistsTraining 1357 505/852Monitoring 183 65/118Test 3078 1151/1927
Table 2. Results for different neural network configurationsTraining Results Test Results
Hiddennodes
Recidivist %correct
Non-recidivist% correct
Total %correct
Recidivist% correct
Non-recidivist% correct
Total %correct
39 35.79 87.42 68.31 37.97 87.86 69.2026 36.49 88.04 68.96 38.84 87.29 69.1720 35.26 89.28 69.29 37.97 87.65 69.0730 38.95 86.60 68.96 40.66 85.78 68.9133 37.02 87.01 68.51 39.88 86.25 68.9113 36.14 88.97 69.42 38.58 86.92 68.8429 34.56 89.90 69.42 35.10 88.89 68.7838 38.07 87.01 68.90 40.05 85.78 68.6828 39.47 85.57 68.51 41.96 84.59 68.6544 37.72 86.91 68.70 40.40 85.52 68.65
Table 3. Results for the best 26-hidden node neural network and logistic regressionTraining Results Test Results
Recidivist %correct
Non-recidivist% correct
Total %correct
Recidivist %correct
Non-recidivist% correct
Total %correct
26-Node NeuralNetwork
38.60 86.08 68.51 41.36 85.89 69.23
Logistic Regression 31.32 89.69 68.05 30.32 88.43 66.70

Table 4. Measures of association for neural network and logistic regression resultsTraining Results Test Results
RIOC OddsRatio
Yule’s Q RIOC Odds Ratio Yule’s Q
26-Node NeuralNetwork
.396 3.89 .591 .419 4.29 .622
Logistic Regression .415 3.95 .596 .377 3.33 .538
DIFFERENTIAL EVOLUTION APPLIED TO THE TWO GROUP CLASSIFICATIONPROBLEM
Paul K. Bergey, Virginia Polytechnic Institute and State University, Blacksburg, VA 24060
ABSTRACT
Genetic algorithms, despite their limited acceptance in the mainstream business community, have evolvedmuch like the biological organisms that they model. This research focuses on the application of arelatively new type of genetic algorithm known as Differential Evolution, to a well seasoned but simpleproblem, known as the two group classification problem. A brief description of the algorithm ispresented, followed by a simple example of how the fitness function is modified to address this new classof problems. Finally, the rule base used to determine if an observation is misclassified is discussed aswell as the method of evaluating the performance of the solution set from the output of the simulation run.
INTRODUCTION
Over the last three decades, the genetic algorithm (GA) has evolved into a variety of specialized andefficient solution deriving techniques. During the early stages of their development, GAs became knownfor their ability to solve large and complex combinatorial problems. More recent applications havesuccessfully applied a modified evolutionary strategey (ES) to the global optimization of some wellknown nonlinear and nonconvex systems, such as the DeJong test suite [Price, Storn, 1997]. Thistechnique, known as Differential Evolution (DE) combines simple arithmetic operators with the classicalevents of selection, mutation and recombination contained in nearly all GA’s to evolve the targetpopulation from its randomly generated starting point to the final solution. The use of arithmeticoperators avoids the mathematical complexity of prior ES’s which required high levels of computationaleffort in coding and evolving adjacent points in the solution space [Price, Storn, 1997]. The focus of thisresearch is to investigate the effectiveness of DE on the two group classification problem. A commontechnique to solving this problem is linear regression analysis using Fisher’s linear discriminant function,which has proven to be optimal under the assumptions of multivariate normality. The techniquesuggested in this research uses a modified objective function, which minimizes the squared error ofmisclassified observations, in evaluating the fitness of each chromosome in the population. The shape ofthe objective function evolves from a linear separating function to a sextic polynomial as the algorithmconverges to the optimal solution. The fitness of polynomial curves beyond the sixth order can beinvestigated with this technique, but the computational effort required is likely exceed the benefit gained[Koza, 1994]. The procedure involves a simulation optimization approach using multiple iterations thatconverge to solutions of varying polynomial order, which are then ultimately compared to determinewhich is the most fit.
DE BASICS
The taxonomy of DE is similar to many GA’s, in that it is comprised of arrays of evolving populations ofchromosomes which use natural selection, cell mutation, and genetic recombination to control theevolutionary process. The initial population of chromosomes is randomly generated as an array of size mby n cells where m represents the number of attributes contained in each chromosome and n representsthe number of chromosomes in the population. Each cell contains a quantitative measure for the attributeit represents as a floating point integer string. In this particular application, the values in the cellsrepresent the coefficients of the evolving polynomial functions. Please refer to Figure 1, which is asnapshot in time of an evolving population. Notice that the parent population contains 10 polynomial
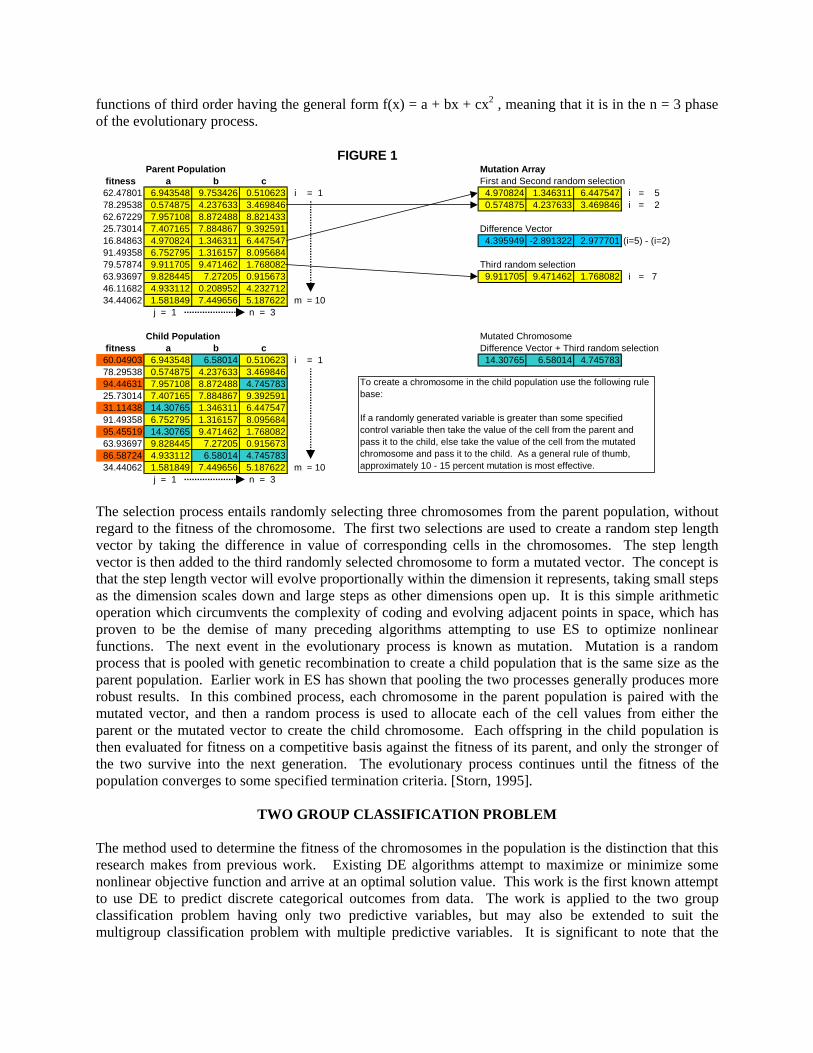
functions of third order having the general form f(x) = a + bx + cx2 , meaning that it is in the n = 3 phaseof the evolutionary process.
The selection process entails randomly selecting three chromosomes from the parent population, withoutregard to the fitness of the chromosome. The first two selections are used to create a random step lengthvector by taking the difference in value of corresponding cells in the chromosomes. The step lengthvector is then added to the third randomly selected chromosome to form a mutated vector. The concept isthat the step length vector will evolve proportionally within the dimension it represents, taking small stepsas the dimension scales down and large steps as other dimensions open up. It is this simple arithmeticoperation which circumvents the complexity of coding and evolving adjacent points in space, which hasproven to be the demise of many preceding algorithms attempting to use ES to optimize nonlinearfunctions. The next event in the evolutionary process is known as mutation. Mutation is a randomprocess that is pooled with genetic recombination to create a child population that is the same size as theparent population. Earlier work in ES has shown that pooling the two processes generally produces morerobust results. In this combined process, each chromosome in the parent population is paired with themutated vector, and then a random process is used to allocate each of the cell values from either theparent or the mutated vector to create the child chromosome. Each offspring in the child population isthen evaluated for fitness on a competitive basis against the fitness of its parent, and only the stronger ofthe two survive into the next generation. The evolutionary process continues until the fitness of thepopulation converges to some specified termination criteria. [Storn, 1995].
TWO GROUP CLASSIFICATION PROBLEM
The method used to determine the fitness of the chromosomes in the population is the distinction that thisresearch makes from previous work. Existing DE algorithms attempt to maximize or minimize somenonlinear objective function and arrive at an optimal solution value. This work is the first known attemptto use DE to predict discrete categorical outcomes from data. The work is applied to the two groupclassification problem having only two predictive variables, but may also be extended to suit themultigroup classification problem with multiple predictive variables. It is significant to note that the
FIGURE 1Parent Population Mutation Array
fitness a b c First and Second random selection62.47801 6.943548 9.753426 0.510623 i = 1 4.970824 1.346311 6.447547 i = 578.29538 0.574875 4.237633 3.469846 0.574875 4.237633 3.469846 i = 262.67229 7.957108 8.872488 8.82143325.73014 7.407165 7.884867 9.392591 Difference Vector16.84863 4.970824 1.346311 6.447547 4.395949 -2.891322 2.977701 (i=5) - (i=2)91.49358 6.752795 1.316157 8.09568479.57874 9.911705 9.471462 1.768082 Third random selection63.93697 9.828445 7.27205 0.915673 9.911705 9.471462 1.768082 i = 746.11682 4.933112 0.208952 4.23271234.44062 1.581849 7.449656 5.187622 m = 10
j = 1 n = 3
Child Population Mutated Chromosome fitness a b c Difference Vector + Third random selection60.04903 6.943548 6.58014 0.510623 i = 1 14.30765 6.58014 4.74578378.29538 0.574875 4.237633 3.46984694.44631 7.957108 8.872488 4.74578325.73014 7.407165 7.884867 9.39259131.11438 14.30765 1.346311 6.44754791.49358 6.752795 1.316157 8.09568495.45519 14.30765 9.471462 1.76808263.93697 9.828445 7.27205 0.91567386.58724 4.933112 6.58014 4.74578334.44062 1.581849 7.449656 5.187622 m = 10
j = 1 n = 3
To create a chromosome in the child population use the following rule base:
If a randomly generated variable is greater than some specified control variable then take the value of the cell from the parent and pass it to the child, else take the value of the cell from the mutated chromosome and pass it to the child. As a general rule of thumb, approximately 10 - 15 percent mutation is most effective.
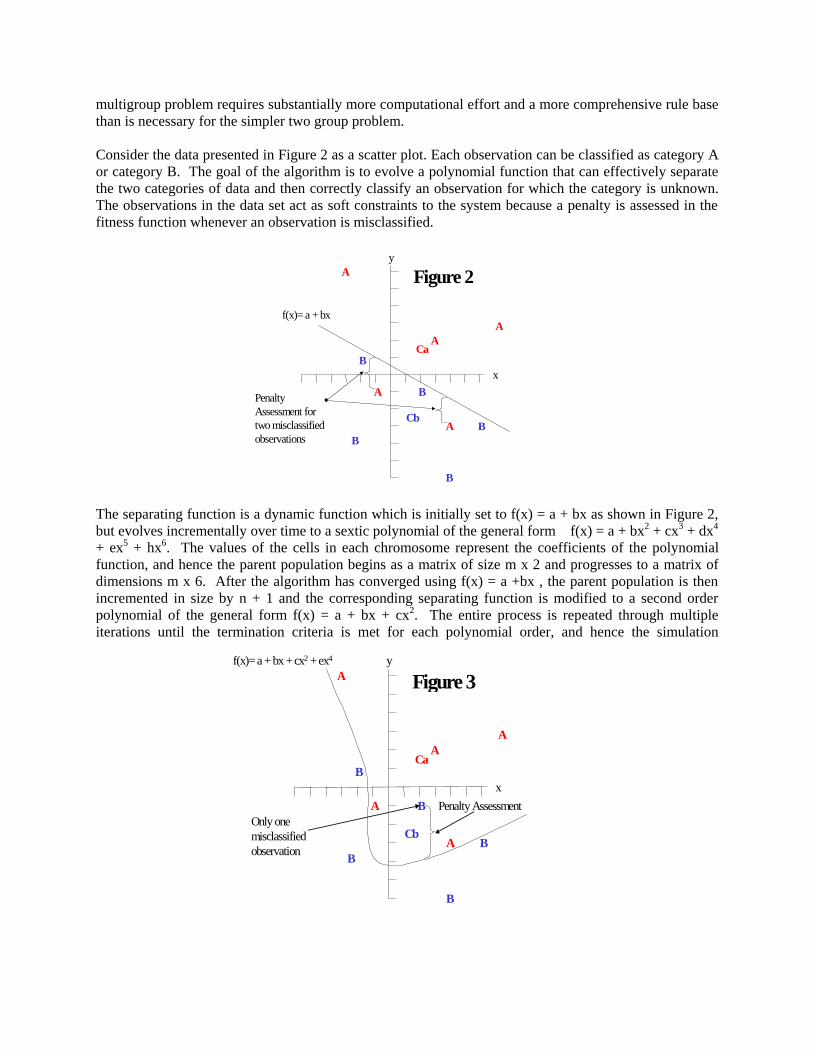
multigroup problem requires substantially more computational effort and a more comprehensive rule basethan is necessary for the simpler two group problem.
Consider the data presented in Figure 2 as a scatter plot. Each observation can be classified as category Aor category B. The goal of the algorithm is to evolve a polynomial function that can effectively separatethe two categories of data and then correctly classify an observation for which the category is unknown.The observations in the data set act as soft constraints to the system because a penalty is assessed in thefitness function whenever an observation is misclassified.
The separating function is a dynamic function which is initially set to f(x) = a + bx as shown in Figure 2,but evolves incrementally over time to a sextic polynomial of the general form f(x) = a + bx2 + cx3 + dx4
+ ex5 + hx6. The values of the cells in each chromosome represent the coefficients of the polynomialfunction, and hence the parent population begins as a matrix of size m x 2 and progresses to a matrix ofdimensions m x 6. After the algorithm has converged using f(x) = a +bx , the parent population is thenincremented in size by n + 1 and the corresponding separating function is modified to a second orderpolynomial of the general form f(x) = a + bx + cx2. The entire process is repeated through multipleiterations until the termination criteria is met for each polynomial order, and hence the simulation
y
x
B
A
A
B
A
B
A
B
ACa
Cb
B
f(x)= a + bx
PenaltyAssessment fortwo misclassifiedobservations
Figure 2
y
x
B
A
A
B
A
B
A
B
ACa
Cb
BOnly onemisclassifiedobservation
f(x)= a + bx + cx2 + ex4
Penalty Assessment
Figure 3

optimization nature of this algorithm. Note in Figure 3, that a higher order polynomial function yieldsfewer misclassified observations for this data set.
The algorithm begins by locating the first moment of each category of data, which is also known as thecentroid or center of mass. The centroid is used initially to orient the data on the coordinate axis systemsuch that the vertical distance between the two centroids is maximized. This condition facilitates the rulebase used to determine if a given observation is misclassified. The fitness function is then used todetermine the suitability of each chromosome in the evolving populations by summing the squared errorsof all the misclassified observations with respect to the separating functions that they define. If allobservations are properly classified by the function, then the penalty assessed by the fitness function iszero as in Figure 4.
The fitness of each chromosome is evaluated in the following manner:Given a function f(x) and centroids CA and CB:
if CyA > Cy
B
then for any xiA f(x) < yi
A If this condition is true for observation i then di = 0and for any xi
B f(x) > yiB If this condition is false for observation i then di = 1
if CyA < Cy
B
then for any xiA f(x) > yi
A If this condition is true for observation i then di = 0and for any xi
B f(x) < yiB If this condition is false for observation i then di = 1
where:CA is the Centroid for category A’s observationsCB is the Centroid for category B’s observationsCy
A is the y component of CA
CyB is the y component of CB
xiA is the x component of the ith observation in category A
yiA is the y component of the corresponding observation in category A
xiB is the x component of the ith observation in category B
yiB is the y component of the corresponding observation in category
y
x
B
A
A
B
A
B
A
B
ACa
Cb
B
f(x)= a + bx + cx2 + dx3 + ex4 + hx5
Zeromisclassifiedobservations
Figure 4

The result of the above evaluation is:
di = 0 when an observation is correctly classifieddi = 1 when an observation is misclassified
m
g(x) = � di * s (1)
i = 1
s = (f(xi) – yI)2 (2)
where:g(x) is the fitness functionf(x) is the separating function
s is the magnitude of the penalty assessment
EVALUATION
The final output of the simulation leaves the modeler with a family of solutions of increasing polynomialorder from which to select a subset to be considered further. The subset of solutions is selected basedupon a combination of fitness score and polynomial order. The solution subset is then tested with a holdout data set to determine the accuracy of each polynomial function in the solution subset. Using theperformance data, the fittest of the polynomial functions is selected as the forecasting model forcategorical predictions.
REFERENCES
[1] Price, K. and Storn, R. “Differential Evolution.” Dr. Dobbs Journal, April, 1997, pp. 18-24.[2] Koza, J.R. Genetic Programming II. Cambridge, Mass.:MIT Press, 1994.
SIMULATION: AN APPLICATION TO THE ENTREPRENEURIAL DECISION
Moncef Belhadjali, Norfolk State University, Norfolk, VA 23504, [email protected] G. Raggad, PACE University, Pleasentville, NY 10570, [email protected]
ABSTRACT
Entrepreneurship theory requires empirical research that enable it to grow. The literature offers a number ofapproaches to the phenomenon, but still lacks an organized knowledge-base. We analyzed data obtained througha survey of non-business school faculty as novice entrepreneurs. Using a sequence of cluster analysis and Monte Carlo simulation written in C++, we were able to determine the weights and priorities of the factors thatinfluence the entrepreneurial decision. Results showed that faculty, as novice entrepreneurs are risk averse andconsider environmental factors as more important than finances and personality.
INTRODUCTION
The entrepreneurship literature offers a number of approaches to the phenomenon. As an attempt at theorybuilding, authors rely on practice. Innovation is a key ingredient for the success of a new venture (Drucker,1985). Authors agree that the central question awaiting for an answer is: What are the factors that determine theoutcome of the entrepreneurial process (Bouchikhi, 1993; Bygrave 1993; Drucker, 1985; Morris & Sexton,1996; Sterns & Hills, 1996) ?
According to Drucker (1985) the practice of innovation is the knowledge base of entrepreneurship,entrepreneurs see change as an opportunity, successful entrepreneurs create a value and make a contribution.Bouchikhi (1993) suggests that the personality of the entrepreneur and the characteristics of the environmentdetermine the outcome, entrepreneurship is a complex interaction between the entrepreneur, the environment,chance events and prior performance. Entrepreneurs are those who perceive opportunities and createorganizations to pursue them (Bygrave and Hofer, 1991).
The entrepreneurial behavior is an innovation to satisfy a market need (Stern & Hills , 1996), a process ofcreating value by bringing together a unique package of resources to exploit an opportunity, an attitude of risk-taking and proactiveness (Morris & Sexton, 1996). A new venture growth is linked to social and professionalnetworking, initiation of contacts, frequency of communication (Ostgaard & Birley, 1996).
The literature recognizes some essential factors that may influence a new venture decision, these include capital,experienced entrepreneurs, skilled labor, accessible suppliers and customers, favorable government policies,proximity of universities, attractive living conditions.
METHOD
Sample
The research was based upon a sample of thirty five faculty members from schools other than the businessschool within the university. The subjects didn’t perform research in entrepreneurship, don’t own their ownbusiness, are interested in the concept of entrepreneurship, and can name at least two successful entrepreneurs.This is important because subjects know enough about entrepreneurship to qualify as novice entrepreneurs.
Collection

Data was gathered from faculty through a questionnaire including nine statements about three meta factors. Thestatements are organized based on a synthesis of the literature, especially the frameworks offered by Bouchikhi(1993) and Drucker (1985). The statements relate to (1) the entrepreneur’s personality, experience, and finances;(2) the change in the environment as it relates to consumer perceptions, success of similar ventures, newtechnology, and production process re-design; (3) the chance factor including unpredictable future events andthe entrepreneur’s ability to control them.
Measurement
The answers were acquired and measured through the Q-Sort tool of the Q-methodology often utilized insystems analysis. The subjects were instructed to read the statements and classify them according to the degreeof agreement/disagreement. The scores are measured on a scale from -2 to +2. Therefore the statement should beclassified as follows: one as a -2, two as a one, three as a 0, two as a +1, and one as a +2. This gives a total ofnine statements classified. In addition, subjects were asked to provide some thoughts about entrepreneurship ingeneral and the questionnaire in particular.
Analysis
The data for this study were analyzed in two steps using cluster analysis and simulation. The objective of thefirst step is to identify individuals who have a common attitude towards the nine statements. The analysisutilized all nine statements to provide an average which is a weight for each..
The second step utilized the clusters through a Monte Carlo simulation written in C++ to identify the most stablecluster. We utilized the weights of the statements as probability values, and performed three simulations on eachcluster. The number of runs were 1,000, 5,000, and 10,000.
RESULTS
TABLE 1. CLUSTERS AND FACTORS:WEIGHT IN % ; PRIORITY
FACTOR I II III IVPersonality 06;8 16;1 11;5 06;8Experience 17;1 16;1 19;1 12;4Finances 06;8 14;3 12;2 10;6Change(success)
12;4 06;9 12;2 05;9
Change(consumer)
10;6 09;6 10;7 10;6
Change(technology)
14;3 09;6 12;2 14;2
Change(redesign)
07;7 07;8 11;5 12;4
Chance(risk impact)
12;4 11;5 09;8 17;1
Chance(risk control)
16;2 12;4 04;9 14;2

Four clusters were obtained as shown in Table 1. The table shows, for each cluster the weight in percentage andthe priority of each factor. For the majority, experience of the entrepreneur is the most important factor thatinfluences the new venture decision. A surprising result is that the finances ranked last in cluster I and second incluster II. In cluster II, personality is the most important when it is the least important in clusters I and IV. Interms of risk attitude, the chance factor ranked last in cluster III and first cluster IV. These results may indicatethat other factors such as sex and risk attitude should be included in the analysis.
TABLE 2. NUMBER OF CHANGES IN FACTORS’ PRIORITIESAFTER THREE SIMULATION RUNS
FACTOR I II III IVPersonality 2 2 2 0Experience 0 0 0 1Finances 3 2 2 1Change(success)
2 2 1 0
Change(consumer)
0 2 0 2
Change(technology)
0 1 3 2
Change(redesign)
2 2 0 0
Chance(risk impact)
1 2 0 0
Chance(risk control)
0 2 0 1
TOTAL 10 15 8 7
TABLE 3. NOVICE ENTREPRENEURS’ PRIORITIES: CLUSTER IV
FACTOR PRIORITYChance(risk impact)
1
Chance(risk control)
2
Change(technology)
2
Change(redesign)
4
Experience 4Finances 6Change(consumer)
6
Personality 8Change(success)
9
The results of the sequence of simulations are summarized in Table 2. The table shows, for each cluster the

number of changes in the priority of each factor after the three simulation runs (1,000; 5,000; 10,000). Finally,the total number of changes within each cluster is shown. Cluster IV is the most stable since it has the lowestnumber of changes. This results indicates that faculty, as novice entrepreneurs are risk averse as shown in Table3.
SUMMARY
Some useful results for researchers and entrepreneurs emerge from our study. One of the areas that need to beexamined further is the relationship between risk attitude, gender and the success of the new venture. Futureresearch should use a larger sample of actual entrepreneurs to benefit a theory of entrepreneurship. Individualswho plan to start a new venture should put less emphasis on finances and perform a careful study of their abilityto control future environmental changes.
REFERENCES
[1] Bouchikhi, H. “A Constructive Framework for Understanding Entrepreneurship Performance.” OrganizationStudies, 1993, 14(4), 549-570.[2] Bygrave, W. “Theory Building in the Entrepreneurship Paradigm.” Journal of Business Venturing, 1993, 8,255-280.[3] Bygrave, W. and Hofer, C. “Theorizing About Entrepreneurship.” Entrepreneurship Theory and Practice,1991, 16(2), 13-22.[4] Drucker, P. Innovation and Entrepreneurship. New York: Harper, 1985.[5] Morris, M.H. and Sexton, D.L. “The Concept of Entrepreneurial Intensity: Implications for CompanyPerformance.” Journal of Business Research, 1996, 36, 5-13.[6] Ostgaard, T.A. and Birley, S. “New Venture Growth and Personal Networks.” Journal of Business Research,1996, 36, 37-50.[7] Sterns, T.M. and Hills, G.E. “Entrepreneurship and New Firm Development: A Definitional Introduction.”Journal of Business Research, 1996, 36, 1-4.
TRACK: Social and Ethical Issues
"" CChhaarr aacctteerr iisstt iiccss ooff II nntteerr nneett UUsseerr iinn EEaasstteerr nn KK eennttuucckkyy""EE.. SSoonnnnyy BBuuttlleerr,, EEaasstteerrnn KKeennttuucckkyy UUnniivveerrssii ttyySStteevveenn LLooyy,, EEaasstteerrnn KKeennttuucckkyy UUnniivveerrssii ttyy
"" II ssssuueess aanndd II mmppll iiccaatt iioonnss ffoorr TTrr aaiinniinngg II nntteerr nnss iinn EEtthhiiccss"" 444455PPaauull iinnee MMaaggeeee--EEggaann,, SStt.. JJoohhnn''ss UUnniivveerrssii ttyy
"" AAnn AApppprr ooaacchh ffoorr TTeeaacchhiinngg MM oorr aall ii ttyy vveerr ssuuss LL eeggaall ii ttyy aanndd EEtthhiiccaall RReellaatt iivviissmm""MMaarryy AA.. FFllaanniiggaann,, LLoonnggwwoooodd CCooll lleeggeeCCllaaii rree RR.. LLaaRRoocchhee,, LLoonnggwwoooodd CCooll lleeggeeWWii ll ll iiaamm PP.. BBrroowwnn,, LLoonnggwwoooodd CCooll lleeggee
"" CCoorr ppoorr aattee SSoocciiaall RReessppoonnssiibbii ll ii ttyy:: AA CCoommppaarr aatt iivvee AAnnaallyyssiiss ooff PPeerr cceepptt iioonnss ooff BBuussiinneessss SSttuuddeennttss iinn SSeeccuullaarraanndd NNoonn--SSeeccuullaarr II nnsstt ii ttuutt iioonnss""
JJoohhnn PP.. AAnnggeell iiddiiss,, SStt.. JJoohhnn''ss UUnniivveerrssii ttyyNNaabbii ll AA.. IIbbrraahhiimm,, AAuugguussttaa SSttaattee UUnniivveerrssii ttyy

Characteristics of Internet Users in Eastern Kentucky
E. Sonny Butler, Eastern Kentucky University, COB, Combs 212, Richmond, KY 40475Stephen Loy, Eastern Kentucky University, COB, Combs 212, Richmond, KY 40475
Abstract
The Internet? Is it Informational or just Chaos? It seems we have been inundated the past year with themost popular telecommunication buzzwords of the 90s, the Information Highway, the Internet, FTP, e-mail, and the World Wide Web (WWW). [1] Major changes are occurring in how people communicatewith each other--professionally, educationally, and personally. This movement has been created by therapid development of micro technology and the ability of people to afford the hardware and software toparticipate. This telecommunications revolution is just beginning, and now is the time for those of us ineducation to adapt to the change and direct the evolution of where we would like to see it grow andbenefit humankind. This article will offer some insight into the world of the Internet and who is using it inthe Eastern Kentucky area.
The Changing Nature of the Internet
The Internet is called a World Wide Web for good reason. This name appropriately describes the structureof the Internet as being a “network of networks.”[1] Over 100,000 networks, and still growing, areconnected to the Internet. For the most part one can think of the Internet as being a very high-speedhighway system, although it sometimes doesn’t seem so, that connects regions of the country and theworld. The long distance Internet connections are provided in the United States by five companies, eachof which leases lines from telecommunications carriers. Organizations build networks with individualusers desktop computers or workstations connected to regional carriers that transmit the information allover the world.
This information highway is revolutionizing communications more than any technology developed thusfar. Electronic documents and networks offer businesses the opportunity to improve their informationmanagement, office management, marketing management, service, and internal and externalcollaboration. Along the same line, education will never be the same. The Internet is going to give all ofus access to seemingly unlimited information, anytime, and anyplace we care to access and use it.However, because of opening the Internet to commercial use, many rapid changes are occurring makingrelevant useful information more difficult to access. Not only is it becoming more difficult to access bythose possessing adequate knowledge of the Internet, but increasingly more difficult by a segment of thepopulation in smaller communities without direct Internet connections.[2]
In the period of less than five years, the culture of the Internet has changed immensely. In the late 1980sprimarily scientists and engineers exchanging technical and scholarly information used the Internet.Gradually more and more universities came online, and this allowed for a free exchange of ideas amongeducators. This is changing. Now, anyone with a computer or access to a computer, the right software,and a modem can acquire access to the Internet. This is making information easier and faster to find andoffers the option of downloading it to your local disk to read and use at your discretion. Prior to the greatgrowth surge of users in the mid 90s, most universities that had Internet connections made their librariesavailable for searching and retrieving information. Now, many of these sites have been blocked due to thetremendous number of people logging into their nets thereby denying the tuition paying students frombeing able to log on and use the facilities.
The Internet is rapidly becoming commercialized as businesses use it to advertise their products and

services. The education industry is beginning to mirror the commercial world. It seems that everyone hasa home page and a presentation. Many, including educators, have a product to sell and desire maximumexposure. Therefore, we are experiencing a chaotic phase in the growth cycle.
Those of us wanting to use the Internet for educational purposes are beginning to find this to be anexercise in futility. In the Internet vernacular there are software programs called “search engines.”[2]They are programs used to assist us in the organizing and retrieving of information on the Internet.Although they were originally written by individuals to assist them in their searches, many have becomecommercial and they are growing rapidly. They use relevance ranking methodology to determine theorder of presentations on the Internet. This ranking method appears to put commercial offerings andpaid-for advertisements ahead of educational documents. You can do a keyword search on a fairlystraight forward keyword and not get back any relevant information through the first 30 presentations. Asthis problem grows, educators and students will need to become more sophisticated users, especially ifthey want to get the maximum benefit from a very powerful tool. [3]
The present chaotic nature of the Internet may be discouraging its use. A survey released January 12,1996 (CNN Internet Site) estimates that the number of Americans on the Internet doubled in 1995, to 9.5million users. However, this is only approximately 3 percent of the population of the United States. Many of these Internet users are short lived due to the frustrations they experience.
This survey found that the top two uses of the Internet today are e-mail and information gathering. Fewerpeople now use the Internet for purposes such as banking, file transfers, shopping, and newsgroups. Onthe average, users reported they use the Internet an average of 6.6 hours per week.
It appears that people look in fewer places than previously believed. Most Web users say that they havevisited fewer than 100 pages, total. Approximately 60 percent of Web users say that they visit fewer than10 sites on a regular basis (at least once a month). Last, the CNN study indicated that 75 percent of Webusers had found that Web sites were not available when they went to access them. This could be one ofthe primary reasons people are beginning to leave the Web.
Sophisticated information-handling skills are needed if we are to survive the infoglut and this widelyoverflowing cornucopia of information known as the Internet. Users must be selective in what they keepbecause to retrieve it again and again is only a few clicks away. Information sources and providers mustbe evaluated based upon their reputation and usefulness of the information they maintain and provide.This use to be the domain of the librarians and teachers; however, that is no longer the case. All of usmust be more careful and selective in the sites we visit and the information we retrieve and use if we areto use our time effectively. The best advice is to have a plan when seeking information on the Internet.[4]
Business educators can use the Internet for various applications if they are willing to weed through thechaos to get to useful information. To get a feel for the Internet users in the Eastern Kentucky area asurvey was constructed and administered to over 300 people throughout Eastern Kentucky. The purposeof the survey was to ascertain some of the characteristics of the Eastern Kentucky population using theInternet and to then compare these to a national population.
To identify the attitudes and usage of the Internet by residents of Eastern Kentucky a survey questionnairewas constructed to measure how, when, where, and how much the respondents access the Internet. Items1-20 are used to measure Internet usage patterns and practices, attitudes toward Internet service, InternetService Providers (ISPs), and e-mail uses. Items 21-49 were used to factor analyze responses to identifysocial attitudes toward the Internet and Internet issues, perceived usefulness of the Internet, perceivedease of use, access practices, level of Internet comfort and/or anxiety. Items 50-56 identify the
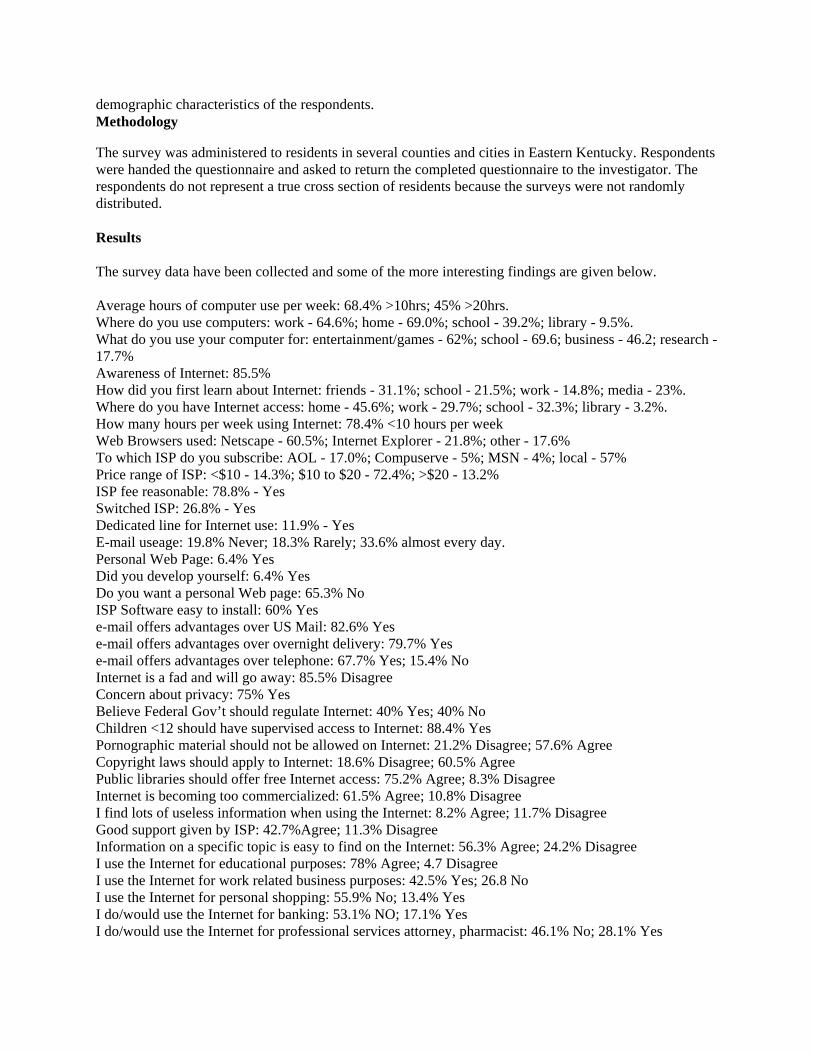
demographic characteristics of the respondents.Methodology
The survey was administered to residents in several counties and cities in Eastern Kentucky. Respondentswere handed the questionnaire and asked to return the completed questionnaire to the investigator. Therespondents do not represent a true cross section of residents because the surveys were not randomlydistributed.
Results
The survey data have been collected and some of the more interesting findings are given below.
Average hours of computer use per week: 68.4% >10hrs; 45% >20hrs.Where do you use computers: work - 64.6%; home - 69.0%; school - 39.2%; library - 9.5%.What do you use your computer for: entertainment/games - 62%; school - 69.6; business - 46.2; research -17.7%Awareness of Internet: 85.5%How did you first learn about Internet: friends - 31.1%; school - 21.5%; work - 14.8%; media - 23%.Where do you have Internet access: home - 45.6%; work - 29.7%; school - 32.3%; library - 3.2%.How many hours per week using Internet: 78.4% <10 hours per weekWeb Browsers used: Netscape - 60.5%; Internet Explorer - 21.8%; other - 17.6%To which ISP do you subscribe: AOL - 17.0%; Compuserve - 5%; MSN - 4%; local - 57%Price range of ISP: <$10 - 14.3%; $10 to $20 - 72.4%; >$20 - 13.2%ISP fee reasonable: 78.8% - YesSwitched ISP: 26.8% - YesDedicated line for Internet use: 11.9% - YesE-mail useage: 19.8% Never; 18.3% Rarely; 33.6% almost every day.Personal Web Page: 6.4% YesDid you develop yourself: 6.4% YesDo you want a personal Web page: 65.3% NoISP Software easy to install: 60% Yese-mail offers advantages over US Mail: 82.6% Yese-mail offers advantages over overnight delivery: 79.7% Yese-mail offers advantages over telephone: 67.7% Yes; 15.4% NoInternet is a fad and will go away: 85.5% DisagreeConcern about privacy: 75% YesBelieve Federal Gov’t should regulate Internet: 40% Yes; 40% NoChildren <12 should have supervised access to Internet: 88.4% YesPornographic material should not be allowed on Internet: 21.2% Disagree; 57.6% AgreeCopyright laws should apply to Internet: 18.6% Disagree; 60.5% AgreePublic libraries should offer free Internet access: 75.2% Agree; 8.3% DisagreeInternet is becoming too commercialized: 61.5% Agree; 10.8% DisagreeI find lots of useless information when using the Internet: 8.2% Agree; 11.7% DisagreeGood support given by ISP: 42.7%Agree; 11.3% DisagreeInformation on a specific topic is easy to find on the Internet: 56.3% Agree; 24.2% DisagreeI use the Internet for educational purposes: 78% Agree; 4.7 DisagreeI use the Internet for work related business purposes: 42.5% Yes; 26.8 NoI use the Internet for personal shopping: 55.9% No; 13.4% YesI do/would use the Internet for banking: 53.1% NO; 17.1% YesI do/would use the Internet for professional services attorney, pharmacist: 46.1% No; 28.1% Yes

Demographics
Gender: 43.6% Male; 55.8% FemaleAge: 29.9% - 18-25; 26.1% - 26-35; 22.9% - 36-45; 20.4% - 46-55; .6% - 56-65Education: .6% < 12 yrs; 15.9% =12yrs; 48.4% some college; 19.7% college grad; 15.3% postSize of city/town: 75.9% <75,000Primary occupation: 10.3% Blue collar; 34.8% white collar; 24.5% professional; 28.4% studentsRace/ethnic origin: 88.3% Caucasian; 3.9% African-American; .6% Hispanic; 3.9% Arab-American;1.7% American/Pacific IslanderIncome per year: 30.2% <$15,000; 20.1% $15,000 - $24,999; 27.5% $25,000-39,999; 16.8% $40,000-$70,000; 5.4% >$70,000.
Conclusions
There are some interesting findings in the study results such as the number of hours per week thatrespondents use their computers, about 70% use their computers over 10 hours per week with it beingsomewhat evenly divided between home and work. Over 85 % were aware of the Internet and 47% hadaccess to the Internet from their home. The most popular browser seems to be Netscape at 60.5% andMicrosoft Internet Explorer came in second with 21.8% of the users surveyed. AOL led the Internetservice providers with 17% followed by Compuserve at 5% and MSN with 4% of the surveyed market.Only 6.4% of the respondents have a personal web page with over 65% saying they did not want a webpage. Of interest is that 40% of the respondents were in favor of government regulation and 40% against.A majority feels the Internet is too commercialized although over 56% say information on specific topicsis easy to find on the Internet. The majority would not use the Internet for shopping, banking, or for theirprofessional needs such as attorney, pharmacist, etc.
The demographics were fairly evenly divided with 43.6% male and 55.8% female. Age, education, size oftown lived in, primary occupation, and income were all within what one might expect in a survey of thisnature. The specific numbers and percentages are given above.
What will be interesting to watch is the change in how people use and perceive the Internet over time. Ithink I am seeing some decline in the growth of users as is to be expected. Of particular interest was theinterest in using the Internet for professional services. This attitude toward technology will change as thispart of the state becomes more accustomed to computer technology.
References:
[1] Binning, B. (1996). Using e-mail, the Internet, and UNIX, Edmond, OK. The University of CentralOklahoma.
[2] Fitzgerald, J., Dennis, A. (1996). Business Data Communications and Networking, NY: John Wiley &Sons, Inc.
[3] Tally, B. & Brunner, C. (1995). The new literacy of the net. Electronic Learning, 15, (1), 14-15.
[4] Tomaiulol, N.G. & Packer, J.G. (1997, January 3). Quantitative Analysis of Five WWW “SearchEngines”. [On-line] Available http://neal.ctstateeu.edu:2001/htdocs/websearch.html.[5] MacLeod, L. & Butler, S. (1997). Internet Applications for Business Communications Classes:Searching Through Chaos to Find Useful Information. Southwestern Federation of AdministrativeDiscipline, 24th Annual Meeting, March 11-15, 1997.
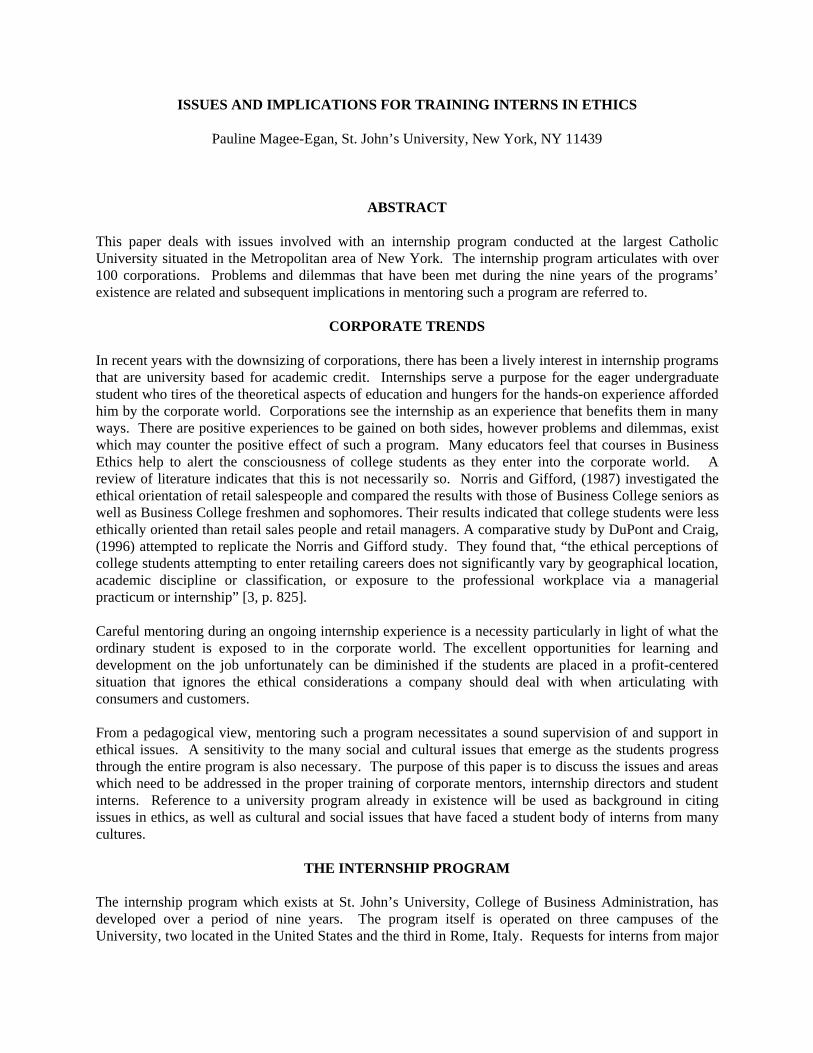
ISSUES AND IMPLICATIONS FOR TRAINING INTERNS IN ETHICS
Pauline Magee-Egan, St. John’s University, New York, NY 11439
ABSTRACT
This paper deals with issues involved with an internship program conducted at the largest CatholicUniversity situated in the Metropolitan area of New York. The internship program articulates with over100 corporations. Problems and dilemmas that have been met during the nine years of the programs’existence are related and subsequent implications in mentoring such a program are referred to.
CORPORATE TRENDS
In recent years with the downsizing of corporations, there has been a lively interest in internship programsthat are university based for academic credit. Internships serve a purpose for the eager undergraduatestudent who tires of the theoretical aspects of education and hungers for the hands-on experience affordedhim by the corporate world. Corporations see the internship as an experience that benefits them in manyways. There are positive experiences to be gained on both sides, however problems and dilemmas, existwhich may counter the positive effect of such a program. Many educators feel that courses in BusinessEthics help to alert the consciousness of college students as they enter into the corporate world. Areview of literature indicates that this is not necessarily so. Norris and Gifford, (1987) investigated theethical orientation of retail salespeople and compared the results with those of Business College seniors aswell as Business College freshmen and sophomores. Their results indicated that college students were lessethically oriented than retail sales people and retail managers. A comparative study by DuPont and Craig,(1996) attempted to replicate the Norris and Gifford study. They found that, “the ethical perceptions ofcollege students attempting to enter retailing careers does not significantly vary by geographical location,academic discipline or classification, or exposure to the professional workplace via a managerialpracticum or internship” [3, p. 825].
Careful mentoring during an ongoing internship experience is a necessity particularly in light of what theordinary student is exposed to in the corporate world. The excellent opportunities for learning anddevelopment on the job unfortunately can be diminished if the students are placed in a profit-centeredsituation that ignores the ethical considerations a company should deal with when articulating withconsumers and customers.
From a pedagogical view, mentoring such a program necessitates a sound supervision of and support inethical issues. A sensitivity to the many social and cultural issues that emerge as the students progressthrough the entire program is also necessary. The purpose of this paper is to discuss the issues and areaswhich need to be addressed in the proper training of corporate mentors, internship directors and studentinterns. Reference to a university program already in existence will be used as background in citingissues in ethics, as well as cultural and social issues that have faced a student body of interns from manycultures.
THE INTERNSHIP PROGRAM
The internship program which exists at St. John’s University, College of Business Administration, hasdeveloped over a period of nine years. The program itself is operated on three campuses of theUniversity, two located in the United States and the third in Rome, Italy. Requests for interns from major

corporations in the Greater New York region has grown to a field of over 100 corporations, national andinternational in nature. The internship program accommodates both U.S. and internationally basedstudents. The Corporations are issued an official guideline which exacts certain requirements:
1. For three credits in a given semester, each intern is required to work 135-160 hours within thecorporate setting under supervision
2. Interns are required to log the hours spent in the corporate setting3. Each intern is to be assigned a research oriented assignment4. A supervisory evaluation is to be submitted by the company to the Faculty member in charge of the
Internship Program
Student guidelines, distributed to potential candidates for the internship exact the following requirement:
1. Students must have a 3.0 general index with a 3.25 index in their major field of study.2. Students must commit themselves to an ongoing relationship with the company for the entire
semester with an average of sixteen hours a week at the corporate site.
Extensive articulation between the company and the University is required in each internship. Academicseminars are held once a month during the semester, monitored by the faculty member in charge of theinterns. Throughout any given semester the mentor is always available for individual student conferences.Final grades are computed by totaling the grade received on the research paper with the level ofevaluation given by the company supervisor of the interns.
Students who major in Accounting, Decision Sciences, Economics and Finance, Management andMarketing are specifically sought after and essentially groomed on the job.
The program has become an entrance into the “real world”. All majors are carefully placed to assure theproper fit between the company and the student.
From experiential background in this program, certain issues have emerged and have given rise to areas,which need to be considered in the proper training and mentoring of interns. It is apparently not enoughto give courses in ethics without following through on bridging the “ideal” with the real issues of thecorporation. Unfortunately, values in the corporate world are not as clear-cut and good judgment mustprevail. Students, because they are in a subordinate position, do not question actions but instead dealpassively with them because it is “accepted” behavior. Their consciousness must be aroused to questionwhether the behavior is ethical.
The main issue in dealing with interns is the fact that not all interns are alike. Interns come from alldifferent cultures and ethnic backgrounds, and as a result carry with them a pre-determined concept ofbusiness practice that is acceptable to their own culture. In dealing with such a diverse population, onecan only remark that a strange array of feelings regarding acceptable business practices has surfaced witheach intern assignment. It is of constant concern to the faculty member and advisor that certain standardsbe monitored in the general practice of interning. Student interns are quite vulnerable because they are inthe position of serving two masters, one, the corporate world which has accepted them as interns, andsecondly, the University which is attempting to monitor their experience.
One need not stray very far to determine, for example, that in the days of the Vietnam War, kickbacks,and paybacks were accepted in the Asian culture but non-acceptable in American business practice. Whatwas non-acceptable very soon became acceptable and was suddenly transformed into any business dealsmade with the Vietnamese. Instead of standing steadfast in our convictions, we transformed our value

system to what we met in the culture. In our own culture, ethics may be discussed, taught and expectedwhen students enter the corporate world but this is not necessarily so. A study with Harvard MBAgraduates by Badaracco [1] revealed that the graduates did not find that companies embodied the valuesthat the graduates had hoped to live by.
A mentor has a difficult job in identifying areas that are related to the field of ethics. The mentor is notphysically present at the internship experience and can only evaluate the experience as related by theintern. The intern is serving two masters, the corporation and the University. Placed in this situation, theintern may not receive the experience he is supposed to get as promised by the corporation to theUniversity. The response one receives from the intern is one of bitter disappointment and a feeling thatthey have been lied to by the corporation that promised an enriching experience.
One of the most grievous offenses that has been revealed of late has been in the investment community.It is not unusual for a young intern to request employment in an investment firm. Many brokers are onlytoo happy to accommodate their wish and to profit from this free help every semester. They continuallyattempt to use our interns for what they refer to as “cold calling” (This is a marketing activity, whichinvolves cold calls to prospects that may wish to invest). In reality and ethically, an intern cannot pose asa broker, yet they are consistently placed in a situation where if they indeed call a prospect, they may beasked questions which can only be answered by a licensed broker. Here, interns must be taught the fineline of what is ethical and legal. Normally an intern would attempt to please their broker rather than haveit reflect on the University.
In the merchandising community there have been frequent infractions that have been monitored andbrought to the interns’ attention. Mislabeling of items, incorrect inventories, and misleading advertising,are amongst many of the infractions and unethical practices to which interns have been exposed. Becauseof the student’s vulnerable position, the mentor or program administrator must constantly monitor orprotect the rights and ethical consciousness of the student.
Only in establishing a complete ongoing awareness of local practices in business with the interns will onebe able to alert, instruct, discuss and sensitize interns to the dangers of unethical business practices.
In Callahan and Bok’s book The Teaching of Ethics in Higher Education (1979) the authors present fivegoals in the teaching of ethics:
1. Stimulate the moral imagination2. Recognize the essence of ethical issues3. Develop analytical skills4. Elicit a sense of moral obligation and personal responsibility5. Learn to tolerate and resist disagreement
These goals can and should be adopted in mentoring an internship program. Raising the consciousness ofthe interns is of paramount importance. Each and every experience is different, but if the mentor canstimulate the moral conscience of the student, as he confronts his internship experience, he will haveprepared his students well for the realities of the corporate world.
REFERENCES
[1] Badaracco, J.L. Jr. “Business Ethics: A View From the Trenches.” California Management Review,Winter 1995, v37n2: 8-28.

[2] Callahan, D. and Bok, S. The Teaching of Ethics in Higher Education. The Hastings Center,Hastings-on-Hudson, 1979.
[3] DuPont, A. M. and Craig, J.S. “Does Management Experience Change the Ethical Perceptions ofRetail Professionals: A comparison of the Ethical Perceptions of Current Students with those ofRecent Graduates.” Journal of Business Ethics, 1996, 15: 815-826.
[4] Norris, D.G. and Gifford, J.B. “Ethical Attitudes of Retail Store Managers: A Longitudinal Analysis.”Journal of Retailing, 1987, 63, 298-311.

AN APPROACH FOR TEACHING MORALITY VERSUS LEGALITY AND ETHICALRELATIVISM
Claire R. LaRoche, Longwood College, Farmville, Virginia, 23909, 804-395-2366Mary A. Flanigan, Longwood College, Farmville, Virginia, 23909, 804-395-2364William P. Brown, Longwood College, Farmville, Virginia, 23909,804-395-2365
ABSTRACT
Two important areas of recent emphasis in business school curricula are ethics and an internationalperspective. This paper describes how the anti-bribery provisions of the Foreign Corrupt Practices Act of1977 (as amended in 1988) can be used to introduce two basic ethical concepts related to these targeted areas:legality versus morality, and ethical relativism.
INTRODUCTION
Many business school students seem to lack an understanding of two basic ethical concepts: legality versusmorality and ethical relativism. This is evident in the increasing number of students who appear to haveadopted the attitude of Milton Friedman’s famous quote: AThe business of business is business. This maximsuggests that business should be concerned only with providing goods and services and the maximization ofprofits and shareholder wealth. Business is viewed as amoral (as opposed to immoral): i.e., moralconsiderations are deemed inappropriate in the conduct of business. While most students acknowledge thatit is necessary for businesses to act within the confines of the law, many seem unable or unwilling todifferentiate between the legality and morality of actions, and thus fail to realize that legal compliance doesnot necessarily assure a positive moral posture. A logical extension of equating legality and morality isethical cultural relativism: if laws differ across countries then morality can differ across countries.
GOALS OF ETHICS INSTRUCTION
While there is considerable debate as to whether business courses can actually "teach" ethics, the authorsagree with Jones who argues that these courses “...can contribute to the moral development of students byalerting them to the ethical dimensions of economic decisions, legitimizing these ethical and social concernsin their minds, exposing them to alternative ethical theories, and giving them practice in informed moraldiscourse “ [6, p. 15]. In other words, as Jones continues, we can give them an intellectual weapon byproviding the "rationale, the ideas and the vocabulary of ethics along with some practice...." [p. 15]. To thosegoals, the authors add the objective of moving the student to higher stages of Kohlberg's moral reasoningmodel. Kohlberg describes the moral development of individuals as a series of levels, with each subsequentstage indicating a higher level of personal belief and conscience. The model, as described by Wood,Longenecker et. al. [1988], consists of three levels, each with two stages, as follows:1. Pre-conventional level:
Stage One: The reward and punishment stage. All persons begin here. We do what is right in order to avoidpunishment.
Stage Two: The individualism and reciprocity stage. We still act out of self-interest but recognize that otherpeople have their interests as well. Thus we enter into “deals” in order to secure our interests.
2. Conventional level:

Stage Three: The interpersonal conformity stage. Here we live up to what is expected of us by people closeto us (family, friends) or by society in general.
Stage Four: The law and order or social system stage. At this stage one meets one's obligations in order tokeep the system as a whole going. Morality is merely obeying the laws and rules of society.
3. Post-conventional level:
Stage Five: The social contract stage. At this stage one is concerned that laws and duties be based on rationalcalculation of overall utility, e.g., ‘the greatest good for the greatest number.’
Stage Six: The universal principles stage. At this stage one believes in the validity of such universal moralprinciples as justice, equality, and the dignity of all human beings, and has a sense of personal commitmentto them. Kohlberg says that very few people reach this stage. [10, p. 253]
According to Wood, Longenecker et al., Kohlberg stated that most people do not advance beyond stage fourof his scale, i.e. morality is merely obeying the laws and rules of society.
This paper will present a mini lesson plan that allows faculty to inject into business courses the rationale ofthe post-conventional levels by introducing the ethical concepts of legality versus morality and cultural ethicalrelativism while teaching the FCPA. The proposed lesson plan would be appropriate for use in manydifferent courses since the FCPA is a topic covered in several disciplines (Accounting, Marketing,Management, Business Law). The first section of the lesson presents the history and an overview of theForeign Corrupt Practices Act (FCPA). This is followed by a brief description of the major objections andcriticisms of the FCPA. The second section of the lesson plan compares and contrasts the concepts of legalityand morality, and introduces the concept of ethical cultural relativism. The final section of the plan discussesthe provisions of the FCPA in light of these two ethical concepts and extends the discussion to internationalbusiness to consider the impact of culture on moral judgments.
FOREIGN CORRUPT PRACTICES ACT
Legislative History
The Foreign Corrupt Practices Act (FCPA) was enacted in 1977 in the wake of the Watergate scandal. During the Watergate investigation of illegal political contributions, the Office of the Special Prosecutoruncovered secret slush funds used by U.S. corporations to make illicit payments to foreign officials [8, p.290]. In order to determine the extent of the problem, the Securities Exchange Commission (SEC) initiateda voluntary disclosure program whereby companies were encouraged to conduct in-house investigations todisclose material aspects of questionable activities. In a report to Congress, the SEC indicated that over 200companies admitted making questionable foreign payments totaling in excess of $300 million. One of themost devastating facts to emerge from this investigation was the extent to which these companies werefalsifying entries in their corporate books and records in an effort to conceal those payments [2, p. 2]. Thequestionable activities ranged from grease payments to government employees to ensure the performanceof ministerial duties, to bribing government officials to obtain contracts.
One of the most infamous examples is Lockheed’s payment of an estimated $22 million to Japanese officialsin connection with the sale of its Tristar L-1011 aircraft in Japan. There was widespread agreement in theU.S. that bribery is immoral, but prior to the passage of the FCPA, it was not a crime to bribe a foreign

official; thus, these payments per se were not illegal. However, under the securities regulations, the non-disclosure of such payments was illegal [6, p. 290]. The Lockheed incident was significant in buildingsupport for antibribery legislation because Congress and the Emergency Loan Guarantee board had providedLockheed with a $250 million loan guarantee to prevent bankruptcy and, presumably, some of this moneyhad been used to make these illicit payments [2, pp. 4-5]. After holding hearings on the matter, the consensusin Congress was that bribery of foreign officials is reprehensible and an antibribery law was needed to restorepublic faith in business.
Overview of the FCPA
In effect, the FCPA seeks to eliminate illicit corporate payments to foreign officials with a two-fold approach:
� The accounting provisions of the Act require a company to Amake and keep books, records, and accounts,that in reasonable detail, accurately and fairly reflect the transactions and dispositions [5]. Subsection13(b)(2)(B) of the Act requires that firms establish internal accounting controls to ensure slush funds cannotexist in the future [8, p. 291].
� The antibribery provisions of the act (Sections 103 and 104) prohibit a company from giving anything ofvalue to a foreign official, political party, or political candidate, to obtain or retain business. It is worth notingthat the amount of these payments need not be significant. Under the business purpose test, it is the purposeof the payment, not the amount, that determines the legality. In addition, a company may be held liable forthe actions of an authorized agent when the firm knows or has reason to know that a payment made by thatagent is illegal. This principle of law, referred to as the reason to know test, was included to prevent corporateofficers from looking the other way in order to circumvent the Act [S.E.C. v. Coffey, p. 1304]. Facilitatingor grease payments made to non-decision making clerical or ministerial officials to speed up paperwork werespecifically excluded from the FCPA. Grease payments are the norm when doing business in some parts ofthe world. In fact, foreign officials are often underpaid in the anticipation that they will receive suchpayments [9, p. 34].
The FCPA is sui generis -- a domestic criminal law applicable to acts committed outside the U.S. The actapplies to firms under the jurisdiction of the SEC. The Justice Department and the SEC have dualenforcement responsibilities. There are sizable penalties for violating the FCPA. For example, a personfound guilty of violating the bribery or accounting provisions could be fined up to $10,000 and/or receivea 5-year prison sentence. A corporation violating the accounting provisions could be fined up to $500,000and up to $1,000,000 for violating the antibribery provision. In addition, there could also be commercialconsequences. For example, an indictment for violating the FCPA could result in the suspension of an exportlicense [11, p. 1-6].
Amendments to FCPA
Dissatisfaction with the FCPA led to the adoption of the Omnibus Trade and Competitiveness Act (OTCA).Among other things, the 1988 amendments addressed criticisms leveled at grease payments and the difficultyof complying with the accounting provisions.
� Grease Payments. Grease Payments will be excluded from prosecution under the FCPA if made to obtainroutine government actions regardless of the type of official paid. The payments would be illegal if madeto obtain or retain business.
� Affirmative Defenses. A person accused of violating the FCPA may assert the affirmative defense that thepayment was legal under the written laws and regulations of that country. A second affirmative defense was
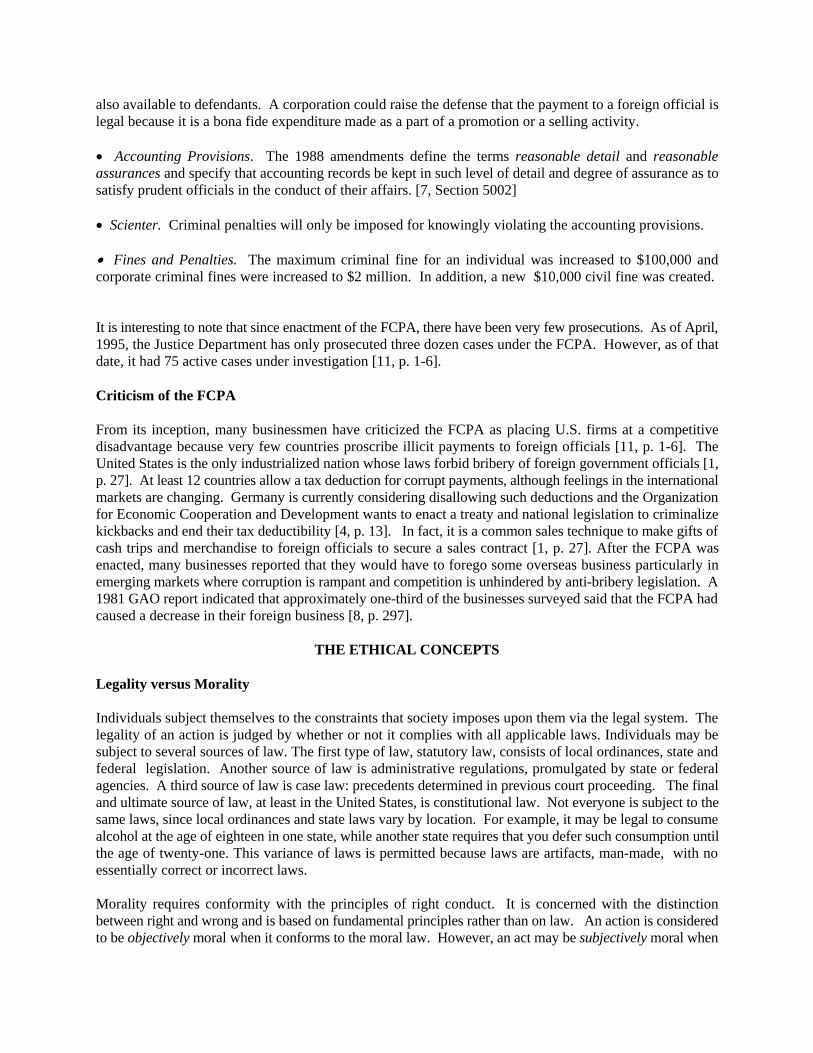
also available to defendants. A corporation could raise the defense that the payment to a foreign official islegal because it is a bona fide expenditure made as a part of a promotion or a selling activity.
� Accounting Provisions. The 1988 amendments define the terms reasonable detail and reasonableassurances and specify that accounting records be kept in such level of detail and degree of assurance as tosatisfy prudent officials in the conduct of their affairs. [7, Section 5002]
� Scienter. Criminal penalties will only be imposed for knowingly violating the accounting provisions.
� Fines and Penalties. The maximum criminal fine for an individual was increased to $100,000 andcorporate criminal fines were increased to $2 million. In addition, a new $10,000 civil fine was created.
It is interesting to note that since enactment of the FCPA, there have been very few prosecutions. As of April,1995, the Justice Department has only prosecuted three dozen cases under the FCPA. However, as of thatdate, it had 75 active cases under investigation [11, p. 1-6].
Criticism of the FCPA
From its inception, many businessmen have criticized the FCPA as placing U.S. firms at a competitivedisadvantage because very few countries proscribe illicit payments to foreign officials [11, p. 1-6]. TheUnited States is the only industrialized nation whose laws forbid bribery of foreign government officials [1,p. 27]. At least 12 countries allow a tax deduction for corrupt payments, although feelings in the internationalmarkets are changing. Germany is currently considering disallowing such deductions and the Organizationfor Economic Cooperation and Development wants to enact a treaty and national legislation to criminalizekickbacks and end their tax deductibility [4, p. 13]. In fact, it is a common sales technique to make gifts ofcash trips and merchandise to foreign officials to secure a sales contract [1, p. 27]. After the FCPA wasenacted, many businesses reported that they would have to forego some overseas business particularly inemerging markets where corruption is rampant and competition is unhindered by anti-bribery legislation. A1981 GAO report indicated that approximately one-third of the businesses surveyed said that the FCPA hadcaused a decrease in their foreign business [8, p. 297].
THE ETHICAL CONCEPTS
Legality versus Morality
Individuals subject themselves to the constraints that society imposes upon them via the legal system. Thelegality of an action is judged by whether or not it complies with all applicable laws. Individuals may besubject to several sources of law. The first type of law, statutory law, consists of local ordinances, state andfederal legislation. Another source of law is administrative regulations, promulgated by state or federalagencies. A third source of law is case law: precedents determined in previous court proceeding. The finaland ultimate source of law, at least in the United States, is constitutional law. Not everyone is subject to thesame laws, since local ordinances and state laws vary by location. For example, it may be legal to consumealcohol at the age of eighteen in one state, while another state requires that you defer such consumption untilthe age of twenty-one. This variance of laws is permitted because laws are artifacts, man-made, with noessentially correct or incorrect laws.
Morality requires conformity with the principles of right conduct. It is concerned with the distinctionbetween right and wrong and is based on fundamental principles rather than on law. An action is consideredto be objectively moral when it conforms to the moral law. However, an act may be subjectively moral when
the person believes the act is moral. It should be noted that the individual’s belief about the act does notnegate the morality or immorality of the act itself, rather only addresses the blame or culpability of theactions. We can objectively judge the morality of acts such as those of Hitler without knowing his beliefs. The denial of this objectivity of morality leads to a position of ethical relativism: if I consider the act to bemoral, it is [3].
Ethical relativism holds that two people or cultures may hold different views of what is moral and both beright. Proponents of this theory hold that cultural relativism applies to morals as well as other cultural areassuch as language. They argue that just as we can not say one culture’s language is correct while another’sis not, we can not say that one culture’s morality is correct and another’s is not. This position, however,does not stand up to scrutiny. If the culture or society determines what is moral, then moral ceases to be whatis right and becomes what is approved by society. Therefore, no two societies could argue about what ismoral, and no person within a society could differ with the moral norms of the society. And yet we do makemoral judgments about actions that we consider to be universal in nature. When we judge murder to bewrong, we deem it to be wrong everywhere. We judge the act objectively not subjectively. Differing culturalbeliefs about the morality of actions generally arise for two reasons: differing conditions within the societyand differing factual beliefs. For example, a society that believes in volcano gods may hold that murder inthe form of human sacrifice is moral [3].
Not everything that is legal is ethical and vice versa: dumping small amounts of toxic waste is legal but is itmoral? Furthermore, laws change over time. Slavery was legal in this country and while our subjectivejudgment about the morality may have changed, the objective morality has never changed. Conversely,consumption of alcohol was once illegal, but is it essentially immoral?
Morality and the FCPA
The provisions of the FCPA can be used to assist students in understanding the concepts of legality versusmorality and cultural relativism. After covering the provisions of the FCPA the lesson should discuss themorality of bribery itself. Most students will acknowledge that bribery is immoral. It does not produce thegreatest good for the greatest number of people but rather favors a few at the expense of others: the generalpublic and competitors. The instructor should then ask: If bribery is essentially wrong should our judgmentof the act be altered by the magnitude, purpose, or recipient of the bribe? Yet the FCPA stipulates that smallbribes, grease payments, are not illegal. Further, the act only addresses bribes of foreign governmentofficials. It is not equally immoral to bribe a member of a foreign corporation to obtain or retain business? Further, under the provisions of the act, only bribes to obtain or retain business are prohibited. Are notbribes to obtain political favor or curry influence, such as campaign donations, equally immoral? Finally,if bribery is immoral, is it not immoral in all societies, not just the United States?
[1] Bialos, Jeffrey P., Gregory Husisian, The Foreign Corrupt Practices Act: Coping With Corruption inTransitional Economies. 1st Edition, Dobbs Ferry, N.Y.: Oceana Publications, 1997.
[2] Cruver, Donald R., Complying With the Foreign Corrupt Practices Act. 1st Ed, Chicago: American BarAssociation, 1994.
[3] DeGeorge, Richard T., Business Ethics 3rd ed, New York, Macmillan, 1990.
[4] Financial Times, July 22, 1997.
[5] Foreign Corrupt Practices Act of 1977 (1977), Pub. L. No. 95-213, Title I, 91 Stat. 1494-1498, 15 U.S.C.Sections 77dd-I, 78dd-2.

[6] Jones, Thomas M. AEthics Education in Business: Theoretical Considerations. Organizational Behavior Teaching Review, 33(4) 1988-1989.
[7] Omnibus Trade and Competitiveness Act (1988), Pub. L. 100-418, 102 Stat. 1107, U.S.C.Sections 78dd-I,78dd-2. S.E.C. v. Coffey, 493 F 2d. 1304 (6th Cir.) (1974).
[8] Sheffet, Mary Jane, (1995) AThe Foreign Corrupt Practices Act and the Omnibus Trade andCompetitiveness Act of 1988: Did They Change Corporate Behavior?, Journal of Public Policy andMarketing, 14(2) (Fall).
[9] Singer, Andrew A., (1991) AEthics, Are Standards Lower Overseas?, Across the Board, (September), pp.31-34.
[10] Wood, J. A. J. G. Longenecker, J. A. McKinney, and C. W. Moore, AEthical Attitudes of Studentsand Business Professionals: A Study of Moral Reasoning. Journal of Business Ethics, 7( 4) April, 1988.
[11] Zarin, Don, Doing Business Under the Foreign Corrupt Practices Act, 1st Ed, New York: Practicing LawInstitute, 1995.
CORPORATE SOCIAL RESPONSIBILITY: A COMPARATIVE ANALYSIS OFPERCEPTIONS OF BUSINESS STUDENTS IN SECULAR AND NON-SECULAR
INSTITUTIONS
John P. Angelidis, St. John’s University, Jamaica, NY 11439, (718) 990-6495Nabil A. Ibrahim, Augusta State University, Augusta, Georgia 30904-2200, (706) 737-1562
ABSTRACT
Differences and similarities between business students in secular and non-secular universities with regardto their attitudes toward corporate social responsibility are examined. A total of 344 students enrolled atfive universities were surveyed. The results of a two-group discriminant analysis indicate that students innon-secular institutions exhibit greater concern about the legal component of corporate responsibility anda weaker orientation toward philanthropic endeavors.
INTRODUCTION
The notion that business firms should be attentive to the needs of a diverse group of constituents having aclaim on the organization has been the subject of vigorous debate for over two decades [2] [3] [19]. Thishas provoked an especially rich and diverse literature investigating the role of business in society.
One stream of research [28][16][14][18][21] has focused on the study of the corporate socialresponsibility orientation of business students. In addition to producing mixed results, a major weaknessof all of these studies is their “global” nature, i.e., treating the universities in which these students areenrolled alike as a homogeneous group. Also, most of the earlier investigations were conducted when thesocial responsibility of corporations was rarely examined in business school curricula. Furthermore, noprevious studies have explored differences among business students at different institutions. The presentstudy is designed to fill this void. Specifically, it seeks to determine whether differences exist betweenbusiness students of secular and non-secular universities in their final year prior to graduation.
METHODOLOGY
Sample
Data were collected as part of a larger cross-national study of corporate social responsibility. Thestudents in this study were undergraduate business students enrolled in sections of a strategic managementcourse in the last semester (or quarter) of their program. A total of 344 questionnaires were administeredto 139 students enrolled in two non-secular universities and 205 students attending three secularuniversities. Students were briefed on the importance of the study and told that the information wasstrictly confidential.
Measures
Each participant's corporate social responsibility orientation (CSRO) was measured with an instrumentdeveloped by Aupperle, Carroll, and Hatfield [4]. It is based on the four-part construct proposed byCarroll [9]. The instrument adopts a forced-choice format to minimize the social desirability ofresponses. Respondents are asked to allocate up to 10 points among four statements in each of severalsets of statements. Each of the four statements in a set represents a different underlying dimension ofCarroll's four components - economic, legal, ethical, and discretionary responsibilities.
The instrument used in this study contained 40 such statements. The mean of each respondent's scores oneach of the four dimensions was calculated to arrive at an individual's orientation toward each of the fourcomponents.
RESULTS
The analysis of the data was conducted in two stages. First, a two-group discriminant analysis wasconducted to determine whether or not differences exist between the two samples. We considered thisprocedure to be the most appropriate analytic technique for exploring differences in CSRO scores amongthe two samples. This procedure compensates for variable intercorrelation and provides an omnibus testof any multivariate effect. The discriminant analysis revealed significant differences between the twogroups (Wilks’ Lambda = 0.9630, 2 = 12.830, p = 0.0121). That is, the two groups exhibited differentcorporate social responsiveness orientations.
Next, to understand the underlying contributions of the variables to the significant multivariate effect, weproceeded to test each variable using a one-way ANOVA. These results show that differences betweenthe two groups were significant on two of the four variables. Specifically, the mean scores on theeconomic component were 2.83 for the secular universities’ sample and 2.67 for the non-secular group.Mean scores on the legal dimensions were 2.67 and 2.47, respectively. On the ethical dimension, thescores were 2.72 and 2.78, respectively. Finally, the students of secular institutions had a mean score of1.64 on the discretionary component while the mean score was 1.88 for the non-secular sample.
From the univariate ANOVAs, we see that important differences exist between the groups with respect tothe legal (F1,342 = 5.693, p = 0.0176) and discretionary (F1,342 = 9.235, p = 0.0026) components.Compared to business students in non-secular institutions, the students of secular universities exhibitgreater concern about the legal component of corporate responsibility and a weaker orientation towarddiscretionary activities. No significant differences between the two groups were observed with respect toeconomic performance (F1,342 = 2.441, p = 0.1191) and the ethical dimension (F1,342 = 0.5062, p = 0.4773).
DISCUSSION AND CONCLUSION
Across the country, the social responsibility of organizations has been one of the principal issuesconfronting business for more than two decades. However, recent revelations about outbreaks of ethicalfailings and questionable or abusive practices by corporations and executives, including the improper useof insider information and hazardous consumer products have prompted fresh concern over the societalimpact of corporate activities. One outcome of these developments has been greater concern withcorporate social responsibility in the business community [5] [6] [10] [20], in university education [17][26] [27], and in studies of executive decision making [1][12] [22].
Yet the empirical literature on corporate social responsibility has been limited by examining theorientation of mostly corporate upper echelons. Very few studies have examined the attitudes of businessstudents before they began their managerial careers. This study was designed to investigate this issue byexamining similarities and differences between students of secular and non-secular universities withrespect to their CSRO.
An interesting aspect of the present study is that it analyzed separately the four components of CSRO.The results reported here reveal that students enrolled in secular universities are more legally driven thantheir counterparts in non-secular universities. On the other hand, the latter are more philanthropicallyoriented than the former. Finally, the data indicate that both groups have similar orientations toward theeconomic and ethical dimensions of corporate responsibility.
Various explanations could be advanced for these results. With respect to the legal component, thisfinding is somewhat surprising given the current trends in American society. In the corporate world,numerous laws and extensive government regulation affect virtually every aspect of business activities.They touch "almost every business decision ranging from the production of goods and services to theirpackaging, distribution, marketing, and service" [8, p. 174]. In such an increasingly legalized businessenvironment, corporate executives as well as business professors and business students are fully aware ofsociety's criminal and civil sanctions. The impact of this knowledge on managerial attitudes and behaviorhas been widely discussed and documented in both the popular and academic literature [11] [13] [15] [25][30]. Also, the nation's business schools have continued to stress the importance of the legal andregulatory constraints on business in their instructional programs. For these reasons, additional researchwith larger samples would be necessary to confirm the finding that students in secular schools exhibitgreater concern for the economic interests of the firm.
Concerning the differences between the two groups with respect to the discretionary dimension, oneinterpretation is that non-secular institutions may be more involved in various community activities.Although anecdotal in nature, there is some evidence that these institutions strongly encourage students toengage in such endeavors. In some cases, these activities are required by professors as integral parts oftheir courses. Future studies should explore this issue to determine whether there are any differencesbetween the two types of institutions with respect to the emphasis placed on programs designed to assistothers in the community.
The similarities with respect to the economic and ethical dimensions may be reflecting a socializationprocess in business education that is imparting these values. The goal of such training is to develop theability to focus not only on the economic survival and wellbeing of the enterprise but to integrate aconcern for the welfare of others with an individual's managerial role [23]. This would support those whoargue that instruction that emphasizes the obligation of business to act for the social good sensitizesstudents to such issues [7] [24] [29].
Certainly, caveats must be offered regarding the conclusions generated by this research. Prudentinterpretation should be exercised given the exploratory nature of this research. Additional research withlarger samples from each group would be necessary to confirm these findings. In addition, this studyclearly is “correlational.” That is, the direction of the “causal” relationship should be explored further.For example, are students who are very interested in the discretionary dimension of social responsibilitymore inclined to enroll in non-secular institutions, or are these institutions more effective in impartingthese values to their students? Also, future longitudinal research that focuses on the measurement ofchange in students' CSRO after their graduation is needed. Nevertheless, this study offers an improvedunderstanding of differences and similarities among students attending secular and non-secularinstitutions.

REFERENCES
[1] Abratt, R. and D. Sacks. "The Marketing Challenge: Towards Profitable and SociallyResponsible," Journal of Business Ethics, 1988, 497-507.
[2] Anderson, J., Jr. "Social Responsibility and the Corporation," Business Horizons, July-August 1988,22-27.
[3] Andrews, K. R. "Directors' Responsibility for Corporate Strategy," Harvard Business Review,November-December 1980, 30.
[4] Aupperle, K. E., A. B. Carroll, and J. P. Hatfield. "An Empirical Examination of the RelationshipBetween Corporate Social Responsibility and Profitability," Academy of Management Journal,1985, 446-463.
[5] Baig, E. "America's Most Admired Corporations," Fortune, 1987, 18-31.[6] Berenheim, R. "An Outbreak of Ethics," Across the Board, May 1988, 14-19.[7] Bok, D. "Can Ethics be Taught?," Change, October 1986, 26-30.[8] Carroll, A. Business and Society, South-Western Publishing Company, Cincinnati, Ohio, 1989,[9] Carroll, A. "A Three Dimensional Conceptual Model of Corporate Social Performance," Academy
of Management Review, 1979, 497-505.[10] Conlin, K. "Business Schools with a Conscience," The New York Times, August 24, 1986, E7.[11] Fisher, A. "How to Cut Your Legal Costs," Fortune, April 23, 1990, 185-192.[12] Ford, R. and F. McLaughlin, "Perceptions of Socially Responsible Activities and Attitudes: A
Comparison of Business Deans and Corporate Chief Executives," Academy of ManagementJournal, 1984, 666-674.
[13] Galen, M. "Guilty! Too Many Lawyers and Too Much Litigation," Business Week, April 13, 1992,60-65.
[14] Goodman, C. and G. Crawford. "Young Executives: A Source of New Ethics?," PersonnelJournal, March 1974, 180-187.
[15] Heydinger, R. "Emerging Issues in Risk Management: The Opportunities are Changing," RiskManagement, September 1987, 60, 72-74.
[16] Hollon, C. and T. Ulrich. "Personal Business Ethics: Managers vs. Managers-to-be," SouthernBusiness Review, 1979, 17-22.
[17] Hosmer, L. "The Other 338: Why a Majority of our Schools of Business Administration do notOffer a Course in Business Ethics," Journal of Business, 1985,17-22.
[18] Ibrahim, N. And Angelidis, J. Corporate Social Responsibility: A Comparative Analysis ofPerceptions of Top Executives and Business Students,” The Mid-Atlantic Journal of Business,1993, 303-314.
[19] Kesner, I. F. and D. E. Dalton. "Boards of Directors and the Checks and (IPM) Balances ofCorporate Governance," Business Horizons, September-October 1986, 17-23.
[20] Lewin, T. "Young, Eager, and Indicted," The New York Times, June 2, 1986, 25.[21] Newstrom, J. and W. Ruch. "The Ethics of Business Students: Preparation for a Career," AACSB
Bulletin, April 1976, 21-29.[22] Posner, B. and W. Schmidt. "Values of the American Manager: An Update," California
Management Review, 1984, 206-216.[23] Powers, C. and D. Vogel Ethics in the Education of Business Managers, The Hastings Center: New
York, 1980.[24] Purcell, T. W. "Do Courses in Business Ethics Pay Off?," California Management Journal, 1977,
50-58.[25] Samuelson, S. "The Changing Relationship Between Managers and Lawyers," Business Horizons,
September-October 1990, 21-27.[26] Scott, W. and T. Mitchell. "The Moral Failure of Management Education," The Chronicle of Higher
Education, December 11, 1985, 35.

[27] Stead, B. and J. Miller. "Can Social Awareness be Increased through Business Curricula?," Journalof Business Ethics, 1988, 553-560.
[28] Stevens, G. "Ethical Inclinations of Tomorrow's Citizens: Actions Speak Louder?," Journal ofBusiness Education, 1984,147-152.
[29] Vogel, D. "Could an Ethics Course have kept Ivan from Going Bad?," The Wall Street Journal,1987, 24.
[30] Whitehill, A. "American Executives through Foreign Eyes," Business Horizons, May-June 1989,42-48.

TTRRAACCKK :: SSppeecciiaall SSeessssiioonnss
"" EEssttaabbll iisshhiinngg AA LL aann AAnndd AAllssoo AA WWeebb SSii ttee""JJ.. AArrtt GGoowwaann,, UUnniivveerrssii ttyy ooff NNoorrtthh CCaarrooll iinnaa -- WWii llmmiinnggttoonn
GGeeoorrggee SScchheell ll ,, UUnniivveerrssii ttyy ooff NNoorrtthh CCaarrooll iinnaa -- WWii llmmiinnggttoonn
"" MM aattcchhiinngg CCuurr rr iiccuulluumm AAnndd SSttrr uuccttuurr ee WWii tthhiinn AA CCooll lleeggee OOff BBuussiinneessss EEnnvvii rr oonnmmeenntt""RRoobbeerrtt DD.. RReeiidd,, JJaammeess MMaaddiissoonn UUnniivveerrssii ttyyJJooaannnnaa RR.. BBaakkeerr,, UUnniivveerrssii ttyy ooff NNoorrtthh CCaarrooll iinnaa -- CChhaarr llootttteeJJooyyccee WW.. GGuutthhrr iiee,, JJaammeess MMaaddiissoonn UUnniivveerrssii ttyy
"" OOrr ggaanniizzaatt iioonnaall VViissuuaall iizzaatt iioonn -- TThhee WWaavvee OOff TThhee FFuuttuurr ee:: AAnn AAppppll iiccaatt iioonn TToo TThhee CCaassee OOff TThhee BBii ll ll iinngg FFaaccttoorr yyAAtt AATT&& TT""
SStteevveenn EE.. MMaarrkkhhaamm,, VVii rrggiinniiaa TTeecchhCCaaddaa RR.. GGrroovvee,, AATT&&TT
ESTABLISHING A LAN AND ALSO A WEB SITE
J. Arthur Gowan, Jr., Univ. of North Carolina at Wilmington, Wilmington, N.C. 28403 (910) 962-3676George P. Schell, University of North Carolina at Wilmington, N.C. 28403 (910) 962-3675
ABSTRACT
The purpose of this article is to summarize a presentation on the development of a LAN to specificallysupport a web site in a university environment. References are made to processes used to develop a webserver at the authors’ business school. The first section approaches the technical issues associated withestablishing a LAN and describes a number of decisions which must be made. It provides a basicoverview of installing Windows-NT along with certain pitfalls to be avoided. The second sectionprovides more information about how a specific web site was created . The site is currently used toprovide students access to lecture notes and contains topical material of interest to visitors to the web site.The authors encourage others to establish sites of their own.
ESTABLISHING A LAN
The purpose of this section is to describe how a LAN server is established with specific reference to theprocess used in our School to establish a Windows NT Server. Initially its primary use was to provideWorld Wide Web (WWW) services to faculty who were interested in developing their own web pages.Since then some applications and files previously residing on a Novell server have been moved to the NT.Many of the following issues require decisions that may be addresses at the university or school level andyour degree of input may be limited. You may have sufficient funding to provide good technologysupport and you may only need to be assigned a folder or directory for your web page by your networkadministrator. On the other hand, you may need to write a grant to obtain funding for the first server inyour department or school and you and/or a cohort may be the one(s) completing the initial installation.The following is an abbreviated primer for the latter and may make others aware of the issues anddecisions that must be made in developing a LAN.
World Wide Web (WWW) Server Defined: A file server is a single computer that provides access tomultiple users. The files accessed may be data files, including HTML web files, or application files,therefore allowing for the sharing of software. Web services can be provided using a file server,dedicated to web services or shared with other file services. The World Wide Web is a series of fileservers providing web services with access through the Internet.
Operating System Choice: Most web servers today operate on either a UNIX, Windows NT, or Novellplatform. All support TCP/IP and can handle a relatively high volume of concurrent traffic. UNIX is theprimary choice among IT managers operating in a centralized computing environment while NT is moresuited to a distributed environment.[1] One advantage of the NT server is that its operating system runsin an environment that is isolated from its applications such that application crashes will not affect thestability of the network. The following will focus on establishing an NT-based web server, which we didwithin our business school. The primary reason was that our School is almost completely PC-based usingWindows95 and the University is migrating towards fewer Novell LANs and more NT-based LANs. Aprimary issue in choosing operating systems will be the skills of technical support as well as theinteroperability of existing systems. Additional pros and cons of each will be discussed.
NT Server Installation Issues:

Hardware requirements: Minimum requirements include: a 33MHz 80486 (Intel is recommended),minimum of 32 MB RAM, and 210 MB hard disk space. In addition a network adapter card connected toa hub, pointing device, VGA monitor, 3.5" floppy drive are required for installation. A CD-ROM isrecommended. These are minimum requirements for NT 3.51. A server-class machine is highlyrecommended. Select a line of servers that features a fast and wide path capable of meeting bandwidthdemands of additional and more powerful processors. Multiple processors are becoming the norm andadding processors to a symmetric-multiprocessing (SMP) system can reduce the occurrences of themessage “server unavailable”. [2] High-speed disk drives with sufficient room for disk swapping andlots of RAM will help ensure bottlenecks do not occur at your server. A rule of thumb for setting the NTswap file size is two time the amount of RAM.
Initial Hardware Configuration: Partitioned disk(s) with a DOS 6.x FAT partition to allow filemanipulation outside the NT OS (NTFS) is recommended. This can be done during the installationprocess. The FAT partition allows a back door to the NTFS partition which itself allows limited filemanipulation (like delete) due to NT security features. NT is typically provided on a CD-ROM. Ifinstalled from the CD, an appropriate NT driver for the CD will not be loaded and have to be installedlater. This can be avoided by copying the CD-ROM files to the FAT partition then installing NT from thehard drive, allowing for the CD-ROM to be detected and appropriate drivers installed along with the otherperipheral devices. Be sure to have a current NT driver for the CD-ROM.
NT Installation Process and Issues: An NT Installation Simulation [3] will be performed at thepresentation, providing step-by-step instructions with parallel discussion of technical and managementrelated issues. In general a custom installation should be chosen, yet minimal. It is best to keep thesystem installation as simple as possible. Additional devices can be configured after the system isinstalled and is stable. Configuring and installing printers and applications are recommended after theprimary installation. Only video, pointers, modem and CD-ROM should be installed. Any devices forwhich NT drivers, specifically NT, are not available, will often cause an incomplete or abortedinstallation. Be sure you have appropriate NT secondary storage device drivers at hand. The mostcommon problems are associated with SCSI devices. The latest NT drivers are typically available via theWWW at manufacturers’ sites. Be certain to have the latest versions.
Windows NT Server is designed to be scaleable, part of which provides the option of distributingnetworking administration, file access and applications to several servers. The potential servers include:a primary domain controller (PDC), a backup domain controller (BDC), and other servers including file,data base, e-mail and WWW. It is possible to install only the PDC, the true NT server, which isresponsible for the primary administration of the network (login and access control) and can be used asthe file and application server as well. As demand grows and performance wanes, a secondary domaincontroller can be added to reduce login processing by the PDC and files/applications can be moved fromthe primary domain controller to other file/application servers.
Installation: Installation is initialized from Disk #1 or its equivalent on the hard drive (WINNT). Theuser is guided through the option to format the NTFS partition for the NT File System (NT’s OS). TheNT files will be copied to a folder, the system will reboot.
NT Setup:
1. NT Licensing Modes: NT licenses can be purchased as a certain number per server or on a separate“seat” license. The charge for a license per “seat” incorporates a charge per workstation only for theserver(s) to which each has authority or access, which is typically the most economical where largenumbers of workstations are involved. For smaller settings with a set number of workstations, paying
for a maximum number of concurrent connections is better. For university applications, the firstapproach is typically used and does not limit the number of concurrent users.
2. Naming your server: You will need a unique name for your server , preferably one that users at theuniversity might recognize. No other servers on your university’s LAN can have the same name. Checkwith your university’s network administrator. Our server was named NTSERVER1 under the networkdomain name of CSB (Cameron School of Business). Notice the name of the server reflects theanticipation of adding/clustering additional NT servers in the future as demand grows.
3. Server type: If this is the first NT Server installation, it will be the primary domain controller (PDC).4. Administrator Password: The administrator has full access via a default account name
“ADMINISTRATOR”. In most university/school settings, this is a technical support staff member. It ishighly recommended that this person also establish his/her own personal account for use when notproviding administrative support functions.
5. Emergency Repair disk: An emergency repair disk should be created to allow for server access bybooting off the floppy should secondary storage devices fail. The disk can be created later by runningRDISK from NT Server.
6. Select Components: These include items such as “accessibility options”, “accessories”,“communications”, etc. Start with default components to reduce potential problems during installation.Remember, keep the installation as simple as possible.
7. Network Interface Card (NICs) Setup: Again, device drivers, including a current NT version for NICsmust be available. A choice of three protocols will also be made, including TCP/IP, NWLink IXP/SPX,and NetBeui. NetBeui is the default for Windows NT. As in other installation options, it is best to keepit simple during installation, choose NetBeui, and add TCP/IP after the installation is complete. TCP/IPwill have to be installed to support WWW services.
8. Network Services: Five network services are offered including Microsoft Internet Information Server (aWWW server), RPC (for running remote jobs under UNIX), NetBIOS (to support older DOS-basedapplications), and Workstation and Server to allow communication between workstations and the server.Again, minimizing complexity will help assure a complete installation. The last three are most oftenchosen.
9. Naming the Domain: The server was named previously. A domain name will be requested, whichshould describe the set of users (clients) and resources. If a university server it might be the name of theuniversity. But typically, universities will have many servers providing more localized support to aschool, department, or administrative areas. The domain name should represent that area of support.
NT Server Management:
With a primary focus of providing support for web-page development, NT Server managementrequirements primarily include establishing user accounts and write privileges to secondary storage forweb pages. Our directory structure consists of a folder called “Web pages”, and 2 sub-folders named“People” and “Departments”. Under “People”, any faculty or staff member who desire to create theirown home page are provided a folder , labeled their last name, and given read/write access. Departmentalpages have read/write access privileges assigned to the Department Chair. It is probably best to have anindividual responsible for a page, even if that person does not do the actual page development. Secondarystorage access to other constituents (students, student groups, etc.) are typically directed by policy at theuniversity level.
ESTABLISHING A WEB SITE
The purpose of this section is to describe how a web site was created to provide support materials forclasses I teach. The site always contains materials I use in courses such as lecture notes and containstopical material of interest to visitors to the web site. For example, some of the materials presented here

will be available at the web site until after Thanksgiving. There are many ways to set up a web site tosupport your teaching activities and they will probably be as varied as our teaching styles. By presentinghow I established my web site I hope to encourage others to establish sites of their own.
Decisions
The first decision concerning the web site is one that will probably be made by administrators. A website requires a computer to act as the web server, web server software, and access to telecommunications.Administrators need to determine if those resources will be made available at the university, school,department, or individual level. It will not matter where the resources are located as long as the instructorhas the ability to access the resource in order to put files on the web server; i.e. “write” authority for filesin the instructor’s subdirectory on the web server. The files contain the images, projects and coursedocuments. If the instructor must work through a third party, such as a technical support staff member,then he/she will lose the ability to quickly change the web site content.
People that visit your web site will do so with a variety of web browser software. The web serversoftware that hosts your site is not important to your web page’s content but may be important to theperson that will administer the web site server software. Different web server software may handle filetransfer protocol (FTP) differently and may handle e-mail accounts differently. Microsoft and Netscapeare the two most common vendors of web server software. Web page content can be handled by thesoftware from major vendors with very little differences among those vendors. E-mail, FTP, and usersecurity varies with both the web server software used and the operating system software for the computerrunning the web server software.
Most schools use Novell or Microsoft Windows NT network software on the network supporting thecomputer running the web server software. The web server software from Netscape and Microsoft isoffered free or at a drastically reduced price for educational institutions. Over the last several years theweb server software has become fairly simple to install. The first web server software package installedin the Cameron School of Business was WebSite from O’Reilly and Associates. It had the characteristicat the time of being the easiest web server software to install. Although many faculty members arecapable of installing the web server software I would suggest that it be installed by the person responsiblefor administering the computer network on which the computer hosting the web site will reside.
Organization and Authorization
Organization and authorization are two issues that need to be addressed jointly by the faculty and thecomputer/network resource staff member. Guidelines for authorization issues are generally set at auniversity level. For example, the University of North Carolina at Wilmington has a policy that all e-mailmessages originating from within the university must have the sender’s e-mail address as authorization.The method of enforcing that policy is to require e-mail to be sent (almost always) through a user accountthat requires a password to access the user account. There is a possibility of an ”open” computer in acomputer lab being used to send e-mail without requiring a user account password. However, since astudent i.d. is required to use the computer lab and since the student’s machine number and time arerecorded in a journal, it would be possible to place an individual student to any message originating fromthe computer labs on campus.
Most universities have policies and guidelines for content of web pages hosted on university resources.Most simply ask the person that develops the web page to make a link to the university home page orotherwise acknowledge that university resources are used to host the page. A comment that viewsexpressed at the web site are not the official views of the university is also a common requirement. It is

becoming common for universities to require each web page to have an e-mail link to the person thatdeveloped the page and a notice of the date the page was last modified. Your university may provide“boilerplate” code for your web page that already includes icons, headings, and required content.
Organization refers to the physical location on computer resources where the web page resides. Basicand/or common content is one aspect but the physical resource is another. Every web page has auniversal reference locator (URL) which specifies the location of computer that hosts the web page files.The web server software will specify which directory/subdirectory name is associated with that URL. Itis generally the responsibility of a staff member or administrator to organize the files on commoncomputing resources. In practice that means that the staff member or administrator can change the initialdirectory where the URL points. Next, the domain name server (DNS) should be notified. The DNS isthe master list of the computer and directory location for every URL and a master list (similar to a phonebook) is kept by every node of the internet that is a gateway for connection to the internet.
We have all tried to visit sites and received a message stating that the site was either not found or hadbeen moved. As demand for internet content at universities grows, universities often push the computerserver responsibility for hosting web sites to schools, departments, or individuals. Such a democraticapproach produces two problems. First, it becomes the responsibility of the school, department, orindividual to purchase and maintain the computing resources that host the web site. Second, and moreimportant, the specific directory and subdirectory on the computer where the URL points is frequentlychanged. This can cause unexpected confusion.
For example, at the beginning of the Fall 1997 semester the Cameron School of Business purchased amore powerful computer to host its web site. At the same time, with a growing number of faculty andstaff developing content for the web site, it was decided that a directory and subdirectory organizationmust be undertaken to reflect organizational changes in the school’s departments and staff. That changedthe directory location of all web page content. That meant that links from other resources now pointed tocomputer resources no longer available. The results can be quite far reaching since you never know howmany people have ‘bookmarked’ your resources or added them as links from other web pages. The mostserious problem we faced in the short term was that all notices for position openings that had been sent toprofessional organizations pointed to a URL that no longer existed.
Fortunately, you can keep your main address on the university’s web site and move the files with imagesand other materials to the computer resources of your school or department. The web page left on theuniversity’s web site is simply a pointer to the new location of your web files. Hypertext markuplanguage (HTML) contains a META command called REFRESH that acts as a “call-forwarding” feature.Whenever the URL for the computer resources hosting your web content pages changes you only have tochange the address in the REFRESH statement.
Suggested Content
Content at your web site should be driven by the underlying purpose of your site. The web site I maintainis primarily maintained for support of courses I currently teach. To that end, the organization of the site isgeared to the individual courses taught at a given semester. Also, I am aware that computer-basedassignments and materials must be in a format conducive to the computer resources available to the bulkof my students. One decision made by a campus-wide committee was that the Microsoft Office suite ofproducts would be available to students at all university computer labs. That decision drove the BusinessSchool to adopt a similar policy. In response, all of the materials used to support teaching of classes ismade available in format acceptable to Microsoft products.

University resources are generally constrained at some point and access to materials via a web site mustrecognize resource constraints. PowerPoint slides are developed as lecture notes for course I teach.These files were originally made available via my web site but I soon had to change that policy. First,students began printing out the PowerPoint slides in the computer labs and that required an unexpectedlylong delay for print jobs. More importantly, the PowerPoint presentations are fairly large and take aconsiderable amount of time for some students to download to their computer.
The PowerPoint slides of my chapter notes are converted to a word processing document (using theReport It feature of PowerPoint) and students access those files. Since the file are roughly 10% the sizeof the original PowerPoint slides they can be download to the student’s computer much faster. As a sidebenefit, word processing documents print much quicker in the computer labs than PowerPoint slides.
If you intend to make teaching materials available via a web site then I strongly recommend that youteach your students how to use the web browser supported by your school. Most often the web browserof choice is Netscape but Microsoft Internet Explorer is also popular. The most common sources ofproblems are “helpers” which are accessed (in Netscape) via the OPTIONS command followed by theGENERAL PREFERENCES command. Students need to be taught how to configure the students to launchcertain programs when they link to a file from your web site with the appropriate extension. For example,if the file extension is DOC then the web browser should know to launch Microsoft’s Word.
It requires considerably more effort to prepare for a course when some materials aree hosted on a web sitebut students receive a richer understanding of the topic. It also serves to require students to becomecompetent, not merely literate, concerning computer technology. This knowledge proves valuable tostudents in internships as well as their careers.
CONCLUSION
This article summarized the development of a LAN to specifically support a web site in a universityenvironment. Technical, organizational, and political issues that the authors viewed or experienced in thedevelopment of the LAN and the web site were discussed. The authors’ objective is to encourage others toestablish sites of their own.
REFERENCES
[1] Whiting, Rick, “Some Assembly Required”, Client /Server Computing, June, 1997, p.31-33.[2] King, Peggy, “Building Better Internet and Intranet Servers”, Bandwidth, December, 1996, p.12-16.[3] Paler, Michael J., Hands-On Microsoft Windows NT 4.0 Server with Projects, International
Thompson Publishing, Cambridge, MA.

MATCHING CURRICULUM AND STRUCTURE WITHIN A COLLEGE OF BUSINESSENVIRONMENT
Robert Reid, James Madison University, MSC 0207, Harrisonburg, VA 22807, 540.568.3252,[email protected]
Joanna Baker, University of North Carolina - Charlotte, MIS/OM Dept., Charlotte, NC 28223,704.547.2064, [email protected]
Joyce Guthrie, James Madison University, MSC 0201, Harrisonburg, VA 22807, 540.568.3255,[email protected]
ABSTRACT
Daily life in higher education is certainly changing. And it’s changing rapidly for all of us. While at one time wefocused our time and energies on teaching, scholarship and some service functions, we have faced new realities inrecent times. These new realities include such things as: increased accountability, assessment, value-addedactivities, faculty productivity, integration of curriculum, cross-functional team teaching, 360 evaluation systems,matrix organizational structures, post-tenure review, student support service systems and experiential learning.Are we in a position to lead, follow, or be swept away by the changes swirling around us?
OUTLINE OF PRESENTATION
1. Driving force behind changea) External factorsb) Internal factorsc) Inefficiencies in old structuresd) Integration of disciplinese) Major curriculum modifications
2. Resistance and barriers to changea) Facultyb) Staffc) Studentsd) Alumni
3. One model for changea) Faculty driven task forcesb) Old vs. new structurec) Strengths of the new structure
4. Student support service issuesa) Functionsb) Centralized vs. decentralizedc) Staffingd) Student, parent and corporate expectationse) Linkages to other campus support areas
5. Challenges associated with new structures and the external environment confronting higher educationa) Faculty activity planning and evaluationb) Promotion and tenure

c) Non-traditional faculty appointmentsd) Post-tenure review
Organizational Visualization – The Wave of the Future:An Application to the Case of the Billing Factory at AT&T
S.E. Markham, Department of Management, Virginia Tech, Blacksburg, VA 24061Cada Grove, AT&T CPOC, 295 N. Maple Avenue Room 6320G1,Basking Ridge, NJ 09920
In this special industry-academic joint session the billing factory for AT&T’s consumer business will beused to highlight the application of organizational visualization tools (cf. Markham, 1997, DecisionSciences, in press). The billing factory at AT&T is an extremely complex cyber-production environmentin which up to 100 million invoices per month can be calculated, rendered, printed, mailed and collected.As a major competitive tool, the billing function represents a relatively new feature since the 1983 Telcodivestiture. During the last two years its performance has dramatically improved as part of an ongoingquality initiative after helping to win the 1994 Malcolm Baldrige Award for the consumer side of thebusiness.
Within AT&T the monitoring organization, referred to as CPOC (Consumer Processes OperationsCenter), is charged with the real-time analysis of billing system performance with more than 250+ metricsbeing collected and processed daily in an Unix-NT client-server environment. As such, the sheer numberof data points coupled with the magnitude of the volume involved results in a highly complex scanningand analysis task for the CPOC monitoring managers. Therefore, as a methodology to (1) move awayfrom “rows & columns” spreadsheet reports and (2) match system metrics and measures with both workprocess flows and their originating organizational entity, the “Explore” tool set will be showcased as apreliminary application of organizational visualization principles. The presentation will also review thehistory of the billing factory and the impact of the quality initiatives as a context for the current work.

TRACK: Student Paper Competition
"" AA TTyyppoollooggyy ooff II nntteerr nneett CCoommmmeerr ccee SSii tteess""JJoohhnn OO''MMaall lleeyy,, VVii rrggiinniiaa TTeecchh
"" EEvvaalluuaatt iinngg tthhee II mmppaacctt ooff II nntteell ll iiggeenntt SScchheedduull iinngg SSyysstteemmss iinn aa CCoommppuutteerr --II nntteeggrr aatteedd MM aannuuffaaccttuurr iinnggEEnnvvii rr oonnmmeenntt""
AAmmyy BB.. WWoosszzcczzyynnsskkii ,, CClleemmssoonn UUnniivveerrssii ttyy
"" HHiieerr aarr cchhiiccaall SSyysstteemm CCoonnttrr ooll lleerr SSooff ttwwaarr ee DDeevveellooppmmeenntt ffoorr aa FFlleexxiibbllee MM aacchhiinniinngg aanndd AAsssseemmbbllyy SSyysstteemm""RRoobbeerrtt JJ.. MMccII llwwaaiinn,, VVii rrggiinniiaa TTeecchh
"" CCoonnttrr ooll ll iinngg tthhee AAtt tt ii ttuuddee ooff tthhee GGoooodd EEmmppllooyyeeeess vveerr ssuuss tthhee BBaadd EEmmppllooyyeeeess aanndd tthhee HHaacckkeerr ss TToowwaarr ddssII nntteerr nneett SSeeccuurr ii ttyy""
AAlleexxaannddeerr DD.. KKoorrzzyykk,, SSrr..,, VVii rrggiinniiaa CCoommmmoonnwweeaall tthh UUnniivveerrssii ttyy
"" AAnn II mmpplleemmeennttaatt iioonn ooff SSooff ttwwaarr ee AAggeennttss iinn aa DDeecciissiioonn SSuuppppoorr tt SSyysstteemm""TTrraaccii JJ.. HHeessss,, VVii rrggiinniiaa TTeecchh
EVALUATING THE IMPACT OF INTELLIGENT SCHEDULING SYSTEMS IN ACOMPUTER-INTEGRATED MANUFACTURING ENVIRONMENT
Amy B. Woszczynski, Clemson University, Department of Management, Clemson, SC 29634-1305
ABSTRACT
Previous research into AI techniques in manufacturing scheduling has concentrated on case studies orsimulated data to support possible scheduling improvements. This paper proposes a process to determinethe actual relationship between the type of scheduling system used and plant-level performance. Firmscurrently using intelligent scheduling systems will be compared to companies using traditional schedulingtechniques. The impact of potential moderating variables, top management support and user participation,and a mediating variable, actual usefulness, will also be examined.
INTRODUCTION
As artificial intelligence (AI) has become more understood and useful, researchers have begun to tout AIas a means to improve information systems. Although manufacturing has been slow to adopt these AItechniques, logic suggests that intelligent systems (defined as systems that can “learn” from pastexperience) can improve operations and more than recoup the investments required in systemdevelopment. In particular, AI in the computer-integrated manufacturing (CIM) environment offers thepotential to increase profits, due to the superior reasoning and learning capabilities of the AI systemsinstalled.
Scheduling systems attempt to plan production in a manufacturing environment to reduce setup times,maximize machine utilization, and assure production of quality goods at the right time and in the rightquantity. Intelligent scheduling systems which use techniques of AI, including neural networks (NNs) andgenetic algorithms, may perform significantly better than traditional systems, offering improved profitsand better customer service. In developing an architecture for intelligent scheduling, Hadavi, Hsu, Chen,& Lee (1992) identified specific scheduling objectives that intelligent systems should incorporate,including committed shipping dates of orders, lowered work-in-process (WIP), and reduction of leadtimes.
This proposal intends to capture the relationship between the type of scheduling system used (intelligentor traditional) and plant-level performance in a CIM environment. An examination of firms currentlyusing intelligent scheduling systems will be compared to companies using traditional schedulingtechniques. Research suggests that companies using intelligent scheduling techniques reap significantlymore benefits than those companies using traditional scheduling systems. The impact of potentialmoderating variables (top management support, user participation) and a mediating variable (actualusefulness) will also be examined.
The proposal is organized as follows. The next section provides a brief review of the relevant literature.This section leads to the objectives of the proposed research, including hypotheses to be tested andpresentation of the full model. Then the research design is discussed, along with proposed analysis ofresults.
THEORETICAL FOUNDATIONS
Traditional Scheduling Systems

Vollmann, Berry, & Whybark (1992) define a schedule as a plan that determines sequencing andallocation of time for each item or operation necessary to complete the item. Traditional schedulingresearch has typically studied manufacturing planning and control systems based on static / dynamicapproaches, single / multiple levels, due date setting procedures, and sequencing rules. Recent additionsto the literature include research into scheduling just-in-time systems, as well as theory of constraints.
Most research into the traditional systems has relied on simulated data to test the actual schedulingenvironment. Therefore, generalizations to “real-world” environments may be invalid. Moreover,traditional systems lack any reasoning capabilities. They solve problems generally off-line and not in realtime. Most schedule adjustments or changes must be manually entered into the system, increasing timerequired for development of schedules, as well as increasing the probability of mistakes. Finally, sinceschedulers often rely on intuition to make changes to schedules (McKay, Safayeni, & Buzacott, 1988), thescheduler may choose not to update schedules, instead making decisions on the floor in real time. Thispaper proposes a bridge to the gap that exists in the literature and directly compares traditional andintelligent scheduling systems.
Intelligent Scheduling Systems
Intelligent scheduling systems, as opposed to traditional systems, have the capability to learn fromprevious experiences. Moreover, the intelligent system functions well in a dynamic environment andmakes decisions on-line and in real time. Additionally, intelligent systems can capture scheduler intuitionor other fuzzy rules through the use of expert reasoning techniques. By capturing these heuristics, thesystem can provide more consistent results over time. Finally, as the environment changes, intelligentsystems change the scheduling rules to meet the evolving environment. For these reasons, I would expectintelligent scheduling systems to outperform traditional systems. Types of intelligent scheduling systemsinclude neural networks, rule-based systems, expert systems, and hybrid systems.
Neural networks (NNs) take inputs and do transformations as required to obtain the desired output. NNsmay use feedforward or backpropagation techniques. Both techniques use principles of artificialintelligence (AI).
In the scheduling environment, NNs play the role of a decision maker and produce rules for a givenworkstation (Cho & Wysk, 1995). For example, as parts move between machines, the NN modifiesmanufacturing times based on changing conditions. Schedules are constantly updated as the NN learnsand produces better schedules, adopting event-driven scheduling concepts.
NN technology produces superior results for many problems. However, often expensive, experiencedprogrammers are needed to adequately adjust the weights to obtain optimal or near-optimal solutions.Moreover, NNs may be difficult for end users to interpret, with confusing weights and hidden layers.
Rule-based intelligent scheduling systems design a decision tree of rules based on multiple conditions.This technique allows the user to easily interpret the decision process with a limited number of rules, butinterpretation becomes difficult as the system grows. System time also becomes a factor as the number ofrules grows over time, and storage of many rules in a rapidly changing environment may be a significantproblem. The Intelligent Scheduling Assistant developed by Kanet & Adelsberger (1987) for Digital is anexample of a rule-based system.
A related rule-based AI technique is deep representation using frames and objects. Deep representationprovides more information to users and detailed explanation of processes and reasoning of the system.May & Vargas (1996) used this procedure to develop SIMPSON, an intelligent assistant for short-termmanufacturing scheduling.

An expert system (ES) solves problems by applying human expertise to solve problems (Duchessi &O’Keefe, 1995). ES software is readily available off-the-shelf, with only minimal programming skillrequired in the development process. However, off-the-shelf software may be limited in features andcapabilities. The ES also requires significant maintenance over time and may not learn as easily as otherAI techniques. For example, May & Vargas (1996) encountered problems and had to abandon theirsystem development because of unexpected system maintenance.
Kempf (1989) reported at least 100 production scheduling applications of ESs throughout the U.S.Examples include Ajmal’s (1994) inventory management system for a small company. This ES reportedlylead to lowered inventory levels and reduced lead times. Other examples of scheduling ESs include thosedeveloped by Adler, Fraiman, & Pinedo (1989); Jain, Barber, & Osterfeld (1990). Moreover, Thesen &Lei (1986) combined simulation-assisted knowledge with ES techniques to develop an ES for robotscheduling. Many prototypes have also been developed (i.e. Sauve & Collinot, 1987).
Finally, other applications use hybrid (combination) systems. These systems combine 2 or more AItechniques to maximize benefits and minimize disadvantages. Holter, Yao, Rabelo, Jones, & Yih (1995)developed a hybrid system for a single machine scheduling problem using a combination of NNs,simulation, and genetic algorithms. This analysis reported significantly less tardiness as compared totraditional systems, as well as lowered WIP inventory, and reduced flow times.
Ehlers, van Rensberg, & van der Merwe (1994) developed a hybrid system that combined 3-D visualrecognition with object-oriented scheduling and rule-based priorities. This system led to an increasedability to see and act upon bottlenecks in the system.
Intelligent ESs that assist in quality control and simulation and control of flexible manufacturing systems(Kovacs, Mescar, Kopacsi, Gavalcova, & Nacsa (1994) have been developed. The hybrid ES, REDS,developed by Hadavi, Hsu, Chen, & Lee (1992), resulted in less tardiness, lowered WIP inventory, andreduction of lead times. Pfughoeft, Hutchinson, & Nazareth (1996) also reported results of a studycombining several techniques of AI. This knowledge-based intelligent scheduling system, implemented ina flexible manufacturing environment, reportedly outperformed common scheduling heuristics.
Although some intelligent scheduling systems have reported significant performance improvements,results to date have been mixed. Many systems have been abandoned over time. Longitudinal studies ofimpact over time have been virtually non-existent. Moreover, the studies reported have been singleinstances or case studies, with little generalizability to other environments. Finally, although some studiesmention performance benefits, many studies only report that the system is successful, with little definitionof the meaning of success. This study attempts to obtain valid, generalizable results both before and afterimplementation of intelligent scheduling systems, as well as determine what (if any) performancevariables are related to the type of scheduling system used. Based on theory and from previous casestudies, Hypothesis 1 will be tested.
POTENTIAL MODERATORS
Top Management Support
Top management support refers to executive level endorsement and aid during the development andimplementation of an information system (the intelligent scheduling system, in this study). According toWong’s (1996) survey, insufficient top management support has the most profound negative effect on ESprojects. Moreover, numerous studies have confirmed the importance of top management support ininformation systems projects (Duchessi & O’Keefe, 1995; Guimaraes, Igbaria, & Lu, 1992; Segars &
Grover, 1993; Tsai, Necco, & Wei, 1994; Udo, Ehie, & Olorunniwo, 1995). Specifically, top managementsupport includes: the presence of one or more “champion(s)” to guide the development andimplementation process; and availability of adequate resources to correctly complete the project. Udo etal. (1995) identified the lack of developing an effective champion as a reason for failure of advancedmanufacturing systems.
User Participation
User participation refers to active involvement of end users in the development process. Garrity (1994)identified the importance of user participation in the development process, particularly in decision-basedsystems. Many other studies also confirmed the importance of user participation in the developmentprocess (Barki & Hartwick, 1994; Burbridge & Friedman, 1988; Franz & Robey, 1986; Hartwick &Barki, 1994; Kappelman & Guynes, 1994; McKeen, Guimaraes, & Wetherbe, 1994; O’Keefe & Preece,1996; Rees, 1993; Saberwhal & King, 1992). Specific sub-factors to be captured include: amount of timeend users spend giving input to developers; number of pilot runs or system tests in which end usersparticipate; and amount of training end users receive. Hypothesis 2 will test the predicted moderatingeffects.
Potential Mediator
Numerous studies have confirmed that user participation in the development process leads to increasedperceived usefulness of the system (Adams, Nelson, & Todd, 1992; Cavaye, 1995; Chin & Todd, 1995;Davis, 1989; Franz & Robey, 1986; Garrity, 1994; Hendricksen, Massey, & Cronan, 1993; Kim & Lee,1986; Rees, 1993; Shaw & Raman, 1992; Subramanian, 1994; Thesen & Lei, 1986), as well as increaseduse of the system (Tait & Vessey, 1988). I theorize further that as user participation increases, actualusefulness will also increase. Further, the system usefulness mediates the relationship between userparticipation and system performance. Actual usefulness for this study is defined as the percentage oftime that the system is available. Hypothesis 3 will test the predicted mediating effect.
HYPOTHESES
Hypothesis 1
The type of scheduling system used will affect a company’s plant-level performance. Specifically,intelligent systems will provide: less tardiness, as measured by percent of customer orders deliveredbeyond the customer’s due date; lowered work-in-process (WIP) inventory levels; and loweredcumulative lead time (CLT).
Hypothesis 2
Given confirmation of Hypothesis 1, top management support and user participation moderates therelationship between type of scheduling system used and company performance.
Hypothesis 3
Given confirmation of Hypotheses 1 and 2, actual usefulness mediates the relationship between userparticipation and system performance. Figure 1 shows the full theoretical model.
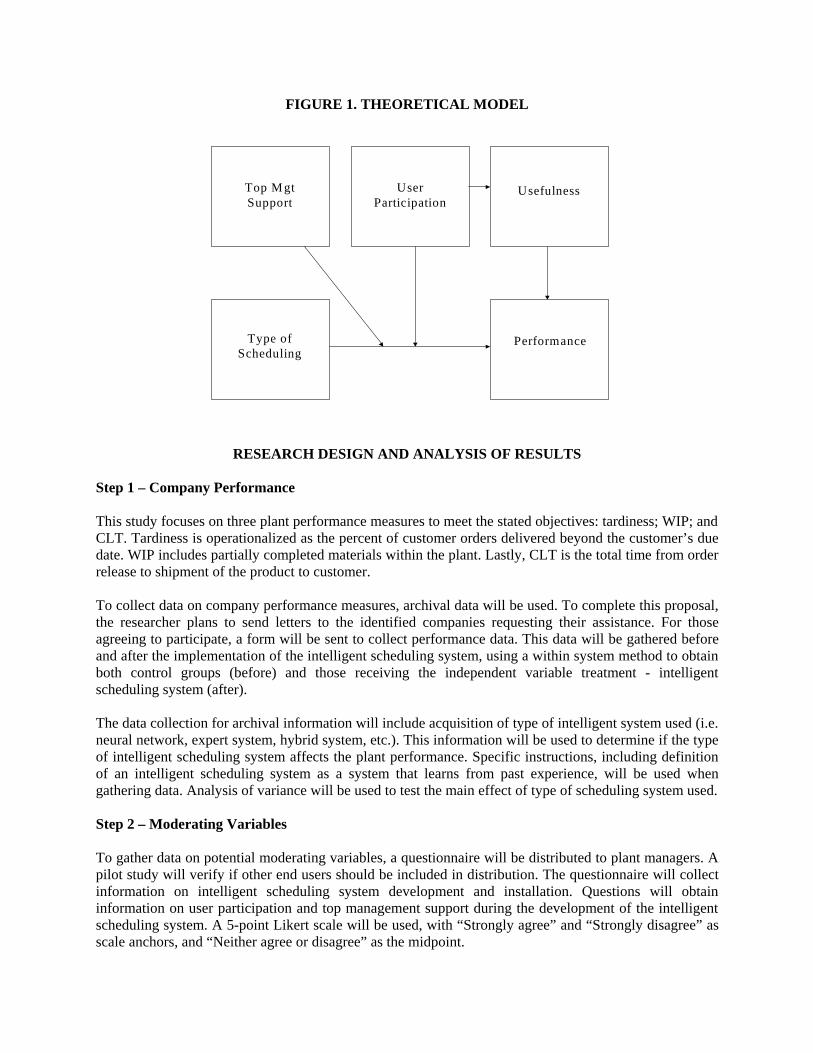
FIGURE 1. THEORETICAL MODEL
RESEARCH DESIGN AND ANALYSIS OF RESULTS
Step 1 – Company Performance
This study focuses on three plant performance measures to meet the stated objectives: tardiness; WIP; andCLT. Tardiness is operationalized as the percent of customer orders delivered beyond the customer’s duedate. WIP includes partially completed materials within the plant. Lastly, CLT is the total time from orderrelease to shipment of the product to customer.
To collect data on company performance measures, archival data will be used. To complete this proposal,the researcher plans to send letters to the identified companies requesting their assistance. For thoseagreeing to participate, a form will be sent to collect performance data. This data will be gathered beforeand after the implementation of the intelligent scheduling system, using a within system method to obtainboth control groups (before) and those receiving the independent variable treatment - intelligentscheduling system (after).
The data collection for archival information will include acquisition of type of intelligent system used (i.e.neural network, expert system, hybrid system, etc.). This information will be used to determine if the typeof intelligent scheduling system affects the plant performance. Specific instructions, including definitionof an intelligent scheduling system as a system that learns from past experience, will be used whengathering data. Analysis of variance will be used to test the main effect of type of scheduling system used.
Step 2 – Moderating Variables
To gather data on potential moderating variables, a questionnaire will be distributed to plant managers. Apilot study will verify if other end users should be included in distribution. The questionnaire will collectinformation on intelligent scheduling system development and installation. Questions will obtaininformation on user participation and top management support during the development of the intelligentscheduling system. A 5-point Likert scale will be used, with “Strongly agree” and “Strongly disagree” asscale anchors, and “Neither agree or disagree” as the midpoint.
Top MgtSupport
UserParticipation
Usefulness
Type ofScheduling
Performance
Variables will be coded for statistical analysis, with 5 referring to “Strongly agree” and 1 referring to“Strongly disagree.” Participants will be asked to consider the development and implementation processused in creating the intelligent scheduling system and to select the response that most closely matchestheir experience. Analysis of variance will be used to evaluate the interaction effect.
Step 3 – Mediating Variable
For each company, daily measures of system availability will be gathered, expressed as a percentage(with 100% meaning that the system experienced no down time). Analysis of variance will evaluate actualusefulness as a mediating variable.
REFERENCES
[ 1 ] Adams, Dennis A., Nelson, R. Ryan, and Todd, Peter A. (Jun 1992) “Perceived usefulness, ease ofuse, and usage of information technology: a replication.” MIS Quarterly. 16(2):227-247.
[ 2 ] Adler, L.B., Fraiman, N.M., and Pinedo, M.L. (1989) “An expert system for scheduling a liquidpackaging plant.” in R.K. Karwan and J.R. Sweigart (eds.) Proceedings of the Third InternationalConference on Expert Systems and the Leading Edge in Production and Operations Management.University of South Carolina, Columbia, SC: 505-518.
[ 3 ] Adler, L.B., Fraiman, N.M., Pinedo, M.L., Plotnicoff, J.C., and Wu, T.P. (1993) “BPSS: Ascheduling support system for the packaging industry.” Operations Research. 41: 641-648.
[ 4 ] Ahmed, Imtiaz, and Fisher, Warren W. (1992) “Due date assignment, job order release, andsequencing interaction in job shop scheduling.” Decision Sciences. 23: 633-647.
[ 5 ] Ajmal, A. (1994) “Intelligent knowledge based expert inventory control system for computerintegrated manufacturing.” Computers and Industrial Engineering. Vol. 27(1-4): 173-176.
[ 6 ] Barki, Henri, and Hartwick, Jon (Mar 1994) “Measuring user participation, user involvement, anduser attitude.” MIS Quarterly. 18(1): 59-82.
[ 7 ] Burbridge, John J., Jr., and Friedman, William H. (Apr 1988) “The roles of user and sponsor in MISprojects.” Project Management Journal. 19(2): 71-76.
[ 8 ] Campbell, Gerard M. (1992) “Master production scheduling under rolling planning horizons withfixed order intervals.” Decision Sciences. 23(2): 312-331.
[ 9 ] Cavaye, Angele L. M. (May 1995) “User participation in system development revisited.”Information and Management. 28(5): 311-323.
[ 10 ] Chin, Wynne W., and Todd, Peter A. (Jun 1995) “On the use, usefulness, and ease of use ofstructural equation modeling in MIS research: a note of caution.” MIS Quarterly. 19(2):237-246.
[ 11 ] Cho, Hyunbo, and Wysk, Richard A. (1995) “Intelligent Workstation Controller for Computer-Integrated Manufacturing: Problems and Methods.” Journal of Manufacturing Systems. 14(4): 252-

263.
[ 12 ] Davis, Fred D. (Sep 1989) “Perceived usefulness, perceived ease of use, and user acceptance ofinformation technology.” MIS Quarterly. 13(3): 319-340.
[ 13 ] Duchessi, Peter, and O’Keefe, Robert M. (Sep/Oct 1995) “Evolutionary steps in expert systemsprojects.” Interfaces. 25(5): 194-208.
[ 14 ] Ehlers, Elizabeth M., van Rensburg, Eugene, and van der Merwe, Riaan (1994) “Intelligentscheduling in the manufacturing environment.” Computers and Industrial Engineering.27(1-4): 31-34.
[ 15 ] Franz, Charles R., and Robey, Daniel (Summer 1986) “Organizational context, user involvement,and the usefulness of information systems.” Decision Sciences. 17(3): 329-356.
[ 16 ] Garrity, Edward J. (Summer 1994) “User participation, management support and system types.”Information Resources Management Journal. 7(3): 34-43.
[ 17 ] Guimaraes, Tor, Igbaria, Magid, and Lu, Ming-Te (Mar/Apr 1992). “The determinants of DSSsuccess: an integrated model.” Decision Sciences. 23(2): 409-430.
[ 18 ] Hadavi, Khosrow, Hsu, Wen-Ling, Chen, Tony, and Lee, Cheoung-Nam. (Fall 1992) “Anarchitecture for real-time distributed scheduling.” AI Magazine. 46-55.
[ 19 ] Handfield, Robert (1993) “Distinguishing features of just-in-time systems in the make-to-order/assemble-to-order environment.” Decision Sciences. 24(3): 581-602.
[ 20 ] Hartwick, Jon, and Barki, Henri (Apr 1994) “Explaining the role of user participation ininformation system use.” Management Science. 40(4): 440-465.
[ 21 ] Hendricksen, Anthony R., Massey, Patti D., and Cronan, Timothy Paul (Jun 1993) “On the test-retest reliability of perceived usefulness and perceived ease of use scales.” MIS Quarterly. 17(2): 227-230.
[ 22 ] Ho, C.J., and Carter, P.L. (1996) “An investigation of alternative dampening procedures to copewith MRP system nervousness.” International Journal of Production Research. 34(1): 137-156.
[ 23 ] Holter, Tammy, Yao, Xiaoqiang, Rabelo, Luis Carlos, Jones, Albert, and Yih, Yuehwern (1995)“Integration of neural networks and genetic algorithms for an intelligent manufacturing controller.”Computers and Industrial Engineering. 29(1-4): 211-215.
[ 24 ] Jain, S., Barber, K., and Osterfeld, D. (1990) “Expert simulation for on-line scheduling.”Communications of the ACM. 33: 54-60.
[ 25 ] Kadipasaoglu, Sukran N., and Sridharan, V. (1995) “Alternative approaches for reducing scheduleinstability in multistage manufacturing under demand uncertainty.” Journal of OperationsManagement. 13: 193-211.
[ 26 ] Kanet, J.J. and Adelsberger, H.H. (1987) “Expert systems in production scheduling.” EuropeanJournal of Operational Research. 29: 51-59.
[ 27 ] Kappelman, Leon A., and Guynes, Carl Stephen (Sep/Oct 1995) “End-user training andempowerment.” Journal of Systems Management. 46(5): 36-41.
[ 28 ] Kempf, K.G. (1989) “Manufacturing process planning and production scheduling: where we areand where we need to be.” in Proceedings of the IEEE 5th Conference on Artificial IntelligenceApplications: 13-19.
[ 29 ] Kern, Gary M., and Wei, Jerry C. (1996) “Master production rescheduling policy in capacity-constrained just-in-time make-to-stock environments.” Decision Sciences. 27(2): 365-387.
[ 30 ] Kim, Eunhong, and Lee, Jinjoo. (Sep 1986) “An exploratory contingency model of userparticipation and MIS use.” Information and Management. 11(2): 87-97.
[ 31 ] Kim, Seung-Chul, and Bobrowski, Paul M. (1995) “Evaluating order release mechanisms in a jobshop with sequence-dependent setup times.” Production and Operations Management. 4(2): 163-180.
[ 32 ] Kovacs, George L., Mesgar, Istvan, Kopacsi, Sandor, Gavalcova, Daniela, and Nacsa, Janos. (1994)“Application of artificial intelligence to problems in advanced manufacturing systems.” Computer-Integrated Manufacturing Systems. 7(3): 153-160.
[ 33 ] Lin, Neng-Pai, Krajewski, Lee, Leong, G. Keong, and Benton, W.C. (1994) “The effects ofenvironmental factors on the design of master production scheduling systems.” Journal of OperationsManagement. 11: 367-384.
[ 34 ] Malhotra, Manoj K., and Jensen, John B., and Philipoom, Patrick R. (1994) “Management of vitalcustomer priorities in job shop manufacturing environments.” Decision Sciences. 25(5/6): 711-736.
[ 35 ] May, Jerrold H., and Vargas, Luis G. (1996) “SIMPSON: An intelligent assistant for short-termmanufacturing scheduling.” European Journal of Operational Research. 88: 269-286.
[ 36 ] McKay, K.N., Safayeni, F.R., and Buzacott, J.A. (July-August 1988) “Job-shop scheduling theory:what is relevant?” Interfaces. 18(4): 84-90.
[ 37 ] McKeen, James D., Guimaraes, Tor, and Wetherbe, James C. (Dec 1994) “The relationshipbetween user participation and user satisfaction: an investigation of four contingency factors.” MISQuarterly. 18(4): 427-451.
[ 38 ] O’Keefe, Robert M., and Preece, Alun D. (1996) “The development, validation and implementationof knowledge-based systems.” European Journal of Operational Research. 92: 458-473.
[ 39 ] Pflughoeft, K.A., Hutchinson, G.K., and Nazareth, D.L. (1996) “Intelligent decision support forflexible manufacturing: design and implementation of a knowledge-based simulator.” Omega. 24(3):347-360.
[ 40 ] Philipoom, Patrick R., and Malhotra, Manoj K., and Jensen, John B. (1993) “An evaluation ofcapacity sensitive order review and release procedures in job shops.” Decision Sciences. 24(6): 1109-1133.
[ 41 ] Rees, Patricia L. (1993) “User participation in expert systems.” Industrial Management and DataSystems. 93(6): 3-7.

[ 42 ] Ritzman, Larry P., and King, Barry E. (1993) “The relative significance of forecast errors inmultistage manufacturing.” Journal of Operations Management. 11: 51-65.
[ 43 ] Sabherwal, Rajiv, and King, William R. (Jul/Aug 1992) “Decision processes for developingstrategic applications of information systems: a contingency approach.” Decision Sciences. 23(4):917-943.
[ 44 ] Sauve, B. and Collinot, A. (1987) “An expert system for scheduling in a flexible manufacturingsystem.” Robotics and Computer Integrated Manufacturing. 3: 229-233.
[ 45 ] Segars, Albert H. and Grover, Varun (December 1993) “Re-examining perceived ease of use andusefulness: a confirmatory factor analysis.” MIS Quarterly: 517-525.
[ 46 ] Shaw, M.J., Park, S., and Raman, N. (1992) “Intelligent scheduling with machine learningcapabilities: the induction of scheduling knowledge.” IIE Transactions. 24(2): 156-167.
[ 47 ] Subramanian, Girish H. (Sep-Dec 1994) “A replication of perceived usefulness and perceived easeof use measurement.” Decision Sciences. 25(5, 6): 863-874.
[ 48 ] Tait, Peter, and Vessey, Iris (Mar 1988) “The effect of user involvement on system success: acontingency approach.” MIS Quarterly. 12(1): 91-108.
[ 49 ] Thesen, A. and Lei, L. (March 1986) “An expert system for scheduling robots in a flexibleelectroplating system with dynamically changing workloads.” Working Paper, Department ofIndustrial Engineering, University of Wisconsin-Madison.
[ 50 ] Tsai, Nancy, Necco, Charles R., and Wei, Grace (Nov 1994) “An assessment of current expertsystems (part 2).” Journal of Systems Management. 45(11): 28-32.
[ 51 ] Udo, Godwin J., Ehie, Ike C., and Olorunniwo, Festus (Sep/Oct 1995) “Fulfilling the promises ofadvanced manufacturing systems.” Industrial Management. 37(5): 23-28.
[ 52 ] Vollmann, Thomas E., Berry, William L., and Whybark, D. Clay (1992) Manufacturing Planningand Control Systems. 3rd edition. Richard D. Irwin Publishing Co., Inc.
[ 53 ] Wahlers, James L., and Cox, James F, III (1994) “Competitive factors and performancemeasurement: applying the theory of constraints to meet customer needs.” International Journal ofProduction Economics. 37: 229-240.
[ 54 ] Wemmerlov, Urban (1992) “Fundamental insights into part family scheduling: the single machinecase.” Decision Sciences. 23: 565-595.
[ 55 ] Wong, Bo K. (Jul/Aug 1996) “The role of top management in the development of expert systems.”Journal of Systems Management. 47(4): 36-40.
HIERARCHICAL SYSTEM CONTROLLER SOFTWARE DEVELOPMENT FOR A FLEXIBLEMACHINING AND ASSEMBLY SYSTEM
Robert J. McIlwain, Department of Management Science and Information Technology Virginia Polytechnic Institute & State University, 1007 Pamplin, Blacksburg, VA 20460
ABSTRACT
This paper is a brief version of a much larger document that I have been writing to fulfill the requirements fora graduate degree in Industrial and Systems Engineering. In order to keep this paper at a reasonable length, Ihave omitted a major portion of the original document. I decided to include the introduction, the projectdevelopment, and the user’s guide sections of the original paper while omitting the literature review, theprogrammer’s guide, the validation procedure, and the conclusionary sections. Enclosed with this paper is aseparate package of diagrams and screen shots that will hopefully give the reader a feel for the software’scapabilities without having to actually run the executables.
INTRODUCTION
Flexible Manufacturing Systems in Industry
Flexible manufacturing systems (FMS’s) are a step forward from traditional assembly lines in the evolutionof automated manufacturing. Modern FMS’s are characterized by several attributes [1]. Firstly, productionis accomplished through the use of reprogrammable machines. Advances in computer technology in the mid1970’s gave rise to computer numerically controlled (CNC) machines. CNC machines receive theirinstructions directly from a computer which facilitates information processing and reduces variabilityresulting in improved quality. Secondly, a machine’s tool changing is accomplished automatically, allowingfor reduced setup times and greater flexibility of product. Thirdly, automated material handling is used fortransferring parts between machines as well as loading and unloading parts to and from machines. This isaccomplished by devices such as robots, conveyors, automated guided vehicles (AGV’s), and automatedstorage/retrieval systems (AS/RS’s). Lastly, control and coordination of all components of an FMS iscomputerized, allowing for unmanned operation of the system. Flexible manufacturing systems allow for therapid production of a variety of customized products that was unobtainable before their advent.
Originally, flexible manufacturing systems consisted of a large number of machines with very sophisticatedmaterial handling systems. This proved to be too expensive for all but the largest of manufacturers. This ledto the trend of grouping small numbers of machines into flexible manufacturing cells (FMC’s) and the designof flexible manufacturing systems composed of several flexible manufacturing cells [4].
The Flexible Machining and Assembly System
The Flexible Machining and Assembly System (FMAS) located in the Robotics and Automation Laboratoryin Whittemore 161 and depicted in Figure 1 consists of three distinct cells: 1) a machining cell consisting ofan IBM 7545 robot and two CNC milling machines, 2) a kitting/assembly cell consisting of an IBM 7547robot, three vertical part feeders, and assembly fixtures, and 3) a material handling and storage systemconsisting of a conveyor, a crane, and a storage rack. The FMAS manufactures and assembles two products(robots and CNC machines) that go through similar processes towards completion.

When an order is placed for a product, an empty pallet must be moved from the storage rack to the kitting cellby material handling. When the pallet arrives, the IBM 7547 robot builds a kit consisting a wax base and oneor more links retrieved from the parts feeders. Each “robot kit” to be built consists of one small wax base andtwo links while each “CNC kit” to be built consists of one large wax base and one link. When the kittingoperation is complete, the material handling system transports the pallet to the machining cell. The 7545robot removes the parts from the pallet and loads them onto the CNC machines for milling. As the partscomplete their required machining operations, they are returned to the pallet by the robot. The materialhandling system transports the pallet back to the kitting/assembly cell where the machined parts areassembled into a completed product by the IBM 7547 robot. Finally, the pallet carrying the completedproduct is returned to the storage rack by material handling to await shipping.
Because multiple orders and products are being processed simultaneously, it is possible that a kit maycomplete an operation at one of the cells and find the other cell busy processing another product. In this casethe pallet containing the semi-finished product is returned to the AS/RS until it can resume processing at thedesired cell.
In addition, the feeders must be kept stocked constantly. Each of the three feeders contains somewherebetween five and ten parts. When a feeder is empty it must be refilled. This is accomplished by sending anappropriate parts pallet to the assembly/kitting, having the robot remove the correct number of parts from thepallet, and inserting them in the top of the feeder.
An operator interface station exists at the end of the main conveyor to provide external input and output to thesystem. Empty raw material pallets are brought to this station when more raw material is needed in thesystem. Pallets containing assembled products are brought to this station when “orders” are packaged andshipped. Finally, pallets that have been associated with system errors must be brought to this station forcorrective action.
Each of the three cells has a personal computer which controls it. These computers are capable of interactingwith the controllers of the components at the device level to perform various tasks. For example, a programcould be downloaded from the workcell control computer to the robot controller to command the IBM 7545robot to pick up a wax link from the pallet and transport it to the first CNC machine. The robot controllerwould in turn guide the robot through the various steps of the action such as grasping, lifting, rotating, anddepositing the part. Each of the three workcell control computers is in turn connected to another personalcomputer whose function is to control the entire system.
At this time the network is not available, so in order to test the system control software it was necessary tocreate a set of three programs that can be used to simulate manually the existence of the actual hardware. Theprograms run simultaneously on one machine sharing the same hard drive and monitor. The programscommunicate with one another using a set of “mailboxes” (described later) that can be used when the networkis eventually running.
Hierarchical Control Architectures
The control architecture of a flexible manufacturing system is responsible for directing the transformation ofproducts from raw materials to finished goods. Responsibilities of the control architecture include schedulingof production, routing of materials, and allocation of limited resources such as robots and machines to themanufacturing process. Choosing the appropriate control architecture can be essential to the success orfailure of an automated manufacturing system.
Hierarchical architectures are often used in controlling flexible manufacturing systems. Hierarchicalarchitectures are characterized by distinct levels of control. At each level, control commands are sent downto the next lower (subordinate) level. Subordinates respond to these commands and return feedback to thenext higher (supervisory) level. In a proper hierarchical system, there is no direct communication betweenentities at the same level or between entities not directly subordinate/supervisory of one another.
The implementation of a hierarchical architecture provides several benefits [3]. Individual aspects can beadded gradually, which will be beneficial to the project development plan presented in Section 2. Theredundant nature of the structure allows for replacement in the case of computer break-down. Softwaredevelopment is simplified by the fact that programming of each component is independent of all othercomponents. This will ease the ability of future programmers in accomplishing modifications to the softwarein the future. Other advantages of a hierarchical architecture include fast response times in relation to thedifferent time scales associated with each level of the hierarchy, simplified control components, and possibleadaptive behavior [2].
Several alternatives exist to hierarchical control architectures [2]. Centralized control architectures arecharacterized by the use of a single computer to make all decisions and keep track of all activities. Thesearchitectures can be slow, inconsistent, and difficult to modify. Modified hierarchical architectures arecharacterized by a loose superior/subordinate decision making relationship not found in proper hierarchicalarchitectures and are more difficult to design. Heterarchical architectures are characterized by nosuperior/subordinate relationship and full autonomy at the component level. Heterarchical architectures aremore adaptable than hierarchical architectures but suffer from a need for higher networking capability and alack of communication standards.
Project Justification
Although a system controller for the FMAS existed at the start of this project, it was deemed desirable tocreate a new control system for several reasons. Firstly, the existing system was only capable of producingone product at a time. The existing system therefore was not required to make decisions involvingscheduling, routing, and resource allocation which are of primary importance in an FMS control system [2].The capabilities of the system needed to be expanded in various ways to reflect the difficulties encountered inindustry. Secondly, the original control system was undocumented and programmed in a FORTRAN basedlanguage which is difficult to compile in a 32 bit environment. Since the trend in programming within thelaboratory is moving towards the use of C and C++ languages, it was desirable to write the code for thecontrol system in C++ to aid in the standardization of all of the programming for the various ongoing andinterconnected projects in the laboratory. Thirdly, much of the source code for the existing software is notavailable which made modifications to the existing software difficult if not impossible. Finally, the existingcontrol system is inflexible in the sense that it is only capable of producing the two wax products: robot andCNC machine. In the future, it will be necessary for the control system’s programming to provide enoughgenerality to produce a wide range of products with vastly different production requirements than the twocurrent products the system is capable of producing.
The purpose of this project was to develop a new system control software package that would serve as thefoundation for further software developments for the FMAS. The system controller that was created wasbased upon a hierarchical model as depicted in Figure 2. The new control software rectified many of theproblems with the original software. The new system controller was capable of more sophisticated decisionmaking regarding the scheduling and routing of products. User friendliness was enhanced by creating a newinterface for the placement of orders as well as a system for monitoring the process. Most importantly, thenew system controller was designed with flexibility in mind, so that the FMAS can continue to develop as acoordinated and integrated project in the future.

PROJECT DEVELOPMENT
Communication Between Controllers
Communication between system control and its subordinate workcell controllers takes place via a group ofASCII files or “mailboxes”. Each subordinate workcell controller has one “in” and one “out” mailboxassigned to it for a total of six distinct mailboxes. System control is able to read from all three out boxes andwrite to all three in boxes. Subordinate cells are able to read commands only from their in boxes and writefeedback only to their own out boxes.
The use of ASCII files is important to the development of the entire FMAS. Although the MFC librarycontains designated classes with serialization functions that might be more efficient for communication, itcannot be assumed that the programmers involved with writing the code at the subordinate level will befamiliar with object oriented programming, or even be using C++. It is possible that a workcell controlsoftware system might be developed in an entirely different programming language. For this reason allcommunications from system control to the workcell controllers are represented by a set of three digit integercodes being written to the in boxes by system control to be read by the workcell controllers. These three digitcodes and their corresponding interpretations by the system controllers are as follows.
The following codes can be sent from system control to assembly/kitting :
100. Initialize IBM 7547 robot: Workcell control tells the IBM 7547 robot to return to its home position.101. Load small (robot ) base feeder: Workcell control tells the IBM 7547 robot to remove a specifiednumber of small bases from a parts pallet and load them into the appropriate feeder.102. Load large (CNC) base feeder: Workcell control tells the IBM 7547 robot to remove a specifiednumber of large bases from a parts pallet and load them into the appropriate feeder.103. Load link feeder: Workcell control tells the IBM 7547 robot to remove a specified number of linksfrom a parts pallet and load them into the appropriate feeder.104. Build robot kit: Workcell control tells the IBM 7547 robot to remove one small base and two linksfrom the feeders and place them on a robot pallet.105. Build CNC kit: Workcell control tells the IBM 7547 robot to remove one large base and one link fromthe feeders and place them on a robot pallet.106. Assemble wax robot: Workcell control tells the IBM 7547 robot to assemble a finished wax robot froma previously machined small base and links.107. Assemble wax CNC: Workcell control tells the IBM 7547 robot to assemble a finished wax CNC froma previously machined large base and link.108. Shutdown assembly/kitting cell: Workcell control tells the IBM 7547 robot to perform a shutdown.
The following commands can be sent from system control to machining :
200. Initialize CNC #1: Workcell control tells the first CNC machine to initialize.201. Initialize CNC #2: Workcell control tells the second CNC machine to initialize.
Important : Both CNC machines must be initialized before command 202 can be given for safety reasons.
202. Initialize IBM 7545 robot: Workcell control tells the IBM 7545 robot to return to its home position.203. Machine wax robot kit: Workcell control tells the machining cell to perform a series of actions on thesmall base and two links that should be contained on the pallet at the cell. This involves the IBM 7545 robot

performing a series of movements of the wax parts from the pallet to the CNCs where they are machined in apreprogrammed pattern and then brought back to the pallet by the robot.204. Machine wax CNC kit: This command is identical to command 203 except that one large base and onelink are involved and the machining patterns are different.205. Shutdown CNC#1: Workcell control tells CNC#1 to perform a shutdown.206. Shutdown CNC#2: Workcell control tells CNC#2 to perform a shutdown.207. Shutdown robot: Workcell control tells the IBM 7545 robot to perform a shutdown.
The following commands can be sent from system control to material handling :
300. Initialize crane: Workcell control tells the crane to return to its home position.301. Initialize conveyor: Workcell control tells the conveyor to return to its home position.302. Move pallet from assembly to machining: Workcell control tells the conveyor to move a pallet from theassembly/kitting cell to the machining cell.303. Move pallet from assembly to AS/RS interface: Workcell control tells the conveyor to move a palletfrom the assembly/kitting cell to the left side of the AS/RS interface.304. Move pallet from machining to assembly: Workcell control tells the conveyor to move a pallet from themachining cell to the assembly/kitting cell.305. Move pallet from machining to AS/RS interface: Workcell control tells the conveyor to move a palletfrom the machining cell to the left side of the AS/RS interface.306. Move pallet from AS/RS interface to assembly: Workcell control tells the conveyor to move a palletfrom the right side of the AS/RS interface to the assembly/kitting cell.307. Move pallet from AS/RS interface to machining: Workcell control tells the conveyor to move a palletfrom the right side of the AS/RS interface to the machining cell.308. Move pallet from AS/RS interface to other side of interface: Workcell control tells the conveyor tomove a pallet from the right side of the AS/RS interface to the left side.309. Move pallet from AS/RS interface to storage rack: Workcell control tells the crane to move a palletfrom the from the left side of the AS/RS interface to the storage rack. This command is followed by a space,the row number, another space, and the column number of the slot that the pallet is to be sent to.310. Move pallet from AS/RS interface to operator interface: Workcell control tells the conveyor to move apallet from the right side of the AS/RS interface to the operator interface station.311. Move pallet from storage rack to AS/RS interface: Workcell control tells the crane to move a palletfrom the storage rack to the right side of the AS/RS interface. This command is followed by a space, the rownumber, another space, and the column number of the slot where the pallet is located.312. Move pallet from operator to AS/RS interface: Workcell control tells the conveyor to move a palletfrom the operator interface to the left side of the AS/RS interface.313. Move pallet from operator to assembly: Workcell control tells the conveyor to move a pallet from theoperator interface to the assembly/kitting cell.314. Package product: Workcell control tells the human operator to remove and package a finished product.315. Load robot (small) base parts pallet: Workcell control tells the human operator to load an empty partspallet with small wax bases.316. Load CNC (large) base parts pallet: Workcell control tells the human operator to load an empty partspallet with large wax bases.317. Load link parts pallet: Workcell control tells the human operator to load an empty parts pallet withlinks.318. Shutdown crane: Workcell control tells the crane to perform a shutdown.319. Shutdown conveyor: Workcell control tells the conveyor to perform a shutdown.
Once a command has been received from system control, each subordinate issues an appropriate series ofcommands to the device level controllers. When the task has been completed, the PC’s at the subordinate

level return a feedback message to system control. System control expects its subordinates to return theidentical message number that each was sent in the first place. For example if system control sends outmessage 202, “machine robot”, then it expects to be returned a value of 202 with the successful completion ofthe machining of the robot. If anything else is returned, then an error message will be produced.
After receiving a code of form 1xx, 2xx, or 3xx, system control expects to receive an integer from theworkcell controllers representing the status of the operation to be performed. Receiving a value of zeromeans that the workcell controller had successfully completed the desired operation. A value of one meansthat the workcell controller is still busy performing the operation. This might occur in response to a query bysystem control in the case of unexplained holdups in the manufacturing process. Also, a series of error codesmust be developed. Each of these should be a three digit integer of the format 9xx.
System control checks each of its mailboxes at a regular interval of time. At this point, it is checking eachbox once every 100 milliseconds. This value is hard coded into the program but can be changed easily ifdeemed appropriate. When a mailbox is checked, its contents are removed and immediately placed at the tailend of a list where they are handled by the decision making portion of the program.
System Initialization
System initialization can be performed in two different ways: by “warm” start or by “cold” start. A warmstart assumes that the system was shutdown either normally or due to an emergency as described in Section2.7. In this case, system control has saved all necessary data on the state of the system through serializationand retrieves it from the hard drive. If the initialization is succeeding a normal shutdown then all palletsshould have been returned to the rack. If the initialization is succeeding an emergency shutdown then systemcontrol assumes that all pallets not in the rack at the time of shutdown were removed from the FMAS by theoperator. A cold start would be appropriate if the system was being started for the first time. In this casematerial handling would be responsible for providing in the form of an ASCII file the status and location inthe rack of all pallets while assembly/kitting is responsible for the quantity of parts in the feeders. This istaken into account in the programs that were written to simulate these cells.
In either case, system control must go through the same process to initialize the hardware. First the CNCmachines in the machining cell must be initialized so that the person initializing these machines can get out ofthe working area of the robots before they are initialized. Once this is accomplished, system control sendsmessages to machining and assembly/kitting to initialize their robots and tells material handling to initializethe conveyor and crane. System control then waits until all three cells have completed initialization beforeproduction can begin.
Once the conveyor has been initialized, any pallets that are currently outside of the FMAS can be reenteredinto the FMAS by the operator. The operator must provide the pallet number and status of the pallet to bereintroduced. This procedure can be performed at any time that the conveyor and the operator are in an idlestate and is particularly useful when recovering from an emergency shutdown.
Order Placement System
Each order that is added to the system is identified by its customer name. This can be any unique string ofcharacters. An order’s attributes consist of the number of wax robots and wax CNC machines required by thecustomer, the priority level (either high or low) of the order, and the time and date it was placed.Immediately after an order is placed it is assigned to a group of pallets. Orders are ranked by priority andthen by date and time. Pallets are ranked by how complete they are. In other words from high to low, pallets

are ranked: assembled, machined, kitted, empty. The program then matches up the orders and the palletswith the highest ranks.
It is also possible to modify or cancel an order. By entering the customer’s name, an order can either beeliminated or have its quantity or priority altered. When either of these options is chosen, all orders areimmediately reassigned using the procedure discussed in the previous paragraph.
The code for order placement was written with the specific option in mind of having another computer placeorders from an even higher level in the hierarchy rather than a human user. With only minor modifications tothe mailbox checking code described in section 2.1, another level of mailboxes could be incorporated into thesoftware without changing the basic order placement structure.
Decision Making Process
Once all three workcells have completed initialization, production can begin. When the user selects the runcommand from system control’s menu, the program begins to find jobs for the crane and conveyor to performif either is currently idle. This is executed by calling a subroutine for finding the crane a task and asubroutine for finding the conveyor a task. Each subroutine is called whenever material handling completes atask or whenever an order is added or modified. In addition, the conveyor subroutine is called whenever themachining cell or assembly/kitting cell have completed a task.
Of primary importance to the crane is transporting pallets tagged for shipping from the rack to the AS/RSinterface. Therefore, the subroutine initially performs a search of the rack to find pallets tagged for shipping.If one is found and the right side of the AS/RS interface is unoccupied, system control sends a message tomaterial handling telling the crane to move the pallet to the interface. This is continued until all palletstagged for shipping are removed from the rack with precedence given to high priority orders over low priorityorders.
If no pallets marked for shipping exist in the rack, the crane subroutine performs a check to determinewhether one of the base feeders is empty or if the link feeder has less than two parts in it. If this is the case,the subroutine searches the rack for an appropriate non-empty parts pallet. If the subroutine finds one, systemcontrol sends a message to material handling telling the crane to move the pallet to the AS/RS interface. If anon-empty pallet of the appropriate type does not exist, system control sends a message to material handlingtelling the crane to move an empty parts pallet to the AS/RS interface. This pallet will eventually betransported to the operator by the conveyor where it will be loaded with the appropriate parts.
If there are no pallets in the rack tagged for shipping and all of the feeders are adequately stocked, thesubroutine checks the left side of the interface to detect whether it is occupied or not. If the interface isoccupied, system control sends a message to material handling telling the crane to move the pallet back to therack. The slot that the pallet is to be sent to is currently chosen at random from all empty slots.
Finally, if no pallets tagged for shipping exist, the feeders do not need refilling, and the AS/RS interface isunoccupied on both sides, the subroutine searches the rack for product pallets with customer names assignedto them. The subroutine starts by searching for pallets of high priority that have already been machined. Ifnone are found, then the subroutine searches for high priority kitted pallets and finally high priority emptypallets. If no high priority pallets are found, the process is repeated for low priority pallets.
The conveyor subroutine’s first function is to relieve the operator of any pallet he may have. If the operatoris done with whatever he is doing and the conveyor is idle, system control sends a message to materialhandling telling the conveyor to move the pallet to an appropriate location. If the pallet is a product pallet it

is either empty after just having had a finished product removed from it for shipping or it is being reenteredinto the FMAS after an error or shutdown of some sort has occurred. In either case it will be sent to the leftside of the AS/RS and eventually be sent to the rack by the crane. If the pallet is a parts pallet it is either fullafter having been loaded by the operator or it is being reentered into the FMAS. If the pallet is non-empty,the appropriate feeder needs refilling, and the assembly cell is unoccupied, the pallet is sent to the assemblycell. Otherwise, the pallet is sent to the left side of the AS/RS interface if it is unoccupied.
If the operator does not need relief, the subroutine checks the machining cell. If the cell is done machining apallet, system control will send a message to material handling telling the conveyor to either move the palletto the assembly cell if it is unoccupied or to move the pallet to the right side of the AS/RS interface if theassembly cell is occupied and the right side of the interface is unoccupied.
If the operator and machining do not need relief, the subroutine checks the assembly cell. If the cell is donewith a pallet, system control will send a message to material handling telling the conveyor to move the palletto an appropriate location. If the pallet is a kit and the machining cell is unoccupied the pallet will be movedto the machining cell. If the pallet is a kit, the machining cell is occupied, and the left side of the AS/RSinterface is unoccupied then the pallet will be move to the interface. If the pallet is assembled or the pallet isa parts pallet it will be sent to the left side of the AS/RS interface if it is unoccupied.
Finally, if the operator, the machining cell, and the assembly cell are all unoccupied, the conveyor subroutinechecks the right side of the AS/RS interface. If the interface is occupied by an empty or machined productpallet it will be sent to the assembly cell if it is unoccupied. If the interface is occupied by a kitted productpallet it will be sent to the machining cell if it is unoccupied. If the interface is occupied by an empty partspallet it will be sent to the operator if the operator is available and idle. If the interface is occupied by an non-empty parts pallet it will be sent to the assembly cell if it is unoccupied and the appropriate feeder needsstocking. All other types of pallets occupying the right side of the interface will be sent to the other (left) sideof the interface if it is unoccupied.
In summary, the two subroutines described above are the heart of the decision making procedure that drivesthe FMAS to continuously produce products as needed. Each action that the workcells complete promptssystem control to find some task for the conveyor and the crane to perform if they are not already busy. Thisprocess continues indefinitely until either there are no orders to fill or a shutdown is requested by the user.
Viewing the System
System control provides three different views of the current situation in the FMAS. Each view is updatedautomatically with the occurrence of a new event. The first view, shown in Figure 3, is a view of the systemhardware which includes the following:� Contents of all slots in the rack by pallet number� Quantity of parts in each of the three feeders� Status of the system, machining cell, assembly cell, interface, conveyor, and crane
The second view, shown in Figure 4, contains information about all orders in the system including customername, quantity of robots and CNCs required, priority, and time and date of placement.
The final view, shown in Figure 5, contains information about all of the pallets. At this point, the software isset for twenty robot pallets, twenty CNC pallets, five small (robot) base pallets, eight large (CNC) basepallets, and seven link pallets. These values can be changed easily within the code if it becomes necessary.System control uses a numbering scheme where the pallet numbers are assigned to robot pallets, CNC pallets,small base pallets, large base pallets, and link pallets in that order. Therefore currently robot pallets are

numbered (1-20), CNC pallets are numbered (21-40), small base pallets are numbered (41-45), large basepallets are numbered (46-53), and link pallets are numbered (54-60). Information provided by this viewincludes type, location, status, and customer assignments for all sixty pallets.
Product Shipping and Packaging
Once all products contained in a customer’s order are complete, the user can “tag” the order for shippingOnce an order has been tagged for shipping, the pallets associated are frozen and cannot be assigned toanother order until they reach the shipping station. Each pallet associated with the order to be shipped mustbe moved by the crane and the conveyor to the human operator interface. The order will be packaged by theoperator and the empty pallet returned to the conveyor and thence back to the rack. The completion ofpackaging is simulated by a message 314 sent from the material handling program to system control.The software considers the tagged for shipping decision to be irreversible. Therefore care must be taken bythe user that only completed orders are tagged. Failure to do this may result in unfinished products arrivingat the operator interface for shipping.
Shutdown
System shutdown is broken down into two types: normal and emergency. Normal shutdowns wouldtypically occur at the end of a session and begin by having machining and assembly finish whatever they aredoing. While this is occurring, material handling should be returning all pallets to the rack. When all of thepallets have been returned to the rack and all hardware has been shutdown, then all data relevant to thesystem control is saved to disk and the system can be started back up using the warm start procedure.
Emergency shutdown would typically occur when something physically goes wrong in the system such as awax part falling out of position. Emergency shutdown can be accessed from a menu or by using the redbutton provided on the toolbar. This type of shutdown sends a message to all three subordinates to stopwhatever they are doing immediately. If this option is chosen, any pallets outside the rack will have to bereturned to the system by the human operator using the new pallet command from the system control menuduring or after reinitialization. In either case, all necessary data is stored using the serialization process usedby Visual C++.
Data Storage
Data needed by system control can be stored at any time by the user for backup purposes. Users should savebackup data regularly with an original filename so that all is not lost in the case of a computer crash. Thesystem can then be restored by changing the backup files name to SystemControl.sav. With slightmodifications to the software, this mechanism could be set to backup at regular time intervals.
USER’S GUIDEOverview of System Control
The system control software is designed to run on a PC with a 32 bit operating system, either Windows 95 orWindows NT. System control communicates with its subordinates through a set of ASCII files or mailboxes.The subordinates will access these mailboxes through a network which unfortunately is not available at thecurrent time of writing. Instead, in order to test the software, three additional programs were created tosimulate the existence of the three subordinate cells. These three programs, once running, continuously readtheir “in” mailboxes. If a message is received from system control, a dialog box appears notifying the user ofwhich message was received. An example of a typical message dialog box is shown in Figure 6. It is up tothe user to make the appropriate response for the subordinates.

The simplest and most practical procedure for running and testing system control is to execute all fourprograms simultaneously. Once all four programs are running, their windows should be resized and reshapedso that all four windows are accessible to the user as shown in Figure 7. It is highly desirable to have a fairlylarge monitor (17” or larger) in order to obtain a suitable view of all four programs. The file names for theexecutables are:
SystemControl.exe Assembly.exeMachining.exe MaterialHandling.exe
As described in section 2.1, the system control software writes to a set of three “in” mail boxes and readsfrom a set of three “out” mail boxes. The filenames associated with these ASCII mailbox files are:
Assembly.in Machining.in MaterialHandling.inAssembly.out Machining.out MaterialHandling.out
During cold starts, system control must be provided with information concerning the contents of the rack andthe pallets from the material handling cell. System control expects to find this information in the ASCII fileMaterialHandling.dat. A typical file of this type is shown in Figure 8.
The first ten lines of the file represent the contents of the ten rows in the rack. In this example, pallet #47occupies the upper left corner of the rack. Zeros indicate unoccupied slots in the rack. Each line shouldcontain sixteen integers separated by spaces representing the sixteen columns in the rack. The number ofrows and columns in the rack are hard coded into the system control program but can be changed easily bychanging the values of the variables m_nRackColumns and m_nRackRows described in Chapter 4.
The last five lines of the file indicate the status of the pallets in order from pallet #1 to pallet #60. Each linerepresents a different pallet type. In order, these pallet types are robot pallet, CNC pallet, small (robot) basepallet, large (CNC) base pallet, and link pallet. For product pallets, the values correspond to the followingnumbering scheme: 0=empty, 1=kit, 2=machined, 3=assembled, 4=tagged for shipping. For parts pallets thevalues represent the quantity of parts currently contained on each pallet. Again, each integer should beseparated from the next by a space.
Also during cold starts, system control must be provided with the quantity of wax parts in the feeders by theassembly/kitting cell. System control expects to find this information in the ASCII file Assembly.dat. Thisfile should be an integer representing the number of small (robot) bases in the feeder followed by a space andthe number of large (CNC) bases in the feeder followed by a space and the number of links in the feeder.During warm starts, system control obtains the data necessary for initialization from a file namedSystemControl.sav. This file should have been created through serialization by either performing a shutdownor by making use of the backup procedure.
System control expects all files with the extension .in, .out, .dat, and .sav to be located in the same directoryas SystemControl.exe. The interrelationship between the various executables and files is depicted in Figure9.
THE SYSTEM CONTROL PROGRAM MENU ITEMS
The system control program is a single document interface (SDI) Windows 95 program. When the programis executed a frame will appear containing a toolbar with one red button, an empty window, and a menu. The

red button is used for emergency stops. The window houses the various views that can be requested as wellas any dialogue boxes that may appear.
OPERATIONAL MODES
The system control software is always in one of four modes. The “down” mode is in effect when the programis initially executed or when a shutdown has been completed. The “initializing” mode is in effect from thetime a warm or cold start has been selected until the run command is executed or a shutdown occurs. The“running” mode is in effect from the time of the selection of the run command and ends with the occurrenceof a shutdown. The “shutting down” mode is in effect from the time of the occurrence of a shutdown until allcomponents of the workcells have completed their individual shutdowns.
File Menu
The file menu contains commands associated with initialization, shutdown, storage, and printing.
Cold Start Command: This command begins the initialization process by sending messages to the machiningworkcell to initialize its two CNC machines and putting the system into initializing mode. When thiscommand is chosen, system control expects the material handling and assembly cells to provide theinformation necessary for initialization in the form of ASCII files. The cold start command is only availablewhen the system is in the down mode.Warm Start Command: This command begins the initialization process by sending messages to the machiningworkcell to initialize its two CNC machines and putting the system into initializing mode. When thiscommand is chosen, system control expects to find the information needed for initialization in the serializedfile SystemControl.sav. The warm start command is only available when the system is in the down mode.Run Command: This command puts the system into running mode so that production can begin. The runcommand is not available until the crane, the conveyor, the assembly cell, and the machining cell have allcompleted initialization.Normal Shutdown Command: This command puts the system in shutting down mode. This causes theassembly and machining cells to finish what they are doing and the material handling cell to return all palletsto the rack. All data is stored in the file SystemControl.sav. This command is only unavailable when thesystem is in the down mode.Emergency Shutdown Command: This command sends messages to the assembly, machining, and materialhandling cells to shutdown immediately and puts the system in shutting down mode. All data is stored in thefile SystemControl.sav. A toolbar with a large red button has been provided that performs the same function.This command is only unavailable when the system is in the down mode.Save As Command: This command allows the user to save data to a file other than SystemControl.sav. Thisis useful as a backup in the event of a computer crash. This command is always available.Print, Print Preview, Print Setup Commands: These are standard Windows commands to send informationfrom one of three views to a printer. These commands are always available.Exit Command: This command closes the system control program. This command can only be accessedwhen the system is in the down mode.
Order Menu
The order menu contains commands associated with placing, modifying, canceling, and shipping orders.Order commands can be selected while the system is in any mode.
New Command: This command allows the user to place a new order. A dialog box, shown in Figure 10,appears prompting the user to enter a customer name, quantity of robots desired, quantity of CNC machinesdesired, and whether the order is of a high or low priority. Associated with all new orders are the date and

time of placement with respect to the computers internal clock. Orders are then assigned to pallets. Existingorders are reassigned to pallets if necessary.Modify Command: A dialog box, shown in Figure 11, appears prompting the user for a customer name. If anorder exists with that customer name, a dialog box will appear that is identical to the one appearing in Figure10. At this point the user can alter any aspect of a previously placed order except for its time and date ofplacement. Orders are then reassigned to pallets as is necessary.Cancel Command: A dialog box, shown in Figure 11, appears prompting the user for a customer name. If theuser presses the OK button, the order with that name will cease to exist. Other existing orders are thenreassigned to pallets if necessary.Ship Command: A dialog box, shown in Figure 11, appears prompting the user for a customer name. If allpallets associated with this customer are in the assembled stage, they are tagged for shipping. Once a pallet istagged for shipping it cannot have an order assigned to it again until the pallet has reached the humanoperator interface and been packaged.
View Menu
The view menu allows the user to change the type of information displayed in the main window. Viewcommands can be selected while the system is in any mode.
Orders Command: This command displays a view showing a list of all orders currently recorded includingthe name of the customer that placed the order, the quantities of wax robots and CNC machines desired by thecustomer, the priority of the order, and the time and date that the order was placed. An example of this viewwas shown in Figure 3.System Command: This command displays a view showing the current status of the system, the assemblycell, the machining cell, the crane, the conveyor, the operator, and the AS/RS interface. Also the currentquantities contained in the robot base, CNC base, and link feeders and the number of the pallet currentlyoccupying each slot in the rack are displayed. An example of this view was shown in Figure 4.Pallets Command: This command displays a view showing the type, status, and location of all pallets in thesystem as well as the customer names associated with robot and CNC pallets. An example of this view wasshown in Figure 5.
Operator Menu
The operator menu is used to inform system control of the availability of the operator as well as to allow forthe reintroduction of pallets to the FMAS.
Available Command: This command informs the system control program of the availability of the operator,toggling between available and unavailable. The operator is assumed to be available initially.New Pallet Command: This command allows the user to have the operator insert a new pallet into theFMAS. When this command is issued a dialog box, shown in Figure 12, appears prompting the user to enterthe number and status of the pallet to be entered into the system from the operator interface. This commandis available whenever the operator and the conveyor are idle. The command is particularly useful whenrecovering from an emergency shutdown.
Help Menu
About SystemControl Command: This command provides standard information about the system controlprogram.

OVERVIEW OF WORKCELL SIMULATION PROGRAMS
Each workcell simulation program is an SDI program written for Windows 95 or Windows NT. When eachprogram is executed, a frame will appear containing an empty window and a menu. Each program operatesin a similar manner. When the run command is issued from the file menu, the program begins to check its“in” mailbox for messages from system control at regular intervals of 100 milliseconds. If one or moremessages are found, a dialog box(es) appear(s) in the main window informing the user of the task(s) thatsystem control expects the workcell to perform.
When the user chooses to simulate the completion of the task, he or she issues the appropriate command fromthe response menu. This causes the workcell program to write the corresponding integer code value (1xx,2xx, or 3xx) followed by a space and then a zero to the workcell programs “out” mailbox. The zerorepresents the successful completion of the task and, for the time being, is the only type of response that theprograms can make. Currently, the user must take great care in selecting the appropriate response. Thesystem control software currently expects to receive the same three digit integer code value from the “out”mailbox as it sent to the “in” mailbox.
In addition the assembly and material handling programs each have an initialize menu which allows the userto create the initialization files utilized during the cold start procedure. Finally, each program has helpcommand and an exit command. The exit command can be executed at any time during the simulation andthe program restarted without any interference to the operation of the system control program.
THE ASSEMBLY PROGRAM MENU ITEMS
File Menu
Run Command: This command must be performed before the program begins to read its mailbox(Assembly.in).Exit Command: This command closes the assembly program.
Initialize Menu
Feeders Command: A dialog box, as shown in Figure 13, appears prompting the user to initialize thequantities in the robot base, CNC base, and link feeders. The user is limited by the maximum capacity ofeach feeder which is hard coded into the software. This data is stored in the file Assembly.dat in ASCII formand subsequently used by the system control program.
Respond Menu
Initialization Complete Command: This command sends message (100 0) to the file Assembly.out indicatingthat the 4547 robot has completed initialization.Kit Built Command: This command sends message (101 0) or (102 0) to the file Assembly.out indicating thateither a robot or CNC kit has been built.Feeder Loaded Command: This command sends message (103 0), (104 0), or (105 0) to the file Assembly.outindicating that either the robot base, CNC base, or link feeder has been loaded.Assembly Complete Command: This command sends message (106 0) or (107 0) to the file Assembly.outindicating that either a robot or CNC has been assembled.Shutdown Complete Command: This command sends message (108 0) to the file Assembly.out indicatingthat the 4547 robot has completed shutdown.
Help Menu
About Assembly Command: This command provides standard information about the program.
THE MACHINING PROGRAM MENU ITEMS
File Menu
Run Command: This command must be performed before the program begins to read its mailbox(Machining.in).Exit Command: This program closes the machining program.
Respond Menu
Initialization Complete Command: This command sends message (200 0), (201 0), or (202 0) to the fileMachining.out indicating that NC#1, NC#2, or the 4545 robot have completed initialization.Machining Complete Command: This command sends message (203 0) or (204 0) to the file Machining.outindicating that either a robot or CNC has been machined.Shutdown Complete Command: This command sends message (205 0), (206 0), or (207 0) to the fileMachining.out indicating that NC#1, NC#2, or the 4545 robot have completed shutdown.
Help Menu
About Machining Command: This command provides standard information about the program.
MATERIAL HANDLING PROGRAM MENU ITEMS
File Menu
Run Command: This command must be performed before the program begins to read its mailbox(MaterialHandling.in).Exit Command: This command closes the material handling program.
Initialize Menu
Rack Command: A dialog box, as shown in Figure 14, appears prompting the user to initialize the rack. Theuser should enter the number of the pallet contained in each slot in the rack. A zero in any slot indicates anempty slot. It is extremely important that no pallet be assigned to more than one slot. Currently systemcontrol expects there to be at most 60 pallets in the system. This data is stored in the fileMaterialHandling.dat in ASCII form and subsequently used by the system control program during cold starts.Pallets Command: A dialog box, as shown in Figures 15 and 16, appears prompting the user to initialize thepallets of the chosen type. If the pallet is of the robot or CNC type, the user can set the pallets as empty,kitted, machined, or assembled. If the pallets are of the robot base, CNC base, or link type, the user definesthe quantity of parts contained by the pallet. For simplicity, it has been assumed that parts pallets are eitherempty, half-full, or full and the feeders are loaded so that these ratios will always hold. This data is stored inthe file MaterialHandling.dat in ASCII form and subsequently used by the system control program duringcold starts. Currently system control expects there to be 20 robot pallets, 20 CNC pallets, 5 robot basepallets, 8 CNC base pallets, and 7 link pallets in the system.

Respond Menu
Initialization Complete Command: This command sends message (300 0) or (301 0) to the fileMaterialHandling.out indicating that the crane or the conveyor have completed initialization.Move Complete Command: This command sends a message between (302 0) and (313 0) to the fileMaterialHandling.out indicating that a move has been completed from one location to another.Product Packaged Command: This command sends message (314 0) to the file MaterialHandling.outindicating that the operator has completed packaging a product and is prepared to return the empty pallet tothe conveyor.Pallet Loaded Command: This command sends message (315 0), (316 0), or (317 0) to the fileMaterialHandling.out indicating that the operator has completed loading a small base, large base, or linkpallet and is prepared to return the pallet to the conveyor.Shutdown Complete Command: This command sends message (318 0) or (319 0) to the fileMaterialHandling.out indicating that the crane or the conveyor has completed shutdown.
Help Menu
About MaterialHandling Command: This command provides standard information about the program.
REFERENCES
[1] Askin, R.G., and Standridge, C.R. Modeling and Analysis of Manufacturing Systems. John Wiley &Sons, Inc., New York (1993).
[2] Dilts, D.M., Boyd, N.P., and Whorms, H.H. “The Evolution of Control Architectures for AutomatedManufacturing Systems.” Journal of Manufacturing Systems, 10, 1, 79-93 (1991).
[3] Groover, M.P. Automation, Production Systems, and Computer Integrated Manufacturing. Prentice-Hall, Inc., Englewood Cliffs, NJ (1980).
[4] Russell, R.S., and Taylor, B.W. Production and Operations Management. Prentice-Hall, Inc.,Englewood Cliffs, NJ (1995).
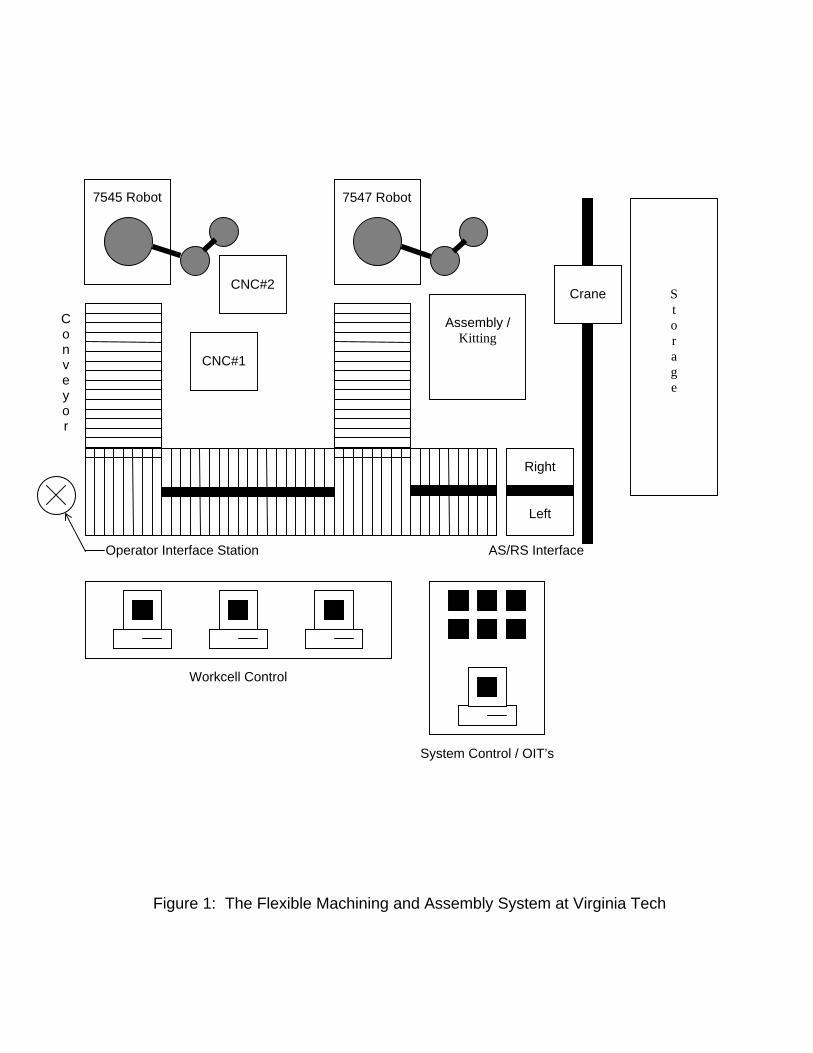
Figure 1: The Flexible Machining and Assembly System at Virginia Tech
Crane
7545 Robot 7547 Robot
Storage
Workcell Control
System Control / OIT’s
CNC#1
CNC#2
Assembly /Kitting
Conveyor
Right
Left
Operator Interface Station AS/RS Interface
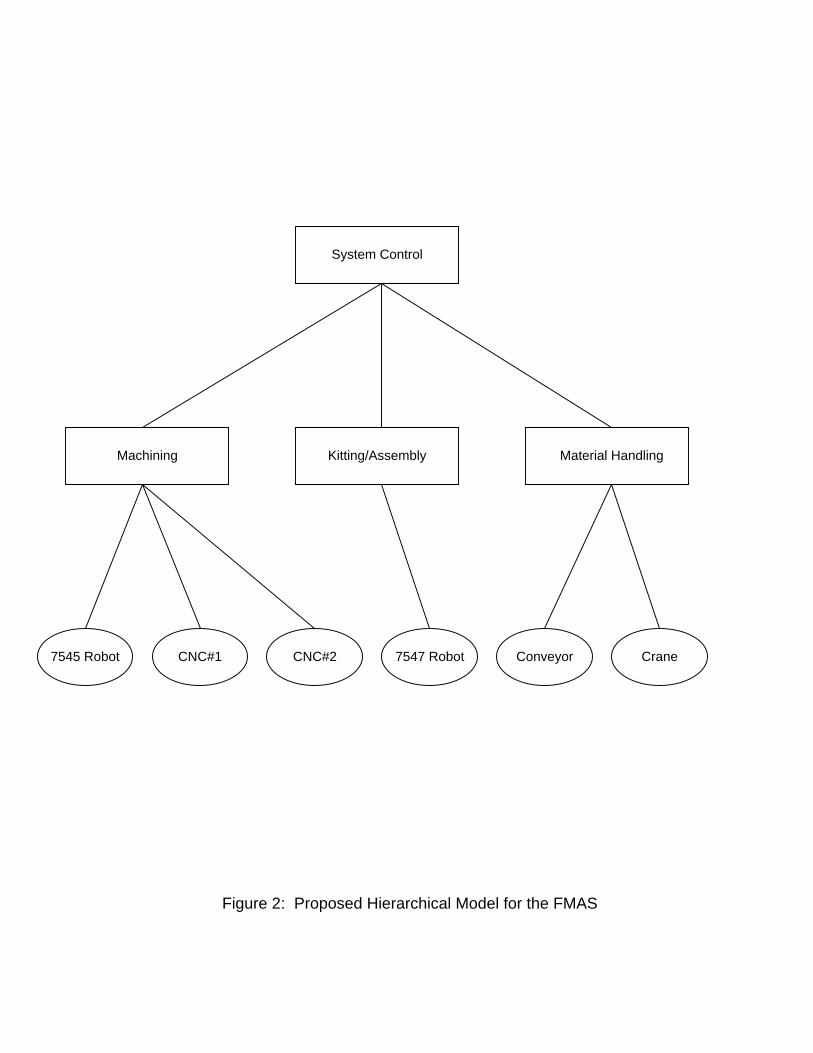
Figure 2: Proposed Hierarchical Model for the FMAS
System Control
Material HandlingMachining Kitting/Assembly
CNC#1 ConveyorCNC#27545 Robot Crane7547 Robot
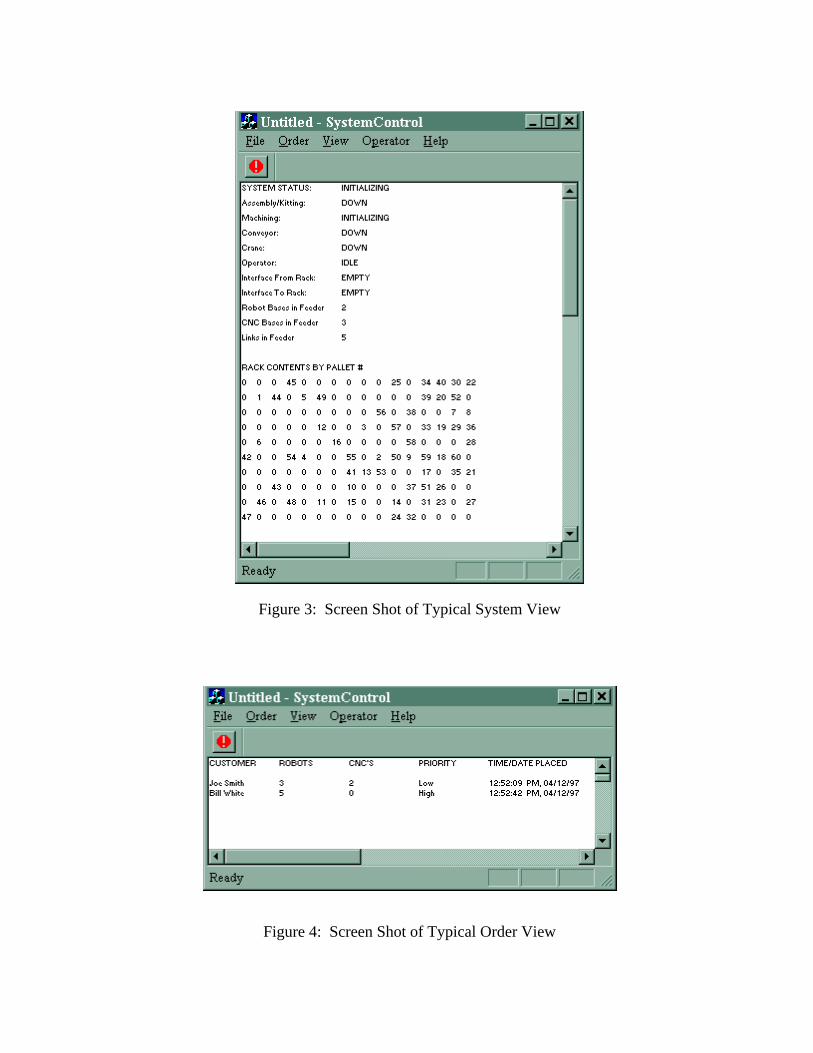
Figure 3: Screen Shot of Typical System View
Figure 4: Screen Shot of Typical Order View
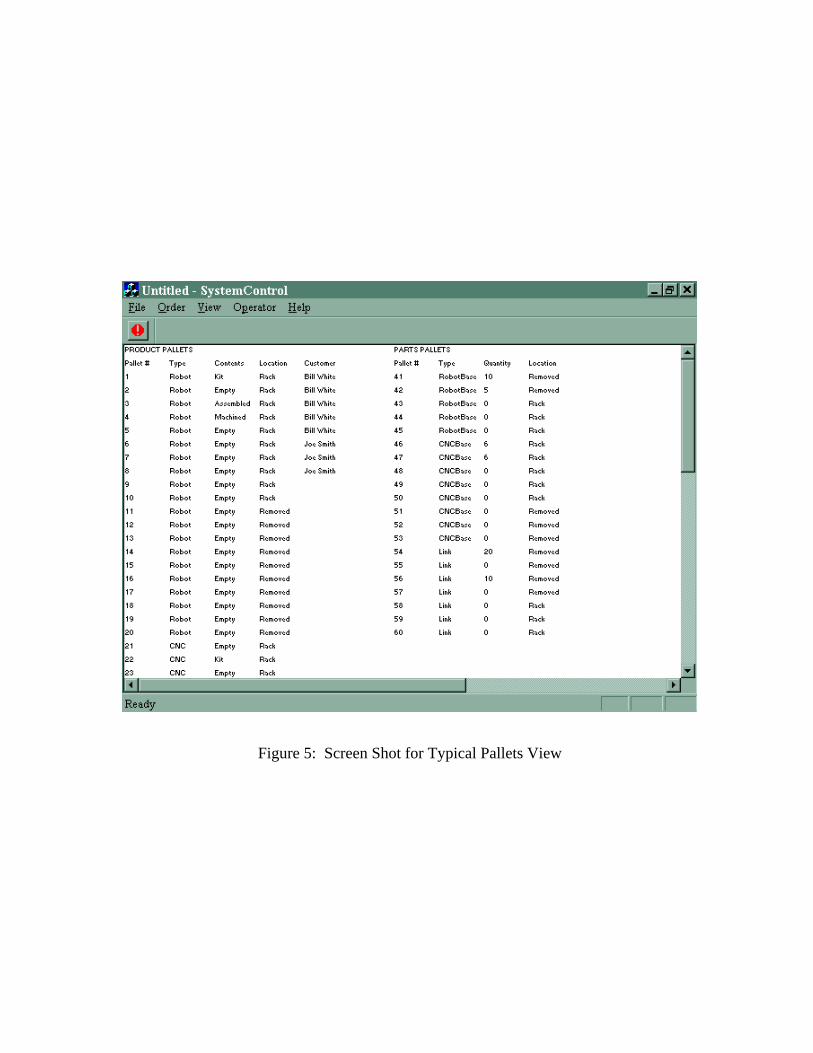
Figure 5: Screen Shot for Typical Pallets View
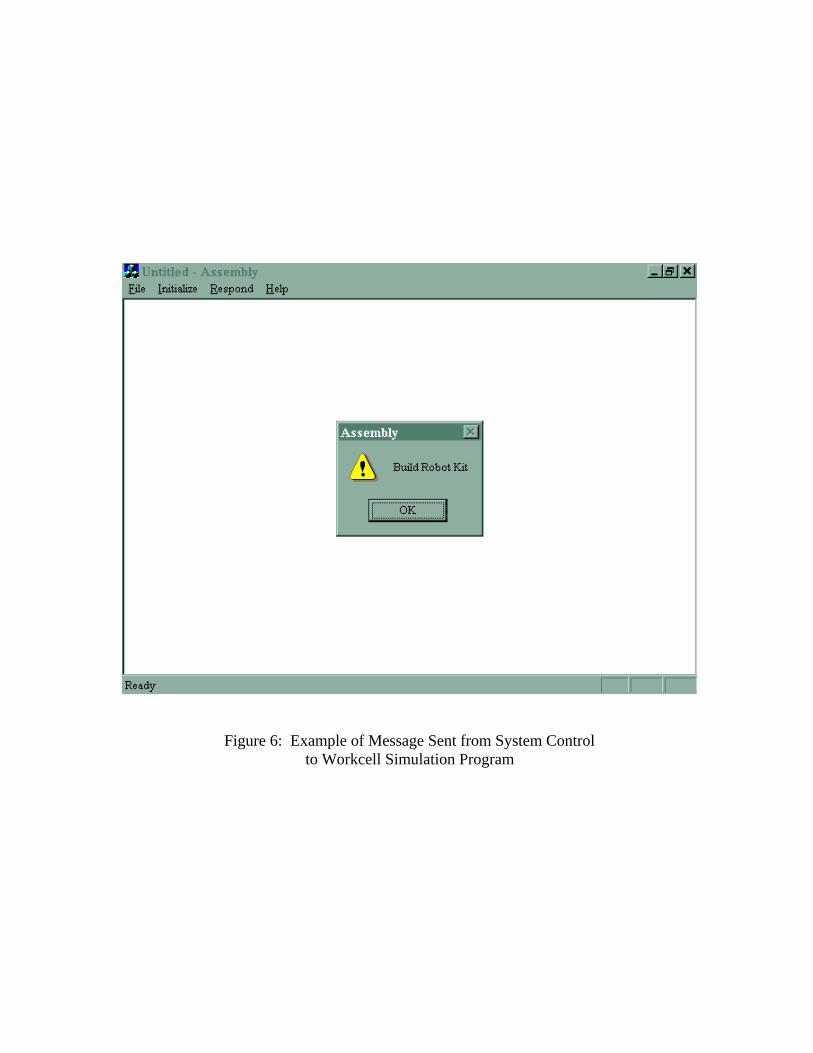
Figure 6: Example of Message Sent from System Controlto Workcell Simulation Program
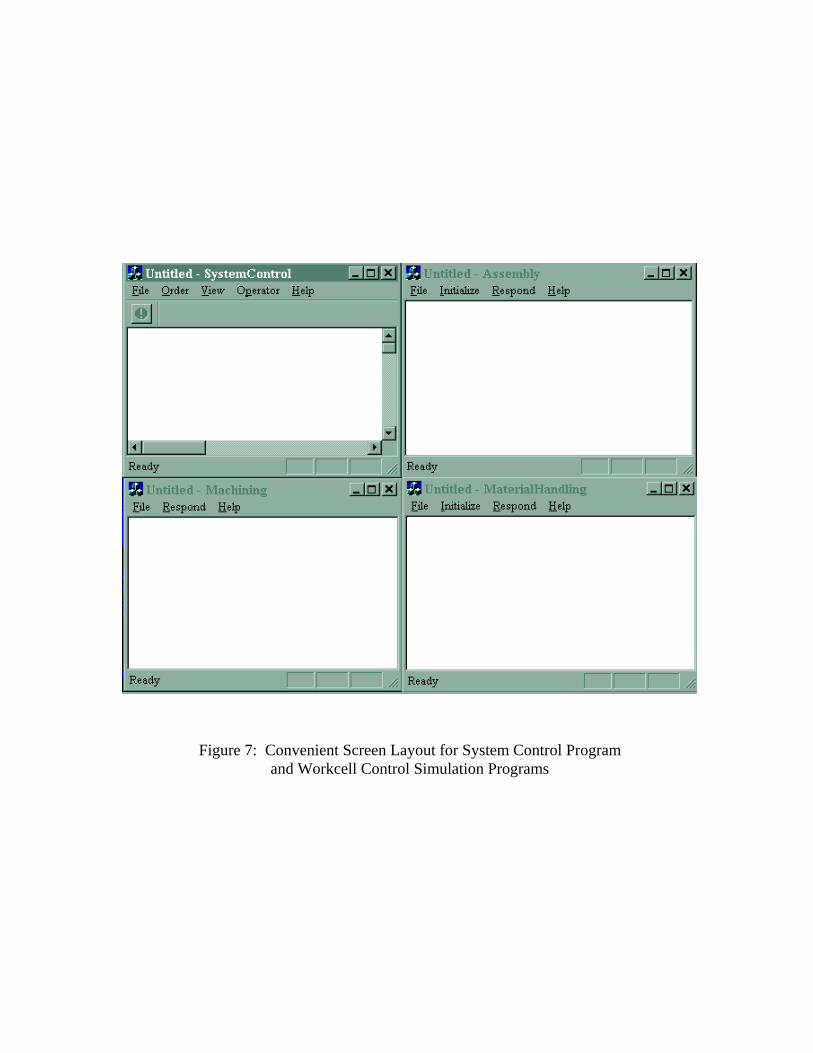
Figure 7: Convenient Screen Layout for System Control Programand Workcell Control Simulation Programs

Figure 8: Typical Example of ASCII File MaterialHandling.dat
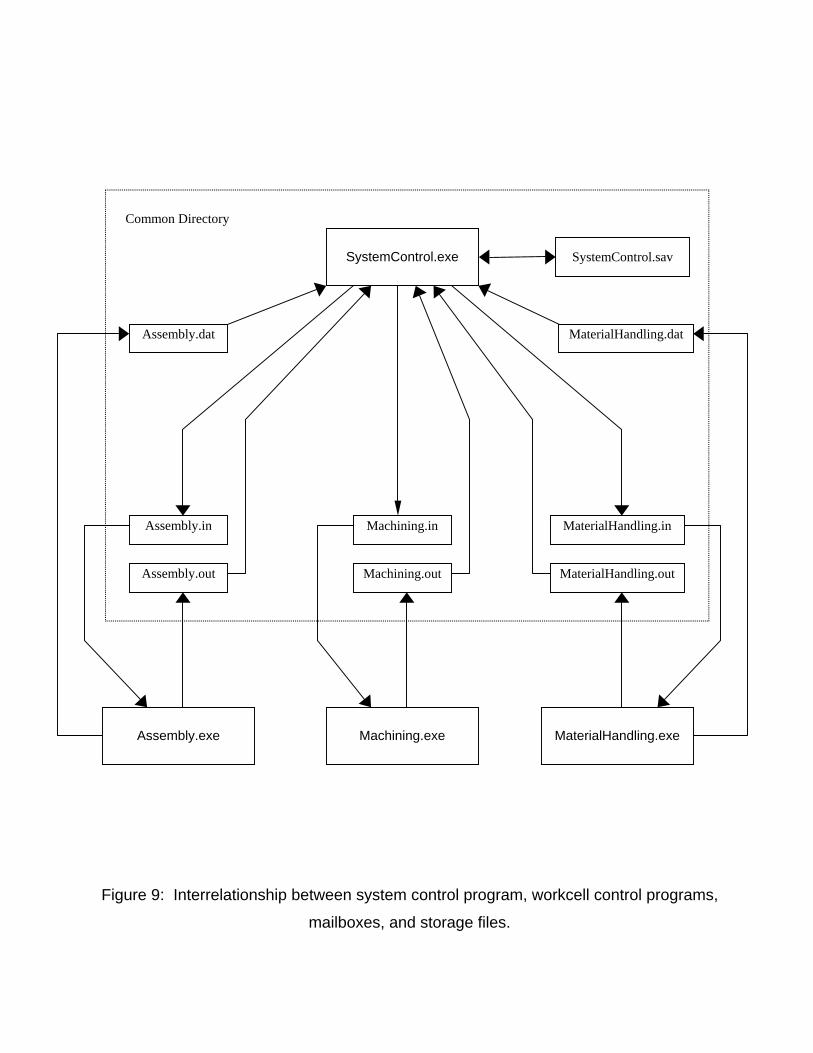
Figure 9: Interrelationship between system control program, workcell control programs,
mailboxes, and storage files.
SystemControl.exe
MaterialHandling.exeMachining.exeAssembly.exe
Machining.outAssembly.out
Machining.inAssembly.in MaterialHandling.in
MaterialHandling.out
Assembly.dat MaterialHandling.dat
Common Directory
SystemControl.sav

Figure 10: Dialog Box for New Orders
Figure 11: Dialog Box for Modifying Orders
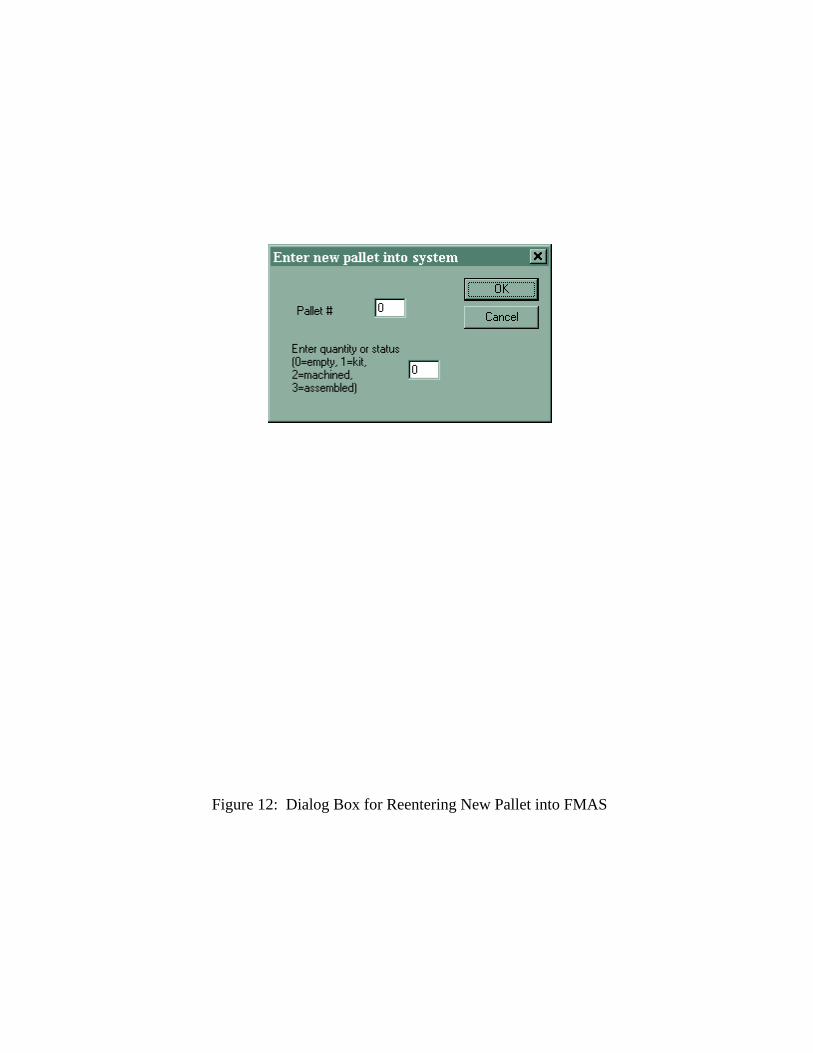
Figure 12: Dialog Box for Reentering New Pallet into FMAS

Figure 13: Dialog Box for Initializing Feeders
Figure 14: Dialog Box for Initializing Rack
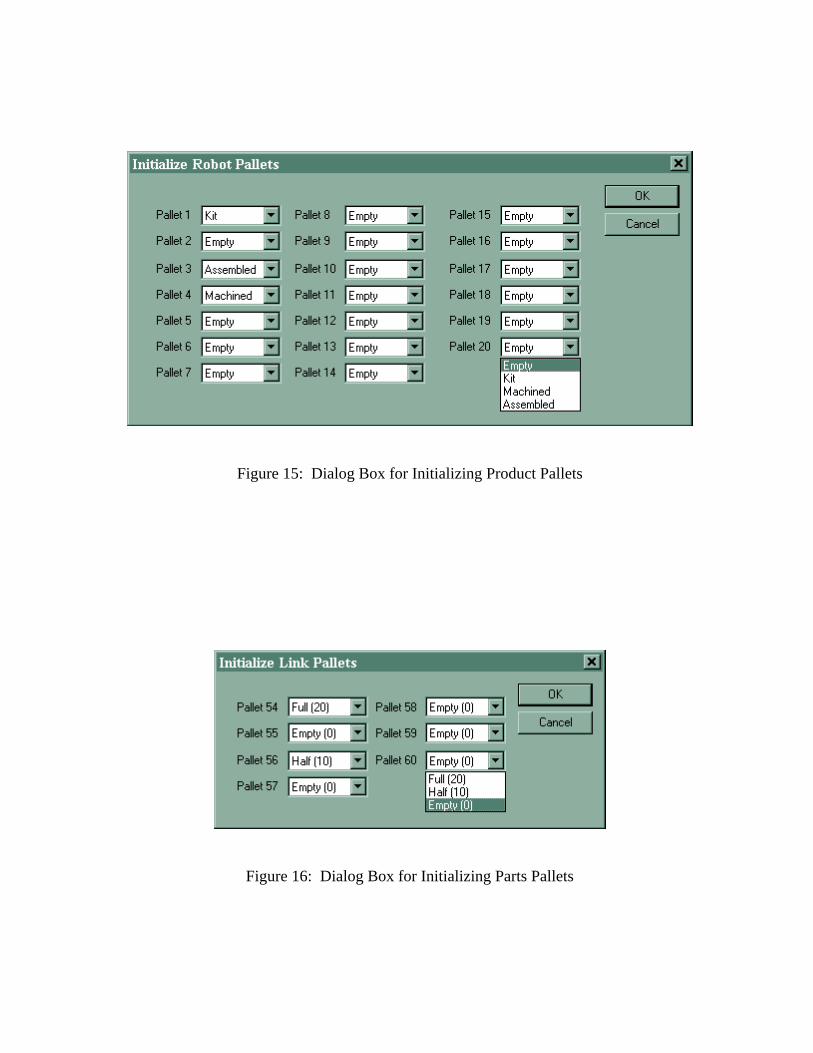
Figure 15: Dialog Box for Initializing Product Pallets
Figure 16: Dialog Box for Initializing Parts Pallets
1
CONTROLLING THE ATTITUDE OF THE GOOD EMPLOYEES VERSUSTHE BAD EMPLOYEES AND THE HACKERS TOWARDS INTERNET SECURITY
Alexander D. Korzyk, Sr.Virginia Commonwealth University
4738 Cedar Cliff RdChester VA 23831
804.748.8590Internet address: [email protected]
ABSTRACTOne of the many decisions facing management is how much control should management
exert over the attitude and behavior of the company employees. Employees in the past haveaccepted management’s decisions in the past and had not been able to do much about thedecisions if they felt they were unjust. On the other hand the knowledge worker of today hasmuch greater power at their disposal than employees of the past. Computers have becomemission critical to millions of companies globally. Yet, the management of many of thesecompanies has chosen to ignore the possibilities of damage caused by a disgruntled employee,good employee, or Hacker. Management constantly hears about Hacking incidents in the newsand is aware of them. However, cases of disgruntled employees or good employees accidentallywreaking havoc on the corporation are kept under the rug from outside the company. In fact,many of these cases are kept quiet even inside the company. This paper attempts to show that thethreat of Hackers is not the greatest computer security threat faced by management. Rather,employees of the company are also a great computer security threat to the company.Management needs to strike a balance between an atmosphere of trusting no one, even inside thecompany , and trusting everyone even outside the company. In today’s Internet environment,having a foolproof computer system connected to companies with which the company doesbusiness that have no computer security may not make economic sense. The balance found bymanagement to work for the company may involve the investment of thousands of dollars insoftware, hardware, training, and consulting to come up with the best solution for the company tocontrol the attitudes of the good employees versus the disgruntled “bad” employees and Hackerstoward Internet security.
INTRODUCTIONOne may think that the biggest security problem facing corporations using the Internet is the
infamous Hacker. Nearly everyday, there is an item in the news about a Hacker hacking into abank, Federal Government Agency, Department of Defense Military Computer, State Agency,etc. However, Hackers do not stop at that. They have gone beyond what was consideredtraditional hacking and now alter web pages on the World Wide Web like the Department ofJustice Web page incident last year. Can we assume that this security incident was committed bya Hacker? Isn’t that the only way that this could have happened? Unfortunately, the answer isno. The biggest problem facing corporations today is not the Hacker, but the disgruntled “Bad”employee. With the empowerment of employees and increasing amount of access to corporateinformation, the ability of the Bad employee has reached new levels unheard of a decade ago.Surprisingly, the Bad employee is not the only other person who could commit such an incident.A disgruntled Federal government employee could have gained unauthorized access to thatwebpage and made the modifications. Some security analysts argue that the biggest problemfacing corporate America is not the Hacker, nor the Bad employee, but the Good employee whoaccidentally or unintentionally destroys or alters data or web sites. Several studies have shown
2
that only 30% of reported incidents come from outside the corporation. This is the onlyproportion attributable to Hackers. The remaining 70% - 80% of reported incidents arecommitted from inside the corporation or has an inside component (Falconer 95). Thisproportion is split primarily between the Good and the Bad employee. This paper attempts toresearch the attitudes of these employees and the Hackers towards Internet Security byconducting a review and analysis of literature. By understanding the behavioral aspects ofHackers and employees, the employer can implement a reasonable security policy. Thinking likea Hacker lets employees know what their company is up against. Thinking like a disgruntledemployee also lets the good employees what they are up against. Treating the Internet as aperson-to-person communication medium like the telephone will help all sizes of companiesrealize that they must take some action to prevent misuse and abuse of Internetworked computers(Stone 97). However, when compared to larger corporations, the small to medium size enterpriseis at a higher risk because the capital required to resource a computer security group is notavailable. No staff is formally assigned and the Information Technology manager shoulderscomplete responsibility for computer security. The Singapore Institute of Management conducteda survey in 1994 in which they found the following: 1) Only 31.3% of the small to medium sizeenterprises did not assign computer responsibility to anyone on the staff; 2) Only 20% had acomputer security policy and only 7.5% had a desktop computer policy; 3) Only 16.4%conducted PC security awareness and training; and 4) Nearly half (49.3%) indicated their PCshad been infected by a virus (Ban and Heng 95).
RESEARCH QUESTION
The primary purpose of this research was to investigate the attitudes of Hackers anddisgruntled “Bad” employees versus Good employees toward Internet Security. The researchquestion concerning these individuals and groups of individuals included the following:
What effect does the attitude of Hackers have on employees trying to work together?
What effect does the attitude of disgruntled employees have on good employees trying towork together?
REVIEW OF LITERATURE
The attitudes of employees and Hackers can be divided into three categories: (1) TheHacker; (2) The Disgruntled “Bad” Employee; and 3) The Good Employee.
The Hacker
Most of the literature found concentrated on the Hacker. The term Hacker can generally beused for several different types of hacking. First, there are individuals who use socialengineering, over the shoulder techniques, espionage, persistence, dedication, ingenuity,information aggregation, and experimentation to obtain intriguing telephone numbers, modems,network access points, and other ways to bypass the ordinary access points (backdoors) tocomputer network computer systems. Hackers learn information by disguising their voices,impersonating, collecting fake research, sending faxes, pretending to speak a foreign language,collecting information from dumpsters, etc. Second, there are individuals who explore andexploit the telephone systems by using black boxes to make free toll free calls around the worldcalled Phreakers. Skilled Hackers can write programs to generate and dial random telephonenumbers, and hang on when a modem answers. The most famous Phreaker is Capn Crunch who

3
used the free whistle in the cereal box to imitate the precise tone (2600 Hz) to signal certaintelephone switches for long distance service (Lindup 94). In the United States alone, longdistance fraud amounted to $2.5 Billion in 1994 (Falconer 95). Third, there are individuals whomake their living buying, selling, and stealing information, the currency of a computerized future(Effross 97). Computer criminals may use a technique called a worm to gather information. Theinfamous Internet Worm of 1988 attacked a majority of the 60,000 computers on the Internet atthat time causing hundreds of millions of dollars of damage (Russell and Zwicky 97). Anexpertly designed worm can raid a secret database and leave no trace of it behind (Gragg 94).They can also break the copy protection of commercial software in order to make illegal copiescalled crackers. In 1994, a well known Hacker, Kevin Mitnick, intruded upon the San DiegoSupercomputer Center and threatened the life of a researcher there who took it upon himself topursue the Hacker with the help of the FBI for nearly one year before catching him (Russell andZwicky 97). Fourth, there are individuals who used to be crackers but became unemployed withthe breakup of the Soviet Union and now write viruses (Lindup 94). “Gifts” such as freecomputer programs posted on bulletin boards, are a popular way for Hackers to distribute theirviruses (Gragg 94). Creating viruses is not done in a clean room environment. Each new virus isprobably created on a single or group of PCs in one or several locations without regard toquarantine or spread. Luckily, over 90% of virus specimens are locked up in a virus researchlaboratory or placed in a private virus collection. Only 10% of all the different viruses end upgetting loose into the computer public (Kelsey 93). If new viruses were left to live on their ownin natural conditions in the computer public their spread would be much slower and their historybetter known. The number of unknown viruses that are unknown before they are spread to thepublic amount to only 2% of all viruses caught by the computer public (Kelsey 93). Fifth, thereare individuals who write programs to generate thousands of Telnet requests to a host computercalled Yackers. They tie up the Telnet port for example 30 seconds per Telnet request. If thehost computer receives 5,000 requests and must wait 30 seconds for each request beforedisconnecting, the Yacker has successfully denied service of the host computer for 41.6 hours.The best defense against this type of attack is to construct a firewall or at a minimum to limit theTelnet queue to the smallest amount possible and reduce the wait time for a response to perhaps10 seconds. Sixth, there are individuals who take over your computer over the Internet calledHijackers. Programs such as Microsoft’s ActiveX allows anyone sharing their computer to besubject to attack from anyone else connected to the website using ActiveX to create the webpage.
The Hacker Profile
The typical hacker can be the teenager next door or the college student. Based on theliterature review there are extremely few female hackers. Hackers do not normally operate bythemselves. They usually form groups in cyberspace, i.e., they physically may be alone orremote but mentally they collaborate as a team to map out strategies and targets for hacking.Hackers live all around the globe. Yet they may belong to the same group in cyberspace. Thebreakdown of geographical communities is occurring as fast as the number of new Internetconnections as technologies bring people closer to those that are geographically distant, but alsoas these same technologies takes people away from those who are physically close (Stone 97).The teenage hacker is deterred by a few successful arrests and sentencing of their hacker friends.However, the college student who is on a moral crusade for the rights to know all that is on theInternet or accessible via the Internet will not stop with merely the arrests of his peers. Theirpassion is so strong that they spend many all-nighters hacking instead of doing their homework.Some Hackers do so in order to make free phone calls especially overseas. Information isvaluable and can be traded for money or access to other sites. To replace cash, the Hackerintroduces exotic payment mechanisms such as “bearer chips,” “credit chips,” “bearer cards,”
4
“debit cards,” “credit disks,” “cash cards,” and “credit transactors.” (Effross 97). Many hackerssimply hack in order to gain free access to the Internet because they have been accustomed to freeaccess while a student (Lindup 94). Some of the more famous Hacker groups are: 8LGM;Chaos; CCCF; HACKTIC; MUDS and 2600. The more dangerous Hackers exist in the VirusExchange Bulletin Boards and may even work for the anti-virus vendors as researchers (Kensey93). Hackers believe that a secret is an expression of privacy which is good whereas most peoplebelieve that concealing something leads to dishonesty and crime. However, Hackers try to revealthe concealment of others particularly the Government because they believe that everyone has theright to know everything about the Government. Hackers have one of the most close knitcommunities of interest on the Internet today. They have a clear purpose, specify requirements ofmembership, provide guidance, offer growth opportunities, mediate disputes, use participativeleadership, and establish rituals.
Behavioral Changes in Good Employees Caused by Hackers
Employees of corporations must follow stricter security guidelines set by management toprevent hacking incidents. Harder passwords make it more difficult to guess but once a Hackergets a valid account, the Hacker can use programs to crack the password in a matter of minutes ifit is an easy password. Regular words are bad passwords. Employees need to question the callerin more detail to ensure that it is not a Hacker impersonating someone. If the corporation has fulltime computer security personnel then they should be passing on any information they learnabout the Hackers when they monitor the Hackers bulletin boards. In the corporation that hasbeen hacked, the attitude towards Internet security may be completely opposite the attitude ineven the same corporation prior to the security hacking incident. Employees are sensitive tomanagement’s decisions on how to control Hacker’s and disgruntled employees. They feel thateveryone has to pay for the actions of the few. Unfortunately, the actions of these few employeesor Hackers can wreak great havoc on the corporation.
The Disgruntled “Bad” Employee
Although some Hackers may do random damage or malicious destruction, the most likelythreat and the most dangerous threat is the disgruntled employee (Gragg 94). This employee mayintroduce a virus to pay back management for something that happened to him such as not gettingpromoted, being moved to another group, not getting a big enough raise, etc. They may also sellcompany confidential information to the competition. Or even worse, they may sell userids andpasswords to criminals or spies.The disgruntled employee normally commits their act without economic or self-serving goals(Dray 88). The most common example of a disgruntled employee is the employee who wrote aprogram that would erase all the company’s files if their name was ever erased (Gragg 94). Thisdisgruntled employee who gets fired at 2:00 p.m. and gets removed from the company networkimmediately does not need to have access after the fact to do damage to his former company.Another case involved a company supervisor who thought they were about to be terminateddeleting the passwords of all here peers using a master file stolen from her company (Ban andHeng 95).
This paper included the dishonest employee in this category. These employees are selfishand self-serving no matter where they work. They typically could alter financial data to generatefinancial disbursements for personal gain or use their computer privileges to discoverunauthorized information for personal gain (Dray 88). A common example of a disgruntleddishonest employee is the former employee who planted a logic bomb and demanded payment of$500,000 or the companies entire computer network would go down for one week. Instead of a
5
bomb the former employee could threaten to release company secrets from a private databasethey had been compiling over a period of years. The irony of this scenario is that the extortiondemand may not in fact be coming from the former employee, but from a Hacker who isimpersonating the former employee. On the other hand the former employee could impersonate aHacker and demand untraceable payments in payer- and payee untraceable Chaum-style cash.This is digital cash only. For example, the extortionist tells the company to purchase $500,000worth of Bank of Albania crypto-credits. By using anonymous remailers with reply-blockcapabilities or posting the crypto-credits to a Usenet the cyber trail disappears (May 97). Thedisgruntled employee moves to the South Pacific and with his laptop and modem redeems thecrypto cash as they see fit. To ensure the cooperation of the Bank of Albania a hefty commissionof $50,000 crypto credits could ensure deniability of the entire transaction taking place. Theaverage cost of internal fraud through information theft is $178, 571 per occurrence (Falconer95). A highly publicized computer fraud case in Singapore against a store manager manipulatingdaily sales reports cost the company $87,967.15 of which only $24,050 was ever recovered (Banand Heng 95). Denial of service attacks are the work of people who are angry at your website(Russell and Zwicky 97). Thus, just because your company does not have a disgruntledemployee, another company may have one who is angry at your company.
The problems faced by a small to medium sized enterprise from a disgruntled employee arean order of magnitude worse than by large corporations. Over half of these smaller companiesdo not even have an Information Technology staff. The criticality of computer operations maymean the difference between bankruptcy and solvency day to day if the small firm does not havethe capability to use a manual backup or the knowledge to quickly restore the operationscomputer. More than half of the Singapore Institute of Management Survey had a goal ofrecovery of their computer systems from failure within 24 hours in order to minimize financiallosses caused by a halt of cash flow (Ban and Heng 95). Each employee carries a much largerportion of the companies burden of operations and is more critical to the total operation of thecompany.
Behavioral Changes in Good Employees Caused by Disgruntled Employees
The disgruntled employee may appear to be a normal employee on the surface to most otheremployees. If this employee ever encountered a cyber-terrorist group while he waspsychologically vulnerable, the cyber-terrorist group could exploit his knowledge and create ascheme to extort digital cash from the former employer. This type of cyber crime will be easy tocommit until the third-world countries of the Internet are ready to eavesdrop on electroniccommunications to protect the corporations from the cyber-terrorist or the disgruntled employee.Sometimes good employees become disgruntled because management tries to implement controlswhich are bothersome, time-wasting, stupid, unnecessary, and incredible. This causes the goodemployee to exhibit behavior of the disgruntled employee such as restricting output, delaying,uncooperative, misleading, falsifying records, refusing orders, withholding information,overloading others, excluding other work which sabotages, ignores, or avoids management’scontrols (Krull 95).
The changes implemented by management to control the attitudes of disgruntled employeesare nearly the same or the same as those implemented by management to control the attitudes ofHackers.The Good Employee
If an employee working on their own followed directions that their computer gave to them,how could anything bad happen? User instructions have been the subject of much research in thehuman computer interface field. Do users always see the instructions and are the instructions
6
clear? Surprisingly, most experts agree that accidental damage by an inept user is the biggestdanger of all (Gragg 94). The damage caused by inadvertent disclosure of information byaccidentally sending a file or email to a competitor company can be very damaging. If the bid fora proposal on a multi-million dollar contract inadvertently gets sent to the wrong email address,how much future revenue is lost if the competitor wins the contract because of that information.Mistakes, both errors and omissions, that result in a loss of data integrity such as miskeying1,000,000 as 100000 is a simple keyboard error with disastrous repercussions, programmers whodevelop code for large information systems may have inadvertently not tested the entire programwhich later reveals calculation errors in the millions of dollars (Dray 88). Employees that areencouraged to log on to the server from home to do extra work or perhaps read their email mayhave accidentally or unknowingly transmitted a virus. A New York Life Insurance Co. employeeworked on business software on his home PC which unbeknownst to him had been infected witha virus from his child’s game software. When he brought the file to work, he then inadvertentlyinfected the entire network which resulted in one and half weeks of computer downtime for theentire company (Scott 91). An employee watering plants in the office may unknowingly waterthe pot after another employee had already watered the plants just before quitting time. The nextmorning the employee gets admonished because the fire department came that night to put out anelectrical fire caused by a monitor left on which was located underneath a cubicle shelf that theplants were on when the water came out of the pot onto the shelf and dripped down into themonitor. The result is the destruction of a $3,000 monitor and possibly destroying the entirebuilding. A lightning strike destroyed a $10,000 server because it was not shut off over theweekend. The network administrator was following instructions to keep the server operational 24hours so that company employees could log into it at any time. The threat from accidental loss ordisruption grows more than the deliberate theft or vandalism of computers as data gets dispersedthroughout the corporation giving more employees greater access to more data (Scott 91).
Another type of employee is the one who does not want their electronic mail database backedup. Some attorneys at law worry that electronic mail may end up being used against them incourt (Scott 91). Requests for documents in any type of court trial has expanded from hard copyor paper based documents to any electronic or digitized documentation. Doctors and attorneysalso worry about need-to-know information. The attorney-client and doctor-patient relationshipis based on confidentiality and privacy. Attorneys working at the same law firm generally do notneed to know about other attorneys’ clients or cases. Doctors working at the same hospital orhealth clinic generally do not need to know about other doctors’ patients. The networksupporting these lawyers and doctors must be able to restrict access within the network and alsoto outside the network.
Behavioral Changes in Good Employees
The New York Life Insurance Co. security incident spurred management to establish a policythat no one place PC software onto a company computer unless the software is shrink-wrapped orhas first been scanned (Scott 91). Employees who collaborate on projects must now scan filessent to them by other employees through email or on a diskette. The atmosphere of trust has gonefrom one extreme to the other. New York Life ignorantly trusted everything on their computersystems until this large security incident completely changed their attitudes toward computersecurity to one of trusting no one. This company also implemented smart cards for all theirhome-office employees who telecommute because the company could not guarantee that theirhome-office employees who dialed up were not in fact a Hacker attempting to gain access to thecompany computers. New York Life also places special software on all the agents laptopcomputers which must be active in order to communicate with the main computers.

7
Attorneys who once freely wrote down notes on their computers and attached them toelectronic mail messages now think twice about what they record on their computers. Many ideasand premises no longer get recorded on the computer. Rather, the attorney writes confidentialideas on paper and keeps the copy under lock and key. If he decides to destroy the evidence, hesimply shreds the paper and there is no record of the document. Electronic mail is not the same.Oliver North thought that he deleted his electronic mail files when the Iran-Contra Affair camebefore Congress and the courts. However, since the security people did their job, the networkadministrator was able to reconstruct his electronic mail account from electronic backups takenwhile he was a national security advisor. This evidence was used against him during hissubsequent trial. Attorneys and doctors who use their organization’s computer network may haveaccess to information they should not. An ethical lawyer or doctor would not open the filespertaining to other attorneys’ clients or doctors’ patients. If the network administrator sets upaccess control to files or records of patients and clients then they could monitor who attempted toopen files restricted from that user and report that information to senior management.
At the corporate management level, most companies keep knowledge about virus activity,data losses, computer problems, etc. confidential and internal to their company because theybelieve that public knowledge of security breaches could be more harmful to the business thanallowing the criminal to go unpunished (Gragg 94).
ANALYSIS
How does management control the attitude of the Hackers, disgruntled employees, and goodemployees? It is clear from the literature review that the main theme of Internet Security must bethat of control of individuals and group behavior. One of the frightening aspects of the Internet isthat of the lack of control. No one entity or group is really in charge of the entire Internet. Someresearchers feel that there is too much effort and handwringing about uncontrollable IT-enabledenvironments such as the Internet (Krull 95). How can the trustworthiness of the Internet beguaranteed? One of the strongest groups on the Internet is the Internet Engineering Task Force.It has developed security standards for secure electronic transactions based on the hostile attitudeof the Hackers and the disgruntled employees and the potential damage these two types ofindividuals and groups can unleash. The IETF security standards also include some minor onesfor even the good employee who can always accidentally damage files, etc. Control in aninformation processing system complements security by providing direction, prevention,detection, and correction; it does not supplant it (Menkus 91). How can this relate to literallymillions of internetworked information processing systems? Most company’s managementassumes that it has the right to control the use of information in their company. Individuals andgroups also assume that they have the right to control information in their group or entity.Hackers could be considered as antiestablishment just as the Hippies were in the 1960s. Acommon issue challenging the right of the establishment is electronic mail. Groups insidecompanies have seen individuals within their companies get terminated or admonished forsending certain context within their electronic mail. More recently, the establishment hasterminated and admonished employees for viewing explicitly sexual or pornographic web sites oncompany owned computers. Access to the Internet at work has caused yet another area formanagement to establish and maintain control. Many employees who used to be good employeesare now suddenly disgruntled employees because they took advantage of the Internet accessprovided by their employer and while they explored the Internet, took the wrong paths thru theweb. Several cases of employees getting terminated for viewing pornographic websites havealready occurred. Management’s ego may be satiated by the sacrifice of the few disgruntledemployees to make examples to the remainder of good employees. Management may feel likethey are in control again. However, a secure information system is more expensive to operate

8
than a less secure system because security and audit detract from response time and throughput oftransactions (Sizer and Clark 89). Thus security and audit may counter what management wantsto do and even interfere with business operations (Krull 95). However, with the distribution ofdata to horizontal levels, management must rely upon the information system to provide themechanisms to control the data. The types of threats to control by a company falls into threebroad domains shown in the following table:
Threat DomainClassified Personal Financial
Indiscretion by 2 or more insiders Minor risk Medium risk Minor riskOutsider involvement by chance Minor risk Medium risk Medium riskDeliberate, based on skill and/or knowledge by aspy or dishonest employee
Major risk Minor risk Major risk
Table 1. Risk assessment in 3 domains (Sizer and Clark 89)
Clearly, the Hacker and the disgruntled employee present the Major risk to the classified andfinancial domains. However, the good employee indiscretion presents a medium risk to thepersonal domain and based on the large number of security incidents compared to the Hackermay really present the biggest risk to a company. Some current security techniques used bymanagement include applications and personnel screening, audit software, dial-up accessrestrictions, password controls, encryption, backup hardware, backup of key data files, andphysical security for hardware (Dray 88). Future control strategies will rely less on intensivesurveillance, policing, and micromanagement of employee’s behavior (Krull 95). The financialamount to spend on security is split between taking 2% - 5% of the companies computer budgetor by determining the value of the information in the specific type of business (Falconer 95).Controlling the knowledge worker of the future will involve conditioning them while in schoolsand universities so that by the time they enter the work force they will exhibit proper etiquetteand behavior in a digital economy. Knowledge workers will use the Internet and computers toearn their status and develop their reputation as individuals and as groups (Stone 97).
CONCLUSIONS
The threat of accidents by good employees has stimulated some companies who have missioncritical data residing on their computers to increase user awareness of computer hazards byproviding training and establishing computer virus policies especially for downloading softwarefrom the Internet. Training users on how to recognize signs of viral activity such as sluggishresponse time or rapid filling up of hard drive space, and how to use the anti-virus software, etc.may reduce the damage from a security incident (Gragg 94). Preventing people from havingmodems unless absolutely necessary is vital to a TCP/IP based network. but Avon Products, Inc.implemented a security policy which spelled out the individual computer users responsibilitiesand routinely sent out reminders that warned employees who seriously abuse the computerequipment or proprietary information can lose their jobs or go to jail (Scott 91). How doesmanagement strike an acceptable balance between security and accessibility, and between thetrust-no-one atmosphere of New York Life that insults the good employees and reasonableprecautions like Avon Products, Inc.? Every company should have at a minimum a policy onwho has access to what files, and should make sure that their employees cannot execute programsthey have not yet been trained to use. It is not good to assume that someone who has no need tomanipulate database tables will never do so. If the files can be reached by clicking on a button,sooner or later, someone will open up the unauthorized file and accidentally or intentionally doextensive while trying to find a way to hurriedly exit the unauthorized file, rather than to admit to
9
what they did and ask for help (Gragg 94). Organizations wanting to be more productive mayincrease accountability of individuals for their own work but remove some controls; reward risk-taking; and empower the employee (Krull 95).
When a significant security incident happens and results in several million dollars of lostproductivity or revenue, the company typically overreacts. The New York Life security incidentwith the virus caused that company to create a virus team of 6-8 people in the data security groupwhich now keeps abreast of viruses, provided virus scanning software to all employees andupdates computer operations policy (Scott 91). If this virus team could come up with a viruskiller that would continuously hunt for known viruses across the network then the number ofvirus specimens in circulation would decrease (Kensey 93). What does senior management do ifthe companies contract partner has a lax computer security program? Wouldn’t it be safer to betrading partners with New York Life than Avon? If you are New York Life do you trust anyoneoutside of your company? What sense does it make for New York Life to have a foolproofsecurity system if their stockbroker does not? One would surmise that company computersecurity budgets are on the rise from the presented information and the publication of securityincidents. On the contrary, many companies have actually cut their security budgets becausenothing has happened to them yet and they feel security is not a problem in order to save shortterm cash (Falconer 95).
RECOMMENDATIONS FOR FURTHER RESEARCH
Group trust of individuals and other groups within a company using computers is harder thanever. Companies trusting other companies is harder than ever. How can individuals expect totrust cyberspace enough to spend digital cash without worrying about its security? The FinancialAction Task Force is examining how to conduct electronic commerce securely. One of the bestalternatives for secure electronic transactions will be based on Java. The Java ElectronicCommerce Framework will allow the secure exchange of digital cash between two parties basedon each parties digital signature. The Virtual World Group is developing products withpersistence or a sense of history or memory of what cyber-people build, share, and exchange(Stone 97). These virtual world products may let researchers better capture the group psyche ofHackers, disgruntled employees, and good employees. With a better knowledge of thebackground and capabilities of Hackers and disgruntled employees, research needs to be done inthe area individual and community attitudes toward Internet security. An employee now mustquestion the cyber-customer in the same or similar manner each employee must question anotheremployee. Thus further research about the cyber-customer needs to be done so the vendors knowtheir customer. Cyber-shopping at a cyber-mall should be protected by a cyber-mall securityforce that knows the cyber-customer. Researchers must be able to think in a virtual world wherenothing is real.
REFERENCES
(Ban and Heng 95) Ban, Lim Yew and Heng, Goh Moh, Computer Security Issues in Small andMedium-sized Enterprises, Singapore Management Review, Vol. 17, No. 1, Jan 1995, pp. 15-29.
(Dray 88) Dray, Jim, Computer Security and Crime: Implications For Policy and Action, pp.297-313.
(Effross 97) Effross, Walter, From Cyberbucks to Cyberpunk: Tomorrow’s ElectronicCommerce on Today’s Mean Streets, URL: http://www.arraydev.com/commerce/jibc/9702-12.htm.

10
Falconer, Tim, Cyber crooks [Unarmed, but dangerous], Chartered Accountants Magazine, Vol.128, No. 10, Dec 1995, pp. 12-17.
(Gragg 94) Gragg, Ellen, Computer Security: Terrible Things Do Happen, Office Systems, Vol.11, No. 2, Feb 94, pp. 41-44.
(Kensey 93) Kensey, Michael F., Computer Viruses—Towards Better Solutions, Computers andSecurity Journal, Vol. 12, No. 6, 1993, Elsevier Science Ltd: Great Britain, pp. 537-541.
(Krull 95) Krull, Alan R., Controls in the Next Millennium: Anticipating the IT-enabled Future,Computers & Security Journal, Vol 14, No. 6, 1995, Elsevier Science Ltd, Great Britain, pp.491-495.
(Lindup 94) Lindup, Ken, The Cyberpunk Age, Computers and Security Journal, Vol. 13, No. 8,1994, Elsevier Science Ltd: Great Britain, pp. 637-645.
(May 97) May, Tim, Untraceable Payments, Extortion, and Other Bad Things, URL:http://www.arraydev.com/commerce/jibc/9701-7.htm.
(Menkus 91) Menkus, Belden, “Control” is Fundamental to Successful Information Security,Computers & Security Journal, Vol. 10, No. 4, Jun 1991, pp. 293-297.
(Russell and Zwicky 97), Russell, Deborah and Zwicky, Elizabeth, Getting a Handle On InternetSecurity, URL: http://www.geocities.com/CapeCanaveral/3498/inetsec.htm, 1997.
(Scott 91) Scott, Robert W., Computer Security: Five Top CIOs Take Aim at a ComplexProblem, Chief Information Officer Journal, Vol. 4, No. 1, Faulkner & Gray: New York,New York, pp. 5-12.
(Sizer and Clark 89) Sizer, Richard and Clark, John, Computer security—a pragmatic approachfor managers, Security Journal, Vol 11, No. 2, April 1989, pp. 88-98.
(Stone 97) Stone, Linda, Virtually Yours: The Internet as a Social Medium, URL:http://home.microsoft.com/reading/reading.asp, 1997.
AN IMPLEMENTATION OF SOFTWARE AGENTS IN A DECISION SUPPORT SYSTEM
Traci J. Hess, Virginia Tech, Blacksburg, VA 24061-0235 (540) 231-7846
ABSTRACT
A brief description of software agents is provided, emphasizing required and relevant agent features. Theusefulness of agents in Decision Support Systems (DSS) in general is illustrated, and specific agentcharacteristics are mapped to the three subsystems within a DSS. Finally, the major effort of the papershows an implemented agent system, whereby four types of agents are created and set into action. Fuzzylogic is employed by the master agent to determine when the user should be notified of pricing changes.
INTRODUCTION
The release of agent-enabled commercial software and the focus on agent applications within researchlabs over the past several years has drawn attention to the computing concept of software agents.Software agents are most commonly thought of as an extended metaphor for a personal assistance, anentity that carries out a task and/or reduces complexity for the user. The successful implementation ofagents in commercial and research applications has prompted market studies and even a prediction byIBM of agents becoming “the most important computing paradigm in the next ten years” [9 p.3].
Commercial and research applications have employed software agents in email, meeting scheduling andsome Internet applications [4][12][15]. These applications provide graphical user interfaces and areintended to be used by individuals with all levels of computing experience. Decision Support Systems(DSS) provide an ideal environment for a business implementation of software agents[10][11]. DSS aredesigned for use by individuals, frequently managers with little computing experience, for the purpose ofsupporting these individuals in a dynamic, decision making environment. In providing processindependent support for the decision maker, a DSS must be able to adapt to changes in businessstrategies, data and the preferences of the user. The difficulty of providing this flexibility often preventsthe successful implementation of a DSS [19].
In this paper, a description of how agents can be integrated within the three subsystems of a DSS isprovided and a prototype of an agent-enabled DSS is described. This prototype was implemented for thepurpose of demonstrating how agents with different features can be utilized within the subsystems of anactual DSS.
BACKGROUND: SOFTWARE AGENTS
The abstract nature of software agents and the potential functionality that can be incorporated into onehave made it difficult for a single definition of a software agent to be widely accepted [5][6][12]. Asoftware agent is a program with characteristics that distinguish it from a standard subroutine or softwareapplication. Several key characteristics are common among most descriptions of software agents andoffer minimal requirements for software to be classified as agent-like. These characteristics areautonomy, reactivity, persistence and purposefulness [1][8]. Mobility, interaction and intelligence areagent characteristics that are not required for software to be considered agent-like. The usefulness andfunctionality of agents is limited, however, if agents cannot exhibit one or more of these qualities.Required Agent Features
Autonomy is a characteristic that appears in most definitions of software agents. The interpretations ofautonomy with regard to software agents vary widely from Foner’s requirement that agents take “periodicaction, spontaneous execution, and initiative” [5, p.1] to Franklin and Graesser’s less restrictiverequirement that agents “exercise control over their own actions” [6, p.6]. Reactivity is another keycharacteristic of agent behavior. Software agents are designed to carry out objectives in a specificenvironment. Within a defined domain, agents are given the authority to carry out a task and are requiredto react appropriately to changes in this domain or context. An agent must be assigned to a specificenvironment to exercise this reactivity, and as Franklin and Graesser stress, an agent may cease to be anagent when it is outside of its environment [6]. The added requirement of persistence further restricts theset of software programs whose behavior qualifies as agent-like. Software agents must run or executecontinuously and are frequently referred to as inhabiting or continuously perceiving their environment.Agents can be further defined by the requirement that they be purposeful and “realize a set of goals ortasks for which they were designed” [16, p.108]. Their reactivity must be tempered such that agents arenot continuously running programs that simply react to changes in the environment.
Useful Agent Features
Agent mobility is achieved by dispatching the agent to a remote location. In computational terms, amobile agent is an agent software program that is passed, as a whole, to a remote location where itexecutes. The entire program is passed to the remote server, including its “code, data, execution state andtravel itinerary” [13, p.1]. In an agent-enabled network, each node can serve and support agentsproviding a peer-to-peer functionality. Client stations can host mobile agent executions reducing networktraffic and server overload. Agent communication is commonly defined as the ability of the agent tocommunicate with other agents or with humans [6]. An agent that can exchange information with otheragents can be more efficient through cooperation and delegation. An agent communication language(ACL) has been developed by the Knowledge Sharing Effort, a joint initiative of several research groups,to provide a means for communication among agents developed in different programming environmentsfor different purposes or domains [7][17]. Intelligence is perhaps the more difficult agent characteristic todefine [3][18]. IBM generally describes intelligence with regard to its own agents as the “degree ofreasoning and learned behavior: the agent’s ability to accept the user’s statement of goals and carry outthe task delegated to it” [9, p. 1]. Intelligent agents can utilize any type of intelligence architecturedepending on the task they have been assigned to perform. Agents can employ case-based reasoning,machine learning, operations research methods, or any number of specific algorithms to help them betterand more independently accomplish their task.
INTEGRATING AGENTS WITHIN A DSS
The three subsystems within a DSS provide a useful delineation for the integration of software agents.These three subsystems, the dialog generation and management software (DGMS), the databasemanagement software (DBMS) and the model based management software (MBMS), separate the DSSinto components based upon the task being performed [19]. Breaking down the DSS into componentsallows us to determine which characteristics are more useful in specific tasks and thus map agents withcertain characteristics to the three DSS components. The levels of autonomy, reactivity, persistence andpurposefulness that an agent can exhibit, in various combinations with the useful characteristics ofmobility, intelligence and interaction, create a wide range of possible agent types. In this paper, somegeneral types of agents are identified for each of the subsystems.
The Database Management Software Component
In the DBMS component of a DSS, the primary task is the capture and storage of internal and externaldata. While the process of extraction should be automated so as to not disrupt the decision makingprocess of the user, changing data needs, heterogeneous data sources and distributed data sources oftenprevent this automation. Software agents that gather data can automate the extraction process andeliminate the manual entry of data by the user. Such data gathering agents do not require much, if any,intelligence. The persistence exhibited by these agents can provide real-time data to the DSS bycontinually updating the data stored in the DBMS. Data gathering agents need minimal communicativeabilities to inform a master agent of data changes. With mobility, agents can travel to remote sites toretrieve data, remain at the remote sight and then send back messages when the data changes. Themobility feature provides network and processing efficiencies that are unavailable with static, datagathering agents. The agent can also be implemented in any programming language and can thusovercome the complexity of data extraction from heterogeneous applications.
The Model Base Management Software Component
The primary function of the MBMS subsystem is the creation, storage and update of models that enablethe problem solving process within a DSS [19]. The models utilize the data stored within the DBMSsubsystem in creating alternate solutions for the user. If the models used to propose alternatives areoutdated or specified incorrectly, the usefulness of the DSS declines. The complexity and timeconsuming nature of specifying models, whether the models are stored as subroutines, statements or data,contributes to the ease with which models become outdated. Software agents can facilitate the initialgeneration of models and assist in the restructuring process. Agents can monitor the actions of the userwithin the DGMS and learn the patterns of actions and events that signal the need for a new model or theupdate of an old one. These learning agents would require a high level of autonomy and must beendowed with intelligence. This simple form of intelligence would be implemented as the ability toremember or store the features of alternatives selected and prompt the user to update or change the modelwhen the alternatives selected differ significantly from the recommendations of the model. Mobilitywould not be useful in this domain as the agent would need to remain resident within the interface towatch the user’s actions. The agent would require communicative abilities since one agent would mostlikely monitor one model, but would need to inform the agents assigned to dependent models of anychanges.
The Dialog Generation Management Software Component
The DGMS subsystem provides a user interface, enabling the user to interact with the DBMS and MBMSsubsystems. Usability issues with the DGMS can determine the overall success or failure of the DSS.The ability to provide dialog styles that reflect the preferences of the users is one of the primary functionsof the DGMS [19]. This capability has proven difficult to successfully implement as most DSS do nottake a proactive approach to ascertaining the user’s preferences. A software agent in the form of aninterface learning agent can help to resolve this problem by learning the user’s interface preferences in thesame manner that agents learned new models in the MBMS subsystem. By recognizing patterns ofactions and events by the user, the agent can automatically alter the order of representations displayed bythe DGMS or provide control mechanisms that give the user greater flexibility. The interface agent thensuccessfully automates a previously manual and often complex process. An interface learning agentrequires levels of autonomy, intelligence, mobility and communicative abilities similar to that exhibitedby the MBMS learning agent.

EXAMPLE IMPLEMENTATION
A prototype of an agent-enabled, product-pricing application was implemented to provide an example ofhow software agents could be integrated into a DSS. This implementation demonstrates the agentcharacteristics described above and explains in depth how some simple agents can be utilized within thethree subsystems of a DSS. The agents were implemented in Java using IBM’s Aglet Workbench[2][13][14], an Application Programming Interface (API) for designing agents. The Aglet Workbenchprovides a set of core classes that can be extended to create mobile, intelligent agents and supportsKQML for agent communication.
A DSS that supports product pricing for a manager would store data from sources both internal andexternal to the firm. In this example, the Internet is used to gather external data, and an intranet is used togather data internal to the manager’s firm. External data is needed from competitors and suppliers whoare geographically dispersed. Internal data is needed from the company’s headquarters. Both externaland internal data is stored in the DBMS component of the DSS. Prior to the integration of agents, themanager would update the DBMS component of the DSS periodically with any changes in competitors’prices or production costs.
In this implementation of software agents shown in Figure 1, a master agent (A1) creates static, datagathering agents (A2, A3, A4) to monitor the competitions’ prices, download changes and record thesechanges in the DBMS. A learning agent (A5) is deployed to watch the manager’s actions through theDGMS portion of the DSS. The learning agent notices that the manager manually updates productioncosts within the DBMS and reports this information to the master agent. The master agent then deploysmobile, data gathering agents (A6, A7, A8, A9) to monitor the cost of raw materials and production costs.The agents used in this implementation demonstrate the various agent characteristics and show how thesecharacteristics can be utilized within the various components of a DSS. The decomposition anddecoupling of tasks pursued in the design of this system facilitates the reuse of individual agents withindifferent agent applications.
To demonstrate the effect of problem solving abilities on autonomy, the master agent is equipped withfuzzy logic. Rather than requiring the manager’s intervention everytime the static, data gathering agentsreport changes in the competitions’ prices, the master agent uses fuzzy logic to decide whether or not tonotify the manager. The initial fuzzy membership sets would be specified by the manager or could beinferred by a learning agent watching the manager’s reactions to price changes through the DGMS. Themembership sets and rules would be stored in the MBMS component of the DSS. In this application,percentage price change and price level are identified as linguistic variables. The percentage changefuzzy membership sets are described as drastic, moderate, minimal and near zero, reflecting thepercentage change in a competitor’s price. The rules for the percentage change variable listed below,determine whether or not the manager should be notified of a percentage change in a competitor’s price.The rules for the price level fuzzy membership set were similarly implemented.
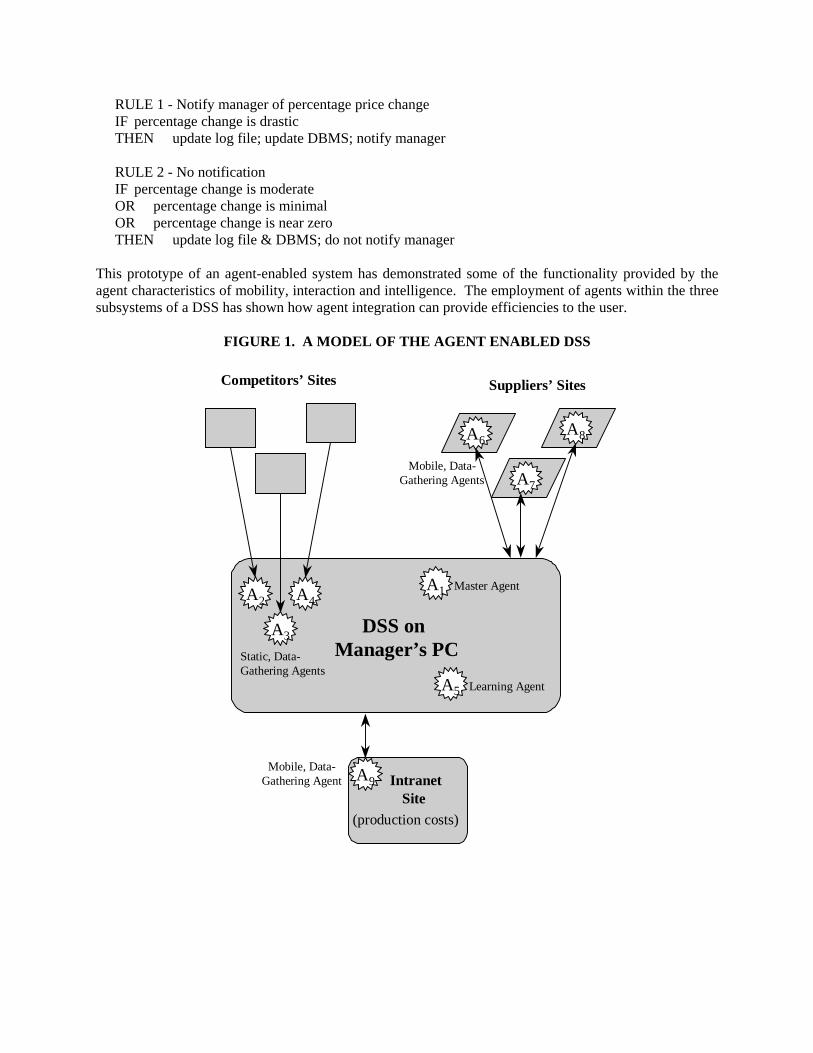
RULE 1 - Notify manager of percentage price changeIF percentage change is drasticTHEN update log file; update DBMS; notify manager
RULE 2 - No notificationIF percentage change is moderateOR percentage change is minimalOR percentage change is near zeroTHEN update log file & DBMS; do not notify manager
This prototype of an agent-enabled system has demonstrated some of the functionality provided by theagent characteristics of mobility, interaction and intelligence. The employment of agents within the threesubsystems of a DSS has shown how agent integration can provide efficiencies to the user.
FIGURE 1. A MODEL OF THE AGENT ENABLED DSS
DSS onManager’s PC
(production costs)
Suppliers’ SitesCompetitors’ Sites
A4
A3
A2
Static, Data-Gathering Agents
A6A8
A7
Mobile, Data-Gathering Agents
A1
A5
Master Agent
Learning Agent
A9Mobile, Data-
Gathering Agent IntranetSite

CONCLUSION
Software agents have received much attention and hype in the media and literature. This research showsthat at least some of this notoriety is well founded as there is widespread utility for this relatively newcomputing paradigm within the Decision Support System domain. This paper has made threecontributions: (1) a synthesis of agent features found in the literature; (2) a development and descriptionof agent capabilities within a DSS; and (3) an illustrative example of an agent-based system implementedover the Internet that shows how agent features utilized within a DSS provide useful managerial support.
REFERENCES
[1] Bradshaw, J.M. Software Agents. Menlo Park, CA: AAAI Press / The MIT Press, 1997.[2] Chang, D.T. and Lange, D.B. “Mobile Agents: A New Paradigm for Distributed Object
Computing on the WWW.” OOPSLA ’96 Workshop, Toward the Integration of WWW andDistributed Object Technology, 1996.
[3] Covrigaru, A.A. and Lindsay, R.K. “Deterministic Autonomous Systems.” AI Magazine, 1991,12(3), 110-117.
[4] Etzioni, O. and Weld, D. “A Softbot-Based Interface to the Internet.” Communications of theACM, 1994, 37(7), 72-76.
[5] Foner, L. “What’s An Agent Anyway?” A Sociological Case Study, Agents Memo, 93-01, MediaLab, Massachusetts Institute of Technology, 1993.
[6] Franklin, S. and Graesser, A. “Is It an Agent, or Just a Program?: A Taxonomy for AutonomousAgents.” Proceedings of the Third International Workshop on Agent Theories, Architectures, andLanguages, 1996.
[7] Genesereth, M. R. and Ketchpel, S.P. “Software Agents.” Communications of the ACM, 1994,37(7), 48-53.
[8] Gilbert, D. “Intelligent Agents: The Right Information at the Right Time - A White Paper,”http://www.network. ibm.com/iag/iagwp1.html, 1997.
[9] Gilbert, D. and Janca, P. “IBM Intelligent Agents - A White Paper,” http://www.network.ibm.com/iag/iagwp1.html, 1995.
[10] Hess, T., Rakes T.R. and Rees, L.P. “A Conceptual Framework for the Use of Software Agents inDecision Support Systems.” Unpublished working paper, 1997.
[11] Hess, T.J., Rakes, T.R., Rees, L.P. “Diverse Software Agents at Work.” Unpublished workingpaper, 1997.
[12] Kautz, H., Selman, B., Coen, M., Ketchpel, S. and Ramming, C. “An Experiment in the Design ofSoftware Agents.” Proceedings of the Twelfth National Conference on Artificial Intelligence,1994, 12(2), 438-443.
[13] Lange, D.B. “Java Aglet Application Programming Interface (J-AAPI) - A White Paper.”http://www/trl.ibm.co.jp/aglets/aglets/JAAPI-whitepaper.html, 1996.
[14] Lange, D.B. and Chang, D.T. “IBM Aglets Workbench: Programming Mobile Agents in Java - AWhite Paper.” http://www.trl.ibm.co.jp/aglets/whitepaper.html, 1995.
[15] Maes, P. “Agents that Reduce Work and Information Overload.” Communications of the ACM,1994, 37(7), 31-40.
[16] Maes, P. “Artificial Life Meets Entertainment: Life Like Autonomous Agents.” Communicationsof the ACM, 1995, 38(11), 108-114.
[17] Neches, R., Fikes, R., Finin, T., Gruber, T., Patil, R., Senator, T., and Swartout, W.R. “EnablingTechnology for Knowledge Sharing.” AI Magazine, 1991, 12(3), 36-56.
[18] Petrie, C. J. “Agent-Based Engineering, the Web and Intelligence.” IEEE Expert, 1996, 11(6), 24-29.

[19] Sprague, R.H., and Carlson, E.D. Building Effective Decision Support Systems. Englewood Cliffs,NJ: Prentice Hall, 1982.

Best Paper in Track Award Recipients
Accounting“Implementing Activity-Based Costing Systems: An Exploratory Survey of Issues, Benefits, andEffect on Overall Performance”
Charlotte T. Houke, The Business Consulting Group, Inc.Nabil A. Ibrahim, Augusta State UniversityPamela Jackson, Augusta State University
Educational Innovation“Classroom Education With No Books”
Mohan P. Rao, Texas A&M University - Kingsville
Finance and Economics“A Reexamination of the Size Effect with Transaction Costs and Alternative Market Portfolios”
Ravinder K. Bhardwaj, Winthrop UniversityLeRoy D. Brooks, University of South Carolina
Information Technology and Systems and AI“An Analysis Tool for Measuring a Firm’s Degree of Supply Chain Coupling”
Mehmet Barut, Clemson UniversityWolfgang Faisst, University of Erlangen-NurnbergJohn J. Kanet, Clemson University
International Issues“Privatization of Pension Funds and Economic Well-Being in Four Latin American Countries”
Gonzalo E. Reyna, Radford UniversityJosetta S. McLaughlin, Radford University
Marketing and Logistics“Postmodern and Positivist Links in Consumer Behavior Research”
Alan J. Greco, North Carolina A&T State University
Production and Operations Management“On the Use of Fill-Rate Criterion to Determine the Optimal Order-Point-Order-QuantityInventory Control Policy: A Theoretical Perspective and A Case Study”
Amy Z. Zeng, University of North Carolina-Wilmington
Quality Issues“The Cost of Quality and Nonconformance: A Total Quality Systems Approach”
Gregory S. Little, AFG Industries, Inc.Ronald G. McMasters, AFG Industries, Inc.Andrew J. Czuchry, East Tennessee State University
Quantitative Theory and Methods“An Efficient Algorithm for the Two Parallel Processors Problem”
Johnny C. Ho, Columbus State UniversityJatinder N. D. Gupta, Ball State UniversityScott Webster, University of Wisconsin – Madison
Note: Only completed papers are eligible for consideration for paper awards. The program chair and current officersare not eligible for any award. Track chairs are not eligible for awards within their tracks. Papers not presented at themeeting and/or not published in the Proceedings are not eligible for any award.
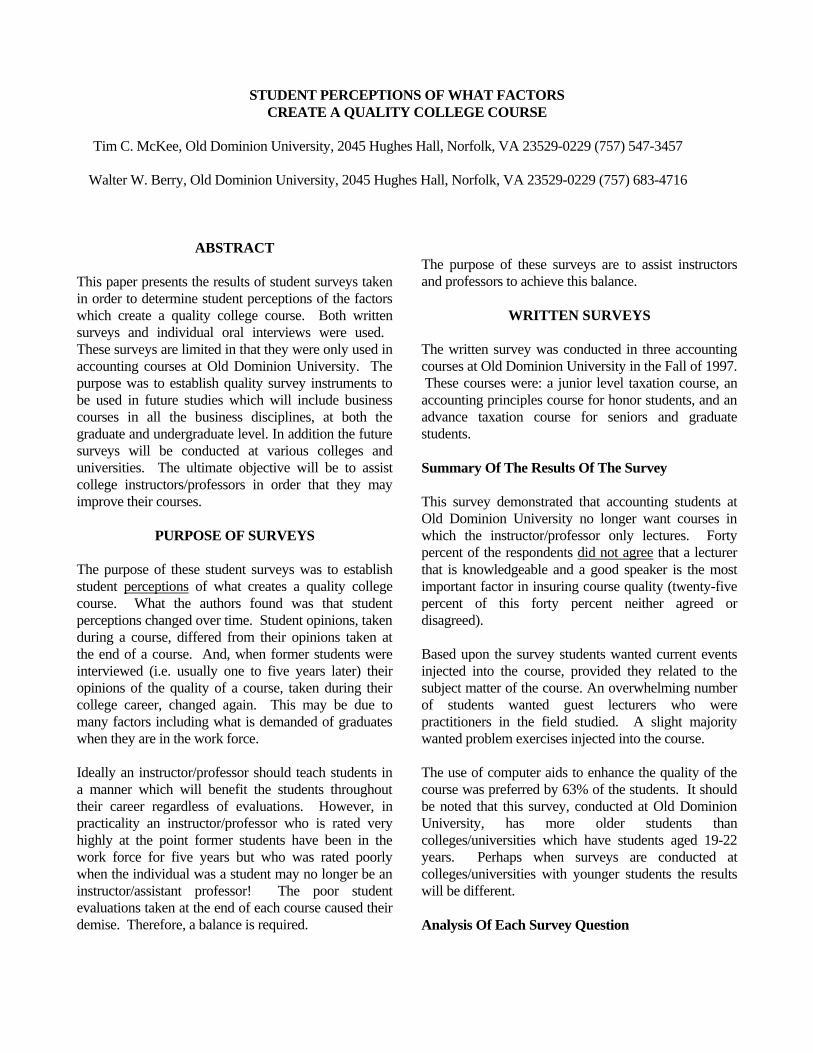
STUDENT PERCEPTIONS OF WHAT FACTORSCREATE A QUALITY COLLEGE COURSE
Tim C. McKee, Old Dominion University, 2045 Hughes Hall, Norfolk, VA 23529-0229 (757) 547-3457
Walter W. Berry, Old Dominion University, 2045 Hughes Hall, Norfolk, VA 23529-0229 (757) 683-4716
ABSTRACT
This paper presents the results of student surveys takenin order to determine student perceptions of the factorswhich create a quality college course. Both writtensurveys and individual oral interviews were used. These surveys are limited in that they were only used inaccounting courses at Old Dominion University. Thepurpose was to establish quality survey instruments tobe used in future studies which will include businesscourses in all the business disciplines, at both thegraduate and undergraduate level. In addition the futuresurveys will be conducted at various colleges anduniversities. The ultimate objective will be to assistcollege instructors/professors in order that they mayimprove their courses.
PURPOSE OF SURVEYS
The purpose of these student surveys was to establishstudent perceptions of what creates a quality collegecourse. What the authors found was that studentperceptions changed over time. Student opinions, takenduring a course, differed from their opinions taken atthe end of a course. And, when former students wereinterviewed (i.e. usually one to five years later) theiropinions of the quality of a course, taken during theircollege career, changed again. This may be due tomany factors including what is demanded of graduateswhen they are in the work force.
Ideally an instructor/professor should teach students ina manner which will benefit the students throughouttheir career regardless of evaluations. However, inpracticality an instructor/professor who is rated veryhighly at the point former students have been in thework force for five years but who was rated poorlywhen the individual was a student may no longer be aninstructor/assistant professor! The poor studentevaluations taken at the end of each course caused theirdemise. Therefore, a balance is required.
The purpose of these surveys are to assist instructorsand professors to achieve this balance.
WRITTEN SURVEYS
The written survey was conducted in three accountingcourses at Old Dominion University in the Fall of 1997. These courses were: a junior level taxation course, anaccounting principles course for honor students, and anadvance taxation course for seniors and graduatestudents.
Summary Of The Results Of The Survey
This survey demonstrated that accounting students atOld Dominion University no longer want courses inwhich the instructor/professor only lectures. Fortypercent of the respondents did not agree that a lecturerthat is knowledgeable and a good speaker is the mostimportant factor in insuring course quality (twenty-fivepercent of this forty percent neither agreed ordisagreed).
Based upon the survey students wanted current eventsinjected into the course, provided they related to thesubject matter of the course. An overwhelming numberof students wanted guest lecturers who werepractitioners in the field studied. A slight majoritywanted problem exercises injected into the course.
The use of computer aids to enhance the quality of thecourse was preferred by 63% of the students. It shouldbe noted that this survey, conducted at Old DominionUniversity, has more older students thancolleges/universities which have students aged 19-22years. Perhaps when surveys are conducted atcolleges/universities with younger students the resultswill be different.
Analysis Of Each Survey Question

Of the 52 respondents to the question "The quality of acourse is enhanced when the instructor only lectures" 73% disagreed or strongly disagreed. Only 7 students(14%) agreed or strongly agreed. This demonstrates thebelief that the old method of teaching, by lecture only,is not considered effective. It is evident that more thanjust lecture is expected by the students of today.
A response of 83% of the students preferred that real-world examples be included by the instructor in theirpresentation of the course material. It should be notedthat 8 (15%) of the students felt that real worldexamples lessened the quality of the course. Since thesurveys were completely anonymous it was impossibleto interview these 8 students. It is hopeful that in futurestudies we can determine why some students do not feelthat real world examples increase the quality of acourse.
Eighty-seven percent of the students surveyed felt thatguest lecturers, who are practitioners in the field of thecourse, increased the quality of the course. Only onestudent (2%) disagreed. It appears ironic that some ofstudents prefer to have a lecture by a practitioner in thefield but do not feel that the use of real world examplesenhance the quality of the course.
If current events are related to the course's subjectmatter 81% feel that they would add to the quality ofthe course. However, ten percent did not.
No one disagreed with the point that computergenerated visual aids enhance the quality of a coursebut almost 40% could neither agree or disagree on thispoint. Only 3 students (6%) strongly agreed. In futurestudies we need to ask how many students have had acourse in which an instructor used computer aids, andthen have these students compare their perceptions ofcourses using computer aids with courses not usingcomputer aids. The authors do not feel that many of thestudents who completed this survey had any coursewhich used computer aid.
The question of whether "A lecturer that isknowledgeable and is a good speaker is the mostimportant factor in insuring course quality" should bebroken into two parts for future studies. The results ofthis current survey showed that 40% of the respondentsneither agreed or disagreed, or they disagreed. In futuresurveys, one question will concentrate on the lecturer's knowledge and a second question will focus on theinstructor’s speaking ability. Slightly over 50% of the respondents felt that “problemsolving class exercises were more important thanlectures only”. This area needs to be explored more. Based upon oral interviews of students, problem-solving class exercises created tension in the classroomsetting. The students interviewed stated that when theywere called upon, at random, to answer assignedproblems they were intimidated and therefore wouldnot prefer this method of teaching. However, interviewsof students who had graduated four years earlier feltthat this method was very beneficial.
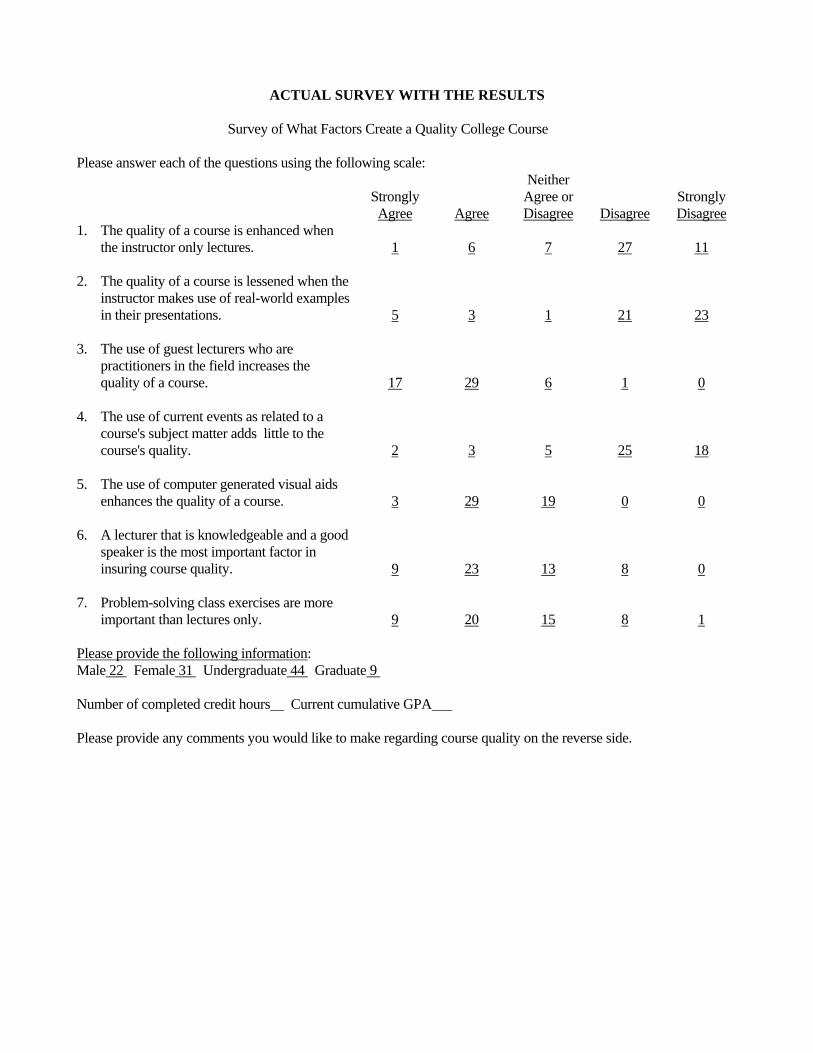
ACTUAL SURVEY WITH THE RESULTS
Survey of What Factors Create a Quality College Course
Please answer each of the questions using the following scale:
StronglyAgree Agree
NeitherAgree orDisagree Disagree
StronglyDisagree
1. The quality of a course is enhanced whenthe instructor only lectures.
1 6 7 27 11
2. The quality of a course is lessened when theinstructor makes use of real-world examplesin their presentations.
5 3 1 21 23
3. The use of guest lecturers who arepractitioners in the field increases thequality of a course.
17 29 6 1 0
4. The use of current events as related to acourse's subject matter adds little to thecourse's quality.
2 3 5 25 18
5. The use of computer generated visual aidsenhances the quality of a course.
3 29 19 0 0
6. A lecturer that is knowledgeable and a goodspeaker is the most important factor ininsuring course quality.
9 23 13 8 0
7. Problem-solving class exercises are moreimportant than lectures only. 9 20 15 8 1
Please provide the following information:Male 22 Female 31 Undergraduate 44 Graduate 9
Number of completed credit hours Current cumulative GPA
Please provide any comments you would like to make regarding course quality on the reverse side.

THE AUDIT AND PREVENTION OF CREDIT CARD FRAUD
Doug Haskett, Old Dominion University, Norfolk, VA 23529-0229 (757) 683-3514Doug Ziegenfuss, Old Dominion University, Norfolk, VA 23529-0229 (757) 683-3514
ABSTRACT
The purpose of this report is to provide a basic understanding of what credit card fraud is, how is it committed,how it is investigated, how to audit for it, and how to detect it. Some relevant statistical and technologicalinformation has been obtained from industry publications. The majority of the material presented in this reportis from the author's first hand knowledge of credit card fraud though more than 2,300 fraud cases whileemployed as an internal fraud investigator for a major U.S. bank card issuer.
There are six major types of credit card fraud. All but one can be realistically contained given the correctamount of technology and education of the general public. The most common type is know as lost and stolen. In this scenario a customer either misplaces or has their card stolen. The amount of loss per account is typicallyunder $2,000. The period of unauthorized use is usually a day or two. This is the oldest type of credit cardfraud and can be prevented if the customer keeps a close watch over their cards and notifies the bankimmediately if their card is missing. The historical rate of this type of fraud remains nearly constant to thepercentage of total cards issued in the public.
Mail and telephone order fraud is committed without the need of a physical card. All that is required is theaccount number, name of the customer, and the expiration date of the card. In this scenario the criminal merelyplaces a call or writes to a merchant requesting a product or service. Losses from this type of fraud to the bankare small as long as the customer notifies the bank when the fraud is discovered. Because a card is not presentfor the transaction it is the responsibility of the merchant to verify the validity of the purchase with thecustomer's bank. If the merchant fails to do this they will become liable for the loss. This process is known as achargeback and will be discussed later. Because banks rarely lose money on this type of transaction many donot classify mail and telephone transactions as fraud, choosing instead to handle it as a customer service matter. For this reason the real value of annual unauthorized purchases may be significantly greater than the $1.3Billion stated previously.
Counterfeiting is the most notorious of all credit card fraud classifications. This type of fraud has been inexistence for more than twenty years but became an epidemic in the late 1980's as new technology madecounterfeiting easier. Counterfeiting can be accomplished in two ways. Embossed counterfeit is altering theraised account numbers to produce a new account number. This requires an embosser. Purchases of embossersmust be registered with law enforcement but occasionally one of these machines gets stolen. An easier way tocounterfeit is by re-encoding the black magnetic strip on the back of the credit card with a new account number. Most of what is necessary to counterfeit magnetically can be purchased at radio shack. Losses on counterfeitcards were very high for a prolonged period of time. The average amount of loss was approximately $5,500. Because of this industry has taken drastic measures to make counterfeiting more difficult. These advances arediscussed later in the report.
Information change, also know as account takeover, has only been serious in the past 2 years. In order tocommit this type of fraud the criminal must call and convince a bank employee that they have recently moved. Once the address has been changed the criminal will later call for a new card. The amount of loss from this typeof fraud is typically between four and five thousand dollars, which is the average limit on a credit card. Somecriminals will boost the available credit line by sending in a stolen check as payment equal to the line of credit. This practice is known as boosting. Because the billing information is no longer going to the legitimate

customer the typical amount of time needed for detection is thirty to sixty days. Recent technological advancesin this area are discussed later in the report. It will suffice to say that the issuer is in the best position to preventthis crime by not sending out new cards immediately following an information request change.
Mail theft has always been a large problem for credit card issuers. There is a great deal of cooperation betweenbankcard investigators and postal inspectors. Credit card fraud as a result of mail theft was up 98% in 1994 over1993. The huge increase that started in 1992 in this type of fraud was the result of industry efforts aimed atcurbing counterfeiting. Between 1992 and 1993 postal inspectors made nearly 10,000 arrests for mail theft(Bruger14). Again, advances in technology that have assisted issuers in reducing this type of fraud will bediscussed later. Mail theft is usually separated from the garden variety stolen card because of it is not a crime ofcircumstance. It usually involves someone in the post office that can remove large numbers of cards from themail stream.
Fraudulent applications are the most troublesome type of credit card fraud for issuers. A criminal completing anapplication in the name of another individual with good credit perpetrates the crime. When the application isapproved the criminal will wait for the card. When the card is received it will be quickly used to its limit. Usually the criminal applies for many cards over a short period of time and can obtain more than $50,000 incredit from various banks within two to three weeks. Advances in technology which address this area will bediscussed later.
The criminals that commit credit card fraud are as diverse as the different types of credit card fraud. The mostnotorious is organized crime. Organized crime and credit card fraud has a twenty-year history. What started outas domestic credit card fraud has developed into international credit card fraud. Today, units of organized crimethat commit credit card fraud in the United States can be traced to such places as Honk Kong, Vietnam, Israel,Russia, and Central America. It is believed that credit card fraud financed the terrorist bombing of the WorldTrade Center in New York.
Some types of credit card fraud, such as lost and stolen cards, seem to be reasonably estimable. There are anexpected percentage of fraud incidents given a specified number of total cards in circulation. The remainingfive other categories change without warning and are driven by the criminals. For example, a decrease in onearea due to improved detection will close that loophole. Criminals will then look to exploit a new area and hopeto catch the industry off guard. The one aspect of credit card fraud that can be anticipated is that it is an ever-evolving beast. Criminals will discover a way to commit fraud and use it until it no longer works. They willthen test other strategies to find another weak link.
What is necessary to the success of credit card fraud is a supply of account numbers. With mail theft, lost andstolen cards, and fraud applications the account number is supplied by the bank. For mail and telephonepurchases, counterfeiting, and information change someone must compromise the account number with accessto it. Few incidents of bank employees selling account numbers have been documented. Any business thatprocesses credit cards presents a risk for leaking accounting numbers to criminals. Numerous cases involvingemployees of hotels and restaurants have been successfully infiltrated. It is estimated that 70% of accountnumbers that are compromised came from hotel and restaurant employees [2, p.42]. Customers of these types ofbusiness are great targets because they tend to use their card frequently and have large limits. Another greatsource of account numbers is mail and telephone businesses. They do an enormous volume at a central site,which makes identifying the leak very difficult. The most recent way to obtain account numbers is through theinternet. Some companies transmit transactions at the end of the day. One criminal was very creative andwiretapped an outbound phone line and downloaded the evening transmission to his computer. In just tenminutes more than 14,000 account numbers had been compromised. Many companies put massive amounts ofdata at risk thinking their security system is impenetrable. Such was the case of Wells Fargo Bank which hadcontracted with Netscape Communications to provide security for its on-line banking services. After 60 days of

operation two local graduate students had gained unauthorized access. All too often companies see the greatbenefits that new technology brings without seriously considering the risks.
Over the last four years the only proven way to decrease credit card fraud has been though the use of newtechnology. Federal Investigators with the U.S. Secret Service claim that a substantial portion of credit cardfraud committed over the last five to ten years was the result of the industry, specifically bank card issuers, notbeing willing to invest in the technology that was available to assist them in decreasing fraud. Security featureshave been developed over the last twenty years to deter certain types of fraud, most notably counterfeiting. Visaintroduced the hologram as a security feature designed to deter counterfeiters. It is a three-dimensional imagesthat, when tilted under light, will give the appearance of motion. This was an effective deterrent only if it wasexamined at the point of sale. In most cases it was not. In 1992 holograms were being reproduced by a blackmarket operation in Hong Kong. Only a very trained eye could spot the minor imperfections in the image. Another deterrent to counterfeiters was the embossing of the "flying V". This is an embossed letter "V" thatappears to the left of the hologram. The shape of the "V" has been altered with the right side of the letterexpanded into a curve. Since Visa had the only mold that the embossing plate was engraved from, this wasthought to be a way to end counterfeiting. Again, this is only effective if examined at the point of sale, which itwas not.
The next major security feature was Visa's CVV, or Code Verification Value. This was an algorithm that usesthe account number, expiration date, and other information to create a check value. This value is encoded to themagnetic strip during the manufacturing process of the card. If a counterfeit card was made of an accountnumber the code would either be missing or incorrect and the bank could reject the transaction. The CVVproject was responsible for saving millions of dollars. If the analyst was lucky enough he could call themerchant and have them keep the card and try for an arrest. MasterCard also had a similar security feature but itwas rolled out late and did not have the effectiveness that the Visa program enjoyed. Realizing that the job ofcounterfeiting was near impossible, criminals came up with a new way of beating the system. It is calledskimming. Since the CVV cannot be re-engineered without knowing the algorithm the key was to produce exactreplicas of an existing card. Skimming is the process of swiping the magnetic strip of a card in a point of saleterminal that can be found at every check out counter. The card is then swiped through a second terminalwithout the customer’s knowledge. The information is read off the magnetic strip the same way as a regularpoint of sale terminal operates. Instead of transmitting the information to the bank the information is capturedexactly as it was read. All that is needed at this point is an encoder to produce as many exact replicas as needed. There is no way to discern the true card from the replica from the bank's perspective.
While this competition between criminal and industry was going on Visa was beginning work on adaptingartificial intelligence and behavioral scoring to detect credit card fraud. The industry had finally becomeproactive and realized that the key to stopping fraud was early identification. In the past the only way to auditfor fraud was after the customer contacted the bank to dispute charges that appeared on their statement. Theimplications of this new technology were overwhelming. Now the audit for the existence of fraud could beaccomplished by having a computer search though large amounts of data and extract accounts that had a highprobability for fraud. This technology was rolled out in the spring of 1992 and has proven to be the turningpoint, at least temporarily.
The first to come out was behavioral scoring. Behavioral scoring examines huge amounts of data and analyzesit for up to 400 independent variables. An independent variable could be anything that the programmer wanted. Information from current and previous fraud investigations was used for the initial tests. If enough independentvariables are answered correctly the account is flagged and sent to the human being who reviewed the account. If the human being thought there was a chance the account was compromised they called the customer toconfirm recent activity. This allowed identification of fraud accounts within twelve hours of beingcompromised, which caught the fraudulent activity before a large balance could be charged.

The next advancement was the introduction of artificial intelligence. The system later became known as neuralnetworks. Visa was the first to develop a neural network at a cost of $2 million. The system was called CRIS,or Cardholder Risk Identification System. The system was designed to mimic the rudimentary functions of thehuman brain. Given an initial set of facts about credit card fraud it sifted through massive amounts of data anddetected accounts it believed were experiencing fraudulent activity. When accounts were confirmed as beingfraudulent the system was alerted to this. With new information the system again sifted through huge amountsof data and identified more accounts. What had been created was a software program that could learn. Eachday it had more information to pull from and each day it got more accurate in spotting fraudulent accounts. Inthe first year CRIS saved the banking industry more than $20 Million [3, p. 16]. One of the drawbacks to thesystem was that it could only look at current data and compares it to what was known about credit card fraud. Itcreated a lot of false positives, which resulted in unnecessary calls being placed to customers.
The next phase is what we are currently in. This combined the power of the neural net with the missinghistorical data needed to get a more accurate picture of spending patterns. The result was a neural net that wasspecific to an individual bank. Here the net could look and current data in real time and compare it to thehistorical spending pattern of the individual customer. What was avoided was the high number of false positivesso analysts could concentrate on the accounts that were actually experiencing fraud. Once the counterfeitingproblem was under control the system was "taught" to audit for other types of credit card fraud.
There have been additional advances in technology that will prevent, rather than detect credit card fraud. Perhaps the most cutting edge innovation is the Kodak portrait security feature. Kodak was able to compress ahuman facial image two hundred fold. This information can fit in just 50 bytes of data, just enough to fit in theunused portion of a magnetic strip. At the point of sale the card is swiped through the magnetic reader and theportrait of the customer is displayed on the terminal. Although this would be a great way to deter fraud at thepoint of sale it is unlikely that it will generate much interest among issuers. The principle reason for this is thatthe next generation of credit cards is already here in the test phase. They are called Smart Cards and possess asmall computer chip, which can store vast amounts of data. Issuers will probably be reluctant to invest inmagnetic based technology that will be obsolete by the year 2002.
With the advent of new technology that was able to audit for fraud in the field bank card employees hadadditional time on their hands that could be put to better use. That use is the recovery of losses from credit cardfraud. Now audits are conducted on each fraud case that is identified. Information that is collected about thecircumstances involving the fraud is passed to the programmers of the neural net and to bank card investigatorsthat work around the world. After the information has been gathered the internal investigators pursue recoveriesthrough chargeback rights. Chargeback rights are detailed sets of rules written by MasterCard and Visaestablishing guidelines for who (Bank or Merchant) has to absorb the loss for a fraudulent transaction. If themerchant failed to perform its responsibilities to deter credit card fraud the bank has the right to be reimbursedfor the loss. The average recovery rate for the industry is approximately 17.5% of the total fraud reported. Asstated previously 1995 fraud for bank card issuers was around $680 Million. Given these figures it is correct toassume that banks were able to recover $119 Million from merchants that did not take proper precaution inprocessing the transactions.
Banks have been able to significantly reduce their exposure to credit card fraud through the use of advancedtechnology. It was the reluctance to use this technology in the mid 1980's that created the enormous losses inthe late 1980's and early 1990's. The industry has, at least temporarily, the upper hand in the fight against creditcard fraud. To keep that position they must be willing to invest in the technologies of tomorrow. Fraud is anexpense that is part of the inherent risk in the credit card industry. Like any product the risk factor is calculatedinto the pricing strategy. Dollars lost to fraud will be made up through increased interest charges to the public. It is a "victimless" crime that we all pay for.

References
[1] Bruger, J. “Neither Snow... Nor rain... Nor Credit Card Theft.” Credit World, Nov./Dec 1995, p. 14-16.
[2] Hobson, J.S. and Ko, M. “Counterfeit Credit Cards- How to Protect Hotel Guests”. Cornell RestaurantAdministration Quarterly, Aug. 1995, p. 48-53.
[3] O'Keefe, M. “Visa Steps up Fraud Protection.” Bank Systems and Technology, Nov. 1994, p. 14-17.
[4] Rutledge, G. “Credit Card Fraud- On the Road to Recovery.” Banker's Magazine, Jan/Feb. 1996, p. 47-50.

SOUTH CAROLINA'S QUALITY AWARD PROGRAM: A LOOK AT THE COMMONTHREADS AND QUALITY MANAGEMENT PRACTICES OF AWARD WINNING
ORGANIZATIONS
Stephen E. Berry, University of South Carolina-Spartanburg, Spartanburg, SC 29303 (864) 503-5557Lilly M. Lancaster, University of South Carolina-Spartanburg, Spartanburg, SC 29303 (864) 503-5597
ABSTRACT
This paper examines South Carolina's state quality award process. Presentations made at the annualawards conference by winning organizations identified a common set of quality management practices: Top Management Involvement, Customer Focused, Employee Involvement, Teams, Education andTraining, Statistical Process Control, Supplier Relationships, Benchmarking, and ContinuousImprovement. The conference highlighted the quality accomplishments of Chem-Nuclear, recipient ofthe prestigious "Governor's Quality Award." Company officials discussed important activities in the earlyyears of its quality journey; identified quality management practices in the critical areas of customers,people, environment, and supplier relationship; and provided encouragement and advice for would-beapplicants.
INTRODUCTION
One of the most important and far-reaching phenomenon that has occurred in the business world duringthe past decade is the "quality Revolution." Total Quality Management (TQM) practices such ascontinuous improvement, customer satisfaction, worker involvement, and statistical process control arewidely used in business today. Another aspect of the quality movement has been the establishment anddevelopment of a number of quality awards and standards.
National quality awards such as the Baldrige Award and Shingo Prize provided the impetus for states tobecome involved in the quality awards process. At least 41 states are initiating quality improvementprograms and 35 states are involved in establishing state quality awards.[1] These awards are useful forpromoting and recognizing quality and productivity improvements in business in individual states.
South Carolina recently held its third annual quality awards conference. The purposes of this paper are:
1. To describe South Carolina's quality award process.2. To identify common threads among award winning organizations in their "journey to qualityexcellence."3. To discuss the quality management practices of the firm that won South Carolina's highest qualityaward. Chem-Nuclear was the sole recipient of the prestigious "Governor's Quality Award."
SOUTH CAROLINA'S QUALITY AWARD PROCESS
In December 1992, the South Carolina Governor's Quality Award was established by the South CarolinaQuality Forum, an affiliate of the South Carolina State Chamber of Commerce.[2] The vision of theForum is that South Carolina be recognized by its peer states for total quality leadership.[3] The purposesof the award process are to:
C Promote the use of quality management systems,
C Share successful quality management strategies,C Promote self-assessment via an objective review,
C Publicly recognize outstanding achievement in the development and implementation of quality management systems
The process is designed to be consistent with the Malcolm Baldrige National Quality Award process andis based on the prior year's Baldrige Award criteria. Seven areas are examined: (1) leadership, (2)strategic planning, (3) customer and market focus, (4) information and analysis, (5) human resourcedevelopment and management, (6) process management, and (7) business results.
Each written application is evaluated by teams of quality professionals. High-scoring applicants receivesite visits. Applicants receive written feedback summaries of strengths and areas for improvement. Award recipients are selected by a panel of judges. Those applicants that show significant progress mayquality for the "Achievers" Award while those that show exemplary quality progress may qualify for theprestigious "Governor's Quality Award" -- the highest statewide recognition for excellence in qualitymanagement.
Award recipients serve as appropriate models of quality achievement for other South Carolinaorganizations. They are expected to share their successful quality strategies with others who areembarking on the quality journey.
COMMON THREADS AMONG AWARD WINNERS
Each winner made a presentation at the annual awards conference--describing the steps and activities intheir "quality journey." All the journeys began in the late 1980's or early 1990's. The main impetus forstarting the journey was the realization that quality was a powerful tool that provided a competitiveadvantage in the intense global marketplace. Although the terminology and applications varied,depending on the type of organization, there emerged a common set of quality management practices.
1. Top Management Involvement
All organizations indicated that the total quality transformation was initiated by the top levels ofmanagement. Without the leadership and commitment from top management, the required culture changewas doomed to failure. Each organization's Strategic Plan had a mission, visions and values that werequality-based and quality-focused.
2. Customer Focused
Every organization realized the importance of satisfying and delighting their customers. Knowing andunderstanding both internal and external customer needs and requirements was considered a top priority. Most organizations formed "Strategic Partnerships" with their customers to ensure satisfaction.
3. Employee Involvement
Every organization recognized that each employee had to be committed to and involved in the qualityprocess if it were to be successful. As time went on, each organization discovered that their employeeswanted to be empowered with the appropriate authority and responsibility. Mutual trust and respectbetween management and operative employees were essential. Management needed to stay flexible, tonot dictate details, to allow the worker closest to the job to figure out the best way to do it. Workers
needed to know they were appreciated. This recognition and rewards were very important.
4. Teams
Without exception each organization found the use of teams to be the most effective way of gettingemployees involved. While titles and descriptions of teams varied, some common terminology emerged;cross functional teams, project teams, process improvement teams, and quality action teams.
5. Education and Training
In order to ensure a successful quality transformation, each organization realized that worker training andeducation was essential. Quality-related courses were offered in areas such as teamwork, statisticalprocess control (SPC), maintenance, and operations. Most organizations combined in-house training withoutside consultants.
6. Statistical Process Control (SPC)
In order to improve a process, it is necessary that this process be measurable in some way. A majority ofthe organizations discussed the importance of understanding variation and training everyone in statisticalanalysis. SPC is used to determine whether variation is normal (and the process is in control) or whetherthe variation is out of control and the process needs corrective action.
7. Supplier Relationships
Most organizations realized the importance of establishing close partnerships with their suppliers. Mostof the discussion focused on reducing the number of suppliers and emphasizing long term relationshipsbased on quality, trust, reliability, and certification.
8. Benchmarking
Benchmarking is defined as a standard or point of reference in measuring or judging quality. Everyorganization stated that, early in their quality transformation process, they studied quality managementpractices from successful, world-class companies. This helped them to improve what they were doing.
9. Continuous Improvement
Each and every organization discussed the fact that the quality journey never ends. Improvements canalways be made in what you do and how you do it. The concept emphasizes small steps andaccomplishments so that employees do not get frustrated and discouraged . The ultimate goal is "zerodefects." The ultimate vision is "Business Excellence."
Chem-Nuclear: Recipient of prestigious "Governor's Quality Award"
Established in 1971, Chem-Nuclear is the leader in low-level radioactive waste disposal. The companyprovides low-level and high-level radioactive waste services to the nuclear power industry and other usersof radioactive materials.
Chem-Nuclear began its quality journey in 1991. Early years activities included:
C Benchmarked Quality LeadersC Developed Quality Approach that best suited Chem-Nuclear SystemsC Executive Management Attended 4 Day Introduction to Quality Process TrainingC All CNS Employees Attended 2 Day Introduction to Quality Process TrainingC Executive Process Management Committee EstablishedC Balanced Focus to each critical area of the Business: Customer - People - Environment - Supplier
The following are examples of quality management practices in each of the firm's critical areas:
1. Customers
The principal customers are electric utility companies that operate nuclear power plants. The keycustomer requirements at Chem-Nuclear are: Know and understand customer requirements (needs), On-time delivery, 100% Customer Satisfaction, Zero Regulatory Violations, one day turnaround on CustomerDissatisfiers, Reliability, and Zero Lost Time Injuries. Each of these requirements has a correspondingCompany-wide measurement that is updated monthly and communicated to the employees by postingresults in each Chem-Nuclear facility.
2. People
Chem-Nuclear uses a variety of employee involvement and empowerment techniques including ProcessImprovement Teams, Workouts, Solutions, Individual Goals & Objectives, monthly Atlas celebrations,and participation in Employee Activity Committee events, all of which are part of their overall qualityprocess.
In early 1995, Chem-Nuclear began implementing cross-functional teams. An important goal offormulating these teams was to get more of the work force involved in running the business and providethe atmosphere for sharing of responsibilities. These teams are now well defined and focusing on theCustomer.
3. Environment
Each processing system provided by Chem-Nuclear must be designed with considerations forenvironmental protection and protection of theworker. Operational procedures must consider the radiological and hazardous impact on the personperforming the work. When transporting waste over public roads, the firm must comply with stringentDepartment of Transportation regulations.
4. Supplier Relationships
In 1994 Chem-Nuclear had 1200 suppliers. It currently has 850 active suppliers. This reduction in thenumber of suppliers was the result of a process improvement team working with suppliers and internalcustomers. Chem-Nuclear supplier excellence program places great emphasis on "partnering" agreementswith suppliers that meet stringent performance requirements and expectations. These types of long-ternrelationships have resulted in cost savings and improved quality.
Chem-Nuclear scored high enough on the application process to earn a site visit in early 1997. Site visitteams verify and clarify the information in the organizations' application. Some benefits associated with asite visit are:

C Received significant amount of "Free" ConsultingC Objective evaluation and feedbackC Assisted with bringing Quality process to next levelC Critical in identifying and confirming strengths and weaknessesC Feedback incorporated into Strategic and Operational approach
Chem-Nuclear urges organizations of all types to become involved in the quality process. It alsoencourages all organizations to become involved in their state's quality award process. It provides thefollowing advice for would-be applicants:
C Don't wait to applyC When you write the application, you will learn new strengths and weaknessesC Involvement = Buy-in = Faster ImprovementC You're probably better than you thinkC Objective Feedback is critical - Use it!C Quality must be integrated into the business plansC Continuous improvement results in big rewardsC Quality and Performance Excellence aren't "quick fixes" - It is a journey with no end
REFERENCES
[1] Bernowski, K. "The State of the States," Quality Progress (May 1993), 27 - 36.[2] South Carolina Governor's Quality Award: Examiner Guidelines[3] South Carolina Governor's Quality Award: General Information

ISSUES IN DSS DEVELOPMENT FOR THE DOE HAZARDOUS WASTE CLEANUPPROGRAM
Laurence J. Moore, Virginia Tech, Blacksburg, VA 24061 (540) 231-5887Tarun K. Sen, Virginia Tech, Blacksburg, VA 24061 (540) 231-6591
ABSTRACT
This paper discusses the issues and problems encountered during a project undertaken by the authors todevelop a computerized database and decision support system for management of the environmentalmanagement (EM) program by the Office of Science and Technology Division of the Department ofEnergy (DOE-EM). DOE-EM has a mandate from the U.S. Congress to clean up a 40-year accumulationof hazardous waste (primarily radioactive) at some 110 sites located in 32 states around the United States.Issues such as clear communication of project specifications, identification of individuals responsible forproviding data, reporting responsibilities, supervision and coordination responsibilities, travelrequirements, user modification requests, use of outside contractors, coordination of project personnel atvarious locations, and user feedback will be discussed. The primary objective of this paper is to present adialog of some of the obstacles and frustrations to successful completion and implementation of adatabase and decision support system for a specific real-world problem.
INTRODUCTION
A prototype information and decision support system was developed for DOE that records theircontamination problems for one focus area, sub-surface contaminants (SCFA), and the technologies thatare available to address these problems. The system provides an on-line interactive system to assist inidentifying problems that are not being addressed by available technologies. The system maintainsinformation on the problems with unmet technology requirements that are addressed in one or more of thefollowing ways: by various projects that DOE conducts, by basic science research programs inuniversities and national labs, and related industrial programs. The information concerning approaches toaddress unmet technology requirements is dynamic where projects progress through various stages ofresearch and development, called gate stages. The system also assists in prioritizing these projects interms of certain need criteria.
The issues and problems encountered in conducting the project will be discussed in conjunction with eachproject stage, including the following:
� Problem Definition� Modeling Approach� Data Gathering� Implementation
PROBLEM DEFINITION
The scope and detail of the project was not as well defined as desired due to the fact that the primarycontractor had originally sub-contracted with another organization to complete the project and thensubsequently cancelled that contract due to reasons unknown to us. The primary contractor was obligatedto deliver a product to DOE within six months of the date we were initially contacted by them. This was

a project that would normally take several years. Due to time pressures, we were asked to submit aproject proposal with a one-week leadtime, which we did based on the primary contractor’s description ofwhat had already been done by the previous sub-contractor. The primary contractor delivered to us apartially developed product built by the previous sub-contractor which we were supposed to modify into acompleted product. Unfortunately, we learned, after thorough examination of the partially developedproduct, that it was not adequate to perform the desired functions and it had to be scrapped and a newproduct developed from scratch by us. Thus, the lack of clear communications of project specificationswas a serious impediment to successful completion of the project. However, we recovered from thisdifficult start and developed a well-designed data model to guide the database development project.
MODELING APPROACH
A second problem encountered was related to the assignment of personnel to the project. The primarycontractor was responsible for providing one or more individuals under contract to them to serve as ourcommunications interface with DOE (to define the system and gather the data). Although the primarycontractor who negotiated our sub-contract stipulated that the product should include decision supportcapabilities as well as a database system, the individual assigned as our interface to DOE insisted that theproduct should focus only on the database system. In fact, he strongly opposed our attempts to includedecision support features in the product. Over the course of several months, we managed to establishsufficient rapport with our intermediary to successfully complete the project, but it was a major difficultyfor us which the primary contractor seemed oblivious to. Over time we came to realize that ourintermediary was a highly intelligent person with great technical skills and understanding of the problemarea.
DATA GATHERING
A third area of difficulty was related to the gathering of data for the database system. We discovered thatdata were maintained at numerous different sites across the U.S. in different formats using differentproducts. Some data was maintained in spreadsheets while other data were maintained in various types ofdatabases. The fields of the various spreadsheets and databases were different depending on the locationsin which they were maintained. There were even duplicate sets of data for the same problems containingdifferent data or different data structures. In addition, there was no clearly defined list of who wasresponsible for various data. In many cases, individuals handling the data were not technically proficientwith databases and didn’t realize, for example, that they were truncating some data fields when copyingthe data from a spreadsheet to a database system. In short, the supervision and coordination of data byDOE sites was a serious problem for us in attempting to develop a centralized consistent data warehouse.We ended up with gaps in much of the data even though it was information needed and desired by theorganization for decision making. We suppose that this is a common problem in most organizationstrying to develop a centralized data warehouse for decision support.
IMPLEMENTATION
Several problems inhibited the successful implementation of the product. One problem was due toincessant requests for modification of the features and capabilities in the database system. These requestsfor changes were ad hoc and often unrelated to the original specifications for the product. The change-requests continued right up to the day the final product was to be delivered. As a result we were unable toperform a thorough job of debugging the system prior to delivery. This was a serious flaw and lead toproblems with the users.

Overall the most serious flaw in the project was the organizational structure employed by the primarycontractor. We were isolated from the end-user (DOE) due to the fact that we were required to interactwith DOE through the primary contractor’s interface person. We were unable to obtain direct feedbackfrom the end-user (DOE) about the features and functionality desired by them. We received thisinformation second-hand from the primary contractor’s interface person.
CONCLUSION
We learned from this experience that it is extremely important to be able to communicate directly with theend user if a decision support project is to be implemented successfully. This may not be as easy as itseems. In a major development project in a large organization there are so many people and organizationsinvolved that this simple task of being able to extract information from the end user is daunting. Thisproblem can be manifested more in the development of integrated corporate-wide data warehousesystems. Often decision support systems are developed to support higher-level decision making. Inthese situations the involvement of top management is critical. Given their time constraints theirinvolvement may be difficult to obtain.

ABSTRACT
In earlier work Keys has suggested nonparametric metamodeling approaches for the single-objectivesimulation-optimization problem. These methodologies are significantly different from their parametriccounterparts, such as Response Surface Methodology. Although details have not been completed on thealgorithm for the single-objective case, it is important to consider the multiobjective case now, for issuesaffecting the latter case will certainly impact the former. This paper presents an overview of the single-objective problem and its solution to date as well as algorithmic issues and alternatives for themultiobjective problem.
INTRODUCTION
Simulation Optimization Definition
Consider a computer-simulation model with d output responses Y that are functions of c controllablefactors X as well as uncontrollable conditions Z. If d = 1, the problem is said to be a single-objective,simulation-optimization problem; if d > 1, then the problem is called multiobjective. The simulationmodels considered in this research represent stochastic systems. In such systems, the uncontrollableconditions introduce random error, �, into the process, i.e. Z = e(�). Therefore the response(s) to beoptimized become(s) a random variable, defined as:
Y = f ( X | Z ) = f ( X , e (�) ). (1)
The objective of simulation optimization is to determine the values of the c controllable factors ordecision variables, X, that optimize the d responses, subject to the set Z of conditions that are bothstochastic and uncontrollable in the sense that they affect outcomes but are not under the influence of thedecision maker. The general simulation-optimization problem may be stated as (Crouch, Greenwood, andRees 1995):
Optimize E[Y] = E[f ( X | Z )] over the region cS �� (2)
where the domain of S may be either continuous, discrete, or mixed, and X = (X1, X2, ..., Xc) S�
Subject to:
v(X) � 0 (3)
where v(X) is a vector of deterministic constraints typically of the form:
li < Xi < ui i = 1, ..., a (3a)
la+j < f(X) < ua+j j = 1, ..., b, (3b)
A SEQUENTIAL-DESIGN METAMODELING STRATEGY USING THIN-PLATE SPLINESFOR MULTIOBJECTIVE SIMULATION OPTIMIZATION
Anthony C. Keys, Marshall University, Huntington, WV 25755Loren Paul Rees, Virginia Polytechnic Institute and State University, Blacksburg, VA 24061-0235

where a is the number of constraints involving one controllable factor, and b is the number of constraintsinvolving more than one controllable factor.
Simulation Optimization Difficulties
This simulation-optimization problem is difficult to solve in practice because the function f in (2) isunknown, as are the magnitude and distribution of the error �. Moreover, the size and shape of thedistribution of � may vary over the domain S.
Often the problem defined by (2) and (3) is made amenable to solution by making one or moreassumptions: (a) domain knowledge or expertise allows S to be reduced to a smaller regionS� where theglobal optimum is believed likely to occur; (b) the function f in (2) may be approximated with aparametric metamodel over the region S� , i.e., f may be assumed to be (typically) linear or quadratic overthe region S� ; and (c) the error � is assumed to be relatively small, homogeneous over S� , and normallydistributed. If assumption (a) is successful in reducing the region so that f is not multi-modal over S� ,then if assumptions (b) and (c) also hold, gradient-based searches such as Response Surface Methodology(RSM) may be used with success (see for example, Box and Draper (1987) or Myers (1976)).
Traditionally, RSM is the most-commonly used optimization technique applied to this type of problem.However, many other approaches besides RSM have been suggested in solving the simulation-optimization problem, including perturbation analysis, frequency domain analysis, stochasticapproximation methods, likelihood ratios, adaptive control techniques, and genetic algorithms. Safizadeh(1990) and Meketon (1987) provide a good survey of these techniques, and Jacobsen and Schruben(1989) and Azadivar (1992) categorize many simulation-optimization approaches. The most relevant ofthe state-of-the-art reviews from the perspective of this research are Barton’s (1992 and 1994), whichoutline recent developments in the use of metamodels to approximate f in (2) above.
As Barton points out, there are other metamodels of promise besides those meeting the parametricassumption (b) above. In particular, the class of nonparametric metamodels offers many advantages overtheir parametric counterparts in that the former are robust to violations of the usual assumptions ofhomogeneity of variance and normality of errors, and they can also model response surfaces of arbitraryshape. In our view, the biggest shortcoming of parametric metamodels is their inability to accommodateglobal search when response surfaces are multimodal.
There are many different nonparametric metamodels, including kernel smoothers and smoothing splines.Barton (1992, 1994) indicates that these two appear to be particularly promising techniques formetamodeling, but points out that there is a need to evaluate their performance in the simulation-optimization domain. This paper is one step in direct response to that stated need.
The need for global metamodels is emphasized further when multiobjective simulation-optimizationproblems are considered. To see this, consider an optimization problem with two objectives and arectangular constraint region. At the highest priority assume a tetramodal response surface constrained toexceed a constant value; imagine that the region meeting the top priority is the “lopped off” portions

of the four mountains. (see Figure 1, panel A, shaded area). Note that the region of search for thesecond-priority goal is now four, disjoint sub-regions. Consequently, local searches are likely to fail –particularly if the second-priority response surface is also multimodal.
FIGURE 1. AN EXAMPLE TETRAMODAL SURFACE AT PRIORITY 1, OF THE FORMY1 > K.
Panel B – Should the domain of search for a surface at priority 2 be restricted?
Panel A – That part (shaded) of a feasible region (dark-bordered rectangle) of an example tetramodalsurface that meets priority 1.

The purpose of this paper is two-fold: first to give the status of algorithm development in the single-objective, nonparametric, simulation-optimization problem, and second to raise issues that must beconsidered for the multiobjective case. Several alternatives are suggested for the latter case.
The organization of this paper is as follows. In section 2 a brief overview of nonparametricmetamodeling is given; in particular, kernel smoothers and smoothing splines are discussed. Section 3presents algorithmic issues, including the reasons for selecting sequential designs over uniform, non-sequential possibilities. The fourth section gives the single- and multiobjective, nonparametric,simulation-optimization algorithms, to the extent that they have been developed. The final portion of thepaper presents conclusions and discusses future work.
NONPARAMETRIC REGRESSION & METAMODELING
Metamodels are models of models, and nonparametric metamodels are models that do not a prioripostulate a functional form. We initially investigated the two metamodels that Barton suggested aspromising in the simulation-optimization domain, both in the category of nonparametric-regressiontechniques. These two techniques are also the most-widely known and well-developed methods innonparametric regression: kernel smoothers and smoothing splines.
These nonparametric regression techniques share several characteristics. Given a sample of data, theycompute an estimated response at a particular point, x, using only the data that are local to x. Eachmethod requires the determination of a smoothing parameter that regulates the size of the neighborhoodaround x used to estimate the response. With a neighborhood of zero, the resulting surface would becomposed of the original data. With a neighborhood equal to the domain of interest, the resulting surfacewould be a linear regression. The optimal neighborhood size (or bandwidth or smoothing parameter) in aleast squares sense is determined by cross-validation.
Kernel Smoothers
This nonparametric regression technique expresses the estimate of the response � �hxY ,ˆ at a point x as theweighted sum of the responses of the data points that lie within a distance h of x. Here h is called thebandwidth of the function, and it controls the amount of smoothing. For a good discussion of kernelsmoothing, see Härdle (1990). The Nadaraya-Watson form of the kernel smooth function in theunivariate case (Nadaraya (1964), Watson (1964)) is:
� � � � � �,xKYxKhx,Ys
1j hs1s
1jj
1hs1 jj �� ��
� XX (4)
where ),(ˆ hxY is the estimate of the response at x for a sample of s data points given a bandwidth of h.jX denotes the vector of factor settings for the jth observation and jY1 is the observed single response at
that point. The kernel weight function, Kh(), can be one of a number of functions, but the differences in
performance among them are small (Härdle, 1990). The choice of bandwidth is of much greaterimportance to the quality of the fit and is selected by cross-validation.
As there are many different variations of these smoothers, in our studies we have selected the multivariateEpanechnikov kernel (1969) as the weight function. It has some optimal properties and is easy tocompute. Kernel methods encounter estimation problems near edges because data points there have fewerpoints on one side than on the other, leading to increased variance and/or bias in estimates there. Rice
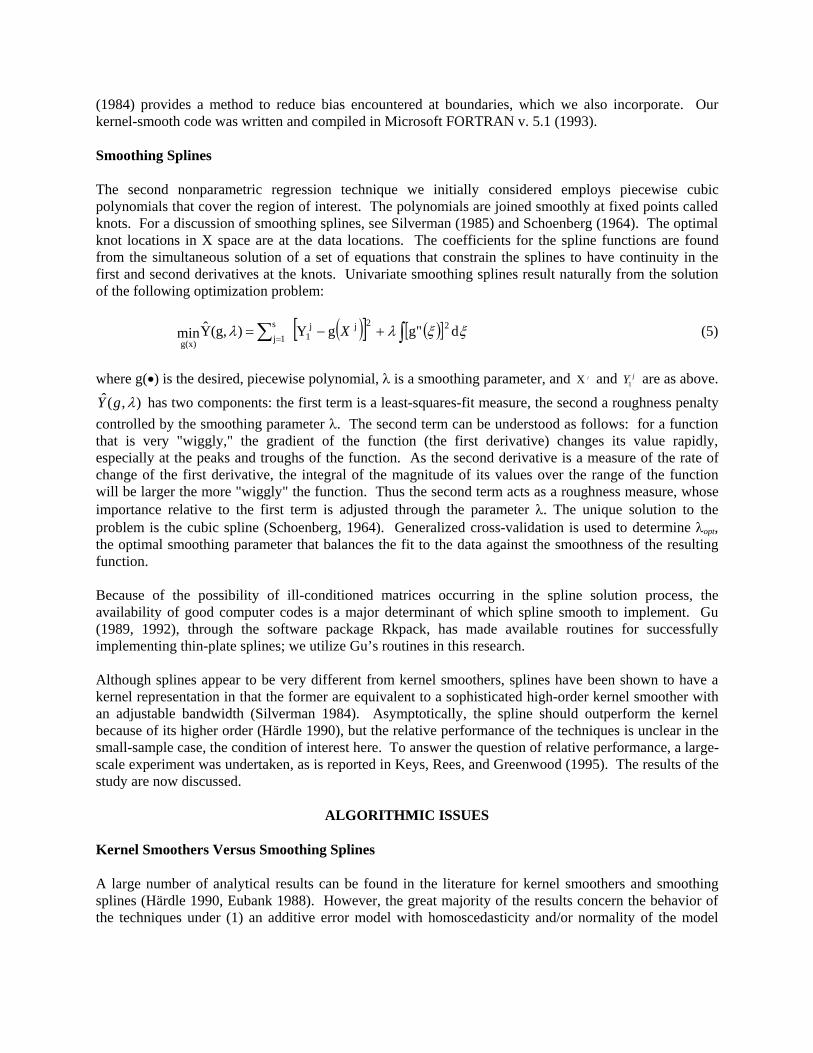
(1984) provides a method to reduce bias encountered at boundaries, which we also incorporate. Ourkernel-smooth code was written and compiled in Microsoft FORTRAN v. 5.1 (1993).
Smoothing Splines
The second nonparametric regression technique we initially considered employs piecewise cubicpolynomials that cover the region of interest. The polynomials are joined smoothly at fixed points calledknots. For a discussion of smoothing splines, see Silverman (1985) and Schoenberg (1964). The optimalknot locations in X space are at the data locations. The coefficients for the spline functions are foundfrom the simultaneous solution of a set of equations that constrain the splines to have continuity in thefirst and second derivatives at the knots. Univariate smoothing splines result naturally from the solutionof the following optimization problem:
� �� � � �� ��� ���
���� dg"gY)(g,Ymin22jj
1s
1jg(x)
X (5)
where g() is the desired, piecewise polynomial, is a smoothing parameter, and jX and jY1 are as above.
),(ˆ �gY has two components: the first term is a least-squares-fit measure, the second a roughness penalty
controlled by the smoothing parameter . The second term can be understood as follows: for a functionthat is very "wiggly," the gradient of the function (the first derivative) changes its value rapidly,especially at the peaks and troughs of the function. As the second derivative is a measure of the rate ofchange of the first derivative, the integral of the magnitude of its values over the range of the functionwill be larger the more "wiggly" the function. Thus the second term acts as a roughness measure, whoseimportance relative to the first term is adjusted through the parameter . The unique solution to theproblem is the cubic spline (Schoenberg, 1964). Generalized cross-validation is used to determine opt,the optimal smoothing parameter that balances the fit to the data against the smoothness of the resultingfunction.
Because of the possibility of ill-conditioned matrices occurring in the spline solution process, theavailability of good computer codes is a major determinant of which spline smooth to implement. Gu(1989, 1992), through the software package Rkpack, has made available routines for successfullyimplementing thin-plate splines; we utilize Gu’s routines in this research.
Although splines appear to be very different from kernel smoothers, splines have been shown to have akernel representation in that the former are equivalent to a sophisticated high-order kernel smoother withan adjustable bandwidth (Silverman 1984). Asymptotically, the spline should outperform the kernelbecause of its higher order (Härdle 1990), but the relative performance of the techniques is unclear in thesmall-sample case, the condition of interest here. To answer the question of relative performance, a large-scale experiment was undertaken, as is reported in Keys, Rees, and Greenwood (1995). The results of thestudy are now discussed.
ALGORITHMIC ISSUES
Kernel Smoothers Versus Smoothing Splines
A large number of analytical results can be found in the literature for kernel smoothers and smoothingsplines (Härdle 1990, Eubank 1988). However, the great majority of the results concern the behavior ofthe techniques under (1) an additive error model with homoscedasticity and/or normality of the model

error term, and, as stated, (2) large sample conditions. Neither set of assumptions may be appropriate forsimulation optimization.
As stated, Keys, Rees, and Greenwood (1995) addressed nonparametric metamodels as an approach tosynthesizing response surfaces in the simulation optimization problem. In particular, two nonparametricmetamodels, a kernel smoother and a thin-plate smoothing spline, were investigated. They conducted anexperiment using over 20,000 smoothing splines and kernel smoothers, on a variety of unimodal,bimodal, and tetramodal surfaces (see Figure 2 for example surfaces). The study showed first thatnonparametric metamodels can be successfully utilized on surfaces characterized by different amountsand distributions of error with relatively small sample sizes for surfaces up to four modes (peaks). Figure3 illustrates this finding by showing the fit possible using 81 points with a smoothing spline on atetramodal surface with moderate variance. The Keys, Rees, and Greenwood experiment also discoveredthat neither nonparametric technique dominates the other in terms of relative performance, but rather thatthe preferred methodology depends on the particular characteristics of the response surface. However,Keys (1995) noted that spline metamodels produce smooth metamodels in contrast to the “pimply”surfaces of kernel smoothers, so that tracking the optima of smoothing splines is easier and moredependable than for kernel smoothers. In addition, the ability of smoothing splines to follow closely thechanges in position of optima on metamodel surfaces make them sensitive to changes in the metamodel’sshape. Keys concluded that using smoothing splines in conjunction with a tracking mechanism should bea way of deducing when a metamodel has moved from an “alias” form to a true rendition of the surface.For these reasons, we suggest that the smoothing spline technique be used in initial, nonparametric,simulation optimizers.
Uniform (Non-Sequential) Design Versus Sequential Design
The benefits of sequential design strategies are well-known in classical modeling approaches such asRSM. In RSM the design points chosen with the assumption of a linear model can be augmented toproduce a design that allows the estimation of parameters for a quadratic model. Savings are realizedbecause the design points for the linear model are re-used. In contrast, synthesizing a fresh design foreach possible model uses many design points and is wasteful if all the points are in the same local region.
Using results concerning design from Müller (1984) and an adaptive procedure for estimating localbandwidths from Müller and Stadtmüller (1987), Faraway (1990) used simulation to test a sequential-design procedure for a kernel smoother. His procedure starts with a uniform design of size thought to belarge enough for the estimation of second derivatives (employing Müller and Stadtmüller’s approach).After this initial step, Faraway applies a sequential-design algorithm that first compares an estimate of theasymptotically-optimal-design density to the actual design density (through calculation of quantiles ofeach density); it then picks the position of the next design point so as to minimize the sum of the squarederrors between the two densities. Simulation results show that under a variety of conditions, thissequential-design method outperforms or equals the performance of the uniform-design method.However, as mentioned, Faraway’s procedure utilizes kernel smoothers, whereas our intent is to usesmoothing splines.
Constant Versus Locally-Varying Bandwidth
In the nonparametric case, regression models are initially synthesized over a uniform grid of design pointsas there is usually no reason to pay more attention to one area over another. Müller (1984) derives resultsfor optimal designs for kernel regressors using a constant bandwidth and a locally varying bandwidth.

0.0
0.5
1.0
-1.0-0.5
0.00.5
1.0
-1.0-0.50.00.5
y
x 1
x2
Unimodal surface
0.0
0.5
1.0
-1.0-0.5
0.00.5
1.0
-1.0-0.50.00.5
y
x 1
x2
Bimodal surface
0.0
0.5
1.0
-1.0-0.5
0.00.5
1.0
-1.0-0.50.00.5
y
x 1
x2
Tetramodal surface
FIGURE 2. DETERMINISTIC COMPONENT OF THE RESPONSE SURFACES.

Panel A -- True Surface
Panel B -- Single replication of a spline fit with 25 observations (s = 25)
Panel C -- Single replication of a spline fit with 81 observations (s = 81)
FIGURE 3. ONE REPLICATION OF A SMOOTHING SPLINE FIT TO A TETRAMODALFUNCTION WITH MODERATE VARIANCE .
-0 .5
0 .0
0 .5
1 .0
-1 .0-0 .5
0 .00 .5
1 .0
-1 .0-0 .5
0 .00 .5
y
x1
x2 x1
-1.0 -0.5 0.0 0.5 1.0
x2
-1.0
-0.5
0.0
0.5
1.0
-0 .5
0 .0
0 .5
1 .0
-1 .0
-0 .50 .0
0 .51 .0
-1 .0-0 .5
0 .00 .5
y
x1
x2
x1
-1 .0 -0 .5 0 .0 0 .5 1 .0
x2
-1 .0
-0 .5
0 .0
0 .5
1 .0
0.0
5
0.0
5
0.1
0
-0 .5
0 .0
0 .5
1 .0
-1 .0-0 .5
0 .00 .5
1 .0
-1 .0-0 .50 .00 .5
y
x1
x2 x1
-1 .0 -0 .5 0 .0 0 .5 1 .0
x2
-1 .0
-0 .5
0 .0
0 .5
1 .0

For the former, the optimal design is uniform; for the latter, the optimal design is a function of the“roughness” of the underlying function. From these results it appears that more sensitivity to theevolution of the underlying function is possible using variable bandwidth estimators. (Recall thatsmoothing splines have been shown to be equivalent to a sophisticated, high-order kernel smoother withan adjustable bandwidth.) Consequently, in this research we utilize a sequential design with smoothingspline, variable-bandwidth estimators.
Issues Particular To Multiobjective Design
The multiobjective example suggested in Figure 1 raises several algorithmic issues. First, shouldmultiobjective surfaces be considered one at a time, or can they be evaluated together? And second, iftaken separately, can/should only the region meeting priority 1 be used for evaluating the other lesscritical priorities?
As a first step in answering the first question, we assume that if multiple objectives can be combined intoa single objective function through weighting or other means, they will be. Hence, as a somewhat generalcase, we consider only lexicographic multiobjective problems, i.e., only those objectives that are atdifferent priority levels a priori. As a further step, we posit that, in general, it is most desirable to beconfident in the form of each and every objective response surface, beginning with the surface at highestpriority. Consequently, we stipulate that each objective be tackled independently and in decreasing orderof importance, but that any prior information be utilized as well.
As to the second question, should reduced regions be used to search lower-level priority surfaces, weproceed cautiously. If, for example, only the four, shaded sub-regions in Figure 1, panel A were used insearching with priority 2, it is possible that the nonparametric method would produce a less representativesurface than if the whole region were used; this is because the missing, interior portions of the regionmight contain important information in constructing an accurate representation even over just the shadedportion. Consequently, we do not eliminate the interior of a search region when going from priority topriority. However, we do eliminate all exterior portions, as shown by the heavy, irregular line in Figure1, panel B. Interior points are defined as convex combinations of all feasible points, whereas exteriorpoints are all other points.
THE SEQUENTIAL-DESIGN METHODOLOGY
The Single-Objective Case
Faraday’s sequential procedure, adapted to work with smoothing splines instead of kernel smoothers, isthe basis of our nonparametric, sequential-design, simulation-optimization methodology. However, wenote that Faraday’s work is incomplete for our purposes in that it does not specify an initial design; it does not specify a stopping criterion; and it does not offer an opinion on how to judge whether the metamodel is a faithful rendition of the true
surface.We are still exploring these issues, although initial heuristics have indicated some success on unimodal,bimodal, and tetramodal surfaces.
Using pseudocode similar to Visual Basic, the main routine of the nonparametric, sequential designalgorithm for simulation optimization is as follows:
Public DesignPoint, SplineMetamodel

Sub NonparametricSequentialDesign()MakeInitialDesignRunsConstructSplineMetamodel ‘from runs at initial pointsWhile (not StoppingConditions) Do
ComputeQuantileEstimates ‘of the 2nd derivative for the metamodel surfaceDetermineNextPointLocation ‘and add it to DesignPointRunPoint ‘at NextPointLocationConstructSplineMetamodel ‘from runs at all existing points
LoopEnd Sub
Our initial design is a “bare-bones,” uniform, 3c design, where c (as defined in section 1) is thedimensionality of the input space:
Sub MakeInitialDesignRuns()‘Create an initial 3c factorial designAdd each DesignPoint to DesignFor each DesignPoint in Design
RunPoint ‘make a simulation run at each point; replications are unnecessaryNextEnd Sub
The spline metamodel is constructed using Gu’s Rkpack code; each metamodel is stored in the objectvariable SplineMetamodel:
Sub ConstructSplineMetamodel()RunGuRkpackStore SplineMetamodelEnd Sub
In the calculation of quantile estimates, numerical procedures are employed on a fine grid of themetamodel surface to estimate second derivatives. Ranking procedures are then utilized to approximatequantiles:
Sub ComputeQuantileEstimates()Calculate2ndDerivatives ‘use numerical proceduresDetermine2ndDerivativeQuantiles ‘use ranking proceduresEnd Sub
Faraway does not explicitly state the technique that should be used to determine the new point, butmentions that xn+1 , must be chosen to minimize
21
1)(
~��
�
n
iii xx , (6)
where ix~ are the estimates of the asymptotically-optimum-design-density quantiles, andx(i) are the quantiles of the current-design density.We note that this stipulation is tantamount to solving an assignment problem, i.e.,
Sub DetermineNextPointLocation()

SolveAssignmentProblemEnd Sub,
as follows:
Minimize ���
�
�
�
1
1
1
1
n
i
n
jijij pc (7)
subject to
11
1
���
�
n
iijp (7a)
��
�
�1
1
1n
jijp (7b)
0�ijp (7c)
and2
jqiij xxc ��� (8)
where pij = 1 if quantile i is assigned to design point j, 0 otherwise.
The determination of stopping conditions for the nonparametric, sequential-design algorithm, asmentioned, is not stipulated by Faraway. Our stopping heuristics include a user-specified tolerance and awindow size parameter. The basic concept is that the user agrees to stop when the X-space positions ofeach optimum have not significantly moved over a total number (i.e., WindowSize) of successivemetamodels. The UserTolerance is the largest average value the user would accept in the movement ofoptima; the WindowSize is the number of successive metamodels over which any optima movementsmust not exceed the UserTolerance.
Function StoppingConditions()StoppingConditions = FalseFor i = NumberOfMetamodels To (NumberOfMetamodels -WindowSize + 1) Step -1
For Each Optimum in MetamodelSurfaceOptima(i)For the same Optimum in MetamodelSurfaceOptima(j)If (Optimum.XSpaceMovement(i, j) >= UserTolerance) _Then StoppingConditions = TrueNext
NextNextEnd Function
The Multiobjective Case

With the initial, conservative assumptions made in the section on issues in multiobjective design, only the(main) routine NonparametricSequentialDesign needs modification for the multiobjective case. Thisroutine becomes:
Public DesignPoint, GlobalRegionSub NonparametricSequentialDesign()SetGlobalSearchRegion ‘sets GlobalRegion equal to given feasible regionMakeInitialDesignRunsConstructSplineMetamodel ‘use runs at initial points for highest-priority surfaceFor ThisSurface = 1 to d ‘arranged in decreasing priority order
While (not StoppingConditions(ThisSurface)) DoComputeQuantileEstimates(ThisSurface) ‘of the 2nd derivativeDetermineNextPointLocation(ThisSurface) ‘then add it to DesignPoint;
‘N.B.: use all point locations from all surfaces so farRunPoint(ThisSurface) ‘at NextPointLocationConstructSplineMetamodel(ThisSurface) ‘from runs at all existing points
Loop ‘next pointConductFineGridSearchOnMetamodel(ThisSurface)ReduceRegion(ThisSurface)
Next ‘surfaceEnd Sub
The routine above introduces two new subroutines; they are composed as follows:
Sub ConductFineGridSearchOnMetamodel()For Each Constraint in GoalConstraints(ThisSurface)
FindFeasibleRegionViaGridSearch ‘determines ThisConstraintFeasibleRegionFeasibleRegion = FeasibleRegion � ThisConstraintFeasibleRegion
‘where � means intersectionNext ‘constraintSurfaceFeasibleRegion(ThisSurface) = FeasibleRegionEnd Sub
Sub ReduceRegion()GlobalRegion = GlobalRegion � SurfaceFeasibleRegion(ThisSurface),where A � B forms the set of all points that are convex combinations of points in A and in B.End Sub
CONCLUSIONS AND FUTURE WORK
A sequential, nonparametric, thin-plate spline simulation-optimization methodology has been developedfor both the single-objective and multiobjective cases. The approach theoretically should convergeasymptotically to the true surface(s) fitted, but it also seems to perform extremely well (i.e., better fitswith fewer runs than parametric approaches) on simple, small-sample problems tried to date. Thepromise for the methodology seems extremely high.
In the short run, additional work is needed in improving stopping criteria and in trying the method onlarger, real-world problems. Moreover, work relaxing the restrictive assumptions made in formulating themultiobjective algorithm should be undertaken.

REFERENCES
[1] Azadivar, F., “A Tutorial on Simulation Optimization,” Proceedings of the 1992 Winter SimulationConference, J. J. Swain, D. Goldsman, R. C. Crain and J. R. Wilson (Eds.), Arlington, VA, 1992,198-204.
[2] Barton, R. R., "Metamodeling: A State of the Art Review," Proceedings of the 1994 WinterSimulation Conference, J. D. Tew, S. Manivannan, D. A. Sadowski and A. F. Seila, (Eds.), 1994,237-244.
[3] ----------------, "Metamodels for Simulation Input-Output Relations," Proceedings of the 1992Winter Simulation Conference, J. J. Swain, D. Goldsman, R. C. Crain and J. R. Wilson (Eds.), 1992,289-299.
[4] Box, G. E. P. and N. R. Draper, Empirical Model-Building and Response Surfaces, John Wiley &Sons, New York, 1987.
[5] Bratcher, T. L., M. A. Moran, and W. J. Zimmer, "Tables of Sample Sizes in the Analysis ofVariance," Journal of Quality Technology, 2 (1970), 156-164.
[6] Crouch, I. W. M., A. G. Greenwood, and L. P. Rees, "Use of a Classifier in a Knowledge-BasedSimulation Optimization System,” Naval Research Logistics, 42 (1995), 1203-1232.
[7] Epanechnikov, V., "Nonparametric Estimates of a Multivariate Probability Density," Theory ofProbability and its Applications, 14 (1969), 153-158.
[8] Eubank, R. L., Spline Smoothing and Nonparametric Regression, Marcel Dekker, Inc., New York,1988.
[9] Faraway, J. J., "Sequential Design for the Nonparametric Regression of Curves and Surfaces,"Computer Science and Statistics: Proceedings of the 22nd Annual Symposium on the Interface,(1990), 104-110.
[10] Greenwood, A. G., L. P. Rees, and I. W. M. Crouch, "Separating the Art and Science of SimulationOptimization: A Knowledge-Based Architecture Providing for Machine Learning," I. I. E.Transactions, 25 (1993), 70-83.
[11] Gu, C., "Rkpack and Its Applications: Fitting Smoothing Spline Models," Technical Report No.857, Department of Statistics, University of Wisconsin-Madison, 1989 (updated 1992).
[12] Härdle, W., "Applied Nonparametric Regression," Econometric Society Monographs, No. 19,Cambridge University Press, Cambridge, (1990).
[13] Jacobsen, S. H., and L. W Schruben, "Techniques for Simulation Response Optimization,"Operations Research Letters, 8(1) (1989), 1-9.
[14] Keys, A. C., "Nonparametric Metamodeling for Simulation Optimization," unpublished Ph. D.Dissertation, Virginia Polytechnic Institute and State University, April 1995.
[15] Keys, A. C. and L. P. Rees, "Smoothing Splines for Sequential, Global Simulation Optimization,"unpublished working paper, Virginia Polytechnic Institute and State University, May 1995.
[16] Meketon, M. S., “Optimization in Simulation: A Survey of Recent Results,” Proceedings of the1987 Winter Simulation Conference, A. Thesen, H. Grant and W. D. Kelton, (Eds.), 1987, 58-67.
[17] Microsoft Corporation, Microsoft FORTRAN Professional Development System, version 5.1,Microsoft Corporation, Redmond, WA, (1993).
[18] Myers, R. H., Response Surface Methodology, Allyn and Bacon, Boston, 1976.[19] Nadaraya, E. A., "On Estimating Regression," Theory of Probability and its Applications, 10
(1964), 186-190.[20] Neter, J., W. Wasserman, and M. H. Kutner, Applied Linear Statistical Models, 3rd Edition, Richard
D. Irwin, Inc., 1990.[21] Rice, J. A., "Boundary Modification for Kernel Regression," Communications in Statistics, Series
A, 13 (1984), 893-900.[22] Safizadeh, M. H., "Optimization in Simulation: Current Issues and the Future Outlook," Naval
Research Logistics, 37 (1990), 807-825.

[23] Sargent, R. G., "Research Issues in Metamodeling," Proceedings of the Winter SimulationConference," B. L. Nelson, W. D. Kelton and G. M. Clark (Eds.), (1991), 858-893.
[24] Schoenberg, I. J., "Spline Functions and the Problem of Graduation," Proceedings of the NationalAcademy of Sciences of the United States of America, 52 (1964), 947-950.
[25] Silverman, B. W., "Spline Smoothing: The Equivalent Variable Kernel Method," The Annals ofStatistics, 12(3) (1984), 898-916.
[26] ---------------------, "Some Aspects of the Spline Smoothing Approach to Non-parametric RegressionCurve Fitting," Journal of the Royal Statistical Society, Series B, 47(1) (1985), 1-52.
[27] Siochi, F. C., L. P. Rees, and A. G. Greenwood, "A Best-First Search Approach for DeterminingStarting Regions in Simulation Optimization,” unpublished working paper, Virginia PolytechnicInstitute and State University, August 1995.
[28] Watson, G. S., "Smooth Regression Analysis," Sankhyã, Series A, 26 (1964), 359-372.

Student Paper Competition Award Recipients
First Place“ An Implementation of Software Agents in a Decision Support System”
Traci J. Hess, Virginia Tech
Second Place“ Evaluating the Impact of Intelligent Scheduling Systems in a Computer-IntegratedManufacturing Environment”
Amy B. Woszczynski, Clemson University
Third Place“ Simulation of Multi-Pier Port Terminal Operations”
Angela Jones, University of Delaware