town of duxbury, massachusetts
TRANSCRIPT
TOWN OF DUXBURY, MASSACHUSETTS
COMPREHENSIVE ANNUAL FINANCIAL REPORT
For the year ended June 30, 2017

On the cover: An oak tree stands in the O’Neil Farm pasture

The Town of
Duxbury, Massachusetts
Comprehensive
Annual Financial Report
For the Year
July 1, 2016 through June 30, 2017
Prepared by the Finance Department

Town of Duxbury, Massachusetts
Comprehensive Annual Financial Report For the Year Ended June 30, 2017
Table of Contents
INTRODUCTORY SECTION ............................................................................................................................... 1
Letter of Transmittal ...................................................................................................................................... 3
Principal Executive Officers .......................................................................................................................... 8
Organizational Chart ..................................................................................................................................... 9
Certificate of Achievement for Excellence in Financial Reporting .............................................................. 10
FINANCIAL SECTION ....................................................................................................................................... 11 Independent Auditor’s Report ..................................................................................................................... 13
Management’s Discussion and Analysis .................................................................................................... 15
Basic Financial Statements ........................................................................................................................ 24
Government-Wide Financial Statements ................................................................................................ 25
Statement of Net Position .................................................................................................................... 25
Statement of Activities ......................................................................................................................... 26
Fund Financial Statements ..................................................................................................................... 28
Governmental Funds – Balance Sheet ............................................................................................... 28
Reconciliation of the Governmental Funds Balance Sheet Total Fund Balances to the Statement of
Net Position .................................................................................................................................... 29
Governmental Funds – Statement of Revenues, Expenditures, and Changes in Fund Balances ..... 30
Reconciliation of the Statement of Revenues, Expenditures, and Changes in Fund Balances of
Governmental Funds to the Statement of Activities ....................................................................... 31
Proprietary Funds – Statement of Net Position ................................................................................... 32
Proprietary Funds – Statement of Revenues, Expenses, and Changes in Net Position .................... 33
Proprietary Funds – Statement of Cash Flows.................................................................................... 34
Fiduciary Funds – Statement of Fiduciary Net Position ...................................................................... 35
Fiduciary Funds – Statement of Changes in Fiduciary Net Position ................................................... 36
Notes to Basic Financial Statements ...................................................................................................... 37
Required Supplementary Information ................................................................................................................ 73
General Fund Budgetary Comparison Schedule ........................................................................................ 74
General Fund – Schedule of Revenues, Expenditures, and Changes in Fund Balance – Budget and
Actual ................................................................................................................................................. 75
Pension Plan Schedules ............................................................................................................................. 79
Schedule of the Town’s Proportionate Share of the Net Pension Liability. ............................................ 80
Schedule of the Town’s Contributions .................................................................................................... 81
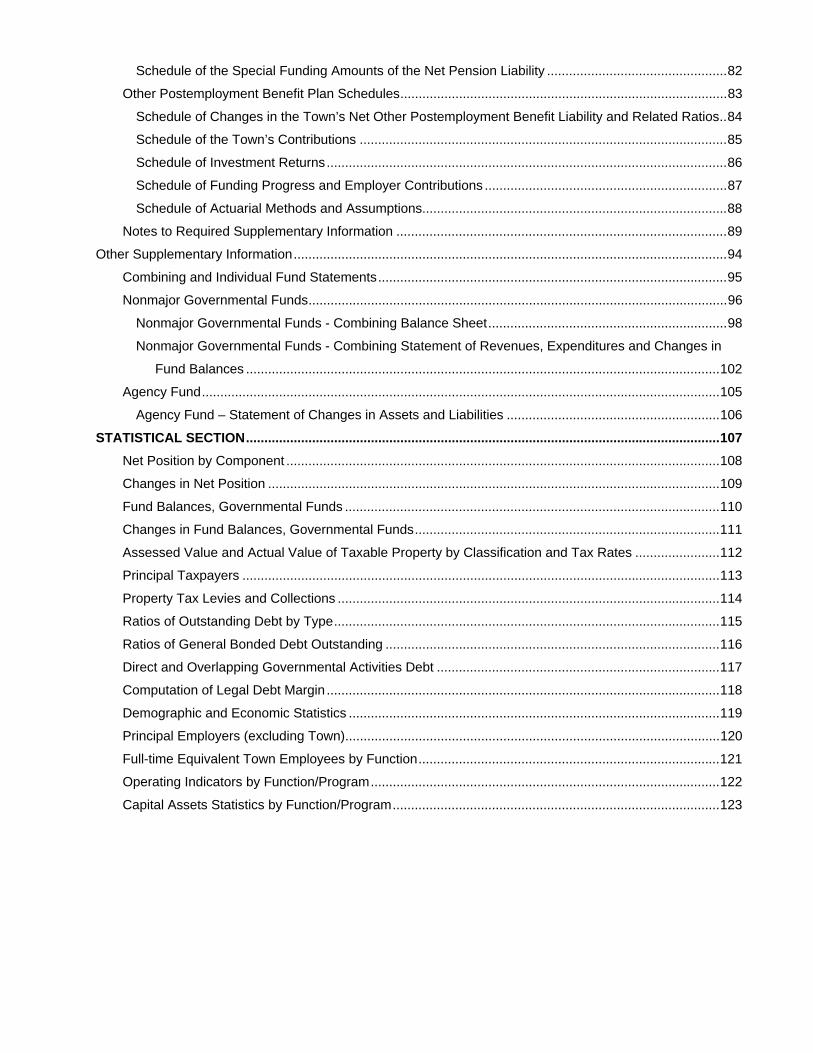
Schedule of the Special Funding Amounts of the Net Pension Liability ................................................. 82
Other Postemployment Benefit Plan Schedules ......................................................................................... 83
Schedule of Changes in the Town’s Net Other Postemployment Benefit Liability and Related Ratios .. 84
Schedule of the Town’s Contributions .................................................................................................... 85
Schedule of Investment Returns ............................................................................................................. 86
Schedule of Funding Progress and Employer Contributions .................................................................. 87
Schedule of Actuarial Methods and Assumptions................................................................................... 88
Notes to Required Supplementary Information .......................................................................................... 89
Other Supplementary Information ...................................................................................................................... 94
Combining and Individual Fund Statements ............................................................................................... 95
Nonmajor Governmental Funds .................................................................................................................. 96
Nonmajor Governmental Funds - Combining Balance Sheet ................................................................. 98
Nonmajor Governmental Funds - Combining Statement of Revenues, Expenditures and Changes in
Fund Balances ................................................................................................................................. 102
Agency Fund ............................................................................................................................................. 105
Agency Fund – Statement of Changes in Assets and Liabilities .......................................................... 106
STATISTICAL SECTION ................................................................................................................................. 107 Net Position by Component ...................................................................................................................... 108
Changes in Net Position ........................................................................................................................... 109
Fund Balances, Governmental Funds ...................................................................................................... 110
Changes in Fund Balances, Governmental Funds ................................................................................... 111
Assessed Value and Actual Value of Taxable Property by Classification and Tax Rates ....................... 112
Principal Taxpayers .................................................................................................................................. 113
Property Tax Levies and Collections ........................................................................................................ 114
Ratios of Outstanding Debt by Type ......................................................................................................... 115
Ratios of General Bonded Debt Outstanding ........................................................................................... 116
Direct and Overlapping Governmental Activities Debt ............................................................................. 117
Computation of Legal Debt Margin ........................................................................................................... 118
Demographic and Economic Statistics ..................................................................................................... 119
Principal Employers (excluding Town) ...................................................................................................... 120
Full-time Equivalent Town Employees by Function .................................................................................. 121
Operating Indicators by Function/Program ............................................................................................... 122
Capital Assets Statistics by Function/Program ......................................................................................... 123

Introductory Section

Town of Duxbury, Massachusetts 1 Comprehensive Annual Financial Report
INTRODUCTORY SECTION
Introductory Section

Town of Duxbury, Massachusetts 2 Comprehensive Annual Financial Report
This page intentionally left blank.

Town of Duxbury, Massachusetts 3 Comprehensive Annual Financial Report
Town of Duxbury, Massachusetts
ACCOUNTING DEPARTMENT
Finance Director 878 Tremont Street John Madden Duxbury, MA 02332 Telephone 781-934-1100 e-mail: [email protected]
December 22, 2017 Letter of Transmittal To the Honorable Board of Selectmen and Citizens of the Town of Duxbury: Subsequent to the close of each year, state law requires the Town of Duxbury to publish a complete set of financial statements in conformity with accounting principles generally accepted in the United States of America (GAAP) that are audited in accordance with generally accepted auditing standards by a firm of licensed certified public accountants. Pursuant to that requirement, we hereby issue the Comprehensive Annual Financial Report (CAFR) of the Town of Duxbury, Massachusetts, for the year ending June 30, 2017, for your review. The report is designed to be used by the elected and appointed officials of the Town and others who are concerned with its management and progress such as bond analysts, banking institutions and credit raters. Just as important, the design and format of this report is aimed at providing the residents and taxpayers of Duxbury a more easily readable and, therefore, a more easily understandable financial report. This report consists of management’s representations concerning the finances of the Town of Duxbury. Consequently, management assumes full responsibility for the completeness and reliability of all of the information presented in this report. As management, we assert that, to the best of our knowledge and belief, this financial report is complete and reliable in all material respects. In order to provide a reasonable basis for making these financial representations, management continues to review and improve its established comprehensive internal controls. The framework for these controls is designed to protect, to the extent possible, the government’s assets from loss, theft or misuse. The cost of internal controls should not outweigh their benefits. As a result, the Town of Duxbury’s comprehensive framework of internal controls has been designed to provide reasonable rather than absolute assurance that the financial statements for the year ended June 30, 2017, are fairly presented in conformity with GAAP. The Town of Duxbury’s financial statements have been audited by Powers & Sullivan, LLC, a firm of licensed certified public accountants. The goal of the independent audit was to provide reasonable assurance that the financial statements of the Town of Duxbury for the year ended June 30, 2017, are free of material misstatement. The independent audit involved examining, on a test basis, evidence supporting the amounts and disclosures in the financial statements; assessing the accounting principles used and significant estimates made by management; and evaluating the overall financial statement presentation. The independent auditor concluded, based upon the audit, that there was a reasonable basis for rendering an unmodified opinion on the Town of Duxbury’s financial statements for the year ended June 30, 2017, and that they are, in fact, fairly presented in conformity with GAAP. The independent auditor’s report is presented as the first component of the financial section of this report.

Town of Duxbury, Massachusetts 4 Comprehensive Annual Financial Report
The independent audit of the financial statements of the Town of Duxbury was part of a broader, federally mandated “Single Audit” designed to meet the special needs of federal grantor agencies. The standards governing Single Audit engagements require the independent auditor to report not only on the fair presentation of the financial statements, but also on the audited government’s internal controls and compliance with legal requirements, with special emphasis on internal controls and legal requirements involving the administration of federal awards. These reports are available in the Town of Duxbury’s separately issued Single Audit Report. GAAP requires that management provide a narrative introduction, overview and analysis to accompany the basic financial statements in the form of Management’s Discussion and Analysis (MD&A). This letter of transmittal is designed to complement the MD&A and should be read in conjunction with it. The Town of Duxbury’s MD&A can be found immediately following the report of the independent auditors. Profile of the Town Duxbury, incorporated on June 17, 1637, was the home of Captain Myles Standish and John Alden. The Town was originally established as a community with plentiful lands for harvesting crops and other natural resources as well as providing a livelihood for many in the shellfish and fishing industries. Because of its proximity to the ocean and its natural harbor, the harbor became one of the busiest in the world during the “Golden Age of Shipbuilding” (approximately 1800-1874) and the Town enjoyed a period of great prosperity. During the late 1800’s other industries began to develop including shoe manufacturing, cranberry harvesting, charcoal production and the production of textiles. The first department store in America, “Ford’s Store” was established in 1826 and the Franco-American cable was pulled ashore at Duxbury Beach on July 23, 1869, uniting Europe and the United States in the first trans-Atlantic telegraph connection. Duxbury is also home to the famous Island Creek oyster. Known for their quality and distinctive flavor, these oysters are in great demand and are shipped to points throughout the United States as well as Bermuda, the Caribbean, and Hong Kong. Duxbury is a town of quiet dignity and stability, with beautiful beaches, tides and marshes combined with Cape Cod homes and Sea Captain’s Colonials. The Town is governed by an open Town Meeting form of government and is located in Southeastern Massachusetts in Plymouth County approximately 33 miles from Boston. Duxbury is accessible by Route 3, a major highway, as well as secondary roads including Routes 3A and 114. The Town is bordered by the Towns of Pembroke on the west, Marshfield on the north, Kingston on the south and the Atlantic Ocean on the east and southeast. Duxbury occupies an area of approximately 23.76 square miles and its population is 15,636 based on the most recent town census. The Town provides general governmental services for the territory within its boundaries, including police and fire protection, public education in grades kindergarten through twelve, water, street maintenance, parks, beaches and other recreational facilities. The Greater Attleboro Taunton Regional Transit Authority provides bus coverage throughout Duxbury to surrounding communities. The Duxbury Housing Authority provides public housing for eligible low income families, the elderly and the handicapped. Local legislative decisions are made by an open Town Meeting. Subject to the legislative decisions made by the Town Meeting, the affairs for the Town are generally administered by a board of three selectmen who are supported by the Town Manager. Local school affairs are administered by a school committee of five persons, elected for staggered three-year terms on an at large basis. The Water and Sewer Departments are managed by the same three-person Board of Selectmen. Local taxes are assessed by a board of three assessors, elected for staggered three-year terms.

Town of Duxbury, Massachusetts 5 Comprehensive Annual Financial Report
Budgetary Controls The Finance Director is responsible for preparing the budget and reviewing it with the various departments, boards and committees. This budget is then presented to the Town Manager who, in turn, after review, presents the budget to the Board of Selectmen. The Selectmen review all requests and town-wide issues and present a budget to Town Meeting for approval. A nine member Finance Committee made up of citizen volunteers appointed by the Town Moderator reviews the budget and makes recommendations to Town Meeting. A separate Fiscal Advisory Committee also made up of nine citizen volunteers appointed by the Town Moderator reviews capital expenditure plans. The level of budgetary control is established by Town Meeting and this approval defines the level at which expenditures may not exceed appropriations. This level is typically at the individual department salary and expense level. The Town Accountant is responsible for ensuring all payroll and invoices are within the budgetary control level before authorizing payment. Additional appropriations may be approved at subsequent Town Meetings. The Finance Committee, upon request of the Town Manager, may approve during the year a transfer from a reserve fund established at Town Meeting. These controls ensure compliance with the budget approved by Town Meeting. Factors Affecting Economic Condition Local Economy The Town of Duxbury continues to reflect a strong economic condition. The per capita income is significantly higher than state averages, and the unemployment rate has always been extremely low. Duxbury has a primarily residential tax base which has grown through rapidly rising home values. In 2017, the average price of a home in Duxbury was $680,200 (based upon 2016 sales data), an increase of approximately 6.30% from the previous year. The current economic environment indicates that property values are on the rise. Building permit activity over the last several years has been strong; a good indicator that that building construction and renovation will convert to increased tax dollars. The community has preserved large amounts of open space. Duxbury is an ocean front community with a pristine coastline, as well as having an excellent reputation for academics, athletics and many cultural and natural amenities. Easy access to the commuter rail in neighboring Kingston facilitates the commute to Boston. All of this has made Duxbury a highly desirable location. The Town continues to be faced with financial challenges. State aid results have been erratic in recent years. While the Town enjoyed a 4.48% increase from FY 2016 to FY 2017, State aid has risen, on average, less than 2.35% over the last three years while state and county assessments over that same period have risen, on average, nearly 8%. Local Receipts showed a one year increase of over 2.5%, due primarily to a spike in motor vehicle excise and continued strength in construction related permitting. While too early to be considered a trend, the three year average for local receipts was nearly 3.9%. The Town was less successful control rising health care costs which will necessitate a 12% rate increase in FY 2018. Fixed costs continue to add to the economic pressures. During the summer of 2017, the Town saw the return of the endangered species Piping Plover in significant numbers. This resulted in restricted use of the beach at various times during the summer. However, residents and non-residents alike continue to purchase annual beach stickers at a record pace. Proposition 2½ caps the Town’s ability to raise taxes and excess levy capacity is limited. The Town last approved a Proposition 2½ operating override (in the amount of $1,000,000) in 1989 and it is unclear whether this will be a viable solution in the near future. New growth for 2017 was strong, and this trend looks to continue for the foreseeable future.

Town of Duxbury, Massachusetts 6 Comprehensive Annual Financial Report
Fortunately, the Town has long enjoyed a cooperative approach to problem solving among its many boards and committees, departments, unions and citizens. This cooperation has led to solid fund balances. Constant oversight is given to the Health Claims Trust, resulting in an equity position that more than covers the ‘incurred but not reported’ claims accrual at the end of 2017. A town-wide approach to problem solving in this area has resulted in a five year average of nearly level funding in the health insurance budget. During the 2017 budget cycle, departments continued to work together to create a budget that did not rely heavily on long-term reserves. The Town further addressed revenue needs with increased fees wherever practical. Department heads, committees, and boards understand that, all in all, revenues are not going to dramatically increase anytime soon. Knowing this, everyone involved in the budget process is committed to providing services more efficiently and at a lower cost. Long-Term Financial Planning The Town’s long-term financial planning is focused on addressing the numerous needs of the community, particularly in view of the revenue constraints of Proposition 2½. Discussions are ongoing concerning issues regarding how to provide the community with the level of services it has come to expect under difficult financial conditions. Town departments, the School Committee, Finance Committee, and the Fiscal Advisory Committee have all provided input. The Town continues to review and modify its sustainable long-term financial plan. Management recognizes that in order to continue to provide services to the community, while at the same time maintaining its existing infrastructure, a formalized plan is necessary. Issues being discussed include long range capital planning, appropriate reserve levels and new revenue sources. The Town has identified debt usage and increasing reserves such as Stabilization as areas requiring greater attention. FY 2017 was a quiet year for capital construction projects. Shortly the Town will be reviewing expansion projects related to the Council on Aging senior center and an aging Public Works facility. During 2017, the Town dedicated just over $1,100,000 in Free Cash and other one-time revenues to fund the portion of the capital plan related to building and equipment replacement and repair. Going forward, it is the goal of the Town to provide at least one million dollars in “cash” funding on an annual basis for capital needs. Additionally, $950,000 was voted to increase reserves such as the Stabilization Fund and Pension Reserve Fund. This figure also includes $300,000 to fund the Other Postemployment Benefit Fund. Relevant Financial Policies The Town uses reserves to balance the current budget only as necessary with the goal of replenishing reserves through conservative budgeting. Major Initiatives The Town, through its long range planning development and strong financial position, saw its bond rating reaffirmed at AAA status. We are all very proud of this achievement. It was through these efforts that the Town has secured and maintained such a lofty bond rating.
Town of Duxbury, Massachusetts 7 Comprehensive Annual Financial Report
Awards and Acknowledgements The Government Finance Officers Association (GFOA) awarded a Certificate of Achievement for Excellence in Financial Reporting to the Town of Duxbury for its comprehensive annual financial report (CAFR) for the year ended June 30, 2016. This was the twelfth year that the Town submitted a CAFR to the GFOA. Based on information available on the GFOA website, only thirty-five municipalities in Massachusetts received this distinction for fiscal year 2016. Of the thirty-five, only seven have held the distinction for more years. In order to receive this prestigious award, a government had to publish an easily readable and efficiently organized CAFR that satisfied both generally accepted accounting principles and applicable legal requirements. A Certificate of Achievement is valid for a period of one year only. We believe that our current CAFR continues to meet the Certificate of Achievement Program’s requirements and we are submitting it to the GFOA to determine its eligibility for another certificate. Preparing a document of this magnitude requires a significant investment of time and resources. I am grateful to the Finance Department for achieving and maintaining this prestigious honor. This document reflects well upon the professionalism of our organization and provides a wealth of information to the community. Respectfully submitted,
John Madden Finance Director
Town of Duxbury, Massachusetts 8 Comprehensive Annual Financial Report
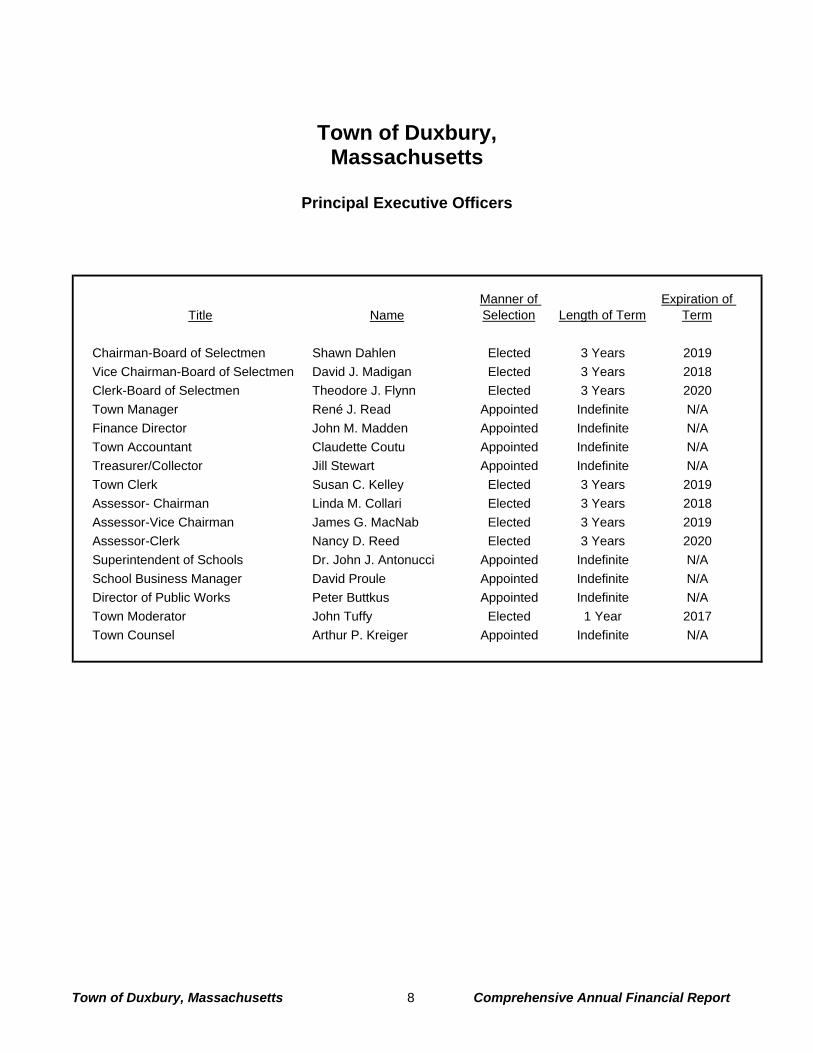
Town of Duxbury,
Massachusetts
Principal Executive Officers
Title NameManner of Selection Length of Term
Expiration of Term
Chairman-Board of Selectmen Shawn Dahlen Elected 3 Years 2019Vice Chairman-Board of Selectmen David J. Madigan Elected 3 Years 2018Clerk-Board of Selectmen Theodore J. Flynn Elected 3 Years 2020Town Manager René J. Read Appointed Indefinite N/AFinance Director John M. Madden Appointed Indefinite N/ATown Accountant Claudette Coutu Appointed Indefinite N/ATreasurer/Collector Jill Stewart Appointed Indefinite N/ATown Clerk Susan C. Kelley Elected 3 Years 2019Assessor- Chairman Linda M. Collari Elected 3 Years 2018Assessor-Vice Chairman James G. MacNab Elected 3 Years 2019Assessor-Clerk Nancy D. Reed Elected 3 Years 2020Superintendent of Schools Dr. John J. Antonucci Appointed Indefinite N/ASchool Business Manager David Proule Appointed Indefinite N/ADirector of Public Works Peter Buttkus Appointed Indefinite N/ATown Moderator John Tuffy Elected 1 Year 2017Town Counsel Arthur P. Kreiger Appointed Indefinite N/A
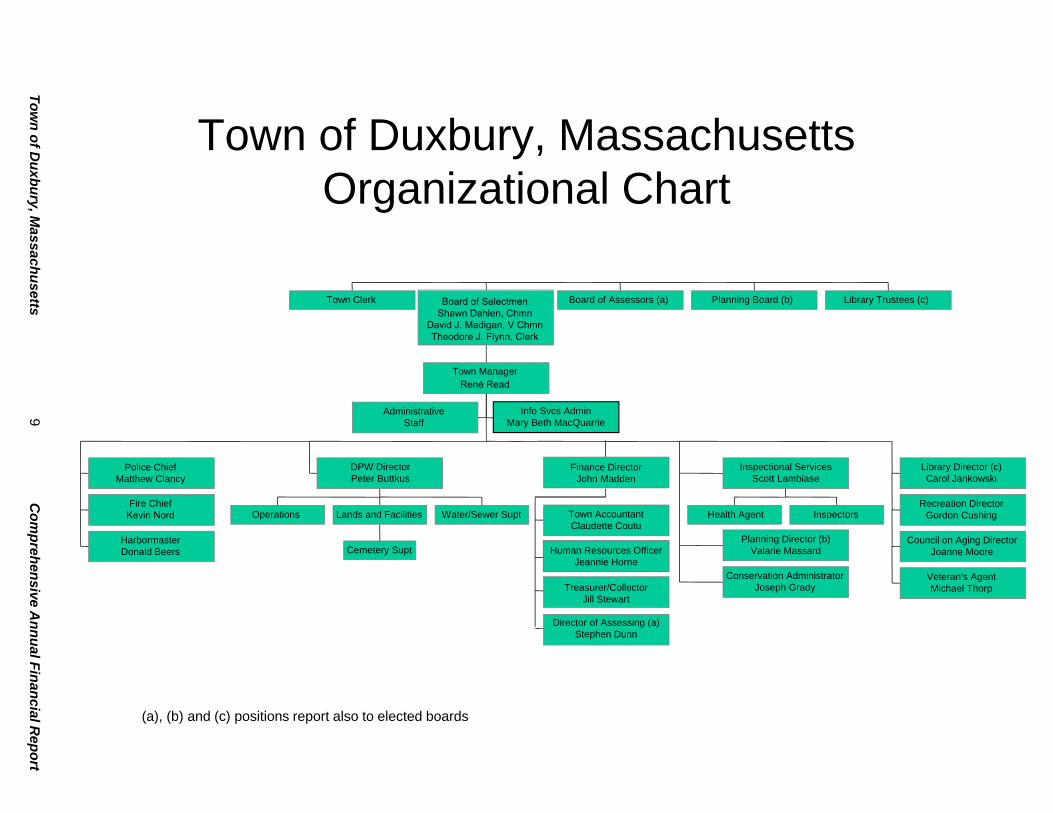
Town of Duxbury, MassachusettsOrganizational Chart
Town of D
uxbury, Massachusetts
9 Com
prehensive Annual Financial R
eport
(a), (b) and (c) positions report also to elected boards
Town Clerk
AdministrativeStaff
Police ChiefMatthew Clancy
Fire ChiefKevin Nord
HarbormasterDonald Beers
Operations
Cemetery Supt
Lands and Facilities Water/Sewer Supt
DPW DirectorPeter Buttkus
Town AccountantClaudette Coutu
Treasurer/CollectorJill Stewart
Director of Assessing (a)Stephen Dunn
Health Agent Inspectors
Inspectional ServicesScott Lambiase
Planning Director (b)Valarie Massard
Conservation AdministratorJoseph Grady
Library Director (c)Carol Jankowski
Recreation DirectorGordon Cushing
Council on Aging DirectorJoanne Moore
Veteran's AgentMichael Thorp
Town ManagerRené Read
Board of SelectmenShawn Dahlen, Chmn
David J. Madigan, V ChmnTheodore J. Flynn, Clerk
Board of Assessors (a) Planning Board (b) Library Trustees (c)
Human Resources OfficerJeannie Horne
Finance DirectorJohn Madden
Info Svcs AdminMary Beth MacQuarrie

Town of Duxbury, Massachusetts 10 Comprehensive Annual Financial Report
Certificate of Achievement for Excellence in Financial Reporting

Financial Section

Town of Duxbury, Massachusetts 11 Comprehensive Annual Financial Report
Financial Section FINANCIAL SECTION

Town of Duxbury, Massachusetts 12 Comprehensive Annual Financial Report
This page intentionally left blank.

13
Independent Auditor’s Report To the Honorable Board of Selectmen Town of Duxbury, Massachusetts Report of the Financial Statements We have audited the accompanying financial statements of the governmental activities, the business-type activities, each major fund, and the aggregate remaining fund information of the Town of Duxbury, Massachusetts, as of and for the year ended June 30, 2017, and the related notes to the financial statements, which collectively comprise the Town’s basic financial statements as listed in the table of contents. Management’s Responsibility for the Financial Statements Management is responsible for the preparation and fair presentation of these financial statements in accordance with accounting principles generally accepted in the United States of America; this includes the design, implementation, and maintenance of internal control relevant to the preparation and fair presentation of financial statements that are free from material misstatement, whether due to fraud or error. Auditor’s Responsibility Our responsibility is to express opinions on these financial statements based on our audit. We conducted our audit in accordance with auditing standards generally accepted in the United States of America and the standards applicable to financial audits contained in Government Auditing Standards, issued by the Comptroller General of the United States. Those standards require that we plan and perform the audit to obtain reasonable assurance about whether the financial statements are free from material misstatement. An audit involves performing procedures to obtain audit evidence about the amounts and disclosures in the financial statements. The procedures selected depend on the auditor’s judgment, including the assessment of the risks of material misstatement of the financial statements, whether due to fraud or error. In making those risk assessments, the auditor considers internal control relevant to the entity’s preparation and fair presentation of the financial statements in order to design audit procedures that are appropriate in the circumstances, but not for the purpose of expressing an opinion on the effectiveness of the entity’s internal control. Accordingly, we express no such opinion. An audit also includes evaluating the appropriateness of accounting policies used and the reasonableness of significant accounting estimates made by management, as well as evaluating the overall presentation of the financial statements. We believe that the audit evidence we have obtained is sufficient and appropriate to provide a basis for our audit opinions. Opinions In our opinion, the financial statements referred to above present fairly, in all material respects, the respective financial position of the governmental activities, the business-type activities, each major fund, and the aggregate remaining fund information of the Town of Duxbury, Massachusetts, as of June 30, 2017, and the respective changes in financial position and, where applicable, cash flows thereof for the year then ended in accordance with accounting principles generally accepted in the United States of America.

14
Other Matters Required Supplementary Information Accounting principles generally accepted in the United States of America require that the management’s discussion and analysis and required supplementary information, as listed in the table of contents, be presented to supplement the basic financial statements. Such information, although not a part of the basic financial statements, is required by the Governmental Accounting Standards Board who considers it to be an essential part of financial reporting for placing the basic financial statements in an appropriate operational, economic, or historical context. We have applied certain limited procedures to the required supplementary information in accordance with auditing standards generally accepted in the United States of America, which consisted of inquiries of management about the methods of preparing the information and comparing the information for consistency with management’s responses to our inquiries, the basic financial statements, and other knowledge we obtained during our audit of the basic financial statements. We do not express an opinion or provide any assurance on the information because the limited procedures do not provide us with sufficient evidence to express an opinion or provide any assurance. Other Information Our audit was conducted for the purpose of forming opinions on the financial statements that collectively comprise the Town of Duxbury, Massachusetts’ basic financial statements. The introductory section, combining statements, individual fund statements and statistical section, as listed in the table of contents, are presented for the purpose of additional analysis and are not a required part of the basic financial statements. The combining and individual fund statements, as listed in the table of contents, are the responsibility of management and were derived from and relates directly to the underlying accounting and other records used to prepare the basic financial statements. Such information has been subjected to the auditing procedures applied in the audit of the basic financial statements and certain additional procedures, including comparing and reconciling such information directly to the underlying accounting and other records used to prepare the basic financial statements or to the basic financial statements themselves, and other additional procedures in accordance with auditing standards generally accepted in the United State of America. In our opinion, the combining and individual fund statements are fairly stated, in all material respects, in relation to the financial statements taken as a whole. The introductory and statistical sections have not been subjected to the auditing procedures applied in the audit of the basic financial statements, and accordingly, we do not express an opinion or provide any assurance on them. Other Reporting Required by Government Auditing Standards In accordance with Government Auditing Standards, we have also issued our report dated December 22, 2017, on our consideration of the Town of Duxbury, Massachusetts’ internal control over financial reporting and on our tests of its compliance with certain provisions of laws, regulations, contracts, and grant agreements and other matters. The purpose of that report is to describe the scope of our testing of internal control over financial reporting and compliance and the results of that testing, and not to provide an opinion on internal control over financial reporting or on compliance. That report is an integral part of an audit performed in accordance with Government Auditing Standards in considering the Town of Duxbury, Massachusetts’ internal control over financial reporting and compliance.
December 22, 2017

Town of Duxbury, Massachusetts 15 Comprehensive Annual Financial Report
Management’s Discussion and Analysis
Management’s Discussion and Analysis

Town of Duxbury, Massachusetts 16 Comprehensive Annual Financial Report
Management’s Discussion and Analysis As management of the Town of Duxbury, we offer readers of these financial statements this narrative overview and analysis of the financial activities for the year ended June 30, 2017. The Town complies with financial reporting requirements issued by the Governmental Accounting Standards Board (GASB). Management’s discussion and analysis are part of these requirements. Overview of the Financial Statements This discussion and analysis are intended to serve as an introduction to the Town of Duxbury’s basic financial statements. These basic financial statements comprise three components: 1) government-wide financial statements, 2) fund financial statements, and 3) notes to the financial statements. Government-wide financial statements. The government-wide financial statements are designed to provide readers with a broad overview of finances, in a manner similar to private-sector business. The statement of net position presents information on all assets and liabilities, and deferred inflows/outflows of resources, with the difference between them reported as net position. Over time, increases or decreases in net position may serve as a useful indicator of whether the financial position of the Town is improving or deteriorating. The statement of activities presents information showing how the government’s net position changed during the most recent year. All changes in net position are reported as soon as the underlying event giving rise to the change occurs, regardless of the timing of related cash flows. Thus, revenues and expenses are reported in this statement for some items that will only result in cash flows in future periods (e.g., uncollected taxes and earned but unused vacation leave). Both of the government-wide financial statements distinguish functions that are principally supported by taxes and intergovernmental revenues (governmental activities) from other functions that are intended to recover all or a significant portion of their costs through user fees and charges (business-type activities). The governmental activities include general government, public safety, education, public works, human services, culture and recreation, community preservation, claims and judgments, and interest. The business-type activities include the activities of the municipal water department and the Percy Walker pool. Fund financial statements. A fund is a grouping of related accounts that is used to maintain control over resources that have been segregated for specific activities or objectives. Fund accounting is used to ensure and demonstrate compliance with finance-related legal requirements. All of the funds can be divided into three categories: governmental funds, proprietary funds, and fiduciary funds. Governmental funds. Governmental funds are used to account for essentially the same functions reported as governmental activities in the government-wide financial statements. However, unlike the government-wide financial statements, governmental fund statements focus on near-term inflows and outflows of spendable resources, as well as on balances of spendable resources available at the end of the year. Such information may be useful in evaluating a government’s near-term financing requirements. Because the focus of governmental funds is narrower than that of the government-wide financial statements, it is useful to compare the information presented for governmental funds with similar information presented for governmental activities in the government-wide financial statements. By doing so, readers may better understand the long-term impact of the government’s near-term financing decisions. Both the governmental fund balance sheet and the governmental fund statement of revenues, expenditures and changes in fund balances provide a reconciliation to facilitate this comparison between governmental funds and governmental activities.

Town of Duxbury, Massachusetts 17 Comprehensive Annual Financial Report
The Town of Duxbury adopts an annual appropriated budget for its general fund. A budgetary comparison schedule has been provided as required supplementary information for the general fund to demonstrate compliance with this budget. Proprietary funds. The Town maintains two types of proprietary funds. Enterprise funds are used to report the same functions presented as business-type activities in the government-wide financial statements. The Town uses enterprise funds to account for its municipal water department and activity of the Percy Walker pool. Internal service funds are an accounting device used to accumulate and allocate costs internally among various functions. The Town uses internal service funds to account for health insurance activities. Because these services primarily benefit governmental rather than business-type activities, they have been included within governmental activities in the government-wide financial statements. Fiduciary funds. Fiduciary funds are used to account for resources held for the benefit of parties outside the government. Fiduciary funds are not reflected in the government-wide financial statements because the resources of those funds are not available to support the Town’s own programs. The accounting used for fiduciary funds is much like that used for proprietary funds. The Town maintains three different types of fiduciary funds. The Other Postemployment Benefits Fund is used to report resources held in trust for healthcare benefits for retirees and beneficiaries. The Private-Purpose Trust Fund is used to report the Town’s scholarship funds. The Agency Fund reports resources held by the Town in a custodial capacity for individuals, private organizations and other governments. The Town’s agency funds are used to account for performance bonds, security deposits and licenses and fees collected on-behalf of the state. Notes to the basic financial statements. The notes provide additional information that is essential to a full understanding of the data provided in the government-wide and fund financial statements. Government-wide Financial Analysis As noted earlier, net position may serve over time as a useful indicator of a government’s financial position. Duxbury’s government-wide assets and deferred outflows of resources exceeded liabilities and deferred inflows of resources by $126 million at the end of 2017. The Town’s total net position increased by $32,000 during 2017, this is an indication that the Town’s overall financial position improved from the prior year. Comparative analysis of the assets, deferred outflows of resources, liabilities, deferred inflows of resources, net position, revenues, expense and transfers of the governmental and business-type activities are discussed herein. Governmental Activities The results of operations of the governmental activities are discussed in the following paragraphs and tables. Net position of $136 million reflects its investment in capital assets (e.g., land, buildings, machinery, and equipment); less any related debt used to acquire those assets that are still outstanding. The Town uses these capital assets to provide services to citizens; consequently, these assets are not available for future spending. Although the investment in its capital assets is reported net of its related debt, it should be noted that the resources needed to repay this debt must be provided from other sources, since the capital assets themselves cannot be used to liquidate these liabilities.
Town of Duxbury, Massachusetts 18 Comprehensive Annual Financial Report
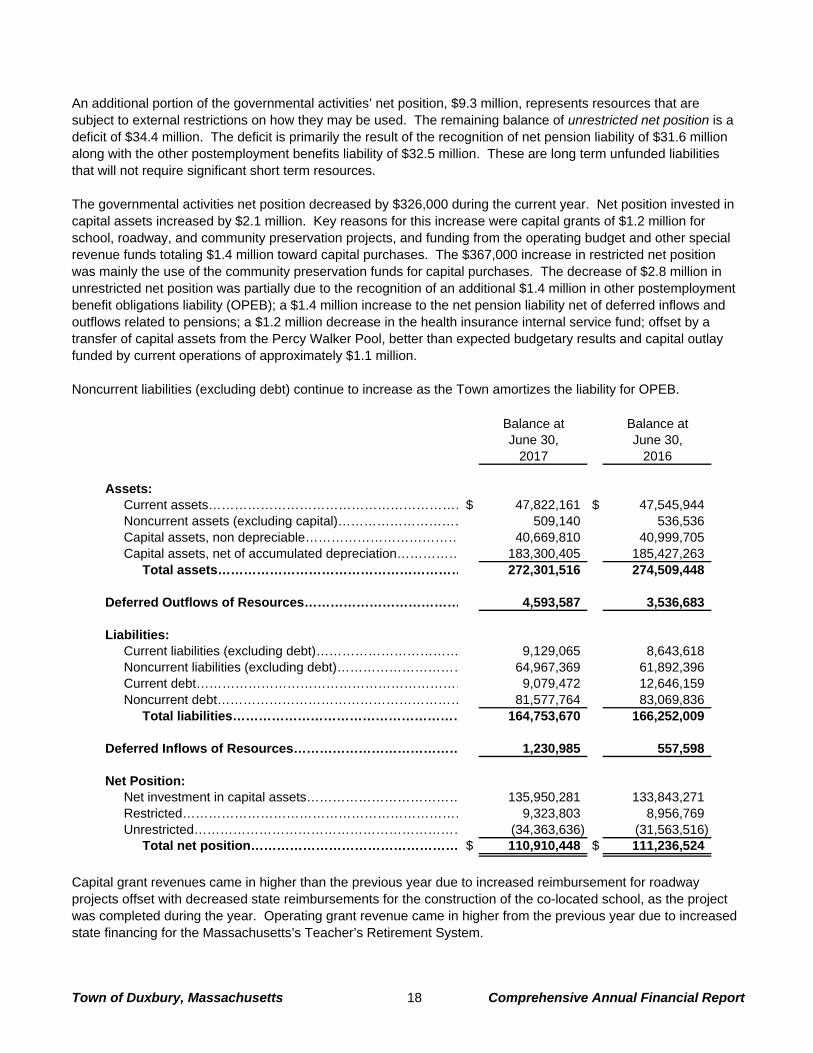
An additional portion of the governmental activities’ net position, $9.3 million, represents resources that are subject to external restrictions on how they may be used. The remaining balance of unrestricted net position is a deficit of $34.4 million. The deficit is primarily the result of the recognition of net pension liability of $31.6 million along with the other postemployment benefits liability of $32.5 million. These are long term unfunded liabilities that will not require significant short term resources. The governmental activities net position decreased by $326,000 during the current year. Net position invested in capital assets increased by $2.1 million. Key reasons for this increase were capital grants of $1.2 million for school, roadway, and community preservation projects, and funding from the operating budget and other special revenue funds totaling $1.4 million toward capital purchases. The $367,000 increase in restricted net position was mainly the use of the community preservation funds for capital purchases. The decrease of $2.8 million in unrestricted net position was partially due to the recognition of an additional $1.4 million in other postemployment benefit obligations liability (OPEB); a $1.4 million increase to the net pension liability net of deferred inflows and outflows related to pensions; a $1.2 million decrease in the health insurance internal service fund; offset by a transfer of capital assets from the Percy Walker Pool, better than expected budgetary results and capital outlay funded by current operations of approximately $1.1 million. Noncurrent liabilities (excluding debt) continue to increase as the Town amortizes the liability for OPEB.
Balance at Balance atJune 30, June 30,
2017 2016
Assets:Current assets……………………………………………………$ 47,822,161 $ 47,545,944 Noncurrent assets (excluding capital)………………………… 509,140 536,536 Capital assets, non depreciable……………………………… 40,669,810 40,999,705 Capital assets, net of accumulated depreciation…………… 183,300,405 185,427,263
Total assets………………………………………………… 272,301,516 274,509,448
Deferred Outflows of Resources……………………………… 4,593,587 3,536,683
Liabilities:Current liabilities (excluding debt)…………………………… 9,129,065 8,643,618 Noncurrent liabilities (excluding debt)………………………… 64,967,369 61,892,396 Current debt……………………………………………………… 9,079,472 12,646,159 Noncurrent debt………………………………………………… 81,577,764 83,069,836
Total liabilities……………………………………………… 164,753,670 166,252,009
Deferred Inflows of Resources………………………………… 1,230,985 557,598
Net Position:Net investment in capital assets……………………………… 135,950,281 133,843,271 Restricted………………………………………………………… 9,323,803 8,956,769 Unrestricted……………………………………………………… (34,363,636) (31,563,516)
Total net position………………………………………… $ 110,910,448 $ 111,236,524
Capital grant revenues came in higher than the previous year due to increased reimbursement for roadway projects offset with decreased state reimbursements for the construction of the co-located school, as the project was completed during the year. Operating grant revenue came in higher from the previous year due to increased state financing for the Massachusetts’s Teacher’s Retirement System.

Town of Duxbury, Massachusetts 19 Comprehensive Annual Financial Report
The public safety functional expense increased partly due to the expenditures related to the new regional 911 dispatch center. The education functional expense line increased due to an increase in the payment made to the Massachusetts’s Teacher’s Retirement System and in the operating budget. The claims and judgement payment in 2016 related to a settlement over the management of the Town’s golf course.
Year Ended Year EndedJune 30, June 30,
2017 2016
Program Revenues:Charges for services…………………………………………… $ 15,806,189 $ 15,205,361 Operating grants and contributions…………………………… 16,276,654 13,869,319 Capital grants and contributions……………………………… 1,161,840 953,518
General Revenues:Real estate and personal property taxes…………………… 57,825,786 56,346,529 Tax liens………………………………………………………… 65,223 2,570 Motor vehicle and other excise taxes………………………… 3,130,995 2,870,355 Community preservation taxes………………………………… 482,247 462,949 Penalties and interest on taxes……………………………… 285,929 263,221 Payments in lieu of taxes……………………………………… 11,725 13,476 Nonrestricted grants and contributions……………………… 1,030,560 982,675 Unrestricted investment income……………………………… 864,313 1,404,393 Miscellaneous…………………………………………………… 50,000 6,500 Gain on sale of capital assets………………………………… 4,440 -
Total revenues……………………………………………… 96,995,901 92,380,866
Expenses:General government…………………………………………… 4,980,915 4,943,552 Public safety…………………………………………………… 13,087,396 11,612,777 Education………………………………………………………… 65,375,555 58,761,241 Public works……………………………………………………… 6,666,580 7,653,366 Human services………………………………………………… 1,333,179 1,359,923 Culture and recreation………………………………………… 3,394,809 3,146,025 Community preservation……………………………………… 259,022 334,472 Claims and judgements………………………………………… - 435,000 Interest…………………………………………………………… 2,302,634 2,385,421
Total expenses……………………………………………… 97,400,090 90,631,777
Excess (deficiency) before special item and transfers…… (404,189) 1,749,089
Special Item - Conversion to governmental activities(Note 14)………………………………………………………… (214,215) -
Transfers…………………………………………………………… 292,328 (183,986)
Change in net position…………………………………………… (326,076) 1,565,103
Beginning net position…………………………………………… 111,236,524 109,671,421
Ending net position……………………………………………… $ 110,910,448 $ 111,236,524

Town of Duxbury, Massachusetts 20 Comprehensive Annual Financial Report
Business-type Activities The results of operations for the business-type activities are discussed in the following paragraphs and tables. For the Town’s water business-type activities, assets and deferred outflows of resources exceeded liabilities and deferred inflows of resources by $15.1 million at the close of 2017. Of this amount $10.5 million (69%) is net investment in capital assets, and $4.6 million (31%) is unrestricted and may be used to meet the water enterprise’s ongoing obligations. There was an increase of $606,000 in net position related to the Water Department’s operations during the year. Revenue increased $166,000 which is fairly consistent with prior year. Expenses increased $216,000, which included a $39,000 increase in the net pension liability, net of deferred outflows/inflows related to pensions along with an increase in maintenance expenditures and design services. On June 30, 2017, the Percy Walker pool ceased operations as an enterprise fund and became a department of the general fund. The balance in net position of $405,000 was transferred to governmental activities.
Business-Type Activities:Balance at Balance atJune 30, June 30,
2017 2016
Assets:Current assets……………………………………………………$ 6,379,550 $ 5,615,288 Capital assets, non depreciable……………………………… 3,629,017 4,712,442 Capital assets, net of accumulated depreciation…………… 9,608,187 10,814,365
Total assets………………………………………………… 19,616,754 21,142,095
Deferred Outflows of Resources……………………………… 156,098 161,425
Liabilities:Current liabilities (excluding debt)…………………………… 194,384 120,922 Noncurrent liabilities (excluding debt)………………………… 1,290,104 1,592,590 Current debt……………………………………………………… 586,307 598,311 Noncurrent debt………………………………………………… 2,530,344 4,206,651
Total liabilities……………………………………………… 4,601,139 6,518,474
Deferred Inflows of Resources………………………………… 33,499 5,066
Net Position:Net investment in capital assets……………………………… 10,518,550 11,036,636 Unrestricted……………………………………………………… 4,619,664 3,743,344
Total net position………………………………………… $ 15,138,214 $ 14,779,980
Town of Duxbury, Massachusetts 21 Comprehensive Annual Financial Report
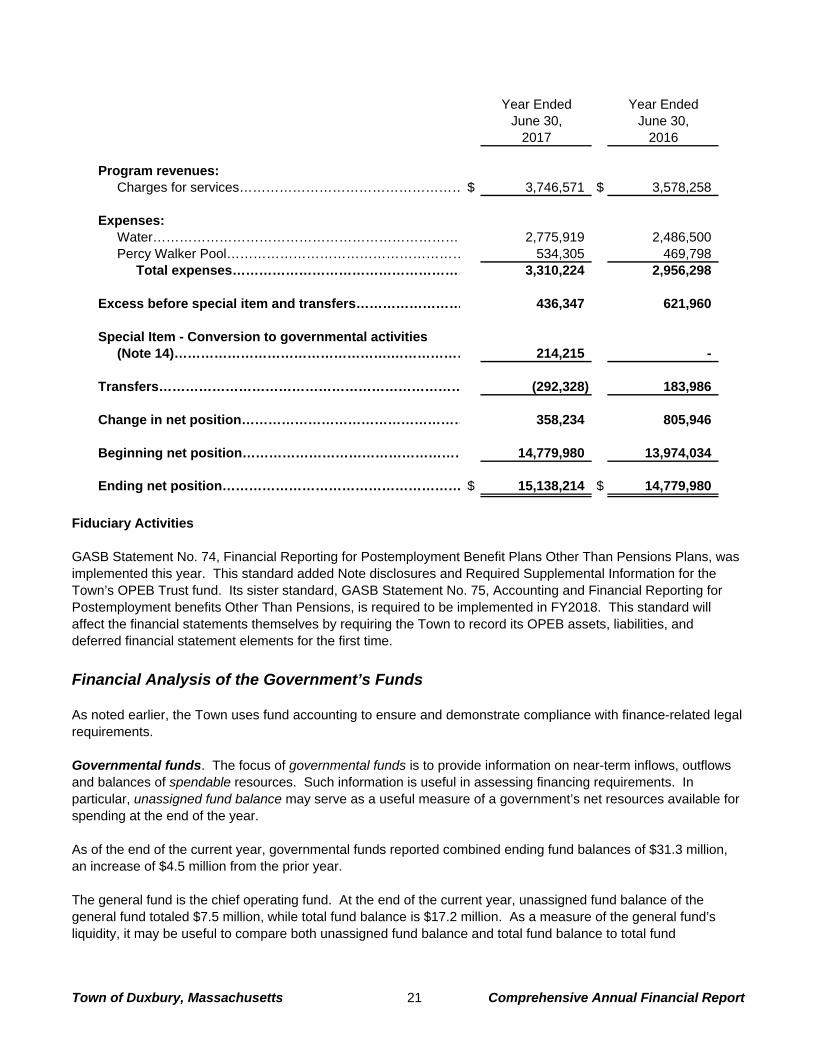
Year Ended Year EndedJune 30, June 30,
2017 2016
Program revenues:Charges for services…………………………………………… $ 3,746,571 $ 3,578,258
Expenses:Water…………………………………………………………… 2,775,919 2,486,500 Percy Walker Pool……………………………………………… 534,305 469,798
Total expenses……………………………………………… 3,310,224 2,956,298
Excess before special item and transfers…………………… 436,347 621,960
Special Item - Conversion to governmental activities(Note 14)………………………………………….……………… 214,215 -
Transfers…………………………………………………………… (292,328) 183,986
Change in net position…………………………………………… 358,234 805,946
Beginning net position…………………………………………… 14,779,980 13,974,034
Ending net position……………………………………………… $ 15,138,214 $ 14,779,980
Fiduciary Activities GASB Statement No. 74, Financial Reporting for Postemployment Benefit Plans Other Than Pensions Plans, was implemented this year. This standard added Note disclosures and Required Supplemental Information for the Town’s OPEB Trust fund. Its sister standard, GASB Statement No. 75, Accounting and Financial Reporting for Postemployment benefits Other Than Pensions, is required to be implemented in FY2018. This standard will affect the financial statements themselves by requiring the Town to record its OPEB assets, liabilities, and deferred financial statement elements for the first time. Financial Analysis of the Government’s Funds As noted earlier, the Town uses fund accounting to ensure and demonstrate compliance with finance-related legal requirements. Governmental funds. The focus of governmental funds is to provide information on near-term inflows, outflows and balances of spendable resources. Such information is useful in assessing financing requirements. In particular, unassigned fund balance may serve as a useful measure of a government’s net resources available for spending at the end of the year. As of the end of the current year, governmental funds reported combined ending fund balances of $31.3 million, an increase of $4.5 million from the prior year. The general fund is the chief operating fund. At the end of the current year, unassigned fund balance of the general fund totaled $7.5 million, while total fund balance is $17.2 million. As a measure of the general fund’s liquidity, it may be useful to compare both unassigned fund balance and total fund balance to total fund
Town of Duxbury, Massachusetts 22 Comprehensive Annual Financial Report
expenditures. Unassigned fund balance represents 9.4% of total general fund expenditures, while total fund balance represents 21.3% of that same amount. The general fund increased by $544,000 in 2017. This was due to the increase in the Town’s stabilization funds better than expected budgetary results. The Community Preservation Act fund had a fund balance at June 30, 2017, of $3.9 million. These funds are attributable to the Town’s acceptance of the Community Preservation Act, which allows the Town to impose a surcharge on property taxes and to receive matching state funds for specified uses related to the acquisition, creation, preservation and support of open space, historic resources, land for recreational use and community housing. The Community Preservation Act’s fund balance increased $286,000 in 2017. This was the net result of $584,000 in taxes and state matching funds collected offset by $297,000 in expenditures on community preservation projects. The highway improvements fund reported $317,000 of expenditures against $317,000 of reimbursements on projects which are fully supported by state grants on a reimbursable basis. The Co-located school major fund was established after the Town passed, by special election, an override of Proposition 2½ allowing the construction of a new middle and high school totaling $128 million. The Town has been approved to receive assistance from the Massachusetts School Building Authority (MSBA) for 45.13% of eligible construction costs. The Co-located school project was completed during 2016, in which the Town had received more than 95% of eligible reimbursements. During 2017, the Town had their final MSBA project costs submission audited by MSBA and soon thereafter, received their final payment of $1.9 million. General Fund Budgetary Highlights The $1.8 million increase from the original budget to the final amended budget resulted mainly from a Spring Special Town Meeting vote to use free cash of $1.8 million to supplement various governmental departments and funds. The largest uses of free cash includes $212,000 for collective bargaining, $400,000 for Special Education Reserve, $300,000 to fund other postemployment benefits, $200,000 to fund debt associated with the purchase of a Fire Pumping Engine, $435,000 for a court judgement BAN and transfers to the stabilization and compensated absence funds. General Fund revenues came in approximately $2 million more than budgeted. The largest area of the surplus was in departmental and other revenues, and motor vehicle excise which made up $831,000 and $780,000, of the total, respectively. This was mainly due to the Town budgeting conservatively in these areas. General fund expenditures and encumbrances were approximately $903,000 less than budgeted. Key components of this surplus include $132,000 in education salaries, $56,000 in legal expenditures, $92,000 in fuel depot expenditures, $66,000 in sewer department expenditures, and $46,000 in property and liability insurance. Capital Asset and Debt Administration In conjunction with the operating budget, the Town annually prepares a capital budget for the upcoming year and a five-year Capital Improvement Plan (CIP) that is used as a guide for future capital expenditures. The Town’s major governmental capital asset activity in 2017 includes additions in vehicles of $978,000 and $518,000 for infrastructure.

Town of Duxbury, Massachusetts 23 Comprehensive Annual Financial Report
Capital Assets
Cost of AccumulatedCapital Assets Depreciation Capitalat end of year at end of year Assets, net
Governmental activitiesFunction:General government……………$ 20,737,326 $ (473,195) $ 20,264,131 Public safety…………………… 19,161,022 (7,049,823) 12,111,199 Education……………………… 184,740,819 (32,274,162) 152,466,657 Public works…………………… 26,211,368 (12,683,608) 13,527,760 Culture and recreation………… 12,020,446 (4,882,190) 7,138,256 Community preservation……… 18,626,878 (1,560,225) 17,066,653 Human services………………… 2,411,511 (1,015,952) 1,395,559
Total governmental…………… $ 283,909,370 $ (59,939,155) $ 223,970,215
Business-type activities
Water…………………………… $ 27,635,001 $ (14,397,797) $ 13,237,204
Debt The Town of Duxbury’s governmental funds had total bonded debt outstanding of $82.8 million at the end of the current year. Of this amount, $69.7 million is related to school construction and equipment, $1.9 million is related to the crematory, $5 million is related to the police station construction, $3 million is related to the fire station renovations, $1.5 million is related to the Powder Point bridge and $1.2 million for the Percy Walker Pool. The remaining $400,000 relates to other capital related projects. The water enterprise fund has $3 million in water debt that is fully supported by the rates and does not rely on a general fund subsidy. For further discussion please refer to Note 4 for major capital activity and Notes 6 and 7 for debt activity. Requests for Information This financial report is designed to provide a general overview of the Town of Duxbury’s finances for all those with an interest in the government’s finances. Questions concerning any of the information provided in this report or requests for additional financial information should be addressed to the Finance Director, Town Hall, 878 Tremont Street, Duxbury, Massachusetts 02332.
Town of Duxbury, Massachusetts 24 Comprehensive Annual Financial Report
Basic Financial Statements
Basic Financial Statements

STATEMENT OF NET POSITION
JUNE 30, 2017
Primary Government
Governmental Business-typeActivities Activities Total
ASSETSCURRENT:
Cash and cash equivalents………………………………….…… $ 19,856,954 $ 4,828,315 $ 24,685,269 Investments………………………………………………………… 24,015,904 - 24,015,904 Receivables, net of allowance for uncollectibles:
Real estate and personal property taxes…………………… 1,174,193 - 1,174,193 Tax liens………………………………………………………… 65,691 - 65,691 Motor vehicle and other excise taxes………………………… 203,255 - 203,255 User fees………………………………………………………… 33,187 1,551,235 1,584,422 Departmental and other……………………………………… 539,183 - 539,183 Special assessments…………………………………………… 46,432 - 46,432 Intergovernmental……………………………………………… 1,189,089 - 1,189,089
Tax foreclosures…………………………………………………… 698,273 - 698,273
Total current assets…………………………………………… 47,822,161 6,379,550 54,201,711
NONCURRENT: Receivables, net of allowance for uncollectibles:
Special assessments…………………………………………… 178,796 - 178,796 Real estate tax deferrals……………………………………… 330,344 - 330,344
Capital assets: Nondepreciable………………………………………………… 40,669,810 3,629,017 44,298,827 Depreciable……………………………………………………… 183,300,405 9,608,187 192,908,592
Total noncurrent assets………………………………………… 224,479,355 13,237,204 237,716,559
TOTAL ASSETS……………………………………………………… 272,301,516 19,616,754 291,918,270
DEFERRED OUTFLOWS OF RESOURCES Deferred outflows related to pensions…………………………… 4,593,587 156,098 4,749,685
LIABILITIES CURRENT:
Warrants payable………………………………………………… 1,138,632 108,270 1,246,902 Accrued payroll…………………………………………………… 3,446,736 22,269 3,469,005 Health claims and stop loss payable…………………………… 1,654,849 - 1,654,849 Accrued interest…………………………………………………… 913,491 19,845 933,336 Other liabilities……………………………………………………… 448,193 - 448,193 Compensated absences…………………………………………… 1,280,000 44,000 1,324,000 Workers' compensation…………………………………………… 247,164 - 247,164 Notes payable……………………………………………………… 2,819,400 150,000 2,969,400 Bonds payable……………………………………………………… 6,260,072 436,307 6,696,379
Total current liabilities………………………………………… 18,208,537 780,691 18,989,228
NONCURRENT: Compensated absences…………………………………………… 394,000 7,000 401,000 Workers' compensation…………………………………………… 395,901 - 395,901 Net pension liability………………………………………………… 31,629,040 1,074,812 32,703,852 Other postemployment benefits………………………………… 32,548,428 208,292 32,756,720 Bonds payable……………………………………………………… 81,577,764 2,530,344 84,108,108
Total noncurrent liabilities……………………………………… 146,545,133 3,820,448 150,365,581
TOTAL LIABILITIES…………………………………………………… 164,753,670 4,601,139 169,354,809
DEFERRED INFLOWS OF RESOURCES Taxes paid in advance…………………………………………… 245,182 - 245,182 Deferred inflows related to pensions…………………………… 985,803 33,499 1,019,302
TOTAL DEFERRED INFLOWS OF RESOURCES………………… 1,230,985 33,499 1,264,484
NET POSITION Net investment in capital assets……………………………………… 135,950,281 10,518,550 146,468,831 Restricted for:
Perpetual care and other permanent funds: Expendable……….…………………………………………… 1,544,334 - 1,544,334 Nonexpendable………………………………………………… 2,318,473 - 2,318,473
Gifts and grants…………………………………………………… 1,423,161 - 1,423,161 Community preservation…………………………………………… 4,037,835 - 4,037,835
Unrestricted……………………………………………………………… (34,363,636) 4,619,664 (29,743,972)
TOTAL NET POSITION……………………………………………… $ 110,910,448 $ 15,138,214 $ 126,048,662
See notes to basic financial statements.
Town of Duxbury, Massachusetts 25 Comprehensive Annual Financial Report
STATEMENT OF ACTIVITIES
YEAR ENDED JUNE 30, 2017
Operating CapitalCharges for Grants and Grants and Net (Expense)
Functions/Programs Expenses Services Contributions Contributions RevenuePrimary Government:
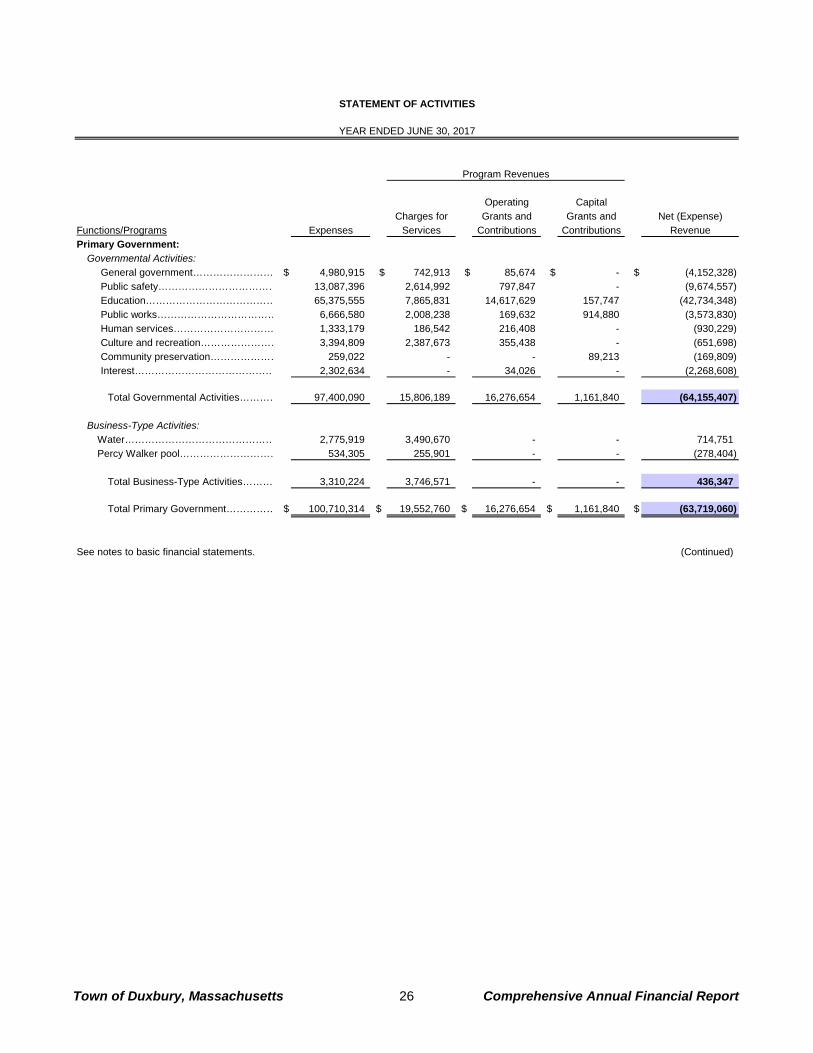
Governmental Activities:General government…………………… $ 4,980,915 $ 742,913 $ 85,674 $ - $ (4,152,328) Public safety……………………………… 13,087,396 2,614,992 797,847 - (9,674,557) Education………………………………… 65,375,555 7,865,831 14,617,629 157,747 (42,734,348) Public works……………………………… 6,666,580 2,008,238 169,632 914,880 (3,573,830) Human services………………………… 1,333,179 186,542 216,408 - (930,229) Culture and recreation…………………… 3,394,809 2,387,673 355,438 - (651,698) Community preservation………………… 259,022 - - 89,213 (169,809) Interest…………………………………… 2,302,634 - 34,026 - (2,268,608)
Total Governmental Activities………… 97,400,090 15,806,189 16,276,654 1,161,840 (64,155,407)
Business-Type Activities:Water……………………………………… 2,775,919 3,490,670 - - 714,751 Percy Walker pool………………………… 534,305 255,901 - - (278,404)
Total Business-Type Activities……… 3,310,224 3,746,571 - - 436,347
Total Primary Government…………… $ 100,710,314 $ 19,552,760 $ 16,276,654 $ 1,161,840 $ (63,719,060)
See notes to basic financial statements. (Continued)
Program Revenues
Town of Duxbury, Massachusetts 26 Comprehensive Annual Financial Report
STATEMENT OF ACTIVITIES
YEAR ENDED JUNE 30, 2017
Governmental Business-TypeActivities Activities Total
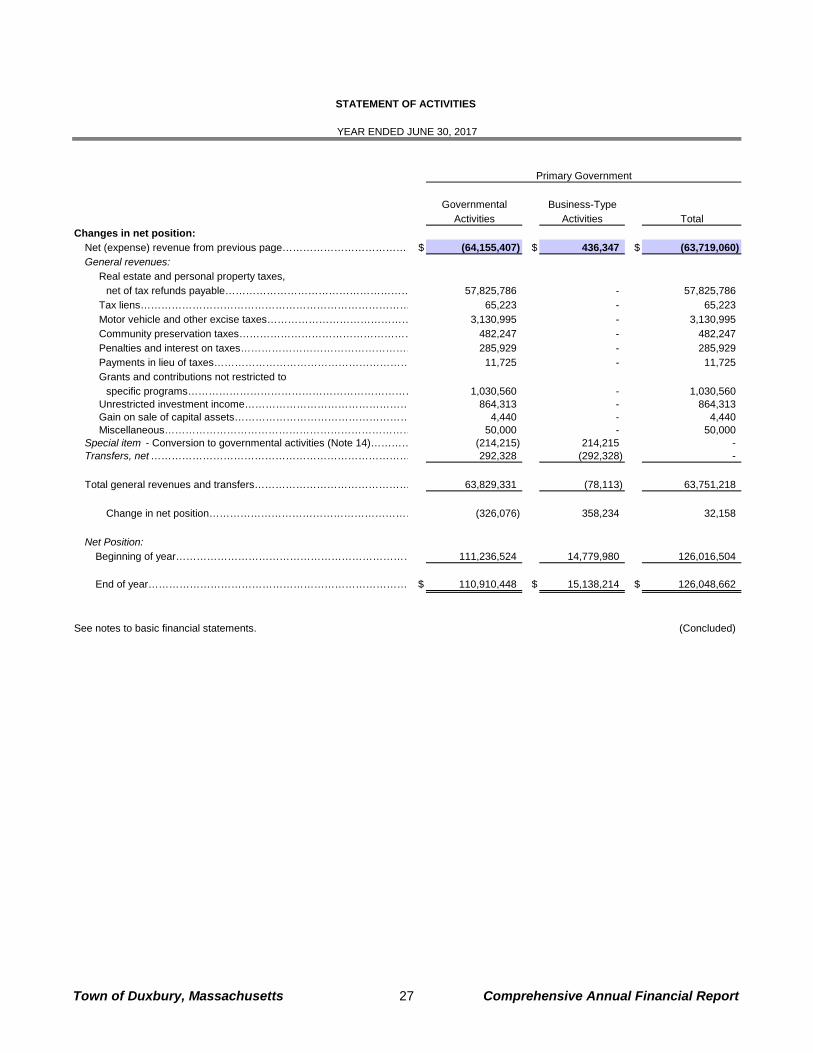
Changes in net position:Net (expense) revenue from previous page………………………………… $ (64,155,407) $ 436,347 $ (63,719,060) General revenues:
Real estate and personal property taxes, net of tax refunds payable……………………………………………… 57,825,786 - 57,825,786
Tax liens…………………………………………………………………… 65,223 - 65,223 Motor vehicle and other excise taxes…………………………………… 3,130,995 - 3,130,995 Community preservation taxes…………………………………………… 482,247 - 482,247 Penalties and interest on taxes…………………………………………… 285,929 - 285,929 Payments in lieu of taxes………………………………………………… 11,725 - 11,725 Grants and contributions not restricted to
specific programs………………………………………………………… 1,030,560 - 1,030,560 Unrestricted investment income………………………………………… 864,313 - 864,313 Gain on sale of capital assets…………………………………………… 4,440 - 4,440 Miscellaneous……………………………………………………………… 50,000 - 50,000
Special item - Conversion to governmental activities (Note 14)………… (214,215) 214,215 - Transfers, net ………………………………………………………………… 292,328 (292,328) -
Total general revenues and transfers……………………………………… 63,829,331 (78,113) 63,751,218
Change in net position…………………………………………………… (326,076) 358,234 32,158
Net Position: Beginning of year…………………………………………………………… 111,236,524 14,779,980 126,016,504
End of year………………………………………………………………… $ 110,910,448 $ 15,138,214 $ 126,048,662
See notes to basic financial statements. (Concluded)
Primary Government
Town of Duxbury, Massachusetts 27 Comprehensive Annual Financial Report
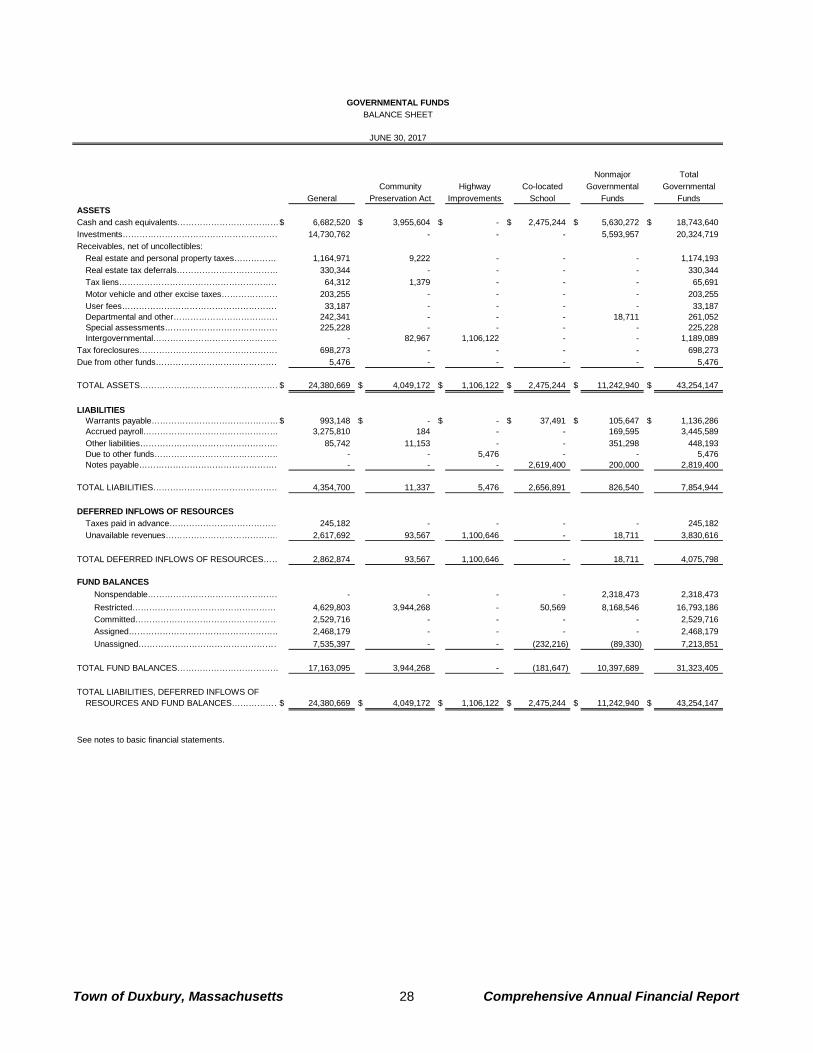
Nonmajor TotalCommunity Highway Co-located Governmental Governmental
General Preservation Act Improvements School Funds FundsASSETSCash and cash equivalents………………………………$ 6,682,520 $ 3,955,604 $ - $ 2,475,244 $ 5,630,272 $ 18,743,640 Investments………………………………………………… 14,730,762 - - - 5,593,957 20,324,719 Receivables, net of uncollectibles:
Real estate and personal property taxes……………… 1,164,971 9,222 - - - 1,174,193 Real estate tax deferrals……………………………… 330,344 - - - - 330,344 Tax liens………………………………………………… 64,312 1,379 - - - 65,691 Motor vehicle and other excise taxes………………… 203,255 - - - - 203,255 User fees………………………………………………… 33,187 - - - - 33,187 Departmental and other………………………………… 242,341 - - - 18,711 261,052 Special assessments…………………………………… 225,228 - - - - 225,228 Intergovernmental……………………………………… - 82,967 1,106,122 - - 1,189,089
Tax foreclosures…………………………………………… 698,273 - - - - 698,273 Due from other funds……………………………………… 5,476 - - - - 5,476
TOTAL ASSETS……………………………………………$ 24,380,669 $ 4,049,172 $ 1,106,122 $ 2,475,244 $ 11,242,940 $ 43,254,147
LIABILITIESWarrants payable……………………………………… $ 993,148 $ - $ - $ 37,491 $ 105,647 $ 1,136,286 Accrued payroll………………………………………… 3,275,810 184 - - 169,595 3,445,589 Other liabilities…………………………………………… 85,742 11,153 - - 351,298 448,193 Due to other funds……………………………………… - - 5,476 - - 5,476 Notes payable…………………………………………… - - - 2,619,400 200,000 2,819,400
TOTAL LIABILITIES……………………………………… 4,354,700 11,337 5,476 2,656,891 826,540 7,854,944
DEFERRED INFLOWS OF RESOURCESTaxes paid in advance………………………………… 245,182 - - - - 245,182 Unavailable revenues…………………………………… 2,617,692 93,567 1,100,646 - 18,711 3,830,616
TOTAL DEFERRED INFLOWS OF RESOURCES…… 2,862,874 93,567 1,100,646 - 18,711 4,075,798
FUND BALANCESNonspendable………………………………………… - - - - 2,318,473 2,318,473 Restricted……………………………………………… 4,629,803 3,944,268 - 50,569 8,168,546 16,793,186 Committed…………………………………………… 2,529,716 - - - - 2,529,716 Assigned……………………………………………… 2,468,179 - - - - 2,468,179 Unassigned…………………………………………… 7,535,397 - - (232,216) (89,330) 7,213,851
TOTAL FUND BALANCES……………………………… 17,163,095 3,944,268 - (181,647) 10,397,689 31,323,405
TOTAL LIABILITIES, DEFERRED INFLOWS OFRESOURCES AND FUND BALANCES………………$ 24,380,669 $ 4,049,172 $ 1,106,122 $ 2,475,244 $ 11,242,940 $ 43,254,147
See notes to basic financial statements.
GOVERNMENTAL FUNDSBALANCE SHEET
JUNE 30, 2017
Town of Duxbury, Massachusetts 28 Comprehensive Annual Financial Report
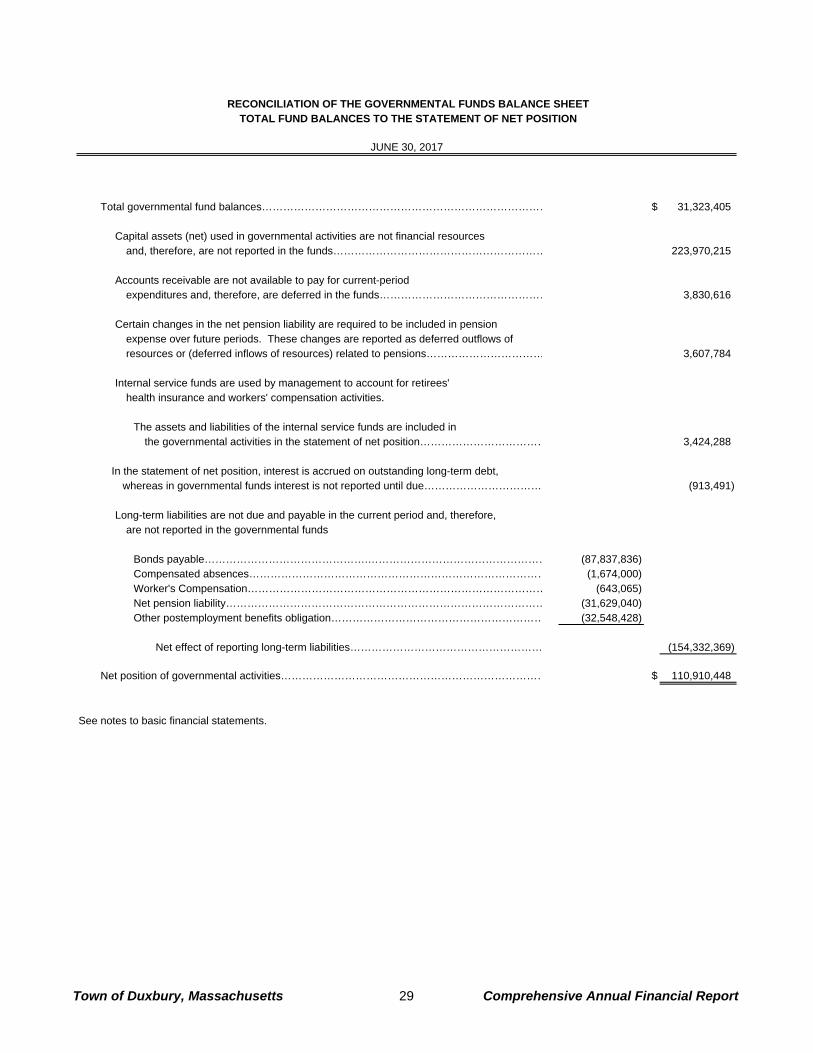
RECONCILIATION OF THE GOVERNMENTAL FUNDS BALANCE SHEETTOTAL FUND BALANCES TO THE STATEMENT OF NET POSITION
JUNE 30, 2017
Total governmental fund balances……………………………………………………………………… $ 31,323,405
Capital assets (net) used in governmental activities are not financial resources and, therefore, are not reported in the funds…………………………………………………… 223,970,215
Accounts receivable are not available to pay for current-period
expenditures and, therefore, are deferred in the funds………………………………………… 3,830,616
Certain changes in the net pension liability are required to be included in pensionexpense over future periods. These changes are reported as deferred outflows ofresources or (deferred inflows of resources) related to pensions…………………………… 3,607,784
Internal service funds are used by management to account for retirees' health insurance and workers' compensation activities.
The assets and liabilities of the internal service funds are included in
the governmental activities in the statement of net position……………………………… 3,424,288
In the statement of net position, interest is accrued on outstanding long-term debt, whereas in governmental funds interest is not reported until due…………………………… (913,491)
Long-term liabilities are not due and payable in the current period and, therefore,
are not reported in the governmental funds
Bonds payable……………………………………….…………………………………………… (87,837,836) Compensated absences………………………………………………………………………… (1,674,000) Worker's Compensation………………………………………………………………………… (643,065) Net pension liability……………………………………………………………………………… (31,629,040) Other postemployment benefits obligation…………………………………………………… (32,548,428)
Net effect of reporting long-term liabilities……………………………………………… (154,332,369)
Net position of governmental activities………………………………………………………………… $ 110,910,448
See notes to basic financial statements.
Town of Duxbury, Massachusetts 29 Comprehensive Annual Financial Report
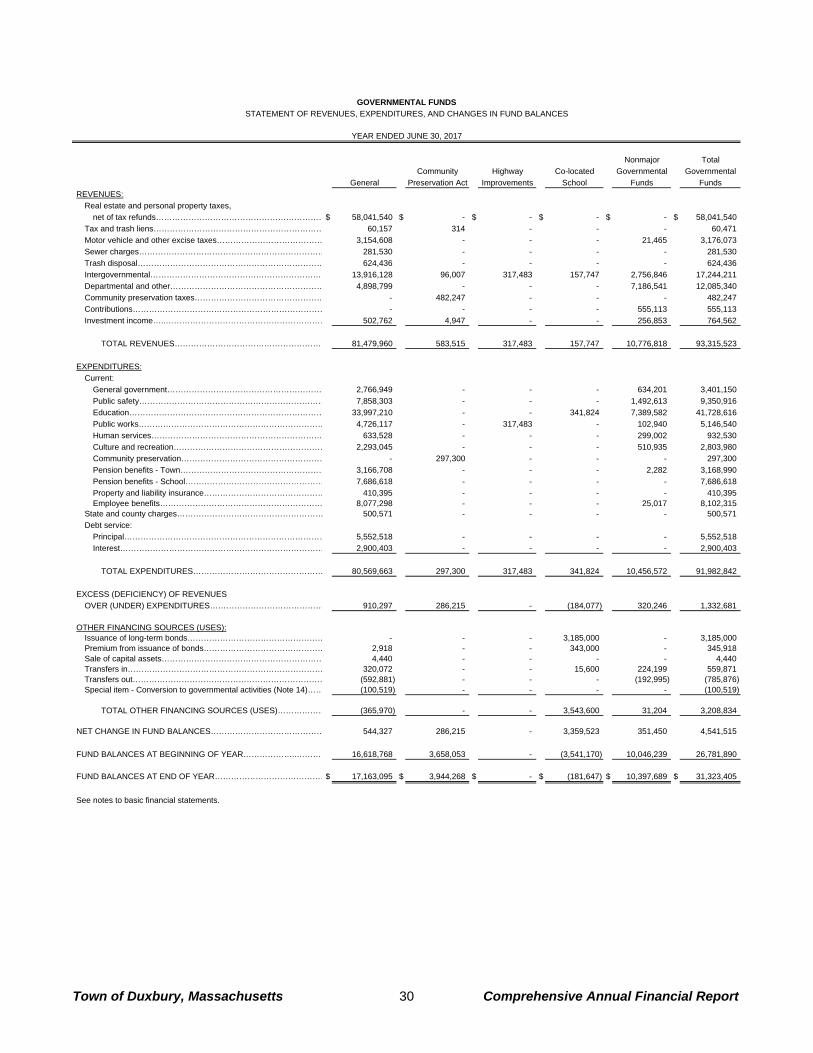
Nonmajor TotalCommunity Highway Co-located Governmental Governmental
General Preservation Act Improvements School Funds FundsREVENUES: Real estate and personal property taxes,
net of tax refunds………………………………………………………$ 58,041,540 $ - $ - $ - $ - $ 58,041,540 Tax and trash liens……………………………………………………… 60,157 314 - - - 60,471 Motor vehicle and other excise taxes………………………………… 3,154,608 - - - 21,465 3,176,073 Sewer charges…………………………………………………………… 281,530 - - - - 281,530 Trash disposal…………………………………………………………… 624,436 - - - - 624,436 Intergovernmental………………………………………………………… 13,916,128 96,007 317,483 157,747 2,756,846 17,244,211 Departmental and other………………………………………………… 4,898,799 - - - 7,186,541 12,085,340 Community preservation taxes………………………………………… - 482,247 - - - 482,247 Contributions……………………………………………………………… - - - - 555,113 555,113 Investment income…..…………………………………………………… 502,762 4,947 - - 256,853 764,562
TOTAL REVENUES………………………………………………… 81,479,960 583,515 317,483 157,747 10,776,818 93,315,523
EXPENDITURES:Current:
General government………………………………………………… 2,766,949 - - - 634,201 3,401,150 Public safety…………………………………………………………… 7,858,303 - - - 1,492,613 9,350,916 Education……………………………………………………………… 33,997,210 - - 341,824 7,389,582 41,728,616 Public works…………………………………………………………… 4,726,117 - 317,483 - 102,940 5,146,540 Human services……………………………………………………… 633,528 - - - 299,002 932,530 Culture and recreation………………………………………………… 2,293,045 - - - 510,935 2,803,980 Community preservation……………………………………………… - 297,300 - - - 297,300 Pension benefits - Town……………………………………………… 3,166,708 - - - 2,282 3,168,990 Pension benefits - School…………………………………………… 7,686,618 - - - - 7,686,618 Property and liability insurance……………………………………… 410,395 - - - - 410,395 Employee benefits…………………………………………………… 8,077,298 - - - 25,017 8,102,315
State and county charges……………………………………………… 500,571 - - - - 500,571 Debt service:
Principal………………………………………………………………… 5,552,518 - - - - 5,552,518 Interest………………………………………………………………… 2,900,403 - - - - 2,900,403
TOTAL EXPENDITURES………………………………………… 80,569,663 297,300 317,483 341,824 10,456,572 91,982,842
EXCESS (DEFICIENCY) OF REVENUESOVER (UNDER) EXPENDITURES…………………………………… 910,297 286,215 - (184,077) 320,246 1,332,681
OTHER FINANCING SOURCES (USES):Issuance of long-term bonds…………………………………………… - - - 3,185,000 - 3,185,000 Premium from issuance of bonds……………………………………… 2,918 - - 343,000 - 345,918 Sale of capital assets…………………………………………………… 4,440 - - - - 4,440 Transfers in……………………………………………………………… 320,072 - - 15,600 224,199 559,871 Transfers out……………………………………………………………… (592,881) - - - (192,995) (785,876) Special item - Conversion to governmental activities (Note 14)…… (100,519) - - - - (100,519)
TOTAL OTHER FINANCING SOURCES (USES)……………… (365,970) - - 3,543,600 31,204 3,208,834
NET CHANGE IN FUND BALANCES…………………………………… 544,327 286,215 - 3,359,523 351,450 4,541,515
FUND BALANCES AT BEGINNING OF YEAR………………..………… 16,618,768 3,658,053 - (3,541,170) 10,046,239 26,781,890
FUND BALANCES AT END OF YEAR……………………………………$ 17,163,095 $ 3,944,268 $ - $ (181,647) $ 10,397,689 $ 31,323,405
See notes to basic financial statements.
GOVERNMENTAL FUNDSSTATEMENT OF REVENUES, EXPENDITURES, AND CHANGES IN FUND BALANCES
YEAR ENDED JUNE 30, 2017
Town of Duxbury, Massachusetts 30 Comprehensive Annual Financial Report

RECONCILIATION OF THE STATEMENT OF REVENUES, EXPENDITURES,AND CHANGES IN FUND BALANCES OF GOVERNMENTAL FUNDS
TO THE STATEMENT OF ACTIVITIES
YEAR ENDED JUNE 30, 2017
Net change in fund balances - total governmental funds…………………………………………………… $ 4,541,515
Governmental funds report capital outlays as expenditures. However, in the Statement of Activities the cost of those assets is allocated over their estimated useful lives and reported as depreciation expense.
Capital outlay…………………………………………………………………………………………… 2,296,384 Percy Walker Pool transfer of capital assets, net of accumulated depreciation……………… 2,009,425 Depreciation expense………………………………………………………………………………… (6,762,562)
Net effect of reporting capital assets………………………………………………………… (2,456,753)
Revenues in the Statement of Activities that do not provide current financial
resources are fully deferred in the Statement of Revenues, Expenditures and Changes in Fund Balances. Therefore, the recognition of revenue for various types of accounts receivable (i.e., real estate and personal property, motor vehicle excise, etc.) differ between the two statements. This amount represents the net change in deferred inflows of resources……………………………………………………… 263,854
The issuance of long-term debt (e.g., bonds and leases) provides current financial
resources to governmental funds, while the repayment of the principal of long- term debt consumes the financial resources of governmental funds. Neither transaction, however, has any effect on net position. Also, governmental funds report the effect of premiums, discounts, and similar items when debt is first issued, whereas these amounts are deferred and amortized in the Statement of Activities.
Issuance of bonds………………………...…………………………………………………………… (3,185,000) Debt service principal payments…………………………………………………………………… 5,552,518 Amortization of bond premiums……………………………………………………………………… 561,559 Premium from issuance of refunding costs, net of issue costs…………………………………… (345,918) Percy Walker Pool transfer of bonds payable……………………………………………………… (1,240,000)
Net effect of reporting long-term debt………………………………………………………… 1,343,159
Some expenses reported in the Statement of Activities do not require the use of current financial resources and, therefore, are not reported as expenditures in the governmental funds.
Net change in compensated absences accrual…………………………………………………… (148,000) Net change in worker's compensation accrual…………………………………………………… 138,178 Net change in accrued interest on long-term debt………………………………………………… 24,343 Net change in deferred outflow/(inflow) of resources related to pensions……………………… 182,077 Net change in net pension liability…………………………………………………………………… (1,596,835) Net change in other postemployment benefits obligation………………………………………… (1,427,386)
Net effect of recording long-term liabilities………………………………………………… (2,827,623)
Internal service funds are used by management to account for health insurance and workers' compensation activities.
The net activity of internal service funds is reported with governmental activities…………… (1,190,228)
Change in net position of governmental activities…………………………………………………………… $ (326,076)
See notes to basic financial statements.
Town of Duxbury, Massachusetts 31 Comprehensive Annual Financial Report
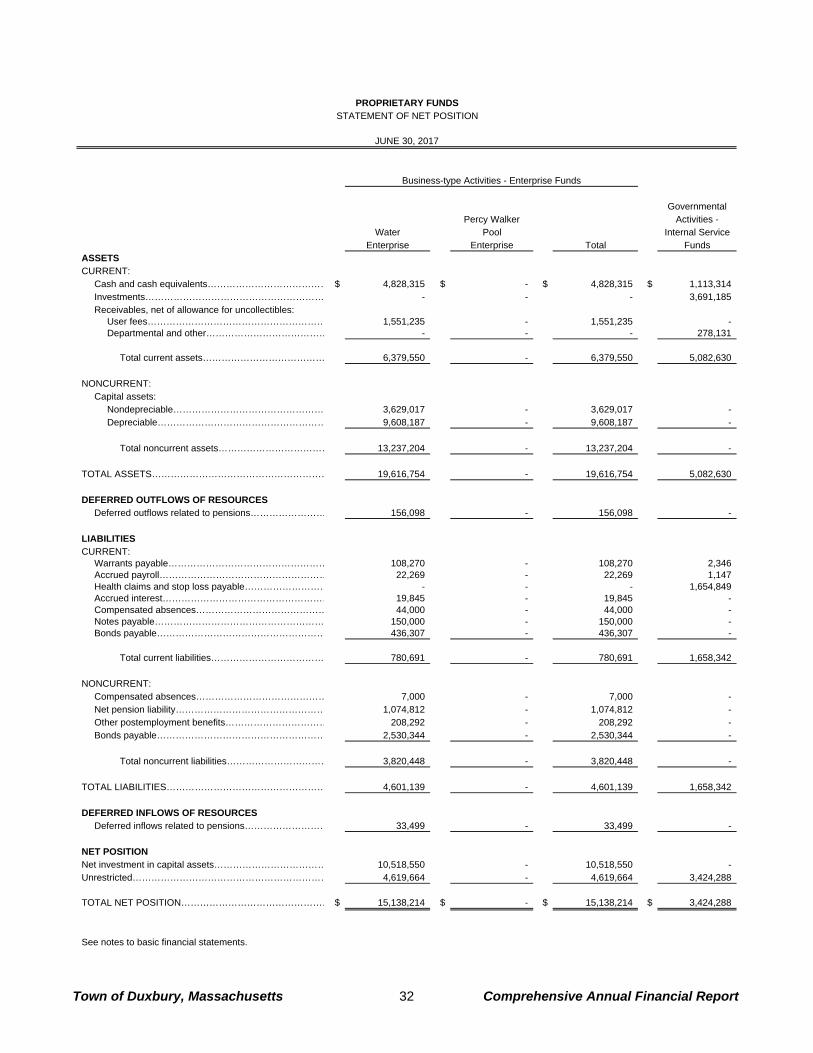
PROPRIETARY FUNDSSTATEMENT OF NET POSITION
JUNE 30, 2017
GovernmentalPercy Walker Activities -
Water Pool Internal ServiceEnterprise Enterprise Total Funds
ASSETSCURRENT:
Cash and cash equivalents………………………………… $ 4,828,315 $ - $ 4,828,315 $ 1,113,314 Investments………………………………………………… - - - 3,691,185 Receivables, net of allowance for uncollectibles:
User fees………………………………………………… 1,551,235 - 1,551,235 - Departmental and other………………………………… - - - 278,131
Total current assets………………………………… 6,379,550 - 6,379,550 5,082,630
NONCURRENT: Capital assets:
Nondepreciable………………………………………… 3,629,017 - 3,629,017 - Depreciable……………………………………………… 9,608,187 - 9,608,187 -
Total noncurrent assets……………………………… 13,237,204 - 13,237,204 -
TOTAL ASSETS………………………………………………… 19,616,754 - 19,616,754 5,082,630
DEFERRED OUTFLOWS OF RESOURCES Deferred outflows related to pensions…………………… 156,098 - 156,098 -
LIABILITIES CURRENT:
Warrants payable…………………………………………… 108,270 - 108,270 2,346 Accrued payroll……………………………………………… 22,269 - 22,269 1,147 Health claims and stop loss payable……………………… - - - 1,654,849 Accrued interest……………………………………………… 19,845 - 19,845 - Compensated absences…………………………………… 44,000 - 44,000 - Notes payable……………………………………………… 150,000 - 150,000 - Bonds payable……………………………………………… 436,307 - 436,307 -
Total current liabilities……………………………… 780,691 - 780,691 1,658,342
NONCURRENT: Compensated absences…………………………………… 7,000 - 7,000 - Net pension liability………………………………………… 1,074,812 - 1,074,812 - Other postemployment benefits…………………………… 208,292 - 208,292 - Bonds payable……………………………………………… 2,530,344 - 2,530,344 -
Total noncurrent liabilities…………………………… 3,820,448 - 3,820,448 -
TOTAL LIABILITIES…………………………………………… 4,601,139 - 4,601,139 1,658,342
DEFERRED INFLOWS OF RESOURCES Deferred inflows related to pensions……………………… 33,499 - 33,499 -
NET POSITION Net investment in capital assets……………………………… 10,518,550 - 10,518,550 - Unrestricted……………………………………………………… 4,619,664 - 4,619,664 3,424,288
TOTAL NET POSITION………………………………………… $ 15,138,214 $ - $ 15,138,214 $ 3,424,288
See notes to basic financial statements.
Business-type Activities - Enterprise Funds
Town of Duxbury, Massachusetts 32 Comprehensive Annual Financial Report

PROPRIETARY FUNDSSTATEMENT OF REVENUES, EXPENSES, AND CHANGES IN NET POSITION
YEAR ENDED JUNE 30, 2017
GovernmentalPercy Walker Activities -
Water Pool Internal ServiceEnterprise Enterprise Total Funds
OPERATING REVENUES:Employee contributions…………………………..……………$ - $ - $ - $ 3,312,333 Employer contributions………………………………..……… - - - 7,278,540 Charges for services……………………………...…………… 3,490,670 255,901 3,746,571 -
TOTAL OPERATING REVENUES……………………… 3,490,670 255,901 3,746,571 10,590,873
OPERATING EXPENSES:Cost of services and administration………………………… 1,788,112 427,780 2,215,892 11,880,852 Depreciation…………………………………………………… 914,090 60,348 974,438 -
TOTAL OPERATING EXPENSES……………………… 2,702,202 488,128 3,190,330 11,880,852
OPERATING INCOME (LOSS)…………………………… 788,468 (232,227) 556,241 (1,289,979)
NONOPERATING REVENUES (EXPENSES):Investment income…………………………………………… - - - 99,751 Interest expense……………………………………………… (73,717) (46,177) (119,894) -
TOTAL NONOPERATING REVENUES (EXPENSES), NET……………………… (73,717) (46,177) (119,894) 99,751
INCOME (LOSS) BEFORE SPECIAL ITEMS AND TRANSFERS…………………………………… 714,751 (278,404) 436,347 (1,190,228)
SPECIAL ITEM:Conversion to governmental activities (Note 14)…………… - 214,215 214,215 -
TRANSFERS:Transfers in…………………………………………………… - 471,215 471,215 - Transfers out…………………………………………………… (108,616) (654,927) (763,543) -
TOTAL TRANSFERS……………………………………… (108,616) (183,712) (292,328) -
CHANGE IN NET POSITION…………………………… 606,135 (247,901) 358,234 (1,190,228)
NET POSITION AT BEGINNING OF YEAR…………………… 14,532,079 247,901 14,779,980 4,614,516
NET POSITION AT END OF YEAR…………………………… $ 15,138,214 $ - $ 15,138,214 $ 3,424,288
See notes to basic financial statements.
Business-type Activities - Enterprise Funds
Town of Duxbury, Massachusetts 33 Comprehensive Annual Financial Report

PROPRIETARY FUNDSSTATEMENT OF CASH FLOWS
YEAR ENDED JUNE 30, 2017
GovernmentalPercy Walker Activities -
Water Pool Internal ServiceEnterprise Enterprise Total Funds
CASH FLOWS FROM OPERATING ACTIVITIES:Receipts from customers and users…………………………………………………$ 3,555,790 $ 255,901 $ 3,811,691 $ - Receipts from interfund services provided………………………………………… - - - 10,396,733 Payments to vendors………………………………………………………………… (984,810) (309,335) (1,294,145) (12,137,353) Payments to employees……………………………………………………………… (658,088) (256,645) (914,733) -
NET CASH FROM OPERATING ACTIVITIES………………………………………… 1,912,892 (310,079) 1,602,813 (1,740,620)
CASH FLOWS FROM NONCAPITAL FINANCING ACTIVITIES:Transfers in…………………………………………………………………………… - 471,215 471,215 - Transfers out…………………………………………………………………………… (108,616) (36,075) (144,691) - Special item - Conversion to governmental activities (Note 14)………………… - 95,211 95,211 -
NET CASH FROM NONCAPITAL FINANCING ACTIVITIES………………………… (108,616) 530,351 421,735 -
CASH FLOWS FROM CAPITAL AND RELATED FINANCING ACTIVITIES:Proceeds from the issuance of bonds and notes…………………………………… 150,000 - 150,000 - Acquisition and construction of capital assets……………………………………… (677,426) (16,834) (694,260) - Principal payments on bonds and notes…………………………………………… (443,311) (155,000) (598,311) - Interest expense……………………………………………………………………… (75,409) (48,438) (123,847) -
NET CASH FROM CAPITAL AND RELATED FINANCING ACTIVITIES…………… (1,046,146) (220,272) (1,266,418) -
CASH FLOWS FROM INVESTING ACTIVITIES:Proceeds from sales and maturities of investments……………………………… - - - 3,591,161 Purchase of investments……………………………………………………………… - - - (3,691,185) Investment income…………………………………………………………………… - - - 99,751
NET CASH FROM INVESTING ACTIVITIES………………………………………… - - - (273)
NET CHANGE IN CASH AND CASH EQUIVALENTS……………………………… 758,130 - 758,130 (1,740,893)
CASH AND CASH EQUIVALENTS AT BEGINNING OF YEAR…………………… 4,070,185 - 4,070,185 2,854,207
CASH AND CASH EQUIVALENTS AT END OF YEAR………………………………$ 4,828,315 $ - $ 4,828,315 $ 1,113,314
RECONCILIATION OF OPERATING INCOME (LOSS) TO NET CASHFROM OPERATING ACTIVITIES:
Operating income (loss)……………………………………………………………… $ 788,468 $ (232,227) $ 556,241 $ (1,289,979) Adjustments to reconcile operating income (loss) to net
cash from operating activities:Depreciation………………………………………………………………………… 914,090 60,348 974,438 - Deferred (outflows)/inflows related to pensions………………………………… (4,998) (4,451) (9,449) - Changes in assets and liabilities:
User fees………………………………………………………………………… 65,120 - 65,120 - Departmental and other………………………………………………………… - - - (194,140) Warrants payable……………………………………………………………… 80,469 (3,907) 76,562 2,346 Accrued payroll………………………………………………………………… 1,877 (3,157) (1,280) (139) Health claims payable………………………………………………………… - - - (258,708) Due to other funds……………………………………………………………… - (166,463) (166,463) - Accrued compensated absences……………………………………………… 15,000 - 15,000 - Net pension liability………………………..………………….………….…… 43,837 39,027 82,864 - Other postemployment benefits obligation………………………..………… 9,029 751 9,780 -
Total adjustments…………………………………………………………… 1,124,424 (77,852) 1,046,572 (450,641)
NET CASH FROM OPERATING ACTIVITIES…………………………………………$ 1,912,892 $ (310,079) $ 1,602,813 $ (1,740,620)
NONCASH INVESTING, CAPITAL, AND FINANCING ACTIVITIES:Special item - Conversion to governmental activities………………………………$ - $ 309,426 $ 309,426 $ -
See notes to basic financial statements.
Business-type Activities - Enterprise Funds
Town of Duxbury, Massachusetts 34 Comprehensive Annual Financial Report
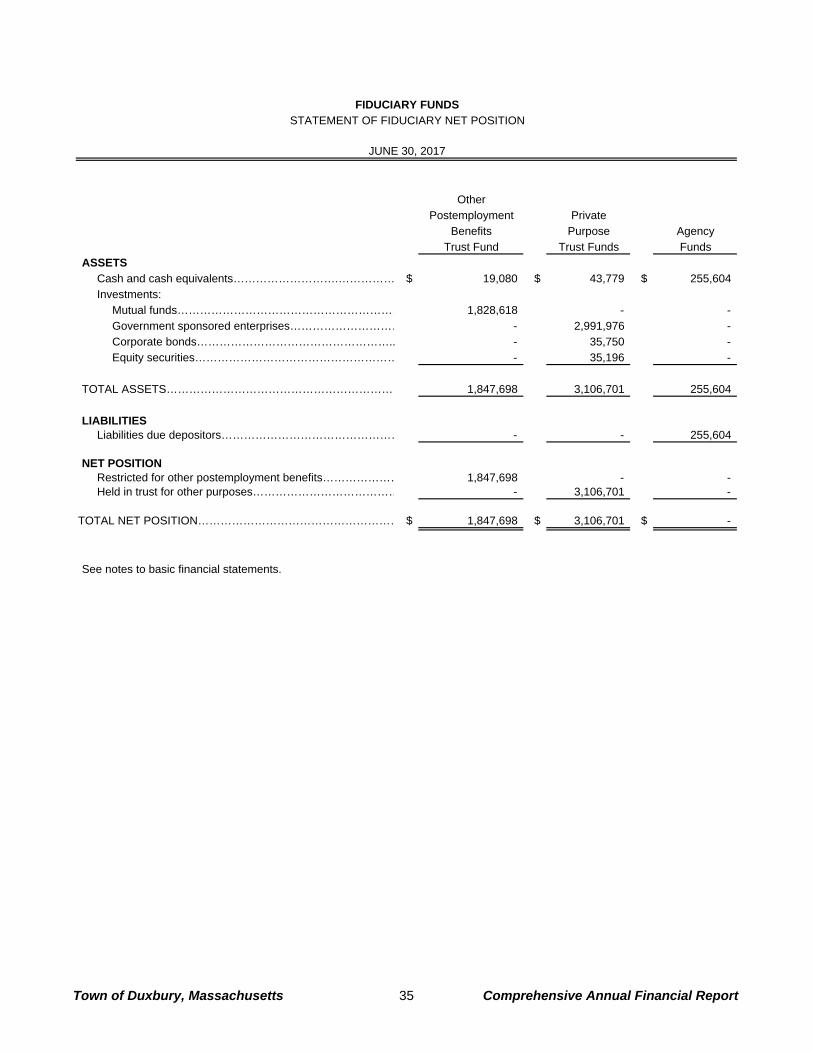
FIDUCIARY FUNDSSTATEMENT OF FIDUCIARY NET POSITION
JUNE 30, 2017
OtherPostemployment Private
Benefits Purpose AgencyTrust Fund Trust Funds Funds
ASSETSCash and cash equivalents……………………….…………… $ 19,080 $ 43,779 $ 255,604 Investments:
Mutual funds…………………………………………………… 1,828,618 - - Government sponsored enterprises………………………… - 2,991,976 - Corporate bonds…………………………………………….. - 35,750 - Equity securities……………………………………………… - 35,196 -
TOTAL ASSETS……………………………………………………… 1,847,698 3,106,701 255,604
LIABILITIESLiabilities due depositors………………………………………… - - 255,604
NET POSITIONRestricted for other postemployment benefits………………… 1,847,698 - - Held in trust for other purposes………………………………… - 3,106,701 -
TOTAL NET POSITION……………………………………………… $ 1,847,698 $ 3,106,701 $ -
See notes to basic financial statements.
Town of Duxbury, Massachusetts 35 Comprehensive Annual Financial Report

FIDUCIARY FUNDSSTATEMENT OF CHANGES IN FIDUCIARY NET POSITION
YEAR ENDED JUNE 30, 2017
OtherPostemployment Private
Benefits PurposeTrust Fund Trust Funds
ADDITIONS:Contributions:
Employer contributions to the trust………………………………… $ 300,000 $ - Employer contributions to pay benefit payments………………… 1,692,355 -
Total contributions………………………………………………… 1,992,355 -
Net investment income:Interest………………………………………………………………… 90,773 197,735
TOTAL ADDITIONS……………………………………………… 2,083,128 197,735
DEDUCTIONS:Benefit payments……………………………………………………… 1,692,355 - Scholarships and other……………………………………………… - 50,214
TOTAL DEDUCTIONS…………………………………………… 1,692,355 50,214
CHANGE IN NET POSITION…………………………………… 390,773 147,521
NET POSITION AT BEGINNING OF YEAR…………………………… 1,456,925 2,959,180
NET POSITION AT END OF YEAR…………………………………… $ 1,847,698 $ 3,106,701
See notes to basic financial statements.
Town of Duxbury, Massachusetts 36 Comprehensive Annual Financial Report
Notes to Basic Financial Statements Year Ended June 30, 2017
Town of Duxbury, Massachusetts 37 Comprehensive Annual Financial Report
NOTE 1 – SUMMARY OF SIGNIFICANT ACCOUNTING POLICIES Notes to Basic Financial Statements The accompanying basic financial statements of the Town of Duxbury, Massachusetts (Town) have been prepared in accordance with accounting principles generally accepted in the United States of America (GAAP). The Governmental Accounting Standards Board (GASB) is the recognized standard-setting body for establishing governmental accounting and financial reporting principles. The significant accounting policies are described herein. A. Reporting Entity The Town of Duxbury, Massachusetts is a municipal corporation governed by an elected three member Board of Selectmen and an appointed Town Manager. For financial reporting purposes, the Town has included all funds, organizations, agencies, boards, commissions and institutions. The Town has also considered all potential component units for which it is financially accountable as well as other organizations for which the nature and significance of their relationship with the Town are such that exclusion would cause the basic financial statements to be misleading or incomplete. As required by GAAP, these basic financial statements present the Town (Primary Government) and its component units. The Town did not identify any component units requiring inclusion in the basic financial statements. B. Government-Wide and Fund Financial Statements Government-Wide Financial Statements The government-wide financial statements (i.e., statement of net position and the statement of changes in net position) report information on all of the non-fiduciary activities of the primary government and its component units. Governmental activities, which are primarily supported by taxes and intergovernmental revenues, are reported separately from business-type activities, which are supported primarily by user fees and charges. Fund Financial Statements Separate financial statements are provided for governmental funds, proprietary funds, and fiduciary funds, even though fiduciary funds are excluded from the government-wide financial statements. Major individual governmental funds and major individual enterprise funds are reported as separate columns in the fund financial statements. Nonmajor funds are aggregated and displayed in a single column. Major Fund Criteria Major funds must be reported if the following criteria are met:
• If total assets and deferred outflows of resources, liabilities and deferred inflows of resources, revenues, or expenditures/expenses of an individual governmental or enterprise fund are at least 10 percent of the corresponding element (assets and deferred outflows of resources, liabilities and deferred inflows or resources, etc.) for all funds of that category or type (total governmental or total enterprise funds), and
• If the total assets and deferred outflows of resources, liabilities and deferred inflows of resources,
revenues, or expenditures/expenses of the individual governmental fund or enterprise fund are at least 5 percent of the corresponding element for all governmental and enterprise funds combined.
Notes to Basic Financial Statements Year Ended June 30, 2017
Town of Duxbury, Massachusetts 38 Comprehensive Annual Financial Report
Additionally, any other governmental or enterprise fund that management believes is particularly significant to the basic financial statements may be reported as a major fund. Internal service funds and fiduciary funds are reported by fund type. C. Measurement Focus, Basis of Accounting and Financial Statement Presentation Government-Wide Financial Statements The government-wide financial statements are reported using the economic resources measurement focus and the accrual basis of accounting. Under this method, revenues are recorded when earned and expenses are recorded when the liabilities are incurred. Real estate and personal property taxes are recognized as revenues in the year for which they are levied. Grants and similar items are recognized as revenue as soon as all eligibility requirements imposed by the provider have been met. The statement of activities demonstrates the degree to which the direct expenses of a particular function or segment are offset by program revenues. Direct expenses are those that are clearly identifiable with a specific function or segment. Program revenues include the following:
• Charges to customers or applicants who purchase, use, or directly benefit from goods, services, or privileges provided by a given function or segment.
• Grants and contributions that are restricted to meeting the operational requirements of a particular
function or segment.
• Grants and contributions that are restricted to meeting the capital requirements of a particular function or segment.
Taxes and other items not identifiable as program revenues are reported as general revenues. For the most part, the effect of interfund activity has been removed from the government-wide financial statements. However, the effect of interfund services provided and used between functions is not eliminated as the elimination of these charges would distort the direct costs and program revenues reported for the functions affected. Fund Financial Statements Governmental fund financial statements are reported using the flow of current financial resources measurement focus and the modified accrual basis of accounting. Under the modified accrual basis of accounting, revenues are recognized when susceptible to accrual (i.e., measurable and available). Measurable means the amount of the transaction can be determined and available means collectible within the current period or soon enough thereafter to pay liabilities of the current period. Expenditures generally are recorded when the fund liability is incurred, as under accrual accounting. However, debt service expenditures, as well as expenditures related to compensated absences and claims and judgments, are recorded only when payment is due. General capital asset acquisitions are reported as expenditures in governmental funds. Issuance of long-term debt and acquisitions under capital leases are reported as other financing sources. Real estate and personal property tax revenues are considered available if they are collected within 60 days after year-end. Investment income is susceptible to accrual. Other receipts and tax revenues become measurable and available when the cash is received and are recognized as revenue at that time.
Notes to Basic Financial Statements Year Ended June 30, 2017
Town of Duxbury, Massachusetts 39 Comprehensive Annual Financial Report
Entitlements and shared revenues are recorded at the time of receipt or earlier if the susceptible to accrual criteria is met. Expenditure driven grants recognize revenue when the qualifying expenditures are incurred and all other grant requirements are met. The following major governmental funds are reported: The general fund is the primary operating fund. It is used to account for all financial resources, except those that are required to be accounted for in another fund. The community preservation act fund is a special revenue fund used to account for funds held for uses restricted by law for community preservation purposes. These funds are attributable to the Town’s acceptance of the Community Preservation Act, which allows the Town to impose up to a 1% surcharge on property taxes and to receive matching state grant funds for specified uses related to the acquisition, creation, preservation and support of open space, historic resources, land for recreational use and community housing. The highway improvements fund is a special revenue fund used to account for construction, reconstruction and improvements of roadways, streets and sidewalks. Costs charged to the fund are subject to reimbursement by the Commonwealth of Massachusetts. The co-located school fund is a capital project fund used to account for the design and construction of the new co-located school. The nonmajor governmental funds consist of other special revenue and capital projects that are aggregated and presented in the nonmajor governmental funds column on the governmental funds financial statements. The following describes the general use of these fund types: The special revenue fund is used to account for and report the proceeds of specific revenue sources that are restricted or committed to expenditures for specified purposes other than permanent funds or capital projects. The capital projects fund is used to account for and report financial resources that are restricted, committed, or assigned to expenditure for capital outlays, including the acquisition or construction of capital facilities and other capital assets of the governmental funds. The permanent fund is used to account for and report financial resources that are legally restricted to the extent that only earnings, not principal, may be used for purposes that support the governmental programs. Proprietary fund financial statements are reported using the flow of economic resources measurement focus and use the accrual basis of accounting. Under this method, revenues are recorded when earned and expenses are recorded when the liabilities are incurred. Proprietary funds distinguish operating revenues and expenses from nonoperating items. Operating revenues and expenses generally result from providing services and producing and delivering goods in connection with the proprietary funds principal ongoing operations. All revenues and expenses not meeting this definition are reported as nonoperating revenues and expenses. The following major proprietary funds are reported: The water enterprise fund is used to account for the Town’s water activities. The Percy Walker pool enterprise fund is used to account for the operating activities at the Town’s pool. At the March 2017 Annual Town Meeting, the Town voted to revoke the enterprise fund provisions of the Massachusetts

Notes to Basic Financial Statements Year Ended June 30, 2017
Town of Duxbury, Massachusetts 40 Comprehensive Annual Financial Report
General Law pertaining to the Percy Walker Pool as of June 30, 2017. The Town has transferred the enterprise fund’s balances at June 30, 2017 from the proprietary fund statement of net position to governmental activities. Starting in fiscal year 2018, the pool will operate as a department of the general fund. Additionally, the following proprietary fund type is reported: The internal service fund is used to account for the financing of services provided by one department to other departments or governmental units. This fund is used to account for risk financing activities related to employees’ health insurance. Fiduciary fund financial statements are reported using the flow of economic resources measurement focus and use the accrual basis of accounting. Fiduciary funds are used to account for assets held in a trustee capacity for others that cannot be used to support the governmental programs. Agency funds have no measurement focus. The following fiduciary fund types are reported: The other postemployment benefit trust fund is used to accumulate resources to provide funding for future other postemployment benefits (OPEB) liabilities. The private purpose trust fund is used to account for trust arrangements that exclusively benefit individuals, private organizations, or other governments. Some of these trusts have donor restrictions and trustee policies that do not allow the endowment portion and any unrealized appreciation to be spent. The restrictions and trustee policies only allows the trustees to approve spending of the realized investment earnings. The Town’s private-purpose trust fund is primarily comprised of scholarships. The agency fund is used to account for assets held in a purely custodial capacity. The Town’s agency fund is comprised of performance bonds, security deposits, and fees and licenses collected on behalf of the state. D. Cash and Investments Government-Wide and Fund Financial Statements Cash and cash equivalents are considered to be cash on hand, demand deposits and short-term investments with an original maturity of three months or less from the date of acquisition. Investments are carried at fair value. The fair values were determined by the closing price for those securities traded on national stock exchanges and at the average bid-and-asked quotation for those securities traded in the over-the-counter market. E. Fair Value Measurements The Town reports required types of financial instruments in accordance with the fair value standards. These standards require an entity to maximize the use of observable inputs (such as quoted prices in active markets) and minimize the use of unobservable inputs (such as appraisals or valuation techniques) to determine fair value. Fair value standards also require the government to classify these financial instruments into a three-level hierarchy, based on the priority of inputs to the valuation technique or in accordance with net asset value practical expedient rules, which allow for either Level 2 or Level 3 depending on lock up and notice periods associated with the underlying funds.
Notes to Basic Financial Statements Year Ended June 30, 2017
Town of Duxbury, Massachusetts 41 Comprehensive Annual Financial Report
Instruments measured and reported at fair value are classified and disclosed in one of the following categories: Level 1 – Quoted prices are available in active markets for identical instruments as of the reporting date. Instruments, which are generally included in this category, include actively traded equity and debt securities, U.S. government obligations, and mutual funds with quoted market prices in active markets. Level 2 – Pricing inputs are other than quoted in active markets, which are either directly or indirectly observable as of the reporting date, and fair value is determined through the use of models or other valuation methodologies. Certain fixed income securities, primarily corporate bonds, are classified as Level 2 because fair values are estimated using pricing models, matrix pricing, or discounted cash flows. Level 3 – Pricing inputs are unobservable for the instrument and include situations where there is little, if any, market activity for the instrument. The inputs into the determination of fair value require significant management judgment or estimation. In some instances the inputs used to measure fair value may fall into different levels of the fair value hierarchy and is based on the lowest level of input that is significant to the fair value measurement. Market price is affected by a number of factors, including the type of instrument and the characteristics specific to the instrument. Instruments with readily available active quoted prices generally will have a higher degree of market price observability and a lesser degree of judgment used in measuring fair value. It is reasonably possible that change in values of these instruments will occur in the near term and that such changes could materially affect amounts reported in these financial statements. For more information on the fair value of the Town’s financial instruments, see Note 2 – Cash and Investments. F. Accounts Receivable Government-Wide and Fund Financial Statements The recognition of revenue related to accounts receivable reported in the government-wide financial statements and the proprietary funds and fiduciary funds financial statements are reported under the accrual basis of accounting. The recognition of revenue related to accounts receivable reported in the governmental funds financial statements are reported under the modified accrual basis of accounting. Real Estate, Personal Property Taxes and Tax Liens Real estate and personal property taxes are levied and based on values assessed on January 1st of every year. Assessed values are established by the Board of Assessor’s for 100% of the estimated fair market value. Taxes are due on August 1st, November 1st, February 1st and May 1st and are subject to penalties and interest if they are not paid by the respective due date. Real estate and personal property taxes levied are recorded as receivables in the year of the levy. Real estate tax liens are processed yearly after the close of the valuation year on delinquent properties and are recorded as receivables in the year they are processed. Real estate receivables are secured via the tax lien process and are considered 100% collectible. Accordingly, an allowance for uncollectibles is not reported. Personal property taxes cannot be secured through the lien process. The allowance for uncollectibles is estimated based on historical trends and specific account analysis.

Notes to Basic Financial Statements Year Ended June 30, 2017
Town of Duxbury, Massachusetts 42 Comprehensive Annual Financial Report
Motor Vehicle and Other Excise Taxes Motor vehicle excise taxes are assessed annually for each vehicle registered and are recorded as receivables in the year of the levy. The Commonwealth is responsible for reporting the number of vehicles registered and the fair values of those vehicles. The tax calculation is the fair value of the vehicle multiplied by $25 per $1,000 of value. Boat excise taxes are assessed annually for each boat registered and are recorded as receivables in the year of the levy. The Commonwealth is responsible for reporting the number of boats registered and the fair value of those boats. The tax calculation is the fair value of the boat multiplied by $10 per $1,000 of value. The allowance for uncollectibles is estimated based on historical trends and specific account analysis. User Fees Water and sewer user fees are levied monthly based on individual meter readings and are subject to penalties and interest if they are not paid by the respective due date. Unbilled user fees are estimated at year-end and are recorded as revenue in the current period. Water and Sewer liens are processed in December of every year and included as a lien on the property owner’s tax bill. Water and Sewer charges and liens are recorded as receivables in the year of the levy. Since the receivables are secured via the lien process, these accounts are considered 100% collectible and therefore do not report an allowance for uncollectibles. Departmental and Other Departmental and other receivables consist of veterans and ambulance receivables and are recorded as receivables in the year accrued. The allowance for uncollectibles is estimated based on historical trends and specific account analysis. Special Assessments Special assessments in the general fund consist of apportioned and unapportioned road improvement and septic system betterments assessed to homeowners whose properties were improved through Town-run construction projects. Since the receivables are secured via the lien process, these accounts are considered 100% collectible and therefore do not report an allowance for uncollectibles. Intergovernmental Various federal and state grants for operating and capital purposes are applied for and received annually. For non-expenditure driven grants, receivables are recorded as soon as all eligibility requirements imposed by the provider have been met. For expenditure driven grants, receivables are recorded when the qualifying expenditures are incurred and all other grant requirements are met. These receivables are considered 100% collectible and therefore do not report an allowance for uncollectibles.
Notes to Basic Financial Statements Year Ended June 30, 2017
Town of Duxbury, Massachusetts 43 Comprehensive Annual Financial Report
G. Inventories Government-Wide and Fund Financial Statements Inventories are recorded as expenditures at the time of purchase. Such inventories are not material in total to the government-wide and fund financial statements, and therefore are not reported. H. Capital Assets Government-Wide and Proprietary Fund Financial Statements Capital assets, which include land, land improvements, buildings, machinery and equipment, and infrastructure (e.g., roads, water mains, sewer mains, and similar items), are reported in the applicable governmental or business-type activity column of the government-wide financial statements, and the proprietary fund financial statements. Capital assets are recorded at historical cost, or at estimated historical cost, if actual historical cost is not available. Donated capital assets; donated works of art, historical treasurers and similar assets; and capital assets received in service concession arrangements are recorded at acquisition value. Except for the capital assets of the governmental activities column in the government-wide financial statements, construction period interest is capitalized on constructed capital assets. All purchases and construction costs in excess of $10,000 are capitalized at the date of acquisition or construction, respectively, with expected useful lives of greater than one year. All major general infrastructure assets acquired or significantly reconstructed in years ending after June 30, 1980, have been recorded at estimated historical cost. Capital assets (excluding land and construction in progress) are depreciated on a straight-line basis. The estimated useful lives of capital assets are as follows:
EstimatedUseful
Life(in years)
Buildings and Building Improvements………… 40Plant, Facilities and Infrastructure…………… 20-40Vehicles………………………………………… 5-15Furniture, Fixtures and Equipment…………… 10Improvements…………………………………… 10-20
Capital Asset Type
The cost of normal maintenance and repairs that do not add to the value of the assets or materially extend asset lives are not capitalized and are treated as expenses when incurred. Improvements are capitalized. Governmental Fund Financial Statements Capital asset costs are recorded as expenditures in the acquiring fund in the year of the purchase.
Notes to Basic Financial Statements Year Ended June 30, 2017
Town of Duxbury, Massachusetts 44 Comprehensive Annual Financial Report
I. Deferred Outflows/Inflows of Resources Government-Wide Financial Statements (Net Position) In addition to assets, the statement of net position will sometimes report a separate section for deferred outflows of resources. This separate financial statement element, deferred outflows of resources, represents a consumption of net position that applies to a future period(s) and so will not be recognized as an outflow of resources (expense/expenditure) until then. The Town has reported deferred outflows of resources related to pensions in this category. In addition to liabilities, the statement of net position will sometimes report a separate section for deferred inflows of resources. This separate financial statement element, deferred inflows of resources, represents an acquisition of net position that applies to a future period(s) and so will not be recognized as an inflow of resources (revenue) until that time. The Town has reported taxes paid in advance and deferred inflows of resources related to pensions in this category. Governmental Fund Financial Statements In addition to liabilities, the governmental funds balance sheet will sometimes report a separate section for deferred inflows of resources. This separate financial statement element, deferred inflows of resources, represents amounts that have been recorded in the governmental fund financial statements but the revenue is not available and so will not be recognized as an inflow of resources (revenue) until it becomes available. The Town has recorded unavailable revenue as deferred inflows of resources in the governmental funds balance sheet. J. Interfund Receivables and Payables During the course of its operations, transactions occur between and within individual funds that may result in amounts owed between funds. Government-Wide Financial Statements Transactions of a buyer/seller nature between and within governmental funds and internal service funds are eliminated from the governmental activities in the statement of net position. Any residual balances outstanding between the governmental activities and business-type activities are reported in the statement of net position as “internal balances”. Fund Financial Statements Transactions of a buyer/seller nature between and within funds are not eliminated from the individual fund statements. Receivables and payables resulting from these transactions are classified as “Due from other funds” or “Due to other funds” on the balance sheet. K. Interfund Transfers During the course of its operations, resources are permanently reallocated between and within funds. These transactions are reported as transfers in and transfers out.

Notes to Basic Financial Statements Year Ended June 30, 2017
Town of Duxbury, Massachusetts 45 Comprehensive Annual Financial Report
Government-Wide Financial Statements Transfers between and within governmental funds and internal service funds are eliminated from the governmental activities in the statement of activities. Any residual balances outstanding between the governmental activities and business-type activities are reported in the statement of activities as “Transfers, net”. Fund Financial Statements Transfers between and within funds are not eliminated from the individual fund statements and are reported as transfers in and transfers out. L. Unavailable Revenue Unavailable revenue at the governmental fund financial statement level represents billed receivables that do not meet the available criterion in accordance with the current financial resources measurement focus and the modified accrual basis of accounting, i.e. receivables that are not considered to be available to liquidate liabilities of the current period. Unavailable revenue is recognized as revenue in the conversion to the government-wide (full accrual) financial statements. M. Net Position and Fund Equity Government-Wide Financial Statements (Net Position) Net position reported as “net investment in capital assets” includes capital assets, net of accumulated depreciation, less the principal balance of outstanding debt used to acquire capital assets. Unspent proceeds of capital related debt are not considered to be capital assets. Outstanding debt related to future reimbursements from the state’s school building program is not considered to be capital related debt. Net position is reported as restricted when amounts are not available for appropriation or are legally restricted by outside parties for a specific future use. Net position has been “restricted for” the following: “Perpetual care and other permanent funds - expendable” represents the amount of realized and unrealized investment earnings of donor restricted trusts. The restrictions and trustee policies only allows the trustees to approve spending of the realized investment earnings. “Perpetual care and other permanent funds - nonexpendable” represents the endowment portion of donor restricted trusts. “Gifts and grants” represents restrictions placed on assets from outside parties. “Community preservation” represents amounts held for uses restricted by law for community preservation purposes. Sometimes the Town will fund outlays for a particular purpose from both restricted (e.g., restricted bond or grant proceeds) and unrestricted resources. In order to calculate the amounts to report as restricted net position and unrestricted net position in the government-wide and proprietary fund financial statements, a flow assumption must be made about the order in which the resources are considered to be applied. It is the Town’s policy to consider restricted net position to have been depleted before unrestricted net position is applied.
Notes to Basic Financial Statements Year Ended June 30, 2017
Town of Duxbury, Massachusetts 46 Comprehensive Annual Financial Report
Fund Financial Statements (Fund Balances) Governmental fund balances are classified as nonspendable, restricted, committed, assigned, or unassigned based on the extent to which the government is bound to honor constraints on the specific purposes for which amounts in those funds can be spent. The governmental fund balance classifications are as follows: “Nonspendable” fund balance includes amounts that cannot be spent because they are either not in spendable form or they are legally or contractually required to be maintained intact. “Restricted” fund balance includes amounts subject to constraints placed on the use of resources that are either externally imposed by creditors, grantors, contributors, or laws or regulations of other governments; or that are imposed by law through constitutional provisions or enabling legislation. “Committed” fund balance includes amounts that can only be used for specific purposes pursuant to constraints imposed by formal action of Open Town Meeting, the government’s highest level of decision-making authority. Town Meeting is the highest level of decision making authority that can, by majority vote of a warrant article at an open Town Meeting, commit funds for a specific purpose. Once voted, the limitation imposed by the vote remains in place until the funds are used for their intended purpose, the purpose no longer exists, or a vote is taken to modify the commitment. “Assigned” fund balance includes amounts that are constrained by the Town’s intent to be used for specific purposes, but are neither restricted nor committed. The Town’s by-laws authorize the Town Accountant to assign fund balance which generally only exists temporarily. Additional action does not have to be taken for the removal of an assignment. “Unassigned” fund balance includes the residual classification for the general fund. This classification represents fund balance that has not been assigned to other funds and that has not been restricted, committed, or assigned to specific purposes within the general fund. The general fund is the only governmental fund that can report a positive unassigned fund balance. In other governmental funds it is not appropriate to report a positive unassigned fund balance amount. However, in governmental funds other than the general fund, if expenditures incurred for specific purposes exceed the amounts that are restricted, committed, or assigned to those purposes, it may be necessary to report a negative unassigned fund balance in that fund. Sometimes the Town will fund outlays for a particular purpose from different components of fund balance. In order to calculate the amounts to report as restricted, committed, assigned, and unassigned fund balance in the governmental fund financial statements a flow assumption must be made about the order in which the resources are considered to be applied. When different components of fund balance can be used for the same purpose, it is the Town’s policy to consider restricted fund balance to have been depleted first, followed by committed fund balance, and assigned fund balance. Unassigned fund balance is applied last. N. Pensions For purposes of measuring the net pension liability, deferred outflows of resources and deferred inflows of resources related to pensions, and pension expense, information about the fiduciary net position of both the Plymouth County Contributory Retirement System and the Massachusetts Teachers Retirement System and additions to/deductions from the Systems fiduciary net position have been determined on the same basis as they are reported by the Systems. For this purpose, benefit payments (including refunds of employee contributions) are recognized when due and payable in accordance with the benefit terms. Investments are reported at fair value.

Notes to Basic Financial Statements Year Ended June 30, 2017
Town of Duxbury, Massachusetts 47 Comprehensive Annual Financial Report
O. Long-term debt Government-Wide and Proprietary Fund Financial Statements Long-term debt is reported as liabilities in the government-wide and proprietary fund statement of net position. Material bond premiums and discounts are deferred and amortized over the life of the bonds using the effective interest method. Bonds payable are reported net of the applicable bond premium or discount. Governmental Fund Financial Statements The face amount of governmental funds long-term debt is reported as other financing sources. Bond premiums and discounts, as well as issuance costs, are recognized in the current period. Bond premiums are reported as other financing sources and bond discounts are reported as other financing uses. Issuance costs, whether or not withheld from the actual bond proceeds received, are reported as general government expenditures. P. Investment Income Excluding the permanent funds, investment income derived from major and nonmajor governmental funds is legally assigned to the general fund unless otherwise directed by Massachusetts General Law (MGL). Investment income from proprietary funds is voluntarily assigned and transferred to the general fund. Q. Compensated Absences Employees are granted vacation and sick leave in varying amounts based on collective bargaining agreements, state laws and executive policies. Government-Wide and Proprietary Fund Financial Statements Vested or accumulated vacation and sick leave are reported as liabilities and expensed as incurred. Governmental Fund Financial Statements Vested or accumulated vacation and sick leave, which will be liquidated with expendable available financial resources, are reported as expenditures and fund liabilities upon maturity of the liability. R. Use of Estimates Government-Wide and Fund Financial Statements The preparation of basic financial statements in conformity with GAAP requires management to make estimates and assumptions that affect the reported amounts of assets and liabilities and disclosure for contingent assets and liabilities at the date of the basic financial statements and the reported amounts of the revenues and expenditures/expenses during the year. Actual results could vary from estimates that were used. S. Individual Fund Deficits Individual fund deficit exists within the nonmajor capital project funds and in the co-located school major fund. These deficits will be funded through grants, available funds, and bond proceeds in future years.

Notes to Basic Financial Statements Year Ended June 30, 2017
Town of Duxbury, Massachusetts 48 Comprehensive Annual Financial Report
T. Total Column Government-Wide Financial Statements The total column presented on the government-wide financial statements represents consolidated financial information. Fund Financial Statements The total column on the fund financial statements is presented only to facilitate financial analysis. Data in this column is not the equivalent of consolidated financial information. NOTE 2 – CASH AND INVESTMENTS A cash and investment pool is maintained that is available for use by all funds. Each fund type's portion of this pool is displayed on the balance sheet as "Cash and Cash equivalents". The deposits and investments of the trust funds are held separately from those of other funds. Statutes authorize the investment in obligations of the U.S. Treasury, agencies, and instrumentalities, certificates of deposit, repurchase agreements, money market accounts, bank deposits and the State Treasurer's Investment Pool (Pool). The Treasurer may also invest trust funds in securities, other than mortgages or collateral loans, which are legal for the investment of funds of savings banks under the laws of the Commonwealth. The Pool meets the criteria of an external investment pool. The Pool is administered by the Massachusetts Municipal Depository Trust (MMDT), which was established by the Treasurer of the Commonwealth who serves as Trustee. The fair value of the position in the Pool is the same as the value of the Pool shares. Custodial Credit Risk – Deposits In the case of deposits, the custodial credit risk is the risk that, in the event of a bank failure the Town’s deposits may not be recovered. At year-end, the carrying amount of deposits totaled $23,816,838 and the bank balance totaled $24,315,451. Of the bank balance, $2,462,543 was covered by Federal Depository Insurance, $517,230 was covered by Share Insurance Fund, $9,858,083 was covered by Depositors Insurance Fund, and $11,477,595 was exposed to custodial credit risk because it was uninsured and uncollateralized. The Town’s investment policy limits its custodial credit risk by 1) pre-qualifying banks, 2) diversifying its investments across several banks and 3) collateralizing deposits where practical. Custodial Credit Risk – Investments For an investment, this is the risk that, in the event of a failure by the counterparty, the Town will not be able to recover the value of its investments or collateral securities that are in the possession of an outside party. The Town’s investments of $17,460,557 in debt securities and $9,395,114 in equity securities are exposed to custodial credit risk as the securities are uninsured. The shares of MMDT and open end mutual funds are not subject to custodial credit risk because they are not evidenced by securities that exist in physical or book entry form. The securities are registered to Dunn & Co. as nominee for the Town of Duxbury. The Town of Duxbury’s investment policy allows for custodial safekeeping in the name of a nominee. It also requires proof that securities purchased from any bank or dealer be provided to the Treasurer and recorded on the Town’s books.

Notes to Basic Financial Statements Year Ended June 30, 2017
Town of Duxbury, Massachusetts 49 Comprehensive Annual Financial Report
Investments As of June 30, 2017, the Town of Duxbury had the following investments:
Under 1-5 6-10 OverFair Value 1 Year Years Years 10 Years
Investment Type
Debt Securities:Government Sponsored Enterprises………………$ 9,010,037 $ 152,111 $ 6,936,708 $ 1,614,219 $ 306,999 Corporate Bonds…………………………………… 1,952,884 - 1,718,833 234,051 - U.S. Treasury Notes………………………………… 6,497,636 - 3,344,743 2,033,260 1,119,633
Total Debt Securities........................................... 17,460,557 $ 152,111 $ 12,000,284 $ 3,881,530 $ 1,426,632
Other Investments:Equity Securities.................................................. 9,395,114 Money Market Mutual Funds............................... 340,330 Equity Mutual Funds………………………………… 2,051,773 MMDT Cash Portfolio……………………………… 846,564
Total Investments................................................ $ 30,094,338
Maturity
The Town participates in MMDT, which maintains a cash portfolio with combined average maturities of approximately 3 months. Interest Rate Risk The Town’s investment policy limits investment maturities as a means of managing exposure to fair value losses arising from increasing interest rates and to match investment maturities with anticipated cash flow requirements. The Town’s investment policy requires investments of operating funds to have a maturity of one year or less from the date of purchase. The Town limits their maximum final stated maturities for other investments to ten (10) years, unless specific authority is given to exceed this limit. Additionally, the policy does not permit the direct investment in securities maturing more than ten (10) years from date of purchase unless the maturities are matched to specific cash flow requirements. Reserve funds are permitted to be invested in securities exceeding ten (10) years if the maturities of such investments are made to coincide, as nearly as practicable, with the expected use of the funds. Credit Risk Credit risk is the risk of loss due to the failure of the security issuer or backer. At June 30, 2017, the Town’s investments were rated as follows:
Government U.S.Quality Sponsored Corporate TreasuryRatings Enterprises Bonds Notes
AAA……………$ - $ - $ 6,497,636 AA+…………… 9,010,037 - - A+……………… - 199,952 - A……………… - 287,438 - A-……………… - 821,597 - BBB+………… - 643,897 -
Fair Value…… $ 9,010,037 $ 1,952,884 $ 6,497,636

Notes to Basic Financial Statements Year Ended June 30, 2017
Town of Duxbury, Massachusetts 50 Comprehensive Annual Financial Report
The Town’s investment in money market mutual funds is unrated. The Town’s investment in MMDT is unrated. The Town’s investment policy states that bank deposits, including repurchase agreements; certificates of deposit; and demand deposits, that exceed the FDIC insured amount are to be made in banks or savings and loan associations with a Moody’s Rating of A3 or above; a Standard & Poor’s and Finch rating of A or above; or a Thompson Bond Watch Rating of A or B. Concentration of Credit Risk The Town places no limit on the amount the government may invest in any one issuer. More than 5% of the Town’s investments are in the following securities:
Percentage
of TotalIssuer Investments
Federal Home Loan Mortgage Corporation......... 14.56%Federal National Mortgage Association............... 15.40%
Fair Value of Investments The Town holds investments that are measured at fair value on a recurring basis. Because investing is not a core part of the Town’s mission, the Town determines that the disclosures related to these investments only need to be disaggregated by major type. The Town chooses a tabular format for disclosing the levels within the fair value hierarchy. The Town categorizes its fair value measurements within the fair value hierarchy established by generally accepted accounting principles. The hierarchy is based on the valuation inputs used to measure the fair value of the asset. Level 1 inputs are quoted prices in active markets for identical assets; Level 2 inputs are significant other observable inputs; Level 3 inputs are significant unobservable inputs.
Notes to Basic Financial Statements Year Ended June 30, 2017
Town of Duxbury, Massachusetts 51 Comprehensive Annual Financial Report
The Town has the following recurring fair value measurements as of June 30, 2017:
QuotedPrices in
Active SignificantMarkets for Other Significant
Identical Observable UnobservableJune 30, Assets Inputs Inputs
Investment Type 2017 (Level 1) (Level 2) (Level 3)
Investments Measured at Fair Value:Debt Securities:Government Sponsored Enterprises…………$ 9,010,037 $ 9,010,037 $ - $ - Corporate Bonds……………………………… 1,952,884 - 1,952,884 - U.S. Treasury Notes………………………… 6,497,636 6,497,636 - -
Total debt securities…………………………… 17,460,557 15,507,673 1,952,884 -
Other investments:Equity Securities……………………………… 9,395,114 9,395,114 - - Money Market Mutual Funds………………… 340,330 340,330 - - Equity Mutual Funds………………………… 2,051,773 2,051,773 - -
Total other investments……………………… 11,787,217 11,787,217 - -
Total investments measured at fair value…… 29,247,774 $ 27,294,890 $ 1,952,884 $ -
Investments Measured at Amortized Cost:MMDT Cash Portfolio………………………… 846,564
Total investments………………………………$ 30,094,338
Fair Value Measurements Using
Government sponsored enterprises, U.S. treasury notes, equity securities, money market mutual funds, and equity mutual funds classified in Level 1 of the fair value hierarchy are valued using prices quoted in active markets for those securities. Corporate bonds classified in Level 2 of the fair value hierarchy are valued using a matrix pricing technique. Matrix pricing is used to value securities based on the securities’ relationship to benchmark quoted prices. MMDT Cash Portfolio investments are valued at amortized cost. Under the amortized cost method, an investment is valued initially at its cost and adjusted for the amount of interest income accrued each day over the term of the investment to account for any difference between the initial cost and the amount payable at its maturity. If amortized cost is determined not to approximate fair value, the value of the portfolio securities will be determined under procedures established by the Advisor.

Notes to Basic Financial Statements Year Ended June 30, 2017
Town of Duxbury, Massachusetts 52 Comprehensive Annual Financial Report
NOTE 3 – RECEIVABLES At June 30, 2017, receivables for the individual major and nonmajor governmental funds and internal service funds in the aggregate, including the applicable allowances for uncollectible accounts, are as follows:
AllowanceGross for Net
Amount Uncollectibles AmountReceivables:
Real estate and personal property taxes……$ 1,191,971 $ (17,778) $ 1,174,193 Real estate tax deferrals……………………… 330,344 - 330,344 Tax liens………………………………………… 65,691 - 65,691 Motor vehicle and other excise taxes……… 328,280 (125,025) 203,255 User fees……………………………………… 33,187 - 33,187 Departmental and other……………………… 688,307 (149,124) 539,183 Special assessments………………………… 225,228 - 225,228 Intergovernmental……………………………… 1,189,089 - 1,189,089
Total……………………………………………$ 4,052,097 $ (291,927) $ 3,760,170
At June 30, 2017, receivables for the water enterprise fund consist of the following:
AllowanceGross for Net
Amount Uncollectibles AmountReceivables:
Water user fees……………………………….. $ 1,551,235 $ - $ 1,551,235
Governmental funds report unavailable revenue in connection with receivables for revenues that are not considered to be available to liquidate liabilities of the current period. At the end of the current year, the various components of unavailable revenue reported in the governmental funds were as follows:
Community NonmajorGeneral Preservation Highway Governmental
Fund Act Improvements Funds TotalReceivable and other asset type:
Real estate and personal property taxes……$ 822,206 $ 9,222 $ - $ - $ 831,428 Real estate tax deferrals……………………… 330,344 - - - 330,344 Tax liens………………………………………… 64,313 1,378 - - 65,691 Motor vehicle and other excise taxes……… 203,255 - - - 203,255 User fees……………………………………… 33,187 - - - 33,187 Departmental and other……………………… 240,886 - - 18,711 259,597 Special assessments………………………… 225,228 - - - 225,228 Intergovernmental……………………………… - 82,967 1,100,646 - 1,183,613 Tax foreclosures……………………………… 698,273 - - - 698,273
Total…………………………………………… $ 2,617,692 $ 93,567 $ 1,100,646 $ 18,711 $ 3,830,616

Notes to Basic Financial Statements Year Ended June 30, 2017
Town of Duxbury, Massachusetts 53 Comprehensive Annual Financial Report
NOTE 4 – CAPITAL ASSETS Capital asset activity for the year ended June 30, 2017, was as follows: Governmental Activities
Transfer of Beginning Percy Walker Pool EndingBalance Increases Decreases Capital Assets Balance
Capital assets not being depreciated:Land……………………………………………………… $ 38,255,188 $ 260,000 $ - $ - $ 38,515,188 Construction in progress………………………………… 2,744,517 60,824 (650,719) - 2,154,622
Total capital assets not being depreciated……… 40,999,705 320,824 (650,719) 40,669,810
Capital assets being depreciated:
Buildings…………………………………………………… 185,566,178 341,637 - 2,380,219 188,288,034 Building improvements…………………………………… 7,701,046 376,976 - - 8,078,022 Infrastructure……………………………………………… 22,825,721 517,970 (379,463) - 22,964,228 Vehicles…………………………………………………… 6,878,182 978,067 (226,756) - 7,629,493 Furniture, fixtures and equipment……………………… 4,510,546 411,629 - 16,834 4,939,009 Improvements…………………………………………… 11,340,774 - - - 11,340,774
Total capital assets being depreciated…………… 238,822,447 2,626,279 (606,219) 2,397,053 243,239,560
Less accumulated depreciation for: Buildings.………………………………………………… (21,658,001) (4,530,155) - (386,785) (26,574,941) Building improvements…………………………………… (995,149) (197,604) - - (1,192,753) Infrastructure……………………………………………… (13,671,972) (946,452) 379,463 - (14,238,961) Vehicles…………………………………………………… (4,659,516) (576,946) 226,756 - (5,009,706) Furniture, fixtures and equipment……………………… (3,346,397) (221,737) - (843) (3,568,977) Improvements…………………………………………… (9,064,149) (289,668) - - (9,353,817)
Total accumulated depreciation…………………… (53,395,184) (6,762,562) 606,219 (387,628) (59,939,155)
Total capital assets being depreciated, net………………… 185,427,263 (4,136,283) - 2,009,425 183,300,405
Total governmental activities capital assets…………………$ 226,426,968 $ (3,815,459) $ (650,719) $ 2,009,425 $ 223,970,215
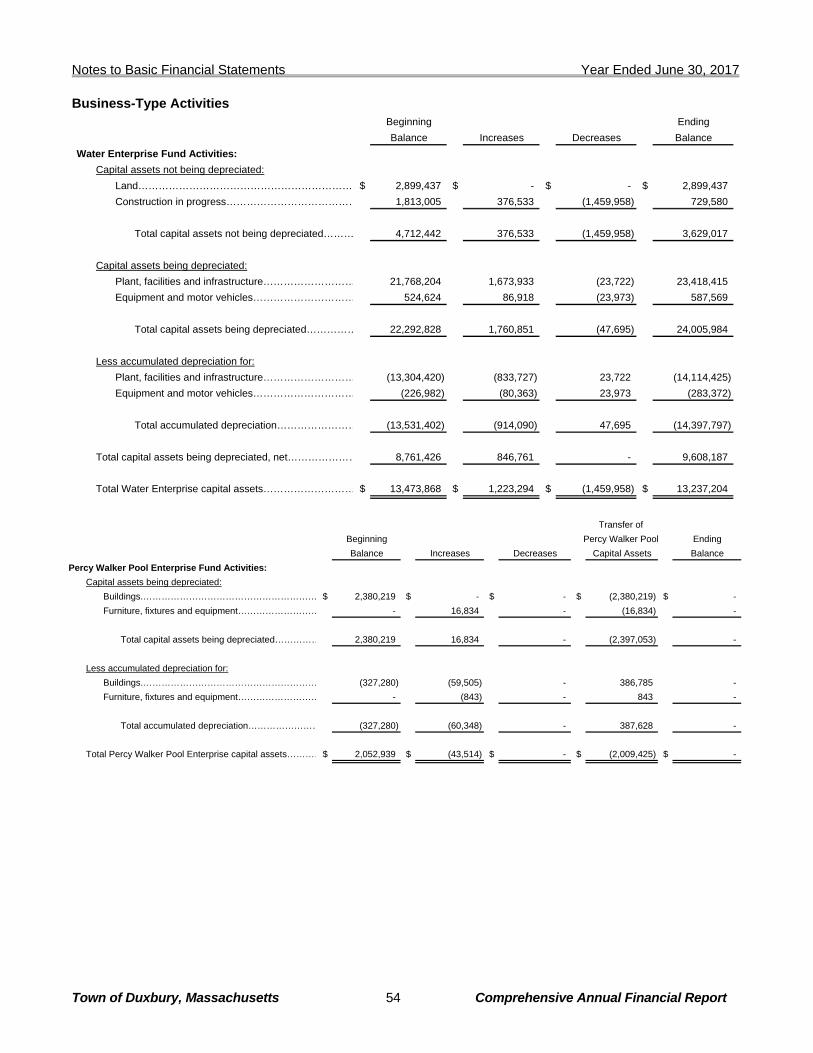
Notes to Basic Financial Statements Year Ended June 30, 2017
Town of Duxbury, Massachusetts 54 Comprehensive Annual Financial Report
Business-Type Activities Beginning EndingBalance Increases Decreases Balance
Water Enterprise Fund Activities:Capital assets not being depreciated:
Land……………………………………………………… $ 2,899,437 $ - $ - $ 2,899,437 Construction in progress………………………………… 1,813,005 376,533 (1,459,958) 729,580
Total capital assets not being depreciated……… 4,712,442 376,533 (1,459,958) 3,629,017
Capital assets being depreciated:
Plant, facilities and infrastructure……………………… 21,768,204 1,673,933 (23,722) 23,418,415 Equipment and motor vehicles………………………… 524,624 86,918 (23,973) 587,569
Total capital assets being depreciated…………… 22,292,828 1,760,851 (47,695) 24,005,984
Less accumulated depreciation for:
Plant, facilities and infrastructure……………………… (13,304,420) (833,727) 23,722 (14,114,425) Equipment and motor vehicles………………………… (226,982) (80,363) 23,973 (283,372)
Total accumulated depreciation…………………… (13,531,402) (914,090) 47,695 (14,397,797)
Total capital assets being depreciated, net………………… 8,761,426 846,761 - 9,608,187
Total Water Enterprise capital assets……………………… $ 13,473,868 $ 1,223,294 $ (1,459,958) $ 13,237,204
Transfer of
Beginning Percy Walker Pool EndingBalance Increases Decreases Capital Assets Balance
Percy Walker Pool Enterprise Fund Activities:Capital assets being depreciated:
Buildings.………………………………………………… $ 2,380,219 $ - $ - $ (2,380,219) $ - Furniture, fixtures and equipment……………………… - 16,834 - (16,834) -
Total capital assets being depreciated…………… 2,380,219 16,834 - (2,397,053) -
Less accumulated depreciation for:Buildings.………………………………………………… (327,280) (59,505) - 386,785 - Furniture, fixtures and equipment……………………… - (843) - 843 -
Total accumulated depreciation…………………… (327,280) (60,348) - 387,628 -
Total Percy Walker Pool Enterprise capital assets…………$ 2,052,939 $ (43,514) $ - $ (2,009,425) $ -
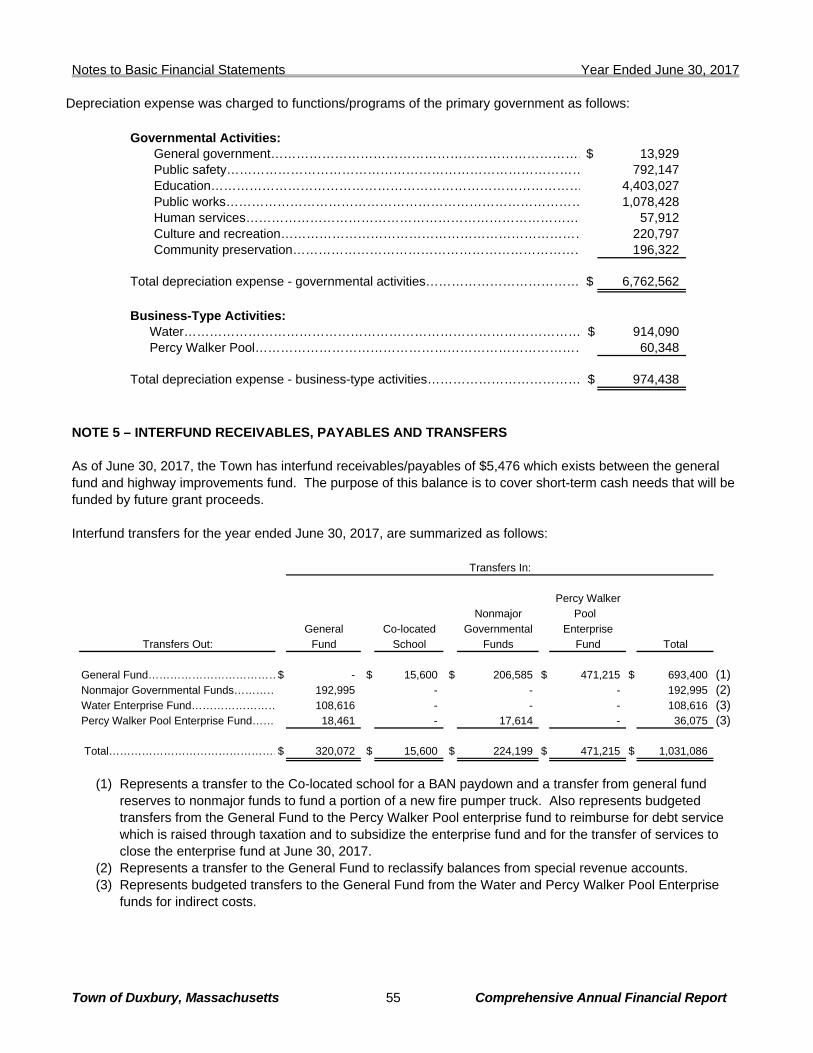
Notes to Basic Financial Statements Year Ended June 30, 2017
Town of Duxbury, Massachusetts 55 Comprehensive Annual Financial Report
Depreciation expense was charged to functions/programs of the primary government as follows:
Governmental Activities:General government…………………………………………………………………$ 13,929 Public safety………………………………………………………………………… 792,147 Education…………………………………………………………………………… 4,403,027 Public works………………………………………………………………………… 1,078,428 Human services……………………………………………………………………… 57,912 Culture and recreation……………………………………………………………… 220,797 Community preservation…………………………………………………………… 196,322
Total depreciation expense - governmental activities……………………………… $ 6,762,562
Business-Type Activities:Water………………………………………………………………………………… $ 914,090 Percy Walker Pool…………………………………………………………………… 60,348
Total depreciation expense - business-type activities……………………………… $ 974,438
NOTE 5 – INTERFUND RECEIVABLES, PAYABLES AND TRANSFERS As of June 30, 2017, the Town has interfund receivables/payables of $5,476 which exists between the general fund and highway improvements fund. The purpose of this balance is to cover short-term cash needs that will be funded by future grant proceeds. Interfund transfers for the year ended June 30, 2017, are summarized as follows:
Percy WalkerNonmajor Pool
General Co-located Governmental EnterpriseTransfers Out: Fund School Funds Fund Total
General Fund………………………………$ - $ 15,600 $ 206,585 $ 471,215 $ 693,400 (1)Nonmajor Governmental Funds………… 192,995 - - - 192,995 (2)Water Enterprise Fund…………………… 108,616 - - - 108,616 (3)Percy Walker Pool Enterprise Fund…… 18,461 - 17,614 - 36,075 (3)
Total…………………………………………$ 320,072 $ 15,600 $ 224,199 $ 471,215 $ 1,031,086
Transfers In:
(1) Represents a transfer to the Co-located school for a BAN paydown and a transfer from general fund
reserves to nonmajor funds to fund a portion of a new fire pumper truck. Also represents budgeted transfers from the General Fund to the Percy Walker Pool enterprise fund to reimburse for debt service which is raised through taxation and to subsidize the enterprise fund and for the transfer of services to close the enterprise fund at June 30, 2017.
(2) Represents a transfer to the General Fund to reclassify balances from special revenue accounts. (3) Represents budgeted transfers to the General Fund from the Water and Percy Walker Pool Enterprise
funds for indirect costs.
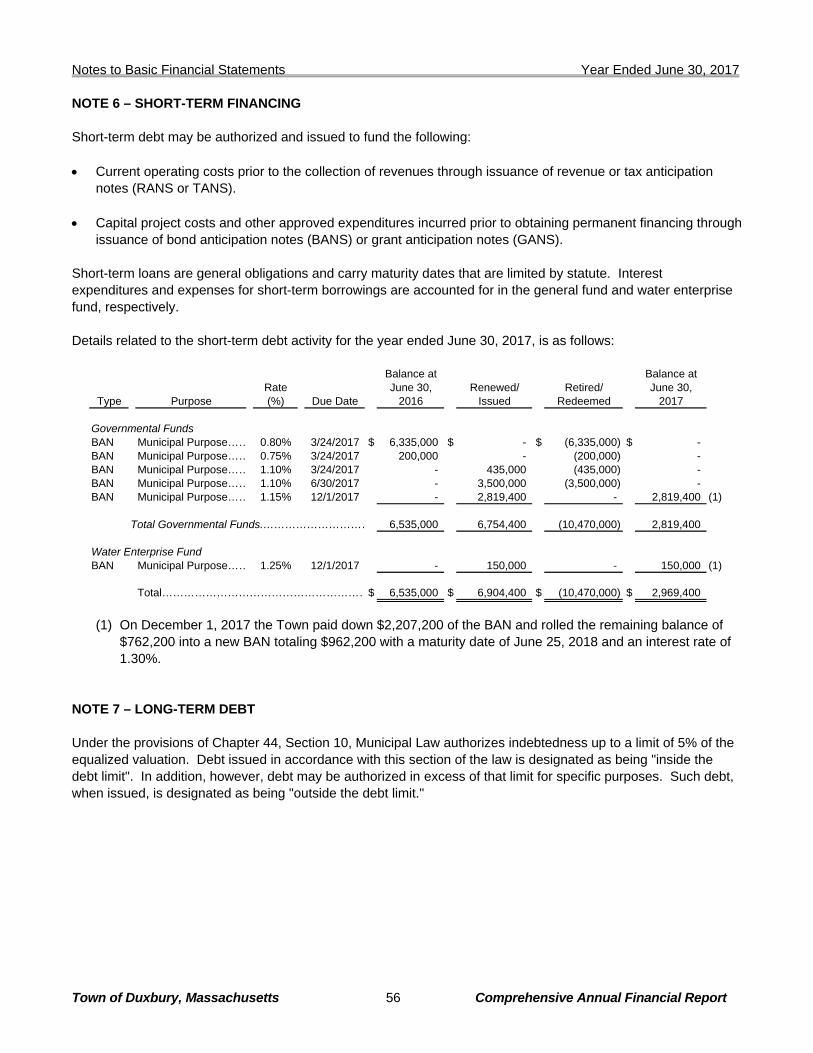
Notes to Basic Financial Statements Year Ended June 30, 2017
Town of Duxbury, Massachusetts 56 Comprehensive Annual Financial Report
NOTE 6 – SHORT-TERM FINANCING Short-term debt may be authorized and issued to fund the following: • Current operating costs prior to the collection of revenues through issuance of revenue or tax anticipation
notes (RANS or TANS). • Capital project costs and other approved expenditures incurred prior to obtaining permanent financing through
issuance of bond anticipation notes (BANS) or grant anticipation notes (GANS). Short-term loans are general obligations and carry maturity dates that are limited by statute. Interest expenditures and expenses for short-term borrowings are accounted for in the general fund and water enterprise fund, respectively. Details related to the short-term debt activity for the year ended June 30, 2017, is as follows:
Balance at Balance at
Rate June 30, Renewed/ Retired/ June 30,Type Purpose (%) Due Date 2016 Issued Redeemed 2017
Governmental FundsBAN Municipal Purpose…… 0.80% 3/24/2017 $ 6,335,000 $ - $ (6,335,000) $ - BAN Municipal Purpose…… 0.75% 3/24/2017 200,000 - (200,000) - BAN Municipal Purpose…… 1.10% 3/24/2017 - 435,000 (435,000) - BAN Municipal Purpose…… 1.10% 6/30/2017 - 3,500,000 (3,500,000) - BAN Municipal Purpose…… 1.15% 12/1/2017 - 2,819,400 - 2,819,400 (1)
Total Governmental Funds.………………………… 6,535,000 6,754,400 (10,470,000) 2,819,400
Water Enterprise FundBAN Municipal Purpose…… 1.25% 12/1/2017 - 150,000 - 150,000 (1)
Total…………………………………………………$ 6,535,000 $ 6,904,400 $ (10,470,000) $ 2,969,400
(1) On December 1, 2017 the Town paid down $2,207,200 of the BAN and rolled the remaining balance of
$762,200 into a new BAN totaling $962,200 with a maturity date of June 25, 2018 and an interest rate of 1.30%.
NOTE 7 – LONG-TERM DEBT Under the provisions of Chapter 44, Section 10, Municipal Law authorizes indebtedness up to a limit of 5% of the equalized valuation. Debt issued in accordance with this section of the law is designated as being "inside the debt limit". In addition, however, debt may be authorized in excess of that limit for specific purposes. Such debt, when issued, is designated as being "outside the debt limit."

Notes to Basic Financial Statements Year Ended June 30, 2017
Town of Duxbury, Massachusetts 57 Comprehensive Annual Financial Report
Details related to the outstanding indebtedness at June 30, 2017, and the debt service requirements are as follows: General Obligation Bonds Payable Schedule – Governmental Funds
Original Interest Outstanding Transfer of OutstandingMaturities Loan Rate at June 30, Percy Walker at June 30,
Project Through Amount (%) 2016 Issued Redeemed Pool Debt 2017
MCWT 1997…………………………………………… 2017 $ 650,000 5.27 $ 41,960 $ - $ (41,960) $ - $ - MCWT 2001 Title V…………………………………… 2019 195,676 4.50 32,604 - (10,868) - 21,736 MCWT 2004 Title V…………………………………… 2021 192,582 3.30-5.25 53,665 - (10,690) - 42,975 Municipal Purpose Loans of 2009…………………… 2017 125,000 3.00-3.85 10,000 - (10,000) - - Municipal Purpose Refunding Loans of 2009……… 2017 1,300,000 3.00-3.85 145,000 - (145,000) - - Municipal Purpose Loans of 2010…………………… 2023 2,950,000 2.00-5.00 345,000 - (40,000) 1,240,000 1,545,000 Municipal Purpose Loans of 2013…………………… 2038 82,575,000 3.00-4.00 72,870,000 - (3,585,000) - 69,285,000 Municipal Purpose Loans of 2014…………………… 2024 2,200,000 2.00-3.00 1,760,000 - (220,000) - 1,540,000 Municipal Purpose Refunding Loans of 2014……… 2023 425,000 2.00-3.00 454,000 - (189,000) - 265,000 Municipal Purpose Loans of 2015…………………… 2025 4,500,000 2.00-3.00 4,050,000 - (450,000) - 3,600,000 Municipal Purpose Refunding Loans of 2016……… 2021 4,120,000 2.00-4.00 4,120,000 - (850,000) - 3,270,000 Municipal PurposeLoans of 2017………….………… 2027 3,185,000 4.00 - 3,185,000 - - 3,185,000
Total Bonds Payable…………….……………………………………………………………………… 83,882,229 3,185,000 (5,552,518) 1,240,000 82,754,711
Add: Unamortized Premium……………………………………………………………………………… 5,298,766 345,918 (561,559) - 5,083,125
Total Bonds Payable, net…………….……………………………………………………………………$ 89,180,995 $ 3,530,918 $ (6,114,077) $ 1,240,000 $ 87,837,836
Debt service requirements for principal and interest for governmental bonds payable in future years are as follows:
Year Principal Interest Total
2018………………$ 5,676,558 $ 2,839,294 $ 8,515,8522019……………… 5,656,558 2,634,843 8,291,4012020……………… 5,630,690 2,423,462 8,054,1522021……………… 5,630,905 2,207,228 7,838,1332022……………… 4,805,000 2,007,257 6,812,2572023……………… 4,795,000 1,823,863 6,618,8632024……………… 4,745,000 1,663,737 6,408,7372025……………… 4,525,000 1,507,473 6,032,4732026……………… 3,885,000 1,353,150 5,238,1502027……………… 3,885,000 1,233,450 5,118,4502028……………… 3,570,000 1,095,900 4,665,9002029……………… 3,150,000 961,500 4,111,5002030……………… 3,150,000 835,500 3,985,5002031……………… 3,150,000 709,500 3,859,5002032……………… 3,150,000 583,500 3,733,5002033……………… 3,150,000 473,250 3,623,2502034……………… 2,840,000 383,400 3,223,4002035……………… 2,840,000 298,200 3,138,2002036……………… 2,840,000 213,000 3,053,0002037……………… 2,840,000 127,800 2,967,8002038……………… 2,840,000 42,599 2,882,599
Totals……………$ 82,754,711 $ 25,417,906 $ 108,172,617
The Town is scheduled to be subsidized by the Massachusetts Clean Water Trust (MCWT) for governmental fund debt on a periodic basis for interest costs for $6,502. Thus, net MCWT loan repayments, including interest, are

Notes to Basic Financial Statements Year Ended June 30, 2017
Town of Duxbury, Massachusetts 58 Comprehensive Annual Financial Report
scheduled to be $64,712 for the three MCWT governmental debt issuances. Since the Town is legally obligated for the total amount of the debt, such amounts have been reported in the accompanying basic financial statements. The 2017 principal and interest subsidies totaled approximately $12,543 and $6,203, respectively. General Obligation Bonds Payable Schedule – Water Enterprise Fund
Original Interest Outstanding OutstandingMaturities Loan Rate at June 30, at June 30,
Project Through Amount (%) 2016 Issued Redeemed 2017
Municipal Purpose Loans of 2008…………………… 2023 $ 1,700,000 3.00-3.85 $ 720,000 $ - $ (120,000) $ 600,000 MCWT 2009…………………………………………… 2029 3,150,000 2.00 2,179,962 - (148,311) 2,031,651 Municipal Purpose Loans of 2014…………………… 2019 864,000 2.00 510,000 - (175,000) 335,000
Total Bonds Payable…………….……………………………………………………………………… $ 3,409,962 $ - $ (443,311) $ 2,966,651
Debt service requirements for principal and interest for water enterprise fund bonds payable in future years are as follows:
Year Principal Interest Total
2018………………$ 436,307 $ 64,702 $ 501,0092019……………… 424,364 54,314 478,6782020……………… 262,482 45,556 308,0382021……………… 265,664 38,331 303,9952022……………… 263,909 31,139 295,0482023……………… 237,221 24,555 261,7762024……………… 170,599 19,828 190,4272025……………… 174,045 16,382 190,4272026……………… 177,561 12,866 190,4272027……………… 181,149 9,279 190,4282028……………… 184,808 5,619 190,4272029……………… 188,542 1,885 190,427
Totals……………$ 2,966,651 $ 324,456 $ 3,291,107
General Obligation Bonds Payable Schedule – Percy Walker Pool Enterprise Fund
Original Interest Outstanding Transfer of OutstandingMaturities Loan Rate at June 30, Percy Walker at June 30,
Project Through Amount (%) 2016 Issued Redeemed Pool Debt 2017
Municipal Purpose Loans of 2010……………… 2025 $ 2,363,000 2.00-5.00 $ 1,395,000 $ - $ (155,000) $ (1,240,000) $ -
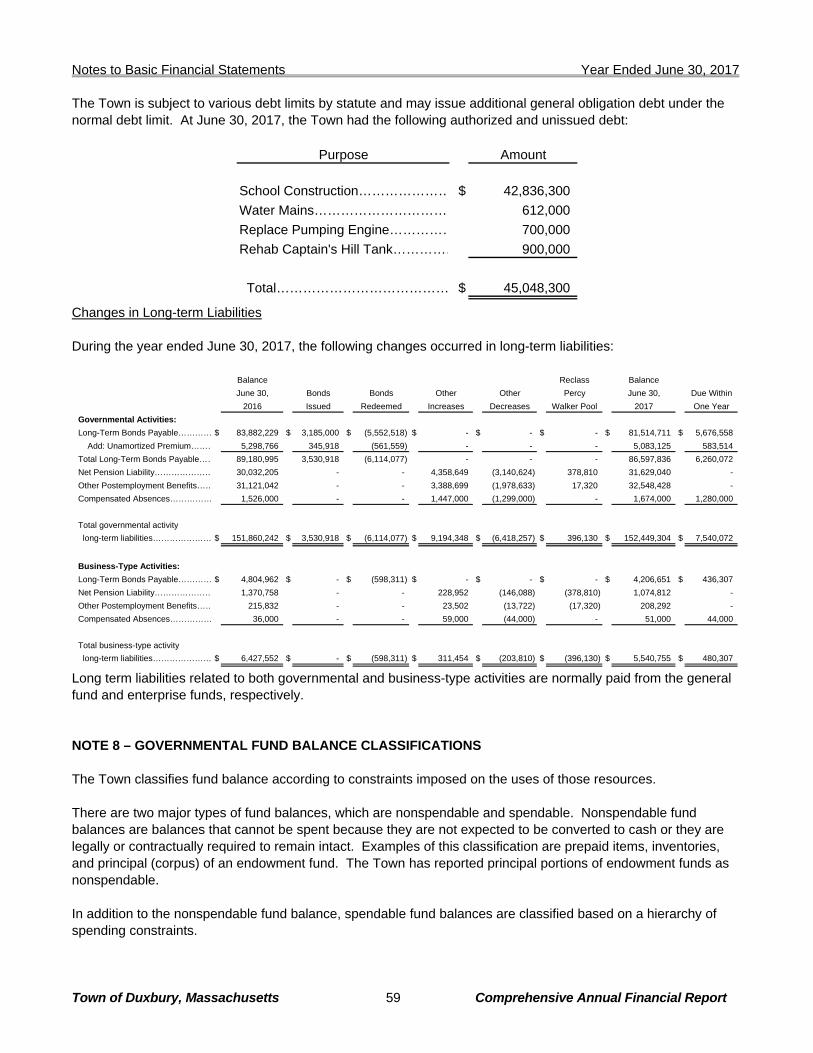
Notes to Basic Financial Statements Year Ended June 30, 2017
Town of Duxbury, Massachusetts 59 Comprehensive Annual Financial Report
The Town is subject to various debt limits by statute and may issue additional general obligation debt under the normal debt limit. At June 30, 2017, the Town had the following authorized and unissued debt:
Purpose Amount
School Construction………………… $ 42,836,300 Water Mains…………………………… 612,000 Replace Pumping Engine…………… 700,000 Rehab Captain's Hill Tank…………… 900,000
Total………………………………… $ 45,048,300
Changes in Long-term Liabilities During the year ended June 30, 2017, the following changes occurred in long-term liabilities:
Balance Reclass BalanceJune 30, Bonds Bonds Other Other Percy June 30, Due Within
2016 Issued Redeemed Increases Decreases Walker Pool 2017 One YearGovernmental Activities:Long-Term Bonds Payable………… $ 83,882,229 $ 3,185,000 $ (5,552,518) $ - $ - $ - $ 81,514,711 $ 5,676,558 Add: Unamortized Premium……… 5,298,766 345,918 (561,559) - - - 5,083,125 583,514 Total Long-Term Bonds Payable…… 89,180,995 3,530,918 (6,114,077) - - - 86,597,836 6,260,072 Net Pension Liability………………… 30,032,205 - - 4,358,649 (3,140,624) 378,810 31,629,040 - Other Postemployment Benefits…… 31,121,042 - - 3,388,699 (1,978,633) 17,320 32,548,428 - Compensated Absences…………… 1,526,000 - - 1,447,000 (1,299,000) - 1,674,000 1,280,000
Total governmental activity long-term liabilities………………… $ 151,860,242 $ 3,530,918 $ (6,114,077) $ 9,194,348 $ (6,418,257) $ 396,130 $ 152,449,304 $ 7,540,072
Business-Type Activities:Long-Term Bonds Payable………… $ 4,804,962 $ - $ (598,311) $ - $ - $ - $ 4,206,651 $ 436,307 Net Pension Liability………………… 1,370,758 - - 228,952 (146,088) (378,810) 1,074,812 - Other Postemployment Benefits…… 215,832 - - 23,502 (13,722) (17,320) 208,292 - Compensated Absences…………… 36,000 - - 59,000 (44,000) - 51,000 44,000
Total business-type activity long-term liabilities………………… $ 6,427,552 $ - $ (598,311) $ 311,454 $ (203,810) $ (396,130) $ 5,540,755 $ 480,307
Long term liabilities related to both governmental and business-type activities are normally paid from the general fund and enterprise funds, respectively. NOTE 8 – GOVERNMENTAL FUND BALANCE CLASSIFICATIONS The Town classifies fund balance according to constraints imposed on the uses of those resources. There are two major types of fund balances, which are nonspendable and spendable. Nonspendable fund balances are balances that cannot be spent because they are not expected to be converted to cash or they are legally or contractually required to remain intact. Examples of this classification are prepaid items, inventories, and principal (corpus) of an endowment fund. The Town has reported principal portions of endowment funds as nonspendable. In addition to the nonspendable fund balance, spendable fund balances are classified based on a hierarchy of spending constraints.
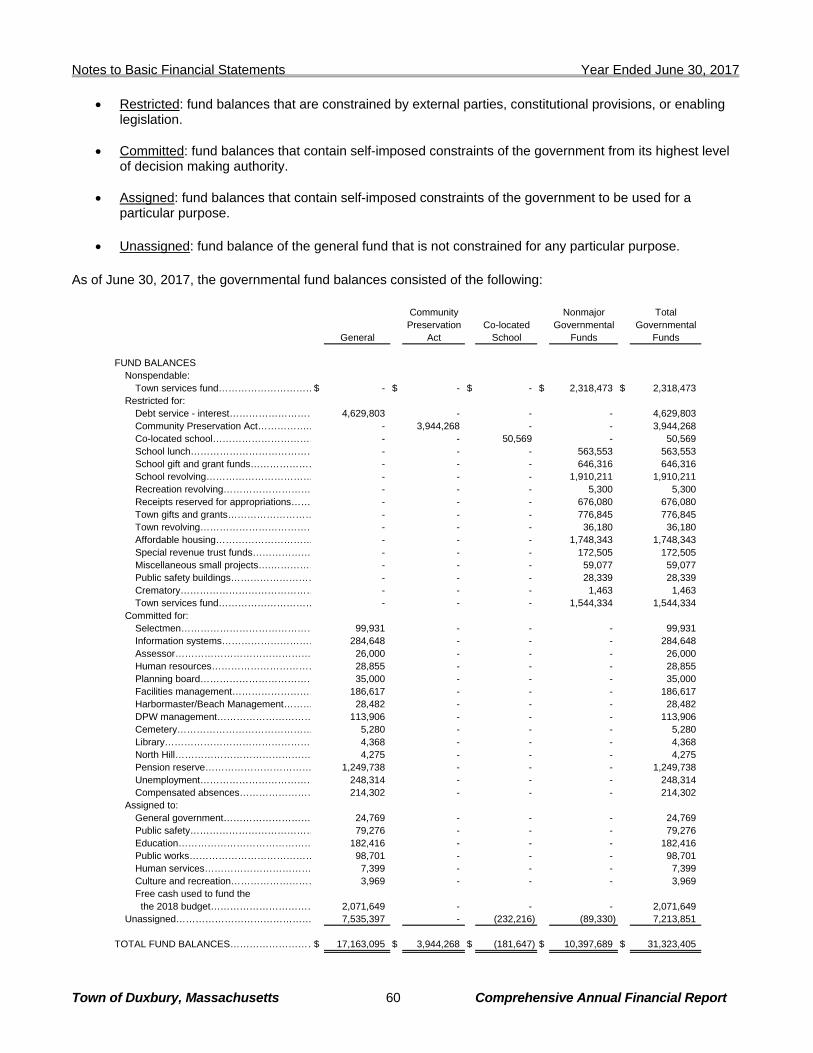
Notes to Basic Financial Statements Year Ended June 30, 2017
Town of Duxbury, Massachusetts 60 Comprehensive Annual Financial Report
• Restricted: fund balances that are constrained by external parties, constitutional provisions, or enabling legislation.
• Committed: fund balances that contain self-imposed constraints of the government from its highest level of decision making authority.
• Assigned: fund balances that contain self-imposed constraints of the government to be used for a
particular purpose.
• Unassigned: fund balance of the general fund that is not constrained for any particular purpose. As of June 30, 2017, the governmental fund balances consisted of the following:
Community Nonmajor TotalPreservation Co-located Governmental Governmental
General Act School Funds Funds
FUND BALANCESNonspendable:
Town services fund…………………………$ - $ - $ - $ 2,318,473 $ 2,318,473 Restricted for:
Debt service - interest……………………… 4,629,803 - - - 4,629,803 Community Preservation Act…………….… - 3,944,268 - - 3,944,268 Co-located school…………………………… - - 50,569 - 50,569 School lunch………………………………… - - - 563,553 563,553 School gift and grant funds………………… - - - 646,316 646,316 School revolving…………………………… - - - 1,910,211 1,910,211 Recreation revolving……………………… - - - 5,300 5,300 Receipts reserved for appropriations…… - - - 676,080 676,080 Town gifts and grants……………………… - - - 776,845 776,845 Town revolving……………………………… - - - 36,180 36,180 Affordable housing………………………… - - - 1,748,343 1,748,343 Special revenue trust funds……………… - - - 172,505 172,505 Miscellaneous small projects….…………… - - - 59,077 59,077 Public safety buildings……………………… - - - 28,339 28,339 Crematory…………………………………… - - - 1,463 1,463 Town services fund………………………… - - - 1,544,334 1,544,334
Committed for:Selectmen…………………………………… 99,931 - - - 99,931 Information systems………………………… 284,648 - - - 284,648 Assessor…………………………………… 26,000 - - - 26,000 Human resources…………………………… 28,855 - - - 28,855 Planning board……………………………… 35,000 - - - 35,000 Facilities management……………………… 186,617 - - - 186,617 Harbormaster/Beach Management……… 28,482 - - - 28,482 DPW management………………………… 113,906 - - - 113,906 Cemetery…………………………………… 5,280 - - - 5,280 Library………………………………………… 4,368 - - - 4,368 North Hill…………………………………… 4,275 - - - 4,275 Pension reserve…………………………… 1,249,738 - - - 1,249,738 Unemployment……………………………… 248,314 - - - 248,314 Compensated absences…………………… 214,302 - - - 214,302
Assigned to: General government……………………… 24,769 - - - 24,769 Public safety………………………………… 79,276 - - - 79,276 Education…………………………………… 182,416 - - - 182,416 Public works………………………………… 98,701 - - - 98,701 Human services…………………………… 7,399 - - - 7,399 Culture and recreation……………………… 3,969 - - - 3,969 Free cash used to fund the the 2018 budget…………………………… 2,071,649 - - - 2,071,649
Unassigned…………………………………… 7,535,397 - (232,216) (89,330) 7,213,851
TOTAL FUND BALANCES………………………$ 17,163,095 $ 3,944,268 $ (181,647) $ 10,397,689 $ 31,323,405
Notes to Basic Financial Statements Year Ended June 30, 2017
Town of Duxbury, Massachusetts 61 Comprehensive Annual Financial Report
Massachusetts General Law Ch.40 §5B allows for the establishment of Stabilization funds for one or more different purposes on an as needed basis. The creation of a fund requires a two-thirds vote of the legislative body and must clearly define the purpose of the fund. Any change to the purpose of the fund along with any additions to or appropriations from the fund requires a two-thirds vote of the legislative body. The stabilization fund balance can be used for general and/or capital purposes upon approval of Town Meeting. Additions to and withdrawals from the funds can only be made upon Town Meeting approval. In accordance with Massachusetts General Law the Town has established a general stabilization fund, a pension reserve fund, an unemployment trust fund and a compensated absences stabilization fund to assist the Town in funding it’s liability for accrued sick and vacation time. At year end, the balance of the general stabilization fund was $4,302,878 and reported as unassigned fund balance in the general fund. The pension trust stabilization, unemployment trust stabilization, and compensated absences trust stabilization totaled $1,249,738, $248,314 and $214,302, respectively. These three funds are reported as committed fund balance in the general fund. The pension trust fund is distinct and separate from the System information in Note 11. The purpose of the fund is to provide a reserve to meet future annual contributions to the Pension System. With the exception of the pension reserve and the unemployment reserve, the committed balances in the General Fund are articles carried forward to next year. With the exception of free cash used to fund the 2018 budget, assigned balances in the General Fund are encumbrances carried forward to next year. The detail of each article and encumbrance is included in the budgetary comparison schedule presented as required supplementary information. NOTE 9 – COMMUNITY PRESERVATION FUNDS In March of 2001, the Town approved the Community Preservation Act (CPA) which allows the Town to impose a surcharge on property taxes and to receive matching state funds for specified uses related to the acquisition, creation, preservation and support of open space, historic resources, land for recreational use and community housing. The CPA requires that the Town spend or set aside for later spending a minimum of 10% of annual revenues for open space, a minimum of 10% of annual revenues for historic resources and a minimum of 10% of annual revenues for community housing. In accordance with the CPA, the Town has approved a bylaw establishing a Community Preservation Committee (CPC) to study the needs, possibilities and resources of the Town regarding community preservation and to make recommendations for Town Meeting approval to fund eligible projects using CPA funds. As of June 30, 2017, the CPA fund has a balance of $3.9 million and is reported as a major fund in the governmental funds financial statements. NOTE 10 – RISK FINANCING The Town is exposed to various risks of loss related to torts; theft of, damage to and destruction of assets; errors and omissions; and natural disasters for which the Town carries commercial insurance. The amount of claim settlements has not exceeded insurance coverage in any of the previous three years. The Town is self-insured for employee health insurance activities and unemployment benefits. These activities are accounted for in the Town’s Internal Service Fund where revenues are recorded when earned and expenditures recorded when the liability is incurred.

Notes to Basic Financial Statements Year Ended June 30, 2017
Town of Duxbury, Massachusetts 62 Comprehensive Annual Financial Report
(a) Employee Health Insurance
The Town estimates its Incurred But Not Reported (IBNR) claims based on a multiyear analysis of average claims paid. The Town purchases individual stop loss insurance for claims in excess of the coverage provided by the Town in the amount of $100,000 per claim. At June 30, 2017, the amount of the liability for health insurance claims totaled $1,292,217. This liability is the Town’s best estimate based on available information. The Town has elected to record a conservative estimate using the high range of the estimated potential liability. Changes in the reported liability since July 1, 2015, are as follows:
Current YearBalance at Claims and
Beginning of Changes in Claims Balance atYear Estimate Payments Year-End
2016…………………… $ 852,980 $ 10,439,436 $ (10,245,336) $ 1,047,080 2017…………………… 1,047,080 12,382,490 (12,137,353) 1,292,217
(b) Workers’ Compensation
Workers’ compensation claims are administered by a third party administrator and are funded on a pay-as-you-go basis from annual appropriations. The estimated future workers’ compensation liability is based on history and injury type. Changes in the reported liability since July 1, 2015, are as follows:
Current YearBalance at Claims and
Beginning of Changes in Claims Balance atYear Estimate Payments Year-End
2016…………………… $ - $ 1,051,390 $ (270,147) $ 781,243 2017…………………… 781,243 194,583 (332,761) 643,065
NOTE 11 – PENSION PLAN Plan Descriptions The Town is a member of the Plymouth County Contributory Retirement System (PCCRS), a cost-sharing multiple-employer defined benefit pension plan covering eligible employees of the 54 member units. The PCCRS is administered by five board members (Board) on behalf of all current employees and retirees except for current teachers and retired teachers. Chapter 32 of the MGL assigns authority to establish and amend benefit provisions of the plan. The audited financial report may be obtained by visiting http://www.pcr-ma.org. The Town is a member of the Massachusetts Teachers’ Retirement System (MTRS), a cost-sharing multi-employer defined benefit plan. MTRS is managed by the Commonwealth of Massachusetts (Commonwealth) on behalf of municipal teachers and municipal teacher retirees. The Commonwealth is a nonemployer contributor and is responsible for 100% of the contributions and future benefit requirements of the MTRS. The MTRS covers certified teachers in cities (except Boston), towns, regional school districts, charter schools, educational collaboratives and Quincy College. The MTRS is part of the Commonwealth’s reporting entity and the audited financial report may be obtained by visiting http://www.mass.gov/osc/publications-and-reports/financial-reports/.
Notes to Basic Financial Statements Year Ended June 30, 2017
Town of Duxbury, Massachusetts 63 Comprehensive Annual Financial Report
Special Funding Situation The Commonwealth is a nonemployer contributor and is required by statute to make 100% of all actuarially determined employer contributions on behalf of the Town to the MTRS. Therefore, the Town is considered to be in a special funding situation as defined by GASB Statement No. 68, Accounting and Financial Reporting for Pensions and the Commonwealth is a nonemployer contributor in MTRS. Since the Town does not contribute directly to MTRS, there is no net pension liability to recognize. The total of the Commonwealth provided contributions have been allocated based on each employer’s covered payroll to the total covered payroll of employers in MTRS as of the measurement date of June 30, 2016. The Town’s portion of the collective pension expense, contributed by the Commonwealth, of $7,686,618 is reported in the general fund as intergovernmental revenue and pension expense in the current fiscal year. The portion of the Commonwealth’s collective net pension liability associated with the Town is $75,354,160 as of the measurement date. Benefits Provided Both Systems provide retirement, disability, survivor and death benefits to plan members and beneficiaries. Massachusetts Contributory Retirement System benefits are, with certain minor exceptions, uniform from system to system. The System provides for retirement allowance benefits up to a maximum of 80% of a member's highest three-year average annual rate of regular compensation. For persons who became members on or after April 2, 2012, average salary is the average annual rate of regular compensation received during the five consecutive years that produce the highest average, or, if greater, during the last five years (whether or not consecutive) preceding retirement. Benefit payments are based upon a member's age, length of creditable service, level of compensation, and group classification. Members become vested after ten years of creditable service. Employees who resign from service and who are not eligible to receive a retirement allowance or are under the age of 55 are entitled to request a refund of their accumulated total deductions. Survivor benefits are extended to eligible beneficiaries of members whose death occurs prior to or following retirement. Cost-of-living adjustments granted between 1981 and 1997 and any increase in other benefits imposed by the Commonwealth’s state law during those years are borne by the Commonwealth and are deposited into the pension fund. Cost-of-living adjustments granted after 1997 must be approved by the Board and are borne by the System. There were no changes of benefit terms that affected the total pension liability at December 31, 2016. Contributions Chapter 32 of the MGL governs the contributions of plan members and member units. Active plan members are required to contribute to the System at rates ranging from 5% to 9% of gross regular compensation with an additional 2% contribution required for compensation exceeding $30,000. The percentage rate is keyed to the date upon which an employee's membership commences. The member units are required to pay into the PCCRS a legislatively mandated actuarial determined contribution that is apportioned among the employers based on active current payroll. The Town’s total contribution for the year ended December 31, 2016, was $3,286,712, 20.39% of covered payroll, actuarially determined as an amount that, when combine with plan member contributions, is expected to finance the costs of benefits earned by plan members during the year, with an additional amount to finance any unfunded accrued liability. The Town’s proportionate share of the required contribution was $4,251,876. The Town paid $3,286,712 for its actual contribution. The required contribution is payable on July 1 and January 1. Employers may choose to pay the entire appropriation in July at a discounted rate. Accordingly, actual contributions may be less than the required contributions.
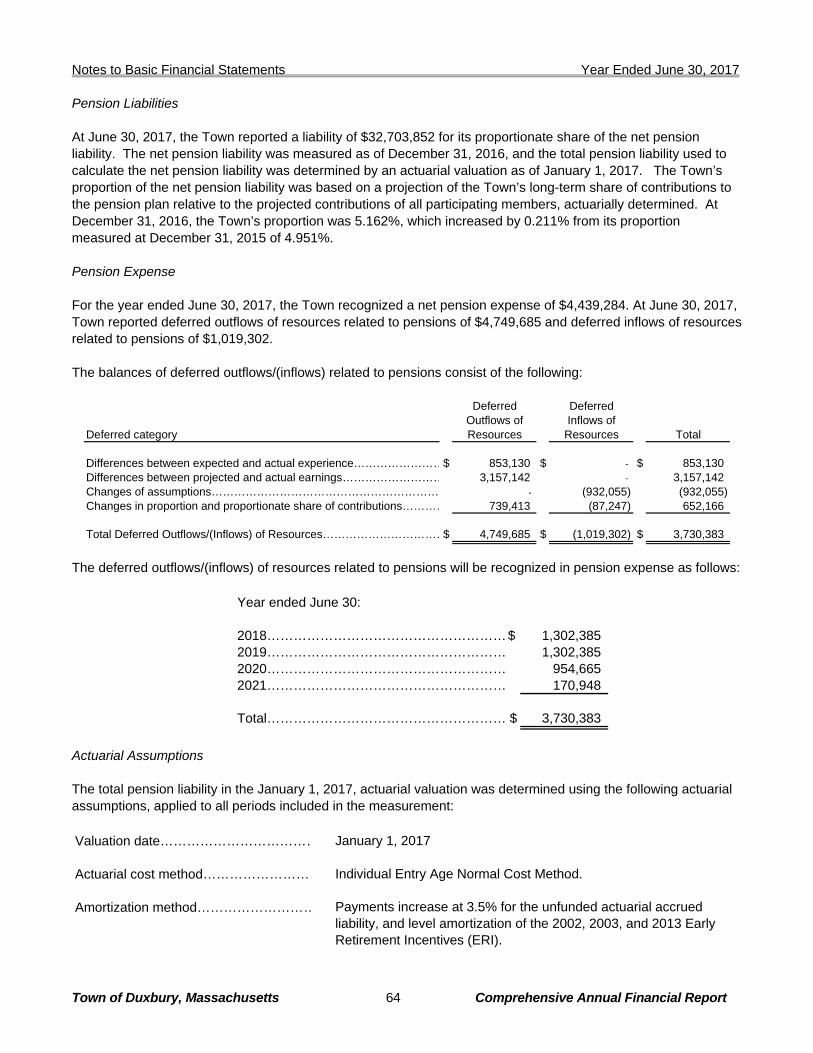
Notes to Basic Financial Statements Year Ended June 30, 2017
Town of Duxbury, Massachusetts 64 Comprehensive Annual Financial Report
Pension Liabilities At June 30, 2017, the Town reported a liability of $32,703,852 for its proportionate share of the net pension liability. The net pension liability was measured as of December 31, 2016, and the total pension liability used to calculate the net pension liability was determined by an actuarial valuation as of January 1, 2017. The Town’s proportion of the net pension liability was based on a projection of the Town’s long-term share of contributions to the pension plan relative to the projected contributions of all participating members, actuarially determined. At December 31, 2016, the Town’s proportion was 5.162%, which increased by 0.211% from its proportion measured at December 31, 2015 of 4.951%. Pension Expense For the year ended June 30, 2017, the Town recognized a net pension expense of $4,439,284. At June 30, 2017, Town reported deferred outflows of resources related to pensions of $4,749,685 and deferred inflows of resources related to pensions of $1,019,302. The balances of deferred outflows/(inflows) related to pensions consist of the following:
Deferred DeferredOutflows of Inflows of
Deferred category Resources Resources Total
Differences between expected and actual experience……………………$ 853,130 $ - $ 853,130 Differences between projected and actual earnings……………………… 3,157,142 - 3,157,142 Changes of assumptions…………………………………………………… - (932,055) (932,055) Changes in proportion and proportionate share of contributions………… 739,413 (87,247) 652,166
Total Deferred Outflows/(Inflows) of Resources……………………………$ 4,749,685 $ (1,019,302) $ 3,730,383
The deferred outflows/(inflows) of resources related to pensions will be recognized in pension expense as follows:
Year ended June 30:
2018………………………………………………$ 1,302,385 2019……………………………………………… 1,302,385 2020……………………………………………… 954,665 2021……………………………………………… 170,948
Total……………………………………………… $ 3,730,383
Actuarial Assumptions The total pension liability in the January 1, 2017, actuarial valuation was determined using the following actuarial assumptions, applied to all periods included in the measurement: Valuation date……………………………… January 1, 2017
Actuarial cost method……………………… Individual Entry Age Normal Cost Method.
Amortization method………………………
Payments increase at 3.5% for the unfunded actuarial accrued liability, and level amortization of the 2002, 2003, and 2013 Early Retirement Incentives (ERI).

Notes to Basic Financial Statements Year Ended June 30, 2017
Town of Duxbury, Massachusetts 65 Comprehensive Annual Financial Report
Remaining amortization period……………
Amortization of the unfunded actuarial accrued liability over 12 years, the 2002 ERI over two years, 2003 ERI over three years, and the 2013 ERI over 11 years; all as of July 1, 2017.
Asset valuation method……………………
Market value with a five-year smoothing of asset returns greater than or less than the assumed rate of return, with a 20% corridor.
Investment rate of return/Discount rate… 8% nominal rate, net of investment expense.
Projected salary increases……………… 3.75% per year.
Cost of living adjustments………………… 3.0% of the first $14,000 of retirement income.
Rates of retirement…………………………
Varies based upon age for general employees, police and fire employees.
Rates of disability…………………………
For general employees, it was assumed that 45% of all disabilities are ordinary (55% are service connected). For police and fire employees, 10% of all disabilities are assumed to be ordinary (90% are service connected).
Mortality rates………………………………
It is assumed that both pre-retirement mortality and beneficiary mortality is represented by the RP-2014 Blue Collar Mortality with Scale MP-2016, fully generational. Mortality for retired members for Group 1 and 2 is represented by the RP-2014 Blue Collar Mortality Table set forward five years for males and three years for females, fully generational. Mortality for retired members for Group 4 is represented by the RP-2014 Blue Collar Mortality Table set forward three years for males, and six years for females, fully generational. Mortality for disabled members for Group 1 and 2 is represented by the RP-2000 Mortality Table set forward six years. Mortality for disabled members for Group 4 is represented by the RP-2000 Mortality Table set forward two years. Generational adjusting is based on Scale MP-2016.
Family composition…………………………
Assumption that 80% of members will be survived by a spouse, females are three years younger than males and males are three years older than females.
Investment Policy The pension plan’s policy in regard to the allocation of invested assets is established and may be amended by the Board and pursuant to Massachusetts General Laws and Public Employee Retirement Administration guidelines. Plan assets are managed on a total return basis with a long-term objective of achieving and maintaining a fully funded status for the benefits provided through the pension plan. The investment objective is to fully fund the Plan by generating sufficient long-term inflation adjusted capital appreciation while providing sufficient liquidity to meet short-term withdrawal requirements. The Board desires to balance the goal of higher long-term returns with the goal of minimizing contribution volatility, recognizing these are often competing goals. This requires taking both assets and liabilities into account when setting investment strategy.
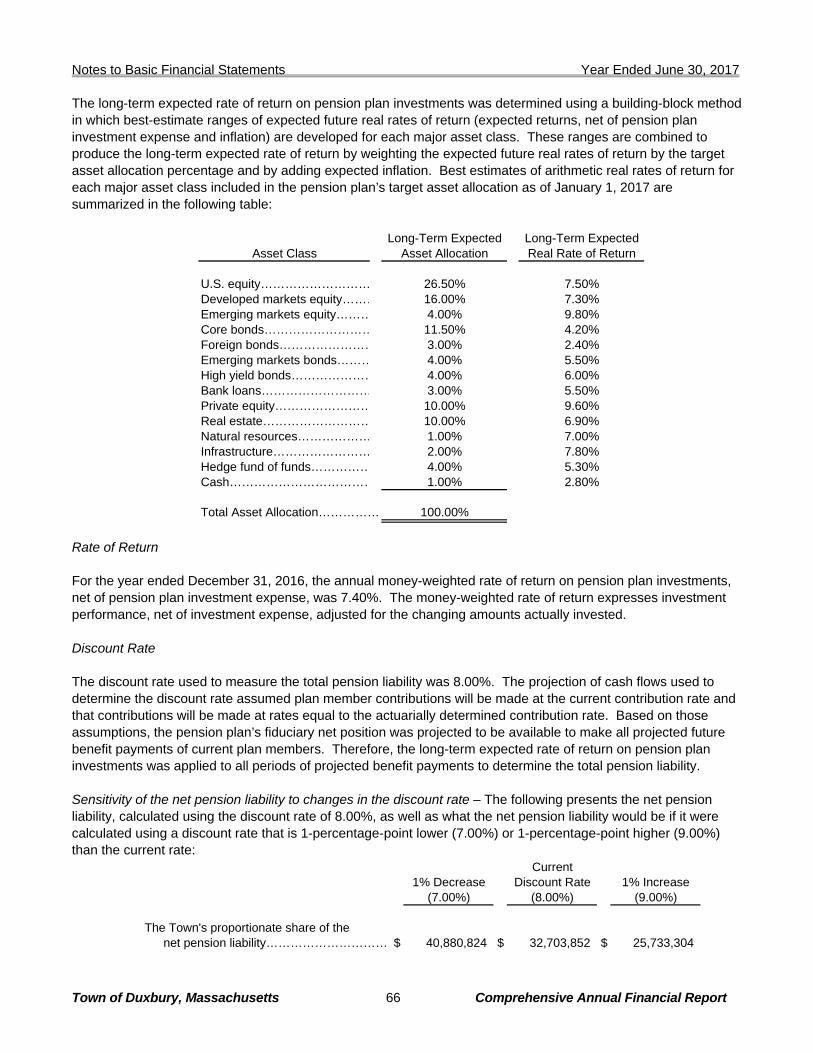
Notes to Basic Financial Statements Year Ended June 30, 2017
Town of Duxbury, Massachusetts 66 Comprehensive Annual Financial Report
The long-term expected rate of return on pension plan investments was determined using a building-block method in which best-estimate ranges of expected future real rates of return (expected returns, net of pension plan investment expense and inflation) are developed for each major asset class. These ranges are combined to produce the long-term expected rate of return by weighting the expected future real rates of return by the target asset allocation percentage and by adding expected inflation. Best estimates of arithmetic real rates of return for each major asset class included in the pension plan’s target asset allocation as of January 1, 2017 are summarized in the following table:
Long-Term Expected Long-Term ExpectedAsset Class Asset Allocation Real Rate of Return
U.S. equity……………………… 26.50% 7.50%Developed markets equity……… 16.00% 7.30%Emerging markets equity……… 4.00% 9.80%Core bonds……………………… 11.50% 4.20%Foreign bonds…………………… 3.00% 2.40%Emerging markets bonds……… 4.00% 5.50%High yield bonds………………… 4.00% 6.00%Bank loans……………………… 3.00% 5.50%Private equity…………………… 10.00% 9.60%Real estate……………………… 10.00% 6.90%Natural resources……………… 1.00% 7.00%Infrastructure…………………… 2.00% 7.80%Hedge fund of funds…………… 4.00% 5.30%Cash……………………………… 1.00% 2.80%
Total Asset Allocation…………… 100.00%
Rate of Return For the year ended December 31, 2016, the annual money-weighted rate of return on pension plan investments, net of pension plan investment expense, was 7.40%. The money-weighted rate of return expresses investment performance, net of investment expense, adjusted for the changing amounts actually invested. Discount Rate The discount rate used to measure the total pension liability was 8.00%. The projection of cash flows used to determine the discount rate assumed plan member contributions will be made at the current contribution rate and that contributions will be made at rates equal to the actuarially determined contribution rate. Based on those assumptions, the pension plan’s fiduciary net position was projected to be available to make all projected future benefit payments of current plan members. Therefore, the long-term expected rate of return on pension plan investments was applied to all periods of projected benefit payments to determine the total pension liability. Sensitivity of the net pension liability to changes in the discount rate – The following presents the net pension liability, calculated using the discount rate of 8.00%, as well as what the net pension liability would be if it were calculated using a discount rate that is 1-percentage-point lower (7.00%) or 1-percentage-point higher (9.00%) than the current rate:
Current1% Decrease Discount Rate 1% Increase
(7.00%) (8.00%) (9.00%)
The Town's proportionate share of the net pension liability……………………………$ 40,880,824 $ 32,703,852 $ 25,733,304

Notes to Basic Financial Statements Year Ended June 30, 2017
Town of Duxbury, Massachusetts 67 Comprehensive Annual Financial Report
Changes in Assumptions and Plan Provisions The following changes in assumptions were included in the January 1, 2017 actuarial valuation:
• Cost of living increases were 3.0% of the first $14,000 of retirement income, as compared to $13,000 in the prior year.
• The annual rate of both pre-retirement and beneficiary mortality was changed to the RP-2014 Blue Collar Mortality with Scale MP-2016, fully generational table.
• The mortality for retired group 1 and 2 members was changed to the RP-2014 Blue Collar Mortality Table set forward five years for males and 3 years for females, fully generational. Group 4 retired members were changed to the RP-2014 Blue Collar Mortality table set forward three years for males, and six years for females, fully generational.
• The assumed family composition was changed to assume that 80% of all male members and 60% of all female members will be survived by a spouse, as compared to the prior valuation assumption that 80% of all members will be survived by a spouse.
• The amortization method changed from the level percent open group method to a method where payments increase at 3.5% for the unfunded actuarial accrued liability and level amortization for the 2002, 2003 and 2013 ERI.
• The amortization period changed from 17 years to amortization of the unfunded liability over 12 years, the 2002 ERI over 2 years, the 2003 ERI over 3 years, and the 2013 ERI over 11 years.
• The assumed annual increase in administrative expenses was changed to 3.75%, from 4.00%. There were no changes in plan provisions in the January 1, 2017 actuarial valuation. NOTE 12 – POSTEMPLOYMENT BENEFITS OTHER THAN PENSIONS Plan Description – The Town of Duxbury administers a single-employer defined benefit healthcare plan (Plan). The Plan provides lifetime healthcare and life insurance for eligible retirees and their spouses through the Town’s group health and life insurance plans, which covers both active and retired members. Chapter 32B of the MGL assigns authority to establish and amend benefit provisions of the plan. Benefit provisions are negotiated between the Town and the unions representing Town employees and are renegotiated each bargaining period. The Retiree Health Plan does not issue a publicly available financial report.
Funding Policy – Contribution requirements are also negotiated between the Town and union representatives. The required contribution is based on a pay-as-you-go financing requirement. The Town contributes 50% of the cost of current-year premiums for eligible retired plan members and their spouses. Plan members receiving benefits contribute the remaining 50% of their premium costs. Administrative costs of the plan are assumed to be included in plan premiums. For 2017, the Town contributed approximately $1.9 million to the plan. For the year ended June 30, 2017, the Town’s average contribution rate was 4.52% of covered-employee payroll. The Commonwealth of Massachusetts passed special legislation that has allowed the Town to establish a postemployment benefit trust fund and to enable the Town to raise taxes necessary to begin pre-funding its OPEB liabilities. During 2017, the Town pre-funded future OPEB liabilities totaling approximately $300,000 by contributing funds to the Other Postemployment Benefit Fund in excess of the pay-as-you-go required contribution. These funds are reported within the Fiduciary Funds financial statements. As of June 30, 2017, the balance of this fund totaled $1.8 million.
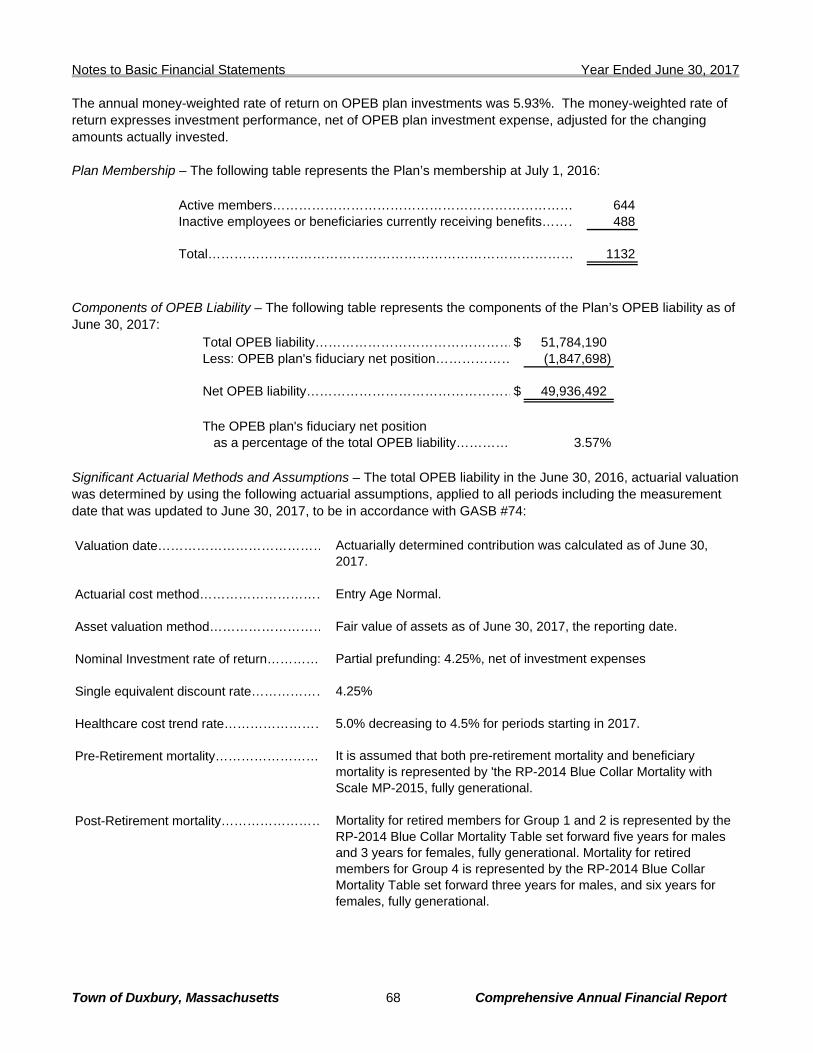
Notes to Basic Financial Statements Year Ended June 30, 2017
Town of Duxbury, Massachusetts 68 Comprehensive Annual Financial Report
The annual money-weighted rate of return on OPEB plan investments was 5.93%. The money-weighted rate of return expresses investment performance, net of OPEB plan investment expense, adjusted for the changing amounts actually invested. Plan Membership – The following table represents the Plan’s membership at July 1, 2016:
Active members…………………………………………………………… 644Inactive employees or beneficiaries currently receiving benefits……… 488
Total………………………………………………………………………… 1132
Components of OPEB Liability – The following table represents the components of the Plan’s OPEB liability as of June 30, 2017:
Total OPEB liability………………………………………$ 51,784,190 Less: OPEB plan's fiduciary net position……………… (1,847,698)
Net OPEB liability…………………………………………$ 49,936,492
The OPEB plan's fiduciary net position as a percentage of the total OPEB liability…………… 3.57%
Significant Actuarial Methods and Assumptions – The total OPEB liability in the June 30, 2016, actuarial valuation was determined by using the following actuarial assumptions, applied to all periods including the measurement date that was updated to June 30, 2017, to be in accordance with GASB #74: Valuation date…………………………………
Actuarially determined contribution was calculated as of June 30, 2017.
Actuarial cost method………………………… Entry Age Normal.
Asset valuation method……………………… Fair value of assets as of June 30, 2017, the reporting date.
Nominal Investment rate of return………… Partial prefunding: 4.25%, net of investment expenses
Single equivalent discount rate……………… 4.25%
Healthcare cost trend rate…………………… 5.0% decreasing to 4.5% for periods starting in 2017.
Pre-Retirement mortality……………………
It is assumed that both pre-retirement mortality and beneficiary mortality is represented by 'the RP-2014 Blue Collar Mortality with Scale MP-2015, fully generational.
Post-Retirement mortality……………………
Mortality for retired members for Group 1 and 2 is represented by the RP-2014 Blue Collar Mortality Table set forward five years for males and 3 years for females, fully generational. Mortality for retired members for Group 4 is represented by the RP-2014 Blue Collar Mortality Table set forward three years for males, and six years for females, fully generational.

Notes to Basic Financial Statements Year Ended June 30, 2017
Town of Duxbury, Massachusetts 69 Comprehensive Annual Financial Report
Disabled mortality……………………………
Mortality for disabled members for Group 4 is represented by the RP-2000 Mortality Table set forward two years. Generational adjusting is based on Scale MP-2015.
Investment Policy The Town’s policy in regard to the allocation of invested assets is established and may be amended by the Board of Selectmen by a majority vote of its members. The OPEB plan’s assets are managed on a total return basis with a long-term objective of achieving and maintaining a fully funded status for the benefits provided through the OPEB plan. The long-term real rate of return on OPEB investments was determined using the Town’s investment policy. The long-term expected rate of return on OPEB plan investments was determined using a building-block method in which best-estimate ranges of expected future real of returns (expected returns, net of pension plan investment expense and inflation) are developed for each major asset class. These ranges are combined to produce the long-term expected rate of return of by weighting the expected future real rates of return by the target asset allocation percentage and by adding expected inflation. Best estimates of geometric real rates of return for each major asset class included in the OPEB plan’s target asset allocation as of June 30, 2017, are summarized in the following table:
Long-Term Expected Long-Term ExpectedAsset Class Asset Allocation Real Rate of Return
Domestic Equity - Large Cap………………… 44.00% 4.66%Domestic Equity - Small/Mid Cap…………… 8.00% 1.02%International Equity - Developed Market…… 9.00% 0.94%International Equity - Emerging Market……… 3.00% 0.44%Domestic Fixed Income……………………… 22.00% 0.92%International Fixed Income…………………… 3.00% 0.13%Alternatives…………………………………… 9.00% 0.70%Real Estate……………………………………… 2.00% 0.25%
Total Asset Allocation………………….……… 100.00%
The Town’s net other postemployment benefits liability was determined based on a projection of employer and employee contributions, benefit payments (with and without subsidy), expenses and the long-term expected rate of return on the other postemployment trust assets which resulted in a selected discount rate of 4.25%. Sensitivity of the net other postemployment benefit liability to changes in the discount rate – The following table presents the net other postemployment benefit liability and service cost, calculated using the discount rate of 4.25%, as well as what the net other postemployment benefit liability and service cost would be if it were calculated using a discount rate that is 1-percentage-point lower (3.25%) or 1-percentage-point higher (5.25%) than the current rate.
Current1% Decrease Discount Rate 1% Increase
(3.25%) (4.25%) (5.25%)
Net OPEB liability……………………$ 58,672,900 $ 49,936,492 $ 42,953,932

Notes to Basic Financial Statements Year Ended June 30, 2017
Town of Duxbury, Massachusetts 70 Comprehensive Annual Financial Report
Sensitivity of the net other postemployment benefit liability to changes in the healthcare trend – The following table presents the net other postemployment benefit liability and service cost, calculated using the current healthcare trend rate of 5.00%, as well as what the net other postemployment benefit liability and service cost would be if it were calculated using a healthcare trend rate that is 1-percentage-point lower (4.00%) or 1-percentage-point higher (6.00%).
1% Decrease Current Trend 1% Increase(4.00%) (5.00%) (6.00%)
Net OPEB liability……………………$ 41,725,741 $ 49,936,492 $ 60,592,374
Changes in Assumptions and Plan Provisions There were no changes in assumptions or plan provisions in the January 30, 2017 actuarial valuation. Annual OPEB Cost and Net OPEB Obligation – The Town’s annual other postemployment benefit (OPEB) cost (expense) is calculated based on the annual required contribution of the employer (ARC), an amount actuarially determined in accordance with the parameters of GASB Statement 45. The ARC represents a level of funding that, if paid on an ongoing basis, is projected to cover the normal cost each year and amortize any unfunded actuarial liabilities (or funding excess) over a period not to exceed thirty years. The components of the Town’s annual OPEB cost for the year, the amount actually contributed to the plan, and changes in the Town’s net OPEB obligation are summarized in the following table:
Annual Required Contribution………..…………………………$ 3,022,313 Interest on net OPEB obligation……………………………… 1,880,212 Adjustment to annual required contribution…………………… (1,490,325) Annual OPEB Cost (expense)………………………………… 3,412,200
Annual Employer Contributions………………………………… (1,992,355)
Increase/Decrease in net OPEB obligation…………………… 1,419,845
Net OPEB obligation - beginning of year……………………… 31,336,874
Net OPEB obligation - end of year…………………………… $ 32,756,719
The Town’s annual OPEB cost, the percentage of annual OPEB cost contributed to the plan, and the net OPEB obligation for 2017 was as follows:
Percentage ofYear Annual Annual OPEB Net OPEB
Ended OPEB Cost Cost Contributed Obligation
6/30/2017 $ 3,412,200 58% $ 32,756,719 6/30/2016 3,280,022 58% 31,336,874 6/30/2015 4,071,142 56% 29,965,807
Funded Status and Funding Progress – As of June 30, 2016, the most recent actuarial valuation date, the actuarial accrued liability for benefits was $41.2 million. The actuarial value of assets for the plan was $1.4 million, or 4%. The remaining $39.8 million was unfunded. The covered payroll (annual payroll of active employees covered by the plan) was $42.6 million, and the ratio of the UAAL to the covered payroll was 93.4%.
Notes to Basic Financial Statements Year Ended June 30, 2017
Town of Duxbury, Massachusetts 71 Comprehensive Annual Financial Report
Actuarial valuations of an ongoing plan involve estimates of the value of reported amounts and assumptions about the probability of occurrence of events far into the future. Examples include assumptions about future employment, mortality, and the healthcare cost trend. Amounts determined regarding the funded status of the plan and the annual required contributions of the employer are subject to continual revision as actual results are compared with past expectations and new estimates are made about the future. The schedule of funding progress, presented as required supplementary information following the notes to the financial statements, presents multiyear trend information about whether the actuarial value of plan assets is increasing or decreasing over time relative to the actuarial accrued liabilities for benefits. Actuarial Methods and Assumptions – Projections of benefits for financial reporting purposes are based on the substantive plan (the plan as understood by the employer and the plan members) and include the types of benefits provided at the time of each valuation and the historical pattern of sharing of benefit costs between the employer and plan members to that point. The actuarial methods and assumptions used include techniques that are designed to reduce the effects of short-term volatility in actuarial accrued liabilities and the actuarial value of assets, consistent with the long-term perspective of the calculations. In the June 30, 2016, actuarial valuation, actuarial liabilities were determined using the projected unit credit cost method. The actuarial assumptions included a 6.0% partially funded rate of return, net of investment expenses; 3.25% projected salary increases; and an annual medical/drug cost trend rate of 5.5% initially, graded to 4.5% over 3 years, and an inflation rate of 3.25%. The UAAL is being amortized over an open 30 year period using a level percent of pay. The asset valuation method being used is market value. The remaining amortization period at June 30, 2017, is 30 years. NOTE 13 – COMMITMENTS AND CONTINGENCIES The Town participates in a number of federal award programs. Although the grant programs have been audited in accordance with the provisions of Title 2 U.S. Code of Federal Regulations Part 200, Uniform Administrative Requirements, Cost Principles, and Audit Requirements for Federal Awards through June 30, 2017, these programs are still subject to financial and compliance audits. The amount, if any, of expenditures which may be disallowed by the granting agencies cannot be determined at this time, although it is expected such amounts, if any, to be immaterial. Various legal actions and claims are pending. Litigation is subject to many uncertainties, and the outcome of individual litigated matters is not always predictable. Although the amount of liability, if any, at June 30, 2017, cannot be ascertained, management believes any resulting liability should not materially affect the financial position at June 30, 2017. NOTE 14 – PERCY WALKER POOL ENTERPRISE FUND RECLASSIFICATION The rates at the Percy Walker Pool are not set to recover 100% of the cost of the pools operations, therefore, Town Meeting voted to revoke the enterprise provisions of Massachusetts General Law Chapter 44, Section 53F½ which terminated the Percy Walker Pool enterprise fund as of June 30, 2017. The Percy Walker Pool Enterprise Fund’s net position on June 30, 2017, of $404,637, was transferred to Governmental Activities as a special item. All current financial resources were transferred to the General Fund. All assets, deferred outflows of resources, liabilities, and deferred inflows of resources previously reported within the Enterprise Fund are now reported in the Governmental Activities and the General Fund.
Notes to Basic Financial Statements Year Ended June 30, 2017
Town of Duxbury, Massachusetts 72 Comprehensive Annual Financial Report
NOTE 15 – SUBSEQUENT EVENTS Management has evaluated subsequent events through December 22, 2017, which is the date the financial statements were available to be issued. NOTE 16 – IMPLEMENTATION OF NEW GASB PRONOUNCEMENTS During 2017, the following GASB pronouncements were implemented:
• GASB Statement #74, Financial Reporting for Postemployment Benefit Plans Other Than Pension Plans. The basic financial statements, related notes and required supplementary information were updated to be in compliance with this pronouncement.
• GASB Statement #77, Tax Abatement Disclosures. This pronouncement did not impact the basic financial statements.
• GASB Statement #78, Pensions Provided through Certain Multiple-Employer Defined Benefit Pension Plans. This pronouncement did not impact the basic financial statements.
• GASB Statement #80, Blending Requirements for Certain Component Units – an amendment of GASB Statement #14. This pronouncement did not impact the basic financial statements.
• GASB Statement #82, Pension Issues – an amendment of GASB Statements #67, #68, and #73. The basic financial statements and related notes were updated to be in compliance with this pronouncement.
The following GASB pronouncements will be implemented in the future:
• The GASB issued Statement #75, Accounting and Financial Reporting for Postemployment Benefits Other Than Pensions, which is required to be implemented in 2018.
• The GASB issued Statement #81, Irrevocable Split-Interest Agreements, which is required to be implemented in 2018.
• The GASB issued Statement #83, Certain Asset Retirement Obligations, which is required to be implemented in 2019.
• The GASB issued Statement #84, Fiduciary Activities, which is required to be implemented in 2020.
• The GASB issued Statement #85, Omnibus 2017, which is required to be implemented in 2018.
• The GASB issued Statement #86, Certain Debt Extinguishment Issues, which is required to be
implemented in 2018.
• The GASB issued Statement #87, Leases, which is required to be implemented in 2021.
Management is currently assessing the impact the implementation of these pronouncements will have on the basic financial statements.

Town of Duxbury, Massachusetts 73 Comprehensive Annual Financial Report
Required Supplementary Information
Required Supplementary Information

Town of Duxbury, Massachusetts 74 Comprehensive Annual Financial Report
General Fund Budgetary Comparison Schedule
The General Fund is the general operating fund of the Town. It is used to account for all the financial resources, except those required to be accounted for in another fund.
General Fund Budgetary Comparison Schedule
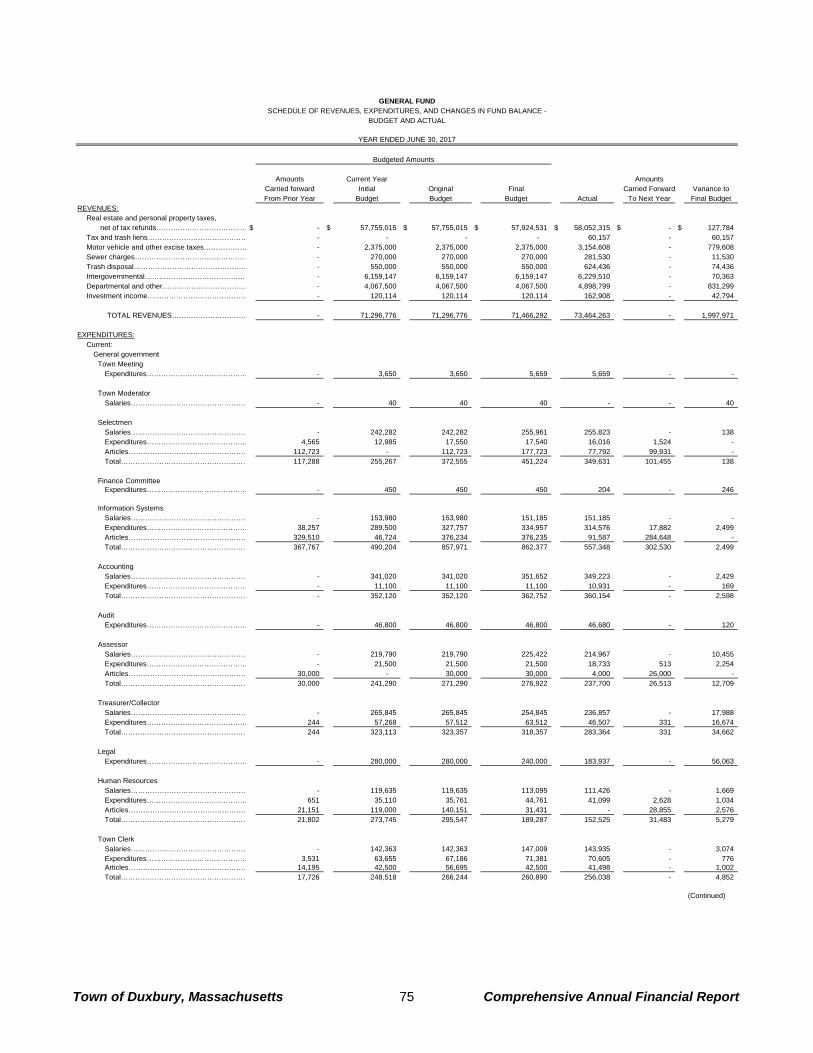
Amounts Current Year AmountsCarried forward Initial Original Final Carried Forward Variance toFrom Prior Year Budget Budget Budget Actual To Next Year Final Budget
REVENUES: Real estate and personal property taxes,
net of tax refunds…………………………………$ - $ 57,755,015 $ 57,755,015 $ 57,924,531 $ 58,052,315 $ - $ 127,784 Tax and trash liens…………………………………… - - - - 60,157 - 60,157 Motor vehicle and other excise taxes……………… - 2,375,000 2,375,000 2,375,000 3,154,608 - 779,608 Sewer charges………………………………………… - 270,000 270,000 270,000 281,530 - 11,530 Trash disposal………………………………………… - 550,000 550,000 550,000 624,436 - 74,436 Intergovernmental……………………………………… - 6,159,147 6,159,147 6,159,147 6,229,510 - 70,363 Departmental and other……………………………… - 4,067,500 4,067,500 4,067,500 4,898,799 - 831,299 Investment income…………………………………… - 120,114 120,114 120,114 162,908 - 42,794
TOTAL REVENUES…………………………… - 71,296,776 71,296,776 71,466,292 73,464,263 - 1,997,971
EXPENDITURES:
Current: General government
Town Meeting Expenditures…………………………………… - 3,650 3,650 5,659 5,659 - -
Town Moderator
Salaries………………………………………… - 40 40 40 - - 40
Selectmen Salaries………………………………………… - 242,282 242,282 255,961 255,823 - 138 Expenditures…………………………………… 4,565 12,985 17,550 17,540 16,016 1,524 - Articles…………………………………………… 112,723 - 112,723 177,723 77,792 99,931 - Total……………………………………………… 117,288 255,267 372,555 451,224 349,631 101,455 138
Finance Committee
Expenditures…………………………………… - 450 450 450 204 - 246
Information Systems Salaries………………………………………… - 153,980 153,980 151,185 151,185 - - Expenditures…………………………………… 38,257 289,500 327,757 334,957 314,576 17,882 2,499 Articles…………………………………………… 329,510 46,724 376,234 376,235 91,587 284,648 - Total……………………………………………… 367,767 490,204 857,971 862,377 557,348 302,530 2,499
Accounting Salaries………………………………………… - 341,020 341,020 351,652 349,223 - 2,429 Expenditures…………………………………… - 11,100 11,100 11,100 10,931 - 169 Total……………………………………………… - 352,120 352,120 362,752 360,154 - 2,598
Audit
Expenditures…………………………………… - 46,800 46,800 46,800 46,680 - 120
Assessor Salaries………………………………………… - 219,790 219,790 225,422 214,967 - 10,455 Expenditures…………………………………… - 21,500 21,500 21,500 18,733 513 2,254 Articles…………………………………………… 30,000 - 30,000 30,000 4,000 26,000 - Total……………………………………………… 30,000 241,290 271,290 276,922 237,700 26,513 12,709
Treasurer/Collector
Salaries………………………………………… - 265,845 265,845 254,845 236,857 - 17,988 Expenditures…………………………………… 244 57,268 57,512 63,512 46,507 331 16,674 Total……………………………………………… 244 323,113 323,357 318,357 283,364 331 34,662
Legal
Expenditures…………………………………… - 280,000 280,000 240,000 183,937 - 56,063
Human Resources Salaries………………………………………… - 119,635 119,635 113,095 111,426 - 1,669 Expenditures…………………………………… 651 35,110 35,761 44,761 41,099 2,628 1,034 Articles…………………………………………… 21,151 119,000 140,151 31,431 - 28,855 2,576 Total……………………………………………… 21,802 273,745 295,547 189,287 152,525 31,483 5,279
Town Clerk
Salaries………………………………………… - 142,363 142,363 147,009 143,935 - 3,074 Expenditures…………………………………… 3,531 63,655 67,186 71,381 70,605 - 776 Articles…………………………………………… 14,195 42,500 56,695 42,500 41,498 - 1,002 Total……………………………………………… 17,726 248,518 266,244 260,890 256,038 - 4,852
(Continued)
GENERAL FUNDSCHEDULE OF REVENUES, EXPENDITURES, AND CHANGES IN FUND BALANCE -
BUDGET AND ACTUAL
YEAR ENDED JUNE 30, 2017
Budgeted Amounts
Town of Duxbury, Massachusetts 75 Comprehensive Annual Financial Report
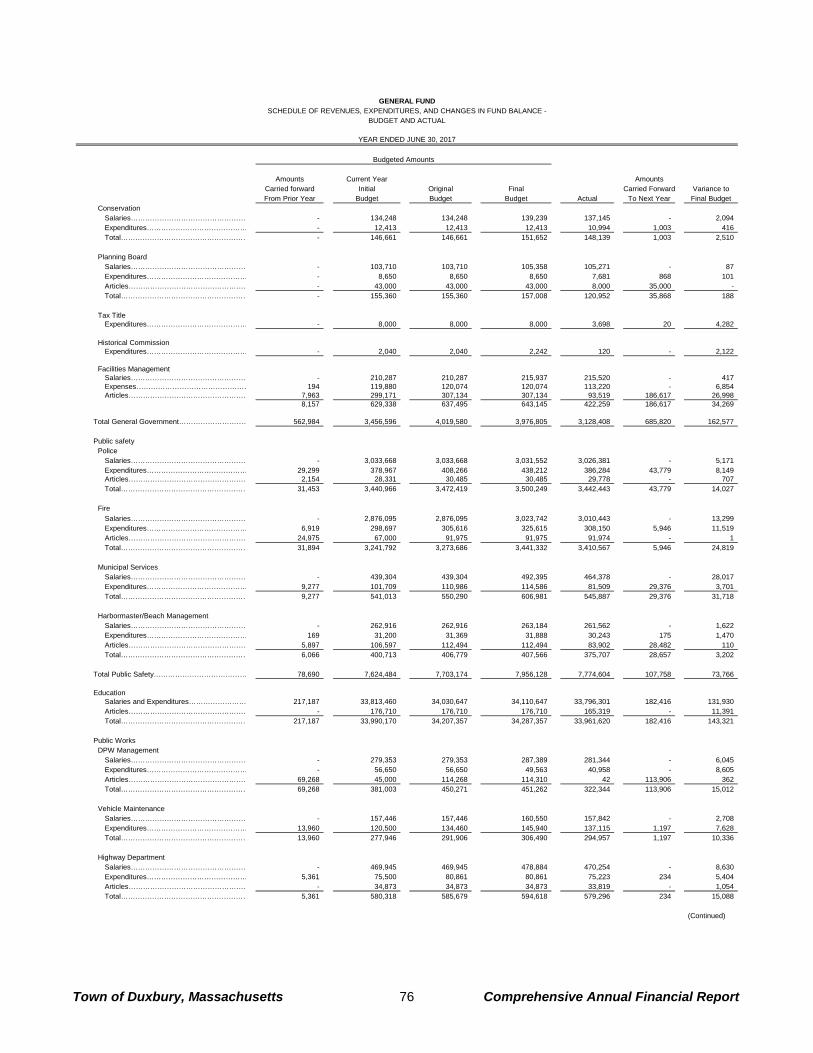
Amounts Current Year AmountsCarried forward Initial Original Final Carried Forward Variance toFrom Prior Year Budget Budget Budget Actual To Next Year Final Budget
GENERAL FUNDSCHEDULE OF REVENUES, EXPENDITURES, AND CHANGES IN FUND BALANCE -
BUDGET AND ACTUAL
YEAR ENDED JUNE 30, 2017
Budgeted Amounts
Conservation Salaries………………………………………… - 134,248 134,248 139,239 137,145 - 2,094 Expenditures…………………………………… - 12,413 12,413 12,413 10,994 1,003 416 Total……………………………………………… - 146,661 146,661 151,652 148,139 1,003 2,510
Planning Board
Salaries………………………………………… - 103,710 103,710 105,358 105,271 - 87 Expenditures…………………………………… - 8,650 8,650 8,650 7,681 868 101 Articles…………………………………………… - 43,000 43,000 43,000 8,000 35,000 - Total……………………………………………… - 155,360 155,360 157,008 120,952 35,868 188
Tax Title
Expenditures…………………………………… - 8,000 8,000 8,000 3,698 20 4,282
Historical Commission Expenditures…………………………………… - 2,040 2,040 2,242 120 - 2,122
Facilities ManagementSalaries………………………………………… - 210,287 210,287 215,937 215,520 - 417 Expenses………………………………………… 194 119,880 120,074 120,074 113,220 - 6,854 Articles…………………………………………… 7,963 299,171 307,134 307,134 93,519 186,617 26,998
8,157 629,338 637,495 643,145 422,259 186,617 34,269
Total General Government………………………… 562,984 3,456,596 4,019,580 3,976,805 3,128,408 685,820 162,577
Public safety Police
Salaries………………………………………… - 3,033,668 3,033,668 3,031,552 3,026,381 - 5,171 Expenditures…………………………………… 29,299 378,967 408,266 438,212 386,284 43,779 8,149 Articles…………………………………………… 2,154 28,331 30,485 30,485 29,778 - 707 Total……………………………………………… 31,453 3,440,966 3,472,419 3,500,249 3,442,443 43,779 14,027
Fire
Salaries………………………………………… - 2,876,095 2,876,095 3,023,742 3,010,443 - 13,299 Expenditures…………………………………… 6,919 298,697 305,616 325,615 308,150 5,946 11,519 Articles…………………………………………… 24,975 67,000 91,975 91,975 91,974 - 1 Total……………………………………………… 31,894 3,241,792 3,273,686 3,441,332 3,410,567 5,946 24,819
Municipal Services
Salaries………………………………………… - 439,304 439,304 492,395 464,378 - 28,017 Expenditures…………………………………… 9,277 101,709 110,986 114,586 81,509 29,376 3,701 Total……………………………………………… 9,277 541,013 550,290 606,981 545,887 29,376 31,718
Harbormaster/Beach Management Salaries………………………………………… - 262,916 262,916 263,184 261,562 - 1,622 Expenditures…………………………………… 169 31,200 31,369 31,888 30,243 175 1,470 Articles…………………………………………… 5,897 106,597 112,494 112,494 83,902 28,482 110 Total……………………………………………… 6,066 400,713 406,779 407,566 375,707 28,657 3,202
Total Public Safety………………………………… 78,690 7,624,484 7,703,174 7,956,128 7,774,604 107,758 73,766
Education
Salaries and Expenditures…………………… 217,187 33,813,460 34,030,647 34,110,647 33,796,301 182,416 131,930 Articles…………………………………………… - 176,710 176,710 176,710 165,319 - 11,391 Total……………………………………………… 217,187 33,990,170 34,207,357 34,287,357 33,961,620 182,416 143,321
Public Works DPW Management
Salaries………………………………………… - 279,353 279,353 287,389 281,344 - 6,045 Expenditures…………………………………… - 56,650 56,650 49,563 40,958 - 8,605 Articles…………………………………………… 69,268 45,000 114,268 114,310 42 113,906 362 Total……………………………………………… 69,268 381,003 450,271 451,262 322,344 113,906 15,012
Vehicle Maintenance Salaries………………………………………… - 157,446 157,446 160,550 157,842 - 2,708 Expenditures…………………………………… 13,960 120,500 134,460 145,940 137,115 1,197 7,628 Total……………………………………………… 13,960 277,946 291,906 306,490 294,957 1,197 10,336
Highway Department Salaries………………………………………… - 469,945 469,945 478,884 470,254 - 8,630 Expenditures…………………………………… 5,361 75,500 80,861 80,861 75,223 234 5,404 Articles…………………………………………… - 34,873 34,873 34,873 33,819 - 1,054 Total……………………………………………… 5,361 580,318 585,679 594,618 579,296 234 15,088
(Continued)
Town of Duxbury, Massachusetts 76 Comprehensive Annual Financial Report
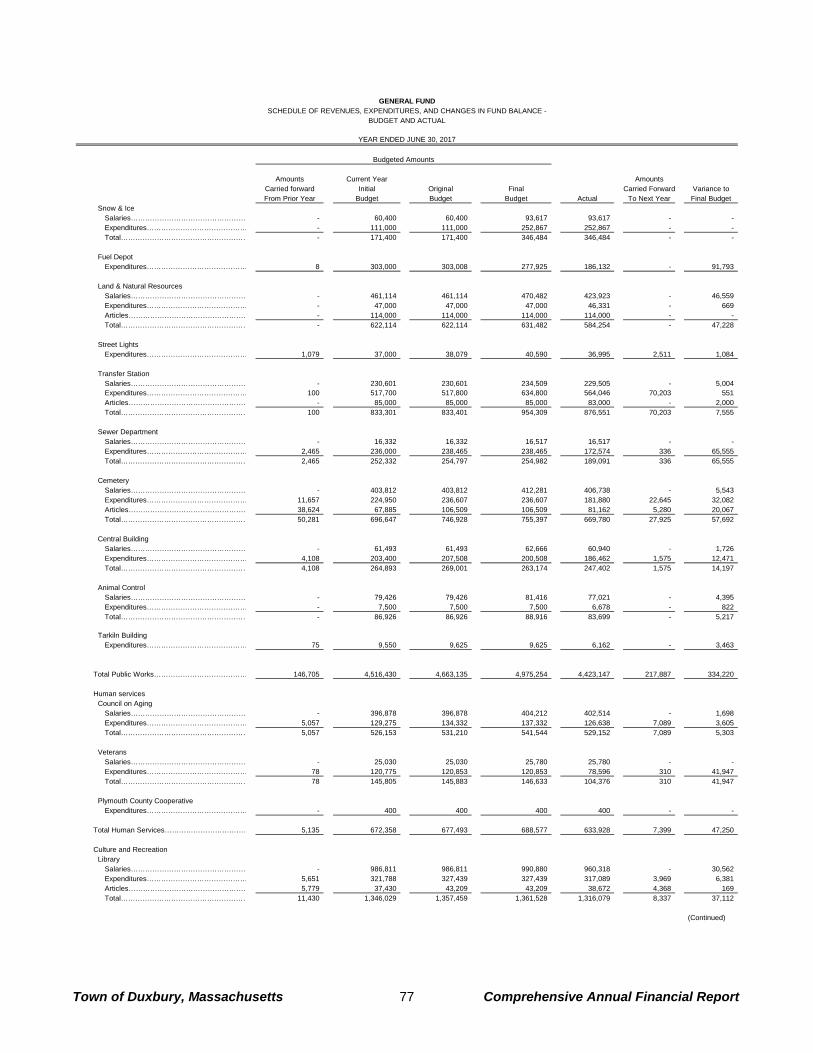
Amounts Current Year AmountsCarried forward Initial Original Final Carried Forward Variance toFrom Prior Year Budget Budget Budget Actual To Next Year Final Budget
GENERAL FUNDSCHEDULE OF REVENUES, EXPENDITURES, AND CHANGES IN FUND BALANCE -
BUDGET AND ACTUAL
YEAR ENDED JUNE 30, 2017
Budgeted Amounts
Snow & Ice Salaries………………………………………… - 60,400 60,400 93,617 93,617 - - Expenditures…………………………………… - 111,000 111,000 252,867 252,867 - - Total……………………………………………… - 171,400 171,400 346,484 346,484 - -
Fuel Depot
Expenditures…………………………………… 8 303,000 303,008 277,925 186,132 - 91,793
Land & Natural Resources Salaries………………………………………… - 461,114 461,114 470,482 423,923 - 46,559 Expenditures…………………………………… - 47,000 47,000 47,000 46,331 - 669 Articles…………………………………………… - 114,000 114,000 114,000 114,000 - - Total……………………………………………… - 622,114 622,114 631,482 584,254 - 47,228
Street Lights Expenditures…………………………………… 1,079 37,000 38,079 40,590 36,995 2,511 1,084
Transfer Station
Salaries………………………………………… - 230,601 230,601 234,509 229,505 - 5,004 Expenditures…………………………………… 100 517,700 517,800 634,800 564,046 70,203 551 Articles…………………………………………… - 85,000 85,000 85,000 83,000 - 2,000 Total……………………………………………… 100 833,301 833,401 954,309 876,551 70,203 7,555
Sewer Department
Salaries………………………………………… - 16,332 16,332 16,517 16,517 - - Expenditures…………………………………… 2,465 236,000 238,465 238,465 172,574 336 65,555 Total……………………………………………… 2,465 252,332 254,797 254,982 189,091 336 65,555
Cemetery Salaries………………………………………… - 403,812 403,812 412,281 406,738 - 5,543 Expenditures…………………………………… 11,657 224,950 236,607 236,607 181,880 22,645 32,082 Articles…………………………………………… 38,624 67,885 106,509 106,509 81,162 5,280 20,067 Total……………………………………………… 50,281 696,647 746,928 755,397 669,780 27,925 57,692
Central Building
Salaries………………………………………… - 61,493 61,493 62,666 60,940 - 1,726 Expenditures…………………………………… 4,108 203,400 207,508 200,508 186,462 1,575 12,471 Total……………………………………………… 4,108 264,893 269,001 263,174 247,402 1,575 14,197
Animal Control
Salaries………………………………………… - 79,426 79,426 81,416 77,021 - 4,395 Expenditures…………………………………… - 7,500 7,500 7,500 6,678 - 822 Total……………………………………………… - 86,926 86,926 88,916 83,699 - 5,217
Tarkiln Building
Expenditures…………………………………… 75 9,550 9,625 9,625 6,162 - 3,463
Total Public Works………………………………… 146,705 4,516,430 4,663,135 4,975,254 4,423,147 217,887 334,220
Human services Council on Aging
Salaries………………………………………… - 396,878 396,878 404,212 402,514 - 1,698 Expenditures…………………………………… 5,057 129,275 134,332 137,332 126,638 7,089 3,605 Total……………………………………………… 5,057 526,153 531,210 541,544 529,152 7,089 5,303
Veterans
Salaries………………………………………… - 25,030 25,030 25,780 25,780 - - Expenditures…………………………………… 78 120,775 120,853 120,853 78,596 310 41,947 Total……………………………………………… 78 145,805 145,883 146,633 104,376 310 41,947
Plymouth County Cooperative
Expenditures…………………………………… - 400 400 400 400 - -
Total Human Services……………………………… 5,135 672,358 677,493 688,577 633,928 7,399 47,250
Culture and Recreation Library
Salaries………………………………………… - 986,811 986,811 990,880 960,318 - 30,562 Expenditures…………………………………… 5,651 321,788 327,439 327,439 317,089 3,969 6,381 Articles…………………………………………… 5,779 37,430 43,209 43,209 38,672 4,368 169 Total……………………………………………… 11,430 1,346,029 1,357,459 1,361,528 1,316,079 8,337 37,112
(Continued)
Town of Duxbury, Massachusetts 77 Comprehensive Annual Financial Report

Amounts Current Year AmountsCarried forward Initial Original Final Carried Forward Variance toFrom Prior Year Budget Budget Budget Actual To Next Year Final Budget
GENERAL FUNDSCHEDULE OF REVENUES, EXPENDITURES, AND CHANGES IN FUND BALANCE -
BUDGET AND ACTUAL
YEAR ENDED JUNE 30, 2017
Budgeted Amounts
Recreation Salaries………………………………………… - 171,790 171,790 183,272 182,791 - 481 Expenditures…………………………………… - 850 850 850 840 - 10 Articles…………………………………………… - 660,000 660,000 660,000 660,000 - - Total……………………………………………… - 832,640 832,640 844,122 843,631 - 491
North Hill
Expenditures…………………………………… - 1,500 1,500 1,500 1,226 - 274 Articles…………………………………………… 104,275 - 104,275 104,275 97,725 4,275 2,275 Total……………………………………………… 104,275 1,500 105,775 105,775 98,951 4,275 2,549
Lifeguards Salaries………………………………………… - 20,160 20,160 20,160 17,933 - 2,227 Expenditures…………………………………… - 1,500 1,500 1,500 1,451 - 49 Total……………………………………………… - 21,660 21,660 21,660 19,384 - 2,276
Public Celebrations
Expenditures…………………………………… 202 - 202 - - - - Articles…………………………………………… - 15,000 15,000 - - - - Total……………………………………………… 202 15,000 15,202 - - - -
Total Culture and Recreation……………………… 115,907 2,216,829 2,332,736 2,333,085 2,278,045 12,612 42,428
Pension Benefits Contributory Retirement……………………… - 3,146,762 3,146,762 3,146,762 3,146,762 - - Non-Contributory Retirement………………… - 20,000 20,000 20,000 19,946 - 54 Total……………………………………………… - 3,166,762 3,166,762 3,166,762 3,166,708 - 54
Property and Liability Insurance…………………… 500 481,363 481,863 456,863 410,395 - 46,468
Employee Benefits………………………………… - 7,270,000 7,270,000 7,782,092 7,777,298 - 4,794
Claims and judgments……………………………… - 333,767 333,767 - - - -
Reserve fund………………………………………… - 115,000 115,000 480 - - 480
State and County Charges…………………………… - 527,872 527,872 527,872 500,171 - 27,701
Debt ServiceDebt Service Principal……………………………… - 5,552,518 5,552,518 5,552,518 5,552,518 - - Debt Service Interest……………………………… - 2,935,767 2,935,767 2,920,167 2,900,403 - 19,764
Total…………………………………………………… - 8,488,285 8,488,285 8,472,685 8,452,921 - 19,764
TOTAL EXPENDITURES…………………… 1,127,108 72,859,916 73,987,024 74,623,960 72,507,245 1,213,892 902,823
EXCESS (DEFICIENCY) OF REVENUES OVER (UNDER) EXPENDITURES…………………… (1,127,108) (1,563,140) (2,690,248) (3,157,668) 957,018 (1,213,892) 2,900,794
OTHER FINANCING SOURCES (USES):
Premium from issuance of bonds…………………… - - - - 2,918 - 2,918 Sale of capital assets………………………………… - - - - 4,440 - 4,440 Transfers in…………………………………………… - 340,783 340,783 340,783 400,072 - 59,289 Transfers out…………………………………………… - (373,661) (373,661) (1,542,881) (1,542,881) - -
TOTAL OTHER FINANCING SOURCES (USES)……………………… - (32,878) (32,878) (1,202,098) (1,135,451) - 66,647
NET CHANGE IN FUND BALANCE…………………… (1,127,108) (1,596,018) (2,723,126) (4,359,766) (178,433) (1,213,892) 2,967,441
BUDGETARY FUND BALANCE, Beginning of year… - 10,684,051 10,684,051 10,684,051 10,684,051 - -
BUDGETARY FUND BALANCE, End of year…………$ (1,127,108) $ 9,088,033 $ 7,960,925 $ 6,324,285 $ 10,505,618 $ (1,213,892) $ 2,967,441
(Concluded)See notes to required supplementary information.
Town of Duxbury, Massachusetts 78 Comprehensive Annual Financial Report

Town of Duxbury, Massachusetts 79 Comprehensive Annual Financial Report
Pension Plan Schedules
The Schedule of the Town’s Proportionate Share of the Net Pension Liability presents multi-year trend information on the Town’s net pension liability and related ratios. The Schedule of Town’s Contributions presents multi-year trend information on the Town’s required and actual contributions to the pension plan and related ratios. The Schedule of the Special Funding Amounts of the Net Pension Liability for the Massachusetts Teachers Contributory Retirement System presents multi-year trend information on the liability and expense assumed by the Commonwealth of Massachusetts on behalf of the Town along with related ratios. These schedules are intended to present information for ten years. Until a ten-year trend is compiled, information is presented for those years for which information is available Pension Plan Schedules

December 31, December 31, December 31,2014 2015 2016
Town's proportion of the net pension liability (asset)…………………… 4.951% 4.951% 5.162%
Town's proportionate share of the net pension liability (asset)…………$ 28,862,001 $ 31,402,963 $ 32,703,852
Town's covered employee payroll…………………………………………$ 15,363,907 $ 15,940,054 $ 16,118,261
Net pension liability as a percentage of covered-employeepayroll……………………………………………………………………… 187.86% 197.01% 202.90%
Plan fiduciary net position as a percentage of the total pension liability……………………………………………………… 58.88% 56.76% 58.32%
Note: this schedule is intended to present information for 10 years.Until a 10-year trend is compiled, information is presented for those years forwhich information is available.
See notes to required supplementary information.
SCHEDULE OF THE TOWN'S PROPORTIONATE SHAREOF THE NET PENSION LIABILITY
PLYMOUTH COUNTY CONTRIBUTORY RETIREMENT SYSTEM
Town of Duxbury, Massachusetts 80 Comprehensive Annual Financial Report
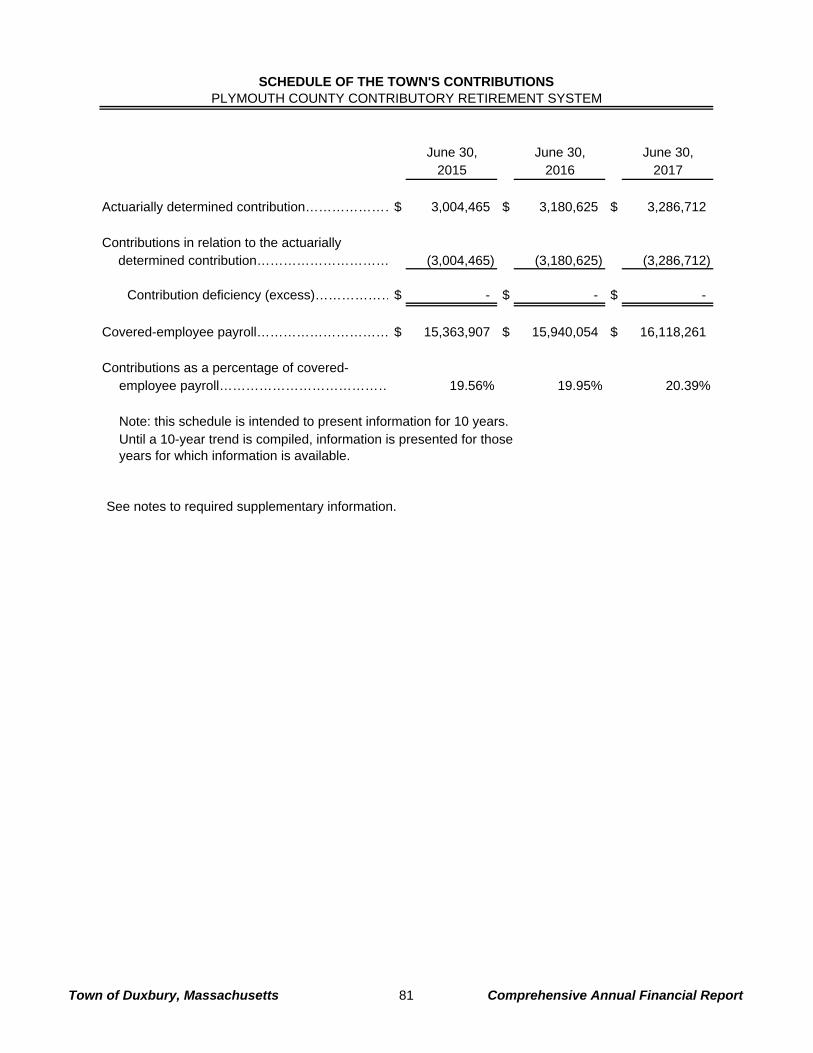
June 30, June 30, June 30,2015 2016 2017
Actuarially determined contribution…………………$ 3,004,465 $ 3,180,625 $ 3,286,712
Contributions in relation to the actuarially determined contribution………………………… (3,004,465) (3,180,625) (3,286,712)
Contribution deficiency (excess)………………$ - $ - $ -
Covered-employee payroll………………………… $ 15,363,907 $ 15,940,054 $ 16,118,261
Contributions as a percentage of covered-employee payroll………………………………… 19.56% 19.95% 20.39%
Note: this schedule is intended to present information for 10 years.Until a 10-year trend is compiled, information is presented for thoseyears for which information is available.
See notes to required supplementary information.
SCHEDULE OF THE TOWN'S CONTRIBUTIONSPLYMOUTH COUNTY CONTRIBUTORY RETIREMENT SYSTEM
Town of Duxbury, Massachusetts 81 Comprehensive Annual Financial Report
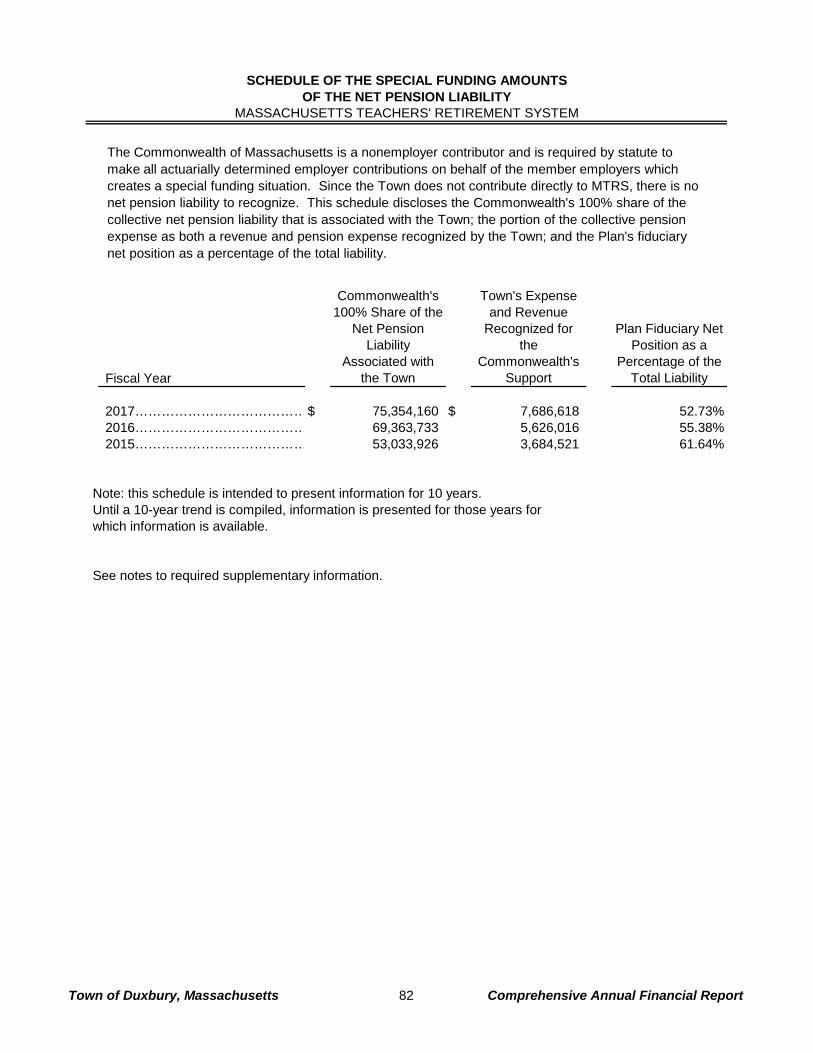
Fiscal Year
Commonwealth's 100% Share of the
Net Pension Liability
Associated with the Town
Town's Expense and Revenue
Recognized for the
Commonwealth's Support
Plan Fiduciary Net Position as a
Percentage of the Total Liability
2017…………………………………$ 75,354,160 $ 7,686,618 52.73%2016………………………………… 69,363,733 5,626,016 55.38%2015………………………………… 53,033,926 3,684,521 61.64%
Note: this schedule is intended to present information for 10 years.Until a 10-year trend is compiled, information is presented for those years forwhich information is available.
See notes to required supplementary information.
SCHEDULE OF THE SPECIAL FUNDING AMOUNTSOF THE NET PENSION LIABILITY
MASSACHUSETTS TEACHERS' RETIREMENT SYSTEM
The Commonwealth of Massachusetts is a nonemployer contributor and is required by statute to make all actuarially determined employer contributions on behalf of the member employers which creates a special funding situation. Since the Town does not contribute directly to MTRS, there is no net pension liability to recognize. This schedule discloses the Commonwealth's 100% share of the collective net pension liability that is associated with the Town; the portion of the collective pension expense as both a revenue and pension expense recognized by the Town; and the Plan's fiduciarynet position as a percentage of the total liability.
Town of Duxbury, Massachusetts 82 Comprehensive Annual Financial Report
Town of Duxbury, Massachusetts 83 Comprehensive Annual Financial Report
Other Postemployment Benefit Plan Schedules
Other Postemployment Benefit Plan Schedules GASB #74 The Schedule of Changes in the Town’s Net Other Postemployment Benefit Liability and Related Ratios presents multi-year trend information on the Plan’s net other postemployment benefit liability and related ratios. The Schedule of the Town’s Contributions presents multi-year trend information on the Town’s actual contributions to the other postemployment benefit plan and related ratios. The Schedule of Investment Returns presents multi-year trend information on the money-weighted investment return on the Plan’s other postemployment assets, net of investment expense. GASB #45 The Schedule of Funding progress compares, over time, the actuarial accrued liability for benefits with the actuarial value of accumulated plan assets. The Schedule of Employer Contributions presents multiyear trend information for required and actual contributions relating to the plan. The Schedule of Actuarial Methods and Assumptions presents factors that significantly affect the identification of trends in the amounts reported.

June 30, 2017
Total OPEB LiabilityService Cost………………………………………………………$ 1,574,616 Interest…………………………………………………………… 2,145,961 Changes of benefit terms……………………………………..… - Differences between expected and actual experience……… - Changes of assumptions……………………………………… - Benefit payments……………………………………………...… (1,692,355)
Net change in total OPEB liability……………………………… 2,028,222
Total OPEB liability- beginning……………………………..… 49,755,968
Total OPEB liability- ending (a)…………………………………$ 51,784,190
Plan fiduciary net position Contributions- employer ……………………………..…………$ 1,992,355 Net investment income………………………...……………… 90,773 Benefit payments……………………………...………………… (1,692,355)
Net change in plan fiduciary net position……………………… 390,773
Plan fiduciary net position- beginning………………………… 1,456,925
Plan fiduciary net position- ending (b)…………………………$ 1,847,698
Town's net OPEB liability- ending (a)-(b)…………………… $ 49,936,492
Plan fiduciary net position as a percentage of the total OPEB liability………………………..……………………… 3.57%
Covered-employee payroll………………………………..……… $ 44,107,553
Town's net OPEB liability as a percentage of covered-employee payroll…………………………..………… 113.22%
Note: this schedule is intended to present information for 10 years.Until a 10-year trend is compiled, information is presented for those yearsfor which information is available.
See notes to required supplementary information.
SCHEDULE OF CHANGES IN THE TOWN'S NET OPEB LIABILITY AND RELATED RATIOS
OTHER POSTEMPLOYMENT BENEFIT PLAN
Town of Duxbury, Massachusetts 84 Comprehensive Annual Financial Report
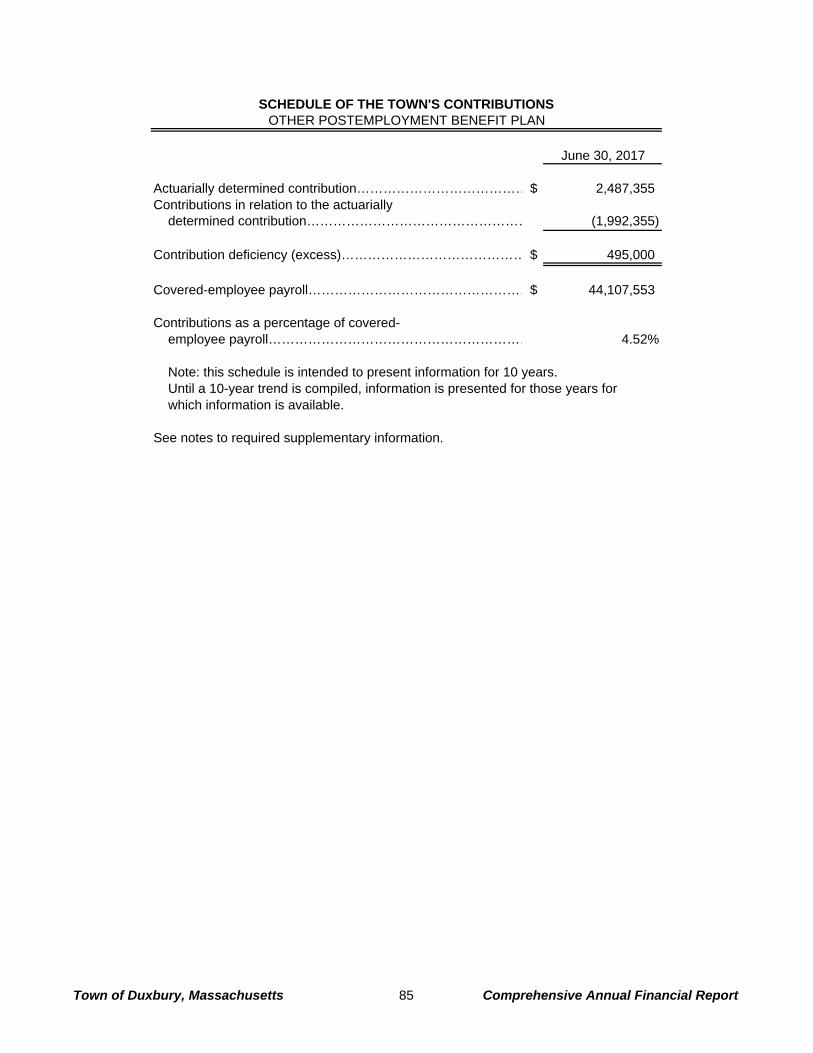
June 30, 2017
Actuarially determined contribution…………………………………$ 2,487,355 Contributions in relation to the actuarially
determined contribution…………………………………………… (1,992,355)
Contribution deficiency (excess)…………………………………… $ 495,000
Covered-employee payroll……………………………………………$ 44,107,553
Contributions as a percentage of covered- employee payroll…………………………………………………… 4.52%
Note: this schedule is intended to present information for 10 years.Until a 10-year trend is compiled, information is presented for those years forwhich information is available.
See notes to required supplementary information.
SCHEDULE OF THE TOWN'S CONTRIBUTIONSOTHER POSTEMPLOYMENT BENEFIT PLAN
Town of Duxbury, Massachusetts 85 Comprehensive Annual Financial Report

June 30, 2017
Annual money-weighted rate of return,net of investment expense……………………………………… 5.93%
Note: This schedule is intended to present information for 10 years.Until a 10-year trend is compiled, information is presented for those years for which information is available.
See notes to required supplementary information.
SCHEDULE OF INVESTMENT RETURNSOTHER POSTEMPLOYMENT BENEFIT PLAN
Town of Duxbury, Massachusetts 86 Comprehensive Annual Financial Report
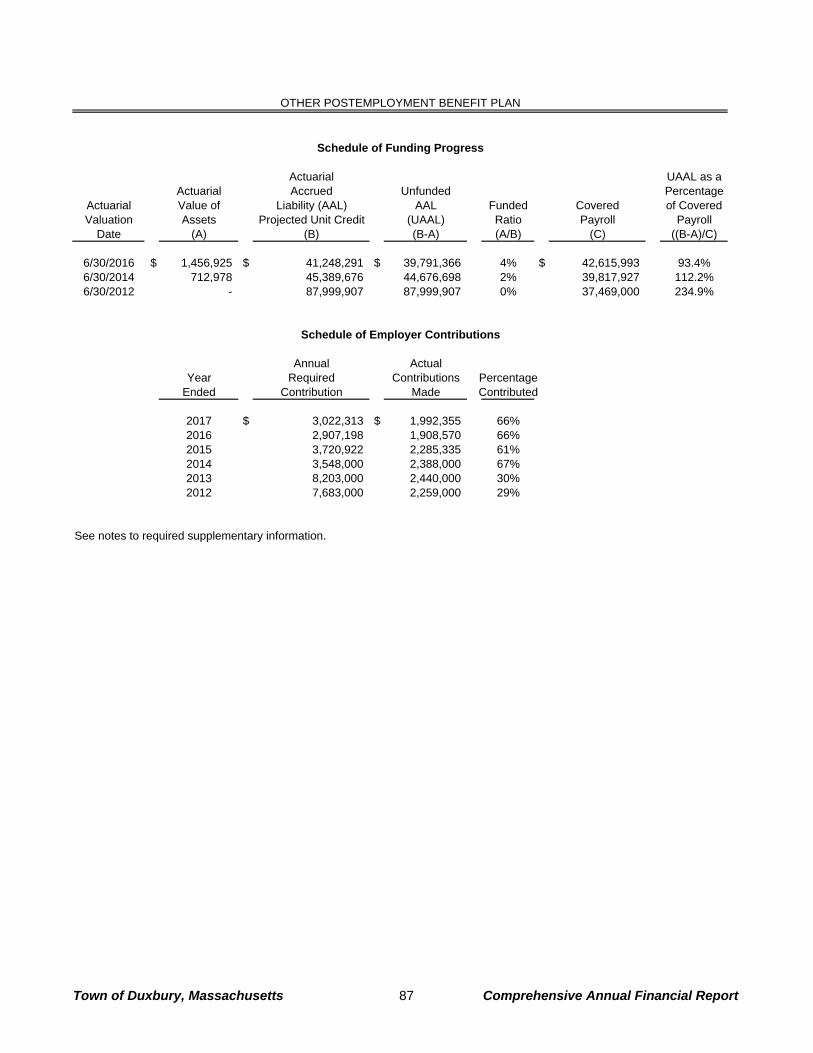
OTHER POSTEMPLOYMENT BENEFIT PLAN
Actuarial UAAL as aActuarial Accrued Unfunded Percentage
Actuarial Value of Liability (AAL) AAL Funded Covered of CoveredValuation Assets Projected Unit Credit (UAAL) Ratio Payroll Payroll
Date (A) (B) (B-A) (A/B) (C) ((B-A)/C)
6/30/2016 $ 1,456,925 $ 41,248,291 $ 39,791,366 4% $ 42,615,993 93.4%6/30/2014 712,978 45,389,676 44,676,698 2% 39,817,927 112.2%6/30/2012 - 87,999,907 87,999,907 0% 37,469,000 234.9%
Annual ActualYear Required Contributions Percentage
Ended Contribution Made Contributed
2017 $ 3,022,313 $ 1,992,355 66%2016 2,907,198 1,908,570 66%2015 3,720,922 2,285,335 61%2014 3,548,000 2,388,000 67%2013 8,203,000 2,440,000 30%2012 7,683,000 2,259,000 29%
See notes to required supplementary information.
Schedule of Employer Contributions
Schedule of Funding Progress
Town of Duxbury, Massachusetts 87 Comprehensive Annual Financial Report
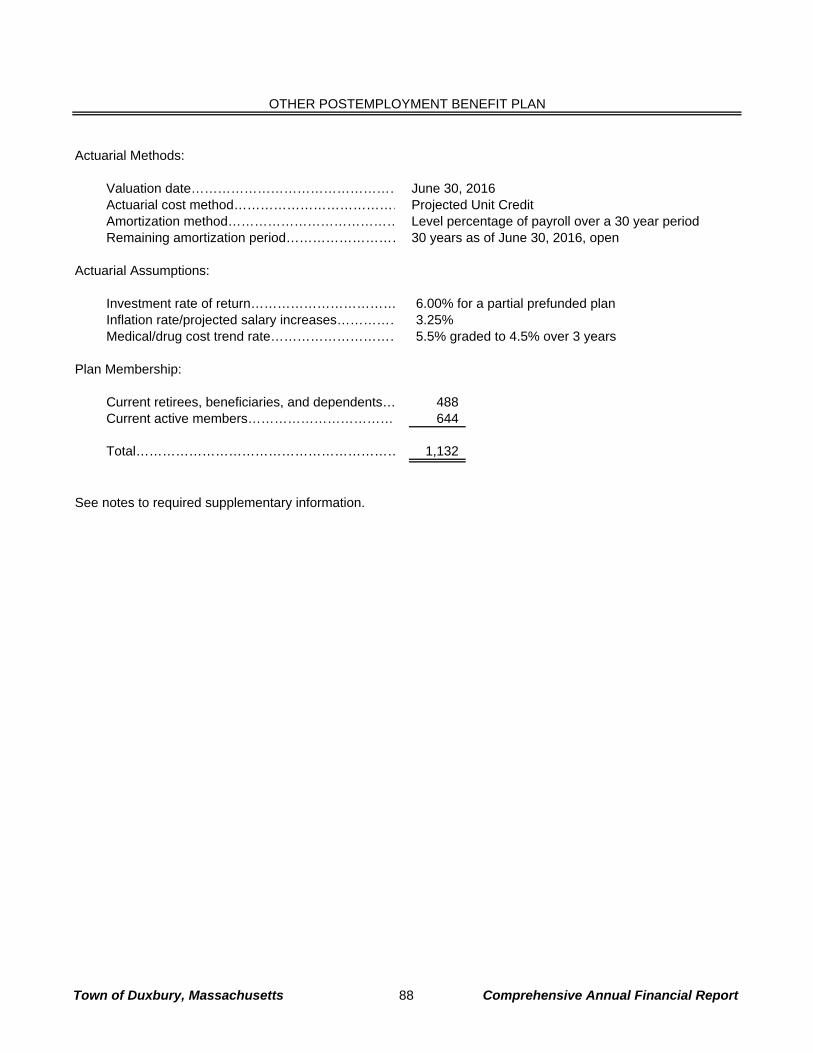
OTHER POSTEMPLOYMENT BENEFIT PLAN
Actuarial Methods:
Valuation date………………………………………… June 30, 2016Actuarial cost method………………………………… Projected Unit CreditAmortization method………………………………… Level percentage of payroll over a 30 year period Remaining amortization period……………………… 30 years as of June 30, 2016, open
Actuarial Assumptions:
Investment rate of return…………………………… 6.00% for a partial prefunded planInflation rate/projected salary increases…………… 3.25%Medical/drug cost trend rate………………………… 5.5% graded to 4.5% over 3 years
Plan Membership:
Current retirees, beneficiaries, and dependents… 488 Current active members……………………………… 644
Total…………………………………………………… 1,132
See notes to required supplementary information.
Town of Duxbury, Massachusetts 88 Comprehensive Annual Financial Report

Notes to Required Supplementary Information Year Ended June 30, 2017
Town of Duxbury, Massachusetts 89 Comprehensive Annual Financial Report
NOTE A – BUDGETARY BASIS OF ACCOUNTING Notes to Required Supplementary Information A. Budgetary Information Municipal Law requires the Town to adopt a balanced budget that is approved at the annual town meeting. The Town Manager presents an annual budget to the Board of Selectmen, Finance Committee and the Fiscal Advisory Committee, which includes estimates of revenues and other financing sources and recommendations of expenditures and other financing uses. Expenditures are budgeted by categories that are broken down by personal services, expenses, debt service and capital outlay and are mandated by Municipal Law. Supplementary appropriations are voted at special town meetings. The majority of appropriations are non-continuing which lapse at the end of each year. Others are continuing appropriations for which the governing body has authorized that an unspent balance from a prior year be carried forward and made available for spending in the current year. These carry forwards are included as part of the subsequent year’s original budget. Generally, expenditures may not exceed the legal level of spending (salaries, expenses and capital) authorized for an appropriation account. However, the payment of debt service is statutorily required, regardless of whether such amounts are appropriated. Additionally, expenditures for disasters, natural or otherwise, and final judgments may exceed the level of spending authorized. The Town adopts an annual budget for the General Fund in conformity with the guidelines described above. The original 2017 approved budget for the General Fund includes $73.1 million in current year appropriations and other amounts to be raised and $1.1 million in encumbrances and appropriations carried over from previous years. During 2017, the Town approved various transfers within appropriation lines in the General Fund along with supplemental appropriations totaling $1.8 million used primarily to fund the snow and ice deficit ($175,000), the Other Postemployment Benefit Trust Fund ($300,000), the Stabilization Trust Funds ($550,000), the Compensated Absence Trust Fund ($100,000), collective bargaining ($212,000), and various other expenditure increases totaling ($300,000). The Accounting office has the responsibility to ensure that budgetary control is maintained on an individual line item appropriation account basis. Budgetary control is exercised through the Town’s accounting system. B. Budgetary - GAAP Reconciliation For budgetary financial reporting purposes, the Uniform Municipal Accounting System basis of accounting (established by the Commonwealth) is followed, which differs from the GAAP basis of accounting. A reconciliation of budgetary-basis to GAAP-basis results for the General Fund for the year ended June 30, 2017, is presented on the following page.

Notes to Required Supplementary Information Year Ended June 30, 2017
Town of Duxbury, Massachusetts 90 Comprehensive Annual Financial Report
Net Change in Fund Balance - budgetary basis………………$ (178,433)
Perspective difference: Activity of the stabilization funds recorded in the general fund for GAAP……………………………………… 756,975 Activity of the pension, unemployment, and compensated absence trust funds recorded in the general fund for GAAP…………………………………… 77,079 Pool enterprise fund balance at June 30, 2017 moved to the general fund…………………………………… (100,519)
Basis of accounting differences: Net change in revenue accrual………………………………… (10,775) Recognition of revenue for on-behalf payments…………… 7,686,618 Recognition of expenditures for on-behalf payments……… (7,686,618)
Net Change in Fund Balance - GAAP basis……………………$ 544,327
NOTE B – PENSION PLAN Pension Plan Schedules A. Schedule of the Town’s Proportionate Share of the Net Pension Liability The Schedule of the Town’s Proportionate Share of the Net Pension Liability details the allocated percentage of the net pension liability (asset), the proportionate share of the net pension liability, and the covered employee payroll. It also demonstrates the net position as a percentage of the pension liability and the net pension liability as a percentage of covered payroll. B. Schedule of the Town’s Contributions Governmental employers are required to pay an annual appropriation as established by PERAC. The appropriation includes the amounts to pay the pension portion of each member’s retirement allowance, an amount to amortize the actuarially determined unfunded liability to zero in accordance with the system’s funding schedule, and additional appropriations in accordance with adopted early retirement incentive programs. The appropriations are payable on July 1 and January 1. The Town may choose to pay the entire appropriation in July at a discounted rate. Accordingly, actual contributions may be less than the “total appropriation”. The pension fund appropriation is allocated to the Town based on covered payroll. C. Schedule of the Special Funding Amounts of the Net Pension Liabilities The Commonwealth of Massachusetts is a nonemployer contributor and is required by statute to make all actuarially determined employer contributions on behalf of the member employers which creates a special funding situation. Since the Town does not contribute directly to MTRS, there is no net pension liability to recognize. This schedule discloses the Commonwealth's 100% share of the collective net pension liability that is associated with the Town; the portion of the collective pension expense as both a revenue and pension expense recognized by the Town; and the Plan's fiduciary net position as a percentage of the total liability.
Notes to Required Supplementary Information Year Ended June 30, 2017
Town of Duxbury, Massachusetts 91 Comprehensive Annual Financial Report
D. Changes in Assumptions The following changes in assumptions were included in the January 1, 2017 actuarial valuation:
• Cost of living increases were 3.0% of the first $14,000 of retirement income, as compared to $13,000 in the prior year.
• The annual rate of both pre-retirement and beneficiary mortality was changed to the RP-2014 Blue Collar Mortality with Scale MP-2016, fully generational table.
• The mortality for retired group 1 and 2 members was changed to the RP-2014 Blue Collar Mortality Table set forward five years for males and 3 years for females, fully generational. Group 4 retired members were changed to the RP-2014 Blue Collar Mortality table set forward three years for males, and six years for females, fully generational.
• The assumed family composition was changed to assume that 80% of all male members and 60% of all female members will be survived by a spouse, as compared to the prior valuation assumption that 80% of all members will be survived by a spouse.
• The amortization method changed from the level percent open group method to a method where payments increase at 3.5% for the unfunded actuarial accrued liability and level amortization for the 2002, 2003 and 2013 ERI.
• The amortization period changed from 17 years to amortization of the unfunded liability over 12 years, the 2002 ERI over 2 years, the 2003 ERI over 3 years, and the 2013 ERI over 11 years.
• The assumed annual increase in administrative expenses was changed to 3.75%, from 4.00%. E. Changes in Plan Provisions – None. NOTE C – OTHER POSTEMPLOYMENT BENEFITS PLAN The Town administers a single-employer defined benefit healthcare plan (“the Retiree Health Plan”). The plan provides lifetime healthcare and life insurance for eligible retirees and their spouses through the Town’s health and life insurance plans, which covers both active and retired members, including teachers. The Other Postemployment Benefit Plan A. Schedule of Changes in the Town’s Net Other Postemployment Benefit Liability and Related Ratios The Schedule of Changes in the Town’s Net Other Postemployment Benefit Liability and Related Ratios presents multi-year trend information on changes in the Plan’s total OPEB liability, changes in the Plan’s net position, and ending net OPEB liability. It also demonstrates the Plan’s net position as a percentage of the total liability and the Plan’s net other postemployment benefit liability as a percentage of covered employee payroll. B. Schedule of the Town’s Contributions The Schedule of the Town’s Contributions includes the Town’s annual required contribution to the Plan, along with the contribution made in relation to the actuarially determined contribution and the covered employee payroll. The Town is not required to fully fund this contribution. It also demonstrates the contributions as a percentage of covered payroll. C. Schedule of Investment Returns The Schedule of Investment Returns includes the money-weighted investment return on the Plan’s other postemployment assets, net of investment expense.
Notes to Required Supplementary Information Year Ended June 30, 2017
Town of Duxbury, Massachusetts 92 Comprehensive Annual Financial Report
The Town The Town currently finances its other postemployment benefits (OPEB) on a combined pre-funded and pay-as-you-go basis. As a result, the funded ratio (actuarial value of assets expressed as a percentage of the actuarial accrued liability) is 4%. In accordance with Governmental Accounting Standards, the Town has recorded its OPEB cost equal to the actuarial determined annual required contribution (ARC) which includes the normal cost of providing benefits for the year and a component for the amortization of the total unfunded actuarial accrued liability of the plan. Projections of benefits for financial reporting purposes are based on the substantive plan and include the types of benefits provided at the time of each valuation and the historical pattern of sharing of benefit costs between the employer and plan members to that point. The actuarial methods and assumptions used include techniques that are designed to reduce the effects of short-term volatility in actuarial accrued liabilities and the actuarial value of assets, consistent with the long-term perspective of the calculations. A. Schedule of Funding Progress The Schedule of Funding Progress presents multiyear trend information which compares, over time, the Town’s actuarial accrued liability for benefits with the actuarial value of accumulated plan assets. B. Schedule of Employer Contributions The Schedule of Employer Contributions presents multiyear trend information for the Town’s required and actual contributions relating to the plan. C. Schedule of Actuarial Methods and Assumptions The Schedule of Actuarial Methods and Assumptions presents factors that significantly affect the identification of trends in the amounts reported. D. Changes in Assumptions – None. E. Changes in Plan Provisions – None.

Town of Duxbury, Massachusetts 93 Comprehensive Annual Financial Report
This page intentionally left blank.
Town of Duxbury, Massachusetts 94 Comprehensive Annual Financial Report
Other Supplementary Information Other Supplementary Information
Town of Duxbury, Massachusetts 95 Comprehensive Annual Financial Report
Combining and Individual Fund Statements Combining and Individual Fund Statements
The combining and individual fund financial statements provide a more detailed view of the “Basic Financial Statements” presented in the preceding subsection.
Combining statements are presented when there are more than one fund of a given fund type. Individual fund statements offer more descriptive account information.

Town of Duxbury, Massachusetts 96 Comprehensive Annual Financial Report
Nonmajor Governmental Funds Nonmajor Governmental Funds Fund Description
Special Revenue Funds Special Revenue Funds are used to account for the proceeds of specific revenue sources (other than permanent funds or capital project funds) that are restricted by law or administrative action to expenditures for specific purposes. The Town’s grouping for nonmajor special revenue funds is as described as follows:
• School Lunch – accounts for the operations of the public school lunch program.
• School Gifts & Grants – accounts for educational programs specifically financed by gifts, grants and other restricted revenues.
• School Revolving – accounts for self-supporting educational programs and activities.
• Recreation Revolving – accounts for self-supporting recreational programs and activities.
• Receipts Reserved for Appropriation – accounts for the sale of cemetery lots.
• Town Gifts & Grants – accounts for various gifts, grants and legally restricted revenues for special
programs administered by Town departments.
• Town Revolving – accounts for self-supporting programs and activities.
• Affordable Housing – accounts for activity related to the creation and preservation of affordable housing.
• Special Revenue Trust Funds – accounts for statutory trust accounts that may be spent to support the government.
Capital Projects Funds Capital Projects Funds are used to account for financial resources to be used for the acquisition, construction or improvement of major capital assets (other than those financed by enterprise funds). Such resources are derived principally from proceeds of general obligation bonds and grants. The Town’s grouping for nonmajor capital project funds is as described as follows:
• Miscellaneous Small Projects – accounts for nonmajor capital projects. • Powder Point Bridge – accounts for the renovation of the Powder Point Bridge.
• Public Safety Buildings – accounts for the renovations to the fire station.
• Capital Equipment – accounts for capital equipment.
• Crematory – accounts for the construction of the new crematory and various cemetery projects.

Town of Duxbury, Massachusetts 97 Comprehensive Annual Financial Report
Permanent Funds Permanent Funds are used to account for financial resources that are legally restricted to the extent that only earnings, not principal, may be used for purposes that support governmental programs. The Town’s grouping for non-major permanent funds is as described as follows:
• Town Services Fund – accounts for the Town’s cemetery and other trust funds that are legally restricted to the extent that only earnings, not principal, may be used for purposes that support governmental programs.
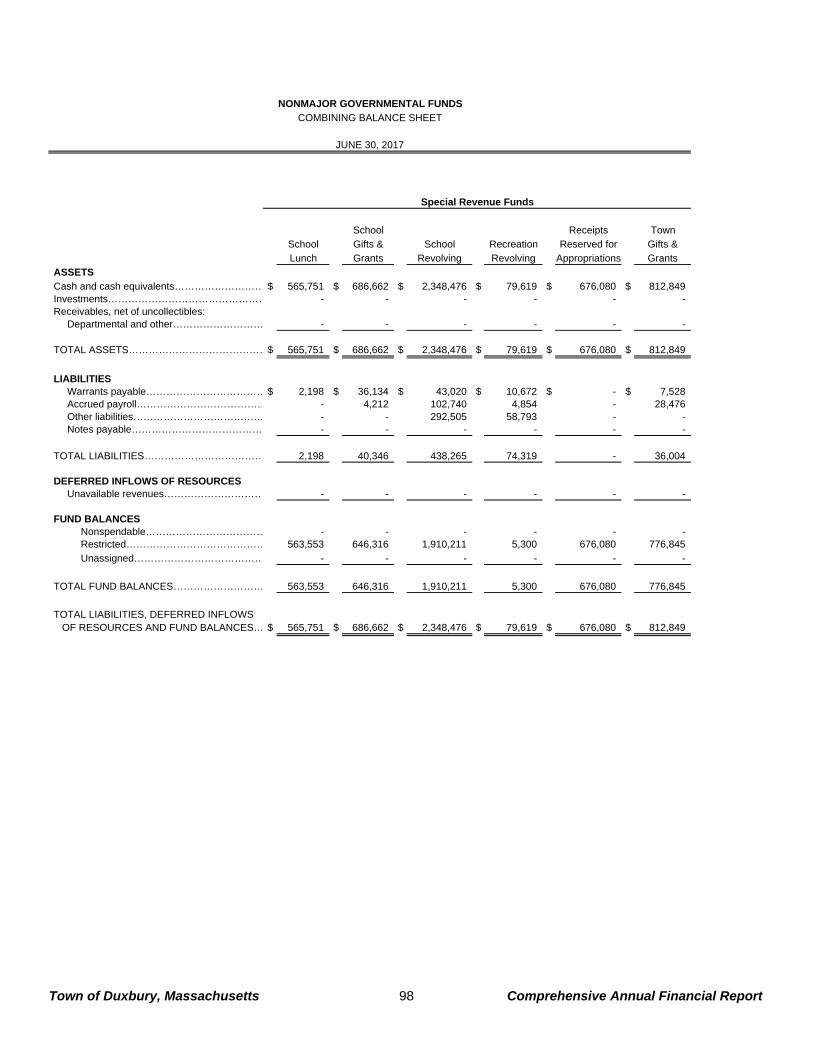
School Receipts TownSchool Gifts & School Recreation Reserved for Gifts &Lunch Grants Revolving Revolving Appropriations Grants
ASSETSCash and cash equivalents……………………… $ 565,751 $ 686,662 $ 2,348,476 $ 79,619 $ 676,080 $ 812,849 Investments………………………………………… - - - - - - Receivables, net of uncollectibles:
Departmental and other……………………… - - - - - -
TOTAL ASSETS……………………………………$ 565,751 $ 686,662 $ 2,348,476 $ 79,619 $ 676,080 $ 812,849
LIABILITIESWarrants payable………………………………$ 2,198 $ 36,134 $ 43,020 $ 10,672 $ - $ 7,528 Accrued payroll………………………………… - 4,212 102,740 4,854 - 28,476 Other liabilities………………………………… - - 292,505 58,793 - - Notes payable………………………………… - - - - - -
TOTAL LIABILITIES……………………………… 2,198 40,346 438,265 74,319 - 36,004
DEFERRED INFLOWS OF RESOURCESUnavailable revenues………………………… - - - - - -
FUND BALANCESNonspendable……………………………… - - - - - - Restricted…………………………………… 563,553 646,316 1,910,211 5,300 676,080 776,845 Unassigned………………………………… - - - - - -
TOTAL FUND BALANCES……………………… 563,553 646,316 1,910,211 5,300 676,080 776,845
TOTAL LIABILITIES, DEFERRED INFLOWS OF RESOURCES AND FUND BALANCES… $ 565,751 $ 686,662 $ 2,348,476 $ 79,619 $ 676,080 $ 812,849
Special Revenue Funds
NONMAJOR GOVERNMENTAL FUNDSCOMBINING BALANCE SHEET
JUNE 30, 2017
Town of Duxbury, Massachusetts 98 Comprehensive Annual Financial Report
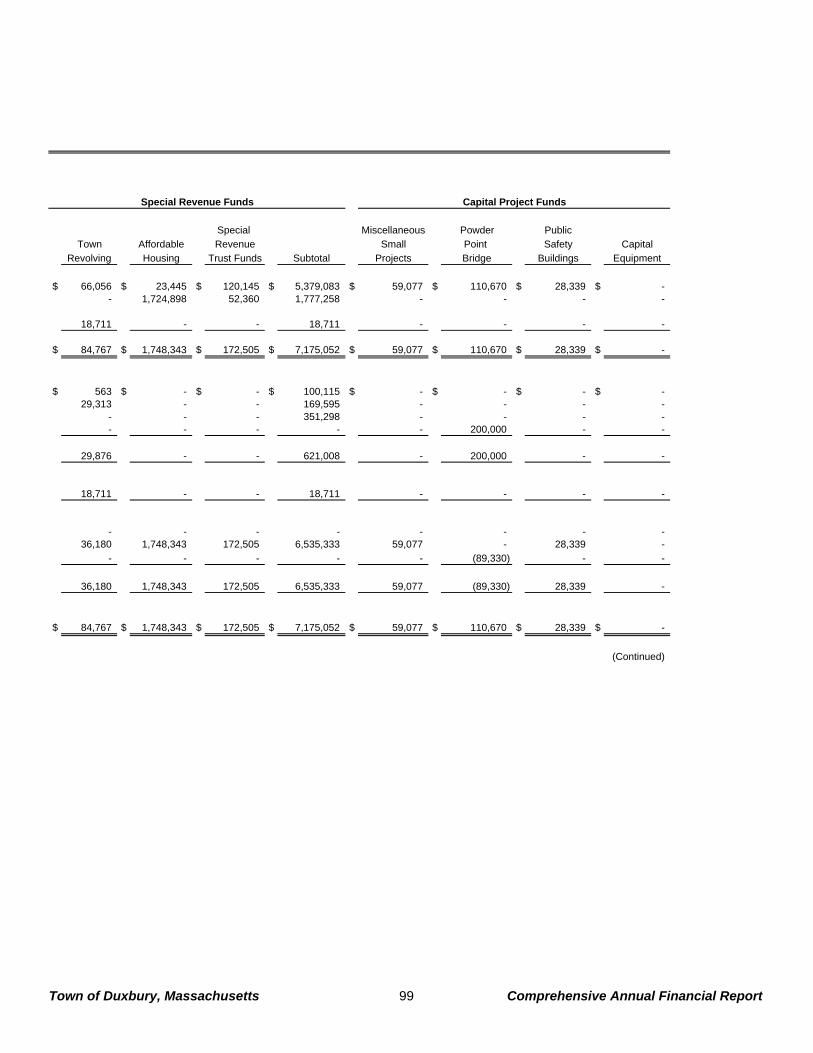
Special Miscellaneous Powder PublicTown Affordable Revenue Small Point Safety Capital
Revolving Housing Trust Funds Subtotal Projects Bridge Buildings Equipment
$ 66,056 $ 23,445 $ 120,145 $ 5,379,083 $ 59,077 $ 110,670 $ 28,339 $ - - 1,724,898 52,360 1,777,258 - - - -
18,711 - - 18,711 - - - -
$ 84,767 $ 1,748,343 $ 172,505 $ 7,175,052 $ 59,077 $ 110,670 $ 28,339 $ -
$ 563 $ - $ - $ 100,115 $ - $ - $ - $ - 29,313 - - 169,595 - - - -
- - - 351,298 - - - - - - - - - 200,000 - -
29,876 - - 621,008 - 200,000 - -
18,711 - - 18,711 - - - -
- - - - - - - - 36,180 1,748,343 172,505 6,535,333 59,077 - 28,339 -
- - - - - (89,330) - -
36,180 1,748,343 172,505 6,535,333 59,077 (89,330) 28,339 -
$ 84,767 $ 1,748,343 $ 172,505 $ 7,175,052 $ 59,077 $ 110,670 $ 28,339 $ -
(Continued)
Capital Project FundsSpecial Revenue Funds
Town of Duxbury, Massachusetts 99 Comprehensive Annual Financial Report

PermanentFunds
TotalTown Nonmajor
Services GovernmentalCrematory Subtotal Fund Funds
ASSETSCash and cash equivalents…………………………$ 1,463 $ 199,549 $ 51,640 $ 5,630,272 Investments………………………………………… - - 3,816,699 5,593,957 Receivables, net of uncollectibles:
Departmental and other………………………… - - - 18,711
TOTAL ASSETS…………………………………… $ 1,463 $ 199,549 $ 3,868,339 $ 11,242,940
LIABILITIESWarrants payable…………………………………$ - $ - $ 5,532 $ 105,647 Accrued payroll…………………………………… - - - 169,595 Other liabilities…………………………………… - - - 351,298 Notes payable…………………………………… - 200,000 - 200,000
TOTAL LIABILITIES………………………………… - 200,000 5,532 826,540
DEFERRED INFLOWS OF RESOURCESUnavailable revenues…………………………… - - - 18,711
FUND BALANCESNonspendable………………………………… - - 2,318,473 2,318,473 Restricted……………………………………… 1,463 88,879 1,544,334 8,168,546 Unassigned…………………………………… - (89,330) - (89,330)
TOTAL FUND BALANCES………………………… 1,463 (451) 3,862,807 10,397,689
TOTAL LIABILITIES, DEFERRED INFLOWS OF RESOURCES AND FUND BALANCES……$ 1,463 $ 199,549 $ 3,868,339 $ 11,242,940
(Concluded)
Capital Project Funds
NONMAJOR GOVERNMENTAL FUNDSCOMBINING BALANCE SHEET
JUNE 30, 2017
Town of Duxbury, Massachusetts 100 Comprehensive Annual Financial Report

Town of Duxbury, Massachusetts 101 Comprehensive Annual Financial Report
This page intentionally left blank.

School Receipts TownSchool Gifts & School Recreation Reserved for Gifts &Lunch Grants Revolving Revolving Appropriations Grants
REVENUES:Motor vehicle and other excise taxes…………………………$ - $ - $ - $ - $ 21,465 $ - Intergovernmental……………………………………………… 114,786 1,751,734 - - - 890,326 Departmental and other……………………………………… 746,547 90,632 4,671,524 171,975 225,560 676,871 Contributions…………………………………………………… - - - - - 475,687 Investment income……………………………………………… - - - - - -
TOTAL REVENUES……………………………………… 861,333 1,842,366 4,671,524 171,975 247,025 2,042,884
EXPENDITURES:Current:
General government………………………………………… - - - - - 504,309 Public safety………………………………………………… - - - - - 816,775 Education……………………………………………………… 702,657 2,088,042 4,591,956 - - - Public works………………………………………………… - - - - - 9,485 Human services……………………………………………… - - - - - 179,895 Culture and recreation……………………………………… - - - 155,824 - 335,723 Pension benefits - Town…………………………………… - - - - - 2,282 Employee benefits…………………………………………… - - - - - -
TOTAL EXPENDITURES………………………………… 702,657 2,088,042 4,591,956 155,824 - 1,848,469
EXCESS (DEFICIENCY) OF REVENUESOVER (UNDER) EXPENDITURES…………………………… 158,676 (245,676) 79,568 16,151 247,025 194,415
OTHER FINANCING SOURCES (USES):Transfers in……………………………………………………… - - - - - 6,585 Transfers out…………………………………………………… - (47) (488) (57,183) (133,706) -
TOTAL OTHER FINANCING SOURCES (USES)…… - (47) (488) (57,183) (133,706) 6,585
NET CHANGE IN FUND BALANCES………………………… 158,676 (245,723) 79,080 (41,032) 113,319 201,000
FUND BALANCES AT BEGINNING OF YEAR……………… 404,877 892,039 1,831,131 46,332 562,761 575,845
FUND BALANCES AT END OF YEAR…………………………$ 563,553 $ 646,316 $ 1,910,211 $ 5,300 $ 676,080 $ 776,845
Special Revenue Funds
YEAR ENDED JUNE 30, 2017
NONMAJOR GOVERNMENTAL FUNDSCOMBINING STATEMENT OF REVENUES, EXPENDITURES, AND CHANGES IN FUND BALANCES
Town of Duxbury, Massachusetts 102 Comprehensive Annual Financial Report
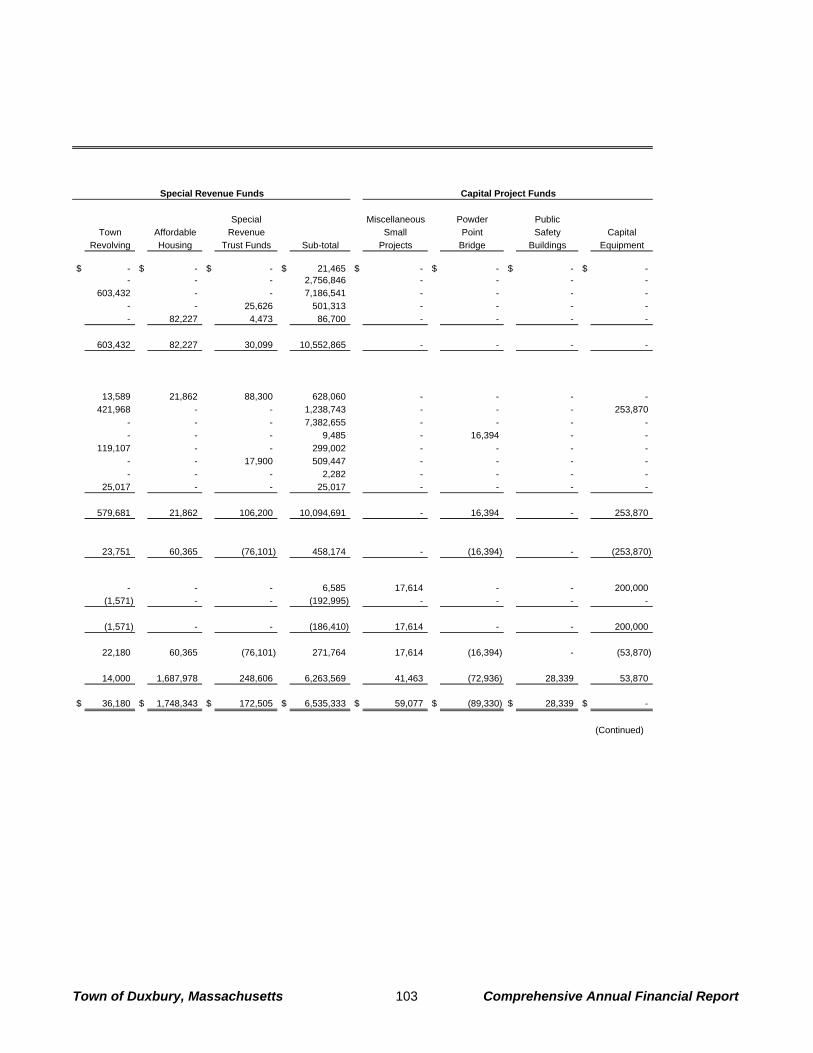
Special Miscellaneous Powder PublicTown Affordable Revenue Small Point Safety Capital
Revolving Housing Trust Funds Sub-total Projects Bridge Buildings Equipment
$ - $ - $ - $ 21,465 $ - $ - $ - $ - - - - 2,756,846 - - - -
603,432 - - 7,186,541 - - - - - - 25,626 501,313 - - - - - 82,227 4,473 86,700 - - - -
603,432 82,227 30,099 10,552,865 - - - -
13,589 21,862 88,300 628,060 - - - - 421,968 - - 1,238,743 - - - 253,870 - - - 7,382,655 - - - - - - - 9,485 - 16,394 - - 119,107 - - 299,002 - - - - - - 17,900 509,447 - - - - - - - 2,282 - - - - 25,017 - - 25,017 - - - -
579,681 21,862 106,200 10,094,691 - 16,394 - 253,870
23,751 60,365 (76,101) 458,174 - (16,394) - (253,870)
- - - 6,585 17,614 - - 200,000 (1,571) - - (192,995) - - - -
(1,571) - - (186,410) 17,614 - - 200,000
22,180 60,365 (76,101) 271,764 17,614 (16,394) - (53,870)
14,000 1,687,978 248,606 6,263,569 41,463 (72,936) 28,339 53,870
$ 36,180 $ 1,748,343 $ 172,505 $ 6,535,333 $ 59,077 $ (89,330) $ 28,339 $ -
(Continued)
Capital Project FundsSpecial Revenue Funds
Town of Duxbury, Massachusetts 103 Comprehensive Annual Financial Report
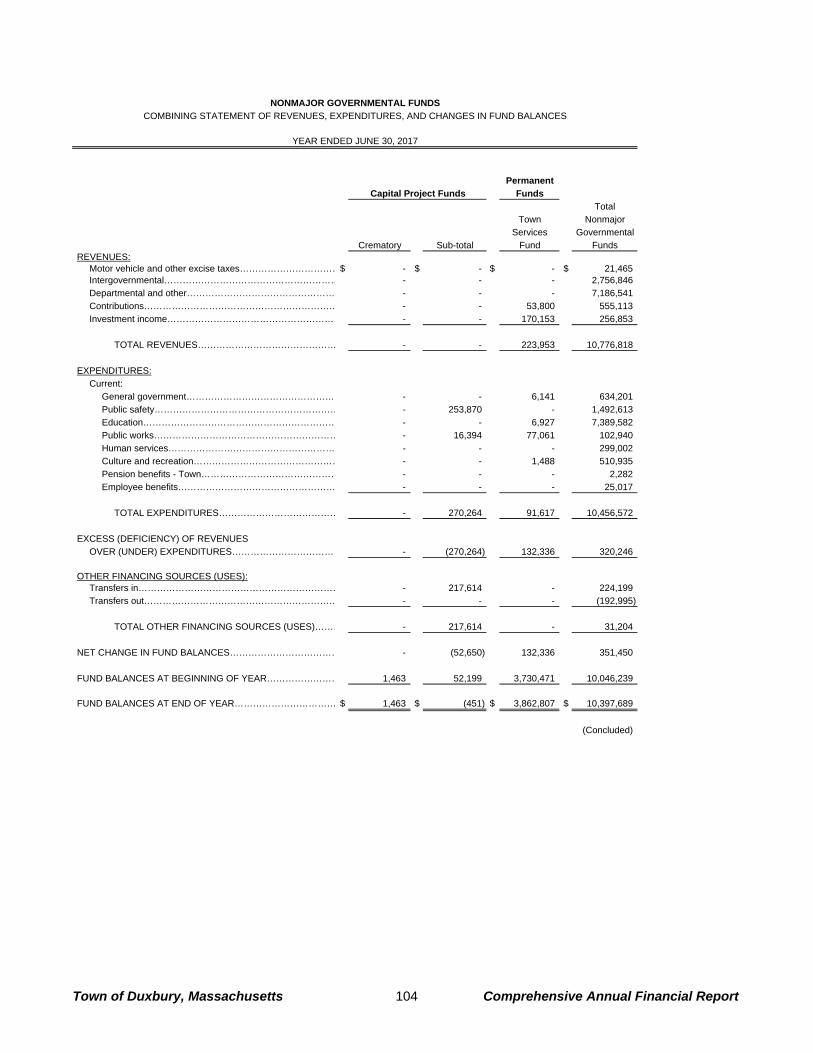
PermanentFunds
TotalTown Nonmajor
Services GovernmentalCrematory Sub-total Fund Funds
REVENUES:Motor vehicle and other excise taxes……………………………$ - $ - $ - $ 21,465 Intergovernmental………………………………………………… - - - 2,756,846 Departmental and other………………………………………… - - - 7,186,541 Contributions……………………………………………………… - - 53,800 555,113 Investment income………………………………………………… - - 170,153 256,853
TOTAL REVENUES……………………………………… - - 223,953 10,776,818
EXPENDITURES:Current:
General government…………………………………………… - - 6,141 634,201 Public safety…………………………………………………… - 253,870 - 1,492,613 Education……………………………………………………… - - 6,927 7,389,582 Public works…………………………………………………… - 16,394 77,061 102,940 Human services……………………………………………… - - - 299,002 Culture and recreation………………………………………… - - 1,488 510,935 Pension benefits - Town……………………………………… - - - 2,282 Employee benefits…………………………………………… - - - 25,017
TOTAL EXPENDITURES………………………………… - 270,264 91,617 10,456,572
EXCESS (DEFICIENCY) OF REVENUESOVER (UNDER) EXPENDITURES……………………………… - (270,264) 132,336 320,246
OTHER FINANCING SOURCES (USES):Transfers in………………………………………………………… - 217,614 - 224,199 Transfers out……………………………………………………… - - - (192,995)
TOTAL OTHER FINANCING SOURCES (USES)……… - 217,614 - 31,204
NET CHANGE IN FUND BALANCES……………………………… - (52,650) 132,336 351,450
FUND BALANCES AT BEGINNING OF YEAR…………………… 1,463 52,199 3,730,471 10,046,239
FUND BALANCES AT END OF YEAR…………………………… $ 1,463 $ (451) $ 3,862,807 $ 10,397,689
(Concluded)
YEAR ENDED JUNE 30, 2017
Capital Project Funds
NONMAJOR GOVERNMENTAL FUNDSCOMBINING STATEMENT OF REVENUES, EXPENDITURES, AND CHANGES IN FUND BALANCES
Town of Duxbury, Massachusetts 104 Comprehensive Annual Financial Report
Town of Duxbury, Massachusetts 105 Comprehensive Annual Financial Report
Agency Fund Agency Fund Fund Description Agency Fund is used to account for assets held in a purely custodial capacity. The Town’s Agency Fund activity consists primarily of performance bonds, security deposits, and licenses and fees collected on-behalf of the state.
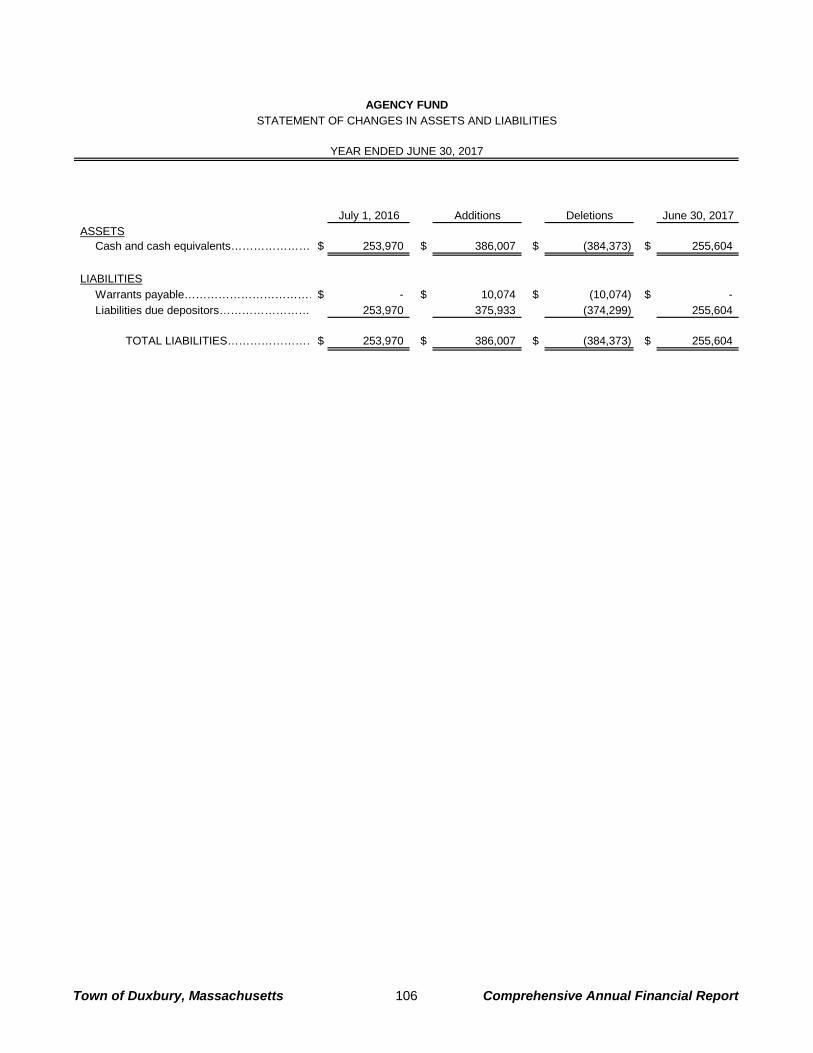
July 1, 2016 Additions Deletions June 30, 2017ASSETS
Cash and cash equivalents………………… $ 253,970 $ 386,007 $ (384,373) $ 255,604
LIABILITIESWarrants payable………………………………$ - $ 10,074 $ (10,074) $ - Liabilities due depositors…………………… 253,970 375,933 (374,299) 255,604
TOTAL LIABILITIES……………………$ 253,970 $ 386,007 $ (384,373) $ 255,604
AGENCY FUNDSTATEMENT OF CHANGES IN ASSETS AND LIABILITIES
YEAR ENDED JUNE 30, 2017
Town of Duxbury, Massachusetts 106 Comprehensive Annual Financial Report

Statistical Section Statistical tables differ from financial statements since they usually cover more than one year and may present nonaccounting data. The following tables reflect social and economic data, financial trends, and fiscal capacity.
Town of Duxbury, Massachusetts 107 Comprehensive Annual Financial Report
STATISTICAL SECTION
Statistical Section This part of the Town of Duxbury’s comprehensive annual financial report presents detailed information as a context for understanding what the information in the financial statements, note disclosures, and required supplementary information says about the Town’s overall financial health. Financial Trends
• These schedules contain trend information to help the reader understand how the Town’s financial performance and well-being have changed over time.
Revenue Capacity
• These schedules contain information to help the reader assess the Town’s most significant local revenue source, the property tax.
Debt Capacity
• These schedules present information to help the reader assess the affordability of the Town’s current levels of outstanding debt and the Town’s ability to issue additional debt in the future.
Demographic and Economic Information
• These schedules offer demographic and economic indicators to help the reader understand the environment within which the Town’s financial activities take place.
Operating Information
• These schedules contain service and infrastructure data to help the reader understand how the information in the Town’s financial report relates to the services the Town provides and the activities it performs.
SOURCES: Unless otherwise noted, the information in these schedules is derived from the comprehensive annual financial reports for the relevant year.
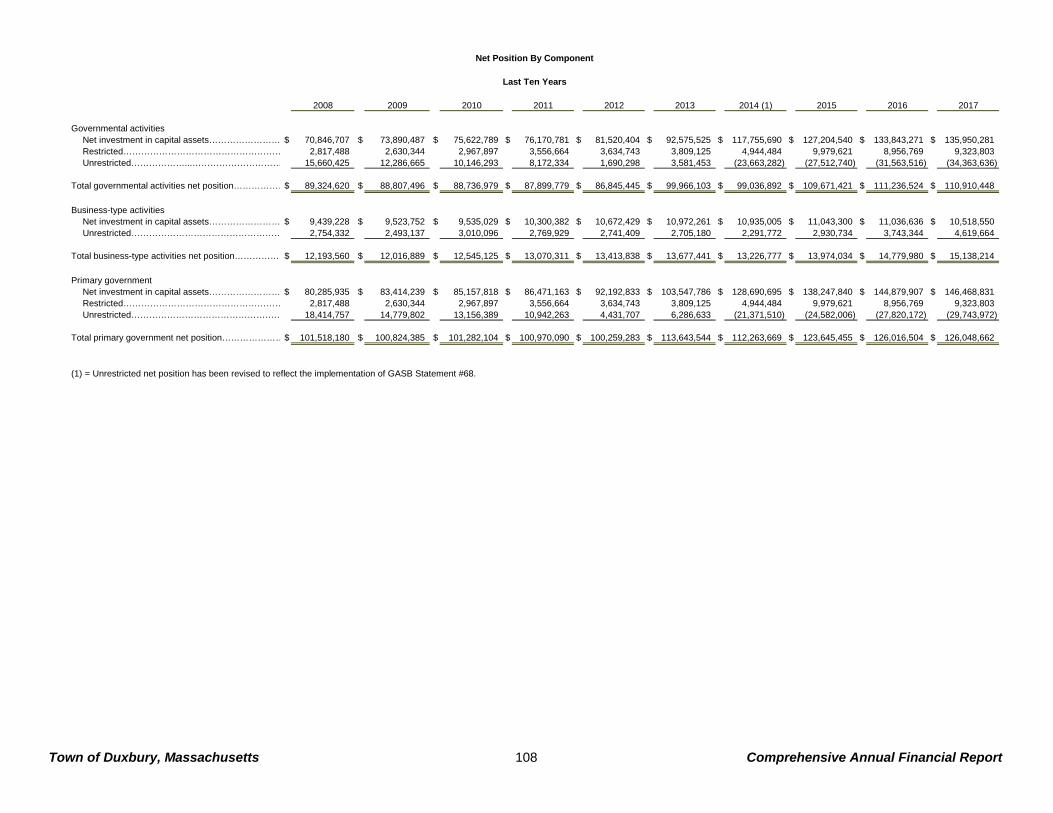
2008 2009 2010 2011 2012 2013 2014 (1) 2015 2016 2017
Governmental activitiesNet investment in capital assets…………………… $ 70,846,707 $ 73,890,487 $ 75,622,789 $ 76,170,781 $ 81,520,404 $ 92,575,525 $ 117,755,690 $ 127,204,540 $ 133,843,271 $ 135,950,281 Restricted……………………………………………… 2,817,488 2,630,344 2,967,897 3,556,664 3,634,743 3,809,125 4,944,484 9,979,621 8,956,769 9,323,803 Unrestricted………………...………………………… 15,660,425 12,286,665 10,146,293 8,172,334 1,690,298 3,581,453 (23,663,282) (27,512,740) (31,563,516) (34,363,636)
Total governmental activities net position………………$ 89,324,620 $ 88,807,496 $ 88,736,979 $ 87,899,779 $ 86,845,445 $ 99,966,103 $ 99,036,892 $ 109,671,421 $ 111,236,524 $ 110,910,448
Business-type activitiesNet investment in capital assets…………………… $ 9,439,228 $ 9,523,752 $ 9,535,029 $ 10,300,382 $ 10,672,429 $ 10,972,261 $ 10,935,005 $ 11,043,300 $ 11,036,636 $ 10,518,550 Unrestricted…………………………………………… 2,754,332 2,493,137 3,010,096 2,769,929 2,741,409 2,705,180 2,291,772 2,930,734 3,743,344 4,619,664
Total business-type activities net position………………$ 12,193,560 $ 12,016,889 $ 12,545,125 $ 13,070,311 $ 13,413,838 $ 13,677,441 $ 13,226,777 $ 13,974,034 $ 14,779,980 $ 15,138,214
Primary governmentNet investment in capital assets…………………… $ 80,285,935 $ 83,414,239 $ 85,157,818 $ 86,471,163 $ 92,192,833 $ 103,547,786 $ 128,690,695 $ 138,247,840 $ 144,879,907 $ 146,468,831 Restricted……………………………………………… 2,817,488 2,630,344 2,967,897 3,556,664 3,634,743 3,809,125 4,944,484 9,979,621 8,956,769 9,323,803 Unrestricted…………………………………………… 18,414,757 14,779,802 13,156,389 10,942,263 4,431,707 6,286,633 (21,371,510) (24,582,006) (27,820,172) (29,743,972)
Total primary government net position…………………$ 101,518,180 $ 100,824,385 $ 101,282,104 $ 100,970,090 $ 100,259,283 $ 113,643,544 $ 112,263,669 $ 123,645,455 $ 126,016,504 $ 126,048,662
(1) = Unrestricted net position has been revised to reflect the implementation of GASB Statement #68.
Last Ten Years
Net Position By Component
Town of Duxbury, Massachusetts 108 Comprehensive Annual Financial Report

2008 2009 2010 2011 2012 2013 2014 2015 2016 2017ExpensesGovernmental activities:
General government………………………………………… $ 3,686,678 $ 3,942,177 $ 3,974,258 $ 4,293,359 $ 5,128,146 $ 5,085,169 $ 4,762,290 $ 5,069,723 $ 4,943,552 $ 4,980,915 Public safety…………………………………………………… 8,522,903 9,850,181 9,710,965 10,039,369 10,964,082 11,307,480 11,087,856 11,467,443 11,612,777 13,087,396 Education……………………………………………………… 44,398,693 50,478,418 50,300,591 52,156,368 53,522,811 56,017,363 54,816,225 53,150,719 58,761,241 65,375,555 Public works…………………………………………………… 5,194,930 5,911,232 5,258,010 5,453,666 5,724,373 6,068,943 6,130,939 6,058,919 7,653,366 6,666,580 Human services……………………………………………… 710,722 857,340 891,585 945,904 1,054,046 1,220,090 1,262,417 1,222,376 1,359,923 1,333,179 Culture and recreation……………………………………… 2,742,203 2,923,774 2,731,672 2,692,071 2,642,103 2,752,739 2,593,462 2,563,386 3,146,025 3,394,809 Community preservation……………………………………… 200,192 147,179 189,761 349,793 376,498 255,580 452,800 243,827 334,472 259,022 Claims and judgements……………………………………… - - - - - - - - 435,000 - Interest………………………………………………………… 784,810 637,234 592,335 477,255 489,622 2,351,280 2,682,114 2,360,916 2,385,421 2,302,634
Total government activities expenses………………………… 66,241,131 74,747,535 73,649,177 76,407,785 79,901,681 85,058,644 83,788,103 82,137,309 90,631,777 97,400,090
Business-type activities:Water…………………………………………………………… 2,487,440 2,323,558 2,197,814 2,350,547 2,628,618 2,753,314 2,508,246 2,616,985 2,486,500 2,775,919 Percy Walker Pool…………………………………………… - - 33,774 380,020 459,274 503,243 467,604 534,863 469,798 534,305
Total business-type activities expenses……………………… 2,487,440 2,323,558 2,231,588 2,730,567 3,087,892 3,256,557 2,975,850 3,151,848 2,956,298 3,310,224
Total primary government expenses…………………………… $ 68,728,571 $ 77,071,093 $ 75,880,765 $ 79,138,352 $ 82,989,573 $ 88,315,201 $ 86,763,953 $ 85,289,157 $ 93,588,075 $ 100,710,314
Program RevenuesGovernmental activities:
Education charges for services……………………………… $ 6,232,869 $ 6,441,625 $ 6,099,245 $ 6,046,720 $ 5,942,281 $ 6,548,587 $ 6,468,917 $ 6,628,568 $ 6,844,498 $ 7,865,831 Public works charges for services…………………………… 1,698,068 2,920,314 1,755,578 1,818,978 1,801,734 1,928,235 1,913,976 1,801,517 1,705,098 2,008,238 Culture and recreation charges for services……………… 2,141,441 2,106,940 2,174,635 2,082,263 2,306,106 2,143,397 2,191,537 2,188,621 2,165,686 2,387,673 Other charges for services…………………………………… 2,223,067 2,939,352 2,557,845 2,527,548 3,414,885 3,170,531 3,284,393 4,171,799 4,490,079 3,544,447 Operating grants and contributions………………………… 10,749,772 12,761,352 13,460,616 14,269,178 13,958,828 13,969,717 15,014,771 11,256,335 13,869,319 16,276,654 Capital grant and contributions……………………………… 1,250,418 1,286,073 799,351 1,128,082 2,371,488 19,383,562 22,173,296 7,112,572 953,518 1,161,840
Total government activities program revenues...…………… 24,295,635 28,455,656 26,847,270 27,872,769 29,795,322 47,144,029 51,046,890 33,159,412 30,028,198 33,244,683
Business-type activities:Charges for services - water………………………………… 2,901,469 2,460,603 2,990,133 3,101,148 3,008,160 3,009,145 3,274,399 3,401,453 3,324,676 3,490,670 Charges for services - Percy Walker Pool………………… - - 46,497 304,513 313,563 372,637 315,811 283,813 253,582 255,901
Total business-type activities program revenues...…………… 2,901,469 2,460,603 3,036,630 3,405,661 3,321,723 3,381,782 3,590,210 3,685,266 3,578,258 3,746,571
Total primary government program revenues………………… $ 27,197,104 $ 30,916,259 $ 29,883,900 $ 31,278,430 $ 33,117,045 $ 50,525,811 $ 54,637,100 $ 36,844,678 $ 33,606,456 $ 36,991,254
Net (Expense)/RevenueGovernmental activities………………………………………… $ (41,945,496) $ (46,291,879) $ (46,801,907) $ (48,535,016) $ (50,106,359) $ (37,914,615) $ (32,741,213) $ (48,977,897) $ (60,603,579) $ (64,155,407) Business-type activities………………………………………… 414,029 137,045 805,042 675,094 233,831 125,225 614,360 537,418 621,960 436,347
Total primary government net expense……………………… $ (41,531,467) $ (46,154,834) $ (45,996,866) $ (47,859,922) $ (49,872,528) $ (37,789,390) $ (32,126,853) $ (48,440,479) $ (59,981,619) $ (63,719,060)
General Revenues and other Changes in Net PositionGovernmental activities:
Real estate and personal property taxes, net of tax refunds payable………………………………… $ 38,483,995 $ 40,555,656 $ 40,995,795 $ 41,964,019 $ 43,943,583 $ 45,330,505 $ 52,613,168 $ 54,467,814 $ 56,346,529 $ 57,825,786 Tax liens……………………………………………………… 126,079 48,105 220,392 133,744 20,397 74,317 128,258 17,656 2,570 65,223 Motor vehicle and other excise taxes……………………… 2,262,861 2,117,119 2,114,070 2,236,742 2,227,654 2,433,608 2,552,550 2,695,218 2,870,355 3,130,995 Community preservation taxes……………………………… 1,110,178 1,171,545 1,187,673 1,204,247 1,285,151 1,322,525 444,959 452,436 462,949 482,247 Penalties and interest on taxes……………………………… 108,421 155,068 177,297 157,119 239,386 208,925 241,339 240,792 263,221 285,929 Payments in lieu of taxes…………………………………… 28,750 12,804 9,321 4,250 10,950 12,956 12,934 15,965 13,476 11,725 Grants and contributions not restricted to specific programs…………………………………………… 1,385,213 1,145,359 872,532 994,936 904,812 982,014 995,264 1,062,816 982,675 1,030,560 Unrestricted investment income…………………………… 484,751 255,383 877,505 852,850 529,788 808,801 1,247,143 656,988 1,404,393 864,313 Miscellaneous………………………………………………… 30,914 - - - - - - - 6,500 50,000 Gain on sale of capital assets……………………………… - - - - - - - 212,580 - 4,440 Special Item - Conversion to governmental activities…… - - - - - - - - - (214,215) Transfers……………………………………………………… 309,109 313,716 276,806 149,908 (109,696) (138,378) (112,976) (210,612) (183,986) 292,328
Total governmental activities…………………………………… 44,330,271 45,774,755 46,731,391 47,697,815 49,052,025 51,035,273 58,122,639 59,611,653 62,168,682 63,829,331
Business-type activities:Special Item - Conversion to governmental activities…… - - - - - - - - - 214,215 Transfers……………………………………………………… (309,109) (313,716) (276,806) (149,908) 109,696 138,378 112,976 210,612 183,986 (292,328)
Total business-type activities…………………………………… (309,109) (313,716) (276,806) (149,908) 109,696 138,378 112,976 210,612 183,986 (78,113)
Total primary government $ 44,021,162 $ 45,461,039 $ 46,454,585 $ 47,547,907 $ 49,161,721 $ 51,173,651 $ 58,235,615 $ 59,822,265 $ 62,352,668 $ 63,751,218
Changes in Net PositionGovernmental activities………………………………………… $ 2,384,775 $ (517,124) $ (70,516) $ (837,201) $ (1,054,334) $ 13,120,658 $ 25,381,426 $ 10,633,756 $ 1,565,103 $ (326,076) Business-type activities………………………………………… 104,920 (176,671) 528,236 525,186 343,527 263,603 727,336 748,030 805,946 358,234
Total primary government……………………………………… $ 2,489,695 $ (693,795) $ 457,720 $ (312,015) $ (710,807) $ 13,384,261 $ 26,108,762 $ 11,381,786 $ 2,371,049 $ 32,158
Last Ten Years
Changes in Net Position
Town of Duxbury, Massachusetts 109 Comprehensive Annual Financial Report

2008 2009 2010 2011 2012 2013 2014 2015 2016 2017
General FundReserved………………………………$ 474,343 $ 823,067 $ 771,541 $ - $ - $ - $ - $ - $ - $ - Unreserved…………………………… 4,441,420 4,731,295 5,882,157 - - - - - - - Restricted…………………………… - - - - - 7,013,483 6,612,344 6,071,276 5,127,521 4,629,803 Committed…………………………… - - - 1,000,645 1,332,306 2,032,555 2,257,522 2,606,405 2,238,705 2,529,716 Assigned……………………………… - - - 2,054,451 1,698,230 2,234,372 1,474,689 1,785,239 1,621,478 2,468,179 Unassigned…………………………… - - - 6,606,737 7,868,426 6,504,610 7,823,978 6,775,272 7,631,064 7,535,397
Total general fund………………………$ 4,915,763 $ 5,554,362 $ 6,653,698 $ 9,661,833 $ 10,898,962 $ 17,785,020 $ 18,168,533 $ 17,238,192 $ 16,618,768 $ 17,163,095
All Other Governmental FundsReserved………………………………$ 1,788,474 $ 1,871,270 $ 1,926,345 $ - $ - $ - $ - $ - $ - $ - Unreserved, reported in:
Special revenue funds…………… 6,704,198 5,252,915 7,438,997 - - - - - - - Capital projects funds…………… 103,266 (82,588) 102,903 - - - - - - - Permanent funds………………… 406,604 263,675 430,125 - - - - - - - Nonspendable…………………… - - - 1,971,395 2,034,870 2,077,070 2,152,855 2,205,823 2,264,673 2,318,473 Restricted………………………… - - - 7,132,302 11,664,137 47,844,142 14,581,241 11,814,850 11,512,555 12,163,383 Unassigned………………………… - - - (961,306) (255,726) (498,150) - - (3,614,106) (321,546)
Total all other governmental funds……$ 9,002,542 $ 7,305,272 $ 9,898,370 $ 8,142,391 $ 13,443,281 $ 49,423,062 $ 16,734,096 $ 14,020,673 $ 10,163,122 $ 14,160,310
The Town implemented GASB 54 in 2011, fund balances prior to 2011 have been reported in the pre-GASB 54 format.
Last Ten Years
Fund Balances, Governmental Funds
Town of Duxbury, Massachusetts 110 Comprehensive Annual Financial Report

2008 2009 2010 2011 2012 2013 2014 2015 2016 2017
Revenues:Real estate and personal property taxes, net of tax refunds……………………………………………$ 38,456,971 $ 40,270,024 $ 40,844,508 $ 41,658,119 $ 43,933,438 $ 45,288,464 $ 52,513,892 $ 54,204,322 $ 56,295,558 $ 58,041,540 Tax and trash liens.....................…………………………… 101,964 123,783 216,803 84,186 91,948 69,547 34,594 17,656 67,508 60,471 Motor vehicle and other excise taxes……………………… 2,281,039 2,135,478 2,099,164 2,107,443 2,304,289 2,264,283 2,630,758 2,492,965 3,035,431 3,176,073 Sewer charges………………………………………………… 320,752 365,785 295,819 319,396 304,243 287,269 296,186 212,226 312,228 281,530 Trash disposal………………………………………………… 315,661 544,505 568,964 633,692 604,833 591,499 599,680 605,573 616,259 624,436 Intergovernmental……………………………………………… 14,015,696 14,682,388 15,069,862 15,405,675 17,004,600 32,930,015 38,635,421 18,317,424 15,926,713 17,244,211 Departmental and other……………………………………… 8,779,635 9,621,256 9,198,751 9,016,882 10,107,279 10,601,027 10,543,232 11,577,762 11,766,381 12,085,340 Community preservation taxes……………………………… 1,110,178 1,171,545 1,187,673 1,204,247 1,285,151 1,322,525 444,959 452,436 462,949 482,247 Contributions…………………………………………………… 84,246 537,054 275,223 341,316 348,240 302,255 290,207 319,020 351,013 555,113 Investment income…………………………………………… 327,076 255,659 812,935 753,198 464,529 728,342 1,072,436 554,845 1,156,690 764,562
Total Revenues………………………………………………… 65,793,218 69,707,477 70,569,702 71,524,154 76,448,550 94,385,226 107,061,365 88,754,229 89,990,730 93,315,523
Expenditures:
General government…………………………………………… 2,498,132 2,394,190 2,652,335 2,923,274 3,236,553 3,668,986 3,421,889 3,619,149 3,392,746 3,290,326 Public safety…………………………………………………… 5,790,187 6,210,899 6,308,590 6,139,513 7,110,163 7,272,844 7,456,518 8,076,183 7,892,295 8,830,467 Education……………………………………………………… 30,667,459 31,933,772 32,759,722 33,097,960 33,962,562 36,483,547 36,443,826 38,288,116 38,752,314 41,314,574 Public works…………………………………………………… 3,462,378 3,919,387 3,443,754 3,671,585 3,731,811 3,884,382 4,162,988 4,255,555 4,770,444 4,457,197 Human services………………………………………………… 551,566 642,844 652,303 694,772 765,164 928,925 935,898 887,962 980,453 932,530 Culture and recreation………………………………………… 1,886,953 1,853,985 1,746,958 1,277,439 1,639,688 1,796,905 1,722,918 1,706,659 2,250,499 2,476,854 Community preservation……………………………………… 192,695 99,858 100,102 635,483 718,536 163,408 260,986 52,013 136,400 62,700 Pension benefits - Town……………………………………… 1,790,855 1,879,350 1,937,647 2,199,485 2,159,162 2,422,765 2,525,382 2,840,847 3,075,063 3,168,990 Pension benefits - School…………………………………… 4,970,000 5,556,000 5,916,000 6,521,227 6,666,279 6,882,597 7,487,437 3,684,521 5,626,016 7,686,618 Property and liability insurance……………………………… 265,802 274,266 223,935 239,620 186,966 253,465 280,147 380,564 387,272 410,395 Employee benefits…………………………………………… 7,209,088 7,597,692 6,799,445 6,785,582 6,806,418 6,692,042 6,916,638 6,973,526 7,642,949 8,102,315 Claims and judgments....................................................... - - - - - - - - 435,000 - State and county charges………...………………………… 251,548 259,473 251,333 273,473 327,762 296,362 448,529 485,681 459,520 500,571 Capital outlay…………………………………………………… 1,499,905 4,908,558 3,121,296 3,917,109 16,632,384 53,127,988 61,056,139 16,721,338 9,887,399 (a) 2,296,384 Debt service: Principal……………………………………………………… 2,746,985 2,584,860 1,761,774 1,543,513 1,482,726 1,363,792 4,301,886 6,276,053 5,580,267 5,552,518 Principal - current refunding……………………………… - - - - - - - - 4,325,000 - Interest……………………………………………………… 787,513 673,298 590,079 520,706 502,267 505,484 4,576,710 3,112,964 3,026,758 2,900,403
Total Expenditures…………………………………………… 64,571,066 70,788,432 68,265,273 70,440,741 85,928,441 125,743,492 141,997,891 97,361,131 98,620,395 91,982,842
Excess (deficiency) of revenues over (under) expenditures………………………………… 1,222,152 (1,080,955) 2,304,429 1,083,413 (9,479,891) (31,358,266) (34,936,526) (8,606,902) (8,629,665) 1,332,681
Other Financing Sources (Uses):
Issuance of bonds and notes………………………………… 125,000 - 787,000 - 16,098,000 67,349,000 2,200,000 4,500,000 - 3,185,000 Issuance of refunding bonds………………………………… 1,300,000 - - - - - 425,000 282,000 4,120,000 - Premium from issuance of bonds and notes……………… 17,918 - 32,767 18,834 29,606 7,013,483 119,049 150,750 216,676 345,918 Premium from issuance of refunding bonds………………… 23,014 - - - - - - - - - Payments to refunded bond escrow agent………………… (1,294,074) - - - - - - - - - Sale of capital assets………………………………………… - - - - - - - 241,000 - 4,440 Transfers in…………………………………………………… 1,241,414 1,306,323 1,418,382 765,242 404,377 527,892 254,154 375,344 852,350 559,871 Transfers out…………………………………………………… (932,305) (992,607) (1,141,576) (615,334) (514,073) (666,270) (367,130) (585,956) (1,036,336) (785,876) Special item - Reclassification Percy Walker Pool………… - - - - - - - - - (100,519)
Total other financing sources (uses)…………………………… 480,967 313,716 1,096,573 168,742 16,017,910 74,224,105 2,631,073 4,963,138 4,152,690 3,208,834
Net change in fund balance………………………………………$ 1,703,119 $ (767,239) $ 3,401,002 $ 1,252,155 $ 6,538,019 $ 42,865,839 $ (32,305,453) $ (3,643,764) $ (4,476,975) $ 4,541,515
Debt service as a percentage of noncapital expenditures…… 5.60% 4.95% 3.61% 3.10% 2.86% 2.57% 10.97% 11.64% 14.57% 9.42%(a) Does not include the transfer of capital assets from the Percy Walker Pool Enterprise Fund.
Changes in Fund Balances, Governmental Funds
Last Ten Years
Town of Duxbury, Massachusetts 111 Comprehensive Annual Financial Report

Assessed Value and Actual Value of Taxable Property by Classification and Tax Rates
Last Ten Years
Assessed and Actual Values and Tax RatesResidential & Total Total Total
Residential Personal Property Commercial Industrial Personal Commercial Commercial Direct TownYear Value Tax Rate Value Value Property Value Tax Rate Rate (2) Value
2008 $3,529,253,752 $10.61 $91,783,748 $2,155,600 $28,288,280 $122,227,628 $10.61 $10.61 $3,651,481,3802009 (1) $3,605,653,048 $10.91 $92,736,552 $2,174,600 $34,180,600 $129,091,752 $10.91 $10.91 $3,734,744,8002010 $3,374,398,059 $11.81 $89,418,341 $2,233,500 $36,242,040 $127,893,881 $11.81 $11.81 $3,502,291,9402011 $3,222,272,471 $12.60 $87,896,029 $2,319,500 $40,395,200 $130,610,729 $12.60 $12.60 $3,352,883,2002012 (1) $3,067,422,072 $13.79 $88,685,699 $2,844,400 $41,683,140 $133,213,239 $13.79 $13.79 $3,200,635,3112013 $3,076,141,600 $14.19 $92,204,500 $2,735,800 $43,585,780 $138,526,080 $14.19 $14.19 $3,214,667,6802014 $3,133,284,628 $16.15 $94,583,642 $2,779,800 $45,889,560 $143,253,002 $16.15 $16.15 $3,276,537,6302015 (1) $3,366,472,285 $15.60 $90,881,004 $4,128,976 $44,938,420 $139,948,400 $15.60 $15.60 $3,506,420,6852016 $3,480,420,057 $15.55 $100,122,228 $3,009,900 $48,372,550 $151,504,678 $15.55 $15.55 $3,631,924,7352017 $3,590,943,268 $15.51 $100,882,281 $3,009,900 $52,872,380 $156,764,561 $15.51 $15.51 $3,747,707,829
(1) Revaluation year.(2) Weighted average direct tax rate, calculated as weighted average of residential, commercial and personal property tax rates.Source: Assessor's Department, Town of DuxburyAll property in the Commonwealth of Massachusetts is assessed at 100% of fair cash value.
Note: Chapter 59, Section 21C of the Massachusetts General Laws, known as "Proposition 2 1/2", imposes 2 separate limits on the annual tax levy of the Town. The primary limitation is that the tax levy cannot exceed 2 1/2 percent of the full and fair cash value. The secondary limitation is that the tax levy cannot exceed the maximum levy limit for the preceding year as determined by the State Commissioner of Revenue by more than 2 1/2 percent, subject to an exception for property added to the tax rolls and for certain substantial valuation increases other than as part of a general revaluation. The secondary limit may be exceeded in any year by a majority vote of the voters, however it cannot exceed the primary limitation.
95.83%
2.76%0.08% 1.33%
Total Assessed Value by ClassificationYear Ended June 30, 2016
Residential Commercial Industrial Personal Property
95.82%
2.69%0.08%
1.41%
Total Assessed Value by ClassificationYear Ended June 30, 2017
Residential Commercial Industrial Personal Property
0.0%0.5%1.0%1.5%2.0%2.5%3.0%3.5%4.0%4.5%5.0%
2008 2009 2010 2011 2012 2013 2014 2015 2016 2017
Commercial Value as % of Total Value
Town of Duxbury, Massachusetts 112 Comprehensive Annual Financial Report

Principal Taxpayers
Current Year and Nine Years Ago
Percentage of Percentage ofTotal Taxable Total Taxable
Nature of Assessed Assessed Assessed AssessedName Business Valuation Rank Value Valuation Rank Value
The Village at Duxbury - Assisted Living Retirement Community $35,205,100 1 0.94% $36,468,670 1 1.00%
Nstar Service Utility $19,389,920 2 0.52% $10,405,600 3 0.28%
The Village at Duxbury - 30 Apartments Retirement Community $11,260,400 3 0.30% $13,011,000 2 0.36%
Verizon New England Utility $10,336,300 4 0.28% - - -
Bay State Gas Public Utility $6,244,120 5 0.17% $5,466,980 8 0.15%
Individual Residence $7,665,700 6 0.20% $9,425,500 4 0.26%
Standish LLC Medical Office Building $7,070,200 7 0.19% $6,598,500 6 0.18%
Island Creek Village East Subsidized Housing $10,859,400 8 0.29% $5,293,900 9 0.14%
Battelle Memorial Institute Research & Office Building $7,026,000 9 0.19% - - -
Welch Thomas F & Welch Rita M Nursing Home $5,712,200 10 0.15% $6,428,800 7 0.18%
Individual Residence - - - $7,175,200 5 0.20%
Individual Residence - - - $4,698,700 10 0.13%
Totals $120,769,340 3.22% $104,972,850 2.87%Source: Assessor's Department
2017 2008
Town of Duxbury, Massachusetts 113 Comprehensive Annual Financial Report

Less Percent of(2) Reserve for (2) First Year Percent of Delinquent Total Total Tax
Total Abatements & Net Net as % Current Net Levy Tax Tax Collections toYear Tax Levy Exemptions Tax Levy of Total Tax Collections Collected Collections Collections Net Tax Levy (3)
2008 $38,742,217 $278,653 $38,463,564 99.28% $37,686,962 97.98% $537,732 $38,224,694 99.38%2009 (1) $40,746,066 $298,044 $40,448,022 99.27% $39,912,037 98.67% $446,809 $40,358,846 99.78%2010 $41,362,073 $252,238 $41,109,835 99.39% $40,569,284 98.69% $532,412 $41,101,696 99.98%2011 $42,246,328 $248,028 $41,998,300 99.41% $41,174,757 98.04% $765,813 $41,940,570 99.86%2012 (1) $44,136,761 $268,633 $43,868,128 99.39% $43,785,222 99.81% $551,104 $44,336,326 101.07%2013 $45,616,134 $285,269 $45,330,865 99.37% $44,899,174 99.05% $935,072 $45,834,246 101.11%2014 $52,916,083 $232,932 $52,683,151 99.56% $51,883,927 98.48% $589,775 $52,473,702 99.60%2015 (1) $54,700,163 $214,125 $54,486,038 99.61% $53,668,095 98.50% $634,864 $54,302,959 99.66%2016 $56,476,430 $222,947 $56,253,483 99.61% $55,536,843 98.73% $900,660 $56,437,502 100.33%2017 $58,126,948 $202,417 $57,924,531 99.65% $57,151,655 98.67% $0 $57,151,655 98.67%
(1) Revaluation year.(2) Includes tax liens.(3) If the actual abatements and exemptions are lower than the estimate, the actual collections can exceed the net levy.Source: Official Statements, Town of Duxbury.
Property Tax Levies and Collections
Last Ten Years
2008 2009 2010 2011 2012 2013 2014 2015 2016 2017
Mill
ions
Real Estate Tax Levies vs. First Year CollectionsLast Ten Years
Real Estate Tax Levy First Year Current Tax Collections
Town of Duxbury, Massachusetts 114 Comprehensive Annual Financial Report

Ratios of Outstanding Debt by Type
Last Ten Years
General General Total Percentage DebtObligation Capital Obligation Capital Debt of Personal U. S. Census Per
Year Bonds (1) Leases Bonds (1) Leases Outstanding Income (2) Population Capita
2008 $ 17,341,100 $ - $ 4,559,000 $ - $ 21,900,100 3.07% 15,360 $ 1,426 2009 14,756,240 - 6,944,000 - 21,700,240 2.99% 15,372 1,412 2010 13,781,466 - 8,523,149 - 22,304,615 3.15% 15,059 1,481 2011 12,237,953 - 7,623,610 - 19,861,563 2.78% 15,274 1,300 2012 26,853,227 - 6,729,413 - 33,582,640 4.53% 15,290 2,196 2013 92,838,435 - 5,957,505 - 98,795,940 12.87% 15,582 6,340 2014 91,161,549 - 6,101,831 - 97,263,380 11.40% 15,560 6,251 2015 89,667,496 - 5,450,336 - 95,117,832 10.77% 15,636 6,083 2016 89,180,995 - 4,804,962 - 93,985,957 10.13% 15,937 5,897 2017 87,837,836 - 2,966,651 - 90,804,487 9.90% 15,297 5,936
(1) Presented net of original issuance discounts and premiums.(2) Personal income is disclosed on the Schedule of Demographic and Economic Statistics.
Source: Audited Financial Statements, U. S. Census
Governmental Activities Business-type Activities
Town of Duxbury, Massachusetts 115 Comprehensive Annual Financial Report
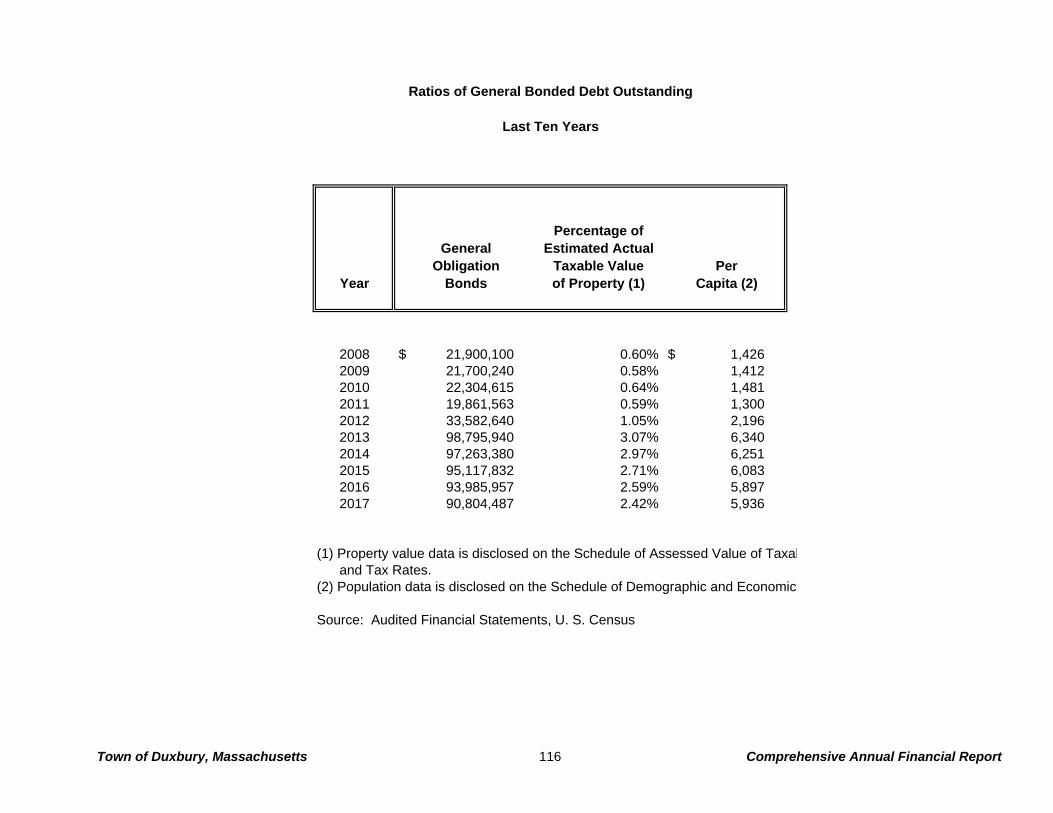
Ratios of General Bonded Debt Outstanding
Last Ten Years
Percentage ofGeneral Estimated Actual
Obligation Taxable Value PerYear Bonds of Property (1) Capita (2)
2008 $ 21,900,100 0.60% $ 1,426 2009 21,700,240 0.58% 1,412 2010 22,304,615 0.64% 1,481 2011 19,861,563 0.59% 1,300 2012 33,582,640 1.05% 2,196 2013 98,795,940 3.07% 6,340 2014 97,263,380 2.97% 6,251 2015 95,117,832 2.71% 6,083 2016 93,985,957 2.59% 5,897 2017 90,804,487 2.42% 5,936
(1) Property value data is disclosed on the Schedule of Assessed Value of Taxab and Tax Rates.(2) Population data is disclosed on the Schedule of Demographic and Economic
Source: Audited Financial Statements, U. S. Census
Town of Duxbury, Massachusetts 116 Comprehensive Annual Financial Report
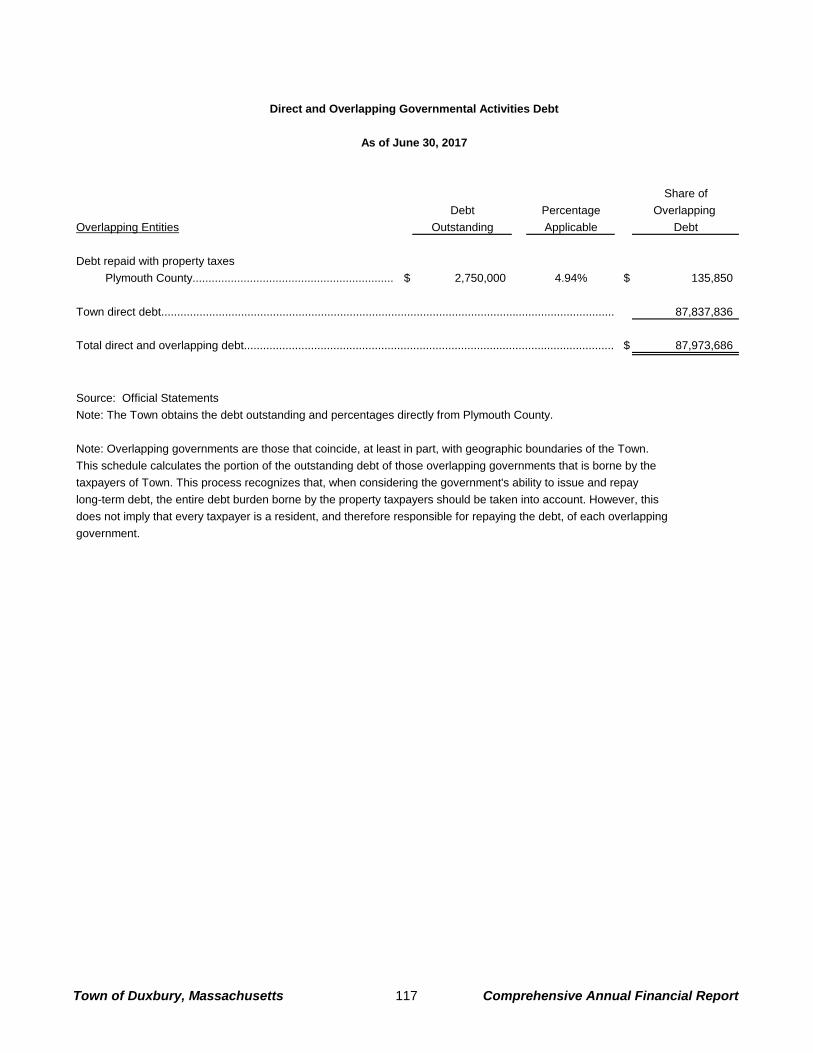
Direct and Overlapping Governmental Activities Debt
As of June 30, 2017
Share ofDebt Percentage Overlapping
Overlapping Entities Outstanding Applicable Debt
Debt repaid with property taxesPlymouth County............................................................... $ 2,750,000 4.94% $ 135,850
Town direct debt.............................................................................................................................................. 87,837,836
Total direct and overlapping debt.................................................................................................................... $ 87,973,686
Source: Official Statements Note: The Town obtains the debt outstanding and percentages directly from Plymouth County.
Note: Overlapping governments are those that coincide, at least in part, with geographic boundaries of the Town.This schedule calculates the portion of the outstanding debt of those overlapping governments that is borne by thetaxpayers of Town. This process recognizes that, when considering the government's ability to issue and repay long-term debt, the entire debt burden borne by the property taxpayers should be taken into account. However, this does not imply that every taxpayer is a resident, and therefore responsible for repaying the debt, of each overlapping government.
Town of Duxbury, Massachusetts 117 Comprehensive Annual Financial Report

2008 2009 2010 2011 2012 2013 2014 2015 2016 2017
Equalized Valuation……………………………… $ 3,837,216 $ 4,026,593 $ 4,026,593 $ 3,853,684 $ 3,853,684 $ 3,466,188 $ 3,466,188 $ 3,475,391 $ 3,475,391 $ 3,475,391
Debt Limit -5% of Equalized Valuation………… $ 191,861 $ 201,330 $ 201,330 $ 192,684 $ 192,684 $ 173,309 $ 173,309 $ 173,770 $ 173,770 $ 173,770
Less:
Outstanding debt applicable to limit………… 15,612 13,287 14,936 13,315 11,758 29,227 29,061 26,477 23,716 21,195 Authorized and unissued debt applicable to limit………………………… 3,579 13 - - 3,325 1,900 200 200 - -
Legal debt margin………………………………… $ 172,670 $ 188,030 $ 186,394 $ 179,369 $ 177,601 $ 142,182 $ 144,048 $ 147,093 $ 150,054 $ 152,575
Total debt applicable to the limit as a percentage of debt limit…………………… 10.00% 6.61% 7.42% 6.91% 7.83% 17.96% 16.88% 15.35% 13.65% 12.20%
Source: Assessor's Office
(Amounts in Thousands)
Last Ten Years
Computation of Legal Debt Margin
Town of Duxbury, Massachusetts 118 Comprehensive Annual Financial Report
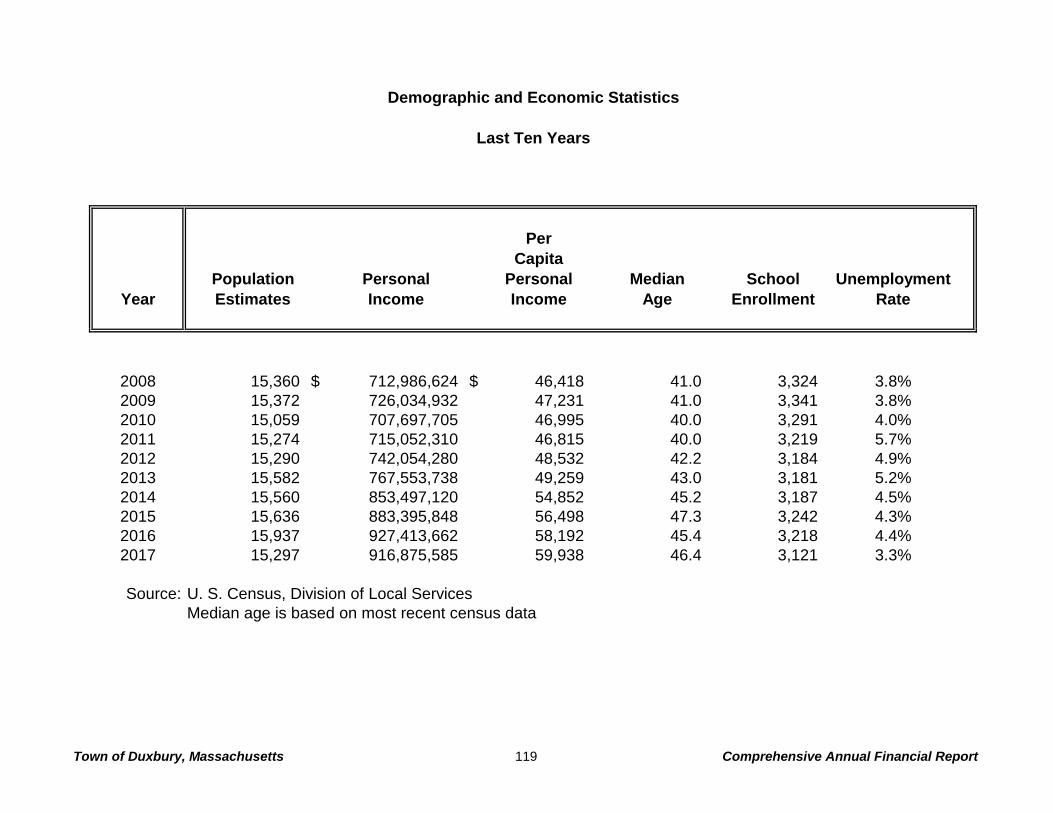
Demographic and Economic Statistics
Last Ten Years
PerCapita
Population Personal Personal Median School UnemploymentYear Estimates Income Income Age Enrollment Rate
2008 15,360 $ 712,986,624 $ 46,418 41.0 3,324 3.8%2009 15,372 726,034,932 47,231 41.0 3,341 3.8%2010 15,059 707,697,705 46,995 40.0 3,291 4.0%2011 15,274 715,052,310 46,815 40.0 3,219 5.7%2012 15,290 742,054,280 48,532 42.2 3,184 4.9%2013 15,582 767,553,738 49,259 43.0 3,181 5.2%2014 15,560 853,497,120 54,852 45.2 3,187 4.5%2015 15,636 883,395,848 56,498 47.3 3,242 4.3%2016 15,937 927,413,662 58,192 45.4 3,218 4.4%2017 15,297 916,875,585 59,938 46.4 3,121 3.3%
Source: U. S. Census, Division of Local ServicesMedian age is based on most recent census data
Town of Duxbury, Massachusetts 119 Comprehensive Annual Financial Report
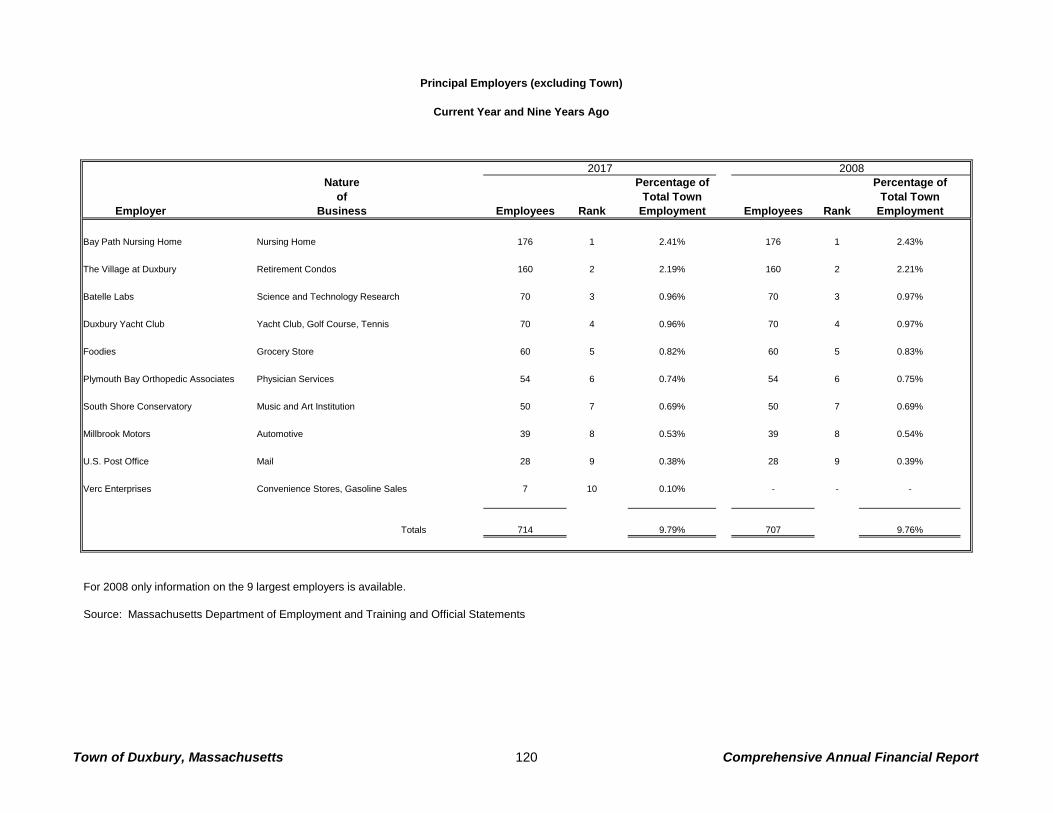
Principal Employers (excluding Town)
Current Year and Nine Years Ago
Nature Percentage of Percentage ofof Total Town Total Town
Employer Business Employees Rank Employment Employees Rank Employment
Bay Path Nursing Home Nursing Home 176 1 2.41% 176 1 2.43%
The Village at Duxbury Retirement Condos 160 2 2.19% 160 2 2.21%
Batelle Labs Science and Technology Research 70 3 0.96% 70 3 0.97%
Duxbury Yacht Club Yacht Club, Golf Course, Tennis 70 4 0.96% 70 4 0.97%
Foodies Grocery Store 60 5 0.82% 60 5 0.83%
Plymouth Bay Orthopedic Associates Physician Services 54 6 0.74% 54 6 0.75%
South Shore Conservatory Music and Art Institution 50 7 0.69% 50 7 0.69%
Millbrook Motors Automotive 39 8 0.53% 39 8 0.54%
U.S. Post Office Mail 28 9 0.38% 28 9 0.39%
Verc Enterprises Convenience Stores, Gasoline Sales 7 10 0.10% - - -
Totals 714 9.79% 707 9.76%
For 2008 only information on the 9 largest employers is available.
Source: Massachusetts Department of Employment and Training and Official Statements
2017 2008
Town of Duxbury, Massachusetts 120 Comprehensive Annual Financial Report
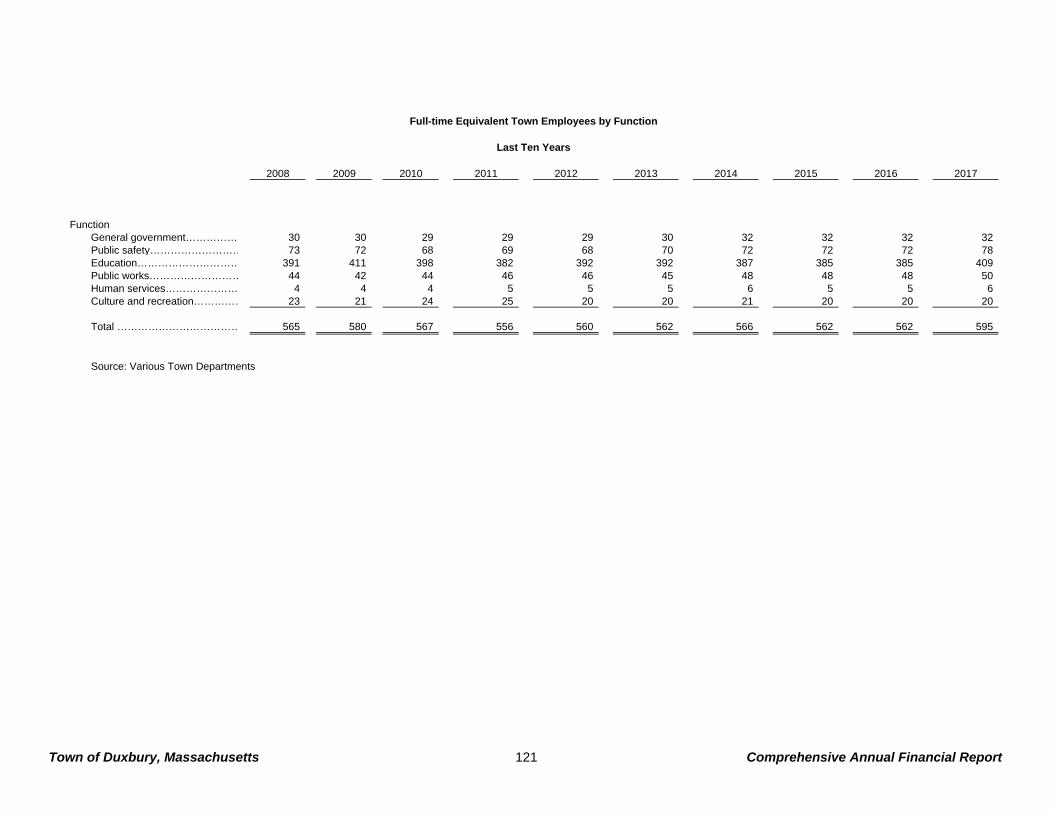
2008 2009 2010 2011 2012 2013 2014 2015 2016 2017
Function General government…………… 30 30 29 29 29 30 32 32 32 32 Public safety……………………… 73 72 68 69 68 70 72 72 72 78 Education………………………… 391 411 398 382 392 392 387 385 385 409 Public works……………………… 44 42 44 46 46 45 48 48 48 50 Human services………………… 4 4 4 5 5 5 6 5 5 6 Culture and recreation…………… 23 21 24 25 20 20 21 20 20 20
Total ……………………………… 565 580 567 556 560 562 566 562 562 595
Source: Various Town Departments
Last Ten Years
Full-time Equivalent Town Employees by Function
Town of Duxbury, Massachusetts 121 Comprehensive Annual Financial Report

Function/Program 2008 2009 2010 2011 2012 2013 2014 2015 2016 2017
Fire DepartmentFire related calls………………………………………… 810 805 606 817 1,035 1,131 847 1,066 992 973 Rescue/EMS……………………………………………… 1,199 1,247 1,328 1,281 1,245 1,323 1,291 1,345 1,479 1,441
Inspectional Services Department Number of building permits (quick and zoning)……… 762 626 522 491 794 573 593 699 769 741 Number of electrical permits…………………………… 483 343 362 368 429 477 606 536 600 543 Number of plumbing/gas permits……………………… 658 529 531 543 618 739 871 796 869 739
Water/Sewer Number of gallons pumped (millions)………………… 543,000 492,250 410,896 500,002 499,754 469,000 502,942 552,891 563,756 587,577 Number of new services added………………………… 15 13 15 8 11 6 6 4 25 8 Number of additional mains installed………………… 10,810 - - - - 1 1 - - - Number of main improvements………………….……… 2 1 - 2 1 2 2 1 - 2
Highway Number of miles completed-road rehab……………… 3 3 4 2 2 3 3 4 2 7 Number of snow operations……………………...…… 35 54 39 31 2 30 36 48 21 22
Cemetery Cremations……………………………………...………… 3,240 3,624 3,014 3,008 3,184 3,248 3,382 2,956 2,583 2,780
Recreation Number of programs offered…………………………… 52 52 60 56 65 68 64 70 68 69 Number of participants-winter………………………… 585 578 588 555 504 522 595 739 664 702 Number of participants-spring………………………… 349 342 320 272 397 325 302 469 371 358 Number of participants-summer………………………… 737 788 822 762 955 798 702 848 766 528 Number of participants-fall….…………………………… 638 642 658 558 507 439 440 442 484 489
Parking Sticker Sales Non resident over sand………………………………… 3,075 2,948 3,512 3,653 3,771 3,281 2,981 3,122 2,862 3,043 Over sand………………………………………………… 2,935 3,331 3,051 3,127 3,203 2,730 3,267 3,873 3,088 3,195 Parking lot………………………………………………… 3,569 3,895 3,511 3,423 3,276 2,799 2,204 2,631 2,968 3,011 Transfer station…………………………………………… 6,178 6,376 6,122 5,822 5,617 5,088 5,207 6,129 5,652 5,886
Senior Center Number of visitors……………………………………… 24,585 34,200 31,940 32,500 27,902 28,000 32,381 34,083 41,081 41,633 Number of activities……………………………………… 1,788 2,234 2,364 2,256 2,308 2,602 10,339 3,492 3,560 3,780 Number of congregate meals…………………………… 4,986 4,693 5,356 4,867 5,367 5,384 5,949 5,050 8,124 4,833 Number of delivered meals……………………………… 7,064 7,005 4,218 5,301 4,025 4,515 4,440 3,996 4,996 6,261 Number of meals served from the café……………… - - - - - - - 5,537 7,558 9,424 Number of paying rentals……………………………… 357 172 135 322 376 118 27 25 13 17 Number of committee meetings………………………… 382 325 340 59 43 180 294 300 423 254
Duxbury Free Library Holdings…………………………………………………… 121,685 121,609 116,948 115,006 117,461 109,437 112,783 253,933 243,665 154,234 Reference questions answered………………………… 6,857 7,887 8,537 8,159 7,829 6,862 6,788 6,368 6,485 6,764 Print materials loaned…………………………………… 167,153 167,206 174,542 168,838 202,980 157,088 151,582 139,986 137,287 131,840 Videos loaned…………………………………………… 75,445 93,416 82,615 48,883 47,071 44,584 41,254 37,444 32,319 28,987 All loans…………………………………………………… 242,598 260,622 257,457 247,909 250,059 236,207 229,079 213,943 212,020 201,278 Loans provided to other towns………………………… 35,212 37,978 39,594 39,282 41,306 38,109 22,163 20,419 21,461 19,991 Materials borrowed from other towns………………… 27,610 31,847 32,107 30,564 29,639 25,625 14,768 13,327 14,857 14,587 Children's programs held……………………………… 246 248 234 259 238 228 338 334 383 427 Children's program attendance………………………… 7,056 6,871 6,646 6,413 6,316 5,558 6,856 6,057 7,062 8,523 Adult & Teen programs held…………………………… 214 236 241 228 262 332 445 467 395 411 Adult & Teen program attendance…………………… 4,849 3,218 3,690 3,901 4,234 4,618 4,300 4,402 4,064 4,098 Public computers………………………………………… 16 17 30 30 30 30 37 31 35 39 Public meeting room use………………………………… 888 979 998 975 941 842 964 918 913 1,160
Source: Various Town Departments
Operating Indicators by Function/Program
Last Ten Years
Town of Duxbury, Massachusetts 122 Comprehensive Annual Financial Report

Function/Program 2008 2009 2010 2011 2012 2013 2014 2015 2016 2017
General GovernmentNumber of buildings……………………… 5 5 5 5 5 5 5 5 5 5
Police Number of stations……………………… 1 1 1 1 1 2 2 2 1 1 Animal control facilities………………… 1 1 1 1 1 1 1 1 1 1
Fire Number of stations……………………… 2 2 2 2 2 2 2 2 2 2 Antique apparatus storage……………… 1 1 1 1 1 1 1 1 1 1
Harbormaster Number of buildings……………………… 2 2 2 2 2 2 2 2 2 2 Public beaches…………………………… 3 3 3 3 3 3 3 3 3 3 Public landings…………………………… 16 16 16 16 16 16 16 16 16 16
Education Number of elementary schools………… 2 2 2 2 2 2 2 2 2 2 Number of middle schools……………… 1 1 1 1 1 1 1 1 1 1 Number of high schools………………… 1 1 1 1 1 1 1 1 1 1 Performing arts center…………………… 1 1 1 1 1 1 1 1 1 1
Public Works Water pumping stations………………… 13 13 13 13 13 13 13 13 13 13 Water towers……………………………… 2 2 2 3 3 3 3 3 3 3 Water other……………………………… 3 3 3 3 3 3 3 3 3 3 Sewage treatment plant………………… 1 1 1 1 1 1 1 1 1 1 Shared septic systems………………… 2 2 2 2 2 2 2 2 2 2 Public works buildings…………………… 11 11 11 11 11 11 11 11 11 11 Crematories……………………………… 1 1 1 1 1 1 1 1 1 1 Cemetery buildings……………………… 3 3 3 3 3 3 3 3 3 3
Human Services Council on aging - senior center……… 1 1 1 1 1 1 1 1 1 1
Culture and Recreation Recreation land (acreage)……………… 179.5 179.5 179.5 182.5 187.5 190.5 190.5 190.5 455.5 455.5 Playgrounds*……………………………… 3 3 3 3 3 3 3 3 3 3 Ball fields*………………………………… 29 29 29 29 29 29 29 29 29 29 Basketball courts………………………… 3 3 3 3 3 3 3 3 3 3 Tennis courts……………………………… 14 14 14 14 14 14 14 14 14 14 Pools……………………………………… 1 1 1 1 1 1 1 1 1 1 Golf courses……………………………… 1 1 1 1 1 1 1 1 1 1 Golf clubhouses………………………… 1 1 1 1 1 1 1 1 1 1 Golf course buildings…………………… 4 4 4 3 3 3 3 3 3 3 Libraries…………………………………… 1 1 1 1 1 1 1 1 1 1
Source: Various Town Departments
* The Town has significantly improved fields/recreational facilities during the last ten years. Most of the fields have new irrigation systems.
Last Ten Years
Capital Asset Statistics by Function/Program
Town of Duxbury, Massachusetts 123 Comprehensive Annual Financial Report