toward a better performance evaluation framework for fake
TRANSCRIPT

Proceedings of the Fourteenth International AAAI Conference on Web and Social Media (ICWSM 2020)
Toward a Better Performance Evaluation Framework for Fake News Classification
Lia Bozarth, Ceren BudakUniversity of Michigan, School of Information
105 S State StAnn Arbor, MI 48109
{lbozarth, cbudak}@umich.edu
Abstract
The rising prevalence of fake news and its alarming down-stream impact have motivated both the industry and academiato build a substantial number of fake news classificationmodels, each with its unique architecture. Yet, the researchcommunity currently lacks a comprehensive model evalua-tion framework that can provide multifaceted comparisonsbetween these models beyond the simple evaluation metricssuch as accuracy or f1 scores. In our work, we examine arepresentative subset of classifiers using a very simple set ofperformance evaluation and error analysis steps. We demon-strate that model performance varies considerably based oni) dataset, ii) evaluation archetype, and iii) performance met-rics. Additionally, classifiers also demonstrate a potential biasagainst small and conservative-leaning credible news sites.Finally, models’ performance varies based on external eventsand article topics. In sum, our results highlight the need tomove toward systematic benchmarking.
Introduction
In the United States, many political pundits and media schol-ars alike have cautioned against the rising influence of fakenews (Silverman 2017; Balmas 2014), stressing that thespread of false information weakens the legitimacy and pub-lic trust in the established political and media institutions.Outside of the U.S., fake news has been tied to Brexit inEurope (Kucharski 2016), and the rising hate, violence, andnationalism in Indonesia (Kwok 2017). It has also beenlinked to the endangerment of election integrity of Euro-pean and Latin American nations (Fletcher et al. 2018;Alimonti and Veridiana 2018). Indeed, fake news, backedby armies of social bots, disseminates significantly fasterand deeper than mainstream news (Shao et al. 2017). Addi-tionally, subsequent research also suggests that it is difficultfor the general public to distinguish fake news from crediblecontent. Equally alarming is that repeated exposure causesreaders to perceive false content as more accurate (Balmas2014). Past work also shows the importance of detecting andcombating misinformation in its early phases of spread (Bu-dak, Agrawal, and El Abbadi 2011). Thus, timely, scalable,
Copyright c© 2020, Association for the Advancement of ArtificialIntelligence (www.aaai.org). All rights reserved.
and high-performing fake news detection automatons be-come a vital component in combating fake news.
Thus far, researchers have leveraged linguistic attributes,user network characteristics, temporal propagation patternsof news articles, and various machine learning paradigmsto build effective models that separate fake news fromtraditional news content (Ruchansky, Seo, and Liu 2017;Liu and Wu 2018; Shu et al. 2019a; Horne et al. 2018;Castelo et al. 2019; Yang et al. 2019). These are all valuablecontributions. Some of these novel approaches led to highperforming classifiers with exceptionally high accuracy andF1 scores. Yet, our review also reveals a key gap: many pa-pers lack comprehensive model performance evaluation anderror analysis steps. Here, we first review 23 distinct classi-fiers from related work and consolidate each according to 4major components: data source, data types, feature engineer-ing techniques, and machine learning paradigms. We thenreached out to the authors of 17 papers and acquired a to-tal of 5 classifiers. Next, we evaluate these models using afew very simple procedures. Our paper makes the followingcontributions:
• We show that model performance may vary drasticallybased on the choice of dataset. As such, results from in-dividual papers, especially those that use a single datasetfor evaluation, should be taken with a grain of salt.
• Additionally, classifiers generally have significantlyhigher performance when trained and validated usingthe common 5-fold 80/20 data split evaluation archetypecompared to validation using a set of domains never be-fore encountered in training. This suggests that classifiersmight be learning domain-specific features as opposed toactual distinctions between fake and traditional news.
• We show that all classifiers studied here demonstratesignificantly higher false-positive rates for right-leaningmainstream news sites. This bias raises an important con-cern for trust in fake news detection systems. Similarly,articles from small credible news sites are also classifiedas fake news more often than those from large sites.
• Next, the performance of classifiers can be worse follow-ing external shocks such as scandals. This indicates thattemporal variations in classifier performance need to be
60
taken into consideration when taking actions based onthese predictions.
• Finally, models generally have a higher false-positive ratewhen classifying news articles involving scandals, and ahigher false-negative rate for articles focused on the 2016election (e.g., polling results).In sum, our simple evaluation approach reveals potential
biases and significant weaknesses in existing classifiers. Italso provides a cautionary tale for real-world applicationsthat use these models. Our work sufficiently demonstratesthat using simple metrics such as accuracy, AUC, or F1 toevaluate and compare models is insufficient. As a commu-nity, we need to collectively investigate and construct a morecomprehensive performance evaluation framework for fakenews classification.
Fake News Classifiers—Review & SelectionWe first review a total of 23 existing fake news classifiersin Section . We observe that text, relational and temporalitydata are the most commonly used data to construct feature-sets: within the 23 classifiers reviewed, 17 (or 74%) exclu-sively use 1 or more of the 3 data types. The remaining 6use at least 1 additional data type (e.g., images). Next, wereach out to authors of all 17 papers and obtained 5 coderepositories. We describe this subset of models in detail inSection .
Meta-review
As shown in Figure 1, the process of building a fake newsclassifier consists of 4 major decisions: i) choosing data-sources, ii) selecting a subset of data from all available datatypes, iii) deciding on the techniques that transform raw datainto features (i.e., feature engineering). These features arebundled closely with iv) the specific machine learning algo-rithm(s) one adopts.
Data Sources: News sites and social media platforms arethe two primary data sources. Our review shows that 12 (or52.1%), and 15 (or 65.2%) out of the 23 classifiers use datafrom news sites and social media platforms respectively,with four (or 17.4%) using both sources.
Data Types: We show text data are by far the most com-mon with 21 (or 91.3%) classifiers using at least some text-based data. It’s followed by relational data (e.g., follower,friend) at 47.8% and temporality data at 26.0% usage. Asmall number of classifiers also use additional data types in-cluding multimedia images and videos (Gupta et al. 2013;Boididou et al. 2018). Other data types include author age,gender, and credibility (Long et al. 2017; Shu, Wang, andLiu 2018); website DNS records (Ma et al. 2009); webmarkup and advertising (Castelo et al. 2019); and geo lo-cation (Deligiannis et al. 2018).
Feature Engineering: A large arsenal of techniques areavailable to transform raw data of varied types into usablefeatures.
Text Data: First, features can be extracted from text us-ing existing theories and domain knowledge such as psy-cholinguistic theories and frameworks (Horne et al. 2018;
Castelo et al. 2019; Zhou and Zafarani 2019). Focusing onnews articles, these features include i) quality, complexityand style (e.g. word count, lexicon diversity, readability),and ii) psychological attributes (e.g., sentiment, subjectiv-ity, biases). See (Zhou and Zafarani 2018) for a detailedliterature review. Intuitively, fake news articles are likelyto include more “clickbaity” elements—capitalization of allwords in the title, use of many exclamation marks, or adop-tion of sharp and sentimental words (e.g., “poisoning”) inthe text. Within a social context, user profile descriptions oruser posts can be used to derive implicit features such as auser’s personality, gender, and age (Shu et al. 2019b). Thesefeatures are also used to detect fake news. As such, this fea-ture extraction approach often leads to highly explainableand transparent classifiers.
Additionally, text can be transformed into i) ngrams,commonly combined with tfidf weighting (Ahmed, Traore,and Saad 2017; Qazvinian et al. 2011); ii) vectors, i.e.,converting content to numeric vectors using variations ofGloVE, Skipgram, CBOW, and then word2vector, sent2vec,or doc2vec (Riedel et al. 2017; Gravanis et al. 2019); andiii) tensors (Guacho et al. 2018; Papanastasiou, Katsimpras,and Paliouras 2019), which are 3-dimensional vector rep-resentations of words or documents. Extracted features canalso undergo additional transformation steps including fea-ture reduction.
Finally, researchers also use text to build networks (e.g.,hashtag-hashtag or text similarity-based networks) and de-rive graph-based features (Rubin 2018).
Relational Data: Relational data are generally used toconstruct networks (e.g., follower-followee network, retweetnetwork, user-article bipartite network). Researchers thenuse these networks to derive usable features including com-munities, clustering coefficient, and network motifs. (Co-letto et al. 2017; Volkova et al. 2017). Networks can alsobe represented as matrices which can then be reducedinto a low-dimensional representation and adopted as fea-tures (Ruchansky, Seo, and Liu 2017). Finally, these net-works can be used by semi-supervised label propagationclassifiers (Tacchini et al. 2017).
Temporality Data: Many existing studies use temporalitydata to build classifiers (Jin et al. 2014; Liu and Wu 2018;Ruchansky, Seo, and Liu 2017; Do et al. 2019). For in-stance, Do et al. (2019) and Ruchansky et al. (2017) parti-tion user interactions (posts) about news based on the times-tamps. Posts within the same partition are treated as a singletext document. Liu and Wu (2018) model the propagationpath of each news story as a multivariate time series whichare then used as features. Additionally, similar to relationaldata, propagation networks can also be used to extract usefulgraph-based features such as motifs.
Machine Learning Paradigms: Reviewed classifiers canbe categorized as supervised, semi-supervised or unsuper-vised. Work by Katsaros et al. (2019) provides an overviewof existing classifiers categorized with respect to paradigms.Further, supervised models can be subcategorized as neuralnetwork (Volkova et al. 2017; Riedel et al. 2017; Ruchan-sky, Seo, and Liu 2017; Wang et al. 2018; Ma, Gao, and
61

Figure 1: An Overview of the Fake News Detection Process. This process consists of 4 major choices in: i) datasources, ii) datatypes, iii) feature engineering techniques, and iv) machine learning paradigm.
Wong 2018; Zhang, Dong, and Yu 2019) or non-neural net-work based approaches (Ahmed, Traore, and Saad 2017;Horne et al. 2018; Castelo et al. 2019; Gravanis et al.2019). Semi-supervised models use label propagation tech-niques (Jin et al. 2014; Tacchini et al. 2017; Rubin 2018;Guacho et al. 2018). Last, the unsupervised paradigm is veryrare–we identified only one related prior work (Yang et al.2019).
Representative Fake News Classifiers
From the 17 models, we see that 3 include a code repositorylink in their original publication. We then emailed authorsof the remaining 14 papers, and 5 of them responded. Fi-nally, we include 2 of the 5 models in our subsequent anal-ysis 1 In sum, we collect a total of 5 distinct classifiers:BTC, CSI, HOAX, NELA, and RDEL. The code reposito-ries (including our code) are available at https://github.com/lbozarth/fakenewsMPE.BTC: This classifier (Gravanis et al. 2019) uses only news
article text data. The authors extract 70 stylistic and psy-cholinguistic features (e.g., number of unique words, sen-
1Two of the classifiers (Bourgonje, Schneider, and Rehm 2017;Guacho et al. 2018) are omitted due to our lack of experience withthe programming language (e.g., MatLab). For the 3rd, our perfor-mance analysis reveals that it likely has an over-fitting issue due toits HTML-based features. To elaborate, we use the pre-generatedHTML-based features and model provided by the paper. We trainthe model on 90% of the domains and validate on the remaining10% (see the bydomains archetype in Section ). The accuracy scoreprovided in the paper using 5-fold training and validation is 0.86.In comparison, here, accuracy scores are 0.84 and 0.75 for trainingand validation respectively. Further, the AUC scores are 0.92 and0.69, suggesting overfitting. We also used the leave-one-out train-ing and validation approach. Observations are similar. Given theoverfitting and that collecting HTML features for 0.7M webpagesin our dataset (see Section ) is also a costly task, we choose to omitthis model from our analysis.
tence readability, and sentiment) and geo-location features.Additionally, they transform each word into a vector usingGLOVE and then sum the vectors to generate a vector rep-resentation of each article. The authors use Adaboost (Pe-dregosa et al. 2011) and concatenation of listed features tomodel fake news.CSI: For each news article, this paper (Ruchansky, Seo,
and Liu 2017) first partitions user engagements (e.g., tweets)with an article based on timestamps of the posts. All engage-ments within a partition are treated as a single document.They then use LSTM to capture the temporal patterns of thedocuments. Additionally, the authors also build a user-usernetwork with the edge weight being the number of sharedarticles between pairs of users. This network’s correspond-ing adjacency matrix is then used to generate lower dimen-sional features that capture the similarity of users’ articlesharing behavior. Finally, both sets of features are integratedtogether using another neural network layer.HOAX: The authors (Tacchini et al. 2017) construct a
user-article bipartite graph based on whether a user liked orshared an article or a post. They then use semi-supervisedharmonic label propagation to classify unlabeled articles.This approach is based on the hypothesis that users who fre-quently like or share fake or low-quality content can be usedto identify the quality of unlabeled content.NELA: This classifier (Horne et al. 2018) uses the follow-
ing 3 distinct dimensions of text-based features to predictfake news: i) style features (e.g. exclamation marks, verbtense, pronoun usage), ii) psycholinguistic features suchas sentiment scores using LIWC, SentiStrength (Thelwall2017) and iii) content complexity features including read-ability (Mc Laughlin, 1969), dictionary size, and averageword length. We refer readers to the original paper for thecomplete list of 100+ features. The authors use Linear Sup-port Vector Machine (SVM) and Random Forest as theirclassification algorithms.
62

CLF Source Text Relational Temporal Other Number of Fea-tures
Machine LearningParadigm
BTC NewsSites
stylistic; psy-cholinguistics;co-ntent complexity;word2vec
X X geotextfeatures(from text)
70 (e.g., stylis-tic); 300(word2vec);N (geotext)
supervised; non-NN;AdaBoost
CSI SocialMedia
doc2vec user-user YES X 122 supervised; NN;LSTM
HOAX SocialMedia
X user-article X X X semi-supervised;propagation
NELA NewsSites
stylistic; psycholin-guistics; co-ntentcomplexity
X X X 122 supervised; non-NN;RandomForest
RDEL NewsSites
ngram (tfidf); cosinesimilarity between ti-tle and text
X X X 4001 supervised; NN;Multi-layer Percep-tron
Table 1: Overview of Classifiers based on i) data source, ii) data types, iii) feature engineering, and iv) machine learningparadigm
RDEL: This model (Riedel et al. 2017) first tokenizes textfrom news articles and extracts the most frequent ngrams(unigram, bigram). Then, for each news article, it con-structs the corresponding term frequency-inverse documentfrequency (TF-IDF) vectors for article title and body sep-arately, and computes the cosine similarity between the 2vectors. Finally, the authors concatenated the features to-gether and use Multilayer Perceptron (Pedregosa et al. 2011)to classify fake and real news articles.
The data source, data types, feature engineering process,and machine learning paradigm for each of the 5 classifiersare summarized on Table 1. As shown, this set of classi-fiers encompasses both neural network and non-neural net-work based supervised learning paradigms, as well as thesemi-supervised paradigm. Additionally, it includes all 3most common data types: text, relational, and temporal-ity. Focusing on feature engineering, the classifiers collec-tively cover the most common text feature engineering ap-proaches: theory-driven, ngrams, word2vec, and doc2vec.Similarly, they also cover some common relational data fea-ture engineering techniques: user-article network, user-usernetwork. Notably, these classifiers do not include popularapproaches such as leveraging user profile descriptions, orfollower-followee networks. Overall, however, we argue thatthis set of classifiers is sufficiently representative.
Data
We use two datasets in this study. The summary statisticsare available on Table 2. Both datasets use Media Bias FactCheck (Van Zandt 2018) as ground truth to label whether adomain is a fake news site. Media Bias Fact Check containsone of the most comprehensive list of fake and mainstreamnews sites and is also used by many related work (Starbird2017; Main 2018). Prior research shows that the choice ofground truth can have a significant effect on downstreamanalysis (Bozarth, Saraf, and Budak 2020). Therefore, wenote that our study is only the first step towards building acomprehensive fake news model evaluation framework. Fu-ture work should consider multiple ground truth labels.
Election-2016 NELA-GTTime Period 12/2015-01/2017 02/2018-10/2018# Domains 1390 130# Fake News Domains 335 (24%) 38 (29%)# Articles 231.6K 304.1K# Fake News Articles 31.3K (16%) 37.4 (14%)# Tweets 1.16M# Fake News tweets 141.9K (12.2%)# Users 215.2K# Fake News Users 37.9K (18%)
Table 2: Basic Statistics for Datasets
Election-2016: This dataset is primarily focused on the2016 U.S. presidential candidates and consists of both socialmedia data and news articles. Social media data collectionis described in detail in Bode et al. (2020). The data col-lection was performed using Sysomos MAP. For any givenday between December, 2015, and January 1, 2017, thisdataset includes i.) 5,000 tweets randomly sampled fromall tweets that included the keyword “Trump”, and ii) 5,000tweets similarly sampled from all that mentioned “Clinton”.The webpages dataset (Budak 2019) includes the content ofthe webpages shared in the Twitter dataset described above.For each tweet with an external URL, the dataset includesa record with: i) the shortened URL, ii) the original URL,iii) domain name, iv) title of the document, v) body of thedocument, (vi) the date of the tweet, and vii) Twitter ac-count id of the user sharing the URL. Here, we use MediaBias Fact Check to identify the list of fake and mainstreamnews sites present in Election-2016, and filter out non news-related sites. As shown on Table 2, Election-2016 contains231.6K unique articles (16% of which are fake news), and1.16M tweets (12.2% of which contain links to fake newsarticles) shared by 215.2K unique users (18% users sharedat least 1 fake news article).
NELA-GT: This dataset (Nørregaard, Horne, and Adalı2019) contains articles scraped from 194 news sites between02/2018 and 11/2018. The list of domains is collected byaggregating existing lists of fake and mainstream news sites
63

provided by other researchers and organizations. News con-tent is scraped via the RSS feed of these sites. Each domainhas source-level veracity labels from 1 or more independentassessments (e.g., Media Bias Fact Check, News Guard). Wenote that 130 out of 194 domains have labels from MediaBias Fact Check.
As shown on Table 2, NELA-GT contains 304.1K uniquearticles (14% of which are fake news).
There are several key distinctions between Election-2016and NELA-GT. First and foremost, news articles in Election-2016 are collected through tweets mentioning Trump orClinton. As such, these articles are almost exclusively aboutone or both candidates. In comparison, creators of NELA-GT directly access and scrape the websites which likely re-sulted in more diverse news topics. Next, Election-2016 con-tains 1.4K distinct news sites, 10 times that of NELA-GT,yet the latter has 72.5K more news articles. Indeed, the me-dian number of articles per domain is 13 for Election-2016and 1.12K for NELA. Finally, over 30% of all fake news do-mains active in 2016 have since become defunct (Bozarth,Saraf, and Budak 2020), thus they are in Election-2016 butnot NELA-GT.
Additional Auxiliary Data: We also obtain the follow-ing data for each news site: i) average monthly traffic usingsimilarweb.com, a popular web analytics platform (Similar-Web 2019; Singal and Kohli 2016); ii) age using whois.com,a domain name registrar database (Mueller and Chango2008); and finally, iii) ideology using Media Bias FactCheck. Additionally, for each article, we also include its pub-lication date (For Election-2016, an article’s date is approxi-mated using the timestamp of the earliest tweet that includedit).
Data Preprocessing: For each dataset, we first filter outall news articles i) without a title, or ii) with fewer than 10words in the article body. Next, we aggregate 4.1K wordsand phrases representing news sites names 2 (e.g., “DailyDot”, “CNNPolitics”); for each news article, we removematching words and phrases from the article.
Analysis
In this section, we first compare and contrast classifier per-formance using different evaluation archetypes. Then, weconduct an in-depth error analysis focusing on domains andarticles of varied attributes. Finally, we examine model per-formance and bias tradeoffs.
Performance Overview
We first underline the 3 most common training and per-formance evaluation archetypes basic, forecast, andbydomains. We then present our evaluation metrics andresults.
(1) Basic N-folds (basic): Using this common ap-proach, data are split into N-folds for training and cross-validation. Here, for each dataset, we use 5-fold (i.e., 80/20)training and validation data split.
2Here, we use the list of news site names provided by MediaBias Fact Check.
(2) Forecasting into the Future (forecast): Here,given a time t, classifiers are trained on fake and mainstreamnews articles that were written before t, and tested againstthose that were written after t. For each dataset, we ran-domly sample 10 dates within its data collection period andsplit data into training and validation accordingly.
(3) Predicting Never Before Encountered Domains(bydomains): In this archetype, classifiers are trained onarticles from 90% randomly sampled domains and testedagainst articles from the remaining 10% that are not presentin training. We repeat this sampling process 10 times foreach dataset.
Evaluation Metrics: We use AUC, F1 (fake news arti-cles as the positive label), precision, and recall to evaluatemodel overall performance. We omit accuracy due to labelimbalance in the datasets (Huang and Ling 2005).
Results: Results are summarized in Figure 2. As shown,we denote classifiers using different colors. Additionally,each grid represents a distinct dataset and performance met-ric combination. Within a given grid, outer-rings representhigher performance. Note that NELA-GT doesn’t provide so-cial media data, so analyses for CSI and HOAX are not avail-able for this dataset. Overall, we see that classifier perfor-mance varies considerably based on the i) dataset, ii) evalu-ation archetype, and iii) metric.
(i) Dataset Effects: The average AUC scores for BTC un-der the basic evaluation archetype are 0.78 and 0.96 whenthe datasets are Election-2016 and NELA-GT respectively, aconsiderable difference. We also observe a similar but lesssignificant effect for RDEL and NELA. One possible expla-nation is that Election-2016 is specifically focused on Don-ald Trump and Hillary Clinton. Thus, news content fromfake and mainstream publishers in this dataset is presumablymuch more similar compared to NELA-GT, which scrapesthe entire RSS feed of news sites daily. The higher arti-cle similarity likely contributes to a performance drop incontent-based models.
(ii) Archetype Effects: RDEL and BTC both perform con-siderably better under basic evaluation compared to pre-dicting new domains (i.e., bydomains). For instance,when dataset is NELA-GT, the AUC score for RDEL is 0.97using basic archetype but 0.72 using bydomains (sim-ilar patterns for BTC). One possible explanation is that, de-spite removing news site name-related tokens (e.g., “dailybeast”, “nytimes”) from data, certain remaining word tokensmay still be indicative of a domain and its practices (e.g.,New York Times has the custom of using the word “Mr.”when addressing the President of the United States (Cor-bett, P. 2017)). Thus, if word2vec or ngram-based classi-fiers such as BTC and RDEL rely heavily on site-specific fea-tures for training, they may perform poorly when validatingon newly encountered domains. Similarly, we also see thatBTC and RDEL perform worse in forecast than basic.Findings here are complementary to prior research (Horne,Nørregaard, and Adali 2019) which demonstrates that theperformance of text-based models decreases over time dueto changes in news content. Interestingly, NELA, the onlyother exclusively text-based classifier, has more comparableAUC scores across the archetypes—the AUC scores are 0.80,
64

Figure 2: Performance Overview For All Classifiers. As shown, we separate the classifiers by colors. Additionally, each gridrepresents a distinct dataset and performance metric combination. Within a given grid, datapoints that lie in the outer-ringsrepresent higher performance. For instance, the upper left corner grid contains each classifier’s AUC scores for the Election-2016 dataset. We see that RDEL, colored in green, has a significantly higher AUC (data point lies on the outer-ring) whenvalidated against the basic archetype compared to forecast and bydomains.
0.73, and 0.82 for basic, bydomains, and forecastrespectively when dataset is Election-2016. We note thatNELA only uses the stylistic and psycholinguistic features ofarticles. As such, it may be more robust to site-specific lin-guistic eccentricities. Compared to text feature-only classi-fiers, both CSI and HOAX—the classifiers that only partiallyor not-at-all rely on text content— have more comparableAUC scores across all archetypes.
Out of the 3 archetypes, basic is the most common. Thatis, model performance is typically examined using 5-foldcross-validation with 80/20 training and validation data split.Yet, if researchers only assess classifiers’ performance basedon basic, they may not discover the potential weakness theirmodels have against never before encountered domains. Infact, our results demonstrate that the word2vec and ngramtext feature-based models maybe especially need to be eval-uated against bydomains.
Evaluation Metric Effects: The ranking of classifierschange based on whether we use AUC or F1. For in-stance, when the dataset is Election-2016 and the archetypeis bydomains, we show that CSI has rank = 2 usingAUC and rank = 4 using F1. Additionally, all classifiers ex-cluding CSI generally have significantly higher recall thanprecision. In fact, CSI has the highest precision across allclassifiers and the lowest recall. As such, the definition of“best-performing” is dependent on whether one prefers pre-cision over recall. Generally, high precision is preferred inhigh stake circumstances. For instance, Google and Face-book both have banned hundreds of fake news sites from
using their Advertising services (Paresh 2016). In this con-text, a credible mainstream news site would suffer consid-erable economic drawbacks if it’s falsely labeled as fake.As such, CSI should be the preferred model despite havinga low recall score. Alternatively, classifiers with a high re-call can serve as a useful filter. As an example, researchersand organizations interested in identifying new fake newsdomains can first apply a high recall model to obtain a list ofpresumptive fake news domains, and then manually revieweach site to label true fakes.
In sum, we demonstrate that the performance of classifiersvaries considerably from case to case as a result of the dif-ference in i) dataset, ii) evaluation archetype, and iii) metric.
Domain and Context-specific Error Analysis
In this section, we conduct in-depth error analysis us-ing false-negative rate (FNR) and false-positive rate(FPR). Here, for each c ∈ {BTC, CSI, HOAX, NELA,RDEL}, we first i) assess whether models perform better orworse on classifying domains of particular subcategories.Next, we then explore ii) errors that are of significant in-terest in the context of the 2016 election.
Domain-level Error Analysis: Here, we examine errorrates based on domain i) ideological-leaning, ii) age, andiii) popularity. To elaborate, conservative elites have longcriticized both the academia and tech firms for having a lib-eral bias (Gross and Simmons 2006). Thus, we aim to deter-mine whether classifiers indeed contain biases such as hav-ing a higher fnr for liberal-leaning fake news sites, and/or a
65

higher fpr for conservative-leaning mainstream news sites.Similarly, a model’s performance may also vary based on adomain’s age and popularity (e.g., incorrectly classifying re-cently created websites with small viewerships as fake newsat a higher rate compared to mature domains with heavy traf-fic). We note that analysis here is focused on the Election-2016 3 dataset and bydomains archetype. We focus on thisarchetype for potential impact. While tech giants and onlineplatforms have blacklisted hundreds of fake news sites, re-ports show that owners of these domains are ramping up forthe 2020 election by creating new sites (Wingfield, Isaac,and Benner 2016; Soares 2019).
Ideological Biases: For each article i in a given valida-tion set, we first assign i to a bin using i’s correspondingdomain’s ideology {unknown,conservative,center, liberal}.Then, for each classifier c, we calculate c’s fpr and fnr foreach bin separately. Here, we denote fpr for the liberal(left)-leaning and conservative(right)-leanings bins as f pr(l) andf pr(r) respectively. Next, to evaluate “liberal bias”, we ex-amine i) whether liberal-leaning fake news sites on aver-age are significantly more often classified by c as credi-ble news (i.e., f nr(l) > f nr(r)), and ii) whether articles byconservative-leaning mainstream news sites on average aresignificantly more often classified by c as fake news (i.e.,f pr(l)< f pr(r)).
To elaborate, we apply Student’s T-test (Gibbons andChakraborti 1991) on the distributions f pr(V, l,c) andf pr(V,r,c). Here, f pr(V, l,c) is classifier c’s false-positiverates for the liberal-leaning bin l across all the validationsets V of the bydomains archetype. For results that arestatistically significant (p − value <= 0.05), we computethe mean differences between the distributions and then plotthe values. We repeat this process for false-negative rates.As shown in Figure 3a, all classifiers have a higher false-positive rate for articles from conservative-leaning crediblenews sites. Furthermore, all results remain significant, ex-cept for NELA, even after adjusting the p-values using theHolm-Bonferroni method (Hochberg 1988) to account formultiple hypothesis testing. One possible explanation forthis bias is that there are significantly fewer liberal-leaningfake news sites available for training. Another explanationis provided by Benkler, et al. (2018). They argue in a re-cent book that some traditional right-leaning news outletsparticipated in the dissemination of fake news by echoingand giving platform to false claims initially produced andcampaigned by fake news sites. This might bring into ques-tion the ground truth definition as opposed to the classifierresults. As a whole, results in this section demonstrate thatresearchers should actively consider potential ideological bi-ases when building and evaluating fake news classifiers.
Domain Age: Similar to the previous section, we first par-tition each domain i based on its age into 3 bins: i) unknown(i.e., DNS record is not available), ii) recent (<= 3years),and iii) mature (> 3year). We then compare fnr and fpr be-tween the bins and assess whether the mean differences are
3We also repeat the analysis using the NELA-GT dataset. Re-sults are largely insignificant given that NELA-GT only contains130 domains. In comparison, Election-2016 has 1.4K.
(a) Domain Ideology.
(b) Domain Age.
(c) Domain Popularity
Figure 3: Mean Differences in Error Rates.We first assigneach prediction from the validation dataset into groups usingits corresponding domain i) ideology, ii) age, or iii) popular-ity. We then compare the classifiers’ false-positive and false-negative error rates for each group of predictions. Here, thex-axis denotes the classifiers, and the y-axis denotes eachclassifier’s mean differences in error rates between a selectedgroup and the baseline group (e.g., subtract a classifier’s av-erage false-positive rate for liberal-leaning sites by the av-erage for conservative-leaning sites). The baseline groupsare {conservative, mature site, large site} for domain ideol-ogy, age, and popularity respectively. Note*, results that arenot statistically significant are removed. Further, results thatare insignificant after adjusting p-values using the Holm–Bonferroni method (Hochberg 1988) are colored in light-blue; finally, results that remain significant after adjustmentare in darkblue.
statistically significant. As shown in Figure 3b, both BTCand HOAX have a significantly higher fpr for recent domains.In other words, the 2 classifiers more often label articles byrecently created credible news domains as fake news. A po-tential explanation is that newly created mainstream newsdomains have published fewer articles and thus models haveless data to train on. Alternatively, newer mainstream sitesmight have language and consumers that are better alignedwith fake news outlets. Finally, for robustness check, wealso repeat the evaluation and set the partitions into recent(<= 5years) and mature (> 5years). We observe similar pat-terns.
Domain Popularity (web-traffic): For each dataset, we di-
66
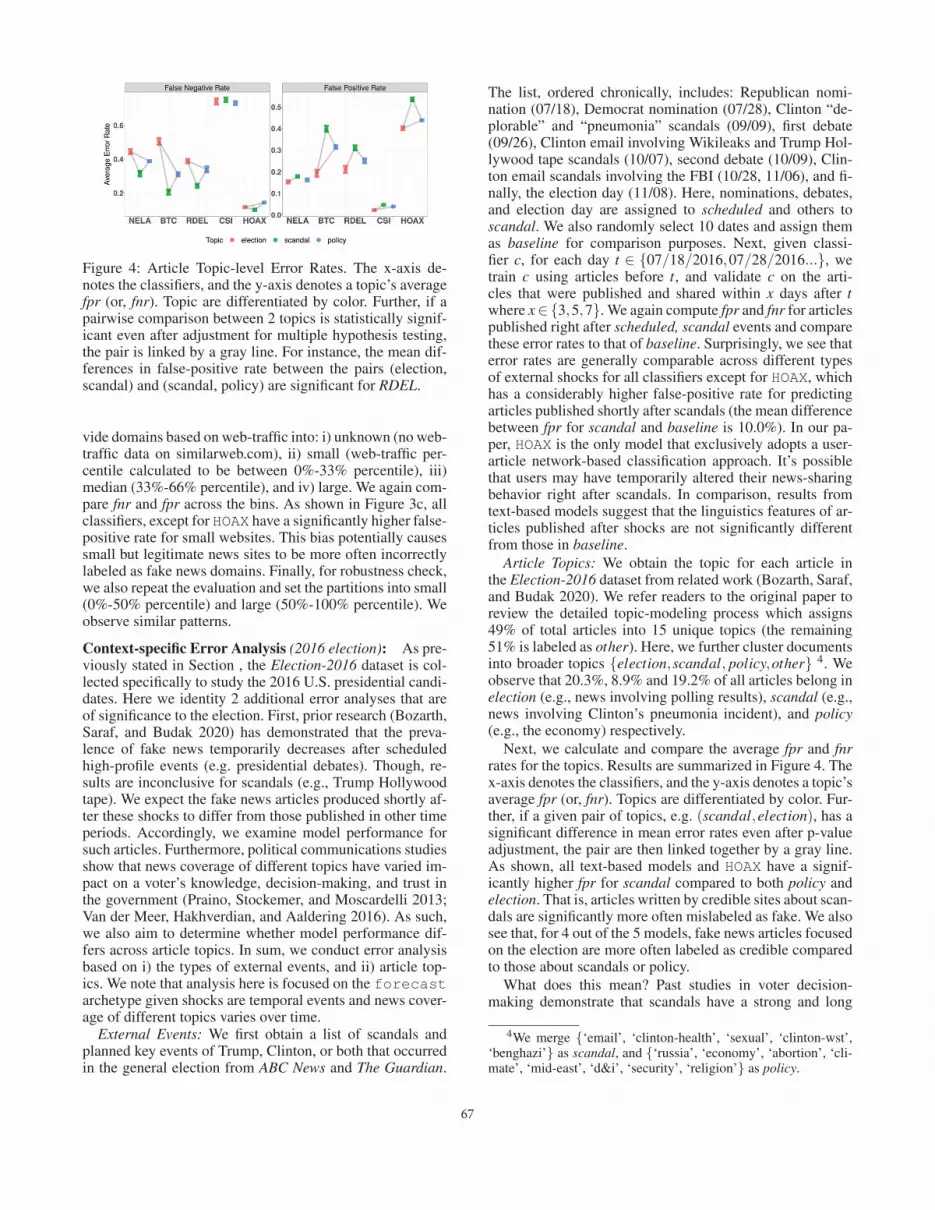
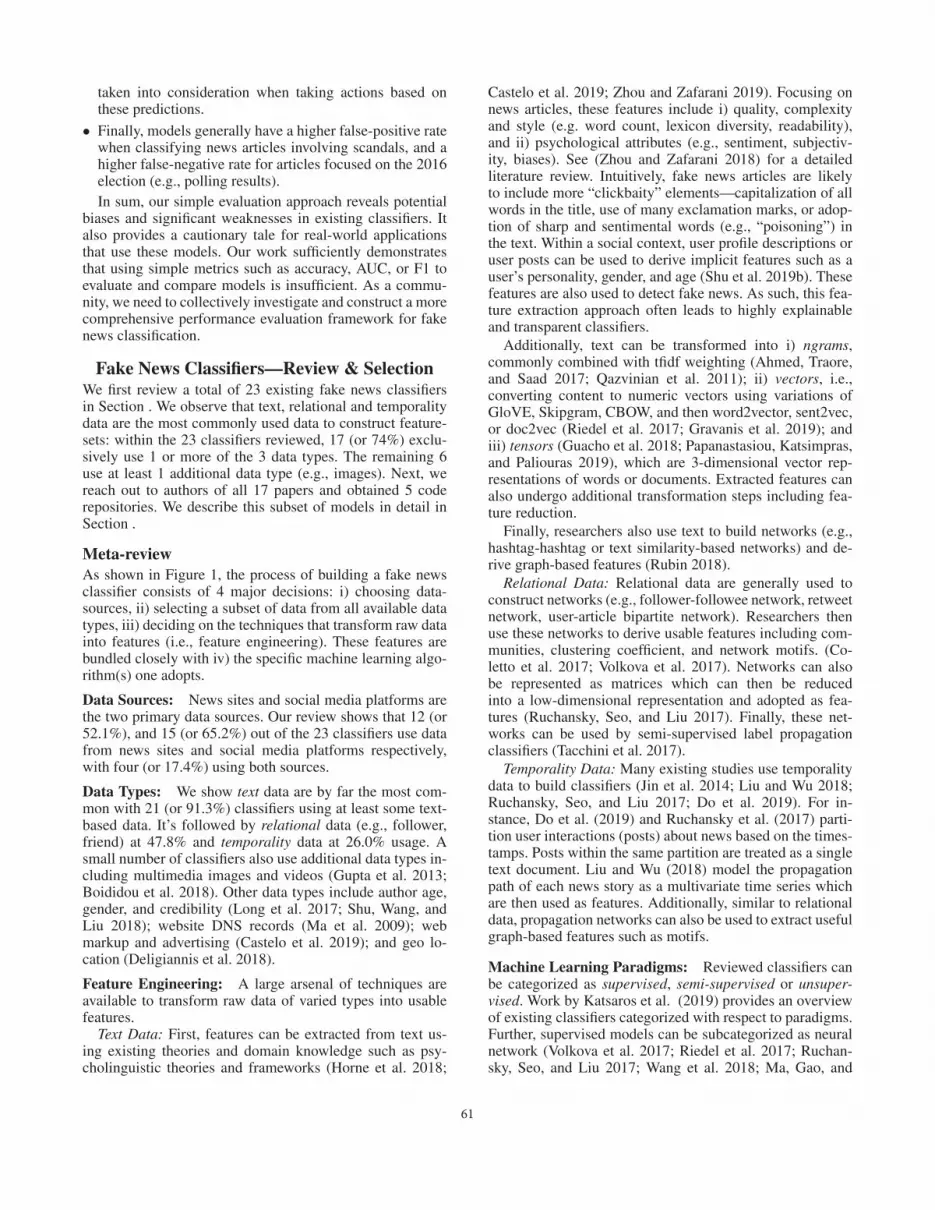
Figure 4: Article Topic-level Error Rates. The x-axis de-notes the classifiers, and the y-axis denotes a topic’s averagefpr (or, fnr). Topic are differentiated by color. Further, if apairwise comparison between 2 topics is statistically signif-icant even after adjustment for multiple hypothesis testing,the pair is linked by a gray line. For instance, the mean dif-ferences in false-positive rate between the pairs (election,scandal) and (scandal, policy) are significant for RDEL.
vide domains based on web-traffic into: i) unknown (no web-traffic data on similarweb.com), ii) small (web-traffic per-centile calculated to be between 0%-33% percentile), iii)median (33%-66% percentile), and iv) large. We again com-pare fnr and fpr across the bins. As shown in Figure 3c, allclassifiers, except for HOAX have a significantly higher false-positive rate for small websites. This bias potentially causessmall but legitimate news sites to be more often incorrectlylabeled as fake news domains. Finally, for robustness check,we also repeat the evaluation and set the partitions into small(0%-50% percentile) and large (50%-100% percentile). Weobserve similar patterns.
Context-specific Error Analysis (2016 election): As pre-viously stated in Section , the Election-2016 dataset is col-lected specifically to study the 2016 U.S. presidential candi-dates. Here we identity 2 additional error analyses that areof significance to the election. First, prior research (Bozarth,Saraf, and Budak 2020) has demonstrated that the preva-lence of fake news temporarily decreases after scheduledhigh-profile events (e.g. presidential debates). Though, re-sults are inconclusive for scandals (e.g., Trump Hollywoodtape). We expect the fake news articles produced shortly af-ter these shocks to differ from those published in other timeperiods. Accordingly, we examine model performance forsuch articles. Furthermore, political communications studiesshow that news coverage of different topics have varied im-pact on a voter’s knowledge, decision-making, and trust inthe government (Praino, Stockemer, and Moscardelli 2013;Van der Meer, Hakhverdian, and Aaldering 2016). As such,we also aim to determine whether model performance dif-fers across article topics. In sum, we conduct error analysisbased on i) the types of external events, and ii) article top-ics. We note that analysis here is focused on the forecastarchetype given shocks are temporal events and news cover-age of different topics varies over time.
External Events: We first obtain a list of scandals andplanned key events of Trump, Clinton, or both that occurredin the general election from ABC News and The Guardian.
The list, ordered chronically, includes: Republican nomi-nation (07/18), Democrat nomination (07/28), Clinton “de-plorable” and “pneumonia” scandals (09/09), first debate(09/26), Clinton email involving Wikileaks and Trump Hol-lywood tape scandals (10/07), second debate (10/09), Clin-ton email scandals involving the FBI (10/28, 11/06), and fi-nally, the election day (11/08). Here, nominations, debates,and election day are assigned to scheduled and others toscandal. We also randomly select 10 dates and assign themas baseline for comparison purposes. Next, given classi-fier c, for each day t ∈ {07/18/2016,07/28/2016...}, wetrain c using articles before t, and validate c on the arti-cles that were published and shared within x days after twhere x∈{3,5,7}. We again compute fpr and fnr for articlespublished right after scheduled, scandal events and comparethese error rates to that of baseline. Surprisingly, we see thaterror rates are generally comparable across different typesof external shocks for all classifiers except for HOAX, whichhas a considerably higher false-positive rate for predictingarticles published shortly after scandals (the mean differencebetween fpr for scandal and baseline is 10.0%). In our pa-per, HOAX is the only model that exclusively adopts a user-article network-based classification approach. It’s possiblethat users may have temporarily altered their news-sharingbehavior right after scandals. In comparison, results fromtext-based models suggest that the linguistics features of ar-ticles published after shocks are not significantly differentfrom those in baseline.
Article Topics: We obtain the topic for each article inthe Election-2016 dataset from related work (Bozarth, Saraf,and Budak 2020). We refer readers to the original paper toreview the detailed topic-modeling process which assigns49% of total articles into 15 unique topics (the remaining51% is labeled as other). Here, we further cluster documentsinto broader topics {election,scandal, policy,other} 4. Weobserve that 20.3%, 8.9% and 19.2% of all articles belong inelection (e.g., news involving polling results), scandal (e.g.,news involving Clinton’s pneumonia incident), and policy(e.g., the economy) respectively.
Next, we calculate and compare the average fpr and fnrrates for the topics. Results are summarized in Figure 4. Thex-axis denotes the classifiers, and the y-axis denotes a topic’saverage fpr (or, fnr). Topics are differentiated by color. Fur-ther, if a given pair of topics, e.g. (scandal,election), has asignificant difference in mean error rates even after p-valueadjustment, the pair are then linked together by a gray line.As shown, all text-based models and HOAX have a signif-icantly higher fpr for scandal compared to both policy andelection. That is, articles written by credible sites about scan-dals are significantly more often mislabeled as fake. We alsosee that, for 4 out of the 5 models, fake news articles focusedon the election are more often labeled as credible comparedto those about scandals or policy.
What does this mean? Past studies in voter decision-making demonstrate that scandals have a strong and long
4We merge {‘email’, ‘clinton-health’, ‘sexual’, ‘clinton-wst’,‘benghazi’} as scandal, and {‘russia’, ‘economy’, ‘abortion’, ‘cli-mate’, ‘mid-east’, ‘d&i’, ‘security’, ‘religion’} as policy.
67

lingering impact on voter choice (Praino, Stockemer, andMoscardelli 2013). As such, perhaps misclassifying articlesinvolving scandals would have a more detrimental down-stream impact. On the other hand, erroneous election-relatedcoverage such as fake polling results and endorsementsalso affect voter behavior (Van der Meer, Hakhverdian, andAaldering 2016). It is important to note one caveat. Theground truth labels are provided at the outlet level. It is en-tirely possible that fake news sites generally publish accu-rate election-related articles. Regardless, our analysis showsthat one might need to adjust prediction w.r.t. the propor-tions of topics covered to determine the quality of news out-lets. Further, we highlight that researchers invested in build-ing effective models should consider the impact/weight ofdifferent types of misclassifications (e.g., misclassifying acredible celebrity gossip piece as fake news may be harm-less, but incorrectly labeling vaccine-related misinformationas credible is harmful).
Performance and Bias Trade-off
In this section, we examine error bias and performancetrade-off with respect to i) domain ideology, ii) domainage, iii) domain popularity, iv) external events and v) articletopic 5. In other words, we ask if a classifier has the highestF1 (or, AUC) score, but significantly favors liberal-leaningnews sites, does there exist another classifier which has aslightly worse F1(or, AUC) score but lower or no significantbias with respect to domain ideology?
Here, we first rank all classifiers based on their averageF1 scores for the validation datasets, and denote the onewith the highest F1 as c�. We then add models with worseF1 scores but lower bias (with respect to domain ideology,domain age, etc.) than c� into the set Calt (these are the alter-native options). Models that have worse F1 scores in addi-tion to higher bias when compared to c� are excluded fromanalysis. Next, we plot the F1 scores and error bias mea-surements of c� and Calt in Figure 5. Here, the z-axis de-notes F1 scores, the x-axis and y-axis denotes f nr and f prbased bias respectively. That is, the x-axis and y-axis valuesare equivalent to the mean differences calculated in Sectionand summarized in Figure 3. A higher absolute value of xand/or y implies a higher bias. We note that results for eventshocks are omitted given that none of the alternative modelsprovides a notable reduction in bias.
As shown in Figure 5a which focuses on ideological bias,HOAX has the highest F1 = 0.42, yet it has f pr = −0.40and f nr = 0.57. In other words, hoax erroneously classifiesarticles published by mainstream conservative-leaning newssites as fake news 40% more often compared to articles bymainstream liberal-leaning publishers. Further, it also mis-classifies articles by liberal-leaning fake news sites as cred-ible 57% more often compared to articles by conservative-leaning fake sites. We can reduce this bias by choosing thealternative NELA, which has F1 = 0.39, f pr = −0.10, andf nr = 0.0. In other words, by trading a small reduction ofF1, we can significantly reduce ideological bias. Focusing
5We focus on the topics scandal and election given that meandifferences in error rates between the pair are the highest.
on Figure 5b, we see that trade a small drop in F1 from0.42 to 0.39 can lead to a modest reduction in domain age-based bias. For domain popularity (Figure 5c) and articletopic (Figure 5d), however, any reduction in bias requires asubstantial drop in performance.
DiscussionWe reviewed 23 existing fake news classification models andprovided a comprehensive overview of the current state ofthis research field. Furthermore, by reaching out to the au-thors of 17 papers, we collected a representative set of 5classifiers that we used for additional performance evalu-ation and error analysis. The results reveal important con-cerns about generalizability. Performance of fake news clas-sifiers varies significantly from one dataset to another, fromone evaluation archetype to another, and from one evaluationmetric to another. We also observed important bias: articlesfrom small and/or conservative-leaning mainstream sites, forexample, were more often labeled incorrectly as fake news.Furthermore, we also showed that model error rate variesacross different topics. Finally, we illustrated that, in somecases, we can trade the model that has the best overall per-formance but high-bias with another that has a slightly worseperformance but a substantially lower bias.
There are several limitations to our work. First, we usedthe list of fake and mainstream news sites provided byMedia Bias Fact Check. Yet, many other sources such asNews Guard provide domain-level veracity labels. Relatedwork (Bozarth, Saraf, and Budak 2020) has highlighted thatthe choice in ground truth labels affects downstream obser-vations. As such, future work should evaluate models us-ing different ground truth of fake and mainstream news sitesto ensure robustness. Similarly, certain sources (Zimdars,M 2018) also partition fake news domains into more fine-grained subcategories (e.g. junk science, state-sponsoredmisinformation sites, clickbait). Understanding whether ex-isting models perform better on some subcategories com-pared to others can also provide valuable insights into po-tential model bias and weaknesses.
Despite these limitations, we believe this work takes animportant step towards reproducibility and replicability infake news classification. We invite other scholars to buildon this effort and help collectively build towards a well-formulated and comprehensive evaluation framework forfake news detection. As a very first step, we argue that ourcommunity needs to make datasets and code repositoriesavailable to others. In our case, we were able to acquireonly 5 out of the 17 published classifiers. The code repos-itories for the 5 classifiers and our own code is availableat https://github.com/lbozarth/fakenewsMPE. Easier accesswould allow our community to compare and contrast differ-ent datasets and algorithms. Such access would also enableour community to develop a robust evaluation frameworkmore quickly.A simple guideline on model evaluation: Here, we pro-vide a simple checklist for researchers interested in build-ing robust and effective models. (1) Models should be eval-uated using multiple datasets and ground truth labels pro-vided by various parties and may be of varying granularity.
68

(a) Domain Ideology. Trade per-formance to reduce bias that fa-vors liberal-leaning sites com-pared to conservative sites.
(b) Domain Age. Trade perfor-mance to reduce bias that favorsmature sites compared to recentlycreated sites.
(c) Domain Popularity. Trade per-formance to reduce bias that fa-vors large sites compared to smallsites.
(d) Article Topic. Trade perfor-mance to reduce bias that favorsarticles about election comparedto those about scandal.
Figure 5: Error Bias and Performance Trade-off. Here, the z-axis denotes F1 scores, the x-axis and y-axis denote false-positiveand false-negative error-based bias respectively. Further, the model c� with highest F1 score is colored in blue, and alternativemodels with worse F1 scores but lower bias than c� are in green.
(2) Individuals interested in creating a model with the in-tent of long-term use should adopt variations of the forecastarchetype to train and validate the model. Similarly, indi-viduals should use the bydomains archetype if the aim is tolabel never-before-encountered websites with unknown fac-tualness. (3) Focusing on metrics, researchers can also con-sider using the precision-recall curve (Boyd, Eng, and Page2013) to optimize precision over recall (or vise versa) if amodel’s particular usage warrants it (e.g., favoring precisionover recall if the impact of a false-positive is high). (4) In-grained prejudices are shown to be present in machine learn-ing models used in real-world applications (O’neil 2016).When such biases come to light, they can significantly raisethe public’s distrust in automatons. As such, using domain-expertise to identify potential high-cost biases and evalu-ate the model for these biases are crucial. Finally, (5) ifthe highest-performing model is indeed biased, researchersshould consider a trade-off between maximizing overall per-formance and reducing potential biases.
We note that this guide is far from being a comprehen-sive framework. Indeed, it is commonplace machine learn-ing best-practice guidance. Yet, our analysis revealed thatthese simple guides have yet to be fully followed in this im-portant area of research so far.
Acknowledgement
This research was partly supported by Michigan Institute forData Science (MIDAS) at the University of Michigan andthe National Science Foundation (Grant IIS-1815875).
References
Ahmed, H.; Traore, I.; and Saad, S. 2017. Detection ofOnline Fake News Using N-Gram Analysis and MachineLearning Techniques. In Traore, I.; Woungang, I.; and Awad,A., eds., Intelligent, Secure, and Dependable Systems in Dis-tributed and Cloud Environments, Lecture Notes in Com-puter Science, 127–138. Springer International Publishing.Alimonti, K. R., and Veridiana. 2018. “fake news” offers
latin american consolidated powers an opportunity to censoropponents.Balmas, M. 2014. When fake news becomes real: Com-bined exposure to multiple news sources and political atti-tudes of inefficacy, alienation, and cynicism. Communica-tion Research 41(3):430–454.Benkler, Y.; Faris, R.; and Roberts, H. 2018. Network pro-paganda: Manipulation, disinformation, and radicalizationin American politics. Oxford University Press.Bode, L.; Budak, C.; Ladd, J. M.; Newport, F.; Pasek, J.;Singh, L. O.; Soroka, S. N.; and Traugott, M. W. 2020.Words That Matter: How the News and Social Media Shapedthe 2016 Presidential Campaign. Washington, D.C.: Brook-ings Institution Press.Boididou, C.; Papadopoulos, S.; Zampoglou, M.; Aposto-lidis, L.; Papadopoulou, O.; and Kompatsiaris, Y. 2018. De-tection and visualization of misleading content on Twitter.International Journal of Multimedia Information Retrieval7(1):71–86.Bourgonje, P.; Schneider, J. M.; and Rehm, G. 2017.From Clickbait to Fake News Detection: An Approachbased on Detecting the Stance of Headlines to Articles. [email protected], K.; Eng, K. H.; and Page, C. D. 2013. Area under theprecision-recall curve: point estimates and confidence inter-vals. In Joint European conference on machine learning andknowledge discovery in databases, 451–466. Springer.Bozarth, L.; Saraf, A.; and Budak, C. 2020. Higher Ground?How Groundtruth Labeling Impacts Our Understanding ofFake News About the 2016 U.S. Presidential Nominees.ICWSM 2020.Budak, C.; Agrawal, D.; and El Abbadi, A. 2011. Limitingthe spread of misinformation in social networks. In Proceed-ings of the 20th International Conference on World WideWeb, WWW ’11, 665–674. New York, NY, USA: ACM.Budak, C. 2019. What happened? the spread of fake newspublisher content during the 2016 u.s. presidential election.WWW ’19.
69

Castelo, S.; Almeida, T.; Elghafari, A.; Santos, A.; Pham,K.; Nakamura, E.; and Freire, J. 2019. A Topic-AgnosticApproach for Identifying Fake News Pages. CompanionProceedings of The 2019 World Wide Web Conference on- WWW ’19 975–980. arXiv: 1905.00957.Coletto, M.; Garimella, K.; Gionis, A.; and Lucchese, C.2017. A Motif-based Approach for Identifying Controversy.arXiv:1703.05053 [cs]. arXiv: 1703.05053.Corbett, P. 2017. Why the times calls trump ‘mr.’ (no, we’renot being rude).Deligiannis, N.; Huu, T. D.; Nguyen, D. M.; and Luo, X.2018. Deep Learning for Geolocating Social Media Usersand Detecting Fake News.Do, T. H.; Luo, X.; Nguyen, D. M.; and Deligiannis, N.2019. Rumour Detection via News Propagation Dynamicsand User Representation Learning. arXiv:1905.03042 [cs,stat]. arXiv: 1905.03042.Fletcher, R.; Cornia, A.; Graves, L.; and Nielsen, R. K. 2018.Measuring the reach of “fake news” and online disinforma-tion in europe. Reuters Institute Factsheet.Gibbons, J. D., and Chakraborti, S. 1991. Comparisons ofthe mann-whitney, student’st, and alternate t tests for meansof normal distributions. The Journal of Experimental Edu-cation 59(3):258–267.Gravanis, G.; Vakali, A.; Diamantaras, K.; and Karadais, P.2019. Behind the cues: A benchmarking study for fake newsdetection. Expert Systems with Applications 128:201–213.Gross, N., and Simmons, S. 2006. Americans’ views of po-litical bias in the academy and academic freedom. In annualmeeting of the American Association of University Profes-sors.Guacho, G. B.; Abdali, S.; Shah, N.; and Papalexakis, E. E.2018. Semi-supervised Content-based Detection of Misin-formation via Tensor Embeddings. arXiv:1804.09088 [cs,stat]. arXiv: 1804.09088.Gupta, A.; Lamba, H.; Kumaraguru, P.; and Joshi, A. 2013.Faking Sandy: Characterizing and Identifying Fake Imageson Twitter During Hurricane Sandy. In Proceedings of the22Nd International Conference on World Wide Web, WWW’13 Companion, 729–736. New York, NY, USA: ACM.Hochberg, Y. 1988. A sharper bonferroni procedure formultiple tests of significance. Biometrika 75(4):800–802.Horne, B. D.; Dron, W.; Khedr, S.; and Adali, S. 2018. As-sessing the News Landscape: A Multi-Module Toolkit forEvaluating the Credibility of News. In Companion of theThe Web Conference 2018 on The Web Conference 2018 -WWW ’18, 235–238. Lyon, France: ACM Press.Horne, B. D.; Nørregaard, J.; and Adali, S. 2019. Robustfake news detection over time and attack. ACM Transactionson Intelligent Systems and Technology (TIST) 11(1):1–23.Huang, J., and Ling, C. X. 2005. Using auc and accuracyin evaluating learning algorithms. IEEE Transactions onknowledge and Data Engineering 17(3):299–310.Jin, Z.; Cao, J.; Jiang, Y.-G.; and Zhang, Y. 2014. NewsCredibility Evaluation on Microblog with a Hierarchical
Propagation Model. In 2014 IEEE International Conferenceon Data Mining, 230–239. ISSN: 2374-8486.Katsaros, D.; Stavropoulos, G.; and Papakostas, D. 2019.Which machine learning paradigm for fake news detection?In 2019 IEEE/WIC/ACM International Conference on WebIntelligence (WI), 383–387. ISSN: null.Kucharski, A. 2016. Post-truth: Study epidemiology of fakenews. Nature 540(7634):525.Kwok, Y. 2017. Where memes could kill: Indonesia’s wors-ening problem of fake news. Time, January 6.Liu, Y., and Wu, Y.-F. B. 2018. Early detection of fakenews on social media through propagation path classifica-tion with recurrent and convolutional networks. In Thirty-Second AAAI Conference on Artificial Intelligence.Long, Y.; Lu, Q.; Xiang, R.; Li, M.; and Huang, C.-R. 2017.Fake News Detection Through Multi-Perspective SpeakerProfiles. In Proceedings of the Eighth International JointConference on Natural Language Processing (Volume 2:Short Papers), 252–256. Taipei, Taiwan: Asian Federationof Natural Language Processing.Ma, J.; Saul, L. K.; Savage, S.; and Voelker, G. M. 2009. Be-yond blacklists: learning to detect malicious web sites fromsuspicious urls. In Proceedings of the 15th ACM SIGKDDinternational conference on Knowledge discovery and datamining, 1245–1254. ACM.Ma, J.; Gao, W.; and Wong, K.-F. 2018. Rumor Detectionon Twitter with Tree-structured Recursive Neural Networks.In Proceedings of the 56th Annual Meeting of the Associa-tion for Computational Linguistics (Volume 1: Long Papers),1980–1989. Melbourne, Australia: Association for Compu-tational Linguistics.Main, T. J. 2018. The Rise of the Alt-Right. BrookingsInstitution Press.Mueller, M., and Chango, M. 2008. Disrupting global gov-ernance: the internet whois service, icann, and privacy. Jour-nal of Information Technology & Politics 5(3):303–325.Nørregaard, J.; Horne, B. D.; and Adalı, S. 2019. Nela-gt-2018: A large multi-labelled news dataset for the studyof misinformation in news articles. In Proceedings of theInternational AAAI Conference on Web and Social Media,volume 13, 630–638.O’neil, C. 2016. Weapons of math destruction. BroadwayBooks.Papanastasiou, F.; Katsimpras, G.; and Paliouras, G. 2019.Tensor Factorization with Label Information for Fake NewsDetection. arXiv:1908.03957 [cs]. arXiv: 1908.03957.Paresh, D. 2016. Without these ads, there wouldn’t bemoney in fake news.Pedregosa, F.; Varoquaux, G.; Gramfort, A.; Michel, V.;Thirion, B.; Grisel, O.; Blondel, M.; Prettenhofer, P.; Weiss,R.; Dubourg, V.; et al. 2011. Scikit-learn: Machinelearning in python. Journal of machine learning research12(Oct):2825–2830.Praino, R.; Stockemer, D.; and Moscardelli, V. G. 2013. Thelingering effect of scandals in congressional elections: In-
70

cumbents, challengers, and voters. Social Science Quarterly94(4):1045–1061.Qazvinian, V.; Rosengren, E.; Radev, D. R.; and Mei, Q.2011. Rumor has it: Identifying misinformation in mi-croblogs. In Proceedings of the conference on empiricalmethods in natural language processing, 1589–1599. As-sociation for Computational Linguistics.Riedel, B.; Augenstein, I.; Spithourakis, G. P.; and Riedel,S. 2017. A simple but tough-to-beat baseline for the FakeNews Challenge stance detection task. arXiv:1707.03264[cs]. arXiv: 1707.03264.Rubin, V. L. 2018. Semi-supervised Content-based FakeNews Detection using Tensor Embeddings and Label Prop-agation.Ruchansky, N.; Seo, S.; and Liu, Y. 2017. CSI: A HybridDeep Model for Fake News Detection. Proceedings of the2017 ACM on Conference on Information and KnowledgeManagement - CIKM ’17 797–806. arXiv: 1703.06959.Shao, C.; Ciampaglia, G. L.; Varol, O.; Flammini, A.; andMenczer, F. 2017. The spread of fake news by social bots.arXiv preprint arXiv:1707.07592 96–104.Shu, K.; Cui, L.; Wang, S.; Lee, D.; and Liu, H. 2019a.dEFEND: Explainable Fake News Detection. In Proceed-ings of the 25th ACM SIGKDD International Conference onKnowledge Discovery & Data Mining - KDD ’19, 395–405.Anchorage, AK, USA: ACM Press.Shu, K.; Zhou, X.; Wang, S.; Zafarani, R.; and Liu, H.2019b. The Role of User Profile for Fake News Detection.arXiv:1904.13355 [cs]. arXiv: 1904.13355.Shu, K.; Wang, S.; and Liu, H. 2018. UnderstandingUser Profiles on Social Media for Fake News Detection. In2018 IEEE Conference on Multimedia Information Process-ing and Retrieval (MIPR), 430–435. ISSN: null.Silverman, C. 2017. The fake news watchdog.SimilarWeb. 2019. Website Demographic Data.Singal, H., and Kohli, S. 2016. Trust necessitated throughmetrics: estimating the trustworthiness of websites. Proce-dia Computer Science.Soares, I. 2019. The fake news machine: Inside a towngearing up for 2020.Starbird, K. 2017. Examining the alternative media ecosys-tem through the production of alternative narratives of massshooting events on twitter. In ICWSM, 230–239.Tacchini, E.; Ballarin, G.; Della Vedova, M. L.; Moret, S.;and de Alfaro, L. 2017. Some Like it Hoax: Automated FakeNews Detection in Social Networks. arXiv:1704.07506 [cs].arXiv: 1704.07506.Thelwall, M. 2017. The heart and soul of the web? sentimentstrength detection in the social web with sentistrength. InCyberemotions. Springer. 119–134.Van der Meer, T. W.; Hakhverdian, A.; and Aaldering, L.2016. Off the fence, onto the bandwagon? a large-scale sur-vey experiment on effect of real-life poll outcomes on subse-quent vote intentions. International Journal of Public Opin-ion Research 28(1):46–72.
Van Zandt. 2018. Media bias/fact check (mbfc news) about.Volkova, S.; Shaffer, K.; Jang, J. Y.; and Hodas, N. 2017.Separating Facts from Fiction: Linguistic Models to ClassifySuspicious and Trusted News Posts on Twitter. In Proceed-ings of the 55th Annual Meeting of the Association for Com-putational Linguistics (Volume 2: Short Papers), 647–653.Vancouver, Canada: Association for Computational Linguis-tics.Wang, Y.; Ma, F.; Jin, Z.; Yuan, Y.; Xun, G.; Jha, K.; Su, L.;and Gao, J. 2018. EANN: Event Adversarial Neural Net-works for Multi-Modal Fake News Detection. In Proceed-ings of the 24th ACM SIGKDD International Conference onKnowledge Discovery & Data Mining, KDD ’18, 849–857.New York, NY, USA: ACM. event-place: London, UnitedKingdom.Wingfield, N.; Isaac, M.; and Benner, K. 2016. Google andfacebook take aim at fake news sites. The New York Times.Yang, S.; Shu, K.; Wang, S.; Gu, R.; Wu, F.; and Liu, H.2019. Unsupervised fake news detection on social media: Agenerative approach. In Proceedings of 33rd AAAI Confer-ence on Artificial Intelligence.Zhang, J.; Dong, B.; and Yu, P. S. 2019. FAKEDETECTOR:Effective Fake News Detection with Deep Diffusive NeuralNetwork. arXiv:1805.08751 [cs, stat]. arXiv: 1805.08751.Zhou, X., and Zafarani, R. 2018. Fake News: A Sur-vey of Research, Detection Methods, and Opportunities.arXiv:1812.00315 [cs]. arXiv: 1812.00315.Zhou, X., and Zafarani, R. 2019. Network-based fake newsdetection: A pattern-driven approach. ACM SIGKDD Explo-rations Newsletter 21(2):48–60.Zimdars, M. 2018. False, misleading, clickbait-y, and/orsatirical ”news” sources. Accessed: 2018-01-30.
71