total dissolved solids modeling in the shatt al-basrah canal, using mike 11
TRANSCRIPT
Mesopot. J. Mar. Sci., 2013, 28(2): 139 - 150
Total dissolved solids modeling in the Shatt Al-Basrah canal, using Mike 11
A.A. Lafta*, Q.M.F. Al-Aeaswi and S.A.R. Al-Taei Marine Science Center, University of Basrah, Basrah, Iraq
*e-mail: [email protected]
(Received: 30 June 2013 - Accepted: 17 November 2013)
Abstract - The application of one dimensional model is presented to simulate the distribution of total dissolved solids in the Shatt Al-Basrah canal using Mike11. The model was being run for 22 days with time step ∆t=60 sec and ∆x=200m. The hydrodynamic behavior and TDS distribution were studied for two time periods, the first period was represented the high flow period due to drying of the marshes and the second period was the period after opening the Nasiriyah drainage pump station in Dhi-Qar province. The model was calibrated in two site of the canal, the first locate before Al-Basrah high way bridge and the second locate near Al-Zubair bridge. The result of the model was in a good agreement with the field data of water level and TDS distribution.
Keywords: Mike 11, Total Dissolved Solids, Modeling.
Introduction Shatt Al-Basrah canal was operated in 1983 to convert the flood water
from the Euphrates river through Hammar marshes during the flood periods, then to drain it to Khor Al-Zubair channel, toward to the Arabian Gulf. For the period between (1983-1993), the canal was started from Qurmat Ali river to Khor Al-Zubair channel.
The flow in the canal was controlled by barrage to prevent the upstream movement of brackish water from Khor Al-Zubair. This barrageis located about 22 km from the upstream of the canal, and the inflow of the canal varied over a range of 200-500 m3/sec.
In 1993, main outfall drain (MOD) was connected to this canal at about 10 km from the canal head and the connection with Qurmat Ali river was closed. This caused an increase in the flow rates which varied between 100-200 m3/s.
Shatt Al-Basrah canalwas used in the nineties of the last century in the processes of drying the marshes by draining water across it to the Arabian Gulf. The water of canal in this period was with an average TDS does not exceed 3000 mg/l in the upstream of the canal (Karim, 1998). In 2008 the Nasiriyah drainage pump station was opened which it is a land drainage pumping station in Iraq located about 10km southeast of Nasiriyah city in the province of Dhi-Qar. The station pumps farm run-off is collected by the Main Outfall Drain (MOD) north of the Euphrates river in Dhi-Qar and Muthanna provinces to a siphon under the Euphrates river where it is then returned to the MOD and eventually discharged in the Arabian Gulf through the Shatt Al-Basrah canal.
140 A.A. Lafta, Q.M.F. Al-Aeaswi and S.A.R. Al-Taei
The MOD canal which is the water of the drained regions of the Euphrates basin is agricultural water drainage (more particular and harmful elements of TDS are chemicals, pesticides, and herbicide used in agriculture which come with surface runoff) are only supplier of water to the Shatt Al-Basrah canal in the present time (MOD, 2008).
An important tool in assessing the hydrodynamic properties and water quality in rivers, streams, channels, lakes and estuaries is the computer models. These models are currently used on a wide range globally to help in the process of water management as well as in the process of forecasting future changes in water quality by assuming possible effects of exposure, such as lack of water resources or pollution faced by water sources. These models are used widely in water management like hydrological studies, salinity intrusion, sediment transport and water quality modeling such as total dissolved solids (Malakahmed, 2008).
Total dissolved solids (often abbreviated TDS) are a measure of the combined content of all inorganic and organic substances contained in a liquid in molecular or ionized suspended form. Generally the operational definition is that the solids must be small enough to survive filtration through a sieve the size of two micrometer (DeZuane John, 1997).
A 1-D Hydrodynamic model in Shatt Al-Basrah canal had been developed by Golder and Associates (1981) to simulate the optimum operation conditions for the gates of Shatt Al-Basrah barrage.
The 2-D mathematical model (labeled FESTSHD & WQ) had been developed by Kudair to simulate pollutants in Shatt Al-Basrah canal and Khor Al-Zubair estuary. The model is characterized by two components: (1) hydrodynamic (HD) model, (2) water quality (WQ) model that describes the transport, decay and biochemical transformations of the discharged pollutants. The continuity, momentum and transport equations are solved by the finite element method using Calerkin Weighted Residuals (CWR). The calibration and verification of this model were done, based on data that related to physical and chemical characteristics of water of the study area.
The hydrodynamic properties in Shatt Al-Basrah canal had been studied by Al-Aesawi (2010) by apply one dimensional model using Mike11 software. This work aims to simulate the variations of the hydrodynamics conditions and TDS distribution in the Shatt Al-Basrah canal in two different time periods by using one dimensional hydrodynamic model. Study Area:
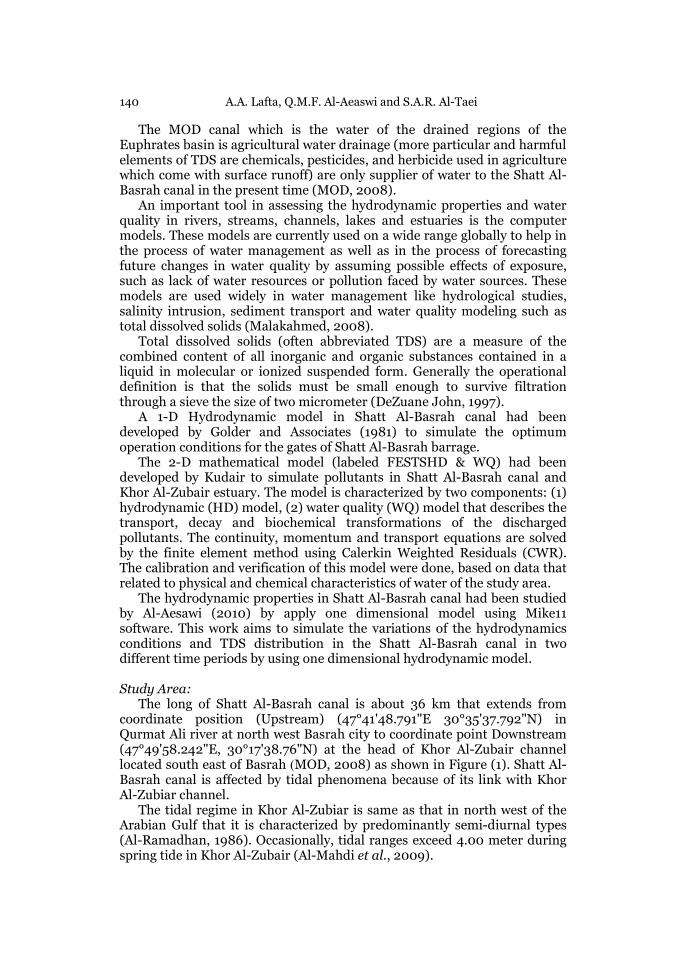
The long of Shatt Al-Basrah canal is about 36 km that extends from coordinate position (Upstream) (47°41'48.791"E 30°35'37.792"N) in Qurmat Ali river at north west Basrah city to coordinate point Downstream (47°49'58.242"E, 30°17'38.76"N) at the head of Khor Al-Zubair channel located south east of Basrah (MOD, 2008) as shown in Figure (1). Shatt Al-Basrah canal is affected by tidal phenomena because of its link with Khor Al-Zubiar channel.
The tidal regime in Khor Al-Zubiar is same as that in north west of the Arabian Gulf that it is characterized by predominantly semi-diurnal types (Al-Ramadhan, 1986). Occasionally, tidal ranges exceed 4.00 meter during spring tide in Khor Al-Zubair (Al-Mahdi et al., 2009).
TDS modeling in the Shatt Al-Basrah using Mike 11 141
Figure 1. Location map of study area, show the two sites of model
calibration. Models Description
MIKE11 is commercial software for simulating flow and water level, water quality and sediment transport in rivers, estuaries, irrigation canals, reservoirs and other inland water bodies. It is a comprehensive engineering tool with a wealth of capabilities provided in a modular framework (Andersen et al., 2006).
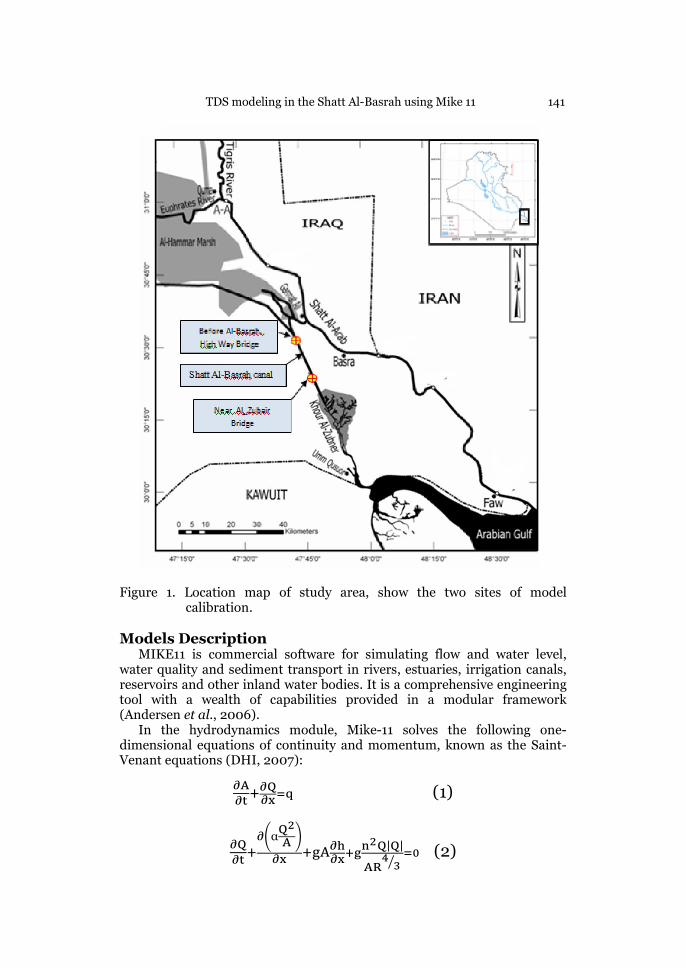
In the hydrodynamics module, Mike-11 solves the following one-dimensional equations of continuity and momentum, known as the Saint-Venant equations (DHI, 2007):
��
�����
���� (1)
��
�����α
��
��
�����
����
�����|�|
���
���� (2)
142 A.A. Lafta, Q.M.F. Al-Aeaswi and S.A.R. Al-Taei
Where, Q = discharge, A = cross-sectional area, h = water surface elevation
above an arbitrary horizontal datum, n = Manning’s coefficient of
roughness, R = hydraulic radius, g = gravity acceleration, α = kinetic energy
coefficient, x = distance along the watercourse and t = time.
The hydrodynamics module contains an implicit finite difference
computation of unsteady flows in rivers and estuaries. The formulations can
be applied to branched and looped river networks. The computational
scheme is applicable to vertically homogeneous flow conditions ranging
from steep river flows to tidally influenced estuaries. Both subcritical and
supercritical flows can be described by means of a numerical scheme that
adapts according to local flow conditions.
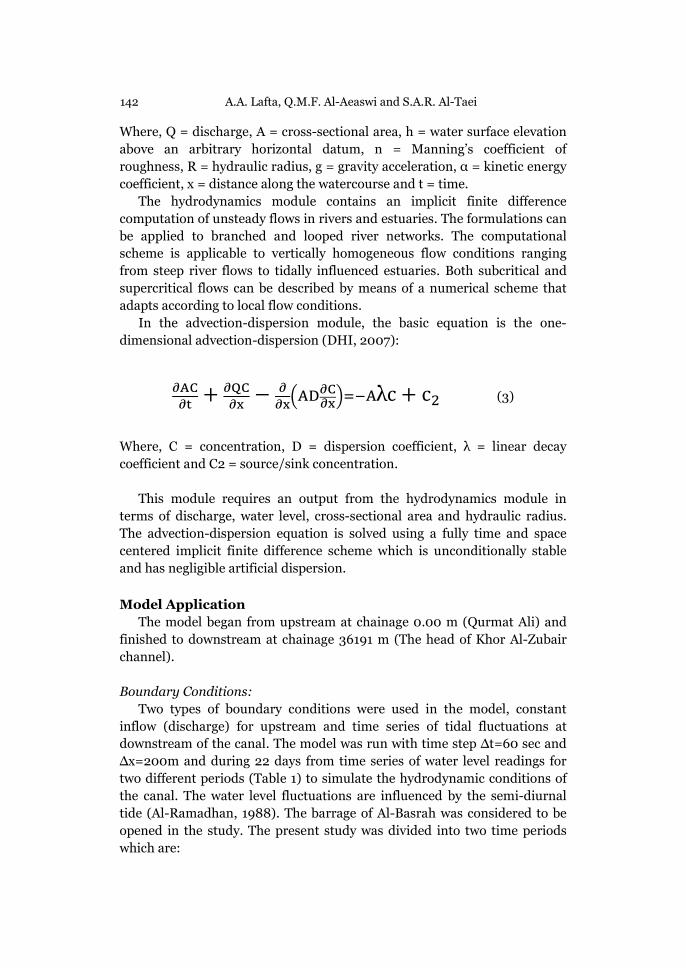
In the advection-dispersion module, the basic equation is the one-
dimensional advection-dispersion (DHI, 2007):
���
��+ ���
��− �
�������
������λc + c�(3)
Where, C = concentration, D = dispersion coefficient, λ = linear decay
coefficient and C2 = source/sink concentration.
This module requires an output from the hydrodynamics module in
terms of discharge, water level, cross-sectional area and hydraulic radius.
The advection-dispersion equation is solved using a fully time and space
centered implicit finite difference scheme which is unconditionally stable
and has negligible artificial dispersion.
Model Application
The model began from upstream at chainage 0.00 m (Qurmat Ali) and
finished to downstream at chainage 36191 m (The head of Khor Al-Zubair
channel).
Boundary Conditions:
Two types of boundary conditions were used in the model, constant
inflow (discharge) for upstream and time series of tidal fluctuations at
downstream of the canal. The model was run with time step ∆t=60 sec and
∆x=200m and during 22 days from time series of water level readings for
two different periods (Table 1) to simulate the hydrodynamic conditions of
the canal. The water level fluctuations are influenced by the semi-diurnal
tide (Al-Ramadhan, 1988). The barrage of Al-Basrah was considered to be
opened in the study. The present study was divided into two time periods
which are:
TDS modeling in the Shatt Al-Basrah using Mike 11 143
Table 1. Input parameters for the model simulations.
Item Value
Time step ∆t 60 sec
Distance ∆x 200 m
Simulation periods 1-from 1/7/1997 to 22/7/1997
2-from 1/3/2009 to 22/3/2009
Resistance Manning number, Coefficient 0.025
Boundary condition Upstream: (inflow)discharge
Downstream: Water Level
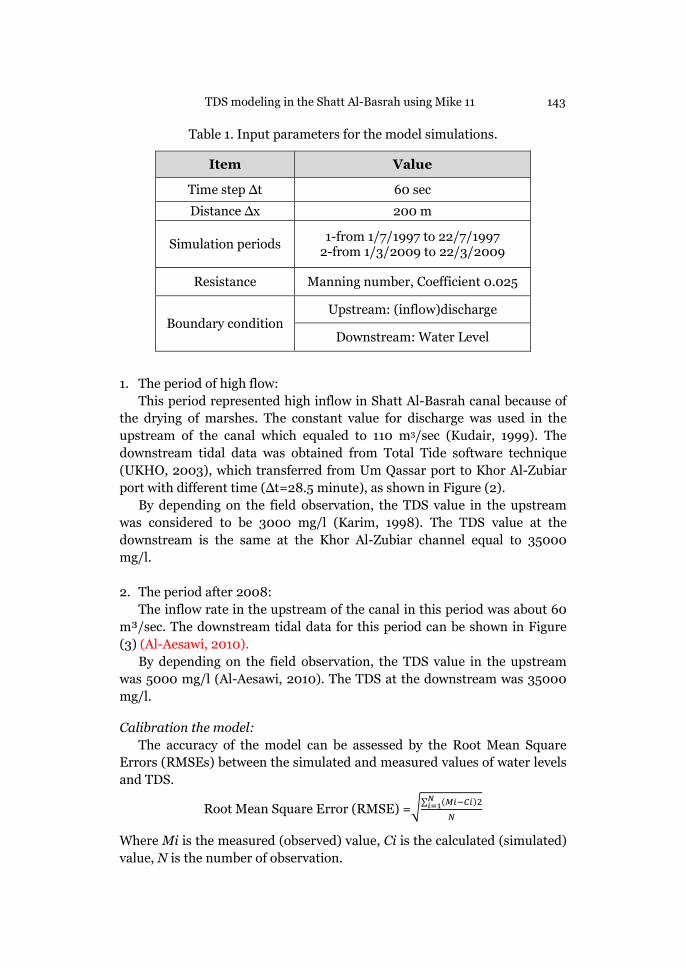
1. The period of high flow:
This period represented high inflow in Shatt Al-Basrah canal because of
the drying of marshes. The constant value for discharge was used in the
upstream of the canal which equaled to 110 m3/sec (Kudair, 1999). The
downstream tidal data was obtained from Total Tide software technique
(UKHO, 2003), which transferred from Um Qassar port to Khor Al-Zubiar
port with different time (∆t=28.5 minute), as shown in Figure (2).
By depending on the field observation, the TDS value in the upstream
was considered to be 3000 mg/l (Karim, 1998). The TDS value at the
downstream is the same at the Khor Al-Zubiar channel equal to 35000
mg/l.
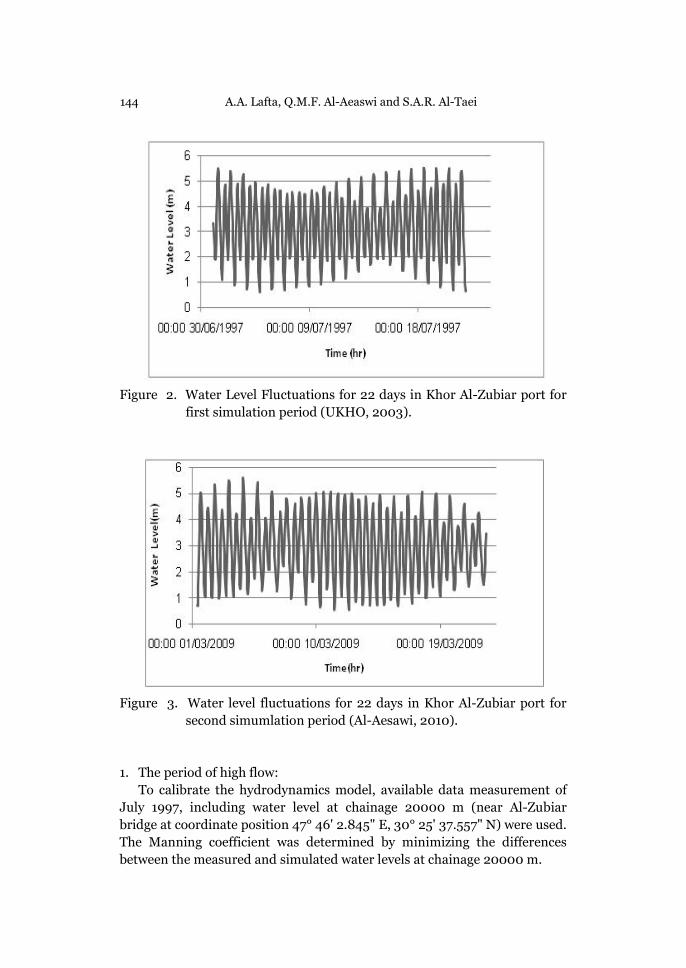
2. The period after 2008:
The inflow rate in the upstream of the canal in this period was about 60
m³/sec. The downstream tidal data for this period can be shown in Figure
(3) (Al-Aesawi, 2010).
By depending on the field observation, the TDS value in the upstream
was 5000 mg/l (Al-Aesawi, 2010). The TDS at the downstream was 35000
mg/l.
Calibration the model:
The accuracy of the model can be assessed by the Root Mean Square
Errors (RMSEs) between the simulated and measured values of water levels
and TDS.
Root Mean Square Error (RMSE) =�∑ (�����)�����
�
Where Mi is the measured (observed) value, Ci is the calculated (simulated)
value, N is the number of observation.
144 A.A. Lafta, Q.M.F. Al-Aeaswi and S.A.R. Al-Taei
Figure 2. Water Level Fluctuations for 22 days in Khor Al-Zubiar port for
first simulation period (UKHO, 2003).
Figure 3. Water level fluctuations for 22 days in Khor Al-Zubiar port for
second simumlation period (Al-Aesawi, 2010).
1. The period of high flow:
To calibrate the hydrodynamics model, available data measurement of
July 1997, including water level at chainage 20000 m (near Al-Zubiar
bridge at coordinate position 47° 46' 2.845" E, 30° 25' 37.557" N) were used.
The Manning coefficient was determined by minimizing the differences
between the measured and simulated water levels at chainage 20000 m.
TDS modeling in the Shatt Al-Basrah using Mike 11 145
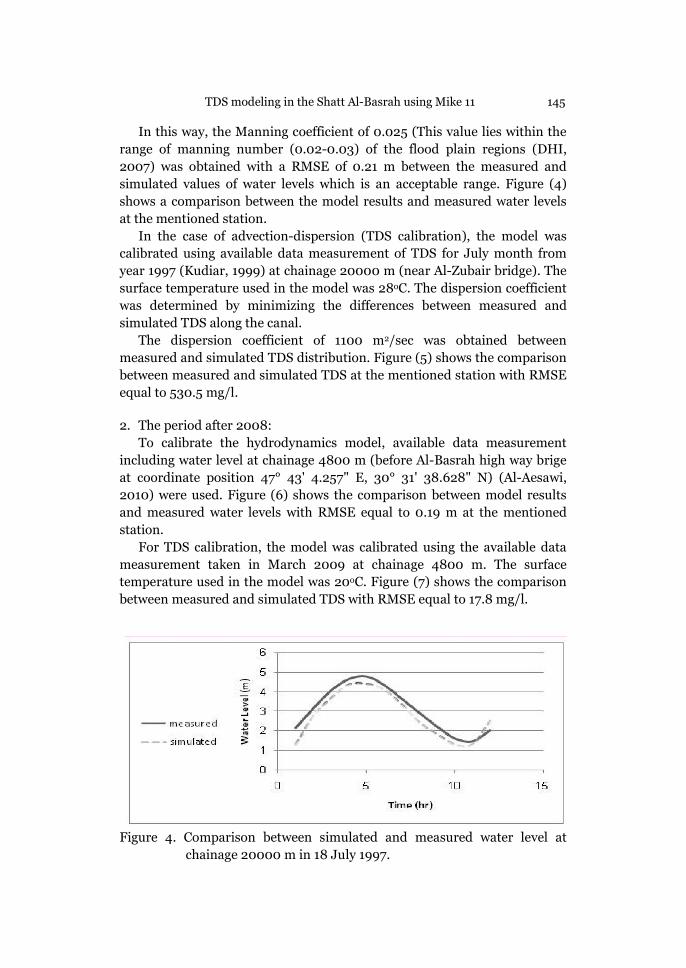
In this way, the Manning coefficient of 0.025 (This value lies within the
range of manning number (0.02-0.03) of the flood plain regions (DHI,
2007) was obtained with a RMSE of 0.21 m between the measured and
simulated values of water levels which is an acceptable range. Figure (4)
shows a comparison between the model results and measured water levels
at the mentioned station.
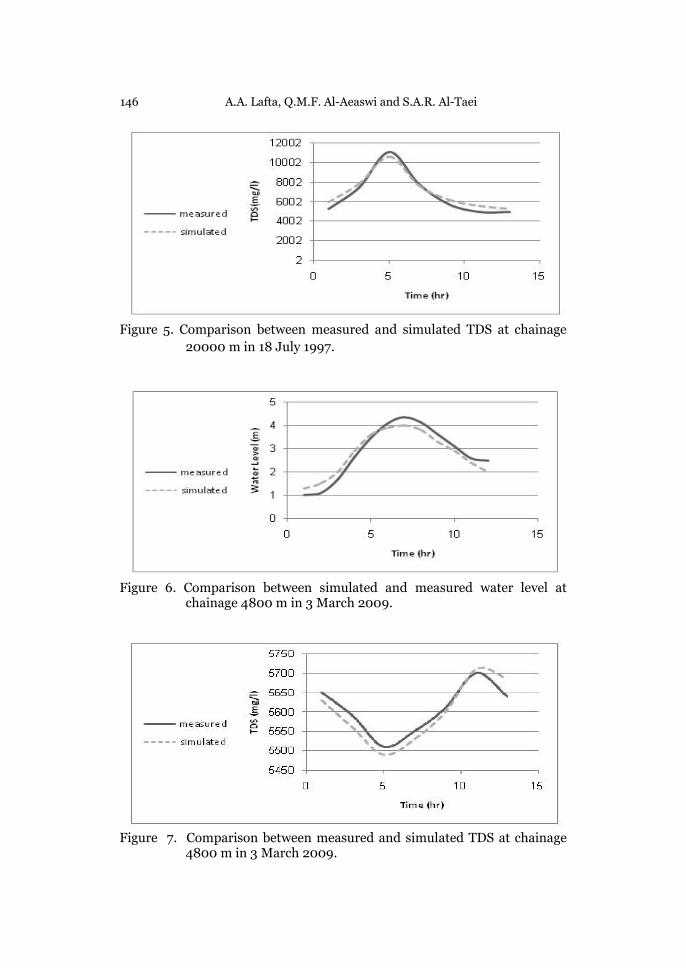
In the case of advection-dispersion (TDS calibration), the model was
calibrated using available data measurement of TDS for July month from
year 1997 (Kudiar, 1999) at chainage 20000 m (near Al-Zubair bridge). The
surface temperature used in the model was 28оC. The dispersion coefficient
was determined by minimizing the differences between measured and
simulated TDS along the canal.
The dispersion coefficient of 1100 m2/sec was obtained between
measured and simulated TDS distribution. Figure (5) shows the comparison
between measured and simulated TDS at the mentioned station with RMSE
equal to 530.5 mg/l.
2. The period after 2008:
To calibrate the hydrodynamics model, available data measurement
including water level at chainage 4800 m (before Al-Basrah high way brige
at coordinate position 47° 43' 4.257" E, 30° 31' 38.628" N) (Al-Aesawi,
2010) were used. Figure (6) shows the comparison between model results
and measured water levels with RMSE equal to 0.19 m at the mentioned
station.
For TDS calibration, the model was calibrated using the available data
measurement taken in March 2009 at chainage 4800 m. The surface
temperature used in the model was 20оC. Figure (7) shows the comparison
between measured and simulated TDS with RMSE equal to 17.8 mg/l.
Figure 4. Comparison between simulated and measured water level at
chainage 20000 m in 18 July 1997.
146 A.A. Lafta, Q.M.F. Al-Aeaswi and S.A.R. Al-Taei
Figure 5. Comparison between measured and simulated TDS at chainage
20000 m in 18 July 1997.
Figure 6. Comparison between simulated and measured water level at
chainage 4800 m in 3 March 2009.
Figure 7. Comparison between measured and simulated TDS at chainage
4800 m in 3 March 2009.
TDS modeling in the Shatt Al-Basrah using Mike 11 147
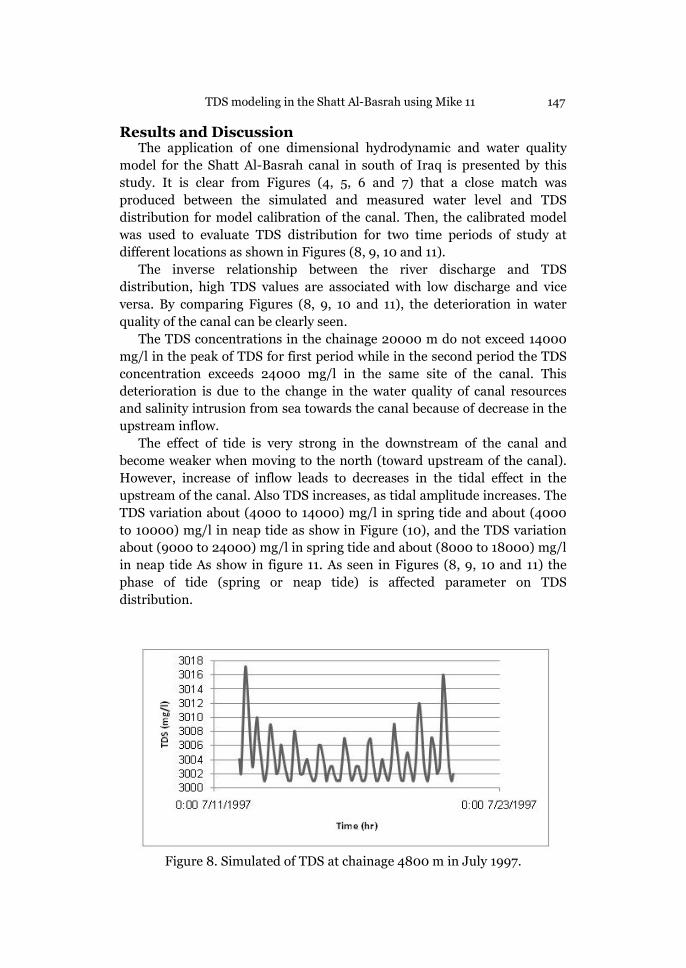
Results and Discussion The application of one dimensional hydrodynamic and water quality
model for the Shatt Al-Basrah canal in south of Iraq is presented by this
study. It is clear from Figures (4, 5, 6 and 7) that a close match was
produced between the simulated and measured water level and TDS
distribution for model calibration of the canal. Then, the calibrated model
was used to evaluate TDS distribution for two time periods of study at
different locations as shown in Figures (8, 9, 10 and 11).
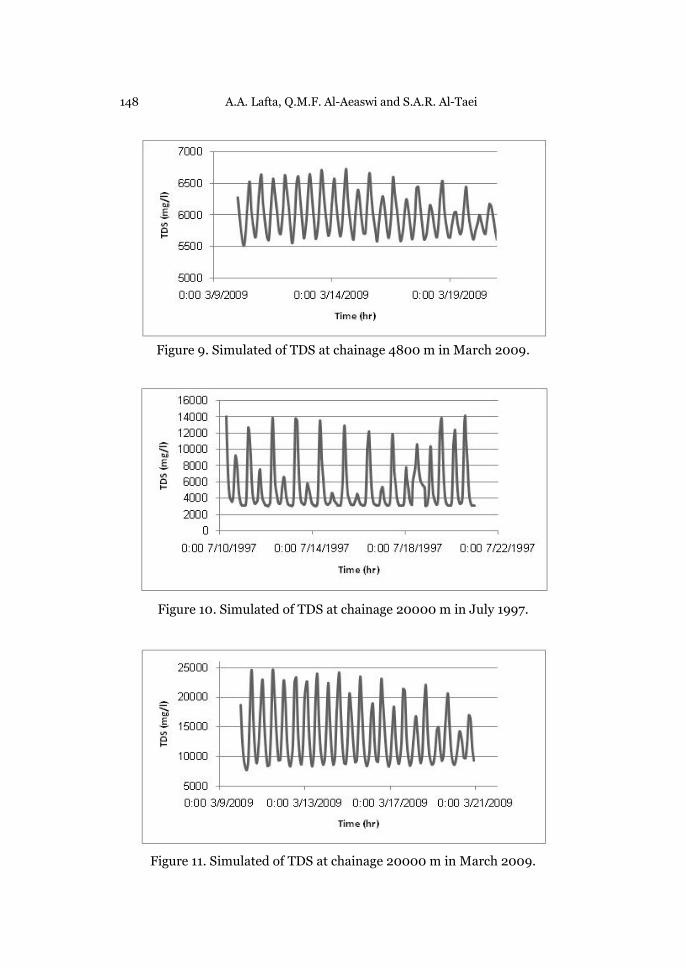
The inverse relationship between the river discharge and TDS
distribution, high TDS values are associated with low discharge and vice
versa. By comparing Figures (8, 9, 10 and 11), the deterioration in water
quality of the canal can be clearly seen.
The TDS concentrations in the chainage 20000 m do not exceed 14000
mg/l in the peak of TDS for first period while in the second period the TDS
concentration exceeds 24000 mg/l in the same site of the canal. This
deterioration is due to the change in the water quality of canal resources
and salinity intrusion from sea towards the canal because of decrease in the
upstream inflow.
The effect of tide is very strong in the downstream of the canal and
become weaker when moving to the north (toward upstream of the canal).
However, increase of inflow leads to decreases in the tidal effect in the
upstream of the canal. Also TDS increases, as tidal amplitude increases. The
TDS variation about (4000 to 14000) mg/l in spring tide and about (4000
to 10000) mg/l in neap tide as show in Figure (10), and the TDS variation
about (9000 to 24000) mg/l in spring tide and about (8000 to 18000) mg/l
in neap tide As show in figure 11. As seen in Figures (8, 9, 10 and 11) the
phase of tide (spring or neap tide) is affected parameter on TDS
distribution.
Figure 8. Simulated of TDS at chainage 4800 m in July 1997.
148 A.A. Lafta, Q.M.F. Al-Aeaswi and S.A.R. Al-Taei
Figure 9. Simulated of TDS at chainage 4800 m in March 2009.
Figure 10. Simulated of TDS at chainage 20000 m in July 1997.
Figure 11. Simulated of TDS at chainage 20000 m in March 2009.
TDS modeling in the Shatt Al-Basrah using Mike 11 149
Conclusion
The results of the model have a good agreement with the observed data
measurements of water levels and TDS distribution in Shatt Al-Basrah
canal, so the model can be considered as a useful tool for assessing water
quality along the Shatt Al-Basrah canal in the future if an accurate boundary
condition of the model is used. The results of the model indicate that there
is a significant deterioration in water quality of the canal because of
reduction of inflow and variation in water quality of canal resources.
ACKNOWLEDGEMENTS
The authors wish to acknowledge DANIDA (the Danish International
Development Agency) for providing the Mike11 Software, and We also offer
our thanks to Miss Zainab Jaffar to help us in language correction.
Reference Al-Aesawi, Q.M. 2010. Hydrualic operation of Shatt Al-Basrah canal using
one dimensional model. M.Sc. thesis, Baghdad University. Al-Mahdi, A.A., Abdullah, S.S. and Husain, N.A. 2009. some features of the
physical oceanography in Iraqi marine Waters. Mesopotamian Journal of Marine Science, 24(1): 13-24.
Al-Ramadhan, B.M. 1988. Residual fluxes of water in an estuarine lagoon. Estuarine, Costal and Shelf-Science, 26(3): 319-330.
Andersen, E.H., Kronvang, B., Soren, E., Larsen, C., Christian, H., Torben, S.J. and Erik, K.R. 2006. Climate-change impacts on hydrology and nutrients in a Danish lowland river basin. Total Science Environment, 365(1-3): 223-237.
De Zuane J. 1997. Handbook of drinking water quality (2nd ed.). John Wiley and Sons. ISBN 0-471-28789-X.
DHI, 2007. Mike 11 a modeling system for rivers and channels, user guide, DHI software, pp: 15-17.
Golder, H. and Associates Ltd. 1981. Flow Simulation study in connection with Basrah Barrage and Shatt Al-Basrah canal, Report submitted to state organization for Dams, Ministry of Irrigation, Iraq.
Karim, H.H. 1998. Evaluation of hydrochemical characteristics of Shatt Al-Basrah and Southern Saddam River around Basrah area, south of Iraq. Marina Mesopotamica, 13(1): 35-51.
Kudiar, K.M. 1999. A finite element model to simulation pollutants transport in Shatt Al-Basrah canal and Khor Al-Zubair estuary. Ph.D thesis, College of Engineering, Baghdad University.
Malakahmad A., Eisakhani M. and Isa M.H. 2008. Developing MIKE-11 Model for Water Quality Simulation in Bertam River, Cameron Highlands. ICCBT (International Conference on Construction and Building Technology) (24), pp: 259-266.
MOD, 2008. Main Outfall Drain, Ministry of Water Resources, Main Outfall Drain Office, unpublished report, Baghdad, Iraq.
UKHO, 2003. Total tide software, United Kingdom Hydrographic Office, UK.
150 A.A. Lafta, Q.M.F. Al-Aeaswi and S.A.R. Al-Taei
البصرةواد الذائبة الكلیة في شط نموذج محاكاة الم Mike11باستخدام برنامج
سامر عدنان رحمةو قاسم مزعل فلیح، الرضا لفتة علي عبد العراقة، البصر، جامعة البصرة، مركز علوم البحار
قدمت الدراسة تطبیق نموذج ذو بعد واحد لمحاكاة توزیع - صخلمستالتم .Mike11المواد الذائبة الكلیة في قناة شط البصرة باستخدام برنامج
ثانیة وبخطوة 60یوم وبخطوة زمنیة مقدارھا 22 تشغیل النموذج لمدةتوزیع المواد محاكاة السلوك الھیدرودینامیكي وتمت متر واحدة، 200 مسافةتمثل االولى ،البصرة لفترتین زمنیتین مختلفتینفي قناة شط ة الكلیة الذائب
اما الفترة األخرى ،االھواروالتي تمثلت بفترة تجفیف فترة التصاریف العالیة ضخ المصب العام في والمتمثلة بافتتاح محطة 2008 فكانت ما بعد عام
ن االول قبل ، یقع المكاتمت معایرة النموذج في مكانین .محافظة ذي قاركانت نتائج النموذج .الثاني بالقرب من جسر الزبیرجسر الخط السریع و
لمتمثلة بارتفاعات المد والجزر یة امتطابقة بصورة جیدة مع القیاسات الحقل .توزیع المواد الذائبةو