top stories - zacks
TRANSCRIPT

1
Global Equity Research
13 June 2014
Top Stories ▼Ipsen (IPN.PA, N – €34.75) (Richard Vosser), Europe Downgrading to Neutral: TASQ (tasquinimod) Overall Survival benefit a bridge too far Since the start of 2013 Ipsen shares have risen 47%, as the value of the base business and significant growth potential from Somatuline have been better appreciated by investors.
UK Banks (Raul Sinha), Europe Prefer domestic UK and pure play EM banks over HSBC & STAN We have been Neutral on StanChart and HSBC in the context of European banks since May and Sept 2013, respectively, driven by the recovery in Europe as well as the prospect of negative EPS revisions in a weak EM revenue environment.
European Technology (Sandeep Deshpande), Europe What to expect at the J.P. Morgan Technology CEO Conference next week - ALERT We have 36 hardware and software companies attending the conference: Several companies (such as SAP, STMicro, ARM, Dassault, Hexagon, and Capgemini) have recently hosted Capital Markets Days, and we look forward to hearing more details on their updated strategies and financial plans.
Tokyo Signals, Noise & Strategy - Vol 20 (Patrick Rial, CFA), Japan Are You Paying Attention? “Like three days passing / cherry blossoms gone, unseen / how I see this world” – Ryota Oshima, 18th century haiku poet.
Asian shipbuilding industries (Sokje Lee), Asia Pacific New shipping economics in eco-ship epoch The ways of ship investment are changing.
Indonesia Automobiles (Aditya Srinath, CFA), Asia Pacific Engine Check: Datsun Go+ completes the LCGC Competitive Landscape Low-cost green cars (LCGCs) now account for 13% of 1ndonesian 4W sales, taking share initially from MPVs.
Food Retail in Emerging Markets (Andrea Teixeira, CFA), Latin America Favor Retailers that Expand Profitably. Picks are: Walmex, CBD, Magnit, Lenta, Savola & BIM In the second annual edition of this proprietary analysis, in collaboration with six of our Global consumer equity research teams, including LatAm, Middle East, Poland, Russia, South Africa, and Turkey teams.
▲Advantest (6857) (N – ¥1,224) (Hisashi Moriyama), Japan Order Trend Strong, Underweight Rating No Longer Justified; Upgrading to Neutral We stated in our June 11 report on SPE sector telephone interviews that orders at Advantest are tracking well ahead of plan.
Q-Strategy Help in EM (Sanaya Tavaria), CEEMEA Stock screens that combine thematic macro and quant EM equities are up 10% in the past three months, outperforming DM by 6%.
Send me your feedback!
GLOBAL Stock Guide
J.P. Morgan Markets
Daily Economic Briefing
Regional First to Market
Inside this Report:
Research by Region
Key Rating, Price Target & EPS Changes
Market at a Glance
Market Monitor
Economics Calendar
J.P. Morgan Forecasts - Economics and Commodities
Analyst Focus List
Today’s Events Conference Call: MedTech - 2014 CEO Conference Call Series: Boston Scientific (BSX) at 11am ET/ 16:00 UK, DIAL-IN: 888-748-4893 or 517-319-9536; Passcode: MEDTECH
Conference Call: Natural Gas Outlook in the Northeast at 2:00pm ET, DIAL-IN: 888-324-7508 (US); 1-773-756-4709 (Outside US); Passcode: MLP
Corporate Marketing ANSYS, INC. (LOS ANGELES, PASADENA) DCC (TORONTO) Iroko Pharmaceuticals (Private) (NEW YORK) WILLIAMS-SONOMA, INC. (PRINCETON)
See end pages for analyst certification. For important disclosures, please refer to the disclosure section at the end of the individual linked notes. J.P. Morgan does and seeks to do business with companies covered in its research reports. As a result, investors should be aware that the firm may have a conflict of interest that could affect the objectivity of this report. Investors should consider this report as only a single factor in making their investment decision.

2
Global Published Research áTOP
Europe
Recommendation Changes
▲Dufry (DUFN VX – Neutral) (Jaafar Mestari) Steady-state was the enemy: upgrading to Neutral following The Nuance Group acquisition
▼Ipsen (IPN FP – Neutral) (Richard Vosser) Downgrading to Neutral: TASQ (tasquinimod) Overall Survival benefit a bridge too far
Price Target and Estimate Changes Active Biotech (ACTI SS – Underweight) (James D Gordon) Reiterating our UW recommendation ahead of TASQ Phase III read-out, which looks likely to disappoint
Atkins (WS) (ATK LN – Overweight) (Jolyon S Wellington) FY14 results in line with expectations, showing organic growth and strategic improvement
Dufry (DUFN VX – Neutral) (Jaafar Mestari) Steady-state was the enemy: upgrading to Neutral following The Nuance Group acquisition
HSBC Holdings plc (HSBA LN – Neutral) (Raul Sinha) UK Banks: Prefer domestic UK and pure play EM banks over HSBC & STAN
Ipsen (IPN FP – Neutral) (Richard Vosser) Downgrading to Neutral: TASQ (tasquinimod) Overall Survival benefit a bridge too far
PZ Cussons (PZC LN – Neutral) (Celine Pannuti, CFA) FY14 growth despite tough markets but hard to repeat in FY15. PT cut to 350p
Price Target and Estimate Changes, continued Standard Chartered (STAN LN – Neutral) (Raul Sinha) UK Banks: Prefer domestic UK and pure play EM banks over HSBC & STAN
Storebrand (STB NO – Overweight) (Daniel Do-Thoi) Updating numbers and highlighting paid-up policy conversions as potential upcoming catalyst
Results and Company Views 3i (III LN – Overweight) (Christopher Brown) Action site visit underlines its potential - we believe a doubling of the current value is not unreasonable
Asia Resource Minerals PLC (ARMS LN – Neutral) (Ben Defay) Change of CEO; position relocated to Indonesia - ALERT
Fenner (FENR LN – Neutral) (Andrew J Wilson) AEP Capital Markets Day Feedback - Growth and margin targets the headline takeaways - ALERT
Halma (HLMA LN – Neutral) (Andrew J Wilson) FY14 Results - First Take - ALERT
Sector Research European Technology (Sandeep Deshpande) What to expect at the J.P. Morgan Technology CEO Conference next week - ALERT
UK Non Life (Andreas van Embden) Update on UK Motor insurance regulation from CMA - ALERT
3
Asia
Price Target and Estimate Changes
KPJ Healthcare Berhad (KPJH.KL – Neutral), Malaysia (Simone Yeoh) Earnings downgrades stabilizing but consistency in performance is key from here; prefer IHH (OW)
PT Tower Bersama Infrastructure Tbk (TBIG.JK – Overweight), Indonesia (Princy Singh) Management meeting: Maintaining growth guidance, M&A focus continues
Reliance Power (RPOL.BO – Underweight), India (Sumit Kishore) What's in the price?
Results and Company Views
Bank of China - H (3988.HK – Overweight), China (Katherine Lei) China Summit 2014: Feedback from the Conference
Belle International Holdings Ltd. (1880.HK – Neutral), China (Ebru Sener Kurumlu) Footwear drag continues
Cathay Pacific (0293.HK – Overweight), Hong Kong (Corrine Png) Pax loads improved in May, cargo demand strengthened on US routes; stay OW
China Hongqiao Group (1378.HK – Neutral), China (Daniel Kang) China Summit 2014: Feeback from the Conference
IJM Corporation (IJMS.KL – Overweight), Malaysia (Hoy Kit Mak) Introducing the IJM Corp/IJM Land arbitrage/intrinsic value calculator
IJM Corporation (IJMS.KL – Overweight), Malaysia (Hoy Kit Mak) Scomi investment finally pays off - ALERT
Infosys (INFY.BO – Overweight), India (Viju K George) Revenue growth recovery will likely get delayed due to the management change; this could be a long haul for Infosys
Infosys (INFY.BO – Overweight), India (Viju K George) Vishal Sikka will be the next CEO of Infosys; this could likely be a long haul even if he's the right man for the job
Lenovo Group Limited (0992.HK – Overweight), China (Gokul Hariharan) China Summit 2014: Feedback from the conference – PC profit growth and Moto share gains remain the upside catalysts
Namchow Chemical Industrial Co. (1702.TT, – Not Covered), Taiwan (Andre Chang, CFA) Company Visit Note
Strategy
Emerging Markets Strategy Dashboards, Global (Adrian Mowat) Identifying change and providing perspective on key economic and equity market data of global emerging markets
Q-Strategy Help in EM, Global (Sanaya Tavaria) Stock screens that combine thematic macro and quant
Economics
A par for the course May CPI print, India (Sajjid Z Chinoy)
April IP delivers a housewarming gift to the new government, India (Sajjid Z Chinoy)
Bank of Korea on hold, with comments in line with our expectation, South Korea (Min Joo Kang)
BI holds; focus still on current account balance, Indonesia (Benjamin Shatil)
Import prices declined in May, South Korea (Min Joo Kang)
May new loans higher than expected; signs of rebalancing between bank loans and non-bank financing, China (Grace Ng)
What’s not to like about India’s May trade deficit?, India (Sajjid Z Chinoy)
Sector Research
Asian Refining update, Asia Pacific (Samuel Lee, CFA) Weak middle distillates have led GRMs lower in 2Q
Asian shipbuilding industries, South Korea (Sokje Lee) New shipping economics in eco-ship epoch
Hong Kong Property, Hong Kong (Cusson Leung) Falling land prices to sustain development returns
Hong Kong Property, Hong Kong (Cusson Leung) Intensifying primary launches; stay positive on developers
Indonesia Automobiles, Indonesia (Aditya Srinath, CFA) Engine Check: Datsun Go+ completes the LCGC Competitive Landscape
Know Your Power, India (Sumit Kishore) Election euphoria does not translate into demand growth or PLF improvement in May
4
Promise Inc(3057.TW, – Not Covered), Taiwan (Gokul Hariharan) Riding the strong big data trend - Company Visit Note
SP Setia (SETI.KL – Neutral), Malaysia (Simone Yeoh) 1HFY14 results: Profits below expectations, but pre-sales in line
Weichai Power (2338.HK – Overweight), China (Karen Li, CFA) A step forward to become a world champion with control in KION obtained
Thailand O&G, Thailand (Scott L Darling) Diesel prices cut by 14 satang; slightly negative for PTT Plc
Australia
Publications
Goodman Group (GMG, OW – A$5.19) (Richard Jones, CFA) Japan projects lift FY14 EPS guidance to 7%
Seven Group Holdings (SVW, N – A$7.70) (Anthony Passe-de Silva) Scheme fails to bridge nexus to oil & gas but Group keeps looking
Mineral Resources Limited (MIN, UW – A$9.70) (Anthony Passe-de Silva) Questioning MIN's step into AQA battle
Newcrest Mining (NCM, N – A$9.71) (Mark Busuttil) Higher than expected depreciation expense sees downgrades to FY15 NPAT estimate
Ramsay Health Care (RHC, N – A$46.80) (Steven Wheen) Acquisition now a fait accompli
Publications, continued
Leighton Holdings Limited (LEI, UW – A$19.81) (Anthony Passe-de Silva) Taking steps on path to strategic change but plenty of uncertainty remains
Strategy Weekender (Paul Brunker) Asian investors on Aussie equities: more puzzled than hurt
Australia Economic Update (Ben Jarman) Labour supply ebbs further in Australia
New Zealand Economic Update (Ben Jarman) Wheeler of fortune
Ocado (Borja Olcese) A unique and disruptive business model. Initiating coverage with an Overweight rating and 500p PT
Japan
Recommendation Changes
▲Advantest (6857) (Neutral) (Hisashi Moriyama) Order Trend Strong, Underweight Rating No Longer Justified; Upgrading to Neutral
Price Target and Estimate Changes Advantest (6857) (Neutral) (Hisashi Moriyama) Order Trend Strong, Underweight Rating No Longer Justified; Upgrading to Neutral
Results and Company Views Kirin Holdings (2503) (Overweight) (Ritsuko Tsunoda) The World Cup Is Finally Here—Will the Spotlight Fall on Kirin?
Results and Company Views, continued Nintendo (7974) (Underweight) (Haruka Mori) E3 Report (3): Takeaways from Analyst Briefing, Tour of E3 Booth - ALERT
Yamato Holdings (9064) (Neutral) (Dan Lu) Nikkei Reports Eight-company Joint Trucking Initiative - ALERT
Strategy Tokyo Signals, Noise & Strategy - Vol 20 (Patrick Rial, CFA) Are You Paying Attention?
Sector Research Electronic Components Update (Masashi Itaya) May Sales: Rohm
5
LatAm
Recommendation, Price Target and Estimate Changes
Gran Tierra Energy (GTE – Overweight) (Caio M Carvalhal) We Continue Positive on Peruvian Operations and Reinforce OW and Top Pick
LatAm Company and Sector News
Food Retail in Emerging Markets (Andrea Teixeira, CFA) Favor Retailers that Expand Profitably. Picks are: Walmex, CBD, Magnit, Lenta, Savola & BIM
Strategy
Brazil Equity Strategy Presentation (Emy Shayo Cherman) Binary Outcome
Emerging Markets Strategy Dashboards (Adrian Mowat) Identifying change and providing perspective on key economic and equity market data of global emerging markets
JPMQ : Global Pairs Trading Ideas (Robert Smith)
Price Reactions To Earnings Announcements (Robert Smith) Latest True Market Surprises For Global Stocks
Strategy, continued
Q-Strategy Help in EM (Sanaya Tavaria) Stock screens that combine thematic macro and quant
The Earnings Landscape (Robert Smith) EPS revisions ratios for all the major regions and markets
Economics
Brazil (Cassiana Fernandez) The blues remains the same
Credit Research
Gildemeister (AUTGIL - Underweight) (Daniel Sensel) 1Q14 review: "You've got a fast car. Is it fast enough so you can fly away?" - We don't think so
Marfrig (MARFRI - Neutral) (Daniel Sensel) The '20s Look Attractive After the Issuance of the New '19s and the Launch of the Tender for the '21s
CEEMEA
Strategy
Emerging Markets Strategy Dashboards (Adrian Mowat) Identifying change and providing perspective on key economic and equity market data of global emerging markets
Q-Strategy Help in EM (Sanaya Tavaria) Stock screens that combine thematic macro and quant
Economics
Middle East and North Africa Today (Brahim Razgallah)
Economics, continued
Turkey (Yarkin Cebeci) CAD narrows, financing improves in April
Commodities and FX
Natural Gas Weekly & Storage Recap (Scott C. Speaker) Price action suggests gas market recognition of lower end-October storage trajectory potential
6
US
Recommendation Changes
▲Accuray (ARAY – Overweight) (Tycho W. Peterson) Upgrading to Overweight on Continued Order Momentum and Attractive Valuation; PT Goes to $12
▼lululemon athletica inc. (LULU – Neutral) (Brian J. Tunick) Downgrading to Neutral; Decelerating Comps, Rising Investments, and Margin Pressures Pushing Us to the Sidelines
Price Target and Estimate Changes
Accuray (ARAY – Overweight) (Tycho W. Peterson) Upgrading to Overweight on Continued Order Momentum and Attractive Valuation; PT Goes to $12
DigitalGlobe, Inc. (DGI – Neutral) (Paul Coster, CFA) Tweaking Estimates; Establishing YE15 Price Target of $34.50
Intel (INTC – Overweight) (Christopher Danely) Intel Hikes 2Q14 and 2014 Guidance on PC Demand Upside. Raising Estimates and Reiterate Overweight
lululemon athletica inc. (LULU – Neutral) (Brian J. Tunick) Downgrading to Neutral; Decelerating Comps, Rising Investments, and Margin Pressures Pushing Us to the Sidelines
Synaptics Inc. (SYNA – Overweight) (Paul Coster, CFA) Adjusting Model for Renesas; Price Target Goes to $98.00
Ulta Salon, Cosmetics & Fragrance, Inc. (ULTA – Overweight) (Brian J. Tunick) Takeaways from ULTA HQ Visit
Results and Company Views
bluebird bio (BLUE – Overweight) (Cory Kasimov) Previewing Initial Look at LentiGlobin Gene Therapy Data in Beta-Thalassemia at EHA This Weekend
C.R. Bard Inc. (BCR – Neutral) (Michael Weinstein) Panel Support is Unanimous; Modest Efficacy Leaves Door Open for Competition - ALERT
CONSOL Energy (CNX – Overweight) (John Bridges, CFA, ACSM) Everything's Relative; but Compared with the Coal Sector, this Duckling is Now a Swan.
LabCorp (LH – Neutral) (Lisa C. Gill) LH Week Day 5: Conference Call Recap
Results and Company Views, continued
Nektar Therapeutics (NKTR – Overweight) (Cory Kasimov) OIC Panel Provides Some Welcome Relief for Naloxegol... We Anticipate Approval by the 9/16 PDUFA - ALERT
Santander Consumer (SC) (SC – Overweight) (Richard Shane) SC On-Site Visit - ALERT
Strategy
JPMQ: Pairs Trade Model (Dubravko Lakos-Bujas) Pair Trade Close Alert (UAL US / LUV US)
Sector Research
Clinical Laboratories (Lisa C. Gill) Another Positive Month for Office Visits in May - ALERT
Communications Equipment & Data Networking (Rod Hall, CFA) Hall Monitor: June 2014
EE/MI (C. Stephen Tusa, Jr CFA) Takeaways from JPM China Conference: The Year of the Duck
Energy Infrastructure/MLPs (Jeremy Tonet, CFA) Weekly Comp Tables
JPM Trust Tracker (Richard Shane) May 2014 Preview
Med Utilization Tracker (Justin Lake) Doc Office Visits +1.2% in May
Medical Utilization Tracker (Michael Weinstein) Physician Office Visits Up 1.2% in May
Monthly Tire Review: June 2014 (Ryan Brinkman) Industry Fundamentals Strong: Expect Slower But Still Solid Growth As Shipments Cycle Tougher Comps
U.S. Asset Managers (Kenneth B. Worthington, CFA) May 2014 Monthly Performance/Sales: Weaker Sales MoM (ex. MM) Driven by Lower US Equity Sales
U.S. Asset Managers (Kenneth B. Worthington, CFA) Weekly Fund Flows: Jun 05 - Jun 11. Fixed Income and Equity Up, MM Funds Show Outflows
www.jpmorganmarkets.com
Europe Equity Research13 June 2014
Ipsen▼ Neutral
Previous: Overweight
IPN.PA, IPN FP
Downgrading to Neutral: TASQ (tasquinimod) Overall Survival benefit a bridge too far
▼
Price: €34.75
Price Target: €36.00Previous: €38.00
European Healthcare (Pharma, Biotech)
Richard Vosser AC
(44-20) 7742-6652
Bloomberg JPMA VOSSER <GO>
James D Gordon
(44-20) 7742-6654
Diana Na
(44 20) 7742 7922
J.P. Morgan Securities plc
For Specialist Sales advice please contact:
Marjan Daeipour
(44 20) 7134-1329
YTD 1m 3m 12mAbs 1.1% 5.7% 10.0% 27.6%Rel -4.7% 3.1% 4.9% 8.6%
Ipsen (IPN.PA;IPN FP)
FYE Dec 2012A 2013E(Prev)
2013E(Curr)
2014E(Prev)
2014E(Curr)
2015E(Prev)
2015E(Curr)
Adj. EPS FY (€) 1.74 1.92 1.85 2.07 2.00 2.51 2.25Revenue FY (€ mn) 1,277 1,298 1,282 1,341 1,298 1,429 1,380EBIT FY (€ mn) 117 182 191 207 207 251 232EBIT Margin FY 9.2% 14.1% 14.9% 15.4% 15.9% 17.5% 16.8%Net Income FY (€ mn) (28) 155 152 169 165 218 198Headline EPS FY (€) (0.33) 1.86 1.83 2.03 1.98 2.62 2.38Headline P/E FY NM 18.7 19.0 17.2 17.6 13.3 14.6Adj P/E FY 19.9 18.1 18.8 16.8 17.3 13.8 15.4Source: Company data, Bloomberg, J.P. Morgan estimates.
Company DataPrice (€) 34.75Date Of Price 12 Jun 14Price Target (€) 36.00Price Target End Date 31-Dec-1452-week Range (€) 37.13-26.33Market Cap (€ bn) 2.90Shares O/S (mn) 83
See page 21 for analyst certification and important disclosures, including non-US analyst disclosures.J.P. Morgan does and seeks to do business with companies covered in its research reports. As a result, investors should be aware that the firm may have a conflict of interest that could affect the objectivity of this report. Investors should consider this report as only a single factor in making their investment decision.
24
28
32
36
€
Jun-13 Sep-13 Dec-13 Mar-14 Jun-14
Price Performance
IPN.PA share price (€)
MSCI-Eu (rebased)
Since the start of 2013 Ipsen shares have risen 47%, as the value of the base business and significant growth potential from Somatuline have been betterappreciated by investors. With limited upside from these areas, we see tasquinimod (TASQ) PIII prostate cancer data in 4Q’14 as the only significant catalyst in the next 12 mths. Unfortunately, we believe this data is unlikely to demonstrate the survival advantage required for TASQ to be successful. Thus,we now see limited upside to our new €36 PT (€38) and move to Neutral.
Only significant catalyst in the next 12 months is TASQ Phase III data in mCRPC (metastatic Castration Resistant Prostate Cancer) expected in 4Q’14. While this could offer the potential for substantial upside, our analysis suggests that this is likely to be ultimately unattainable.
Highly competitive mCRPC market, likely to require a survival benefit for TASQ to take share and potentially even reach the market: In the last 4 years regulators have approved 4 agents (Zytiga, Xtandi, Xofigo and Provenge) all with statistically significant OS (Overall Survival) benefits. Not only does this mean a drug without this benefit is likely to be relegated to a niche, but it is also possible that it is refused approval. Ipsen are aware of this, extending the trial repeatedly trying to show an OS benefit.
TASQ has a low likelihood of showing a survival benefit in the Phase III, in our view: We see multiple reasons that could reduce the potential for TASQ to show an OS benefit (1) Treatment only to progression; (2) Use of Zytiga (Xtandi/Xofigo) earlier in the placebo arm; (3) A more heterogeneous patient population; (4) Potential for a relatively high treatment dropout rate and dose reductions in a more severe population enrolled into Phase III and (5) inconclusive OS benefit in Phase II.
Without an OS benefit, we see limited upside to current levels: We continue to include no sales for TASQ in our model, but even if TASQreaches the market in a niche with peak sales of €100m, this would only be worth an extra €2 taking our Embedded Value to €38, only 9% upside.
Downgrades to our forecasts: Outside of our analysis on TASQ, we have also revised our forecasts for the disappointing Dysport New Formulation data and the relaunch of Increlex, which leads to Adjusted EPS cuts of 3-16% through 2014-2020. As a result we have lowered our PT to €36, which is based on 16x 2015 EPS estimates.
www.jpmorganmarkets.com
Europe Equity Research13 June 2014
UK Banks
HSBA.L, HSBA LNNeutralPrice: 621p
Price Target: 675p
Prefer domestic UK and pure play EM banks over HSBC & STAN
STAN.L, STAN LNNeutralPrice: 1,330p
Price Target: 1,450p
UK Banks
Raul Sinha AC
(44-20) 7742-2190
Bloomberg JPMA SINHA <GO>
J.P. Morgan Securities plc
Vivek Gautam
(44-20) 7742 3244
J.P. Morgan Securities plc
Josh Klaczek
(852) 2800-8534
J.P. Morgan Securities (Asia Pacific) Limited
Joy Wu
(852) 2800-8557
J.P. Morgan Securities (Asia Pacific) Limited
Equity Ratings and Price Targets
Mkt Cap Rating Price TargetCompany Ticker (£ mn) Price (p) Cur Prev Cur PrevHSBC Holdings plc HSBA LN 116,928.10 621 N n/c 675 700Standard Chartered STAN LN 32,266.96 1,330 N n/c 1,450 1,500
Source: Company data, Bloomberg, J.P. Morgan estimates. n/c = no change. All prices as of 12 Jun 14.
See page 17 for analyst certification and important disclosures, including non-US analyst disclosures.J.P. Morgan does and seeks to do business with companies covered in its research reports. As a result, investors should be aware that the firm may have a conflict of interest that could affect the objectivity of this report. Investors should consider this report as only a single factor in making their investment decision.
We have been Neutral on StanChart and HSBC in the context of European banks since May and Sept 2013, respectively, driven by the recovery in Europe as well as the prospect of negative EPS revisions in a weak EM revenue environment. Consensus EPS has been revised lower by c20% and c15% for the two banks over the period, respectively. With pressures on EM/capital markets revenues persisting near term, earnings expectations are likely to continue to adjust lower, in our view, although the outlook for 2015 appears to be improving given recent EM FX moves. Our EPS estimates (revised c5% lower again) are still c8% below company compiled and BBG consensus, which reinforces our preference for Lloyds and Barclays within the UK and local EM banks in Asia. Between the two, we continue to prefer StanChart, inline with our more constructive house view on EM Asia.
Near term revenue pressures: We expect EM and capital markets geared revenues to remain under pressure for HSBC and StanChart with Q2’14 unlikely to provide an inflection point for earnings. We also note for StanChart a very strong comparative period in Q2'13 where there was a significant pick up in group revenue taking H1’13 revenue growth to mid-single digits, after being only slightly up in Q1’13. As a result, we expect H1’14 revenue trends to be slightly weaker (-3% y/y) than Q1’14 at the upcoming IMS on 26 June ’14.
Uncertain capital requirements weigh on dividend prospects: Although both banks have similar absolute CT1 ratios on our estimates (HSBC 11.2% and StanChart 11.1% FY’14E), we expect StanChart to operate with a higher buffer over its minimum capital stack (8.4%), relative to HSBC (10.4%) which also has higher litigation risk in our view. Capital uncertainty in the UK and litigation are likely to weigh on DPS growth with scrip neutralization unlikely at HSBC pre 2016, in our view.
FX translation and margins key to H2’14 outlook: Despite the near term pressures, the recovery in local EM currencies if sustained could become a tailwind to revenues in H2’14 (c1%) and 2015. Our assumptions for margins in Transaction banking are broadly flat for 2014 with a pick-up in 2015.
Changes to estimates and PTs: We are cutting our 2016E EPS estimates for HSBC and StanChart by 5%. Our cuts are driven by lower revenues given the persisting weakness in GBM/Financial Markets income, partlyoffset by lower costs for both banks and lower provisions in the case of HSBC. Our Dec-15 price target falls to 675p (700p) for HSBC and 1450p (1500p) for StanChart, driven by our earnings revisions.
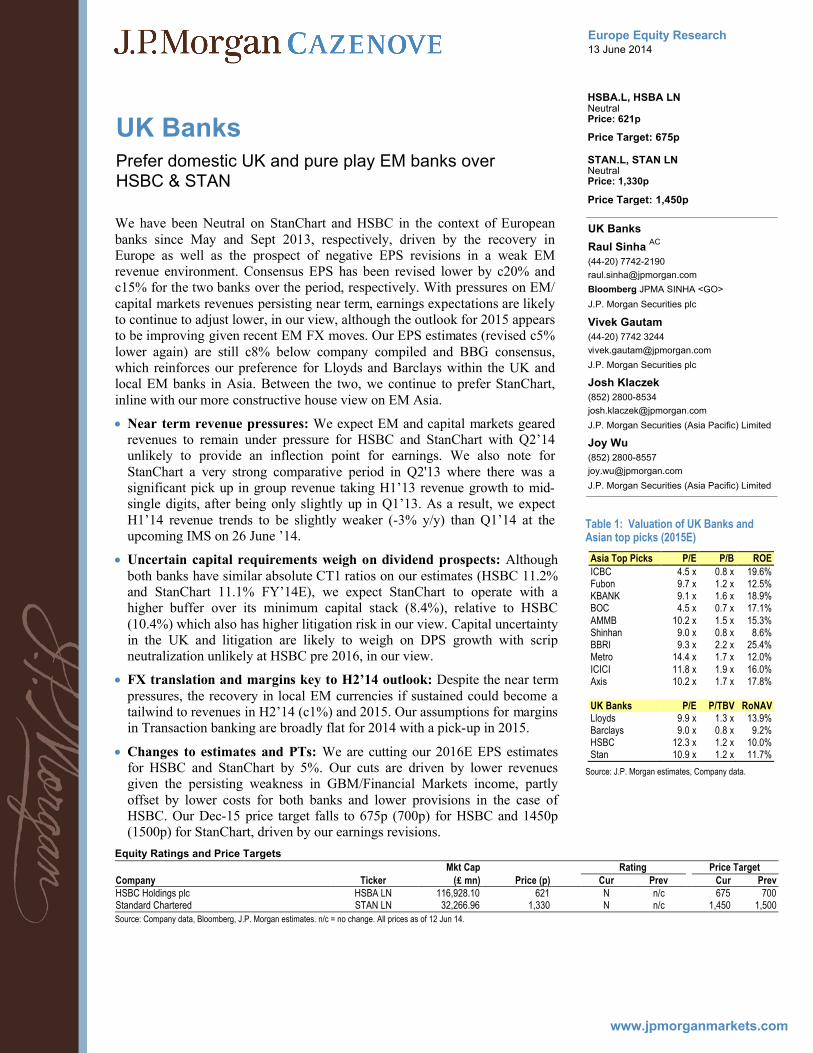
Table 1: Valuation of UK Banks and Asian top picks (2015E)
Asia Top Picks P/E P/B ROE
ICBC 4.5 x 0.8 x 19.6%Fubon 9.7 x 1.2 x 12.5%KBANK 9.1 x 1.6 x 18.9%BOC 4.5 x 0.7 x 17.1%AMMB 10.2 x 1.5 x 15.3%Shinhan 9.0 x 0.8 x 8.6%BBRI 9.3 x 2.2 x 25.4%Metro 14.4 x 1.7 x 12.0%ICICI 11.8 x 1.9 x 16.0%Axis 10.2 x 1.7 x 17.8%
UK Banks P/E P/TBV RoNAVLloyds 9.9 x 1.3 x 13.9%Barclays 9.0 x 0.8 x 9.2%HSBC 12.3 x 1.2 x 10.0%Stan 10.9 x 1.2 x 11.7%
Source: J.P. Morgan estimates, Company data.
www.jpmorganmarkets.com
Europe Equity Research13 June 2014
European TechnologyWhat to expect at the J.P. Morgan Technology CEO Conference next week - ALERT
European Technology
Sandeep Deshpande AC
(44-20) 7134-5276
Bloomberg JPMA DESHPANDE <GO>
J.P. Morgan Securities plc
Stacy Pollard AC
(44-20) 7134-5420
Bloomberg JPMA POLLARD <GO>
J.P. Morgan Securities plc
Chetan Udeshi, CFA
(91-22) 6157-3319
J.P. Morgan India Private Limited
Hannes Leitner
(44-20) 7742-8666
J.P. Morgan Securities plc
See page 2 for analyst certification and important disclosures, including non-US analyst disclosures.J.P. Morgan does and seeks to do business with companies covered in its research reports. As a result, investors should be aware that the firm may have a conflict of interest that could affect the objectivity of this report. Investors should consider this report as only a single factor in making their investment decision.
We have 36 hardware and software companies attending the conference: Several companies (such as SAP, STMicro, ARM, Dassault, Hexagon, and Capgemini) have recently hosted Capital Markets Days, and we look forward to hearing more details on their updated strategies and financial plans. Overall,we expect to get a mood of the end market whether consumer or enterprise, development of risk or opportunity in the supply chain as well as gain some color into businesses going into 2H14.
Semiconductor stocks are on a roll so we will be looking to probe whether there are roadblocks coming: The SOX is up 16.4% year to date and most major stocks in our space our on a roll with improving sales and margin. The risk for semi companies is over-build and inventory; thus we will be probing risk of that happening over the next couple of quarters by questioning companies on allocation or lack thereof and lead times. Investors will also be looking at timing of “take off” of new drivers such as Internet of Things as well as whether there is potential for another run in smartphones/tablets.
In Software/Services, SMAC themes are bound to prevail. SMAC = Social, Mobile, Analytics (Big Data) and Cloud. The SMAC trends are a major driver for companies like SAP and Capgemini and, although perhaps slower to be adopted in the CAD/PLM space, companies like Hexagon, Dassault and Aveva will also likely touch on these topics. In addition, JPM analyst Stacy Pollard will host a brief 10-minute session on the morning of the 18th about the Cloud, with materials from the JPM CIO Cloud Survey as well as a recent SaaS Primer report.
In Communications tech focus will be on China build, European potential, margin and potential for disruption by SDN/NFV: China wireless build is a significant ongoing revenue driver in wireless equipment so we will be looking at spending progress on that front as well as whether Europe 4G will at last begin to impact equipment company revenues by 2H. Most comm. tech companies have improving margin YoY as the competitive environment has improved – so can the good times continue or will companies begin to aggressively compete for share at expense of margin. Finally there will also be questions on mid term potential of SDN/NFV to disrupt the router business but also the radio networks.
We are featuring a panel of J.P. Morgan IT experts on the 18th June, where we will hear the firm’s overall IT spending plans in 2014, as well as particular trends in hot areas such as Data & Analytics, Security and Digital infrastructure, among others. Indeed, we’ll hear from both sides (IT buyer and seller) with regards to banks – because we also have several software vendors focused on the financial services sector (Temenos, SimCorp and Misys), and of course this sector remains a large percentage of the revenues for companies like Capgemini (22% for 2013).
The conference runs from 8:30am to 5:00pm both days, the 17th and 18th of June. We also invite you to join us for a Drinks Reception and World Cup Screening from 5:00pm on the 17th.

www.jpmorganmarkets.com
Japan Equity Research12 June 2014
Clients should contact representatives and execute transactions through a J.P. Morgan subsidiary or affiliate in their home jurisdiction unless governing law permits otherwise.
Tokyo Signals, Noise & Strategy - Vol 20Are You Paying Attention?
Strategy
Patrick Rial, CFA AC
(81-3) 6736-8649
JPMorgan Securities Japan Co., Ltd.
Jesper J Koll
(81-3) 6736-8600
JPMorgan Securities Japan Co., Ltd.
Rajiv Batra
(91-22) 6157-3568
J.P. Morgan India Private Limited
See page 18 for analyst certification and important disclosures, including non-US analyst disclosures.J.P. Morgan does and seeks to do business with companies covered in its research reports. As a result, investors should be aware that the firm may have a conflict of interest that could affect the objectivity of this report. Investors should consider this report as only a single factor inmaking their investment decision.
“Like three days passing / cherry blossoms gone, unseen / how I see this world” –Ryota Oshima, 18th century haiku poet.
The governance structure of Japan Inc. that persisted throughout the post-War era, which denied shareholders a voice, and certainly their claim as the ultimate owners of capital, is weakening.
Japan’s political leadership has embarked on a fundamental reorientation: return on capital matters and shareholders are moving from the fringe to the center. The concrete steps in the adoption of the stewardship code by domestic asset managers, national pension reform, and the traction that the JPX-Nikkei 400 is generating, all speak to this trend.
Naysayers claim that Japan still lags the rest of the world. While we have quibbles with such generalizations, on the whole, they are correct. However, in the market, fortunes are rarely made by pointing out the way things are, but rather in recognizing changes on the margin that are not yet discounted.
With this in mind, we note that the JPX-Nikkei 400 is emerging as a topic of interest among both investors and corporates. An index rebalance will be announced on Aug. 7. While we think the index has shortcomings as an investment, companies appear eager to take steps to gain admission to this group of “Japan All Stars.” In that sense, the potential impact of the index is greater than if it were an investment product alone.
The speed at which the stewardship code is being adopted by domesticinstitutions has also been a positive surprise. In total, 127 fund operators, both foreign and domestic, have pledged to adopt the code. In the long run, this represents a tidal change in fiduciary oversight, and investors who aren’t paying attention risk missing the cherry blossoms before they fall, in our view.
From the business weeklies: Weekly Toyo Keizai advises on how to navigate the treacherous IPO and new issues markets in Japan. The magazine also surveys top auto journalists on the strength of Toyota’s revival. Diamond Weekly looks at the Sharp’s Kameyama plant 10 years after opening.
New insights from our analysts: Dairo Murata sees top convenience stores continuing to squeeze out 2nd-tier rivals with continuous new store openingsand better cost structures. Hisashi Moriyama raises Toshiba and Fuji Electric to “Overweight” as the consolidation phase in domestic semiconductors has resulted in a limited number of strong players, while the “Internet of things” is set to drive top-line growth going forward.
TIJ: The secrets of Nagano residents' longevity are revealed.
ContentsStrategy Insights 2Noise & Signals from the Local Press 9Tactical View – Neutral 10New Insights from Our Analysts 11J.P. Morgan Japan Top-Down Thesis 12What We’re Watching – Key Drivers of Our Thesis 14This is Japan 15Tokyo Signals, Noise & Strategy Backlog 16
www.jpmorganmarkets.com
Asia Pacific Equity Research12 June 2014
Clients should contact representatives and execute transactions through a J.P. Morgan subsidiary or affiliate in their home jurisdiction unless governing law permits otherwise.
Asian shipbuilding industriesNew shipping economics in eco-ship epoch
Ship Building & Repairs
Sokje Lee AC
(82-2) 758-5729
Bloomberg JPMA SOKJELEE <GO>
J.P. Morgan Securities (Far East) Ltd, Seoul Branch
Minsung Lee
(822) 758-5728
J.P. Morgan Securities (Far East) Ltd, Seoul Branch
Jesper J Koll
(81-3) 6736-8600
JPMorgan Securities Japan Co., Ltd.
See page 12 for analyst certification and important disclosures, including non-US analyst disclosures.J.P. Morgan does and seeks to do business with companies covered in its research reports. As a result, investors should be aware that the firm may have a conflict of interest that could affect the objectivity of this report. Investors should consider this report as only a single factor in making their investment decision.
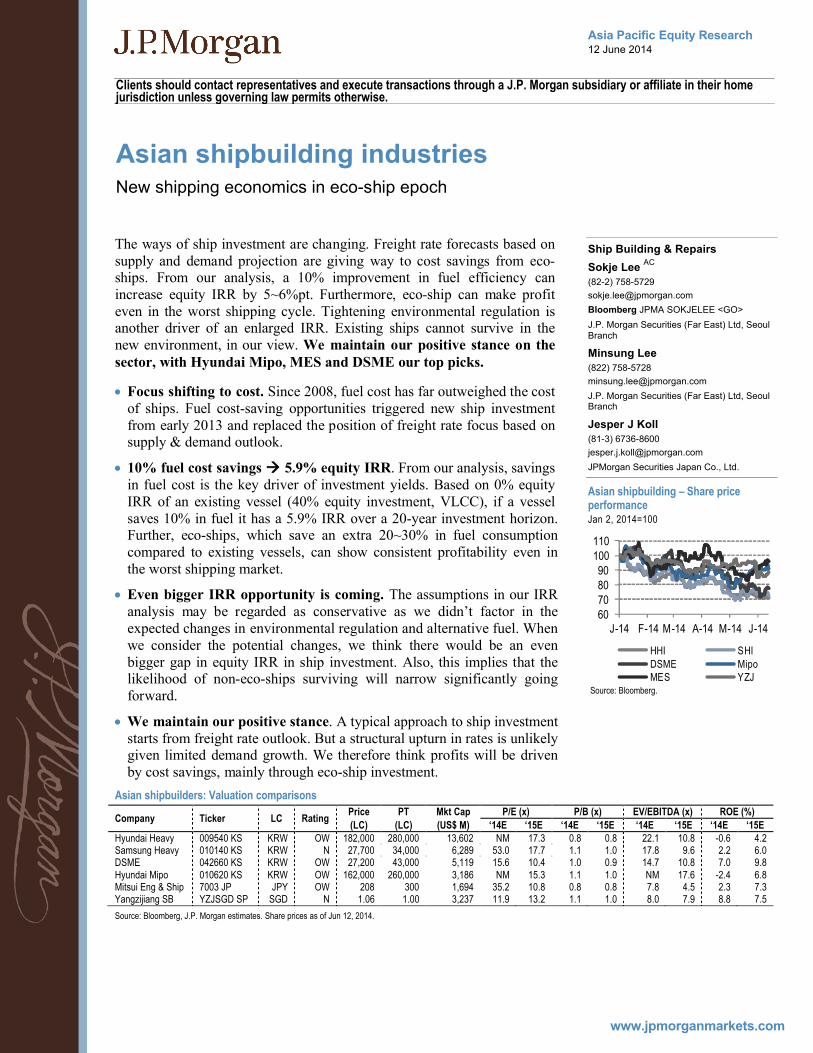
The ways of ship investment are changing. Freight rate forecasts based on supply and demand projection are giving way to cost savings from eco-ships. From our analysis, a 10% improvement in fuel efficiency can increase equity IRR by 5~6%pt. Furthermore, eco-ship can make profit even in the worst shipping cycle. Tightening environmental regulation is another driver of an enlarged IRR. Existing ships cannot survive in the new environment, in our view. We maintain our positive stance on the sector, with Hyundai Mipo, MES and DSME our top picks.
Focus shifting to cost. Since 2008, fuel cost has far outweighed the cost of ships. Fuel cost-saving opportunities triggered new ship investment from early 2013 and replaced the position of freight rate focus based on supply & demand outlook.
10% fuel cost savings 5.9% equity IRR. From our analysis, savings in fuel cost is the key driver of investment yields. Based on 0% equity IRR of an existing vessel (40% equity investment, VLCC), if a vessel saves 10% in fuel it has a 5.9% IRR over a 20-year investment horizon. Further, eco-ships, which save an extra 20~30% in fuel consumption compared to existing vessels, can show consistent profitability even in the worst shipping market.
Even bigger IRR opportunity is coming. The assumptions in our IRR analysis may be regarded as conservative as we didn’t factor in the expected changes in environmental regulation and alternative fuel. When we consider the potential changes, we think there would be an even bigger gap in equity IRR in ship investment. Also, this implies that the likelihood of non-eco-ships surviving will narrow significantly going forward.
We maintain our positive stance. A typical approach to ship investment starts from freight rate outlook. But a structural upturn in rates is unlikely given limited demand growth. We therefore think profits will be driven by cost savings, mainly through eco-ship investment.
Asian shipbuilders: Valuation comparisons
Company Ticker LC RatingPrice PT Mkt Cap P/E (x) P/B (x) EV/EBITDA (x) ROE (%)
(LC) (LC) (US$ M) ‘14E ‘15E ‘14E ‘15E ‘14E ‘15E ‘14E ‘15EHyundai Heavy 009540 KS KRW OW 182,000 280,000 13,602 NM 17.3 0.8 0.8 22.1 10.8 -0.6 4.2Samsung Heavy 010140 KS KRW N 27,700 34,000 6,289 53.0 17.7 1.1 1.0 17.8 9.6 2.2 6.0DSME 042660 KS KRW OW 27,200 43,000 5,119 15.6 10.4 1.0 0.9 14.7 10.8 7.0 9.8Hyundai Mipo 010620 KS KRW OW 162,000 260,000 3,186 NM 15.3 1.1 1.0 NM 17.6 -2.4 6.8Mitsui Eng & Ship 7003 JP JPY OW 208 300 1,694 35.2 10.8 0.8 0.8 7.8 4.5 2.3 7.3Yangzijiang SB YZJSGD SP SGD N 1.06 1.00 3,237 11.9 13.2 1.1 1.0 8.0 7.9 8.8 7.5
Source: Bloomberg, J.P. Morgan estimates. Share prices as of Jun 12, 2014.
Asian shipbuilding – Share price performanceJan 2, 2014=100
Source: Bloomberg.
60708090
100110
J-14 F-14 M-14 A-14 M-14 J-14
HHI SHIDSME MipoMES YZJ
www.jpmorganmarkets.com
Asia Pacific Equity Research12 June 2014
Indonesia AutomobilesEngine Check: Datsun Go+ completes the LCGC Competitive Landscape
Head of ASEAN Strategy & Indonesian Research
Aditya Srinath, CFA AC
(62-21) 5291-8573
Bloomberg JPMA SRINATH <GO>
PT J.P. Morgan Securities Indonesia
Indra Cahya
(62-21) 5291-8575
PT J.P. Morgan Securities Indonesia
Nick Lai
(852) 2800 8543
J.P. Morgan Securities (Asia Pacific) Limited
Akira Kishimoto
(81-3) 6736-8646
JPMorgan Securities Japan Co., Ltd.
See page 5 for analyst certification and important disclosures, including non-US analyst disclosures.J.P. Morgan does and seeks to do business with companies covered in its research reports. As a result, investors should be aware that the firm may have a conflict of interest that could affect the objectivity of this report. Investors should consider this report as only a single factor in making their investment decision.
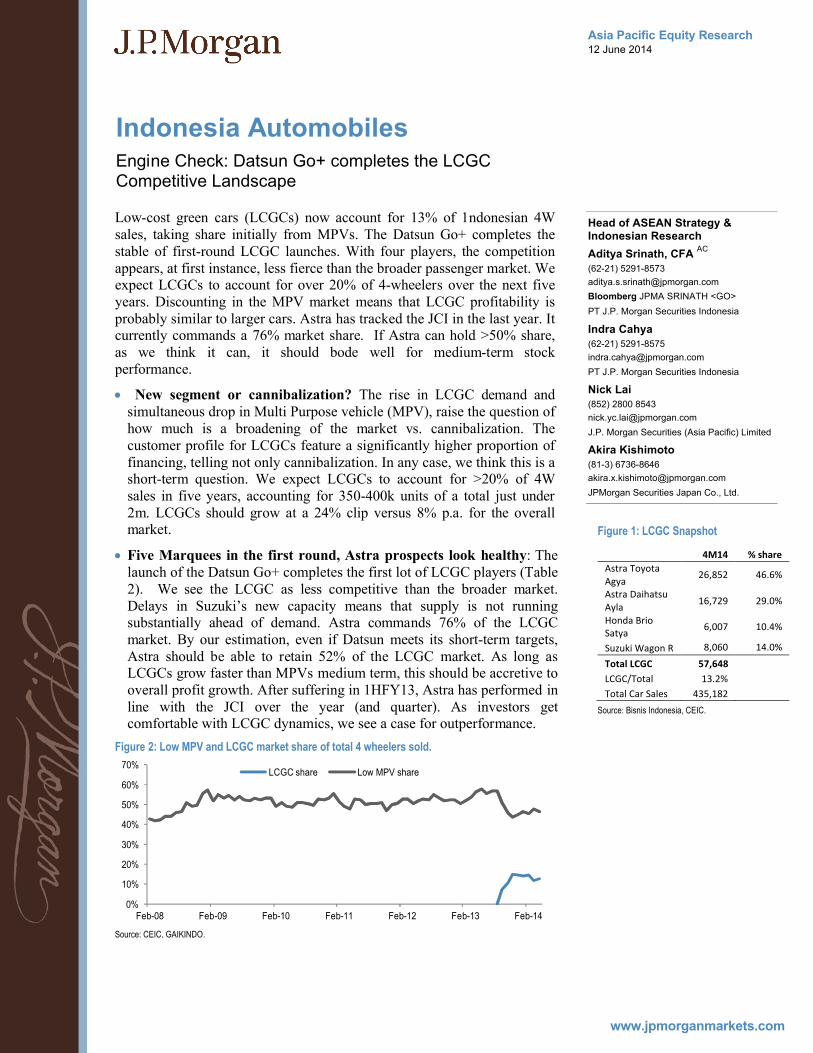
Low-cost green cars (LCGCs) now account for 13% of 1ndonesian 4W sales, taking share initially from MPVs. The Datsun Go+ completes the stable of first-round LCGC launches. With four players, the competition appears, at first instance, less fierce than the broader passenger market. We expect LCGCs to account for over 20% of 4-wheelers over the next fiveyears. Discounting in the MPV market means that LCGC profitability is probably similar to larger cars. Astra has tracked the JCI in the last year. It currently commands a 76% market share. If Astra can hold >50% share, as we think it can, it should bode well for medium-term stock performance.
New segment or cannibalization? The rise in LCGC demand and simultaneous drop in Multi Purpose vehicle (MPV), raise the question of how much is a broadening of the market vs. cannibalization. The customer profile for LCGCs feature a significantly higher proportion offinancing, telling not only cannibalization. In any case, we think this is a short-term question. We expect LCGCs to account for >20% of 4W sales in five years, accounting for 350-400k units of a total just under 2m. LCGCs should grow at a 24% clip versus 8% p.a. for the overall market.
Five Marquees in the first round, Astra prospects look healthy: The launch of the Datsun Go+ completes the first lot of LCGC players (Table 2). We see the LCGC as less competitive than the broader market. Delays in Suzuki’s new capacity means that supply is not running substantially ahead of demand. Astra commands 76% of the LCGC market. By our estimation, even if Datsun meets its short-term targets, Astra should be able to retain 52% of the LCGC market. As long as LCGCs grow faster than MPVs medium term, this should be accretive to overall profit growth. After suffering in 1HFY13, Astra has performed in line with the JCI over the year (and quarter). As investors get comfortable with LCGC dynamics, we see a case for outperformance.
Figure 2: Low MPV and LCGC market share of total 4 wheelers sold.
Source: CEIC, GAIKINDO.
0%
10%
20%
30%
40%
50%
60%
70%
Feb-08 Feb-09 Feb-10 Feb-11 Feb-12 Feb-13 Feb-14
LCGC share Low MPV share
Figure 1: LCGC Snapshot
4M14 % share
Astra Toyota Agya
26,852 46.6%
Astra Daihatsu Ayla
16,729 29.0%
Honda Brio Satya
6,007 10.4%
Suzuki Wagon R 8,060 14.0%
Total LCGC 57,648
LCGC/Total 13.2%
Total Car Sales 435,182
Source: Bisnis Indonesia, CEIC.
www.jpmorganmarkets.com
Latin America Equity Research13 June 2014
Food Retail in Emerging MarketsFavor Retailers that Expand Profitably. Picks are: Walmex, CBD, Magnit, Lenta, Savola & BIM
LatAm Food & Beverage, Retail and Healthcare
Andrea Teixeira, CFA AC
(1-212) 622-6735
J.P. Morgan Securities LLC
Pedro Leduc
(52-55) 5339-4846
J.P. Morgan Casa de Bolsa, S.A. de C.V., J.P. Morgan Grupo Financiero
Joseph Giordano
(55-11) 4950-3020
Banco J.P. Morgan S.A.
South African Retail
Stephen Carrott
(27-11) 507-0373
J.P. Morgan Equities South Africa Proprietary Ltd.
Russian Consumer & Retail
Elena Jouronova, CFA
(7-495) 967-3888
J.P. Morgan Bank International LLC
European Retail
Borja Olcese
(34-91) 516-1511
J.P. Morgan Securities plc
Jaime Vazquez
(34-91) 516-1421
J.P. Morgan Securities plc
Poland Consumer
Michal Kuzawinski
(48-22) 44 19534
J.P. Morgan Securities plc
MENA Consumer
Muneeza Hasan
(971) 4428-1766
JPMorgan Chase Bank, N.A., Dubai Branch
See page 17 for analyst certification and important disclosures, including non-US analyst disclosures.J.P. Morgan does and seeks to do business with companies covered in its research reports. As a result, investors should be aware that the firm may have a conflict of interest that could affect the objectivity of this report. Investors should consider this report as only a single factor inmaking their investment decision.
In the second annual edition of this proprietary analysis, in collaboration with six of our Global consumer equity research teams, including LatAm, Middle East, Poland, Russia, South Africa, and Turkey teams. We analyzed and contrasted key performance and valuation metrics for 21 food retailers in our coverage universe in EM. Our main conclusion is that investors should continue to favor retailers that deliver floor space growth that is accretive to returns, as stock performance tends to track ROIC. EV/EBITDAR, and enterprise value over invested capital against ROIC shows a good predictor of performance (all adjusted for leases).
In LatAm, we continue to favor Walmex, CBD (food), Falabella and Inretail. All these companies have been growing floor space with returns higher than cost of capital, and delivering high marginal ROIC. Focus on small formats such as Bodega express (WMX) or Mini Mercado (CBD) has been paying off, and ROIC is one of the key determinants of EPS growth going forward.
We do not find compelling value in the South Africa food retailers given continued consumer macro-headwinds which have hit food retail sales growth particularly hard. Pick n’ Pay’s turnaround is gaining momentum, but on a Feb FY15 JPME PE of 32x, we feel this is more than priced in, hence our Underweight view. We continue to accumulate SHP on any dips in the share price.
In Russia we favor Magnit and Lenta. Both are, in our view, structural winners in the sector due to their low price formats, focus on operating efficiencies, quality management. Lenta is set to demonstrate the fastest growth among listed peers while Magnit’s attraction is also its strong balance sheet (we recommend buying Magnit’s local shares).
Our preference in Turkey remains for BIM, both in the short term and longer term. BIM has better growth prospects and returns and is less exposed to the cycle. Management also has better track record in delivering guidance.
We believe that the environment in Poland remains highly competitive, reflected in ongoing subdued sales and margin pressure at Biedronka. With negative sales momentum, and reduced margin visibility, we remain cautious.
Within MENA, Savola remains our preferred consumer play as we expect Savola’s retail segment (2014-16E JPMe 46% of rev & 32% of EBITDA) to drive the group’s mid to long-term earnings growth, with continued healthy Hyper/Super mkt ops and Savola’s foray into the convenience store format in 2013 where the company plans to take the total store count to 1,000 in 5yrs (JPMe 770 stores) from 23 in 2013. The segment is set to benefit from indigenous customer traffic underpinned by a healthy rate of urbanization, government spending and improving living standards resulting in growing preference for organized retail.
www.jpmorganmarkets.com
Japan Equity Research12 June 2014
Advantest (6857)▲ Neutral
Previous: Underweight
6857.T, 6857 JT
Order Trend Strong, Underweight Rating No Longer Justified; Upgrading to Neutral
▲
Price: ¥1,224
Price Target: ¥1,350Previous: ¥950
Japan
Electronics/Precision & Industrial
Hisashi Moriyama AC
(81-3) 6736-8601
Bloomberg JPMA MORIYAMA <GO>
JPMorgan Securities Japan Co., Ltd.
Advantest Corporation (Reuters: 6857.T, Bloomberg: 6857 JT)
2013/3 2014/3 2015/3 E 2016/3 E 2017/3 ESales (¥ mn) 132,903 111,878 153,000 169,000 180,000Operating Profit (¥ mn) 80 -36,369 13,000 17,000 21,000Pretax Profit (¥ mn) -1,293 -35,501 13,000 17,000 21,000Net Profit (¥ mn) -3,821 -35,540 10,500 16,000 20,000EPS (¥) -22.03 -204.10 60.30 91.88 114.85P/E (x) NM NM 20.3 13.3 10.7ROE -2.8% -27.6% 8.5% 11.2% 12.0%Source: Company data, Bloomberg, J.P. Morgan estimates.
Company DataPrice (¥) 1,224Date Of Price 11 Jun 14Market Cap (¥ bn) 212.08Shares O/S (mn) 17352-week Range (¥) 1,710-988TOPIX 1,239.07DPS (¥) 20.00Dividend Yield 1.6%ROE 8.5%Price Target (¥) 1,350Price Target End Date 31-Dec-14
See page 11 for analyst certification and important disclosures, including non-US analyst disclosures.J.P. Morgan does and seeks to do business with companies covered in its research reports. As a result, investors should be aware that the firm may have a conflict of interest that could affect the objectivity of this report. Investors should consider this report as only a single factor in making their investment decision.
800
1,200
1,600
2,000
¥
Jun-13 Sep-13 Dec-13 Mar-14 Jun-14
Price Performance
6857.T share price (¥)
TOPIX (rebased)
We stated in our June 11 report on SPE sector telephone interviews that orders at Advantest are tracking well ahead of plan. After also reviewing our earnings estimates for Advantest, we think an argument can be made that the stock is not tremendously overvalued. Additionally, because final demand from Chinese smartphone makers is likely a key reason April–June orders are outpacing plan, this probably represents new demand. We also think Advantest is seeing strong demand for SoC testers for new market applications expected to be released around September, including new high-end smartphones and healthcare wristbands. Although we still expect new orders to peak in the April–June quarter and gradually decline from there, we now look for orders and sales to exceed our previous estimates.
Raising our earnings estimates: Reflecting upward revisions to our estimates for orders and sales, we raise our FY2014 operating profit forecast to ¥13.0 billion from ¥9.5 billion. We raise our full-year orders estimate to ¥153 billion from ¥140 billion, mainly on a hike in our April–June estimate (to ¥50 billion from ¥35 billion), reflecting information from the aforementioned telephone interview. We principally hike our estimate of orders for SoC testers for low-end and mid-range Chinese smartphones (Figures 1-2). Although we expect orders to peak in April–June (1Q FY2014) and then slow to ¥40 billion in 2Q, ¥33 billion in 3Q, and ¥30 billion in 4Q, this view is tempered by our telephone interviews with SPE makers Tokyo Electron and Dainippon Screen Mfg., both of which said they remain confident that orders will continue recovering after April–June. If this plays out, then orders at back-end firms like Advantest could potentially increase again from October–December 2014 to January–March2015 (reflecting lead-time differences).
Upgrading to Neutral, raising price target to ¥1,350 from ¥950: We base our price target on our FY2014 EPS estimate and a P/E of 22.4x (we previously based our price target on P/B owing to low profit levels and questionable growth potential, but we switch to a P/E-based valuation to reflect expected profit growth). We apply a 5.1pt premium to the sector P/E average of 17.3x, mainly to account for three key factors: (1) our view, based on orders at front-end SPE firms, that Advantest’s orders around end-FY may potentially exceed our estimates; (2) Advantest’s marginal profit margin is still around 50%, which means stronger-than-expected sales would significantly boost profits; and (3) the scope of applications for semiconductors is expanding to healthcare wristbands and other new markets, and this could create new earnings growth opportunities for back-end SPE firms. Our price target time horizon remains December 2014.
www.jpmorganmarkets.com
Global Emerging Markets Equity Research13 June 2014
Q-Strategy Help in EMStock screens that combine thematic macro and quant
Emerging Markets Equity Strategy
Sanaya Tavaria AC
(1-212) 622-5469
J.P. Morgan Securities LLC
Adrian Mowat
(852) 2800-8599
J.P. Morgan Securities (Asia Pacific) Limited
Pedro Martins Junior, CFA
(55-11) 4950-4121
Banco J.P. Morgan S.A.
David Aserkoff, CFA
(44-20) 7134-5887
J.P. Morgan Securities plc
Rajiv Batra
(91-22) 6157-3568
J.P. Morgan India Private Limited
Kevyn H Kadakia
(91-22) 6157-3250
J.P. Morgan India Private Limited
Quantitative Strategy
Robert Smith AC
(852) 2800 8569
Bloomberg JPMA RSMITH <GO>
J.P. Morgan Securities (Asia Pacific) Limited
See page 8 for analyst certification and important disclosures, including non-US analyst disclosures.J.P. Morgan does and seeks to do business with companies covered in its research reports. As a result, investors should be aware that the firm may have a conflict of interest that could affect the objectivity of this report. Investors should consider this report as only a single factor in making their investment decision.
EM equities are up 10% in the past three months, outperforming DM by 6%. A reduction in risk premiums, improving economic conditions, and reversal in extreme bearish positioning are driving a sharp rally in EM equities. We remain bullish, with a target of 1200 for MSCI EM by year-end.
Our economists forecast EM GDP growth to accelerate from 2.7% (1Q)to 4.1 % (2Q) and 4.9% (3Q). US growth is forecast to rebound from -1% (1Q) to 3% for the rest of the year. 2015 EM EPS can surprise positively in our view as exports plus a domestic cyclical lift support revenue growth and a focus on costs boosts margins. The market should discount better 2015 EPS in 2H14. We introduce a screen of stocks in our OW and neutral markets with high earnings Q-scores (see Table 4).
Top 5 stocks combining Q-scores and top down macro strategy:Largan Precision, Catcher Technology, Compal Electronics, Hero Motocorp, and Siliconware Precision.
Top 5 stocks with highest overall Q-scores: Kroton Educacional, Largan Precision, Catcher Technology, HCL Technologies, Steinhoff International.
For more on J.P. Morgan's Quant products, see page 7. For our detailed macro views, see Key Trades and Risks, Mowat et al, 18 May 2014.
The quantitative tool uses the J.P. Morgan Q-score developed by Robert Smith and J.P. Morgan’s quant team. The J.P. Morgan Q-Score provides an indication of a company’s expected return versus both its country peers and its regional industry peers using a balanced multi-factor quantitative approach. For more details, please see page 6.
Table 1: Top stocks combining Q-scores and top-down macro strategyName Ticker Country JPM
RecoKey Trades Overall Q-score
Largan Precision 3008 TT Taiwan OW Global growth 99.7%Catcher Technology 2474 TT Taiwan OW Global growth 99.5%Compal Electronics 2324 TT Taiwan OW Global growth 98.4%Hero Motocorp HMCL IN India UW OW India 98.0%Siliconware Precision 2325 TT Taiwan N Global growth 97.8%Tata Steel TATA IN India OW OW India 97.3%Tata Motors TTMT IN India OW Global growth 96.7%TSMC 2330 TT Taiwan OW Global growth 96.5%MediaTek Inc 2454 TT Taiwan OW Global growth 96.2%Hiwin Technologies 2049 TT Taiwan OW OW Taiwan 95.8%Adv. Semicon. Engg. 2311 TT Taiwan OW Global growth 95.6%Fubon Financial 2881 TT Taiwan OW OW Taiwan 93.8%SK Hynix 000660 KS Korea OW Global growth 93.6%Sesa Sterlite SSLT IN India OW OW India 91.9%Hon Hai Precision 2317 TT Taiwan OW Global growth 90.8%Novatek Microelectron 3034 TT Taiwan OW Global growth 90.6%Bank Rakyat Indon. BBRI IJ Indonesia OW OW Indonesia 89.7%Kasikornbank KBANK TB Thailand OW OW Thailand 89.5%Taishin Financial 2887 TT Taiwan N OW Taiwan 88.6%
Source: J.P. Morgan, Factset, 9 June 2014.
Key Trades
1. Broadening global growth (IT, Korean auto,
Mexican cyclical)
2. Value outperforms (Korea, Taiwan, Turkey)
3. Lower CAD risk and the hope of change (India,
Indonesia)
4. The other ASEAN winners (Thailand,
Philippines)
Key asset allocation:
OW: Korea, Taiwan, India, Indonesia, Thailand,
Philippines, Turkey, Peru, Greece
UW: China, Brazil, Russia,
Colombia, Poland

16
Appendix áTOP
Key Rating, Price Target & EPS Changes Europe
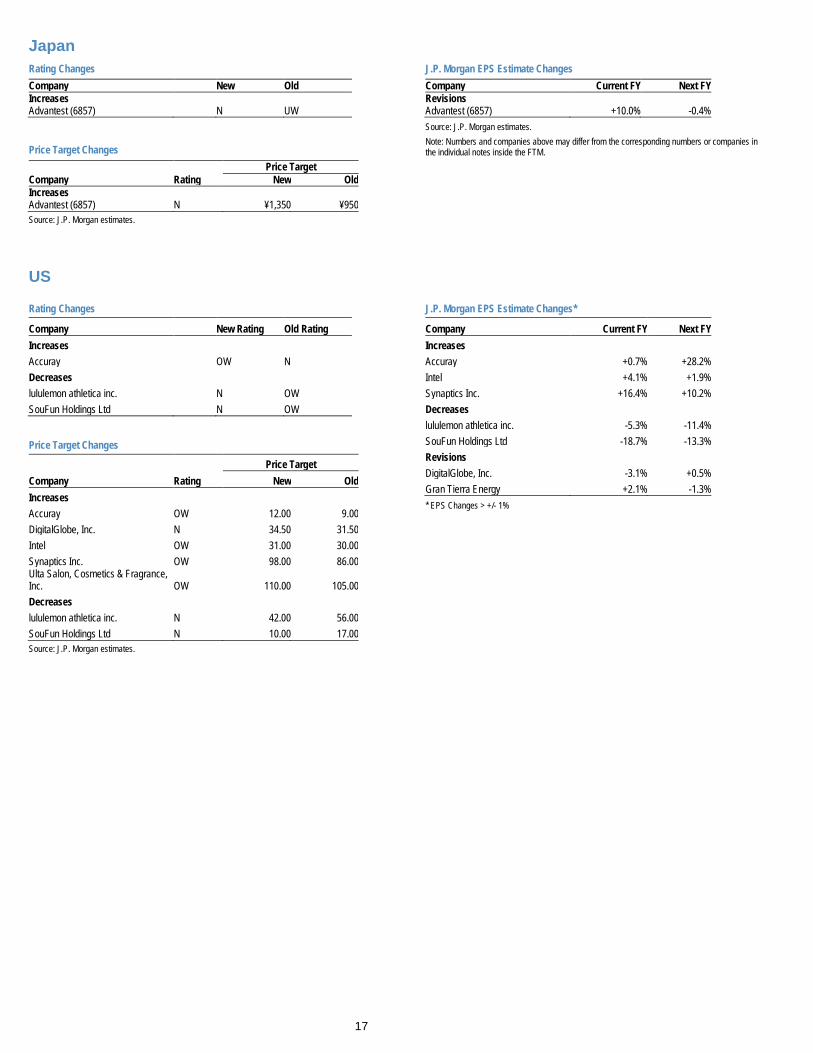
Rating Changes Company New Rating Old Rating Increases
Dufry N UW Decreases
Ipsen N OW Price Target Changes Price Target Company Rating New Old Increases
Dufry N SFr. 166.00 SFr. 141.00 Storebrand OW kr 42.30 kr 41.00 Decreases Active Biotech UW 36.00 kr 59.00 kr Atkins (WS) OW 1,548 p 1,619 p HSBC Holdings plc N 675 p 700 p Ipsen N € 36.00 € 38.00 PZ Cussons N 350 p 370 p Standard Chartered N 1,450 p 1,500 p Source: J.P. Morgan estimates.
J.P. Morgan EPS Estimate Changes Company Current FY Next FY Increases
Storebrand +7.8% +0.1% Decreases Atkins (WS) -0.2% -0.4% HSBC Holdings plc -0.1% -1.1% Ipsen -3.6% -3.4% PZ Cussons -1.1% -4.0% Standard Chartered -3.8% -5.0% Revisions Active Biotech nm nm Dufry -33.7% +4.8% Source: J.P. Morgan estimates
Asia
Price Target Changes Price Target Company Rating New Old Increases
KPJ Healthcare Berhad N R3.60 R3.50 Reliance Power UW INR63.0 INR54.0 PT Tower Bersama Infrastructure Tbk OW Rp8,300.00 Rp6,920.00 Source: J.P. Morgan estimates.
J.P. Morgan EPS Estimate Changes Company Current FY Next FY Increases
PT Tower Bersama Infrastructure Tbk +24.1% +9.4% Revisions KPJ Healthcare Berhad +15.1% -8.1% Reliance Power -6.2% +14.5% J.P. Morgan DPS Estimate Changes Company Current FY Next FY Revisions
KPJ Healthcare Berhad -14.5% +5.4%
Australia
Estimate Changes* Company FY_14 FY_15 Upgrades
RHC 0.0% +5.3% Downgrades MIN -1.8% -5.9% NCM -0.4% -40.0% SVW -1.5% -8.0% * EPS Changes > +/- 1%
Price Target Changes Target Company New Old Upgrades
GMG 5.30 5.21 RHC 48.04 43.43 Downgrades MIN 9.26 10.38 NCM 10.35 11.00 SVW 8.30 8.64 Source: J.P. Morgan estimates.
17
Japan
Rating Changes Company New Old Increases
Advantest (6857) N UW Price Target Changes Price Target Company Rating New Old Increases
Advantest (6857) N ¥1,350 ¥950 Source: J.P. Morgan estimates.
J.P. Morgan EPS Estimate Changes Company Current FY Next FY Revisions
Advantest (6857) +10.0% -0.4% Source: J.P. Morgan estimates. Note: Numbers and companies above may differ from the corresponding numbers or companies in the individual notes inside the FTM.
US
Rating Changes
Company New Rating Old Rating Increases
Accuray OW N Decreases lululemon athletica inc. N OW SouFun Holdings Ltd N OW
Price Target Changes
Price Target Company Rating New Old Increases
Accuray OW 12.00 9.00 DigitalGlobe, Inc. N 34.50 31.50 Intel OW 31.00 30.00 Synaptics Inc. OW 98.00 86.00 Ulta Salon, Cosmetics & Fragrance, Inc. OW 110.00 105.00 Decreases lululemon athletica inc. N 42.00 56.00 SouFun Holdings Ltd N 10.00 17.00 Source: J.P. Morgan estimates.
J.P. Morgan EPS Estimate Changes*
Company Current FY Next FY Increases
Accuray +0.7% +28.2% Intel +4.1% +1.9% Synaptics Inc. +16.4% +10.2% Decreases lululemon athletica inc. -5.3% -11.4% SouFun Holdings Ltd -18.7% -13.3% Revisions DigitalGlobe, Inc. -3.1% +0.5% Gran Tierra Energy +2.1% -1.3% * EPS Changes > +/- 1%
18
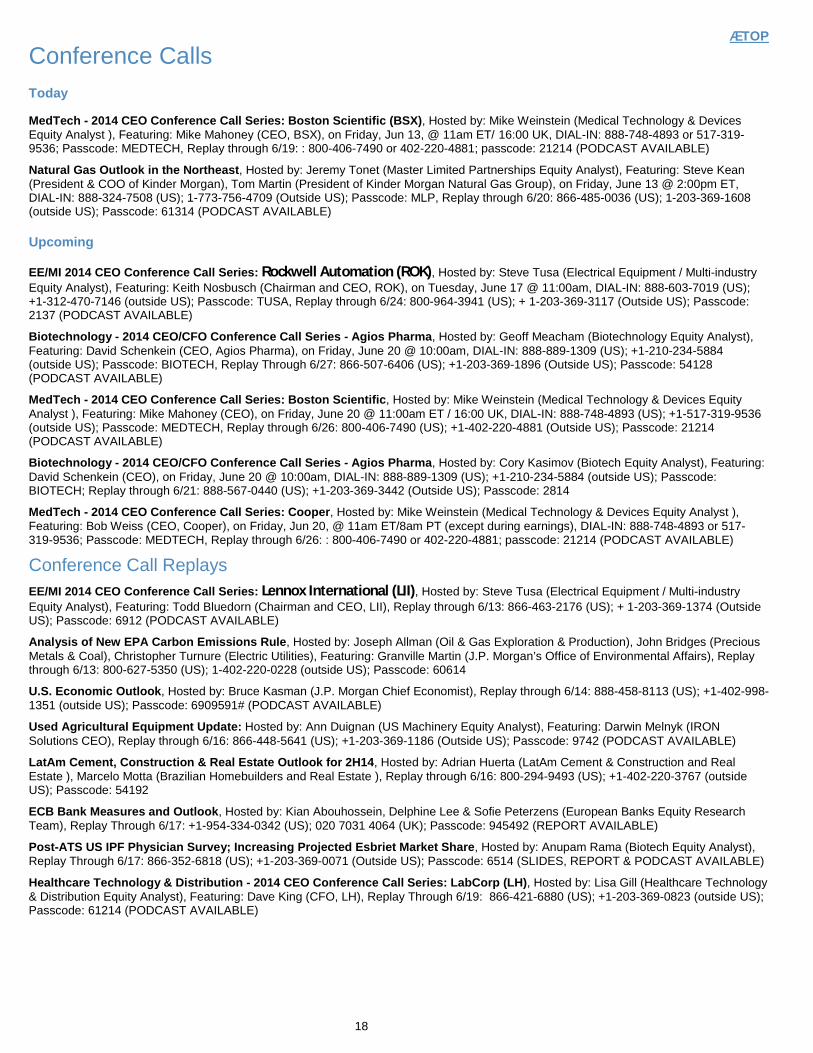
Conference Calls áTOP
Today
MedTech - 2014 CEO Conference Call Series: Boston Scientific (BSX), Hosted by: Mike Weinstein (Medical Technology & Devices Equity Analyst ), Featuring: Mike Mahoney (CEO, BSX), on Friday, Jun 13, @ 11am ET/ 16:00 UK, DIAL-IN: 888-748-4893 or 517-319-9536; Passcode: MEDTECH, Replay through 6/19: : 800-406-7490 or 402-220-4881; passcode: 21214 (PODCAST AVAILABLE)
Natural Gas Outlook in the Northeast, Hosted by: Jeremy Tonet (Master Limited Partnerships Equity Analyst), Featuring: Steve Kean (President & COO of Kinder Morgan), Tom Martin (President of Kinder Morgan Natural Gas Group), on Friday, June 13 @ 2:00pm ET, DIAL-IN: 888-324-7508 (US); 1-773-756-4709 (Outside US); Passcode: MLP, Replay through 6/20: 866-485-0036 (US); 1-203-369-1608 (outside US); Passcode: 61314 (PODCAST AVAILABLE)
Upcoming
EE/MI 2014 CEO Conference Call Series: Rockwell Automation (ROK), Hosted by: Steve Tusa (Electrical Equipment / Multi-industry Equity Analyst), Featuring: Keith Nosbusch (Chairman and CEO, ROK), on Tuesday, June 17 @ 11:00am, DIAL-IN: 888-603-7019 (US); +1-312-470-7146 (outside US); Passcode: TUSA, Replay through 6/24: 800-964-3941 (US); + 1-203-369-3117 (Outside US); Passcode: 2137 (PODCAST AVAILABLE)
Biotechnology - 2014 CEO/CFO Conference Call Series - Agios Pharma, Hosted by: Geoff Meacham (Biotechnology Equity Analyst), Featuring: David Schenkein (CEO, Agios Pharma), on Friday, June 20 @ 10:00am, DIAL-IN: 888-889-1309 (US); +1-210-234-5884 (outside US); Passcode: BIOTECH, Replay Through 6/27: 866-507-6406 (US); +1-203-369-1896 (Outside US); Passcode: 54128 (PODCAST AVAILABLE)
MedTech - 2014 CEO Conference Call Series: Boston Scientific, Hosted by: Mike Weinstein (Medical Technology & Devices Equity Analyst ), Featuring: Mike Mahoney (CEO), on Friday, June 20 @ 11:00am ET / 16:00 UK, DIAL-IN: 888-748-4893 (US); +1-517-319-9536 (outside US); Passcode: MEDTECH, Replay through 6/26: 800-406-7490 (US); +1-402-220-4881 (Outside US); Passcode: 21214 (PODCAST AVAILABLE)
Biotechnology - 2014 CEO/CFO Conference Call Series - Agios Pharma, Hosted by: Cory Kasimov (Biotech Equity Analyst), Featuring: David Schenkein (CEO), on Friday, June 20 @ 10:00am, DIAL-IN: 888-889-1309 (US); +1-210-234-5884 (outside US); Passcode: BIOTECH; Replay through 6/21: 888-567-0440 (US); +1-203-369-3442 (Outside US); Passcode: 2814
MedTech - 2014 CEO Conference Call Series: Cooper, Hosted by: Mike Weinstein (Medical Technology & Devices Equity Analyst ), Featuring: Bob Weiss (CEO, Cooper), on Friday, Jun 20, @ 11am ET/8am PT (except during earnings), DIAL-IN: 888-748-4893 or 517-319-9536; Passcode: MEDTECH, Replay through 6/26: : 800-406-7490 or 402-220-4881; passcode: 21214 (PODCAST AVAILABLE)
Conference Call Replays EE/MI 2014 CEO Conference Call Series: Lennox International (LII), Hosted by: Steve Tusa (Electrical Equipment / Multi-industry Equity Analyst), Featuring: Todd Bluedorn (Chairman and CEO, LII), Replay through 6/13: 866-463-2176 (US); + 1-203-369-1374 (Outside US); Passcode: 6912 (PODCAST AVAILABLE)
Analysis of New EPA Carbon Emissions Rule, Hosted by: Joseph Allman (Oil & Gas Exploration & Production), John Bridges (Precious Metals & Coal), Christopher Turnure (Electric Utilities), Featuring: Granville Martin (J.P. Morgan’s Office of Environmental Affairs), Replay through 6/13: 800-627-5350 (US); 1-402-220-0228 (outside US); Passcode: 60614
U.S. Economic Outlook, Hosted by: Bruce Kasman (J.P. Morgan Chief Economist), Replay through 6/14: 888-458-8113 (US); +1-402-998-1351 (outside US); Passcode: 6909591# (PODCAST AVAILABLE)
Used Agricultural Equipment Update: Hosted by: Ann Duignan (US Machinery Equity Analyst), Featuring: Darwin Melnyk (IRON Solutions CEO), Replay through 6/16: 866-448-5641 (US); +1-203-369-1186 (Outside US); Passcode: 9742 (PODCAST AVAILABLE)
LatAm Cement, Construction & Real Estate Outlook for 2H14, Hosted by: Adrian Huerta (LatAm Cement & Construction and Real Estate ), Marcelo Motta (Brazilian Homebuilders and Real Estate ), Replay through 6/16: 800-294-9493 (US); +1-402-220-3767 (outside US); Passcode: 54192
ECB Bank Measures and Outlook, Hosted by: Kian Abouhossein, Delphine Lee & Sofie Peterzens (European Banks Equity Research Team), Replay Through 6/17: +1-954-334-0342 (US); 020 7031 4064 (UK); Passcode: 945492 (REPORT AVAILABLE)
Post-ATS US IPF Physician Survey; Increasing Projected Esbriet Market Share, Hosted by: Anupam Rama (Biotech Equity Analyst), Replay Through 6/17: 866-352-6818 (US); +1-203-369-0071 (Outside US); Passcode: 6514 (SLIDES, REPORT & PODCAST AVAILABLE)
Healthcare Technology & Distribution - 2014 CEO Conference Call Series: LabCorp (LH), Hosted by: Lisa Gill (Healthcare Technology & Distribution Equity Analyst), Featuring: Dave King (CFO, LH), Replay Through 6/19: 866-421-6880 (US); +1-203-369-0823 (outside US); Passcode: 61214 (PODCAST AVAILABLE)

19
Upcoming Conferences
Homepage
Jun 17 – 18, 2014 – Technology CEO Conference London, UK, J.P. Morgan offices, 25 Bank Street
June 18,2014 - European Sectors and Strategy Outlook Hotel Orfila, Madrid
Jun 19, 2014 – 5th Annual Oil & Gas 1x1 Corporate Access Day Hilton Boston Downtown, Boston
Jun 24 – 25, 2014 – Media CEO Conference London, UK, J.P. Morgan offices, 25 Bank Street
June 25, 2014 – Emerging Markets Equity Strategy: 2014 Second Half Outlook London, United Kingdom, J.P. Morgan offices, 25 Bank Street, E14 5JP
June 25 – 26, 2014 – 3rd Southern Cone and Andean Conference Lima, Peru
June 26, 2014 – European Healthcare Conference London, UK, J.P. Morgan offices, 25 Bank Street
June 30,2014 - 2014 Emerging Markets Macro: Second Half Outlook J.P. Morgan, 270 Park Ave, New York July 29 – 30, 2014 – 9th Annual Mexico CEO/CFO Conference Mexico City
Aug 13 – 14, 2014 – Auto Conference New York, NY, J.P. Morgan, 270 Park Avenue
Sept 23 – 24, 2014 – Asia and CEEMEA Emerging Markets Corporate Conference London, UK, J.P. Morgan offices, 25 Bank Street
Nov 12, 2014 – Ultimate Services Investor Conference New York, NY, Westin Grand Central Hotel, 212, East 42nd Street
December 1 – 5, 2014 – 7th Brazil Opportunities Conference São Paulo
For additional conference information contact your J.P. Morgan representative or email [email protected].
Please remember that all J.P. Morgan conferences are by invitation only. Invitations are non-transferable.
20
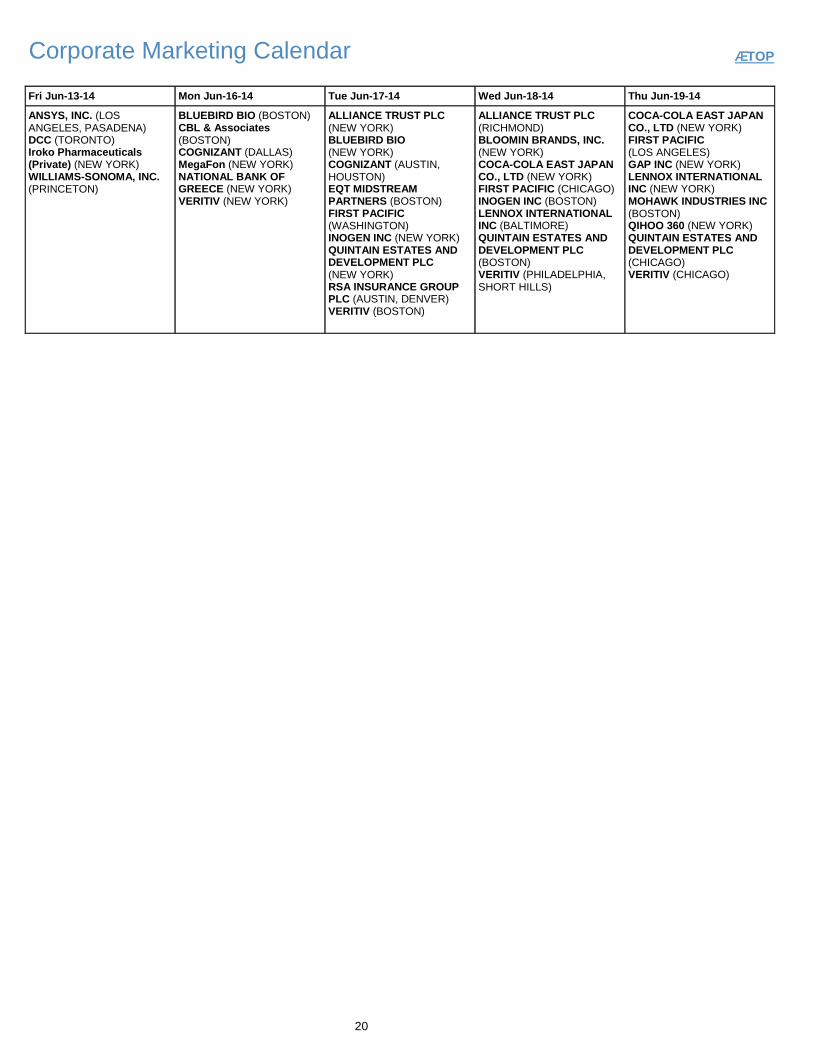
Corporate Marketing Calendar áTOP
Fri Jun-13-14 Mon Jun-16-14 Tue Jun-17-14 Wed Jun-18-14 Thu Jun-19-14
ANSYS, INC. (LOS ANGELES, PASADENA) DCC (TORONTO) Iroko Pharmaceuticals (Private) (NEW YORK) WILLIAMS-SONOMA, INC. (PRINCETON)
BLUEBIRD BIO (BOSTON) CBL & Associates (BOSTON) COGNIZANT (DALLAS) MegaFon (NEW YORK) NATIONAL BANK OF GREECE (NEW YORK) VERITIV (NEW YORK)
ALLIANCE TRUST PLC (NEW YORK) BLUEBIRD BIO (NEW YORK) COGNIZANT (AUSTIN, HOUSTON) EQT MIDSTREAM PARTNERS (BOSTON) FIRST PACIFIC (WASHINGTON) INOGEN INC (NEW YORK) QUINTAIN ESTATES AND DEVELOPMENT PLC (NEW YORK) RSA INSURANCE GROUP PLC (AUSTIN, DENVER) VERITIV (BOSTON)
ALLIANCE TRUST PLC (RICHMOND) BLOOMIN BRANDS, INC. (NEW YORK) COCA-COLA EAST JAPAN CO., LTD (NEW YORK) FIRST PACIFIC (CHICAGO) INOGEN INC (BOSTON) LENNOX INTERNATIONAL INC (BALTIMORE) QUINTAIN ESTATES AND DEVELOPMENT PLC (BOSTON) VERITIV (PHILADELPHIA, SHORT HILLS)
COCA-COLA EAST JAPAN CO., LTD (NEW YORK) FIRST PACIFIC (LOS ANGELES) GAP INC (NEW YORK) LENNOX INTERNATIONAL INC (NEW YORK) MOHAWK INDUSTRIES INC (BOSTON) QIHOO 360 (NEW YORK) QUINTAIN ESTATES AND DEVELOPMENT PLC (CHICAGO) VERITIV (CHICAGO)
21
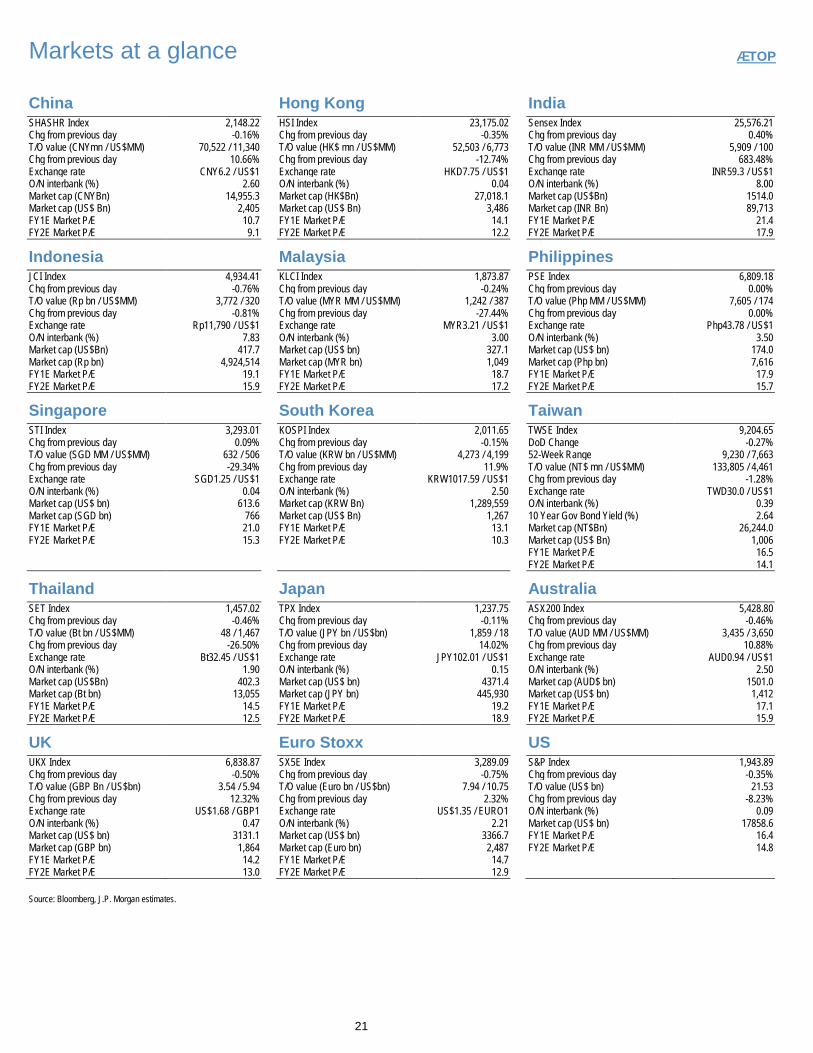
Markets at a glance áTOP
China
Hong Kong
India SHASHR Index 2,148.22
HSI Index 23,175.02
Sensex Index 25,576.21
Chg from previous day -0.16%
Chg from previous day -0.35%
Chg from previous day 0.40% T/O value (CNYmn / US$MM) 70,522 / 11,340
T/O value (HK$ mn / US$MM) 52,503 / 6,773
T/O value (INR MM / US$MM) 5,909 / 100
Chg from previous day 10.66%
Chg from previous day -12.74%
Chg from previous day 683.48% Exchange rate CNY6.2 / US$1
Exchange rate HKD7.75 / US$1
Exchange rate INR59.3 / US$1
O/N interbank (%) 2.60
O/N interbank (%) 0.04
O/N interbank (%) 8.00 Market cap (CNYBn) 14,955.3
Market cap (HK$Bn) 27,018.1
Market cap (US$Bn) 1514.0
Market cap (US$ Bn) 2,405
Market cap (US$ Bn) 3,486
Market cap (INR Bn) 89,713 FY1E Market P/E 10.7
FY1E Market P/E 14.1
FY1E Market P/E 21.4
FY2E Market P/E 9.1
FY2E Market P/E 12.2
FY2E Market P/E 17.9 Indonesia
Malaysia
Philippines
JCI Index 4,934.41
KLCI Index 1,873.87
PSE Index 6,809.18 Chg from previous day -0.76%
Chg from previous day -0.24%
Chg from previous day 0.00%
T/O value (Rp bn / US$MM) 3,772 / 320
T/O value (MYR MM / US$MM) 1,242 / 387
T/O value (Php MM / US$MM) 7,605 / 174 Chg from previous day -0.81%
Chg from previous day -27.44%
Chg from previous day 0.00%
Exchange rate Rp11,790 / US$1
Exchange rate MYR3.21 / US$1
Exchange rate Php43.78 / US$1 O/N interbank (%) 7.83
O/N interbank (%) 3.00
O/N interbank (%) 3.50
Market cap (US$Bn) 417.7
Market cap (US$ bn) 327.1
Market cap (US$ bn) 174.0 Market cap (Rp bn) 4,924,514
Market cap (MYR bn) 1,049
Market cap (Php bn) 7,616
FY1E Market P/E 19.1
FY1E Market P/E 18.7
FY1E Market P/E 17.9 FY2E Market P/E 15.9
FY2E Market P/E 17.2
FY2E Market P/E 15.7
Singapore
South Korea
Taiwan
STI Index 3,293.01
KOSPI Index 2,011.65
TWSE Index 9,204.65 Chg from previous day 0.09%
Chg from previous day -0.15%
DoD Change -0.27%
T/O value (SGD MM / US$MM) 632 / 506
T/O value (KRW bn / US$MM) 4,273 / 4,199
52-Week Range 9,230 / 7,663 Chg from previous day -29.34%
Chg from previous day 11.9%
T/O value (NT$ mn / US$MM) 133,805 / 4,461
Exchange rate SGD1.25 / US$1
Exchange rate KRW1017.59 / US$1
Chg from previous day -1.28% O/N interbank (%) 0.04
O/N interbank (%) 2.50
Exchange rate TWD30.0 / US$1
Market cap (US$ bn) 613.6
Market cap (KRW Bn) 1,289,559
O/N interbank (%) 0.39 Market cap (SGD bn) 766
Market cap (US$ Bn) 1,267
10 Year Gov Bond Yield (%) 2.64
FY1E Market P/E 21.0
FY1E Market P/E 13.1
Market cap (NT$Bn) 26,244.0 FY2E Market P/E 15.3
FY2E Market P/E 10.3
Market cap (US$ Bn) 1,006
FY1E Market P/E 16.5
FY2E Market P/E 14.1
Thailand
Japan
Australia
SET Index 1,457.02
TPX Index 1,237.75
ASX200 Index 5,428.80
Chg from previous day -0.46%
Chg from previous day -0.11%
Chg from previous day -0.46% T/O value (Bt bn / US$MM) 48 / 1,467
T/O value (JPY bn / US$bn) 1,859 / 18
T/O value (AUD MM / US$MM) 3,435 / 3,650
Chg from previous day -26.50%
Chg from previous day 14.02%
Chg from previous day 10.88% Exchange rate Bt32.45 / US$1
Exchange rate JPY102.01 / US$1
Exchange rate AUD0.94 / US$1
O/N interbank (%) 1.90
O/N interbank (%) 0.15
O/N interbank (%) 2.50 Market cap (US$Bn) 402.3
Market cap (US$ bn) 4371.4
Market cap (AUD$ bn) 1501.0
Market cap (Bt bn) 13,055
Market cap (JPY bn) 445,930
Market cap (US$ bn) 1,412 FY1E Market P/E 14.5
FY1E Market P/E 19.2
FY1E Market P/E 17.1
FY2E Market P/E 12.5
FY2E Market P/E 18.9
FY2E Market P/E 15.9 UK
Euro Stoxx
US
UKX Index 6,838.87
SX5E Index 3,289.09
S&P Index 1,943.89
Chg from previous day -0.50%
Chg from previous day -0.75%
Chg from previous day -0.35% T/O value (GBP Bn / US$bn) 3.54 / 5.94
T/O value (Euro bn / US$bn) 7.94 / 10.75
T/O value (US$ bn) 21.53
Chg from previous day 12.32%
Chg from previous day 2.32%
Chg from previous day -8.23% Exchange rate US$1.68 / GBP1
Exchange rate US$1.35 / EURO1
O/N interbank (%) 0.09
O/N interbank (%) 0.47
O/N interbank (%) 2.21
Market cap (US$ bn) 17858.6 Market cap (US$ bn) 3131.1
Market cap (US$ bn) 3366.7
FY1E Market P/E 16.4
Market cap (GBP bn) 1,864
Market cap (Euro bn) 2,487
FY2E Market P/E 14.8 FY1E Market P/E 14.2
FY1E Market P/E 14.7
FY2E Market P/E 13.0
FY2E Market P/E 12.9
Source: Bloomberg, J.P. Morgan estimates.
22
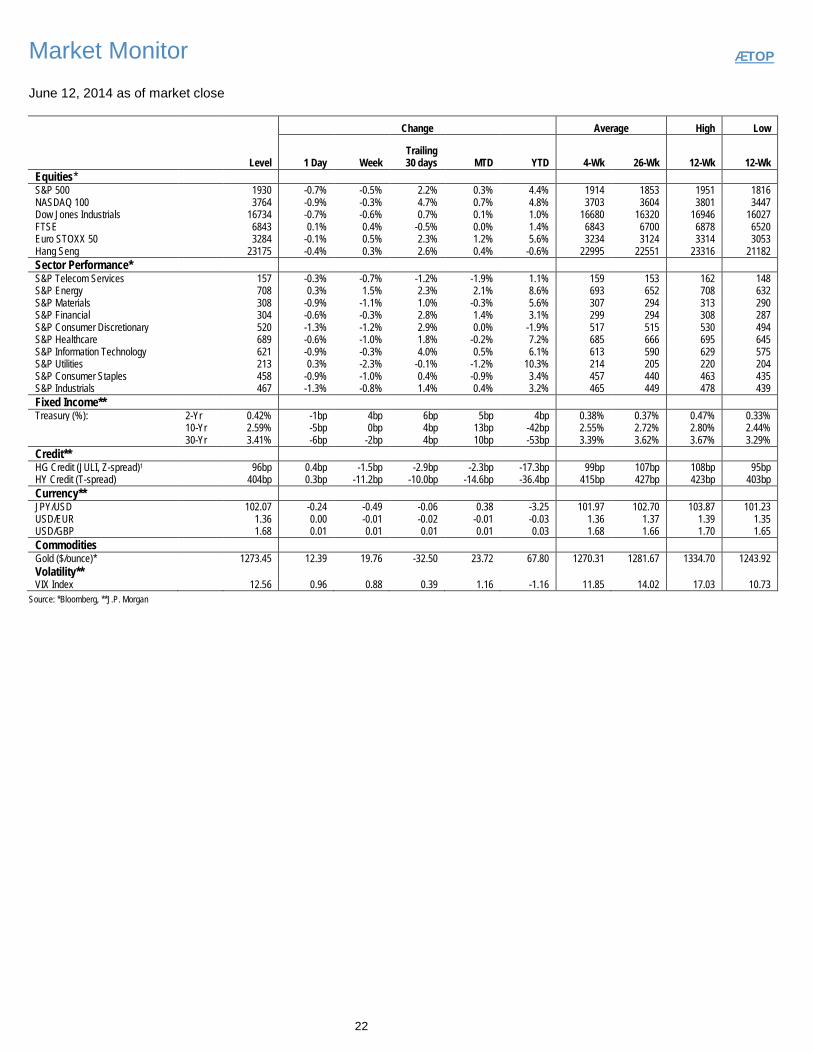
Market Monitor áTOP
June 12, 2014 as of market close
Change Average High Low
Level 1 Day Week Trailing 30 days MTD YTD 4-Wk 26-Wk 12-Wk 12-Wk
Equities* S&P 500
1930 -0.7% -0.5% 2.2% 0.3% 4.4% 1914 1853 1951 1816
NASDAQ 100
3764 -0.9% -0.3% 4.7% 0.7% 4.8% 3703 3604 3801 3447 Dow Jones Industrials
16734 -0.7% -0.6% 0.7% 0.1% 1.0% 16680 16320 16946 16027
FTSE
6843 0.1% 0.4% -0.5% 0.0% 1.4% 6843 6700 6878 6520 Euro STOXX 50
3284 -0.1% 0.5% 2.3% 1.2% 5.6% 3234 3124 3314 3053
Hang Seng
23175 -0.4% 0.3% 2.6% 0.4% -0.6% 22995 22551 23316 21182 Sector Performance* S&P Telecom Services
157 -0.3% -0.7% -1.2% -1.9% 1.1% 159 153 162 148
S&P Energy
708 0.3% 1.5% 2.3% 2.1% 8.6% 693 652 708 632 S&P Materials
308 -0.9% -1.1% 1.0% -0.3% 5.6% 307 294 313 290
S&P Financial
304 -0.6% -0.3% 2.8% 1.4% 3.1% 299 294 308 287 S&P Consumer Discretionary
520 -1.3% -1.2% 2.9% 0.0% -1.9% 517 515 530 494
S&P Healthcare
689 -0.6% -1.0% 1.8% -0.2% 7.2% 685 666 695 645 S&P Information Technology
621 -0.9% -0.3% 4.0% 0.5% 6.1% 613 590 629 575
S&P Utilities
213 0.3% -2.3% -0.1% -1.2% 10.3% 214 205 220 204 S&P Consumer Staples
458 -0.9% -1.0% 0.4% -0.9% 3.4% 457 440 463 435
S&P Industrials
467 -1.3% -0.8% 1.4% 0.4% 3.2% 465 449 478 439 Fixed Income** Treasury (%): 2-Yr 0.42% -1bp 4bp 6bp 5bp 4bp 0.38% 0.37% 0.47% 0.33%
10-Yr 2.59% -5bp 0bp 4bp 13bp -42bp 2.55% 2.72% 2.80% 2.44%
30-Yr 3.41% -6bp -2bp 4bp 10bp -53bp 3.39% 3.62% 3.67% 3.29%
Credit** HG Credit (JULI, Z-spread)1
96bp 0.4bp -1.5bp -2.9bp -2.3bp -17.3bp 99bp 107bp 108bp 95bp
HY Credit (T-spread)
404bp 0.3bp -11.2bp -10.0bp -14.6bp -36.4bp 415bp 427bp 423bp 403bp Currency** JPY/USD
102.07 -0.24 -0.49 -0.06 0.38 -3.25 101.97 102.70 103.87 101.23
USD/EUR
1.36 0.00 -0.01 -0.02 -0.01 -0.03 1.36 1.37 1.39 1.35 USD/GBP
1.68 0.01 0.01 0.01 0.01 0.03 1.68 1.66 1.70 1.65
Commodities Gold ($/ounce)*
1273.45 12.39 19.76 -32.50 23.72 67.80 1270.31 1281.67 1334.70 1243.92
Volatility** VIX Index 12.56 0.96 0.88 0.39 1.16 -1.16 11.85 14.02 17.03 10.73
Source: *Bloomberg, **J.P. Morgan
23
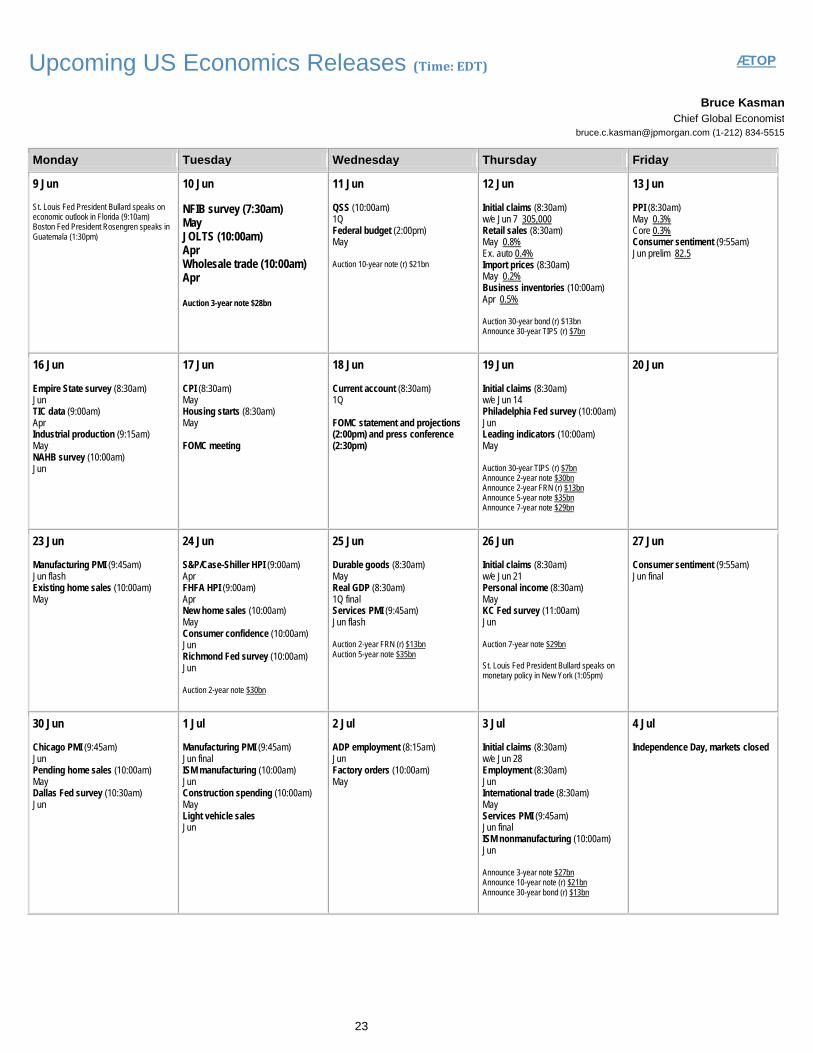
Upcoming US Economics Releases (Time: EDT) áTOP
Bruce Kasman
Chief Global Economist [email protected] (1-212) 834-5515
Monday Tuesday Wednesday Thursday Friday
9 Jun St. Louis Fed President Bullard speaks on economic outlook in Florida (9:10am) Boston Fed President Rosengren speaks in Guatemala (1:30pm)
10 Jun NFIB survey (7:30am) May JOLTS (10:00am) Apr Wholesale trade (10:00am) Apr Auction 3-year note $28bn
11 Jun QSS (10:00am) 1Q Federal budget (2:00pm) May Auction 10-year note (r) $21bn
12 Jun Initial claims (8:30am) w/e Jun 7 305,000 Retail sales (8:30am) May 0.8% Ex. auto 0.4% Import prices (8:30am) May 0.2% Business inventories (10:00am) Apr 0.5% Auction 30-year bond (r) $13bn Announce 30-year TIPS (r) $7bn
13 Jun PPI (8:30am) May 0.3% Core 0.3% Consumer sentiment (9:55am) Jun prelim 82.5
16 Jun Empire State survey (8:30am) Jun TIC data (9:00am) Apr Industrial production (9:15am) May NAHB survey (10:00am) Jun
17 Jun CPI (8:30am) May Housing starts (8:30am) May FOMC meeting
18 Jun Current account (8:30am) 1Q FOMC statement and projections (2:00pm) and press conference (2:30pm)
19 Jun Initial claims (8:30am) w/e Jun 14 Philadelphia Fed survey (10:00am) Jun Leading indicators (10:00am) May Auction 30-year TIPS (r) $7bn Announce 2-year note $30bn Announce 2-year FRN (r) $13bn Announce 5-year note $35bn Announce 7-year note $29bn
20 Jun
23 Jun Manufacturing PMI (9:45am) Jun flash Existing home sales (10:00am) May
24 Jun S&P/Case-Shiller HPI (9:00am) Apr FHFA HPI (9:00am) Apr New home sales (10:00am) May Consumer confidence (10:00am) Jun Richmond Fed survey (10:00am) Jun Auction 2-year note $30bn
25 Jun Durable goods (8:30am) May Real GDP (8:30am) 1Q final Services PMI (9:45am) Jun flash Auction 2-year FRN (r) $13bn Auction 5-year note $35bn
26 Jun Initial claims (8:30am) w/e Jun 21 Personal income (8:30am) May KC Fed survey (11:00am) Jun Auction 7-year note $29bn St. Louis Fed President Bullard speaks on monetary policy in New York (1:05pm)
27 Jun Consumer sentiment (9:55am) Jun final
30 Jun Chicago PMI (9:45am) Jun Pending home sales (10:00am) May Dallas Fed survey (10:30am) Jun
1 Jul Manufacturing PMI (9:45am) Jun final ISM manufacturing (10:00am) Jun Construction spending (10:00am) May Light vehicle sales Jun
2 Jul ADP employment (8:15am) Jun Factory orders (10:00am) May
3 Jul Initial claims (8:30am) w/e Jun 28 Employment (8:30am) Jun International trade (8:30am) May Services PMI (9:45am) Jun final ISM nonmanufacturing (10:00am) Jun Announce 3-year note $27bn Announce 10-year note (r) $21bn Announce 30-year bond (r) $13bn
4 Jul Independence Day, markets closed
24
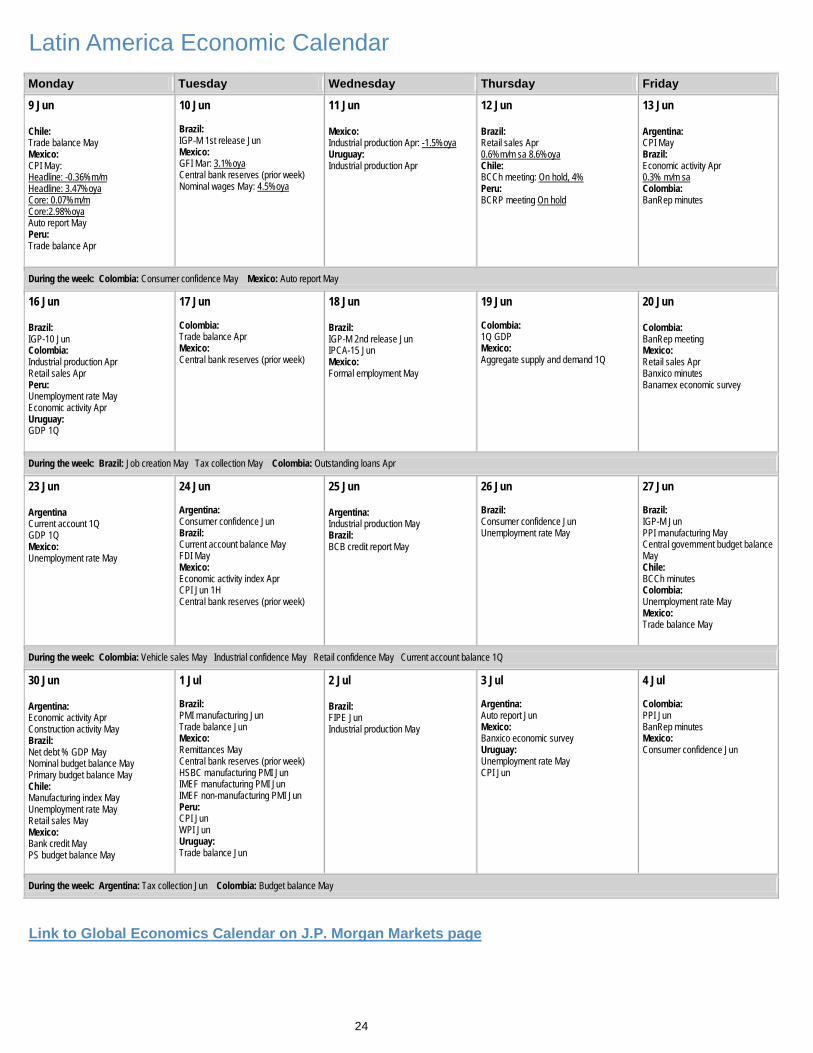
Latin America Economic Calendar Monday Tuesday Wednesday Thursday Friday
9 Jun Chile: Trade balance May Mexico: CPI May: Headline: -0.36%m/m Headline: 3.47%oya Core: 0.07%m/m Core:2.98%oya Auto report May Peru: Trade balance Apr
10 Jun Brazil: IGP-M 1st release Jun Mexico: GFI Mar: 3.1%oya Central bank reserves (prior week) Nominal wages May: 4.5%oya
11 Jun Mexico: Industrial production Apr: -1.5%oya Uruguay: Industrial production Apr
12 Jun Brazil: Retail sales Apr 0.6%m/m sa 8.6%oya Chile: BCCh meeting: On hold, 4% Peru: BCRP meeting On hold
13 Jun Argentina: CPI May Brazil: Economic activity Apr 0.3% m/m sa Colombia: BanRep minutes
During the week: Colombia: Consumer confidence May Mexico: Auto report May 16 Jun Brazil: IGP-10 Jun Colombia: Industrial production Apr Retail sales Apr Peru: Unemployment rate May Economic activity Apr Uruguay: GDP 1Q
17 Jun Colombia: Trade balance Apr Mexico: Central bank reserves (prior week)
18 Jun Brazil: IGP-M 2nd release Jun IPCA-15 Jun Mexico: Formal employment May
19 Jun Colombia: 1Q GDP Mexico: Aggregate supply and demand 1Q
20 Jun Colombia: BanRep meeting Mexico: Retail sales Apr Banxico minutes Banamex economic survey
During the week: Brazil: Job creation May Tax collection May Colombia: Outstanding loans Apr 23 Jun Argentina Current account 1Q GDP 1Q Mexico: Unemployment rate May
24 Jun Argentina: Consumer confidence Jun Brazil: Current account balance May FDI May Mexico: Economic activity index Apr CPI Jun 1H Central bank reserves (prior week)
25 Jun Argentina: Industrial production May Brazil: BCB credit report May
26 Jun Brazil: Consumer confidence Jun Unemployment rate May
27 Jun Brazil: IGP-M Jun PPI manufacturing May Central government budget balance May Chile: BCCh minutes Colombia: Unemployment rate May Mexico: Trade balance May
During the week: Colombia: Vehicle sales May Industrial confidence May Retail confidence May Current account balance 1Q 30 Jun Argentina: Economic activity Apr Construction activity May Brazil: Net debt % GDP May Nominal budget balance May Primary budget balance May Chile: Manufacturing index May Unemployment rate May Retail sales May Mexico: Bank credit May PS budget balance May
1 Jul Brazil: PMI manufacturing Jun Trade balance Jun Mexico: Remittances May Central bank reserves (prior week) HSBC manufacturing PMI Jun IMEF manufacturing PMI Jun IMEF non-manufacturing PMI Jun Peru: CPI Jun WPI Jun Uruguay: Trade balance Jun
2 Jul Brazil: FIPE Jun Industrial production May
3 Jul Argentina: Auto report Jun Mexico: Banxico economic survey Uruguay: Unemployment rate May CPI Jun
4 Jul Colombia: PPI Jun BanRep minutes Mexico: Consumer confidence Jun
During the week: Argentina: Tax collection Jun Colombia: Budget balance May Link to Global Economics Calendar on J.P. Morgan Markets page
25
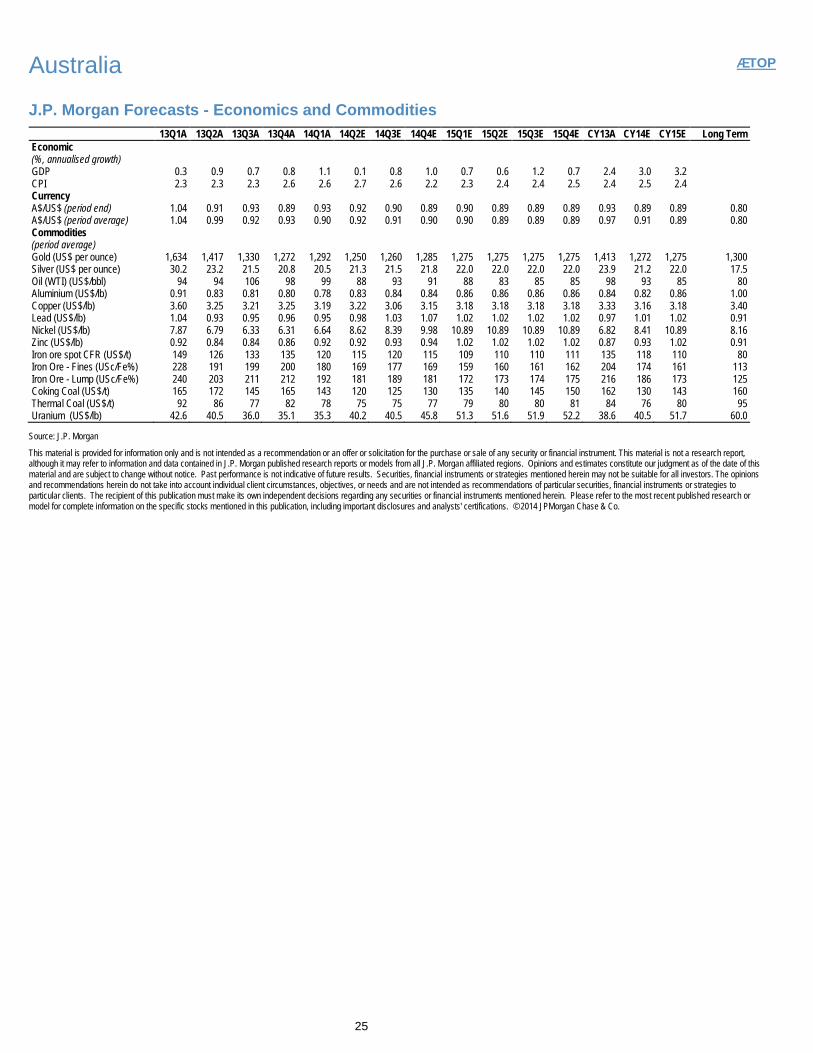
Australia áTOP
J.P. Morgan Forecasts - Economics and Commodities 13Q1A 13Q2A 13Q3A 13Q4A 14Q1A 14Q2E 14Q3E 14Q4E 15Q1E 15Q2E 15Q3E 15Q4E CY13A CY14E CY15E Long Term Economic (%, annualised growth) GDP 0.3 0.9 0.7 0.8 1.1 0.1 0.8 1.0 0.7 0.6 1.2 0.7 2.4 3.0 3.2 CPI 2.3 2.3 2.3 2.6 2.6 2.7 2.6 2.2 2.3 2.4 2.4 2.5 2.4 2.5 2.4 Currency A$/US$ (period end) 1.04 0.91 0.93 0.89 0.93 0.92 0.90 0.89 0.90 0.89 0.89 0.89 0.93 0.89 0.89 0.80 A$/US$ (period average) 1.04 0.99 0.92 0.93 0.90 0.92 0.91 0.90 0.90 0.89 0.89 0.89 0.97 0.91 0.89 0.80 Commodities (period average) Gold (US$ per ounce) 1,634 1,417 1,330 1,272 1,292 1,250 1,260 1,285 1,275 1,275 1,275 1,275 1,413 1,272 1,275 1,300 Silver (US$ per ounce) 30.2 23.2 21.5 20.8 20.5 21.3 21.5 21.8 22.0 22.0 22.0 22.0 23.9 21.2 22.0 17.5 Oil (WTI) (US$/bbl) 94 94 106 98 99 88 93 91 88 83 85 85 98 93 85 80 Aluminium (US$/lb) 0.91 0.83 0.81 0.80 0.78 0.83 0.84 0.84 0.86 0.86 0.86 0.86 0.84 0.82 0.86 1.00 Copper (US$/lb) 3.60 3.25 3.21 3.25 3.19 3.22 3.06 3.15 3.18 3.18 3.18 3.18 3.33 3.16 3.18 3.40 Lead (US$/lb) 1.04 0.93 0.95 0.96 0.95 0.98 1.03 1.07 1.02 1.02 1.02 1.02 0.97 1.01 1.02 0.91 Nickel (US$/lb) 7.87 6.79 6.33 6.31 6.64 8.62 8.39 9.98 10.89 10.89 10.89 10.89 6.82 8.41 10.89 8.16 Zinc (US$/lb) 0.92 0.84 0.84 0.86 0.92 0.92 0.93 0.94 1.02 1.02 1.02 1.02 0.87 0.93 1.02 0.91 Iron ore spot CFR (US$/t) 149 126 133 135 120 115 120 115 109 110 110 111 135 118 110 80 Iron Ore - Fines (USc/Fe%) 228 191 199 200 180 169 177 169 159 160 161 162 204 174 161 113 Iron Ore - Lump (USc/Fe%) 240 203 211 212 192 181 189 181 172 173 174 175 216 186 173 125 Coking Coal (US$/t) 165 172 145 165 143 120 125 130 135 140 145 150 162 130 143 160 Thermal Coal (US$/t) 92 86 77 82 78 75 75 77 79 80 80 81 84 76 80 95 Uranium (US$/lb) 42.6 40.5 36.0 35.1 35.3 40.2 40.5 45.8 51.3 51.6 51.9 52.2 38.6 40.5 51.7 60.0
Source: J.P. Morgan
This material is provided for information only and is not intended as a recommendation or an offer or solicitation for the purchase or sale of any security or financial instrument. This material is not a research report, although it may refer to information and data contained in J.P. Morgan published research reports or models from all J.P. Morgan affiliated regions. Opinions and estimates constitute our judgment as of the date of this material and are subject to change without notice. Past performance is not indicative of future results. Securities, financial instruments or strategies mentioned herein may not be suitable for all investors. The opinions and recommendations herein do not take into account individual client circumstances, objectives, or needs and are not intended as recommendations of particular securities, financial instruments or strategies to particular clients. The recipient of this publication must make its own independent decisions regarding any securities or financial instruments mentioned herein. Please refer to the most recent published research or model for complete information on the specific stocks mentioned in this publication, including important disclosures and analysts' certifications. © 2014 JPMorgan Chase & Co.

26
European Analyst Focus List áTOP
J.P. Morgan AFL 12 June
Ticker Name Industry Ccy Close Price Analyst
Focus list add date
Focus List add price
Price Target
Potential Upside
/Downside* Position Rating PT end
date AGS BB Ageas Insurance EUR 30.3 Ashik Musaddi, CFA 22-Jan-10 25.40 40.61 34% Long OW Dec-14 UBSN VX UBS Diversified Financials CHF 18.0 Kian Abouhossein 06-Sep-11 10.46 23.00 28% Long OW Dec-14 WPP LN WPP Group Media GBp 1,303.0 Filippo Pietro Lo Franco 06-Jun-13 1,120 1,552 19% Long OW Dec-14 ABI BB Anheuser Busch InBev Food, Beverage & Tobacco EUR 83.3 Mike J Gibbs 14-Jun-13 69.56 93.00 12% Long OW May-15 ERICB SS Ericsson Technology Hardware & Equipment SEK 82.9 Sandeep Deshpande 08-Jul-13 77.00 90.00 9% Long OW Dec-14 AIR FP Airbus Group Capital Goods EUR 52.2 David H Perry, CFA 15-Jul-13 41.84 65.00 24% Long OW Dec-14 EZJ LN easyJet Transportation GBp 1,530.0 Jamie Baker 16-Sep-13 1,299 1,909 25% Long OW Dec-14 DAI GR Daimler AG Automobiles & Components EUR 69.7 Jose M Asumendi 16-Sep-13 57.10 80.00 15% Long OW Dec-14 OR FP L'Oréal Household & Personal Products EUR 128.6 Celine Pannuti, CFA 16-Sep-13 124.90 135.00 5% Long OW Dec-14 FP FP TOTAL Energy EUR 51.7 Nitin Sharma 16-Sep-13 42.80 54.50 5% Long OW Dec-14 PNDORA DC PANDORA Consumer Durables & Apparel DKK 404.3 Chiara Battistini 16-Sep-13 222.80 445.00 10% Long OW Dec-14 SMDS LN D S Smith Materials GBp 317.0 Alexander Mees 16-Sep-13 284 360 14% Long OW Mar-15 HEXAB SS Hexagon AB Electronic Equip., Instruments SEK 216.7 Stacy Pollard 16-Sep-13 197.40 250.00 15% Long OW Dec-14 UTDI GR United Internet Internet Software & Services EUR 34.7 Hannes Wittig 23-Sep-13 26.60 45.00 30% Long OW Dec-14 TSCO LN Tesco Food & Staples Retailing GBp 295.0 Jaime Vazquez 25-Sep-13 374 235 20% Short UW Dec-14 SMP LN St. Modwen Real Estate GBp 385.0 Neil Green, CFA 8-Oct-13 309 425 10% Long OW Apr-15 JMAT LN Johnson Matthey Materials GBp 3,247.0 Martin Evans 14-Oct-13 2,821 3,850 19% Long OW Dec-14 RTN LN Restaurant Group Consumer Services GBp 613.0 Victoria A Greer 06-Dec-13 549 755 23% Long OW Apr-15 SOLB BB Solvay Materials EUR 120.3 Ben Scarlett 07-Jan-14 112.5 82.0 32% Short UW Dec-14 AAL LN Anglo American Materials GBp 1,464.5 Fraser Jamieson 08-Jan-14 1,273 1,350 8% Short UW Dec-14 JUP LN Jupiter Diversified Financials GBp 415.1 Edward Morris, CFA 10-Jan-14 382 474 14% Long OW Dec-14 LAND LN Land Securities Real Estate GBp 1,074.0 Tim Leckie, CFA 14-Jan-14 989.50 1,100 2% Long OW Jan-15 HEI GR HeidelbergCement Construction Materials EUR 64.1 Rajesh Patki 28-Jan-14 56.25 74.00 15% Long OW Apr-15 RIO LN Rio Tinto Plc Materials GBp 3,156.5 Dominic O’Kane 12-May-14 3,188 4,500 43% Long OW Dec-14 BAB LN Babcock Intl Group Commercial & Professional Serv GBp 1,220.0 Robert Plant 19-May-14 1,185.0 1,500.0 23% Long OW Dec-14 ABF LN Associated British Foods Food Products GBp 3,044.0 Catherine Farrant 23-May-14 3,020.0 3,500.0 15% Long OW Apr-15 RMG LN Royal Mail Group Air Freight & Logistics GBp 499.8 Christopher G Combe 27-May-14 526.0 765.0 53% Long OW Mar-15 Source: Bloomberg, J.P. Morgan estimates. Share price data as at COB 11 June 2014. *From Latest Closing Price J.P. Morgan may remove a stock from the AFL pursuant to applicable law and/or J.P. Morgan policy without any further notice.
J.P. Morgan AFL 12 June - Performance
Absolute performance Country performance MSCI Europe Industry Performance
Ticker Name Position
Price Returns
since addition to
AFL
Total Returns since
addition to AFL (incl.
dvds)
1M 3M YTD
Total Returns
since addition to AFL
1M 3M YTD
Total Returns
since addition to
AFL
1M 3M YTD
AGS BB Ageas Long 19.3% 53.5% 0.7% 1.2% 2.5% 55.1% 1.4% 8.5% 11.5% 93.5% 2.2% 8.3% 5.4% UBSN VX UBS Long 72.0% 77.5% (1.0%) 3.0% 7.8% 74.1% 2.0% 8.3% 8.5% 67.4% 2.1% 5.7% 3.0% WPP LN WPP Group Long 16.3% 21.7% 5.4% 10.0% (3.8%) 12.4% 0.0% 5.9% 3.5% 30.0% 3.6% 7.7% 2.3% ABI BB Anheuser Busch InBev Long 19.7% 21.2% 4.3% 17.6% 9.8% 26.8% 1.4% 8.5% 11.5% 14.5% 2.2% 13.5% 10.7% ERICB SS Ericsson Long 7.6% 9.7% 1.9% 5.9% 9.3% 22.8% 2.1% 9.4% 8.9% 25.6% 2.9% 5.2% 2.5% AIR FP Airbus Group Long 24.8% 26.6% 0.8% 6.0% (5.1%) 21.1% 2.2% 10.7% 8.7% 17.9% 0.4% 7.4% 3.9% EZJ LN easyJet Long 17.8% 20.9% (7.7%) (5.3%) 4.7% 6.2% 0.0% 5.9% 3.5% 25.0% 2.2% 9.0% 11.3% DAI GR Daimler AG Long 22.0% 25.6% 4.9% 11.9% 14.5% 15.5% 2.0% 9.9% 4.2% 20.2% 4.8% 11.2% 11.4% OR FP L'Oréal Long 3.0% 3.4% 1.7% 12.4% 2.8% 13.1% 2.2% 10.7% 8.7% 12.7% 3.0% 10.6% 4.9% FP FP TOTAL Long 20.8% 26.8% 1.1% 15.2% 19.0% 13.1% 2.2% 10.7% 8.7% 16.8% 1.1% 14.4% 11.8% PNDORA DC PANDORA Long 81.5% 83.0% 3.1% 18.1% 40.1% 32.1% 4.0% 10.1% 22.0% 1.2% 1.8% 11.2% 3.2% SMDS LN D S Smith Long 11.6% 14.5% (0.7%) 2.2% (3.5%) 6.2% 0.0% 5.9% 3.5% 8.8% (0.1%) 10.9% 7.5% HEXAB SS Hexagon AB Long 9.8% 12.0% 0.2% 1.5% 8.0% 13.6% 2.1% 9.4% 8.9% 2.0% 2.9% 5.2% 2.5% UTDI GR United Internet Long 30.3% 31.9% 9.8% 11.4% 13.6% 15.2% 2.0% 9.9% 4.2% 9.2% 1.8% 4.5% (3.2%) TSCO LN Tesco Short 21.1% 13.9% 0.3% (0.9%) 8.4% 7.3% 0.0% 5.9% 3.5% (2.3%) 0.4% 6.8% (2.1%) SMP LN St. Modwen Long 24.6% 23.7% 3.2% (0.4%) 5.6% 10.4% 0.0% 5.9% 3.5% 24.0% 3.7% 14.5% 17.7% JMAT LN Johnson Matthey Long 15.1% 11.1% 0.1% 7.6% 0.5% 8.0% 0.0% 5.9% 3.5% 12.3% (0.1%) 10.9% 7.5% RTN LN Restaurant Group Long 11.7% 11.6% (4.4%) (11.9%) 3.5% 6.6% 0.0% 5.9% 3.5% 18.3% 3.7% 10.7% 10.6% SOLB BB Solvay Short (6.9%) (13.8%) 0.3% (11.1%) -- 12.0% 1.4% 8.5% -- 9.0% (0.1%) 10.9% -- AAL LN Anglo American Short (15.0%) (19.0%) 10.6% (5.5%) -- 3.9% 0.0% 5.9% -- 9.1% (0.1%) 10.9% -- JUP LN Jupiter Long 8.7% 10.5% 1.1% 7.2% -- 3.6% 0.0% 5.9% -- (1.4%) 2.1% 5.7% -- LAND LN Land Securities Long 8.5% 9.3% (2.5%) 3.9% -- 3.2% 0.0% 5.9% -- 16.2% 3.7% 14.5% -- HEI GR HeidelbergCement Long 14.0% 11.6% 1.8% 8.9% -- 5.8% 2.0% 9.9% -- 9.7% (0.1%) 10.9% -- RIO LN Rio Tinto plc Long (1.0%) (5.5%) (5.2%) -- -- 0.3% 0.0% -- -- 0.2% (0.1%) -- -- BAB LN Babcock Intl Group Long 3.0% 3.6% -- -- -- 0.2% -- -- -- 2.5% -- -- -- ABF LN Associated British Foods Long 0.8% 3.5% -- -- -- 0.6% -- -- -- 1.0% -- -- -- RMG LN Royal Mail Group Long (5.0%) (6.2%) -- -- -- 0.1% -- -- -- 0.2% -- -- -- Source: Bloomberg, J.P. Morgan estimates. Share price data as at COB 11 June 2014. Returns not shown where the period on the AFL is less than 1M/3M. J.P. Morgan may remove a stock from the AFL pursuant to applicable law and/or J.P. Morgan policy without any further notice.

27
Asia Analyst Focus List
Open Trades (as of June 12, 2014 close) Country OW UW
Sector OW UW
China PetroChina Sun Art Retail Group Limited
Autos Mazda Motor India Sesa Sterlite Bharat Heavy Electricals (BHEL)
Basic Materials Tata Steel Ltd CSR Limited
Indonesia Bank Danamon
Consumer Matahari Department Store Esprit Holdings Malaysia Tenaga Maxis Berhad
Emerging Technology BYD Company Limited Lite-On Technology Corporation
Philippines Ayala Land Globe Telecom
Financials Fubon Financial Holdings ANZ Banking Group Singapore Singapore Airlines Far East Hospitality Trust
Infrastructure GS Engineering & Construction
South Korea Hyundai Motor Company Hanjin Shipping Co Ltd
Oil and Gas PetroChina Sinopec Shanghai Petrochemical Taiwan ASE ASUSTek Computer
Property Sun Hung Kai Properties Agile Property Holdings Ltd
Thailand KASIKORNBANK
SMID-Caps TAL Education Group VTech Holdings
Technology TSMC Wintek
Telecommunications 21Vianet Group Inc. Maxis Berhad
Transportation Singapore Airlines Hanjin Shipping Co Ltd
Utilities & Power Equipment China Everbright International Shanghai Electric Group
Source: J.P. Morgan
Country relative performance in US$ (MSCI AC Asia Pacific ex JP)
Source: J.P. Morgan, Bloomberg.
Sector relative performance in US$ (MSCI AC Asia Pacific ex JP)
Source: J.P. Morgan, Bloomberg.
Last Four Weeks’ Additions Company Name BBG Ticker Analyst Name Rating Add Date Add Price Current Price Price Target BYD Company Limited 1211 HK Alvin Kwock OW 14-May-14 39.30 42.60 67.00 LPN Development LPN TB Anne Jirajariyavech, CFA UW 14-May-14 17.00 20.00 14.00 GS Engineering & Construction 006360 KS Karen Li, CFA UW 15-May-14 37550.00 32300.00 27000.00 China Everbright International 257 HK Boris Kan OW 15-May-14 9.36 10.62 13.00 ASUSTek Computer 2357 TT Alvin Kwock UW 15-May-14 309.00 326.00 265.00 Esprit Holdings 330 HK Ebru Sener Kurumlu UW 16-May-14 11.72 11.28 11.30 PetroChina 857 HK Adrian Mowat OW 19-May-14 9.28 9.45 11.25 Sun Art Retail Group Limited 6808 HK Adrian Mowat UW 19-May-14 9.98 9.22 8.60 Tenaga TNB MK Hoy Kit Mak OW 19-May-14 12.20 11.66 16.50 Ayala Land ALI PM Yutan, Jeanette G OW 19-May-14 32.50 31.55 36.00 Hyundai Motor Company 005380 KS Seo, Scott OW 19-May-14 233500.00 225000.00 330000.00 Hanjin Shipping Co Ltd 117930 KS Seo, Scott UW 19-May-14 6150.00 6250.00 4000.00 Matahari Department Store LPPF IJ Ebru Sener Kurumlu OW 19-May-14 14500.00 13750.00 18000.00 Fubon Financial Holdings 2881 TT Klaczek, Josh OW 19-May-14 41.00 43.30 51.00 ANZ Banking Group ANZ AU Klaczek, Josh UW 19-May-14 32.66 33.83 34.75 CSR Limited CSR AU Kang, Daniel UW 19-May-14 3.32 3.45 3.00 21Vianet Group Inc. VNET US Sullivan, James R OW 16-May-14 25.85 26.83 35.00 Wintek 2384 TT Park, JJ UW 20-May-14 10.40 10.35 7.00 Sesa Sterlite SSLT IN Iyer, Bharat X OW 20-May-14 245.75 292.50 265.00 Bharat Heavy Electricals (BHEL) BHEL IN Iyer, Bharat X UW 20-May-14 277.80 243.65 130.00 Sun Hung Kai Properties 16 HK Leung, Cusson OW 20-May-14 100.80 106.20 128.00 Agile Property Holdings Ltd 3383 HK Leung, Cusson UW 20-May-14 5.58 6.04 6.00 Source: J.P. Morgan, Bloomberg. Priced at June 12, 2014
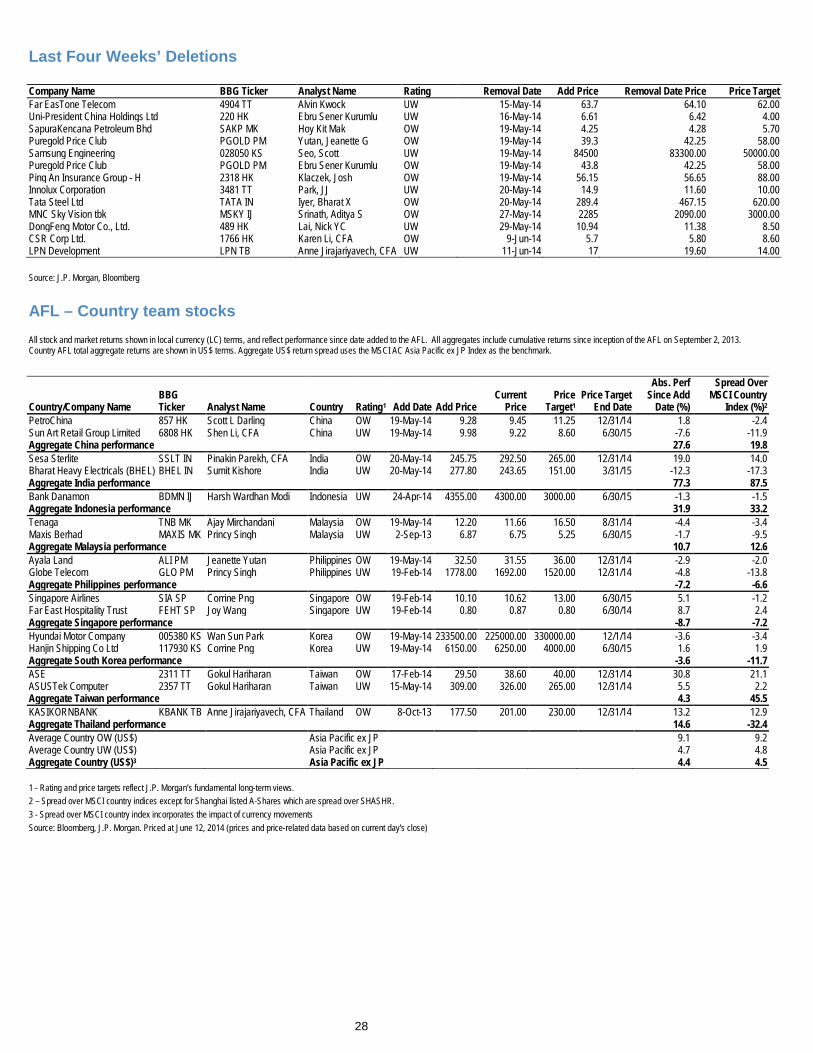
28
Last Four Weeks’ Deletions
Company Name BBG Ticker Analyst Name Rating Removal Date Add Price Removal Date Price Price Target Far EasTone Telecom 4904 TT Alvin Kwock UW 15-May-14 63.7 64.10 62.00 Uni-President China Holdings Ltd 220 HK Ebru Sener Kurumlu UW 16-May-14 6.61 6.42 4.00 SapuraKencana Petroleum Bhd SAKP MK Hoy Kit Mak OW 19-May-14 4.25 4.28 5.70 Puregold Price Club PGOLD PM Yutan, Jeanette G OW 19-May-14 39.3 42.25 58.00 Samsung Engineering 028050 KS Seo, Scott UW 19-May-14 84500 83300.00 50000.00 Puregold Price Club PGOLD PM Ebru Sener Kurumlu OW 19-May-14 43.8 42.25 58.00 Ping An Insurance Group - H 2318 HK Klaczek, Josh OW 19-May-14 56.15 56.65 88.00 Innolux Corporation 3481 TT Park, JJ UW 20-May-14 14.9 11.60 10.00 Tata Steel Ltd TATA IN Iyer, Bharat X OW 20-May-14 289.4 467.15 620.00 MNC Sky Vision tbk MSKY IJ Srinath, Aditya S OW 27-May-14 2285 2090.00 3000.00 DongFeng Motor Co., Ltd. 489 HK Lai, Nick YC UW 29-May-14 10.94 11.38 8.50 CSR Corp Ltd. 1766 HK Karen Li, CFA OW 9-Jun-14 5.7 5.80 8.60 LPN Development LPN TB Anne Jirajariyavech, CFA UW 11-Jun-14 17 19.60 14.00 Source: J.P. Morgan, Bloomberg
AFL – Country team stocks
All stock and market returns shown in local currency (LC) terms, and reflect performance since date added to the AFL. All aggregates include cumulative returns since inception of the AFL on September 2, 2013. Country AFL total aggregate returns are shown in US$ terms. Aggregate US$ return spread uses the MSCI AC Asia Pacific ex JP Index as the benchmark.
Country/Company Name BBG Ticker Analyst Name Country Rating1 Add Date Add Price
Current Price
Price Target1
Price Target End Date
Abs. Perf Since Add
Date (%)
Spread Over MSCI Country
Index (%)2 PetroChina 857 HK Scott L Darling China OW 19-May-14 9.28 9.45 11.25 12/31/14 1.8 -2.4 Sun Art Retail Group Limited 6808 HK Shen Li, CFA China UW 19-May-14 9.98 9.22 8.60 6/30/15 -7.6 -11.9 Aggregate China performance 27.6 19.8 Sesa Sterlite SSLT IN Pinakin Parekh, CFA India OW 20-May-14 245.75 292.50 265.00 12/31/14 19.0 14.0 Bharat Heavy Electricals (BHEL) BHEL IN Sumit Kishore India UW 20-May-14 277.80 243.65 151.00 3/31/15 -12.3 -17.3 Aggregate India performance 77.3 87.5 Bank Danamon BDMN IJ Harsh Wardhan Modi Indonesia UW 24-Apr-14 4355.00 4300.00 3000.00 6/30/15 -1.3 -1.5 Aggregate Indonesia performance 31.9 33.2 Tenaga TNB MK Ajay Mirchandani Malaysia OW 19-May-14 12.20 11.66 16.50 8/31/14 -4.4 -3.4 Maxis Berhad MAXIS MK Princy Singh Malaysia UW 2-Sep-13 6.87 6.75 5.25 6/30/15 -1.7 -9.5 Aggregate Malaysia performance 10.7 12.6 Ayala Land ALI PM Jeanette Yutan Philippines OW 19-May-14 32.50 31.55 36.00 12/31/14 -2.9 -2.0 Globe Telecom GLO PM Princy Singh Philippines UW 19-Feb-14 1778.00 1692.00 1520.00 12/31/14 -4.8 -13.8 Aggregate Philippines performance -7.2 -6.6 Singapore Airlines SIA SP Corrine Png Singapore OW 19-Feb-14 10.10 10.62 13.00 6/30/15 5.1 -1.2 Far East Hospitality Trust FEHT SP Joy Wang Singapore UW 19-Feb-14 0.80 0.87 0.80 6/30/14 8.7 2.4 Aggregate Singapore performance -8.7 -7.2 Hyundai Motor Company 005380 KS Wan Sun Park Korea OW 19-May-14 233500.00 225000.00 330000.00 12/1/14 -3.6 -3.4 Hanjin Shipping Co Ltd 117930 KS Corrine Png Korea UW 19-May-14 6150.00 6250.00 4000.00 6/30/15 1.6 1.9 Aggregate South Korea performance -3.6 -11.7 ASE 2311 TT Gokul Hariharan Taiwan OW 17-Feb-14 29.50 38.60 40.00 12/31/14 30.8 21.1 ASUSTek Computer 2357 TT Gokul Hariharan Taiwan UW 15-May-14 309.00 326.00 265.00 12/31/14 5.5 2.2 Aggregate Taiwan performance 4.3 45.5 KASIKORNBANK KBANK TB Anne Jirajariyavech, CFA Thailand OW 8-Oct-13 177.50 201.00 230.00 12/31/14 13.2 12.9 Aggregate Thailand performance 14.6 -32.4 Average Country OW (US$)
Asia Pacific ex JP
9.1 9.2
Average Country UW (US$)
Asia Pacific ex JP
4.7 4.8 Aggregate Country (US$)3
Asia Pacific ex JP
4.4 4.5
1 - Rating and price targets reflect J.P. Morgan's fundamental long-term views. 2 – Spread over MSCI country indices except for Shanghai listed A-Shares which are spread over SHASHR. 3 - Spread over MSCI country index incorporates the impact of currency movements Source: Bloomberg, J.P. Morgan. Priced at June 12, 2014 (prices and price-related data based on current day's close)

29
AFL – Sector team stocks
All returns shown in US$ terms, and reflect performance since date added to the AFL. All aggregates include cumulative returns since inception of the AFL on September 2, 2013. Aggregate US$ return spread uses the MSCI AC Asia Pacific ex JP Index as the benchmark.
Company Name BBG Ticker Analyst Name MSCI Sector Indices Rating1 Add Date
Add Price
Current Price
Price Target1
Price Target
End Date
Abs. Perf
Since Add Date
(%)
Spread Over MSCI
Sector Index
(%)2 Mazda Motor (7261) 7261 JT Akira Kishimoto Autos OW 4-Apr-14 479.0 480.0 680.0 12/31/14 1.5 1.7 Aggregate Autos performance -0.4 -0.9 Matahari Department Store LPPF IJ Princy Singh Consumer OW 19-May-14 14500.00 13750.00 18000.00 12/31/14 -8.1 -8.8 Esprit Holdings 330 HK Ebru Sener Kurumlu Consumer UW 16-May-14 11.72 11.28 11.30 6/30/15 -3.7 -3.9 Aggregate Consumer performance 20.0 20.2 BYD Company Limited 1211 HK Alvin Kwock Emerging Technology OW 14-May-14 39.30 42.60 65.00 6/30/15 8.4 1.2 Lite-On Technology Corporation 2301 TT William Chen Emerging Technology UW 2-Sep-13 50.00 48.95 40.00 12/31/14 -2.9 -25.1 Aggregate Emerging Technology performance 12.7 12.7 Fubon Financial Holdings 2881 TT Jemmy S Huang Financials OW 19-May-14 41.00 43.30 51.00 12/31/14 6.2 3.2 ANZ Banking Group ANZ AU Scott Manning Financials UW 19-May-14 32.66 33.83 34.75 12/31/14 4.4 1.4 Aggregate Financials performance -4.8 -4.8 GS Engineering & Construction 006360 KS Sokje Lee Infrastructure UW 15-May-14 37550.00 32300.00 27000.00 12/31/14 -13.2 -16.9 Aggregate Infrastructure performance -0.4 0.1 Tata Steel Ltd TATA IN Pinakin Parekh, CFA Metals & Mining OW 11-Nov-13 360.80 549.65 620.00 3/31/15 63.4 60.0 CSR Limited CSR AU Jason Steed Metals & Mining UW 19-May-14 3.32 3.45 3.00 12/31/14 4.8 2.0 Aggregate Metals & Mining performance -9.6 -9.4 PetroChina 857 HK Scott L Darling Oil and Gas OW 2-Sep-13 8.54 9.45 11.25 12/31/14 10.7 2.3 Sinopec Shanghai Petrochemical 338 HK Scott L Darling Oil and Gas UW 29-Apr-14 1.90 2.11 1.70 12/31/14 11.1 3.9 Aggregate Oil and Gas performance -5.0 -4.5 TAL Education Group XRS US Leon Chik, CFA SMID-Caps OW 24-Apr-14 23.33 26.31 34.00 12/31/14 12.8 15.2 VTech Holdings 303 HK Leon Chik, CFA SMID-Caps UW 9-Jan-14 100.60 107.50 82.00 12/31/14 6.9 5.0 Aggregate SMID-Caps performance 0.7 0.2 TSMC 2330 TT JJ Park Technology OW 17-Apr-14 120.00 123.50 150.00 12/31/14 3.5 -3.8 Wintek 2384 TT Narci Chang Technology UW 20-May-14 10.40 10.35 7.00 12/31/14 0.2 -1.9 Aggregate Technology performance 5.0 5.5 21Vianet Group Inc. VNET US Michelle Wei, CFA Telecommunications OW 16-May-14 25.85 26.83 35.00 12/31/15 3.8 3.7 Maxis Berhad MAXIS MK Princy Singh Telecommunications UW 19-Feb-14 6.95 6.75 5.25 6/30/15 -0.5 -8.6 Aggregate Telecom performance -9.9 -8.9 Singapore Airlines SIA SP Corrine Png Transportation OW 4-Apr-14 10.39 10.62 13.00 6/30/15 3.1 -1.4 Hanjin Shipping Co Ltd 117930 KS Corrine Png Transportation UW 25-Mar-14 6480.00 6250.00 4000.00 6/30/15 2.0 -4.8 Aggregate Transportation performance -51.1 -50.3 Sun Hung Kai Properties 16 HK Equity Cusson Leung Property OW 20-May-14 100.80 106.20 128.00 12/31/14 5.4 2.7 Agile Property Holdings Ltd 3383 HK Equity Ryan Li, CFA Property UW 20-May-14 5.58 6.04 6.00 12/31/14 8.3 5.6 Aggregate Property performance -2.9 -2.4 China Everbright International 257 HK Elaine Wu Utilities & Power Equipment OW 15-May-14 9.36 10.62 13.00 6/30/15 13.5 11.1 Shanghai Electric Group 2727 HK Boris Kan Utilities & Power Equipment UW 2-Sep-13 2.84 2.97 2.40 12/31/14 4.6 -14.2 Aggregate Utilities & Power Equipment performance 48.7 49.4 Average Sector OW (US$)
5.7 5.8
Average Sector UW (US$)
5.9 6.0 Aggregate Sector Performance
-0.2 -0.1
1 - Rating and price targets reflect J.P. Morgan's fundamental long-term views. 2 – Spread over MSCI sector indices except for Shanghai listed A-Shares which are spread over SHASHR. Source: Bloomberg, J.P. Morgan. Priced at June 11, 2014 (prices and price-related data based on previous day's close) J.P Morgan’s Asia Analyst Focus List (AFL) is a selection of high-conviction stocks collaboratively chosen by each Country and Sector research team across Asia-Pacific. The AFL includes Overweight- and Underweight-rated stocks, Overweight having superior outperformance prospects in a team’s universe over the horizon of rating (6-12 months), and Underweight stocks having among the poorer relative performance prospects over the horizon of rating (6-12 months). The aim is to have one Overweight and one Underweight idea from each Research team in the AFL. Analysts can add or delete recommendations at any time and changes will be published, with the analyst’s rationale, on J.P. Morgan Markets. Please check J.P. Morgan Markets https://www.jpmorganmarkets.com for the most up-to- date AFL at any time, or contact your J.P. Morgan representative. The Analyst Focus List is not a model portfolio. Please refer to specific company research for the fundamental investment thesis for each stock included in this list as well as the analysts’ complete views. If a stock is placed under research restriction, J.P. Morgan may remove the stock from the AFL pursuant to applicable law and/or J.P. Morgan policy without any further notice. Important disclosures, including price charts for all companies under coverage for at least one year, are available through the search function on J.P. Morgan's website https://jpmm.com/research/disclosures. Total returns exclude commissions. Past results are not indicative of future performance. Additional information available upon request. Japanese stocks included in the Asia AFL are chosen according to the Asia AFL methodology above, independent of the Japanese Analyst Focus List (Japan AFL). Japan stocks are not included at the Country Team level, but may appear in Sector Team selections. To view the Japan AFL and its methodology, click here: Japan Analyst Focus List (Japan AFL)
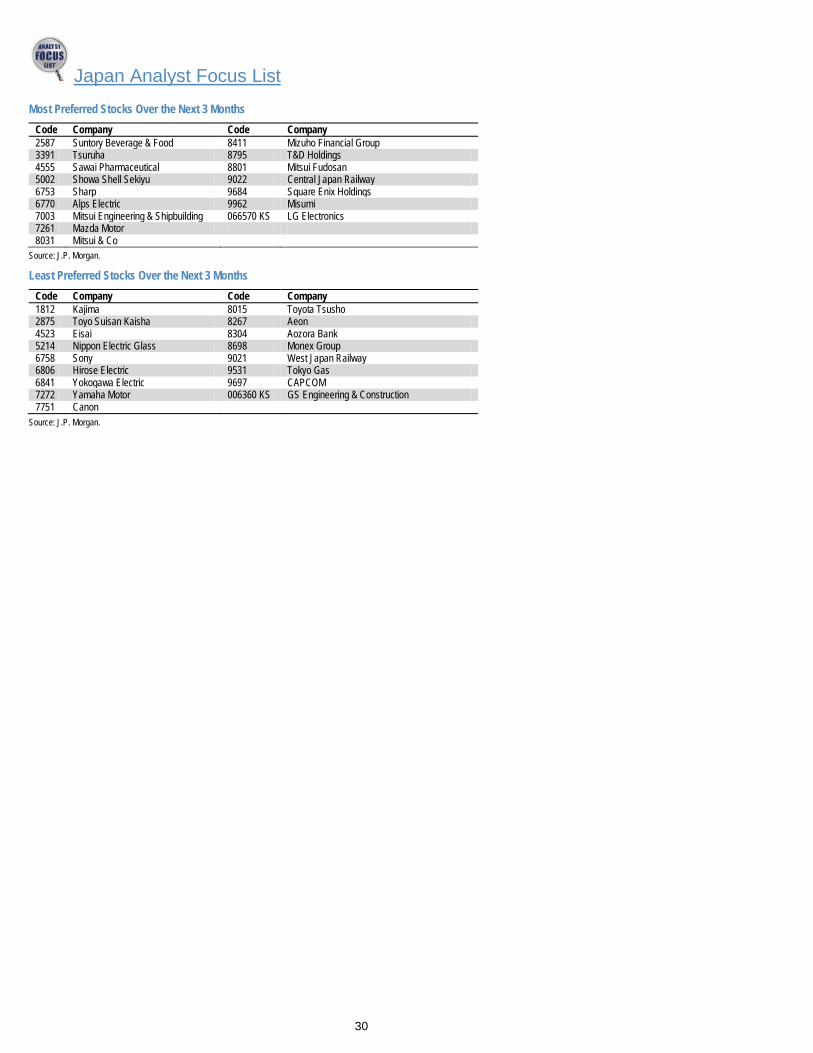
30
Japan Analyst Focus List
Most Preferred Stocks Over the Next 3 Months Code Company Code Company 2587 Suntory Beverage & Food 8411 Mizuho Financial Group 3391 Tsuruha 8795 T&D Holdings 4555 Sawai Pharmaceutical 8801 Mitsui Fudosan 5002 Showa Shell Sekiyu 9022 Central Japan Railway 6753 Sharp 9684 Square Enix Holdings 6770 Alps Electric 9962 Misumi 7003 Mitsui Engineering & Shipbuilding 066570 KS LG Electronics 7261 Mazda Motor 8031 Mitsui & Co
Source: J.P. Morgan.
Least Preferred Stocks Over the Next 3 Months Code Company Code Company 1812 Kajima 8015 Toyota Tsusho 2875 Toyo Suisan Kaisha 8267 Aeon 4523 Eisai 8304 Aozora Bank 5214 Nippon Electric Glass 8698 Monex Group 6758 Sony 9021 West Japan Railway 6806 Hirose Electric 9531 Tokyo Gas 6841 Yokogawa Electric 9697 CAPCOM 7272 Yamaha Motor 006360 KS GS Engineering & Construction 7751 Canon
Source: J.P. Morgan.
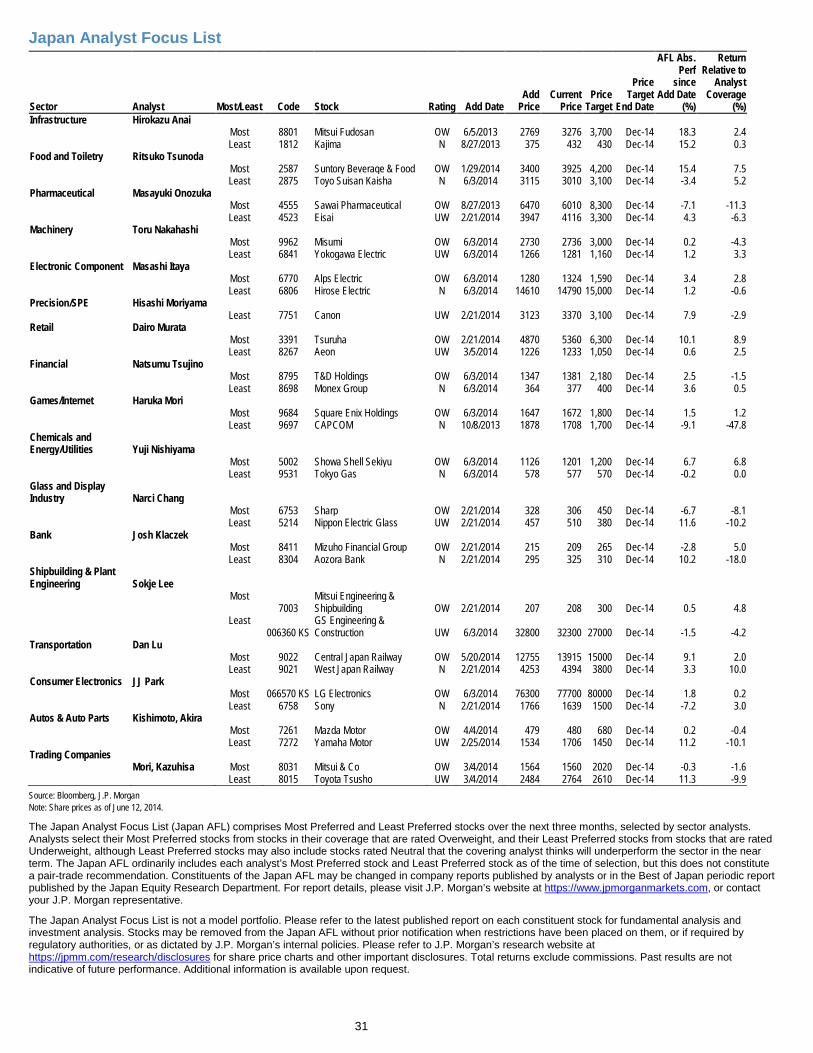
31
Japan Analyst Focus List
Sector Analyst Most/Least Code Stock Rating Add Date Add
Price Current
Price Price
Target
Price Target
End Date
AFL Abs. Perf
since Add Date
(%)
Return Relative to
Analyst Coverage
(%) Infrastructure Hirokazu Anai
Most 8801 Mitsui Fudosan OW 6/5/2013 2769 3276 3,700 Dec-14 18.3 2.4
Least 1812 Kajima N 8/27/2013 375 432 430 Dec-14 15.2 0.3 Food and Toiletry Ritsuko Tsunoda
Most 2587 Suntory Beverage & Food OW 1/29/2014 3400 3925 4,200 Dec-14 15.4 7.5
Least 2875 Toyo Suisan Kaisha N 6/3/2014 3115 3010 3,100 Dec-14 -3.4 5.2
Pharmaceutical Masayuki Onozuka
Most 4555 Sawai Pharmaceutical OW 8/27/2013 6470 6010 8,300 Dec-14 -7.1 -11.3
Least 4523 Eisai UW 2/21/2014 3947 4116 3,300 Dec-14 4.3 -6.3 Machinery Toru Nakahashi
Most 9962 Misumi OW 6/3/2014 2730 2736 3,000 Dec-14 0.2 -4.3
Least 6841 Yokogawa Electric UW 6/3/2014 1266 1281 1,160 Dec-14 1.2 3.3
Electronic Component Masashi Itaya
Most 6770 Alps Electric OW 6/3/2014 1280 1324 1,590 Dec-14 3.4 2.8
Least 6806 Hirose Electric N 6/3/2014 14610 14790 15,000 Dec-14 1.2 -0.6 Precision/SPE Hisashi Moriyama
Least 7751 Canon UW 2/21/2014 3123 3370 3,100 Dec-14 7.9 -2.9
Retail Dairo Murata
Most 3391 Tsuruha OW 2/21/2014 4870 5360 6,300 Dec-14 10.1 8.9
Least 8267 Aeon UW 3/5/2014 1226 1233 1,050 Dec-14 0.6 2.5 Financial Natsumu Tsujino
Most 8795 T&D Holdings OW 6/3/2014 1347 1381 2,180 Dec-14 2.5 -1.5
Least 8698 Monex Group N 6/3/2014 364 377 400 Dec-14 3.6 0.5
Games/Internet Haruka Mori
Most 9684 Square Enix Holdings OW 6/3/2014 1647 1672 1,800 Dec-14 1.5 1.2
Least 9697 CAPCOM N 10/8/2013 1878 1708 1,700 Dec-14 -9.1 -47.8 Chemicals and Energy/Utilities Yuji Nishiyama
Most 5002 Showa Shell Sekiyu OW 6/3/2014 1126 1201 1,200 Dec-14 6.7 6.8
Least 9531 Tokyo Gas N 6/3/2014 578 577 570 Dec-14 -0.2 0.0
Glass and Display Industry Narci Chang
Most 6753 Sharp OW 2/21/2014 328 306 450 Dec-14 -6.7 -8.1 Least 5214 Nippon Electric Glass UW 2/21/2014 457 510 380 Dec-14 11.6 -10.2 Bank Josh Klaczek Most 8411 Mizuho Financial Group OW 2/21/2014 215 209 265 Dec-14 -2.8 5.0 Least 8304 Aozora Bank N 2/21/2014 295 325 310 Dec-14 10.2 -18.0 Shipbuilding & Plant Engineering Sokje Lee
Most 7003
Mitsui Engineering & Shipbuilding OW 2/21/2014 207 208 300 Dec-14 0.5 4.8
Least 006360 KS
GS Engineering & Construction UW 6/3/2014 32800 32300 27000 Dec-14 -1.5 -4.2
Transportation Dan Lu Most 9022 Central Japan Railway OW 5/20/2014 12755 13915 15000 Dec-14 9.1 2.0 Least 9021 West Japan Railway N 2/21/2014 4253 4394 3800 Dec-14 3.3 10.0 Consumer Electronics JJ Park Most 066570 KS LG Electronics OW 6/3/2014 76300 77700 80000 Dec-14 1.8 0.2 Least 6758 Sony N 2/21/2014 1766 1639 1500 Dec-14 -7.2 3.0 Autos & Auto Parts Kishimoto, Akira Most 7261 Mazda Motor OW 4/4/2014 479 480 680 Dec-14 0.2 -0.4 Least 7272 Yamaha Motor UW 2/25/2014 1534 1706 1450 Dec-14 11.2 -10.1 Trading Companies Mori, Kazuhisa Most 8031 Mitsui & Co OW 3/4/2014 1564 1560 2020 Dec-14 -0.3 -1.6 Least 8015 Toyota Tsusho UW 3/4/2014 2484 2764 2610 Dec-14 11.3 -9.9 Source: Bloomberg, J.P. Morgan Note: Share prices as of June 12, 2014.
The Japan Analyst Focus List (Japan AFL) comprises Most Preferred and Least Preferred stocks over the next three months, selected by sector analysts. Analysts select their Most Preferred stocks from stocks in their coverage that are rated Overweight, and their Least Preferred stocks from stocks that are rated Underweight, although Least Preferred stocks may also include stocks rated Neutral that the covering analyst thinks will underperform the sector in the near term. The Japan AFL ordinarily includes each analyst’s Most Preferred stock and Least Preferred stock as of the time of selection, but this does not constitute a pair-trade recommendation. Constituents of the Japan AFL may be changed in company reports published by analysts or in the Best of Japan periodic report published by the Japan Equity Research Department. For report details, please visit J.P. Morgan’s website at https://www.jpmorganmarkets.com, or contact your J.P. Morgan representative.
The Japan Analyst Focus List is not a model portfolio. Please refer to the latest published report on each constituent stock for fundamental analysis and investment analysis. Stocks may be removed from the Japan AFL without prior notification when restrictions have been placed on them, or if required by regulatory authorities, or as dictated by J.P. Morgan’s internal policies. Please refer to J.P. Morgan’s research website at https://jpmm.com/research/disclosures for share price charts and other important disclosures. Total returns exclude commissions. Past results are not indicative of future performance. Additional information is available upon request.
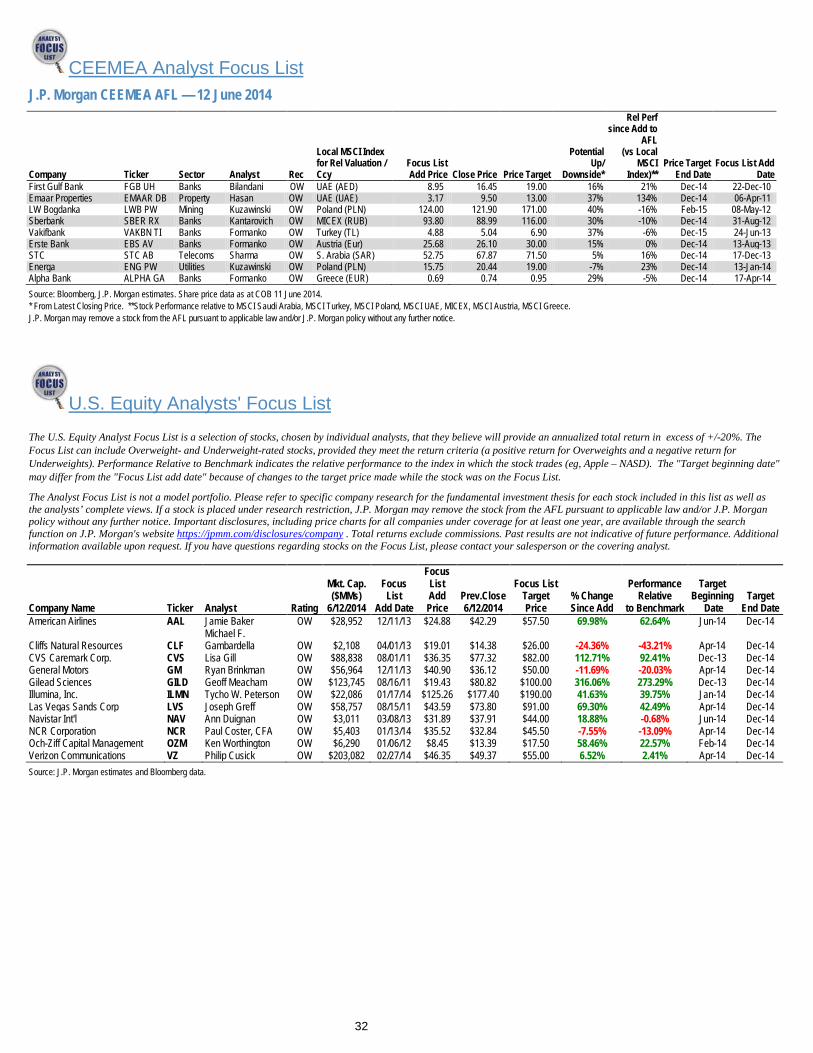
32
CEEMEA Analyst Focus List J.P. Morgan CEEMEA AFL — 12 June 2014
Company Ticker Sector Analyst Rec
Local MSCI Index for Rel Valuation / Ccy
Focus List Add Price Close Price Price Target
Potential Up/
Downside*
Rel Perf since Add to
AFL (vs Local
MSCI Index)**
Price Target End Date
Focus List Add Date
First Gulf Bank FGB UH Banks Bilandani OW UAE (AED) 8.95 16.45 19.00 16% 21% Dec-14 22-Dec-10 Emaar Properties EMAAR DB Property Hasan OW UAE (UAE) 3.17 9.50 13.00 37% 134% Dec-14 06-Apr-11 LW Bogdanka LWB PW Mining Kuzawinski OW Poland (PLN) 124.00 121.90 171.00 40% -16% Feb-15 08-May-12 Sberbank SBER RX Banks Kantarovich OW MICEX (RUB) 93.80 88.99 116.00 30% -10% Dec-14 31-Aug-12 Vakifbank VAKBN TI Banks Formanko OW Turkey (TL) 4.88 5.04 6.90 37% -6% Dec-15 24-Jun-13 Erste Bank EBS AV Banks Formanko OW Austria (Eur) 25.68 26.10 30.00 15% 0% Dec-14 13-Aug-13 STC STC AB Telecoms Sharma OW S. Arabia (SAR) 52.75 67.87 71.50 5% 16% Dec-14 17-Dec-13 Energa ENG PW Utilities Kuzawinski OW Poland (PLN) 15.75 20.44 19.00 -7% 23% Dec-14 13-Jan-14 Alpha Bank ALPHA GA Banks Formanko OW Greece (EUR) 0.69 0.74 0.95 29% -5% Dec-14 17-Apr-14 Source: Bloomberg, J.P. Morgan estimates. Share price data as at COB 11 June 2014. * From Latest Closing Price. **Stock Performance relative to MSCI Saudi Arabia, MSCI Turkey, MSCI Poland, MSCI UAE, MICEX, MSCI Austria, MSCI Greece. J.P. Morgan may remove a stock from the AFL pursuant to applicable law and/or J.P. Morgan policy without any further notice.
U.S. Equity Analysts' Focus List The U.S. Equity Analyst Focus List is a selection of stocks, chosen by individual analysts, that they believe will provide an annualized total return in excess of +/-20%. The Focus List can include Overweight- and Underweight-rated stocks, provided they meet the return criteria (a positive return for Overweights and a negative return for Underweights). Performance Relative to Benchmark indicates the relative performance to the index in which the stock trades (eg, Apple – NASD). The "Target beginning date" may differ from the "Focus List add date" because of changes to the target price made while the stock was on the Focus List.
The Analyst Focus List is not a model portfolio. Please refer to specific company research for the fundamental investment thesis for each stock included in this list as well as the analysts’ complete views. If a stock is placed under research restriction, J.P. Morgan may remove the stock from the AFL pursuant to applicable law and/or J.P. Morgan policy without any further notice. Important disclosures, including price charts for all companies under coverage for at least one year, are available through the search function on J.P. Morgan's website https://jpmm.com/disclosures/company . Total returns exclude commissions. Past results are not indicative of future performance. Additional information available upon request. If you have questions regarding stocks on the Focus List, please contact your salesperson or the covering analyst.
Mkt. Cap. ($MMs)
Focus List
Focus List Add Prev.Close
Focus List Target % Change
Performance Relative
Target Beginning Target
Company Name Ticker Analyst Rating 6/12/2014 Add Date Price 6/12/2014 Price Since Add to Benchmark Date End Date American Airlines AAL Jamie Baker OW $28,952 12/11/13 $24.88 $42.29 $57.50 69.98% 62.64% Jun-14 Dec-14
Cliffs Natural Resources CLF Michael F. Gambardella OW $2,108 04/01/13 $19.01 $14.38 $26.00 -24.36% -43.21% Apr-14 Dec-14
CVS Caremark Corp. CVS Lisa Gill OW $88,838 08/01/11 $36.35 $77.32 $82.00 112.71% 92.41% Dec-13 Dec-14 General Motors GM Ryan Brinkman OW $56,964 12/11/13 $40.90 $36.12 $50.00 -11.69% -20.03% Apr-14 Dec-14 Gilead Sciences GILD Geoff Meacham OW $123,745 08/16/11 $19.43 $80.82 $100.00 316.06% 273.29% Dec-13 Dec-14 Illumina, Inc. ILMN Tycho W. Peterson OW $22,086 01/17/14 $125.26 $177.40 $190.00 41.63% 39.75% Jan-14 Dec-14 Las Vegas Sands Corp LVS Joseph Greff OW $58,757 08/15/11 $43.59 $73.80 $91.00 69.30% 42.49% Apr-14 Dec-14 Navistar Int'l NAV Ann Duignan OW $3,011 03/08/13 $31.89 $37.91 $44.00 18.88% -0.68% Jun-14 Dec-14 NCR Corporation NCR Paul Coster, CFA OW $5,403 01/13/14 $35.52 $32.84 $45.50 -7.55% -13.09% Apr-14 Dec-14 Och-Ziff Capital Management OZM Ken Worthington OW $6,290 01/06/12 $8.45 $13.39 $17.50 58.46% 22.57% Feb-14 Dec-14 Verizon Communications VZ Philip Cusick OW $203,082 02/27/14 $46.35 $49.37 $55.00 6.52% 2.41% Apr-14 Dec-14 Source: J.P. Morgan estimates and Bloomberg data.

33
Your feedback can help us to make the FTM better. Please take a moment to tell us what you think. Click here to send comments Click here to unsubscribe
Company-Specific Disclosures: Important disclosures, including price charts, are available for compendium reports and all J.P. Morgan–covered companies by visiting https://jpmm.com/research/disclosures, calling 1-800-477-0406, or e-mailing [email protected] with your request. J.P. Morgan’s Strategy, Technical, and Quantitative Research teams may screen companies not covered by J.P. Morgan. For important disclosures for these companies, please call 1-800-477-0406 or e-mail [email protected]. Analyst Certification: As to each individual report referenced herein, the primary research analyst(s) named within the report individually certify, with respect to each security or issuer that the analyst covered in the report, that: (1) all of the views expressed in the report accurately reflect his or her personal views about any and all of the subject securities or issuers; and (2) no part of any of the research analyst's compensation was, is, or will be directly or indirectly related to the specific recommendations or views expressed in the report. For individual analyst certifications, please refer to the disclosure section at the end of the attached individual notes. For all Korea-based research analysts listed on the front cover, they also certify, as per KOFIA requirements, that their analysis was made in good faith and that the views reflect their own opinion, without undue influence or intervention. Research excerpts: This note includes excerpts from previously published research. For access to the full reports, including analyst certification and important disclosures, investment thesis, valuation methodology, and risks to rating and price targets, please contact your salesperson or the covering analyst’s team or visit www.jpmorganmarkets.com. Other Disclosures: All research reports made available to clients are simultaneously available on our client website, J.P. Morgan Markets. Not all research content is redistributed, e-mailed or made available to third-party aggregators. For all research reports available on a particular stock, please contact your sales representative. Options related research: If the information contained herein regards options related research, such information is available only to persons who have received the proper option risk disclosure documents. For a copy of the Option Clearing Corporation's Characteristics and Risks of Standardized Options, please contact your J.P. Morgan Representative or visit the OCC's website at http://www.optionsclearing.com/publications/risks/riskstoc.pdf Legal Entities Disclosures U.S.: JPMS is a member of NYSE, FINRA, SIPC and the NFA. JPMorgan Chase Bank, N.A. is a member of FDIC. U.K.: JPMorgan Chase N.A., London Branch, is authorised by the Prudential Regulation Authority and is subject to regulation by the Financial Conduct Authority and to limited regulation by the Prudential Regulation Authority. Details about the extent of our regulation by the Prudential Regulation Authority are available from J.P. Morgan on request. J.P. Morgan Securities plc (JPMS plc) is a member of the London Stock Exchange and is authorised by the Prudential Regulation Authority and regulated by the Financial Conduct Authority and the Prudential Regulation Authority. Registered in England & Wales No. 2711006. Registered Office 25 Bank Street, London, E14 5JP. South Africa: J.P. Morgan Equities South Africa Proprietary Limited is a member of the Johannesburg Securities Exchange and is regulated by the Financial Services Board. Hong Kong: J.P. Morgan Securities (Asia Pacific) Limited (CE number AAJ321) is regulated by the Hong Kong Monetary Authority and the Securities and Futures Commission in Hong Kong and/or J.P. Morgan Broking (Hong Kong) Limited (CE number AAB027) is regulated by the Securities and Futures Commission in Hong Kong. Korea: J.P. Morgan Securities (Far East) Ltd, Seoul Branch, is regulated by the Korea Financial Supervisory Service. Australia: J.P. Morgan Australia Limited (JPMAL) (ABN 52 002 888 011/AFS Licence No: 238188) is regulated by ASIC and J.P. Morgan Securities Australia Limited (JPMSAL) (ABN 61 003 245 234/AFS Licence No: 238066) is regulated by ASIC and is a Market, Clearing and Settlement Participant of ASX Limited and CHI-X. Taiwan: J.P.Morgan Securities (Taiwan) Limited is a participant of the Taiwan Stock Exchange (company-type) and regulated by the Taiwan Securities and Futures Bureau. India: J.P. Morgan India Private Limited, having its registered office at J.P. Morgan Tower, Off. C.S.T. Road, Kalina, Santacruz East, Mumbai - 400098, is a member of the National Stock Exchange of India Limited (SEBI Registration Number - INB 230675231/INF 230675231/INE 230675231) and Bombay Stock Exchange Limited (SEBI Registration Number - INB 010675237/INF 010675237) and is regulated by Securities and Exchange Board of India. For non local research reports, this material is not distributed in India by J.P. Morgan India Private Limited. Thailand: This material is issued and distributed in Thailand by JPMorgan Securities (Thailand) Ltd., which is a member of the Stock Exchange of Thailand and is regulated by the Ministry of Finance and the Securities and Exchange Commission and its registered address is 3rd Floor, 20 North Sathorn Road, Silom, Bangrak, Bangkok 10500. Indonesia: PT J.P. Morgan Securities Indonesia is a member of the Indonesia Stock Exchange and is regulated by the OJK a.k.a. BAPEPAM LK. Philippines: J.P. Morgan Securities Philippines Inc. is a Trading Participant of the Philippine Stock Exchange and a member of the Securities Clearing Corporation of the Philippines and the Securities Investor Protection Fund. It is regulated by the Securities and Exchange Commission. Brazil: Banco J.P. Morgan S.A. is regulated by the Comissao de Valores Mobiliarios (CVM) and by the Central Bank of Brazil. Mexico: J.P. Morgan Casa de Bolsa, S.A. de C.V., J.P. Morgan Grupo Financiero is a member of the Mexican Stock Exchange and authorized to act as a broker dealer by the National Banking and Securities Exchange Commission. Singapore: This material is issued and distributed in Singapore by or through J.P. Morgan Securities Singapore Private Limited (JPMSS) [MCI (P) 199/03/2014 and Co. Reg. No.: 199405335R] which is a member of the Singapore Exchange Securities Trading Limited and is regulated by the Monetary Authority of Singapore (MAS) and/or JPMorgan Chase Bank, N.A., Singapore branch (JPMCB Singapore) which is regulated by the MAS. This material is provided in Singapore only to accredited investors, expert investors and institutional investors, as defined in Section 4A of the Securities and Futures Act, Cap. 289. Recipients of this document are to contact JPMSS or JPMCB Singapore in respect of any matters arising from, or in connection with, the document. Japan: JPMorgan Securities Japan Co., Ltd. is regulated by the Financial Services Agency in Japan. Malaysia: This material is issued and distributed in Malaysia by JPMorgan Securities (Malaysia) Sdn Bhd (18146-X) which is a Participating Organization of Bursa Malaysia Berhad and a holder of Capital Markets Services License issued by the Securities Commission in Malaysia. Pakistan: J. P. Morgan Pakistan Broking (Pvt.) Ltd is a member of the Karachi Stock Exchange and regulated by the Securities and Exchange Commission of Pakistan. Saudi Arabia: J.P. Morgan Saudi Arabia Ltd. is authorized by the Capital Market Authority of the
34
Kingdom of Saudi Arabia (CMA) to carry out dealing as an agent, arranging, advising and custody, with respect to securities business under licence number 35-07079 and its registered address is at 8th Floor, Al-Faisaliyah Tower, King Fahad Road, P.O. Box 51907, Riyadh 11553, Kingdom of Saudi Arabia. Dubai: JPMorgan Chase Bank, N.A., Dubai Branch is regulated by the Dubai Financial Services Authority (DFSA) and its registered address is Dubai International Financial Centre - Building 3, Level 7, PO Box 506551, Dubai, UAE. Country and Region Specific Disclosures U.K. and European Economic Area (EEA): Unless specified to the contrary, issued and approved for distribution in the U.K. and the EEA by JPMS plc. Investment research issued by JPMS plc has been prepared in accordance with JPMS plc's policies for managing conflicts of interest arising as a result of publication and distribution of investment research. Many European regulators require a firm to establish, implement and maintain such a policy. This report has been issued in the U.K. only to persons of a kind described in Article 19 (5), 38, 47 and 49 of the Financial Services and Markets Act 2000 (Financial Promotion) Order 2005 (all such persons being referred to as "relevant persons"). This document must not be acted on or relied on by persons who are not relevant persons. Any investment or investment activity to which this document relates is only available to relevant persons and will be engaged in only with relevant persons. In other EEA countries, the report has been issued to persons regarded as professional investors (or equivalent) in their home jurisdiction. Australia: This material is issued and distributed by JPMSAL in Australia to "wholesale clients" only. This material does not take into account the specific investment objectives, financial situation or particular needs of the recipient. The recipient of this material must not distribute it to any third party or outside Australia without the prior written consent of JPMSAL. For the purposes of this paragraph the term "wholesale client" has the meaning given in section 761G of the Corporations Act 2001. Germany: This material is distributed in Germany by J.P. Morgan Securities plc, Frankfurt Branch and J.P.Morgan Chase Bank, N.A., Frankfurt Branch which are regulated by the Bundesanstalt für Finanzdienstleistungsaufsicht. Hong Kong: The 1% ownership disclosure as of the previous month end satisfies the requirements under Paragraph 16.5(a) of the Hong Kong Code of Conduct for Persons Licensed by or Registered with the Securities and Futures Commission. (For research published within the first ten days of the month, the disclosure may be based on the month end data from two months prior.) J.P. Morgan Broking (Hong Kong) Limited is the liquidity provider/market maker for derivative warrants, callable bull bear contracts and stock options listed on the Stock Exchange of Hong Kong Limited. An updated list can be found on HKEx website: http://www.hkex.com.hk. Japan: There is a risk that a loss may occur due to a change in the price of the shares in the case of share trading, and that a loss may occur due to the exchange rate in the case of foreign share trading. In the case of share trading, JPMorgan Securities Japan Co., Ltd., will be receiving a brokerage fee and consumption tax (shouhizei) calculated by multiplying the executed price by the commission rate which was individually agreed between JPMorgan Securities Japan Co., Ltd., and the customer in advance. Financial Instruments Firms: JPMorgan Securities Japan Co., Ltd., Kanto Local Finance Bureau (kinsho) No. 82 Participating Association / Japan Securities Dealers Association, The Financial Futures Association of Japan, Type II Financial Instruments Firms Association and Japan Investment Advisers Association. Korea: This report may have been edited or contributed to from time to time by affiliates of J.P. Morgan Securities (Far East) Ltd, Seoul Branch. Singapore: JPMSS and/or its affiliates may have a holding in any of the securities discussed in this report; for securities where the holding is 1% or greater, the specific holding is disclosed in the Important Disclosures section above. India: For private circulation only, not for sale. Pakistan: For private circulation only, not for sale. New Zealand: This material is issued and distributed by JPMSAL in New Zealand only to persons whose principal business is the investment of money or who, in the course of and for the purposes of their business, habitually invest money. JPMSAL does not issue or distribute this material to members of "the public" as determined in accordance with section 3 of the Securities Act 1978. The recipient of this material must not distribute it to any third party or outside New Zealand without the prior written consent of JPMSAL. Canada: The information contained herein is not, and under no circumstances is to be construed as, a prospectus, an advertisement, a public offering, an offer to sell securities described herein, or solicitation of an offer to buy securities described herein, in Canada or any province or territory thereof. Any offer or sale of the securities described herein in Canada will be made only under an exemption from the requirements to file a prospectus with the relevant Canadian securities regulators and only by a dealer properly registered under applicable securities laws or, alternatively, pursuant to an exemption from the dealer registration requirement in the relevant province or territory of Canada in which such offer or sale is made. The information contained herein is under no circumstances to be construed as investment advice in any province or territory of Canada and is not tailored to the needs of the recipient. To the extent that the information contained herein references securities of an issuer incorporated, formed or created under the laws of Canada or a province or territory of Canada, any trades in such securities must be conducted through a dealer registered in Canada. No securities commission or similar regulatory authority in Canada has reviewed or in any way passed judgment upon these materials, the information contained herein or the merits of the securities described herein, and any representation to the contrary is an offence. Dubai: This report has been issued to persons regarded as professional clients as defined under the DFSA rules. Brazil: Ombudsman J.P. Morgan: 0800-7700847 / [email protected].
"Other Disclosures" last revised April 5, 2014.
This message is provided for information purposes only and should be read in conjunction with the latest research report on this company. The information is believed to be reliable, but J.P. Morgan does not warrant its completeness or accuracy. Opinions, estimates and assumptions constitute our judgment as of the date hereof and are subject to change without notice. Past performance is not indicative of future results. This material is not intended as an offer or solicitation for the purchase or sale of any financial instrument. All J.P. Morgan research is subject to a standard form global hedge clause as well as company specific disclosures included on all research and incorporated herein by reference. The recipient of this material must not distribute it to any third party without the prior written consent of J.P. Morgan. Additional information is available upon request © 2014 JPMorgan Chase & Co.