to swab is to teach - metasub
TRANSCRIPT

J e a n n e G a r b a r i n o , P h D @J e a n n e G a r b @Rockedu_
#Rockedu To Swab Is To Teach
¡ Inherent to STEM training is the development of critical thinking skills
¡ This is important for both STEM and non-STEM careers
¡ STEM education correlated with higher paying jobs § Potential to decrease wage gap,
particularly for socioeconomically disadvantaged
We All Agree: STEM Education is Important

Recent and Projected Growth in Employment in the United States (2010 – 2020)
http://www.ed.gov/stem

This i s a g lobal s tandardized tes t g iven to 15 year o ld s tudents . The purpose i s to gauge educat ional success and crea t iv i ty.
Programme for Internat ional Student Assessment (PISA)
International Rankings for Science and Math (2012)
Source: Organizat ion for Economic Cooperat ion and Development

US Schools: Expensive and Unchanging
¡ The US spends approximately $12,000 per full-time K-12 student. § This is 35% higher than other nations in the OECD Convention*
§ Despite the amount we spend, performance has not improved in years
* Convention on the Organization of Economic Cooperation and Development includes 34 nations
Hyper-Testing. Teacher Sanctioning. Lack of Resources. This all leads to compartmentalized, surface level science instruction.
THE LEARNING OF SCIENCE RESEMBLES NOTHING OF THE PRACTICE OF SCIENCE.

• Vaccinat ions
• Climate change
• GMOs
• Hyped media
• Act out of fear, not fac t
• Genera l apathy
The Repercussions
are Real .

Next Generation Science Standards (NGSS) ¡ Organized by the National Academy of Sciences ¡ Based on the intersection of knowledge and application ¡ Emphasis on cross-cutting principles to integrate all
science and engineering disciplines
New Standards for Science Education
Overarching goals: • Instill general appreciation • Public engagement on issues related to science • Develop critical thinking • Empower students to find the career of their choosing.

From A Framework for K-12 Science Educat ion , Nat ional Academies Press , 2011.
NGSS Framework
Science and Engineering Principles • Asking questions, defining problems • Planning and executing investigations • Analyzing data, mathematical modeling • Using evidence to construct arguments
Emphasis on the Human Built World • How does the natural world interact with human
infrastructure? • How do the life sciences integrate with engineering
principles?
Relevant Entry Points and Big pictures • How does [enter scientific concept] this relate to the
students? • Why should students care?

Addresses the goals of the NGSS, particularly regarding the nexus of the built and natural environment
Microbiome Research: A perfect platform for integrating
relevant and accessible knowledge and application for students, while
providing a wide breadth of scientific experience

Learning At the Bench (LAB) Initiative: ¡ Provides students an opportunity to learn by discovery ¡ Encourages students to come up with their own research
question – explore what interests them! ¡ Puts the investigative power into their hands – empowers
students and creates buy-in ¡ Connects Students to scientists – breaks stereotypes
Connecting HS Students to Microbiome Research
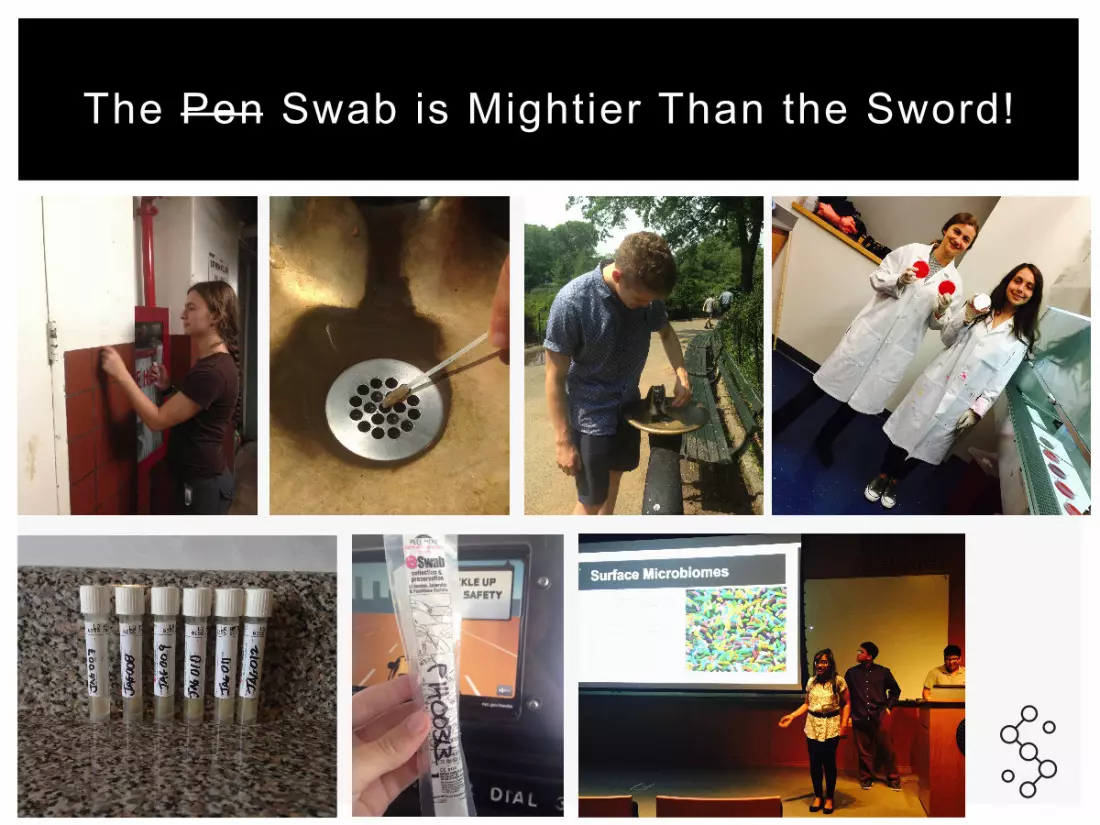
The Pen Swab is Mightier Than the Sword!

Students as Investigators
MATERIALS & METHODS
The Microbiomes of Central Park Water Fountains Will Lounsbery-Scaife, Elias Pineda, Nell Kirchberger, Anya Auerbach, Anya Dunaif, Jonathan
Schneiderman PhD, Elizabeth Waters PhD, Jeanne Garbarino PhD Science Outreach Teaching Laboratory, Rockefeller University
Hundreds of thousands of people use Central Parks’ drinking fountains every day. Previous reports have shown disease outbreaks caused by drinking from public fountains, so we wanted to test the cleanliness of the ones in Central Park. To test this, we collected samples from 34 drinking fountains across the park. DNA taken from the samples was compared to DNA of known species, allowing us to determine which species the DNA sequences from our samples are from, and to see if there are any dangerous bacteria on the fountains.
Moving from the Northern tip of the park downwards, we sampled the selected fountains for three minutes each with two synthetic swabs—one on the bowl and one on the spigot. Back in the lab, we used MoBio kits and AMPure beads to extract and concentrate the DNA from our samples, and a Qubit 2.0 Fluorometer to quantify it. On one water fountain, we used four swabs: two before a class of young children drank from it, and two after.
SUMMARY
RESULTS
DISCUSSION
TheDairy
CobCot
ConservatoryGarden
TheZoo
Con
serv
ator
yW
ater
LaskerPool/Rink
Tavern On the Green
LoebBoathouse
TheMall
A C B
B C
B C
B C
B C
B C
B C
B C
2 3
D
1 2 3
The Lake
The Pool
The Pond
Turtle Pond
Harlem Meer
Jacqueline Kennedy Onassis Reservoir
MetropolitanMuseum
Of Art
GreatLawn
GreatHill
0.77 miles(1239 meters)
1.15 miles(1850 meters)
0.27 miles(434 meters)
1.71 miles(2752 meters)
0.31 miles(499 meters)
1.41 miles(2269 meters)
0.99 miles(1593 meters)
Reservoir Path1.58 miles(2543 meters)
0.25 miles(402 meters)
0.55 miles(885 meters)
Runners Map
Legend
The periphery of Central Park
(Central Park West, Central
Park South, 5th Ave. and 110th
St.) is 6.1 miles
Copyright 2008 CentralPark.com All Rights Reserved
Outer Park Drive Loop 6.03 miles(9704 meters)
CallBoxes
BridlePath
Pedestrian Pathsand Areas
Reservoir Path
PublicWashrooms
PublicTelephones
DrinkingFountains
Par
k D
rive
Par
k D
rive
Park Drive
Park
Drive
Park
Driv
e
Park
Dri
ve
Park Drive
W 58th St
Center Drive
Park Drive
West
Dri
veW
est D
rive
E 61st St
Park Drive
Manhatt
an A
ve
5th
Ave
Manhatt
an A
ve
Par
k D
rive
E 81st St
E 70th St
W 76th St
7th
Ave
W 111th St
5th
Ave
E 95th St
E 97th St
E 94th St
E 93rd St
E 96th St
Central Park North
Central Park South
E 60th St
E 59th St
E 109th St
E 110th St
E 101st St
E 105th St
E 103rd St
E 102nd St
E 104th St
E 111th St
E 108th St
E 107th St
E 106th St
5th
Ave
Lenox
Ave
Harlem
Lane
Madiso
n A
ve
Cen
tral P
ark
West
Madiso
n A
ve
Cen
tral P
ark
West
Madiso
n A
ve
5th
Ave
6th
Ave
Madiso
n A
ve
Cen
tral P
ark
West
5th
Ave
E 63rd St
E 67th St
E 64th St
E 68th St
E 69th St
E 62nd St
E 65th St
E 66th St
E 72nd St
E 73rd St
E 71st St
E 74th St
E 78th St
E 75th St
E 77th St
E 76th St
E 80th St
E 82nd St
E 83rd St
E 86th St
E 87th St
E 89th St
E 85th St
E 84th St
E 79th St
Broadw
ay
8th
Ave
W 57th St
W 104th St
W 105th St
W 98th St
W 106th St
W 101st St
W 102nd St
W 77th St
W 100th St
W 108th St
W 107th St
W 109th St
W 103rd St
W 95th St
W 93rd St
W 87th St
W 91st St
W 82nd St
W 89th St
W 90th St
W 83rd St
W 85th St
W 88th St
W 92nd St
W 94th St
W 84th St
W 86th St
W 81st St
W 97th St
W 96th St
W 73rd St
W 62nd St
W 70th St
W 61st St
W 68th St
W 69th St
W 74th St
W 75th St
W 71st St
W 72nd St
W 65th St
W 67th St
W 64th St
W 63rd St
W 66th St
E 98th St
E 99th St
E 90th St
E 92nd St
E 91st St
E 88th St
Cen
tral P
ark
West
INTRODUCTION New York, one of the most densely occupied cities in the world, is home to a volatile microbial population that covers the city�s surfaces. By collecting samples from high traffic areas throughout the city, the Pathomap Project aims to document these populations, and detect any pathogenic threats. Central Park�s drinking fountains are perfect surfaces to sample, as they are frequently used and could serve as vectors for disease.
Sample* Yield** (ng/µg)
001 .608
002 3.0
003 .888
004 1.15
005 .806
006 .212
007 .348
008 .710
009 .434
009B <.5
010 1.09
010B .210
011 3.18
012 3.70
013 .112
014 .304
015 .890
016 .324
017 1.05
018 1.47
019*** 10.1
020 3.44
021 14.6
022 14.1
023 .364
024 6.34
025 .550
026 11.5
027 12.3
028 16.2
029 1.43
030 14.9
031 5.64
032 2.08
033 2.54
Sample* Yield** (ng/µg)
034 n/a
035 .522
036 2.20
037 1.02
038 2.98
039 3.86
040 4.86
041 .720
042 11.5
043 4.30
044 1.93
045 .786
046 2.46
047 8.36
048 32.2
049 29.6
050 23.0
051 2.5
052 16.2
053 8.26
054 7.16
055 4.12
056 12.0
057 3.20
058 15.3
059 5.40
060 11.9
061 5.90
062 3.16
063 5.04
064 3.32
065 5.38
066 6.78
067 .680
068 .940
The average yield for all samples was 5.57 ng/µg. The average yield for all bowls was 4.17 ng/µg, and the average yield for all spigots 7.01 ng/µg. Before the yields were calculated, we hypothesized that bowls would have higher yields, as they have larger surface areas and contain more visible algal growth. A possible reason for this is that bowls are washed every time the fountain is used, whereas microbial growth on the spigots is only washed when it rains. Another possibility is that spigots come into more direct contact with peoples’ mouths than bowls, and thus have more bacterial growth.
Most of the samples with yields over 10 ng/µg are from spigots in areas of high traffic, such as Columbus Circle, the Sheep Meadow, and the east 72nd street entrance. However, some samples, such as 019 and 021, are bowl samples that were not taken from areas with seemingly high traffic. This raises questions as to what factors affect the amount of microbes on fountains other than the amount of use the fountain sees and the location on the fountain.
An additional topic for further research would be how effective are drinking fountains as vectors of disease? If someone drinks from a fountain with pathogenic bacteria on it, how likely are they to become sick?
*All even numbered samples are spigots, all odd numbered samples are bowls **Yields measure nanograms of DNA per microgram of EB Buffer
019, 020
021, 022
001, 002
002 ,003
005 ,006
007, 008
009, 009B, 010, 010B
013, 014
015, 016
017, 018
011, 012
023, 024, 025, 026
027, 028
029, 030
033, 034
035, 036
037, 038
039, 040 031, 032
053, 054
041, 042
043, 044
055, 056 057, 058
059, 060
061, 062
063, 064
065, 066 067, 068
049, 050
051, 052
047, 048
045, 046
***Samples in red had yields of more than 10 ng/µg
= sampled fountain
DNA yields of all samples
REFERENCES Central Park Conservancy Centralpark.com Pathomap.org Sezen F, Aval E, Ağkurt T, Yilmaz S, Temel F, Güleşen R, Korukluoğlu G, Sucakli MB, Torunoğlu MA, Zhu BP Epidemiology and Infection [2014:1-7]
Map of Central Park
Microbial Accumulation On Surfaces With Frequent Skin ContactAnya Auerbach, Jonathan Schneiderman PhD, Elizabeth Waters PhD, Jeanne Garbarino PhD
The Science Outreach and Education Lab, The Rockefeller University, New York, NY
INTRODUCTION:
SUMMARYMicrobes are found all around us, interacting with their habitats and humans in complex ways. However, little is known about how populations of microbes travel around urban environments. As part of the PathomapProject, we are interested in how bacterial populations in New York City arrive at a new location and accumulate over time. To study this we experimented with sampling surfaces at Grand Central Terminal hourly, and isolated DNA from the samples. However, we found very little DNA, meaning there were very few microbes on the surface. This was surprising a surprising find- we usually assume that locations like subway stations are highly contaminated. This information helps us understand how quickly microbes spread through the city and how populations may become established. Ultimately, understanding the microbial populations of New York City will help us respond to threats from infectious species.
METHODS and RESULTS :
CONCLUSIONS:
REFERENCES:
Our method of DNA collection consisted of two primary components: collection and extraction. During collection, we took an initial sample prior to wiping down in order to establish a baseline for comparison. We then used Clorox wipes to physically remove any organisms from the surface. The surface was then swabbed for three minutes and the sample stored in preservative.
• The first six samples collected from just the ticket machine touch screen (see Table 1.)
• The rest of the swabs covered the ticket dispenser, coin slot, credit card reader and touch screen
• 6 of the later samples were dipped in the polysorbate detergent Tween 20 prior to use
• Samples were collected immediately after wiping, as well as one and in some cases two hours later
• None of these resulted in high yields
Trials One and Two:
Trial Three:• Swabbed the door handles at the entrance to
Grand Central• Collected from two or three handles per swab• One set were soaked in Tween 20 before swabbing
(see Table 2.)• The yields were again all below 0.5 ng/µl, the
lowest detectable quantity
The microorganisms in our environment have a profound impact on our lives. Although the human microbiome has been well studied in recent years, the microbes of indoor surfaces and our urban environment are still poorly known. The Pathomap project, spearheaded by the Mason lab at Weill Cornell Medical College, is studying the microbiome of New York City’s public transit system. Their preliminary results indicate large and varied bacterial populations in subway stations across the city and on multiple surfaces: turnstiles, wooden benches, and subway handrails.
Although the Mason Lab’s study tells us about bacterial abundance and diversity, it does not shed much light on how bacteria have arrived on these surfaces. Other studies have demonstrated a high degree of variability between human hand microbiomes, and a close association between the hand and cell phone microbiomes, suggesting that surfaces in frequent contact with skin exchange microbes with it (Beckstrom et al, 2013; Dunn et al, 2013).We were interested in how bacteria accumulate on surfaces in frequent contact with large human populations. We hypothesized that over the course of the day we would observe an increase in both DNA yield and bacterial diversity on our sample surfaces in Grand Central Terminal.
Sample # of machines Pre-wipe Y/N Post-wipe # hours Tween Y/N Yield / µL01 1 N 0 N < 0.5 ng02 1 Y NA N .1 ng03 1 N 0 N < 0.5 ng04 4 N 1 N < 0.5 ng05 1 N 1 N < 0.5 ng06 1 N 1 N < 0.5 ng07 5 N 0 Y < 0.5 ng08 1 N 0 Y < 0.5 ng09 1 N 0 N < 0.5 ng11 5 N 1 Y < 0.5 ng12 1 N 1 Y < 0.5 ng13 1 N 1 N < 0.5 ng15 5 N 2 Y < 0.5 ng16 1 N 2 Y < 0.5 ng17 1 N 2 N < 0.5 ng
• The DNA yields from our sample surfaces were extremely low, even when we utilized methods to improve yield
• We concluded that very little DNA accumulates on these surfaces- whether because of rapid turnover or frequent cleaning
• It is interesting that these surfaces in a crowded subway station- an environment we typically consider heavily contaminated- were in fact quite clean, at least of microbial life
• We recommend further research investigate the causes of the low yields, whether people’s hands are removing as much DNA as they deposit, or if these surfaces are being cleaned frequently to prevent accumulation
• New York City may be considered dirty, but our research suggests that some areas, at least, are not as infested with microbial life as we think they are.
Sample # # of handles Tween Y/N Yield Per µL Lysol Wipes18 3 Y < 0.5 ng Swabbed Before19 3 N < 0.5 ng20 2 N < 0.5 ng Swabbed After21 2 Y < 0.5 ng22 2 N < 0.5 ng Swabbed
1 hour later23 2 Y < 0.5 ng
Door Handle (left) and Ticket Machine (right)
• We extracted and then concentrated the DNA from each swab
• In the third trial we also tried extracting DNA from the preservative liquid
• The DNA extracted using our method may come from living or dead organisms
Extraction:
Table 1.Ticket Machine sampling with multiple variables.
Table 2.Door Handle sampling with multiplying variables
Konieczny, J., and Rdzawski, Z., 2012, Antibacterial properties of copper and its alloys, Archives of Materials Science and Engineering, v. 56 issue 2, p. 53-60. http://www.archivesmse.org/vol56_2/5621.pdf (July 31st 2014)Beckstrom, AC, CLeman, PE., Cassis-Ghavami, FL,. And Kamitsuka MD., 2013, Surveillance study of bacterial contamination of the parent's cell phone in the NICU and the effectiveness of an anti-microbial gel in reducing transmission to the hands, PubMed, http://www.ncbi.nlm.nih.gov/pubmed/24008502 (July 31st 2014)Dunn, Robert R., Fierer, Noah, and Menninger, Holly L., Home Life: Factors Structuring the Bacterial Diversity Found within and between Homes, PLoSOne. 2013, http://www.ncbi.nlm.nih.gov/pmc/articles/PMC3661444/ (July 31st 2014)Hospodsky, D., Pickering, A., Julian, T., Miller, D., Gorthala, S., Boehm, A., Peccia, J., 2013, Hand bacterial communities vary across two different human populations, Microbiology, 160, 1144-1152.
¡ Human Power! § Data collection often requires an army § DNA extractions are straightforward – students can
easily follow MoBio protocols § Students are inherently computer savvy and can work
with data output § Keeps mentoring skills sharpened § Broader Impacts!!
¡ You get to learn what words like “fleek” and “brick” mean.
Benefits to Scientists

And Science Education!
For Science!

Acknowledgements
The Rockefeller University Yasmen Khan Elizabeth Hubin Mark Stoeckle Elizabeth Waters Julie Nadel Zach Charlop-Powers Debjani Chakraborty
WCMC Chris Mason Ebrahim Afshinnekoo Jorge Gandara Paul Zumbo
The Pinkerton Foundation Brooke Astor One Year Fund Dreyfus Foundation
Barnard Krista McGuire NAC Clara Pregitzer