tibetan population in china: myths and facts re-examined
TRANSCRIPT
Asian Ethnicity, Volume 1, Number 1, March 2000
Tibetan Population in China: Myths andFacts Re-examined
YAN HAO
(Institute of Economic Research, State Department of PlanningCommission, Beijing)
China is not only the most populous country in the world, but also a multinational countrywith 56 ethnic groups. Tibetans (4.6 million in 1990) ranked in number as the ninth largestminority group. The Tibet question has attracted wide publicity in the Western media inrecent years. The Chinese government is frequently criticised for political oppression andhuman rights violation in Tibet, particularly in three population-related areas: genocide,forced birth control programmes and population transfer. Surprisingly, internationaldemographic circles show little interest in these controversies. This paper aims tore-examine the myths and facts about the Tibetan population in China, in an attempt toachieve a better understanding of the Tibet question as a whole.
This paper is organised roughly into four parts: introduction, including the de� nitionof Tibet, total Tibetan population in China, an examination of the `genocide’ myth, and areview of family planning programmes and population transfer in Tibetan inhabited areas.Government data used in this paper come primarily from various publications of the 1990National Census results. Information compiled by the Tibetan Government-in-Exile (TGIE),is used as a comparison, in addition to some other Western sources.
Analyses show that the `genocide’ myth is not supported by indirect estimates onTibetan mortality, and the `forced birth control’ allegation lacks solid demographicfoundation. On the contrary, Tibetan population has experienced an unprecedented growthsince the early 1960s. Still dominant in the Tibet Autonomous Region (TAR), Tibetans wereonly slightly outnumbered by non-Tibetans in other Tibetan prefectures in neighbouringprovinces. However, the number of non-Tibetans transferring into ethnographic Tibet is onthe rise. Instead of explicit resettlement programmes, the migration � ow is triggeredprimarily by structural transformation and the Government’s modernisation policy. It ishistoric coincidence if the current policies run counter to the interest of Tibetan national-ists. However, under no circumstances should one believe that time is running out for apolitical solution of the Tibet question.
IntroductionChina has long been a multi-ethnic country with Han Chinese being the majority. Accordingthe 1990 national census, minority populations totalled 91.3 million, accounting for 8.1%of the national total of 1,130.5 million. Tibetans (4.6 million) ranked in number as the ninthlargest in 55 minority groups, only behind the Zhuang (15.6 million), the Manchus (9.8million), the Hui (8.6 million), the Miao (7.4 million), the Uygurs (7.2 million), the Yi (6.6million), the Tujia (5.7 million) and the Mongols (4.8 million).1
1 Population Census Of� ce, State Bureau of Statistics (SBS), Zhongguo 1990 nian renkou pucha 10% chouyangziliao (10% Sample Tabulation on the 1990 Population Census of the People’s Republic of China) (ChineseStatistics Press, Beijing, 1991).
1463-1369/00/010011-26 Ó 2000 Taylor & Francis Ltd
12 Yan Hao
The history of Han–Tibetan relations can be traced back as early as the Tang dynasty(618–907). Although there are con� icting arguments over whether Tibet became part ofChina during the Yuan dynasty (1206–1368), it is widely agreed that Tibet enjoyed de factoindependence after the collapse of the Qing dynasty (1644–1911) from 1913 to 1951.2 Thisperiod of uncertainty came to an end in 1951 with the entering (also referred to as`invasion’ ) of the People’s Liberation Army (PLA) into Lhasa under the 17-point Agree-ment reached between the Communist government and the then Tibetan government (May1951). According to the Agreement, Tibet’s old political, economic and social structureremained largely unchanged in subsequent years, when a thoroughgoing socialist transform-ation was carried out in all other parts of China. However, this � rst trial of the `one-country,two systems’ policy proved to be short-lived. In 1959, an armed rebellion (or `nationaluprising’) in Tibet was swiftly and brutally suppressed, causing the Dalai Lama and theTibetan government to � ee into exile in India. In 1965 the TAR was formally established.Like other autonomous regions in China, the TAR was assured by the Constitution of equaland autonomous status. Nevertheless, policy implementation over the following decadeswent through a zigzag course. Tibetans had an especially hard time during the chaotic yearsof the Cultural Revolution (1966–76). In the late 1970s, the Chinese government � nallyshifted its attention from political struggle to economic development by adopting a seriesof market-oriented reforms. Additional af� rmative action measures were introduced in Tibetto promote economic growth, social stability and rapprochement between Hans andTibetans. It is an incontestable fact that, like other parts of China, Tibet has experiencedconsiderable social and economic progress over the last two decades or so.
Ironically, as the government started to introduce a politically more � exible, economi-cally more liberalised, and ethnically more sensitive policy in Tibet, street riots occurredonce again in Lhasa in the late 1980s. In the climax of unrest, martial law was imposed in1989—for the � rst time anywhere in the PRC—to restore peace and order.3 Ethnic unrestin Tibet was given wide publicity in the Western media, and the Tibet question suddenlyassumed far greater signi� cance as a matter of international concern than had been the casebefore.4 Among China’s minority problems, Tibet has proved by far the most controversialinternationally, even to the extent of putting China’s diplomatic and trade relations withforeign countries at risk. So far, no government in the world challenges China’s sovereigntyover Tibet of� cially, but quite a number of Western politicians refer to Tibet as an`occupied’ land, and frequently criticise the Chinese government for political oppressionand human rights violation in Tibet. Among the most serious allegations, three are relatedto population issues: genocide, forced birth control programmes and population transfer.
Compared with its high level of publicity in international politics, Tibet has curiouslydrawn little interest in the broad circle of demographers. From tens of thousands of entriesin the computerised bibliography POPLINE (the October 1996 version), the largest databaseof information on population, family planning and related health issues, one can � nd onlytwo research papers on Tibet written by non-Chinese authors. One of them is in Hungarianand not well known, the other by Goldstein and Beall.5 No prominent journals indemography have paid special attention to the development of the Tibetan population, incontrast to the numerous papers devoted to China as a whole. Chinese demographers, on
2 See Melvyn C. Goldstein, A History of Modern Tibet, 1913–1951: The Demise of the Lamaist State (Universityof California Press, Berkeley, 1989).
3 Quite a number of plausible explanations for the irony can be found in Melvyn C. Goldstein, The Snow Lion andthe Dragon (University of California Press, Berkeley, 1997), pp. 83–7.
4 For an account of the Tibet question as a matter of Chinese national concern since the late nineteenth century,when British and Russian forces tried to in� ltrate the region, see Wang Lixiong, Tianzang: Xizang de Mingyun(Sky Burial: the Fate of Tibet) (Mirror Books, Hong Kong, 1998), pp. 55–106.
5 Melvyn C. Goldstein and Cynthia M. Beall, `China’s Birth Control Policy in the Tibet Autonomous Region’ , AsianSurvey, vol. 31, no. 3 (1991).
Tibetan Population in China 13
the other hand, have given a great deal of attention to Tibetan population issues, but mostof their works are published in Chinese, not easily accessible for academics and the generalpublic overseas. As a result of excessive politicisation and lack of scholarly interest, theinformation about the Tibetan population in China available in the Western media is usuallya mixture of myths, facts and, occasionally, simplistic playing with � gures.
Goldstein was right to point out that the heart of the Tibet question is about `control ofa territory—about who rules, who lives there, and who decides what goes on there’ . Thereis no international consensus about `when a people is justi� ed in demanding self-determi-nation or when a multiethnic state has the right to prevent secession’ . 6 For achieving abetter understanding of the question, the author believes it is helpful to have a second lookat Tibet’s population issues from a different angle. Undoubtedly, the demographic factorhas profound implications to a possible solution of the question in future.
Other than an introduction including a brief discussion of the de� nition of Tibet, thispaper is organised roughly into three parts: total Tibetan population in China, an examin-ation of the `genocide’ myth, and a review of family planning programmes and populationtransfer in Tibetan inhabited areas. Government data used in this paper come primarily fromvarious publications of the 1990 census results. Information compiled by the TibetanGovernment-in-Exile (TGIE), downloaded directly from their of� cial website on theInternet, is used as a comparison, in addition to some other sources provided by Westernauthors. It is worth noticing that, owing to a lack of systematic population statistics andvital records in Tibet, both sides have been making extensive use of estimates to supporttheir arguments.
Geographic location and reference period are as essential as population � gures inconducting demographic analysis. The question raised by Goldstein and Beall in theirpaper: `what and where is Tibet’?7 is clearly a highly relevant one. Although it falls outsidethe scope of this paper, it must be mentioned that TGIE sources consider that the area ofTibet extends well beyond the present TAR, some maps even including the whole ofQinghai Province and its capital Xining. According to TGIE sources, there was, before the`invasion’ , a place `traditionally ’ known as Tibet, which consisted of three `provinces’ ,Amdo, Kham and U-Tsang, and covered an area of 2.5 million square kilometres,corresponding to the geological plateau of Tibet. Amdo is currently split into the provincesof Qinghai and Gansu, and Kham into Sichuan, Gansu and Yunnan. U-Tsang, together withwestern Kham, is referred to as the Tibet Autonomous Region (TAR). The current TARcomprises less than half traditional Tibet.
In several works, Melvyn Goldstein has adopted the terms `political Tibet’ and`ethnographic Tibet’ . The former is equivalent to the area ruled by the Dalai Lamas inmodern times, as well as to the present TAR, while the latter term corresponds to theborderlands now incorporated into other Tibetan autonomous prefectures in neighbouringChinese provinces. Goldstein concluded that most of the ethnic Tibetan areas that are nowoutside the TAR have been under separate administration for centuries.8 The greater Tibetmay be an ideal state of affairs to some Tibetans, but it is disingenuous to discuss regionssuch as Amdo as if they are or were part of Tibet proper. `To lump statistics from otherprovinces with those of the TAR is deceptive and somewhat analogous to reporting onMexico using examples from Mexico’s “lost territories” of Texas and California.’ 9
6 Goldstein, The Snow Lion and the Dragon , pp. ix–x.7 Goldstein and Beall, `China’s Birth Control Policy’ , pp. 285–303.8 According to more detailed information provided by Goldstein, in 1728 three large ethnic Tibetan areas in Kham
were placed by the Qing government under the jurisdiction of Sichuan and three others under the jurisdiction ofYunnan province. Amdo or Kokonor had already been placed under the jurisdiction of Xining in 1724. Goldstein,The Snow Lion and the Dragon, p. 16.
9 Goldstein and Beall, `China’s Birth Control Policy’ , p. 291.
14 Yan Hao
The present author follows Goldstein in equating `political Tibet’ with the TAR.However, unless otherwise indicated, the Tibetan population in China is treated as a whole.
Total Tibetan population in China: Estimates and Census results
To conduct a scienti� c, full census is only possible in a modern society. In China, the � rstnational census was conducted in 1953, followed by three subsequent ones in 1964, 1982and 1990. Over the period, population statistics have become increasingly complete andreliable, thanks to continuous improvements in census methods.
Historical � gures of the Tibetan population in China are not readily available. Inprevious literature, however, there are a number of estimates from different periods.According to two Chinese scholars, Sun Huaiyang and Li Xiru, the Tibetan population wasabout 2.8 million in the 1910s, down from 3.5 million during the mid-Qing period.10 Bell,an English diplomat stationed in Lhasa in the 1930s, assumed the total Tibetan populationwas 4–5 million at that time.11 Nevertheless, most estimates agreed that the Tibetanpopulation was on the decline in the � rst half of the twentieth century. Citing unidenti� edhistorical sources, a TGIE report asserted that the Tibetan population was at least 6 millionat the end of 1949.12 The same source even quoted an of� cial Chinese report in People’sDaily (10 November, 1959) to support the 6-million � gure, in spite of a 10-year differencefrom 1949 to 1959.
According to China’ s State Statistical Bureau, the `TAR’ had 1,273,969 people in November1959. Tibetan areas of Kham then named Xikang by China had 3,381,064 Tibetans. In Qinghaiand other Tibetan areas incorporated into Gansu, Tibetans were reported to number 1,675,534.If the total of these three � gures is taken, the Tibetan population then stood at 6,330,567.
For several reasons, these � gures seemed suspicious. Notably, the TAR did not evenexist in 1959, while Xikang was abolished in 1956. The Chinese government did notpublish annual population statistics at that time, particularly extremely detailed breakdownsby region and ethnicity. Investigation by this author showed the citation above to be afabrication. TGIE sources in the 1990s still claim the total number of Tibetans to be about6 million, and this � gure is quite possible if taken to include all Tibetans worldwide, notjust those in China.
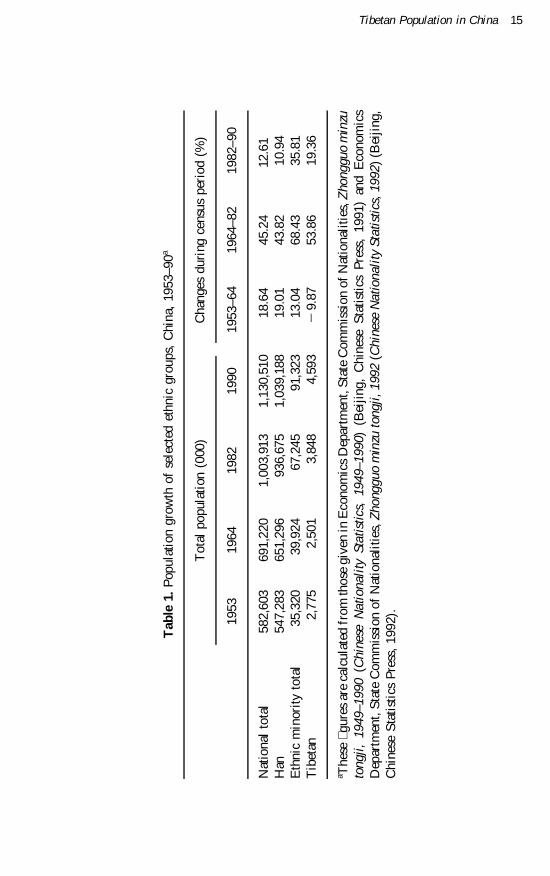
The � gures for the total Tibetan population in China from four censuses are shown inTable 1, in relation to relevant national data. The Tibetan � gures of the � rst three censusesare basically estimates, derived from household registration records and survey results.Inconsistency between these � gures is unavoidable. In comparison, the 1990 � gures aremuch more accurate, because they incorporate data from the � rst full census ever conductedscienti� cally and systematically in the TAR. Given the extremely harsh conditions, therelatively underdeveloped infrastructure and the unique cultural and religious factors in theTAR, conducting a full census is understandably an arduous task. According to theRegional Of� ce of Census, as many as 8,727 interviewers, 1,481 supervisors and 5,707local assistants (Tibetan 93% and non-Tibetan 7%) were involved in the � eldwork. Apartfrom regular household and individual records, the census also collected valuable infor-mation on nuptiality, fertility and mortality. All data-processing work for the TAR wascompleted locally in Lhasa. The double check procedure con� rms that the census results ofthe TAR are quite reliable, with a duplication rate of 0.14 per thousand, a missing rate of
10 Sun Huayang and Li Xiru, `Zhongguo Zangzu renkou de yanbian he xianzhuang ’ (`The Evolution and CurrentSituation of China’s Tibetan Population ’), Zhongguo renkou kexue (Chinese Population Studies), no. 51 (June1995), pp. 35–9.
11 Charles Alfred Bell, Tibet: Past and Present (Oxford University Press, London, 1968), p. 8.12 Of� ce of Tibet, Human Rights, http://www.gn.apc.org/tibetlondon/WhitePaper/white5.html (1996).
Tibetan Population in China 15
Tab
le1.
Pop
ulat
ion
grow
thof
sele
cted
ethn
icgr
oups
,C
hina
,19
53–9
0a
Tot
alpo
pula
tion
(000
)C
hang
esdu
ring
cens
uspe
riod
(%)
1953
1964
1982
1990
1953
–64
1964
–82
1982
–90
Nat
iona
lto
tal
582,
603
691,
220
1,00
3,91
31,
130,
510
18.6
445
.24
12.6
1H
an54
7,28
365
1,29
693
6,67
51,
039,
188
19.0
143
.82
10.9
4E
thni
cm
inor
ityto
tal
35,3
2039
,924
67,2
4591
,323
13.0
468
.43
35.8
1T
ibet
an2,
775
2,50
13,
848
4,59
32
9.87
53.8
619
.36
a The
se�g
ures
are
calc
ulat
edfr
omth
ose
give
nin
Eco
nom
ics
Dep
artm
ent,
Stat
eC
omm
issi
onof
Nat
iona
litie
s,Z
hong
guo
min
zuto
ngji
,19
49–1
990
(Chi
nese
Nat
iona
lity
Stat
isti
cs,
1949
–199
0)(B
eijin
g,C
hine
seSt
atis
tics
Pres
s,19
91)
and
Eco
nom
ics
Dep
artm
ent,
Stat
eC
omm
issi
onof
Nat
iona
litie
s,Z
hong
guo
min
zuto
ngji
,199
2(C
hine
seN
atio
nali
tySt
atis
tics
,199
2)(B
eiji
ng,
Chi
nese
Sta
tist
ics
Pres
s,19
92).
16 Yan Hao
Table 2. Selected demographic indicators of selected ethnic groups, China, 1990a
Infant ChangesEthnic mortality rate Life Proportion Median in womengroup (1/1000) expectancy 0–14 (%) age aged 15–49 (%)
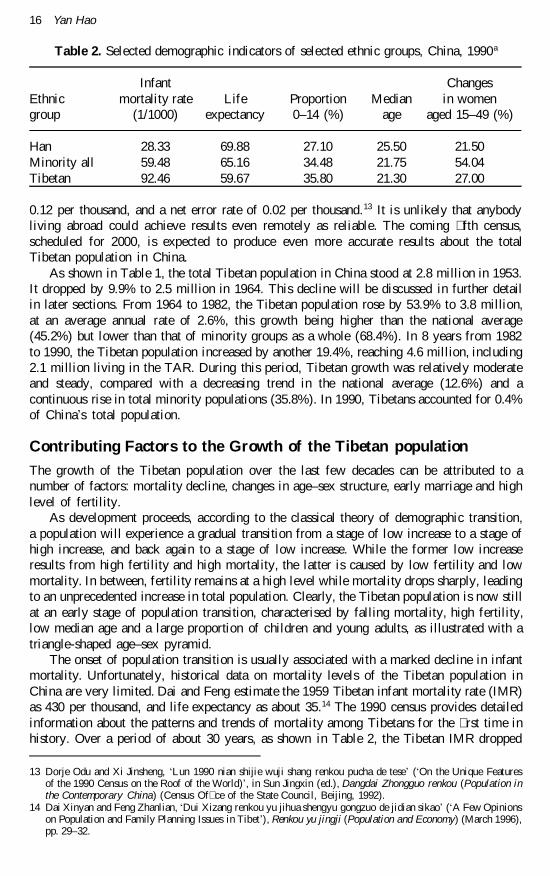
Han 28.33 69.88 27.10 25.50 21.50Minority all 59.48 65.16 34.48 21.75 54.04Tibetan 92.46 59.67 35.80 21.30 27.00
0.12 per thousand, and a net error rate of 0.02 per thousand.13 It is unlikely that anybodyliving abroad could achieve results even remotely as reliable. The coming � fth census,scheduled for 2000, is expected to produce even more accurate results about the totalTibetan population in China.
As shown in Table 1, the total Tibetan population in China stood at 2.8 million in 1953.It dropped by 9.9% to 2.5 million in 1964. This decline will be discussed in further detailin later sections. From 1964 to 1982, the Tibetan population rose by 53.9% to 3.8 million,at an average annual rate of 2.6%, this growth being higher than the national average(45.2%) but lower than that of minority groups as a whole (68.4%). In 8 years from 1982to 1990, the Tibetan population increased by another 19.4%, reaching 4.6 million, including2.1 million living in the TAR. During this period, Tibetan growth was relatively moderateand steady, compared with a decreasing trend in the national average (12.6%) and acontinuous rise in total minority populations (35.8%). In 1990, Tibetans accounted for 0.4%of China’s total population.
Contributing Factors to the Growth of the Tibetan population
The growth of the Tibetan population over the last few decades can be attributed to anumber of factors: mortality decline, changes in age–sex structure, early marriage and highlevel of fertility.
As development proceeds, according to the classical theory of demographic transition,a population will experience a gradual transition from a stage of low increase to a stage ofhigh increase, and back again to a stage of low increase. While the former low increaseresults from high fertility and high mortality, the latter is caused by low fertility and lowmortality. In between, fertility remains at a high level while mortality drops sharply, leadingto an unprecedented increase in total population. Clearly, the Tibetan population is now stillat an early stage of population transition, characterised by falling mortality, high fertility,low median age and a large proportion of children and young adults, as illustrated with atriangle-shaped age–sex pyramid.
The onset of population transition is usually associated with a marked decline in infantmortality. Unfortunately, historical data on mortality levels of the Tibetan population inChina are very limited. Dai and Feng estimate the 1959 Tibetan infant mortality rate (IMR)as 430 per thousand, and life expectancy as about 35.14 The 1990 census provides detailedinformation about the patterns and trends of mortality among Tibetans for the � rst time inhistory. Over a period of about 30 years, as shown in Table 2, the Tibetan IMR dropped
13 Dorje Odu and Xi Jinsheng, `Lun 1990 nian shijie wuji shang renkou pucha de tese’ (`On the Unique Featuresof the 1990 Census on the Roof of the World)’ , in Sun Jingxin (ed.), Dangdai Zhongguo renkou (Population inthe Contemporary China) (Census Of� ce of the State Council, Beijing, 1992).
14 Dai Xinyan and Feng Zhanlian, `Dui Xizang renkou yu jihua shengyu gongzuo de jidian sikao’ (`A Few Opinionson Population and Family Planning Issues in Tibet’), Renkou yu jingji (Population and Economy) (March 1996),pp. 29–32.
Tibetan Population in China 17
from around 400 to 92 per thousand, and life expectancy nearly doubled from 35 to 60. Thatmeans that more Tibetans will survive today, thanks to the government ’s efforts to promotethe people’s health and living standards. However, compared with the similar indicators ofother ethnic groups, there is certainly much room for further improvement in reducingmortality rates among Tibetans.
The age–sex distribution of the Tibetans is relatively even and smooth amongpeople aged 30 and over. Substantial increases are observed in the 20–9 agecohort, indicating that during the immediate post-1959 period the Tibetan populationexperienced a phenomenal baby boom. Since the onset of demographic transitionis still a recent phenomenon, the Tibetan population as a whole is still quite young,with a median age of only 21.3. Well over one-third of Tibetans (35.8%) wereunder 15 years of age. This implies that the growth potential of the Tibetan population willremain high for the foreseeable future. The growth momentum can also be explainedthrough the changes in the total female population aged 15–49 from 1982 to 1990.Were a birth limit imposed on couples in 1990, the population as a whole wouldkeep growing, simply because more and more young adults were entering the reproductiveage.
Considering the fact that marriage in China is almost universal, and the proportion ofex-nuptial births is extremely low, the following discussion focuses mainly on theage at � rst marriage and the level of marital fertility (Table 3). Certainly, there arevariations in patterns of nuptiality and ex-nuptial births by different ethnic groups.According to the 1990 census, the proportion of unmarried women in reproductive ages(15–49) was 28.1% among Tibetans. The proportion of those who had never marriedincreased markedly in the older age groups, from 7.9% in the 50–4 group to 10.6% in group60 and over. This phenomenon can be attributed to the unique social structure and religioustradition of the Tibetans in the pre-1959 period. On the one hand, the custom of polygamywas once practised in some Tibetan tribes. On the other hand, a large number of adultmales, sometimes up to one-third of the total local adult males, practised celibacy andstayed in monasteries all their lives. For example, there were still 114,100 monks as lateas in 1958, accounting for 9.5% of the total population in Tibet.15 According to a 1949record of Tibetan regions in the neighbouring Qinghai Province, there were 5,900 monksin a total population of 34,350 in Yushu County, and 7,890 monks in a total population of21,000 in Nangqen County.16 In 1994 the number of monks in the TAR was 42,500, or 2%of the total population,17 still remarkably high by international standards. Nevertheless, asMackerras points out, unattached women did not necessarily mean childless women intraditional Tibet.18
The age at � rst marriage has a considerable effect on fertility levels. Early marriagegenerally leads to early childbearing, not only prolonging women’s reproductive lives butalso reducing the mean generation length of the population as a whole. Within a limitedtime span, the more generations, the more women in childbearing age, the more births, andthe higher the fertility. In traditional China, early marriage was a common practice. Latemarriage has long been one of the major objectives of China’s family planning programmes.The minimum legal age of marriage for women was set at 20 by the 1980 Marriage Law.In some pastoral regions of the TAR and Qinghai, the minimum age is only 18 for women
15 Dai and Feng, `Dui Xizang renkou’ .16 Yang Fengchuan and Gong Qide, `Qinghai gaoyuan Zangzu renkou de tedian’ (`The Demographic Characteristics
of the Tibetans on the Qinghai Plateau’ ), in Sun Jingxin (ed.), Dangdai Zhongguo renkou , pp. 805–19.17 Wang, Tianzang, p. 334.18 Colin Mackerras, China’s Minorities: Integration and Modernization in the Twentieth Century (Oxford University
Press, Hong Kong, 1994), p. 129.
National
Tibet
250
200
150
100
50
0
per
thou
sand
15–19 20–24 25–29 30–34 35–39 40–44 45–49
Age group
18 Yan Hao
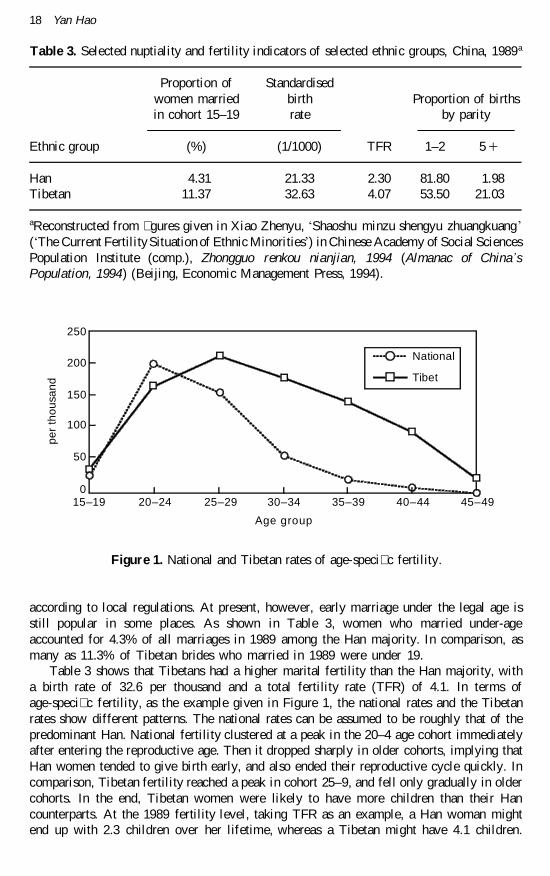
Table 3. Selected nuptiality and fertility indicators of selected ethnic groups, China, 1989a
Proportion of Standardisedwomen married birth Proportion of birthsin cohort 15–19 rate by parity
Ethnic group (%) (1/1000) TFR 1–2 5 1
Han 4.31 21.33 2.30 81.80 1.98Tibetan 11.37 32.63 4.07 53.50 21.03
aReconstructed from � gures given in Xiao Zhenyu, `Shaoshu minzu shengyu zhuangkuang ’
(`The Current FertilitySituation of Ethnic Minorities’ ) in Chinese Academy of Social SciencesPopulation Institute (comp.), Zhongguo renkou nianjian, 1994 (Almanac of China’sPopulation, 1994) (Beijing, Economic Management Press, 1994).
Figure 1. National and Tibetan rates of age-speci� c fertility.
according to local regulations. At present, however, early marriage under the legal age isstill popular in some places. As shown in Table 3, women who married under-ageaccounted for 4.3% of all marriages in 1989 among the Han majority. In comparison, asmany as 11.3% of Tibetan brides who married in 1989 were under 19.
Table 3 shows that Tibetans had a higher marital fertility than the Han majority, witha birth rate of 32.6 per thousand and a total fertility rate (TFR) of 4.1. In terms ofage-speci� c fertility, as the example given in Figure 1, the national rates and the Tibetanrates show different patterns. The national rates can be assumed to be roughly that of thepredominant Han. National fertility clustered at a peak in the 20–4 age cohort immediatelyafter entering the reproductive age. Then it dropped sharply in older cohorts, implying thatHan women tended to give birth early, and also ended their reproductive cycle quickly. Incomparison, Tibetan fertility reached a peak in cohort 25–9, and fell only gradually in oldercohorts. In the end, Tibetan women were likely to have more children than their Hancounterparts. At the 1989 fertility level, taking TFR as an example, a Han woman mightend up with 2.3 children over her lifetime, whereas a Tibetan might have 4.1 children.
Tibetan Population in China 19
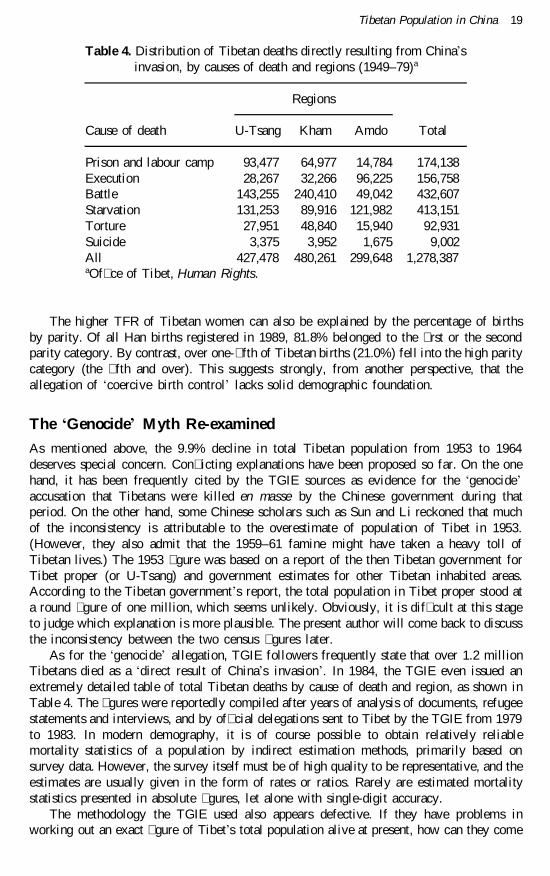
Table 4. Distribution of Tibetan deaths directly resulting from China’sinvasion, by causes of death and regions (1949–79)a
Regions
Cause of death U-Tsang Kham Amdo Total
Prison and labour camp 93,477 64,977 14,784 174,138Execution 28,267 32,266 96,225 156,758Battle 143,255 240,410 49,042 432,607Starvation 131,253 89,916 121,982 413,151Torture 27,951 48,840 15,940 92,931Suicide 3,375 3,952 1,675 9,002All 427,478 480,261 299,648 1,278,387aOf� ce of Tibet, Human Rights.
The higher TFR of Tibetan women can also be explained by the percentage of birthsby parity. Of all Han births registered in 1989, 81.8% belonged to the � rst or the secondparity category. By contrast, over one-� fth of Tibetan births (21.0%) fell into the high paritycategory (the � fth and over). This suggests strongly, from another perspective, that theallegation of `coercive birth control’ lacks solid demographic foundation.
The `Genocide’ Myth Re-examined
As mentioned above, the 9.9% decline in total Tibetan population from 1953 to 1964deserves special concern. Con� icting explanations have been proposed so far. On the onehand, it has been frequently cited by the TGIE sources as evidence for the `genocide’
accusation that Tibetans were killed en masse by the Chinese government during thatperiod. On the other hand, some Chinese scholars such as Sun and Li reckoned that muchof the inconsistency is attributable to the overestimate of population of Tibet in 1953.(However, they also admit that the 1959–61 famine might have taken a heavy toll ofTibetan lives.) The 1953 � gure was based on a report of the then Tibetan government forTibet proper (or U-Tsang) and government estimates for other Tibetan inhabited areas.According to the Tibetan government’s report, the total population in Tibet proper stood ata round � gure of one million, which seems unlikely. Obviously, it is dif� cult at this stageto judge which explanation is more plausible. The present author will come back to discussthe inconsistency between the two census � gures later.
As for the `genocide’ allegation, TGIE followers frequently state that over 1.2 millionTibetans died as a `direct result of China’s invasion’ . In 1984, the TGIE even issued anextremely detailed table of total Tibetan deaths by cause of death and region, as shown inTable 4. The � gures were reportedly compiled after years of analysis of documents, refugeestatements and interviews, and by of� cial delegations sent to Tibet by the TGIE from 1979to 1983. In modern demography, it is of course possible to obtain relatively reliablemortality statistics of a population by indirect estimation methods, primarily based onsurvey data. However, the survey itself must be of high quality to be representative, and theestimates are usually given in the form of rates or ratios. Rarely are estimated mortalitystatistics presented in absolute � gures, let alone with single-digit accuracy.
The methodology the TGIE used also appears defective. If they have problems inworking out an exact � gure of Tibet’s total population alive at present, how can they come
20 Yan Hao
to these exact death � gures by analysing documents? When they have a problem in clearlyde� ning the boundary of the greater Tibet as well as its provinces, how can they breakdown the � gures by regions? Knowledge of statistics tells us that random sampling isnecessary for acquiring reliable data in any surveys. Those conducted entirely amongpolitical refugees could produce anything but objective and unbiased results. From 1979 to1983, the TGIE did send three small fact-� nding delegations to China. By bus and air, thedelegates, mainly TGIE of� cials and the Dalai Lama’s family members, visited a numberof cities and major religious sites in the TAR, Qinghai and Sichuan. The delegatesreportedly witnessed massive poverty among the Tibetan population and irretrievabledestruction of Tibetan culture.19 However, these people are not scholars, and their activitieswere under constant surveillance of Chinese of� cials. Private interviews with locals werealmost impossible, let alone inquiries about death records. Here, another Chinese source iscited by Samdup as proof of the table’s validity that `some 87,000 Tibetans were killed inCentral Tibet, in the Lhasa Uprising of March 1959’ . Again, the present author checked theoriginal source, a speech by the late Premier Zhou Enlai in 1957 on China’s nationalitypolicies,20 � rst published in Beijing Review in 1980. The article is not long, 14 pages withphotos and graphs. The problem is that one can hardly � nd in it any clues implying that87,000 Tibetans were killed. On the contrary, Zhou was talking about the importance of� ghting against Han chauvinism! If these TGIE sources are not reluctant to fabricateChinese sources in open publications, how can they expect people to believe in theircitations of so-called Chinese secret internal documents and speeches that are neveravailable in originals to independent researchers?21
Table 4 indicates that most deaths were caused by battle (33.8%) and starvation(32.3%). A close look is helpful to see where, when and on whom the disaster fell.
Deaths Caused by Battle
According to both Feigon and Smith, no major battles were fought in the early 1950s whenthe PLA marched into Tibet after they seized Qinghai from Muslim warlords and liberatedXikang (eastern Kham) peacefully. Even in the decisive Qamdo battle, the main Tibetanforce surrendered without even a skirmish, leaving only 150 Tibetans killed or wounded.Khampas (native Tibetans in Kham) were even blamed for collaborating with the PLA.22
Armed revolts broke out only in 1956 in eastern Kham (Sichuan) and Amdo (Qinghai)when the government tried to impose socialist transformation policies there similar to thoseof other provinces. Rebellion in these regions was later suppressed mercilessly by the PLA.Most massacres reportedly took place in Qinghai in 1958.23 Curiously, Table 4 shows muchfewer deaths in Qinghai (Amdo). The Tibetan resistance reached a climax in Tibet properin 1959. However, the uprising was con� ned mainly to Lhasa, and the PLA crackdown wascompleted in just a couple of days. Organised resistance continued in other places for only
19 Avedon, John F., Tibet Today (Wisdom, London, 1988).20 Zhou, Enlai, `Some Questions on Policy towards Nationalities’ , Beijing Review, vol. 34, no. 9 (1980), pp. 14–22;
vol. 34, no. 10 (1980), pp. 18–23.21 See also the footnote in Warren Smith, Tibetan Nation: A History of Tibetan Nationalism and Sino-Tibetan
Relations (Westview Press, Boulder, 1996), p. 451, which claims that the � gures reportedly come from a secret1960 PLA document captured by the Tibetan Resistance in 1966, and were published � rst by a Tibetan Buddhistorganisation in India in 1990. It is said that 87,000 enemies were eliminated in the original document, and Smithbelieves that `eliminated’ does not necessarily mean killed. However, it is hard to understand why it took 6 yearsfor the PLA document to be captured, and 30 years for it to be published. It is also highly unlikely that a resistanceforce could ever exist in Tibet as late as in 1966.
22 Lee Feigon, Demystifying Tibet (Ivan R. Dee, Chicago, 1996), p. 144.23 Tsering Dawa, `Colonisation in Tibet and its Threat to Tibetans’ Survival ’ , China Spring, no. 173 (February 1998),
pp. 63–88.
Tibetan Population in China 21
another month. The TGIE estimates of the number killed in the revolt vary from 5,000 to10,000 in a 1976 statement,24 substantially fewer than the later estimate of 143,000 forU-Tsang (Tibet proper).
Deaths Caused by Starvation
It is well documented that China suffered from a nationwide famine during 1959–61 owingto crop failure and the Government ’s mismanagement of the economy. Some Tibetaninhabited regions, such as the farming areas in Qinghai (Amdo) and Sichuan (easternKham), were also affected. Many attempts have been made so far to estimate the actualnumber of excess deaths25 in China as a whole, based on a variety of approaches andassumptions. Estimated � gures range from 16.5 million26 to 29.5 million.27 From data from18 provinces, Peng Xizhe, a leading Chinese demographer, came to an estimate of 23million.28 That means, excess deaths accounted for about 1.2% of China’s total populationof 662 million each year during that period. If, according to Table 4, 413,000 Tibetans diedof starvation during the period, or about 138,000 each year, in a total population of about3 million in 1960 (2.97 million by 1.0% annual increase or 3.08 million by 2.0% since1953), the excess deaths should account for about 4.6% of the total population each year.This is nearly four times as high as the national average, quite unlikely because of twounique factors in Tibetan inhabited regions. First, over half of the Tibetan population ismade up of self-suf� cient nomads to this day, and their livelihood seldom depends onexternal food supply. Second, in the farming areas of Tibet proper, the land of formeraristocrat landowners had been distributed to individual farmers just after the 1959 LandReform. Policies that became routine in other provinces, such as the commune system, thecentral grain purchase and supply system, and the agricultural tax system, were notintroduced to the TAR until 1965. Farmers, working on their own land for the � rst time,were enthusiastic to raise output, and there were no reports of any crop failures. However,according to Smith, starvation conditions prevailed, not because harvests were poor, butbecause `virtually all’ agricultural and pastoral production was con� scated and trucked toother provinces to help alleviate famine.29 These claims come entirely from refugees’personal interviews, and cannot be veri� ed by any other sources.30 In fact, the governmenthad just exempted Tibetan farmers from all agricultural taxes, so it is hardly likely that theywould wish to institute a policy of con� scating `virtually all’ agricultural products fromthem. Even if there was such a policy, from where could the government mobilise enoughmanpower to enforce it in such a vast and inaccessible area? What was the point of loadingbarley on small trucks and sending them along the zigzag road 3,000 metres above sea levelto feed the numerous and rice-eating Sichuanese a thousand miles away, especially sincethe Soviet Union had cut off oil supplies, so that fuel was seriously short in China at thetime?
Regardless of the absolute death � gures, it is an educated guess that the majority of theTibetans who died in battle were males in their prime ages from Sichuan (eastern Kham)
24 Smith, Tibetan Nation, p. 451.25 Deaths exceeding those that would have occurred had previous conditions prevailed.26 Ansley J. Coale, `Population Trends, Population Policy, and Population Studies in China’ , Population and
Development Review, vol. 7, no. 1 (1981), pp. 503–31.27 Basil Ashton, `Famine in China, 1958–1961 ’ , Population and Development Review, vol. 10, no. 4 (1984).28 Peng Xizhe, `Demographic Consequences of the Great Leap Forward in China’s Provinces ’ , Population and
Development Review, vol. 13, no. 4 (1987), pp. 639–70.29 Smith, Tibetan Nation, p. 487.30 According to Goldstein and Beall (`China’s Birth Control Policy’ , p. 301), the accounts offered by refugees are
likely to be exaggerations or fabrications told to foreigners to garner sympathy and support for the `Tibetan cause ’ .
22 Yan Hao
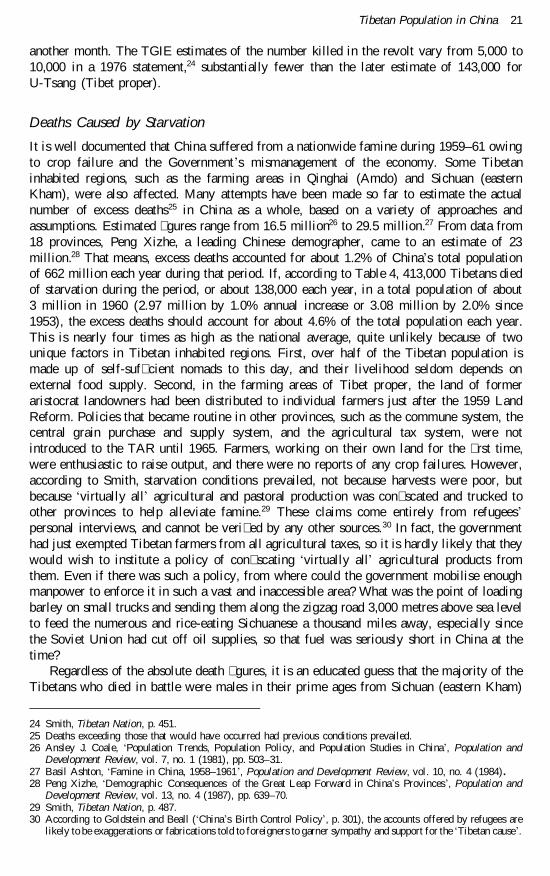
Table 5. Estimates of total Tibetan population, with annual growth rate at 1.5%, 1953–64
Total Tibetan Total Tibetanpopulation with 1953 population with 1964 Difference between
Year � gure as benchmark (`000) � gure as benchmark (`000) estimates (`000)
1953 2,775 2,118 6571954 2,817 2,150 6661955 2,859 2,183 6761956 2,902 2,216 6861957 2,945 2,250 6951958 2,989 2,284 7051959 3,034 2,319 7151960 3,080 2,354 7261961 3,126 2,390 7361962 3,173 2,427 7461963 3,221 2,463 7571964 3,269 2,501 768
and Qinghai (Amdo). Those who were executed, or died in prison or of torture werepredominantly male as well. Deaths caused by starvation were not considered age–sexspeci� c, but the very young and very old are more likely to be affected. Moreover, themajority of the deaths occurred in a short period from 1957 (when military crackdownswere � rst reported) to 1961 (when the country recovered from the famine).
Estimating the Missing Tibetans: Two Exercises
We come now to the central question: how many Tibetans died as a direct result of Chinese`invasion’? It might be helpful in the section to estimate the missing Tibetans from thecensus data with two simple exercises.
The � rst possible exercise involves an assumed growth rate. As mentioned in previoussections, the total Tibetan population in China declined by 9.9% from 2.8 million in 1953to 2.5 million in 1964. Also as mentioned, both � gures are estimates. Regardless of theirreliability, both � gures can be taken here as benchmarks for the calculation. In between, itis necessary to � nd a reasonable growth rate, assuming that the `genocide’ never took place.
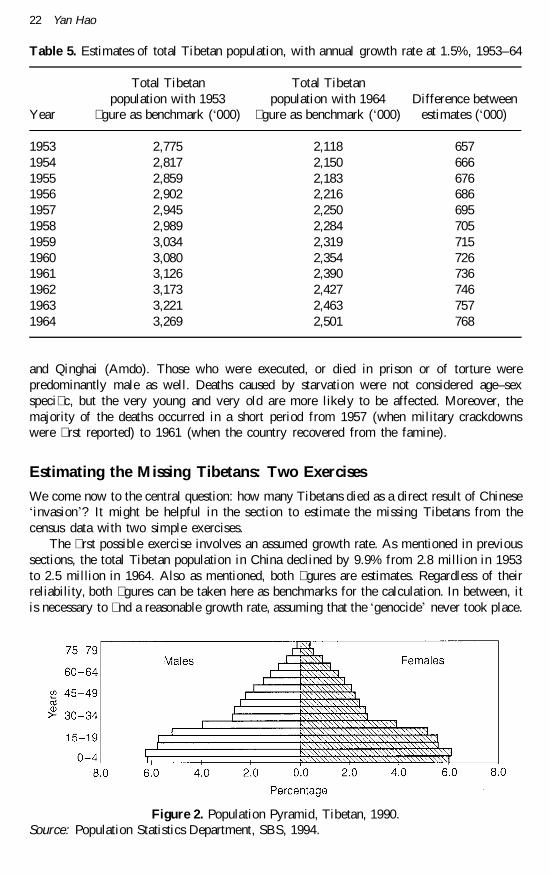
Figure 2. Population Pyramid, Tibetan, 1990.Source: Population Statistics Department, SBS, 1994.
Tibetan Population in China 23
It is known from previous discussions that, like all populations in the pre-transitional stage,the Tibetan grew very slowly, with high fertility usually offset by similarly high mortality.This situation remained little changed until the late 1950s. It is highly unlikely that theannual rate of growth could ever exceed the 1.0% mark. Since the early 1960s, as impliedin Figure 2, the Tibetan population has experienced an unprecedented and continuousperiod of high growth, with an annual rate at about 2.6%. Taking 1.5% as a syntheticaverage annual growth rate for the period 1953–64, the present author comes to the resultspresented in Table 5. As can be seen, the total Tibetan population would have been 3.3million, were the 1953 � gure taken as benchmark. It results in a total of 768,000 Tibetansmissing from the 1964 census � gure. On the other hand, with the 1964 � gure as benchmark,total Tibetan population would have been 2.1 million in 1953. It implies that the 1953 � guremight have been in� ated by a total of 657,000. Since both 1953 � gure and 1964 � gure arethemselves unreliable, it is hard to make any reasonable interpretation of the estimates inTable 5. Moreover, the assumption of a 1.5% growth rate during the period in question isindeed arbitrary and, not the least, bold. The present author believes, therefore, suchestimates should not be given excessive attention as solid demographic evidence in supportof whatever political arguments. Otherwise, it is no different from meaningless play with� gures.
The second possible exercise makes use of the standardisation of age–sex structures. Asknown in demographic studies, the age–sex structure of a population, normally illustratedin a population pyramid, provides important information about its history. If a considerablenumber of people are missing (owing to death or migration) from certain age–sex cohortsduring a short period in the past, visible shrinkage can easily be detected from the pyramid.No matter how arguable is the reliability of the death � gures compiled by the TGIE, theycan still be used as benchmarks to test whether the deaths have left any physical effect onthe Tibetan population pyramid of 1990. A brief glimpse of the pyramid given in Figure2 tells us that the age–sex distribution of the Tibetan population aged 30 and over (thoseborn before 1960) is quite smooth, without detectable shrinkage in any particular age–sexcohorts. This approximately standard pyramid is typical for a pre-transitional population.The pre-1960 distribution pattern can be interpreted in three probable ways: either therewere no massive deaths or migration among a speci� c cohort, or the deaths occurred onlyin older age groups who would have died out anyhow during the period 1960–90, or thedeaths spread evenly across all age and sex cohorts. From previous discussions, the presentauthor believes that most deaths occurred in a short period from 1957 to 1961. He alsoassumes that the young males constitute a great majority of all deaths. The effect ofmigration will be discussed later. Apparently, the � rst two interpretations of the pyramid � tthese assumptions poorly. The third one sounds quite plausible according to the starvationtheory, in which people of all cohorts are likely to be affected. However, a careful look atthe pyramid reveals the existence of an imbalance in sex distribution in women’s favour,particularly in certain advanced age groups.31 It might hint that, according to the previousassumption, an unidenti� ed number of Tibetan adult males of the pre-1960 period aremissing from the 1990 census. The similar pattern of lower sex ratios in older age groupscan also be detected in the 1982 census data of Tibetans in the TAR (Appendix 1).
By adjusting the sex ratio of the Tibetans aged 30 and over in 1990 (i.e. those bornbefore 1960) to the national average, the present author has tried to arrive at a syntheticnumber of Tibetan adult males who would be alive in 1990. The difference between the
31 A TGIE source also suggests that the high sex ratio in Eastern and North-eastern Tibet might re� ect the massiveextent of the � ghting and casualties in these areas. Jamyang Norbu, `The Tibetan Resistance Movement and theRole of the C.I.A.’ , in Robert Barnett (ed.), Resistance and Reform in Tibet (Hurst, London, 1994), p. 189.
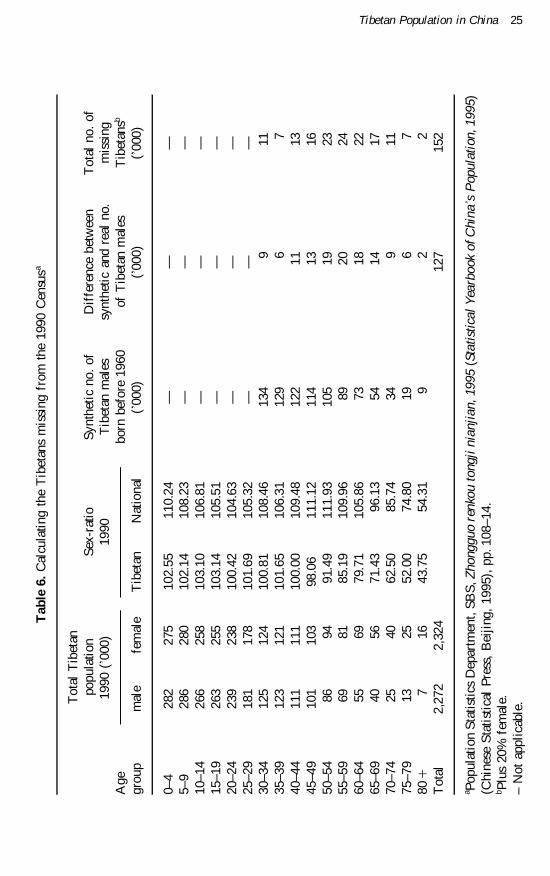
24 Yan Hao
synthetic and the real � gures is considered the number of missing Tibetans, 127,000 inTable 6. A bulge (56.4%) is observed in cohorts 50–64, or cohorts 20–34 in 1960, quiteagreeing with the present author’s assumption that the missing Tibetans were more likelyto be males in their prime years. By adding another 20% as missing females to males ineach cohort, the present author comes to a total of 152,000 Tibetans missing from the 1990census.
As in the � rst exercise, the underlying assumptions play a decisive role. The assump-tions used for the above calculation are far from rigorous or scienti� c, but they lead not tominimising but overestimating the missing Tibetans by at least three factors. First, the sexratio of the Tibetans is not necessarily identical to the national average. Traditionally, thesex ratio among Tibetans was much lower than the rest of China.32 As we can see fromTable 6, the 1990 sex ratio of those under 30 (born after 1960, and, hence, less likely tobe affected by battles and the famine) was consistently lower and looked more natural thanthe national average in every age cohort. It is doubtful that the 1990 pattern wassubstantially different from that 30 years earlier. Anyhow, son preference is not prominentin the Tibetan culture. Applying high national ratios to standardise the age–sex structure ofthe Tibetans might in� ate the number of the males. Second, there is also an apparentdifference in mortality patterns between the Tibetan of the 1960s and the national averageof the 1990s. Over the last three decades, the life expectancy of the Tibetans hasincreased by one-third from below 40 to nearly 60. Meanwhile, the national average alreadyreached 69 in 1990. Transplanting the national pattern directly to the Tibetans mightgenerate more Tibetans still alive in 1990 than the reality. Third, the assumption thatwomen make up 20% of the missing � gures is relatively arbitrary. The current method isused simply because necessary and reliable Tibetan statistics of previous periods are notavailable.
Still there are two additional points that should be raised about the missing Tibetansreached above. First, the missing � gure does not necessarily mean the death � gure.Migration is another cause of people missing from the census data. It is well documentedthat, in the aftermath of the 1959 crackdown, tens of thousands of Tibetans followedthe Dalai Lama into exile. Migration, or more precisely emigration here, is a highlyselective process. Regardless of their social and economic status, the majority ofrefugees were undoubtedly young males. The massive exodus of Tibetans certainlyis an important contributing factor to the missing � gures of 1990. Chinese demographersestimate that as many as 90,000 Tibetans � ed into exile at that time.33 Then, thereseem to be only around 60,000 missing Tibetans left in the above quite boldestimate.
Second, it is dif� cult, through comparison between age–sex cohorts, to detect the effectof factors that may in� uence all cohorts relatively evenly and simultaneously, such asfamine and epidemic diseases. The missing � gures above give us no information about thedeaths caused by starvation during the period 1959–61 among the Tibetan. Apparently,Tibetans were not entirely immune from the nationwide famine. The question is to whatextent? As discussed above, refugee reports of massive deaths are largely one-sided storiesthat cannot be independently veri� ed. It is doubtful whether the excess death rate wasalmost four times as high as the national average. Maybe a rough idea can be obtained fromanother angle. It is well understood in history that, during periods of natural disaster andsocial chaos, the fertility level of a population will fall drastically. For example, China’s
32 Mackerras, China’ s Minorities, p. 133.33 Sun and Li, `Zhongguo Zangzu renkou de yanbian he xianzhuang ’ , p. 36.
Tibetan Population in China 25
Tab
le6.
Cal
cula
ting
the
Tib
etan
sm
issi
ngfr
omth
e19
90C
ensu
sa
Tot
alT
ibet
anpo
pula
tion
Sex-
ratio
Synt
heti
cno
.of
Dif
fere
nce
betw
een
Tot
alno
.of
1990
(’00
0)19
90T
ibet
anm
ales
synt
hetic
and
real
no.
mis
sing
Age
born
befo
re19
60of
Tib
etan
mal
esT
ibet
ansb
grou
pm
ale
fem
ale
Tib
etan
Nat
iona
l(’
000)
(’00
0)(’
000)
0–4
282
275
102.
5511
0.24
——
—5–
928
628
010
2.14
108.
23—
——
10–1
426
625
810
3.10
106.
81—
——
15–1
926
325
510
3.14
105.
51—
——
20–2
423
923
810
0.42
104.
63—
——
25–2
918
117
810
1.69
105.
32—
——
30–3
412
512
410
0.81
108.
4613
49
1135
–39
123
121
101.
6510
6.31
129
67
40–4
411
111
110
0.00
109.
4812
211
1345
–49
101
103
98.0
611
1.12
114
1316
50–5
486
9491
.49
111.
9310
519
2355
–59
6981
85.1
910
9.96
8920
2460
–64
5569
79.7
110
5.86
7318
2265
–69
4056
71.4
396
.13
5414
1770
–74
2540
62.5
085
.74
349
1175
–79
1325
52.0
074
.80
196
780
17
1643
.75
54.3
19
22
Tot
al2,
272
2,32
412
715
2
a Pop
ulat
ion
Stat
istic
sD
epar
tmen
t,SB
S,Z
hong
guo
renk
outo
ngji
nian
jian
,199
5(S
tati
stic
alY
earb
ook
ofC
hina
’sP
opul
atio
n,19
95)
(Chi
nese
Sta
tist
ical
Pres
s,B
eiji
ng,
1995
),pp
.108
–14.
b Plu
s20
%fe
mal
e.–
Not
appl
icab
le.
26 Yan Hao
birth rate dropped by 38.4% from 29.2 per thousand in 1958 to 18.0 per thousand in 1961.The 1990 census data show that the number of Han Chinese born in 1961 (10.6 million)was substantially smaller than of those born in the pre-famine year of 1958 (17.8 million),or a decrease of 40%.34 Although the Tibetan birth rate during the same period isunavailable, the census data prove that the decrease in Tibetan births, down by 11.5% from51,373 to 45,479, is about 25% of that of the Hans. While the sudden fertility declineamong the Hans can be attributed solely to famine, that among Tibetans was primarily aconsequence of the prevailing social upheaval caused by rebellions and their suppression.The famine played a lesser role in causing Tibetan deaths. Taking the national excess deathrate (1.2%) as a parameter, the Tibetan rate is assumed to be at 0.3% (25% of the nationalrate). Allowing that the total Tibetan population stood at 3 million at that time, it comes toan estimate of about 9,000 excess deaths per year, or less than 30,000 during the entirefamine period.
Targeting different periods with different methods, the two above exercises result inquite different estimates, which are not comparable with each other. Yet they provide adifferent angle to re-examine the `genocide’ myth. And they both lead to the clearconclusion that the death � gures provided by the TGIE are exaggerations not sustained bythe evidence.
Family Planning Programmes in the TAR and Other Ethnic TibetanRegions
China’s birth control policy is another frequent target of criticism from the TGIE sourcesand the Western media.35 For example, the TGIE stated in an information bulletin that theferocity with which Tibetan women and even the young girls are subjected to forcedsterilisation and compulsory abortions leaves us with no doubt as to the motives of theChinese government: to slowly annihilate the Tibetan race’ .36 A special report on Tibetanwomen stated that `the {one-child}policy implemented in China is applied in Tibet as well.Young women with one or no children are routinely sterilised. Vasectomies are forced onTibetan men. No women under 22 years of age are allowed to have children’ .37 China’sbirth control policy has long been a controversial topic, both at home and abroad. Thatcoercive measures have been employed in policy implementation is a fact widely reported.38
Therefore, governments have tried in recent years to minimise the use of coercion bychanging workstyle and providing better service in family planning programmes.
In order to achieve economically, socially and ecologically balanced and sustainabledevelopment, every country has the right to formulate its own population policy compatiblewith its domestic conditions. China is now experiencing a typical phase of populationexpansion. Over the last four decades, the total population doubled from 587.9 million in1953 to 1,219.3 million in 1995. Since the founding of the People’s Republic in 1949, thegovernment has adopted a series of policies to improve people’s living standard. However,it took almost 20 years for the government to come to the conclusion that rapid populationgrowth has an adverse effect on the country’s socio-economic development, and drastic
34 Population Statistics Department, SBS, Zhongguo renkou tongji nianjian, 1995 (Statistical Yearbook of China’sPopulation, 1995) (Chinese Statistics Press, Beijing, 1995), pp. 100–85.
35 Samdup; Asia Watch Committee, Human Rights in Tibet (Asia Watch Committee, Washington, 1988); Blake Kerr,`Refugee Accounts of Human Rights Violations in Tibet’ , Tibetan Review, vol. 24, no. 8 (1989), p. 1a.
36 Feigon, Demystifying Tibet, p. 209, citing TGIE, `Present Conditions in Tibet’ , Dharamsala, 1990.37 The Tibetan Government in Exile (TGIE), National Report on Tibetan Women, http://coombs.anu.edu.au/
WWWVLPages/TibPages/Current/TibetWomen-Report.html (1995).38 John Aird, Foreign Assistance to Coercive Family Planning in China (Unpublished personal report, tabled in the
Australian Senate by Senator B. Harradine, May 1992).
Tibetan Population in China 27
birth control measures are needed to apply an early brake on the growth momentum thatmay well last for another century. Since the � rst efforts in the mid-1960s, China’s birthcontrol policy has become increasingly rigid as the core of all population policies andfamily planning programme has been increasingly intensi� ed. As the country embarked ona renewed drive for modernisation in the early 1980s, the government adopted an even moreambitious policy, the one-child policy. Although the degree to which the policy enforce-ment is coercive is arguable, remarkable progress has been achieved in recent years incurtailing rapid population growth. For example, China’s recorded TFR dropped sharplyfrom 5.8 in 1970 to 2.3 in 1989.
China is a vast country with considerable regional disparities in social and economicdevelopment. As Greenhalgh observes, policies drawn up at the national level are notimplemented directly. Rather, each locality is expected to devise its own regulations thataccord with central policy but also conform to local conditions. This is also the case withthe population policy.39 Together with the environment protection policy, the birth controlpolicy is given top priority on government agenda in China. Unlike the former, however,the one-child policy has never been translated into a law, and remains largely a nationalguideline to date. It is the local governments, primarily the provincial governments, that areresponsible for working out concrete birth control regulations, including target population,conditions for having additional children, incentives and penalties. Therefore, regulationscan differ substantially from time to time, from place to place, and from one segment ofthe population to another.
Although all Chinese citizens are subject to birth control regulations, it does not followthat every couple must meet the one-child requirement under all circumstances. Accordingto Greenhalgh’s analysis on provincial birth planning regulations, there are two basicprinciples for allowing couples to have an additional child: to preserve a minimumpatrilineal family; and to reduce gross inequalities by giving special consideration tounderprivileged areas and groups. The former principle tries to ensure that each couple canend up with at least one son. The latter principle applies mainly to people who work inhazardous occupations, who live in poor and remote regions, and who belong to minoritynationalities. The last two categories are especially relevant to discussions in this paper.
Couples of ethnic background commonly can have one or two more children than theirHan Chinese counterparts, depending on their ethnicity, occupation and the place ofresidence. In high density provinces, minority couples are allowed to have two children. Inprovinces where population density is low or the minority proportion in local population ishigh, minority couples can have up to three children. In Tibet, having up to four childrenper family is allowed.40 In terms of occupation, public servants, workers in state-ownedfactories and military personnel are generally required to stick to the one-child limit.
Even in minority regions, programmes target Han residents much earlier than non-Hans.There are also marked differences in the number of children allowed. In Tibet, familyplanning programmes started quite late, and are con� ned at the moment largely togovernment employees in urban areas. So far, as in other Chinese provinces, there appearsto be no intention of replacing the local regulations with formal legislation. Starting from1980, Han public servants are allowed only one child, while, since 1985, Tibetan employeeshave been asked to stop at two. As Goldstein and Beall observe,41 Tibetan city dwellers not
39 Susan Greenhalgh, `Shifts in China’s Population Policy, 1984–86: Views from the Central, Provincial, and LocalLevels’ , Population and Development Review, vol. 12, no. 3 (1986), pp. 491–515.
40 Xiao Zhenyu, Jihua shengyu zhengce ’ (`Family Planning Policies’), in Xu Dixin (ed.), Dangdai Zhongguo derenkou (Contemporary China Series: Population) (Chinese Social Science Press, Beijing, 1988), p. 433.
41 Goldstein and Beall, `China’s Birth Control Policy’ , p. 294.
28 Yan Hao
employed in formal sectors have been subject to the two-child limit only since 1990. ForTibetan farmers, the three-to-four-child limit is simply an indicative plan target developedby the local family planning department. So far, no serious efforts have been made toimplement the above plan targets in rural areas of Tibet. In pastoral areas, usually at analtitude as high as 4,000 metres above sea level, family planning programmes are neithernecessary nor possible. Therefore, judging by the plan targets, birth control policy is quite� exible in Tibet. It is not true, as suggested by the Asia Watch Committee and Kerr,42 thatTibetan common folk are only permitted to have two children and Tibetan of� cials onlyone, and the two-child limit is applied universally in Tibet.
The plan target on paper is one thing, and to translate it into reality is another thing.After more than two decades of the enthusiastic, and sometimes coercive, birth controlcampaign, the result is not as satisfactory as expected. In China, of all women aged 15–64with surviving children, according to the 1990 census, 26.8% had one child, 27.2% had twochildren, and 46.0% had three or more children.43 In Tibet, as mentioned above, familyplanning programmes target mainly government employees. There is no serious attempt toenforce birth control among Tibetan farmers and herdsmen who live in such vast areas withsuch low population density. According to 1993 � gures, of all urban Han women ofchildbearing age, 92.4% were using some kind of contraceptives. Among the Tibetans,the prevalence rate was 50.6% in cities and 18.9% in rural areas. There are no groundsfor the assertion that `young women with one or no children are routinely sterilised’ . Onthe one hand, there is no one-child limit for any Tibetan couples. On the other hand, thecommonest contraceptive used in China by women with one child is the IUD. Sterilisationis only routinely’ suggested to, or forced to a certain extent on, women who alreadyhave two or more children. Over the last two decades, nearly 100 million Chinesewomen have undergone sterilisation as a permanent contraceptive method (40%out of 230 million contraceptive users). It is true that for most of them it is not avoluntary choice. No matter how coercive the programme might be, however, one canhardly � nd even a single case in which a childless woman is sterilised for thepurpose of birth control. From their own on-the-spot surveys in Tibet from 1986to 1988, Goldstein and Beall conclude that the Tibet Autonomous Region isactually experiencing high population growth rather than suffering a policy of coerciveand restrictive birth control that is causing population decline and threatening thecontinued existence of Tibetans’ 44. The present author has come to a similar conclusionfrom census data that the Tibetan population is growing rather than declining. As observedby Wang during his 10 visits to the TAR, rural Tibetan families have four to � ve childrenon average. It is not unusual to � nd quite large families with as many as seven to eightchildren.45
Most claims of `coercive birth control’ in Tibet come from Tibetan refugees inIndia.46 It is common knowledge that migration is a selective process. Politicalrefugees by all accounts are the most politicised segment of migrants. Goldstein arguesthat the accounts offered by refugees are likely to be exaggerations or fabrications togarner sympathy and support. Other factors might also affect scholars like Kerr,such as misinformed opinions and � aws in research methodology. Certainly, individualcases of abuse cannot be dismissed completely, particularly in the neighbouring
42 Kerr, `Refugee Accounts of Human Rights Violations in Tibet’ , p. 43.43 Population Census Of� ce, SBS, Zhongguo 1990 nian renkou pucha 10% chouyang ziliao, pp. 430–60.44 Goldstein and Beall, `China’s Birth Control Policy’ , p. 300.45 Wang, Tianzang, p. 483.46 The Tibetan Government in Exile (TGIE), National Report on Tibetan Women, p. 10
Tibetan Population in China 29
provinces of Qinghai and Sichuan where not only are local regulations different,but policy enforcement is less lenient. That is why TGIE sources claim that birthcontrol policy is enforced more repressively on the population of Kham (Sichuan)and Amdo (Qinghai). Understandably, local of� cials of Sichuan simply cannot afford totake a laissez faire attitude toward birth control in a province where (until ChongqingMunicipality was taken from Sichuan in 1997) the population stood at over 107 million(according to the 1990 census). In the TAR, as a matter of fact, lack of quali� ed personneland � nancial resources hamper the programme efforts. For example, in 1995 there wereonly 43 full-time family planning of� cials and workers in Tibet, with a total annual budgetof RMB¥300,000, including administrative overheads.47 That means, there is only 1.1programme worker for every 10,000 registered city dwellers, and each city woman can onlyreceive service worth less than ¥5 per year. The majority living in rural and pastoral areasare not even taken into account. As a 1995 survey � nds, demands for family planningservice among Tibetan women seem to be rising, particularly in cities and in prosperousfarming areas surrounding Lhasa.48 It is naive to suggest that modern Tibetan women,against the world trend of fertility transition, still want as many children as possible. Farfrom there being coercion, local family planning workers are struggling to meet the growingdemand with the limited resources available. Moreover, birth control policies are nottargeted against Tibetans.
Transfer of Non-Tibetans in the TAR and Other Ethnic TibetanRegions
The Chinese government is frequently criticised for the transfer and settlement of non-Ti-betans into traditionally Tibetan inhabited areas, in an attempt to � nally suppress theTibetan issue by changing the very character and the identity of Tibet and its people’ . Asa result, Tibetans are now outnumbered by the `Chinese’ in their own land.49
Compared with those debatable allegations of `genocide’ and forced birth control’ , thepresent author believes that the suggestion of population transfer of non-Tibetans into thetraditionally Tibetan regions, or ethnographic Tibet, is basically true, considering the factthat before 1949 there were only a handful of Han Chinese traders in political Tibet. It isalso true that this population transfer has been gaining momentum in recent years. This willcertainly affect Tibetan culture. However, the present author sees no deliberate attempt bythe Chinese government against the Tibetans or their culture, but instead views the issue ofpopulation transfer as part of the modernisation process that has been implementedeverywhere in China since the late 1970s. This paper considers the situation as shown inthe 1990 census, taking care to distinguish between political and ethnographic Tibet.
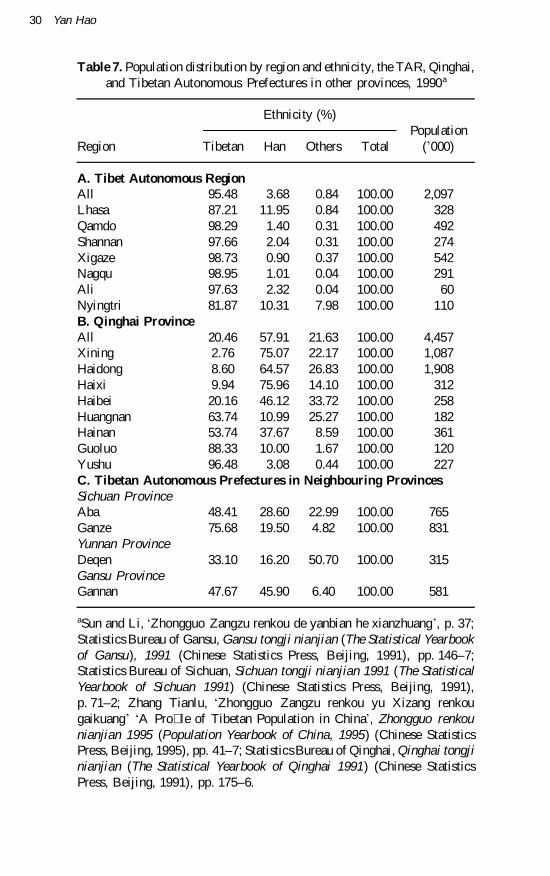
Table 7 presents the population distribution by ethnicity of the TAR and other ethnicTibetan regions in neighbouring provinces. In 1990, of the total population of 2.1 millionin the TAR, 95.5% were ethnic Tibetans. Non-Tibetans accounted for just 4.5%. OnlyLhasa and Nyingtri had a relatively higher proportion of non-Tibetans, 12.8% and 18.3%respectively. Qamdo, Shannan, Xigaze, Nagqu and Ali Prefectures all remained overwhelm-ingly Tibetan, with their shares ranging from 97.3% to 98.9%. What these � gures show isthat in 1990 the great majority of the population in Tibet were Tibetans.
As pointed out previously, the different political and historical experiences of theTibetans outside the TAR require them not to be aggregated with those in the TAR. The
47 Dai and Feng, `Dui Xizang renkou’ , pp. 29–32.48 China Population Information and Research Centre, `Xizang renkou fazhan yu jihua shengyu kaocha baogao ’
(`Report on Tibet Population Development and Family Planning’), Renkou yanjiu, vol. 20, no. 1 (1996), pp. 41–8.49 Samdup, `Chinese Population Threat to Tibetan Identity’ .
30 Yan Hao
Table 7. Population distribution by region and ethnicity, the TAR, Qinghai,and Tibetan Autonomous Prefectures in other provinces, 1990a
Ethnicity (%)Population
Region Tibetan Han Others Total (’000)
A. Tibet Autonomous RegionAll 95.48 3.68 0.84 100.00 2,097Lhasa 87.21 11.95 0.84 100.00 328Qamdo 98.29 1.40 0.31 100.00 492Shannan 97.66 2.04 0.31 100.00 274Xigaze 98.73 0.90 0.37 100.00 542Nagqu 98.95 1.01 0.04 100.00 291Ali 97.63 2.32 0.04 100.00 60Nyingtri 81.87 10.31 7.98 100.00 110B. Qinghai ProvinceAll 20.46 57.91 21.63 100.00 4,457Xining 2.76 75.07 22.17 100.00 1,087Haidong 8.60 64.57 26.83 100.00 1,908Haixi 9.94 75.96 14.10 100.00 312Haibei 20.16 46.12 33.72 100.00 258Huangnan 63.74 10.99 25.27 100.00 182Hainan 53.74 37.67 8.59 100.00 361Guoluo 88.33 10.00 1.67 100.00 120Yushu 96.48 3.08 0.44 100.00 227C. Tibetan Autonomous Prefectures in Neighbouring ProvincesSichuan ProvinceAba 48.41 28.60 22.99 100.00 765Ganze 75.68 19.50 4.82 100.00 831Yunnan ProvinceDeqen 33.10 16.20 50.70 100.00 315Gansu ProvinceGannan 47.67 45.90 6.40 100.00 581
aSun and Li, `Zhongguo Zangzu renkou de yanbian he xianzhuang’ , p. 37;Statistics Bureau of Gansu, Gansu tongji nianjian (The Statistical Yearbookof Gansu), 1991 (Chinese Statistics Press, Beijing, 1991), pp. 146–7;Statistics Bureau of Sichuan, Sichuan tongji nianjian 1991 (The StatisticalYearbook of Sichuan 1991) (Chinese Statistics Press, Beijing, 1991),p. 71–2; Zhang Tianlu, `Zhongguo Zangzu renkou yu Xizang renkougaikuang’ `A Pro� le of Tibetan Population in China’ , Zhongguo renkounianjian 1995 (Population Yearbook of China, 1995) (Chinese StatisticsPress, Beijing, 1995), pp. 41–7; StatisticsBureau of Qinghai, Qinghai tongjinianjian (The Statistical Yearbook of Qinghai 1991) (Chinese StatisticsPress, Beijing, 1991), pp. 175–6.
Tibetan Population in China 31
`outnumber ’ myths, however, were largely based on misuse of `of� cial’ population � guresof other ethnic Tibetan regions. For example, Qinghai has always been claimed by theTGIE as the traditional `Tibetan Province’ of Amdo. Of its total population of 4.5 million,Tibetans accounted for just above one-� fth (20.5%), clearly a minority. However, the TGIEfailed to remind the public of the fact that Xining, the capital city, and its populoussurrounding areas of Haidong Prefecture have never been considered as part of ethno-graphic Tibet in modern times. The dominant groups there are Han Chinese and MuslimHui. In the Qing dynasty, Xining and its suburbs were alternatively controlled by Qinghaiambans and Gansu governors. This region was cut off from Gansu to merge with Qinghaiin 1928 by the Chiang Kai-shek government. Xining was the stronghold of the Muslim Maclan, which ruled the province until 1949. Therefore, it is improper to include Xining andits suburbs in any calculations of total population in ethnographic Tibet. Otherwise, theresult would be distorted, with the inclusion of a total of 3 million non-Tibetans, or 67.2%of Qinghai’s total population.
The other two prefectures within ethnographic Tibet in which the Tibetan share of thepopulation is small are Haibei (Tshochang in Tibetan) and Haixi (Tshonup). Haibei isof� cially known as the Tibetan and Mongolian Autonomous Prefecture, where Tibetanstraditionally coexist with Mongols. Han migrants are concentrated mainly in state farms setup since the 1950s. The apparent presence of Han Chinese in Haixi (76.0%) results fromthe emergence of Golmud as an important transport hub and a centre of the mining industryover the last few decades. In the four other Prefectures of Huangnan (Malho), Hainan(Tsholho), Guoluo (Golog) and Yushu (Jyekundo), local Tibetans have been the majorityover a long period, with their proportion ranging from 53.7% to 96.5%. In all six Tibetanprefectures, Tibetans accounted for 49.2%, slightly less than half of the total population.
Tibetan prefectures in other provinces have a longer history of Han in� uence. In 1990,Tibetan dominance could only be found in Ganze (Kanze). However, Tibetans stillaccounted for a majority of 51.2% when the population of the four Tibetan prefectures wereput together, with Han Chinese accounting for 27.6% and other ethnic groups 21.2%.
The 1990 census has not only produced the most accurate and reliable data on theTibetan population in China so far, but it can be easily tested, since data tapes are nowavailable to all foreign researchers. However, the of� cial Chinese data are consideredmisleading by the TGIE sources: `The Chinese government uses � gures which are designedto downplay the presence of Chinese settlers.’ 50 On the other hand, they admit that their� gures are only estimates, since the TGIE cannot conduct censuses in Tibet themselves.According to TGIE estimates,51 six million Tibetans in the greater Tibet are outnumberedby 7.5 million Chinese. A total of 6.2 million Chinese civilians had been moved into Tibet(the greater Tibet, of course) in addition to 500,000 troops. In the TAR, there were as manyas 1.7 million Chinese in the mid-1980s, including 630,000 in Lhasa area alone, or twiceas high as the of� cial Chinese � gure (328,000) of 1990 for the city as a whole. The of� cial� gure that only 94,500 non-Tibetans living in the TAR was deemed extremely unlikely,because the state sector alone employed 50,000 people.52 `Large number of labourers,including peddlers and hawkers have now � owed into Tibet with a total of at least 100,000in Lhasa alone.’ 53 Since the geographical and time references of the above estimates are notde� ned clearly, it is dif� cult to make a meaningful judgement on data reliability. Whatshould be stressed is that inconsistency does exist in of� cial population � gures. Special
50 Ibid.51 Ibid.52 Dawa, `Colonisation in Tibet’ , p. 64.53 Ngapo Ngawang Jigme, in People’ s Daily, 23 March 1989.
32 Yan Hao
caution is required in interpreting of� cial statistics from different sources. The Ministry ofPublic Security makes annual population estimates based on the household registrationrecords, while the State Bureau of Statistics (SBS) publishes regular estimates based oncensus and survey results. Obviously, overlaps and differences between estimates from thetwo systems are unavoidable. Also worth noticing is that military � gures are not normallyincluded in regional data. As in most countries, regional statistics only refer to residentialpopulation.
The present author is not in any position to verify whether the published data have beenarti� cially manipulated to `downplay ’ the presence of non-Tibetans in ethnographic Tibet.However, it is true that the 1990 census data are inadequate to address the populationtransfer issue for two apparent reasons: the exclusion of newly arrived migrants from thecensus and the latest development of internal migration in China as a whole. As above, theTAR and other Tibetan regions are discussed separately.
The 1990 census was conducted through household interview. Interviewees wereidenti� ed primarily according to household registration records. Non-residents, that is thosewho were not locally registered and had no of� cial residency rights, were also interviewedas long as they had lived in the area longer than one year.54 A uni� ed questionnaire wasused in all provinces except the TAR. Compared with a total of 21 items in the nationalquestionnaire, that used in the TAR consists of only 19 items. Three items relating tomigration were omitted: the number of persons in the household registered locally but whohad been away for more than one year, the respondent ’s residence on 1 July 1985 (� veyears prior to the census date), and reasons for migration if applicable. The reason for thisomission was given as poor record management and the small number of cross-regionalmigration.55 Tsering Dawa cites these omissions as evidence of the `downplay ’ theory. Aclose look is necessary to see if the omission is indeed relevant to discussions in this paper.The � rst item is about the number of registered persons absent from the census date.Obviously, it has little to do with population transfer from outside TAR. The second is notabout the respondent ’s migrant status, since locally registered persons would also have toanswer the same question. For migrants, what is missing might be information about theirorigin. It is certainly relevant to the question of where these people came from, either fromneighbouring prefectures or from other provinces. The third item is also important becauseit would provide information about the motives for migration. As can be seen, the of� cialdata are only adequate for analysis on the ethnic status of locally registered residents andnon-residents who had lived in the TAR for longer than 1 year. Their usefulness ishampered because newly arrived migrants, those who stayed for less than 1 year, wereexcluded from the census. This might greatly underestimate the real number of non-Tibetanmigrants in the TAR. The amendment of the questionnaire has no effect on identifying aperson’s ethnic or migrant status once he was included in the census. However, lack ofdetailed information makes further analysis on the migrants’ origin and motives dif� cult.
In China, a drastic rise in population mobility, or a huge `� oating population’ , hasemerged only since the late 1970s, when a series of market-oriented reforms were adopted.Previously, ordinary people, particularly those living in the countryside, were denied theright to move from one place to another by the rigid household registration system. Thiswas once criticised as a severe violation of human rights, along with limits on emigration.
54 The census results reveal that a total of 44.8 million people fell in this category in 1990, implying a notably widegap between registration data and census data. Shen Tirui, `Zhongguo 1990 renkou pucha de hukou zhengdungongzuo ’ (`The Recti� cation of the Household Registration System in China’ s 1990 Census’), in Sun Jingxin (ed.),Dangdai Zhongguo renkou (Population in the Contemporary China) (Census Of� ce of the State Council, Beijing,1992).
55 Dorje and Xi, `Lun 1990 nian shijie wuji shang’ , pp. 81–2.
Tibetan Population in China 33
Over the last decades, however, the rapid structural shift from a planned to a marketeconomy has considerably eroded many of the barriers on rural-urban and cross-regionalmigration. There are a number of contributing factors:
· rural decollectivisation, which has freed up to 300 million surplus labourers previouslyrestricted to the countryside;
· the rapid expansion of the non-public and informal sectors;· the increasing regional disparity in economic development and living standards; and· the current relaxation of migratory controls.
The `� oating population’ refers to people staying in places where they do not have apermanent local residency status. Its size increased reportedly from 50 million in 1990 tonearly 100 million in 1995.56 A 1996 survey conducted by the Chinese Academy of SocialSciences shows that 80–90% of the cross-regional migrants were rural labourers looking formanual jobs in urban areas. The remainder were skilled craftsmen and traders, oftenself-employed. Most of the migratory � ows were within the migrants’ own provinces(70%), but the out-of-provincial � ows appeared to be gaining popularity in recent years.The economically advanced coastal regions were major recipients of inter-provincialmigration.
At present, migrants are not barred from entering the TAR and other Tibetan regions.If only a small fraction of the `� oating population’ move into ethnographic Tibet, theirpresence is easily visible because of the extremely low population density there. Given theharsh natural conditions on the plateau of Tibet and the fact that farming and pastoral landhas long been allocated to local Tibetan households, urban areas are the only possible placeswhere migrants can � nd a job or start a business. The estimate is quite plausible that, inLhasa areas alone, non-residents might total 100,000.57 That is why the TGIE usuallycomplains that Lhasa is rapidly becoming a `Chinese’ city. Compared with local residents,Tibetan or non-Tibetan, these migrants have no rights that guarantee access to jobs in thepublic sectors or subsidised services such as food supply, housing, education and healthcare, but have to struggle for their own survival. Some run small shops or restaurants, andsome sell their skills as craftsmen. The unskilled and poor usually end up doing dirty,dangerous and low-paid jobs on construction sites, which locals are reluctant to take. It ispossible that these migrants will stay permanently.
Another contributing factor to the recent in� ux of non-Tibetans into the TAR is theacceleration of the local economy. In the early 1980s, the government announced anambitious target for economic growth to quadruple China’s per capita GNP in 20 years.With average annual growth rate at 8–9%, this target has already been met a few years ago.In the 1980s, coastal regions topped the government’s development agenda. In recent years,however, the government has gradually shifted its attention to inland provinces, includingthe TAR. On the one hand, the central government pours in huge sums of money, as highas RMB¥8 billion, to improve infrastructure and expand productive capacity. Since 1994,62 large-scale construction projects have been completed. On the other hand, the TARgovernment has also set their own ambitious targets, and introduced a series of policiesdesigned to encourage external investment, from overseas as well as from other provinces.As a result, numerous non-Tibetans come as managers, technicians, engineers, businessmen,or construction workers. Unlike the � oating population’ , these more sophisticated migrants
56 Chan Kam Wing and Yang Yunyan, Internal Migration in Post-Mao China: A Dualistic Approach ’ , in ChinaPopulation Association (ed.), Symposium on Demography of China (China Population Association, Beijing, 1997),pp. 179–97.
57 For more information see Barry Sautman and Shiu-hing Lo, The Tibet Question and the Hong Kong Experience ,Occasional Papers no. 127, Contemporary Asian Studies, University of Maryland School of Law (1995).
34 Yan Hao
are sent to the TAR on a rotating basis under strict contracts, either by governmentdepartments or by management. These people rarely change their residency status, and moreoften come to the TAR alone, leaving their families at home. The contracts normally runfor 2–3 years. When the contracts expire, the concerned people return home to reunite withtheir families.
TGIE sources cite of� cial Chinese publications that tens of thousands of constructionworkers have been sent into the TAR.58 They fail to mention that, bound by theiremployment obligations, few will remain after their project is completed. It is notattractive to most ordinary Chinese with a secure job at home to work in the TAR.Therefore, both public and private sectors have to provide incentives, such as higher payor extra fringe bene� ts, to their employees to work there. TGIE sources sometimes cite theexistence of these people as evidence of an explicit government policy to encouragepopulation transfer to ethnographic Tibet.59 However, they fail to remind readers of the factthat these incentives are part of routine employment packages in the TAR, neitherethnic-sensitive nor origin-sensitive. All local Tibetan employees enjoy exactly the equalpay and same bene� ts as their non-Tibetan colleagues. For example, Tibetans, whoseancestors lived on the plateau of Tibet for generations, are equally eligible for a `high-alti-tude allowance’ .
As for the of� cially registered Han residents in the TAR, their number has actuallydropped by nearly half from 122,400 in 1980 to 64,890 in 1993. On the one hand, a largenumber of of� cials and technicians who came in the 1950s and 1960s returned home afterretirement. On the other hand, more and more Han of� cials and technicians have beengradually replaced by well-educated and quali� ed Tibetans according to a new policy sincethe early 1980s. The proportion of Hans in total government employees fell from 54.4% in1980 to 29.7% in 1993.60
In China, regional disparities exist in population distribution and socio-economicdevelopment. Of its total population, 41% live in coastal regions that account for just 14%of China’s total territory. By contrast, only 6.3% live in the vast western frontier regionsthat cover over half the country’s land mass. According to 1996 statistics, coastal regionsproduced 57.9% of China’s GDP, while frontier regions contributed only 4.0%. On average,the per capita disposable income of the frontier regions was less than one-third that ofcoastal regions.61 Save for ethnic and cultural factors, it is natural for government leadersto adopt measures to reach a possibly balanced development of national economy. And abalanced development cannot be achieved without rational movement of population. Allgovernments in the world, regardless of their political system or level of development, havepolicies, explicit or implicit, to encourage population � ow from developed to underdevel-oped regions.
No government-organised resettlement programmes have ever been introduced in theTAR. Although TGIE sources frequently quote what former Chinese leaders, like MaoZedong, said in the 1950s on possible population transfer to the TAR,62 the fact isthat such ideas have never materialised. Political Tibet was virtually closed to allunauthorised entry of people from outside until the late 1970s. Population transferafter the 1980s, as discussed above, is more or less a by-product of the government’sambitious drive for modernisation, thorough-going market-oriented reforms, and
58 Samdup, `Chinese Population Threat to Tibetan Identity’ .59 Ibid.60 Wang, Tianzang, p. 348.61 State Bureau of Statistics, Zhongguo tongji nianjian 1997 (The Statistical Yearbook of China 1997) (China
Statistical Publishing House, Beijing, 1997).62 Samdup, `Chinese Population Threat to Tibetan Identity’ .
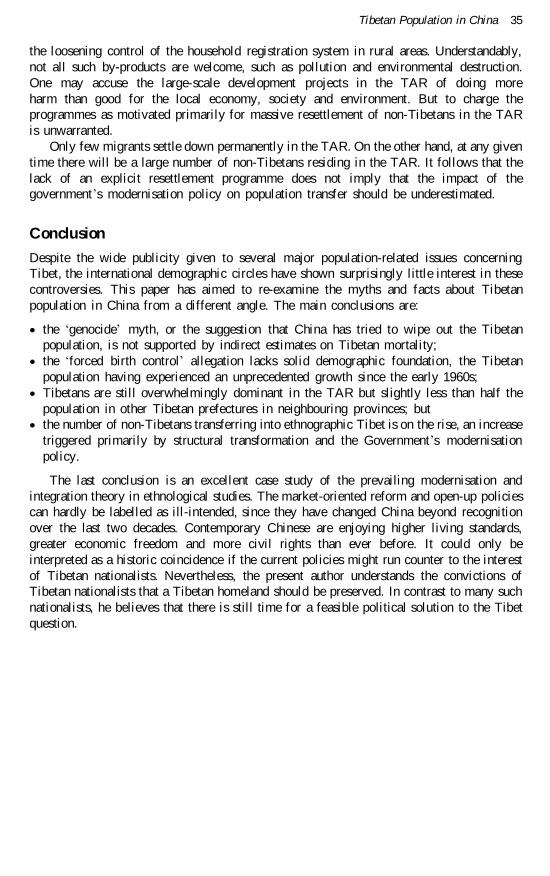
Tibetan Population in China 35
the loosening control of the household registration system in rural areas. Understandably,not all such by-products are welcome, such as pollution and environmental destruction.One may accuse the large-scale development projects in the TAR of doing moreharm than good for the local economy, society and environment. But to charge theprogrammes as motivated primarily for massive resettlement of non-Tibetans in the TARis unwarranted.
Only few migrants settle down permanently in the TAR. On the other hand, at any giventime there will be a large number of non-Tibetans residing in the TAR. It follows that thelack of an explicit resettlement programme does not imply that the impact of thegovernment ’s modernisation policy on population transfer should be underestimated.
Conclusion
Despite the wide publicity given to several major population-related issues concerningTibet, the international demographic circles have shown surprisingly little interest in thesecontroversies. This paper has aimed to re-examine the myths and facts about Tibetanpopulation in China from a different angle. The main conclusions are:
· the `genocide’ myth, or the suggestion that China has tried to wipe out the Tibetanpopulation, is not supported by indirect estimates on Tibetan mortality;
· the `forced birth control’ allegation lacks solid demographic foundation, the Tibetanpopulation having experienced an unprecedented growth since the early 1960s;
· Tibetans are still overwhelmingly dominant in the TAR but slightly less than half thepopulation in other Tibetan prefectures in neighbouring provinces; but
· the number of non-Tibetans transferring into ethnographic Tibet is on the rise, an increasetriggered primarily by structural transformation and the Government ’s modernisationpolicy.
The last conclusion is an excellent case study of the prevailing modernisation andintegration theory in ethnological studies. The market-oriented reform and open-up policiescan hardly be labelled as ill-intended, since they have changed China beyond recognitionover the last two decades. Contemporary Chinese are enjoying higher living standards,greater economic freedom and more civil rights than ever before. It could only beinterpreted as a historic coincidence if the current policies might run counter to the interestof Tibetan nationalists. Nevertheless, the present author understands the convictions ofTibetan nationalists that a Tibetan homeland should be preserved. In contrast to many suchnationalists, he believes that there is still time for a feasible political solution to the Tibetquestion.
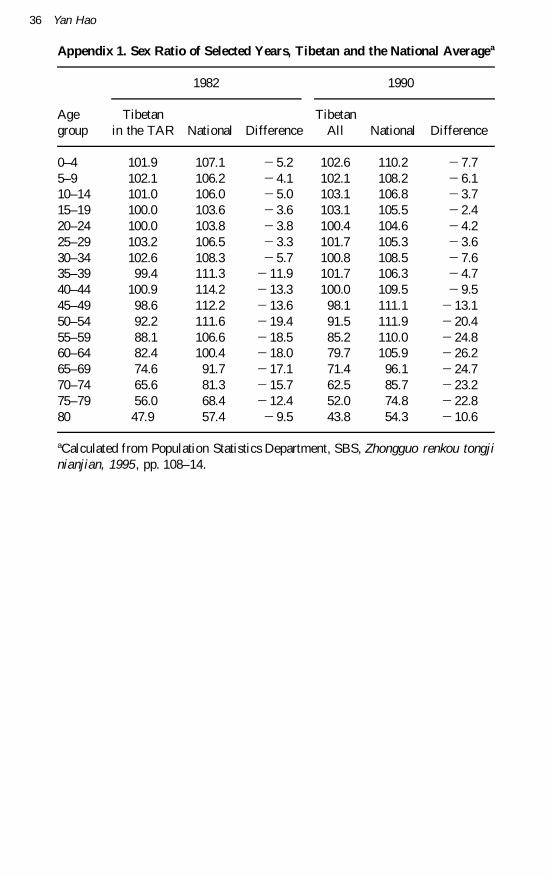
36 Yan Hao
Appendix 1. Sex Ratio of Selected Years, Tibetan and the National Averagea
1982 1990
Age Tibetan Tibetangroup in the TAR National Difference All National Difference
0–4 101.9 107.1 2 5.2 102.6 110.2 2 7.75–9 102.1 106.2 2 4.1 102.1 108.2 2 6.110–14 101.0 106.0 2 5.0 103.1 106.8 2 3.715–19 100.0 103.6 2 3.6 103.1 105.5 2 2.420–24 100.0 103.8 2 3.8 100.4 104.6 2 4.225–29 103.2 106.5 2 3.3 101.7 105.3 2 3.630–34 102.6 108.3 2 5.7 100.8 108.5 2 7.635–39 99.4 111.3 2 11.9 101.7 106.3 2 4.740–44 100.9 114.2 2 13.3 100.0 109.5 2 9.545–49 98.6 112.2 2 13.6 98.1 111.1 2 13.150–54 92.2 111.6 2 19.4 91.5 111.9 2 20.455–59 88.1 106.6 2 18.5 85.2 110.0 2 24.860–64 82.4 100.4 2 18.0 79.7 105.9 2 26.265–69 74.6 91.7 2 17.1 71.4 96.1 2 24.770–74 65.6 81.3 2 15.7 62.5 85.7 2 23.275–79 56.0 68.4 2 12.4 52.0 74.8 2 22.880 47.9 57.4 2 9.5 43.8 54.3 2 10.6
aCalculated from Population Statistics Department, SBS, Zhongguo renkou tongjinianjian, 1995, pp. 108–14.