three essays in venture capital - research explorer
TRANSCRIPT
Three Essays in Venture Capital
A thesis submitted to the University of Manchester for the degree of
Doctor of Philosophy
in the Faculty of Humanities
June 2015
Fan Wang
Manchester Business School
2
CONTENTS
Abstract ............................................................................................................................. 6
Declaration ........................................................................................................................ 7
Copyright Statement ......................................................................................................... 8
Dedication ......................................................................................................................... 9
Acknowledgements ......................................................................................................... 10
Chapter 1
Introduction
1.1 Motivation ................................................................................................................ 11
1.2 Thesis structure ......................................................................................................... 18
References ....................................................................................................................... 19
Chapter 2
Syndicated Venture Capital Investments: What's in it for
Local Venture Capitalists?
Abstract ........................................................................................................................... 21
2.1 Introduction ............................................................................................................... 22
2.2 Literature and hypothesis development .................................................................... 25
2.2.1 Theoretical framework ....................................................................................... 25
2.2.2 Syndicate experience .......................................................................................... 30
2.2.3 Syndicate experience and investment selection .................................................. 31
2.2.4 Syndicate experience and investment performance ............................................ 33
2.3. Data and methodology ............................................................................................. 34
2.3.1 Data and sample ................................................................................................. 34
3
2.3.2 Dependent variables ........................................................................................... 37
2.3.3 Explanatory variables ........................................................................................ 38
2.3.4 Control variables ................................................................................................ 39
2.3.5 Estimation models .............................................................................................. 40
2.4 Analysis ..................................................................................................................... 44
2.4.1 Local VC firms’ foreign syndicate experience ................................................... 44
2.4.3 Univariate analysis of selection and performance ............................................. 45
2.4.2 Local VC firms with foreign syndicate experience ............................................. 47
2.4.4 Investment selection ........................................................................................... 49
2.4.5 Investment performance ..................................................................................... 50
2.4.6 Robustness check ................................................................................................ 51
2.5 Conclusion ................................................................................................................ 53
References ....................................................................................................................... 55
Appendix ......................................................................................................................... 73
Chapter 3
Do Venture Capital Firms Benefit as Boards of Directors in
Mature Public Companies?
Abstract ........................................................................................................................... 74
3.1 Introduction ............................................................................................................... 75
3.2 Literature review and hypothesis development ........................................................ 77
3.2.1 VC characteristics and directorships ................................................................. 77
3.2.2 Directorships and VC fundraising ..................................................................... 79
3.2.3 Directorships and investment performance ....................................................... 81
3.3 Data and methodology .............................................................................................. 82
3.3.1 Data and sample ................................................................................................. 82

4
3.3.2 Dependent variables ........................................................................................... 85
3.3.3 Determinants of VC directorship ....................................................................... 86
3.3.4 Estimation models .............................................................................................. 88
3.4 Analysis ..................................................................................................................... 93
3.4.1. Directorship and VC firm characteristics ......................................................... 93
3.4.1.1 Univariate analysis ................................................................................................. 93
3.4.1.2 Multivariate analysis............................................................................................... 94
3.4.2 Directorship and fundraising ............................................................................. 96
3.4.2.1 Univariate analysis ................................................................................................. 98
3.4.2.2 Multivariate analysis............................................................................................... 99
3.4.3 Directorship and investment performance ....................................................... 101
3.4.3.1 Univariate analysis ............................................................................................... 101
3.4.3.2 Multivariate analysis............................................................................................. 102
3.5 Conclusion .............................................................................................................. 104
References ..................................................................................................................... 107
Appendix ....................................................................................................................... 120
Chapter 4
Dead Investors: What do we Know about the Failure of
Venture Capital Firms?
Abstract ......................................................................................................................... 122
4.1 Introduction ............................................................................................................. 123
4.2 Literature and hypothesis development .................................................................. 125
4.2.1 VC activities and failure of VC firms ............................................................... 126
4.2.1.1 Fundraising ........................................................................................................... 126
4.2.1.2 Investment ............................................................................................................. 128
5
4.2.1.3 Exits ....................................................................................................................... 129
4.2.2 VC characteristics and failure of VC firms ...................................................... 131
4.2.2.1 VC firm location .................................................................................................... 132
4.2.2.2 VC firm year of incorporation .............................................................................. 133
4.3 Data and methodology ............................................................................................ 134
4.3.1 Data and sample ............................................................................................... 134
4.3.2 Identifying failed VC firms ............................................................................... 135
4.3.3 Dependent variables ......................................................................................... 136
4.3.4 Explanatory variables ...................................................................................... 137
4.3.5 Estimation model .............................................................................................. 139
4.4 Analysis and results ................................................................................................ 141
4.4.1 Summary statistics ............................................................................................ 141
4.4.2 Univariate analysis ........................................................................................... 144
4.4.3 VC firm failure .................................................................................................. 147
4.5 Conclusion .............................................................................................................. 151
References ..................................................................................................................... 153
Chapter 5
Conclusion
5.1 Summary and suggestions for future research ........................................................ 165
5.2. Implications for market practitioners and policy makers ....................................... 170
References ..................................................................................................................... 172
This thesis contains 43,070 words, including title page, tables, appendices, and footnotes.

6
Abstract The University of Manchester
Fan Wang
Doctor of Philosophy (Ph.D.)
Three Essays in Venture Capital
June 2015
This thesis examines various issues related to venture capital (VC) firms. The thesis
consists of three essays that try to answer the following questions: Do local VC firms
benefit from their syndication experience with foreign partners? Do VC firms benefit
from their directorships in mature public companies? What do we know about the failure
of VC firms?
The first essay examines the benefits of cross-border syndication to ‘local’ (in the context
of the first essay, Asian) VC firms. The main finding is that, post-syndication, local VC
firms invest more in the high-tech industry than they did pre-syndication. I interpret this
as a result of enhanced knowledge and confidence in assessing and taking on rather risky
investments. Further, local VC firms have a higher likelihood of successful exits from
their portfolio companies post-syndication. I interpret these results as being benefits to
local VC firms that they derive from syndicating with their foreign partners. Overall, my
results indicate that there are tangible benefits for local VC firms from syndicating with
international VC partners. These benefits are more pronounced when the foreign partners
are from North America or Europe.
The second essay examines the benefits to venture capital firms through their
directorships in mature public companies. I investigate the benefits to venture capital
firms in terms of fundraising and investment performance. First, my empirical results
show that venture capital firms raise more funds and set higher fund-raising targets during
the post-directorship period. Second, I show that venture capital firms are more likely to
exit successfully from their investments post-appointment as a board of director in an
S&P 1500 company. Overall, my results indicate that being on the board of mature public
companies brings tangible benefits to venture capital firms.
The third essay examines the failure of VC firms. Based on a sample of 2,752 VC firms
in the United States established between 1980 and 2004, the study finds that almost one-
third of VC firms in the sample had gone out of business by the end of 2014. I then
investigate the causal factors of VC firm failure. Specifically, I examine VC
characteristics (location and year of incorporation) and factors related to VC activities
(fundraising, investments, and exits). The empirical results show that VC firms with a
higher level of failure tolerance and risk appetite are more likely to fail, whereas VC firms
with better fundraising abilities and stronger control rights are less likely to do so.

7
Declaration
I, Fan Wang, declare that no portion of the work referred to in this thesis has been
submitted in support of an application for another degree or qualification of this or any
other institute of learning.
8
Copyright Statement
i. The author of this thesis (including any appendices and/or schedules to this thesis)
owns certain copyright or related rights in it (the ‘Copyright’), and he has given
the University of Manchester certain rights to use such Copyright, including for
administrative purposes.
ii. Copies of this thesis, either in full or in extracts, and whether in hard or electronic
copy, may be made only in accordance with the Copyright, Designs and Patents
Act 1988 (as amended) and regulations issued under it or, where appropriate, in
according with licensing agreements which the University has entered into from
time to time. This page must be part of any such copies made.
iii. The ownership of certain Copyright, patents, designs, trademarks, and other
intellectual property (the ‘Intellectual Property’) and any reproductions of
copyright works in the thesis, for example graphs and tables (‘Reproductions’),
which may be described in this thesis, may not be owned by the author and may
be owned by third parties. Such Intellectual Property Rights and Reproductions
cannot and must not be made available for use without the prior written permission
of the owner(s) of the relevant Intellectual Property Rights and/or Reproductions.
iv. Further information on the conditions under which disclosure, publication, and
commercialisation of this thesis, the Copyright and any Intellectual Property
Rights, and/or Reproductions described in it may take place is available in the
University IP Policy (see http://documents.manchester.ac.uk/
DocuInfo.aspx?DocID=487), in any relevant Thesis restriction declarations
deposited in the University Library, the University’s Library’s regulations (see
http://www.manchester.ac.uk/library/aboutus/regulations), and in the University’s
policy on Presentation of Theses.

9
Dedication
This thesis is dedicated to Yong Wang, my father.

10
Acknowledgements
I would like to acknowledge all those who supervised, supported, encouraged, or
accompanied me along this journey. First and foremost, I am very grateful to my
supervisors, Professor Arif Khurshed and Dr Abdul Mohamed, who gave me the
opportunity and freedom to conduct my research in the area of my interest. Their
continuous encouragement and guidance motivated me through the Ph.D. programme.
I would like to thank my Ph.D. examiners Dr Susanne Espenlaub and Professor Neslihan
Ozkan for their valuable comments and feedback during my viva. I would also like to
thank other committee members, university staff, and colleagues, Dr Konstantinos
Stathopoulos, Professor Stuart Hyde, Dr Maria Marchica, Dr Ning Gao, Professor
Norman Strong, Dr George Christodoulakis, Professor Ser-Huang Poon, Professor
Richard Stapleton, Dr Edward Lee, Dr Marie Dutordoir, Dr Roberto Mura, and Dr
Abdulkadir Mohamed. My sincere thanks also go to Professor Arif Khurshed, who gave
me the opportunity to assist teach at Manchester Business School.
In addition, I would like to thank all my friends in Manchester—Zhe Wen, Hanpeng Xiao,
Baochao Gao, Qinye Lu, Jingya Wang, Caiwei Ye, and Ye Su—all of whom provided me
with unforgettable memories.
In addition, I would like to thank the U.S. Financial Management Association and IPAG
Business School, who invited me to present my research findings. I would also like to
thank the participants of the 2014 FMA Annual Meeting and my discussant Jonathan A.
Daigle, who provided me with valuable comments and feedback.
I want to give my special thanks to my parents, Yong Wang and Yun Hu, for their undying
love and unconditional support, and for encouraging me to chase my dreams with courage.
Finally, I owe a heartfelt thanks to Yinting Wu for accompanying me on this journey.
11
Chapter 1
Introduction
1.1 Motivation
The venture capital market has experienced rapid growth during the past three decades.
The total amount of VC investments increased from only $610 million in 1980 to over
$30 billion in 2010.1 As the market has grown, a number of new trends have emerged.
According to Chemmanur and Fulghieri (2014), two of the most important trends that
have affected the industry are globalisation and the changing role of VC firms.
Specifically, VC firms have been actively expanding their activities internationally, and
have shifted from their traditional role as capital providers in small private companies to
innovation facilitators in large mature companies. Following these trends, a number of
recent studies have examined related issues such as cross-border VC investment (e.g.,
Dai, Jo, and Kassicieh, 2011); VC failure tolerance and corporate innovation (e.g., Tian
and Wang, 2014); and VCs’ role in mature companies (e.g., Celikyurt, Sevillir, and
Shivdasani, 2012). These studies, however, have exclusively focussed on the capital
receivers (i.e. portfolio companies that received VC financing) but have ignored how the
VC firms could have been affected by the new trends. My thesis, which consists of three
essays, separately examines three newly emerging issues in the global VC market, with a
focus on capital providers, i.e. VC firms. Specifically, the thesis explores the following
three research questions: (1) do local VC firms benefit from their syndication experience
with foreign VC firms? (2) do VC firms benefit from their directorship status in mature
public companies? and (3) what do we know about the failure of VC firms? These essays
1 Based on data on the U.S. market, published by PricewaterhouseCoopers’ Moneytree report.
12
provide new perspectives on existing VC studies, and have opened up new areas for future
research.
The focus of the first essay is on cross-border VC investments; it examines whether local
VC firms benefit from their partnership with foreign VC firms within the context of the
Asian VC market. Cross-border investments by VC firms have grown rapidly during the
past two decades (Aizenman and Kendall, 2012; Dai et al., 2012). In particular, VC firms
from developed economies such as the United States and Europe have expanded their
activities internationally, with a focus on Asian countries, due to the rapid growth of
entrepreneurial activities and the rise of investment opportunities (Deloitte, 2007). At the
same time, many Asian countries have taken steps to remove major obstacles and
impediments to foreign investors, which has created favourable legal and regulatory
environments for foreign VCs to conduct their business. Following this emerging trend,
several recent studies have examined various aspects of cross-border VC investments,
mainly from the perspective of foreign investors (e.g., Dai et al., 2012; Wang and Wang,
2012; Humphery-Jenner and Suchard, 2013). These studies have provided empirical
evidence that syndication or joint ventures with local VC firms is an effective way for
foreign VC firms to alleviate information asymmetry and enhance investment
performance. Whether such partnerships also benefit local VC firms, however, remains
unexplored, thus leaving a gap in the VC literature. I postulate that such collaborations
between local and foreign VC firms should be mutually beneficial: if foreign VC firms
benefit from forming partnerships with local VC firms in the form of lower levels of
information asymmetry, there should also be accrued benefits to local VC firms. Because
the Asian VC market is relatively less developed than that of the Western economies, the
arrival of U.S. and European VC firms has not only brought capital but also learning
13
opportunities to local VC firms. The potential benefits could include better contract
design, knowledge on advising and nurturing entrepreneurs, knowledge of monitoring
portfolio companies, and the ability to take them to successful exits (Dai et al., 2012).
Using a sample of 3,309 investments from 1996 to 2009 in Asia, I examine the potential
benefits to local VC firms through their syndicate experience with foreign VC firms.2 I
examine benefits from two aspects: changes in local VC firms’ investment behaviours,
and successful exits from portfolio companies. I find that local VC firms that have
invested heavily in non-tech portfolio companies increase their exposure to high-tech
industries (especially the information technology and telecommunication sectors)
significantly post-syndication. This switch from traditional industries to high-tech
ventures suggests that during their collaborations, local VC firms have acquired
knowledge and expertise from their foreign partners, which are mostly firms that are
experienced with assessing high-tech ventures. In terms of investment performance, I find
that local VC firms with foreign syndicate experience tend to have a higher likelihood of
successful exits than local VC firms without any foreign exposure. Overall, the results
suggest that partnerships between local and foreign VC firms are mutually beneficial.
Syndicate experience with foreign VC firms increases local VC firms’ exposure to high-
tech industries, and enhances their ability to take portfolio companies to successful exits.
This essay makes several contributions to the existing literature on VC investments. First,
my study complements previous research (Dai et al., 2012; Wang and Wang, 2012;
Humphery-Jenner and Suchard, 2013) on cross-border VC investments by examining the
2 The sample covers the following countries: China, Hong Kong (treated separately from China for the
purposes of this study), India, Indonesia, Japan, Malaysia, Pakistan, The Philippines, Singapore, South
Korea, Taiwan, Thailand, and Vietnam.
14
value of cross-border syndication from the perspective of local VC firms. It is the first
study to provide empirical evidence that collaborations between local and foreign VC
investors are mutually beneficial. Second, this study contributes to the literature on VC
syndication. In addition to the risk-sharing (Lockett and Wright, 2001) and resource-
based motives (Hopp and Rieder, 2011), the study’s findings suggest that learning is also
an important motive for VC firms to form syndication. Third, this study contributes to
studies on strategic alliances (Dodgson, 1993; Inkpen and Crossan, 1995; Lane and
Lubatkin, 1998) by providing some of the first empirical evidence of organisational
learning within the context of venture capital markets.
My second essay examines whether VC firms benefit as boards of directors in mature
public companies. Although previous studies have long recognised the role of VC firms
as capital providers and monitors of small and young companies, a recent study by
Celikyurt et al. (2012) brought VC firms’ role in mature public companies to the attention
of academics. In their study, Celikyurt and colleagues documented that 30.5 percent of
Standard & Poor (S&P) 1500 companies had directors with a VC background before
joining the board. While they found that the presence of VC directors improves corporate
innovation (as measured by number of patents produced and citations of patents), their
study is only from the perspective of portfolio companies (i.e. S&P 1500 companies). The
question of whether VC firms benefit from their directorship status in these companies
remains unexplored. It seems to be costly for VC firms to have partners on the boards of
mature public companies, considering the time and effort they need to dedicate to those
companies, and the potential for distraction from their primary responsibilities at their
VC firms. As ‘smart’ players in the financial market, however, I posit that VC firms make
such decisions based on the fact that they derive substantial benefits related to their board

15
appointments. The potential benefits include credibility, visibility, enhanced networks and
reputation, and detailed knowledge of R&D at large public companies (Celikyurt, 2012),
all of which in return may benefit VC firms’ activities such as fundraising and investment
performance.
I hand-collected data on VC directors by following Celikyurt et al. (2012). The final
sample consists of 1,359 unique VC directors, working in 700 different VC firms. I also
collected data on fundraising, investments, and exits from VentureXpert. I examined
potential benefits to VC firms from two aspects: fundraising and investment performance.
First, I found that VC firms with directorships raised a significantly larger amount than
VC firms without directorships. To address the concern of the selection effect, I compared
fundraising performance during the pre-appointment and post-appointment periods and
found consistent results. I also addressed the concern of industry trend effects by using
the difference-in-difference method, and yet the results remained qualitatively the same.
Second, in terms of investment performance, the results show that VC firms with
directorships tend to have a higher likelihood of successful exits than those without
directorships. Overall, these results suggest that directorships in mature public companies
do provide benefits to VC firms in terms of fundraising and investment performance. I
interpret this as a result of credibility, enhanced networks, and knowledge and expertise
acquired through having directorships in mature public companies.
This study contributes to the emerging literature on VC firms’ changing roles. It is the
first to study VC firms’ roles in mature public companies from the perspective of VC
firms. My findings complement the study by Celikyurt et al. (2012) by providing
empirical evidence of the benefits that accrue to VC firms through directorships in mature
16
public companies. Second, this study adds to the literature on VC fundraising (Gompers
and Lerner, 1998; Gompers, 1996; Jeng and Wells, 2000; Mayer et al., 2004). The results
suggest that, in addition to VC ‘grandstanding’ (Gompers, 1996) (i.e. quickly taking
portfolio companies public), VC firms can also enhance their reputation through
directorships in large public companies, which then improves their ability and prospects
for raising new funds. Third, this study provides empirical evidence of VC firms’ role as
knowledge intermediaries. A number of recent studies (e.g., González-Uribe, 2013; Dessi
and Yin, 2014) show that VC investors can communicate valuable knowledge to
entrepreneurs and among portfolio companies. The results of this study suggest that VC
firms can transfer knowledge and expertise gained in mature public companies to their
small private portfolio companies, and therefore improve their likelihood of successful
exits.
The third essay examines the failure of VC firms. Although previous studies have
extensively examined the survival of VC-backed firms (e.g., Ruhnka et al., 1992; Kaplan
and Stromberg, 2003 and 2004; Cumming, Fleming, and Schwienbacher 2005; Nahata,
2008), the survival of the capital providers (i.e. VC firms) remains relatively unknown.
In recent years, a number of articles in major VC-related media have brought the issue of
VC firm failure to the attention of researchers. These articles have tried to identify a list
of ‘walking dead’ VC firms—those that are officially in business but have not made any
new investments during the past ten years—although the reasons behind such inactivity
remain unexplored. My study aims to complete the picture by examining the broader issue
of VC firm failure, which incorporates both ‘walking dead’ as well as ‘dead’ VC firms.
This issue of VC firm failure is at least as important as the failure of VC-backed firms,
since the survival of capital providers directly influences entrepreneurial firms.
17
Understanding the failure of VC firms enables both investors and investees to make better
investment decisions, and therefore benefits the development of entrepreneurship.
I hand-collected on VC firm status from the office of the U.S. Secretary of State rather
than from VentureXpert due to better data quality in the former. The final sample consists
of 2,752 independent VC firms in the United States established between 1980 and 2004.
The results show that almost one-third of VC firms had failed by the end of 2014, which
is a surprisingly large proportion. This suggests that the high failure rate not only applies
to VC-backed companies, but also to VC firms themselves. I then examine the casual
factors of VC firm failure from two aspects: VC activities–related factors and VC
characteristics. Specifically, I examine fundraising ability, investment preference (risk
appetite), control rights, failure tolerance, location, and year of incorporation. I model the
likelihood of failure and inactivity with logit regressions. The results show that VC firms
with a higher level of failure tolerance and risk appetite are more likely to fail, while VC
firms with better fundraising abilities and control rights over entrepreneurs are less likely
to fail. Overall, my results suggest that VC firms fail mainly due to internal factors (such
as their attitude towards risk and tolerance for failure) rather than external factors (such
as the entrepreneurial and economic environment).
This study is the first to examine the failure of VC firms. These findings complement
previous studies by providing original, broad evidence of VC firm failure. My study
extends the recently discussed phenomena by providing a more comprehensive and
detailed analysis of both ‘dead’ and ‘walking dead’ VC firms. In addition, my study adds
to the literature on VC failure tolerance (e.g., Tian and Wang, 2014; Chemmanur,
Loutskina, and Tian, 2014). The study provides the first empirical evidence of the effects
18
of failure tolerance on VC firms.
1.2 Thesis structure
The structure of this thesis follows the format accepted by the Manchester Accounting
and Finance Group, Manchester Business School. All chapters are incorporated into a
format suitable for submission and publication in peer-reviewed academic journals. The
chapters in this thesis are self-contained; each has a separate literature review, answers
unique and original questions, and uses different datasets. The tables, figures, equations,
footnotes, and appendices are independent, and are numbered from the beginning of each
chapter. Page numbers, titles, and subtitles have sequential order throughout the thesis.
This thesis is structured as follows. Chapter 1 includes the introduction; Chapter 2
examines the benefits of cross-border syndication to local VC firms; Chapter 3 studies
the benefits of directorships in mature public companies to VC firms; Chapter 4 examines
the failure of VC firms; and Chapter 5 provides a conclusion. From Chapter 2 to Chapter
4, I use the third person (we) instead of the first (I), because these chapters are working
papers co-authored with my supervisors.

19
References
Aizenman, J., and Kendall, J. 2012. The internationalization of venture capital. Journal
of Economic Studies 39, 488-511.
Celikyurt, U., Sevilir, M., and Shivdasani, A. 2014. Venture capitalists on boards of
mature public firms. Review of Financial Studies 27, 56-101.
Chemmanur, J. T., and Fulghieri, P. 2014. Entrepreneurial finance and innovation: An
introduction and agenda for future research, Review of Financial Studies 27, 1-19.
Chemmanur, J. T., Loutskina, E., and Tian, X. 2014. Corporate venture capital, value
creation, and innovation. Review of Financial Studies 27, 2434-2473.
Cumming, D., Fleming, G., and Schwienbacher, A. 2006. Legality and VC exits.
Journal of Corporate Finance 12, 214-245.
Dai, N., Jo, H., and Kassicieh, S. 2012. Cross-border venture capital investments in Asia:
Selection and exit performance. Journal of Business Venturing 27, 666-684.
Deloitte, 2007. Global trends in venture capital 2007 survey. Available:
https://www.deloitte.com/assets/Dcom-Canada/Local%20Assets/Documents/ca_
en_TMT_VC_2007survey_dec2007 (1).pdf. [7 August 2012]
Dessi, R., and Yin, N. 2014. Venture capital and knowledge transfer. Working paper.
Dodgson, M. 1993. Learning, trust, and technological collaboration. Human Relations
46, 77-95.
Gompers, P. 1996. Grandstanding in the venture capital industry. Journal of Financial
Economics, 42, 133-156.
Gompers, P., Lerner, J., Blair, M., and Hellmann, T. 1998. What drives venture capital
fundraising? Brookings Paper on Economic Activity. Microeconomics, 149-204.
González-Uribe, J. 2013. Venture capital and the diffusion of knowledge. Working
paper.
Hopp, C., and Rieder, F. 2011. What drives venture capital syndication? Applied
Economics 43, 3089-3102.
Humphery-Jenner, M., and Suchard, J. A. 2013. Foreign VCs and venture success:
Evidence from China. Journal of Corporate Finance 21, 16-35.
Inkpen, A. C., and Crossan, M. M. 1995. Believing is seeing: Joint ventures and
organization learning. Journal of Management Studies 32, 595-618.
Jeng, L. A., and Wells, P. C. 2000. The determinants of venture capital fundraising:
Evidence across countries. Journal of Corporate Finance 6, 241-289.
20
Kaplan, S., and Stromberg, P. 2003. Financial contracting theory meets the real word:
An empirical analysis of venture capital contracts. Review of Economic Studies 70,
281-315.
Kaplan, S., and Stromberg, P. 2004. Characteristics, contracts, and actions: Evidence
from venture capitalist analyses. Journal of Finance 59: 2177-2210.
Lane, P. J., and Lubatkin, M. 1998. Relative absorptive capacity and inter-organisational
learning. Strategic Management Journal 19, 461-77.
Lockett, A., and Wright, M. 2001. The syndication of venture capital investments.
Omega 29, 375-390.
Mayer, C., Schoors, K., and Yafeh, Y. 2004. Sources of funds and investment activities
of venture capital funds: Evidence from Germany, Israel, Japan and the U.K.
Journal of Corporate Finance 11, 586-608.
Nahata, R. 2008. Venture capital reputation and investment performance. Journal of
Financial Economics 90, 127-151.
Ruhnka, J., Feldman, H., and Dean, T. 1992. The ‘living dead’ phenomenon in venture
capital investments. Journal of Business Venturing 7, 137-155.
Tian, X., and Wang, T. 2014. Tolerance for failure and corporate innovation. Review of
Financial Studies 27, 211-255.
Wang, L., and Wang, S., 2012. Cross-border venture capital performance: Evidence
from China. Pan-Basin Finance Journal 19, 71-79.
21
Chapter 2
Syndicated Venture Capital Investments: What’s in it for
Local Venture Capitalists?
Abstract
This paper examines the benefits of cross-border syndications to local venture capital (VC)
firms. Post-syndication, we find that local VC firms invest more in the high-tech industry
than they did pre-syndication. We interpret this as a result of an enhanced knowledge and
confidence in assessing and taking on rather risky investments. Further, local VC firms
have a higher likelihood of a successful exit from their portfolio companies post-
syndication. We interpret these results as being benefits to local VC firms that are derived
from syndicating with their foreign partners. Overall, our results indicate that there are
tangible benefits for local VC firms from syndicating with international VC partners.
These benefits are more pronounced when the foreign partners are from North America
or Europe.
22
2.1 Introduction
Cross-border venture capital (VC) investment has been a growing trend in recent years
(Aizenman and Kendall, 2012; Dai et al., 2012). Several recent studies have examined
various aspects of cross-border VC investment from the perspective of foreign VC
investors (Dai et al., 2012; Wang and Wang, 2012; Humphery-Jenner and Suchard, 2013).
These studies have concluded both theoretically and empirically that syndication or joint
venture with local VC firms is an effective way for foreign VC firms to alleviate
information asymmetry and to enhance their investment performance. The benefits of
collaboration between local and foreign VC firms from the perspective of local VC firms,
however, has not been analysed, thus leaving a gap in the VC literature. If foreign VC
firms benefit from collaboration with local VC firms (i.e. there is a lower level of
information asymmetry), there should also be accrued benefits to local VC firms. The
potential benefits could include taking the firms to successful exits; better contract design;
and increased knowledge on advising and nurturing entrepreneurs and monitoring
portfolio companies (Dai et al., 2012). This paper contributes to the literature by
examining the benefits to local VC firms from syndicating with foreign VC firms,
focussing on their investment behaviour post-syndication and the likelihood of successful
exits from their portfolio companies.
VC firms are actively expanding their operations internationally, particularly in Asian
countries (Deloitte, 2007). For example, many U.S. and European VC firms have moved
to Asia due to growth and the rise of investment opportunities in the region.3 Generally,
3 For instance, New Enterprise Associates (NEA), the world’s largest U.S. VC firm, recently announced a
move to China, while Kleiner, Perkins, Caufield, & Byers (a Silicon Valley–based VC firm) has re-
23
VC firms require their portfolio companies to be in a country with favourable laws and
regulations. Many Asian countries have opened their economies by taking steps to
remove major obstacles and impediments to foreign VC investment. Foreign VC firms
not only bring capital; they also provide an opportunity for local VC firms to form
syndicates with them.
This study examines the benefits for local VC firms that syndicate with foreign VC firms
in Asia, using a sample of 3,966 investment rounds in 3,309 portfolio companies from
1996 to 2009. We measured the benefits to local VC firms through successful exits from
their portfolio companies and changes in their investment behaviours. We focussed on
portfolio companies that were based in China, Hong Kong (treated separately from China
for the purposes of this study), India, Indonesia, Japan, Malaysia, Pakistan, The
Philippines, Singapore, South Korea, Taiwan, Thailand, and Vietnam. We defined a VC
firm as ‘local’ if it was based in the country of the portfolio company, and ‘foreign’ if it
was headquartered in a country other than the country where its portfolio company exists.
Our empirical results show changes in the local venture capitalists’ investment behaviour
post-syndication with foreign venture capitalists. Local VC firms that had invested in
non-tech portfolio firms had a tendency, post-syndication, to invest heavily in high-tech
portfolio companies with foreign VC firms. We found that post-syndication, local VC
firms’ investments were clustered in the information technology (IT) and
telecommunication sectors. These sectors require enhanced expertise and knowledge in
assessing successful investments. A switch from non-tech to the high-tech sector is
established its headquarters in India. (See https://www.gsb.stanford.edu/news/bmag/sbsm0805/feature-
vcasia.html): ‘3i Group invests 10 percent of their capital in Asia’. (See the annual report 2014 at
http://www.3i.com/investor-relations/results-reports/reports?set_disclaimer=true.)
24
attributable to the skills and expertise that local VC firms master during their syndication
with foreign VC firms. In order to investigate if the changes in local venture capitalists’
investment behaviour is due to syndication with foreign VC firms (and not because of
other factors such as industry trends), we used a control sample of local VC firms that did
not syndicate with foreign VC firms throughout our sample period. Our results show that
the matched control sample tended to invest more in the non-tech than in the high-tech
industry during our sample period.
In terms of investment performance, although we found that syndicate experience with
foreign VC firms increases the likelihood of a successful exit for local VC firms, this
evidence was more pronounced in local VC firms that syndicated with European or North
American VC firms than was the case with VC entities from other Asian countries. When
comparing the pre- and post-syndication periods, we found that the likelihood of
successful exits increased significantly post-syndication. These results were robust when
compared to a control sample of local VC firms that had no syndication with foreign VC
firms.
Overall, our results suggest that local VC firms learn from their foreign VC partners. This
learning experience gives them the expertise and the confidence to invest in rather risky
industries such as the high-tech industry. In addition, local VC firms see an enhancement
in the performance of their investments in terms of successful exits. These findings allow
us to provide a more complete picture of the benefits of syndication between local and
foreign VC firms from the perspective of the local VC firm.
The remainder of this paper is organised as follows: in Section 2 we provide a discussion

25
of the theoretical framework and testable hypotheses of our study. Section 3 outlines our
data and methodology. In Section 4 we present our results, and Section 5 concludes the
paper.
2.2 Literature and hypothesis development
2.2.1 Theoretical framework
VC syndication has always been one of the most enduring characteristics of the VC
industry (Tykvová and Schertler, 2011; Meuleman and Wright, 2011). ‘Syndication’ may
be broadly defined as two or more venture capital firms that co-invest in a portfolio
company and share a joint pay-off. More broadly, syndication between VC firms is
essentially a form of inter-firm alliance (Wright and Lockett, 2003). Various reasons and
motives have been proposed to explain firms’ incentives to form alliances (joint ventures),
including risk reduction, economies of scale, access to markets, and the pursuit of
legitimacy (e.g., Hennart, 1988; Kogut, 1998).
Hennart (1988) examined the motivation to form joint ventures by focussing on the
perspective of transaction costs. He investigated two types of equity joint ventures (JVs):
‘scale’ JVs and ‘link’ JVs. While ‘scale’ joint ventures are formed when all the parents
take similar moves, such as vertical integration, horizontal expansion, or entering into a
new market, in ‘link’ joint ventures, parents take different moves. Hennart argues that
firms make joint venture decisions based on both the general market environment and the
potential transaction costs. He also contends that the minimisation of transaction costs is
26
not the sole reason behind joint ventures. Following Hennart (1988), Kogut (1988)
examined the motivation to enter JVs by comparing the transaction cost perspective and
the strategic behaviour perspective. The former predicts that firms form joint ventures to
minimise transaction costs, while the latter predicts that firms choose joint venture
partners to improve competitive positioning of the parties. Kogut argues that the primary
differences in the implications of these two perspectives are the motives to cooperate, and
the choice of partners. While these earlier studies have examined joint ventures in a broad
way, outlining the general motives behind joint ventures, they have not focussed on VC
firms.
Another branch of studies has focussed on VC firms specifically, examining the motives
for VC firms to form alliances (i.e. to make syndicated investments). Various studies in
the literature on VC syndication have documented that syndicates are usually formed to
share risk (the risk-sharing perspective), or to gain access to valuable resources (the
resource-based perspective). The risk-sharing perspective views syndication as a means
of diversifying risk without sacrificing the returns (e.g., Lockett and Wright, 2001). From
this perspective, information asymmetries and adverse selection problems could be
mitigated through syndication, because joint decision-making among VC firms enhances
the accuracy of the assessment and provides increased ‘deal flows’ (discussed below) at
the pre-investment stage. For instance, Lerner (1994) examined the rationale for the
syndication of VC investments. By using a sample of 271 U.S. biotechnology firms, he
found that VC firms use syndication to resolve or to exploit informational uncertainties.
Specifically, he found that experienced VC firms only syndicate first-round investments
to VC firms with a similar level of experience. In later rounds, however, experienced VC
firms syndicate with both their peers and with less experienced VC firms. This result
27
suggests that VC firms use syndication to mitigate information asymmetries in early-stage
investments where there is a greater level of uncertainty. On the other hand, the resource-
based perspective suggests that syndication is a way of sharing resources among
participating VC firms (e.g., Hopp and Rieder, 2011). This perspective suggests that
different information and heterogeneous skills brought by various VC firms could
enhance the post-investment performance of the portfolio companies (e.g., Ferrary, 2010).
In addition to the traditional risk-sharing and resource-based perspective, another
important motive for VC firms to form syndicates is ‘deal flow’. Given that VC
investment has a relatively high failure rate, VC firms need to be in a position where they
can select from a wide supply of deals so that they can increase the likelihood of
encountering high-quality ventures. This is especially the case during times when there is
more capital available than is required by entrepreneurial firms. Syndication provides a
good platform for VC firms to share networks, contacts, and the knowledge of potential
investment opportunities, and therefore may increase future deal flow for VC firms.
Several empirical studies have examined the motives for VC syndication. An earlier study
by Bygrave (1987) examined syndicated VC investments from the perspective of
networking. Based on a sample of 464 VC firms and 1,501 portfolio companies in the
United States, Bygrave found that the sharing of information is more important than the
spreading of financial risk as a reason to form syndicates. That is to say, syndication
between VC firms in the United States is mostly driven by the resource-based motive
rather than the risk-sharing motive. Bygrave also controlled for the size of these VC firms,
and yet found consistent results. Studies in other developed economies, however, have
not yielded consistent results. For instance, Lockett and Wright (2001) examined different
28
motives for the syndication of VC investments. By surveying a sample of 60 VC firms
based in the United Kingdom, they found that overall the risk-sharing motive provides a
strong explanation. But for early stage investments, they found the resource-based motive
to be much more important. Their results suggest that VC firms hold heterogeneous
attitudes towards syndication. VC firms that are involved in early-stage transactions tend
to use more syndication, and consider the sharing of resources as their primary motive.
Among all the studies on motives to form alliances or joint ventures, the studies of Grant
(1996), Hamel (1991), and Khanna et al., (1998) in particular have documented that
organisational learning is another very important motive. Their studies suggest that firms
form alliances in order to form a platform for organisational learning, which provides
access to the knowledge of their partners. Through the experience of mutual
interdependence, problem-solving, and observation of alliances’ activities and outcomes,
participating firms are able to learn from their partners (Inkpen, 1998). Inkpen (1998)
found that the formation of an alliance is an acknowledgement that the alliance partner
has useful knowledge that can be used by the alliance partner to enhance its own strategy
and operations. This type of knowledge is valuable to the partner firm, even outside the
specific terms of the alliance agreement. Alliances between firms provide a better
platform for organisational learning than other contexts, thus resulting in risk reduction
(Powell, 1987). A number of empirical studies (Dodgson, 1993; Inkpen and Crossan,
1995; Lane and Lubatkin, 1998) have also addressed the importance of alliances in the
learning process.
The formation of alliances, partnerships, and/or syndicates between local and foreign VC
firms could also be attributed to the learning motive. From the perspective of foreign VC
29
firms, the inclusion of a local partner that is geographically close to the investee company,
and has superior knowledge of the local market, technology, and legal environments, as
well as having linguistic skills and valuable contacts, may help to reduce the level of
information asymmetry caused by cultural differences and geographical distance (Mäkelä
and Maula 2006, 2008). In other words, foreign VC firms learn from the knowledge and
experience provided by local VC firms, thus mitigating information asymmetry and
leading to better performance (Humphery-Jenner and Suchard, 2013; Dai et al., 2012).
On the other hand, from the perspective of local VC firms, forming partnerships with
foreign VC firms allows local VC firms to access heterogeneous knowledge and skills
and provides them with opportunities to learn from their foreign partners. The learning
opportunities for the local VC firms stem from the fact that the venture capital industry
in Asia is still rather young and underdeveloped (Dai et al., 2012). The number of local
VC firms is small; firms often operate on a small scale and are unlikely to provide value-
adding advice to their portfolio companies (Bruton and Manigart, 2005).
Foreign VC firms, on the other hand, especially VC firms from North America and
Europe, have relatively rich experience developed in their home countries, and are able
to provide a larger amount of capital and better networks (Dai et al., 2012). Through such
collaboration, local VC firms are able to access foreign VC firms’ rich experience and
expertise, and acquire better knowledge on how to advise and nurture entrepreneurial
firms and exit their portfolio successfully. The need to syndicate with foreign VC firms
from the perspective of local VC firms might arguably be due to mutual benefits between
local and foreign VC firms.
30
2.2.2 Syndicate experience
Although our analysis of syndicate experience starts with the assumption that the
experience of all foreign syndicates is homogenous (see Figure 1), knowledge and
expertise, which both add value to the local VC, may vary significantly based on the
region or country of the VC firms.
A large body of strategic management literature (Inkpen, 1998; Inkpen and Crossan, 1995)
has pointed out factors such as learning objectives, leadership commitment, and cultural
alignment as important determinants in knowledge acquisition. The idea of ‘cultural
alignment’ posits that the effectiveness of knowledge acquisition might be improved as a
result of a lower level of cultural differences (i.e. higher cultural alignment). Within the
context of cross-border VC syndication, local VC firms’ learning effectiveness might be
subject to cultural distance between local and foreign VC firms. In other words, the
cultural alignment among Asian countries is higher, and the syndicate might provide a
better platform for organisational learning and could lead to effective knowledge
acquisition. Hence, in our analysis we differentiated broad foreign syndicate experience
based on foreign partners’ country of origin. Specifically, we divided the broad experience
into ‘Asian experience’ (syndicate experience with non-local Asian VC firms) and ‘non-
Asian experience’ (syndicate experience with non-local, non-Asian VC firms). We then
further classified the non-Asian experience category into ‘Western experience’ (syndicate
experience with VC firms from Western economies, specifically North America and
Europe) and ‘non-Western experience’ (syndicate experience with VC firms from non-
Western economies). Despite the high cultural and institutional distance between local
31
and non-Asian foreign countries, the learning effectiveness of syndication might be
significant. Provided the fact that Asian VC firms are less experienced and less developed
than those from Western economies (Dai et al., 2012), the level of knowledge and
expertise brought by Western VC firms might be significantly valuable to local VC firms.
In other words, the richness of the skills and experience to some extent could mitigate the
obstacles caused by cultural misalignment, and therefore could lead to effective
knowledge acquisition.
Overall, the effectiveness of this knowledge transfer in Asian countries might be high due
to a higher level of cultural alignment. In addition, the effectiveness might be high in the
syndicates between Asian and Western countries due to the superior knowledge and skills
of Western VC firms. Therefore, in our analysis we focussed on three types of foreign
syndicate experience: broad experience, Asian experience, and Western experience.
[INSERT FIGURE 1 HERE]
2.2.3 Syndicate experience and investment selection
As discussed above, local VC firms may learn from their foreign partners during their
collaboration, and use the knowledge in their follow-up investments. In other words, the
syndicate experience may influence local VC firms’ future investment behaviour. For
instance, investment selection and focus might change drastically due to foreign syndicate
exposure. Foreign VC firms, especially from Western economies, are more experienced
in investing in early-stage high-tech ventures. According to Cumming and Dai (2010),
32
64.3 percent of VC investments in the United States between 1980 and 2009 invested in
the IT sector (with 18 percent in the medical sector and the remaining 18 percent in other
sectors). Asian VC firms, on the other hand, tend to invest more in traditional industries
and expansion-stage ventures. As Dai et al. (2012) documented, about 30 percent of VC
investments in Asia between 1996 and 2006 were in non-technology industries, and 54
percent were in expansion-stage ventures. As such, Asian VC firms were less experienced
and less likely to invest in high-tech industries or early-stage ventures. By working side-
by-side with foreign VC firms that had extensive experience and knowledge of investing
in early-stage and high-tech industries, local VC firms could learn from their foreign
partners and acquire the necessary skills in selecting promising deals. On the other hand,
from the resource-based point of view, local VC firms with foreign syndicate experience
are likely to be more knowledgeable and experienced than their peers. They are thus likely
to make riskier (but potentially more lucrative) investments in early-stage or high-tech
ventures.
Ultimately, local VC firms are likely to use knowledge gained via syndication in their
follow-up investments to make appropriate investment decisions, not only in high-tech
industries but also in early-stage investments. We therefore hypothesise that local VC
firms that syndicate with foreign VC firms are more likely to invest in high-tech and
early-stage financing rounds. We tested our hypothesis on different types of syndicate
experience. As is the case with ‘broad’ experience, Asian and Western experiences both
provide a platform for organisational learning, where local VC firms acquire knowledge
and skills from their foreign partners. Both types of experience may influence local VC
firm investment behaviour. The effect of syndicate experience might be comparable,
however, given that the focus is on the knowledge and skills of investing in high-tech and
33
early-stage ventures. We formulate the following hypothesis:
Hypothesis 1: Local VC firms with foreign syndication experience are more likely to
invest in high-technology industries and early-stage ventures.
2.2.4 Syndicate experience and investment performance
In the previous section, we posited that syndicate experience with foreign VC firms would
influence local VC firms in their investment selection. Various studies, including those
by Cumming and Johan (2008) and Giot and Schwienbacher (2007), have examined VC
exits in different contexts. While some studies (Cumming and Johan, 2008; Elisabete,
Cesaltina, and Mohamed, 2008) have reported that the characteristics of VC firms and
investee companies affect the exits, others (Cumming, Fleming, and Schwienbacher, 2006;
Cumming and MacIntosh, 2003) have found that better economic conditions and legal
environments increase the likelihood of exits. In addition, VC syndication (Megginson
and Weiss, 1991; Lerner, 1994; Giot and Schwienbacher, 2007), geographical distance,
and cultural disparity (Cumming and Dai, 2010) also influence a VC firm’s exit in cross-
border investments. Recent studies on Asian VC markets (Dai et al., 2012; Wang and
Wang, 2012; Humphery-Jenner and Suchard, 2013) have found supportive evidence that
a joint venture or a partnership between foreign and local VC firms leads to better
investment performance for foreign VC firms.
If local VC firms gain experience via syndication with foreign partners, their investment
performance is likely to improve as compared to their investments prior to foreign

34
syndication. Therefore, we hypothesise that a local VC firm’s syndicate experience with
foreign VC firms increases the likelihood of a successful exit. We tested the following
related hypothesis:
Hypothesis 2: Post-syndication, the likelihood of a successful exit for a local VC firm will
be higher than in the pre-syndication period.
2.3. Data and methodology
2.3.1 Data and sample
We collected venture capital investment and exit data from the Asia Venture Capital
Journal (AVCJ) database. This database provides better coverage for Asian deals than
VentureXpert (see Brander, Du, and Hellmann, 2014).4
We constructed our sample as follows: we collected all available venture capital
investment in the AVCJ database, which included 11,748 VC investments made by both
foreign and local VC firms from 1990 to 2013. We included investments that received
initial funding between 1996 and 2009, because the globalisation of venture capital only
started to quicken its pace starting in the mid-1990s (Iriyama, Li, and Madhavan, 2010).
We then tracked the outcome of each investment until the end of 2012, and allowed for at
least three years to observe an exit for an investment made in 2009 (Gompers and Lerner,
2000; Hochberg et al., 2007; Nahata, 2008). We included in our sample all portfolio
4 See Table 1 in the Appendix for a comparison of data representativeness between AVCJ and other
databases, including VentureXpert.
35
companies that had received local VC funding. In order to be included in the sample, we
required that exit date, investment size, and region of the VC firms was available. This
filtration led to a final sample of 3,309 investments in portfolio companies from the period
1996 through 2009. Our final sample includes VC investments in the following countries:
China, Hong Kong (treated as separate from China for the purposes of this study), India,
Indonesia, Japan, Malaysia, Pakistan, The Philippines, Singapore, South Korea, Taiwan,
Thailand, and Vietnam.
Table 2 presents the descriptive statistics of the Asian VC market from 1990 to 2013.5
Panel A of the table shows that China attracted 37.6 percent of all investments in Asia
during this period, followed by Japan (24.9 percent) and India (16.9 percent). This
indicates that developing countries such as China and India were the most popular
investment destinations, while traditional developed countries such as Japan still
remained economically significant. In terms of total capital invested in Asia, China
received $920 million in total from 1990 to 2013, while Japan and India received in total
$629 million and $487 million, respectively. It is clear from the table that most of the VC
capital during this period was invested in emerging economies, specifically China and
India. China and India attracted more than half of the total capital invested in Asia. Panel
B provides a summary of syndication in the Asian market. The results show that
syndicated investments only accounted for approximately 30 percent (3,544/11,748) in
Asia, while the remaining 70 percent (8,204/11,748) were non-syndicated investments.
This is quite different from other developed economies, where syndicated investments
5 This table is based on all investment rounds made in Asia from 1990 to 2013. We started with this initial
sample of 11,748 rounds of investments and constructed our proxies for syndicate experience from this
sample. In order to provide a more comprehensive picture of the VC market in Asia, we provide the
descriptive statistics of the initial sample first, followed by our sample of 3,309 in Table 3.
36
usually account for a large proportion. In terms of syndication with foreign VC firm, 34.1
percent (1,207/3,544) were syndicated with foreign firms during this period, while the
remaining were syndications among local VC firms. This result shows that the majority
of syndicated investments in Asia are made by local VC firms, and that collaboration
between local and foreign VC firms is not a very common phenomenon.
Panel C of the table further examines syndicated investments made by both local and
foreign VC firms. As shown in the table, syndication with Western VC firms is more
common than syndication with foreign Asian VC firms (934 vs. 273). This result suggests
that there is a tendency for local VC firms to syndicate with Western (European and North
American) VC firms as compared to VC firms from other Asian counties. Among all the
countries in our sample, we found that most of the collaboration between local and foreign
VC firms took place in China and India, while in developed economies such as Japan and
South Korea, syndicated investments with foreign VC firms only accounted for a very
small proportion. The explanation could be that developed economies have their own VC
market; their local VC firms are relatively mature and are able to provide sufficient capital
to local entrepreneurial firms. Emerging economies, on the other hand, have less
developed VC markets and require more capital than local VC firms can provide in order
to sustain their fast-growing entrepreneurial activities.
Overall, our results indicate that syndication is less common in the Asian VC market as
compared to Western countries, especially North America, where more than half of the
investments were syndicated during the period of this study (Nahata, 2008). Syndication
with foreign (both Asian and Western) investors accounts for 34 percent, while
syndication with local firms accounts for 66 percent. China and India appear to be the
37
most attractive destinations for Western VC firms.
[INSERT TABLE 2 HERE]
2.3.2 Dependent variables
We used two sets of dependent variables in our analysis of investment selection. In
Models 1–3 of Table 6, we used dummy variables to indicate whether an investment was
made by local VC firms with foreign syndicate experience (‘Broad’, ‘Asian’, and
‘Western’). This took the value of one if the investment was made by a local VC with
foreign syndicate experience, and zero otherwise. We also used the actual number of
foreign syndicate experience as dependent variables in Models 4–6 of Table 6.
The dependent variable in our analysis of investment performance was a dummy that took
the value of one if the investee company was exited through an initial public offering
(IPO) or mergers and acquisitions (M&A) by the end of 2012, and zero otherwise. We
considered exits via both the IPO and M&A routes as successful exits, since VC firms
generate returns primarily by exiting successfully through these two routes (Triantis,
2001). Several recent studies of VC firms have used this measure of VC investment
success (see Bottazzi et al., 2008; Cumming and Dai, 2010; Dai et al., 2012; Nahata, 2008;
Zarutskie, 2010).
38
2.3.3 Explanatory variables
Broad experience
We measured ‘broad experience’ as the cumulative number of investments made by a
local VC in the past that included foreign VC firms. We classified any previously
syndicated investment with a non-local VC firm as a ‘broad’ experience. In the case of
multiple investors, we took the average of this variable; we also took the logarithm of this
variable in our analysis. Broad experience (I) is a dummy variable that took the value of
1 if there was at least one broad experience, and 0 otherwise.
Asian experience
We measured ‘Asian experience’ as the cumulative amount of investments made by a
local VC in the past, but involving only foreign Asian VC firms. We only classified
syndicated investments with non-local Asian VC firms as an Asian experience. In the
event of multiple investors, we took the average of this variable; we also took the
logarithm of this variable in our analysis. Asian experience (I) is a dummy variable, which
took the value of 1 if there was at least one broad experience, and 0 otherwise.
Western experience
We measured ‘Western experience’ as the cumulative amount of investment by a local
VC in the past that involved only Western VC firms (i.e. VC firms from North America
or Europe). We only considered syndicated investments between non-local and Western

39
VC firms as a Western experience. In the case of multiple investors, we took the average
of this variable; we also took the logarithm of this variable in our analysis. Western
experience (I) is a dummy variable, which took the value of 1 if there was at least one
broad experience, and 0 otherwise.
2.3.4 Control variables
Selection and performance are influenced by VC and portfolio company characteristics.
We included several variables to control for VC characteristics, investee companies, and
the country of the VC firms. VC syndication is important and can systematically reduce
the level of uncertainty. Megginson and Weiss (1991) and Lerner (1994) found that VC
syndication is positively related to the likelihood of IPO exits. Giot and Schwienbacher
(2007) found that the larger the size of VC syndication, the shorter the time to exit a
portfolio company. Similarly, recent studies on the Asian and Chinese markets (Dai et al.,
2012; Wang and Wang, 2012; Humphery-Jenner and Suchard, 2013) provided evidence
on VC syndication for investment performance. We therefore included a dummy variable
that took the value of one if the deal involved more than one VC firm. We also controlled
for VC portfolio size, since previous studies by Cumming (2006) found that portfolio size
is negatively related to the likelihood of a successful exit. We also included VC-type
dummies to indicate different types of VC firms.
We controlled for venture-related characteristics. We included dummy variables that
indicated financing stages (venture’s stage). Specifically, we included early-stage,
expansion-stage, and later-stage dummies in our analysis. We included these variables
40
because previous studies have suggested that early-stage ventures are risky and have a
high failure risk (Cochrane, 2005). The levels of information asymmetry and uncertainty
are higher at the early stage than at the later stage (Dai et al., 2012). In addition, we also
accounted for venture industry–specific fixed effects by including industry dummies in
our estimations.
The time-varying variables, related to the country of the VC firms, were included to
capture the effect of selection and investment performance. Stock market development
measures the level of stock market development in the country of a portfolio company.
This was measured as the average of stock market capitalisation, scaled by gross domestic
product (GDP). Previous studies in the United States (such as the study by Black and
Gilson, 1998) have shown that a well-developed market is extremely important to the
development of the VC industry, as it provides a viable exit mechanism for both investors
and entrepreneurs. Stock market development is undoubtedly important in the context of
cross-border investments, since VC firms are more likely to exit successfully the higher
the level of stock market development (Hazarika et al., 2010; Jeng and Wells, 2000). We
also included total rounds received in our study to control for investment size. In addition,
we included venture-nation dummies and year dummies to control for VC country fixed
effects and unobservable temporal effects.
2.3.5 Estimation models
Logit model
We used a logit model to estimate selection and investment performance (at the company
41
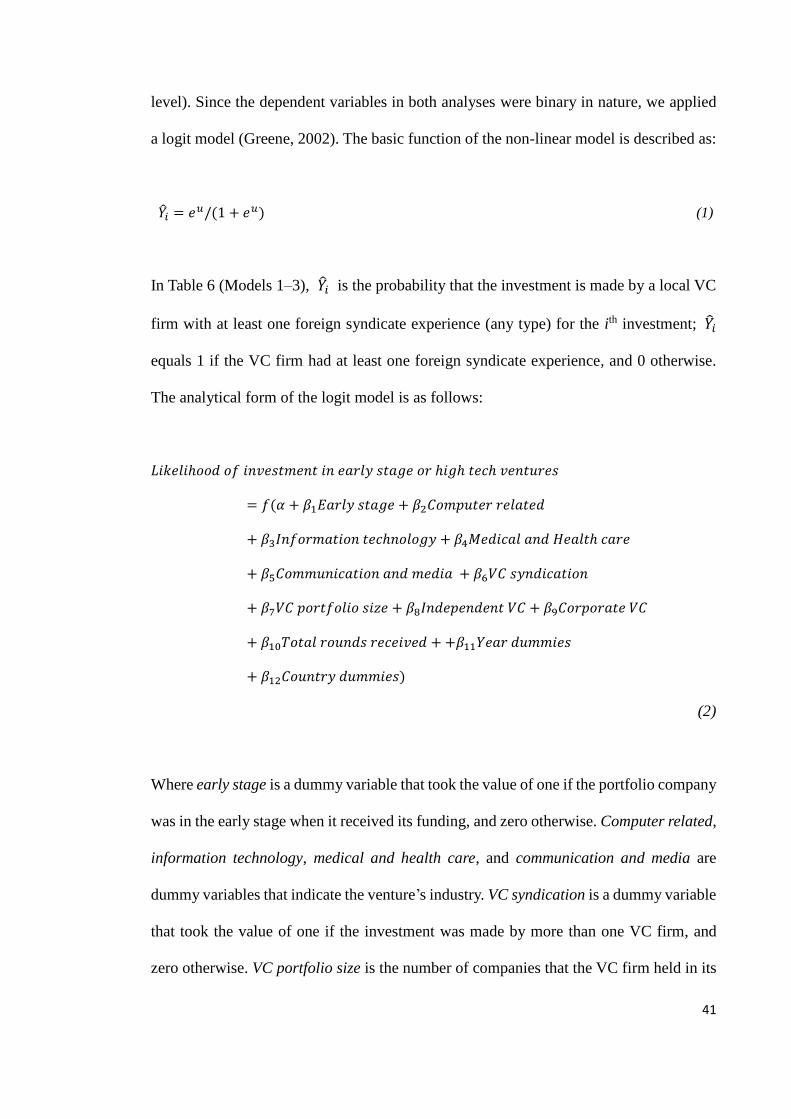
level). Since the dependent variables in both analyses were binary in nature, we applied
a logit model (Greene, 2002). The basic function of the non-linear model is described as:
�̂�𝑖 = 𝑒𝑢/(1 + 𝑒𝑢) (1)
In Table 6 (Models 1–3), �̂�𝑖 is the probability that the investment is made by a local VC
firm with at least one foreign syndicate experience (any type) for the ith investment; �̂�𝑖
equals 1 if the VC firm had at least one foreign syndicate experience, and 0 otherwise.
The analytical form of the logit model is as follows:
𝐿𝑖𝑘𝑒𝑙𝑖ℎ𝑜𝑜𝑑 𝑜𝑓 𝑖𝑛𝑣𝑒𝑠𝑡𝑚𝑒𝑛𝑡 𝑖𝑛 𝑒𝑎𝑟𝑙𝑦 𝑠𝑡𝑎𝑔𝑒 𝑜𝑟 ℎ𝑖𝑔ℎ 𝑡𝑒𝑐ℎ 𝑣𝑒𝑛𝑡𝑢𝑟𝑒𝑠
= 𝑓(𝛼 + 𝛽1𝐸𝑎𝑟𝑙𝑦 𝑠𝑡𝑎𝑔𝑒 + 𝛽2𝐶𝑜𝑚𝑝𝑢𝑡𝑒𝑟 𝑟𝑒𝑙𝑎𝑡𝑒𝑑
+ 𝛽3𝐼𝑛𝑓𝑜𝑟𝑚𝑎𝑡𝑖𝑜𝑛 𝑡𝑒𝑐ℎ𝑛𝑜𝑙𝑜𝑔𝑦 + 𝛽4𝑀𝑒𝑑𝑖𝑐𝑎𝑙 𝑎𝑛𝑑 𝐻𝑒𝑎𝑙𝑡ℎ 𝑐𝑎𝑟𝑒
+ 𝛽5𝐶𝑜𝑚𝑚𝑢𝑛𝑖𝑐𝑎𝑡𝑖𝑜𝑛 𝑎𝑛𝑑 𝑚𝑒𝑑𝑖𝑎 + 𝛽6𝑉𝐶 𝑠𝑦𝑛𝑑𝑖𝑐𝑎𝑡𝑖𝑜𝑛
+ 𝛽7𝑉𝐶 𝑝𝑜𝑟𝑡𝑓𝑜𝑙𝑖𝑜 𝑠𝑖𝑧𝑒 + 𝛽8𝐼𝑛𝑑𝑒𝑝𝑒𝑛𝑑𝑒𝑛𝑡 𝑉𝐶 + 𝛽9𝐶𝑜𝑟𝑝𝑜𝑟𝑎𝑡𝑒 𝑉𝐶
+ 𝛽10𝑇𝑜𝑡𝑎𝑙 𝑟𝑜𝑢𝑛𝑑𝑠 𝑟𝑒𝑐𝑒𝑖𝑣𝑒𝑑 + +𝛽11𝑌𝑒𝑎𝑟 𝑑𝑢𝑚𝑚𝑖𝑒𝑠
+ 𝛽12𝐶𝑜𝑢𝑛𝑡𝑟𝑦 𝑑𝑢𝑚𝑚𝑖𝑒𝑠)
(2)
Where early stage is a dummy variable that took the value of one if the portfolio company
was in the early stage when it received its funding, and zero otherwise. Computer related,
information technology, medical and health care, and communication and media are
dummy variables that indicate the venture’s industry. VC syndication is a dummy variable
that took the value of one if the investment was made by more than one VC firm, and
zero otherwise. VC portfolio size is the number of companies that the VC firm held in its
42
current portfolio; independent VC is a dummy variable that took the value of one if the
VC firm was not affiliated with corporations, financial institutions, or governments, and
zero otherwise. Corporate VC is a dummy that took the value of one if the VC firm was
affiliated with a corporation, and zero otherwise. Total rounds received is the total number
of rounds a portfolio company had received since the first-round investment. Year
dummies and country dummies are sets of dummy variables that indicate the year of
investment and VC firms’ country of origin, respectively.
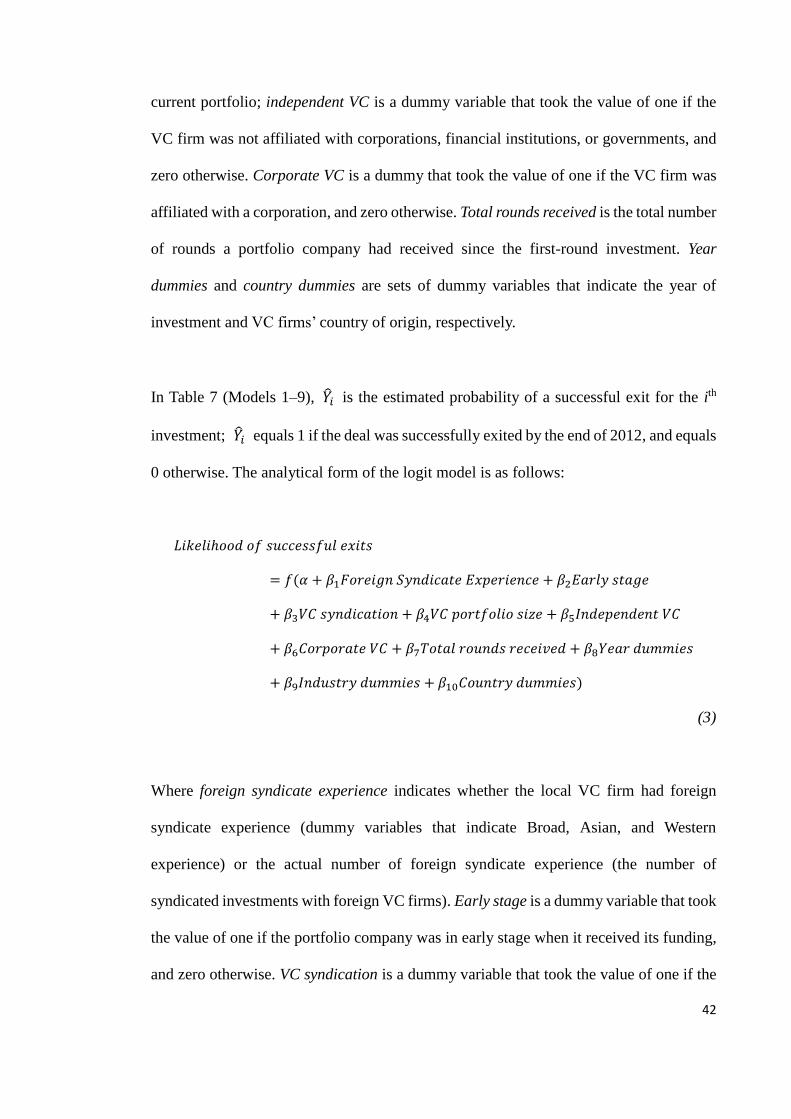
In Table 7 (Models 1–9), �̂�𝑖 is the estimated probability of a successful exit for the ith
investment; �̂�𝑖 equals 1 if the deal was successfully exited by the end of 2012, and equals
0 otherwise. The analytical form of the logit model is as follows:
𝐿𝑖𝑘𝑒𝑙𝑖ℎ𝑜𝑜𝑑 𝑜𝑓 𝑠𝑢𝑐𝑐𝑒𝑠𝑠𝑓𝑢𝑙 𝑒𝑥𝑖𝑡𝑠
= 𝑓(𝛼 + 𝛽1𝐹𝑜𝑟𝑒𝑖𝑔𝑛 𝑆𝑦𝑛𝑑𝑖𝑐𝑎𝑡𝑒 𝐸𝑥𝑝𝑒𝑟𝑖𝑒𝑛𝑐𝑒 + 𝛽2𝐸𝑎𝑟𝑙𝑦 𝑠𝑡𝑎𝑔𝑒
+ 𝛽3𝑉𝐶 𝑠𝑦𝑛𝑑𝑖𝑐𝑎𝑡𝑖𝑜𝑛 + 𝛽4𝑉𝐶 𝑝𝑜𝑟𝑡𝑓𝑜𝑙𝑖𝑜 𝑠𝑖𝑧𝑒 + 𝛽5𝐼𝑛𝑑𝑒𝑝𝑒𝑛𝑑𝑒𝑛𝑡 𝑉𝐶
+ 𝛽6𝐶𝑜𝑟𝑝𝑜𝑟𝑎𝑡𝑒 𝑉𝐶 + 𝛽7𝑇𝑜𝑡𝑎𝑙 𝑟𝑜𝑢𝑛𝑑𝑠 𝑟𝑒𝑐𝑒𝑖𝑣𝑒𝑑 + 𝛽8𝑌𝑒𝑎𝑟 𝑑𝑢𝑚𝑚𝑖𝑒𝑠
+ 𝛽9𝐼𝑛𝑑𝑢𝑠𝑡𝑟𝑦 𝑑𝑢𝑚𝑚𝑖𝑒𝑠 + 𝛽10𝐶𝑜𝑢𝑛𝑡𝑟𝑦 𝑑𝑢𝑚𝑚𝑖𝑒𝑠)
(3)
Where foreign syndicate experience indicates whether the local VC firm had foreign
syndicate experience (dummy variables that indicate Broad, Asian, and Western
experience) or the actual number of foreign syndicate experience (the number of
syndicated investments with foreign VC firms). Early stage is a dummy variable that took
the value of one if the portfolio company was in early stage when it received its funding,
and zero otherwise. VC syndication is a dummy variable that took the value of one if the

43
investment was made by more than one VC firm, and zero otherwise. VC portfolio size is
the number of companies that the VC firm held in its current portfolio. Independent VC
is a dummy variable that took the value of one if the VC firm was not affiliated with
corporations, financial institutions, or governments, and zero otherwise. Corporate VC is
a dummy that took the value of one if the VC firm was affiliated with a corporation, and
zero otherwise. Total rounds received is the total number of rounds a portfolio company
had received since the first-round investment. Industry dummies are dummy variables that
indicate the portfolio company’s industry, including computer-related, information
technology, medical and health care, and communication and media. Year dummies and
country dummies are sets of dummy variables that indicate the year of investment and the
VC firms’ country of origin, respectively.
In equation (1), u is the normal linear regression model, which is:
𝑢 = 𝛼 + 𝛽1𝑋1 + 𝛽2𝑋2 + ⋯ + 𝛽𝑡𝑋𝑡 (4)
Where 𝛼 is the constant and 𝛽1 to 𝛽𝑡 are coefficients of independent variables 𝑋1
to 𝑋𝑡. The log transformation of the logistic model is given by:
𝑙𝑛[�̂�𝑖/(1 − �̂�𝑖)] = 𝛼 + 𝛽1𝑋1 + 𝛽2𝑋2 + ⋯ + 𝛽𝑡𝑋𝑡 (5)
The parameters were estimated through the maximum likelihood method. To test the
statistical significance of the predictor variable, we used the Wald test. Pseudo 𝑅2 was
used to measure the goodness fit of the model; pseudo 𝑅2 is similar to 𝑅2 in the
ordinary least squares (OLS); the larger the pseudo 𝑅2, the better the goodness of fit.
44
2.4 Analysis
Our empirical analysis proceeded as follows: we first briefly described local VC firms’
syndicate experience to provide an insight of foreign syndication in Asia. Then we
provided a comparison between local VC firms with and without foreign syndicate
experience, using univariate analysis. To address concerns of the selection effect, we
examined whether local VC firms changed their investment activities (selection and
performance) following collaboration with foreign partners. Finally, we used regression
analysis to examine the impact of foreign syndicate experience on investment selection
and performance.
2.4.1 Local VC firms’ foreign syndicate experience
Table 3 shows the distribution of investments from 1996 through 2009 by local VC firms
with and without foreign syndicate experience (Broad, Asian, and Western). As may be
seen from the table, only a small fraction of investments were backed by VC firms with
broad experience between 1996 and 1999. In 1999, for instance, a large fraction of
investments did not involve broad experience, while only a small fraction of investments
had broad experience (92.9 percent vs. 7.1 percent, respectively). Interestingly, the
syndications between local and foreign VC firms increased starting in 2000, and reached
a peak between 2007 and 2008. During our sample period, the year 2008 saw the highest
number of syndication activities (44.1 percent) between local and foreign VC firms, but
45
that figure had dropped by approximately 4 percent by 2009. Splitting broad syndication
experience into Asian, Western, or both, we found that syndication experience was
identically distributed between Asian and Western VC firms. On average, the table shows
that syndication experience between local and Asian VC firms alone was less common
than syndication between local and Western VC firms alone. Comparing local VC firms
with Western experience only versus Western and Asian experience, we found that
Western experience only was higher than Western and Asian experience. This suggests
that local VC firms tend to syndicate with Asian or Western partners, while syndication
with both Asian and Western partners is the least desirable situation for local VC firms.
The table shows that 17.5 percent of our sample involved syndication between local and
Asian alone, while 30.1 percent were between local firms and Western firms alone,
compared to 12.8 percent between local and both Asian and Western VC firms.
Overall, the results show that syndication between local and foreign VC firms rose from
2000 to 2009, while before 2000, hardly any local VC firms syndicated with foreign VC
firms. In terms of syndicate experience, a small fraction of local VC investments
syndicated with Asian VCs, while a larger proportion involved Western VC firms. This
would suggest that the benefit of syndication (if any) between local and foreign VC firms
is mostly driven by Western VC firms.
[INSERT TABLE 3 HERE]
2.4.3 Univariate analysis of selection and performance
Table 5 shows the univariate analysis of local VC firms’ investment selection and
46
performance. The table provides a comparison between local VC firms with and without
foreign syndicate experience. The first column provides the analysis for the full sample
(i.e. all 3,309 portfolio companies). As shown in the table, the VC firms in our sample
were typically independent VC firms (72.3 percent) and likely to make a sole investment
rather than syndicated investments (19.3 percent). In terms of portfolio company–related
factors, most investments were in the expansion stage (65.2 percent) and non-technology
industries (61.5 percent). The table also shows that 20.4 percent of the investments had
exited by the end of 2012. The next four columns provide a comparison between
investments that were backed by local VC firms with broad experience and those with no
foreign syndicate experience. As can be seen from the table, VC firms with broad
experience had a larger number of companies in their investment portfolio and were more
likely to participate in syndicated investments. There was no significant difference
between broad and non-broad experience in terms of investment stages, but there were
differences in terms of industry preferences. Specifically, VC firms with foreign syndicate
experience (broad) invested more in the IT industry, and less in non-technology sectors,
than those without broad experience. The next eight columns provide a comparison
between investments with and without Asian and Western experience. The results are
similar to the previous analysis in terms of VC firm–related factors and industry focus.
That is, VC firms with Asian or Western experience had a larger investment portfolio,
were more likely to participate in syndication, and invested more in high-tech industries.
In addition, VC firms exposed to Western experience invested more in early-stage and
less in expansion-stage ventures. This might suggest that local VC firms learn from their
previous foreign partners and become more experienced and knowledgeable in advising
and nurturing early-stage ventures. Finally, in terms of investment performance, only
Asian experience showed a significantly positive impact.
47
Overall, our results show that there are significant differences between local VC firms
with foreign syndicate experience and those without. Specifically, we show that local VC
firms with foreign exposure tend to invest more in high-tech industries and early-stage
ventures. While this may suggest that local VC firms learn from their foreign partners
during previous collaboration experience, and become more knowledgeable in assessing
and nurturing early-stage and high-tech ventures, these differences could be due to the
selection effect. That is, local VC firms with foreign syndicate experience may have a
preference for early-stage and high-tech ventures even without any foreign exposure. The
differences between the two groups may not be a result of foreign syndication.
[INSERT TABLE 4 HERE]
2.4.2 Local VC firms with foreign syndicate experience
To address the concern of the selection effect, we focussed only on local VC firms with
foreign syndicate experience and examined whether there was a difference between the
pre- and post- syndication periods in terms of investment selection and performance.
Table 4 provides an analysis of local VC firms’ investment selection and performance
prior to and following foreign syndication.6 We defined the year of the first foreign
syndication as year 0, and counted the number of investments in early-stage investments,
6 We also examined whether the length of being with foreign VC firms influenced local VC firms’
investment activities. For instance, we tested 1 year after vs. 3 years after; 1 year after vs. 5 years after, etc.
We found that the longer local VC firms syndicated with foreign VC firms, the greater the impact on
selection and performance.
48
high-tech industries, and the number of successful exits for local VC firms between (-5,
+5) window around the first year of syndication. We then calculated the percentage (of
the total number of investments) of the investments’ focus (early and high-tech) and exits
over different time horizons in the pre- and post-syndication periods. We computed
changes in the percentage of investments and successful exits as the difference of the two
percentages. As shown in the table, local VC firms tended to invest more in early-stage
and high-tech industries after association/syndication. Specifically, local VC firms with
broad experience allocated more than 3.5 percent of their investments to early-stage
ventures and 11.4 percent to high-tech industries, respectively, five years post-association
(compared to five years before the association). Asian experience, however, did not show
any changes in early-stage investments. In fact, local VC firms invested less in early-
stage investments by approximately 3.4 percent, as compared to pre-syndication periods.
The percentage of investments in high-tech industries increased by 3.1 percent, but was
not statistically significant. In terms of investment performance, broad experience
improved the success rate (over -5, +5 window) by 8.5 percent, and Asian experience by
7.6 percent, while Western experience improved by 7.2 percent, respectively. The table
shows that the success rates were generally higher post-syndication with Asian or Western
VC firms than the pre-syndication period.
Overall, our results show that local VC firms change their investment preference during
the post-syndication period. Specifically, they increase their investment in early-stage and
high-tech ventures, which are usually considered to be riskier. This result suggests that
local VC firms acquire skills and expertise in assessing riskier ventures during their
collaboration with foreign partners, and become more confident in taking on those
investments. In terms of investment performance, we find that local VC firms increase
49
their success rate after syndicating with foreign VC firms, which also suggests the transfer
of knowledge, skills, and expertise from foreign to local VC firms.
[INSERT TABLE 5 HERE]
2.4.4 Investment selection
In this section, we analysed the investment decisions of local VC firms at the portfolio
company level. We examined a cross-sectional data set where the unit-of-analysis was at
the portfolio company level (i.e. there is one observation for each portfolio company).
The company level regressions are shown in Table 6. We first used logit models (Models
1–3) to examine investments made by local VC firms.7 The main results are as follows:
foreign syndicate experience, both broad and Western, shows significant impact on the
investment stage preference of local VC firms. The results suggest that local VC firms
with broad or Western experience are more likely to invest in early-stage ventures. Further,
the results show strong industry-clustering effects. Specifically, VC firms with foreign
syndicate experience (broad, Western, and Asian) are more likely to invest in IT and
computer-related industries. This suggests that they learn from their previous foreign
partners that specialise in high-tech industries. In Models 4–6, we used OLS regressions;
the dependent variables are the actual number of previous syndicate experiences (defined
7 We follow Dai et al. (2012)’s method to examine investment selection by VC firms. The dependent variables in Model 1-3 are dummy variables that equals to one if there is at least one local VC firm with foreign (broad, Asian, or Western) syndicate experience, and zero otherwise. The rationale for using Foreign Syndicate Experience as dependent variables is that we are trying to model the probability of “spotting” local VC firms with foreign syndicate experience in early-stage/high-tech ventures. That is, the probability of local VC firms with foreign syndicate experience investing in early-stage/high-tech ventures.
50
in Table 1). The results are similar and robust: VC firms with foreign syndicate experience
make more investments in early-stage and high-tech ventures, consistent with our
Hypotheses 1a–1c.
[INSERT TABLE 6 HERE]
2.4.5 Investment performance
We examined the impact of foreign syndicate experience on investment performance
using a logit model. The dependent variable is a dummy, which took the value of one if
the portfolio company ultimately went public or was acquired by the end of 2012. The
independent variables include the characteristics of the first round of financing. These
variables appear because VC firms make important strategic decisions in the first round
and, at this stage, their interactions with investee companies lay the foundation for
subsequent investments, which is critical for the investment’s success (De Clercq et al.,
2006; Fitza et al., 2009). All models were based on company-level analysis. We used
indicators instead of actual numbers as explanatory variables in Models 1–3. In Models
4–6, the explanatory variables were the cumulative amount of previous syndicated
investments with foreign VC firms (broad, Asian, Western). The results of Models 1 and
4 indicate that broad experience has a significant impact on investment performance. In
Models 2, 3, 5, and 6, we divided broad experience into two categories: Asian experience
and Western experience. As shown in Models 2 and 5, both coefficients of the Asian
experience variables were statistically significant, suggesting that Asian experience
increases the likelihood of successful exits. In Models 3 and 6, we examined the impact
51
of Western experience; the results show that Western experience was positive and
significantly related to the likelihood of successful exits. Overall, the results suggest that
partnership with foreign VC firms helps to professionalise the local VC firms. Local VC
firms learned from foreign VC firms and acquired better knowledge for advising and
nurturing entrepreneurs, leading to successful exits, which is consistent with Hypothesis
2. In terms of the control variables, we found that VC syndication helped to improve the
success rate of investment projects, but VC portfolio size was negatively related to the
likelihood of successful exits. We also found that ‘corporate’ VC firms performed better
than ‘independent’ VC firms. As expected, early- and expansion-stage investments were
less likely to be exited compared to later-stage investments. We also found that the total
rounds invested was positively related to the investment performance at the company
level.
Overall, we found that foreign syndicate experience for local VC firms is directly related
to investment success. This indicates that local VC firms have learned from their previous
collaboration with foreign VC firms and have gained experience in advising and nurturing
entrepreneurs by exiting their portfolios successfully.
[INSERT TABLE 7 HERE]
2.4.6 Robustness check
In this section, we report the robustness of our results. We attempted to address
endogeneity concerns, since we observed the exit success of deals that were funded by
52
local VC firms. We used the two-stage Heckman selection model to ameliorate selection
bias concerns. In the first stage, we used the probit model in the selection equation to
estimate the likelihood of an investment having only local investors. The control group
was obtained from the AVCJ database, which contains 3,950 investments made by only
foreign VC firms during the period 1996–2009. In the selection model, we also included
control variables used in the main regression and controlled for industry, country, and
year fixed effects. The results were consistent with our previous findings; and the inverse
Mills ratio was not significant at any conventional level, suggesting the absence of
potential selection bias.
There is also a potential endogeneity concern in our analysis. That is, local VC firms with
better quality might be more likely to form syndication with foreign VC firms. Therefore,
the better performance might be a result of VC firm’s quality not the syndication
experience. In order to address this concern, we incorporate proxies that measure local
VC firms’ quality including VC firm age and size in our analysis of selection and
investment performance. The results remained quantitatively consistent.8
In addition, we included non-Western experience (Figure 1) in our analysis to assess
whether non-Western foreign syndicate experience influenced local VC firms. As
expected, we did not find any significant impact for non-Western experience, suggesting
that only Western experience influences local VC firms’ selection and performance.
8 The AVCJ database does not provide a good coverage on VC firm’s age and size. A lot of local VC firms’ age and size information are missing. That is why we did not use these proxies in our main analysis. In the robustness analysis, we used a subsample of VC firms, whose age and size information are available and ran the same regressions. The results remained consistent with our main results.
53
2.5 Conclusion
A number of studies on VC cross-border activities have been conducted in recent years
(Dai et al., 2012; Humphery-Jenner and Suchard, 2013; Li et al., 2014). These studies
have independently documented that forming a partnership or syndicate with local VC
firms is an effective way to alleviate the information asymmetry caused by cultural and
geographical distance. These studies focussed on the benefits of syndications between
local and foreign VC firms from the perspective of foreign investors. Our study goes
beyond previous studies by examining the value of syndication from the perspective of
local VC firms. Specifically, we examined whether the syndicate experience with foreign
VC firms influences local VC investment behaviour and performance, post-syndication.
We used three different proxies for syndicate experience: broad experience, Asian
experience, and Western experience. Our results indicate that all types of syndicate
experience have significant impacts on local VC firm investment selection. Specifically,
local VC firms are more likely to invest in early-stage ventures and high-tech industries
following their syndications. We investigated whether the syndicate’s experience has an
impact on investment performance in terms of exit success. The results show that all types
of foreign syndicate experience improve local VC firm investment performance. We
speculate this is due to the learning effect between local and their foreign partners during
syndication, and the knowledge and skills acquired during the syndication enhance local
VC firms’ subsequent investments.
This study brings up some interesting areas for future research. For instance, do local VC
firms tend to syndicate with the same foreign investors? Or do they tend to form
54
partnerships with a variety of different VC firms to gain diversified knowledge and
expertise? Which group performs better? Do local VCs terminate their partnerships with
foreign VCs once they mature? Is there an optimal level of exposure to foreign investors?
In addition, if forming partnerships with foreign VC firms is beneficial, why do some
local VCs choose not to do so? Is it due to cultural disparities? Or did they have some
unpleasant experience with foreign investors? Future research that examines these
questions could shed more light on the issue of cross-border VC syndication.
This study also provides several practical implications for market practitioners and policy
makers. For instance, we have shown that collaboration with foreign VC investors is
beneficial to local VC firms in terms of investment behaviours and performance: in other
words, the entrance of foreign VCs is beneficial to the development of local VC markets.
Policy makers should realise the importance of foreign VC investors, and encourage such
collaboration by continuing to make efforts to remove obstacles for foreign investors to
conduct business, especially within those countries where the VC market is less
developed. In addition, local VC firms that have no syndicate experience with foreign VC
firms should consider such collaboration as a platform for organisational learning. In
doing so, these local VC firms could acquire knowledge and skills to improve their
investment performance. Local VC firms with the intention of syndicating may prefer VC
firms from North America or Europe over VC firms from other countries. Since there
exists the potential for learning opportunities and gaining experience for local VC firms
through syndication, Western foreign VC firms add value to the knowledge and success
of local VC firms.

55
References
Aizenman, J., and Kendall, J. 2012. The internationalization of venture capital. Journal
of Economic Studies 39, 488-511.
Black, B., and Gilson, R. 1998. Venture capital and the structure of capital markets: Banks
versus stock markets. Journal of Financial Economics 47, 243-277.
Bottazzi, L., Da Rin, M., and Hellmann, T. 2008. Who are the active investors? Evidence
from venture capital. Journal of Financial Economics 89, 488-512.
Brander, J., Du, Q., and Hellmann, T. 2014. The effects of government-sponsored venture
capital: International evidence. Review of Finance 18, 1-48.
Bruton, G. D., Fried, V., and Manigart, S. 2005. Institutional influences on the worldwide
expansion of venture capital. Entrepreneurship Theory and Practice 29, 737-760.
Bygrave, D. W. 1987. Syndicated investments by venture capital firms: A networking
perspective. Journal of Business Venturing 2, 139-154.
Cochrane, J. H. 2005. The risk and return of venture capital. Journal of Financial
Economics 75, 3-52.
Cumming D., and Johan, S. 2008. Pre-planned exit strategies in venture capital. European
Economic Review 52, 1209-1241.
Cumming, D., Fleming, G., and Schwienbacher, A. 2006. Legality and venture capital
exits. Journal of Corporate Finance 12, 214-245.
Cumming, D. J., and MacIntosh, J. G. 2003. Venture capital exits in Canada and the
United States. University of Toronto Law Journal 53, 101-200.
Cumming, D., and Dai, N. 2010. Local bias in venture capital investments. Journal of
Empirical Finance 17, 362-380.
Dai, N., Jo, H., and Kassicieh, S. 2012. Cross-border venture capital investments in Asia:
Selection and exit performance. Journal of Business Venturing 27, 666-684.
De Clercq, D., Fried, V. H., Lehtonen, O., and Sapienza, H. J. 2006. An entrepreneur’s
guide to the venture capital galaxy. Academy of Management Perspectives 20, 90-
112.
Deloitte, 2007. Global trends in venture capital 2007 survey. Available:
https://www.deloitte.com/assets/Dcom-
Canada/Local%20Assets/Documents/ca_en_TMT_VC_2007survey_dec2007(1).pd
f. [7 August 2012]
56
Dodgson, M. 1993. Learning, trust, and technological collaboration. Human Relations 46,
77-95.
Elisabete, G., Cesaltina, P., and Mohamed, A. 2008. The exit decision in the European
venture capital market. Working Paper, Universidade de Évora.
Ferrary, M. 2010. Syndication of venture capital investment: The art of resource pooling.
Entrepreneurship Theory and Practice 34, 885-908.
Fitza, M., Matusik, S. F., and Mosakowski, E. 2009. Do VCs matter? The importance of
owners on performance variance in start-up firms. Strategic Management Journal
30, 387-404.
Giot, P., and Schwienbacher, A. 2007. IPOs, trade sales and liquidations: Modelling
venture capital exits using survival analysis. Journal of Banking and Finance 31,
679-702.
Gompers, P., and Lerner, J. 2000. The determinants of corporate venture capital successes:
Organizational structure, incentives, and complementarities. Concentrated
Corporate Ownership, University of Chicago Press, 17-54.
Grant, R. M. 1996. Prospering in dynamically competitive environments: Organizational
capability as knowledge integration. Organization Science 7, 375-387.
Hamel, G. 1991. Competition for competence and inter-partner learning within
international strategic alliances. Strategic Management Journal 12, 83-104.
Hazarika, R., Nahata, R., and Tandon, K. 2010. Success in global venture capital investing:
Do institutional and cultural differences matter? Working Paper, Baruch College.
Hennart, J. F. 1988. A transactions costs theory of equity JVs. Strategic Management
Journal 9, 361-374.
Hochberg, Y. V., Ljungqvist, A., and Lu, Y. 2007. Whom you know matters: Venture
capital networks and investment performance. Journal of Finance 62, 251-301.
Hopp, C., and Rieder, F. 2011. What drives venture capital syndication? Applied
Economics 43, 3089-3102.
Humphery-Jenner, M., and Suchard, J. A. 2013. Foreign VCs and venture success:
Evidence from China. Journal of Corporate Finance 21, 16-35.
Inkpen, A. C., and Crossan, M. M. 1995. Believing is seeing: Joint ventures and
organization learning. Journal of Management Studies 32, 595-618.
Inkpen, A. 1998. Learning, knowledge acquisition, and strategic alliances. European
Management Journal 16, 223-229.
57
Iriyama, A., Li, Y., and Madhavan, R. 2010. Spiky globalization of venture capital
investments: The influence of prior human networks. Strategic Entrepreneurship
Journal 4, 128-145.
Jeng, L., and Wells, P. 2000. The determinants of venture capital funding: Evidence across
countries. Journal of Corporate Finance 6, 241-289.
Khanna, T., Gulati, R., and Nohria, N. 1998. The dynamics of learning alliances:
Competition, cooperation, and relative scope. Strategic Management Journal 19,
193-210.
Kogut, B. 1998. Joint ventures: Theoretical and empirical perspectives. Strategic
Management Journal 9, 319-322.
Lane, P. J., and Lubatkin, M. 1998. Relative absorptive capacity and inter-organizational
learning. Strategic Management Journal 19, 461-477.
Lerner, J. 1994. The syndication of venture capital investments. Financial Management
23, 16-27.
Lerner, J. 1994. Venture capitalists and the decision to go public. Journal of Financial
Economics 35, 293-316.
Li, Y., Vertinsky, I. B., and Li, J. 2014. National distances, international experience, and
venture capital investment performance. Journal of Business Venturing 29, 471-489.
Lockett, A., and Wright, M. 2001. The syndication of venture capital investments. Omega:
The International Journal of Management Science 29, 375-390.
Mäkelä, M. M., and Maula, M. 2006. Inter-organizational commitment in syndicated
cross-border VC investments. Entrepreneurship Theory and Practice 30, 273-298.
Mäkelä, M. M., and Maula, M. 2008. Attracting cross-border venture capital: The role of
a local investor. Entrepreneurship and Regional Development 20, 237-257.
Megginson, W., and Weiss, K. 1991. Venture capital certification in initial public
offerings. Journal of Finance 46, 879-893.
Meuleman, M., and Wright, M. 2011. Cross-border private equity syndication:
Institutional context and learning. Journal of Business Venturing 26, 35-48.
Nahata, R. 2008. Venture capital reputation and investment performance. Journal of
Financial Economics 90, 127-151.
Powell, W. W. 1987. Hybrid organizational forms. California Management Review 30,
67-87.
Tykvová, T., and Schertler, A. 2011. Cross-border venture capital flows and local ties:
58
Evidence from developed countries. The Quarterly Review of Economics and
Finance 51, 36-48.
Triantis, G. G. 2001. Financial contract design in the world of venture capital. University
of Chicago Law Review 68, 305-322.
Wang, L., and Wang, S. 2012. Cross-border venture capital performance: Evidence from
China. Pan-Basin Finance Journal 19, 71-79.
Wright, M., Lockett, A. 2003. The structure and management of alliances: Syndication in
the venture capital industry. Journal of Management Studies 40, 2073-2102.
Zarutskie, R. 2010. The role of top management team human capital in venture capital
markets: Evidence from first-time funds. Journal of Business Venturing 25, 155-172.
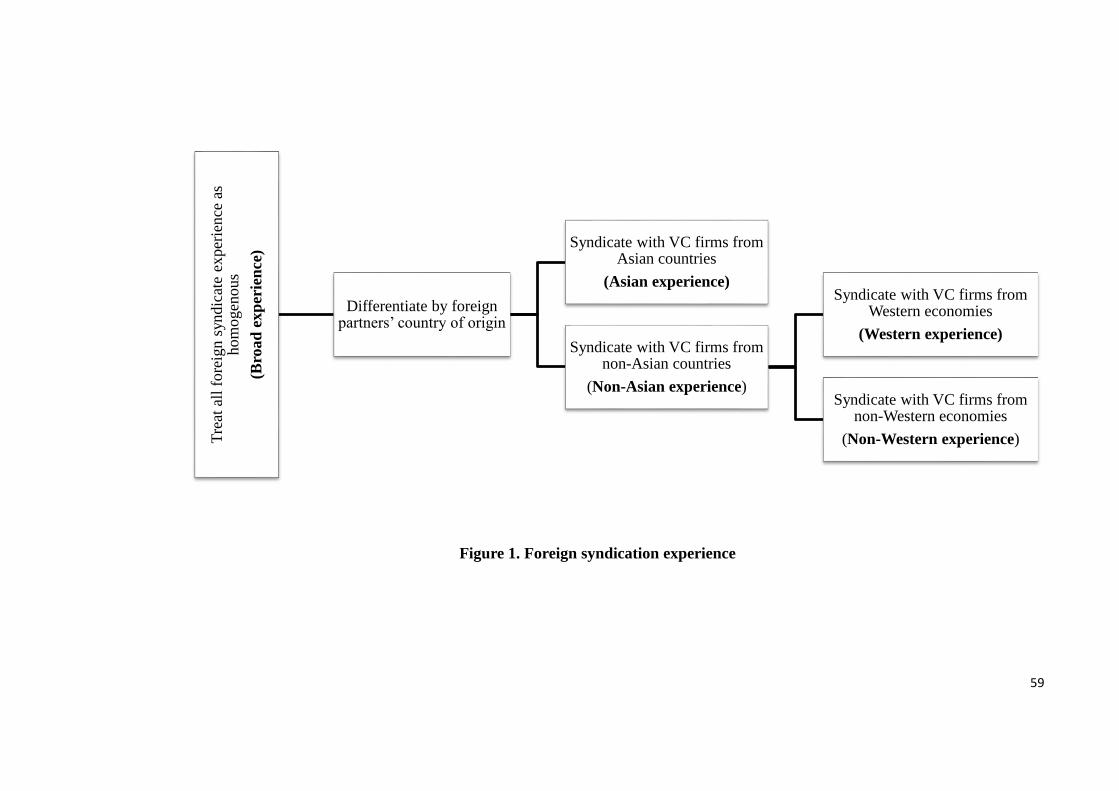
59
Figure 1. Foreign syndication experience
Tre
at a
ll f
ore
ign s
yndic
ate
exper
ience
as
hom
ogen
ous
(Bro
ad
exp
erie
nce
)
Differentiate by foreign partners’ country of origin
Syndicate with VC firms from Asian countries
(Asian experience)
Syndicate with VC firms from non-Asian countries
(Non-Asian experience)
Syndicate with VC firms from Western economies
(Western experience)
Syndicate with VC firms from non-Western economies
(Non-Western experience)
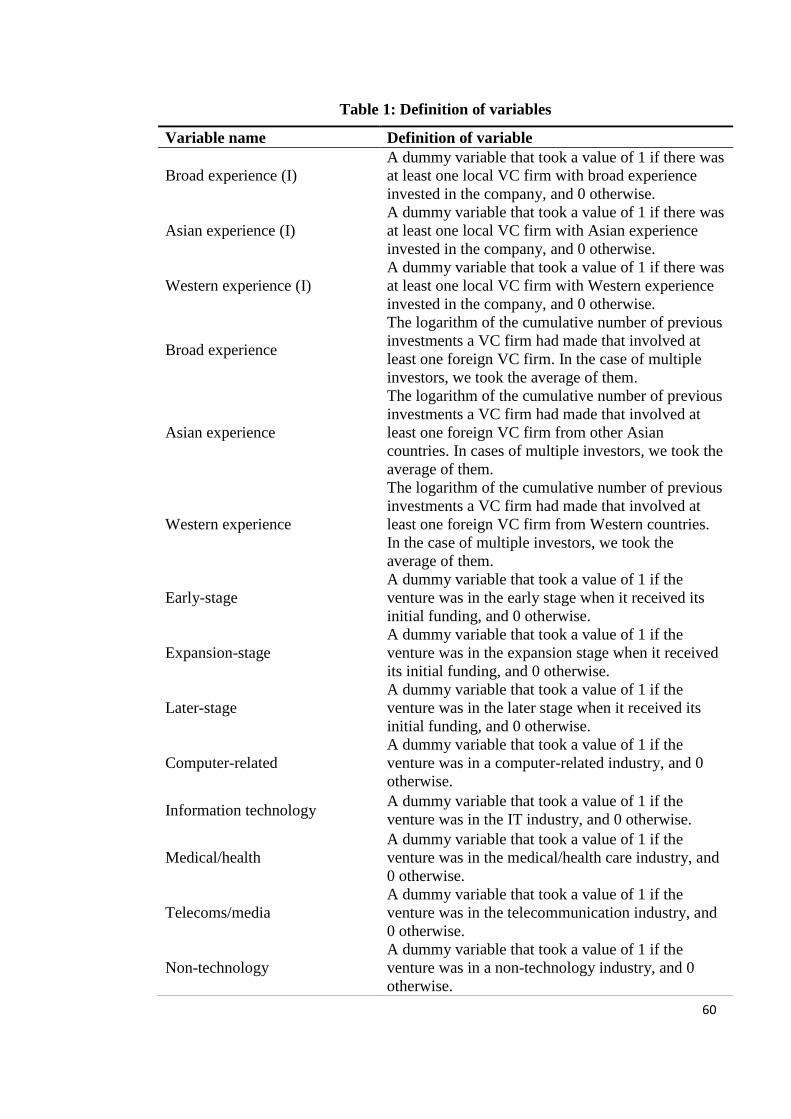
60
Table 1: Definition of variables
Variable name Definition of variable
Broad experience (I)
A dummy variable that took a value of 1 if there was
at least one local VC firm with broad experience
invested in the company, and 0 otherwise.
Asian experience (I)
A dummy variable that took a value of 1 if there was
at least one local VC firm with Asian experience
invested in the company, and 0 otherwise.
Western experience (I)
A dummy variable that took a value of 1 if there was
at least one local VC firm with Western experience
invested in the company, and 0 otherwise.
Broad experience
The logarithm of the cumulative number of previous
investments a VC firm had made that involved at
least one foreign VC firm. In the case of multiple
investors, we took the average of them.
Asian experience
The logarithm of the cumulative number of previous
investments a VC firm had made that involved at
least one foreign VC firm from other Asian
countries. In cases of multiple investors, we took the
average of them.
Western experience
The logarithm of the cumulative number of previous
investments a VC firm had made that involved at
least one foreign VC firm from Western countries.
In the case of multiple investors, we took the
average of them.
Early-stage
A dummy variable that took a value of 1 if the
venture was in the early stage when it received its
initial funding, and 0 otherwise.
Expansion-stage
A dummy variable that took a value of 1 if the
venture was in the expansion stage when it received
its initial funding, and 0 otherwise.
Later-stage
A dummy variable that took a value of 1 if the
venture was in the later stage when it received its
initial funding, and 0 otherwise.
Computer-related
A dummy variable that took a value of 1 if the
venture was in a computer-related industry, and 0
otherwise.
Information technology A dummy variable that took a value of 1 if the
venture was in the IT industry, and 0 otherwise.
Medical/health
A dummy variable that took a value of 1 if the
venture was in the medical/health care industry, and
0 otherwise.
Telecoms/media
A dummy variable that took a value of 1 if the
venture was in the telecommunication industry, and
0 otherwise.
Non-technology
A dummy variable that took a value of 1 if the
venture was in a non-technology industry, and 0
otherwise.
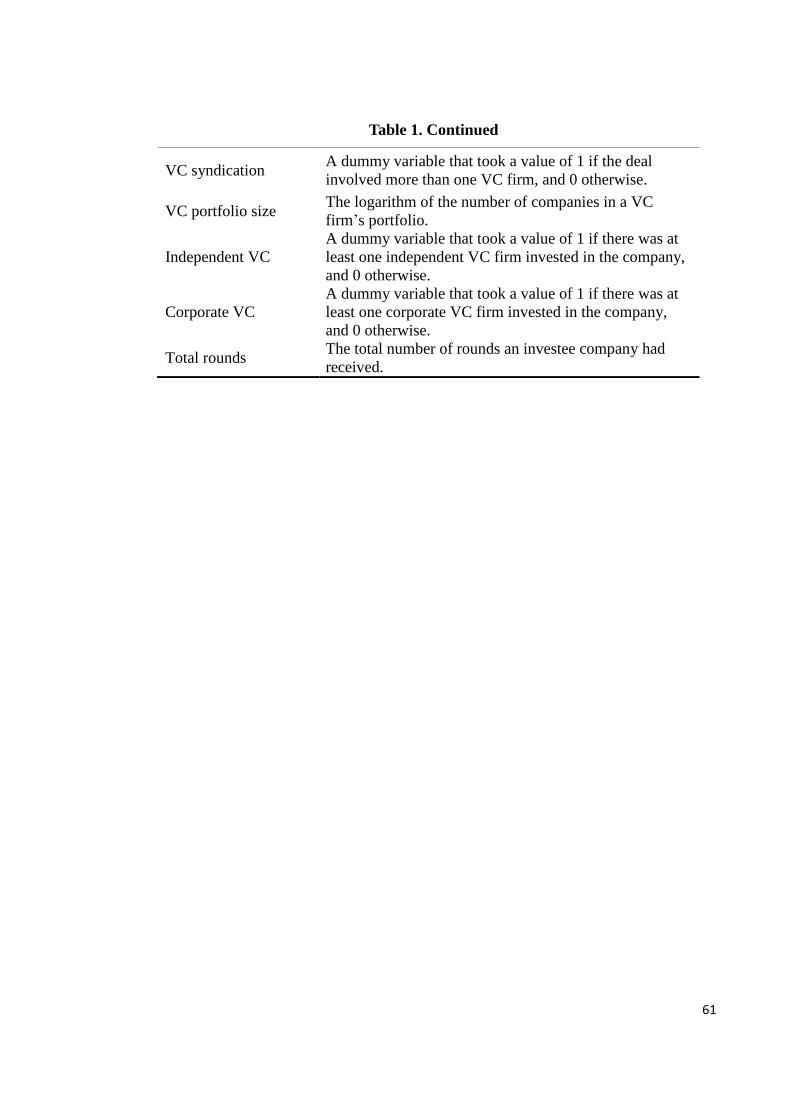
61
Table 1. Continued
VC syndication A dummy variable that took a value of 1 if the deal
involved more than one VC firm, and 0 otherwise.
VC portfolio size The logarithm of the number of companies in a VC
firm’s portfolio.
Independent VC
A dummy variable that took a value of 1 if there was at
least one independent VC firm invested in the company,
and 0 otherwise.
Corporate VC
A dummy variable that took a value of 1 if there was at
least one corporate VC firm invested in the company,
and 0 otherwise.
Total rounds The total number of rounds an investee company had
received.
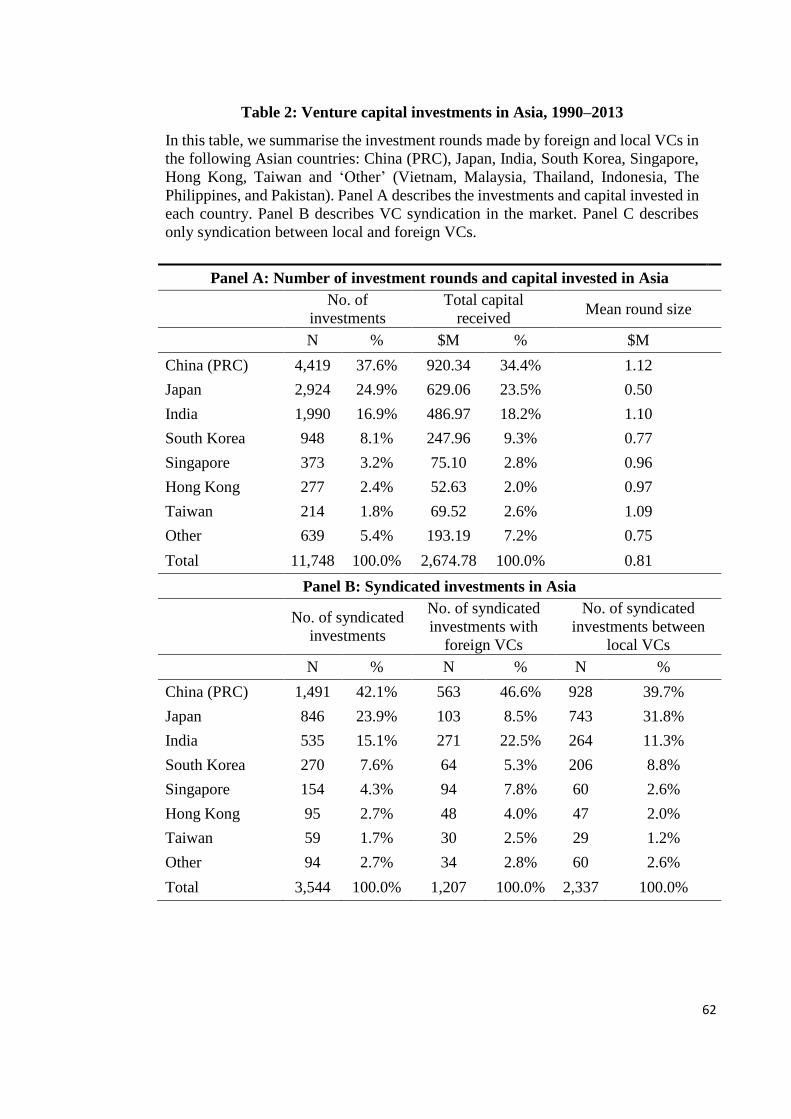
62
Table 2: Venture capital investments in Asia, 1990–2013
In this table, we summarise the investment rounds made by foreign and local VCs in
the following Asian countries: China (PRC), Japan, India, South Korea, Singapore,
Hong Kong, Taiwan and ‘Other’ (Vietnam, Malaysia, Thailand, Indonesia, The
Philippines, and Pakistan). Panel A describes the investments and capital invested in
each country. Panel B describes VC syndication in the market. Panel C describes
only syndication between local and foreign VCs.
Panel A: Number of investment rounds and capital invested in Asia
No. of
investments
Total capital
received Mean round size
N % $M % $M
China (PRC) 4,419 37.6% 920.34 34.4% 1.12
Japan 2,924 24.9% 629.06 23.5% 0.50
India 1,990 16.9% 486.97 18.2% 1.10
South Korea 948 8.1% 247.96 9.3% 0.77
Singapore 373 3.2% 75.10 2.8% 0.96
Hong Kong 277 2.4% 52.63 2.0% 0.97
Taiwan 214 1.8% 69.52 2.6% 1.09
Other 639 5.4% 193.19 7.2% 0.75
Total 11,748 100.0% 2,674.78 100.0% 0.81
Panel B: Syndicated investments in Asia
No. of syndicated
investments
No. of syndicated
investments with
foreign VCs
No. of syndicated
investments between
local VCs
N % N % N %
China (PRC) 1,491 42.1% 563 46.6% 928 39.7%
Japan 846 23.9% 103 8.5% 743 31.8%
India 535 15.1% 271 22.5% 264 11.3%
South Korea 270 7.6% 64 5.3% 206 8.8%
Singapore 154 4.3% 94 7.8% 60 2.6%
Hong Kong 95 2.7% 48 4.0% 47 2.0%
Taiwan 59 1.7% 30 2.5% 29 1.2%
Other 94 2.7% 34 2.8% 60 2.6%
Total 3,544 100.0% 1,207 100.0% 2,337 100.0%
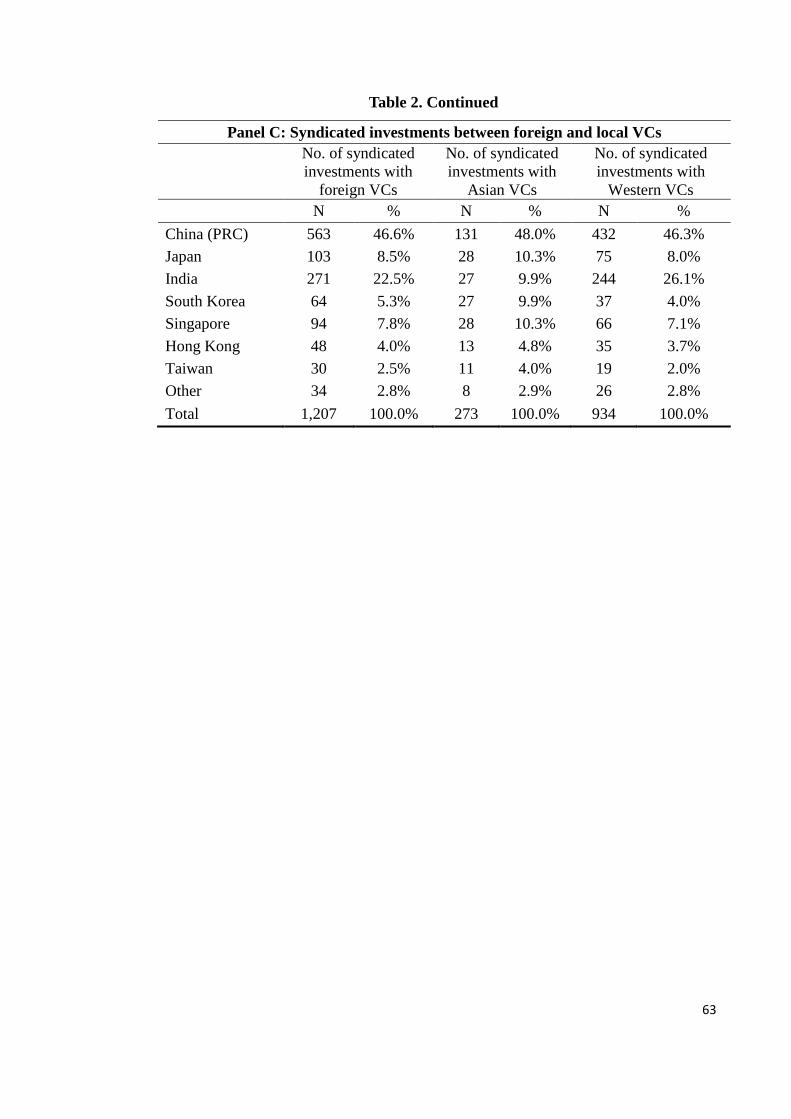
63
Table 2. Continued
Panel C: Syndicated investments between foreign and local VCs
No. of syndicated
investments with
foreign VCs
No. of syndicated
investments with
Asian VCs
No. of syndicated
investments with
Western VCs
N % N % N %
China (PRC) 563 46.6% 131 48.0% 432 46.3%
Japan 103 8.5% 28 10.3% 75 8.0%
India 271 22.5% 27 9.9% 244 26.1%
South Korea 64 5.3% 27 9.9% 37 4.0%
Singapore 94 7.8% 28 10.3% 66 7.1%
Hong Kong 48 4.0% 13 4.8% 35 3.7%
Taiwan 30 2.5% 11 4.0% 19 2.0%
Other 34 2.8% 8 2.9% 26 2.8%
Total 1,207 100.0% 273 100.0% 934 100.0%
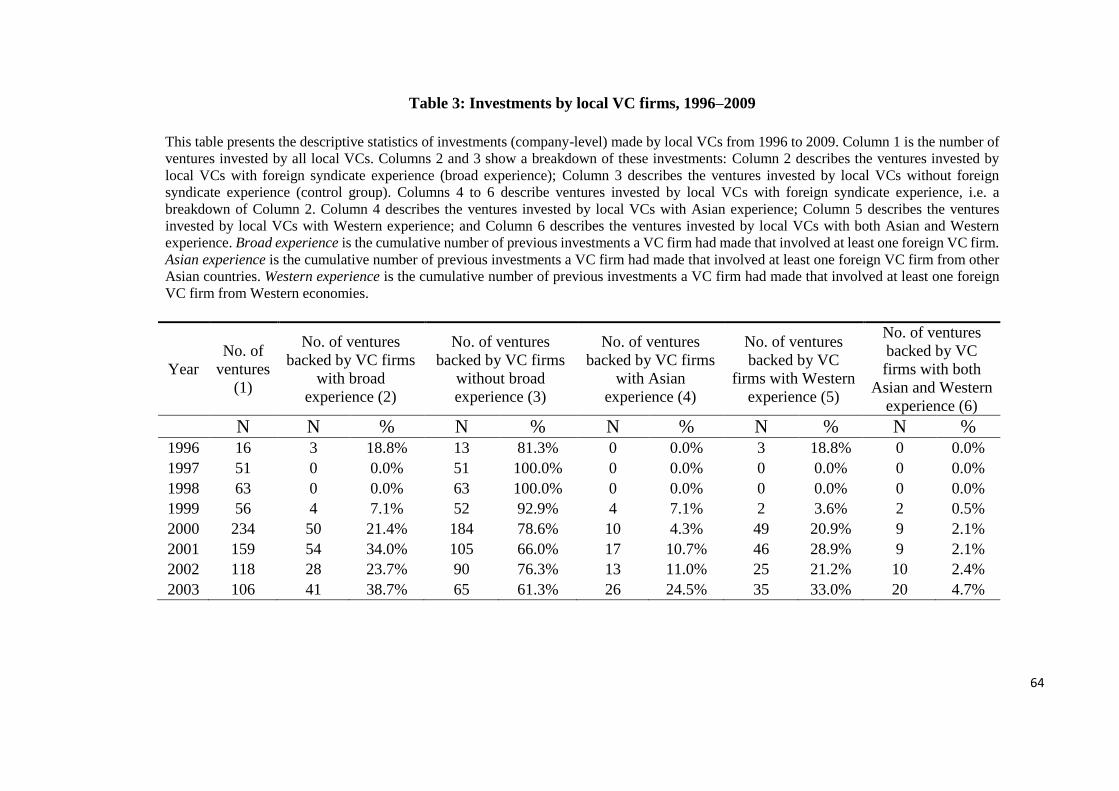
64
Table 3: Investments by local VC firms, 1996–2009
This table presents the descriptive statistics of investments (company-level) made by local VCs from 1996 to 2009. Column 1 is the number of
ventures invested by all local VCs. Columns 2 and 3 show a breakdown of these investments: Column 2 describes the ventures invested by
local VCs with foreign syndicate experience (broad experience); Column 3 describes the ventures invested by local VCs without foreign
syndicate experience (control group). Columns 4 to 6 describe ventures invested by local VCs with foreign syndicate experience, i.e. a
breakdown of Column 2. Column 4 describes the ventures invested by local VCs with Asian experience; Column 5 describes the ventures
invested by local VCs with Western experience; and Column 6 describes the ventures invested by local VCs with both Asian and Western
experience. Broad experience is the cumulative number of previous investments a VC firm had made that involved at least one foreign VC firm.
Asian experience is the cumulative number of previous investments a VC firm had made that involved at least one foreign VC firm from other
Asian countries. Western experience is the cumulative number of previous investments a VC firm had made that involved at least one foreign
VC firm from Western economies.
Year
No. of
ventures
(1)
No. of ventures
backed by VC firms
with broad
experience (2)
No. of ventures
backed by VC firms
without broad
experience (3)
No. of ventures
backed by VC firms
with Asian
experience (4)
No. of ventures
backed by VC
firms with Western
experience (5)
No. of ventures
backed by VC
firms with both
Asian and Western
experience (6)
N N % N % N % N % N % 1996 16 3 18.8% 13 81.3% 0 0.0% 3 18.8% 0 0.0%
1997 51 0 0.0% 51 100.0% 0 0.0% 0 0.0% 0 0.0%
1998 63 0 0.0% 63 100.0% 0 0.0% 0 0.0% 0 0.0%
1999 56 4 7.1% 52 92.9% 4 7.1% 2 3.6% 2 0.5%
2000 234 50 21.4% 184 78.6% 10 4.3% 49 20.9% 9 2.1%
2001 159 54 34.0% 105 66.0% 17 10.7% 46 28.9% 9 2.1%
2002 118 28 23.7% 90 76.3% 13 11.0% 25 21.2% 10 2.4%
2003 106 41 38.7% 65 61.3% 26 24.5% 35 33.0% 20 4.7%
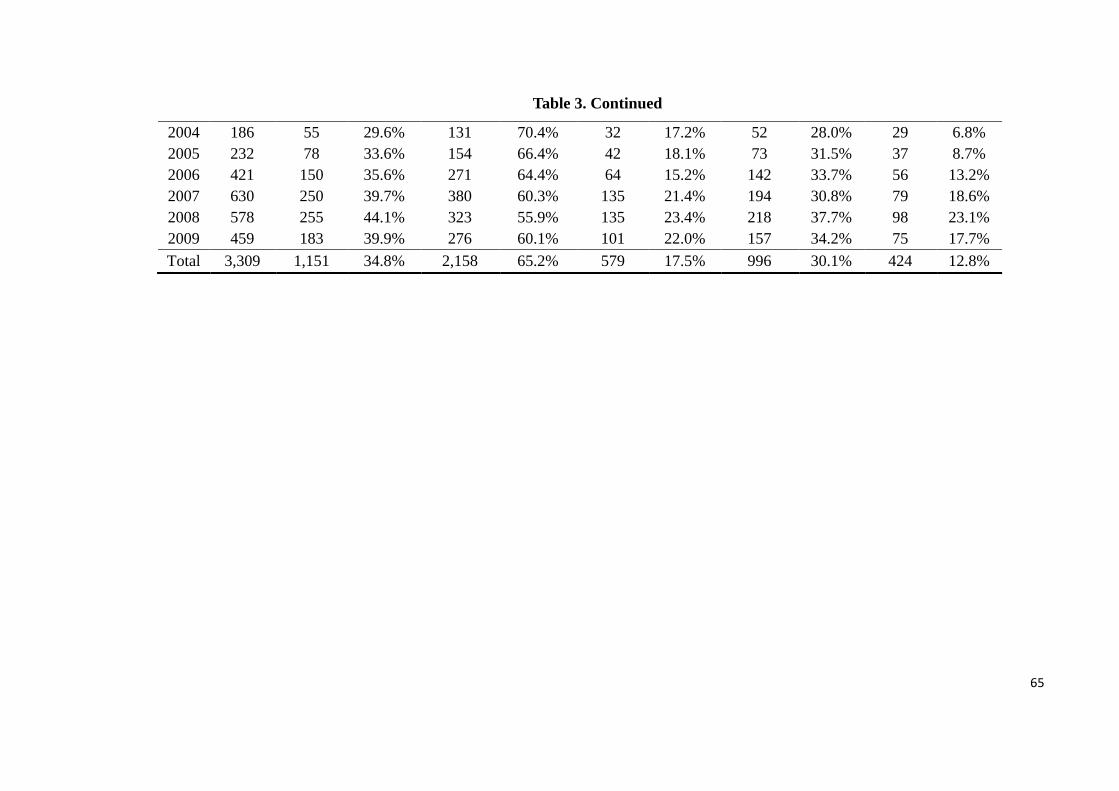
65
Table 3. Continued
2004 186 55 29.6% 131 70.4% 32 17.2% 52 28.0% 29 6.8%
2005 232 78 33.6% 154 66.4% 42 18.1% 73 31.5% 37 8.7%
2006 421 150 35.6% 271 64.4% 64 15.2% 142 33.7% 56 13.2%
2007 630 250 39.7% 380 60.3% 135 21.4% 194 30.8% 79 18.6%
2008 578 255 44.1% 323 55.9% 135 23.4% 218 37.7% 98 23.1%
2009 459 183 39.9% 276 60.1% 101 22.0% 157 34.2% 75 17.7%
Total 3,309 1,151 34.8% 2,158 65.2% 579 17.5% 996 30.1% 424 12.8%
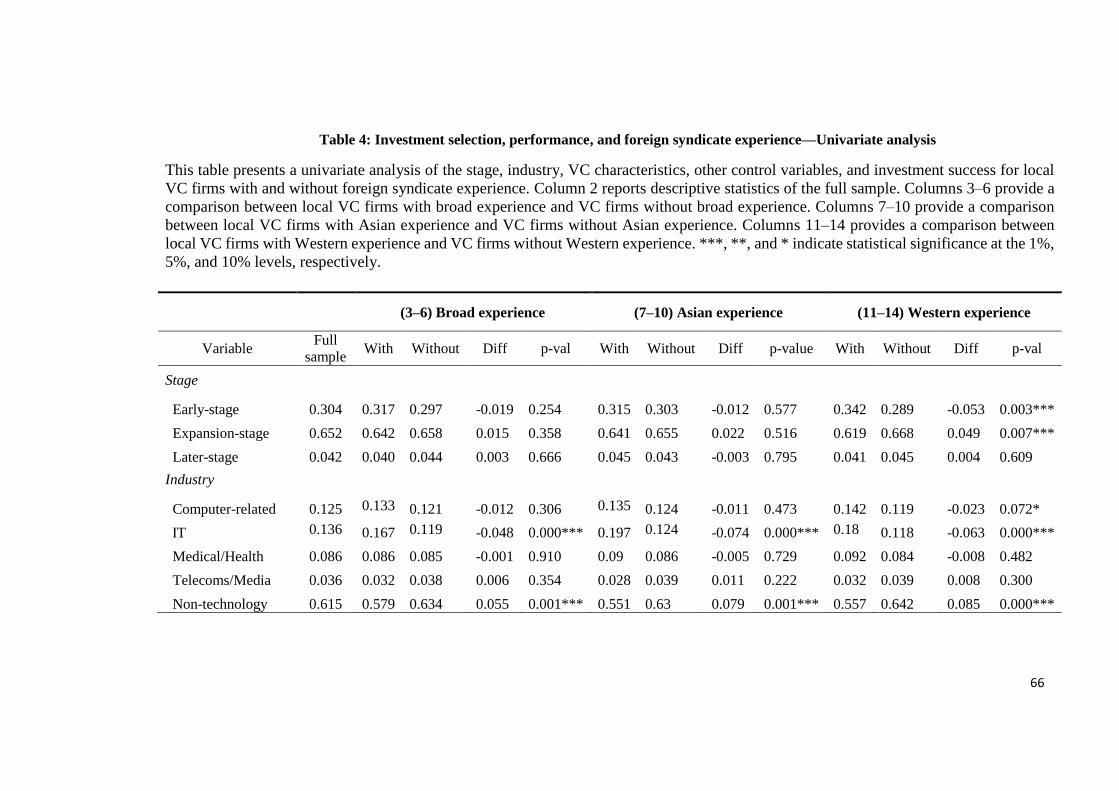
66
Table 4: Investment selection, performance, and foreign syndicate experience—Univariate analysis
This table presents a univariate analysis of the stage, industry, VC characteristics, other control variables, and investment success for local
VC firms with and without foreign syndicate experience. Column 2 reports descriptive statistics of the full sample. Columns 3–6 provide a
comparison between local VC firms with broad experience and VC firms without broad experience. Columns 7–10 provide a comparison
between local VC firms with Asian experience and VC firms without Asian experience. Columns 11–14 provides a comparison between
local VC firms with Western experience and VC firms without Western experience. ***, **, and * indicate statistical significance at the 1%,
5%, and 10% levels, respectively.
(3–6) Broad experience (7–10) Asian experience (11–14) Western experience
Variable Full
sample With Without Diff p-val With Without Diff p-value With Without Diff p-val
Stage
Early-stage 0.304 0.317 0.297 -0.019 0.254 0.315 0.303 -0.012 0.577 0.342 0.289 -0.053 0.003***
Expansion-stage 0.652 0.642 0.658 0.015 0.358 0.641 0.655 0.022 0.516 0.619 0.668 0.049 0.007***
Later-stage 0.042 0.040 0.044 0.003 0.666 0.045 0.043 -0.003 0.795 0.041 0.045 0.004 0.609
Industry
Computer-related 0.125 0.133 0.121 -0.012 0.306 0.135 0.124 -0.011 0.473 0.142 0.119 -0.023 0.072*
IT 0.136 0.167 0.119 -0.048 0.000*** 0.197 0.124 -0.074 0.000*** 0.18 0.118 -0.063 0.000***
Medical/Health 0.086 0.086 0.085 -0.001 0.910 0.09 0.086 -0.005 0.729 0.092 0.084 -0.008 0.482
Telecoms/Media 0.036 0.032 0.038 0.006 0.354 0.028 0.039 0.011 0.222 0.032 0.039 0.008 0.300
Non-technology 0.615 0.579 0.634 0.055 0.001*** 0.551 0.63 0.079 0.001*** 0.557 0.642 0.085 0.000***
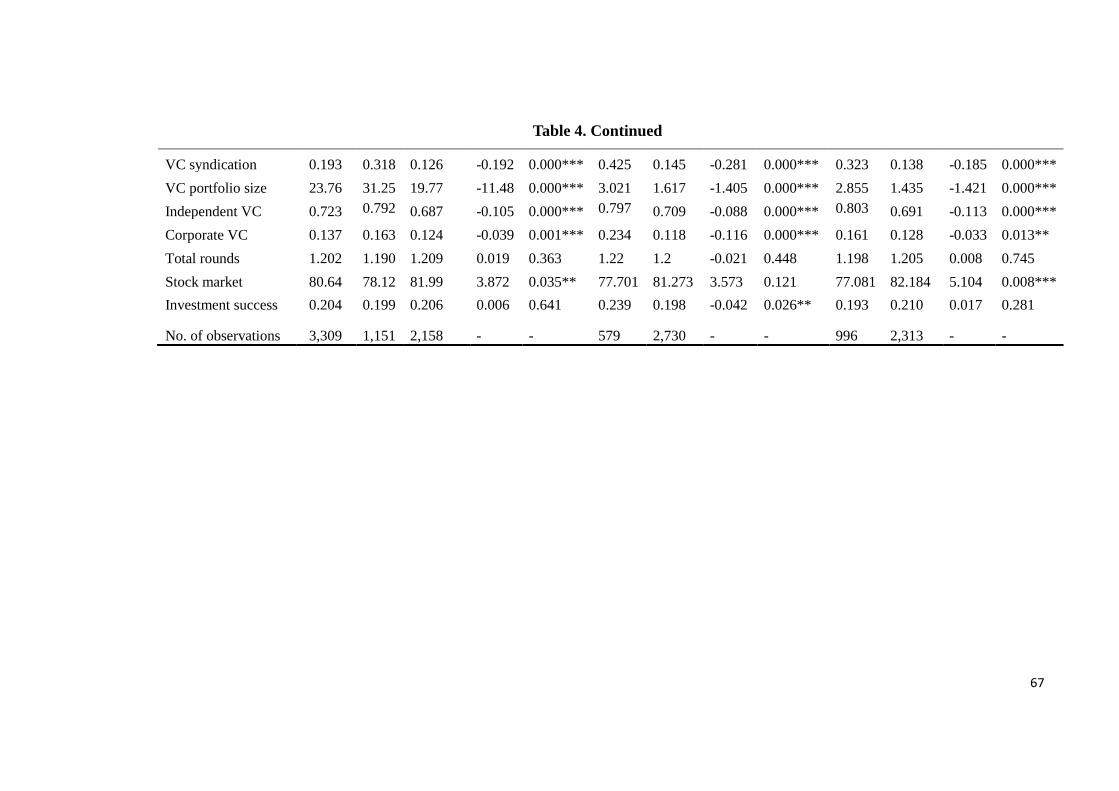
67
Table 4. Continued
VC syndication 0.193 0.318 0.126 -0.192 0.000*** 0.425 0.145 -0.281 0.000*** 0.323 0.138 -0.185 0.000***
VC portfolio size 23.76 31.25 19.77 -11.48 0.000*** 3.021 1.617 -1.405 0.000*** 2.855 1.435 -1.421 0.000***
Independent VC 0.723 0.792 0.687 -0.105 0.000*** 0.797 0.709 -0.088 0.000*** 0.803 0.691 -0.113 0.000***
Corporate VC 0.137 0.163 0.124 -0.039 0.001*** 0.234 0.118 -0.116 0.000*** 0.161 0.128 -0.033 0.013**
Total rounds 1.202 1.190 1.209 0.019 0.363 1.22 1.2 -0.021 0.448 1.198 1.205 0.008 0.745
Stock market 80.64 78.12 81.99 3.872 0.035** 77.701 81.273 3.573 0.121 77.081 82.184 5.104 0.008***
Investment success 0.204 0.199 0.206 0.006 0.641 0.239 0.198 -0.042 0.026** 0.193 0.210 0.017 0.281
No. of observations 3,309 1,151 2,158 - - 579 2,730 - - 996 2,313 - -
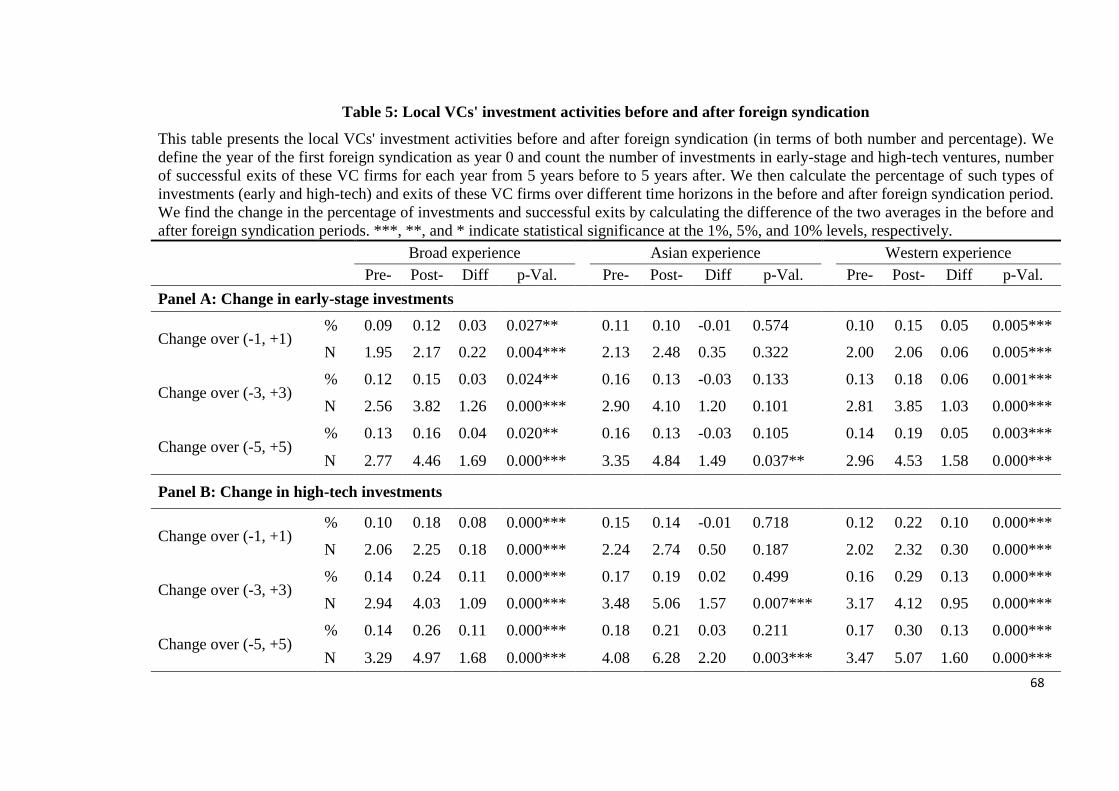
68
Table 5: Local VCs' investment activities before and after foreign syndication
This table presents the local VCs' investment activities before and after foreign syndication (in terms of both number and percentage). We
define the year of the first foreign syndication as year 0 and count the number of investments in early-stage and high-tech ventures, number
of successful exits of these VC firms for each year from 5 years before to 5 years after. We then calculate the percentage of such types of
investments (early and high-tech) and exits of these VC firms over different time horizons in the before and after foreign syndication period.
We find the change in the percentage of investments and successful exits by calculating the difference of the two averages in the before and
after foreign syndication periods. ***, **, and * indicate statistical significance at the 1%, 5%, and 10% levels, respectively.
Broad experience Asian experience Western experience
Pre- Post- Diff p-Val. Pre- Post- Diff p-Val. Pre- Post- Diff p-Val.
Panel A: Change in early-stage investments
Change over (-1, +1) % 0.09 0.12 0.03 0.027** 0.11 0.10 -0.01 0.574 0.10 0.15 0.05 0.005***
N 1.95 2.17 0.22 0.004*** 2.13 2.48 0.35 0.322 2.00 2.06 0.06 0.005***
Change over (-3, +3) % 0.12 0.15 0.03 0.024** 0.16 0.13 -0.03 0.133 0.13 0.18 0.06 0.001***
N 2.56 3.82 1.26 0.000*** 2.90 4.10 1.20 0.101 2.81 3.85 1.03 0.000***
Change over (-5, +5) % 0.13 0.16 0.04 0.020** 0.16 0.13 -0.03 0.105 0.14 0.19 0.05 0.003***
N 2.77 4.46 1.69 0.000*** 3.35 4.84 1.49 0.037** 2.96 4.53 1.58 0.000***
Panel B: Change in high-tech investments
Change over (-1, +1) % 0.10 0.18 0.08 0.000*** 0.15 0.14 -0.01 0.718 0.12 0.22 0.10 0.000***
N 2.06 2.25 0.18 0.000*** 2.24 2.74 0.50 0.187 2.02 2.32 0.30 0.000***
Change over (-3, +3) % 0.14 0.24 0.11 0.000*** 0.17 0.19 0.02 0.499 0.16 0.29 0.13 0.000***
N 2.94 4.03 1.09 0.000*** 3.48 5.06 1.57 0.007*** 3.17 4.12 0.95 0.000***
Change over (-5, +5) % 0.14 0.26 0.11 0.000*** 0.18 0.21 0.03 0.211 0.17 0.30 0.13 0.000***
N 3.29 4.97 1.68 0.000*** 4.08 6.28 2.20 0.003*** 3.47 5.07 1.60 0.000***
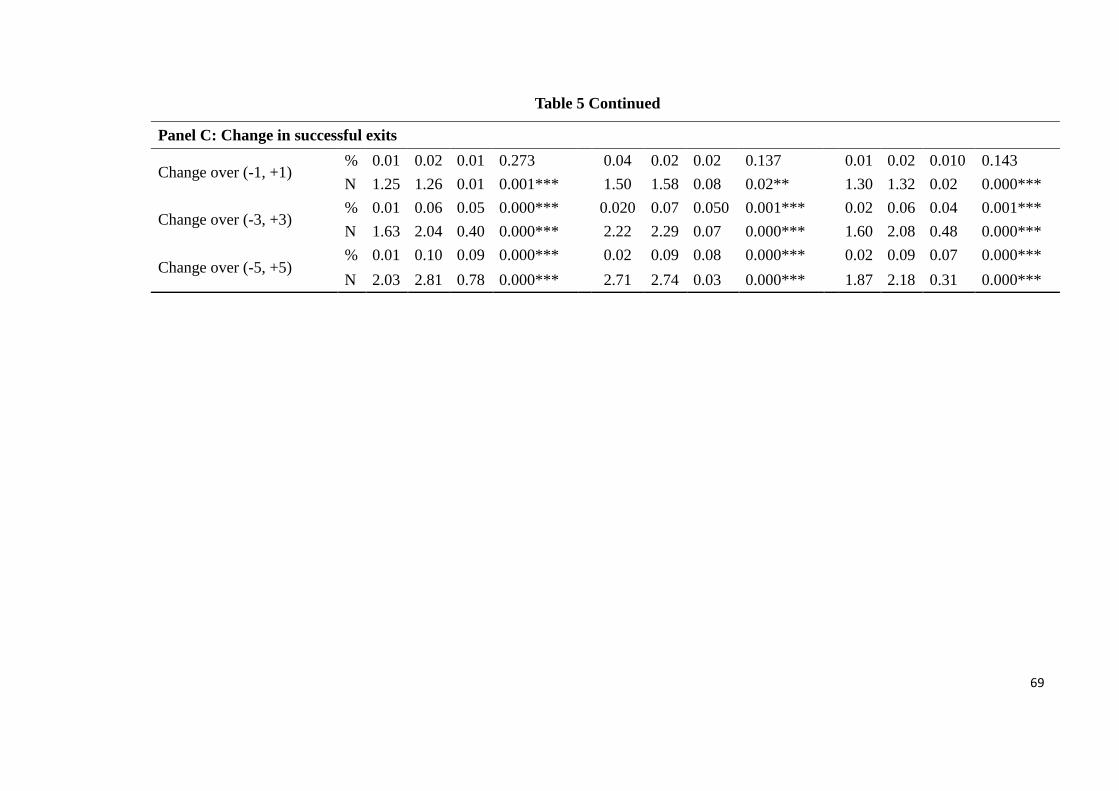
69
Table 5 Continued
Panel C: Change in successful exits
Change over (-1, +1) % 0.01 0.02 0.01 0.273 0.04 0.02 0.02 0.137 0.01 0.02 0.010 0.143
N 1.25 1.26 0.01 0.001*** 1.50 1.58 0.08 0.02** 1.30 1.32 0.02 0.000***
Change over (-3, +3) % 0.01 0.06 0.05 0.000*** 0.020 0.07 0.050 0.001*** 0.02 0.06 0.04 0.001***
N 1.63 2.04 0.40 0.000*** 2.22 2.29 0.07 0.000*** 1.60 2.08 0.48 0.000***
Change over (-5, +5) % 0.01 0.10 0.09 0.000*** 0.02 0.09 0.08 0.000*** 0.02 0.09 0.07 0.000***
N 2.03 2.81 0.78 0.000*** 2.71 2.74 0.03 0.000*** 1.87 2.18 0.31 0.000***
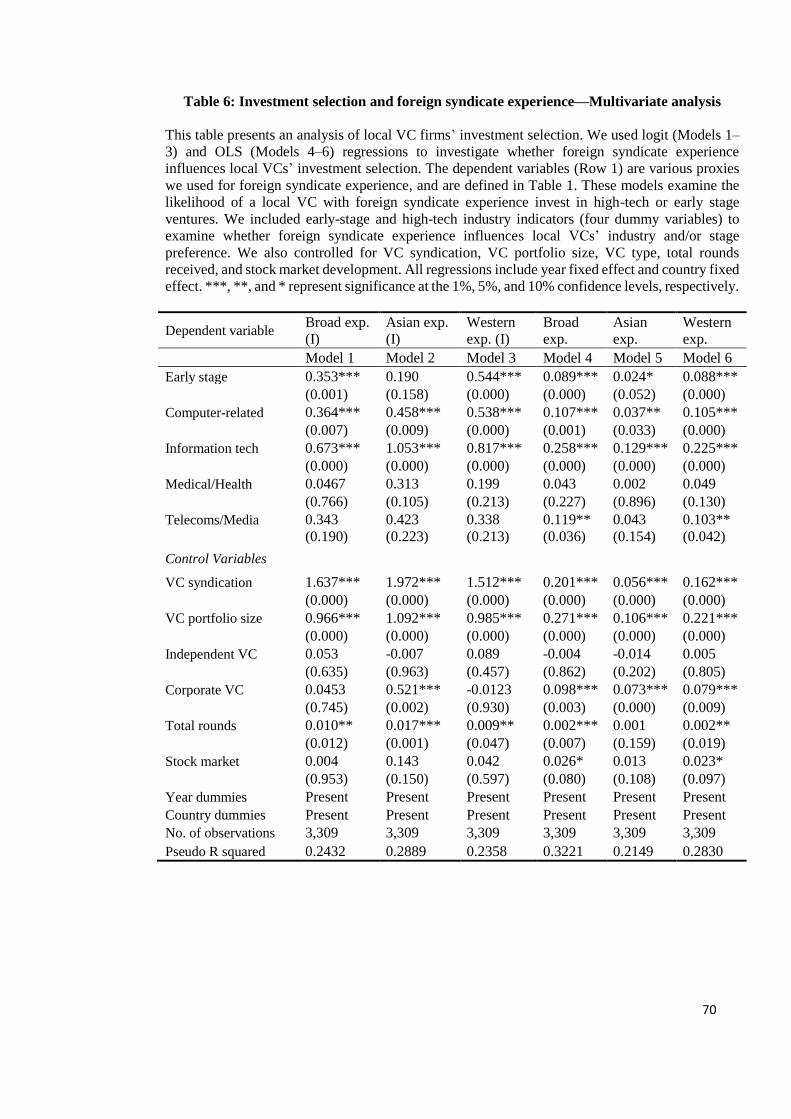
70
Table 6: Investment selection and foreign syndicate experience—Multivariate analysis
This table presents an analysis of local VC firms’ investment selection. We used logit (Models 1–
3) and OLS (Models 4–6) regressions to investigate whether foreign syndicate experience
influences local VCs’ investment selection. The dependent variables (Row 1) are various proxies
we used for foreign syndicate experience, and are defined in Table 1. These models examine the
likelihood of a local VC with foreign syndicate experience invest in high-tech or early stage
ventures. We included early-stage and high-tech industry indicators (four dummy variables) to
examine whether foreign syndicate experience influences local VCs’ industry and/or stage
preference. We also controlled for VC syndication, VC portfolio size, VC type, total rounds
received, and stock market development. All regressions include year fixed effect and country fixed
effect. ***, **, and * represent significance at the 1%, 5%, and 10% confidence levels, respectively.
Dependent variable Broad exp.
(I)
Asian exp.
(I)
Western
exp. (I)
Broad
exp.
Asian
exp.
Western
exp.
Model 1 Model 2 Model 3 Model 4 Model 5 Model 6
Early stage 0.353*** 0.190 0.544*** 0.089*** 0.024* 0.088***
(0.001) (0.158) (0.000) (0.000) (0.052) (0.000)
Computer-related 0.364*** 0.458*** 0.538*** 0.107*** 0.037** 0.105***
(0.007) (0.009) (0.000) (0.001) (0.033) (0.000)
Information tech 0.673*** 1.053*** 0.817*** 0.258*** 0.129*** 0.225***
(0.000) (0.000) (0.000) (0.000) (0.000) (0.000)
Medical/Health 0.0467 0.313 0.199 0.043 0.002 0.049
(0.766) (0.105) (0.213) (0.227) (0.896) (0.130)
Telecoms/Media 0.343 0.423 0.338 0.119** 0.043 0.103**
(0.190) (0.223) (0.213) (0.036) (0.154) (0.042)
Control Variables
VC syndication 1.637*** 1.972*** 1.512*** 0.201*** 0.056*** 0.162***
(0.000) (0.000) (0.000) (0.000) (0.000) (0.000)
VC portfolio size 0.966*** 1.092*** 0.985*** 0.271*** 0.106*** 0.221***
(0.000) (0.000) (0.000) (0.000) (0.000) (0.000)
Independent VC 0.053 -0.007 0.089 -0.004 -0.014 0.005
(0.635) (0.963) (0.457) (0.862) (0.202) (0.805)
Corporate VC 0.0453 0.521*** -0.0123 0.098*** 0.073*** 0.079***
(0.745) (0.002) (0.930) (0.003) (0.000) (0.009)
Total rounds 0.010** 0.017*** 0.009** 0.002*** 0.001 0.002**
(0.012) (0.001) (0.047) (0.007) (0.159) (0.019)
Stock market 0.004 0.143 0.042 0.026* 0.013 0.023*
(0.953) (0.150) (0.597) (0.080) (0.108) (0.097)
Year dummies Present Present Present Present Present Present
Country dummies Present Present Present Present Present Present
No. of observations 3,309 3,309 3,309 3,309 3,309 3,309
Pseudo R squared 0.2432 0.2889 0.2358 0.3221 0.2149 0.2830
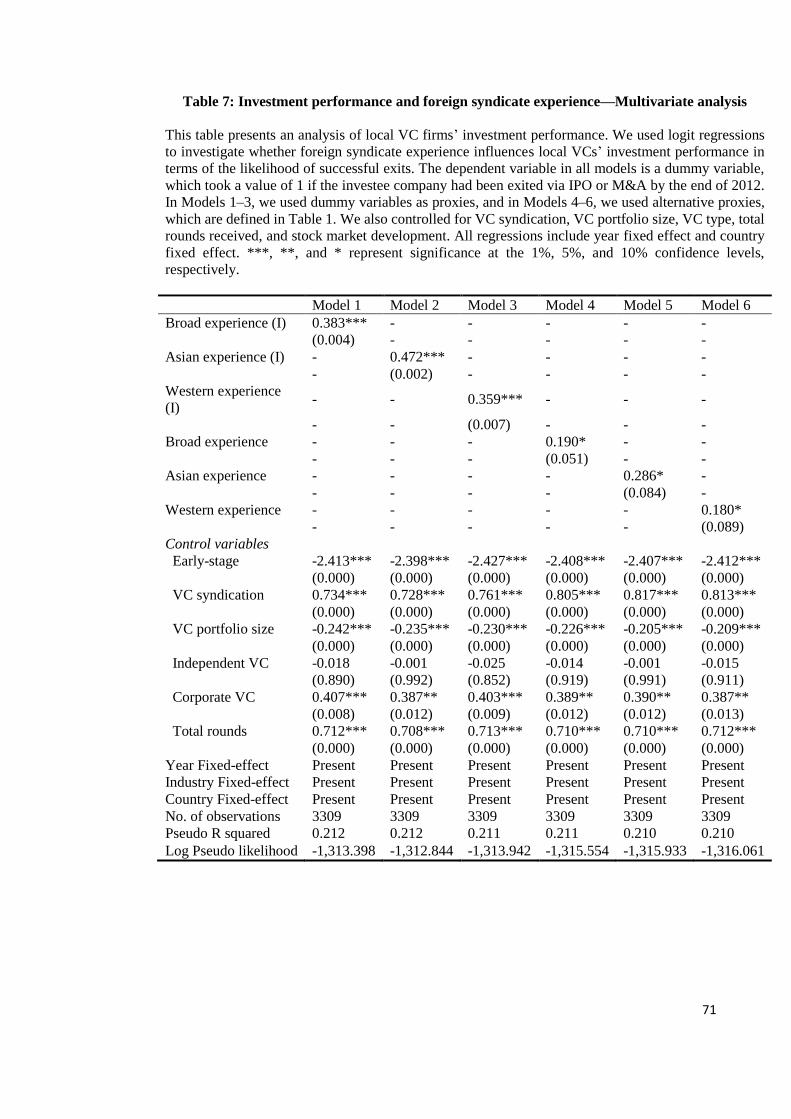
71
Table 7: Investment performance and foreign syndicate experience—Multivariate analysis
This table presents an analysis of local VC firms’ investment performance. We used logit regressions
to investigate whether foreign syndicate experience influences local VCs’ investment performance in
terms of the likelihood of successful exits. The dependent variable in all models is a dummy variable,
which took a value of 1 if the investee company had been exited via IPO or M&A by the end of 2012.
In Models 1–3, we used dummy variables as proxies, and in Models 4–6, we used alternative proxies,
which are defined in Table 1. We also controlled for VC syndication, VC portfolio size, VC type, total
rounds received, and stock market development. All regressions include year fixed effect and country
fixed effect. ***, **, and * represent significance at the 1%, 5%, and 10% confidence levels,
respectively.
Model 1 Model 2 Model 3 Model 4 Model 5 Model 6
Broad experience (I) 0.383*** - - - - -
(0.004) - - - - -
Asian experience (I) - 0.472*** - - - -
- (0.002) - - - -
Western experience
(I) - - 0.359*** - - -
- - (0.007) - - -
Broad experience - - - 0.190* - -
- - - (0.051) - -
Asian experience - - - - 0.286* -
- - - - (0.084) -
Western experience - - - - - 0.180*
- - - - - (0.089)
Control variables
Early-stage -2.413*** -2.398*** -2.427*** -2.408*** -2.407*** -2.412***
(0.000) (0.000) (0.000) (0.000) (0.000) (0.000)
VC syndication 0.734*** 0.728*** 0.761*** 0.805*** 0.817*** 0.813***
(0.000) (0.000) (0.000) (0.000) (0.000) (0.000)
VC portfolio size -0.242*** -0.235*** -0.230*** -0.226*** -0.205*** -0.209***
(0.000) (0.000) (0.000) (0.000) (0.000) (0.000)
Independent VC -0.018 -0.001 -0.025 -0.014 -0.001 -0.015
(0.890) (0.992) (0.852) (0.919) (0.991) (0.911)
Corporate VC 0.407*** 0.387** 0.403*** 0.389** 0.390** 0.387**
(0.008) (0.012) (0.009) (0.012) (0.012) (0.013)
Total rounds 0.712*** 0.708*** 0.713*** 0.710*** 0.710*** 0.712***
(0.000) (0.000) (0.000) (0.000) (0.000) (0.000)
Year Fixed-effect Present Present Present Present Present Present
Industry Fixed-effect Present Present Present Present Present Present
Country Fixed-effect Present Present Present Present Present Present
No. of observations 3309 3309 3309 3309 3309 3309
Pseudo R squared 0.212 0.212 0.211 0.211 0.210 0.210
Log Pseudo likelihood -1,313.398 -1,312.844 -1,313.942 -1,315.554 -1,315.933 -1,316.061
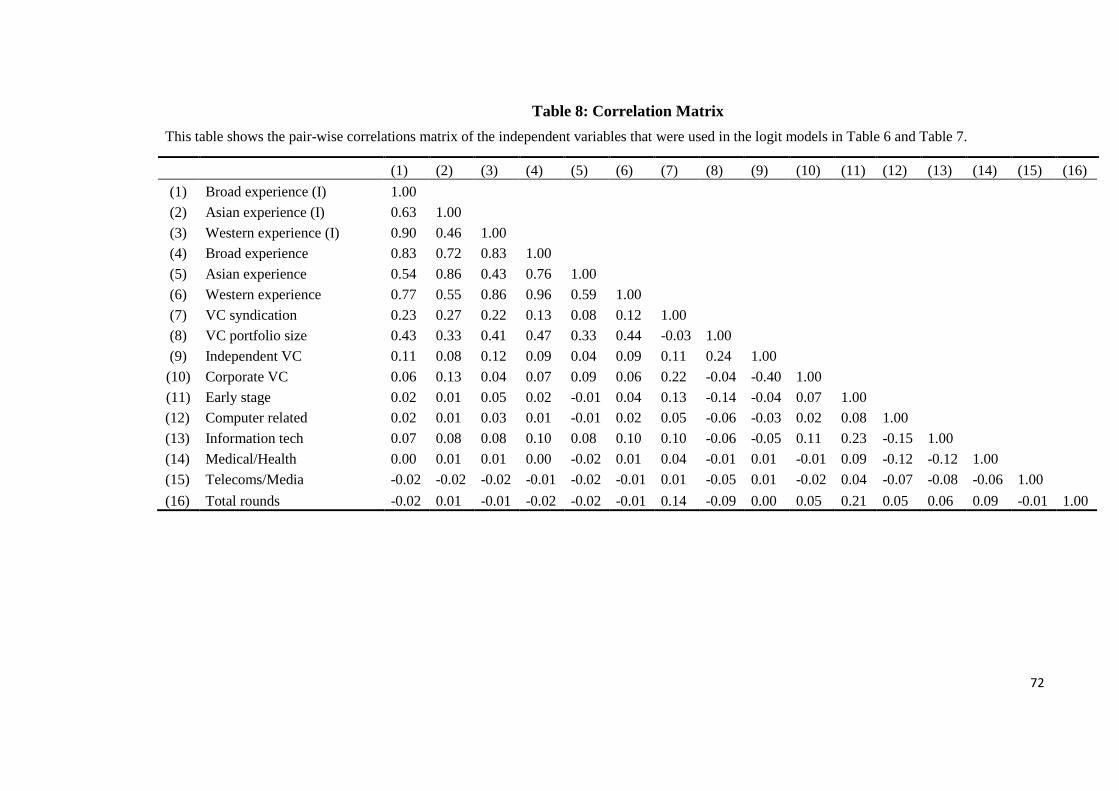
72
Table 8: Correlation Matrix
This table shows the pair-wise correlations matrix of the independent variables that were used in the logit models in Table 6 and Table 7.
(1) (2) (3) (4) (5) (6) (7) (8) (9) (10) (11) (12) (13) (14) (15) (16)
(1) Broad experience (I) 1.00
(2) Asian experience (I) 0.63 1.00
(3) Western experience (I) 0.90 0.46 1.00
(4) Broad experience 0.83 0.72 0.83 1.00
(5) Asian experience 0.54 0.86 0.43 0.76 1.00
(6) Western experience 0.77 0.55 0.86 0.96 0.59 1.00
(7) VC syndication 0.23 0.27 0.22 0.13 0.08 0.12 1.00
(8) VC portfolio size 0.43 0.33 0.41 0.47 0.33 0.44 -0.03 1.00
(9) Independent VC 0.11 0.08 0.12 0.09 0.04 0.09 0.11 0.24 1.00
(10) Corporate VC 0.06 0.13 0.04 0.07 0.09 0.06 0.22 -0.04 -0.40 1.00
(11) Early stage 0.02 0.01 0.05 0.02 -0.01 0.04 0.13 -0.14 -0.04 0.07 1.00
(12) Computer related 0.02 0.01 0.03 0.01 -0.01 0.02 0.05 -0.06 -0.03 0.02 0.08 1.00
(13) Information tech 0.07 0.08 0.08 0.10 0.08 0.10 0.10 -0.06 -0.05 0.11 0.23 -0.15 1.00
(14) Medical/Health 0.00 0.01 0.01 0.00 -0.02 0.01 0.04 -0.01 0.01 -0.01 0.09 -0.12 -0.12 1.00
(15) Telecoms/Media -0.02 -0.02 -0.02 -0.01 -0.02 -0.01 0.01 -0.05 0.01 -0.02 0.04 -0.07 -0.08 -0.06 1.00
(16) Total rounds -0.02 0.01 -0.01 -0.02 -0.02 -0.01 0.14 -0.09 0.00 0.05 0.21 0.05 0.06 0.09 -0.01 1.00
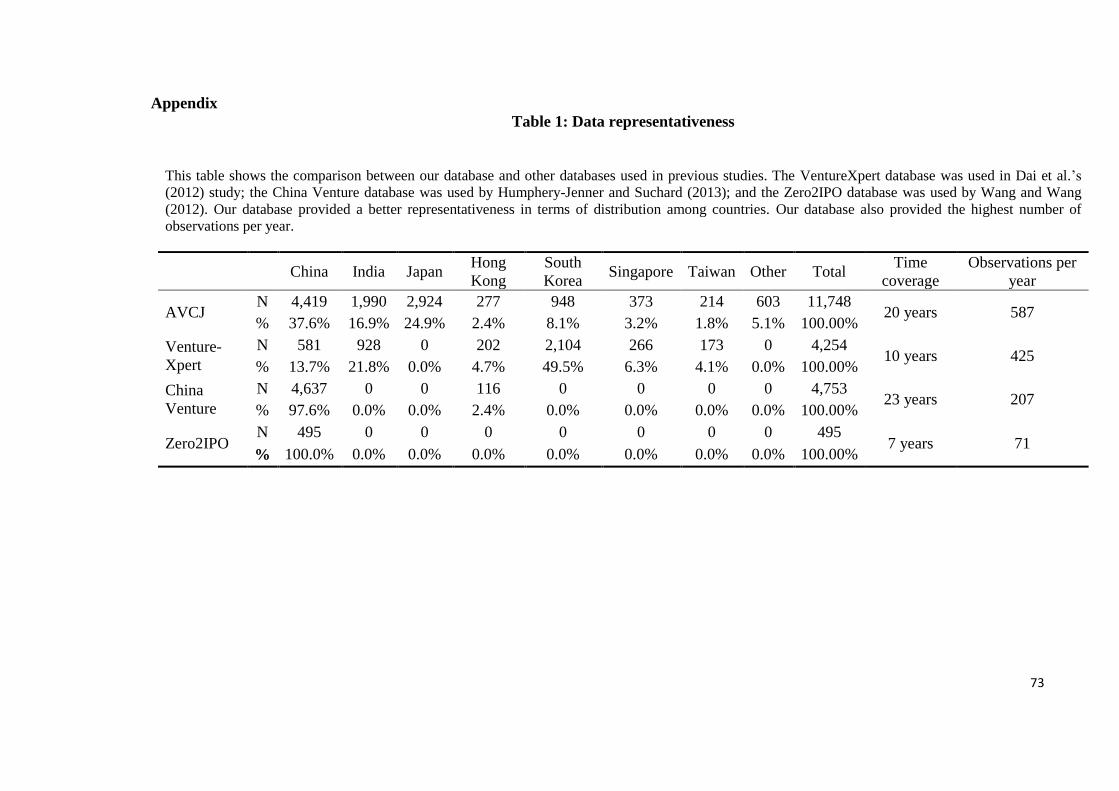
73
Appendix
Table 1: Data representativeness
This table shows the comparison between our database and other databases used in previous studies. The VentureXpert database was used in Dai et al.’s
(2012) study; the China Venture database was used by Humphery-Jenner and Suchard (2013); and the Zero2IPO database was used by Wang and Wang
(2012). Our database provided a better representativeness in terms of distribution among countries. Our database also provided the highest number of
observations per year.
China India Japan Hong
Kong
South
Korea Singapore Taiwan Other Total
Time
coverage
Observations per
year
AVCJ N 4,419 1,990 2,924 277 948 373 214 603 11,748
20 years 587 % 37.6% 16.9% 24.9% 2.4% 8.1% 3.2% 1.8% 5.1% 100.00%
Venture-
Xpert
N 581 928 0 202 2,104 266 173 0 4,254 10 years 425
% 13.7% 21.8% 0.0% 4.7% 49.5% 6.3% 4.1% 0.0% 100.00%
China
Venture
N 4,637 0 0 116 0 0 0 0 4,753 23 years 207
% 97.6% 0.0% 0.0% 2.4% 0.0% 0.0% 0.0% 0.0% 100.00%
Zero2IPO N 495 0 0 0 0 0 0 0 495
7 years 71 % 100.0% 0.0% 0.0% 0.0% 0.0% 0.0% 0.0% 0.0% 100.00%
74
Chapter 3
Do Venture Capital Firms Benefit as Boards of Directors in
Mature Public Companies?
Abstract
This paper examines the benefits to venture capital firms through their directorships in
mature public companies. We investigate the benefits to venture capital firms in terms of
fundraising and investment performance. First, our empirical results show that venture
capital firms raise more funds and set higher fund-raising targets during the post-
directorship period. Second, we show that venture capital firms are more likely to exit
successfully from their investments post-appointment as a board of director in an S&P
1500 company. Our results indicate that being on the board of mature public companies
brings tangible benefits to venture capital firms.
75
3.1 Introduction
Venture capitalists (VCs) have long been recognised as providers of capital, and monitors
of small and young businesses. Only recently have VC firms’ roles in mature public firms
been brought to the attention of academics and professionals alike. A recent study by
Celikyurt, Sevilir, and Shivdasani (2012) examined the role of VC directors in mature
public companies. They documented that 30.5 percent of Standard & Poor (S&P) 1500
companies had directors with a VC background prior to their appointment on the board.
They found that the presence of VC directors on the board is strongly associated with
greater innovation activity by mature firms. In addition, the presence of VC directors also
increases the likelihood that the firm will acquire a VC-backed firm, establish strategic
alliances with other VC-backed firms, and will undertake corporate venture capital
investments in start-up companies. Because the focus of their study was on the benefits
to mature firms of having VC directors on the board, the question of whether VC firms
benefit by being on the board of mature public companies thus remained unexplored. In
this paper, we aim to fill this gap by examining whether VC firms benefit from being on
the boards of mature public companies. We investigate the potential (but crucial) benefits
to VC firms, which are mainly fundraising and investment performance.
We followed Celikyurt et al. (2012) to construct our VC director sample, which covers
the period from 1998 to 2011. Our final sample consists of 1,359 unique VC directors
working in 700 different VC firms. We collected VC fundraising, VC investments, VC
firms, and exits data from VentureXpert, which has been used extensively in previous
studies (Nahata, 2008; Cumming and Dai, 2010).
76
The first benefit we examined was VC fundraising, which a number of previous studies
have examined (Gompers and Lerner, 1998; Gompers, 1996; Jeng and Wells, 2000;
Mayer et al., 2004). In general, these studies have found that reputation increases VC
firms’ ability to raise new capital, and reputation is achieved through taking portfolio
companies public quickly (i.e. VC ‘grandstanding’). In our study, we postulated that
directorships in mature public companies can also lead to an improved fundraising
performance. Although our univariate analysis indicated that there is a significant
difference between VC firms with directorships and VC firms without directorships, this
difference could have been due either to the selection effect or the treatment effect. We
addressed these concerns by comparing fundraising performance during pre- and post-
directorship appointment periods, and found that better performance was due to
directorship. In addition, we used the difference-in-difference method to address the
concern that the difference could be due to the industry effect (i.e. VC firms raise more
funds when the industry is booming), and yet the results remained quantitatively the same.
Overall, our results show that directorships in mature public companies benefit VC firms
in terms of fundraising performance.
The second benefit we examined is VC investment performance. A number of recent
studies have examined VC firms’ role as knowledge intermediaries (González-Uribe,
2013; Dessi and Yin, 2014). These studies have shown that VC investors can
communicate valuable knowledge to entrepreneurs, and to other portfolio companies,
thus facilitating innovation. Based on these earlier findings, we questioned whether VC
firms can also transfer knowledge and experience gained in mature public companies to
their small non-public portfolio companies, and thus improve their investment
77
performance, as measured by the likelihood of a successful exit (Cumming and Dai, 2010;
Dai et al., 2012; Nahata, 2008). Our empirical results show that VC firms improve their
investment performance after becoming directors in mature public companies, and better
investment performance is due to their status as director and not due to their reputation
during the pre-appointment period.
Overall, our results show that VC firms do benefit from their directorships in S&P 1500
companies in terms of fundraising and investment performance. Specifically, VC firms
raise more funds, set higher fundraising targets, and have a higher likelihood of successful
exits after being directors in mature public companies. These results are consistent when
controlling for a matched sample of VC firms with similar reputation, but without
directorships in mature public companies.
The rest of this paper is organised as follows. Section 2 highlights related studies and
raises testable hypotheses; Section 3 provides an outline of the study, as well as data and
methodology; Section 4 analyses the empirical results; and Section 5 concludes the paper.
3.2 Literature review and hypothesis development
3.2.1 VC characteristics and directorships
Before analysing the potential benefits that accrue to VC firms, we focussed on the
characteristics of VC firms that make them more likely to build connections with public
78
companies. As suggested by Celikyurt et al. (2012), mature public companies select
directors with VC backgrounds based on the anticipated experience and expertise that
may be brought by these VC directors.9 VC firms’ experience and reputation within the
VC industry are therefore likely to influence public companies’ choices and decisions.
We used initial public offering (IPO) market share and VC investment share to measure
VC firms’ reputation, similarly to how Nahata (2008) and Krishnan et al. (2011) measured
these factors in their studies. We measured IPO market share as the dollar market value
of all companies taken public by the VC firm from the beginning of calendar year 1980
up until a given calendar year, normalised by the aggregate market value of all VC-backed
companies that went public during those years. The VC investment share is the dollar
investment made by a VC firm from the beginning of 1980 up until a given calendar year,
normalised by the overall aggregate investment in the VC industry in those years. We
postulate that reputable VC firms, which have higher IPO market share and VC
investment shares, are more visible and potentially more valuable to mature public
companies, and hence they are likely to obtain board seats.
In addition to reputation, we also examined other characteristics of VC firms. Specifically,
we examined VC firms’ age, size, location, and type. We used the total number of years
a firm had experience as a VC investor (Cumming et al., 2006) as a measure of VC firms’
experience. We posit that because older VC firms are more experienced, knowledgeable,
and credible, they are therefore more likely to be selected as directors by S&P 1500
companies. We classified all VC firms into two categories: ‘independent VCs’ and
9 For instance, in an article in the Silicon Valley Business Journal (23 June 2014), Intel announced that
Aneel Bhusri, CEO of Greylock Partners, had joined the company’s board. Intel said: ‘We are very pleased
to have Aneel Bhusri as an Intel director. His more than 20 years’ experience in enterprise software
innovation and cloud computing will increase our board’s depth in areas that are key to Intel’s business and
crucial in today’s connected world’.
79
‘others’. Independent VC firms are traditional VC firms that are not affiliated with any
corporations, banks, or governments, while those with such affiliations are defined as
‘others’. Given that S&P 1500 companies invite VCs to join the board to add value, it is
unlikely that they would invite non-independent VC firms to join the board of directors.10
Such ‘captive’ VC firms, especially corporate VC firms, thus are far less likely than
independent VC firms to attain directorships.
Finally, we examined whether the location of VC firms influences the likelihood of
obtaining directorships. VC firms based in U.S. venture hotbeds (California and New
York State) are exposed to more entrepreneurial activities than those based in other states
(Gompers et al., 2005). These VC firms might be more experienced in evaluating and
cultivating young firms than other VC firms, which is potentially valuable for S&P 1500
companies.11 We therefore posit that VC firms based in venture hotbeds are more likely
to obtain directorships. Based on the above discussion, we therefore developed the
following hypothesis:
Hypothesis 1: More reputable, older, larger, and independent VC firms, and those based
in venture hotbeds, are more likely to join the boards of directors of S&P 1500 companies.
3.2.2 Directorships and VC fundraising
10 For instance, it is unlikely that the semiconductor company Qualcomm would consider inviting someone
from Intel Capital to join its board of directors. 11 For example, generally speaking, a VC firm based in California would be more appealing to S&P 1500
companies than a VC firm based in Nebraska.
80
Gompers and Lerner (1998) examined the fundraising process within the context of the
U.S. VC market and found that economic growth, R&D expenditures, and firm-specific
reputation and performance influence fundraising. Further, they found that VC firms tend
to hold larger equity stakes in firms that have recently gone public in order to raise greater
amounts of funds. A related study by Gompers (1996) showed that young VC firms tend
to rush to IPOs in order to facilitate their future fundraising. Evidence from outside the
United States also shows similar findings. Jeng and Wells (2000) and Mayer et al. (2004)
examined the impact of a series of factors such as IPOs, accounting standards, labour
markets, and economic growth on the ability of VC firms to raise new capital. They
showed that the ability to take companies public determines the ability to raise new capital.
Our analysis extends prior studies by incorporating another potentially important
determinant of VC fundraising: reputation. Previous studies have found that a good
reputation increases VC firms’ abilities to raise new capital. The reputation of VC firms
is achieved by bringing their portfolio companies to IPOs as early as possible, i.e. by VC
‘grandstanding’ (Gompers, 1996). We postulate, however, that VC firms can gain
reputation through directorships in mature public companies. Board seats in S&P 1500
companies provide visibility, credibility, and enhanced networks for VC professionals,
which may in turn improve VC firms’ ability to raise new capital. The measures we used
are total amounts raised and target amounts. The total amount equals the sum of all funds
raised by a particular VC firm during the sampling period (1980–2013); the target amount
is the sum of all target funds of VC firms during the sampling period. The total amount
raised objectively measures the results of fundraising, while the target amount captures
VC firms’ subjective perception. We posit that VC firms, after obtaining directorships,
are not only better able to raise new funds, but also become more confident in their ability
81
to raise funds. Therefore, we hypothesise that directorships in S&P 1500 companies will
increase the total amount VC firms raise, and the target amounts VC firms set:
Hypothesis 2a: Directorships in S&P 1500 companies will increase the total amounts VC
firms raise.
Hypothesis 2b: Directorships in S&P 1500 companies will increase the target amounts
that VC firms set.
3.2.3 Directorships and investment performance
Various studies, including those by Cumming and Johan (2008), Giot and Schwienbacher
(2007), and Isaksson (2007), have examined VC exits in different contexts. A large body
of literature has concluded that exits are influenced by various factors. These studies have
reported that the characteristics of VC firms and investee companies affect the likelihood
of exits (Cumming and Johan, 2008; Elisabete, Cesaltina, and Mohamed, 2008). Others
(Cumming et al., 2006; Cumming and MacIntosh, 2003) have found that better economic
conditions and legal environments increase the likelihood of exits. In addition, VC
syndication (Megginson and Weiss, 1991; Lerner, 1994; Giot and Schwienbacher, 2007),
geographical distance, and cultural disparity (Cumming and Dai, 2010) also influence
VCs firms’ exits within the context of cross-border VC investments.
Only recently have VC firms’ roles in mature public firms been brought to attention.
Celikyurt et al.’s (2012) study found that VC directors in mature public companies
significantly improve public companies’ innovation activities. Following Celikyurt et al.

82
(2012) and González-Uribe (2013), Dessi and Yin (2014) further examined VC firms’
role as knowledge intermediaries. For instance, they found that VC investors can
communicate valuable knowledge to entrepreneurs, and to other portfolio companies,
thus facilitating innovation.
We measured investment performance in the current study by the likelihood of a
successful exit, which has been used extensively by previous studies (Cumming and Dai,
2010; Dai et al., 2012; Nahata, 2008). We postulate that being on the board of mature
public companies provides VC professionals access to better knowledge and experience
of the product, market, and the industry, which could be transferred to their portfolio
companies and therefore improve performance. In other words, VC firms benefit from
their directorships in mature public companies in the form of the ability to take their
portfolio companies to successful exits. We therefore hypothesise that directorships in
S&P 1500 companies could increase the likelihood of a successful exit:
Hypothesis 3: Directorships in S&P 1500 companies will increase the likelihood of a
successful exit.
3.3 Data and methodology
3.3.1 Data and sample
We followed the method used by Celikyurt et al. (2012) to construct our initial sample.
83
We collected director data from the RiskMetrics12 database, which provides information
on directors of S&P 1500 firms from 1996 onwards. The RiskMetrics database reports
the directors’ primary employment, committees they serve on, their board affiliations,
shares held, total voting power, etc. Our sample covers U.S. companies from 1998 to 2011,
and extends the sample studied by Celikyurt et al. (2012).13 To identify VC directors, we
adopted a two-step method. In the first step, we searched for keywords that might define
a VC firm in four different employment-related data items provided by RiskMetrics for
each individual director.14The employment-related data items that we searched were the
primary company name, employment category, other employment title, and type of
services for each director. If at least one of the keywords we searched was available in
any of these data items, we considered the director as a potential VC director. In the
second step, we hand-collected information on VC director candidates from the
VentureXpert database in the Securities Data Company (SDC) database. We only
recorded candidates as VC directors if they were from VC firms that were in the
VentureXpert database; this was to avoid including directors that may have self-described
themselves as a venture capitalist based on their experience as a private investor, but who
lacked the skills and networks associated with working at a VC firm. After these two
steps, we identified 1,359 unique VC directors working in 700 different VC firms. In
addition, we collected information on VC directors’ year of joining in order to more
accurately measure the starting point of potential benefits.15 For instance, if a VC became
a director of Company A in 2006 but joined VC firm B in 2009, we considered 2009 as
12 Formerly known as the Investor Responsibility Research Center (IRRC). 13 Our sample starts in 1998 because this is the first year that the IRRC database collected primary
employment data on directors, which is one of the main data items we needed for our analysis. 14 The keywords are: venture, capital, partner, fund, investor, angel, finance, financial, and management. 15 We also collected the job title of each VC director in the VC firm, although we only recorded the title of
the VC director if he or she was a founder of the VC firm, because other titles are time-varying.
84
the starting point, rather than 2006. We collected this information primarily from VC
firms’ websites, with supplementary sources such as Bloomberg and Forbes. We collected
fundraising, VC investments, VC firms, and exits data from VentureXpert (SDC
Platinum), which is the official database used by the National Venture Capital Association
(NVCA), and has been used extensively by previous studies.
Table 2 presents a summary of the statistics of our sample. Panel A shows VC firms’
directorships in S&P 1500 companies. As shown, on average, each VC firm was
associated with around two S&P 1500 companies, while the maximum number ranged up
to 25. This suggests that there were significant differences among VC firms in terms of
their affiliation with public companies. The majority of firms were associated with one
S&P 1500 company, while only a small number of VC firms had multiple affiliations. In
addition, as shown in the table, it is common for VC firms to send multiple partners to sit
on boards, as suggested by the number of directors per VC firm on the board of S&P 1500
companies. Similarly, S&P 1500 companies usually invite more than one VC director to
sit on the board. Again, these numbers vary significantly among different VC firms. Panel
B presents the descriptive statistics of VC directors’ experience.
As shown in the table, most VC firms joined the S&P 1500 boards around 1999, and most
VC firms joined/started the VC firm around the same time. As discussed above, there are
two types of VC directors in our sample: those who joined the S&P 1500 board first, then
joined/started the VC firm (15 percent); and those who started their careers as venture
capitalists, then became directors of S&P 1500 companies (85 percent). For the former
case, they stayed on the board for around six years before they joined/started the VC firm.
The latter spent on average seven years in a VC firm before starting their directorships in
85
S&P 1500 companies. Panel C describes VC directors’ roles within the VC firm and the
S&P 1500 company. We found that 37 percent of our VC directors were the founder/co-
founder of the VC firms they were associated with, suggesting that S&P 1500 companies
tend to favour the most experienced and reputable VCs in the industry. In terms of VC
directors’ roles within the S&P 1500 companies, 7 percent held the chair/vice-chair
positions; 8 percent held CEO, CFO, and/or COO positions; and 9 percent held
president/vice-president positions. The majority (82 percent), however, did not hold the
above positions. This is also shown by the classification of ‘directorship’: 77 percent of
the VC directors were independent directors, while only 22 percent were employees or
linked to the S&P 1500 companies. These results suggest that large public companies
invite VC directors mostly for their experience and expertise in the field, rather than their
management skills.
Overall, our results show that VC firms tend to send multiple partners to sit on the boards
of S&P 1500 companies; the majority of VC directors started their careers as venture
capitalists, then joined the S&P 1500 boards; and only a small proportion of VC directors
hold positions such as chair, CEO, or CFO within the S&P 1500 companies, while the
majority are independent directors.
[INSERT TABLE 2 HERE]
3.3.2 Dependent variables
The dependent variable across all models in Table 4 is a dummy variable, which took the
86
value of one if a specific VC firm obtained at least one directorship of an S&P 1500
company in that particular year, and zero otherwise. The dependent variables in Table 6
are either the natural logarithm of total amount raised or the target amount. The dependent
variable in Models 1–3 of Table 8 is a dummy that took the value of one if the investee
company was exited through IPO and/or mergers and acquisitions (M&As) by the end of
2012, and zero otherwise. We considered both IPOs and M&As to be successful exits
(Cumming and Dai, 2010; Dai et al., 2012; Nahata, 2008). In Models 4–6 of Table 8, the
dependent variable is the time to exit, calculated by taking the difference between the year
in which the portfolio company received its initial funding and the observation year, or
the end of 2012.
3.3.3 Determinants of VC directorship
Directorship
‘Directorship’ is a dummy variable that took the value of one if the VC firm had at least
one partner sitting on the board of an S&P 1500 company, and zero if the VC firm had
never obtained any directorships during the sampling period.
Post-directorship
The ‘post-directorship’ variable was only observable for VC firms that had attained
directorships during the sampling period. This is a dummy variable that took the value of
one if the VC firm had existing directorships in S&P 1500 companies, and zero if the VC
firm had not yet obtained directorships.
87
Directorship length
The ‘directorship length’ variable was only observable for VC firms that had obtained
directorships during the sampling period. We measured this as the number of years
between the year in which a VC firm attained a directorship and the observation year.
Control variables
In our analysis of directorship and VC fundraising, we followed Gompers and Lerner
(1998) by including several variables to control for VC firm characteristics. For instance,
Gompers and Lerner (1998) found that older and larger VC firms are more likely to raise
larger amounts of funds than younger and smaller ones. A better economic environment,
as measured by gross domestic product (GDP) growth in the previous year, also facilitates
VC firms’ fund-raising abilities. In addition to VC firm age, size, and GDP growth, we
also included VC firm type, location, and year dummies to control for other VC firm
characteristics and year fixed effects in our models.
In our analysis of investment performance, we followed Nahata (2008) by including
variables to control for characteristics of VC firms, portfolio companies, and deal
characteristics. We included VC firm age, IPO market share (to control for VC firms’
experience), and reputation (Nahata, 2008). We also controlled for venture-related
characteristics. We included seed/start-up stage, early stage, expansion stage, and later
stage dummies in our analysis. We included these variables because previous studies have
suggested that early-stage ventures are risky and have a high failure risk (Cochrane, 2005);
88
the level of information asymmetry and uncertainty are higher at the early stage than at
the later stage (Dai et al., 2012). VC syndication is also important and can systematically
reduce the level of uncertainty. Megginson and Weiss (1991) and Lerner (1994) found
that VC syndication is positively related to the likelihood of IPO exits. Giot and
Schwienbacher (2007) found that the larger the size of VC syndication, the shorter the
time to exit a portfolio company. Therefore, we included syndicate size, which is the total
number of VC firms invested in a particular portfolio company. To control for other
characteristics of VC firms, we included VC type dummies to indicate different types of
VC firms. In addition, we accounted for venture industry and year-specific fixed effects
by including industry dummies and year dummies in our estimations; we also included
total funding received to control for investment size.
3.3.4 Estimation models
a. Logit model
We used a logit model to estimate the likelihood of becoming directors and investment
performance (at the company level). Since the dependent variables in both analyses were
binary in nature, we applied a logit model. The basic function of the non-linear model is
described as:
�̂�𝑖 = 𝑒𝑢/(1 + 𝑒𝑢) (1)
In Table 4, �̂�𝑖 is the probability of having at least one partner sitting on the board of an
S&P 1500 company for the ith year; �̂�𝑖 equals 1 if the VC firm had at least one
89
directorship in an S&P 1500 company, and 0 otherwise. Equation (1) is as follows:
𝑢 = 𝛼 + 𝛽1𝑋1 + 𝛽2𝑋2 + ⋯ + 𝛽𝑡𝑋𝑡 (2)
Where 𝛼 is the constant, and 𝛽1 to 𝛽𝑡 are coefficients of independent variables 𝑋1
to 𝑋𝑡. The analytical form of the logit model in Table 4 is as follows:
𝐿𝑖𝑘𝑒𝑙𝑖ℎ𝑜𝑜𝑑 𝑜𝑓 𝑏𝑒𝑐𝑜𝑚𝑖𝑛𝑔 𝑎 𝑑𝑖𝑟𝑒𝑐𝑡𝑜𝑟
= 𝑓(𝛼 + 𝛽1𝑉𝐶 𝑓𝑖𝑟𝑚 𝑟𝑒𝑝𝑢𝑡𝑎𝑡𝑖𝑜𝑛 + 𝛽2𝑉𝐶 𝑓𝑖𝑟𝑚 𝑎𝑔𝑒 + 𝛽3𝑉𝐶 𝑓𝑖𝑟𝑚 𝑠𝑖𝑧𝑒
+ 𝛽4𝑉𝐶 𝑓𝑖𝑟𝑚 𝑡𝑦𝑝𝑒 + 𝛽5𝑉𝐶 𝑓𝑖𝑟𝑚 𝑙𝑜𝑐𝑎𝑡𝑖𝑜𝑛 + 𝛽6𝑌𝑒𝑎𝑟 𝑑𝑢𝑚𝑚𝑖𝑒𝑠)
(3)
Where VC firm reputation was measured by two proxies: the first, IPO market share, is
the dollar market value of all companies taken public by the VC firm from the beginning
of calendar year 1980 up until a given calendar year, normalised by the aggregate market
value of all VC-backed companies that went public from the beginning of 1980 up until
the same calendar year. The second, VC investment share, is the dollar investment from
the beginning of 1980 up until a given calendar year, normalised by the overall aggregate
investment in the VC industry in those years. VC firm age was measured by the period
between VC firms’ year of incorporation and the observation year. VC firm size is the VC
firms’ capital under management in a particular year, calculated by taking the sum of all
previous funds raised by the VC firm. VC firm type was measured by a dummy variable
that took the value of one if the VC firm was not affiliated with any other entities, and
zero otherwise. VC firm location is a dummy variable that took the value of one if the VC
firm was based in either California or New York State; year dummies are dummy
90
variables that indicate the observation year.
In Table 8, �̂�𝑖 in equation (1) is the estimated probability of a successful exit for the ith
investment; �̂�𝑖 equals 1 if the company was successfully exited by the end of 2012, and
equals 0 otherwise. u is the normal linear regression model. The analytical form of the
logit model in Table 8 (Models 1–3) is the following:
𝐿𝑖𝑘𝑒𝑙𝑖ℎ𝑜𝑜𝑑 𝑜𝑓 𝑠𝑢𝑐𝑐𝑒𝑠𝑠𝑓𝑢𝑙 𝑒𝑥𝑖𝑡
= 𝑓(𝛼 + 𝛽1𝑉𝐶 𝑓𝑖𝑟𝑚′𝑠 𝑑𝑖𝑟𝑒𝑐𝑡𝑜𝑟𝑠ℎ𝑖𝑝 + 𝛽2𝑉𝐶 𝑓𝑖𝑟𝑚 𝑎𝑔𝑒
+ 𝛽3𝑉𝐶 𝑓𝑖𝑟𝑚 𝑟𝑒𝑝𝑢𝑡𝑎𝑡𝑖𝑜𝑛 + 𝛽4𝑉𝐶 𝑓𝑖𝑟𝑚 𝑙𝑜𝑐𝑎𝑡𝑖𝑜𝑛 + 𝛽5𝑉𝑒𝑛𝑡𝑢𝑟𝑒 𝑠𝑡𝑎𝑔𝑒
+ 𝛽6𝑉𝐶 𝑠𝑦𝑛𝑑𝑖𝑐𝑎𝑡𝑒 𝑠𝑖𝑧𝑒 + 𝛽7𝑉𝐶 𝑓𝑖𝑟𝑚 𝑡𝑦𝑝𝑒 + 𝛽8𝑇𝑜𝑡𝑎𝑙 𝑓𝑢𝑛𝑑𝑖𝑛𝑔
+ 𝛽9𝑌𝑒𝑎𝑟 𝑑𝑢𝑚𝑚𝑖𝑒𝑠 + 𝛽10𝐼𝑛𝑑𝑢𝑠𝑡𝑟𝑦 𝑑𝑢𝑚𝑚𝑖𝑒𝑠)
(4)
Where VC firm’s directorship was measured by three proxies. Directorship is a dummy
variable that took the value of one if the portfolio company received funding from at least
one VC firm with directorships, and zero otherwise. Post-directorship is a dummy
variable that took the value of one if the year in which a portfolio company received its
initial funding was during the post-directorship period, and zero otherwise. Directorship
length is the number of years between the year in which a VC firm obtained directorships
and the observation year. VC firm age was measured by the period between VC firms’
year of incorporation and the observation year; VC firm reputation was measured by IPO
market share, which is the dollar market value of all companies taken public by the VC
firm from the beginning of calendar year 1980 up until a given calendar year, normalised
by the aggregate market value of all VC-backed companies that went public from the
91
beginning of 1980 up until the same calendar year. VC firm location is a dummy variable
that took the value of one if the VC firm was based in either California or New York State
(venture hotbeds), and zero otherwise. Venture stage was measured by three dummies that
indicate the stage of the portfolio company when it received its first funding. VC syndicate
size is the number of VC firms that invested in the portfolio company. VC firm type was
measured by two dummy variables that indicate whether the VC firms were affiliated
with a corporation or a bank. Total funding is the total amount that the portfolio company
had received across all rounds. Year dummies and industry dummies are dummy variables
that indicate the observation year and the portfolio company’s industry, respectively.
The log transformation of the logistic model is given by:
𝑙𝑛[�̂�𝑖/(1 − �̂�𝑖)] = 𝛼 + 𝛽1𝑋1 + 𝛽2𝑋2 + ⋯ + 𝛽𝑡𝑋𝑡 (5)
We estimated the parameters through the maximum likelihood method. To test the
statistical significance of the predictor variable, we used the Wald test. Pseudo 𝑅2 was
used to measure the goodness fit of the model. Pseudo 𝑅2 was similar to 𝑅2 in the
ordinary least squares (OLS): the larger the pseudo 𝑅2, the better the goodness of fit.
b. Heckman two-stage model
In our analysis of directorship and VC fund-raising, we used a Heckman two-stage model,
which estimates two equations. The first stage is the probability of raising a fund in a
particular year:

92
Stage 1:
𝐿𝑖𝑘𝑒𝑙𝑖ℎ𝑜𝑜𝑑 𝑜𝑓 𝑟𝑎𝑖𝑠𝑖𝑛𝑔 𝑎 𝑓𝑢𝑛𝑑
= 𝑓(𝛼 + 𝛽1𝑉𝐶 𝑓𝑖𝑟𝑚 𝑎𝑔𝑒 + 𝛽2𝑉𝐶 𝑓𝑖𝑟𝑚 𝑠𝑖𝑧𝑒 + 𝛽3𝑉𝐶 𝑓𝑖𝑟𝑚 𝑙𝑜𝑐𝑎𝑡𝑖𝑜𝑛
+ 𝛽4𝐺𝐷𝑃 𝑔𝑟𝑜𝑤𝑡ℎ + 𝛽5𝑌𝑒𝑎𝑟 𝑑𝑢𝑚𝑚𝑖𝑒𝑠)
(6)
The second stage is the estimation of the amount raised (or target size), given that the
funds were raised in that year:
𝑆𝑡𝑎𝑔𝑒 2:
𝑆𝑖𝑧𝑒 𝑜𝑓 𝑡ℎ𝑒 𝑓𝑢𝑛𝑑𝑠 𝑟𝑎𝑖𝑠𝑒𝑑
= 𝑓(𝛼 + 𝛽1𝑉𝐶 𝑓𝑖𝑟𝑚′𝑠 𝑑𝑖𝑟𝑒𝑐𝑡𝑜𝑟𝑠ℎ𝑖𝑝 + 𝛽2𝑉𝐶 𝑓𝑖𝑟𝑚 𝑎𝑔𝑒 + 𝛽3𝑉𝐶 𝑓𝑖𝑟𝑚 𝑠𝑖𝑧𝑒
+ 𝛽4𝑉𝐶 𝑓𝑖𝑟𝑚 𝑡𝑦𝑝𝑒 + 𝛽5𝑉𝐶 𝑓𝑖𝑟𝑚 𝑙𝑜𝑐𝑎𝑡𝑖𝑜𝑛 + 𝛽6𝑌𝑒𝑎𝑟 𝑑𝑢𝑚𝑚𝑖𝑒𝑠)
(7)
c. Cox proportional hazard model
We examined the ‘time-to-exit’/exit rate using a Cox proportional hazard model in Table
8 (Models 4–6). This model was used in our company-level analysis. The dependent
variable is the hazard rate, which is the probability of exiting an investment, given that
the exits have not occurred. The following is the hazard model:
ℎ𝑗(𝑡|𝑋𝑗) = ℎ0(𝑡) 𝑒𝑥𝑝 (𝛽0 + 𝑋𝑗𝛽𝑥) (8)
Where ℎ𝑗(𝑡|𝑋𝑗) is the proportional hazard rate, and ℎ0(𝑡) is the baseline hazard rate at
93
time t. j is the index for an individual firm, and 𝑋𝑗 is a vector of independent variables,
which includes VC firm–related factors, portfolio company–related factors, and other
control variables. 𝛽𝑥 are coefficients to be estimated through the maximum likelihood
method. The Cox model makes no assumptions about the distribution of the hazard rate,
and can take any shape (i.e. they could be increasing or decreasing functions).
In our analysis of investment performance, we used the computed time to exit as the
dependent variable. The ‘survival’ time in years is either the time between the first
investment date, the exit date, or the difference between the investment date and 31 March
2012. We did not consider the not-yet-exited deals as being unsuccessful, but rather
treated them as being ‘right-censored’.
3.4 Analysis
3.4.1. Directorship and VC firm characteristics
3.4.1.1 Univariate analysis
Before moving on to the analysis of the potential benefits of directorship in S&P 1500
companies that accrue to VC firms, we were interested in the initiation of the process, i.e.
what characteristics of VC firms make them more likely to build such connections with
large public companies? We first examined whether or not there was a difference between
VC firms with directorships and VC firms without directorships in terms of their
characteristics. Table 3 shows a comparison between these two groups. As shown in the
table, VC firms with directorships were in general more reputable and larger than those
94
without, as measured by IPO market share, VC investment share, and firm size. In terms
of firm type, VC firms with directorships were mainly independent, while VC firms
without directorships had higher proportions of ‘captive’ VC firms (CVCs; i.e. those that
are affiliated with corporations, banks, or governments). This is not surprising, because
having directors from independent VC firms sitting on the board will lead to fewer
conflicts of interest than having directors from captive VC firms, especially corporate VC
firms, which are likely subsidiaries of their competitors. This explains why only 3 percent
of directors from CVCs were found on the board of S&P 1500 companies. VC firms with
directorships were more concentrated in the two venture hotbeds of the United States
(California and New York). Nearly 50 percent of these VC firms were headquartered in
these two states. VC firms without directorships, on the other hand, were relatively more
scattered across the country.
Overall, our results suggest that VC firms with directorships are more reputable; larger;
mostly not affiliated with corporations, banks, or governments; and based mainly in
California or New York. The results so far, however, do not necessarily imply that such
VC characteristics lead to directorships in S&P 1500 companies. Therefore, in the next
section we test whether these characteristics cause VC firms to obtain directorships,
controlling for other determinants.
[INSERT TABLE 3 HERE]
3.4.1.2 Multivariate analysis
95
In this section, we tested whether certain characteristics of VC firms lead to directorships
in S&P 1500 companies, controlling for the variables shown in Table 3. The dependent
variable in these models is a dummy variable that took the value of one if a specific VC
firm obtained at least one directorship in an S&P 1500 company, and zero otherwise.
These regressions control for size effect, firm location, firm types, and year-fixed effects.
The main explanatory variable we were interested in was VC firms’ reputation (Nahata,
2008). We used IPO market share and VC investment share as two measures of VC firms’
reputation. IPO market share is the dollar market value of all companies taken public by
the VC firm from the beginning of calendar year 1980 until a given calendar year,
normalised by the aggregate market value of all VC-backed companies that went public
from the beginning of 1980 up until the same calendar year. VC investment share is the
dollar investment from the beginning of 1980 up until a given calendar year, normalised
by the overall aggregate investment in the VC industry in those years. We also examined
whether older, larger, and independent VC firms, and those based in venture hubs, are
more likely to obtain directorships.
Model 1 presents regression estimates with VC reputation as measured by IPO market
share. The coefficient of IPO market share is positive and significant at 1 percent,
indicating that more reputable VC firms are more likely to become directors in S&P 1500
companies. Model 2 examines an alternative measure of VC reputation. The coefficient
of the VC investment share is positive and significant, at 1 percent, which is consistent
with the results of Model 1. In Model 3, we included both measures of reputation, and the
results are consistent with our Hypothesis 1. In all three models we included VC firms’
age, size, type, and location to examine whether these characteristics also influenced the
likelihood of becoming directors in S&P 1500 companies. The results indicate that larger,
96
independent VC firms, and those based in venture hubs, are more likely to obtain
directorships, which is consistent with Hypothesis 1. The results indicate, however, that
younger VC firms are more likely to obtain directorships in S&P 1500 companies, which
is inconsistent with our hypothesis. Our explanation is that younger VC firms are more
motivated to build up their reputations through directorships in large public companies,
while older and more established VC firms have less incentive to do so. This is similar to
Gompers’s (1996) ‘VC grandstanding’ theory, which suggests that young VC firms take
companies public earlier than older VC firms do in order to establish a reputation.
Overall, our results show that more reputable and larger VC firms are more likely to
obtain board seats in S&P 1500 companies, and that independent VC firms, based in
venture capital hubs, are more likely to become directors than captive VC firms and those
based in other states.
[INSERT TABLE 3 HERE]
3.4.2 Directorship and fundraising
In the previous section, we examined the initiation of attaining directorships, i.e. what
characteristics determine the likelihood of becoming directors in S&P 1500 companies.
Now we move on to the potential benefits that accrue to VC firms, given that they already
have directorships in S&P 1500 companies. We conducted our analysis in two steps. First,
we compared VC firms with directorships with VC firms without directorships to see if
there was a significant difference between these two groups. The differences we found in
97
the first step, however, could be due to a treatment effect, a selection effect, or both. Under
the treatment effect, VC firms do benefit from their directorships in large public
companies in terms of knowledge, experience, credibility, and visibility, which may lead
to better fundraising and investment performance. Under the selection effect, S&P 1500
companies only recruit people from reputable, experienced VC firms with a good track
record to sit on the board, in order to add value to the corporation. In other words, VC
firms with directorships are essentially good VC firms in the first place, and the difference
is not due to directorships. It is also possible that both effects exist, since they are not
mutually exclusive. That is to say, good VC firms are more likely to attain directorships
in large public companies; and such directorships, in return, are beneficial to them, and
thus make these VC firms even better. In order to test if there was a treatment effect, in
the second step we focussed only on VC firms with directorships and tested if there was
a significant difference between pre-directorship and post-directorship periods in terms
of fundraising and investment performance. Overall, our first step tried to identify if there
was a potential treatment effect; step two aimed to confirm its existence.
Celikyurt, Sevilir, and Shivdasani’s study (2012) suggested a few potential benefits of
directorships in large public companies that may accrue to VC firms, such as enhanced
networks and reputation, greater visibility, and access to detailed knowledge of R&D
efforts. In this study, we focussed on two primary functions of VC firms: fundraising and
funding portfolio companies. In the following sections, we examine whether being on the
board of S&P 1500 companies facilitates VC firms to raise more funds and thus improve
their investment performance.
98
3.4.2.1 Univariate analysis
Table 5 provides a univariate analysis of directorships and VC firms’ fundraising abilities.
Panel A compares VC firms with directorships with VC firms without directorships. The
measures we used were fund size and target size. Fund size is equal to the average size of
all funds a VC firm raised during the sampling period, which is 1980 to 2013. The target
amount is the average of all target amounts set by a VC firm during the sampling period.
While fund size measures the objective results of fundraising, target size captures VC
firms’ subjective perception. Panel A tests whether there is a difference between VC firms
with directorships and VC firms without directorships. The results show that the fund size
raised by VC firms with directorships was triple that of VC firms without directorships.
Similarly, the target size of VC firms with directorships was double the target amount
compared to VC firms without directorships. The t-tests for these three measures are all
significant, at 1 percent. The results indicate that not only are VC firms with directorships
more confident (i.e. they set higher targets) but they are also better able to achieve their
targets (i.e. they have larger fund sizes) compared to VC firms without directorships. The
difference between VC firms with directorships and VC firms without directorships,
however, cannot suggest that there is a treatment effect. This difference could be because
VC firms with directorships are essentially high-quality VC firms and are able to raise a
greater number of funds, even without directorships.
Panel B aims to test if there is a treatment effect by comparing pre-directorship
fundraising and post-directorship fundraising. The results show that VC firms are able to
raise more funds after joining the boards of directors of S&P 1500 companies. Similarly,
99
the post-directorship target size is also higher compared to pre-directorship. Panel C uses
the difference-in-difference method to account for the potential industry effect. The
results show that on average, VC firms raised $205 million more than the industry average
in the post-directorship period, but only raised $23 million above the industry average in
the pre-directorship period; this difference is significant, at 1 percent. The results are
similar for target size. Our results suggest that VC firms set higher targets and are able to
raise more funds in the post-directorship period, even controlling for the industry effect.
Overall, our results indicate that VC firms with directorships perform better than VC
firms without directorships in terms of fundraising, and that this is due to their
involvement in large public companies. The reason might be that sitting on the board of
large public companies provides networks, visibility, and creditability to VC
professionals, which in turn further improves their ability to raise more funds.
[INSERT TABLE 5 HERE]
3.4.2.2 Multivariate analysis
In this section we tested whether being on the board of S&P 1500 companies leads to
better fundraising performance. We used the Heckman two-stage model to estimate two
equations. The first equation is the probability of raising a fund in a given year; the second
is the amount raised, assuming that the fund was raised in that particular year. Models 1
and 3 include all VC firms, i.e. VC firms with directorships and VC firms without
directorships. The main independent variable we were interested in was directorship, a
dummy variable that took the value of one if the particular VC firm had directors on S&P
100
1500 company boards, and zero otherwise. We also controlled for other VC
characteristics such as VC firm age, VC firm size, VC type, VC location, and year fixed
effects. The results indicate that having directors sitting on the board of mature public
companies leads to more funds being raised, as well as higher targets. These results from
the multivariate analysis are consistent with the findings of the univariate analysis. In
terms of other VC characteristics, we found that older and larger VC firms are more likely
to raise more funds and to set higher targets. Although the results indicate that there is a
significant difference in terms of fundraising between VC firms with directorships and
VC firms without directorships, as discussed above, the difference may be attributable to
a selection effect. We ran additional tests to address this concern.
Models 2 and 4 focussed only on VC firms with directorships to test whether being on
the board of large public companies improved these VC firms’ fundraising performance.
The main independent variable we were interested in was post-directorship, a dummy
variable that took the value of one if a particular firm-year was during the post-
directorship period, and zero otherwise. As shown in the table, post-directorship was
positively and significantly related to both fund size and target size, suggesting that VC
firms do perform better in terms of fundraising after their partners become directors of
S&P 1500 companies. Other VC characteristics are similar to the results of Models 1 and
3, i.e. larger and older VC firms are more likely to raise more funds and to set higher
targets.
Overall, the multivariate results show that having a directorship in an S&P 1500 company
leads to better performance in terms of fundraising: VC firms are able to raise more funds
and set higher targets after they have had partners sit on the boards of S&P 1500
101
companies. The network and visibility provided by the directorships do add value to VC
firms’ follow-up fundraising abilities.
[INSERT TABLE 6 HERE]
3.4.3 Directorship and investment performance
As discussed, we aimed to examine whether being on the boards of mature public
companies benefits VC firms in terms of two main functions of VC firms: raising funds
and making investments. In this section we tested whether directorships lead to better
investment performance, as measured by the likelihood of successful exits, either via
IPOs or M&As (Nahata, 2008; Cumming and Dai, 2010; Zarutskie, 2010; Dai et al., 2012).
3.4.3.1 Univariate analysis
Table 7 presents the univariate analysis of directorship and VC investment performance.
Panel A compares the investment performance of VC firms with directorships with VC
firms without directorships. As shown in the table, 11 percent of the investments made
by VC firms with directorships went public, while only 7 percent of investments made by
VC firms without directorships went public. In terms of M&As, 27.7 percent of the
investments made by VC firms with directorships were exited through M&As, while only
19.7 percent were made by VC firms without directorships. The percentage of all
successful exits of VC firms with directorships thus was nearly 12 percent more than that

102
of VC firms without directorships. This result alone, however, does not suggest that
directorships improve VC firms’ investment performance. The difference could also be
due to the fact that VC firms with directorships are able to take portfolio companies to
successful exits, even without directorships. Therefore in Panel B we compared the pre-
directorship period with the post-directorship period by only focussing on VC firms with
directorships. The results indicate that 40 percent of investments made during the post-
directorship period were exited successfully, compared to 37 percent of investments made
during the pre-directorship periods. The difference is significant, at 5 percent.
Overall, our results suggest that investments made by VC firms with directorships have
higher success rates compared to VC firms without directorships, and that this better
investment performance is due (at least partially) to having directorships in S&P 1500
companies. The reason might be that detailed knowledge of products and markets at large
public companies may be valuable in assessing and coaching the portfolio companies in
which the VC firms invest, and therefore improves their investment performance.
[INSERT TABLE 7 HERE]
3.4.3.2 Multivariate analysis
In this section, we tested whether being on the board of S&P 1500 companies leads to
better investment performance. Our analysis was at the company level, i.e. there was only
one observation for each portfolio company. We used two measures to estimate
investment performance: the likelihood of successful exits, and the time to exits. The
103
dependent variable in Models 1–3 is a dummy variable that took the value of one if the
portfolio company ultimately went public or was acquired by the end of 2012, and zero
if otherwise; the dependent variable in Models 4–6 is the time to exit, calculated by taking
the difference between the year in which the portfolio company received its initial funding
and the observation year, or the end of 2012. Models 1 and 4 include all VC firms, while
Models 2, 3, 5, and 6 only include VC firms with directorships. The main independent
variables we were interested in were directorship, post-directorship, and directorship
length. Directorship is a dummy variable that took the value of one if a particular portfolio
company was backed by at least one VC firm with a directorship in an S&P 1500 company,
and zero otherwise. Post-directorship is a dummy variable that took the value of one if
the year in which the portfolio company received its initial funding was during the post-
directorship period, and zero otherwise. Directorship length is the number of years of
directorships in S&P 1500 companies at the time of investment. In the case of multiple
investors, we took the average of their directorship length. Since the issue of VC exits has
been studied extensively by previous studies, we included most of the control variables
used in previous studies, such as characteristics of VC firms and investee companies
(Cumming and Johan, 2007; Elisabete, Cesaltina, and Mohamed, 2008), venture stages
(Cumming, Fleming, and Schwienbacher 2006; Cumming and MacIntosh, 2003), and VC
syndication (Megginson and Weiss, 1991; Lerner, 1994; Giot and Schwienbacher, 2007).
We also included year fixed effects and industry fixed effects.
As shown in Table 8, directorship in Models 1 and 4 is positively related to the likelihood
of successful exits and times to exit, and is significant, at 1 percent. The results indicate
that being on the board of large public companies leads to improved investment
performance. The control variables are mostly consistent with previous studies. For
104
instance, early-stage and seed-stage ventures are less likely to be exited; a large syndicate
size leads to better performance; and a larger investment size contributes positively to the
likelihood of a successful exit. This difference, however, may be attributed to a selection
effect: VC firms with directorships are of high quality, and thus are able to bring portfolio
companies to successful exits, even without directorships. We therefore conducted an
additional analysis to test if there was a treatment effect. In Models 2, 3, 5, and 6, we
focussed only on VC firms with directorships. As shown in the table, both post-
directorship and directorship length were positively related to the likelihood of successful
exits and times to exit, and both were significant, at 5 percent. These results indicate that
VC firms do benefit from their directorships in large public companies, and that their
investment performance is improved at least partially as a result of their directorships.
Overall, our results show that not only do VC firms with directorships tend to perform
better than VC firms without directorships in terms of successful exits, but also that
having a directorship in a large public company improves VC firms’ abilities to take
portfolio companies to successful exits.
[INSERT TABLE 8 HERE]
3.5 Conclusion
In this paper, we aimed to examine whether being on the board of mature public
companies benefits VC firms. We investigated potential benefits mainly from the
perspective of fundraising and investment performance. We followed the method used by
Celikyurt et al. (2012) to construct our initial sample, and extended Celikyurt et al.’s
105
(2012) sample to 2011. Our final sample of VC directors consists of 1,359 unique VC
directors, working in 700 different VC firms.
Our empirical results show that VCs from reputable VC firms are more likely to become
directors in S&P 1500 companies, and that being on the boards of mature public
companies does benefit VC firms in terms of fundraising and investment performance,
controlling for a matched sample of VC firms without directorships. We found that VC
firms not only raise more funds, but also set higher targets after becoming board directors.
We interpret this as the result that directorships provide visibility, networks, and
credibility to VC firms. We also found that being on boards increases the likelihood of
successful exits of VC firms’ other portfolio companies. We speculate that the improved
performance is due to that directorships provide VC firms access to knowledge and
increased learning opportunities. One shortfall of our study is that it did not include
proxies that measure visibility, credibility, network, knowledge and learning effect and
therefore are unable to identify which specific factor/factors contributes to the improved
performance. Furthermore, our study did not include director-specific proxies that
measure individual director’s quality such as education background, work experience,
and expertise etc. Future studies that address the above issues could shed more light on
VC director’s role in mature public companies and VC firms.
Our study extends Celikyurt et al.’s (2012) work by examining the other side of the VC
firm–S&P 1500 company relationship, and raises a few interesting questions for future
research. For instance, how are these VC directors selected? Are they invited or sent by

106
VC firms?16 Do these VC directors gain personal benefits, such as compensation or other
non-cash rewards? Could sitting on boards be detrimental to VC firms if they have too
many directors in large public companies, and thus are distracted from their primary
responsibilities? How do they balance their roles in large public companies and in small
private companies? Future studies that examine these questions would improve our
understanding of VC firms’ roles in mature companies.
Our study also provides several practical implications for market practitioners. For
instance, VC firms should view gaining directorships (in addition to grandstanding) as a
way of building reputation, and as an opportunity to gain access to better knowledge and
expertise. By sending partners to large public companies, or hiring partners with board
seats, VC firms could gain credibility and enhanced networks, as well as better knowledge
and expertise, which could then improve VC firms’ fundraising abilities and investment
performance.
16 Although we have provided some evidence about VC firm level in our analysis, we did not examine the
characteristics of individual VC directors, such as their work experience, education, and networks.
107
References
Celikyurt, U., Sevilir, M., and Shivdasani, A. 2014. Venture capitalists on boards of
mature public firms. Review of Financial Studies 27, 56-101.
Cumming D., and Johan, S. 2008. Pre-planned exit strategies in VC. European Economic
Review 52, 1209-1241.
Cumming, D., Fleming, G., and Schwienbacher, A. 2006. Legality and VC exits. Journal
of Corporate Finance 12, 214-245.
Cumming, D. J., and MacIntosh, J. G. 2003. VC exits in Canada and the United States.
University of Toronto Law Journal 53, 101-200.
Cumming, D., and Dai, N. 2010. Local bias in VC investments. Journal of Empirical
Finance 17, 362-380.
Dai, N., Jo, H., and Kassicieh, S. 2012. Cross-border venture capital investments in Asia:
Selection and exit performance. Journal of Business Venturing 27, 666-684.
Dessi, R., and Yin, N. 2014. Venture capital and knowledge transfer. Working paper.
Elisabete, G., Cesaltina, P., and Mohamed, A. 2008. The exit decision in the European VC
market. Working paper.
Giot, P., and Schwienbacher, A. 2007. IPOs, trade sales and liquidations: Modelling VC
exits using survival analysis. Journal of Banking and Finance 31, 679-702.
Gompers, P. 1996. Grandstanding in the venture capital industry. Journal of Financial
Economics 42, 133-156.
Gompers, P., Lerner, J., and Scharfstein, D. 2005. Entrepreneurial spawning: Public
corporations and the genesis of new ventures, 1986 to 1999. Journal of Finance 60,
577-614.
Gompers, P., Lerner, J., Blair M., and Hellmann, T. (1998). What drives venture capital
fundraising? Brookings Paper on Economic Activity: Microeconomics, 149-204.
González-Uribe, J. 2013. Venture capital and the diffusion of knowledge. Working paper.
Isaksson, A. 2007. Exit strategy and the intensity of exit-directed activities among VC-
backed entrepreneurs in Sweden. Ph.D. dissertation, Umeå School of Business.
Jeng, L. A., and Wells, P. C. 2000. The determinants of venture capital fundraising:
Evidence across countries. Journal of Corporate Finance 6, 241-289.
Krishnan, C. N. V., Ivanov, V., and Masulis, R. 2011. Venture capital reputation, post-IPO
performance, and corporate governance. Journal of Financial and Quantitative

108
Analysis 46, 1295-1333.
Lerner, J. 1994. The syndication of VC investments. Financial Management 23, 16-27.
Mayer, C., Schoors, K., and Yafeh, Y. 2004. Sources of funds and investment activities
of venture capital funds: Evidence from Germany, Israel, Japan and the U.K.
Journal of Corporate Finance 11, 586-608.
Megginson, W., and Weiss, K. 1991. VC certification in initial public offerings. Journal
of Finance 46, 879-893.
Nahata, R. 2008. Venture capital reputation and investment performance. Journal of
Financial Economics 90, 127-151.
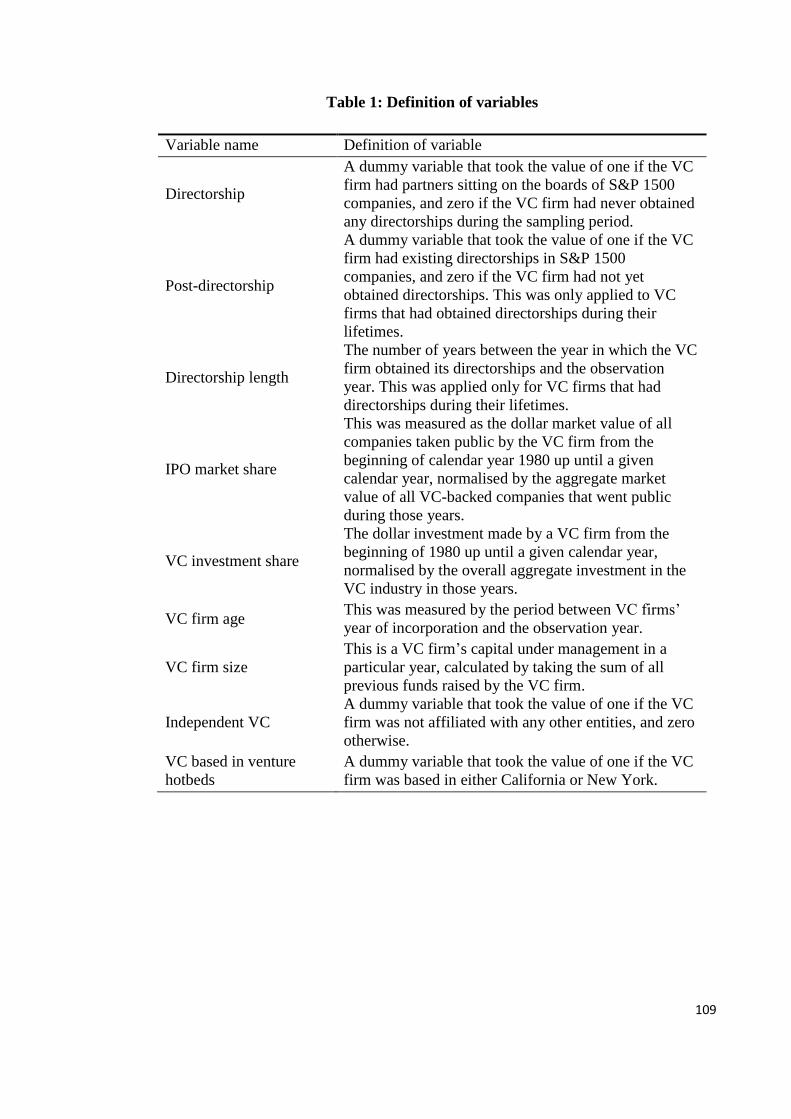
109
Table 1: Definition of variables
Variable name Definition of variable
Directorship
A dummy variable that took the value of one if the VC
firm had partners sitting on the boards of S&P 1500
companies, and zero if the VC firm had never obtained
any directorships during the sampling period.
Post-directorship
A dummy variable that took the value of one if the VC
firm had existing directorships in S&P 1500
companies, and zero if the VC firm had not yet
obtained directorships. This was only applied to VC
firms that had obtained directorships during their
lifetimes.
Directorship length
The number of years between the year in which the VC
firm obtained its directorships and the observation
year. This was applied only for VC firms that had
directorships during their lifetimes.
IPO market share
This was measured as the dollar market value of all
companies taken public by the VC firm from the
beginning of calendar year 1980 up until a given
calendar year, normalised by the aggregate market
value of all VC-backed companies that went public
during those years.
VC investment share
The dollar investment made by a VC firm from the
beginning of 1980 up until a given calendar year,
normalised by the overall aggregate investment in the
VC industry in those years.
VC firm age This was measured by the period between VC firms’
year of incorporation and the observation year.
VC firm size
This is a VC firm’s capital under management in a
particular year, calculated by taking the sum of all
previous funds raised by the VC firm.
Independent VC
A dummy variable that took the value of one if the VC
firm was not affiliated with any other entities, and zero
otherwise.
VC based in venture
hotbeds
A dummy variable that took the value of one if the VC
firm was based in either California or New York.

110
Table 1. Continued
Seed/Start-up venture
A dummy variable that took the value of 1 if the venture
was in the seed/start-up stage when it received its initial
funding, and 0 otherwise.
Early-stage venture
A dummy variable that took the value of 1 if the venture
was in the early stage when it received its initial
funding, and 0 otherwise.
Expansion-stage venture
A dummy variable that took the value of 1 if the venture
was in the expansion stage when it received its initial
funding, and 0 otherwise.
Syndicate size The total number of VC firms invested in the portfolio
company.
Total funding received The total amount of funding received by a portfolio
company across all rounds.
GDP growth in the
previous year
The GDP growth of the United States in the previous
year.

111
Table 2: Summary statistics
This table presents the descriptive statistics of VC firms’ directorships in S&P 1500
companies. Panel A describes VC firms’ and VC directors’ association with S&P
1500 companies. Panel B describes VC directors’ experience in VC firms and S&P
1500 companies. Panel C describes VC directors’ roles within VC firms or S&P 1500
companies. † VC directors who started as directors and then joined/started the VC
firms constituted less than 15 percent of our sample, and therefore our main focus
was VC directors who started with a VC firm before becoming a director in one or
more S&P 1500 companies.
Panel A: VC firms and S&P 1500
Mean Median Max
No. of S&P 1500 companies per VC firm is associated
with 2.539 1.000 25.000
No. of S&P1500 companies per director is associated
with 0.893 1.000 6.000
No. of directors per VC firm has that sit on the board of
S&P 1500 1.941 1.000 18.000
No. of directors per S&P 1500 company has on board 1.329 1.000 5.000
Panel B: VC directors' experience
Mean Median Max
Year in which the VC became a director in S&P 1500 1999 1999 2011
Year in which the VC joined/started the VC firm 1997 1998 2012
No. of years of experience in S&P 1500 before joining
the VC firm† 5.988 4.500 30.000
No. of years of experience in VC firm before joining
the S&P 1500 7.396 5.000 36.000
Panel C: VC directors' role
N %
VC directors' role in the VC firm
Founder, Co-Founder 491 37.20%
Other job titles 829 62.80%
VC directors' role in S&P 1500
Chairman, Vice Chairman 94 7.12%
Chief officers (CEO,CFO,COO) 110 8.33%
President, Vice President 127 9.62%
Other job titles 1083 82.05%
Directorship classification
Employee 74 5.66%
Linked 215 16.45%
Independent 1017 77.81%
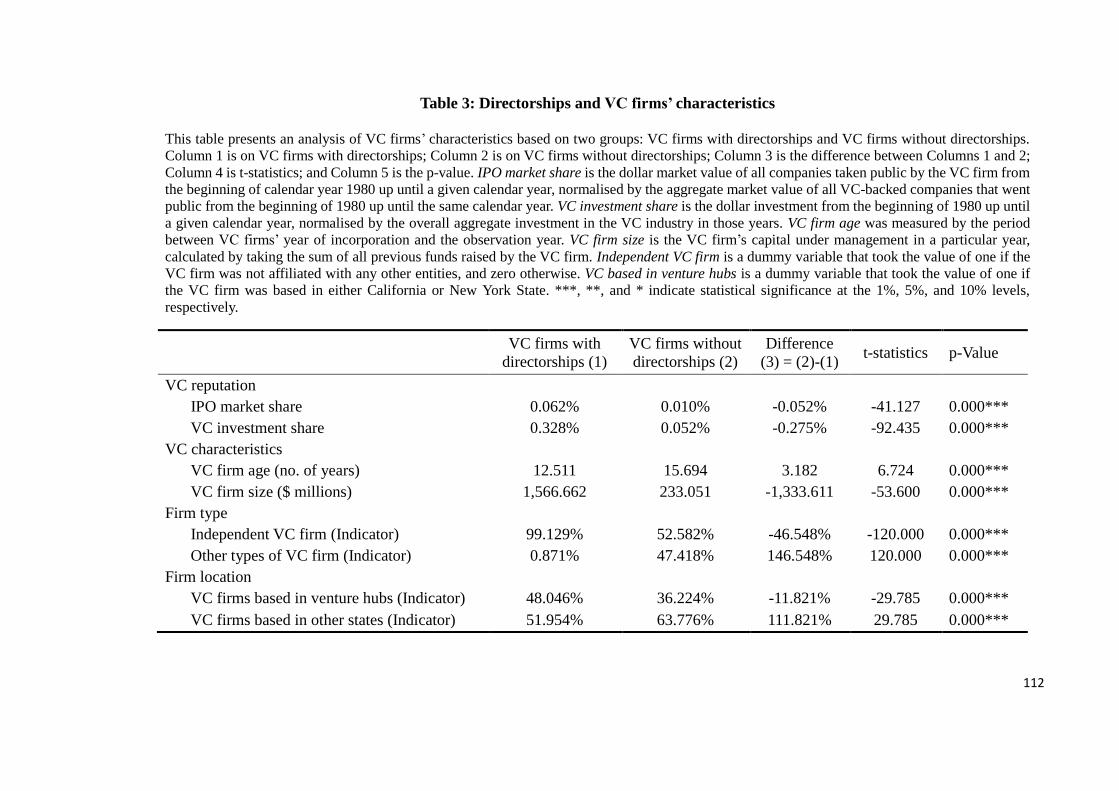
112
Table 3: Directorships and VC firms’ characteristics
This table presents an analysis of VC firms’ characteristics based on two groups: VC firms with directorships and VC firms without directorships.
Column 1 is on VC firms with directorships; Column 2 is on VC firms without directorships; Column 3 is the difference between Columns 1 and 2;
Column 4 is t-statistics; and Column 5 is the p-value. IPO market share is the dollar market value of all companies taken public by the VC firm from
the beginning of calendar year 1980 up until a given calendar year, normalised by the aggregate market value of all VC-backed companies that went
public from the beginning of 1980 up until the same calendar year. VC investment share is the dollar investment from the beginning of 1980 up until
a given calendar year, normalised by the overall aggregate investment in the VC industry in those years. VC firm age was measured by the period
between VC firms’ year of incorporation and the observation year. VC firm size is the VC firm’s capital under management in a particular year,
calculated by taking the sum of all previous funds raised by the VC firm. Independent VC firm is a dummy variable that took the value of one if the
VC firm was not affiliated with any other entities, and zero otherwise. VC based in venture hubs is a dummy variable that took the value of one if
the VC firm was based in either California or New York State. ***, **, and * indicate statistical significance at the 1%, 5%, and 10% levels,
respectively.
VC firms with
directorships (1)
VC firms without
directorships (2)
Difference
(3) = (2)-(1) t-statistics p-Value
VC reputation
IPO market share 0.062% 0.010% -0.052% -41.127 0.000***
VC investment share 0.328% 0.052% -0.275% -92.435 0.000***
VC characteristics
VC firm age (no. of years) 12.511 15.694 3.182 6.724 0.000***
VC firm size ($ millions) 1,566.662 233.051 -1,333.611 -53.600 0.000***
Firm type
Independent VC firm (Indicator) 99.129% 52.582% -46.548% -120.000 0.000***
Other types of VC firm (Indicator) 0.871% 47.418% 146.548% 120.000 0.000***
Firm location
VC firms based in venture hubs (Indicator) 48.046% 36.224% -11.821% -29.785 0.000***
VC firms based in other states (Indicator) 51.954% 63.776% 111.821% 29.785 0.000***
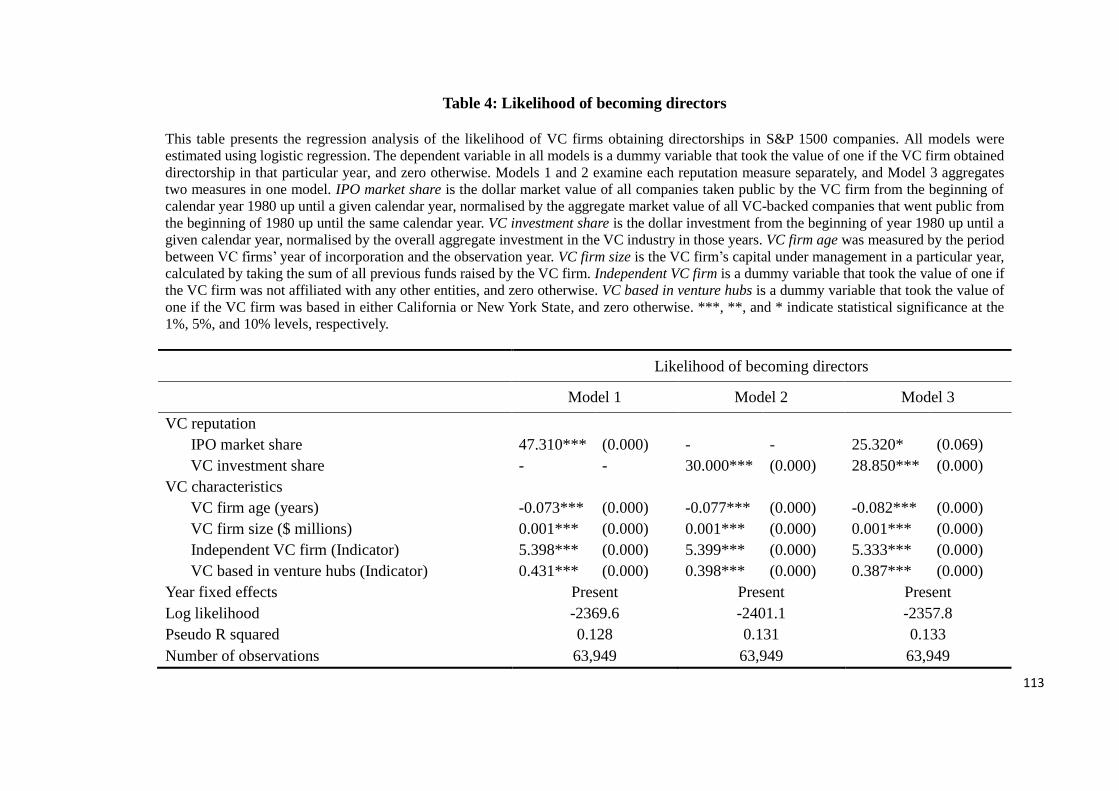
113
Table 4: Likelihood of becoming directors
This table presents the regression analysis of the likelihood of VC firms obtaining directorships in S&P 1500 companies. All models were
estimated using logistic regression. The dependent variable in all models is a dummy variable that took the value of one if the VC firm obtained
directorship in that particular year, and zero otherwise. Models 1 and 2 examine each reputation measure separately, and Model 3 aggregates
two measures in one model. IPO market share is the dollar market value of all companies taken public by the VC firm from the beginning of
calendar year 1980 up until a given calendar year, normalised by the aggregate market value of all VC-backed companies that went public from
the beginning of 1980 up until the same calendar year. VC investment share is the dollar investment from the beginning of year 1980 up until a
given calendar year, normalised by the overall aggregate investment in the VC industry in those years. VC firm age was measured by the period
between VC firms’ year of incorporation and the observation year. VC firm size is the VC firm’s capital under management in a particular year,
calculated by taking the sum of all previous funds raised by the VC firm. Independent VC firm is a dummy variable that took the value of one if
the VC firm was not affiliated with any other entities, and zero otherwise. VC based in venture hubs is a dummy variable that took the value of
one if the VC firm was based in either California or New York State, and zero otherwise. ***, **, and * indicate statistical significance at the
1%, 5%, and 10% levels, respectively.
Likelihood of becoming directors
Model 1 Model 2 Model 3
VC reputation
IPO market share 47.310*** (0.000) - - 25.320* (0.069)
VC investment share - - 30.000*** (0.000) 28.850*** (0.000)
VC characteristics
VC firm age (years) -0.073*** (0.000) -0.077*** (0.000) -0.082*** (0.000)
VC firm size ($ millions) 0.001*** (0.000) 0.001*** (0.000) 0.001*** (0.000)
Independent VC firm (Indicator) 5.398*** (0.000) 5.399*** (0.000) 5.333*** (0.000)
VC based in venture hubs (Indicator) 0.431*** (0.000) 0.398*** (0.000) 0.387*** (0.000)
Year fixed effects Present Present Present
Log likelihood -2369.6 -2401.1 -2357.8
Pseudo R squared 0.128 0.131 0.133
Number of observations 63,949 63,949 63,949
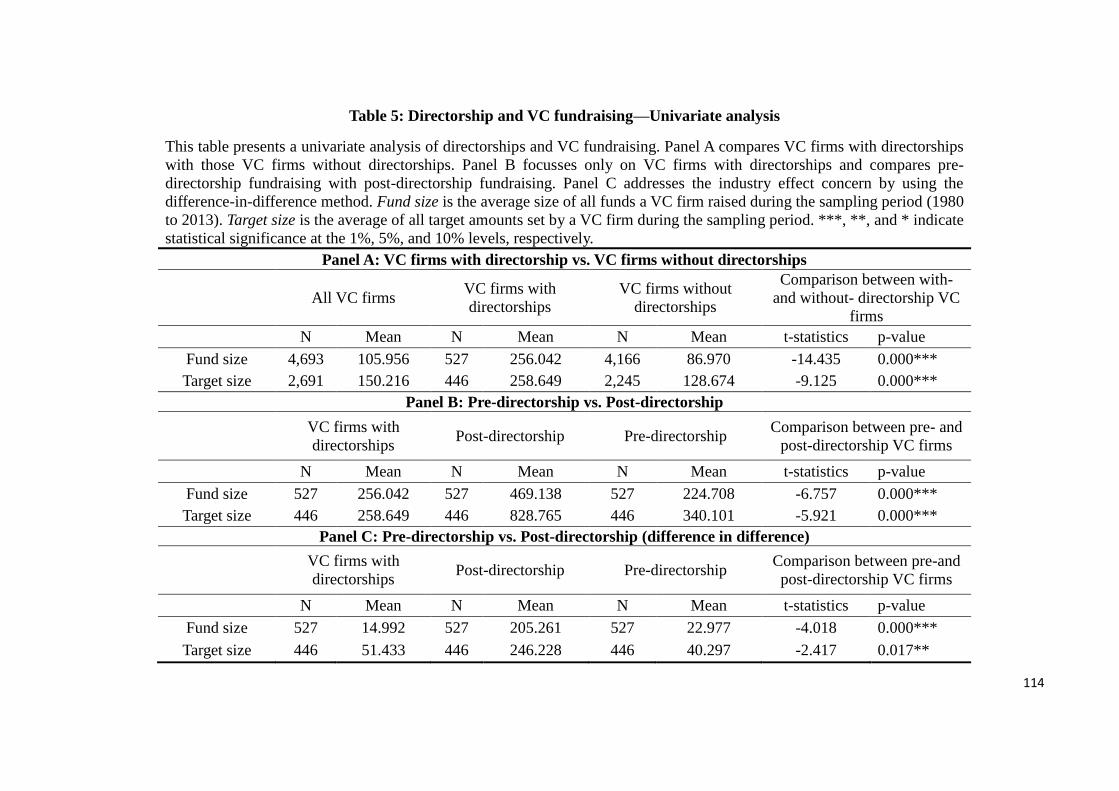
114
Table 5: Directorship and VC fundraising—Univariate analysis
This table presents a univariate analysis of directorships and VC fundraising. Panel A compares VC firms with directorships
with those VC firms without directorships. Panel B focusses only on VC firms with directorships and compares pre-
directorship fundraising with post-directorship fundraising. Panel C addresses the industry effect concern by using the
difference-in-difference method. Fund size is the average size of all funds a VC firm raised during the sampling period (1980
to 2013). Target size is the average of all target amounts set by a VC firm during the sampling period. ***, **, and * indicate
statistical significance at the 1%, 5%, and 10% levels, respectively.
Panel A: VC firms with directorship vs. VC firms without directorships
All VC firms VC firms with
directorships
VC firms without
directorships
Comparison between with-
and without- directorship VC
firms
N Mean N Mean N Mean t-statistics p-value
Fund size 4,693 105.956 527 256.042 4,166 86.970 -14.435 0.000***
Target size 2,691 150.216 446 258.649 2,245 128.674 -9.125 0.000***
Panel B: Pre-directorship vs. Post-directorship
VC firms with
directorships Post-directorship Pre-directorship
Comparison between pre- and
post-directorship VC firms
N Mean N Mean N Mean t-statistics p-value
Fund size 527 256.042 527 469.138 527 224.708 -6.757 0.000***
Target size 446 258.649 446 828.765 446 340.101 -5.921 0.000***
Panel C: Pre-directorship vs. Post-directorship (difference in difference)
VC firms with
directorships Post-directorship Pre-directorship
Comparison between pre-and
post-directorship VC firms
N Mean N Mean N Mean t-statistics p-value
Fund size 527 14.992 527 205.261 527 22.977 -4.018 0.000***
Target size 446 51.433 446 246.228 446 40.297 -2.417 0.017**
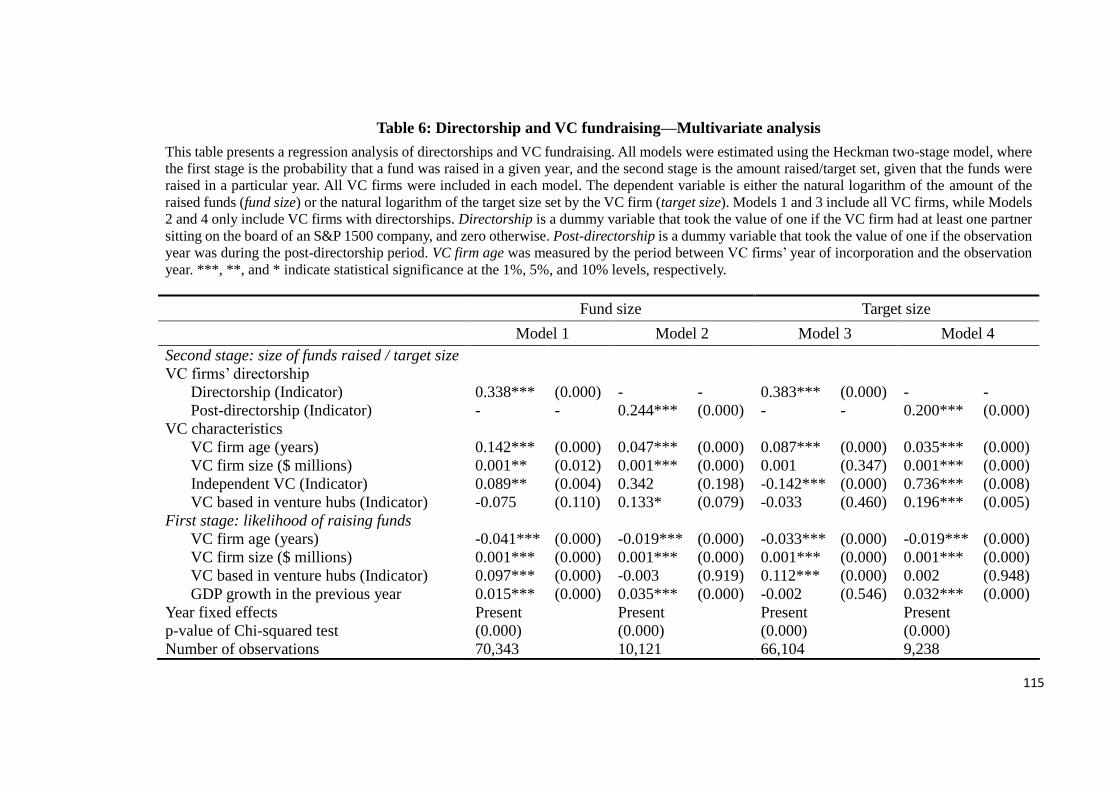
115
Table 6: Directorship and VC fundraising—Multivariate analysis
This table presents a regression analysis of directorships and VC fundraising. All models were estimated using the Heckman two-stage model, where
the first stage is the probability that a fund was raised in a given year, and the second stage is the amount raised/target set, given that the funds were
raised in a particular year. All VC firms were included in each model. The dependent variable is either the natural logarithm of the amount of the
raised funds (fund size) or the natural logarithm of the target size set by the VC firm (target size). Models 1 and 3 include all VC firms, while Models
2 and 4 only include VC firms with directorships. Directorship is a dummy variable that took the value of one if the VC firm had at least one partner
sitting on the board of an S&P 1500 company, and zero otherwise. Post-directorship is a dummy variable that took the value of one if the observation
year was during the post-directorship period. VC firm age was measured by the period between VC firms’ year of incorporation and the observation
year. ***, **, and * indicate statistical significance at the 1%, 5%, and 10% levels, respectively.
Fund size Target size
Model 1 Model 2 Model 3 Model 4
Second stage: size of funds raised / target size
VC firms’ directorship
Directorship (Indicator) 0.338*** (0.000) - - 0.383*** (0.000) - -
Post-directorship (Indicator) - - 0.244*** (0.000) - - 0.200*** (0.000)
VC characteristics
VC firm age (years) 0.142*** (0.000) 0.047*** (0.000) 0.087*** (0.000) 0.035*** (0.000)
VC firm size ($ millions) 0.001** (0.012) 0.001*** (0.000) 0.001 (0.347) 0.001*** (0.000)
Independent VC (Indicator) 0.089** (0.004) 0.342 (0.198) -0.142*** (0.000) 0.736*** (0.008)
VC based in venture hubs (Indicator) -0.075 (0.110) 0.133* (0.079) -0.033 (0.460) 0.196*** (0.005)
First stage: likelihood of raising funds
VC firm age (years) -0.041*** (0.000) -0.019*** (0.000) -0.033*** (0.000) -0.019*** (0.000)
VC firm size ($ millions) 0.001*** (0.000) 0.001*** (0.000) 0.001*** (0.000) 0.001*** (0.000)
VC based in venture hubs (Indicator) 0.097*** (0.000) -0.003 (0.919) 0.112*** (0.000) 0.002 (0.948)
GDP growth in the previous year 0.015*** (0.000) 0.035*** (0.000) -0.002 (0.546) 0.032*** (0.000)
Year fixed effects Present Present Present Present
p-value of Chi-squared test (0.000) (0.000) (0.000) (0.000)
Number of observations 70,343 10,121 66,104 9,238
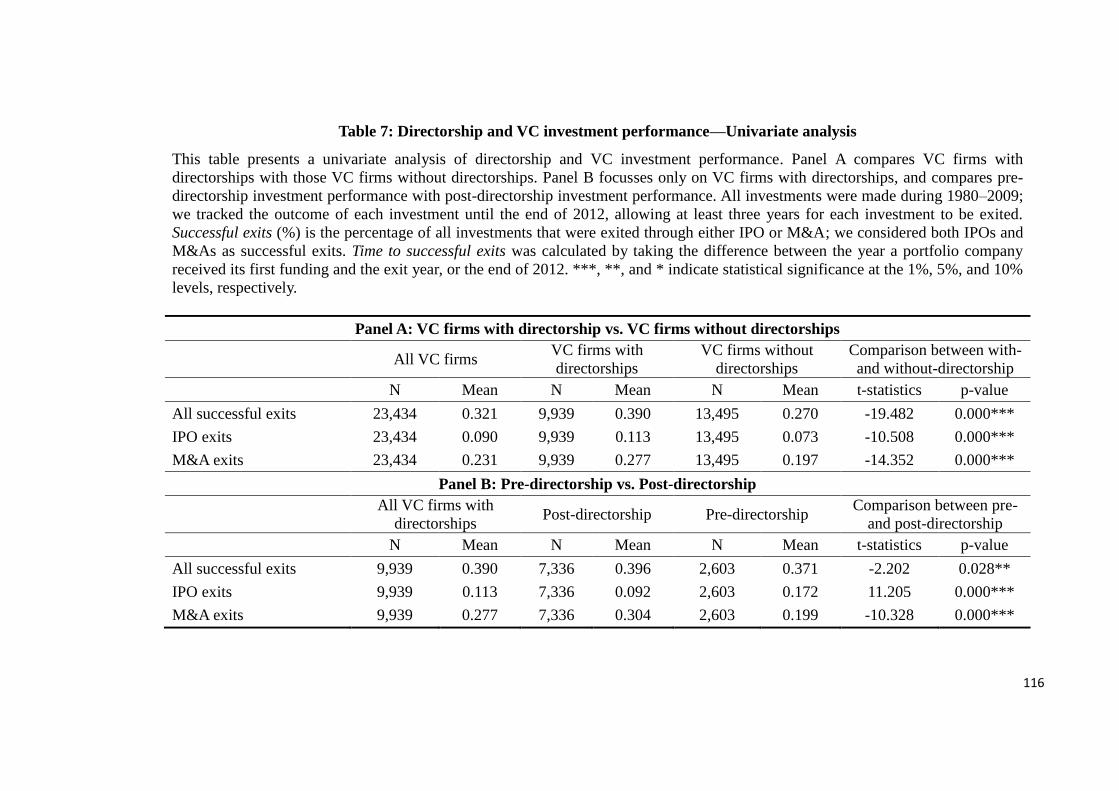
116
Table 7: Directorship and VC investment performance—Univariate analysis
This table presents a univariate analysis of directorship and VC investment performance. Panel A compares VC firms with
directorships with those VC firms without directorships. Panel B focusses only on VC firms with directorships, and compares pre-
directorship investment performance with post-directorship investment performance. All investments were made during 1980–2009;
we tracked the outcome of each investment until the end of 2012, allowing at least three years for each investment to be exited.
Successful exits (%) is the percentage of all investments that were exited through either IPO or M&A; we considered both IPOs and
M&As as successful exits. Time to successful exits was calculated by taking the difference between the year a portfolio company
received its first funding and the exit year, or the end of 2012. ***, **, and * indicate statistical significance at the 1%, 5%, and 10%
levels, respectively.
Panel A: VC firms with directorship vs. VC firms without directorships
All VC firms VC firms with
directorships
VC firms without
directorships
Comparison between with-
and without-directorship
N Mean N Mean N Mean t-statistics p-value
All successful exits 23,434 0.321 9,939 0.390 13,495 0.270 -19.482 0.000***
IPO exits 23,434 0.090 9,939 0.113 13,495 0.073 -10.508 0.000***
M&A exits 23,434 0.231 9,939 0.277 13,495 0.197 -14.352 0.000***
Panel B: Pre-directorship vs. Post-directorship
All VC firms with
directorships Post-directorship Pre-directorship
Comparison between pre-
and post-directorship
N Mean N Mean N Mean t-statistics p-value
All successful exits 9,939 0.390 7,336 0.396 2,603 0.371 -2.202 0.028**
IPO exits 9,939 0.113 7,336 0.092 2,603 0.172 11.205 0.000***
M&A exits 9,939 0.277 7,336 0.304 2,603 0.199 -10.328 0.000***
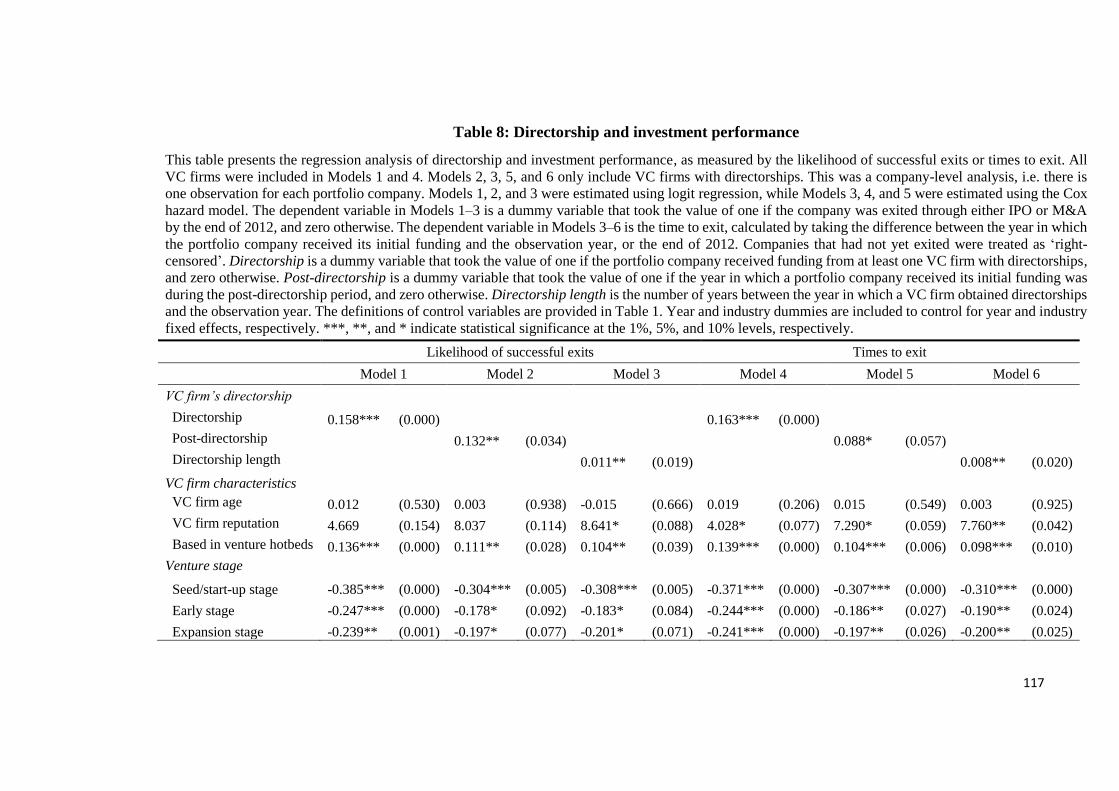
117
Table 8: Directorship and investment performance
This table presents the regression analysis of directorship and investment performance, as measured by the likelihood of successful exits or times to exit. All
VC firms were included in Models 1 and 4. Models 2, 3, 5, and 6 only include VC firms with directorships. This was a company-level analysis, i.e. there is
one observation for each portfolio company. Models 1, 2, and 3 were estimated using logit regression, while Models 3, 4, and 5 were estimated using the Cox
hazard model. The dependent variable in Models 1–3 is a dummy variable that took the value of one if the company was exited through either IPO or M&A
by the end of 2012, and zero otherwise. The dependent variable in Models 3–6 is the time to exit, calculated by taking the difference between the year in which
the portfolio company received its initial funding and the observation year, or the end of 2012. Companies that had not yet exited were treated as ‘right-
censored’. Directorship is a dummy variable that took the value of one if the portfolio company received funding from at least one VC firm with directorships,
and zero otherwise. Post-directorship is a dummy variable that took the value of one if the year in which a portfolio company received its initial funding was
during the post-directorship period, and zero otherwise. Directorship length is the number of years between the year in which a VC firm obtained directorships
and the observation year. The definitions of control variables are provided in Table 1. Year and industry dummies are included to control for year and industry
fixed effects, respectively. ***, **, and * indicate statistical significance at the 1%, 5%, and 10% levels, respectively.
Likelihood of successful exits Times to exit
Model 1 Model 2 Model 3 Model 4 Model 5 Model 6
VC firm’s directorship
Directorship 0.158*** (0.000) 0.163*** (0.000)
Post-directorship 0.132** (0.034) 0.088* (0.057)
Directorship length 0.011** (0.019) 0.008** (0.020)
VC firm characteristics
VC firm age 0.012 (0.530) 0.003 (0.938) -0.015 (0.666) 0.019 (0.206) 0.015 (0.549) 0.003 (0.925)
VC firm reputation 4.669 (0.154) 8.037 (0.114) 8.641* (0.088) 4.028* (0.077) 7.290* (0.059) 7.760** (0.042)
Based in venture hotbeds 0.136*** (0.000) 0.111** (0.028) 0.104** (0.039) 0.139*** (0.000) 0.104*** (0.006) 0.098*** (0.010)
Venture stage
Seed/start-up stage -0.385*** (0.000) -0.304*** (0.005) -0.308*** (0.005) -0.371*** (0.000) -0.307*** (0.000) -0.310*** (0.000)
Early stage -0.247*** (0.000) -0.178* (0.092) -0.183* (0.084) -0.244*** (0.000) -0.186** (0.027) -0.190** (0.024)
Expansion stage -0.239** (0.001) -0.197* (0.077) -0.201* (0.071) -0.241*** (0.000) -0.197** (0.026) -0.200** (0.025)

118
Table 8. Continued
Other control variables
VC syndicate size 0.068*** (0.000) 0.062*** (0.000) 0.062*** (0.000) 0.058*** (0.000) 0.054*** (0.000) 0.054*** (0.000)
Corporate VC 0.065 (0.211) 0.003 (0.970) -0.001 (0.989) 0.091** (0.024) 0.032 (0.599) 0.033 (0.586)
Bank VC -0.177*** (0.001) -0.113 (0.210) -0.106 (0.239) -0.119*** (0.006) -0.065 (0.350) -0.059 (0.395)
Total funding 0.001*** (0.000) 0.001*** (0.000) 0.001*** (0.000) 0.001*** (0.000) 0.001*** (0.000) 0.001*** (0.000)
Year fixed effects Present Present Present Present Present Present
Industry fixed effects Present Present Present Present Present Present
Log-likelihood -11985.969 -5882.719 -5882.157 -65055.484 -32358.902 -32358.121
Pseudo R squared 0.085 0.074 0.074 - - -
Number of observations 20,458 9,450 9,450 20,458 9,450 9,450

119
Table 9: Correlation matrix
This table shows the pair-wise correlations matrix of the independent variables that were used in the logit and Cox models in Tables 4, 6, and 8.
(1) (2) (3) (4) (5) (6) (7) (8) (9) (10) (11) (12)
(1) VC firm age (years) 1.000
(2) VC firm size ($ millions) 0.120 1.000
(3) Independent VC (I) 0.007 -0.043 1.000
(4) VC based in venture hubs (I) 0.145 0.104 -0.044 1.000
(5) Seed/start-up venture -0.028 -0.031 0.016 0.023 1.000
(6) Early-stage venture -0.008 -0.023 0.000 0.064 -0.552 1.000
(7) Expansion-stage venture 0.032 0.031 -0.017 -0.065 -0.351 -0.463 1.000
(8) Syndicate size 0.004 0.035 -0.409 0.245 0.013 0.035 -0.043 1.000
(9) Total funding received 0.131 0.140 -0.156 0.189 -0.275 0.123 0.115 0.351 1.000
(10) IPO market conditions 0.010 0.049 0.001 0.031 0.026 -0.027 0.002 0.045 0.021 1.000
(11) Directorship (I) 0.289 0.070 0.103 0.232 -0.010 0.083 -0.077 0.188 0.271 0.040 1.000
(12) Directorship length (years) 0.357 0.035 0.093 0.236 -0.012 0.081 -0.069 0.161 0.238 -0.008 0.744 1.000
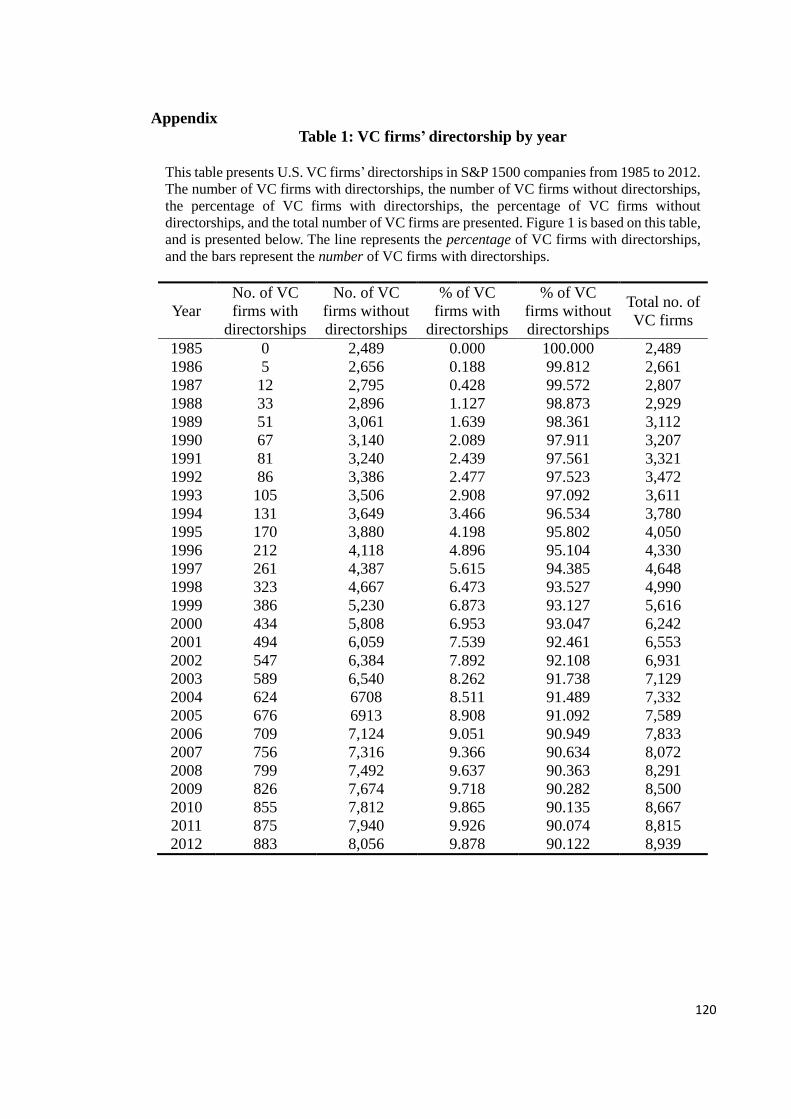
120
Appendix
Table 1: VC firms’ directorship by year
This table presents U.S. VC firms’ directorships in S&P 1500 companies from 1985 to 2012.
The number of VC firms with directorships, the number of VC firms without directorships,
the percentage of VC firms with directorships, the percentage of VC firms without
directorships, and the total number of VC firms are presented. Figure 1 is based on this table,
and is presented below. The line represents the percentage of VC firms with directorships,
and the bars represent the number of VC firms with directorships.
Year
No. of VC
firms with
directorships
No. of VC
firms without
directorships
% of VC
firms with
directorships
% of VC
firms without
directorships
Total no. of
VC firms
1985 0 2,489 0.000 100.000 2,489
1986 5 2,656 0.188 99.812 2,661
1987 12 2,795 0.428 99.572 2,807
1988 33 2,896 1.127 98.873 2,929
1989 51 3,061 1.639 98.361 3,112
1990 67 3,140 2.089 97.911 3,207
1991 81 3,240 2.439 97.561 3,321
1992 86 3,386 2.477 97.523 3,472
1993 105 3,506 2.908 97.092 3,611
1994 131 3,649 3.466 96.534 3,780
1995 170 3,880 4.198 95.802 4,050
1996 212 4,118 4.896 95.104 4,330
1997 261 4,387 5.615 94.385 4,648
1998 323 4,667 6.473 93.527 4,990
1999 386 5,230 6.873 93.127 5,616
2000 434 5,808 6.953 93.047 6,242
2001 494 6,059 7.539 92.461 6,553
2002 547 6,384 7.892 92.108 6,931
2003 589 6,540 8.262 91.738 7,129
2004 624 6708 8.511 91.489 7,332
2005 676 6913 8.908 91.092 7,589
2006 709 7,124 9.051 90.949 7,833
2007 756 7,316 9.366 90.634 8,072
2008 799 7,492 9.637 90.363 8,291
2009 826 7,674 9.718 90.282 8,500
2010 855 7,812 9.865 90.135 8,667
2011 875 7,940 9.926 90.074 8,815
2012 883 8,056 9.878 90.122 8,939
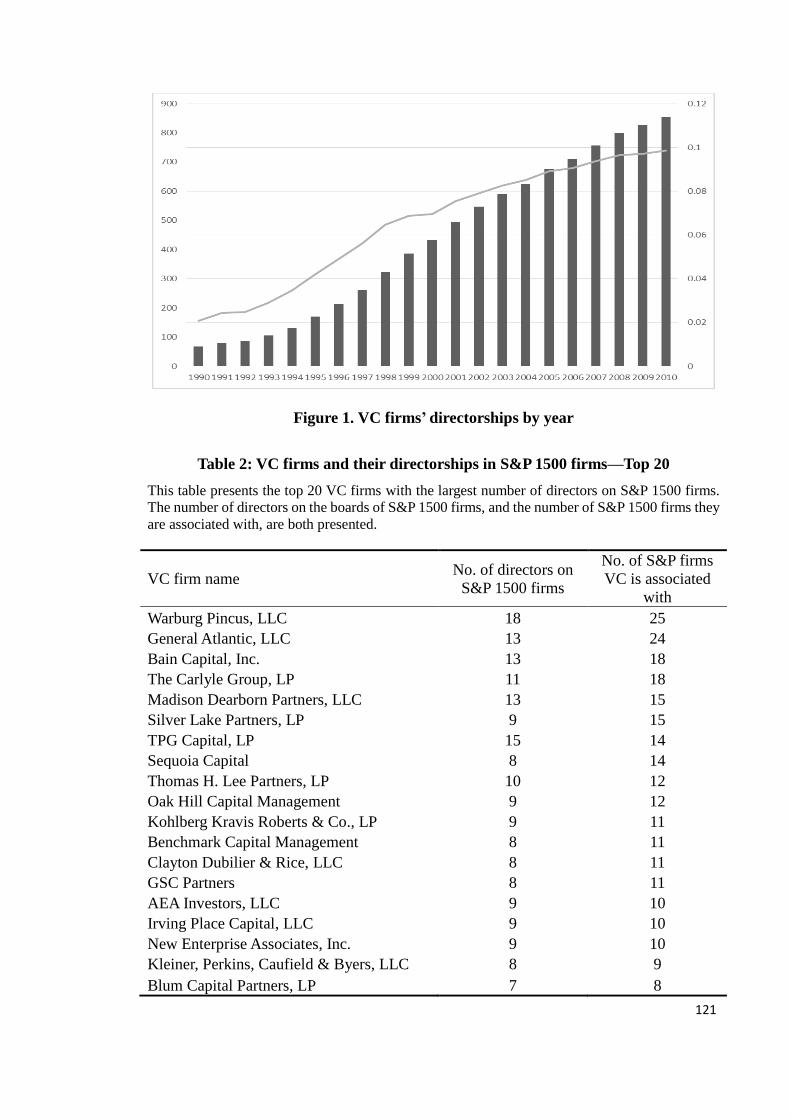
121
Figure 1. VC firms’ directorships by year
Table 2: VC firms and their directorships in S&P 1500 firms—Top 20
This table presents the top 20 VC firms with the largest number of directors on S&P 1500 firms.
The number of directors on the boards of S&P 1500 firms, and the number of S&P 1500 firms they
are associated with, are both presented.
VC firm name No. of directors on
S&P 1500 firms
No. of S&P firms
VC is associated
with
Warburg Pincus, LLC 18 25
General Atlantic, LLC 13 24
Bain Capital, Inc. 13 18
The Carlyle Group, LP 11 18
Madison Dearborn Partners, LLC 13 15
Silver Lake Partners, LP 9 15
TPG Capital, LP 15 14
Sequoia Capital 8 14
Thomas H. Lee Partners, LP 10 12
Oak Hill Capital Management 9 12
Kohlberg Kravis Roberts & Co., LP 9 11
Benchmark Capital Management 8 11
Clayton Dubilier & Rice, LLC 8 11
GSC Partners 8 11
AEA Investors, LLC 9 10
Irving Place Capital, LLC 9 10
New Enterprise Associates, Inc. 9 10
Kleiner, Perkins, Caufield & Byers, LLC 8 9
Blum Capital Partners, LP 7 8
122
Chapter 4
Dead Investors: What do we Know about the Failure of
Venture Capital Firms?
Abstract
This paper examines the failure of venture capital (VC) firms. Based on a sample of 2,752
VC firms in the United States incorporated between 1980 and 2004, we find that almost
one-third of VC firms in our sample had gone out of business by the end of 2014. We then
investigate the causal factors of VC firm failure. Specifically, we examine VC
characteristics (location and year of incorporation) and factors related to VC activities
(fundraising, investment, and exit). Our empirical results show that VC firms with a
higher level of failure tolerance and risk appetite are more likely to fail, while VC firms
with better fundraising abilities and stronger control rights are less likely to fail.
123
4.1 Introduction
Although the survival of VC-backed companies has been examined extensively by
previous studies (e.g., Ruhnka et al., 1992; Gompers, 1995; Cumming and MacIntosh,
2003; Kaplan and Stromberg, 2003, 2004; Cumming, Fleming, and Schwienbacher, 2006;
Nahata, 2008), the survival of the investors (i.e. the VC firms) remains relatively
unexplored. A number of articles in recent years in major VC-related media have brought
the issue of VC firm failure to the attention of researchers.17 Although these articles have
tried to identify a list of failed VC firms, the reasons behind such phenomenon remain
unexplored. This study aims to complete the picture by examining the broader issue of
VC firm failure. This issue of VC firm failure is at least as important as the failure of VC-
backed firms, since the survival of capital providers directly influences entrepreneurial
firms. Understanding the failure of VC firms would enable both investors and investees
to make better investment decisions, and therefore would benefit the development of
entrepreneurship.
We postulate in this paper that the failure of VC firms is influenced by two sets of factors:
VC activities–related factors (fundraising, investments, and exits) and VC characteristics
(location, and year of incorporation). First, because prior studies (Nahata, 2008; Wang
and Wang, 2011; Ruhnka et al., 1992) have suggested that sufficient funding is crucial to
the survival of VC-backed firms, we therefore hypothesise that the ability to raise large
numbers of funds also plays a significant role in the survival of VC firms. Second, in
17 For instance: The Economist, ‘Private equity firms: Zombies at the gates’ (23 March 2013); Entrepreneur,
‘Zombie VC firms can be an entrepreneur’s nightmare’ (1 Nov. 2013); Forbes, ‘Venture capital’s walking
dead’ (1 April 2011); Business Insider, ‘Over half of VC firms have shut down, and many more are dying’
(23 Feb 2011).
124
terms of investment-related factors, we posit that the use of stage financing (Gompers,
1995; Kaplan and Stromberg, 2003, 2004; Tian 2011) and risk appetite (Cumming,
Fleming, and Schwienbacher, 2006; Cumming and MacIntosh, 2003) influence VC firms’
investment outcome, and therefore affect the likelihood of failure. Finally, we postulate
that control rights, as measured by exit route preference (Cumming, 2008), and failure
tolerance, as measured by the number of years spent with failed ventures (Tian and Wang,
2014), also influence the likelihood of failure. On the other hand, we believe that VC
characteristics, including location and year of incorporation, also affect the failure of VC
firms. Specifically, we hypothesise that VC firms based in venture hotbeds, i.e. areas with
a higher level of entrepreneurial activities, are less likely to fail (Gompers et al, 2005).
We also posit that VC firms founded during the internet bubble period were more likely
to fail, because the tremendously increased VC activity at that time was lured by the
success stories of the early-stage internet during the bubble period (Sahlman, 2010).
We first identified failed VC firms. We used hand-collected data on VC firm status from
the office of the U.S. Secretary of State, instead of status reported by the VentureXpert
database, due to the better data quality of the former. We found that nearly one-third of
VC firms in our sample were considered failed, which is a surprisingly large proportion.
We then examined the difference between the failed and living VC firms in terms of their
activities (fundraising, investment, and exit) and characteristics (location and year of
incorporation). Specifically, we found that failed VC firms raise smaller amounts of funds
on average, invest heavily in early-stage and high-tech ventures, have lower control rights
compared to entrepreneurs, and have higher failure tolerance. In addition, we found that
VC firms based outside venture hotbeds, and those established during the internet bubble,
have higher rates of failure. Finally, we used a number of explanatory variables to
125
examine the causal factors of VC firm failure. Our results indicate that VC firms with a
higher level of failure tolerance and risk appetite are more likely to fail, while VC firms
with better fundraising abilities and stronger control rights are less likely to fail.
To the best of our knowledge, this paper is the first to study the failure of VC firms. Our
study completes the picture by examining the other side of VC investments. In addition,
our study provides several practical implications to market practitioners. On the one hand,
our results provide a brief set of criteria that institutional investors could use when
investing in VC funds. They could preliminarily estimate the likelihood of failure of the
VC firm, which could therefore assist in their decision-making. On the other hand, VC
firms themselves should be aware of the potential causal factors of failure, and should
adjust their operational activities accordingly in order to survive.
The rest of this paper is organised as follows: Section 2 highlights related studies in the
literature, and raises testable hypotheses; Section 3 outlines the data and methodology;
Section 4 analyses the data and provides empirical results; and Section 5 concludes the
paper.
4.2 Literature and hypothesis development
To the best of our knowledge, our paper is the first empirical study of the failure of VC
firms. As a result, related studies in the literature are sparse. Before we move on to related
studies, we first develop a framework (as shown in Figure 1), within which we conduct
our literature review and hypotheses development. VC firms are essentially companies
126
themselves; therefore the usual organisational structure, operational activities, and
characteristics of a typical company also apply to VC firms. We mainly looked at two
aspects of VC firms: VC activities and VC characteristics. Specifically, we looked at
fundraising, investment, and exit activities of VC firms, with a focus on their fundraising
ability, use of stage financing, risk appetite, exit route preference, and failure tolerance.
We also looked at their characteristics, including location and year of incorporation.
4.2.1 VC activities and failure of VC firms
According to Gompers and Lerner (2004), the three primary activities of VC firms are
fundraising, investments, and exits. In this section, we review studies in the literature on
these activities of VC firms, and link them to the failure of VC firms.
4.2.1.1 Fundraising
Although there have not yet been any studies on the importance of fundraising for the
survival of VC firms, a number of studies have been conducted on the importance of
funding for VC-backed companies. For instance, Nahata’s (2008) study on VC
investment performance found that successful companies receive on average an aggregate
VC investment of $31.4 million, which is significantly larger than that received by
unsuccessful companies, which is only $21.6 million. His results suggest that the success
of portfolio companies is positively related to the level of funding they receive from their
VC investors. Similarly, studies on cross-border VC investment (Wang and Wang, 2011;
127
Dai, Jo, and Kassicieh, 2012) have also shown that the level of funding that portfolio
companies receive plays a significant role in VC investment success. In an earlier
qualitative study, Ruhnka et al. (1992) surveyed a group of eighty U.S. VC firms to
identify the causal factors of the ‘living dead’ phenomenon in VC investments.18 For both
high-tech and non-high-tech investments, the VC firms surveyed considered the lack of
follow-up funding as one of the top ten reasons for the ‘living dead’ phenomenon. In
general, previous studies have concluded that funding is crucial to the success of
companies: sufficient funding leads to success, while lack of funding leads to failure.
From the perspective of VC firms, unlike portfolio companies, they do not receive
external funding from investors. They do need to raise funds from a limited number of
partners, however, which are usually institutional investors such as pension funds,
endowments, and financial institutions. In other words, VC firms also need funding from
external investors in order to survive. Therefore, VC firms that are able to raise more
funds (i.e. with better fundraising abilities) should be better able to survive, and for longer,
than those with insufficient funding. In addition, fundraising ability to some extent
already measures the quality of a VC firm, such as track record, networks, and trust
between VCs and limited partnerships (LPs) (Kollmann, Kuckertz, and Middelberg,
2014). We therefore hypothesise that VC firms with better fundraising abilities are more
likely to survive:
Hypothesis 1: VC firms with better fundraising abilities are less likely to fail.
18 The term ‘living dead’ refers to portfolio companies that are economically self-sustaining, but are unable
to achieve satisfying levels of sales growth or profitability for their VC investors.
128
4.2.1.2 Investment
The second operational activity is investment. One of the most common features of VC
investment is stage financing, i.e. the stepwise disbursement of capital from VC investors
to entrepreneurial firms (Tian, 2011). VC firms use staging to mitigate agency problems,
because VC investors retain the option to terminate a project if it fails to meet stage targets,
which leads to better investment performance (Gompers, 1995; Kaplan and Stromberg,
2003, 2004). Similarly, a recent study by Tian (2011) found that the use of staging by VC
firms is positively related to the propensity to go public, the operating performance in the
initial public offering (IPO) year, and the post-IPO survival rate. Therefore, we posit that
the use of stage financing should help VC firms reduce investment risk, and therefore
reduce the likelihood of failure:
Hypothesis 2: VC firms that use stage financing are less likely to fail.
Another aspect of VC firms’ investment activities is stage and industry preference, which
reflect VC firms’ risk appetite. A number of previous studies (Cumming, Fleming, and
Schwienbacher, 2006; Cumming and MacIntosh, 2003) have concluded that early-stage
ventures are riskier than expansion-stage and later-stage ventures. In addition, studies on
VC investment performance have also found that early/seed-stage investments have a
lower likelihood of successful exits (Nahata, 2008; Cumming, 2008; Dai et al., 2012). If
a VC firm makes most of its investments in riskier ventures (i.e. seed/early-stage and/or
high-tech ventures), the overall investment risk taken by the VC firm is much higher,
which may lead to a higher failure rate. Therefore, VC firms with a portfolio of riskier

129
companies might have a higher likelihood of failure:
Hypothesis 3: VC firms with an investment preference for early-stage and/or high-tech
ventures are more likely to fail.
4.2.1.3 Exits
We will discuss two aspects of VC exits in this section: exit route preference and failure
tolerance. The former concerns successful ventures, while the latter concerns
unsuccessful ventures. The first factor to consider is that IPOs and trade sales are
conventionally considered to be successful exits for VC firms (Cumming and Dai, 2010;
Dai et al., 2012; Nahata, 2008); a number of studies have examined the choice between
these two exit routes. For instance, Bayar and Chemmanur (2011) found that crucial
factors driving exit choice include competition in the product market, differences in
information asymmetry, and the private benefits of control that accrue to the entrepreneurs.
Among these factors, the third one is most relevant to VC firms. Cumming (2008) argues
that VC firms with stronger control rights prefer exiting by trade sales rather than through
IPOs, since entrepreneurs usually prefer IPOs over trade sales due to the private benefits
of being the CEO of a publicly listed firm (Black and Gilson 1998; Bascha and Walz 2001;
Hellmann 2006). In other words, a preference for trade sale exits over IPOs may suggest
stronger control rights of a VC firm. Stronger control rights may allow VC investors to
manage the investee firm more effectively, and therefore increase its success rate. We
therefore posit that VC firms that prefer trade sales over IPOs as exit routes have a lower
likelihood of failure:
130
Hypothesis 4: VC firms with stronger control rights are less likely to fail.
The concept of VC failure tolerance is relatively new; this measures a VC firm’s attitude
towards underperforming/unsuccessful ventures. Recent studies have examined the
benefits of VC investors’ tolerance for failure of their portfolio companies. Manso (2011)
developed a theoretical model to show that tolerance for failure is crucial in motivating
innovation. His study showed that failure-tolerant VC investors will choose a termination
threshold for a project that is lower than the ex-post optimal level, while failure-intolerant
VCs will choose a higher threshold. Following Manso (2011), Tian and Wang’s (2014)
empirical study examined the relationship between VC investors’ failure tolerance and
corporate innovation, and found consistent results. The effects of failure tolerance to VC
firms themselves, however, remains unknown. We argue that high failure-tolerance would
make VC firms less likely/willing to terminate underperforming projects, and therefore
may incur serious losses. In addition, this effect should be most evident when VC firms
are young, because younger VC firms can only ‘afford’ a very limited number of failures,
while mature VC firms that are more capital-abundant may continue to survive, even after
a number of failed investments. As a result, these young VC firms with higher failure
tolerance are more likely to fail than those that are failure-intolerant, which leads them to
liquidate under-performing projects quickly. In short, we posit that high failure tolerance
is detrimental to VC firms:
Hypothesis 5: VC firms with higher failure tolerance are more likely to fail.
Overall, in this section, we discuss VC activities (fundraising, investments, and exits) and

131
the failure of VC firms. Specifically, we posit that VC firms with better fundraising
abilities, and those that use stage financing, are less likely to fail, while VC firms that
prefer early-stage and/or high-tech ventures, and those with higher failure tolerance, are
more likely to fail.
4.2.2 VC characteristics and failure of VC firms
One fundamental characteristic of VC firms is their type. Traditionally, there are two main
types of VC firms: independent VCs (IVCs) and ‘captive’ VCs (CVCs). The former are
typically funded by LPs such as pension funds, university endowments, and other
institutional investors, while the latter are usually subsidiaries or affiliates of corporations,
financial institutions, or governments. Not only are these two types of VC firms
structurally different; they also have different investment objectives. The common
objectives of CVC investments are usually strategic, or a mixture of both financial and
strategic. For example, a survey conducted in 2008 by the National Institute of Standards
and Technology (NIST) on U.S. corporate VCs found that only 15 percent of the corporate
VCs surveyed had pure financial objectives. The majority of these corporate VCs had
strategic objectives, such as seeking new directions, supporting existing businesses, and
gaining access to new technology. Due to the significant differences between CVCs and
IVCs in terms of organisational structure and operations, it would be misleading if we
included CVCs in our analysis. As a result, we have only focussed on independent VC
firms in the following analysis.
132
4.2.2.1 VC firm location
Gompers et al.’s (2005) study on entrepreneurial ‘spawning’ examined the creation of
venture-backed start-ups. By using a sample of 5,112 VC-backed start-ups that received
financing from 1986 to 1999, they found that the most prolific ‘spawners’ were originally
venture-backed companies located in California (specifically, the Silicon Valley) and
Massachusetts; they concluded that entrepreneurial learning and networks are important
determinants of the creation of venture-backed companies. They pointed out that venture
hotbeds such as California (Silicon Valley) and Massachusetts have a higher level of
entrepreneurial activities than other places, because potential entrepreneurs may find
launching their own venture less daunting. On the one hand, these potential entrepreneurs
have better networks of labour, goods, capital, and customers (Saxenian, 1994). On the
other hand, the general entrepreneurial environment enables potential entrepreneurs to
learn and practice with more experienced entrepreneurs. From the perspective of VC
firms, being located in an area with a high level of entrepreneurial activities may offer
them more investment opportunities, and therefore a higher chance of encountering high-
quality ventures. For example, a VC firm based in California should have a relatively
higher probability of investing in the ‘next Google’ than a VC firm based in, say, Alaska.
That is to say, the entrepreneurial environment within which a VC firm operates may have
a significant impact on its investments, or even its very survival. We therefore posit that
VC firms based in venture hotbeds are more likely to survive than VC firms based in
other states:
Hypothesis 6: VC firms based in venture hotbeds are less likely to fail than VC firms
133
based in other states.
4.2.2.2 VC firm year of incorporation
Another characteristic of VC firms that we examine is the year of incorporation. In their
study, Puri and Zarustkie (2012) examined the performance of VC-backed and non-VC-
backed companies during their entire life cycles. Although they found that VC-backed
firms outperformed non-VC-backed firms during the internet bubble period, the
performance difference between VC- and non-VC-backed firms diminished in the post–
internet bubble years. In other words, VC firms added less value to their portfolio
companies during the bubble period. Their study focussed on the comparison between
VC- and non-VC-backed firms. In another (related) study by Achleitner, Engel, and
Reiner (2013) that only examined VC-backed firms, the authors documented that VC
investments during the period before the internet bubble showed an average internal rate
of return (IRR) of 87 percent, but the average IRR during the bubble years (1999–2000)
was merely 11 percent. Sahlman (2010) also confirmed that mortality rate during the
internet bubble period was higher, and suggested that this trend was the result of
tremendously increased VC activity fuelled by early internet success stories. Therefore,
if a VC firm was founded during the internet bubble period, it would most likely follow
the market trend and wish to participate in such seemingly ‘glamorous’ internet ventures.
As a result, we would expect such VC firms to have more investment failures, which may
eventually have led to the firms themselves failing. We therefore posit that VC firms
established during the internet bubble period are more likely to fail:
134
Hypothesis 7: VC firms incorporated during the internet bubble period are more likely to
fail.
Overall, we argue that the fundamental non-time-varying characteristics of VC firms play
a significant role in the failure of VC firms. Specifically, we posit that VC firms located
outside venture hotbeds, and VC firms established during the internet bubble period,
should have a higher likelihood of failure.
4.3 Data and methodology
4.3.1 Data and sample
We used the VentureXpert database to collect data on VC firms in the United States. We
first included all VC firms in the database. We then excluded captive VC firms and those
with unknown name and unknown location, and only included those that were
incorporated between 1980 and 2004. Our final sample consists of 2,752 VC firms in the
United States with the necessary information. In the following sections, we discuss how
we identified defunct VC firms, the dependent and explanatory variables, and the
estimation model that we used.
135
4.3.2 Identifying failed VC firms
In order to examine the failure of VC firms, we first needed to identify defunct VC firms.
We started with the status of VC firms reported by the VentureXpert database. According
to VentureXpert, the majority of VC firms are considered to be active: either actively
seeking new investments (61.2%), making few investments (0.8%), or reducing
investment activity (0.3%). The rest of the VC firms were considered to be either
inactive/unknown (22.6%) or defunct (15.1%). The criteria used by VentureXpert to
identify active/inactive VC firms is solely based on these firms’ investment activity,
however, and the accuracy of the data is fairly poor.19 As a result, we used an alternative
source to collect information on VC firms’ status. We hand-collected information from
the office of the U.S. Secretary of State, which specifies the current status of business
entities registered in each state in the United States.20 A summary of the status of VC
firms is shown below.
[INSERT TABLE 2 HERE]
In Table 2, we report the status of VC firms in our sample at the end of 2014. We only
included independent VC firms, and those incorporated between 1980 and 2004, allowing
for at least ten years for each VC firm to observe a failure event. According to the office
19 We manually verified the status reported by VentureXpert with the status reported by the authorities (the
office of the U.S. Secretary of State) and found that almost 40 percent were inaccurate. We contacted
Thomson ONE customer service (the owner of VentureXpert) regarding this issue, and were told that this
might be due to out-of-date data. The VC firm status data was obtained through a mixture of surveys,
government filings, public news, and reporters, but was updated irregularly. 20 We were able to find approximately 85 percent of the VC firms on the U.S. Secretary of State website;
the remaining data was collected via a mixture of other sources, including Bloomberg and Dun & Bradstreet
reports and company websites. We also cross-checked data accuracy among these sources, and found
consistent results.

136
of the U.S. Secretary of State, 69.8 percent (1,921) of VC firms in our sample were still
in business at the end of 2014, while 30.20 percent (831) had failed. The defunct VC firms
are those that were legally out of business. We further divided the ‘living’ VC firms into
two groups: active and inactive VC firms. Inactive VC firms (8.68%, 239) are those that
were officially in business but had not made any new investments during the past ten
years (so-called ‘zombie VCs’).21 We considered both active and inactive VC firms as
living in our analysis, and only considered defunct VC firms as failed.
Our results indicate that almost one-third of VC firms fail within ten years, which is a
fairly significant proportion. In the analysis section, we aim to find the difference between
the failed and living VC firms, and therefore the causal factors of VC firm failure.
4.3.3 Dependent variables
The main dependent variable we used in our study was ‘defunct VC firms’, which is a
dummy variable that took the value of one if a VC firm was considered to be failed (as
discussed above) at the end of 2014, and zero otherwise. We also examined inactive VC
firms in our analysis, and used a dummy variable to indicate whether a living VC firm
was active or inactive. This variable took the value of one if the VC firm was active but
had not made any new investments during the past ten years, and zero otherwise.
21 ‘VC walking dead’ or ‘Zombie fund’ are defined as those VC firms/funds that are officially in business
but no longer have enough cash to add new portfolio companies. This phenomenon has been discussed
fiercely in a number of recent articles on Forbes, Reuters PE Hub, VentureBeat, and other VC-related media.
Our study also examines this type of VC firm, in Section 4.
137
4.3.4 Explanatory variables
VC fundraising ability
We used average fund size as a measure of VC firms’ ability to raise new funds. We first
counted the total number of funds, and the total amount a VC firm raised since its
incorporation. Then we divided the total amount by the total number of funds. We used
the natural logarithm in the regression analysis. The larger the average fund size, the better
a VC firm’s fundraising ability.
Use of stage financing
We used the average number of rounds a VC firm invested in one company as a measure
of VC firms’ usage of stage financing. We first counted the total number of rounds and
the total number of companies a VC firm had invested in since its inception. We then
divided the total number of rounds by the total number of companies. The larger this
variable, the more frequently a VC firm used stage financing.
Early-stage preference
We measured the risk appetite of a VC firm by its investment stage preference. If a VC
firm had a high proportion of early-stage investments, we considered this as a sign of high
risk appetite. We used the proportion of early-stage investments as a measure of risk
appetite, which we calculated by dividing the total number of early-stage investments by

138
the total number of investments. This variable ranges from zero to one.
High-tech preference
We also used industry preference as a measure of VC firms’ risk appetite. If a VC firm
had a high proportion of investments in high-tech ventures, we considered this as a sign
of high risk appetite. We used the proportion of high-tech investments as a measure of
risk appetite, which we calculated by dividing the number of high-tech investments by
VC firms’ total number of investments. This variable ranges from zero to one.
VC control rights
We measured the control rights of a VC firm by its exit route preference. We counted the
total number of successful exits (IPOs and trade sales) of VC firms and calculated the
percentage of trade sale exits. The higher the proportion, the stronger the control rights.
This variable ranges from zero to one.
VC failure tolerance
We measured VC failure tolerance by the average number of years a VC firm stayed with
ventures that eventually failed (Tian and Wang, 2014). Specifically, we first identified
failed ventures (‘write-offs’).22 We then calculated the time difference (in years) between
a VC firm’s first investment date in these failed ventures and the last investment date. The
22 We also considered ‘living dead’ investments to be failed ventures. We followed Tian and Wang (2014)
and considered portfolio companies that had not received any new investments during the past ten years as
failed ventures.
139
longer the elapsed time, the higher the failure tolerance of the VC firm.
VC characteristics
We also examined non-time-varying characteristics of VC firms. We constructed dummy
variables to indicate VC firms’ location and year of incorporation. Specifically, we created
indicators of VC firms based in venture hotbeds (California and New York), and VC firms
founded during the internet bubble period (1999–2000).
4.3.5 Estimation model
Logit model
We used a logit model to estimate the causal factors of the failure and inactivity of VC
firms. Since the dependent variables in our analysis are binary in nature, we applied the
logit model. The basic function of the non-linear model is described as:
�̂�𝑖 = 𝑒𝑢/(1 + 𝑒𝑢) (1)
In Table 6 (Models 1–5), �̂�𝑖 is the probability of failure for the ith VC firm; �̂�𝑖 equals 1
if the VC firm was considered to be failed, and 0 otherwise. The analytical form of the
logit model in Table 6 is the following:
140
𝐿𝑖𝑘𝑒𝑙𝑖ℎ𝑜𝑜𝑑 𝑜𝑓 𝑓𝑎𝑖𝑙𝑢𝑟𝑒 𝑜𝑟 𝑖𝑛𝑎𝑐𝑡𝑖𝑣𝑖𝑡𝑦
= 𝑓(𝛼 + 𝛽1𝑉𝐶 𝑓𝑢𝑛𝑑𝑟𝑎𝑖𝑠𝑖𝑛𝑔 𝑎𝑏𝑖𝑙𝑖𝑡𝑦 + 𝛽2𝑈𝑠𝑒 𝑜𝑓 𝑠𝑡𝑎𝑔𝑒𝑑 𝑓𝑖𝑛𝑎𝑛𝑐𝑖𝑛𝑔
+ 𝛽3𝐸𝑎𝑟𝑙𝑦 𝑠𝑡𝑎𝑔𝑒 𝑝𝑟𝑒𝑓𝑒𝑟𝑒𝑛𝑐𝑒 + 𝛽4𝐻𝑖𝑔ℎ 𝑡𝑒𝑐ℎ 𝑝𝑟𝑒𝑓𝑒𝑟𝑒𝑛𝑐𝑒
+ 𝛽5𝑉𝐶 𝑐𝑜𝑛𝑡𝑟𝑜𝑙 𝑟𝑖𝑔ℎ𝑡𝑠 + 𝛽6𝑉𝐶 𝑓𝑎𝑖𝑙𝑢𝑟𝑒 𝑡𝑜𝑙𝑒𝑟𝑎𝑛𝑐𝑒 + 𝛽6𝑉𝑒𝑛𝑡𝑢𝑟𝑒 ℎ𝑜𝑡𝑏𝑒𝑑𝑠
+ 𝛽6𝐼𝑛𝑡𝑒𝑟𝑛𝑒𝑡 𝑏𝑢𝑏𝑏𝑙𝑒 + 𝛽6𝑌𝑒𝑎𝑟 𝑑𝑢𝑚𝑚𝑖𝑒𝑠)
(2)
Where VC fundraising ability was measured by the average fund size (logged). Use of
staged financing was measured by the average number of rounds a VC firm invested in
one company. Early-stage preference was measured by the percentage of early-stage
investments a VC firm made (as a proportion of all investments). High-tech preference
was measured by the percentage of high-tech investments a VC firm made (as a
proportion of all investments). VC control rights was measured by the percentage of trade
sale exits as a proportion of total number of successful exits. VC failure tolerance is the
average number of years a VC firm stayed with ventures that eventually failed. Venture
hotbeds is a dummy variable that took the value of one if the VC firm was based in
California or New York State. Internet bubble is a dummy variable that took the value of
one if the VC firm was established during the internet bubble period (1999–2000), and
zero otherwise. Year dummies are dummy variables that indicate VC firms’ year of
incorporation.
In equation (1), u is the normal linear regression model, which is:
𝑢 = 𝛼 + 𝛽1𝑋1 + 𝛽2𝑋2 + ⋯ + 𝛽𝑡𝑋𝑡 (3)
141
Where 𝛼 is the constant, and 𝛽1 to 𝛽𝑡 are coefficients of independent variables 𝑋1
to 𝑋𝑡. The log transformation of the logistic model is given by:
𝑙𝑛[�̂�𝑖/(1 − �̂�𝑖)] = 𝛼 + 𝛽1𝑋1 + 𝛽2𝑋2 + ⋯ + 𝛽𝑡𝑋𝑡 (4)
The parameters were estimated through the maximum likelihood method. To test the
statistical significance of the predictor variable, we used the Wald test. Pseudo 𝑅2 was
used to measure the goodness fit of the model. Pseudo 𝑅2 is similar to 𝑅2 in the
ordinary least squares (OLS): the larger the pseudo 𝑅2, the better the goodness of fit.
4.4 Analysis and results
In this section we provide the results from our empirical analysis. This section consists of
three parts: summary statistics, univariate analysis, and VC firm failure. In the first part,
we describe characteristics and activities of all VC firms in our sample. In the second part,
we compare the characteristics and activities of failed and living VC firms in terms of
their location, year of incorporation, fundraising abilities, investment, and exit activities.
In the third part, we examine the causal factors of the failure of VC firms by including
potential explanatory variables and control variables. In addition, in a subsection in part
three, we focus on living VC firms, and examine what factors lead to VC firm inactivity.
4.4.1 Summary statistics
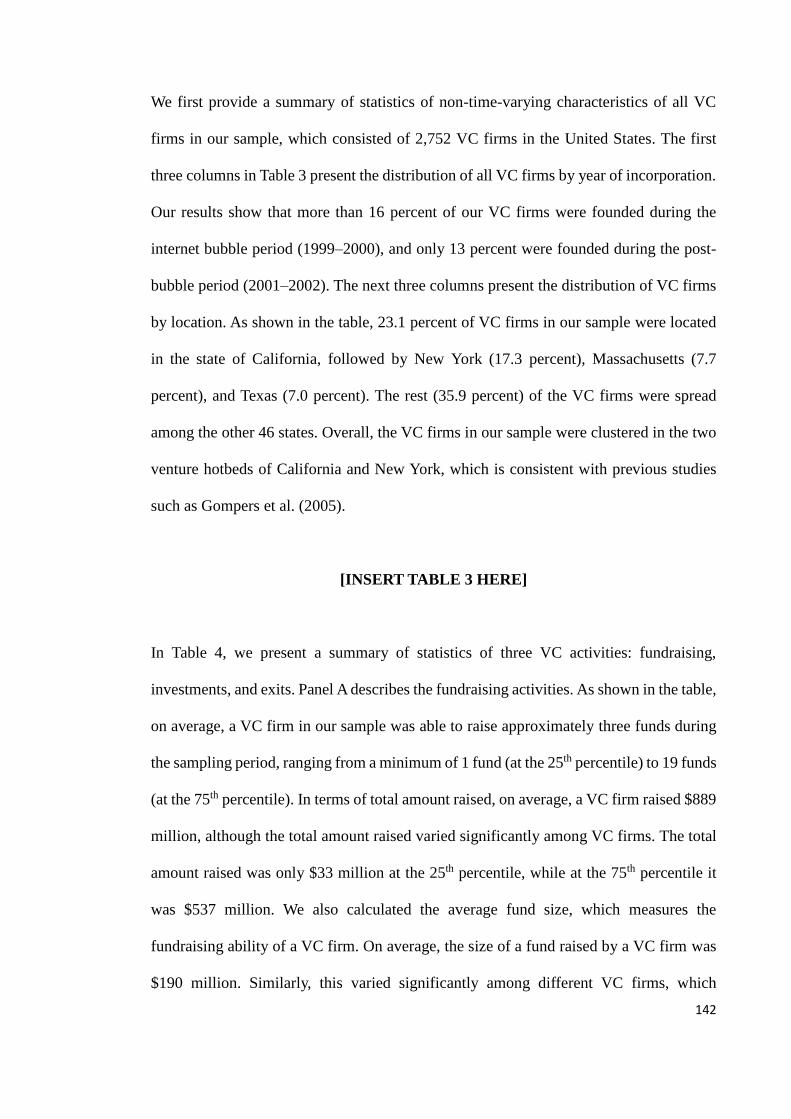
142
We first provide a summary of statistics of non-time-varying characteristics of all VC
firms in our sample, which consisted of 2,752 VC firms in the United States. The first
three columns in Table 3 present the distribution of all VC firms by year of incorporation.
Our results show that more than 16 percent of our VC firms were founded during the
internet bubble period (1999–2000), and only 13 percent were founded during the post-
bubble period (2001–2002). The next three columns present the distribution of VC firms
by location. As shown in the table, 23.1 percent of VC firms in our sample were located
in the state of California, followed by New York (17.3 percent), Massachusetts (7.7
percent), and Texas (7.0 percent). The rest (35.9 percent) of the VC firms were spread
among the other 46 states. Overall, the VC firms in our sample were clustered in the two
venture hotbeds of California and New York, which is consistent with previous studies
such as Gompers et al. (2005).
[INSERT TABLE 3 HERE]
In Table 4, we present a summary of statistics of three VC activities: fundraising,
investments, and exits. Panel A describes the fundraising activities. As shown in the table,
on average, a VC firm in our sample was able to raise approximately three funds during
the sampling period, ranging from a minimum of 1 fund (at the 25th percentile) to 19 funds
(at the 75th percentile). In terms of total amount raised, on average, a VC firm raised $889
million, although the total amount raised varied significantly among VC firms. The total
amount raised was only $33 million at the 25th percentile, while at the 75th percentile it
was $537 million. We also calculated the average fund size, which measures the
fundraising ability of a VC firm. On average, the size of a fund raised by a VC firm was
$190 million. Similarly, this varied significantly among different VC firms, which

143
suggests that the fundraising abilities of VC firms differ considerably from each other. In
other words, some VC firms are better able to raise large funds than other VC firms.
Panel B in Table 4 describes VC firms’ investment activities in terms of their investment
amount, rounds participated in, and number of companies invested in. On average, a VC
firm in our sample invested in 27 companies and participated in 58 rounds during the
sampling period. Based on these factors, we calculated the average number of rounds in
a company, and used this as a measure of VC firms’ use of stage financing. Our results
show that, on average, a VC firm invested more than one (1.71) round in a company,
suggesting the widespread use of stage financing by VC firms. We also calculated the
percentage of investments in the early stage made by all VC firms during the sampling
period, and used this as one measure of VC firms’ risk appetite. As shown in the table, on
average, 18 percent of VC firms’ investments were made in the early stage, and 82 percent
were invested during other stages. These results suggest that VC firms tend to make the
majority of their investments in ‘safer’ ventures, i.e. during the expansion-stage and later-
stage ventures. We also calculated the percentage of investments in high-tech industries
as another measure of VC firms’ risk appetite. As shown in the table, 55 percent of
investments were made in high-tech industries, thus suggesting the technology focus of
VC firms.
Panel C in Table 4 describes the exit activities of VC firms. We looked at both successful
exits (IPOs and trade sales) and unsuccessful exits (‘write-offs’). On average, a VC firm
had six successful exits during the sampling period, consisting of two IPOs and four trade
sales. This result suggests that trade sales are a more common exit route than IPOs, which
is consistent with previous studies (Giot and Schwienbacher, 2007). In terms of write-
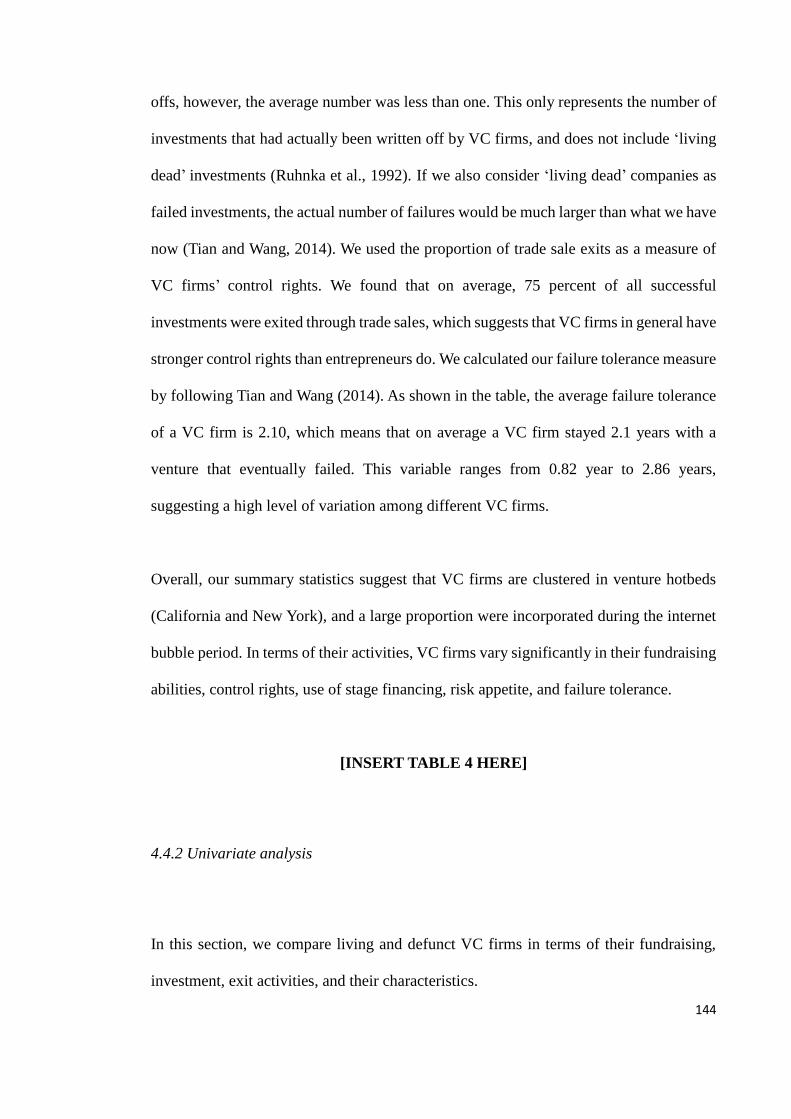
144
offs, however, the average number was less than one. This only represents the number of
investments that had actually been written off by VC firms, and does not include ‘living
dead’ investments (Ruhnka et al., 1992). If we also consider ‘living dead’ companies as
failed investments, the actual number of failures would be much larger than what we have
now (Tian and Wang, 2014). We used the proportion of trade sale exits as a measure of
VC firms’ control rights. We found that on average, 75 percent of all successful
investments were exited through trade sales, which suggests that VC firms in general have
stronger control rights than entrepreneurs do. We calculated our failure tolerance measure
by following Tian and Wang (2014). As shown in the table, the average failure tolerance
of a VC firm is 2.10, which means that on average a VC firm stayed 2.1 years with a
venture that eventually failed. This variable ranges from 0.82 year to 2.86 years,
suggesting a high level of variation among different VC firms.
Overall, our summary statistics suggest that VC firms are clustered in venture hotbeds
(California and New York), and a large proportion were incorporated during the internet
bubble period. In terms of their activities, VC firms vary significantly in their fundraising
abilities, control rights, use of stage financing, risk appetite, and failure tolerance.
[INSERT TABLE 4 HERE]
4.4.2 Univariate analysis
In this section, we compare living and defunct VC firms in terms of their fundraising,
investment, exit activities, and their characteristics.
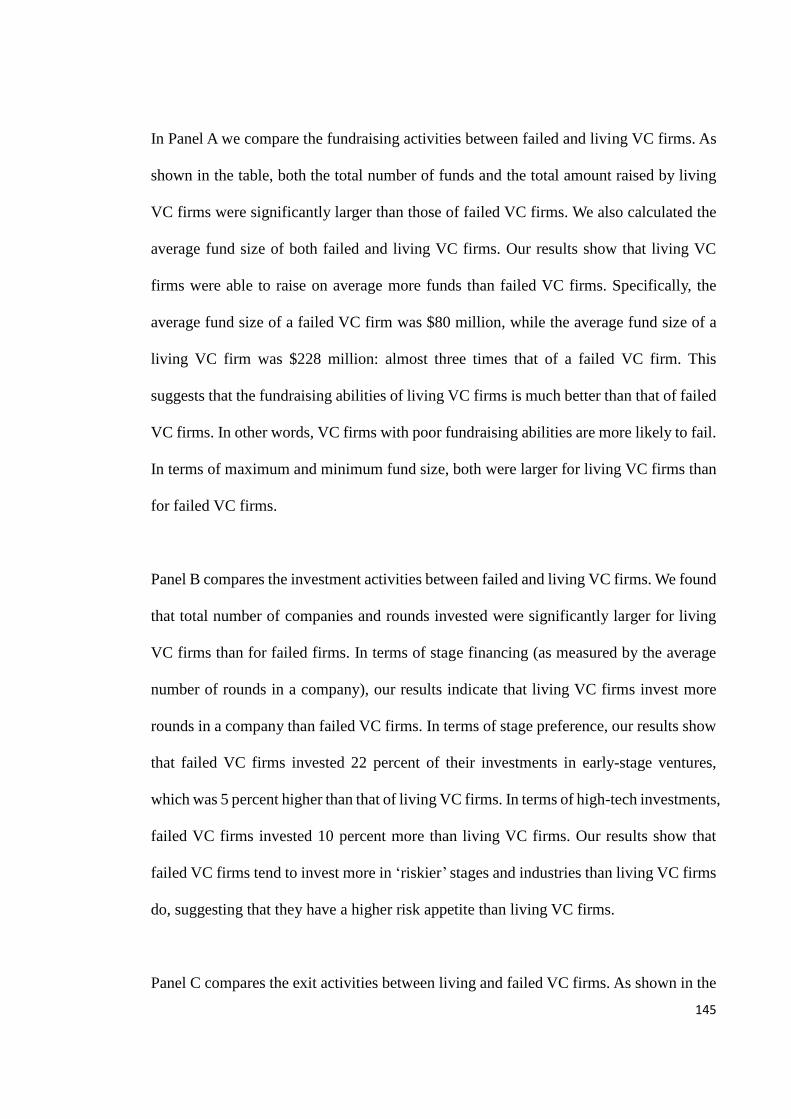
145
In Panel A we compare the fundraising activities between failed and living VC firms. As
shown in the table, both the total number of funds and the total amount raised by living
VC firms were significantly larger than those of failed VC firms. We also calculated the
average fund size of both failed and living VC firms. Our results show that living VC
firms were able to raise on average more funds than failed VC firms. Specifically, the
average fund size of a failed VC firm was $80 million, while the average fund size of a
living VC firm was $228 million: almost three times that of a failed VC firm. This
suggests that the fundraising abilities of living VC firms is much better than that of failed
VC firms. In other words, VC firms with poor fundraising abilities are more likely to fail.
In terms of maximum and minimum fund size, both were larger for living VC firms than
for failed VC firms.
Panel B compares the investment activities between failed and living VC firms. We found
that total number of companies and rounds invested were significantly larger for living
VC firms than for failed firms. In terms of stage financing (as measured by the average
number of rounds in a company), our results indicate that living VC firms invest more
rounds in a company than failed VC firms. In terms of stage preference, our results show
that failed VC firms invested 22 percent of their investments in early-stage ventures,
which was 5 percent higher than that of living VC firms. In terms of high-tech investments,
failed VC firms invested 10 percent more than living VC firms. Our results show that
failed VC firms tend to invest more in ‘riskier’ stages and industries than living VC firms
do, suggesting that they have a higher risk appetite than living VC firms.
Panel C compares the exit activities between living and failed VC firms. As shown in the
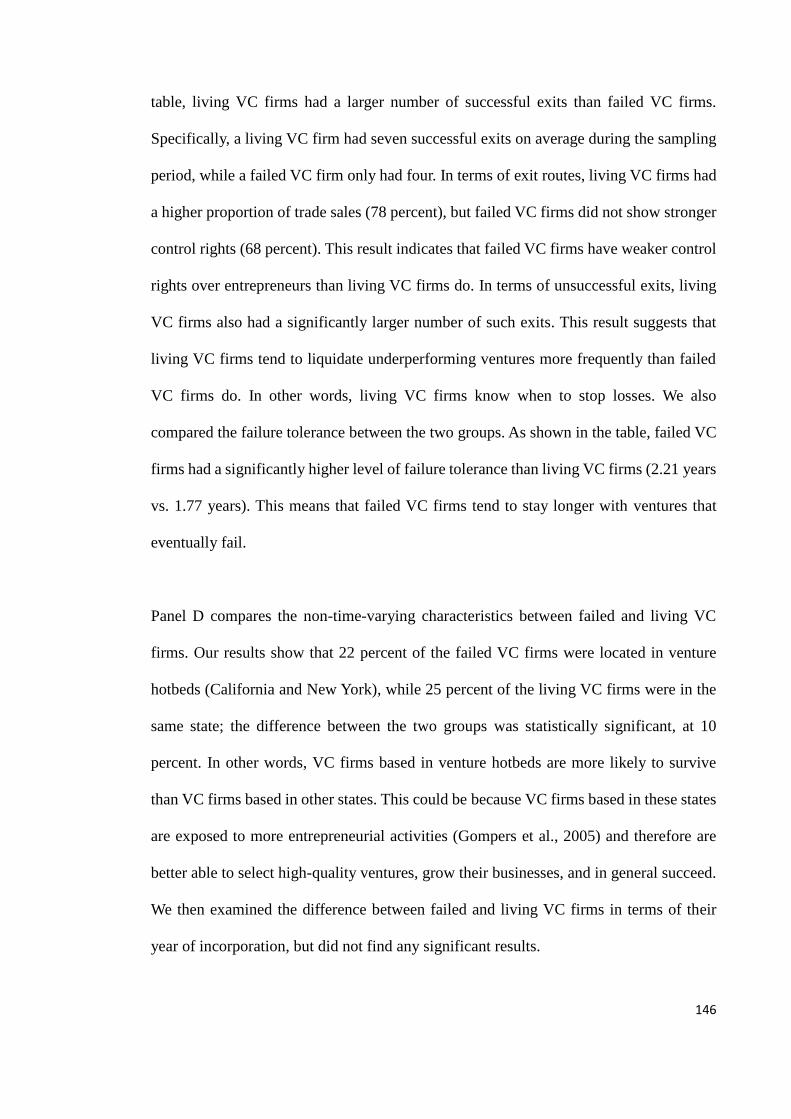
146
table, living VC firms had a larger number of successful exits than failed VC firms.
Specifically, a living VC firm had seven successful exits on average during the sampling
period, while a failed VC firm only had four. In terms of exit routes, living VC firms had
a higher proportion of trade sales (78 percent), but failed VC firms did not show stronger
control rights (68 percent). This result indicates that failed VC firms have weaker control
rights over entrepreneurs than living VC firms do. In terms of unsuccessful exits, living
VC firms also had a significantly larger number of such exits. This result suggests that
living VC firms tend to liquidate underperforming ventures more frequently than failed
VC firms do. In other words, living VC firms know when to stop losses. We also
compared the failure tolerance between the two groups. As shown in the table, failed VC
firms had a significantly higher level of failure tolerance than living VC firms (2.21 years
vs. 1.77 years). This means that failed VC firms tend to stay longer with ventures that
eventually fail.
Panel D compares the non-time-varying characteristics between failed and living VC
firms. Our results show that 22 percent of the failed VC firms were located in venture
hotbeds (California and New York), while 25 percent of the living VC firms were in the
same state; the difference between the two groups was statistically significant, at 10
percent. In other words, VC firms based in venture hotbeds are more likely to survive
than VC firms based in other states. This could be because VC firms based in these states
are exposed to more entrepreneurial activities (Gompers et al., 2005) and therefore are
better able to select high-quality ventures, grow their businesses, and in general succeed.
We then examined the difference between failed and living VC firms in terms of their
year of incorporation, but did not find any significant results.
147
Overall, the results in Table 5 suggest that living VC firms have better fundraising abilities
than failed VC firms. Such firms were able to raise, on average, larger funds than failed
VC firms could. In terms of investment activities, living VC firms tend to use more stage
financing and have a lower level of failure tolerance and risk appetite than failed VC firms.
They use more rounds in a company and invest less in early-stage and high-tech ventures.
Lastly, in terms of exits, living VC firms show stronger control rights, as suggested by
their preference for trade sale exits over IPO exits. In addition, living VC firms have a
lower level of failure tolerance than failed VC firms; they spend a significantly shorter
amount of time with ventures that eventually fail.
[INSERT TABLE 5 HERE]
4.4.3 VC firm failure
In this section, we examine the causal factors of the failure of VC firms. In Table 6, we
used logistic regression to examine a number of potential determinants of VC firm failure.
The dependent variable in all models in Table 6 is a dummy variable, which took the
value of one if the VC firm had failed by the end of 2014, and zero if it was still alive.
We examined explanatory variables based on our hypotheses, which included location,
year of incorporation, fundraising ability, stage financing, control rights, risk appetite,
and failure tolerance. We used VC firms’ non-time-varying characteristics as control
variables, and included them in all models. We then included factors related to VC
activities accordingly in each model.
148
In Model 2, we included a fundraising-related variable. We used average fund size as the
proxy for VC firms’ fundraising abilities. Our results show that the better a VC firm’s
fundraising ability, the lower its likelihood of failure. In other words, VC firms that are
able to raise larger funds are more likely to survive, which is consistent with our
Hypothesis 2. In Model 3, we included investment-related factors: the use of stage
financing and risk appetite. We used the average number of rounds in a company as a
measure of stage financing, and early-stage and high-tech investments (as a fraction of
total investments) as proxies for VC firms’ risk appetite. A higher percentage represents
a higher risk appetite. Our results show that the use of stage financing is negatively related
to the likelihood of failure, while risk appetite is positively related to the likelihood. All
variables are statistically significant. This suggests that VC firms that have a higher risk
appetite use less stage financing, and are more likely to fail, which is consistent with
Hypotheses 2 and 3. In Model 4, we included exit-related factors: control rights and
failure tolerance. Our results show that control rights are negatively related to the
likelihood of failure, which is also significant, at 1 percent. This is consistent with our
Hypothesis 4. In terms of failure tolerance, we found that it is positively and significantly
related to the likelihood of failure. Our results suggest that VC firms with stronger control
rights over entrepreneurs, and those with a lower level of failure tolerance, are less likely
to fail. In Model 5, we included all activities-related factors and found consistent results.
In terms of non-time-varying characteristics, we found that VC firms based in venture
hotbeds are less likely to fail, likely due to their exposure to a higher number of
entrepreneurial activities. In terms of year of incorporation, our results show that VC
firms founded during the internet bubble (1999–2000) period are more likely to fail than
those founded outside (either before or after) this period.
149
[INSERT TABLE 6 HERE]
Overall, our results suggest that VC firms that are able to raise more funds, use more stage
financing, and have stronger control rights are less likely to fail. On the other hand, poor
decision-making at the management level (i.e. high failure tolerance) could potentially
lead to VC firm failure, especially during the earlier years. In addition, VC firms founded
during the period of the internet bubble are more likely to fail.
VC inactivity
In this section, we examined ‘zombie’ VC firms, i.e. VCs that are officially in business
but that have not made any new investments during the past ten years.23 Although this
phenomenon has been discussed frequently in the media in recent years, the reasons
behind such inactivity remain relatively unknown. In this section, we aimed to explore
‘walking dead’ VC firms in more detail, and to try to understand what factors have caused
these VC firms to become inactive.
We considered ‘inactivity’ as a status that lies somewhere between success and failure.
These VC firms likely still have some active companies in their investment portfolio but
are unable to raise further capital (or recover capital through exits) to add new investments.
In this sense, they are survivors, but definitely would not be considered successes.
Another possible explanation is that these VC firms entered ‘dormancy’ willingly, i.e.
they chose not to make any new investments during a period of ten or fifteen years. This
23 We also used 15 years as the criterion, and found consistent results.
150
could be the case for corporate VC firms, which are sponsored by their corporate parents
and mainly pursue strategic rather than financial objectives. Independent VC firms,
however, raise capital from external LPs and usually are required to liquidate the fund
and distribute profit within ten to twelve years. That is to say, these VC firms are under
pressure to continuously produce a satisfying level of return for limited partners, and
therefore are unlikely to intentionally stop investment activities. Therefore, independent
VC firms in our sample were more likely to become inactive unwillingly. We postulate
that the inactive status is a result of similar factors that cause VC firms to fail.
In our analysis, we only focussed on living VC firms, and then further divided living VC
firms into active and inactive firms. In Table 7, the dependent variable in all models is a
dummy that took the value of one if the VC firm was considered to be inactive at the end
of 2014, and zero if it was still active. We examined the same factors we used in our
analysis of VC firm failure, i.e. activities-related factors and characteristics. Our results
show that fundraising ability, risk appetite, control rights, and failure tolerance still play
significant roles. Specifically, VC firms with better fundraising abilities and control rights
are more likely to be active, while VC firms with a higher level of risk appetite and failure
tolerance are more likely to become inactive. Our results suggest that VC firm inactivity
is subject to the same factors that cause VC firms to fail.
[INSERT TABLE 7 HERE]
151
4.5 Conclusion
Although previous studies have examined extensively the failure/success of VC-backed
companies, the survival of VC investors has received little attention from academia. In
this paper, we examined the failure of VC firms. We hand-collected VC firm status data
from the office of the U.S. Secretary of State, and collected VC firm characteristics and
activities data from VentureXpert. We found that almost one-third of VC firms in our
sample could be classified as failed VC firms, which is a surprisingly large proportion.
We further examined the difference between failed and living VC firms in terms of their
activities and characteristics, and found significant results. Finally, we used a number of
explanatory variables to examine the causal factors of VC firm failure. Our results
indicate that VC firms with a higher level of failure tolerance and risk appetite are more
likely to fail, while VC firms with better fundraising abilities and stronger control rights
are less likely to fail. However, one shortfall of our study is that it only incorporated firm-
level factors but did not include founder/partner-level factors. Individual general partner’s
quality as measured by their education background, work experience, and expertise etc.
could also be used to explain the failure of VC firms. Also, by incorporating these
measures, the concern of potential unobserved heterogeneity could be reduced. Future
studies that look at this area could shed more light on the issue of VC firm failure.
To the best of our knowledge, this paper is the first study to examine the failure of VC
firms. Our study provides several practical implications for market practitioners. For
instance, our results provide institutional investors (from whom VC firms raise capital,
or LPs) brief assessment criteria, which could assist in their decision-making. For instance,
more risk-averse institutional investors may prefer to invest in VC firms with a lower
152
level of failure tolerance and risk appetite, both of which decrease the likelihood of failure.
On the other hand, VC firms could adjust operational activities accordingly to increase
their likelihood of survival. For instance, inexperienced VC firms should be less failure-
tolerant when dealing with underperforming ventures, and should terminate such
investments in a timely manner. In addition, this study is the first to examine the failure
of VC firms, and therefore brings the issue of VC firm survival to the attention of policy
makers. More favourable polices should be created to support young and small VC firms,
which is crucial to entrepreneurship and economic development.
Our study generates several interesting questions for future research. For instance, our
study only briefly examined ‘walking dead’ VC firms, and identified a set of casual
factors of the inactivity phenomena. A number of questions remain unexplored, however.
For instance, why can’t these VC firms raise new funds? What do their operational
activities consist of if they are not making new investments? Do these ‘walking dead’ VC
firms eventually fail? If they do survive, what strategies did they use to turn the firm
around? Future research that explores these questions could shed new light on the survival
of VC firms, and would provide a more complete picture of the entire life cycle of VC
firms.
153
References
Achleitner, A. K., Engel, N. and Reiner, U. 2013. The performance of venture capital
investments: Do investors overact? Review of Financial Economics 22, 20-35.
Bascha, A., and Walz, U. 2001. Convertible securities and optimal exit decisions in
venture capital finance. Journal of Corporate Finance 7, 285-306.
Bayar, O., and Chemmanur, T. 2011. IPOs versus acquisitions and the valuation premium
puzzle: A theory of exit choice by entrepreneurs and venture capitalists. Journal of
Financial and Quantitative Analysis 46, 1755-1793.
Black, B. S., and Gilson, R. J. 1998. Venture capital and the structure of capital markets:
Banks versus stock markets. Journal of Financial Economics 47, 243-277.
Cumming, D., Fleming, G., and Schwienbacher, A. 2006. Legality and VC exits. Journal
of Corporate Finance 12, 214-245.
Cumming, D. J., and MacIntosh, J. G. 2003. VC exits in Canada and the United States.
University of Toronto Law Journal 53, 101-200.
Cumming, D. 2008. Contracts and exits in venture capital finance. Review of Financial
Studies 21, 1947-1982.
Cumming, D., and Dai, N. 2010. Local bias in VC investments. Journal of Empirical
Finance 17, 362-380.
Dai, N., Jo, H., and Kassicieh, S. 2012. Cross-border VC investments in Asia: Selection
and exit performance. Journal of Business Venturing 27, 666-684.
Giot, P., and Schwienbacher, A. 2007. IPOs, trade sales and liquidations: Modelling
venture capital exits using survival analysis. Journal of Banking and Finance 31,
679-702.
Gompers, P., and Lerner, J. 2004. The venture capital cycle. 2nd ed. Cambridge, MA:
MIT Press.
Gompers, P. 1995. Optimal investments, monitoring, and the staging of venture capital.
Journal of Finance 5, 1461-1489.
Gompers, P., Lerner, J., and Scharfstein, D. 2005. Entrepreneurial spawning: Public
corporations and the genesis of new ventures, 1986 to 1999. Journal of Finance 60,
577-614.
Hellmann, T. 2006. IPOs, acquisitions, and the use of convertible securities in venture
capital. Journal of Financial Economics 81, 649-679.
154
Kaplan, S., and Stromberg, P. 2003. Financial contracting theory meets the real world: An
empirical analysis of venture capital contracts. Review of Economic Studies 70, 281-
315.
Kaplan, S., and Stromberg, P. 2004. Characteristics, contracts, and actions: Evidence from
venture capitalist analyses. Journal of Finance 59, 2177-2210.
Kollmann, T., Kuckertz, A., and Middelberg, N. 2014. Trust and controllability in venture
capital fundraising. Journal of Business Research 67, 2411-2418.
Manso, G. 2011. Motivating innovation. Journal of Finance 66, 1823-1860.
Nahata, R. 2008. Venture capital reputation and investment performance. Journal of
Financial Economics 90, 127-151.
Puri, M., and Zarutskie, R. 2012. On the life cycle dynamics of venture-capital- and non-
venture-capital-financed firms. Journal of Finance 67, 2247-2293.
Ruhnka, J., Feldman, H., and Dean, T. 1992. The ‘living dead’ phenomenon in venture
capital investments. Journal of Business Venturing 7, 137-155.
Sahlman, W. A. 2010. Risk and reward in venture capital. Harvard Business School Note,
811-836, 1-37.
Saxenian, A. L. 1994. Regional advantage: Culture and competition in Silicon Valley and
Route 128. Cambridge, MA: Harvard University Press.
Tian, X. 2011. The causes and consequences of venture capital stage financing. Journal
of Financial Economics 101, 132-159.
Tian, X., and Wang, T. 2014. Tolerance for failure and corporate innovation. Review of
Financial Studies 27, 211-255.
Wang, L., and Wang, S. 2012. Cross-border venture capital performance: Evidence from
China. Pan-Basin Finance Journal 19, 71-79.
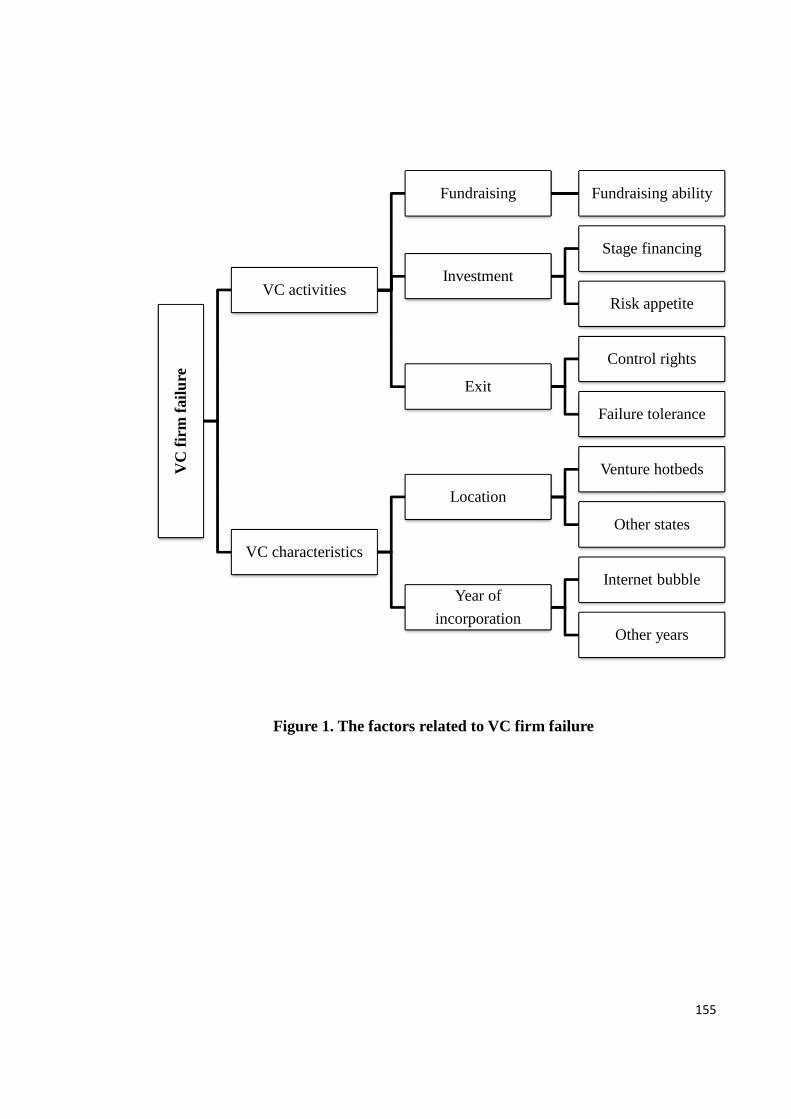
155
Figure 1. The factors related to VC firm failure
VC
fir
m f
ail
ure
VC activities
Fundraising Fundraising ability
Investment
Stage financing
Risk appetite
Exit
Control rights
Failure tolerance
VC characteristics
Location
Venture hotbeds
Other states
Year of
incorporation
Internet bubble
Other years
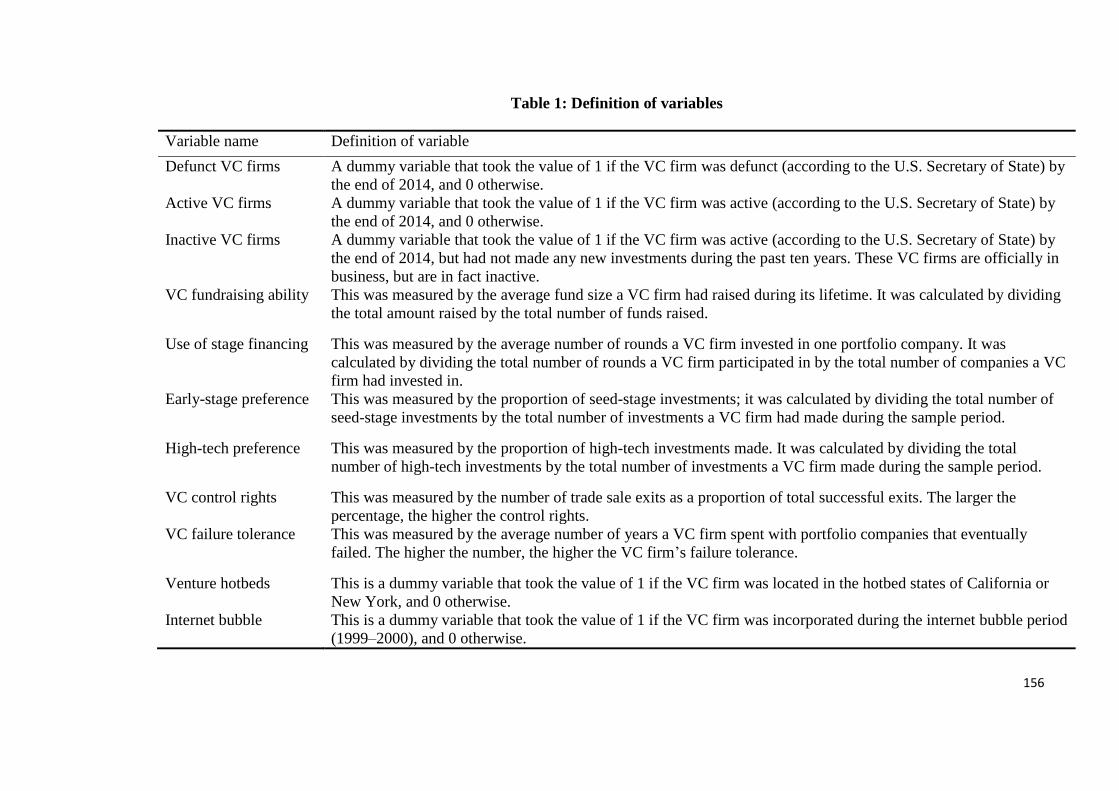
156
Table 1: Definition of variables
Variable name Definition of variable
Defunct VC firms A dummy variable that took the value of 1 if the VC firm was defunct (according to the U.S. Secretary of State) by
the end of 2014, and 0 otherwise.
Active VC firms A dummy variable that took the value of 1 if the VC firm was active (according to the U.S. Secretary of State) by
the end of 2014, and 0 otherwise.
Inactive VC firms A dummy variable that took the value of 1 if the VC firm was active (according to the U.S. Secretary of State) by
the end of 2014, but had not made any new investments during the past ten years. These VC firms are officially in
business, but are in fact inactive.
VC fundraising ability This was measured by the average fund size a VC firm had raised during its lifetime. It was calculated by dividing
the total amount raised by the total number of funds raised.
Use of stage financing This was measured by the average number of rounds a VC firm invested in one portfolio company. It was
calculated by dividing the total number of rounds a VC firm participated in by the total number of companies a VC
firm had invested in.
Early-stage preference This was measured by the proportion of seed-stage investments; it was calculated by dividing the total number of
seed-stage investments by the total number of investments a VC firm had made during the sample period.
High-tech preference This was measured by the proportion of high-tech investments made. It was calculated by dividing the total
number of high-tech investments by the total number of investments a VC firm made during the sample period.
VC control rights This was measured by the number of trade sale exits as a proportion of total successful exits. The larger the
percentage, the higher the control rights.
VC failure tolerance This was measured by the average number of years a VC firm spent with portfolio companies that eventually
failed. The higher the number, the higher the VC firm’s failure tolerance.
Venture hotbeds This is a dummy variable that took the value of 1 if the VC firm was located in the hotbed states of California or
New York, and 0 otherwise.
Internet bubble This is a dummy variable that took the value of 1 if the VC firm was incorporated during the internet bubble period
(1999–2000), and 0 otherwise.

157
Table 2: The status of VC firms
This table presents the current status of VC firms. We hand-collected the status information from the office of the
U.S. Secretary of State (50 states). The reported status is the status at the end of 2014. We only included VC firms
that were incorporated between 1980 and 2004, with known location (state and city), and those that were not
affiliated with corporations, financial institutions, or governments. Our final sample consists of 2,752 VC firms
based in the United States. Living VC firms are those that were officially in business, and defunct VC firms are those
that had gone out of business by the end of 2014. We further divided the living VC firms into two groups: active
and inactive VC firms. Inactive VC firms are those that were officially in business but had not made any new
investments during the past ten years (so-called ‘zombie VCs’).
% N
Living VC firms 69.80% 1,921
Active VC firms 61.12% 1,682
Inactive VC firms 8.68% 239
Defunct VC firms 30.20% 831
Total 100.00% 2,752
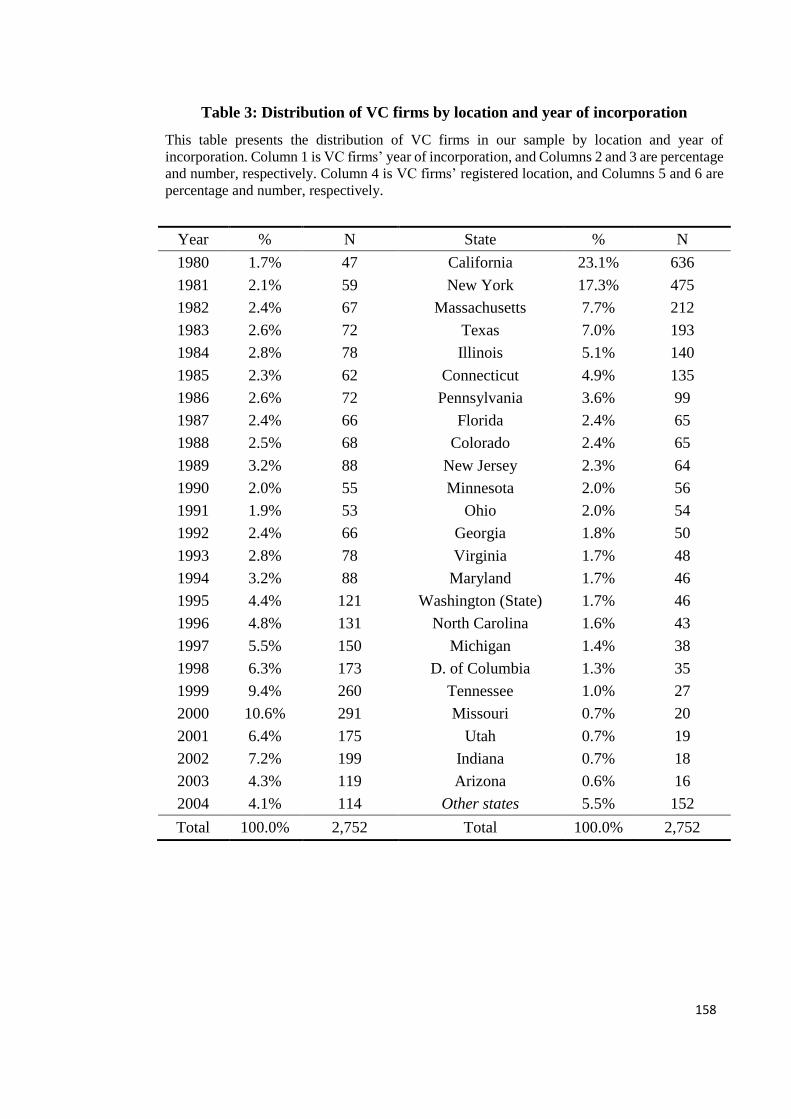
158
Table 3: Distribution of VC firms by location and year of incorporation
This table presents the distribution of VC firms in our sample by location and year of
incorporation. Column 1 is VC firms’ year of incorporation, and Columns 2 and 3 are percentage
and number, respectively. Column 4 is VC firms’ registered location, and Columns 5 and 6 are
percentage and number, respectively.
Year % N State % N
1980 1.7% 47 California 23.1% 636
1981 2.1% 59 New York 17.3% 475
1982 2.4% 67 Massachusetts 7.7% 212
1983 2.6% 72 Texas 7.0% 193
1984 2.8% 78 Illinois 5.1% 140
1985 2.3% 62 Connecticut 4.9% 135
1986 2.6% 72 Pennsylvania 3.6% 99
1987 2.4% 66 Florida 2.4% 65
1988 2.5% 68 Colorado 2.4% 65
1989 3.2% 88 New Jersey 2.3% 64
1990 2.0% 55 Minnesota 2.0% 56
1991 1.9% 53 Ohio 2.0% 54
1992 2.4% 66 Georgia 1.8% 50
1993 2.8% 78 Virginia 1.7% 48
1994 3.2% 88 Maryland 1.7% 46
1995 4.4% 121 Washington (State) 1.7% 46
1996 4.8% 131 North Carolina 1.6% 43
1997 5.5% 150 Michigan 1.4% 38
1998 6.3% 173 D. of Columbia 1.3% 35
1999 9.4% 260 Tennessee 1.0% 27
2000 10.6% 291 Missouri 0.7% 20
2001 6.4% 175 Utah 0.7% 19
2002 7.2% 199 Indiana 0.7% 18
2003 4.3% 119 Arizona 0.6% 16
2004 4.1% 114 Other states 5.5% 152
Total 100.0% 2,752 Total 100.0% 2,752

159
Table 4: Summary statistics
Panel A presents the descriptive statistics of VC fundraising activities. We summarise the total number of funds raised, total amount raised,
maximum fund size, minimum fund size, average fund size, and average target size during the sample period. We report the mean, median,
standard deviation, and the value at the 25th and 75th percentiles. Panel B presents an analysis of VC fundraising activities between defunct
and living VC firms. Column 2 is on failed VC firms; Column 3 is on living VC firms; Column 4 is the difference between Column 2 and
Column 3; Column 5 is t-statistics; and Column 6 is the p-value. All amounts and sizes are in millions of U.S. dollars. ***, **, and * indicate
statistical significance at the 1%, 5%, and 10% levels, respectively.
Panel A: Fundraising-related factors
N Mean Median SD 25% 75%
Total number of funds 1,486 3.02 2.00 3.28 1.00 4.00
Total amount raised 1,486 889.36 124.02 3,199.54 33.30 537.22
Average fund size 1,486 190.28 64.06 396.12 23.52 177.75
Maximum fund size 1,486 359.01 95.60 972.76 28.00 275.00
Minimum fund size 1,486 87.52 30.00 203.40 10.10 89.21
Panel B: Investment-related factors
Total number of companies invested in 2,150 26.85 10.00 50.68 3.00 29.00
Total number of rounds invested 2,150 58.11 15.00 126.25 4.00 57.00
Average number of rounds in a company 2,150 1.71 1.50 0.79 1.00 2.07
% of investments in early-stage ventures 2,150 0.18 0.14 0.22 0.00 0.27
% of investments in high-tech ventures 2,150 0.55 0.67 0.37 0.14 0.87
Panel C: Exit-related factors
Total number of IPO exits 2,752 1.86 0.00 6.18 0.00 1.00
Total number of trade sale exits 2,752 4.50 1.00 11.34 0.00 4.00
Total number of ‘write-offs’ 2,752 0.54 0.00 1.61 0.00 0.00
% of exits through trade sales 1,521 0.75 0.86 0.30 0.60 1.00
VC failure tolerance 930 2.10 1.63 2.03 0.82 2.86
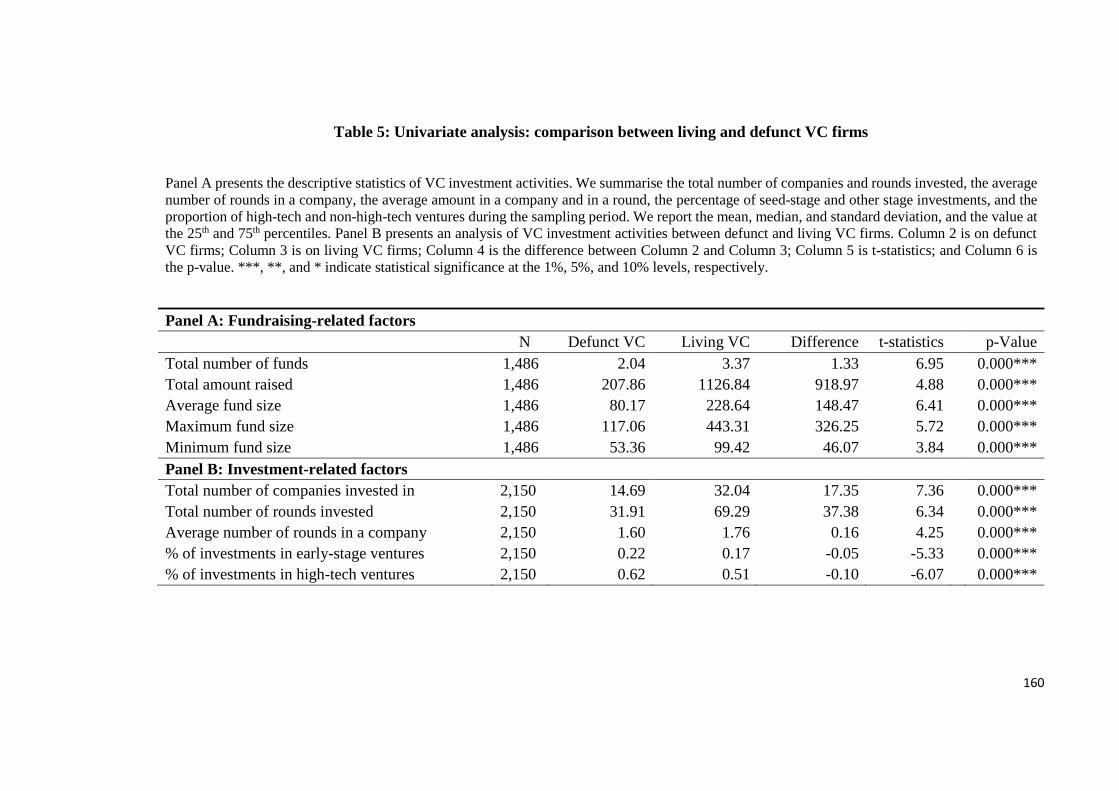
160
Table 5: Univariate analysis: comparison between living and defunct VC firms
Panel A presents the descriptive statistics of VC investment activities. We summarise the total number of companies and rounds invested, the average
number of rounds in a company, the average amount in a company and in a round, the percentage of seed-stage and other stage investments, and the
proportion of high-tech and non-high-tech ventures during the sampling period. We report the mean, median, and standard deviation, and the value at
the 25th and 75th percentiles. Panel B presents an analysis of VC investment activities between defunct and living VC firms. Column 2 is on defunct
VC firms; Column 3 is on living VC firms; Column 4 is the difference between Column 2 and Column 3; Column 5 is t-statistics; and Column 6 is
the p-value. ***, **, and * indicate statistical significance at the 1%, 5%, and 10% levels, respectively.
Panel A: Fundraising-related factors
N Defunct VC Living VC Difference t-statistics p-Value
Total number of funds 1,486 2.04 3.37 1.33 6.95 0.000***
Total amount raised 1,486 207.86 1126.84 918.97 4.88 0.000***
Average fund size 1,486 80.17 228.64 148.47 6.41 0.000***
Maximum fund size 1,486 117.06 443.31 326.25 5.72 0.000***
Minimum fund size 1,486 53.36 99.42 46.07 3.84 0.000***
Panel B: Investment-related factors
Total number of companies invested in 2,150 14.69 32.04 17.35 7.36 0.000***
Total number of rounds invested 2,150 31.91 69.29 37.38 6.34 0.000***
Average number of rounds in a company 2,150 1.60 1.76 0.16 4.25 0.000***
% of investments in early-stage ventures 2,150 0.22 0.17 -0.05 -5.33 0.000***
% of investments in high-tech ventures 2,150 0.62 0.51 -0.10 -6.07 0.000***
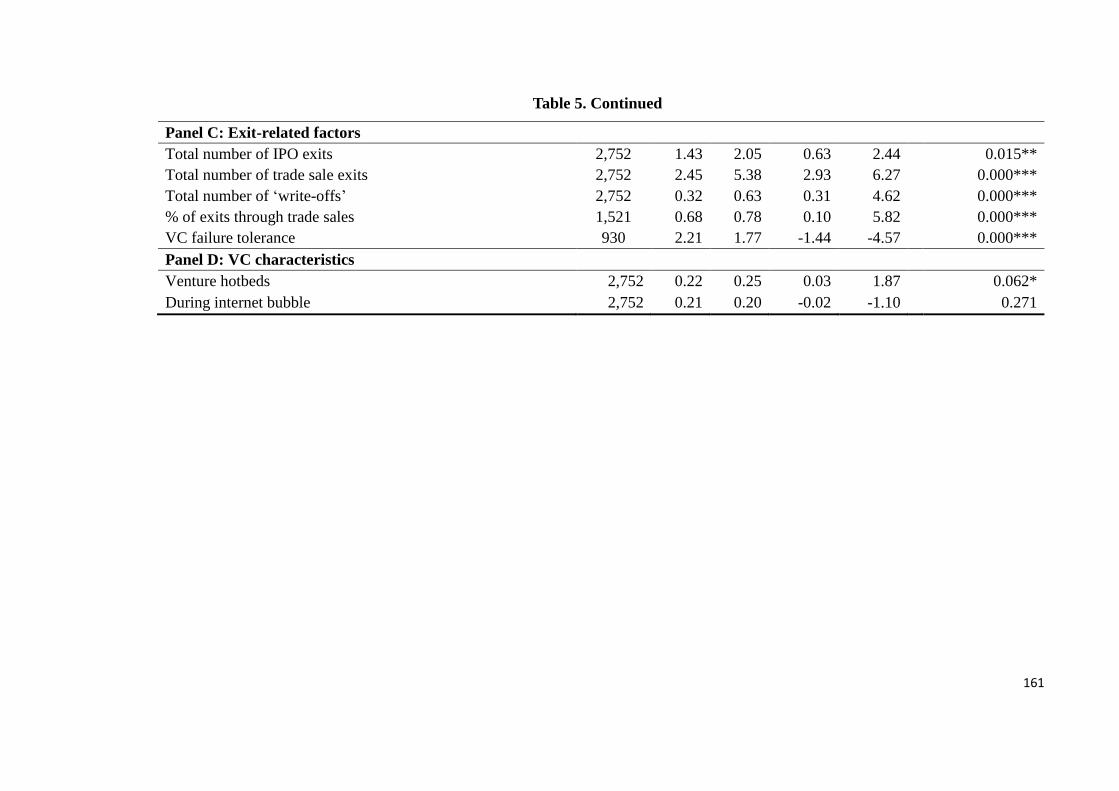
161
Table 5. Continued
Panel C: Exit-related factors
Total number of IPO exits 2,752 1.43 2.05 0.63 2.44 0.015**
Total number of trade sale exits 2,752 2.45 5.38 2.93 6.27 0.000***
Total number of ‘write-offs’ 2,752 0.32 0.63 0.31 4.62 0.000***
% of exits through trade sales 1,521 0.68 0.78 0.10 5.82 0.000***
VC failure tolerance 930 2.21 1.77 -1.44 -4.57 0.000***
Panel D: VC characteristics
Venture hotbeds 2,752 0.22 0.25 0.03 1.87 0.062*
During internet bubble 2,752 0.21 0.20 -0.02 -1.10 0.271
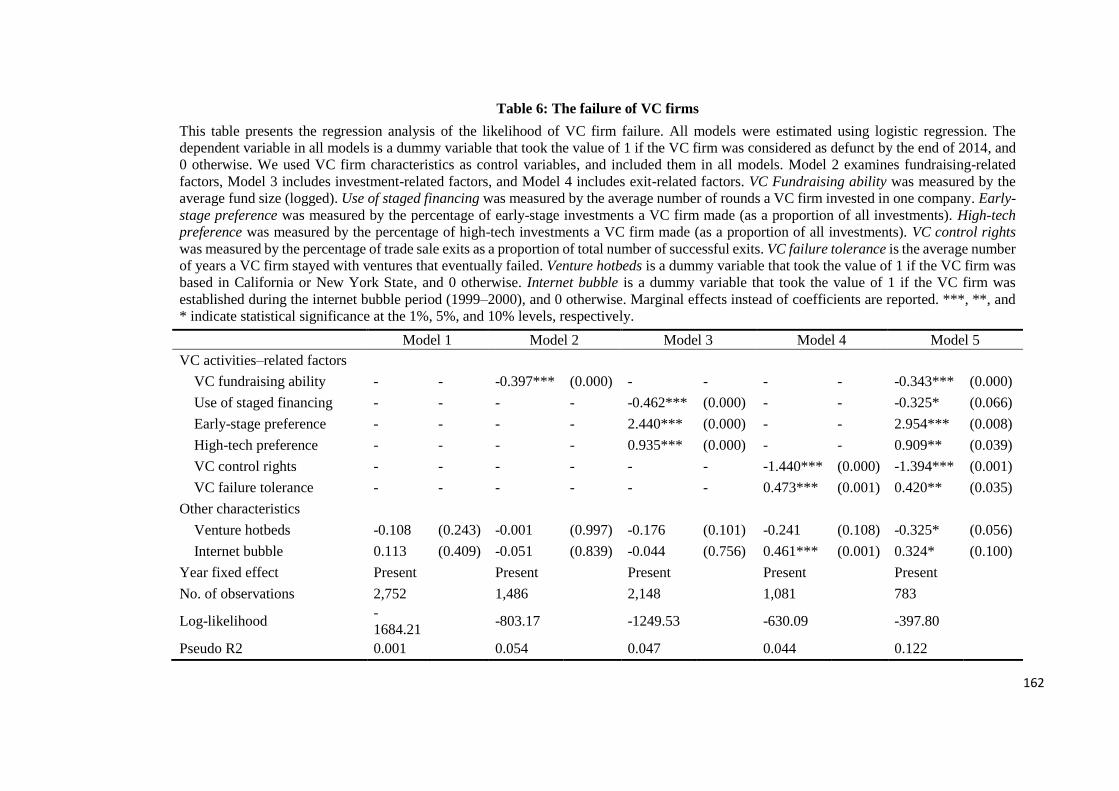
162
Table 6: The failure of VC firms
This table presents the regression analysis of the likelihood of VC firm failure. All models were estimated using logistic regression. The
dependent variable in all models is a dummy variable that took the value of 1 if the VC firm was considered as defunct by the end of 2014, and
0 otherwise. We used VC firm characteristics as control variables, and included them in all models. Model 2 examines fundraising-related
factors, Model 3 includes investment-related factors, and Model 4 includes exit-related factors. VC Fundraising ability was measured by the
average fund size (logged). Use of staged financing was measured by the average number of rounds a VC firm invested in one company. Early-
stage preference was measured by the percentage of early-stage investments a VC firm made (as a proportion of all investments). High-tech
preference was measured by the percentage of high-tech investments a VC firm made (as a proportion of all investments). VC control rights
was measured by the percentage of trade sale exits as a proportion of total number of successful exits. VC failure tolerance is the average number
of years a VC firm stayed with ventures that eventually failed. Venture hotbeds is a dummy variable that took the value of 1 if the VC firm was
based in California or New York State, and 0 otherwise. Internet bubble is a dummy variable that took the value of 1 if the VC firm was
established during the internet bubble period (1999–2000), and 0 otherwise. Marginal effects instead of coefficients are reported. ***, **, and
* indicate statistical significance at the 1%, 5%, and 10% levels, respectively.
Model 1 Model 2 Model 3 Model 4 Model 5
VC activities–related factors
VC fundraising ability - - -0.397*** (0.000) - - - - -0.343*** (0.000)
Use of staged financing - - - - -0.462*** (0.000) - - -0.325* (0.066)
Early-stage preference - - - - 2.440*** (0.000) - - 2.954*** (0.008)
High-tech preference - - - - 0.935*** (0.000) - - 0.909** (0.039)
VC control rights - - - - - - -1.440*** (0.000) -1.394*** (0.001)
VC failure tolerance - - - - - - 0.473*** (0.001) 0.420** (0.035)
Other characteristics
Venture hotbeds -0.108 (0.243) -0.001 (0.997) -0.176 (0.101) -0.241 (0.108) -0.325* (0.056)
Internet bubble 0.113 (0.409) -0.051 (0.839) -0.044 (0.756) 0.461*** (0.001) 0.324* (0.100)
Year fixed effect Present Present Present Present Present
No. of observations 2,752 1,486 2,148 1,081 783
Log-likelihood -
1684.21 -803.17 -1249.53 -630.09 -397.80
Pseudo R2 0.001 0.054 0.047 0.044 0.122
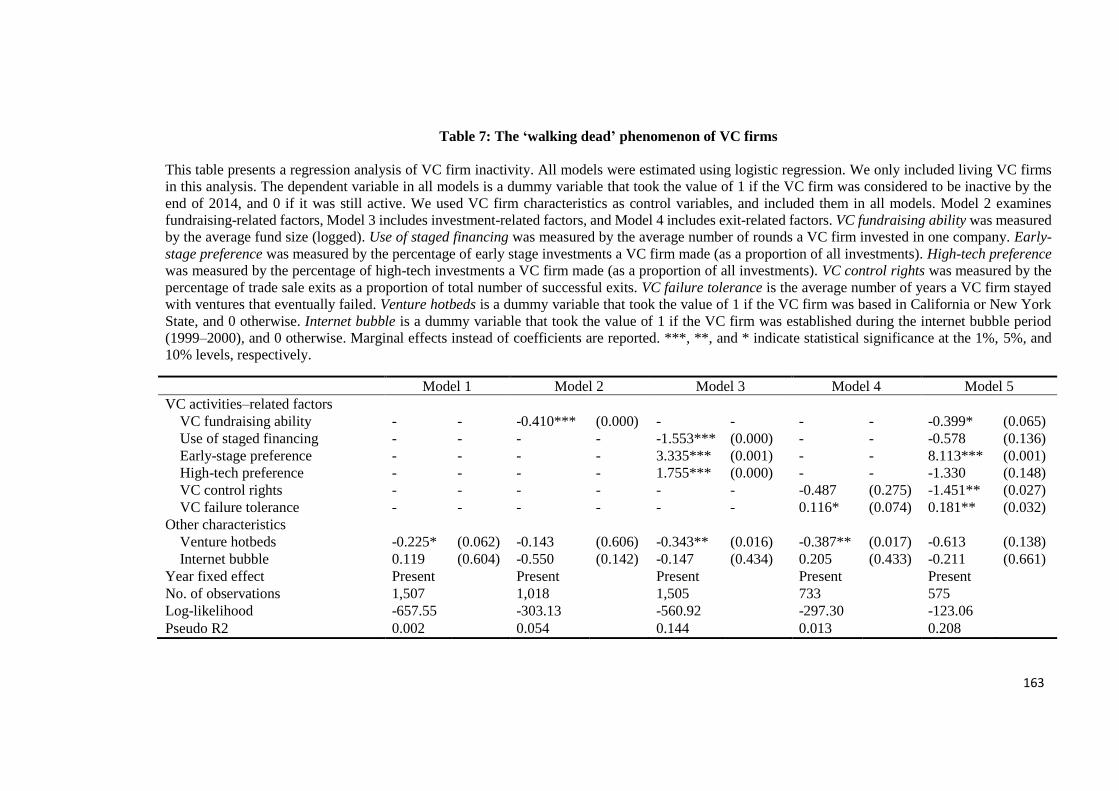
163
Table 7: The ‘walking dead’ phenomenon of VC firms
This table presents a regression analysis of VC firm inactivity. All models were estimated using logistic regression. We only included living VC firms
in this analysis. The dependent variable in all models is a dummy variable that took the value of 1 if the VC firm was considered to be inactive by the
end of 2014, and 0 if it was still active. We used VC firm characteristics as control variables, and included them in all models. Model 2 examines
fundraising-related factors, Model 3 includes investment-related factors, and Model 4 includes exit-related factors. VC fundraising ability was measured
by the average fund size (logged). Use of staged financing was measured by the average number of rounds a VC firm invested in one company. Early-
stage preference was measured by the percentage of early stage investments a VC firm made (as a proportion of all investments). High-tech preference
was measured by the percentage of high-tech investments a VC firm made (as a proportion of all investments). VC control rights was measured by the
percentage of trade sale exits as a proportion of total number of successful exits. VC failure tolerance is the average number of years a VC firm stayed
with ventures that eventually failed. Venture hotbeds is a dummy variable that took the value of 1 if the VC firm was based in California or New York
State, and 0 otherwise. Internet bubble is a dummy variable that took the value of 1 if the VC firm was established during the internet bubble period
(1999–2000), and 0 otherwise. Marginal effects instead of coefficients are reported. ***, **, and * indicate statistical significance at the 1%, 5%, and
10% levels, respectively.
Model 1 Model 2 Model 3 Model 4 Model 5
VC activities–related factors
VC fundraising ability - - -0.410*** (0.000) - - - - -0.399* (0.065)
Use of staged financing - - - - -1.553*** (0.000) - - -0.578 (0.136)
Early-stage preference - - - - 3.335*** (0.001) - - 8.113*** (0.001)
High-tech preference - - - - 1.755*** (0.000) - - -1.330 (0.148)
VC control rights - - - - - - -0.487 (0.275) -1.451** (0.027)
VC failure tolerance - - - - - - 0.116* (0.074) 0.181** (0.032)
Other characteristics
Venture hotbeds -0.225* (0.062) -0.143 (0.606) -0.343** (0.016) -0.387** (0.017) -0.613 (0.138)
Internet bubble 0.119 (0.604) -0.550 (0.142) -0.147 (0.434) 0.205 (0.433) -0.211 (0.661)
Year fixed effect Present Present Present Present Present
No. of observations 1,507 1,018 1,505 733 575
Log-likelihood -657.55 -303.13 -560.92 -297.30 -123.06
Pseudo R2 0.002 0.054 0.144 0.013 0.208
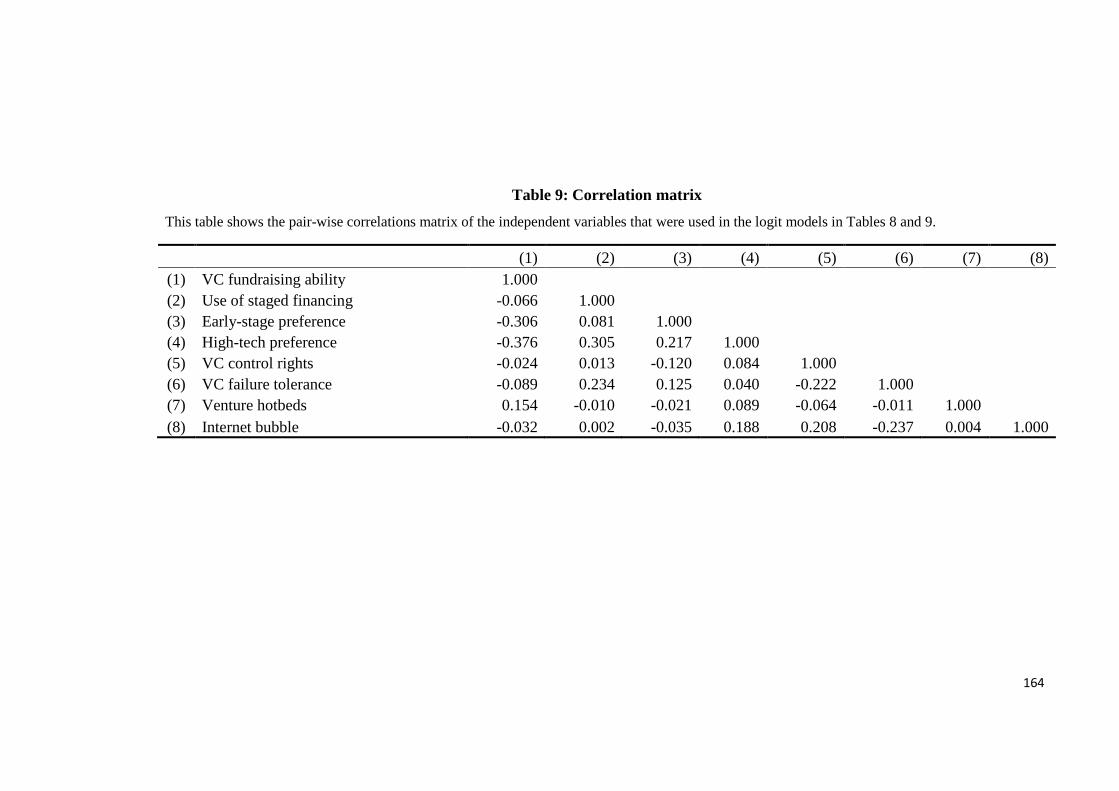
164
Table 9: Correlation matrix
This table shows the pair-wise correlations matrix of the independent variables that were used in the logit models in Tables 8 and 9.
(1) (2) (3) (4) (5) (6) (7) (8)
(1) VC fundraising ability 1.000
(2) Use of staged financing -0.066 1.000
(3) Early-stage preference -0.306 0.081 1.000
(4) High-tech preference -0.376 0.305 0.217 1.000
(5) VC control rights -0.024 0.013 -0.120 0.084 1.000
(6) VC failure tolerance -0.089 0.234 0.125 0.040 -0.222 1.000
(7) Venture hotbeds 0.154 -0.010 -0.021 0.089 -0.064 -0.011 1.000
(8) Internet bubble -0.032 0.002 -0.035 0.188 0.208 -0.237 0.004 1.000
165
Chapter 5
Conclusion
5.1 Summary and suggestions for future research
This thesis examines three newly emerged issues related to VC investment. The global
VC market has experienced rapid growth during the past three decades. As the market
grows, a number of new trends have emerged, including the globalisation of VC
investments and the changing role of VC investors. A number of recent studies have
examined these issues, but have primarily focussed on VC-backed companies (e.g., Dai
et al., 2012; Celikyurt et al., 2012; Tian and Wang, 2014). This thesis complements
previous studies by providing empirical evidence on three contemporary issues from the
perspective of VC firms in Chapters 2, 3, and 4.
In the first essay, I examined the issue of cross-border VC syndication. Specifically, we
investigated whether local VC firms benefit from their syndication experience with
foreign VC investors. This study extends beyond previous studies (e.g., Dai et al., 2012;
Wang and Wang, 2012; Humphery-Jenner and Suchard, 2013) by examining the value of
cross-border syndication from the perspective of local VC firms. Using a sample of 3,309
investments from 1996 to 2009 in Asia, I examined benefits to local VC firms from two
aspects: changes in local VC firms’ investment behaviours, and successful exits from
166
portfolio companies. First, my results show that there is a significant difference between
local VC firms with foreign syndication experience and those without any foreign
exposure. In order to address concerns of the selection effect, I compared local VC firms’
investment preferences during the pre- and post-syndication periods, and found consistent
results. These results suggest that local VC firms increase their exposure to high-tech and
early-stage ventures during the post-syndication period. A switch from traditional
industries to high-tech ventures suggests the maturity of local VC firms: they have
acquired knowledge and expertise of assessing and nurturing high-tech companies during
their collaborations with foreign VC firms. Second, in terms of investment performance,
I found that local VC firms with foreign syndication experience perform better than those
without foreign syndication experience, as measured by the likelihood of successful exits.
Overall, my results suggest that syndication with foreign VC firms is beneficial to local
VC firms. Engaging in partnerships with foreign VC firms not only changes local VC
firms’ investment preferences, but also enhances their ability to take portfolio companies
to successful exits. More broadly, cross-border syndication between local and foreign VC
firms is mutually beneficial. Foreign VC firms achieve a lower level of information
asymmetry, while local VC firms acquire knowledge and expertise from their foreign
partners.
This essay also brings up several interesting questions for future research. For instance,
do local VC firms tend to syndicate with the same foreign investors? Or do they tend to
form partnerships with a variety of different VC firms in order to gain diversified
167
knowledge and expertise? Which group performs better? Do local VCs terminate their
partnerships with foreign VCs once they mature? Is there an optimal level of exposure to
foreign investors? In addition, if forming partnerships with foreign VC firms is indeed
beneficial, why do some local VCs choose not to engage in such partnerships—is it due
to cultural disparity? Or did they have some unpleasant experience with foreign investors?
Future research that examines these questions could shed more light on the issue of cross-
border VC syndication.
In the second essay, I examined whether being on the boards of mature public companies
benefits VC firms. Following Celikyurt et al. (2012), I hand-collected data on VC
directors; this data consists of 1,359 unique directors working in 700 VC firms. I
investigated potential benefits from two aspects: fundraising and investment performance.
First, my results show that VC firms with directorships on average raise significantly
more funds than VC firms without directorships. To address concerns of the selection
effect, I compared the fundraising performance of VC firms with directorships during the
pre- and post-appointment periods, and found consistent results. I also used the
difference-in-difference method to address concerns of the industry effect, and yet the
results remained quantitatively the same. I followed Gompers and Lerner (1998) to
examine VC firm fundraising by using the Heckman two-stage model. I found that being
on the boards of mature public companies is positively related to the size of funds raised.
These results suggest that having directorships in large public companies brings
credibility, visibility, and enhanced networks to VC firms, which in turn facilitates their
168
fund-raising abilities. Second, in terms of investment performance, I found that being on
such boards increases the likelihood of successful exits of VC firms’ other portfolio
companies. I used the same method to address concerns of the selection effect, and found
consistent results. In the regression analysis, I used the logistic model and the Cox hazard
model to examine both the likelihood of successful exits and the times to exit. My results
show that directorship status is associated with a higher likelihood of successful exits and
shorter times to exit. These results suggest that VC firms gain better knowledge and
experience of products, markets, and the industry during their directorship appointment
in mature public companies; these advantages are then transferred to other portfolio
companies and thus improve investment performance. Overall, my results suggest that
being on the boards of mature public companies is beneficial to VC firms. They achieve
credibility, visibility, and enhanced networks, which then facilitates their future fund-
raising abilities. They also gain access to better knowledge and experience, which then
can be transferred to other portfolio companies and improve performance.
This study also raises a few interesting questions for future research. For instance, how
are these VC directors selected? Are they invited, or are they sent by VC firms?24 Do
these VC directors gain personal benefits, such as compensation or other non-cash
rewards? Could sitting on the board be detrimental to VC firms if they have too many
directors in large public companies, and thus are distracted from their primary
24 Although we have provided some evidence at the VC firm level in Chapter 3, we have not examined the
characteristics of VC directors, such as their work experience, education, or networks.
169
responsibilities? How do they balance their roles in large public companies and in small
private companies? Future studies that examine these questions would improve our
understanding of VC firms’ roles in mature companies.
In the third essay, I examined the failure of VC firms. I hand-collected data from the office
of the U.S. Secretary of State on VC firms’ status. My final sample consists of 2,752 VC
firms in the United States incorporated between 1980 and 2004. I found that almost one-
third of VC firms in the sample had gone out of business by the end of 2014, which is a
fairly large proportion. These results indicate that high failure rates not only apply to VC-
backed companies, but also to the capital providers, i.e. the VC firms themselves. I then
compared failed and living VC firms in terms of their characteristics and activities
(fundraising, investments, and exits). I found that failed VC firms on average raise a
smaller number of funds from limited partners (LPs) than living VC firms do. They invest
heavily in riskier ventures such as early-stage and high-tech companies. In addition, they
tend to use fewer rounds of investments, and exit through IPOs more frequently than
living VC firms do. In the regression analysis, I used the logistic model to examine the
failure of VC firms. My results suggest that VC firms with a higher level of failure
tolerance and risk appetite are more likely to fail, while VC firms with better fundraising
abilities and stronger control rights are less likely to fail. I also examined the inactivity of
VC firms, or the ‘walking dead’ phenomenon. My results show that inactivity is caused
by some of the same factors that cause VC firm failure.

170
To the best of my knowledge, this is the first study to examine the failure of VC firms. It
opens up some interesting areas for future research. Although our study provides some
casual factors for the ‘walking dead’ phenomenon, a number of questions still remain
unexplored. For instance: why can’t these VC firms raise new funds? What are their
operational activities if they are not making any new investments? Do these ‘walking
dead’ VC firms eventually fail? If they do survive, what strategies did they use to turn the
firm around? Future research that explores these questions could shed new light on the
survival of VC firms, and would provide a more complete picture of the life cycle of VC
firms.
5.2. Implications for market practitioners and policy makers
This thesis’s three essays offer several implications for market practitioners and policy
makers. In the first essay, I showed that collaboration with foreign VC investors is
beneficial to local VC firms in terms of investment behaviours and performance. In other
words, the entrance of foreign VCs is beneficial to the development of local VC markets.
Policy makers should realise the importance of foreign VC investors and should continue
to make efforts to remove obstacles for foreign investors to conduct business; they should
encourage such collaboration, especially within those countries where the VC market is
less developed. Local VC firms—especially those that have no foreign exposure—should
be more open culturally, and should consider partnership with foreign VCs as a platform
for organisational learning, where they could acquire better knowledge, expertise, and
171
experience from their foreign partners.
In the second essay, I showed that having directorships in mature public companies is
beneficial to VC firms in terms of fundraising and investment performance. VC firms
should view this (in addition to ‘grandstanding’) as a way of building reputation, and an
opportunity to gain access to better knowledge and expertise. By sending partners to large
public companies (or hiring partners with board seats), VC firms could gain credibility
and enhanced networks, as well as better knowledge and expertise, all of which then could
improve VC firms’ fundraising and investment performance.
In the third paper, I identified a set of causal factors of VC firm failure. This provides
institutional investors (from whom VC firms raise capital, or LPs) brief assessment
criteria, which could assist their decision-making. For instance, more risk-averse
institutional investors may prefer to invest in VC firms with a lower level of failure
tolerance and risk appetite, both of which decrease the likelihood of failure. On the other
hand, VC firms could adjust their operational activities accordingly to increase their
likelihood of survival. For instance, inexperienced VC firms should be less failure-
tolerant when dealing with underperforming ventures, and should terminate such
investments in a timely manner. In addition, this study is the first to examine the failure
of VC firms, and therefore brings the issue of VC firm survival to the attention of policy
makers. More favourable polices should be created to support young and small VC firms,
which is crucial to entrepreneurship and economic development.
172
References
Celikyurt, U., Sevilir, M., and Shivdasani, A. 2014. Venture capitalists on boards of
mature public firms. Review of Financial Studies 27, 56-101.
Dai, N., Jo, H., and Kassicieh, S. 2012. Cross-border VC investments in Asia: Selection
and exit performance. Journal of Business Venturing 27, 666-684.
Gompers, P., Lerner, J., Blair M., and Hellmann, T. 1998. What drives venture capital
fundraising? Brookings Paper on Economic Activity. Microeconomics, 149-204.
Humphery-Jenner, M., and Suchard, J. A. 2013. Foreign VCs and venture success:
Evidence from China. Journal of Corporate Finance 21, 16-35.
Tian, X., and Wang, T. 2014. Tolerance for failure and corporate innovation. Review of
Financial Studies 27, 211-255.
Wang, L., and Wang, S., 2012. Cross-border venture capital performance: Evidence
from China. Pan-Basin Finance Journal 19, 71-79.