three-dimensional structure of diferric bovine lactoferrin at 2.8 Å resolution
TRANSCRIPT
J. Mol. Biol. (1997) 274, 222±236
Three-dimensional Structure of Diferric BovineLactoferrin at 2.8 AÊ Resolution
Stanley A. Moore, Bryan F. Anderson, Colin R. Groom, M. Haridasand Edward N. Baker*
Department of BiochemistryMassey University, PalmerstonNorth, New Zealand
Present addresses: C. R. Groom,Research, Sandwich, Kent CT13 9NSchool of Biosciences, Mahatma GaGandhinagar 686008, India.
Abbreviations used: bLf, bovine lhuman lactoferrin; STf, rabbit serumstructurally conserved region; OTf,NAG, N-acetylglucosamine; MAN,
0022±2836/97/470222±15 $25.00/0/mb9
The three-dimensional structure of diferric bovine lactoferrin (bLf) hasbeen determined by X-ray crystallography in order to investigate the fac-tors that in¯uence iron binding and release by transferrins. The structurewas solved by molecular replacement, using the coordinates of diferrichuman lactoferrin (hLf) as a search model, and was re®ned with data to2.8 AÊ resolution by simulated annealing (X-PLOR) and restrained leastsquares (TNT). The ®nal model comprises 5310 protein atoms (residues 5to 689), 124 carbohydrate atoms (from ten monosaccharide units, in threeglycan chains), 2 Fe3�, 2 CO3
2ÿ and 50 water molecules. This model givesan R-factor of 0.232 for 21440 re¯ections in the resolution range 30.0 to2.8 AÊ . The folding of the bLf molecule is essentially the same as that ofhLf, but bLf differs in the extent of closure of the two domains of eachlobe, and in the relative orientations of the two lobes. Differences indomain closure are attributed to amino acid changes in the interface, anddifferences in lobe orientations to slightly altered packing of two hydro-phobic patches between the lobes. Changed interdomain interactions mayexplain the lesser iron af®nity of bLf, compared with hLf, and two lysineresidues behind the N-lobe iron site of bLf offer new insights into the``dilysine trigger'' mechanism proposed for iron release by transferrins.The bLf structure is also notable for several well-de®ned oligosaccharideunits which demonstrate the structural factors that stabilise carbohydratestructure. One glycan chain, attached to Asn545, appears to contribute tointerdomain interactions and may modulate iron release from the C-lobe.
# 1997 Academic Press Limited
Keywords: crystal structure; lactoferrin; iron binding; carbohydratestructure*Corresponding author
Introduction
Proteins of the transferrin family ful®l a key rolein controlling the levels of free iron in the body¯uids of animals. The two principle members ofthis family, serum transferrin and lactoferrin,together with ovotransferrin (a differently-glycosy-lated form of avian serum transferrins, found inegg white), have highly conserved structural andfunctional properties (Baker, 1994; Brock, 1985;
P®zer CentralJ, UK; M. Haridas,ndhi University,
actoferrin; hLf,transferrin; SCR,
hen ovotransferrin;b-1,4-mannose.
71386
Harris & Aisen, 1989). These proteins are all mono-meric glycoproteins of 78,000 Da, with the abilityto bind two Fe3� ions, together with two CO3
2ÿ
ions; the synergistic relationship between metal ionand anion binding is a unique feature of transferrinchemistry. Binding is, however, reversible, and thecombination of high af®nity (K � 1020) with mech-anisms for iron release is of fundamental import-ance for transferrin function.
Three-dimensional structures for human lactofer-rin (Anderson et al., 1987, 1989), rabbit serumtransferrin (Bailey et al., 1988) and chicken andduck ovotransferrins (Kurokawa et al., 1995; Rawaset al., 1996), show that the three proteins shareessentially the same folding, and highly similariron-binding sites, consistent with their extensiveamino acid sequence similarity of 55 to 65% iden-tity (Baker, 1994). In each case the polypeptidechain is folded into two homologous lobes (its N-
# 1997 Academic Press Limited
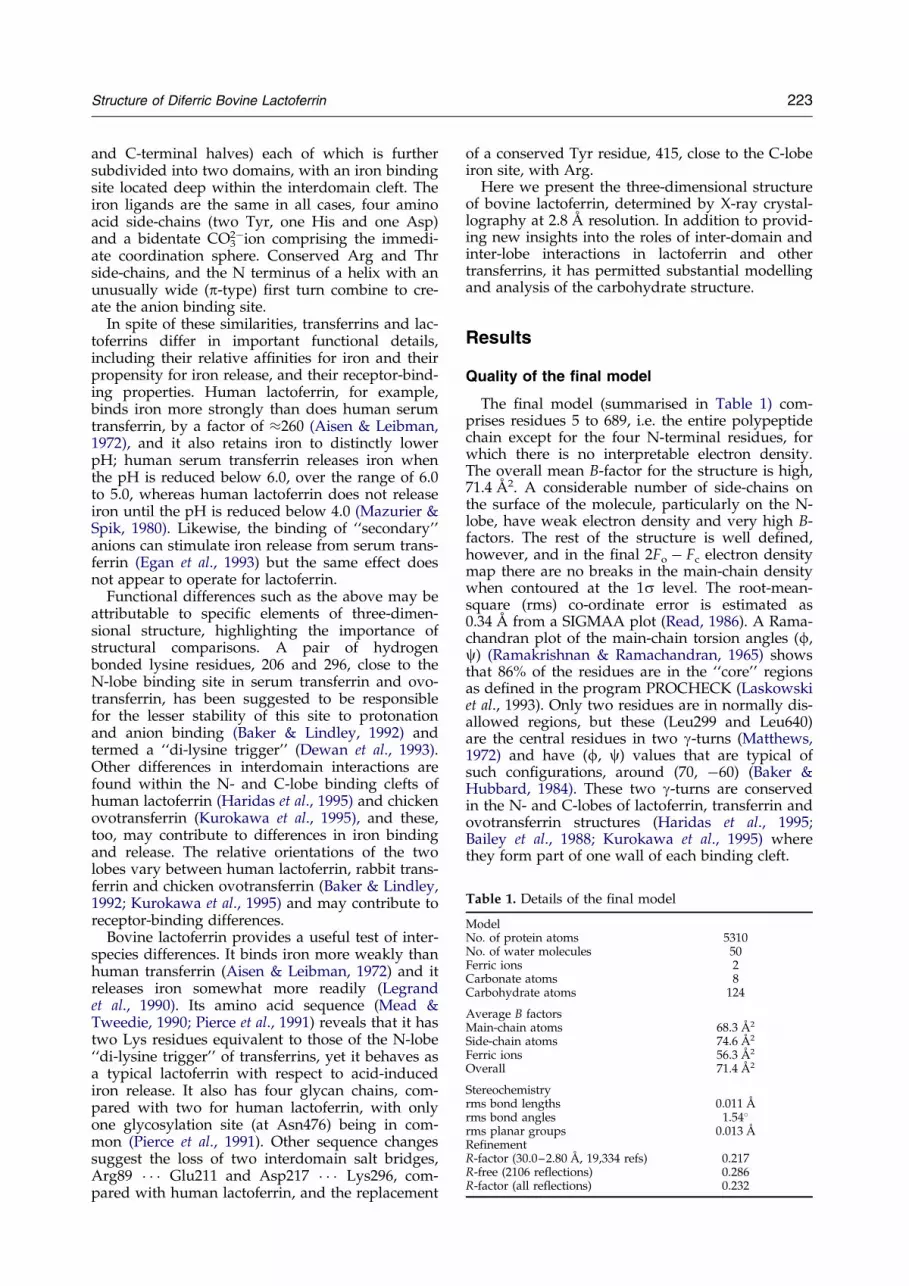
Table 1. Details of the ®nal model
ModelNo. of protein atoms 5310No. of water molecules 50Ferric ions 2Carbonate atoms 8Carbohydrate atoms 124
Average B factorsMain-chain atoms 68.3 AÊ 2
Side-chain atoms 74.6 AÊ 2
Ferric ions 56.3 AÊ 2
Overall 71.4 AÊ 2
Stereochemistryrms bond lengths 0.011 AÊ
rms bond angles 1.54�rms planar groups 0.013 AÊ
RefinementR-factor (30.0±2.80 AÊ , 19,334 refs) 0.217R-free (2106 reflections) 0.286R-factor (all reflections) 0.232
Structure of Diferric Bovine Lactoferrin 223
and C-terminal halves) each of which is furthersubdivided into two domains, with an iron bindingsite located deep within the interdomain cleft. Theiron ligands are the same in all cases, four aminoacid side-chains (two Tyr, one His and one Asp)and a bidentate CO3
2ÿion comprising the immedi-ate coordination sphere. Conserved Arg and Thrside-chains, and the N terminus of a helix with anunusually wide (p-type) ®rst turn combine to cre-ate the anion binding site.
In spite of these similarities, transferrins and lac-toferrins differ in important functional details,including their relative af®nities for iron and theirpropensity for iron release, and their receptor-bind-ing properties. Human lactoferrin, for example,binds iron more strongly than does human serumtransferrin, by a factor of �260 (Aisen & Leibman,1972), and it also retains iron to distinctly lowerpH; human serum transferrin releases iron whenthe pH is reduced below 6.0, over the range of 6.0to 5.0, whereas human lactoferrin does not releaseiron until the pH is reduced below 4.0 (Mazurier &Spik, 1980). Likewise, the binding of ``secondary''anions can stimulate iron release from serum trans-ferrin (Egan et al., 1993) but the same effect doesnot appear to operate for lactoferrin.
Functional differences such as the above may beattributable to speci®c elements of three-dimen-sional structure, highlighting the importance ofstructural comparisons. A pair of hydrogenbonded lysine residues, 206 and 296, close to theN-lobe binding site in serum transferrin and ovo-transferrin, has been suggested to be responsiblefor the lesser stability of this site to protonationand anion binding (Baker & Lindley, 1992) andtermed a ``di-lysine trigger'' (Dewan et al., 1993).Other differences in interdomain interactions arefound within the N- and C-lobe binding clefts ofhuman lactoferrin (Haridas et al., 1995) and chickenovotransferrin (Kurokawa et al., 1995), and these,too, may contribute to differences in iron bindingand release. The relative orientations of the twolobes vary between human lactoferrin, rabbit trans-ferrin and chicken ovotransferrin (Baker & Lindley,1992; Kurokawa et al., 1995) and may contribute toreceptor-binding differences.
Bovine lactoferrin provides a useful test of inter-species differences. It binds iron more weakly thanhuman transferrin (Aisen & Leibman, 1972) and itreleases iron somewhat more readily (Legrandet al., 1990). Its amino acid sequence (Mead &Tweedie, 1990; Pierce et al., 1991) reveals that it hastwo Lys residues equivalent to those of the N-lobe``di-lysine trigger'' of transferrins, yet it behaves asa typical lactoferrin with respect to acid-inducediron release. It also has four glycan chains, com-pared with two for human lactoferrin, with onlyone glycosylation site (at Asn476) being in com-mon (Pierce et al., 1991). Other sequence changessuggest the loss of two interdomain salt bridges,Arg89 � � � Glu211 and Asp217 � � � Lys296, com-pared with human lactoferrin, and the replacement
of a conserved Tyr residue, 415, close to the C-lobeiron site, with Arg.
Here we present the three-dimensional structureof bovine lactoferrin, determined by X-ray crystal-lography at 2.8 AÊ resolution. In addition to provid-ing new insights into the roles of inter-domain andinter-lobe interactions in lactoferrin and othertransferrins, it has permitted substantial modellingand analysis of the carbohydrate structure.
Results
Quality of the final model
The ®nal model (summarised in Table 1) com-prises residues 5 to 689, i.e. the entire polypeptidechain except for the four N-terminal residues, forwhich there is no interpretable electron density.The overall mean B-factor for the structure is high,71.4 AÊ 2. A considerable number of side-chains onthe surface of the molecule, particularly on the N-lobe, have weak electron density and very high B-factors. The rest of the structure is well de®ned,however, and in the ®nal 2Fo ÿ Fc electron densitymap there are no breaks in the main-chain densitywhen contoured at the 1s level. The root-mean-square (rms) co-ordinate error is estimated as0.34 AÊ from a SIGMAA plot (Read, 1986). A Rama-chandran plot of the main-chain torsion angles (f,c) (Ramakrishnan & Ramachandran, 1965) showsthat 86% of the residues are in the ``core'' regionsas de®ned in the program PROCHECK (Laskowskiet al., 1993). Only two residues are in normally dis-allowed regions, but these (Leu299 and Leu640)are the central residues in two g-turns (Matthews,1972) and have (f, c) values that are typical ofsuch con®gurations, around (70, ÿ60) (Baker &Hubbard, 1984). These two g-turns are conservedin the N- and C-lobes of lactoferrin, transferrin andovotransferrin structures (Haridas et al., 1995;Bailey et al., 1988; Kurokawa et al., 1995) wherethey form part of one wall of each binding cleft.
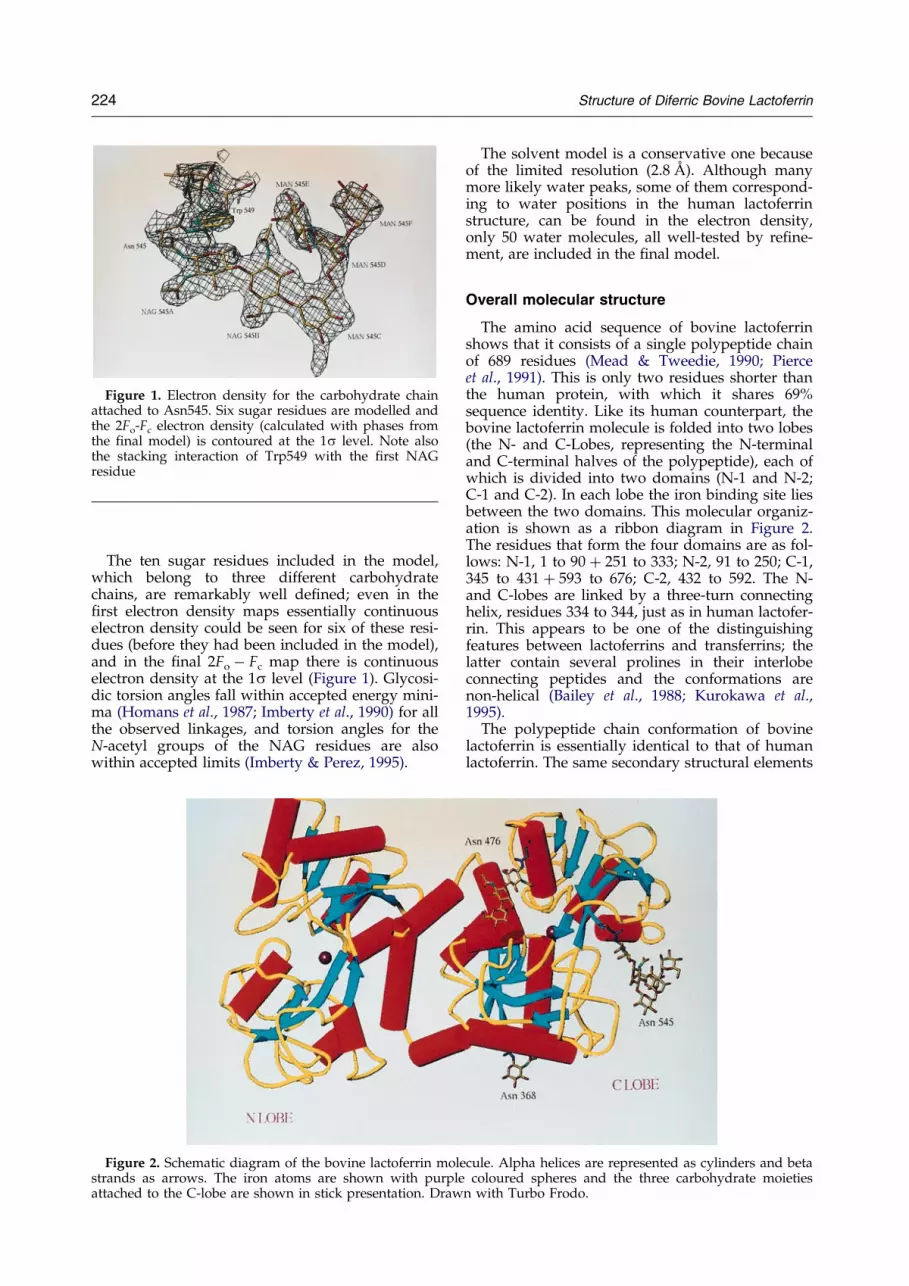
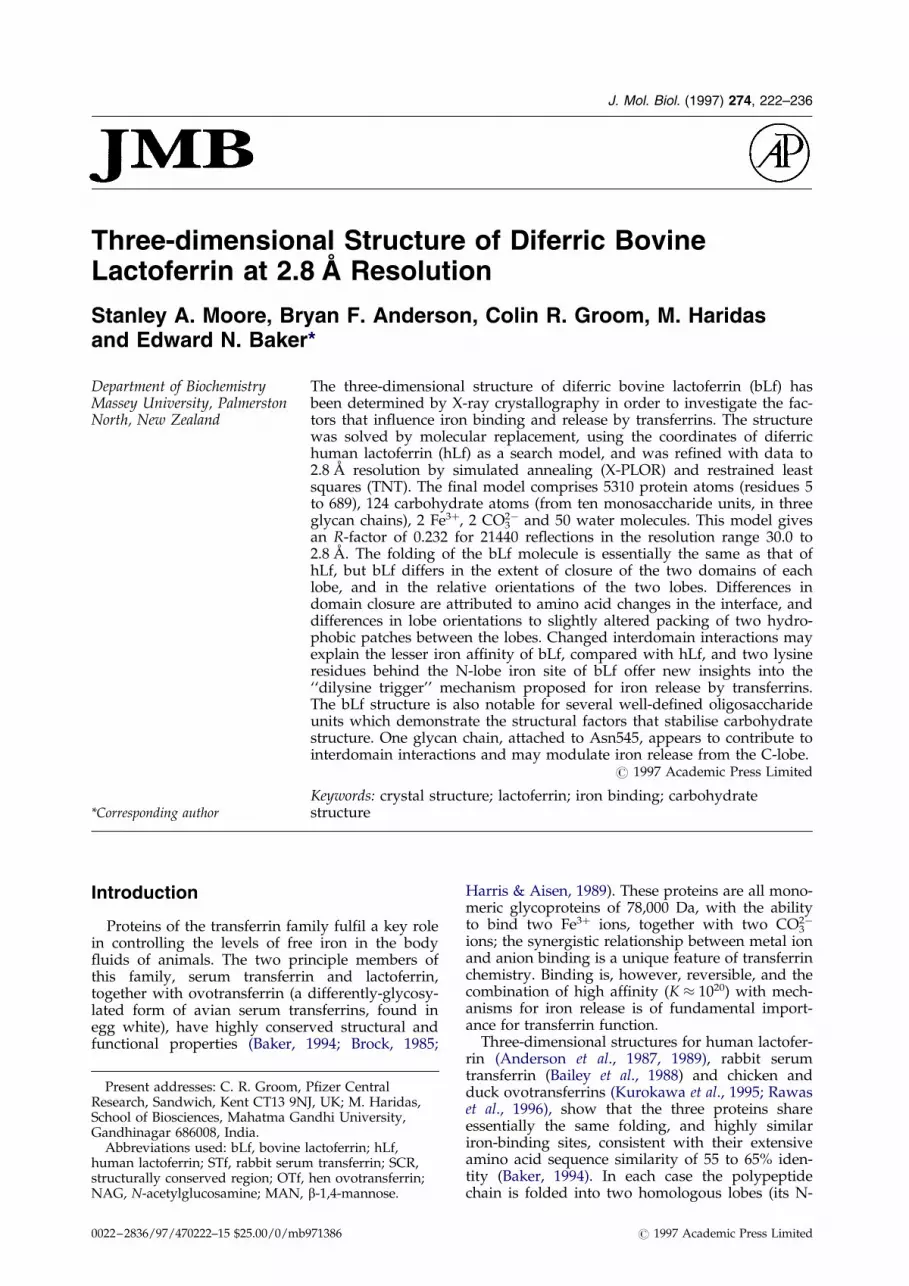
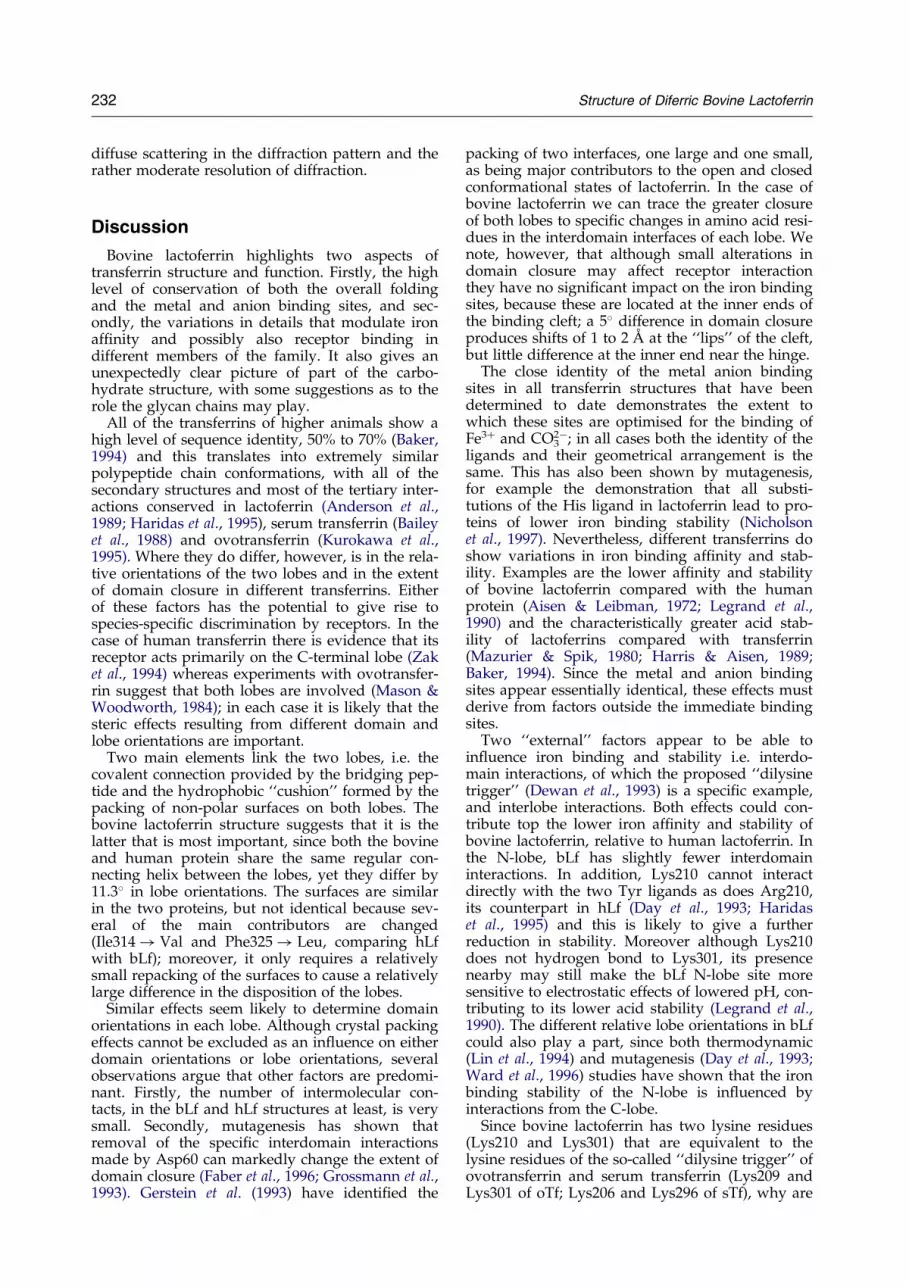
Figure 1. Electron density for the carbohydrate chainattached to Asn545. Six sugar residues are modelled andthe 2Fo-Fc electron density (calculated with phases fromthe ®nal model) is contoured at the 1s level. Note alsothe stacking interaction of Trp549 with the ®rst NAGresidue
224 Structure of Diferric Bovine Lactoferrin
The ten sugar residues included in the model,which belong to three different carbohydratechains, are remarkably well de®ned; even in the®rst electron density maps essentially continuouselectron density could be seen for six of these resi-dues (before they had been included in the model),and in the ®nal 2Fo ÿ Fc map there is continuouselectron density at the 1s level (Figure 1). Glycosi-dic torsion angles fall within accepted energy mini-ma (Homans et al., 1987; Imberty et al., 1990) for allthe observed linkages, and torsion angles for theN-acetyl groups of the NAG residues are alsowithin accepted limits (Imberty & Perez, 1995).
Figure 2. Schematic diagram of the bovine lactoferrin molestrands as arrows. The iron atoms are shown with purpleattached to the C-lobe are shown in stick presentation. Draw
The solvent model is a conservative one becauseof the limited resolution (2.8 AÊ ). Although manymore likely water peaks, some of them correspond-ing to water positions in the human lactoferrinstructure, can be found in the electron density,only 50 water molecules, all well-tested by re®ne-ment, are included in the ®nal model.
Overall molecular structure
The amino acid sequence of bovine lactoferrinshows that it consists of a single polypeptide chainof 689 residues (Mead & Tweedie, 1990; Pierceet al., 1991). This is only two residues shorter thanthe human protein, with which it shares 69%sequence identity. Like its human counterpart, thebovine lactoferrin molecule is folded into two lobes(the N- and C-Lobes, representing the N-terminaland C-terminal halves of the polypeptide), each ofwhich is divided into two domains (N-1 and N-2;C-1 and C-2). In each lobe the iron binding site liesbetween the two domains. This molecular organiz-ation is shown as a ribbon diagram in Figure 2.The residues that form the four domains are as fol-lows: N-1, 1 to 90 � 251 to 333; N-2, 91 to 250; C-1,345 to 431 � 593 to 676; C-2, 432 to 592. The N-and C-lobes are linked by a three-turn connectinghelix, residues 334 to 344, just as in human lactofer-rin. This appears to be one of the distinguishingfeatures between lactoferrins and transferrins; thelatter contain several prolines in their interlobeconnecting peptides and the conformations arenon-helical (Bailey et al., 1988; Kurokawa et al.,1995).
The polypeptide chain conformation of bovinelactoferrin is essentially identical to that of humanlactoferrin. The same secondary structural elements
cule. Alpha helices are represented as cylinders and betacoloured spheres and the three carbohydrate moieties
n with Turbo Frodo.

Table 2. Secondary structures
Helix N-lobe C-lobe b-Strand N-lobe C-lobe
a1 12±29 351±365 ba 5±10 345±349a2 41±53 376±388 bb 33±39 368±374a3 60±68 395±407 bc 55±59 390±394a5 121±136 463±479 bd 75±82 408±414a6 144±153 482±486 be 90±100 433±441a6a 166±170 499±503 bf 112±116 454±458a7 190±203 524±537 bg 154±158 488±492a8 212±218 545±552 bh 206±211 539±545a8a 222±227 Ð bi 226±230 568±572a9 263±279 605±622 bj 247±257 589±599a10 315±321 656±661 bk 305±310 646±649a11 321±333 662±676a12 334±344 678±689
Helices and b-strands labelled as for human lactoferrin (Anderson et al., 1989).
Structure of Diferric Bovine Lactoferrin 225
exist (Table 2), allowing for the change in residuenumbering. The only insertion or deletion occursin a ¯exible, loosely structured external loop fol-lowing strand bd in the C-1 domain. In human lac-toferrin this loop, 417 to 427, is for the most partpoorly de®ned (Haridas et al., 1995); in bovine lac-toferrin it is two residues shorter and has a differ-ent conformation but this does not appear to haveany in¯uence on the rest of the structure. Bovinelactoferrin also has one extra disulphide bond com-pared with the human protein. This disulphide,160 to 183, corresponds to a disulphide that alsoappears in serum transferrin. Its impact on the lac-toferrin structure is minimal, however; in hLf resi-dues 160 and 183 have (f, c) angles (87, ÿ1) andÿ99, 46) and the Ca . . . Ca distance is 4.5 AÊ ,whereas in bLf the corresponding values are (104,ÿ8) and (ÿ96, 67) and a Ca . . . Ca distance of 4.8 AÊ .Thus the extra disulphide is accommodated withlittle disturbance of the polypeptide conformation.The change may affect interdomain interactions,and possibly domain closure, however, since inhLf the residue 183 is Phe and its side-chain pro-jects into the interdomain space (see below).
The main conformational difference betweenhuman and bovine lactoferrins concerns the rela-tive lobe and domain orientations. In order toquantify these differences, and extend the analysisto other transferrins for which high resolutionstructures are available, a set of structurally con-served regions (SCRs) was used to superimposethe molecules. The proteins compared, in additionto bLf, were human lactoferrin (Haridas et al.,1995), hen ovotransferrin (Kurokawa et al., 1995),rabbit transferrin N-lobe (Sarra et al., 1990) andhuman transferrin N-lobe (G. D. Brayer & R. T. A.MacGillivray, personal communication). Residueswere included in SCRs if the rms difference for allproteins was less than 3.0 AÊ , including the match-ing of the N-1 domain residues to C-1 and N-2domain to C-2. An additional criterion was thatresidues immediately before or after a homologoussegment should have similar (f, c) angles. Usingthese criteria the SCRs comprised (bLf numbering):N-1 domain residues 6 to 26, 34 to 68, 74 to 81, 252to 258, 264 to 279, 286 to 289, 297 to 309, 315 to
331; N-2 domain residues 93 to 100, 105 to 132, 153to 161, 169 to 172, 189 to 200, 205 to 217, 224 to251: C-1 domain residues 345 to 365, 369 to 403,407 to 414, 594 to 600, 604 to 619, 629 to 632, 638 to650, 656 to 672; C-2 domain residues 434 to 441,447 to 474, 487 to 495, 501 to 504, 523 to 534, 539 to551, 556 to 593.
When bLf and hLf are compared, the individualdomains of the two proteins superimpose well,with rms differences for main chain atoms (N, Ca,C, O) of 0.47 AÊ (N-1), 0.44 AÊ (N-2), 0.42 AÊ (C-1),and 0.43 AÊ (C-2). The lobes as a whole superim-pose less well, i.e. N-lobe 0.77 AÊ and C-lobe 0.64 AÊ .This is because there are differences in the extentof domain closure for each lobe, i.e. when one pairof domains is superimposed (e.g. the N-1 domains)the other pair (N-2) do not match and anadditional rotation is required to bring them intocorrespondence. By this analysis, the N-lobe of bLfis 5.3� more closed than that of hLf, and the C-lobeof bLf is 3.7� more closed than that of hLf.
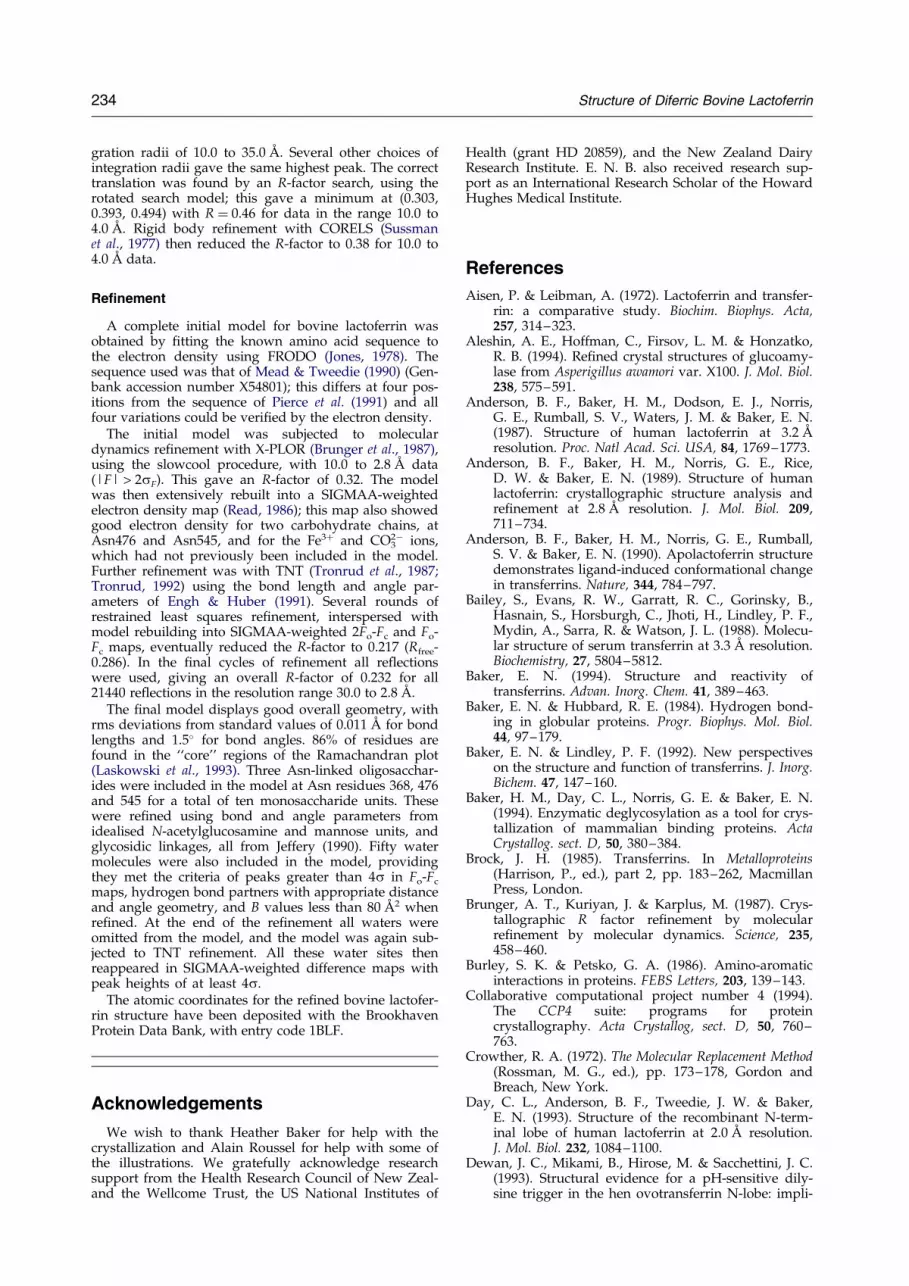
When this analysis is extended to other proteins,i.e. hen ovotransferrin and the N-lobe half-mol-ecules of rabbit transferrin and human transferrin,similar patterns emerge (see Table 3). Two generalconclusions should be highlighted. First, the degreeto which N-lobe and C-lobe domains match (N-1to C-1, N-2 to C-2) does not seem to vary with thedifferent proteins. Second, when the N-lobes aresuperimposed on the basis of their N-2 domainsonly (Figure 3) it is clear that the transferrin N-lobes are more closed than their lactoferrincounterparts. Relative to bovine lactoferrin, the N-lobe of rabbit transferrin is the most closed (5.3�),followed by human transferrin (5.0�). Both henovotransferrin and human lactoferrin N-lobes aremore open than bLf (1.8� and 5.3�, respectively).These differences do not correlate with iron af®nity(the transferrin N-lobe is more closed than that oflactoferrin, but binds iron less strongly). Rather,they re¯ect the sequence differences in the domaininterfaces and the resulting differences in packing.The C-lobe openings are more closely clustered.Relative to bLf the oTf C-lobe is 2.7� more closedand hLf 3.7� more open. On average the C-lobesare more closed than the N-lobes.
Table 3. Domain superpositions
Domain bLf N1 Domain bLf N2
hLf N1 0.47 hLf N2 0.44oTf N1 0.67 oTf N2 0.49rTf N1 0.70 rTf N2 0.69hTf N1 0.54 hTf N2 0.45bLf C1 1.09 bLf C2 0.61hLf C1 1.04 hLf C2 0.67oTf C1 1.00 oTf C2 0.72
bLf C1 bLf C2
hLf C1 0.42 hLf C2 0.43oTf C1 0.69 oTf C2 0.63
rms differences are in AÊ . Main chain atoms (N, Ca, C, O) of theSCR residues identi®ed in the text were used in the superposi-tions.
226 Structure of Diferric Bovine Lactoferrin
When the human and bovine lactoferrin mol-ecules as a whole are compared, the two lobes arefound to differ by 11.3� in their relative orien-tations (i.e. when the C-lobes are superimposed afurther rotation of 11.3� is required to superimposeN-lobes: see Figure 4). Similar structural variationsare found in all the transferrin structures deter-mined to date. The 11.3� difference in lobe orien-tations between bovine and human lactoferrinscompares with 12.5� between bLf and rabbit serumtransferrin (sTf), 15.7� between hLf and oTf and6.8� between sTf and oTf. Thus bovine lactoferrinmost closely resembles human lactoferrin but noneof the transferrins agree very closely.
Metal and anion binding sites
As in the other transferrin structures the twometal and anion-binding sites are extremely simi-
Figure 3. Different domain closure in transferrins. Ca ploferrin (yellow), human lactoferrin (green), human serum trrin (blue). For references, see text. The structures are superi
lar, to each other and to the corresponding sites inhuman lactoferrin. In the N-lobe the iron ligandsare Asp60, Tyr92, Tyr192, His253 and the bidentateCO3
2ÿ ion, and in the C-lobe Asp395, Tyr433,Tyr526, His595 and the CO3
2ÿ ion (Figure 5). Theiron-ligand bond lengths are all in the range 1.9 to2.1 AÊ . The carbonate ion occupies a positivelycharged pocket in the wall of domain 2 (N-2 or C-2), this pocket being formed by the N terminus ofhelix a5 and the side-chains of an arginine residue(Arg121 in the N-lobe, Arg463 in the C-lobe) and athreonine residue (Thr117 and Thr459). This resultsin a set of hydrogen bonds that satisfy the fullhydrogen bonding potential of the carbonate ion,and allow it to ®t perfectly between the iron atomand anion binding pocket. The metal-ligand bondsand the hydrogen bonds involving the anion arelisted in Table 4; none of them deviate signi®cantlyfrom those in human lactoferrin.
Outside the immediate binding site there areboth similarities and differences with other trans-ferrins. Two features are common to all the pro-teins. First, the non-coordinated carboxylateoxygen of the Asp ligand (60 or 395) is hydrogenbonded to both the peptide NH and the side-chainOH of Ser122 (Thr464 in the C-lobe). As notedbelow, these are key interdomain interactions. Sec-ondly, a water molecule is situated only �4.0 AÊ
from the iron atom, hydrogen bonded to the phe-nolate oxygen of the ``®rst'' Tyr ligand, Tyr92(433), as well as to 61 N (396 N), 122 OG (464OG1) and 251 O (593 O); this water molecule ispresent in all the structures determined to date.
Differences include the loss of a hydrogenbond that helps to restrain the anion-bindingArg121 in the N-lobe of human lactoferrin; inhLf Arg121 is hydrogen bonded to Ser191 OG,
t showing the superposition of the N-lobes of bovine lacto-ansferrin (red), rabbit serum (purple) and hen ovotransfer-mposed on the basis of the N-2 domains.
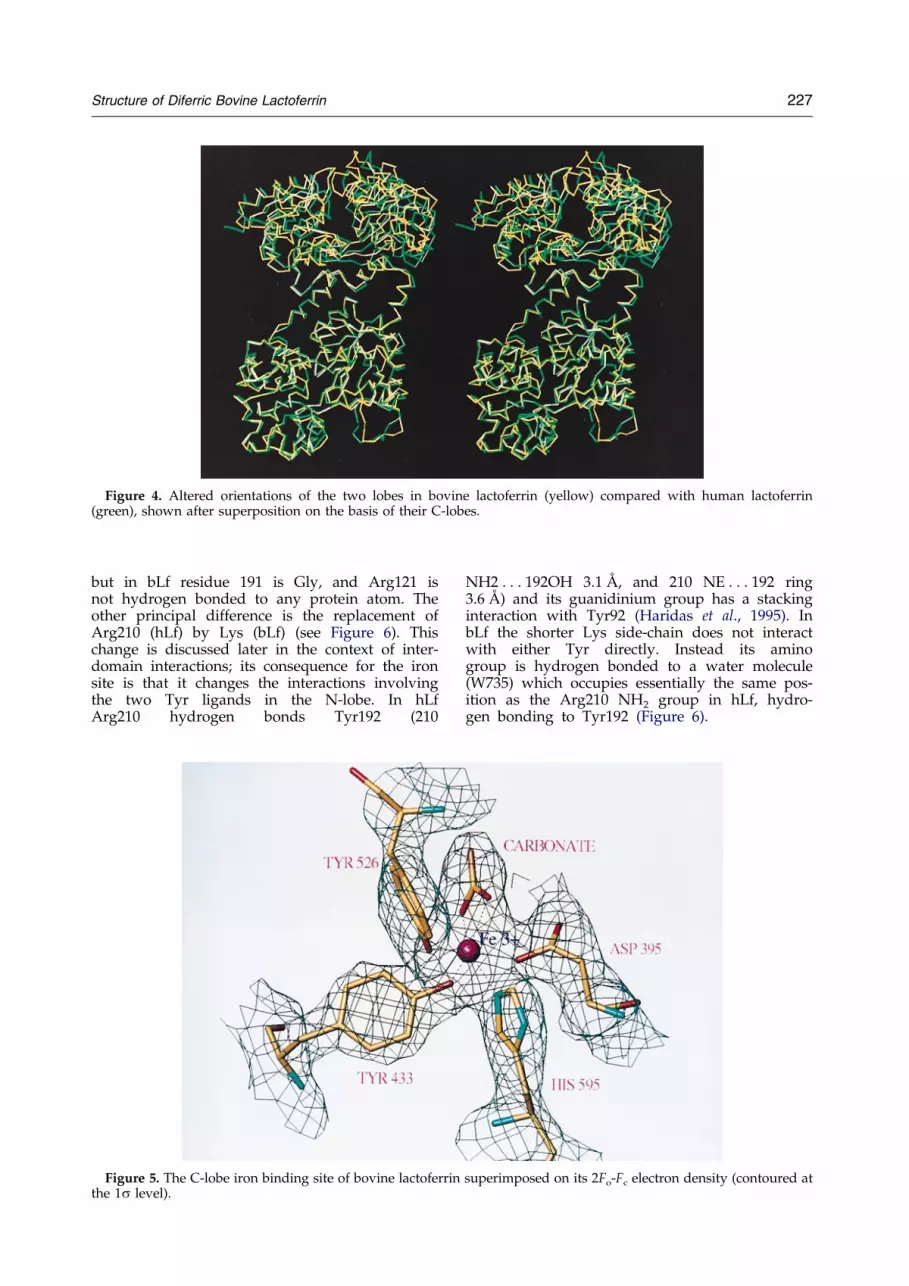
Figure 4. Altered orientations of the two lobes in bovine lactoferrin (yellow) compared with human lactoferrin(green), shown after superposition on the basis of their C-lobes.
Structure of Diferric Bovine Lactoferrin 227
but in bLf residue 191 is Gly, and Arg121 isnot hydrogen bonded to any protein atom. Theother principal difference is the replacement ofArg210 (hLf) by Lys (bLf) (see Figure 6). Thischange is discussed later in the context of inter-domain interactions; its consequence for the ironsite is that it changes the interactions involvingthe two Tyr ligands in the N-lobe. In hLfArg210 hydrogen bonds Tyr192 (210
Figure 5. The C-lobe iron binding site of bovine lactoferrithe 1s level).
NH2 . . . 192OH 3.1 AÊ , and 210 NE . . . 192 ring3.6 AÊ ) and its guanidinium group has a stackinginteraction with Tyr92 (Haridas et al., 1995). InbLf the shorter Lys side-chain does not interactwith either Tyr directly. Instead its aminogroup is hydrogen bonded to a water molecule(W735) which occupies essentially the same pos-ition as the Arg210 NH2 group in hLf, hydro-gen bonding to Tyr192 (Figure 6).
n superimposed on its 2Fo-Fc electron density (contoured at
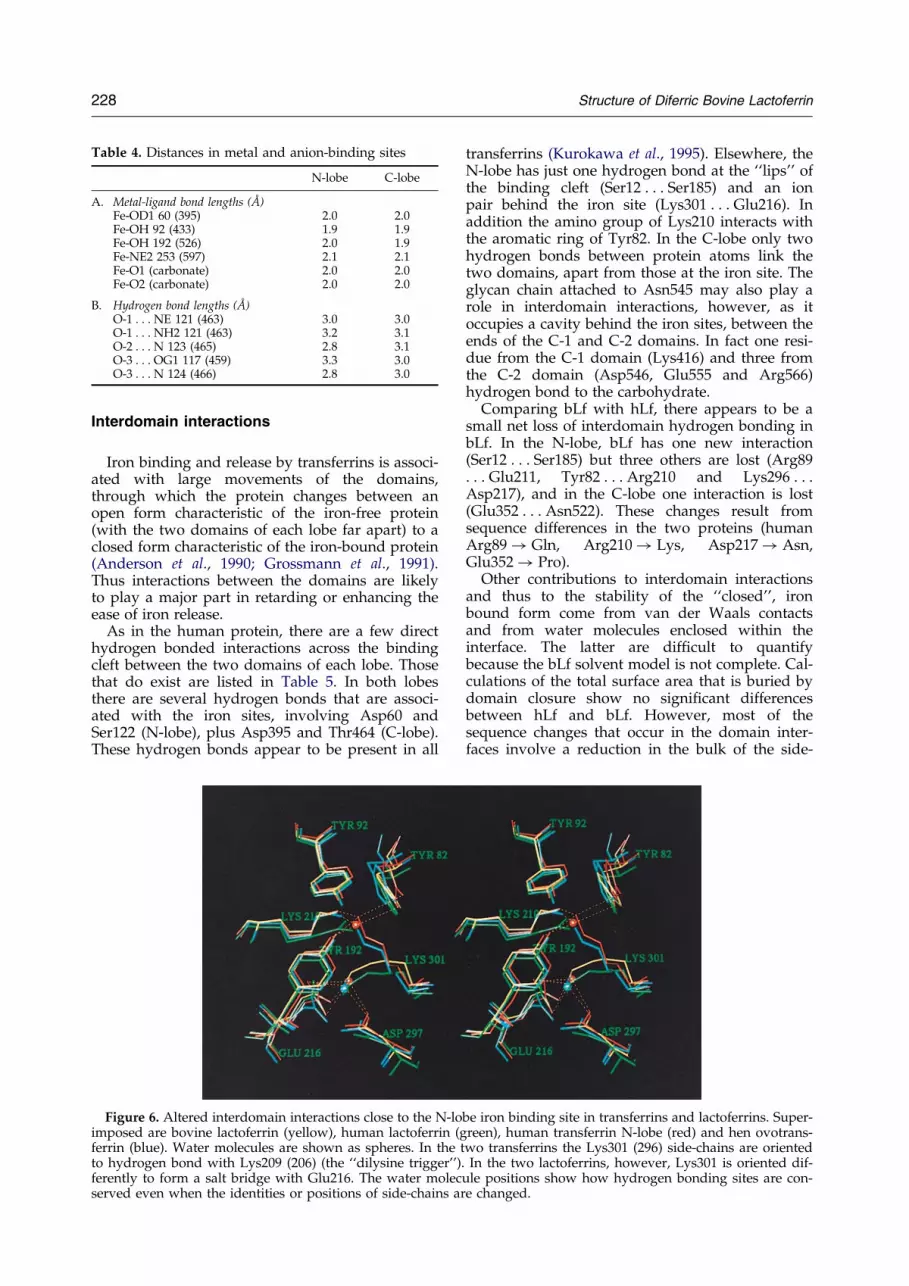
Table 4. Distances in metal and anion-binding sites
N-lobe C-lobe
A. Metal-ligand bond lengths (AÊ )Fe-OD1 60 (395) 2.0 2.0Fe-OH 92 (433) 1.9 1.9Fe-OH 192 (526) 2.0 1.9Fe-NE2 253 (597) 2.1 2.1Fe-O1 (carbonate) 2.0 2.0Fe-O2 (carbonate) 2.0 2.0
B. Hydrogen bond lengths (AÊ )O-1 . . . NE 121 (463) 3.0 3.0O-1 . . . NH2 121 (463) 3.2 3.1O-2 . . . N 123 (465) 2.8 3.1O-3 . . . OG1 117 (459) 3.3 3.0O-3 . . . N 124 (466) 2.8 3.0
228 Structure of Diferric Bovine Lactoferrin
Interdomain interactions
Iron binding and release by transferrins is associ-ated with large movements of the domains,through which the protein changes between anopen form characteristic of the iron-free protein(with the two domains of each lobe far apart) to aclosed form characteristic of the iron-bound protein(Anderson et al., 1990; Grossmann et al., 1991).Thus interactions between the domains are likelyto play a major part in retarding or enhancing theease of iron release.
As in the human protein, there are a few directhydrogen bonded interactions across the bindingcleft between the two domains of each lobe. Thosethat do exist are listed in Table 5. In both lobesthere are several hydrogen bonds that are associ-ated with the iron sites, involving Asp60 andSer122 (N-lobe), plus Asp395 and Thr464 (C-lobe).These hydrogen bonds appear to be present in all
Figure 6. Altered interdomain interactions close to the N-loimposed are bovine lactoferrin (yellow), human lactoferrin (ferrin (blue). Water molecules are shown as spheres. In theto hydrogen bond with Lys209 (206) (the ``dilysine trigger'')ferently to form a salt bridge with Glu216. The water molecserved even when the identities or positions of side-chains a
transferrins (Kurokawa et al., 1995). Elsewhere, theN-lobe has just one hydrogen bond at the ``lips'' ofthe binding cleft (Ser12 . . . Ser185) and an ionpair behind the iron site (Lys301 . . . Glu216). Inaddition the amino group of Lys210 interacts withthe aromatic ring of Tyr82. In the C-lobe only twohydrogen bonds between protein atoms link thetwo domains, apart from those at the iron site. Theglycan chain attached to Asn545 may also play arole in interdomain interactions, however, as itoccupies a cavity behind the iron sites, between theends of the C-1 and C-2 domains. In fact one resi-due from the C-1 domain (Lys416) and three fromthe C-2 domain (Asp546, Glu555 and Arg566)hydrogen bond to the carbohydrate.
Comparing bLf with hLf, there appears to be asmall net loss of interdomain hydrogen bonding inbLf. In the N-lobe, bLf has one new interaction(Ser12 . . . Ser185) but three others are lost (Arg89. . . Glu211, Tyr82 . . . Arg210 and Lys296 . . .Asp217), and in the C-lobe one interaction is lost(Glu352 . . . Asn522). These changes result fromsequence differences in the two proteins (humanArg89! Gln, Arg210! Lys, Asp217! Asn,Glu352! Pro).
Other contributions to interdomain interactionsand thus to the stability of the ``closed'', ironbound form come from van der Waals contactsand from water molecules enclosed within theinterface. The latter are dif®cult to quantifybecause the bLf solvent model is not complete. Cal-culations of the total surface area that is buried bydomain closure show no signi®cant differencesbetween hLf and bLf. However, most of thesequence changes that occur in the domain inter-faces involve a reduction in the bulk of the side-
be iron binding site in transferrins and lactoferrins. Super-green), human transferrin N-lobe (red) and hen ovotrans-two transferrins the Lys301 (296) side-chains are oriented. In the two lactoferrins, however, Lys301 is oriented dif-ule positions show how hydrogen bonding sites are con-re changed.
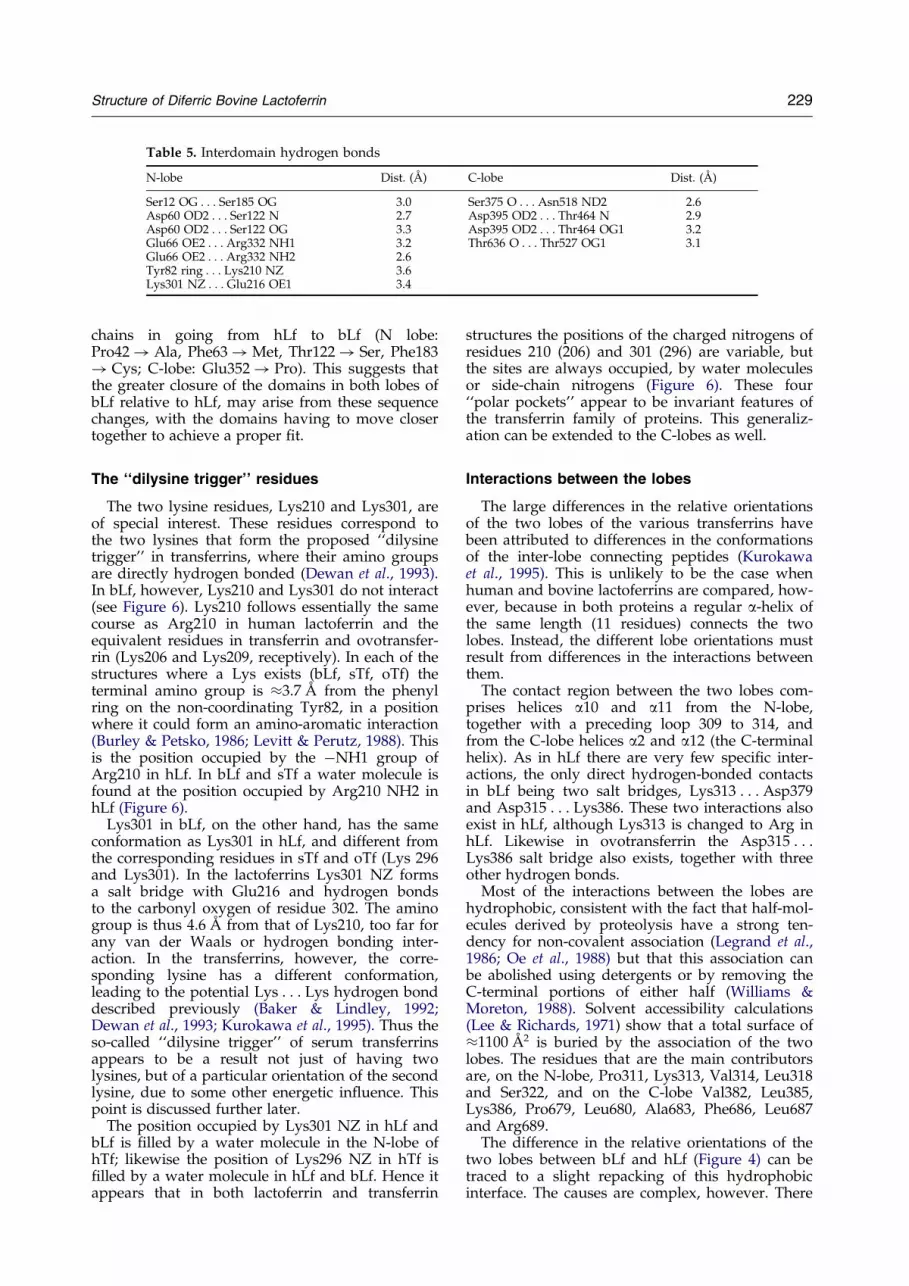
Table 5. Interdomain hydrogen bonds
N-lobe Dist. (AÊ ) C-lobe Dist. (AÊ )
Ser12 OG . . . Ser185 OG 3.0 Ser375 O . . . Asn518 ND2 2.6Asp60 OD2 . . . Ser122 N 2.7 Asp395 OD2 . . . Thr464 N 2.9Asp60 OD2 . . . Ser122 OG 3.3 Asp395 OD2 . . . Thr464 OG1 3.2Glu66 OE2 . . . Arg332 NH1 3.2 Thr636 O . . . Thr527 OG1 3.1Glu66 OE2 . . . Arg332 NH2 2.6Tyr82 ring . . . Lys210 NZ 3.6Lys301 NZ . . . Glu216 OE1 3.4
Structure of Diferric Bovine Lactoferrin 229
chains in going from hLf to bLf (N lobe:Pro42! Ala, Phe63!Met, Thr122! Ser, Phe183! Cys; C-lobe: Glu352! Pro). This suggests thatthe greater closure of the domains in both lobes ofbLf relative to hLf, may arise from these sequencechanges, with the domains having to move closertogether to achieve a proper ®t.
The ``dilysine trigger'' residues
The two lysine residues, Lys210 and Lys301, areof special interest. These residues correspond tothe two lysines that form the proposed ``dilysinetrigger'' in transferrins, where their amino groupsare directly hydrogen bonded (Dewan et al., 1993).In bLf, however, Lys210 and Lys301 do not interact(see Figure 6). Lys210 follows essentially the samecourse as Arg210 in human lactoferrin and theequivalent residues in transferrin and ovotransfer-rin (Lys206 and Lys209, receptively). In each of thestructures where a Lys exists (bLf, sTf, oTf) theterminal amino group is �3.7 AÊ from the phenylring on the non-coordinating Tyr82, in a positionwhere it could form an amino-aromatic interaction(Burley & Petsko, 1986; Levitt & Perutz, 1988). Thisis the position occupied by the ÿNH1 group ofArg210 in hLf. In bLf and sTf a water molecule isfound at the position occupied by Arg210 NH2 inhLf (Figure 6).
Lys301 in bLf, on the other hand, has the sameconformation as Lys301 in hLf, and different fromthe corresponding residues in sTf and oTf (Lys 296and Lys301). In the lactoferrins Lys301 NZ formsa salt bridge with Glu216 and hydrogen bondsto the carbonyl oxygen of residue 302. The aminogroup is thus 4.6 AÊ from that of Lys210, too far forany van der Waals or hydrogen bonding inter-action. In the transferrins, however, the corre-sponding lysine has a different conformation,leading to the potential Lys . . . Lys hydrogen bonddescribed previously (Baker & Lindley, 1992;Dewan et al., 1993; Kurokawa et al., 1995). Thus theso-called ``dilysine trigger'' of serum transferrinsappears to be a result not just of having twolysines, but of a particular orientation of the secondlysine, due to some other energetic in¯uence. Thispoint is discussed further later.
The position occupied by Lys301 NZ in hLf andbLf is ®lled by a water molecule in the N-lobe ofhTf; likewise the position of Lys296 NZ in hTf is®lled by a water molecule in hLf and bLf. Hence itappears that in both lactoferrin and transferrin
structures the positions of the charged nitrogens ofresidues 210 (206) and 301 (296) are variable, butthe sites are always occupied, by water moleculesor side-chain nitrogens (Figure 6). These four``polar pockets'' appear to be invariant features ofthe transferrin family of proteins. This generaliz-ation can be extended to the C-lobes as well.
Interactions between the lobes
The large differences in the relative orientationsof the two lobes of the various transferrins havebeen attributed to differences in the conformationsof the inter-lobe connecting peptides (Kurokawaet al., 1995). This is unlikely to be the case whenhuman and bovine lactoferrins are compared, how-ever, because in both proteins a regular a-helix ofthe same length (11 residues) connects the twolobes. Instead, the different lobe orientations mustresult from differences in the interactions betweenthem.
The contact region between the two lobes com-prises helices a10 and a11 from the N-lobe,together with a preceding loop 309 to 314, andfrom the C-lobe helices a2 and a12 (the C-terminalhelix). As in hLf there are very few speci®c inter-actions, the only direct hydrogen-bonded contactsin bLf being two salt bridges, Lys313 . . . Asp379and Asp315 . . . Lys386. These two interactions alsoexist in hLf, although Lys313 is changed to Arg inhLf. Likewise in ovotransferrin the Asp315 . . .Lys386 salt bridge also exists, together with threeother hydrogen bonds.
Most of the interactions between the lobes arehydrophobic, consistent with the fact that half-mol-ecules derived by proteolysis have a strong ten-dency for non-covalent association (Legrand et al.,1986; Oe et al., 1988) but that this association canbe abolished using detergents or by removing theC-terminal portions of either half (Williams &Moreton, 1988). Solvent accessibility calculations(Lee & Richards, 1971) show that a total surface of�1100 AÊ 2 is buried by the association of the twolobes. The residues that are the main contributorsare, on the N-lobe, Pro311, Lys313, Val314, Leu318and Ser322, and on the C-lobe Val382, Leu385,Lys386, Pro679, Leu680, Ala683, Phe686, Leu687and Arg689.
The difference in the relative orientations of thetwo lobes between bLf and hLf (Figure 4) can betraced to a slight repacking of this hydrophobicinterface. The causes are complex, however. There

230 Structure of Diferric Bovine Lactoferrin
are some changes in the side-chains that contribute(Lys313! Arg, Val314! Ile, Val382! Ala andArg689! Lys; bLf residues given ®rst) and thesechanges have some impact on the association ofthe lobes. The changes in domain closure in eachlobe are at least of equal importance, however,both because the orientations of the domains affectthe interactions between the lobes, and becausepart of the 11.3� angular difference between thelobes is actually a re¯ection of different domainorientations.
Carbohydrate structure
The amino acid sequence of bovine lactoferrinreveals ®ve potential N-glycosylation sites, withAsn-X-Ser/Thr sequence motifs; these are atAsn233, Asn281, Asn368, Asn476 and Asn545(Pierce et al., 1991). Chemical studies, however,show that only four glycan chains are actuallyattached (Spik et al., 1994), and that the site atAsn281 is not used.
Our crystallographic analysis of bLf clearly con-®rms three of the attachment sites, and the remark-ably good quality of the electron density hasenabled us to model no fewer than ten sugar resi-dues. Electron density is present for one N-acetyl-glucosamine (NAG) residue at Asn368, for atrisaccharide comprising two NAG residues and ab-1,4-mannose (MAN) residue at Asn476 and for amannose-rich hexasaccharide at Asn545. No den-sity indicating the presence of carbohydrate can beseen at either Asn233 or Asn281.
The most striking feature of the carbohydratestructure is the well-de®ned biantennary hexasac-charide at Asn545. This comprises an Asn-NAG(b-1,4) NAG (b-1,4) MAN core, followed by a 1,6-linked MAN to which two further MAN residuesare attached through a-1,6 and a-1,3 linkages. It isshown, ®tted to its electron density, in Figure 1,and its location on the bLf molecule can be seen inFigure 2.
Asn545 is located in a fairly deep cleft,between the back ends of the C-1 and C-2domains, near the hinge region of the C-lobe.The result is that the inner core of this glycanchain is sandwiched between the two domains.
Table 6. Carbohydrate hydrogen bonding
Asn545 glycan
NAG 545A O-3 . . . NAG 545B O-5 3.1NAG 545A O-6 . . . Asp546 OD2 2.7NAG 545B O-3 . . . MAN 545C O-5 2.8NAG 545B O-3 . . . MAN 545D O-4 3.3NAG 545B O-7 . . . MAN 545E O-2 2.7MAN 545C O-2 . . . Lys416 NZ 2.8MAN 545D O-2 . . . Glu51 OE2a 3.2MAN 545D O-4 . . . Glu555 OE2 2.7MAN 545E O-3 . . . Arg566 NH1 3.4MAN 545F O-4 . . . Glu555 OE2 3.3MAN 545F O-4 . . . Glu555 O 3.3
a Intermolecular contact.
This is probably the reason why attempts to fullydeglycosylate bovine lactoferrin with the endogly-cosidase PNGase F (which cleaves the Asn-NAGbond) were unsuccessful (Baker et al., 1994), forthis glycan chain the cleavage site would be inac-cessible. A tryptophan residue, Trp549, plays animportant structural role at this site; a hydrogenbond of 3.0 AÊ from Trp549 NE1 to OD1 ofAsn545 orients both the side-chain amide of theAsn residue and the indole ring of the Trp, andthe indole ring in turn makes an angled stackinginteraction with the axial face of the ®rst NAGresidue (Figure 1). This type of interaction is seenin other protein±carbohydrate structures (Vyas,1991). Both C-1 and C-5 of the ®rst NAG residuemake van der Waals contacts with the Trp549indole ring, and O6 makes a short hydrogenbond (2.7 AÊ ) with OD2 of Asp546, thus furtherstabilizing the conformation of this hexasacchar-ide; in fact four of the six residues have at leastone hydrogen bond to the protein (Table 6).
Asn368 is on the surface of the C-1 domain, onthe turn between helix a1 and strand bb, and thesingle NAG residue at this site is oriented by ahydrogen bond between the acetyl oxygen O-7 andthe side-chain amide of Gln614. Asn476 is at the C-terminus of helix a5 on the C-2 domain. In contrastto the glycan at Asn545 this has little interactionwith the protein structure, the only contact being aweak hydrogen bond (3.4 AÊ ) between the acetami-do oxygen O-7 of the second NAG and the side-chain amide of Asn671. In spite of this, the Asn-NAG-NAG-MAN core structures at both theAsn476 and Asn545 attachment sites have remark-ably similar conformations (Table 7). These appearto be stabilized by a common hydrogen bondingcon®guration in which the O-3 hydroxyl of onesugar is hydrogen bonded to the O-5 ether oxygenof the next sugar. The glycosidic torsion anglevalues also fall within accepted energy minima forall the observed linkages (Table 7) (Homans et al.,1987; Imberty et al., 1990). From these and otherAsn-linked carbohydrate structures it thus appearsthat the conformation of the Asn-NAG-NAG-MANunit is relatively rigid and is determined by glyco-sidic torsion angle minima and favourable hydro-gen bonds (Imberty et al., 1990; Imberty & Perez,
Asn368 glycan
NAG 368A O-7 . . . Gln614 NE2 2.6
Asn476 glycan
NAG 476A O-3 . . . NAG 476B O-5 3.1NAG 476B O-3 . . . 476C O-5 3.4NAG 476B O-7 . . . ASN 671 ND2 3.4
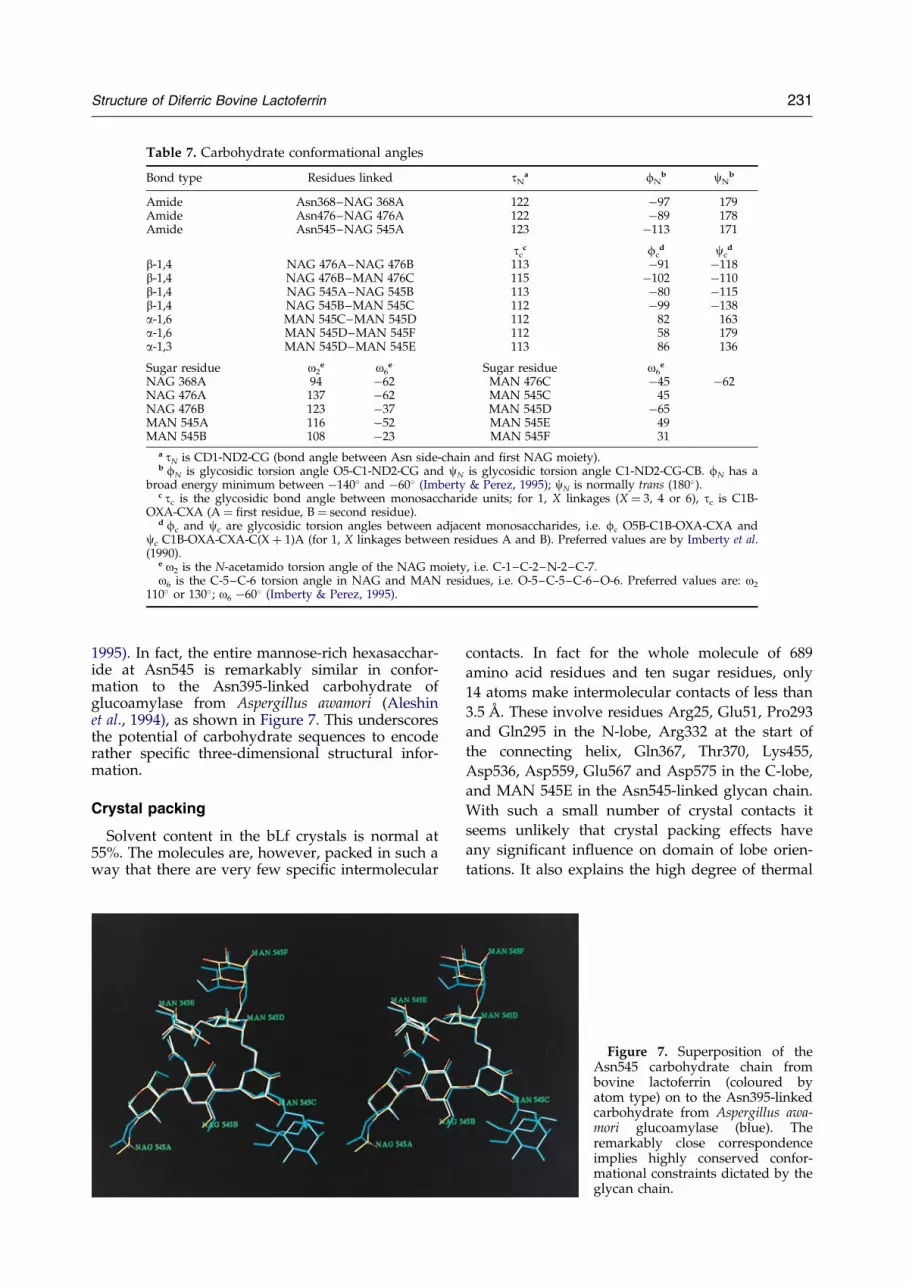
Table 7. Carbohydrate conformational angles
Bond type Residues linked tNa fN
b cNb
Amide Asn368±NAG 368A 122 ÿ97 179Amide Asn476±NAG 476A 122 ÿ89 178Amide Asn545±NAG 545A 123 ÿ113 171
tcc fc
d ccd
b-1,4 NAG 476A±NAG 476B 113 ÿ91 ÿ118b-1,4 NAG 476B±MAN 476C 115 ÿ102 ÿ110b-1,4 NAG 545A±NAG 545B 113 ÿ80 ÿ115b-1,4 NAG 545B±MAN 545C 112 ÿ99 ÿ138a-1,6 MAN 545C±MAN 545D 112 82 163a-1,6 MAN 545D±MAN 545F 112 58 179a-1,3 MAN 545D±MAN 545E 113 86 136
Sugar residue o2e o6
e Sugar residue o6e
NAG 368A 94 ÿ62 MAN 476C ÿ45 ÿ62NAG 476A 137 ÿ62 MAN 545C 45NAG 476B 123 ÿ37 MAN 545D ÿ65MAN 545A 116 ÿ52 MAN 545E 49MAN 545B 108 ÿ23 MAN 545F 31
a tN is CD1-ND2-CG (bond angle between Asn side-chain and ®rst NAG moiety).b fN is glycosidic torsion angle O5-C1-ND2-CG and cN is glycosidic torsion angle C1-ND2-CG-CB. fN has a
broad energy minimum between ÿ140� and ÿ60� (Imberty & Perez, 1995); cN is normally trans (180�).c tc is the glycosidic bond angle between monosaccharide units; for 1, X linkages (X � 3, 4 or 6), tc is C1B-
OXA-CXA (A � ®rst residue, B � second residue).d fc and cc are glycosidic torsion angles between adjacent monosaccharides, i.e. fc O5B-C1B-OXA-CXA and
cc C1B-OXA-CXA-C(X � 1)A (for 1, X linkages between residues A and B). Preferred values are by Imberty et al.(1990).
e o2 is the N-acetamido torsion angle of the NAG moiety, i.e. C-1±C-2±N-2±C-7.o6 is the C-5±C-6 torsion angle in NAG and MAN residues, i.e. O-5±C-5±C-6±O-6. Preferred values are: o2
110� or 130�; o6 ÿ60� (Imberty & Perez, 1995).
Structure of Diferric Bovine Lactoferrin 231
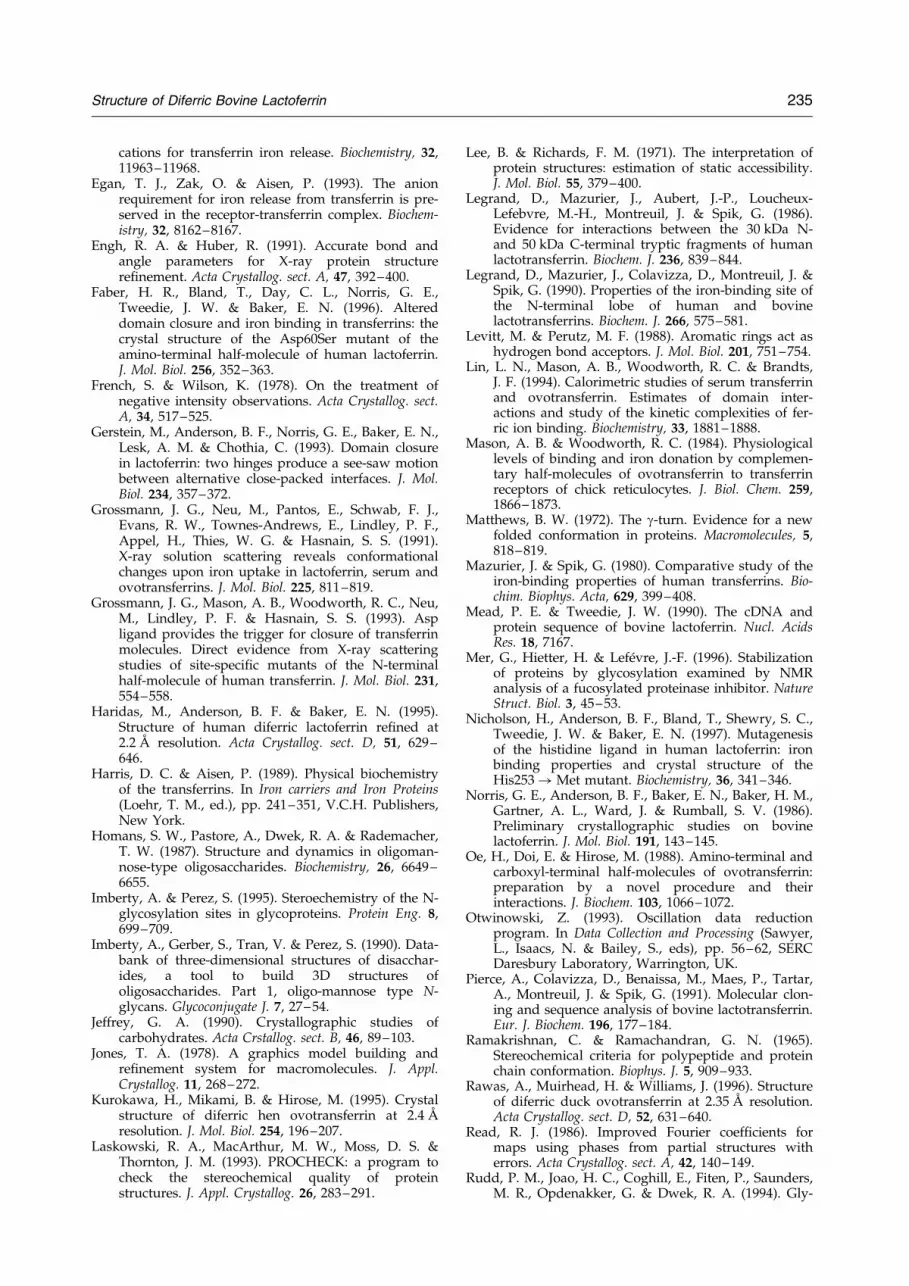
1995). In fact, the entire mannose-rich hexasacchar-ide at Asn545 is remarkably similar in confor-mation to the Asn395-linked carbohydrate ofglucoamylase from Aspergillus awamori (Aleshinet al., 1994), as shown in Figure 7. This underscoresthe potential of carbohydrate sequences to encoderather speci®c three-dimensional structural infor-mation.
Crystal packing
Solvent content in the bLf crystals is normal at55%. The molecules are, however, packed in such away that there are very few speci®c intermolecular
contacts. In fact for the whole molecule of 689
amino acid residues and ten sugar residues, only
14 atoms make intermolecular contacts of less than
3.5 AÊ . These involve residues Arg25, Glu51, Pro293
and Gln295 in the N-lobe, Arg332 at the start of
the connecting helix, Gln367, Thr370, Lys455,
Asp536, Asp559, Glu567 and Asp575 in the C-lobe,
and MAN 545E in the Asn545-linked glycan chain.
With such a small number of crystal contacts it
seems unlikely that crystal packing effects have
any signi®cant in¯uence on domain of lobe orien-
tations. It also explains the high degree of thermal
Figure 7. Superposition of theAsn545 carbohydrate chain frombovine lactoferrin (coloured byatom type) on to the Asn395-linkedcarbohydrate from Aspergillus awa-mori glucoamylase (blue). Theremarkably close correspondenceimplies highly conserved confor-mational constraints dictated by theglycan chain.
232 Structure of Diferric Bovine Lactoferrin
diffuse scattering in the diffraction pattern and therather moderate resolution of diffraction.
Discussion
Bovine lactoferrin highlights two aspects oftransferrin structure and function. Firstly, the highlevel of conservation of both the overall foldingand the metal and anion binding sites, and sec-ondly, the variations in details that modulate ironaf®nity and possibly also receptor binding indifferent members of the family. It also gives anunexpectedly clear picture of part of the carbo-hydrate structure, with some suggestions as to therole the glycan chains may play.
All of the transferrins of higher animals show ahigh level of sequence identity, 50% to 70% (Baker,1994) and this translates into extremely similarpolypeptide chain conformations, with all of thesecondary structures and most of the tertiary inter-actions conserved in lactoferrin (Anderson et al.,1989; Haridas et al., 1995), serum transferrin (Baileyet al., 1988) and ovotransferrin (Kurokawa et al.,1995). Where they do differ, however, is in the rela-tive orientations of the two lobes and in the extentof domain closure in different transferrins. Eitherof these factors has the potential to give rise tospecies-speci®c discrimination by receptors. In thecase of human transferrin there is evidence that itsreceptor acts primarily on the C-terminal lobe (Zaket al., 1994) whereas experiments with ovotransfer-rin suggest that both lobes are involved (Mason &Woodworth, 1984); in each case it is likely that thesteric effects resulting from different domain andlobe orientations are important.
Two main elements link the two lobes, i.e. thecovalent connection provided by the bridging pep-tide and the hydrophobic ``cushion'' formed by thepacking of non-polar surfaces on both lobes. Thebovine lactoferrin structure suggests that it is thelatter that is most important, since both the bovineand human protein share the same regular con-necting helix between the lobes, yet they differ by11.3� in lobe orientations. The surfaces are similarin the two proteins, but not identical because sev-eral of the main contributors are changed(Ile314! Val and Phe325! Leu, comparing hLfwith bLf); moreover, it only requires a relativelysmall repacking of the surfaces to cause a relativelylarge difference in the disposition of the lobes.
Similar effects seem likely to determine domainorientations in each lobe. Although crystal packingeffects cannot be excluded as an in¯uence on eitherdomain orientations or lobe orientations, severalobservations argue that other factors are predomi-nant. Firstly, the number of intermolecular con-tacts, in the bLf and hLf structures at least, is verysmall. Secondly, mutagenesis has shown thatremoval of the speci®c interdomain interactionsmade by Asp60 can markedly change the extent ofdomain closure (Faber et al., 1996; Grossmann et al.,1993). Gerstein et al. (1993) have identi®ed the
packing of two interfaces, one large and one small,as being major contributors to the open and closedconformational states of lactoferrin. In the case ofbovine lactoferrin we can trace the greater closureof both lobes to speci®c changes in amino acid resi-dues in the interdomain interfaces of each lobe. Wenote, however, that although small alterations indomain closure may affect receptor interactionthey have no signi®cant impact on the iron bindingsites, because these are located at the inner ends ofthe binding cleft; a 5� difference in domain closureproduces shifts of 1 to 2 AÊ at the ``lips'' of the cleft,but little difference at the inner end near the hinge.
The close identity of the metal anion bindingsites in all transferrin structures that have beendetermined to date demonstrates the extent towhich these sites are optimised for the binding ofFe3� and CO3
2ÿ; in all cases both the identity of theligands and their geometrical arrangement is thesame. This has also been shown by mutagenesis,for example the demonstration that all substi-tutions of the His ligand in lactoferrin lead to pro-teins of lower iron binding stability (Nicholsonet al., 1997). Nevertheless, different transferrins doshow variations in iron binding af®nity and stab-ility. Examples are the lower af®nity and stabilityof bovine lactoferrin compared with the humanprotein (Aisen & Leibman, 1972; Legrand et al.,1990) and the characteristically greater acid stab-ility of lactoferrins compared with transferrin(Mazurier & Spik, 1980; Harris & Aisen, 1989;Baker, 1994). Since the metal and anion bindingsites appear essentially identical, these effects mustderive from factors outside the immediate bindingsites.
Two ``external'' factors appear to be able toin¯uence iron binding and stability i.e. interdo-main interactions, of which the proposed ``dilysinetrigger'' (Dewan et al., 1993) is a speci®c example,and interlobe interactions. Both effects could con-tribute top the lower iron af®nity and stability ofbovine lactoferrin, relative to human lactoferrin. Inthe N-lobe, bLf has slightly fewer interdomaininteractions. In addition, Lys210 cannot interactdirectly with the two Tyr ligands as does Arg210,its counterpart in hLf (Day et al., 1993; Haridaset al., 1995) and this is likely to give a furtherreduction in stability. Moreover although Lys210does not hydrogen bond to Lys301, its presencenearby may still make the bLf N-lobe site moresensitive to electrostatic effects of lowered pH, con-tributing to its lower acid stability (Legrand et al.,1990). The different relative lobe orientations in bLfcould also play a part, since both thermodynamic(Lin et al., 1994) and mutagenesis (Day et al., 1993;Ward et al., 1996) studies have shown that the ironbinding stability of the N-lobe is in¯uenced byinteractions from the C-lobe.
Since bovine lactoferrin has two lysine residues(Lys210 and Lys301) that are equivalent to thelysine residues of the so-called ``dilysine trigger'' ofovotransferrin and serum transferrin (Lys209 andLys301 of oTf; Lys206 and Lys296 of sTf), why are
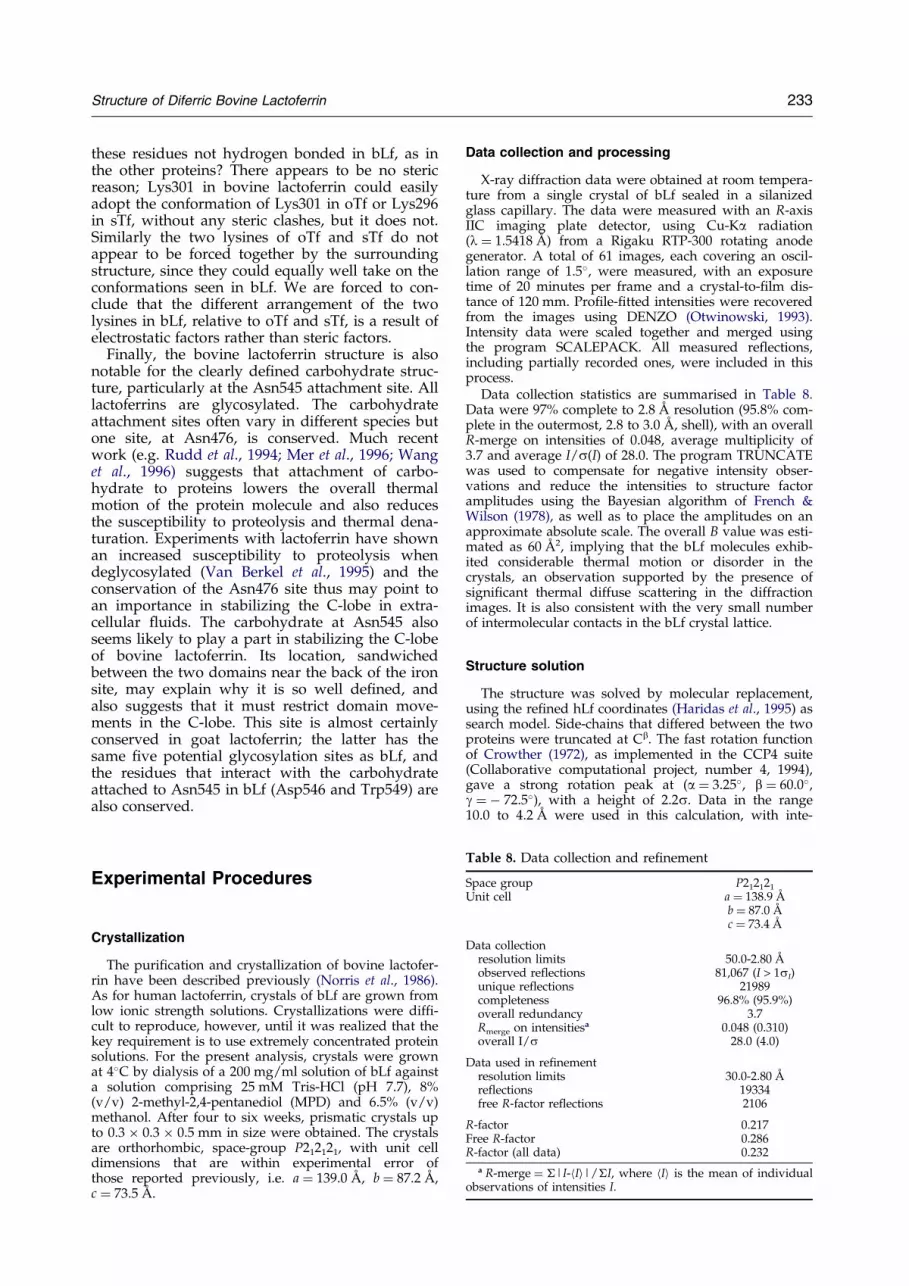
Table 8. Data collection and re®nement
Space group P212121
Unit cell a � 138.9 AÊ
b � 87.0 AÊ
c � 73.4 AÊ
Data collectionresolution limits 50.0-2.80 AÊ
observed reflections 81,067 (I > 1sI)unique reflections 21989completeness 96.8% (95.9%)overall redundancy 3.7Rmerge on intensitiesa 0.048 (0.310)overall I/s 28.0 (4.0)
Data used in refinementresolution limits 30.0-2.80 AÊ
reflections 19334free R-factor reflections 2106
R-factor 0.217Free R-factor 0.286R-factor (all data) 0.232
a R-merge � �|I-hIi|/�I, where hIi is the mean of individualobservations of intensities I.
Structure of Diferric Bovine Lactoferrin 233
these residues not hydrogen bonded in bLf, as inthe other proteins? There appears to be no stericreason; Lys301 in bovine lactoferrin could easilyadopt the conformation of Lys301 in oTf or Lys296in sTf, without any steric clashes, but it does not.Similarly the two lysines of oTf and sTf do notappear to be forced together by the surroundingstructure, since they could equally well take on theconformations seen in bLf. We are forced to con-clude that the different arrangement of the twolysines in bLf, relative to oTf and sTf, is a result ofelectrostatic factors rather than steric factors.
Finally, the bovine lactoferrin structure is alsonotable for the clearly de®ned carbohydrate struc-ture, particularly at the Asn545 attachment site. Alllactoferrins are glycosylated. The carbohydrateattachment sites often vary in different species butone site, at Asn476, is conserved. Much recentwork (e.g. Rudd et al., 1994; Mer et al., 1996; Wanget al., 1996) suggests that attachment of carbo-hydrate to proteins lowers the overall thermalmotion of the protein molecule and also reducesthe susceptibility to proteolysis and thermal dena-turation. Experiments with lactoferrin have shownan increased susceptibility to proteolysis whendeglycosylated (Van Berkel et al., 1995) and theconservation of the Asn476 site thus may point toan importance in stabilizing the C-lobe in extra-cellular ¯uids. The carbohydrate at Asn545 alsoseems likely to play a part in stabilizing the C-lobeof bovine lactoferrin. Its location, sandwichedbetween the two domains near the back of the ironsite, may explain why it is so well de®ned, andalso suggests that it must restrict domain move-ments in the C-lobe. This site is almost certainlyconserved in goat lactoferrin; the latter has thesame ®ve potential glycosylation sites as bLf, andthe residues that interact with the carbohydrateattached to Asn545 in bLf (Asp546 and Trp549) arealso conserved.
Experimental Procedures
Crystallization
The puri®cation and crystallization of bovine lactofer-rin have been described previously (Norris et al., 1986).As for human lactoferrin, crystals of bLf are grown fromlow ionic strength solutions. Crystallizations were dif®-cult to reproduce, however, until it was realized that thekey requirement is to use extremely concentrated proteinsolutions. For the present analysis, crystals were grownat 4�C by dialysis of a 200 mg/ml solution of bLf againsta solution comprising 25 mM Tris-HCl (pH 7.7), 8%(v/v) 2-methyl-2,4-pentanediol (MPD) and 6.5% (v/v)methanol. After four to six weeks, prismatic crystals upto 0.3 � 0.3 � 0.5 mm in size were obtained. The crystalsare orthorhombic, space-group P212121, with unit celldimensions that are within experimental error ofthose reported previously, i.e. a � 139.0 AÊ , b � 87.2 AÊ ,c � 73.5 AÊ .
Data collection and processing
X-ray diffraction data were obtained at room tempera-ture from a single crystal of bLf sealed in a silanizedglass capillary. The data were measured with an R-axisIIC imaging plate detector, using Cu-Ka radiation(l � 1.5418 AÊ ) from a Rigaku RTP-300 rotating anodegenerator. A total of 61 images, each covering an oscil-lation range of 1.5�, were measured, with an exposuretime of 20 minutes per frame and a crystal-to-®lm dis-tance of 120 mm. Pro®le-®tted intensities were recoveredfrom the images using DENZO (Otwinowski, 1993).Intensity data were scaled together and merged usingthe program SCALEPACK. All measured re¯ections,including partially recorded ones, were included in thisprocess.
Data collection statistics are summarised in Table 8.Data were 97% complete to 2.8 AÊ resolution (95.8% com-plete in the outermost, 2.8 to 3.0 AÊ , shell), with an overallR-merge on intensities of 0.048, average multiplicity of3.7 and average I/s(I) of 28.0. The program TRUNCATEwas used to compensate for negative intensity obser-vations and reduce the intensities to structure factoramplitudes using the Bayesian algorithm of French &Wilson (1978), as well as to place the amplitudes on anapproximate absolute scale. The overall B value was esti-mated as 60 AÊ 2, implying that the bLf molecules exhib-ited considerable thermal motion or disorder in thecrystals, an observation supported by the presence ofsigni®cant thermal diffuse scattering in the diffractionimages. It is also consistent with the very small numberof intermolecular contacts in the bLf crystal lattice.
Structure solution
The structure was solved by molecular replacement,using the re®ned hLf coordinates (Haridas et al., 1995) assearch model. Side-chains that differed between the twoproteins were truncated at Cb. The fast rotation functionof Crowther (1972), as implemented in the CCP4 suite(Collaborative computational project, number 4, 1994),gave a strong rotation peak at (a � 3.25�, b � 60.0�,g � ÿ 72.5�), with a height of 2.2s. Data in the range10.0 to 4.2 AÊ were used in this calculation, with inte-
234 Structure of Diferric Bovine Lactoferrin
gration radii of 10.0 to 35.0 AÊ . Several other choices ofintegration radii gave the same highest peak. The correcttranslation was found by an R-factor search, using therotated search model; this gave a minimum at (0.303,0.393, 0.494) with R � 0.46 for data in the range 10.0 to4.0 AÊ . Rigid body re®nement with CORELS (Sussmanet al., 1977) then reduced the R-factor to 0.38 for 10.0 to4.0 AÊ data.
Refinement
A complete initial model for bovine lactoferrin wasobtained by ®tting the known amino acid sequence tothe electron density using FRODO (Jones, 1978). Thesequence used was that of Mead & Tweedie (1990) (Gen-bank accession number X54801); this differs at four pos-itions from the sequence of Pierce et al. (1991) and allfour variations could be veri®ed by the electron density.
The initial model was subjected to moleculardynamics re®nement with X-PLOR (Brunger et al., 1987),using the slowcool procedure, with 10.0 to 2.8 AÊ data(|F| > 2sF). This gave an R-factor of 0.32. The modelwas then extensively rebuilt into a SIGMAA-weightedelectron density map (Read, 1986); this map also showedgood electron density for two carbohydrate chains, atAsn476 and Asn545, and for the Fe3� and CO3
2ÿ ions,which had not previously been included in the model.Further re®nement was with TNT (Tronrud et al., 1987;Tronrud, 1992) using the bond length and angle par-ameters of Engh & Huber (1991). Several rounds ofrestrained least squares re®nement, interspersed withmodel rebuilding into SIGMAA-weighted 2Fo-Fc and Fo-Fc maps, eventually reduced the R-factor to 0.217 (Rfree-0.286). In the ®nal cycles of re®nement all re¯ectionswere used, giving an overall R-factor of 0.232 for all21440 re¯ections in the resolution range 30.0 to 2.8 AÊ .
The ®nal model displays good overall geometry, withrms deviations from standard values of 0.011 AÊ for bondlengths and 1.5� for bond angles. 86% of residues arefound in the ``core'' regions of the Ramachandran plot(Laskowski et al., 1993). Three Asn-linked oligosacchar-ides were included in the model at Asn residues 368, 476and 545 for a total of ten monosaccharide units. Thesewere re®ned using bond and angle parameters fromidealised N-acetylglucosamine and mannose units, andglycosidic linkages, all from Jeffery (1990). Fifty watermolecules were also included in the model, providingthey met the criteria of peaks greater than 4s in Fo-Fc
maps, hydrogen bond partners with appropriate distanceand angle geometry, and B values less than 80 AÊ 2 whenre®ned. At the end of the re®nement all waters wereomitted from the model, and the model was again sub-jected to TNT re®nement. All these water sites thenreappeared in SIGMAA-weighted difference maps withpeak heights of at least 4s.
The atomic coordinates for the re®ned bovine lactofer-rin structure have been deposited with the BrookhavenProtein Data Bank, with entry code 1BLF.
Acknowledgements
We wish to thank Heather Baker for help with thecrystallization and Alain Roussel for help with some ofthe illustrations. We gratefully acknowledge researchsupport from the Health Research Council of New Zeal-and the Wellcome Trust, the US National Institutes of
Health (grant HD 20859), and the New Zealand DairyResearch Institute. E. N. B. also received research sup-port as an International Research Scholar of the HowardHughes Medical Institute.
References
Aisen, P. & Leibman, A. (1972). Lactoferrin and transfer-rin: a comparative study. Biochim. Biophys. Acta,257, 314±323.
Aleshin, A. E., Hoffman, C., Firsov, L. M. & Honzatko,R. B. (1994). Re®ned crystal structures of glucoamy-lase from Asperigillus awamori var. X100. J. Mol. Biol.238, 575±591.
Anderson, B. F., Baker, H. M., Dodson, E. J., Norris,G. E., Rumball, S. V., Waters, J. M. & Baker, E. N.(1987). Structure of human lactoferrin at 3.2 AÊ
resolution. Proc. Natl Acad. Sci. USA, 84, 1769±1773.Anderson, B. F., Baker, H. M., Norris, G. E., Rice,
D. W. & Baker, E. N. (1989). Structure of humanlactoferrin: crystallographic structure analysis andre®nement at 2.8 AÊ resolution. J. Mol. Biol. 209,711±734.
Anderson, B. F., Baker, H. M., Norris, G. E., Rumball,S. V. & Baker, E. N. (1990). Apolactoferrin structuredemonstrates ligand-induced conformational changein transferrins. Nature, 344, 784±797.
Bailey, S., Evans, R. W., Garratt, R. C., Gorinsky, B.,Hasnain, S., Horsburgh, C., Jhoti, H., Lindley, P. F.,Mydin, A., Sarra, R. & Watson, J. L. (1988). Molecu-lar structure of serum transferrin at 3.3 AÊ resolution.Biochemistry, 27, 5804±5812.
Baker, E. N. (1994). Structure and reactivity oftransferrins. Advan. Inorg. Chem. 41, 389±463.
Baker, E. N. & Hubbard, R. E. (1984). Hydrogen bond-ing in globular proteins. Progr. Biophys. Mol. Biol.44, 97±179.
Baker, E. N. & Lindley, P. F. (1992). New perspectiveson the structure and function of transferrins. J. Inorg.Bichem. 47, 147±160.
Baker, H. M., Day, C. L., Norris, G. E. & Baker, E. N.(1994). Enzymatic deglycosylation as a tool for crys-tallization of mammalian binding proteins. ActaCrystallog. sect. D, 50, 380±384.
Brock, J. H. (1985). Transferrins. In Metalloproteins(Harrison, P., ed.), part 2, pp. 183±262, MacmillanPress, London.
Brunger, A. T., Kuriyan, J. & Karplus, M. (1987). Crys-tallographic R factor re®nement by molecularre®nement by molecular dynamics. Science, 235,458±460.
Burley, S. K. & Petsko, G. A. (1986). Amino-aromaticinteractions in proteins. FEBS Letters, 203, 139±143.
Collaborative computational project number 4 (1994).The CCP4 suite: programs for proteincrystallography. Acta Crystallog, sect. D, 50, 760±763.
Crowther, R. A. (1972). The Molecular Replacement Method(Rossman, M. G., ed.), pp. 173±178, Gordon andBreach, New York.
Day, C. L., Anderson, B. F., Tweedie, J. W. & Baker,E. N. (1993). Structure of the recombinant N-term-inal lobe of human lactoferrin at 2.0 AÊ resolution.J. Mol. Biol. 232, 1084±1100.
Dewan, J. C., Mikami, B., Hirose, M. & Sacchettini, J. C.(1993). Structural evidence for a pH-sensitive dily-sine trigger in the hen ovotransferrin N-lobe: impli-
Structure of Diferric Bovine Lactoferrin 235
cations for transferrin iron release. Biochemistry, 32,11963±11968.
Egan, T. J., Zak, O. & Aisen, P. (1993). The anionrequirement for iron release from transferrin is pre-served in the receptor-transferrin complex. Biochem-istry, 32, 8162±8167.
Engh, R. A. & Huber, R. (1991). Accurate bond andangle parameters for X-ray protein structurere®nement. Acta Crystallog. sect. A, 47, 392±400.
Faber, H. R., Bland, T., Day, C. L., Norris, G. E.,Tweedie, J. W. & Baker, E. N. (1996). Altereddomain closure and iron binding in transferrins: thecrystal structure of the Asp60Ser mutant of theamino-terminal half-molecule of human lactoferrin.J. Mol. Biol. 256, 352±363.
French, S. & Wilson, K. (1978). On the treatment ofnegative intensity observations. Acta Crystallog. sect.A, 34, 517±525.
Gerstein, M., Anderson, B. F., Norris, G. E., Baker, E. N.,Lesk, A. M. & Chothia, C. (1993). Domain closurein lactoferrin: two hinges produce a see-saw motionbetween alternative close-packed interfaces. J. Mol.Biol. 234, 357±372.
Grossmann, J. G., Neu, M., Pantos, E., Schwab, F. J.,Evans, R. W., Townes-Andrews, E., Lindley, P. F.,Appel, H., Thies, W. G. & Hasnain, S. S. (1991).X-ray solution scattering reveals conformationalchanges upon iron uptake in lactoferrin, serum andovotransferrins. J. Mol. Biol. 225, 811±819.
Grossmann, J. G., Mason, A. B., Woodworth, R. C., Neu,M., Lindley, P. F. & Hasnain, S. S. (1993). Aspligand provides the trigger for closure of transferrinmolecules. Direct evidence from X-ray scatteringstudies of site-speci®c mutants of the N-terminalhalf-molecule of human transferrin. J. Mol. Biol. 231,554±558.
Haridas, M., Anderson, B. F. & Baker, E. N. (1995).Structure of human diferric lactoferrin re®ned at2.2 AÊ resolution. Acta Crystallog. sect. D, 51, 629±646.
Harris, D. C. & Aisen, P. (1989). Physical biochemistryof the transferrins. In Iron carriers and Iron Proteins(Loehr, T. M., ed.), pp. 241±351, V.C.H. Publishers,New York.
Homans, S. W., Pastore, A., Dwek, R. A. & Rademacher,T. W. (1987). Structure and dynamics in oligoman-nose-type oligosaccharides. Biochemistry, 26, 6649±6655.
Imberty, A. & Perez, S. (1995). Steroechemistry of the N-glycosylation sites in glycoproteins. Protein Eng. 8,699±709.
Imberty, A., Gerber, S., Tran, V. & Perez, S. (1990). Data-bank of three-dimensional structures of disacchar-ides, a tool to build 3D structures ofoligosaccharides. Part 1, oligo-mannose type N-glycans. Glycoconjugate J. 7, 27±54.
Jeffrey, G. A. (1990). Crystallographic studies ofcarbohydrates. Acta Crstallog. sect. B, 46, 89±103.
Jones, T. A. (1978). A graphics model building andre®nement system for macromolecules. J. Appl.Crystallog. 11, 268±272.
Kurokawa, H., Mikami, B. & Hirose, M. (1995). Crystalstructure of diferric hen ovotransferrin at 2.4 AÊ
resolution. J. Mol. Biol. 254, 196±207.Laskowski, R. A., MacArthur, M. W., Moss, D. S. &
Thornton, J. M. (1993). PROCHECK: a program tocheck the stereochemical quality of proteinstructures. J. Appl. Crystallog. 26, 283±291.
Lee, B. & Richards, F. M. (1971). The interpretation ofprotein structures: estimation of static accessibility.J. Mol. Biol. 55, 379±400.
Legrand, D., Mazurier, J., Aubert, J.-P., Loucheux-Lefebvre, M.-H., Montreuil, J. & Spik, G. (1986).Evidence for interactions between the 30 kDa N-and 50 kDa C-terminal tryptic fragments of humanlactotransferrin. Biochem. J. 236, 839±844.
Legrand, D., Mazurier, J., Colavizza, D., Montreuil, J. &Spik, G. (1990). Properties of the iron-binding site ofthe N-terminal lobe of human and bovinelactotransferrins. Biochem. J. 266, 575±581.
Levitt, M. & Perutz, M. F. (1988). Aromatic rings act ashydrogen bond acceptors. J. Mol. Biol. 201, 751±754.
Lin, L. N., Mason, A. B., Woodworth, R. C. & Brandts,J. F. (1994). Calorimetric studies of serum transferrinand ovotransferrin. Estimates of domain inter-actions and study of the kinetic complexities of fer-ric ion binding. Biochemistry, 33, 1881±1888.
Mason, A. B. & Woodworth, R. C. (1984). Physiologicallevels of binding and iron donation by complemen-tary half-molecules of ovotransferrin to transferrinreceptors of chick reticulocytes. J. Biol. Chem. 259,1866±1873.
Matthews, B. W. (1972). The g-turn. Evidence for a newfolded conformation in proteins. Macromolecules, 5,818±819.
Mazurier, J. & Spik, G. (1980). Comparative study of theiron-binding properties of human transferrins. Bio-chim. Biophys. Acta, 629, 399±408.
Mead, P. E. & Tweedie, J. W. (1990). The cDNA andprotein sequence of bovine lactoferrin. Nucl. AcidsRes. 18, 7167.
Mer, G., Hietter, H. & LefeÂvre, J.-F. (1996). Stabilizationof proteins by glycosylation examined by NMRanalysis of a fucosylated proteinase inhibitor. NatureStruct. Biol. 3, 45±53.
Nicholson, H., Anderson, B. F., Bland, T., Shewry, S. C.,Tweedie, J. W. & Baker, E. N. (1997). Mutagenesisof the histidine ligand in human lactoferrin: ironbinding properties and crystal structure of theHis253!Met mutant. Biochemistry, 36, 341±346.
Norris, G. E., Anderson, B. F., Baker, E. N., Baker, H. M.,Gartner, A. L., Ward, J. & Rumball, S. V. (1986).Preliminary crystallographic studies on bovinelactoferrin. J. Mol. Biol. 191, 143±145.
Oe, H., Doi, E. & Hirose, M. (1988). Amino-terminal andcarboxyl-terminal half-molecules of ovotransferrin:preparation by a novel procedure and theirinteractions. J. Biochem. 103, 1066±1072.
Otwinowski, Z. (1993). Oscillation data reductionprogram. In Data Collection and Processing (Sawyer,L., Isaacs, N. & Bailey, S., eds), pp. 56±62, SERCDaresbury Laboratory, Warrington, UK.
Pierce, A., Colavizza, D., Benaissa, M., Maes, P., Tartar,A., Montreuil, J. & Spik, G. (1991). Molecular clon-ing and sequence analysis of bovine lactotransferrin.Eur. J. Biochem. 196, 177±184.
Ramakrishnan, C. & Ramachandran, G. N. (1965).Stereochemical criteria for polypeptide and proteinchain conformation. Biophys. J. 5, 909±933.
Rawas, A., Muirhead, H. & Williams, J. (1996). Structureof diferric duck ovotransferrin at 2.35 AÊ resolution.Acta Crystallog. sect. D, 52, 631±640.
Read, R. J. (1986). Improved Fourier coef®cients formaps using phases from partial structures witherrors. Acta Crystallog. sect. A, 42, 140±149.
Rudd, P. M., Joao, H. C., Coghill, E., Fiten, P., Saunders,M. R., Opdenakker, G. & Dwek, R. A. (1994). Gly-
236 Structure of Diferric Bovine Lactoferrin
coforms modify the dynamic stability and func-tional activity of an enzyme. Biochemistry, 33, 17±22.
Sarra, R., Garratt, R., Gorinsky, B., Jhoti, H. & Lindley,P. F. (1990). High resolution X-ray studies on rabbitserum transferrin: preliminary structure analysis ofthe N-terminal half-molecule at 2.3 AÊ resolution.Acta Crystallog. sect. B, 46, 763±771.
Spik, G., Coddeville, B., Mazurier, J., Bourne, Y.,Cambillau, C. & Montreuil, J. (1994). Primary andthree-dimensional structure of lactotransferrin (lac-toferrin) glycans. Advan. Expt. Med. Biol. 357, 21±32.
Sussman, J. L., Holbrook, S. R., Church, G. M. & Kim,S. H. (1977). A structure-factor least-squares pro-cedure for macromolecular structures using con-strained and restrained parameters. Acta Crystallog.sect. A, 33, 800±804.
Tronrud, D. E. (1992). Conjugate-direction minimization:an improved method for re®nement ofmacromolecules. Acta Crystallog. sect. A, 48, 912±916.
Tronrud, D. E., Ten, Eyck L. F. & Matthews, B. W.(1987). An ef®cient general-purpose least-squaresre®nement program for macromolecular structures.Acta Crystallog. sect. A, 43, 489±501.
Van Berkel, P. H. C., Geerts, M. E. J., Van Veen, H. A.,Kooiman, P. M., Pieper, F. R., de Boer, H. A. &Nuijens, J. H. (1995). Glycosylated and unglycosy-lated human lactoferrins both bind iron and showidentical af®nities towards human lysozyme andbacterial lipopolysaccharide, but differ in their sus-ceptibilities towards tryptic proteolysis. Biochem. J.312, 107±114.
Vyas, N. (1991). Atomic features of protein±carbo-hydrate interactions. Curr. Opin. Struct. Biol. 1, 732±740.
Wang, C., Eufemi, M., Turano, C. & Giartosio, A. (1996).In¯uence of the carbohydrate moiety on the stab-ility of glycoproteins. Biochemistry, 35, 7299±7307.
Ward, P. P., Zhou, X. & Conneely, O. M. (1996). Coop-erative interactions between the amino- and car-boxyl-terminal lobes contribute to the unique iron-binding stability of lactoferrin. J. Biol. Chem. 271,12790±12794.
Williams, J. & Moreton, K. (1988). The dimerisation ofhalf-molecule fragments of ovotransferrin. Biochem.J. 251, 849±855.
Zak, O., Trinder, D. & Aisen, P. (1994). Primary recep-tor-recognition site of human transferrin is in the C-terminal lobe. J. Biol. Chem. 26, 7110±7114.
Edited by D. Rees
(Received 27 May 1997; received in revised form 18 August 1997; accepted 19 August 1997)