thixotropy, yielding and ultrasonic doppler velocimetry in pulp fibre suspensions
TRANSCRIPT
Rheol Acta (2012) 51:201–214DOI 10.1007/s00397-011-0577-7
ORIGINAL CONTRIBUTION
Thixotropy, yielding and ultrasonic Doppler velocimetryin pulp fibre suspensions
Babak Derakhshandeh · Dimitris Vlassopoulos ·Savvas G. Hatzikiriakos
Received: 25 April 2011 / Revised: 9 July 2011 / Accepted: 15 July 2011 / Published online: 5 August 2011© Springer-Verlag 2011
Abstract This paper reports thixotropy in concentratedpulp fibre suspensions and studies their transient flowbehaviour using conventional rheometry coupled witha velocimetry technique. Specifically, an ultrasonicDoppler velocimeter is used in conjunction with arate-controlled rheometer to deduce the local velocityprofiles of pulp fibre suspensions. Pulp suspensions arefound to exhibit a plateau in their flow curves where aslight increase in the shear stress generates a jump inthe corresponding shear rate, implying the occurrenceof shear banding. The velocity profiles were found tobe discontinuous in the vicinity of the yielding radiuswhere the Herschel–Bulkley model failed to predictthe flow. Shear history and the time of rest prior tothe measurement were found to play a significant roleon the rheology and the local velocity profiles of pulpsuspensions.
Keywords Velocimetry · UDV · Shear banding ·Pulp fibre suspensions · Thixotropy · Rheo-optics ·Suspension · Yielding
B. Derakhshandeh · S. G. Hatzikiriakos (B)Department of Chemical and Biological Engineering,The University of British Columbia, Vancouver,BC, V6T 1Z3, Canadae-mail: [email protected]
D. VlassopoulosFORTH, Institute of Electronic Structure & Laser,Heraklion, Crete, Greece
Introduction
Thixotropy is the decrease of viscosity with time when asample is sheared from rest and its subsequent recoverywhen flow stops (Schalek and Szegvari 1923; Mewisand Wagner 2009). Extensive studies of thixotropy havetaken place and been reported in the scientific litera-ture for various systems. Some noteworthy publicationsinclude the reviews of the field by Mewis (1979), Barnes(1997) and Mewis and Wagner (2009).
Due to the presence of microstructure within thesample, thixotropic materials often exhibit an apparentyield stress i.e. a minimum shear stress is required torupture the structures and to initiate flow (Mewis andWagner 2009; Ovarlez et al. 2009). In other words,unless the apparent yield stress is exceeded, flow doesnot take place. In an ideal yield-stress fluid, the shearrate is constant or exhibits a continuous spatial profileand models such as Herschel–Bulkley (HB), Cassonor Bingham precisely predict the velocity profiles in agiven geometry (Bonn and Denn 2009).
However, most of the concentrated suspensions donot conform to this definition of apparent yield stress(Raynaud et al. 2002; Bonn et al. 2002; Baudez et al.2004; Jarny et al. 2005). The presence of thixotropyand yielding is often associated with shear-banding. Inthis case, the shear rate profile exhibits an apparentdiscontinuity, i.e., the shear rate takes two significantlydifferent values for the same shear stress (Coussot et al.1993; Mas and Magnin 1994; Pignon et al. 1996; Ovarlezet al. 2006). This can also be viewed as a pseudo phaseseparation, where the flowing complex fluid is spatiallysplit into two regions bearing the same shear stress, onebeing the low-shear-rate and the other the high-shear-rate region. This is the banding instability that gives
202 Rheol Acta (2012) 51:201–214
rise to a discontinuous velocity profile (Olmsted 2008;Dhont and Briels 2008). Typically, this translates into astress plateau region in the flow curve (Coussot et al.1993; Bonnecaze and Cloitre 2010). However, the in-verse is not always true, i.e. the appearance of stressplateau in the flow curve does not necessarily meanthat there is shear banding (Meeker et al. 2004a, b).Note also that often a thin slip layer is observed withslip velocities being a weak (power-law) function ofthe shear stress and it is unclear if banding occurs ornot (Bécu et al. 2006; Erwin et al. 2010; Coussot andOvarlez 2010). Wormlike micelles represent the mostextensively studied and best understood shear-bandingexperimental system, which exhibits strong shear thin-ning but typically no yield stress (Cates and Fielding2006). In this work, we shall focus on yield-stress fluids.
From the above, it is evident that the field is veryrich, and there are different macroscopic reflectionsof shear banding, although the origin always appearsto be the coupling of the system’s order parameter tothe flow field. A further remark is that there is oftena distinction made between shear banding and shearstress localization. Whereas both reflect discontinuousvelocity and discontinuous shear rate, the former isassociated with the steady thinning flow curve and finitevelocities in the two bands; on the other hand, the latteris the pseudo phase separation situation with a nearlyzero or unsteady velocity branch and a finite velocitybranch (Coussot 2007). For the present purposes weshall call the velocity discontinuity banding but notethat it reflects coexistence behaviour.
Concentrated suspensions and pastes such as mi-crogels, paints, mud and cement are known to beyielding and often thixotropic materials (Cloitre 2009;Barnes 1997; Raynaud et al. 2002; Bonn and Denn2009). Shear-banding is often observed in these sys-tems and, given the complex flow behaviour, a numberof studies have been devoted to develop appropriatetechniques to study their rheology. It is now well-known that velocimetry techniques such as magneticresonance imaging (MRI), particle image velocimetry(PIV) and ultrasonic Doppler velocimetry (UDV) canbe successfully implemented to study thixotropic sys-tems (Raynaud et al. 2002), shear-banding (Mas andMagnin 1994; Callaghan 2008; Manneville 2008) and tomeasure the apparent yield stress of complex suspen-sions (Derakhshandeh et al. 2010a).
Pulp fibre suspensions fit into the complex fluids de-scribed above as they are composed of microstructuresexhibiting yielding and thixotropic behaviour. Flow offibre suspensions plays a key role in manufacturing adiverse range of products, for example, fibre-reinforcedcomposites, food stuffs, biomass, carpeting and textiles
(Tucker and Advani 1994; Papathanasiou and Guell1997; Piteira et al. 2006; Kerekes 2006; Umer et al.2007). The unique behaviour of the fibres in suspensiongives rise to their complex rheology. The large aspectratio of pulp fibres (40 to 100) induces significant con-tact among fibres at all concentrations (Kerekes et al.1985). This has a strong effect on suspension rheology.In shear flow, fibres aggregate into local mass concen-trations called flocs, which are typically a few fibrelengths in size. Having locally a larger concentrationthan the average suspension concentration, flocs alsohave a larger strength than the suspension average.Consequently, fibre suspensions are heterogeneous inboth mass and strength, an important factor in pulpsuspension rheology.
The suspension often cannot be treated as a con-tinuum because fibres and flocs are large relative tothe dimensions of the flow field. Both shear historyand time in a given shear flow (thixotropy) may causefloc size and strength to differ among suspensions evenwhen suspension averages are the same. Fibre orienta-tion and migration away from solid boundaries createa depletion layer near walls which complicates rheo-logical measurements further (Nguyen and Boger 1992;Barnes 1997; Swerin 1998; Wikström and Rasmuson1998).
Another complexity in measuring the rheologicalproperties of pulp fibre suspensions is the limitation inloading the rheometer when geometries such as cone-plate and parallel-plate are implemented. Under com-pressive stress, water squeezes out and as a result thefibre mass concentration increases. The same limitationis also present when Couette geometry with a narrowgap is used. In this case, the bob pushes fibres downand water squeezes out of the sample. These lead toimprecise rheological data. Under these conditions, onemay not expect a uniform flow.
Generally, models such as HB have been used torepresent the flow behaviour of pulp fibre suspensionsat different fibre mass concentrations (Pettersson 2004;Ventura et al. 2007). More recently, Derakhshandehet al. (2010b) using a coupled UDV and rheome-try technique in a wide gap rheometer measured thevelocity profiles of the suspension along with a HBmodel to represent the velocity profiles. The HB modelwas found to adequately describe the velocity profilesand the flow behaviour of pulp suspensions. However,in some cases at higher fibre mass concentrations,the obtained velocity profiles exhibited a discontinu-ous change in the slope at the interface between theyielded and un-yielded regions. This is typical behav-iour of materials which exhibit shear banding (Olmsted2008).
Rheol Acta (2012) 51:201–214 203
As discussed before, pulp suspensions are hetero-geneous systems containing millimetre-sized fibres andcentimetre-sized fibre flocs. The discontinuity in thevelocity profiles at the transition from the yielded tothe un-yielded zone can also be due to the presence oflarge moving flocs in the layer next to the un-yieldedregion. In this case, UDV probes finite velocities for themoving fibre flocs and drops to zero in the next layer.Therefore, at this point, it is not clear whether pulpsuspensions display shear banding as they go throughyielding transition.
A recent review on pulp fibre suspension rheology(Derakhshandeh et al. 2011) indicates that past workshave generally focused on the apparent yield stressmeasurement, post-yield flow behaviour and some par-ticular aspects of pulping or papermaking. One aspectthat has not been addressed to date is measurementand analysis of thixotropy and possible shear-bandingeffects in pulp suspensions, particularly the more con-centrated ones.
This paper addresses the time-dependent rheologyof concentrated pulp suspensions with emphasis onthixotropy, viscosity bifurcation and shear-banding.UDV is used to explore the velocity profiles across thegap of a vane in large cup geometry in order to studythe yielding transition in pulp suspensions. The velocityprofiles are then used to propose a model to describethe behaviour of pulp sheared in the yielded region.In this study, pulp suspension of higher mass concen-trations is used compared to those used previously inour studies (Derakhshandeh et al. 2010a, b) since thephenomena of thixotropy and shear banding are moredominant at high mass concentrations. The paper is orga-nized as follows. Section “Materials and experimentalprocedure” describes the materials and the experimen-tal methods and measurement protocols established forthis study. Section “Results and discussion” includesthe results obtained by conventional rheometry, ultra-sonic Doppler velocimetry and the modeling effort.Finally Section “Conclusions” summarizes the key con-clusions from this work.
Materials and experimental procedure
Material
Pulp fibre suspensions of 6 wt.% were prepared fromstone-ground wood (SGW; Paprican, Pointe-Claire,QC) by breaking up the dried pulp sheets and rehydrat-ing the fibres with tap water using a disintegrator (TMI,Montreal, QC) for 30 min at 120 rpm. The pulp fibreproperties are summarized in Table 1. Having shortest
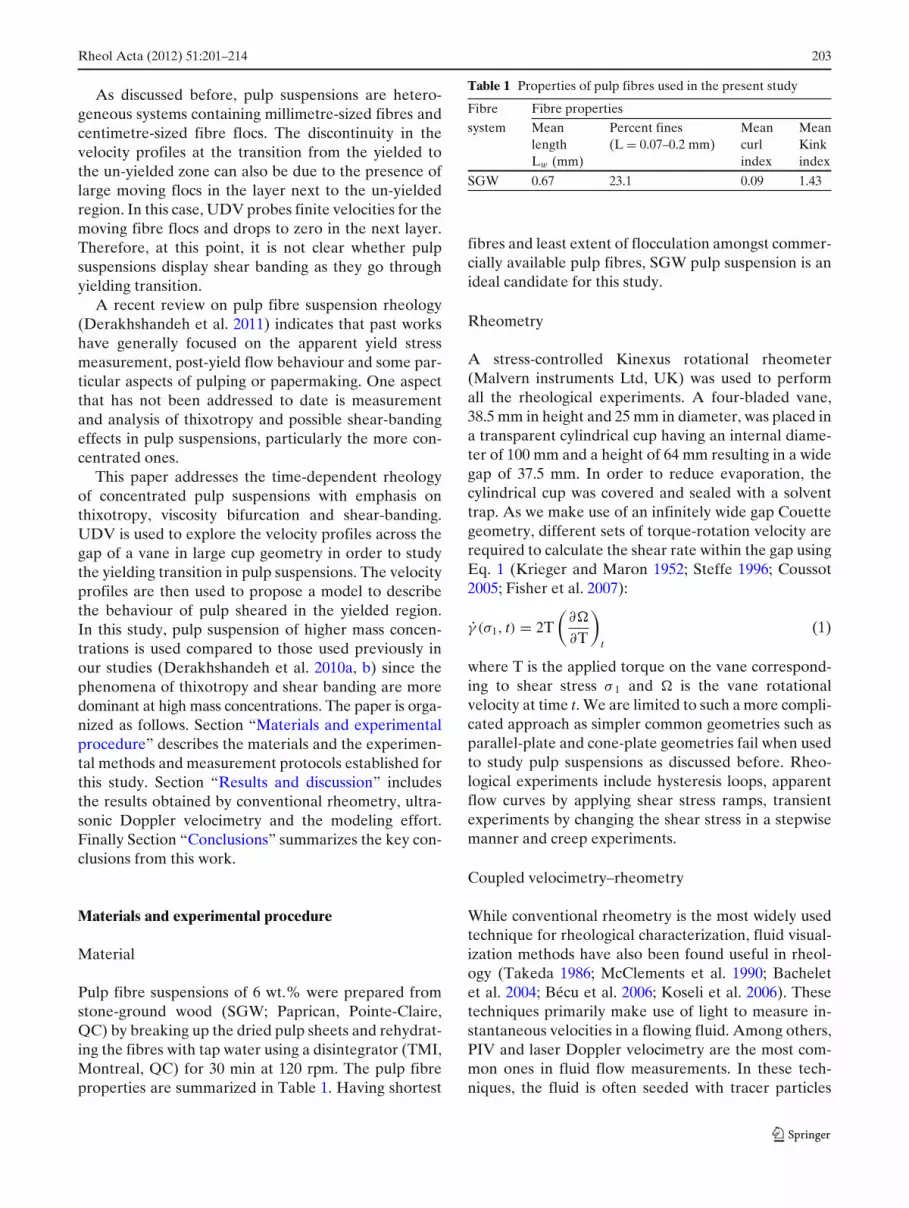
Table 1 Properties of pulp fibres used in the present study
Fibre Fibre properties
system Mean Percent fines Mean Meanlength (L = 0.07–0.2 mm) curl KinkLw (mm) index index
SGW 0.67 23.1 0.09 1.43
fibres and least extent of flocculation amongst commer-cially available pulp fibres, SGW pulp suspension is anideal candidate for this study.
Rheometry
A stress-controlled Kinexus rotational rheometer(Malvern instruments Ltd, UK) was used to performall the rheological experiments. A four-bladed vane,38.5 mm in height and 25 mm in diameter, was placed ina transparent cylindrical cup having an internal diame-ter of 100 mm and a height of 64 mm resulting in a widegap of 37.5 mm. In order to reduce evaporation, thecylindrical cup was covered and sealed with a solventtrap. As we make use of an infinitely wide gap Couettegeometry, different sets of torque-rotation velocity arerequired to calculate the shear rate within the gap usingEq. 1 (Krieger and Maron 1952; Steffe 1996; Coussot2005; Fisher et al. 2007):
γ̇ (σ1, t) = 2T(
∂�
∂T
)t
(1)
where T is the applied torque on the vane correspond-ing to shear stress σ 1 and � is the vane rotationalvelocity at time t. We are limited to such a more compli-cated approach as simpler common geometries such asparallel-plate and cone-plate geometries fail when usedto study pulp suspensions as discussed before. Rheo-logical experiments include hysteresis loops, apparentflow curves by applying shear stress ramps, transientexperiments by changing the shear stress in a stepwisemanner and creep experiments.
Coupled velocimetry–rheometry
While conventional rheometry is the most widely usedtechnique for rheological characterization, fluid visual-ization methods have also been found useful in rheol-ogy (Takeda 1986; McClements et al. 1990; Bacheletet al. 2004; Bécu et al. 2006; Koseli et al. 2006). Thesetechniques primarily make use of light to measure in-stantaneous velocities in a flowing fluid. Among others,PIV and laser Doppler velocimetry are the most com-mon ones in fluid flow measurements. In these tech-niques, the fluid is often seeded with tracer particles
204 Rheol Acta (2012) 51:201–214
which are assumed to follow the fluid flow dynamics.Tracking the motion of the seeded particles, the fluidvelocity can be obtained instantaneously. These twotechniques often require a complicated set-up and asthey utilize laser light to follow the flow field they areexclusively used to study transparent systems. There-fore, in the case of opaque systems such as pulp fibresuspensions other techniques such as UDV should beimplemented.
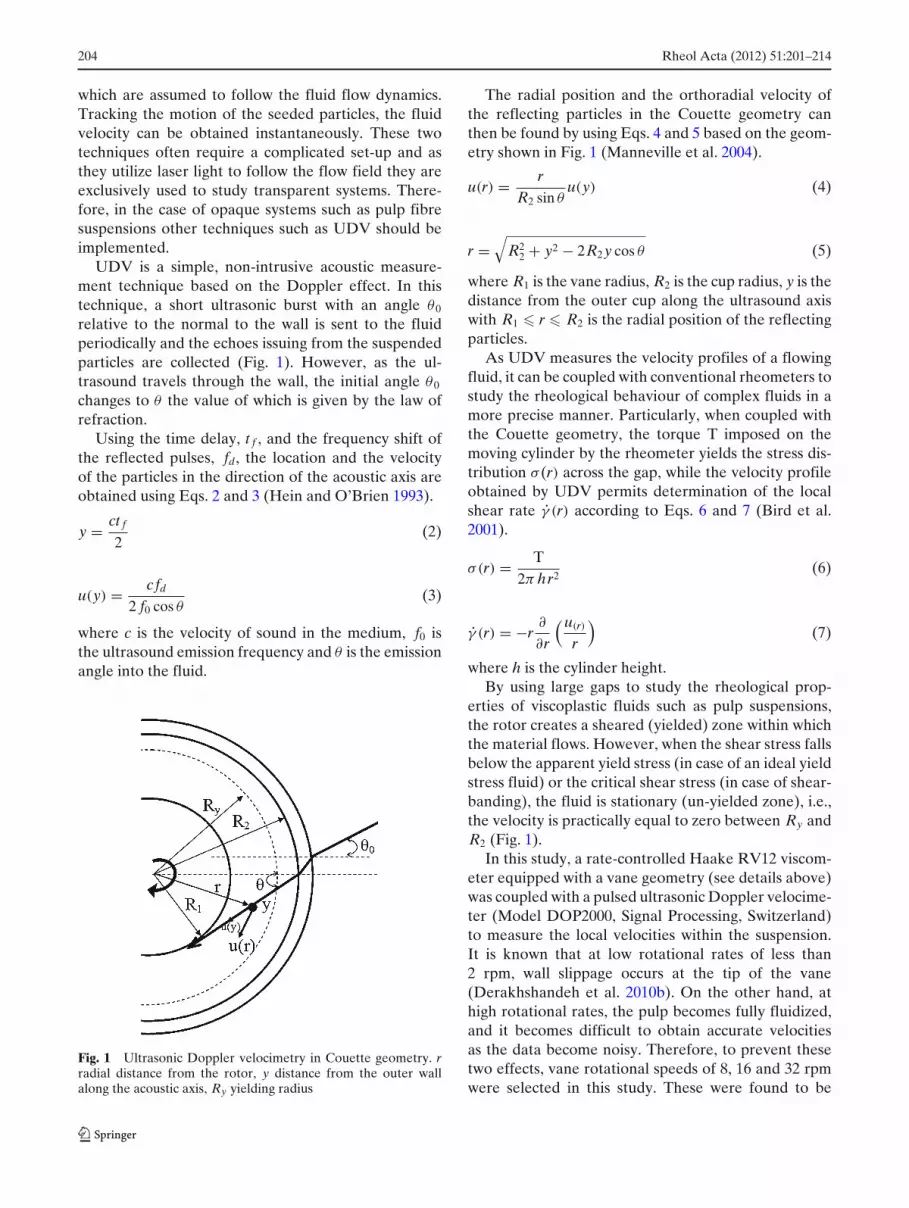
UDV is a simple, non-intrusive acoustic measure-ment technique based on the Doppler effect. In thistechnique, a short ultrasonic burst with an angle θ0
relative to the normal to the wall is sent to the fluidperiodically and the echoes issuing from the suspendedparticles are collected (Fig. 1). However, as the ul-trasound travels through the wall, the initial angle θ0
changes to θ the value of which is given by the law ofrefraction.
Using the time delay, t f , and the frequency shift ofthe reflected pulses, fd, the location and the velocityof the particles in the direction of the acoustic axis areobtained using Eqs. 2 and 3 (Hein and O’Brien 1993).
y = ct f
2(2)
u(y) = cfd
2 f0 cos θ(3)
where c is the velocity of sound in the medium, f0 isthe ultrasound emission frequency and θ is the emissionangle into the fluid.
Fig. 1 Ultrasonic Doppler velocimetry in Couette geometry. rradial distance from the rotor, y distance from the outer wallalong the acoustic axis, Ry yielding radius
The radial position and the orthoradial velocity ofthe reflecting particles in the Couette geometry canthen be found by using Eqs. 4 and 5 based on the geom-etry shown in Fig. 1 (Manneville et al. 2004).
u(r) = rR2 sin θ
u(y) (4)
r =√
R22 + y2 − 2R2 y cos θ (5)
where R1 is the vane radius, R2 is the cup radius, y is thedistance from the outer cup along the ultrasound axiswith R1 � r � R2 is the radial position of the reflectingparticles.
As UDV measures the velocity profiles of a flowingfluid, it can be coupled with conventional rheometers tostudy the rheological behaviour of complex fluids in amore precise manner. Particularly, when coupled withthe Couette geometry, the torque T imposed on themoving cylinder by the rheometer yields the stress dis-tribution σ (r) across the gap, while the velocity profileobtained by UDV permits determination of the localshear rate γ̇ (r) according to Eqs. 6 and 7 (Bird et al.2001).
σ(r) = T2π hr2
(6)
γ̇ (r) = −r∂
∂r
(u(r)
r
)(7)
where h is the cylinder height.By using large gaps to study the rheological prop-
erties of viscoplastic fluids such as pulp suspensions,the rotor creates a sheared (yielded) zone within whichthe material flows. However, when the shear stress fallsbelow the apparent yield stress (in case of an ideal yieldstress fluid) or the critical shear stress (in case of shear-banding), the fluid is stationary (un-yielded zone), i.e.,the velocity is practically equal to zero between Ry andR2 (Fig. 1).
In this study, a rate-controlled Haake RV12 viscom-eter equipped with a vane geometry (see details above)was coupled with a pulsed ultrasonic Doppler velocime-ter (Model DOP2000, Signal Processing, Switzerland)to measure the local velocities within the suspension.It is known that at low rotational rates of less than2 rpm, wall slippage occurs at the tip of the vane(Derakhshandeh et al. 2010b). On the other hand, athigh rotational rates, the pulp becomes fully fluidized,and it becomes difficult to obtain accurate velocitiesas the data become noisy. Therefore, to prevent thesetwo effects, vane rotational speeds of 8, 16 and 32 rpmwere selected in this study. These were found to be
Rheol Acta (2012) 51:201–214 205
appropriate rates based on the signals obtained fromUDV and the rheological response of pulp suspensions.Applying these rotational rates, the velocity profileswere measured in both steady-state and transientconditions.
The ultrasonic transducer has an active diameter of20 mm and a pulse repetition frequency of 100 Hzto 15.6 kHz which can be changed depending on themagnitude of the expected velocity. The number ofmeasuring points was set to 128 in one profile with spa-tial resolution of 0.19–0.25 mm, temporal resolution of45–55 ms/profile and velocity resolution of 0.025 mm/s.A cup, identical to that used in the rheometry, wasmade with an indentation of 14◦ at the surface (θ0 =14◦in Fig. 1) to attach the UDV probe. The space betweenthe transducer and the plexiglass wall was filled with anultrasonic gel to establish an efficient acoustic couplingbetween the probe and the vessel.
The sound speed in the ultrasound gel and pulpsuspension was measured using one of the accessoriesof the UDV instrument by measuring the time thatwas taken by an ultrasound burst to travel over a fixeddistance of 10 mm. The sound velocity was found tobe ∼1,478 m/s in the ultrasound gel and ∼1,495 m/s inthe pulp suspension. This velocity difference alters thesound entrance angle by ∼0.2◦. Therefore, the refrac-tion of the ultrasound beam through the interface wasneglected i.e. θ0 ∼ θ = 14◦ in Fig. 1.
Using Eqs. 6, 7 and a HB constitutive model, Eq. 8,the integral expression of Eq. 9 was derived for the ve-locity profile across the yielded zone:
σ = σy + Kγ̇ n (8)
u(r) = r
Ry∫r
(T
2πhr2 − σy
K
) 1n dr
r(9)
where σ y, K and n are the HB parameters and R1
and Ry are the vane and the yielding radii while R1 �r � Ry. Equation 9 was then solved numerically tofit the obtained experimentally steady-state velocityprofiles.
Results and discussion
Hysteresis loops
A typical experiment to study thixotropy is the hystere-sis loop. In this measurement, the shear stress or shearrate is increased and then decreased continuously orin small steps. A thixotropic material exhibits a hys-
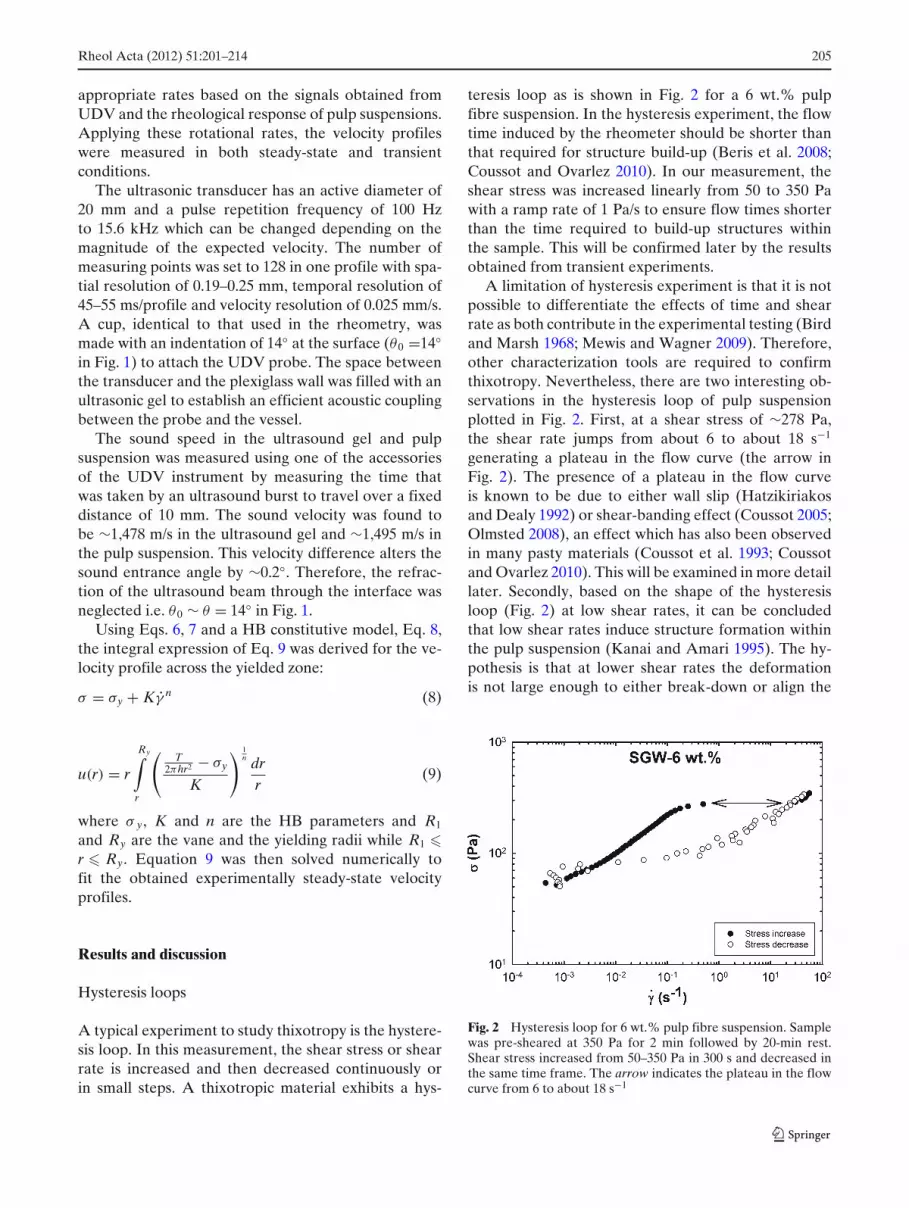
teresis loop as is shown in Fig. 2 for a 6 wt.% pulpfibre suspension. In the hysteresis experiment, the flowtime induced by the rheometer should be shorter thanthat required for structure build-up (Beris et al. 2008;Coussot and Ovarlez 2010). In our measurement, theshear stress was increased linearly from 50 to 350 Pawith a ramp rate of 1 Pa/s to ensure flow times shorterthan the time required to build-up structures withinthe sample. This will be confirmed later by the resultsobtained from transient experiments.
A limitation of hysteresis experiment is that it is notpossible to differentiate the effects of time and shearrate as both contribute in the experimental testing (Birdand Marsh 1968; Mewis and Wagner 2009). Therefore,other characterization tools are required to confirmthixotropy. Nevertheless, there are two interesting ob-servations in the hysteresis loop of pulp suspensionplotted in Fig. 2. First, at a shear stress of ∼278 Pa,the shear rate jumps from about 6 to about 18 s−1
generating a plateau in the flow curve (the arrow inFig. 2). The presence of a plateau in the flow curveis known to be due to either wall slip (Hatzikiriakosand Dealy 1992) or shear-banding effect (Coussot 2005;Olmsted 2008), an effect which has also been observedin many pasty materials (Coussot et al. 1993; Coussotand Ovarlez 2010). This will be examined in more detaillater. Secondly, based on the shape of the hysteresisloop (Fig. 2) at low shear rates, it can be concludedthat low shear rates induce structure formation withinthe pulp suspension (Kanai and Amari 1995). The hy-pothesis is that at lower shear rates the deformationis not large enough to either break-down or align the
Fig. 2 Hysteresis loop for 6 wt.% pulp fibre suspension. Samplewas pre-sheared at 350 Pa for 2 min followed by 20-min rest.Shear stress increased from 50–350 Pa in 300 s and decreased inthe same time frame. The arrow indicates the plateau in the flowcurve from 6 to about 18 s−1
206 Rheol Acta (2012) 51:201–214
fibre domains. Instead, smaller fibre flocs merge to makestructures (domains) of larger dimensions and individualfibres collide to make and/or be incorporated into thefibre flocs. In contrast, at high shear rates, the upwardand downward flow curves overlap as pulp adopts thesame state of structures.
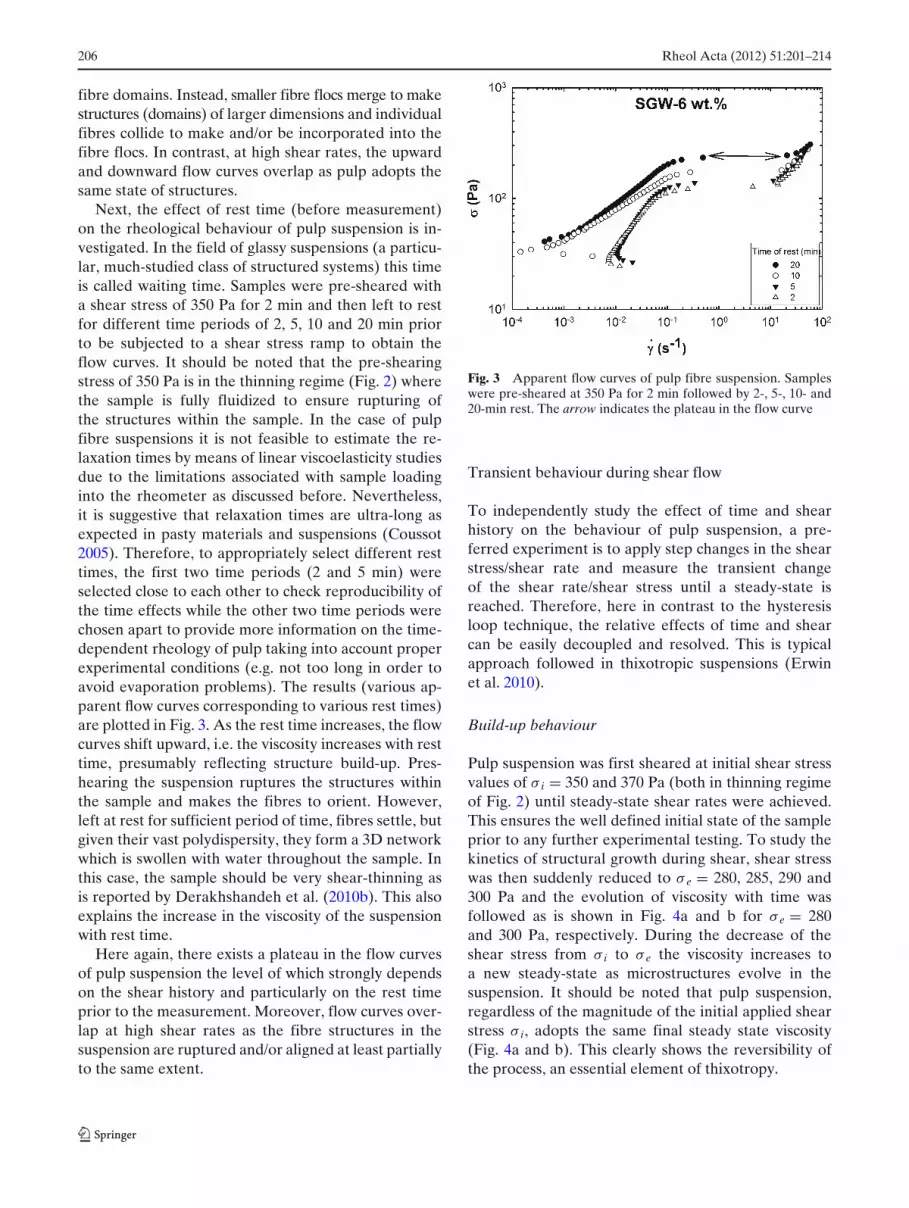
Next, the effect of rest time (before measurement)on the rheological behaviour of pulp suspension is in-vestigated. In the field of glassy suspensions (a particu-lar, much-studied class of structured systems) this timeis called waiting time. Samples were pre-sheared witha shear stress of 350 Pa for 2 min and then left to restfor different time periods of 2, 5, 10 and 20 min priorto be subjected to a shear stress ramp to obtain theflow curves. It should be noted that the pre-shearingstress of 350 Pa is in the thinning regime (Fig. 2) wherethe sample is fully fluidized to ensure rupturing ofthe structures within the sample. In the case of pulpfibre suspensions it is not feasible to estimate the re-laxation times by means of linear viscoelasticity studiesdue to the limitations associated with sample loadinginto the rheometer as discussed before. Nevertheless,it is suggestive that relaxation times are ultra-long asexpected in pasty materials and suspensions (Coussot2005). Therefore, to appropriately select different resttimes, the first two time periods (2 and 5 min) wereselected close to each other to check reproducibility ofthe time effects while the other two time periods werechosen apart to provide more information on the time-dependent rheology of pulp taking into account properexperimental conditions (e.g. not too long in order toavoid evaporation problems). The results (various ap-parent flow curves corresponding to various rest times)are plotted in Fig. 3. As the rest time increases, the flowcurves shift upward, i.e. the viscosity increases with resttime, presumably reflecting structure build-up. Pres-hearing the suspension ruptures the structures withinthe sample and makes the fibres to orient. However,left at rest for sufficient period of time, fibres settle, butgiven their vast polydispersity, they form a 3D networkwhich is swollen with water throughout the sample. Inthis case, the sample should be very shear-thinning asis reported by Derakhshandeh et al. (2010b). This alsoexplains the increase in the viscosity of the suspensionwith rest time.
Here again, there exists a plateau in the flow curvesof pulp suspension the level of which strongly dependson the shear history and particularly on the rest timeprior to the measurement. Moreover, flow curves over-lap at high shear rates as the fibre structures in thesuspension are ruptured and/or aligned at least partiallyto the same extent.
Fig. 3 Apparent flow curves of pulp fibre suspension. Sampleswere pre-sheared at 350 Pa for 2 min followed by 2-, 5-, 10- and20-min rest. The arrow indicates the plateau in the flow curve
Transient behaviour during shear flow
To independently study the effect of time and shearhistory on the behaviour of pulp suspension, a pre-ferred experiment is to apply step changes in the shearstress/shear rate and measure the transient changeof the shear rate/shear stress until a steady-state isreached. Therefore, here in contrast to the hysteresisloop technique, the relative effects of time and shearcan be easily decoupled and resolved. This is typicalapproach followed in thixotropic suspensions (Erwinet al. 2010).
Build-up behaviour
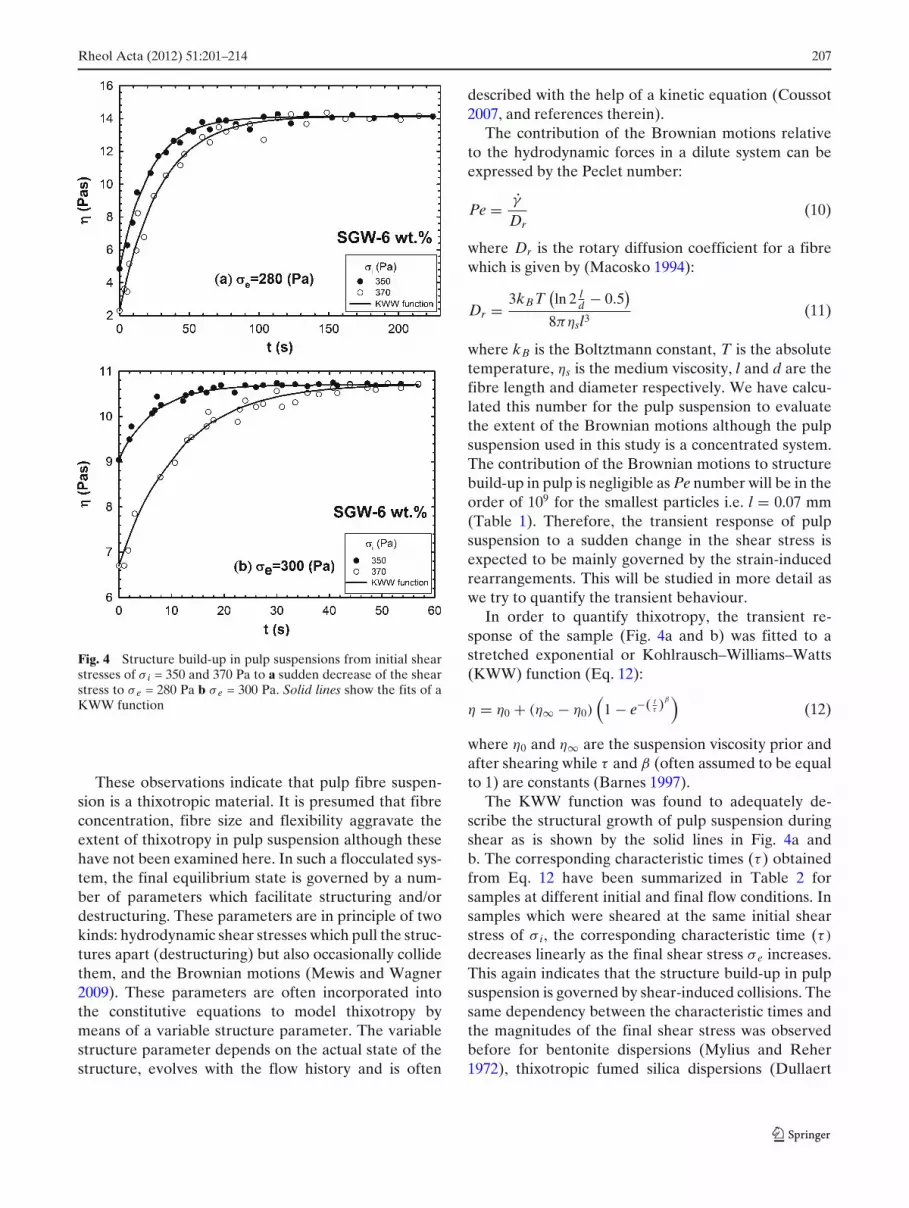
Pulp suspension was first sheared at initial shear stressvalues of σ i = 350 and 370 Pa (both in thinning regimeof Fig. 2) until steady-state shear rates were achieved.This ensures the well defined initial state of the sampleprior to any further experimental testing. To study thekinetics of structural growth during shear, shear stresswas then suddenly reduced to σ e = 280, 285, 290 and300 Pa and the evolution of viscosity with time wasfollowed as is shown in Fig. 4a and b for σ e = 280and 300 Pa, respectively. During the decrease of theshear stress from σ i to σ e the viscosity increases toa new steady-state as microstructures evolve in thesuspension. It should be noted that pulp suspension,regardless of the magnitude of the initial applied shearstress σ i, adopts the same final steady state viscosity(Fig. 4a and b). This clearly shows the reversibility ofthe process, an essential element of thixotropy.
Rheol Acta (2012) 51:201–214 207
Fig. 4 Structure build-up in pulp suspensions from initial shearstresses of σ i = 350 and 370 Pa to a sudden decrease of the shearstress to σ e = 280 Pa b σ e = 300 Pa. Solid lines show the fits of aKWW function
These observations indicate that pulp fibre suspen-sion is a thixotropic material. It is presumed that fibreconcentration, fibre size and flexibility aggravate theextent of thixotropy in pulp suspension although thesehave not been examined here. In such a flocculated sys-tem, the final equilibrium state is governed by a num-ber of parameters which facilitate structuring and/ordestructuring. These parameters are in principle of twokinds: hydrodynamic shear stresses which pull the struc-tures apart (destructuring) but also occasionally collidethem, and the Brownian motions (Mewis and Wagner2009). These parameters are often incorporated intothe constitutive equations to model thixotropy bymeans of a variable structure parameter. The variablestructure parameter depends on the actual state of thestructure, evolves with the flow history and is often
described with the help of a kinetic equation (Coussot2007, and references therein).
The contribution of the Brownian motions relativeto the hydrodynamic forces in a dilute system can beexpressed by the Peclet number:
Pe = γ̇
Dr(10)
where Dr is the rotary diffusion coefficient for a fibrewhich is given by (Macosko 1994):
Dr = 3kBT(ln 2 l
d − 0.5)
8πηsl3(11)
where kB is the Boltztmann constant, T is the absolutetemperature, ηs is the medium viscosity, l and d are thefibre length and diameter respectively. We have calcu-lated this number for the pulp suspension to evaluatethe extent of the Brownian motions although the pulpsuspension used in this study is a concentrated system.The contribution of the Brownian motions to structurebuild-up in pulp is negligible as Pe number will be in theorder of 109 for the smallest particles i.e. l = 0.07 mm(Table 1). Therefore, the transient response of pulpsuspension to a sudden change in the shear stress isexpected to be mainly governed by the strain-inducedrearrangements. This will be studied in more detail aswe try to quantify the transient behaviour.
In order to quantify thixotropy, the transient re-sponse of the sample (Fig. 4a and b) was fitted to astretched exponential or Kohlrausch–Williams–Watts(KWW) function (Eq. 12):
η = η0 + (η∞ − η0)(
1 − e−( tτ )
β)
(12)
where η0 and η∞ are the suspension viscosity prior andafter shearing while τ and β (often assumed to be equalto 1) are constants (Barnes 1997).
The KWW function was found to adequately de-scribe the structural growth of pulp suspension duringshear as is shown by the solid lines in Fig. 4a andb. The corresponding characteristic times (τ ) obtainedfrom Eq. 12 have been summarized in Table 2 forsamples at different initial and final flow conditions. Insamples which were sheared at the same initial shearstress of σ i, the corresponding characteristic time (τ)
decreases linearly as the final shear stress σ e increases.This again indicates that the structure build-up in pulpsuspension is governed by shear-induced collisions. Thesame dependency between the characteristic times andthe magnitudes of the final shear stress was observedbefore for bentonite dispersions (Mylius and Reher1972), thixotropic fumed silica dispersions (Dullaert
208 Rheol Acta (2012) 51:201–214
Table 2 Thixotropic time constants for build-up
Build-up
Initial shear stress, Initial shear stress,σi = 350 (Pa) σi = 370 (Pa)
Final shear Thixotropic Final shear, Thixotropicstress, σe (Pa) time constant, stress, σe (Pa) time constant,
τ (s) τ (s)
280 21.6 280 28.8285 19.8 285 23.7290 12.0 290 17.4300 5.8 300 11.4
and Mewis 2005) and layered-silicate montmorillonitesuspensions (Mobuchon et al. 2007). It should be notedthat the stretching exponent β in Eq. 12 was inde-pendent of the flow history and remained constantclose to 1 for all measurements. In other words thestructure build-up in pulp fibre suspensions is a singleexponential process and can be characterized by onecharacteristic time. This indicates that pulp fibre flocshave a narrow size distribution in the suspension.
Figure 4a and b and Table 2 show that pulps whichwere initially sheared at a lower shear stress of σ i =350 Pa evolve faster with shorter characteristic timescompared with those sheared at σ i = 370 Pa. Suspen-sions pre-sheared at lower shear stress include moredeveloped structures and thus respond faster during thestructure growth process. Next we study the structurebreakdown in pulp suspensions.
Structure breakdown
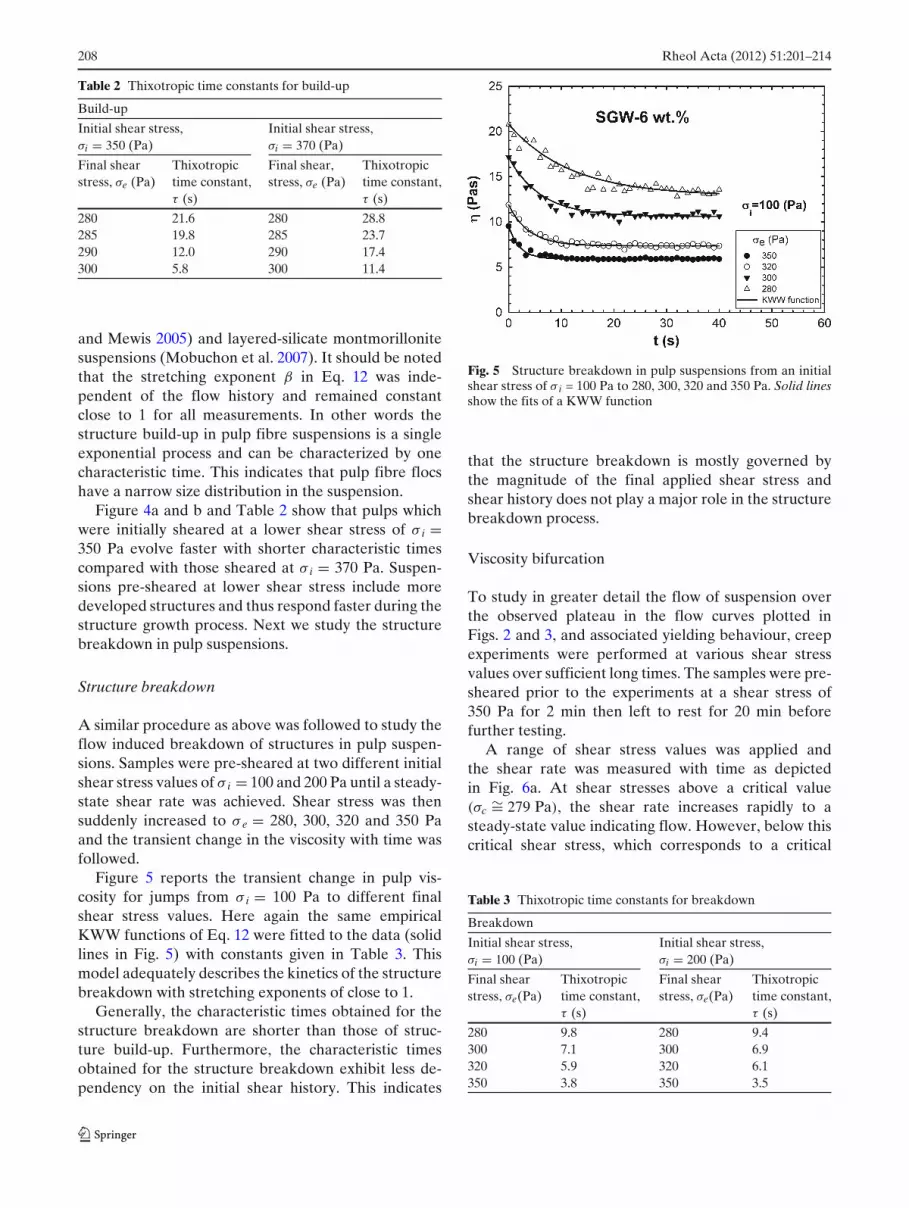
A similar procedure as above was followed to study theflow induced breakdown of structures in pulp suspen-sions. Samples were pre-sheared at two different initialshear stress values of σ i = 100 and 200 Pa until a steady-state shear rate was achieved. Shear stress was thensuddenly increased to σ e = 280, 300, 320 and 350 Paand the transient change in the viscosity with time wasfollowed.
Figure 5 reports the transient change in pulp vis-cosity for jumps from σ i = 100 Pa to different finalshear stress values. Here again the same empiricalKWW functions of Eq. 12 were fitted to the data (solidlines in Fig. 5) with constants given in Table 3. Thismodel adequately describes the kinetics of the structurebreakdown with stretching exponents of close to 1.
Generally, the characteristic times obtained for thestructure breakdown are shorter than those of struc-ture build-up. Furthermore, the characteristic timesobtained for the structure breakdown exhibit less de-pendency on the initial shear history. This indicates
Fig. 5 Structure breakdown in pulp suspensions from an initialshear stress of σ i = 100 Pa to 280, 300, 320 and 350 Pa. Solid linesshow the fits of a KWW function
that the structure breakdown is mostly governed bythe magnitude of the final applied shear stress andshear history does not play a major role in the structurebreakdown process.
Viscosity bifurcation
To study in greater detail the flow of suspension overthe observed plateau in the flow curves plotted inFigs. 2 and 3, and associated yielding behaviour, creepexperiments were performed at various shear stressvalues over sufficient long times. The samples were pre-sheared prior to the experiments at a shear stress of350 Pa for 2 min then left to rest for 20 min beforefurther testing.
A range of shear stress values was applied andthe shear rate was measured with time as depictedin Fig. 6a. At shear stresses above a critical value(σc
∼= 279 Pa), the shear rate increases rapidly to asteady-state value indicating flow. However, below thiscritical shear stress, which corresponds to a critical
Table 3 Thixotropic time constants for breakdown
Breakdown
Initial shear stress, Initial shear stress,σi = 100 (Pa) σi = 200 (Pa)
Final shear Thixotropic Final shear Thixotropicstress, σe(Pa) time constant, stress, σe(Pa) time constant,
τ (s) τ (s)
280 9.8 280 9.4300 7.1 300 6.9320 5.9 320 6.1350 3.8 350 3.5
Rheol Acta (2012) 51:201–214 209
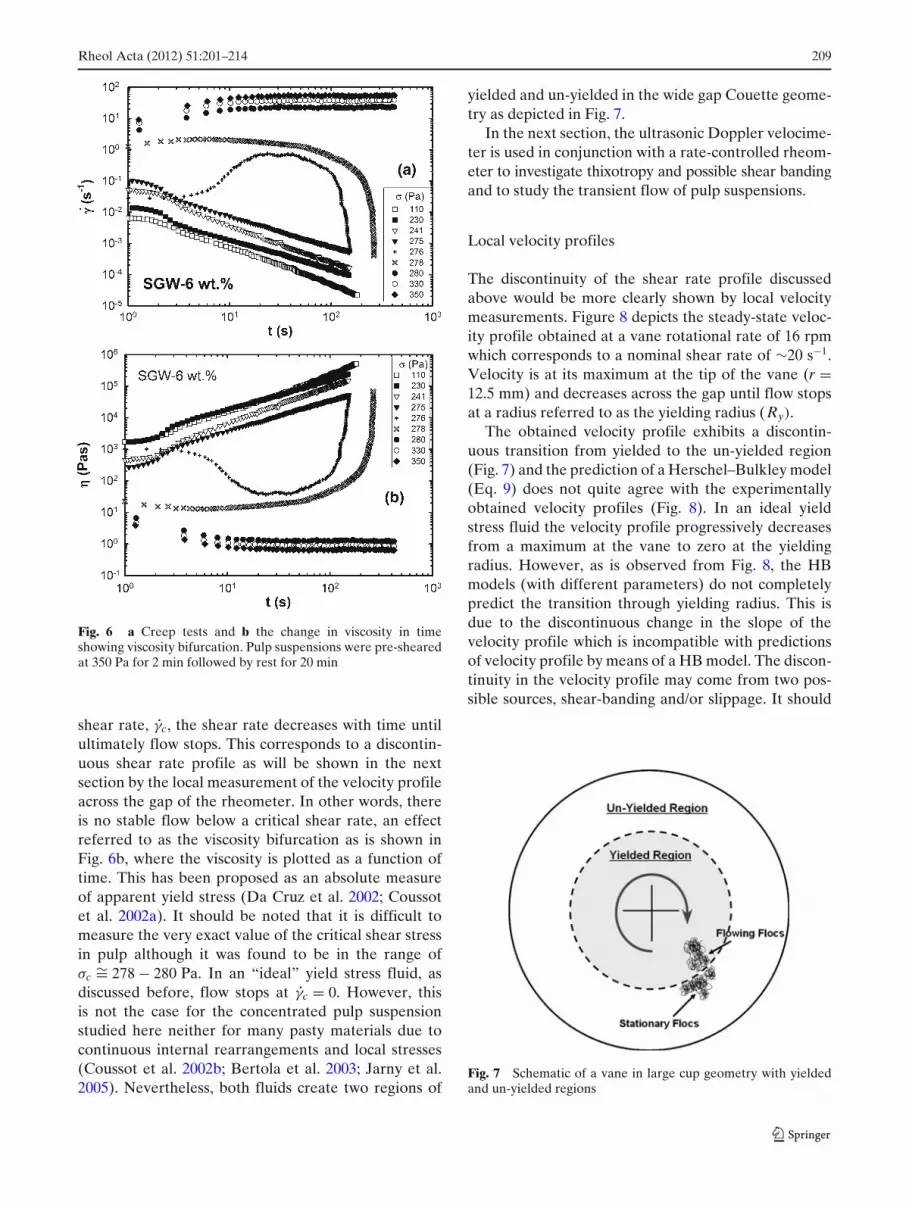
Fig. 6 a Creep tests and b the change in viscosity in timeshowing viscosity bifurcation. Pulp suspensions were pre-shearedat 350 Pa for 2 min followed by rest for 20 min
shear rate, γ̇c, the shear rate decreases with time untilultimately flow stops. This corresponds to a discontin-uous shear rate profile as will be shown in the nextsection by the local measurement of the velocity profileacross the gap of the rheometer. In other words, thereis no stable flow below a critical shear rate, an effectreferred to as the viscosity bifurcation as is shown inFig. 6b, where the viscosity is plotted as a function oftime. This has been proposed as an absolute measureof apparent yield stress (Da Cruz et al. 2002; Coussotet al. 2002a). It should be noted that it is difficult tomeasure the very exact value of the critical shear stressin pulp although it was found to be in the range ofσc
∼= 278 − 280 Pa. In an “ideal” yield stress fluid, asdiscussed before, flow stops at γ̇c = 0. However, thisis not the case for the concentrated pulp suspensionstudied here neither for many pasty materials due tocontinuous internal rearrangements and local stresses(Coussot et al. 2002b; Bertola et al. 2003; Jarny et al.2005). Nevertheless, both fluids create two regions of
yielded and un-yielded in the wide gap Couette geome-try as depicted in Fig. 7.
In the next section, the ultrasonic Doppler velocime-ter is used in conjunction with a rate-controlled rheom-eter to investigate thixotropy and possible shear bandingand to study the transient flow of pulp suspensions.
Local velocity profiles
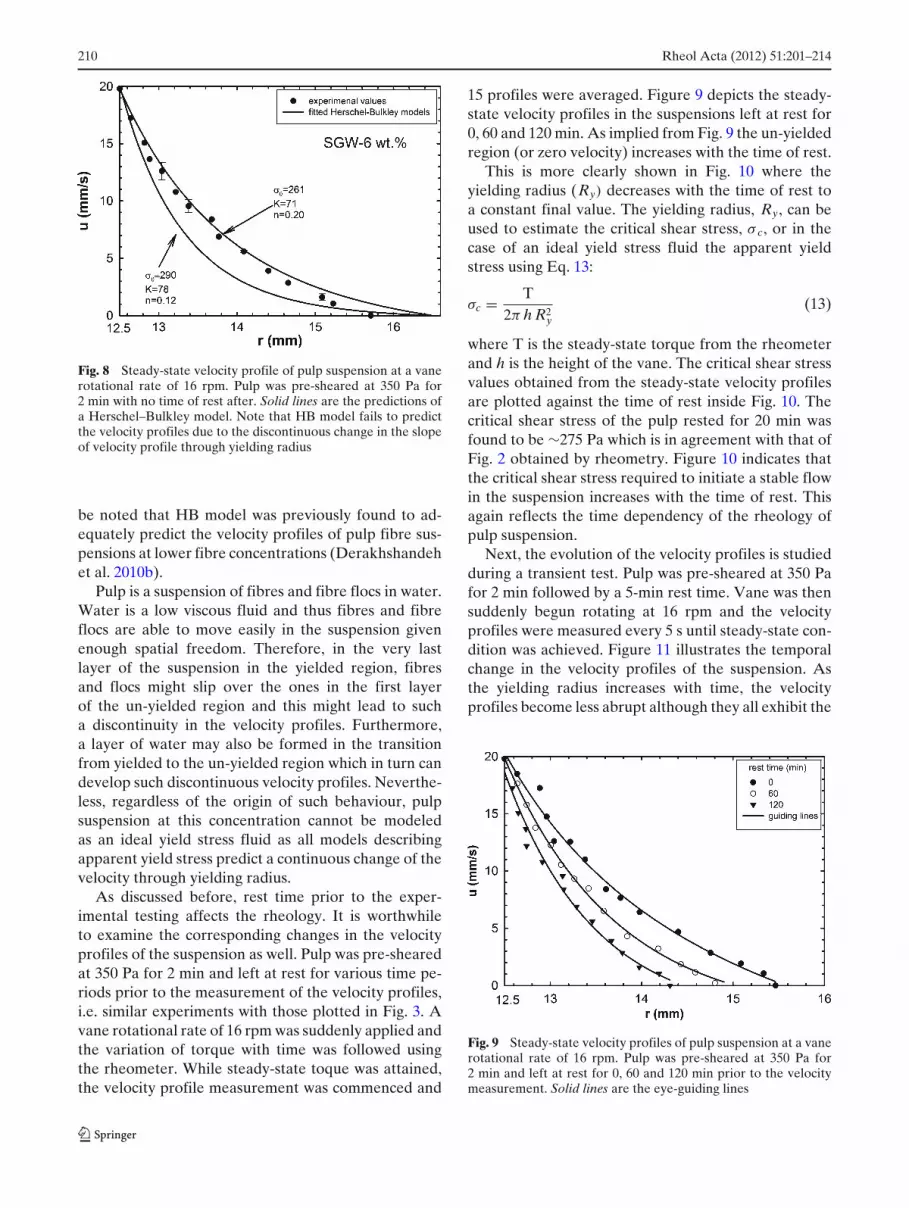
The discontinuity of the shear rate profile discussedabove would be more clearly shown by local velocitymeasurements. Figure 8 depicts the steady-state veloc-ity profile obtained at a vane rotational rate of 16 rpmwhich corresponds to a nominal shear rate of ∼20 s−1.Velocity is at its maximum at the tip of the vane (r =12.5 mm) and decreases across the gap until flow stopsat a radius referred to as the yielding radius (Ry).
The obtained velocity profile exhibits a discontin-uous transition from yielded to the un-yielded region(Fig. 7) and the prediction of a Herschel–Bulkley model(Eq. 9) does not quite agree with the experimentallyobtained velocity profiles (Fig. 8). In an ideal yieldstress fluid the velocity profile progressively decreasesfrom a maximum at the vane to zero at the yieldingradius. However, as is observed from Fig. 8, the HBmodels (with different parameters) do not completelypredict the transition through yielding radius. This isdue to the discontinuous change in the slope of thevelocity profile which is incompatible with predictionsof velocity profile by means of a HB model. The discon-tinuity in the velocity profile may come from two pos-sible sources, shear-banding and/or slippage. It should
Fig. 7 Schematic of a vane in large cup geometry with yieldedand un-yielded regions
210 Rheol Acta (2012) 51:201–214
Fig. 8 Steady-state velocity profile of pulp suspension at a vanerotational rate of 16 rpm. Pulp was pre-sheared at 350 Pa for2 min with no time of rest after. Solid lines are the predictions ofa Herschel–Bulkley model. Note that HB model fails to predictthe velocity profiles due to the discontinuous change in the slopeof velocity profile through yielding radius
be noted that HB model was previously found to ad-equately predict the velocity profiles of pulp fibre sus-pensions at lower fibre concentrations (Derakhshandehet al. 2010b).
Pulp is a suspension of fibres and fibre flocs in water.Water is a low viscous fluid and thus fibres and fibreflocs are able to move easily in the suspension givenenough spatial freedom. Therefore, in the very lastlayer of the suspension in the yielded region, fibresand flocs might slip over the ones in the first layerof the un-yielded region and this might lead to sucha discontinuity in the velocity profiles. Furthermore,a layer of water may also be formed in the transitionfrom yielded to the un-yielded region which in turn candevelop such discontinuous velocity profiles. Neverthe-less, regardless of the origin of such behaviour, pulpsuspension at this concentration cannot be modeledas an ideal yield stress fluid as all models describingapparent yield stress predict a continuous change of thevelocity through yielding radius.
As discussed before, rest time prior to the exper-imental testing affects the rheology. It is worthwhileto examine the corresponding changes in the velocityprofiles of the suspension as well. Pulp was pre-shearedat 350 Pa for 2 min and left at rest for various time pe-riods prior to the measurement of the velocity profiles,i.e. similar experiments with those plotted in Fig. 3. Avane rotational rate of 16 rpm was suddenly applied andthe variation of torque with time was followed usingthe rheometer. While steady-state toque was attained,the velocity profile measurement was commenced and
15 profiles were averaged. Figure 9 depicts the steady-state velocity profiles in the suspensions left at rest for0, 60 and 120 min. As implied from Fig. 9 the un-yieldedregion (or zero velocity) increases with the time of rest.
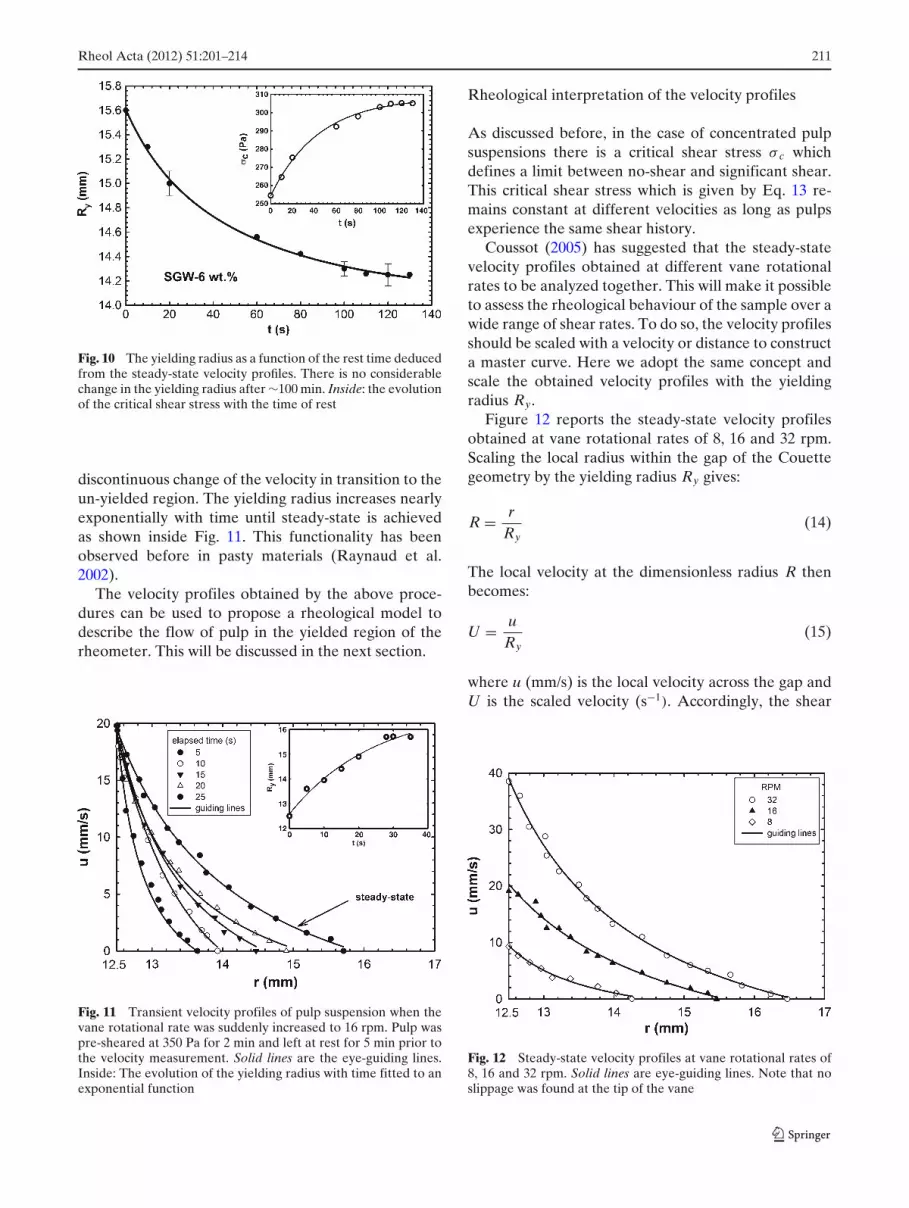
This is more clearly shown in Fig. 10 where theyielding radius (Ry) decreases with the time of rest toa constant final value. The yielding radius, Ry, can beused to estimate the critical shear stress, σ c, or in thecase of an ideal yield stress fluid the apparent yieldstress using Eq. 13:
σc = T2π h R2
y(13)
where T is the steady-state torque from the rheometerand h is the height of the vane. The critical shear stressvalues obtained from the steady-state velocity profilesare plotted against the time of rest inside Fig. 10. Thecritical shear stress of the pulp rested for 20 min wasfound to be ∼275 Pa which is in agreement with that ofFig. 2 obtained by rheometry. Figure 10 indicates thatthe critical shear stress required to initiate a stable flowin the suspension increases with the time of rest. Thisagain reflects the time dependency of the rheology ofpulp suspension.
Next, the evolution of the velocity profiles is studiedduring a transient test. Pulp was pre-sheared at 350 Pafor 2 min followed by a 5-min rest time. Vane was thensuddenly begun rotating at 16 rpm and the velocityprofiles were measured every 5 s until steady-state con-dition was achieved. Figure 11 illustrates the temporalchange in the velocity profiles of the suspension. Asthe yielding radius increases with time, the velocityprofiles become less abrupt although they all exhibit the
Fig. 9 Steady-state velocity profiles of pulp suspension at a vanerotational rate of 16 rpm. Pulp was pre-sheared at 350 Pa for2 min and left at rest for 0, 60 and 120 min prior to the velocitymeasurement. Solid lines are the eye-guiding lines
Rheol Acta (2012) 51:201–214 211
Fig. 10 The yielding radius as a function of the rest time deducedfrom the steady-state velocity profiles. There is no considerablechange in the yielding radius after ∼100 min. Inside: the evolutionof the critical shear stress with the time of rest
discontinuous change of the velocity in transition to theun-yielded region. The yielding radius increases nearlyexponentially with time until steady-state is achievedas shown inside Fig. 11. This functionality has beenobserved before in pasty materials (Raynaud et al.2002).
The velocity profiles obtained by the above proce-dures can be used to propose a rheological model todescribe the flow of pulp in the yielded region of therheometer. This will be discussed in the next section.
Fig. 11 Transient velocity profiles of pulp suspension when thevane rotational rate was suddenly increased to 16 rpm. Pulp waspre-sheared at 350 Pa for 2 min and left at rest for 5 min prior tothe velocity measurement. Solid lines are the eye-guiding lines.Inside: The evolution of the yielding radius with time fitted to anexponential function
Rheological interpretation of the velocity profiles
As discussed before, in the case of concentrated pulpsuspensions there is a critical shear stress σ c whichdefines a limit between no-shear and significant shear.This critical shear stress which is given by Eq. 13 re-mains constant at different velocities as long as pulpsexperience the same shear history.
Coussot (2005) has suggested that the steady-statevelocity profiles obtained at different vane rotationalrates to be analyzed together. This will make it possibleto assess the rheological behaviour of the sample over awide range of shear rates. To do so, the velocity profilesshould be scaled with a velocity or distance to constructa master curve. Here we adopt the same concept andscale the obtained velocity profiles with the yieldingradius Ry.
Figure 12 reports the steady-state velocity profilesobtained at vane rotational rates of 8, 16 and 32 rpm.Scaling the local radius within the gap of the Couettegeometry by the yielding radius Ry gives:
R = rRy
(14)
The local velocity at the dimensionless radius R thenbecomes:
U = uRy
(15)
where u (mm/s) is the local velocity across the gap andU is the scaled velocity (s−1). Accordingly, the shear
Fig. 12 Steady-state velocity profiles at vane rotational rates of8, 16 and 32 rpm. Solid lines are eye-guiding lines. Note that noslippage was found at the tip of the vane
212 Rheol Acta (2012) 51:201–214
rate and the shear stress distributions across the gap ofthe Couette geometry become:
γ̇ (R) =∣∣∣∣∣∣R
∂(
U/R
)∂ R
∣∣∣∣∣∣ (16)
σ(r) = σc
(Ry
r
)2
= σc
R2= σ(R) (17)
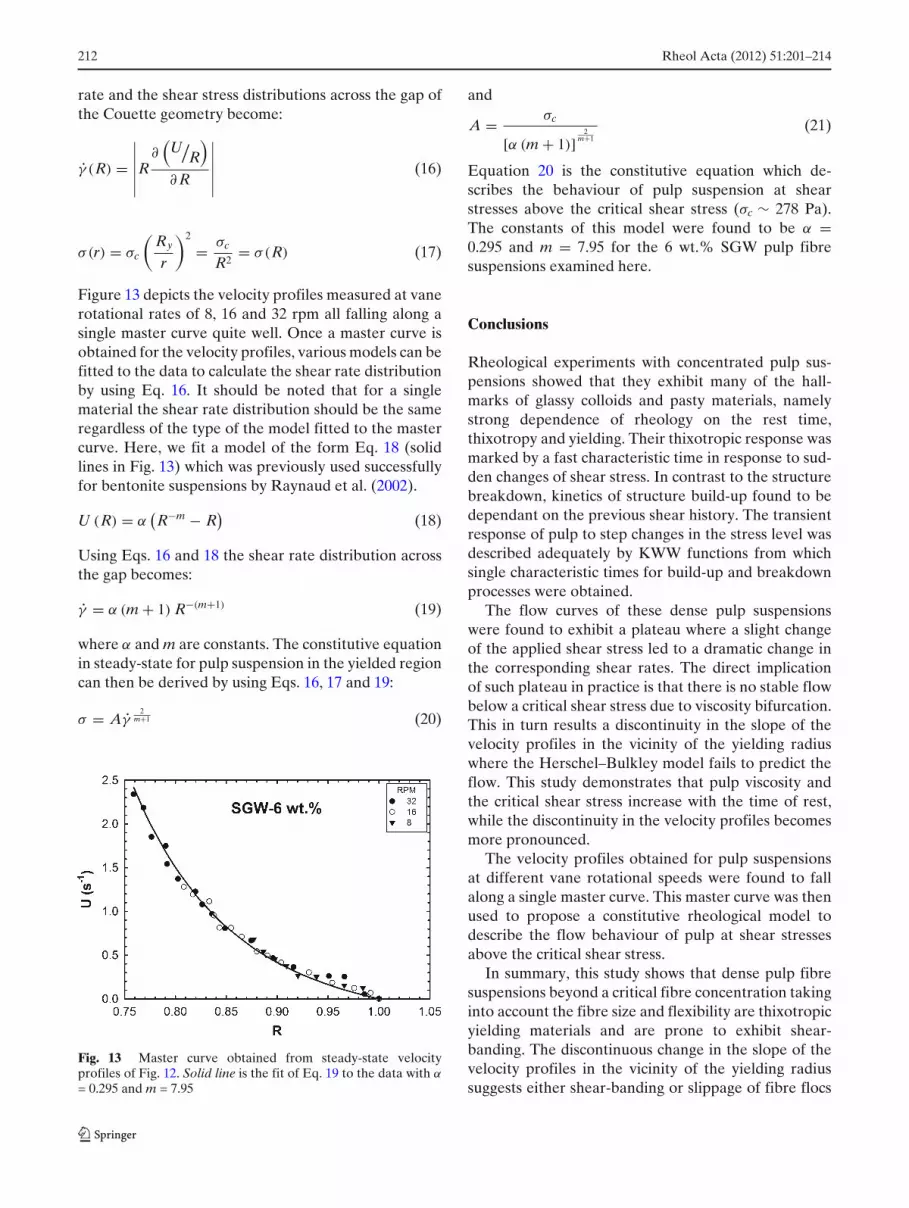
Figure 13 depicts the velocity profiles measured at vanerotational rates of 8, 16 and 32 rpm all falling along asingle master curve quite well. Once a master curve isobtained for the velocity profiles, various models can befitted to the data to calculate the shear rate distributionby using Eq. 16. It should be noted that for a singlematerial the shear rate distribution should be the sameregardless of the type of the model fitted to the mastercurve. Here, we fit a model of the form Eq. 18 (solidlines in Fig. 13) which was previously used successfullyfor bentonite suspensions by Raynaud et al. (2002).
U (R) = α(R−m − R
)(18)
Using Eqs. 16 and 18 the shear rate distribution acrossthe gap becomes:
γ̇ = α (m + 1) R−(m+1) (19)
where α and m are constants. The constitutive equationin steady-state for pulp suspension in the yielded regioncan then be derived by using Eqs. 16, 17 and 19:
σ = Aγ̇2
m+1 (20)
Fig. 13 Master curve obtained from steady-state velocityprofiles of Fig. 12. Solid line is the fit of Eq. 19 to the data with α
= 0.295 and m = 7.95
and
A = σc
[α (m + 1)]2
m+1
(21)
Equation 20 is the constitutive equation which de-scribes the behaviour of pulp suspension at shearstresses above the critical shear stress (σc ∼ 278 Pa).The constants of this model were found to be α =0.295 and m = 7.95 for the 6 wt.% SGW pulp fibresuspensions examined here.
Conclusions
Rheological experiments with concentrated pulp sus-pensions showed that they exhibit many of the hall-marks of glassy colloids and pasty materials, namelystrong dependence of rheology on the rest time,thixotropy and yielding. Their thixotropic response wasmarked by a fast characteristic time in response to sud-den changes of shear stress. In contrast to the structurebreakdown, kinetics of structure build-up found to bedependant on the previous shear history. The transientresponse of pulp to step changes in the stress level wasdescribed adequately by KWW functions from whichsingle characteristic times for build-up and breakdownprocesses were obtained.
The flow curves of these dense pulp suspensionswere found to exhibit a plateau where a slight changeof the applied shear stress led to a dramatic change inthe corresponding shear rates. The direct implicationof such plateau in practice is that there is no stable flowbelow a critical shear stress due to viscosity bifurcation.This in turn results a discontinuity in the slope of thevelocity profiles in the vicinity of the yielding radiuswhere the Herschel–Bulkley model fails to predict theflow. This study demonstrates that pulp viscosity andthe critical shear stress increase with the time of rest,while the discontinuity in the velocity profiles becomesmore pronounced.
The velocity profiles obtained for pulp suspensionsat different vane rotational speeds were found to fallalong a single master curve. This master curve was thenused to propose a constitutive rheological model todescribe the flow behaviour of pulp at shear stressesabove the critical shear stress.
In summary, this study shows that dense pulp fibresuspensions beyond a critical fibre concentration takinginto account the fibre size and flexibility are thixotropicyielding materials and are prone to exhibit shear-banding. The discontinuous change in the slope of thevelocity profiles in the vicinity of the yielding radiussuggests either shear-banding or slippage of fibre flocs
Rheol Acta (2012) 51:201–214 213
over each other. These must be distinguished in thefuture in order to obtain a clear picture and developdesign criteria for the processing of these systems.
Nomenclature
A Constantm Constantc Sound velocity in the medium, mmfd Frequency shift of the reflected ultrasound
pulses, Hzf0 Ultrasound emission frequency, Hzh Vane height, mmR Dimensionless radiusR1 Vane radius, mmR2 Cup radius, mmRy Yielding radius, mmr Local radius within the cup, mmT Torque, N.mCv Volume fractionu(y) Velocity in the direction of acoustic axis, mm/su(r) Velocity in the orthoradial direction, mm/sU Scaled velocity, s−1
t Time, st f Time delay of the reflected ultrasound pulses, sy Distance of fibres from the outer wall in couette
geometry, mmK HB consistency indexn HB power-law indexDr Particle rotary diffusion, s−1
kB Boltzmann constant, m2Kg s−2 K−1
T Absolute temperature, Kd Particle diameter, m
Greek letters
α Constantβ Constantσ (r) Shear stress, Paσ i Pre-shear stress, Paσ e Final shear stress in the step-wise experiments,
Paσ c Critical shear stress, Paσ y Apparent yield stress, Paγ̇ Shear rate, s−1
θ Emission angle into the fluidηs Medium viscosity, Pasη0 Suspension viscosity prior shearing, Pasη∞ Suspension viscosity after shearing, Pasτ Structure build-up/breakdown time constant, s
Acknowledgements The authors would like to acknowledgeNSERC for the collaborative grant (CRDPJ 379851). The paperis dedicated to the late Prof. Chad Bennington, a colleague,collaborator and friend.
References
Bachelet C, Dantan Ph, Flaud P (2004) Indirect on-line determi-nation of the rheological behavior of a power law fluid basedon numerical flow simulations. Eur Phys J Appl Phys 25:209–217
Barnes HA (1997) Thixotropy-a review. J Non-Newton FluidMech 70:1–33
Baudez J, Rodts S, Chateau X, Coussot P (2004) New techniquefor reconstructing instantaneous profiles from viscometrictests: Application to pasty materials. J Rheol 48:69–82
Bécu L, Manneville S, Colin A (2006) Yielding and flow in ad-hesive and non-adhesive concentrated emulsions. Phys RevLett 96:138302
Beris AN, Stiakakis E, Vlassopoulos D (2008) A thermodynam-ically consistent model for the thixotropic behaviour of con-centrated star polymer suspensions. J Non-Newton FluidMech 152:76–85
Bertola V, Bertrand F, Tabuteau H, Bonn D, Coussot P (2003)Wall slip and yielding in pasty materials. J Rheol 1211:47–61
Bird RB, Marsh BD (1968) Viscoelastic Hysteresis. I. Modelpredictions. Trans Soc Rheol 12:479–488
Bird RB, Stewart WE, Lightfoot EN (2001) Transport Phenom-ena, 2nd edn. Wiley, Chichester
Bonn D, Denn MM (2009) Yield stress f luids slowly yield toanalysis. Science 324:1401–1402
Bonn D, Coussot P, Huynh HT, Bertrand F, Debrégeas G (2002)Rheology of soft-glassy materials. Europhys Lett 59:786–792
Bonnecaze RT, Cloitre M (2010) Micromechanics of soft particleglasses. Adv Polym Sci 236:117–161
Callaghan PT (2008) Rheo NMR and shear banding. Rheol Acta47:243–255
Cates ME, Fielding SM (2006) Rheology of giant micelles. AdvPhys 55(7–8):799–879
Cloitre M (2009) Yielding, flow and slip in microgel suspensions:from microstructure to macroscopic rheology. In: De LasNieves, A, Weitz DA, Matteson H, Wyss H (eds) Microgels:Fundamentals and Applications. Springer, New York
Coussot P (2005) Rheometry of pastes, suspensions and granularmaterials. Wiley, Chichester, Chapter 3:116
Coussot P (2007) Rheophysics of pastes: a review of microscopicmodelling approaches. Soft Matter 3:528–540
Coussot P, Ovarlez G (2010) Physical origin of shear-banding injammed systems. Eur Phys J 33(3):183–188
Coussot P, Leonov AI, Piau JM (1993) Rheology of concentrateddispersed systems in low molecular weight matrix. J Non-Newton Fluid Mech 46:179–217
Coussot P, Raynaud JS, Bertrand F, Moucheront P, Guilbaud JP,Huynh HT, Jarny S, Lesueur D (2002a) Coexistence of liquidand solid phases in flowing soft-glassy materials. Phys RevLett 88(21):218301–1
Coussot P, Nguyen QD, Huynh HT, Bonn D (2002b) Avalanchebehavior in yield stress fluids. Phys Rev Lett 88:175501
Da Cruz F, Chevoir F, Bonn D, Coussot P (2002) Viscosity bifur-cation in granular materials, foams, and emulsions. Phys RevE 66(5):051305
Derakhshandeh B, Hatzikiriakos SG, Bennington CPJ (2010a)The apparent yield stress of pulp fibre suspensions. J Rheol-ogy 54(5):1137–1154
214 Rheol Acta (2012) 51:201–214
Derakhshandeh B, Hatzikiriakos SG, Bennington CPJ (2010b)Rheology of pulp fibre suspensions using ultrasonic Dopplervelocimetry. Rheol Acta 49(11–12):1127–1140
Derakhshandeh B, Kerekes RJ, Hatzikiriakos SG, BenningtonCPJ (2011) Rheology of pulp fibre suspensions: A criticalreview. Chem Eng Sci 66(15):3460–3470
Dhont JKG, Briels WJ (2008) Gradient and vorticity banding.Rheol Acta 47:257–281
Dullaert K, Mewis J (2005) Thixotropy:Build-up and breakdowncurves during flow. J Rheol 49(6):1213–1231
Erwin BM, Vlassopoulos D, Cloitre M (2010) Rheologicalfingerprinting of an aging soft colloidal glass. J Rheol54(4):915–939
Fisher DT, Clayton SA, Boger DV, Scales PJ (2007) The bucketrheometer for shear stress-shear rate measurement of indus-trial suspensions. J Rheol 51(5):821–831
Hatzikiriakos SG, Dealy JM (1992) Role of slip and fracture inthe oscillating flow of HDPE in a capillary. J Rheol 36:845–884
Hein IA, O’Brien WD (1993) Current time-domain methods forassessing tissue motion by analysis from reflected ultrasoundechoes—A review. IEEE Trans Ultrason, Ferroelect, FreqControl 40:84–102
Jarny S, Roussel N, Rodts S, Le Roy R, Coussot P (2005) Rhe-ological behavior of cement pastes from MRI velocimetry.Concrete Cement Res 35:1873–1881
Kanai H, Amari T (1995) Negative thixotropy in ferric-oxidesuspensions. Rheol Acta 34:303–310
Kerekes RJ (2006) Rheology of fibre suspensions in papermak-ing: an overview of recent research. Nord Pulp Pap Res J21(5):598–612
Kerekes RJ, Soszynski RM, Doo PAT (1985) The flocculationof pulp fibres,” 8th Fundamental Research Symposium, Me-chanical Engineering Publications, Oxford, England:265–310
Koseli V, Zeybek S, Uludag Y (2006) Online viscosity mea-surement of complex solutions using ultrasound doppler ve-locimetry. Turk J Chem 30:297–305
Krieger IM, Maron SH (1952) Direct determination of the flowcurves of non-Newtonian fluids. J Appl Phys 23:147–149
Macosko CHW (1994) Rheology: principles, measurements, andapplications. Wiley, Chichester
Mas R, Magnin A (1994) Rheology of colloidal suspensions: caseof lubricating greases. J Rheol 38:889–908
Manneville S (2008) Recent experimental probes of shear band-ing. Rheol Acta 47(3):301–318
Manneville S, Bécu L, Colin A (2004) High-frequency ultrasonicspeckle velocimetry in sheared complex fluids. Eur Phys JAppl Phys 28:361–373
McClements DJ, Povery MJW, Jury M (1990) Ultrasonic Char-acterization of a Food Emulsion. Ultrasonics 28:266–272
Meeker SP, Bonnecaze RT, Cloitre M (2004a) Slip and flow insoft particle pastes. Phys Rev Lett 92(19):198302
Meeker SP, Bonnecaze RT, Cloitre M (2004b) Slip and flow inpastes of soft particles: Direct observation and rheology. JRheol 48(6):1295–1320
Mewis J (1979) Thixotropy—A general review. J Non-NewtonFluid Mech 6:1–20
Mewis J, Wagner NJ (2009) Thixotropy. Adv Colloid Interf Sci147–148:214–227
Mobuchon C, Carreau PJ, Heuzey M-C (2007) Effect of flow his-tory on the structure of a non-polar polymer/clay nanocom-posite model system. Rheol Acta 46(8):1045–1056
Mylius E, Reher E (1972) Modelluntersuchungen zur Charak-terisierung Thixotroper Medien un ihre Anwendung fürVerfahrenstechnische Prozessberechnungen. Plaste Kautsch19:420–431
Nguyen QD, Boger DV (1992) Measuring the flow properties ofyield stress fluids. Annu Rev Fluid Mech 24:47–88
Olmsted PD (2008) Perspectives on shear banding in complexfluids. Rheol Acta 47:283–300
Ovarlez G, Rodts S, Chateau X, Coussot P (2009) Phenomenol-ogy and physical origin of shear localization and shear band-ing in complex fluids. Rheol Acta 48:831–844
Ovarlez G, Bertrand F, Rodts S (2006) Local determination ofthe constitutive law of a dense suspension of noncolloidalparticles through MRI. J Rheol 50:259–292
Papathanasiou P, Guell TD (1997) Flow induced alignment incomposite materials. 1st (ed). Woodhead Publishing Lim-ited, Cambridge
Pettersson JA (2004) Flow and mixing of pulp suspensions. Ph.D.Thesis, Chalmers University of Technology
Pignon F, Magnin A, Piau JM (1996) Thixotropic colloidal sus-pensions and flow curves with minimum: identification offlow regimes and rheometric consequences. J Rheol 40:573–587
Piteira MF, Maia JM, Raymundo A, Sousa I (2006) Extensionalflow behaviour of natural fibre-filled dough and its rela-tionship with structure and properties. J Non-Newton FluidMech 137(1–3):72–80
Raynaud JS, Moucheront P, Baudez JC, Bertrand F, GuilbaudJP, Coussot P (2002) Direct determination by nuclear mag-netic resonance of the thixotropic and yielding behaviour ofsuspensions. J Rheol 46:709–732
Schalek E, Szegvari A (1923) The slow coagulation of concen-trated iron oxide sol to a reversible gel. Kolloid-Zeitschrift33(6):326–334
Swerin A (1998) Rheological properties of cellulosic fibre sus-pensions flocculated by cationic polyacrylamides. ColloidSurf A: Physicochem Eng Asp 133(3):279–294
Steffe JF (1996) Rheological methods in food process engineer-ing. 2nd ed. ISBN 0–9632036–1–4
Takeda Y (1986) Velocity Profile Measurement by UltrasoundDoppler Shift Method. Int J Heat Fluid Flow 7:313–318
Tucker CL III, Advani SG (1994) Flow and rheology in polymericcomposites manufacturing. Elsevier, Amsterdam, pp 147–202
Umer R, Bickerton S, Fernyhough A (2007) Modelling liquidcomposite moulding processes employing wood fibre matreinforcements. Key Eng Mater 334:113–116
Ventura C, Blanco A, Negro C, Ferreira P, Garcia F, RasteiroM (2007) Modeling pulp fibre suspension rheology. TAPPIJ 6(7):17–23
Wikström T, Rasmuson A (1998) Yield stress of pulp suspen-sions: The influence of fibre properties and processing con-ditions. Nord Pulp Pap Resour J 13(3):243–250