thermodynamic and kinetic analyses of the solar thermal
TRANSCRIPT

Diss. ETH No. 16 784
THERMODYNAMIC AND KINETIC
ANALYSES OF THE SOLAR THERMAL
GASIFICATION OF PETROLEUM COKE
A dissertation submitted to the
Swiss Federal Institute of Technology Zurich
for the degree of
Doctor of Technical Sciences
presented by
Dominic Trommer
Dipl. Chem.-Ing. ETHborn December 17, 1977citizen of Ramsen (SH)
accepted on the recommendation ofProf. Dr. Aldo Steinfeld, examiner
Prof. Dr. Marco Mazzotti, co-examiner
2006


Preface
This thesis presents a fundamental study of the thermodynamics and chem-ical kinetics of the solar thermal steam gasification of petroleum coke. Thesolar thermal gasification of carbonaceous materials is a process that usesconcentrated solar power as the source of high-temperature process heat.The reactants, i.e. petcoke and steam, uniquely serve as the chemical sourceof the products being synthesis gas, which is a mixture of hydrogen andcarbon monoxide.
Gasification is a state of the art process applied in today’s petroleum pro-cessing industry, converting low or negative valued solid and liquid residualfeedstocks into a gaseous product. The resulting gas is easily purified fromcompounds that would cause pollution problems and greatly extends the useof the employed solid fuels. The solar gasification process further preservesfossil resources because the energy content of the syngas product has beenupgraded by the solar input in an amount equal to the enthalpy change ofthe reaction. The combination of petcoke and solar energy creates a linkbetween todays petroleum-based technology and tomorrows solar chemicaltechnology.
The thesis is performed in the framework of a joint project between theresearch and development center of Petroleos de Venezuela, S.A. (PDVSA /INTEVEP), the Swiss Federal Institute of Technology (ETH) and the Centrode Investigaciones Energeticas, Medioambientales y Tecnologicos (CIEMAT).The main objective of the project is the development of the required tech-nology for the production of high quality syngas using extra-heavy Orinocotype of crude oil or derived residues such as petroleum coke using a solarthermochemical process. The joint project comprises a second thesis thatfocuses on the modeling of the radiative heat transfer in chemical reactingsystems.
The work presented in this thesis was was performed at the Professorshipin Renewable Energy Carriers at the Swiss Federal Institute of TechnologyZurich (ETH). I would like to take the opportunity and thank all the people
i

ii PREFACE
and institutions who have made this work possible and helped me in any wayto finish this thesis successfully.
I am particularly grateful to Prof. Dr. Aldo Steinfeld, who supervisedmy doctoral thesis during the last four years. He has provided me with anexcellent research environment and has helped to accomplish my dissertationby continuous support and challenge in every part of this work.
I thank Prof. Dr. Marco Mazzotti for critically reviewing this thesis andtaking over my final examination as a co-examiner.
Further, I would like to thank Philipp Haueter and Andreas Z’Graggenwho have greatly contributed both with engineering and numerical skillsto the success of my thesis as well as the SynPet project. I will alwayskeep in good memory the professional and constructive ambiance during theexperimental campaign an PSI’s solar furnace.
I thank the master students, R. Alvarez, M. Fasciana, F. Noembrini, andR. Speck as well as the students who did a semester project, C. Brander,F. Kritter, and C. Rechsteiner for contributing to this thesis with a largeexperimental effort.
I am grateful to the other members of the PRE group, namely PatrickCoray, Hansmartin Friess, Elena Galvez, Wojciech Lipinsky, Tom Melchior,Reto Muller, Jorg Petrasch, Lothar Schunk, and Peter and Vita von Zedtwitzfor all the discussions of the experimental and theoretical work.
Very special thanks go to my girlfriend, Anja Bar, princess of Berlin, forher love and patience that give me pleasure everyday and have helped me toendure difficult times. Also, I would like to thank my parents, Margret andBernhard, for supporting me with their experience, and my sister, Natalie,for the good time we had.
Zurich, August 2006 Dominic Trommer
LATEX2ε

iii
AbstractThe objectives of this thesis are the theoretical and experimental analyses
of the chemical kinetics and thermodynamics of the solar thermal gasification ofpetroleum coke.
Equilibrium computation of the stoichiometric system of petcoke and steam at1 bar and 1300 K result in an equimolar mixture of H2 and CO. A 2nd-law analysisfor electricity generation using the gasification products indicates the potential ofdoubling the specific electrical output and halving the specific CO2 emissions vis-a-vis conventional petcoke-fired power plants.
Rate laws for pyrolysis and reactive gasification are derived: Pyrolysis is mod-eled as a linear combination of first order decomposition reactions. The model forthe reactive gasification bases upon a Langmuir-Hinshelwood type reaction mech-anism considering reversible sorption of gaseous species and irreversible reactionsamong adsorbed species and with molecules from the gas phase. Further, the grainmodel is used to account for mass transfer limitations in the solid.
The rate constants are determined experimentally by thermogravimetry in the900-1300 K temperature interval using H2O-CO2-Ar mixtures and gaseous reactionproducts are detected by GC. The TG experiments show a different reactivity fordelayed coke samples if they are gasified as received, after partial gasification inan entrained flow reactor, or after temperature-treatment above 1300 K.
Experiments with laboratory scale fluidized bed reactors featuring two differentmodes of heat transfer were performed. The particles in the bed were heated bydirect and indirect thermal radiation from the ETH’s high-flux solar simulatorusing transparent and opaque fluidization tubes. An effect of the heat transfermode on the reaction kinetics was not observed and rate data complies with datafrom the TG experiments.
The design of a 5 kW solar thermal cavity reactor with entrained flow of gasand solids operated with a fine ground coke slurry is presented. Experiments atPSI’s solar furnace yielded chemical conversion of carbon and steam up to 87%and 69%, respectively, at a solar power input in the range 3.3-6.6 kW and a cokemass flow rate in the range 1.85-4.45 g/min. Operation with a stoichiometric feedproduced a gas with H2/CO ≈ 2 and CO2/CO ≈ 0.3.
A mathematical reactor model is developed based on the axial dispersionmodel. The axial dispersion number is obtained from residence time distributionmeasurements. The model is extended by means of radial temperature profilesextracted from a heat transfer simulation. The kinetic model is used to calculatethe reactor performance and the modeled data is compared with the experimentalcampaign. Mass transfer in the gas phase was analyzed and found to have no effectfor the used particle size and temperatures.
The research presented in this work serves as a fundamental reaction kineticsstudy that can be applied for the design of solar thermal gasification reactors.

iv PREFACE
ZusammenfassungDie vorliegende Doktorarbeit befasst sich mit der theoretischen und experi-
mentellen Analyse der Reaktionskinetik sowie mit der Thermodynamik fur diesolarthermische Vergasung von Petrolkoks.
Die Gleichgewichtszusammensetzung eines stochiometrischen Reaktionssys-tems bestehend aus Wasserdampf und Petrolkoks bei 1 bar und 1300 K ergibt eineaquimolare Mischung aus Wasserstoff und Kohlenmonoxid. Eine thermodynami-sche Analyse fur die Umwandlung der Vergasungsprodukte in Elektrizitat zeigtauf, dass der solare Prozess gegenuber konventionellen thermischen Kraftwerkenmit Koksfeuerung die spezifische Elektrizitatsproduktion verdoppelt bei gleichzei-tiger Halbierung der spezifischen Emissionen.
Geschwindigkeitsgesetze fur die Pyrolyse und die oxidative H2O-CO2-Verga-sung des Petrolkoks werden aufgestellt: Die Pyrolyse wird als Linearkombinationvon Zersetzungsreaktionen erster Ordnung modelliert. Das Modell der oxidativenVergasung basiert auf einem Reaktionsmechanismus nach Langmuir-Hinshelwood,der reversible Sorptionsprozesse der gasformigen Reaktanden und irreversible Re-aktionen zwischen den adsorbierten Spezies berucksichtigt. Das ‘Grain’-Modellwird verwendet, um den Stofftransport im Innern der Kokspartikel zu modellieren.
Die Geschwindigkeitskonstanten werden fur den Bereich 900-1300 K experi-mentell bestimmt. Dazu wurden Experimente in einem Thermogravimeter mitProbeatmospharen mit unterschiedlichen Konzentrationen von Wasser und Koh-lendioxid durchgefuhrt. Die gasformigen Produkte wurden mittels Gaschromato-graphie analysiert. Die TG-Experimente ergaben verschiedene Reaktivitaten furdie Vergasung von Delayed-Koks Proben. Dabei kam es darauf an, ob die Probenim Originalzustand, nach erfolgter partieller Vergasung in einem Flugstaubreaktoroder nach vorgangiger thermischer Deaktivierung bei Temperaturen oberhalb 1300K vergast wurden, ergaben sich verschiedene Reaktionsgeschwindigkeiten.
Im Weiteren wurden Experimente mit Wirbelschichtreaktoren im Labormass-stab durchgefuhrt. Zwei Typen von Reaktoren wurden verwendet, die sich in derArt und Weise des Energieeintrages in die Wirbelschicht unterschieden. In beidenReaktoren wurde die Wirbelschicht durch Bestrahlung mit dem ETH High-FluxSolarsimulator beheizt. In einem Fall erfolgte der Strahlungseintrag direkt durcheine transparente Reaktorwand aus Quarz, im anderen indirekt uber eine opakeKeramikwand. Ein Einfluss der Art des Warmeeintrages auf die chemische Kinetikkonnte nicht festgestellt werden.
Das Design eines 5 kW Flugstaubreaktors fur die solarthermische Vergasungvon Petrolkoks Pulver mit Wasserdampf wird beschrieben. Experimente im Solar-ofen am PSI in Villigen ergaben einen Stoffumsatz von bis zu 87% fur Kohlenstoffund 69% fur Wasser. Dies erfolgte bei einem solaren Strahlungseintrag in der Hohevon 3.3-6.6 kW und einem Koksmassenstrom in der Hohe von 1.85-4.45 g/min. Imstochiometrischen Betrieb (nH2O,0 = nC,0) bei einer Nenntemperatur von 1500 K

v
produzierte der Reaktor ein Gas mit H2/CO ≈ 2 und CO2/CO ≈ 0.3.
Ein mathematisches Modell fur einen Flugstaubreaktor wurde entwickelt, wel-ches auf dem axialen Dispersionsmodell basiert. Die axiale Dispersionszahl wurdeexperimentell aus der Verweilzeitverteilung des Reaktors bestimmt. Das Disper-sionsmodell beinhaltet radiale Temperaturgradienten, die von den Resultaten einerSimulation der Warmetonung im Reaktor abgeleitet wurden. Der Stoffumsatz imReaktor wurde mit dem Modell fur die chemische Kinetik berechnet und mit denexperimentellen Daten aus der Versuchskampagne mit dem 5 kW Pilotreaktor va-lidiert. Die Analyse des Stofftransportes in der Gasphase ergab, dass dieser unterden gegebenen Bedingungen keinen limitierenden Einfluss ausbt.
Die vorliegende Arbeit behandelt die reaktionskinetischen und thermodyna-mischen Grundlagen fur den Bau und den Betrieb von solarthermischen Verga-sungsreaktoren.

vi PREFACE

Contents
Preface i
Abstract iii
Zusammenfassung iv
Nomenclature xi
1 Introduction 1
1.1 Motivation . . . . . . . . . . . . . . . . . . . . . . . . . . . . . 1
1.2 Problem statement . . . . . . . . . . . . . . . . . . . . . . . . 2
2 Background and literature review 5
2.1 Chemistry of gasification . . . . . . . . . . . . . . . . . . . . . 5
2.1.1 Pyrolysis . . . . . . . . . . . . . . . . . . . . . . . . . . 6
2.1.2 H2O-CO2 gasification . . . . . . . . . . . . . . . . . . . 7
2.2 Survey of gasification techniques . . . . . . . . . . . . . . . . . 8
2.2.1 Conventional gasification processes . . . . . . . . . . . 8
2.2.2 Gasification with concentrated solar power . . . . . . . 12
2.2.3 Comparison . . . . . . . . . . . . . . . . . . . . . . . . 15
2.3 Feedstock characterization . . . . . . . . . . . . . . . . . . . . 15
2.3.1 Petroleum coke . . . . . . . . . . . . . . . . . . . . . . 15
2.3.2 Chemical composition . . . . . . . . . . . . . . . . . . 18
2.3.3 Sample preparation and morphology . . . . . . . . . . 20
3 Thermodynamics 23
vii

viii CONTENTS
3.1 Equilibrium composition . . . . . . . . . . . . . . . . . . . . . 23
3.2 Enthalpy of reaction . . . . . . . . . . . . . . . . . . . . . . . 27
3.3 Second law analysis . . . . . . . . . . . . . . . . . . . . . . . . 27
3.3.1 System setup . . . . . . . . . . . . . . . . . . . . . . . 28
3.3.2 Results . . . . . . . . . . . . . . . . . . . . . . . . . . . 28
3.4 Summary and conclusions . . . . . . . . . . . . . . . . . . . . 32
4 Reaction kinetics 33
4.1 Heterogeneous gas-solid reactions . . . . . . . . . . . . . . . . 33
4.1.1 Structural models for the coke particle . . . . . . . . . 35
4.1.2 Mass transfer model for the gas phase . . . . . . . . . . 40
4.2 Experimental systems for kinetic analyses . . . . . . . . . . . 45
4.2.1 Differential and integral reactors . . . . . . . . . . . . . 45
4.2.2 Thermogravimetry . . . . . . . . . . . . . . . . . . . . 46
4.3 Reaction mechanisms . . . . . . . . . . . . . . . . . . . . . . . 47
4.3.1 Pyrolysis . . . . . . . . . . . . . . . . . . . . . . . . . . 47
4.3.2 H2O-CO2 gasification . . . . . . . . . . . . . . . . . . . 48
5 Rate data from thermogravimetry 55
5.1 Experimental . . . . . . . . . . . . . . . . . . . . . . . . . . . 55
5.1.1 Setup: Netzsch STA 409 and Varian Micro GC . . . . . 55
5.1.2 Experimental procedure . . . . . . . . . . . . . . . . . 58
5.2 Results . . . . . . . . . . . . . . . . . . . . . . . . . . . . . . . 61
5.2.1 Pyrolysis . . . . . . . . . . . . . . . . . . . . . . . . . . 61
5.2.2 H2O-CO2 gasification . . . . . . . . . . . . . . . . . . . 63
5.3 Kinetic analyses . . . . . . . . . . . . . . . . . . . . . . . . . . 75
5.3.1 Pyrolysis . . . . . . . . . . . . . . . . . . . . . . . . . . 75
5.3.2 H2O-CO2 gasification . . . . . . . . . . . . . . . . . . . 77
5.4 Summary and conclusions . . . . . . . . . . . . . . . . . . . . 79
6 Rate constants from integral reactors 83
6.1 DFB reactor . . . . . . . . . . . . . . . . . . . . . . . . . . . . 84
6.1.1 Reactor setup . . . . . . . . . . . . . . . . . . . . . . . 84

CONTENTS ix
6.1.2 Experimental procedure . . . . . . . . . . . . . . . . . 85
6.1.3 Results . . . . . . . . . . . . . . . . . . . . . . . . . . . 87
6.2 IFB reactor . . . . . . . . . . . . . . . . . . . . . . . . . . . . 95
6.2.1 Reactor setup . . . . . . . . . . . . . . . . . . . . . . . 95
6.2.2 Experimental procedure . . . . . . . . . . . . . . . . . 98
6.2.3 Results . . . . . . . . . . . . . . . . . . . . . . . . . . . 98
6.3 Kinetic analysis . . . . . . . . . . . . . . . . . . . . . . . . . . 101
6.3.1 Comparison of the DFB and IFB rate data . . . . . . . 110
6.4 Summary and conclusions . . . . . . . . . . . . . . . . . . . . 112
7 SynPet 5 kW process reactor 115
7.1 Reactor design . . . . . . . . . . . . . . . . . . . . . . . . . . 115
7.2 Experimental setup . . . . . . . . . . . . . . . . . . . . . . . . 117
7.3 Results . . . . . . . . . . . . . . . . . . . . . . . . . . . . . . . 119
7.3.1 Reference experiment . . . . . . . . . . . . . . . . . . . 120
7.3.2 SynPet experiments at PSI’s solar furnace . . . . . . . 122
7.4 Summary and conclusions . . . . . . . . . . . . . . . . . . . . 128
8 SynPet reactor modeling 131
8.1 Choosing the correct model . . . . . . . . . . . . . . . . . . . 131
8.2 One-dimensional axial dispersion model . . . . . . . . . . . . . 133
8.2.1 Governing equations . . . . . . . . . . . . . . . . . . . 133
8.2.2 Numerical methods . . . . . . . . . . . . . . . . . . . . 135
8.3 Axial dispersion number and RTD . . . . . . . . . . . . . . . . 138
8.4 Chemical reaction . . . . . . . . . . . . . . . . . . . . . . . . . 143
8.4.1 Reactivity correction . . . . . . . . . . . . . . . . . . . 143
8.4.2 Mass transfer in the gas phase . . . . . . . . . . . . . . 146
8.4.3 Reaction source term . . . . . . . . . . . . . . . . . . . 148
8.5 Radial temperature profiles . . . . . . . . . . . . . . . . . . . 150
8.6 Results and experimental validation . . . . . . . . . . . . . . . 153
8.6.1 Reference experimental run . . . . . . . . . . . . . . . 153
8.6.2 SynPet experiments in the PSI solar furnace . . . . . . 157
8.7 Summary and conclusions . . . . . . . . . . . . . . . . . . . . 161

x CONTENTS
9 Summary and outlook 165
9.1 Summary . . . . . . . . . . . . . . . . . . . . . . . . . . . . . 166
9.2 Outlook . . . . . . . . . . . . . . . . . . . . . . . . . . . . . . 168
Curriculum vitae 191
Nomenclature
a mass specific surface, (m2/g)av volume specific surface, (m2/m3)A surface, (m2)c molar concentration, (mol/m3)C mean solar flux concentration ratio, (−)C〈∗〉 carbon site on the coke surfaced thickness, diameter, (m)D diffusion coefficient, (m2/s)D dispersion coefficient of the axial dispersion model, (m2/s)E probability density function, (−)EA activation energy, (J/mol)F cumulative distribution function, (−)H fluidized bed height, (m)I solar irradiation, (kW/m2)j′′ diffusion flux, (mol/m2/s)k′ elementary rate constant of the oxygen exchange mechanism,
(units according to the rate law)k elementary rate constant of the extended mechanism,
(units according to the rate law)k0 pre-exponential factor, (same units as rate constant)k thermal conductivity, (W/m/K)K, a lumped rate constants, (units according to the rate law)L length, (m)m sample mass, (g)m mass flow rate, (g/s)m′′ mass flux, (g/m2/s)M molar mass, (g/mol)n reaction order, (−)n mole number, (mol)n molar flow rate, (mol/s)
xi
xii NOMENCLATURE
n′′ molar flux, (mol/m2/s)N species dependent numerator of a rate expressionN number of control volumes, (−)p partial pressure, (Pa)P total pressure, (Pa)q′′ heat flux, (J/m2/s)Q heat rate, (W)r rate of reaction, (mol/m2/s)r′ rate of reaction, (mol/g/s)r′′ rate of reaction, (mol/m3/s)r′ overall amount of pyrolysis products, (mol/g)R radius, (m)R ideal gas constant, (J/mol/K)SSY sum of squares, (units of the addends Y )t time, (s)T absolute temperature, (K)u superficial velocity, (m/s)V volume, (m3)w weight fraction, (−)W work output, (kW)x H/C elemental molar ration, (−)x maximum conversion of a pseudo component
with respect to the overall sample mass, (−)X chemical conversion, X ∈ [0, 1], (−)XG coke conversion due to H2O-CO2 gasification, XG ∈ [0, 1], (−)XP coke conversion due to pyrolysis, XP ∈ [0,
∑i ci], (−)
y O/C elemental molar ration, (−)y molar fraction, (−)
Greek symbols
α conversion of pseudo component, α ∈ [0, 1], (−)β linear heating rate (ramp) of the thermobalance, (K/s)∆G Gibbs free energy change, (kJ/mol)ε emissivity, (−)εv void fraction, (−)η process efficiency, (−)ηP particle effectiveness, (−)

xiii
µ dynamic viscosity, (kg/m/s)µ predictand of the RTD, (s)ν stoichiometric coefficient, (−)ρm specific molar density per unit mass, (mol/kg)ρv specific molar density per unit volume, (mol/m3)σ Stefan-Boltzmann constant, (W/m2/K4)σ variance, (s−1)θ fractional surface coverage, θ ∈ [0, 1], (−)θ reduced time, (−)
Subscripts
B bulkcoke petroleum cokeC.C. combined Brayton-Rankine cyclee electriceff effectiveF.C. fuel cellgr graphiteG gasification, gasi, j chemical species or reaction numberI interfaceintr intrinsicm mass, mixtureobs observed overallP pyrolysis, particlereact reactivityR.C. Rankine cycler.g. reactive gasS solidtot totalv volumewgs water-gas shiftW, P, E grid points of the finite volume methodw, e east and west face of the control volume0 initial, overall
xiv NOMENCLATURE
Abbreviations
BET Brunauer-Emmet-TellerCFD computational fluid dynamicsCPC compound parabolic concentratorDFB directly irradiated fluidized bedDTG differential thermogravimetryEGF electric gain factorE.O. specific electric outputETH Swiss Federal Institute of TechnologyFVM finite volume methodGC gas chromatographIFB indirectly irradiated fluidized bedIGCC integrated gasification combined cycleLHV low heating valueMFR mixed flow reactorPCM progressive-conversion modelPD Petrozuata delayedPFR plug flow reactorPLOT porous layer open tubularPSA pressure swing adsorptionPSI Paul Scherrer InstituteQFBR quartz fluidized bed reactorRMS root mean square (error)RTD residence time distributionSCM shrinking core modelSOFC solid oxide fuel cellTG thermogravimeter

Chapter 1
Introduction
1.1 Motivation
Anthropogenic emissions of greenhouse gases and other pollutants can be sig-nificantly reduced or even completely eliminated by substituting fossil fuelsby cleaner fuels, e.g. solar hydrogen. The complete substitution is, evidently,a long-term goal. Strategically, it is desirable to consider midterm goals aim-ing at the development of hybrid solar/fossil endothermic processes in whichfossil fuels are used exclusively as the chemical source for H2 production, andconcentrated solar power is used exclusively as the energy source of processheat.
An important example of such hybridization is the endothermic steamgasification of petroleum coke (petcoke) to synthesis gas (syngas). Petcokeis a major solid byproduct from the processing of heavy and extra heavy oilsusing delay-coking and flexicoking technology.1 The syngas product, besidesbeing a high-quality fluid fuel, is cleaner than its solid feedstock because itsenergy content has been upgraded by the solar input in an amount equal tothe enthalpy change of the reaction.
The combination of petcoke and solar energy creates a link between to-day’s petroleum-based technology and tomorrow’s solar chemical technology.It also builds bridges between present and future energy economies becauseof the potential of solar energy to become a viable economic path once thecost of energy will account for the environmental externalities from burning
1Reserves of heavy and extra heavy crude oil in the Orinoco belt are estimated at54.7 · 109 barrels. Current production rate of petcoke is 1.1 · 104 tons/day in the Orinocobelt [59] and 1.1·105 tons/day in the world [14] (anticipated worldwide petcoke productionrate of the year 2000).
1
2 CHAPTER 1. INTRODUCTION
fossil fuels, such as the cost of greenhouse gas mitigation and pollution abate-ment. Hybrid solar/fossil processes such as the one presented in this thesisoffer a viable route for fossil fuel decarbonization and create a transition pathtowards solar hydrogen [85, 95].
The use of the sun as a source of primary energy has several advantages:The solar energy reserve is essentially unlimited, free of charge, and its useis ecologically benign. However, solar radiation is dilute (≈ 1 kW/m2),intermittent, and unequally distributed over the surface of the earth [84]. Itis therefore necessary to convert solar energy into chemical energy carriers- so called solar fuels - that can be stored long term and transported longrange.
There are basically three pathways for the production of fuels with so-lar energy: the electrochemical, the photochemical, and the thermochemicalpathway [84, 82]. The solar gasification of petcoke is an example for a ther-mochemical process. The basic idea is to concentrate the dilute sunlightover a small surface area with the help of parabolic mirrors and capture theradiant energy by means of a suitable reactor or receiver to obtain heat athigh temperatures that can be used to run endothermic chemical reactionsproducing storable and transportable fuels. These solar fuels finally containsolar energy in the form of chemical energy.
1.2 Problem statement
The main objectives of this thesis are the theoretical and experimental anal-yses of the chemical kinetics and thermodynamics of the solar thermal gasifi-cation of petroleum coke using temperature and pressure conditions encoun-tered in solar thermal reactors. The accomplishment of the following pointsis thereby of particular interest:
• A study of the chemical thermodynamics of the steam gasificationof petcoke based on a simplified net reaction representing the over-all chemical conversion of a carbonaceous fuel with the composition ofpetcoke. The results of this study include the thermodynamic equi-librium composition, the syngas yield and the enthalpy change of thegasification reaction.
• The thermodynamic study is complemented with a 2nd-law (exergy)analysis to examine technically viable routes for extracting power fromthe gasification products and to establish a base for comparing them
1.2. PROBLEM STATEMENT 3
with electricity generation using conventional power plants, especiallyin terms of their CO2 mitigation potential.
• Formulation of a set of kinetic rate laws based on elementary reactionmechanisms describing reversible adsorption/desorption processes andirreversible surface chemistry. The kinetic equations are amended withthe necessary mass transfer relations for heterogeneous gas-solid reac-tion systems to enable the calculation of gasification rates over a widerange of temperatures.
• Assessment and development of suitable experimental procedures fa-cilitating the experimental determination of the feed stock dependentkinetic parameters including the Arrhenius-type temperature depen-dence for conditions prevalent in solar thermal reactors.
• Contribute to the development of a 5 kW prototype reactor accomplish-ing the solar thermal gasification of petroleum coke by direct irradiationin the framework of the joint project.
• Development of a mathematical model for the prediction and inter-pretation of the 5 kW process reactor performance features, such asamount and composition of the produced gas as well as conversion ofreactants. The kinetic models to be developed offer the possibility ofdescribing local conditions in the gasification reactor, thus representingthe process that leads to the reactor outlet conditions.
The numerical reactor model consists of differential balance equationsfor the chemical species and includes rate expressions for chemical re-actions and mass transfer. Because kinetic models provide the mostdetailed description of gasification reactors they require a large num-ber of parameters that are feedstock dependent (activation energies,pre-exponential factors, etc.). Typical results of kinetic models aretemperature and component concentration profiles in axial and radialdirections [14].
The model further has the purpose of validating the laboratory scaleexperimental rate data using process conditions of the 5 kW scale andfind improvements to the design of the process reactor.

4 CHAPTER 1. INTRODUCTION
Chapter 2
Background and literaturereview
2.1 Chemistry of gasification
The gasification of carbonaceous feedstocks is an overall process that occursvia pyrolysis reactions (thermal decomposition and devolatilization) and sub-sequent heterogeneous gas-solid reactions of the pyrolysis residue (coke, char)with reactive gases such as oxygen, steam, carbon dioxide, and hydrogen.
Besides carbon, the solid feedstock usually contains other elements in-cluding hydrogen, oxygen, nitrogen, sulfur, heavy metals, and trace elementsin varying amounts. In a gasification process the solid feedstock is convertedto a gaseous product, which can be used either as an energy source or as araw material for the synthesis of chemicals and various fuels. The resultinggaseous product can be handled with more convenience and is easily purifiedfrom compounds that would cause pollution problems. Thus, gasification isan upgrading process that greatly extends the uses of solid fuels [14].
From a chemical point of view, gasification is essentially an incompletecombustion. In contrast to the combustion process working with excess oxy-gen, gasification processes operate at substoichiometric conditions with con-trolled oxygen supply. In an autothermal gasifier both heat is produced byinternal combustion and the solid is converted to a new gaseous fuel. Di-lution of the product gas with nitrogen and excess CO2 can be avoided bysubstituting external heating for the internal combustion. Heat sources thatapply for external heating are conventional firing systems, concentrated solarenergy, or nuclear heat. However, all of the named heat sources are afflictedwith a less favorable heat transfer characteristic.
5

6 CHAPTER 2. BACKGROUND AND LITERATURE REVIEW
As a carbonaceous feedstock passes a gasification reactor or gasifier, thefollowing physical, chemical, and thermal processes may occur sequentiallyor simultaneously, depending on the reactor design and the type of feedstock[71]:
• drying,
• pyrolysis (devolatilization),
• H2O-CO2 reactive gasification,
• combustion.
With respect to the solar thermal steam gasification of petcoke, the dryingand the combustion are omitted because petcoke contains less than 1 wt%of moisture and the reactive gas does further not contain oxygen, whichis required to run the combustion reaction. The pyrolysis and H2O-CO2
reactive gasification steps are discussed in the following.
2.1.1 Pyrolysis
Pyrolysis is the destructive chemical decomposition induced in organic ma-terials by heat in the absence of an oxidizing agent such as oxygen, steam,or carbon dioxide. It is an endothermic process and requires the additionof heat. Pyrolysis converts the carbonaceous feedstock into a carbon richsolid (char or coke) and liquid derivatives, oil, tar, and fuel gases such ashydrogen, methane, carbon monoxide and light hydrocarbons. The natureof the pyrolysis process and the evolving products are closely related to theoperating conditions and to the composition and properties of the feedstock.
Many parameters besides the already mentioned feed composition havean effect on pyrolysis [71]:
• Particle size: For particles bigger than 100 µm an increase of the par-ticle size leads to higher devolatilization times. Below 100 µm theparticle size has no effect [51].
• Heating rate: The influence of the heating rate is difficult to measure,but it is generally believed that rapid heating prevents secondary reac-tions among the pyrolysis products yielding higher volatile componentsthan slow heating. The char produced by fast heating is more reactivethan char from a pyrolysis process featuring low heating rates.

2.1. CHEMISTRY OF GASIFICATION 7
• Temperature: The reactor temperature has a significant impact on boththe pyrolysis product yield and the product composition. Pyrolysiscan be subdivided into low temperature and high temperature pro-cesses. High temperature pyrolysis produces mainly gases, while themain products of low temperature pyrolysis are tar and heavy oil.
Despite the fact that petcoke already is a solid pyrolysis product derivedfrom petroleum residues it still contains a certain amount of volatile matter(cf. Table 2.1 on page 19). This volatile matter can be removed in a furtherpyrolysis step, the so-called calcination. During calcination petcoke is heatedin rotary kilns to temperatures up to 1400 ◦C to remove remanent moistureand higher boiling hydrocarbons.
2.1.2 H2O-CO2 gasification
Gasification of carbonaceous materials, such as petroleum coke with steam(‘steam gasification’) and carbon dioxide (‘dry gasification’), is a heteroge-neous gas-solid reaction of solid carbon and steam/carbon dioxide in the gasphase. The net process is endothermic by about 50% of the feedstock’s lowheating value and proceeds at above 1300 K to produce, in equilibrium, anequimolar mixture of H2 and CO. The latter is the so called synthesis gasthat can be used to fuel highly efficient gas turbines or as a basic commod-ity for the chemical synthesis of higher hydrocarbons by the Fischer-Tropschprocess.
The CO/CO2 ratio in the product gas can be further adjusted in a water-gas shift reactor increasing the H2 content in the product gas by conversion ofCO to CO2. If, in addition, a CO2 separation and sequestration step is addedthe process can be used to produce CO2-free hydrogen [94] and gasificationbecomes a decarbonization process.
The key parameters controlling the rate of the oxidative gasification aretemperature and partial pressures of the gaseous reactants. The mode ofaction is described in detail in Chapter 4.3. Due to the exponential temper-ature dependence defined by the Arrhenius law (cf. Equation (4.36) on page48), the influence of temperature exceeds the effect of the reactants partialpressures.
H2O-CO2 gasification involves a series of chemical reactions includingadsorption and desorption of gases on the coke surface, reactions amongadsorbed species, and the release of carbon to the gas phase by the formationand desorption of a surface oxygen complex. The respective reactions are
8 CHAPTER 2. BACKGROUND AND LITERATURE REVIEW
presented in detail in Chapter 4.3, and are not further worked out at thispoint.
In contrast to pyrolysis, which is essentially a unimolecular decompositionreaction, the rate of the reactive gasification step not only depends on tem-perature and fuel properties but also on type and concentration of a gaseousreactant at the solid surface. The reactive gasification requires therefore thetransport of reactants from the bulk gas to the solid and of products fromthe solid to the bulk gas. In addition, the fluid dynamics inside the reactorare important because they have an effect on the mass transfer rate betweenthe solid and the gas phase.
2.2 Survey of gasification techniques
Gasification technologies have been applied commercially for more than acentury. Originally, gasification was used for the production of fuel or towngas for lighting and heating. In the first half of the last century the maininterest shifted to synthesis gas for the production of chemicals and liquidmotor fuels.
More recently, petroleum-derived residues have gained attention as gasi-fication feedstocks because of a continuous decrease in the volume of con-ventional crudes which have to be replaced by heavier crudes. The crude oilprocessed in U.S. refineries over the last twenty years is characterized by acontinuous increase in the gravity and sulfur content [25]. The higher volumeof heavy crudes results in a higher yield of residues and a higher demand fordisposal and conversion technologies. Besides technological and economicalreasons, gasification is favored by environmental restrictions increasing inmany countries and causing a higher demand for clean technologies.
Newer developments in the field of gasification are the integrated gasifi-cation combined cycle (IGCC) for clean and efficient electricity productionbased on low or negative valued feed stocks. Coproduction plants offer the si-multaneous production of chemical commodities and electric energy and theintegration of gasification with refineries offers new business opportunities[86, 25].
2.2.1 Conventional gasification processes
This chapter contains a survey of conventional gasification techniques. First,a set of criteria commonly used for the classification of autothermic gasifi-
2.2. SURVEY OF GASIFICATION TECHNIQUES 9
cation processes is presented, followed by some representative examples toelaborate on the conventional reactor technology.
Several economical, technical, and chemical aspects of the gasification ofsolid carbonaceous materials are summarized in the literature [14, 71, 86,25, 96, 42, 74, 1, 23, 75]. There are more than 150 companies around theworld that sell systems based on gasification concepts. Many of these areoptimized for the efficient conversion of specific feedstocks such as waste,petroleum residues, coal or biomass, and operate at various scales dependingon particular demands such as energy production or amount of solids to pro-cess. As a consequence, a large amount of different process implementationsare available on the market.
Classification of gasification systems
Conventional gasification processes can be classified based on the methodused to generate heat for the gasification reactions, on the contacting patternof the reactants, and on the physical state of the residue removed [96].
Heat transfer mode. Based on the heat transfer a gasification process canbe autothermic or allothermic. In an autothermic process, internal combus-tion of a part of the solid feedstock with oxygen produces the heat required torun the gasification reaction inside the reactor. This has the advantage thatany losses associated with the heat transfer are avoided and the constructionof the gasifier is simplified. Further, the temperature can be adjusted quicklyand accurately by regulation of the oxygen content in the gasification agent.In an allothermic process, the heat required is transfered by means of agaseous, liquid (molten slag, salts or metals), or solid heat carrier broughtinto direct contact with the reactants or indirectly via heat exchange surfaces.
Contacting pattern. The contacting pattern describes how the solid fuelis brought into contact with the gasification agent. Based on this, a gasifi-cation process can be classified as fixed bed, fluidized bed, or entrained flow,as depicted schematically in Figure 2.1. The choice of a specific pattern hasan important effect on the type, rank, and size distribution of the solid fuelto use. Further, it determines the residence time, reactor temperature andpressure, and some characteristics of the produced gas.
Fixed bed gasifiers [Figure 2.1 (a)] contain a bed of lump fuel maintainedat a constant depth. The coke is fed from the top end and flows countercur-rent to the rising gas stream. A single particle moving through the bed passes

10 CHAPTER 2. BACKGROUND AND LITERATURE REVIEW
product gasproduct gas
ashcoke
H2O, O2
ash
coke dust
H2O, O2
H2O, O2
coke
product gasash
(a) (b) (c)
Figure 2.1: Gasifier types for autothermic gasification: (a) fixed bed, (b)fluidized bed, and (c) entrained flow gasifier.
different zones including drying and preheating, devolatilization, gasification,oxidation, and ash removal. Fixed bed gasification systems are simple, reli-able and offer high efficiency with respect to coke and energy consumption.
Fluidized bed gasifiers [Figure 2.1 (b)] accept coke as grains with a size ofless than ≈ 3 mm. The gasification agent maintains the fuel in a suspendedstate of continuous random motion. Reactors of this type are characterizedby high mass and heat transfer rates, uniform and moderate temperatures, ahigh specific gasification rate and product uniformity as well as high toleranceto a wide range of feed stock compositions.
Entrained flow gasifiers [Figure 2.1 (c)] are operated with pulverized cokewith particles of less than 0.12 mm. The solid fuel is entrained with the gasify-ing agent to react in a concurrent flow having the form of a high temperatureflame. Entrained bed gasifiers accept virtually all types of carbonaceous feedstocks. Swelling and caking characteristics of the solid fuel do not affect theoperability of the process as particle interaction is poor. Full entrainmentof the particles requires relatively high flow rates leading in turn to small
2.2. SURVEY OF GASIFICATION TECHNIQUES 11
residence times. In order to obtain full conversion of the coke entrained flowreactors operate at very high temperatures (above 1800 K). Devolatilizationproducts are released in the high temperature region and thus further crackedand oxidized. In opposition to combustion, sulfur and nitrogen contained bythe solid fuel is converted to H2S, small amounts of COS, and NH3 ratherthan SO2 and NOx.
Ash removal. The last criterion to distinguish a gasification process is thephysical state of the residue removed. Gasification reactors can operate inthe slagging or non-slagging mode depending on wether the ashes liquefy ornot.
Commercial gasification systems
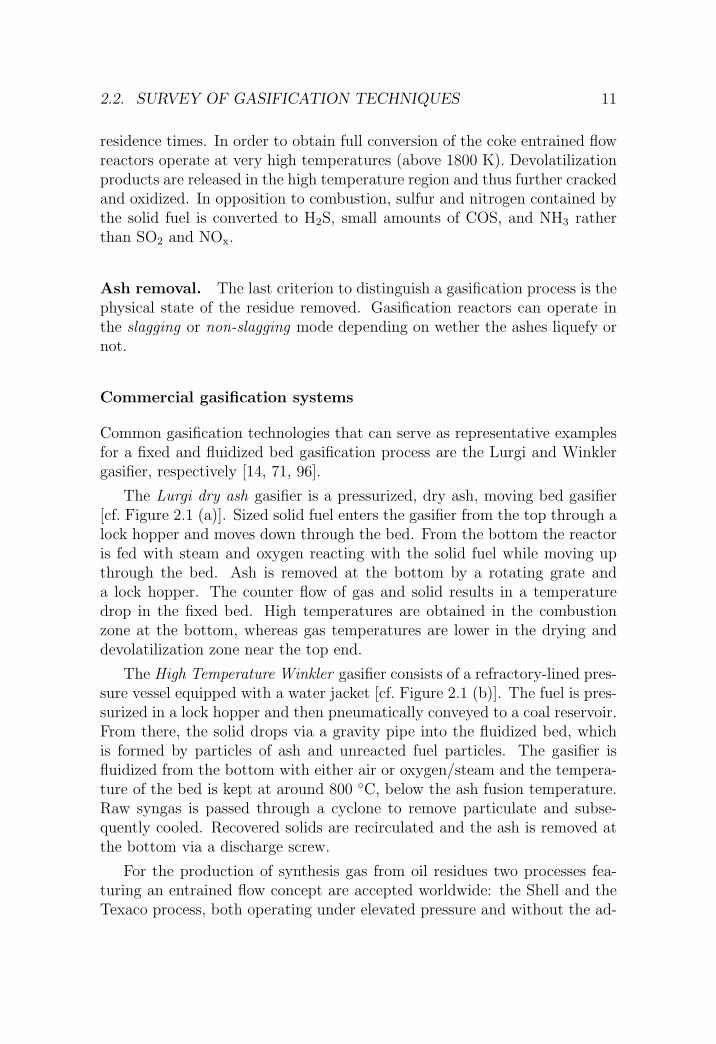
Common gasification technologies that can serve as representative examplesfor a fixed and fluidized bed gasification process are the Lurgi and Winklergasifier, respectively [14, 71, 96].
The Lurgi dry ash gasifier is a pressurized, dry ash, moving bed gasifier[cf. Figure 2.1 (a)]. Sized solid fuel enters the gasifier from the top through alock hopper and moves down through the bed. From the bottom the reactoris fed with steam and oxygen reacting with the solid fuel while moving upthrough the bed. Ash is removed at the bottom by a rotating grate anda lock hopper. The counter flow of gas and solid results in a temperaturedrop in the fixed bed. High temperatures are obtained in the combustionzone at the bottom, whereas gas temperatures are lower in the drying anddevolatilization zone near the top end.
The High Temperature Winkler gasifier consists of a refractory-lined pres-sure vessel equipped with a water jacket [cf. Figure 2.1 (b)]. The fuel is pres-surized in a lock hopper and then pneumatically conveyed to a coal reservoir.From there, the solid drops via a gravity pipe into the fluidized bed, whichis formed by particles of ash and unreacted fuel particles. The gasifier isfluidized from the bottom with either air or oxygen/steam and the tempera-ture of the bed is kept at around 800 ◦C, below the ash fusion temperature.Raw syngas is passed through a cyclone to remove particulate and subse-quently cooled. Recovered solids are recirculated and the ash is removed atthe bottom via a discharge screw.
For the production of synthesis gas from oil residues two processes fea-turing an entrained flow concept are accepted worldwide: the Shell and theTexaco process, both operating under elevated pressure and without the ad-

12 CHAPTER 2. BACKGROUND AND LITERATURE REVIEW
dition of a catalyst. The Texaco process was originally designed for partialoxidation of natural gas; the Shell process was tailored from the beginningto gasification of heavy oil. The differences between the two processes arevirtually negligible and involve only details of the equipment design.
The Texaco gasifier [96, 71, 14] consists of a pressure vessel with a refrac-tory lining that operates at temperatures in the range of 1250 to 1450 ◦Cand pressures of 3 MPa for power generation and up to 8 MPa for H2 andchemical synthesis. Oxygen and steam are introduced through burners at thetop of the gasifier. Solid feedstock such as coal and coke are pre-processedinto a slurry by fine grinding and water addition and then pumped into theburner. Raw gas and molten ash produced during the gasification processflow out toward the bottom of the gasifier, where they are cooled and cleanedfrom slag ash either by water quenching or by means of a radiant cooler.
The Shell Coal Gasification Process [20, 19, 96, 71] is a dry-feed, oxygen-blown, entrained flow coal gasification process, which has the capability ofconverting virtually any coal and coke into a clean medium Btu synthesis gas.High pressure nitrogen or recycled syngas is used to pneumatically conveydried, pulverized fuel to the gasifier. The solids enter the gasifier throughdiametrically opposed burners, where it reacts with oxygen at temperaturesexceeding 1370 ◦C. The gasification temperature is maintained sufficientlyhigh to ensure that the mineral matter in the fuel is molten and smoothlyflows down the gasifier wall to the slag tap. The hot syngas exiting thegasifier is quenched to below the softening point and then further cooledin the syngas cooler. Essentially all nitrogen and sulfur compounds in thefeedstock are converted to their elements. The process is well suited for cokeutilization and gasifies petcoke with the same conversion and sulfur removalefficiencies that are observed for coal.
2.2.2 Gasification with concentrated solar power
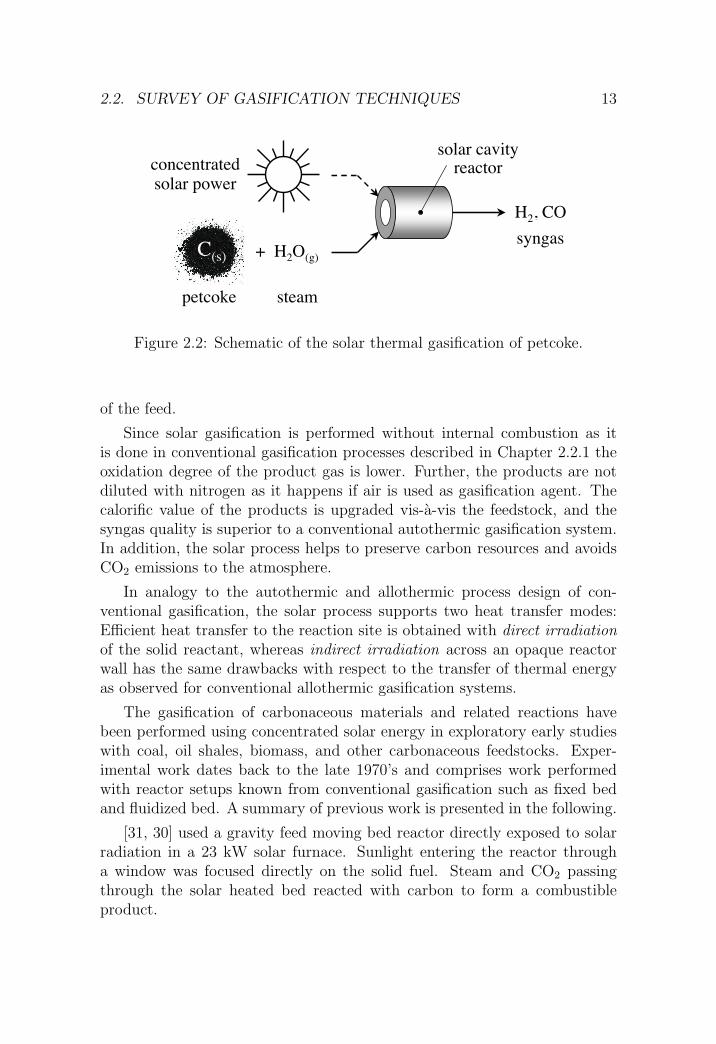
Gasification with concentrated solar power is a hybrid solar/fossil endother-mic process in which fossil fuels are used exclusively as the chemical sourcefor hydrogen production, and concentrated solar power is used exclusively asthe energy source of process heat. A schematic of the process is shown inFigure 2.2.
The reactants being steam and a carbonaceous solid fuel such as petcokeare fed to a solar cavity reactor and gasified with high temperature solarprocess heat. The main products are H2, CO, and CO2 with compositionsdepending on the process conditions, such as temperature and stoichiometry
2.2. SURVEY OF GASIFICATION TECHNIQUES 13
syngas
H2, CO
+ H2O(g)C(s)
petcoke steam
concentratedsolar power
solar cavityreactor
Figure 2.2: Schematic of the solar thermal gasification of petcoke.
of the feed.
Since solar gasification is performed without internal combustion as itis done in conventional gasification processes described in Chapter 2.2.1 theoxidation degree of the product gas is lower. Further, the products are notdiluted with nitrogen as it happens if air is used as gasification agent. Thecalorific value of the products is upgraded vis-a-vis the feedstock, and thesyngas quality is superior to a conventional autothermic gasification system.In addition, the solar process helps to preserve carbon resources and avoidsCO2 emissions to the atmosphere.
In analogy to the autothermic and allothermic process design of con-ventional gasification, the solar process supports two heat transfer modes:Efficient heat transfer to the reaction site is obtained with direct irradiationof the solid reactant, whereas indirect irradiation across an opaque reactorwall has the same drawbacks with respect to the transfer of thermal energyas observed for conventional allothermic gasification systems.
The gasification of carbonaceous materials and related reactions havebeen performed using concentrated solar energy in exploratory early studieswith coal, oil shales, biomass, and other carbonaceous feedstocks. Exper-imental work dates back to the late 1970’s and comprises work performedwith reactor setups known from conventional gasification such as fixed bedand fluidized bed. A summary of previous work is presented in the following.
[31, 30] used a gravity feed moving bed reactor directly exposed to solarradiation in a 23 kW solar furnace. Sunlight entering the reactor througha window was focused directly on the solid fuel. Steam and CO2 passingthrough the solar heated bed reacted with carbon to form a combustibleproduct.

14 CHAPTER 2. BACKGROUND AND LITERATURE REVIEW
[90] applied a similar reactor concept, adapted for a beam down arrange-ment, and compared the performance of the fixed bed reactor to that of anindirectly irradiated fluidized bed reactor in a 2 kW vertical-beam solar fur-nace using charcoal, steam, and CO2 as reactants. A numerical model ofthe moving chemical bed reactor for gasifying coal using concentrated solarradiation is proposed by [7, 8].
[6] and [4] investigated the high temperature solar pyrolysis of coal andthe solar fired biomass flash pyrolysis, respectively. Powdered coal sampleswere exposed to concentrated solar radiation in a horizontal reactor arrange-ment with a quartz dome and biomass was pyrolyzed in a windowed free fallreactor.
[55, 54] developed a two stage fluidized bed hybrid coal gasification sys-tem capable of 24-hour operation. A portion of the syngas is withdrawnas product and the remaining portion acts as a heat-transfer and fluidizingmedium heated by a solar receiver. Another concept for the use of a solarreceiver in combination with an allothermic gasification reactor is presentedby [46].
[9, 64, 38] studied the gasification reaction of various reactants in tubularreactors enclosed by a cavity type black body solar receiver. [9] used fixedand fluidized bed reactors for the pyrolysis of oil shales. [38] and [64] usedtransparent and opaque fluidization tubes and characterized chemical con-version and composition of the product gas at 730-950 K and 1050-1600 K,respectively.
[56] presents a study of solar thermal energy conversion by thermal stor-age. An infrared furnace is used as radiation source heating a mixture of coaland molten salt to 1173 K. The gasification agent is CO2.
[24] and [44] performed laboratory scale experiments with directly ir-radiated fixed bed and fluidized bed reactors, respectively. Reactants areheated by direct irradiation with concentrated radiation from a solar simu-lator. More recently, the reaction kinetics of steam gasification of coal wereinvestigated for a quartz tubular reactor containing a fluidized bed, and di-rectly exposed to an external source of concentrated thermal radiation [63].
Several of the aforementioned solar reactor applications tested with small-scale prototypes were filed for a patent [29, 53, 69].

2.3. FEEDSTOCK CHARACTERIZATION 15
2.2.3 Comparison
The solar thermal steam gasification of petcoke provides a valuable alterna-tive to conventional gasification processes. The advantages of supplying solarenergy for process heat are four-fold:
1. The calorific value of the feedstock is upgraded and fossil fuel resourcesare preserved due to the exclusive use of the feedstock as the chemicalsource of the product gas.
2. The gaseous products are not contaminated by the byproducts of com-bustion, such as CO2 and N2 if air is used as the gasifying agent.
3. The discharge of pollutants to the environment is avoided.
4. No capital investment for an air separation unit arises compensating forthe more complex reactor technology and solar radiation concentrationinstallations.
The direct irradiation of reactants further provides an efficient means ofheat transfer directly to the reaction site. Reaction kinetics are enhanced,and the limitations imposed by indirect heat transport are bypassed similarto a conventional autothermic reactor heated by internal combustion.
2.3 Feedstock characterization
This chapter outlines some of the basic feedstock properties that are impor-tant for the experimentation and modeling work of this thesis. The produc-tion of petcoke is described in Chapter 2.3.1 with special consideration ofthe two coke types used in this thesis. Next, the chemical composition of thecokes is presented in Chapter 2.3.2 and the sample preparation procedure ispresented in Chapter 2.3.3.
2.3.1 Petroleum coke
The gasification experiments presented in this thesis are performed with pet-coke being a gray to black solid consisting mainly of carbon. Two differenttypes of petcokes are used: A Flexicoke and a delayed coke (PD coke) derivedfrom the processing of Venezuelan extra heavy crude oil from the Petrozuataoil field located in the Orinoco belt. Manufacturer of the petcokes is theVenezuelan oil company PDVSA.

16 CHAPTER 2. BACKGROUND AND LITERATURE REVIEW
From a chemical point of view, coking can be considered as a severethermal cracking process in which one of the end products is carbon (coke).Coking is used to convert low grade feed stocks to coke, gas, and distillates.Compared to other carbonaceous fuels such as coal, petcoke has a low reac-tivity under normal conditions.
Two types of coking processes are predominantly used in refineries [14,79, 27, 15]:
1. Delayed coking is a semibatch process that uses multiple coking cham-bers whereof one drum is making coke from refinery residues and onedrum is being decoked.
2. Fully continuous processes, such as Fluid- and Flexicoking, where hy-drocarbons are coked in a fluidized bed and coke is withdrawn as afluidized solid.
Typical feedstocks for coking units are crude oil residues obtained fromthe vacuum distillation. The products obtained from coking are gases, naph-tha, fuel oil, gas oil, and solid coke. The formation of large quantities ofcoke is usually a severe problem unless the coke can be put to use. Possi-ble options for the use of coke are combustion as a means of steam raising,gasification and stockpiling. In opposition to coal, petcoke is low in volatilesand contains a substantial amount of vanadium, nickel, and sulfur.
A considerable amount of the produced delayed coke is stabilized in an ad-ditional calcination step, which includes the elimination of water and higherboiling hydrocarbons contained in the petcoke at temperatures around 1400◦C. Under calcination conditions an expansion of the crystallite size takesplace because of the cracking of side chains. At the same time the originalhydrogen content of about 3.5 wt% is reduced to below 0.1 wt%. Undergraphitization conditions (≈ 2900 ◦C) good crystallized forms of petcoke aretransformed into graphites that can be used as anodes for the metal reduction[14].
Delayed coking
Delayed coking is the oldest and most widely used coking process. It makesuse of the fact that refinery residues can be heated above the coking pointwithout significant coke formation as long as heaters with a sufficiently highflow rate are used.
2.3. FEEDSTOCK CHARACTERIZATION 17
Delayed coking units consist of a fractionator, a heater, and a pair ofcoke drums whereof one is on stream and one is cleaned. The bottom of thefractionator column is heated above the coking point as aforementioned andtransfered to large insulated coking drums that provide long residence times(≈ 24 hours) and allow the cracking reactions to proceed to completion. Theheater typically operates at 480 to 500 ◦C and the temperature in the cokedrum ranges from 415 to 450 ◦C at pressures from 100 to 620 kPa.
The condensation reactions that give rise to the highly aromatic cokeproduct also tend to retain sulfur, nitrogen, and metals causing an enrichmentof these elements in the solid coke. Therefore, petcoke has a high content ofsulfur and heavy metals imposing an additional restriction with respect to afurther use of petcoke as a fuel for combustion processes [79, 27, 15].
Fluid and Flexicoking
Fluid coking is a continuous process consisting of two vessels, a fluidized bedreactor where the feed is converted to coke and a burner for the generationof the required heat. Small coke particles produced in the process circulatebetween the vessels acting as a heat transfer medium. Flexicoking is a directdescendant of fluid coking and uses the same configuration as a fluid cokerbut includes an additional gasification step that keeps the solid inventoryconstant by gasification of excess coke.
The reactor contains a fluidized bed of coke particles, and steam is in-troduced at the bottom as fluidization agent. The feed consisting of refineryresidues is injected directly into the reactor. The temperature in the cokingvessel ranges from 480 to 570 ◦C, pressure is atmospheric and residence timeis in the order of 15-30 s. Part of the incoming feed is vaporized, and partdeposits on the fluidized coke particles. The material on the particle surfacecracks and vaporizes to form laminated layer of dry coke. Coke is constantlywithdrawn from the reactor and fed to the burner where it is partially burntto generate the reactor heat. Excess coke from the reactor-burner circuit isfed to a fluidized bed gasifier and converted to a low heating value gas usingsteam and air.
Flexicoke exhibits an onion type structure. Because of the higher ther-mal cracking severity used in the fluid coker compared to the delayed coker,Flexicoke is much harder and denser than delayed coke. It also contains asmaller amount of volatiles and has the highest metal content of all cokes.
18 CHAPTER 2. BACKGROUND AND LITERATURE REVIEW
2.3.2 Chemical composition
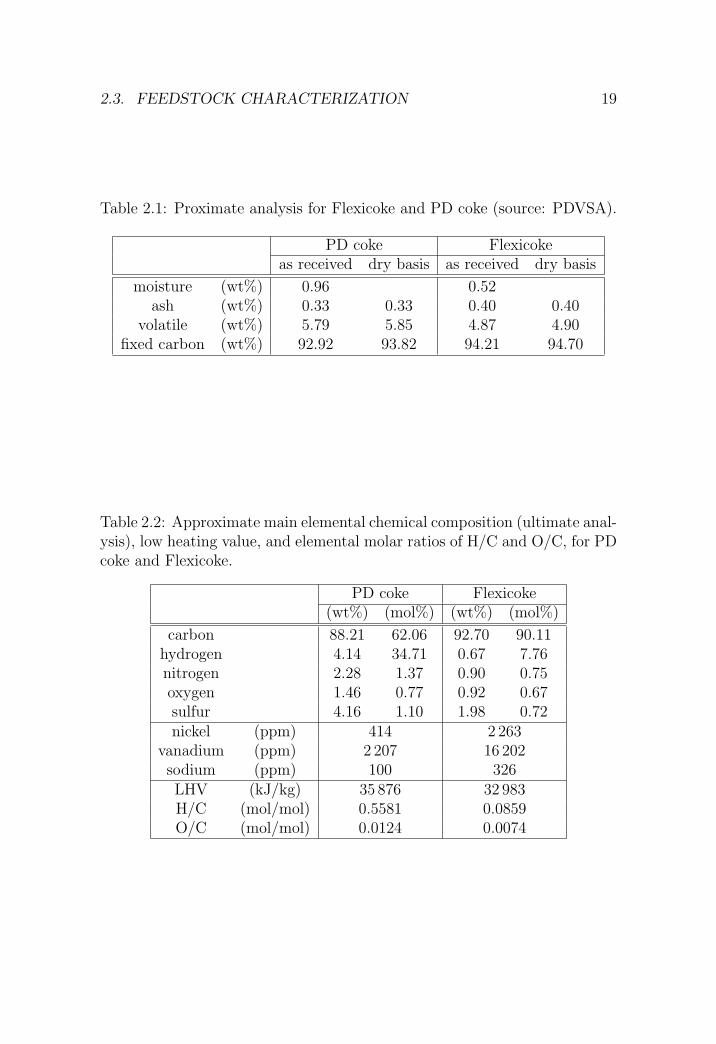
The composition of the coke is expressed in terms of the proximate andultimate analyses, which are generally used to characterize solid fuels. Therespective data for PD coke and Flexicoke are listed in Tables 2.1 and 2.2.
Proximate analysis. The proximate analysis includes the determinationof moisture, volatile matter, fixed carbon (by difference), and ash usingmethods defined by the ASTM. PD coke contains about 1% moisture, 5.8%volatiles and as little as 0.3% ash. The amount of moisture and volatiles inFlexicoke is lower because of the more severe conditions of the Flexicokingprocess, and the ash content is higher than that reported for PD coke.
Since for both coke types the amount of ashes is very low compared to theoverall sample weight, the ash content is not included in the calculation ofthe chemical conversion. Moreover, the formation of an ash layer around thecoke particle is excluded from the heterogeneous models presented in Chapter4.1 as a possible source of mass transfer limitation between the gas and solidphase. Nevertheless, there is a possible catalytic effect of mineral matterpresent in the ash that affects the overall reactivity of the coke. Catalyticeffects of certain coke components are assumed to be adequately modeled bythe reaction kinetics taking into account the specific reactivity of the differentcoke types.
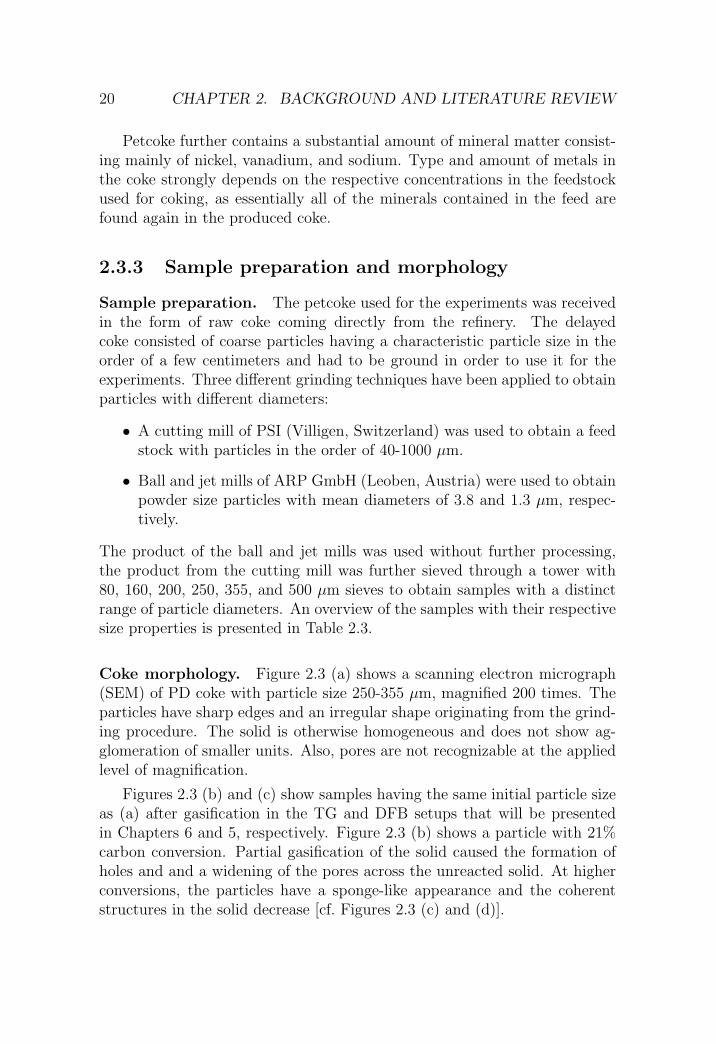
Ultimate analysis. Table 2.2 presents the ultimate analysis describing theapproximate main elemental chemical composition of the coke in percent solidmass. The obviously most abundant element on a weight basis is carbon with88 and 93% for PD coke and Flexicoke, respectively. The high carbon contentis a direct consequence of the coking process converting refinery residues intoa carbon rich solid, gas, and distillates. The second-most important elementon a mass basis is sulfur followed by hydrogen, nitrogen, and oxygen.
The sulfur content in PD coke being 4.1% is more than twice that ofFlexicoke and states a serious drawback with regard to the use of coke as afuel for a combustion process due to the formation of SO2.
The weight fraction of hydrogen is relatively low for both cokes but stillaccounts for more than 4% of the total mass in the case of PD coke vis-a-vis only 0.67% in the case of Flexicoke. Taking into account the low molarweight of hydrogen results in a molar hydrogen fraction of 34.7% for PDcoke. Hydrogen is therefore the second-most frequent element behind carbonin this coke type accounting for as much as one third of all atoms.
2.3. FEEDSTOCK CHARACTERIZATION 19
Table 2.1: Proximate analysis for Flexicoke and PD coke (source: PDVSA).
PD coke Flexicokeas received dry basis as received dry basis
moisture (wt%) 0.96 0.52ash (wt%) 0.33 0.33 0.40 0.40
volatile (wt%) 5.79 5.85 4.87 4.90fixed carbon (wt%) 92.92 93.82 94.21 94.70
Table 2.2: Approximate main elemental chemical composition (ultimate anal-ysis), low heating value, and elemental molar ratios of H/C and O/C, for PDcoke and Flexicoke.
PD coke Flexicoke(wt%) (mol%) (wt%) (mol%)
carbon 88.21 62.06 92.70 90.11hydrogen 4.14 34.71 0.67 7.76nitrogen 2.28 1.37 0.90 0.75oxygen 1.46 0.77 0.92 0.67sulfur 4.16 1.10 1.98 0.72nickel (ppm) 414 2 263
vanadium (ppm) 2 207 16 202sodium (ppm) 100 326LHV (kJ/kg) 35 876 32 983H/C (mol/mol) 0.5581 0.0859O/C (mol/mol) 0.0124 0.0074
20 CHAPTER 2. BACKGROUND AND LITERATURE REVIEW
Petcoke further contains a substantial amount of mineral matter consist-ing mainly of nickel, vanadium, and sodium. Type and amount of metals inthe coke strongly depends on the respective concentrations in the feedstockused for coking, as essentially all of the minerals contained in the feed arefound again in the produced coke.
2.3.3 Sample preparation and morphology
Sample preparation. The petcoke used for the experiments was receivedin the form of raw coke coming directly from the refinery. The delayedcoke consisted of coarse particles having a characteristic particle size in theorder of a few centimeters and had to be ground in order to use it for theexperiments. Three different grinding techniques have been applied to obtainparticles with different diameters:
• A cutting mill of PSI (Villigen, Switzerland) was used to obtain a feedstock with particles in the order of 40-1000 µm.
• Ball and jet mills of ARP GmbH (Leoben, Austria) were used to obtainpowder size particles with mean diameters of 3.8 and 1.3 µm, respec-tively.
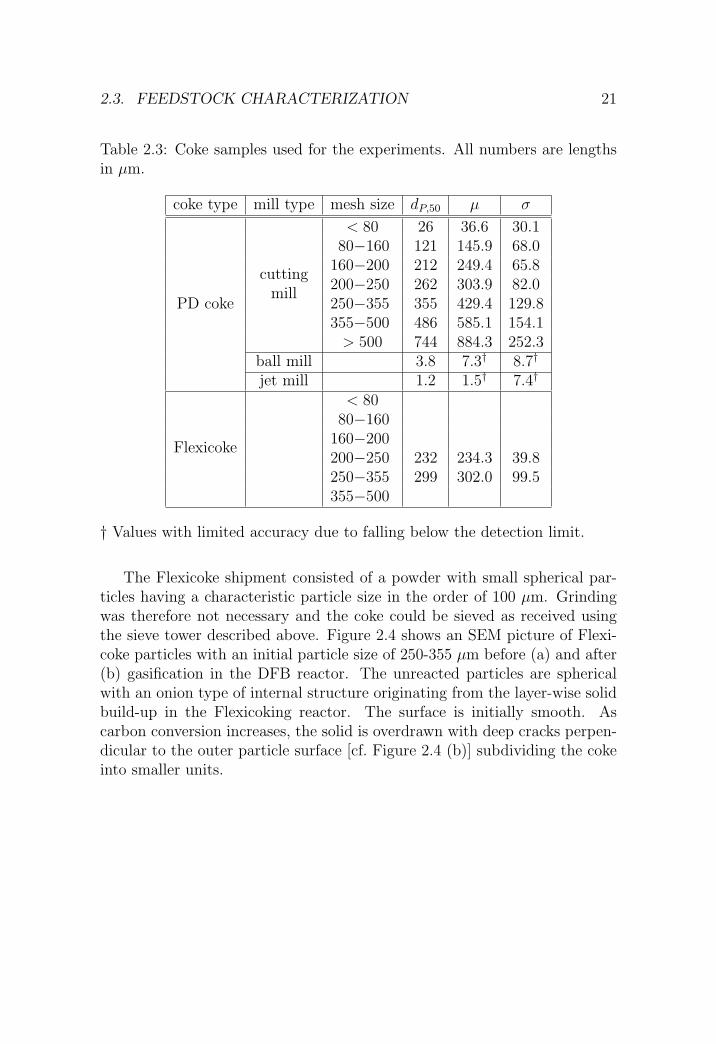
The product of the ball and jet mills was used without further processing,the product from the cutting mill was further sieved through a tower with80, 160, 200, 250, 355, and 500 µm sieves to obtain samples with a distinctrange of particle diameters. An overview of the samples with their respectivesize properties is presented in Table 2.3.
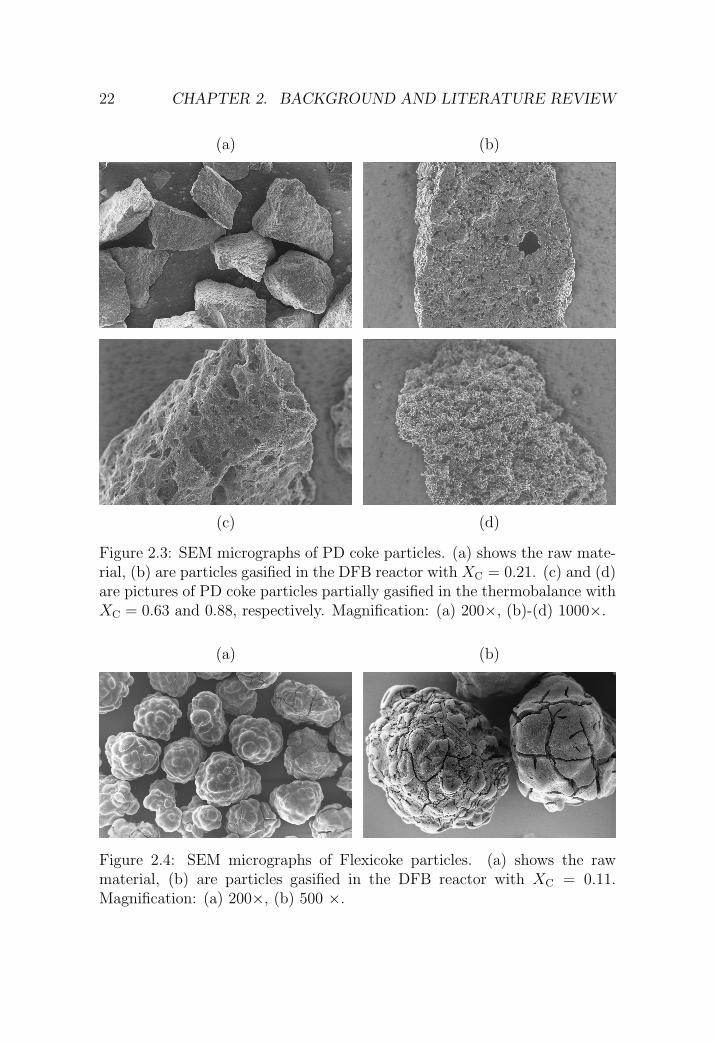
Coke morphology. Figure 2.3 (a) shows a scanning electron micrograph(SEM) of PD coke with particle size 250-355 µm, magnified 200 times. Theparticles have sharp edges and an irregular shape originating from the grind-ing procedure. The solid is otherwise homogeneous and does not show ag-glomeration of smaller units. Also, pores are not recognizable at the appliedlevel of magnification.
Figures 2.3 (b) and (c) show samples having the same initial particle sizeas (a) after gasification in the TG and DFB setups that will be presentedin Chapters 6 and 5, respectively. Figure 2.3 (b) shows a particle with 21%carbon conversion. Partial gasification of the solid caused the formation ofholes and and a widening of the pores across the unreacted solid. At higherconversions, the particles have a sponge-like appearance and the coherentstructures in the solid decrease [cf. Figures 2.3 (c) and (d)].
2.3. FEEDSTOCK CHARACTERIZATION 21
Table 2.3: Coke samples used for the experiments. All numbers are lengthsin µm.
coke type mill type mesh size dP,50 µ σ
< 80 26 36.6 30.180−160 121 145.9 68.0
160−200 212 249.4 65.8cutting
200−250 262 303.9 82.0PD coke
mill250−355 355 429.4 129.8355−500 486 585.1 154.1
> 500 744 884.3 252.3ball mill 3.8 7.3† 8.7†
jet mill 1.2 1.5† 7.4†
< 8080−160
160−200Flexicoke
200−250 232 234.3 39.8250−355 299 302.0 99.5355−500
† Values with limited accuracy due to falling below the detection limit.
The Flexicoke shipment consisted of a powder with small spherical par-ticles having a characteristic particle size in the order of 100 µm. Grindingwas therefore not necessary and the coke could be sieved as received usingthe sieve tower described above. Figure 2.4 shows an SEM picture of Flexi-coke particles with an initial particle size of 250-355 µm before (a) and after(b) gasification in the DFB reactor. The unreacted particles are sphericalwith an onion type of internal structure originating from the layer-wise solidbuild-up in the Flexicoking reactor. The surface is initially smooth. Ascarbon conversion increases, the solid is overdrawn with deep cracks perpen-dicular to the outer particle surface [cf. Figure 2.4 (b)] subdividing the cokeinto smaller units.
22 CHAPTER 2. BACKGROUND AND LITERATURE REVIEW
(a) (b)
(c) (d)
Figure 2.3: SEM micrographs of PD coke particles. (a) shows the raw mate-rial, (b) are particles gasified in the DFB reactor with XC = 0.21. (c) and (d)are pictures of PD coke particles partially gasified in the thermobalance withXC = 0.63 and 0.88, respectively. Magnification: (a) 200×, (b)-(d) 1000×.
(a) (b)
Figure 2.4: SEM micrographs of Flexicoke particles. (a) shows the rawmaterial, (b) are particles gasified in the DFB reactor with XC = 0.11.Magnification: (a) 200×, (b) 500 ×.

Chapter 3
Thermodynamics1
This chapter presents the chemical thermodynamics of the steam gasificationof petcoke. Chemical equilibrium compositions are computed over a widerange of temperatures. A 2nd-law analysis is conducted to determine themaximum solar exergy conversion efficiency and to identify the major sourcesof irreversibility.
Together with the reaction kinetics presented in Chapters 4, 5, and 6,this information determines the constrains to be imposed on the design andefficient operation of the solar chemical reactor.
3.1 Equilibrium composition
The steam gasification of petcoke is a complex process, but the overall chem-ical conversion can be represented by the simplified net reaction:
CHxOy + (1− y)H2O =(x
2+ 1− y
)H2 + CO (3.1)
where x and y are the elemental molar ratios of H/C and O/C in petcoke,respectively. The chemical product is syngas, whose quality depends on xand y. Table 2.2 on page 19 shows the approximate chemical composition,the low heating value, and the elemental molar ratios for Flexicoke and PDcoke.
1Material from this chapter has been published in ‘D. Trommer, F. Noembrini, M.Fasciana, et al. Hydrogen production by steam gasification of petroleum coke using con-centrated solar power I. Thermodynamic and kinetic analyses. International Journal ofHydrogen Energy, 2005. 30(6): p. 605-618’, and in ‘D. Trommer, M. Romero, H. Rivas,and A. Steinfeld. Hydrogen production via steam gasification of petroleum coke usingconcentrated solar power. in AchemAmerica. 2003. Mexico City’.
23

24 CHAPTER 3. THERMODYNAMICS
In the analysis that follows, sulfur compounds and other impurities con-tained in the raw materials are omitted. These are of course important,but it is assumed that their exclusion does not affect the main conclusions.The moisture content (cf. Table 2.1 on page 19) is also not accounted forin Equation (3.1), but the stoichiometric addition of water can be adjustedaccordingly.
Equation (3.1) summarizes the overall reaction, but a group of competingintermediate reactions that are essential for the successful gasification needto be considered, namely:
steam gasification:C(gr) + H2O = CO + H2 (3.2)
Boudouard equilibrium:
2 CO = C(gr) + CO2 (3.3)
methanation:C(gr) + 2 H2 = CH4 (3.4)
reforming:CH4 + H2O = CO + 3 H2 (3.5)
water-gas shift:CO + H2O = CO2 + H2 (3.6)
all of which depend strongly on the temperature as well as on the pressureand the carbon/oxygen ratio, and determine the relative amounts of H2, H2O,CO, CO2, CH4, in the gas phase, and C(gr) in the solid phase. The HSCOutokumpu code [72] was used to compute the equilibrium composition ofthe system CHxOy +(1−y)H2O at 1 bar and over the range of temperaturesof interest.
Figure 3.1 and 3.2 show the results for Flexicoke and PD coke, respec-tively. Species whose mole fraction is less than 10−5 have been omitted fromthe figures. Below about 700 K, CH4, CO2, H2O are the thermodynamicallystable components. In the temperature range 800-1100 K, they are used upby a combination of reactions (3.1) to (3.6). When the gasification goes tocompletion, at above about 1300 K, the chemical system consists of a singlegas phase containing H2 and CO in a molar ratio equal to (x/2+1− y), 1.03for Flexicoke and 1.17 for PD coke. Figure 3.3 shows the percent yield of H2
and CO as a function of temperature.
At above 1300 K, the yield for both types of coke exceeds 99%. Athigher pressures, as preferred in industrial applications, the thermodynamic

3.1. EQUILIBRIUM COMPOSITION 25
Figure 3.1: Variation of the thermodynamic equilibrium composition withtemperature of the system CHxOy + (1− y)H2O at 1 bar for Flexicoke.
Figure 3.2: Variation of the thermodynamic equilibrium composition withtemperature of the system CHxOy + (1− y)H2O at 1 bar for PD coke.

26 CHAPTER 3. THERMODYNAMICS
Figure 3.3: Variation of the percent yield of H2 and CO with temperaturefor the gasification of Flexicoke and PD coke, assuming the equilibrium com-position in Figures 3.1 and 3.2, respectively.
Figure 3.4: Enthalpy change of reaction (3.2) as a function of temperatureT for the two types of petcoke, when the reactants are fed at 300 K andthe products are obtained at T having the equilibrium composition given inFigures 3.1 and 3.2.

3.2. ENTHALPY OF REACTION 27
equilibrium of Equation (3.1) is shifted to the left in such a way so as torelieve the pressure in accordance with Le Chatelier’s principle. For example,at 10 bar, the equilibrium composition for Flexicoke is shifted such that thegasification goes to 99% completion at above 1600 K, as shown also in Figure3.3. The results for the PD coke are comparable and the same conclusionscan be drawn regarding temperature requirements at higher pressures.
3.2 Enthalpy of reaction
Reaction (3.1) proceeds endothermically in the 800-1500 K range. Figure 3.4shows the enthalpy change of reaction (3.1) as a function of temperature Tfor the two types of petcoke, when the reactants are fed at 300 K and theproducts are obtained at T and having an equilibrium composition given inFigures 3.1 and 3.2, respectively.
Note that since petcoke has no reference enthalpy, all enthalpy changeswere calculated by assigning to petcoke (of stoichiometric formula CHxOy,with x and y given in Table 2.2) the reference enthalpy of {C(gr) + x/2H2 +y/2O2} at 300 K, and further adjusting for the small offset between thereported heating value of petcoke and the enthalpy change of reaction (3.7)at 300 K: [
C(gr) +x
2H2 +
y
2O2
]︸ ︷︷ ︸
CHxOy
+(1 +
x
4− y
2
)O2
=x
2H2O(g) + CO2 (3.7)
At 1300 K, gasifying Flexicoke requires about 18 000 kJ/kg, 2 100 kJ/kg morethan the energy required for gasifying PD coke. Part of the reason for thedifferent gasification enthalpies arises from the fact that more water is neededper unit weight of petcoke gasified as the elementary carbon content increases(see Equation (3.1) and Table 2.2), and consequently more energy is neededfor producing steam at the required reaction temperature. In summary, thesteam gasification process consumes about 56% and 44% of the LHV of thefeedstock for Flexicoke and PD coke, respectively.
3.3 Second law analysis
A 2nd-law (exergy) analysis is performed to examine two technically viableroutes for extracting power from the chemical products of the gasification,

28 CHAPTER 3. THERMODYNAMICS
and to establish a base for comparing them with electricity generation byconventional power plants, especially in terms of their CO2 mitigation po-tential. The analysis follows the derivation and notation described by v.Zedtwitz and Steinfeld [95].
3.3.1 System setup
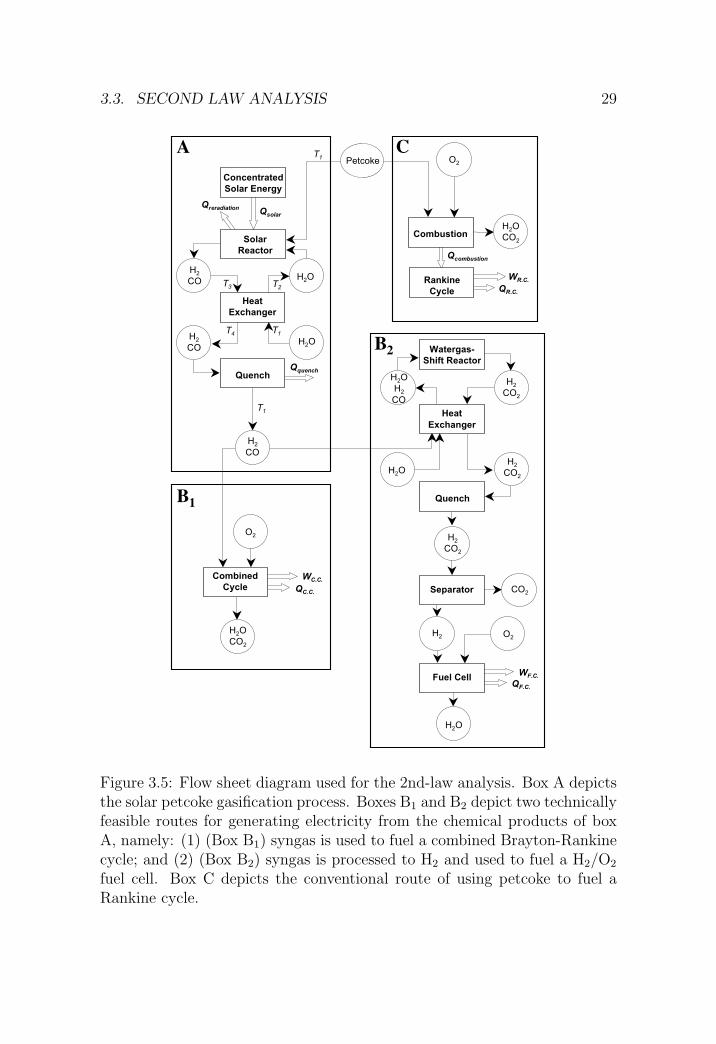
The complete process flow sheet is shown in Figure 3.5, with several optionalroutes grouped in boxes. Box A depicts the solar petcoke gasification processand includes the solar reactor, a heat exchanger, and a quencher. Boxes B1
and B2 depict two technically feasible routes for generating electricity fromthe chemical products of the solar petcoke gasification. These two routes are:
1. (box A + B1) syngas produced by solar steam gasification of petcoke isused to fuel a 55%-efficient combined Brayton-Rankine cycle; and
2. (box A + B2) syngas produced by solar steam-gasification of petcoke isfurther processed to H2 by water-gas shift followed by H2/CO2 separa-tion, and the H2 is used to fuel a 65%-efficient fuel cell.
The H2/CO2 separation unit is assumed to be based on the pressure swingadsorption technique (PSA) at 90% recovery rate [73]. Its minimum energyexpenditure is equal to the ∆G of unmixing, about 1% of the electric outputof the fuel cell. State-of-the-art stationary SOFC fuel cells feature energyconversion efficiencies in the range 55-60% when fed with natural gas, and inthe range 65-70% when fed directly with hydrogen since the relative loss inthe reformer is in the order of 10% [39].
Finally, box C depicts the conventional route for electricity generation byusing petcoke as a combustion fuel to a 35%-efficient Rankine cycle.
3.3.2 Results
Table 3.1 shows the complete energy balance and efficiencies calculation.Values for power are normalized to a petcoke mass flow rate of 1 g/s. Thethree routes considered for generating electricity are depicted by the boxesA + B1, A + B2, and C of Figure 3.5.
The calculations have been carried out using the following baseline pa-rameters for box A: mpetcoke = 1 g/s, Treactor = 1350 K, Ptot = 1 bar,I = 1 kW/m2, C = 2 000. Further, in box B1: ηC.C. = 55%, in box B2:ηF.C. = 65%, PSA with 90% recovery rate, and in box C: ηR.C. = 35%.
3.3. SECOND LAW ANALYSIS 29
QF.C.
QR.C.
Qquench
WC.C.
QC.C.
H2O
H2
CO2
Watergas-
Shift Reactor
Qcombustion
WR.C.H2O
Solar
Reactor
Qreradiation
Concentrated
Solar Energy
Qsolar
Rankine
Cycle
Petcoke O2
Separator
Quench
CO2
H2
Fuel Cell
H2O
CO2
Heat
Exchanger
H2
CO
H2O
H2
CO
H2
CO
O2
Combined
Cycle
H2O
CO2
H2O
H2
CO
Quench
Heat
Exchanger
H2
CO2
H2O
H2
CO2
WF.C.
O2
A
B2
B1
C
T4
T1
T1
T3 T
2
T1
Combustion
Figure 3.5: Flow sheet diagram used for the 2nd-law analysis. Box A depictsthe solar petcoke gasification process. Boxes B1 and B2 depict two technicallyfeasible routes for generating electricity from the chemical products of boxA, namely: (1) (Box B1) syngas is used to fuel a combined Brayton-Rankinecycle; and (2) (Box B2) syngas is processed to H2 and used to fuel a H2/O2
fuel cell. Box C depicts the conventional route of using petcoke to fuel aRankine cycle.

30 CHAPTER 3. THERMODYNAMICS
Table 3.1: Exergy analysis of the solar steam gasification of petcoke using theprocess modeling shown in Figure 3.5. Three routes for generating electricityare considered: 1) Route A + B1: solar petcoke gasification to syngas, whichis used to fuel a combined Brayton-Rankine cycle. 2) Route A + B2: solarpetcoke gasification to syngas and further processing to H2, which is used tofuel an H2/O2 fuel cell. 3) Route C: petcoke is used to fuel a Rankine cycle.
Units Flexicoke PD coke
Qsolar kW 12.93 11.02Qreradiation kW 1.22 1.04Qreactor ,net kW 11.71 9.98Qheat exchanger kW 2.89 2.65Qquench kW 2.35 2.72WC.C. kWe 23.21 23.68QC.C. kW 18.99 19.38WF.C. kWe 21.31 21.92QF.C. kW 1.93 1.99WR.C. kWe 11.54 12.56QR.C. kW 21.44 23.32ηabsorption - 0.906 0.906ηheat exchanger box A - 0.552 0.494ηheat exchanger box B2 - 0.615 0.618ηexergy for route A + B1 - 0.506 0.505ηexergy for route A + B2 - 0.464 0.467ηexergy for route C - 0.35 0.35E.O.a for route A + B1 kWhe/kg 6.45 6.58E.O. for route A + B2 kWhe/kg 5.92 6.09E.O. for route C kWhe/kg 3.21 3.49EGFb for route A + B1 - 2.01 1.89EGF for route A + B2 - 1.85 1.75CO2 emissions A + B1 kg CO2/kWhe 0.54 0.49CO2 emissions A + B2 kg CO2/kWhe 0.59 0.53CO2 emissions C kg CO2/kWhe 1.09 0.93
a E.O. = specific electric output.b EGF = electric gain factor; ratio of the electric output of the process tothat obtained when using the same amount of petcoke to fuel a 35%-efficientRankine cycle.
3.3. SECOND LAW ANALYSIS 31
The heat exchanger of box A is employed for producing steam at 1250K. Thus, steam and petcoke are fed to the solar reactor at 1250 and 300K, respectively, and the products of the solar reactor are cooled in the heatexchanger from 1350 K to 792 K and 852 K for Flexicoke and PD coke,respectively, before entering the quencher. The heat exchange of box B2,with ηheat exchanger = 62%, is employed to preheat the reactants to the water-gas shift reactor from 300 to 600 K.
The maximum exergy efficiency, defined as the ratio of electric power out-put to the thermal power input (solar power + heating value of reactants),amounts to 51% for route A + B1 and 47% for route A + B2. Thus, bothsolar gasification routes offer significantly higher exergy efficiencies than theconventional 35%-efficient route via the petcoke-fired Rankine cycle. Thepath to H2 and its use in high-efficient fuel cells (route A + B2) is thermo-dynamically less favorable than using syngas directly in a combined cycle(route A + B1), due the energy consumption in the processing of H2 fromsyngas, especially by the H2/CO2 separation.
Hydrogen and its use in fuel cells may be the preferable path for mobileand/or decentralized applications. In contrast, syngas may be the desiredfinal fuel for centralized power generation, or for applications in the chemicalindustry, e.g. synthesis of methanol and Fischer-Tropsch chemicals. Syngasmay also be fed directly to SOFC without the need for water-gas shift andgas separation stages, increasing the overall efficiency.
About 9.4% of the input solar power is lost by re-radiation and may befurther reduced by increasing the solar concentration ratio. The major sourceof irreversibility is, however, associated with the quenching of syngas exitingthe reactor: 41% and 49% of the solar power input may be lost by quenchingthe syngas from 1350 to 300 K, for Flexicoke and PD coke respectively. Thus,the use of the heat exchanger of Box A for recovering part of the sensibleheat of the syngas becomes justifiable.
Not considered in this analysis is the energy requirement for removingsulfur-containing compounds and other impurities from the syngas, by scrub-bing H2S or by other techniques. In general, the exergy efficiency of a solarenergy conversion process is an important criterion for judging its relativeeconomic potential: the higher it is, the lower is the required solar collectionarea for producing a given amount of fuel, and, consequently, the lower arethe costs of the solar concentrating system which usually correspond to abouthalf of the total investments for the entire solar plant [81].
Besides the exergy efficiency, an important figure-of-merit of the processperformance is the Electric Gain Factor (EGF), defined as the ratio of the
32 CHAPTER 3. THERMODYNAMICS
electric output of the process to that obtained when using the same amountof petcoke as a combustion fuel in a 35%-efficient Rankine cycle. The EGFfor the two electricity generation routes A + B1 and A + B2 are indicatedin Table 3.1 (EGF for route C is obviously 1), along with the specific CO2
emissions in kg CO2 per kWhe.
As expected, the EGF is highest for route A + B1 and reaches values of2.01 and 1.89 for Flexicoke and PD coke, respectively. The EGF is relativelyhigh also for route A + B2, reaching values of 1.85 and 1.75, respectively.Thus, both solar gasification routes offer a remarkable net gain in the elec-trical output, averaging about double specific electric output vis-a-vis thedirect use of petcoke for fueling a 35%-efficient Rankine cycle. Doubling thespecific electric output implies reducing by half the CO2 emissions. SpecificCO2 emissions amount to 0.49 - 0.56 kg CO2/kWhe, about half as much asthe specific emissions discharged by petcoke-fired power plants. Further, forthe fuel cell route, if after separating the streams of H2 and CO2 the latteris sequestered, the proposed process becomes a decarbonization process thatconverts petcoke to hydrogen without any release of CO2 to the atmosphere.
3.4 Summary and conclusions
This chapter presents an analysis of the thermodynamics of the steam-gasi-fication of petcoke using concentrated solar power. The equilibrium compo-sition of the stoichiometric system of petcoke and steam at 1 bar and 1300K consists of a single gas phase containing H2 and CO in a molar ratio equalto 1.03 and 1.17 for Flexicoke for PD coke, respectively. A 2nd-law analysisfor generating electricity using the gasification products indicates the poten-tial of doubling the specific electrical output and, consequently, halving thespecific CO2 emissions, vis-a-vis conventional petcoke-fired power plants.
In summary, the proposed petcoke/solar hybrid thermochemical processesconserves petroleum and reduces emissions. It further converts intermittentsolar energy into a storable and transportable chemical fuel. At the sametime, petcoke is solar-upgraded to a cleaner fluid fuel that can be used forelectricity generation in highly efficient combined cycles or fuel cells. In con-trast to the gasification using process heat derived from the internal petcokecombustion, the solar-driven gasification produces high quality syngas thatis not contaminated by the products of combustion. Syngas can be furtherprocessed to separate streams of H2 and CO2; if the latter is sequestered, theproposed process becomes a decarbonization process that converts petcoketo hydrogen without release of CO2 to the atmosphere.
Chapter 4
Reaction kinetics1
4.1 Heterogeneous gas-solid reactions
The modeling of heterogeneous chemical reactions is complicated by a seriesof issues not encountered in homogeneous systems. Since more than onephase is present, rate equations for heterogeneous reactions often incorporatemass transfer terms in addition to the usual chemical kinetics term. The masstransfer terms may differ in type and number depending on the shape of theheterogeneous system. A general rate expression that holds for all reactingsystems is not available.
For a fluid-particle reaction as it is encountered in the H2O-CO2 gasifica-tion of coke, the following set of consecutive reaction steps (resistances) canbe identified:
Step I Diffusion of the reactant from the bulk gas through the gas film tothe external particle surface.
Step II Diffusion of the reactant from the particle surface through the poresto a reaction site.
Step IIIA Reactant adsorbs on the surface and is attached to an active site.
Step IIIB Reaction with the solid or a molecule from the gas phase (singlesite mechanism) or with an adjacent active site (dual site mechanism).
1Material from this chapter has been published in ‘D. Trommer and A. Steinfeld. Ki-netic modeling for the combined pyrolysis and steam gasification of petroleum coke andexperimental determination of the rate constants by dynamic thermogravimetry in the500-1520 K range. Energy & Fuels, 2006. 20(3): p. 1250-1258’.
33

34 CHAPTER 4. REACTION KINETICS
Step IIIC Desorption of the products from the solid surface.
Step IV Diffusion of the products from the reaction site across the pores tothe particle surface.
Step V Diffusion of the products from the external particle surface to thebulk gas.
Steps I and V describe the mass transfer of gaseous reactants and productsacross the fluid film surrounding the coke particle, described in Chapter 4.1.2.The structural particle model in Chapter 4.1.1 considers the steps II and IV.Steps IIIA to IIIC are considered by the Langmuir-Hinshelwood reactionmodel and treated in Chapter 4.3. The above list could be further extendedby an ash layer diffusion resistance, which is neglected since it has no practicalrelevance for the coke used in this study.
Depending on the physical and chemical boundary conditions of the sys-tem such as temperature, pressure, stoichiometry of the reaction, and solidporosity, different resistances from the list above can become rate control-ling since it is always the slowest step that controls the overall rate of theprocess. For the measurement of intrinsic chemical kinetics (i.e. based onreaction rates that are not affected by mass transfer limitations), it is de-sirable to choose the experimental conditions in order to obtain chemicalreaction control, which is usually encountered at low temperatures. If this isnot feasible diffusion effects have to be considered in the model, leading toundesired complication.
Another important issue is the contacting pattern of the involved phases.There are many possibilities to bring two phases in contact with each other.Real chemical reactors can usually be described using the assumption of anidealized flow pattern such as batch, semi-batch, mixed flow or plug flowmodels. It is essential to have a mathematical model that correctly repro-duces the physical situation of the reacting system. A mismatch in the flowmodel, for example, can easily result in a situation where the reaction ki-netics have been simulated with an amazing degree of accuracy and just thesame the resulting equations fail to give a correct prediction of a scale-up[49].
In the following chapters the models for the heterogeneous gasificationreaction of the H2O-CO2-coke system are presented starting on the particlescale with a structural model for a single coke particle (Chapter 4.1.1) andfollowed by the mass transfer model for the surrounding gas film (Chapter4.1.2). Chapter 4.2 presents a survey of reactor configurations that are used

4.1. HETEROGENEOUS GAS-SOLID REACTIONS 35
for the experimental campaigns of this thesis, including the models for therespective flow patterns.
4.1.1 Structural models for the coke particle
There are two important concepts in modeling of non-catalytic gas-solid reac-tions: The progressive-conversion model (PCM) and the shrinking unreactedcore model (SCM). The PCM and SCM models represent two idealizationsthat mark the extremes with respect to the reaction behavior of a solid par-ticle and delimit the burn-off characteristics of real particle reacting with asurrounding fluid [49, 99].
initialunreactedparticle
PCM
SCM
completelyreactedparticle
particle shrinks with time and finally disapears
Figure 4.1: Progressive-conversion and shrinking unreacted core model.
Progressive-conversion model. The progressive-conversion model as-sumes that the diffusion rates in the gas and solid phase are very fast com-pared to the reaction rate. The concentration of the gaseous reactant insidethe particle is everywhere the same and the overall gas-solid reaction rate issolely controlled by the intrinsic reactivity of the solid. While the reactiongoes to completion, the solid particle is uniformly converted to solid and/orfluid products, but the particle size rests unaltered as the reaction goes tocompletion (cf. PCM in Figure 4.1).
Shrinking unreacted core model. The shrinking-core model applies tonon-porous particles and situations where the rate of reaction is fast com-

36 CHAPTER 4. REACTION KINETICS
pared to the diffusion rate in the solid. The reaction thereby occurs at theouter surface of the unreacted particle. The reaction zone has the form ofa sharp line moving into the solid and leaving behind completely convertedas well as inert material (cf. SCM in Figure 4.1). Two cases are possible:(1) No inert material is present, and the solid is converted to a gas withoutthe formation of residues. This situation applies to the steam gasificationof petcoke which has a very low ash content and is essentially completelygasified. (2) For materials with a high content of inert material, a solid ashlayer is formed inhibiting further conversion due to diffusion limitation insidethe particle.
General model
The PCM and SCM models are frequently used idealizations for non-catalyticgas solid reactions applying to situations where either the rate of the gas-solid reaction in the particle is very fast compared to diffusion (SCM), or thediffusion process is very fast compared to the rate of the chemical reaction(PCM). In reality, a porous solid can exhibit the characteristics of bothmodels depending on the particle temperature: At low temperatures, thereaction is slow and the particle is best described by the SCM model. Athigh temperatures, the reaction rate is usually much faster than diffusionresulting in PCM behavior.
Diffusion with homogeneous reaction. If the reaction and diffusionrates inside a porous particle are of the same order of magnitude, an inter-mediate case between SCM and PCM arises with the reaction occurring in adiffuse zone, which can be as big as the entire particle. This case is schemat-ically shown in Figure 4.2: A gaseous reactant at the same time diffuses intoa spherical particle and reacts with the porous solid causing a characteristicconcentration gradient.
The concentration profile across a porous sphere in steady state is theresult of the differential mass conservation equation obtained from a massbalance over a spherical shell of thickness ∆R (cf. Figure 4.2) and taking thelimit for ∆R → 0 [11]:
1
R2
d
dR
(R2 n′′i
)= r′′i (pj, T ) i, j = H2O, H2, ... (4.1)
n′′i is the molar flux of species i per unit surface and time of a sphere withradius R and r′′i (pj, T ) is the homogeneous rate of reaction per unit volume.
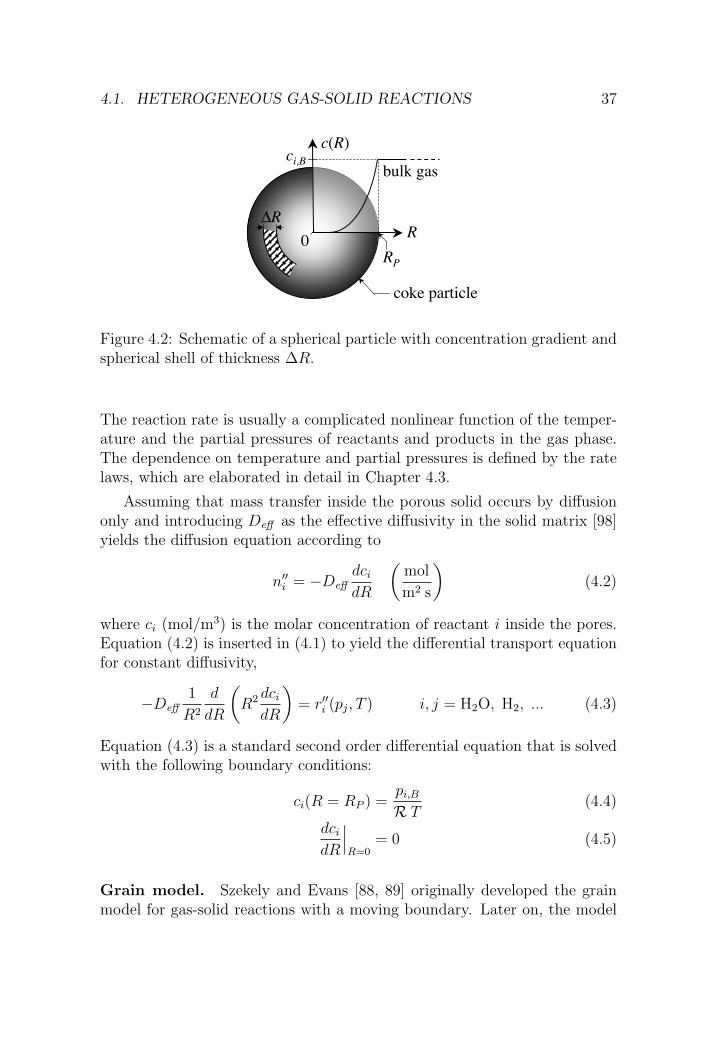
4.1. HETEROGENEOUS GAS-SOLID REACTIONS 37
R
c(R)
!R
ci,B
0RP
coke particle
bulk gas
Figure 4.2: Schematic of a spherical particle with concentration gradient andspherical shell of thickness ∆R.
The reaction rate is usually a complicated nonlinear function of the temper-ature and the partial pressures of reactants and products in the gas phase.The dependence on temperature and partial pressures is defined by the ratelaws, which are elaborated in detail in Chapter 4.3.
Assuming that mass transfer inside the porous solid occurs by diffusiononly and introducing Deff as the effective diffusivity in the solid matrix [98]yields the diffusion equation according to
n′′i = −Deffdci
dR
(mol
m2 s
)(4.2)
where ci (mol/m3) is the molar concentration of reactant i inside the pores.Equation (4.2) is inserted in (4.1) to yield the differential transport equationfor constant diffusivity,
−Deff1
R2
d
dR
(R2 dci
dR
)= r′′i (pj, T ) i, j = H2O, H2, ... (4.3)
Equation (4.3) is a standard second order differential equation that is solvedwith the following boundary conditions:
ci(R = RP ) =pi,B
R T(4.4)
dci
dR
∣∣∣R=0
= 0 (4.5)
Grain model. Szekely and Evans [88, 89] originally developed the grainmodel for gas-solid reactions with a moving boundary. Later on, the model
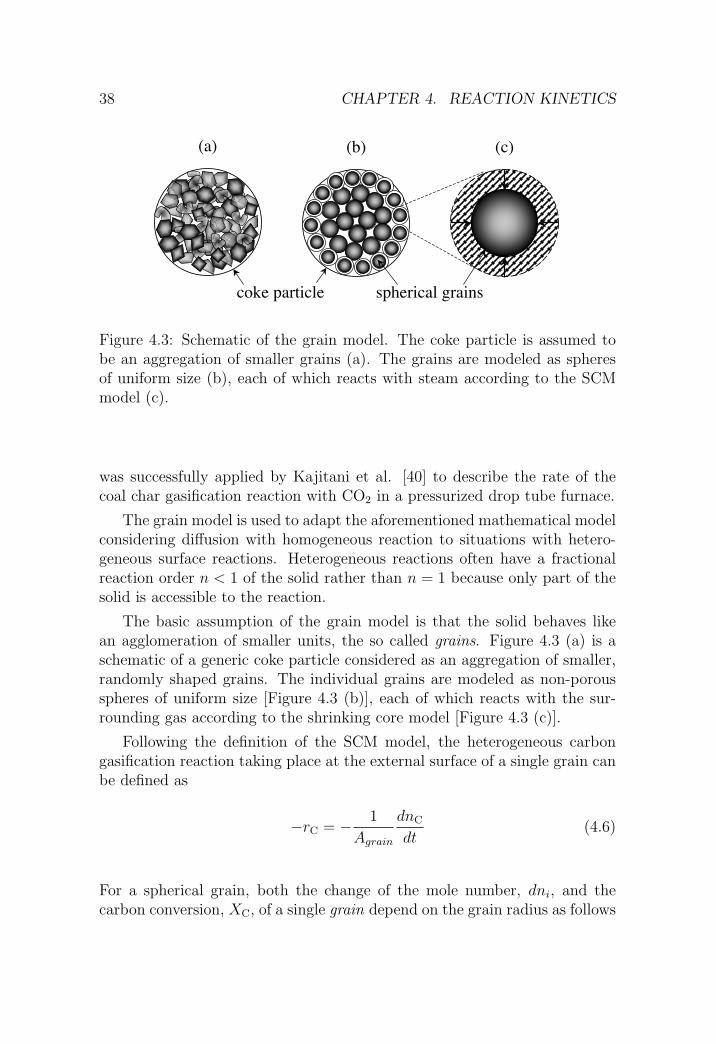
38 CHAPTER 4. REACTION KINETICS
(a) (c)(b)
coke particle spherical grains
Figure 4.3: Schematic of the grain model. The coke particle is assumed tobe an aggregation of smaller grains (a). The grains are modeled as spheresof uniform size (b), each of which reacts with steam according to the SCMmodel (c).
was successfully applied by Kajitani et al. [40] to describe the rate of thecoal char gasification reaction with CO2 in a pressurized drop tube furnace.
The grain model is used to adapt the aforementioned mathematical modelconsidering diffusion with homogeneous reaction to situations with hetero-geneous surface reactions. Heterogeneous reactions often have a fractionalreaction order n < 1 of the solid rather than n = 1 because only part of thesolid is accessible to the reaction.
The basic assumption of the grain model is that the solid behaves likean agglomeration of smaller units, the so called grains. Figure 4.3 (a) is aschematic of a generic coke particle considered as an aggregation of smaller,randomly shaped grains. The individual grains are modeled as non-porousspheres of uniform size [Figure 4.3 (b)], each of which reacts with the sur-rounding gas according to the shrinking core model [Figure 4.3 (c)].
Following the definition of the SCM model, the heterogeneous carbongasification reaction taking place at the external surface of a single grain canbe defined as
−rC = − 1
Agrain
dnC
dt(4.6)
For a spherical grain, both the change of the mole number, dni, and thecarbon conversion, XC, of a single grain depend on the grain radius as follows

4.1. HETEROGENEOUS GAS-SOLID REACTIONS 39
dni = ρvdV = ρv4πR2dR (4.7)
XC = 1− nC
nC,0
= 1−(
R
R0
)3
(4.8)
Therefore, assuming SCM behavior, the heterogeneous gasification reac-tion taking place at the external surface of the coke grain becomes
−rC = − 1
Agrain
dnC
dt= av,0
−1ρv (1−XC)−2/3 dXC
dt(4.9)
where av,0 is the surface to volume ratio of the grain at X = 0 and ρv is thevolumetric molar density of carbon.
Equation (4.9) is the surface specific reaction rate of a single grain. It canbe used to express the homogeneous reaction inside the coke particle, r′′i , asit appears in Equation (4.3), in terms of a pseudo homogeneous surface reac-tion based on the coke’s specific volumetric surface. The specific volumetricsurface of the coke, av, is defined as
av =Acoke
Vcoke
(4.10)
and therefore the homogeneous rate, r′′i , becomes
r′′i =Acoke
Vcoke
ri = av,coke ri (4.11)
and for C : − r′′C = ρv (1−XC)−2/3 dXC
dt(4.12)
Substituting Equation (4.12) into Equation (4.3) yields the governing equa-tion of the grain model
−Deff1
R2
d
dR
(R2 dci
dR
)= avri (4.13)
The solution to differential equations of this type describing diffusioninside the particle in the presence of a chemical reaction is obtained in theform of a radial concentration profile, c(R). Usually, the concentration profileis given in terms of the dimensionless Thiele Modulus
φM = L
√n + 1
2
k(T )cn−1i
Deff (T )(4.14)

40 CHAPTER 4. REACTION KINETICS
where L is a characteristic spacial dimension of the particle, n is the reactionorder, and k(T ) a reaction constant.
Since the concentration profile is only of theoretical interest, sources fre-quently report the effect of mass transfer limitations inside the solid in theform of the particle effectiveness factor, ηP . The particle effectiveness fac-tor is defined as the ratio of the observed overall reaction rate, robs , andthe intrinsic rate of reaction, rintr , that would be observed under the sameconditions as robs if diffusion inside the solid was instantaneous [49, 11, 16]:
ηP =robs
rintr
(4.15)
Straight forward analytical solutions for ηP in terms of φM are availablefor the case of simple n-th order power law kinetics, ri = k ·pn
i with n ≥ 0, see[49]. For complicated rate expressions the solution of Equation (4.3) is notreadily accessible and requires detailed knowledge of the particle porosity andits change with increasing carbon conversion. Models for complex kineticsfurther require additional stoichiometric and empirical corrections, see [48,87].
A pore-level calculation required to solve the above problem is beyond thescope of this thesis. ηP is therefore determined experimentally by TG exper-iments using samples with different particle sizes. Equation (4.15) is used incombination with an empirical correlation between effectiveness factor andparticle size to model the variation of the gasification rate with particle size.The correlation for ηP is shown together with the corresponding experimentaldata in Chapter 5.2.2 on page 68.
4.1.2 Mass transfer model for the gas phase
A mass transfer model for the transport of reactants and products in the gasphase surrounding the coke particle has to be considered in situations wherethe film mass transfer has a limiting effect on the overall rate of the chemicalreaction. Film diffusion resistances are particularly important in reactingsystems characterized by high temperatures and big particles. However, filmdiffusion is negligible in reacting systems characterized by very small particlesand/or slow chemical reactions due to low temperature.
Simple theories for interfacial mass transfer usually assume that a stag-nant fluid film exists near every surface [16]. If the reactant diffusing acrossthe film is dilute, the convection induced by diffusion is negligible and a sim-ple expression for the steady state flux can be obtained in terms of a mass

4.1. HETEROGENEOUS GAS-SOLID REACTIONS 41
transfer coefficient, kmtf ,
n′′i = kmtf (pi,I − pi,B) (4.16)
where pi,I is the partial pressure of component i at the gas-solid interfaceand pi,B is the partial pressure in the bulk phase. Different expressions forkmtf according to the theories of film, penetration, and surface renewal areavailable from [16].
If the rate of the chemical reaction is available in a simple form e.g. asa first or second order reaction or a power law expression, it is possible toobtain an overall rate expression for the series of mass transfer and chemicalreaction. The overall rate expression depends on the bulk gas compositionand is obtained by eliminating the unknown gas concentrations at the particlesurface via equating the rate of the chemical reaction with the rate of themass transfer.
However, the gasification of petcoke considered in this thesis is compli-cated by two issues that prevent the use of the aforementioned simple ap-proach to derive a single expression taking into account both chemical reac-tion and mass transfer:
1. Reactants and products in the considered experimental setups are notdilute and the gasification reaction produces a significant amount ofgas at the particle-gas interface. It is therefore inevitable to includeconvection in the mass transfer model.
2. The Langmuir-Hinshelwood rate equations used in this thesis are com-plicated expressions of the partial pressures of the involved species [cf.Equations (4.53) and (4.83)] and do not allow to eliminate the unknowninterface concentration analytically.
As a consequence, stagnant film models can not be used and a more so-phisticated model has to be developed, which considers convection in theboundary layer. Since there is no analytical solution for the unknown inter-face concentration of the gaseous reactants and products, the series of masstransfer and chemical reaction has to be solved numerically.
The mass transfer model presented in the following paragraph is an adap-tion of a model presented by Welty et al. [98] for the combustion of pulverizedcoal particles. The model provides a mathematical expression for the masstransfer of component i across a finite concentration boundary layer. Theoverall rate of reaction is then obtained by equating this expression with rateof the chemical reaction of component i and calculating the root in terms ofthe unknown interface composition.
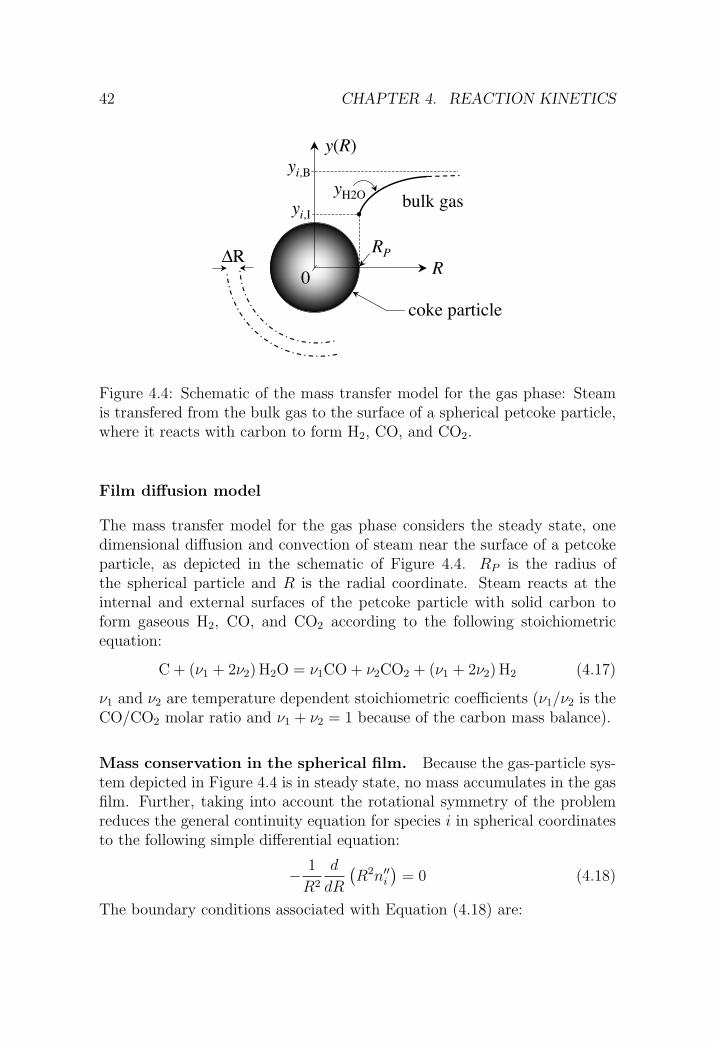
42 CHAPTER 4. REACTION KINETICS
R
RP
coke particle
0
yi,I
yi,B
y(R)
bulk gasyH2O
!R
Figure 4.4: Schematic of the mass transfer model for the gas phase: Steamis transfered from the bulk gas to the surface of a spherical petcoke particle,where it reacts with carbon to form H2, CO, and CO2.
Film diffusion model
The mass transfer model for the gas phase considers the steady state, onedimensional diffusion and convection of steam near the surface of a petcokeparticle, as depicted in the schematic of Figure 4.4. RP is the radius ofthe spherical particle and R is the radial coordinate. Steam reacts at theinternal and external surfaces of the petcoke particle with solid carbon toform gaseous H2, CO, and CO2 according to the following stoichiometricequation:
C + (ν1 + 2ν2) H2O = ν1CO + ν2CO2 + (ν1 + 2ν2) H2 (4.17)
ν1 and ν2 are temperature dependent stoichiometric coefficients (ν1/ν2 is theCO/CO2 molar ratio and ν1 + ν2 = 1 because of the carbon mass balance).
Mass conservation in the spherical film. Because the gas-particle sys-tem depicted in Figure 4.4 is in steady state, no mass accumulates in the gasfilm. Further, taking into account the rotational symmetry of the problemreduces the general continuity equation for species i in spherical coordinatesto the following simple differential equation:
− 1
R2
d
dR
(R2n′′i
)= 0 (4.18)
The boundary conditions associated with Equation (4.18) are:

4.1. HETEROGENEOUS GAS-SOLID REACTIONS 43
• The molar concentration of species i at an infinite distance from theparticle surface equals the bulk concentration.
yi(R = ∞) = yi,B =pi,B
Ptot
(4.19)
• The molar flux of species i at the particle surface, n′′i (R = RP ), equalsthe overall rate of the gasification reaction throughout the entire cokeparticle divided by its outer surface.
n′′i (R = RP ) = ηP · ri(yj,I , P, T )mcoke a
AP
(4.20)
The overall rate of the chemical reaction is calculated with Equation(4.15) from the particle model in Chapter 4.1.1 and the rate laws forrintr to be described in Chapter 4.3. The controlling concentration forthe chemical reaction is the concentration at the particle-gas interfacerather than the bulk concentration as in Chapter 4.1.1.
The molar flux of i at a radial position R, n′′i (R), is obtained from inte-gration of the mass transfer Equation (4.18) and subsequent insertion of theboundary condition (4.20):
n′′i (R) = ηP · ri(yj,I , P, T )mcoke a
AP
(RP
R
)2
(4.21)
with [n′′i ] =
(mol
m2 · s
)and i, j = H2O, H2, ...
Flux equation. The molar flux equation for component i in the radialdirection is defined as the sum of the diffusive and convective flows [16]
n′′i = j′′i + yi
∑j
n′′j (4.22)
∑j n′′j represents the total radial convective flow and j′′i the molar diffusion
flux according to Fick’s law
j′′i = −c ·Did
dRyi (4.23)
where c is the overall molar concentration of the gas phase.

44 CHAPTER 4. REACTION KINETICS
H2O is considered as the key transporting species. The respective diffu-sion Equation (4.22) takes the form
n′′H2O = −c ·DH2O,mdyH2O
dR+ yH2O
(n′′H2O + n′′CO + n′′CO2
+ n′′H2+ n′′Ar
)(4.24)
where DH2O,m is the multicomponent diffusion coefficient of steam into themixture of Ar, H2, CO, CO2 and CH4. DH2O,m is calculated using Blanc’s law[68] that gives an estimate of the true multicomponent diffusion coefficientbeing difficult to calculate [16].
Di,m =
(n∑
j=1j 6=i
yj
Di,j
)−1
(4.25)
The equations for the fluxes of H2, CO, and CO2 result from the stoi-chiometry of the gasification reaction, Equation (4.17). Argon has no nettransfer, since it is an inert [98]. The molar fluxes of the remaining speciescan be expressed in terms of the steam flux, n′′H2O, as follows:
n′′CO = − ν1
ν1 + 2ν2
n′′H2O (4.26)
n′′CO2= − ν2
ν1 + 2ν2
n′′H2O (4.27)
n′′H2= −n′′H2O (4.28)
Substituting Equations (4.26), (4.27), and (4.28) into (4.24) yields thediffusion equation depending only on the steam flux and the stoichiometriccoefficients:
n′′H2O = − c ·DH2O,m
1 + yH2O ν1,2
dyH2O
dR(4.29)
with
ν1,2 =ν1 + ν2
ν1 + 2ν2
(4.30)
Integration of Equation (4.29) over the gas phase (R = RP →∞) resultsin the flux equation for steam
n′′H2O(R) =RP
R2
c ·DH2O,m
ν1,2
ln
(1 + yH2O,I ν1,2
1 + yH2O,B ν1,2
)(4.31)
The remaining species, i.e. H2, CO, and CO2, are obtained from Equations(4.26) to (4.28).
4.2. EXPERIMENTAL SYSTEMS FOR KINETIC ANALYSES 45
The amount of steam transfered from the particle to the gas phase isthe product of the steam flux and the external surface area of the particle,AP = 4πRP
2:
AP · n′′H2O(R = RP ) = 4πRPc ·DH2O,m
ν1,2
ln
(1 + yH2O,I ν1,2
1 + yH2O,B ν1,2
)(4.32)
The overall rate of reaction, ri,obs , is the result of the series process con-sisting of the two resistances ‘film diffusion’ and ‘surface reaction’ and isobtained from equating Equation (4.32) for the amount of gas transferedin the fluid film with the rate of the gasification reaction elaborated in theprevious section:
AP · n′′i (RP , yj,B, yj,I) = ηP mP a ri(yj,I , P, T ) (4.33)
with i, j = H2O, H2, ...
Equation (4.33) is a system of four equations that is solved numerically forthe unknown interface composition, yj,I . The result is used to calculatethe overall rate of reaction with the right hand side of Equation (4.33). Adiscussion of the effect of the gas phase mass transfer resistance on the overallrate of the gasification reaction is presented in Chapter 8.4.2 for the modelof the 5 kW process reactor.
4.2 Experimental systems for kinetic
analyses
4.2.1 Differential and integral reactors
The experimental strategy in studying the rate of heterogeneous gas-solidreactions and rate law exploration usually involves measuring the extent ofconversion in a semi-batch setup operated with a steady fluid flow. Reactorswith any flow pattern (mixed flow, plug flow, etc) can be used, as long asthe pattern selected is known; otherwise the kinetics can not be found [49].
Two reactor concepts for the analysis of experimental rate data can bedistinguished. They are briefly discussed at this point, as there is a certainrelevance to the evaluation of the experimental rate data in the followingchapters:

46 CHAPTER 4. REACTION KINETICS
Differential reactor. The basic assumption behind a differential flow re-actor is that the reaction rate is constant at all points within the reactor.Since heterogeneous reactions are concentration-dependent, this assumptionis only reasonable in the case of small conversion and/or small reactors. Anexample of a differential reactor is the thermogravimeter discussed in Chap-ter 5: The samples used for TG experiments are small (≈ 30-40 mg) andmass transfer in the gas phase surrounding the coke particles is consideredto be fast. Therefore, no concentration gradients emerge, and the mass con-servation equation can be applied in the differential form.
Integral reactor. Integral reactors have a high spacial variation of thereaction rate due to significant chemical conversion, and the fluid passingthrough the reactor shows significant concentration gradients. Concentrationchanges in the reactor have to be considered in the method of analysis usingthe integrated form of the mass conservation equation. Examples of integralreactors are the fluidized bed reactors presented in Chapter 6 and the SynPetreactor discussed in Chapters 7 and 8.
4.2.2 Thermogravimetry
Thermogravimetry (TG, TGA) is a common application used in chemistryand material science for the determination of thermochemical properties ofsubstances and mixtures of substances. In addition, it provides an excellentmeans to measure the reaction kinetics of various physical and chemical pro-cesses involving solids and liquids. Thermogravimetry on its own determinesthe temperature and time resolved changes of the sample mass while the sam-ple is exposed to a controlled gas atmosphere and a predefined temperatureprogram [33].
TG experiments are performed in a thermobalance, which essentially con-sists of a high temperature furnace and an electronic precision balance. Thefurnace chamber is vacuum proof and allows to perform experiments withcontrolled sample environments that can be reactive or inert. The balanceis directly connected with the sample crucible in the furnace and measuresthe sample weight online as a function of temperature and time. The tem-perature control of the furnace allows two modes of operation being eitherisothermal, dynamic with a constant heating rate, or any combination of thetwo.
The sample arrangement in the thermobalance is of particular impor-tance. If a cup containing a bed of particles with a stagnant gas atmosphere

4.3. REACTION MECHANISMS 47
on top is used (cf. [65, 28]), the sample has to be considered as an integralreactor and mass and heat transfer equations need to be solved in order toobtain meaningful rate data. If, on the other hand, the sample size is smalland mass transfer is fast compared to the chemical reaction as it is assumedfor the experiments in Chapter 5, concentration and temperature gradientsin the sample and in the surrounding gas phase are negligible allowing to usethe differential reactor concept.
Often TG is combined with other analyses: The evolved gas analysis(EGA) using gas and mass chromatography provides additional informationon chemical reactions based on the production or consumption of gaseousspecies. Other thermal analysis techniques such as differential thermal anal-ysis (DTA) and differential scanning calorimetry (DSC) provide data on tem-perature differences and heat fluxes of the sample and are usually applied incases where calorific data is required.
4.3 Reaction mechanisms
4.3.1 Pyrolysis
The pyrolysis model used in this thesis, the so called distribution of activationenergy model, was originally developed by Pitt [67] and later on used in otherexperimental studies on coal devolatilization [5] and rapid pyrolysis of coalblends [92].
The basic assumptions of the model are:
• Coke is a mixture of pseudo-components decomposing independently.
• The decomposition reaction of the pseudo-components is of first order.
• There exists a wide distribution of the activation energy, and a spe-cific value for the activation energy is associated with a characteristicdecomposition temperature.
Based on the above assumptions, the rate of pyrolysis is calculated as alinear combination of first-order decomposition rates of pseudo-components:
dXP
dt=∑
i
xiri =∑
i
xidαi
dt(4.34)
where xi is the ultimate yield obtained by complete decomposition of compo-nent i and the conversion of the individual pseudo-components, ri, is defined

48 CHAPTER 4. REACTION KINETICS
as
ri =dαi
dTβ = ki (1− αi) (4.35)
where the temperature dependence of the rate constant is given by the Ar-rhenius law,
ki = k0,i · exp
(−EA,i
R T
)(4.36)
k0 is the pre-exponential factor and EA is the activation energy in (J/mol).
4.3.2 H2O-CO2 gasification
Two mechanisms are considered for the gasification of carbon with H2O andCO2: the oxygen-exchange and the extended mechanisms.
Oxygen exchange mechanism
The oxygen-exchange mechanism postulates reversible oxygen-exchange sur-face reactions
CO2 + C〈∗〉k′1 //
k′−1
oo CO + C〈O〉 (4.37)
H2O + C〈∗〉k′2 //
k′−2
oo H2 + C〈O〉 (4.38)
followed by the unidirectional gasification step at higher temperaturesthrough combination of oxygen and carbon atoms from the solid to formCO(g),
C〈O〉k′3 // CO + nC〈∗〉 (4.39)
In the above equations, C〈∗〉 and C〈O〉 represent free active sites on thecarbon surface and active sites with adsorbed oxygen, respectively.
Inhibition occurs by the recombination of adsorbed oxygen with either COor H2. Equation (4.39) typically controls the movement towards equilibrium,while Equations (4.37) and (4.38) provide for the water-gas shift equilibrium.Assuming elementary reactions, the rate laws for the formation/consumptionof the gas species H2O, CO2, CO, and H2 are obtained as functions of theirpartial pressures in the bulk phase and the fraction of surface covered with
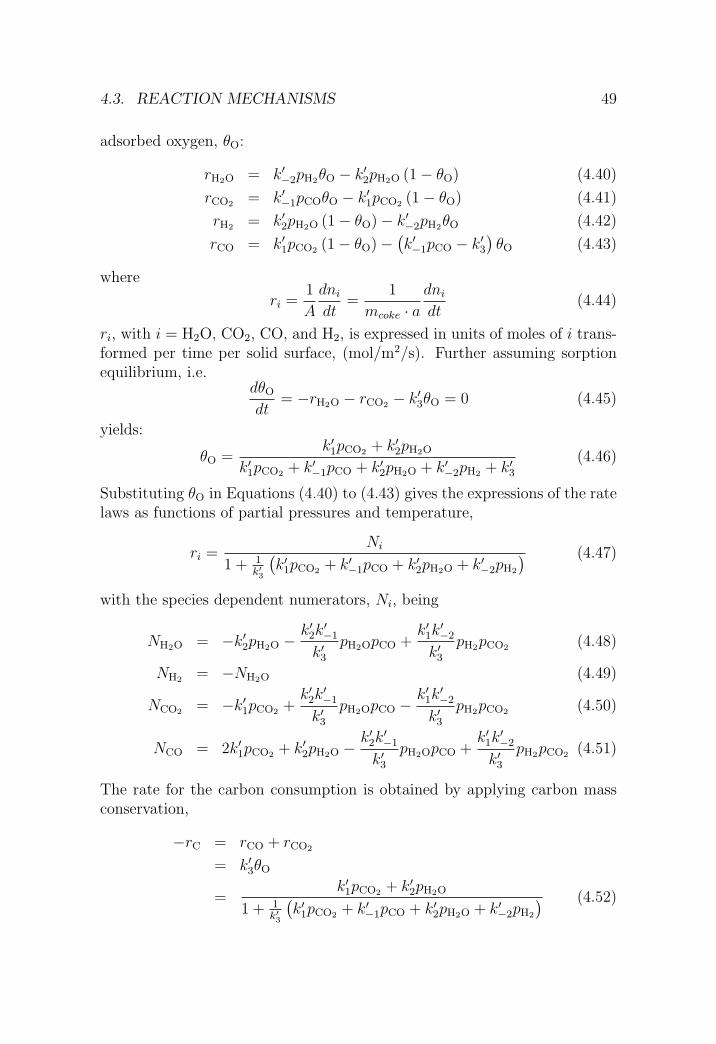
4.3. REACTION MECHANISMS 49
adsorbed oxygen, θO:
rH2O = k′−2pH2θO − k′2pH2O (1− θO) (4.40)
rCO2 = k′−1pCOθO − k′1pCO2 (1− θO) (4.41)
rH2 = k′2pH2O (1− θO)− k′−2pH2θO (4.42)
rCO = k′1pCO2 (1− θO)−(k′−1pCO − k′3
)θO (4.43)
where
ri =1
A
dni
dt=
1
mcoke · adni
dt(4.44)
ri, with i = H2O, CO2, CO, and H2, is expressed in units of moles of i trans-formed per time per solid surface, (mol/m2/s). Further assuming sorptionequilibrium, i.e.
dθO
dt= −rH2O − rCO2 − k′3θO = 0 (4.45)
yields:
θO =k′1pCO2 + k′2pH2O
k′1pCO2 + k′−1pCO + k′2pH2O + k′−2pH2 + k′3(4.46)
Substituting θO in Equations (4.40) to (4.43) gives the expressions of the ratelaws as functions of partial pressures and temperature,
ri =Ni
1 + 1k′3
(k′1pCO2 + k′−1pCO + k′2pH2O + k′−2pH2
) (4.47)
with the species dependent numerators, Ni, being
NH2O = −k′2pH2O −k′2k
′−1
k′3pH2OpCO +
k′1k′−2
k′3pH2pCO2 (4.48)
NH2 = −NH2O (4.49)
NCO2 = −k′1pCO2 +k′2k
′−1
k′3pH2OpCO −
k′1k′−2
k′3pH2pCO2 (4.50)
NCO = 2k′1pCO2 + k′2pH2O −k′2k
′−1
k′3pH2OpCO +
k′1k′−2
k′3pH2pCO2 (4.51)
The rate for the carbon consumption is obtained by applying carbon massconservation,
−rC = rCO + rCO2
= k′3θO
=k′1pCO2 + k′2pH2O
1 + 1k′3
(k′1pCO2 + k′−1pCO + k′2pH2O + k′−2pH2
) (4.52)
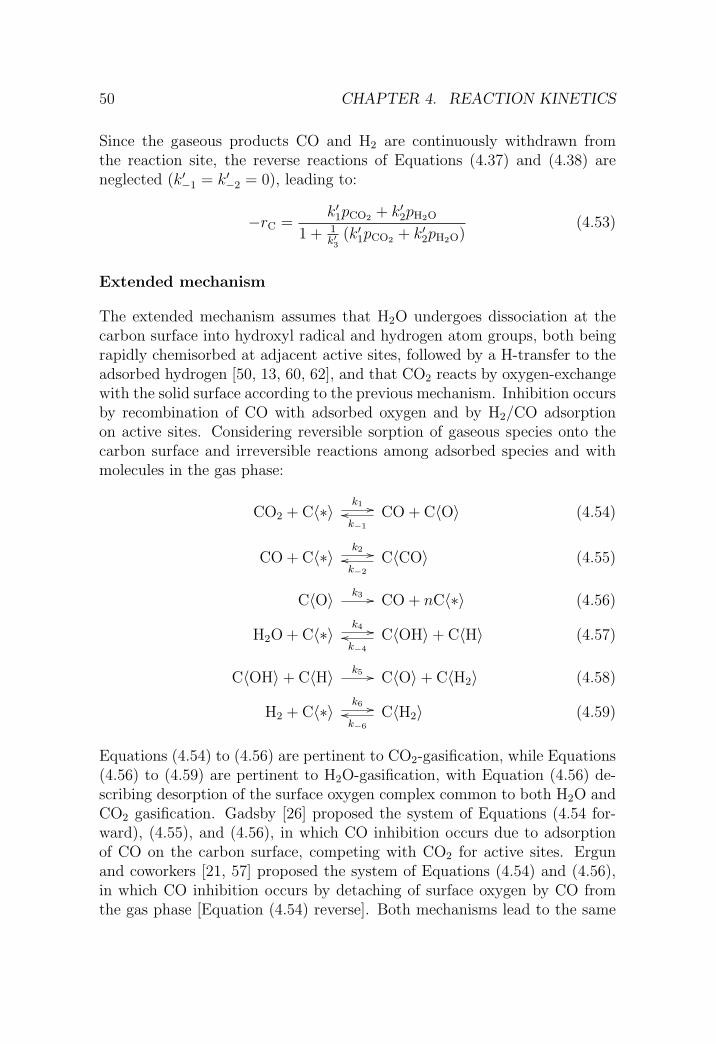
50 CHAPTER 4. REACTION KINETICS
Since the gaseous products CO and H2 are continuously withdrawn fromthe reaction site, the reverse reactions of Equations (4.37) and (4.38) areneglected (k′−1 = k′−2 = 0), leading to:
−rC =k′1pCO2 + k′2pH2O
1 + 1k′3
(k′1pCO2 + k′2pH2O)(4.53)
Extended mechanism
The extended mechanism assumes that H2O undergoes dissociation at thecarbon surface into hydroxyl radical and hydrogen atom groups, both beingrapidly chemisorbed at adjacent active sites, followed by a H-transfer to theadsorbed hydrogen [50, 13, 60, 62], and that CO2 reacts by oxygen-exchangewith the solid surface according to the previous mechanism. Inhibition occursby recombination of CO with adsorbed oxygen and by H2/CO adsorptionon active sites. Considering reversible sorption of gaseous species onto thecarbon surface and irreversible reactions among adsorbed species and withmolecules in the gas phase:
CO2 + C〈∗〉k1 //
k−1
oo CO + C〈O〉 (4.54)
CO + C〈∗〉k2 //
k−2
oo C〈CO〉 (4.55)
C〈O〉 k3 // CO + nC〈∗〉 (4.56)
H2O + C〈∗〉k4 //
k−4
oo C〈OH〉+ C〈H〉 (4.57)
C〈OH〉+ C〈H〉 k5 // C〈O〉+ C〈H2〉 (4.58)
H2 + C〈∗〉k6 //
k−6
oo C〈H2〉 (4.59)
Equations (4.54) to (4.56) are pertinent to CO2-gasification, while Equations(4.56) to (4.59) are pertinent to H2O-gasification, with Equation (4.56) de-scribing desorption of the surface oxygen complex common to both H2O andCO2 gasification. Gadsby [26] proposed the system of Equations (4.54 for-ward), (4.55), and (4.56), in which CO inhibition occurs due to adsorptionof CO on the carbon surface, competing with CO2 for active sites. Ergunand coworkers [21, 57] proposed the system of Equations (4.54) and (4.56),in which CO inhibition occurs by detaching of surface oxygen by CO fromthe gas phase [Equation (4.54) reverse]. Both mechanisms lead to the same

4.3. REACTION MECHANISMS 51
form of the rate law for carbon consumption by gasification using only CO2
as gasifying agent:
−rC =a1pCO2
1 + a2pCO2 + a3pCO
(4.60)
with a1, a2, and a3 being lumped rate constants. Reif [70] analyzed in detailthe importance of the two CO inhibition paths described above and foundexperimentally that the recombination of C〈O〉 and CO is considerably fasterthan CO adsorption. For gasification at elevated pressures, Blackwood andIngeme [12] and Muller [63] extended the Erguns mechanism by adding:
CO2 + C〈CO〉 k7 // 2CO + C〈O〉 (4.61)
CO + C〈CO〉 k8 // CO2 + 2C〈∗〉 (4.62)
In the mathematical treatment that follows, Equations (4.61) and (4.62) areomitted from consideration since the reduced system represents reasonablywell data in the 0-1 bar pressure range used in this study. CO inhibitioncan occur both by recombination with an adsorbed oxygen [Equation (4.54)reverse] and by competition for active sites [Equation (4.55)]. Further as-suming sorption equilibrium for CO, O, H2, and the intermediate componentOH-H representing the adsorbed water,
θOH,H : k4pH2Oθv = (k−4 + k5) θOH,H (4.63)
θCO : k2pCOθv = k−2θCO (4.64)
θH2 : k6pH2θv + k5θOH,H = k−6θH2 (4.65)
θO : k5θOH,H + k1pCO2θv = (k−1pCO + k3) θO (4.66)
withθv = 1− (θOH,H + θCO + θH2 + θO) (4.67)
Assuming elementary reactions, the rate laws for the formation/consumptionthe gas species H2O, H2, CO2, and CO are obtained as functions of theirpartial pressures and θi:
rH2O = k−4θOH,H − k4pH2Oθv (4.68)
rH2 = k−6θH2 − k6pH2θv (4.69)
rCO = k1pCO2θv − k−1pCOθO + k−2θCO − k2pCOθv + k3θO (4.70)
rCO2 = k−1pCOθO − k1pCO2θv (4.71)
The system of Equations (4.63) to (4.67) is solved analytically for the un-known θi, and the solution inserted in Equations (4.68) to (4.71) to yield the
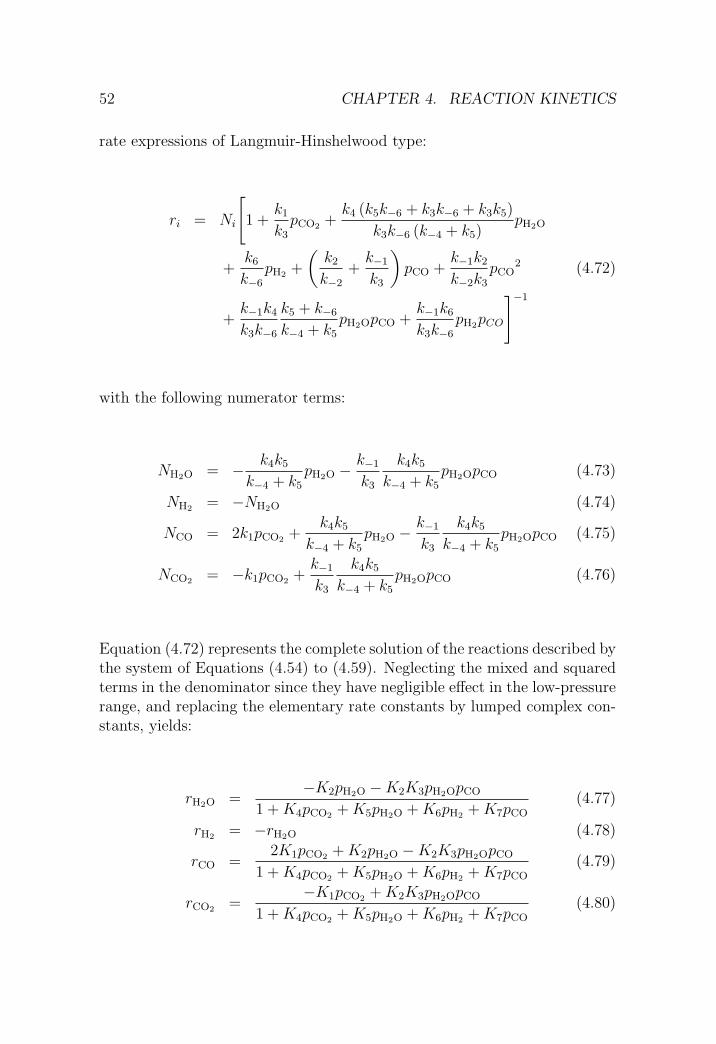
52 CHAPTER 4. REACTION KINETICS
rate expressions of Langmuir-Hinshelwood type:
ri = Ni
[1 +
k1
k3
pCO2 +k4 (k5k−6 + k3k−6 + k3k5)
k3k−6 (k−4 + k5)pH2O
+k6
k−6
pH2 +
(k2
k−2
+k−1
k3
)pCO +
k−1k2
k−2k3
pCO2 (4.72)
+k−1k4
k3k−6
k5 + k−6
k−4 + k5
pH2OpCO +k−1k6
k3k−6
pH2pCO
]−1
with the following numerator terms:
NH2O = − k4k5
k−4 + k5
pH2O −k−1
k3
k4k5
k−4 + k5
pH2OpCO (4.73)
NH2 = −NH2O (4.74)
NCO = 2k1pCO2 +k4k5
k−4 + k5
pH2O −k−1
k3
k4k5
k−4 + k5
pH2OpCO (4.75)
NCO2 = −k1pCO2 +k−1
k3
k4k5
k−4 + k5
pH2OpCO (4.76)
Equation (4.72) represents the complete solution of the reactions described bythe system of Equations (4.54) to (4.59). Neglecting the mixed and squaredterms in the denominator since they have negligible effect in the low-pressurerange, and replacing the elementary rate constants by lumped complex con-stants, yields:
rH2O =−K2pH2O −K2K3pH2OpCO
1 + K4pCO2 + K5pH2O + K6pH2 + K7pCO
(4.77)
rH2 = −rH2O (4.78)
rCO =2K1pCO2 + K2pH2O −K2K3pH2OpCO
1 + K4pCO2 + K5pH2O + K6pH2 + K7pCO
(4.79)
rCO2 =−K1pCO2 + K2K3pH2OpCO
1 + K4pCO2 + K5pH2O + K6pH2 + K7pCO
(4.80)

4.3. REACTION MECHANISMS 53
where the Ki are defined as:
K1 = k1
K2 =k4k5
k−4 + k5
K3 =k−1
k3
K4 =k1
k3
(4.81)
K5 =k4 (k5k−6 + k3k−6 + k3k5)
k3k−6 (k−4 + k5)
K6 =k6
k−6
K7 =k2
k−2
+k−1
k3
The rate of carbon consumption is calculated in analogy to the oxygen-exchange mechanism by applying carbon mass conservation:
−rC = rCO + rCO2
= k3θO
=K1pCO2 + K2pH2O
1 + K4pCO2 + K5pH2O + K6pH2 + K7pCO
(4.82)
Further neglecting the inhibition effect of the product gases in Equations(4.77) to (4.80) and (4.82), the final expression for the rate of carbon con-version becomes:
−rC =K1pCO2 + K2pH2O
1 + K4pCO2 + K5pH2O
(4.83)
Note that Equation (4.53) obtained by applying the oxygen-transfer mech-anism is a special case of Equation (4.83), with the additional boundaryconditions
K4 =K1
a4
and K5 =K2
a4
(4.84)
reducing the number of independent parameters from 4 in Equation (4.83) toonly 3 in Equation (4.53). Note also that Equation (4.72) does not considerthe dual-site mechanism or the two-center adsorption [97]. The temperaturedependence of the rate constants derived by the oxygen-transfer mechanism[Equation (4.53)] and by the extended mechanism [Equation (4.83)] is givenby the Arrhenius law [Equation (4.36)].

54 CHAPTER 4. REACTION KINETICS
The experimental determination of the constants K1, K2, K3, K4, andK5 in Equations (4.77) to (4.80) and (4.83) by dynamic experiments witha thermobalance is described in Chapter 5. Further, K1, K2, and K3 aredetermined in Chapter 6 using a fluidized bed reactor heated by direct andindirect thermal radiation from a solar simulator. Using two different modesof heat transfer allows to test if the selection of a direct or indirect irradiatedsolar reactor system has an effect on the rate of the chemical reaction. Suchan effect would cause differences with respect to the measured rate constants.

Chapter 5
Experimental rate data fromthermogravimetry1
5.1 Experimental
5.1.1 Setup: Netzsch STA 409 and Varian Micro GC
The experiments in this chapter were performed with a thermogravimetersystem (Netzsch STA 409 CD) equipped with two furnaces. The first isa conventional high-temperature electric furnace with a maximum workingtemperature of 1823 K. This furnace is suitable for experiments with con-trolled reactive gas atmospheres having a dew point below room temperature.The second is a special electric furnace with a maximum working temper-ature of 1523 K, suitable for reactive atmospheres containing up to 100%steam at 1 bar total pressure. A schematic of the steam-furnace (a) and thehigh temperature furnace (b) with the main components indicated is shownin Figure 5.1. Both furnaces are mounted on a double hoist system allowingalternative use and offering maximum flexibility with respect to experimentalconditions such as temperature and steam concentration.
The gasification experiments were performed with dish shaped samplecrucibles, shown in Figure 5.2, that are made of aluminum oxide (Al2O3) andhave an outer diameter of 17 mm. The sample carrier connecting the cruciblewith the balance is equipped with a thermocouple type S and measures the
1Material from this chapter has been published in ‘D. Trommer and A. Steinfeld. Ki-netic modeling for the combined pyrolysis and steam gasification of petroleum coke andexperimental determination of the rate constants by dynamic thermogravimetry in the500-1520 K range. Energy & Fuels, 2006. 20(3): p. 1250-1258’.
55

56 CHAPTER 5. RATE DATA FROM THERMOGRAVIMETRY
balance system
(a) (b)
balance system
insulation
heating element
protective tube
sample carrier
petcoke sample
reactive gas
purge gas
crucible
radiation shield
thermocouple
Figure 5.1: Cross-sectional schematics of the Netzsch steam furnace (a) andhigh temperature furnace (b).
Figure 5.2: Empty crucible(left) and crucible with mount-ed coke sample (right).
temperature directly at the sample crucible. Petcoke samples of 35 to 40 mgwere mounted as a thin layer on the flat sample crucibles and swept by thereacting gas flowing through the furnace. This arrangement avoids stagnantgas around the sample and minimizes mass and heat transfer resistancesbetween the coke sample and the bulk gas [65, 28].
The measuring part of the STA 409 thermogravimeter features a vacuumproof housing suitable to realize controlled atmospheres that can be inert orreactive. The experimental setup includes a TASC 414 System Controller fortemperature programming and data acquisition. The weight signal from the

5.1. EXPERIMENTAL 57
Table 5.1: Analyzed gas mixtures used for the GC calibration
nominal compositionname manufacturer
gas conc.balance
H2, O2, N2,PanGasCO, CH4, CO2
1% Ar
Mix 216 Scott CO2, CO, CH4,Scotty 4 Speciality Gases C2H6, C2H4, C2H2
1% N2
Mix 234 Scott H2, CH4 4%Scotty 14 Speciality Gases CO2, CO, N2, O2 5%
He
Praxair H2S, COS 1000 ppm Ar
digital balance and the temperature signal from the sample thermocoupleare recorded with a nominal accuracy of 5 · 10−3 mg and 0.1 K, respectively.
The steam furnace (Figure 5.1 a) is used for the gasification runs withH2O-CO2-Ar mixtures. The reactive gas enters the furnace chamber at thetop end and flows downwards past the coke sample. The mixing of reactivegas (steam) and purge gas from the balance takes place near the exit of thefurnace, offering the possibility to perform experiments with arbitrary steamconcentrations up to 100%.
The steam furnace is coupled with a steam generator unit (BronkhorstHitec CEM) via a transfer line heated to 200 ◦C to avoid the condensation ofsteam. Mechanical flow controllers for Ar and CO2 (Vogtlin Q-FLOW) andelectronic flow controllers for water (Bronkhorst LIQUI-FLOW) are used toset the mass flow rates and the steam concentration in the reactive gas.
The high-temperature furnace (Figure 5.1 b) was used for the pyrolysisruns in pure Ar. In opposition to the steam furnace, this setup has nodouble furnace wall and features a bottom up flow. The furnace chamber isseparated from the balance by means of a ceramic radiation shield, and thegas exit is located at the top end. If a reactive gas is used, the concentrationof the reactant is reduced due to the dilution with purge gas coming from thebalance. Both the steam and the high-temperature furnaces are suitable torun experiments with corrosive gases as far as material and safety constraintsare obeyed.
Every experimental run with the TG setup included an evolved gas anal-ysis in order to retrieve further information about the chemical reactions oc-curring in the sample. The thermobalance is therefore coupled to a Varian CP

58 CHAPTER 5. RATE DATA FROM THERMOGRAVIMETRY
4900 Quad micro gas chromatograph (GC) equipped with a Molecular Sieve5A PLOT and a PoraPLOT U column (both 10 m with heated injectors).The first column is used to analyze the permanent gases H2, O2, N2, CH4 andCO using argon as carrier gas. The second is operated with helium as carriergas and measures CO2, C2H6, C2H4, C2H2, H2S and COS. To obtain quanti-tative concentration data, the micro GC was calibrated in advance using aset of four analyzed calibration gases. The compositions of the respective gasmixtures are indicated in Table 5.1.
Rate data for the H2O-CO2 reactive gasification and the pyrolysis reactionis obtained from dynamic TG experiments with constant heating rates. Theexperimental procedure includes the measurement of the weight loss curveof coke samples exposed to different reactive and inert gas atmospheres [61]and is elaborated in the Chapter 5.1.2.
5.1.2 Experimental procedure
Pyrolysis
The pyrolysis experiments were conducted in the high temperature furnace(cf. Figure 5.1) allowing the investigation of the thermal decomposition overthe whole temperature range from ambient up to 1550 K. A non-isothermal(dynamic) temperature program was used starting at 500 K and ramping upwith a linear heating rate, β = 10 Kmin−1, to the final pyrolysis tempera-ture of 1550 K. Experiments are performed with inert sample atmospheresconsisting of 100% argon at a flow rate of 210 mlN/min and a total pressureof 1 bar.
An experimental run with the TG setup starts with the activation ofthe auxiliary devices and loading of the temperature program. A ≈ 36 mgcoke sample, weighed on an external Mettler Toledo XS105 DualRange highprecision balance is placed as a thin layer on the flat sample crucible, asshown in Figure 5.2, and stored in the TG furnace. The furnace chamber ispurged three times with argon to ensure an inert sample atmosphere at thebeginning of the experiment. Once this is done, the temperature program isstarted and automatically completed by the control system.
Table 5.2 presents a list with the pyrolysis runs and the respective tem-perature and concentration data. Compared to the gasification experimentsthat are elaborated in the following subsection, samples with smaller parti-cles (200-250 µm) are used for experiments at high temperatures, becausebigger samples caused systematic errors due to bursting of single particles.

5.1. EXPERIMENTAL 59
H2O-CO2 gasification
The experimental procedure of a gasification experiment with steam and car-bon dioxide is rather similar to the pyrolysis run described in the previoussubsection. The main difference is the use of the steam furnace (cf. Figure5.1) instead of the high temperature furnace and a slightly different temper-ature program. Further, experiments with the steam furnace have a biggercycle time and are complicated by the operation of the steam generator andadditional heaters that take longer to reach thermal equilibrium.
The temperature program used for the TG experiments with reactiveH2O-CO2 sample environments consists of a dynamic ramp between 470 and1250 K with a constant heating rate, β = 20 Kmin−1. The faster heatingrate compared to the pyrolysis runs was chosen for the sake of efficiency.
The following gas flows were used, depending on the desired reactive gascomposition: The purge gas flow through the balance was maintained at 153mlN/min Ar during all experiments. Argon did not enter the furnace chamberbut needed to be subtracted in the calculation of the product concentrations.The reactive gas flow consisted of the three components
• argon,
• steam,
• carbon dioxide
at a respective flow rate that varied between 0 and 100% of the total reactivegas flow rate. For material safety reasons, the reactive gas stream was keptbelow the 153 mlN/min argon of the purge gas stream. The pressure insidethe furnace chamber was atmospheric in all experiments.
The complete list of the H2O-CO2 gasification experiments with the re-spective temperature and concentration data is presented in Table 5.3.
The steam flow was controlled by a temperature safety valve and startedonly when the furnace reached a minimum temperature of 150 ◦C, which isachieved during the automatic preheating phase of the furnace. At the starttemperature of the experiment, the reactive gases are still inert vis-a-vis coke.When the thermobalance finished the automatic preheating sequence fromambient temperature to the programmed start point at 470 K, both reactivegases, steam and carbon dioxide were present without reacting with the coke,and the experiment is started and completed automatically.
Since the off-gas contained a considerable amount of water depending onthe chosen composition of the reactive gas, a cooler was used after the ther-
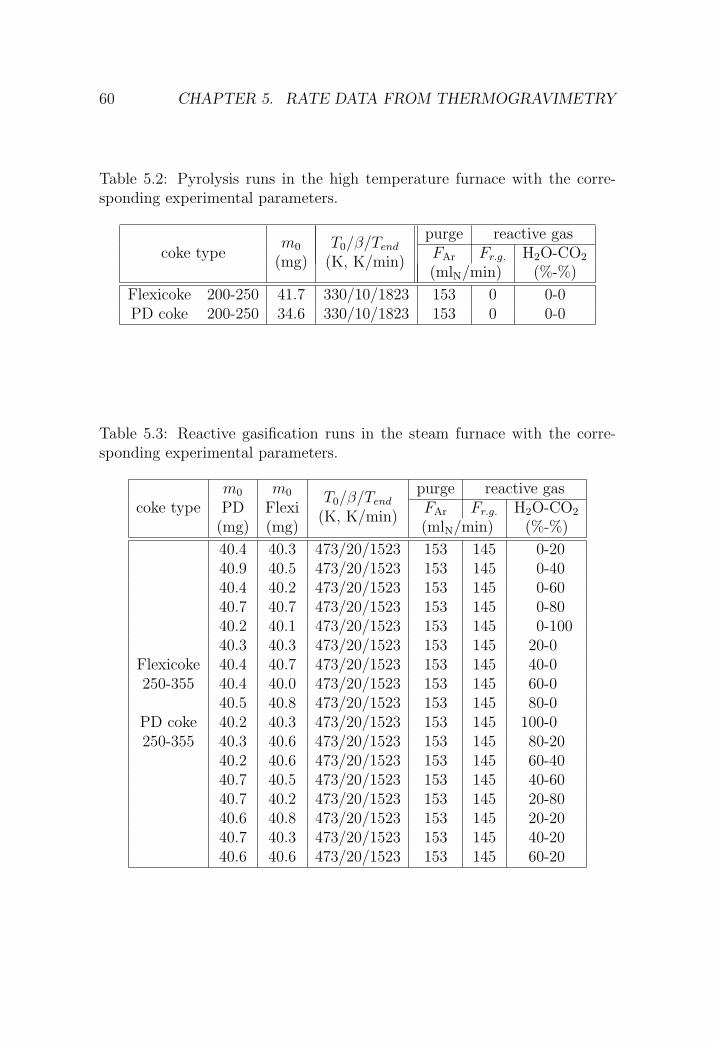
60 CHAPTER 5. RATE DATA FROM THERMOGRAVIMETRY
Table 5.2: Pyrolysis runs in the high temperature furnace with the corre-sponding experimental parameters.
purge reactive gascoke type
m0 T0/β/Tend FAr Fr.g. H2O-CO2(mg) (K, K/min)(mlN/min) (%-%)
Flexicoke 200-250 41.7 330/10/1823 153 0 0-0PD coke 200-250 34.6 330/10/1823 153 0 0-0
Table 5.3: Reactive gasification runs in the steam furnace with the corre-sponding experimental parameters.
m0 m0 purge reactive gascoke type PD Flexi
T0/β/Tend FAr Fr.g. H2O-CO2
(mg) (mg)(K, K/min)
(mlN/min) (%-%)
40.4 40.3 473/20/1523 153 145 0-2040.9 40.5 473/20/1523 153 145 0-4040.4 40.2 473/20/1523 153 145 0-6040.7 40.7 473/20/1523 153 145 0-8040.2 40.1 473/20/1523 153 145 0-10040.3 40.3 473/20/1523 153 145 20-0
Flexicoke 40.4 40.7 473/20/1523 153 145 40-0250-355 40.4 40.0 473/20/1523 153 145 60-0
40.5 40.8 473/20/1523 153 145 80-0PD coke 40.2 40.3 473/20/1523 153 145 100-0250-355 40.3 40.6 473/20/1523 153 145 80-20
40.2 40.6 473/20/1523 153 145 60-4040.7 40.5 473/20/1523 153 145 40-6040.7 40.2 473/20/1523 153 145 20-8040.6 40.8 473/20/1523 153 145 20-2040.7 40.3 473/20/1523 153 145 40-2040.6 40.6 473/20/1523 153 145 60-20
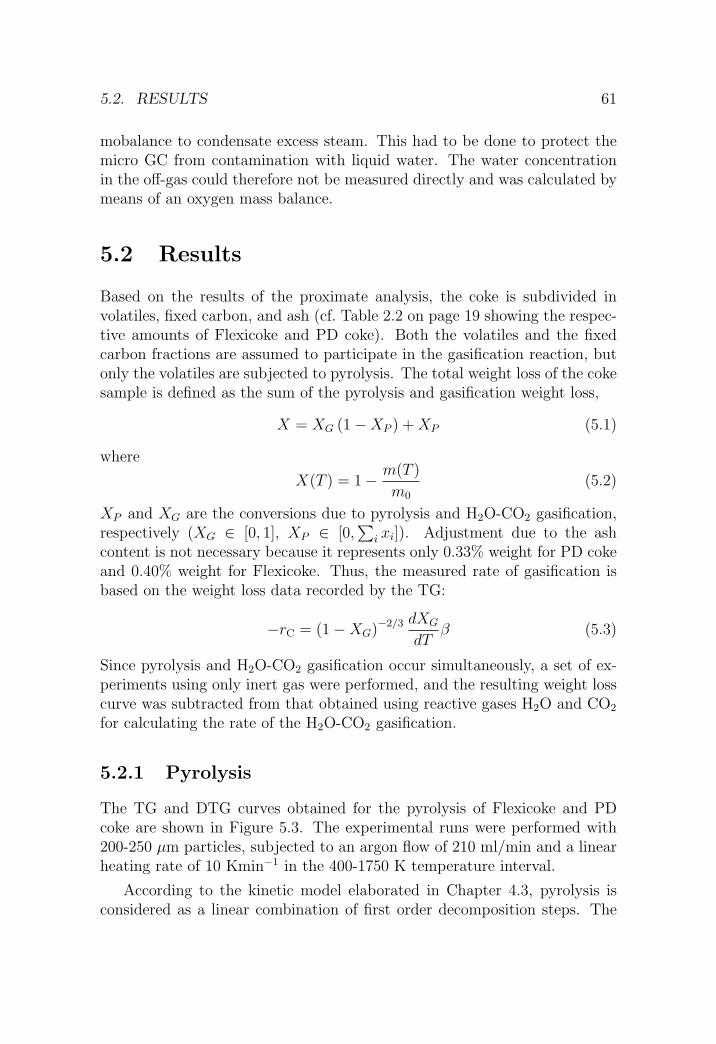
5.2. RESULTS 61
mobalance to condensate excess steam. This had to be done to protect themicro GC from contamination with liquid water. The water concentrationin the off-gas could therefore not be measured directly and was calculated bymeans of an oxygen mass balance.
5.2 Results
Based on the results of the proximate analysis, the coke is subdivided involatiles, fixed carbon, and ash (cf. Table 2.2 on page 19 showing the respec-tive amounts of Flexicoke and PD coke). Both the volatiles and the fixedcarbon fractions are assumed to participate in the gasification reaction, butonly the volatiles are subjected to pyrolysis. The total weight loss of the cokesample is defined as the sum of the pyrolysis and gasification weight loss,
X = XG (1−XP ) + XP (5.1)
where
X(T ) = 1− m(T )
m0
(5.2)
XP and XG are the conversions due to pyrolysis and H2O-CO2 gasification,respectively (XG ∈ [0, 1], XP ∈ [0,
∑i xi]). Adjustment due to the ash
content is not necessary because it represents only 0.33% weight for PD cokeand 0.40% weight for Flexicoke. Thus, the measured rate of gasification isbased on the weight loss data recorded by the TG:
−rC = (1−XG)−2/3 dXG
dTβ (5.3)
Since pyrolysis and H2O-CO2 gasification occur simultaneously, a set of ex-periments using only inert gas were performed, and the resulting weight losscurve was subtracted from that obtained using reactive gases H2O and CO2
for calculating the rate of the H2O-CO2 gasification.
5.2.1 Pyrolysis
The TG and DTG curves obtained for the pyrolysis of Flexicoke and PDcoke are shown in Figure 5.3. The experimental runs were performed with200-250 µm particles, subjected to an argon flow of 210 ml/min and a linearheating rate of 10 Kmin−1 in the 400-1750 K temperature interval.
According to the kinetic model elaborated in Chapter 4.3, pyrolysis isconsidered as a linear combination of first order decomposition steps. The

62 CHAPTER 5. RATE DATA FROM THERMOGRAVIMETRY
400 600 800 1000 1200 1400 1600 180088
92
96
100
Sam
ple
weigh
t(%
)
!0.5
!0.4
!0.3
!0.2
!0.1
0
0.1
Temperature (K)
Con
vers
ion
rate
(%/m
in)
DTG
TG
-3.8 %
-11.7 %
PD coke
Flexicoke
957 K
1010 K
Figure 5.3: TG and DTG data for the pyrolysis of Flexicoke and PD coke.dP = 200-250 µm, β = 10 Kmin−1.
Figure 5.4: Weight loss and product gas composition as a function of tem-perature for the pyrolysis of PD coke. dP = 250-355 µm, β = 10 Kmin−1.
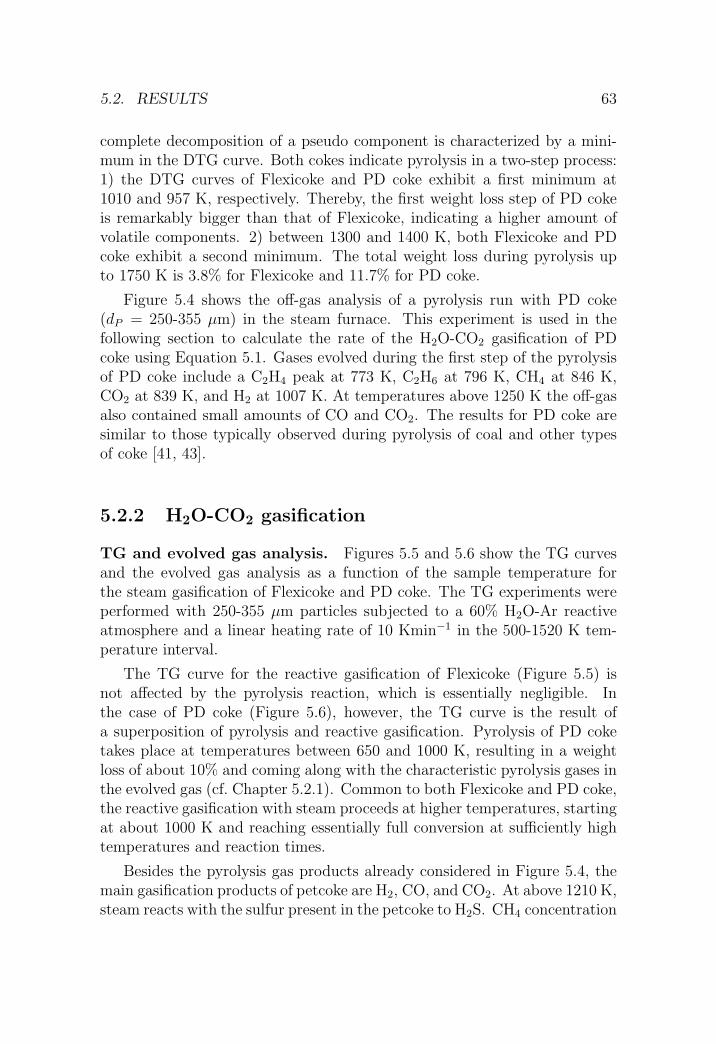
5.2. RESULTS 63
complete decomposition of a pseudo component is characterized by a mini-mum in the DTG curve. Both cokes indicate pyrolysis in a two-step process:1) the DTG curves of Flexicoke and PD coke exhibit a first minimum at1010 and 957 K, respectively. Thereby, the first weight loss step of PD cokeis remarkably bigger than that of Flexicoke, indicating a higher amount ofvolatile components. 2) between 1300 and 1400 K, both Flexicoke and PDcoke exhibit a second minimum. The total weight loss during pyrolysis upto 1750 K is 3.8% for Flexicoke and 11.7% for PD coke.
Figure 5.4 shows the off-gas analysis of a pyrolysis run with PD coke(dP = 250-355 µm) in the steam furnace. This experiment is used in thefollowing section to calculate the rate of the H2O-CO2 gasification of PDcoke using Equation 5.1. Gases evolved during the first step of the pyrolysisof PD coke include a C2H4 peak at 773 K, C2H6 at 796 K, CH4 at 846 K,CO2 at 839 K, and H2 at 1007 K. At temperatures above 1250 K the off-gasalso contained small amounts of CO and CO2. The results for PD coke aresimilar to those typically observed during pyrolysis of coal and other typesof coke [41, 43].
5.2.2 H2O-CO2 gasification
TG and evolved gas analysis. Figures 5.5 and 5.6 show the TG curvesand the evolved gas analysis as a function of the sample temperature forthe steam gasification of Flexicoke and PD coke. The TG experiments wereperformed with 250-355 µm particles subjected to a 60% H2O-Ar reactiveatmosphere and a linear heating rate of 10 Kmin−1 in the 500-1520 K tem-perature interval.
The TG curve for the reactive gasification of Flexicoke (Figure 5.5) isnot affected by the pyrolysis reaction, which is essentially negligible. Inthe case of PD coke (Figure 5.6), however, the TG curve is the result ofa superposition of pyrolysis and reactive gasification. Pyrolysis of PD coketakes place at temperatures between 650 and 1000 K, resulting in a weightloss of about 10% and coming along with the characteristic pyrolysis gases inthe evolved gas (cf. Chapter 5.2.1). Common to both Flexicoke and PD coke,the reactive gasification with steam proceeds at higher temperatures, startingat about 1000 K and reaching essentially full conversion at sufficiently hightemperatures and reaction times.
Besides the pyrolysis gas products already considered in Figure 5.4, themain gasification products of petcoke are H2, CO, and CO2. At above 1210 K,steam reacts with the sulfur present in the petcoke to H2S. CH4 concentration
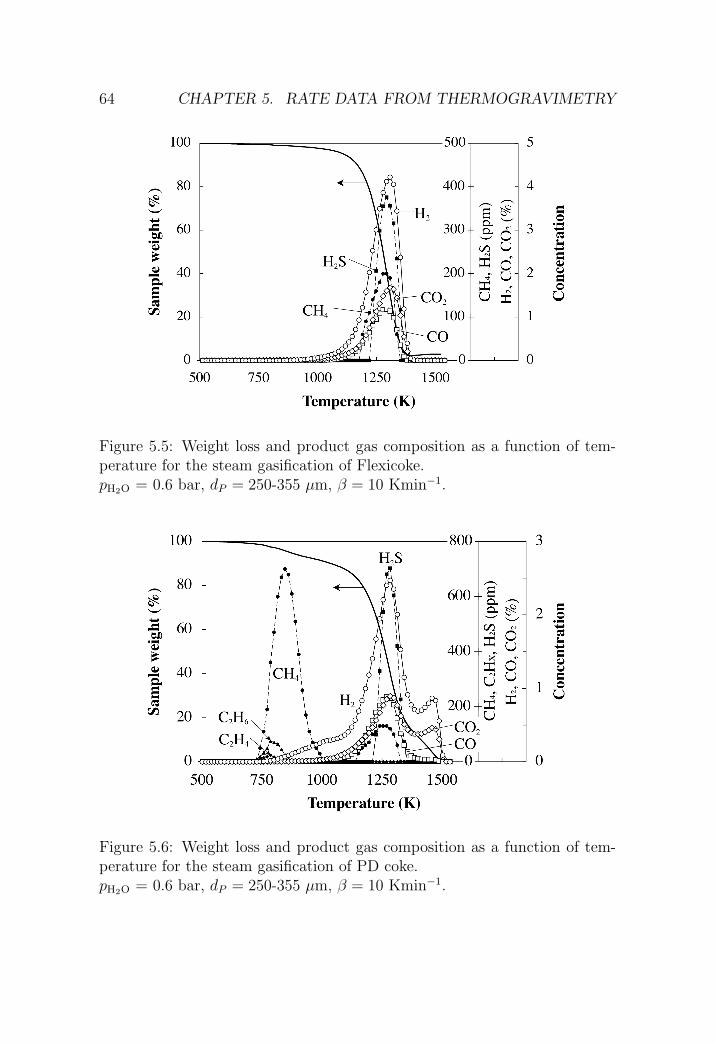
64 CHAPTER 5. RATE DATA FROM THERMOGRAVIMETRY
Figure 5.5: Weight loss and product gas composition as a function of tem-perature for the steam gasification of Flexicoke.pH2O = 0.6 bar, dP = 250-355 µm, β = 10 Kmin−1.
Figure 5.6: Weight loss and product gas composition as a function of tem-perature for the steam gasification of PD coke.pH2O = 0.6 bar, dP = 250-355 µm, β = 10 Kmin−1.
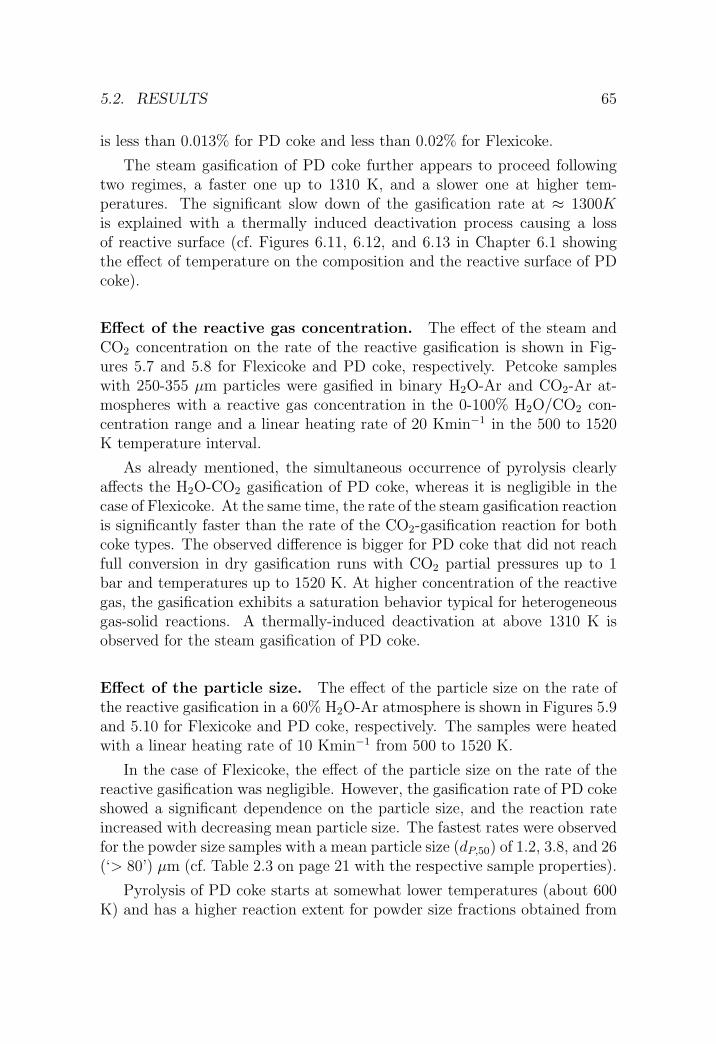
5.2. RESULTS 65
is less than 0.013% for PD coke and less than 0.02% for Flexicoke.
The steam gasification of PD coke further appears to proceed followingtwo regimes, a faster one up to 1310 K, and a slower one at higher tem-peratures. The significant slow down of the gasification rate at ≈ 1300Kis explained with a thermally induced deactivation process causing a lossof reactive surface (cf. Figures 6.11, 6.12, and 6.13 in Chapter 6.1 showingthe effect of temperature on the composition and the reactive surface of PDcoke).
Effect of the reactive gas concentration. The effect of the steam andCO2 concentration on the rate of the reactive gasification is shown in Fig-ures 5.7 and 5.8 for Flexicoke and PD coke, respectively. Petcoke sampleswith 250-355 µm particles were gasified in binary H2O-Ar and CO2-Ar at-mospheres with a reactive gas concentration in the 0-100% H2O/CO2 con-centration range and a linear heating rate of 20 Kmin−1 in the 500 to 1520K temperature interval.
As already mentioned, the simultaneous occurrence of pyrolysis clearlyaffects the H2O-CO2 gasification of PD coke, whereas it is negligible in thecase of Flexicoke. At the same time, the rate of the steam gasification reactionis significantly faster than the rate of the CO2-gasification reaction for bothcoke types. The observed difference is bigger for PD coke that did not reachfull conversion in dry gasification runs with CO2 partial pressures up to 1bar and temperatures up to 1520 K. At higher concentration of the reactivegas, the gasification exhibits a saturation behavior typical for heterogeneousgas-solid reactions. A thermally-induced deactivation at above 1310 K isobserved for the steam gasification of PD coke.
Effect of the particle size. The effect of the particle size on the rate ofthe reactive gasification in a 60% H2O-Ar atmosphere is shown in Figures 5.9and 5.10 for Flexicoke and PD coke, respectively. The samples were heatedwith a linear heating rate of 10 Kmin−1 from 500 to 1520 K.
In the case of Flexicoke, the effect of the particle size on the rate of thereactive gasification was negligible. However, the gasification rate of PD cokeshowed a significant dependence on the particle size, and the reaction rateincreased with decreasing mean particle size. The fastest rates were observedfor the powder size samples with a mean particle size (dP,50) of 1.2, 3.8, and 26(‘> 80’) µm (cf. Table 2.3 on page 21 with the respective sample properties).
Pyrolysis of PD coke starts at somewhat lower temperatures (about 600K) and has a higher reaction extent for powder size fractions obtained from
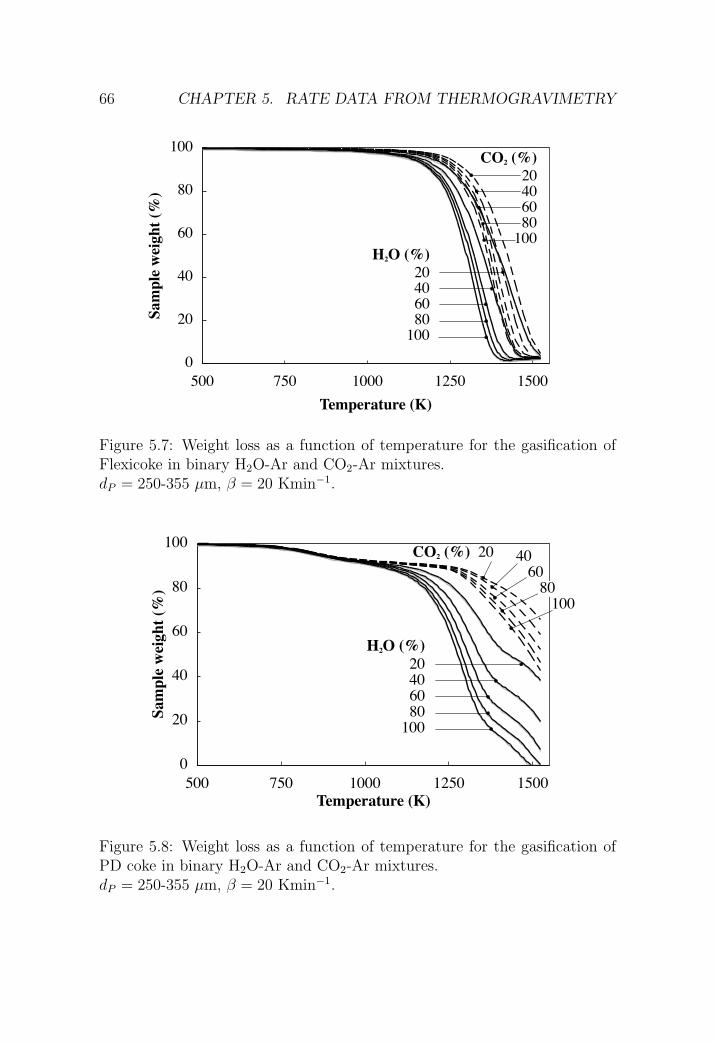
66 CHAPTER 5. RATE DATA FROM THERMOGRAVIMETRY
0
20
40
60
80
100
500 750 1000 1250 1500
Temperature (K)
Sam
ple
wei
gh
t (%
)
H2O (%)
20
40
60
80
100
CO2 (%)
20
40
60
80
100
Figure 5.7: Weight loss as a function of temperature for the gasification ofFlexicoke in binary H2O-Ar and CO2-Ar mixtures.dP = 250-355 µm, β = 20 Kmin−1.
0
20
40
60
80
100
500 750 1000 1250 1500
Temperature (K)
Sam
ple
wei
gh
t (%
)
CO2 (%) 20
H2O (%)
20
40
60
80
100
40
60
80
100
Figure 5.8: Weight loss as a function of temperature for the gasification ofPD coke in binary H2O-Ar and CO2-Ar mixtures.dP = 250-355 µm, β = 20 Kmin−1.

5.2. RESULTS 67
0
20
40
60
80
100
500 700 900 1100 1300 1500
Temperature (K)
Sa
mp
le w
eig
ht
(%)
dP (µm)
<80
80-160
160-200
200-250
250-355
355-500
Figure 5.9: Weight loss as a function of temperature for the steam gasificationof Flexicoke. The parameter is the mean particle size.pH2O = 0.6 bar, β = 10 Kmin−1.
0
20
40
60
80
100
500 700 900 1100 1300 1500
Temperature (K)
Sam
ple
wei
gh
t (%
)
dP (µm)
>500
355-500
250-355
200-250
160-200
80-160
1.2
3.8
<80
Figure 5.10: Weight loss as a function of temperature for the steam gasifica-tion of PD coke. The parameter is the mean particle size. pH2O = 0.6 bar,β = 10 Kmin−1.

68 CHAPTER 5. RATE DATA FROM THERMOGRAVIMETRY
grinding with the jet mill and the ball mill. For all particles bigger than200-250 µm, the reaction does not reach completion before below 1310 K,and its rate undergoes attenuation by thermal deactivation.
The averaged weight of the residuum found at the end of the TG experi-ment was 3.6 and 1.1 wt% for Flexicoke and PD coke, respectively.
Experimental particle effectiveness
The particle effectiveness factor, ηP , is determined experimentally usingEquation (4.15) from the particle model presented in Chapter 4.1.1:
ηP =robs
rintr
ηP is the ratio of the observed overall rate of reaction, robs , and the intrinsicrate of reaction, rintr , that would be observed under the same conditions ifdiffusion in the solid was instantaneous.
The intrinsic rate, rintr , is obtained experimentally from gasification ex-periments using very small particles since the diffusion resistance inside theparticle becomes negligible for RP → 0. Alternatively, rintr is accessible viathe extrapolation of a series of experiments using particles of different sizesto RP = 0, which is done in the following.
Figures 5.11 and 5.12 show experimentally measured rate data for fivetemperatures between 1050 and 1250 K. The radii of the coke samples usedfor the experiments are in the 20-213 µm and 0.6-372 µm range for Flexicoke(Figure 5.11) and PD coke (Figure 5.12), respectively. The dashed linesrepresent the extrapolation of the experimental rate data at each temperaturelevel to RP = 0 in order to obtain the intrinsic rate, rintr . Once the intrinsicrate at a certain temperature is known, the effectiveness factor, ηP , is readilycalculated by application of Equation (4.15) to any rate measured at thesame temperature with particles having a different size.
Figure 5.13 shows the effectiveness factors calculated for the experimentsin Figures 5.9 and 5.10. As expected, ηP of samples consisting of smallparticles is one. ηP = 1 is observed for Flexicoke particles with RP < 10−5
m and for PD coke particles with RP < 10−6 m, whereas PD coke withRP = 372 µm has an effectiveness as low as 20%. Figures 5.11, 5.12 and5.13 further show that the effectivity of PD coke is stronger affected byan increase of the particle size than Flexi coke. An effect of the particletemperature, which is known to have a significant influence on the particleeffectiveness due to the exponential temperature dependence of the reactionrate, was not found in the investigated temperature interval. An extension
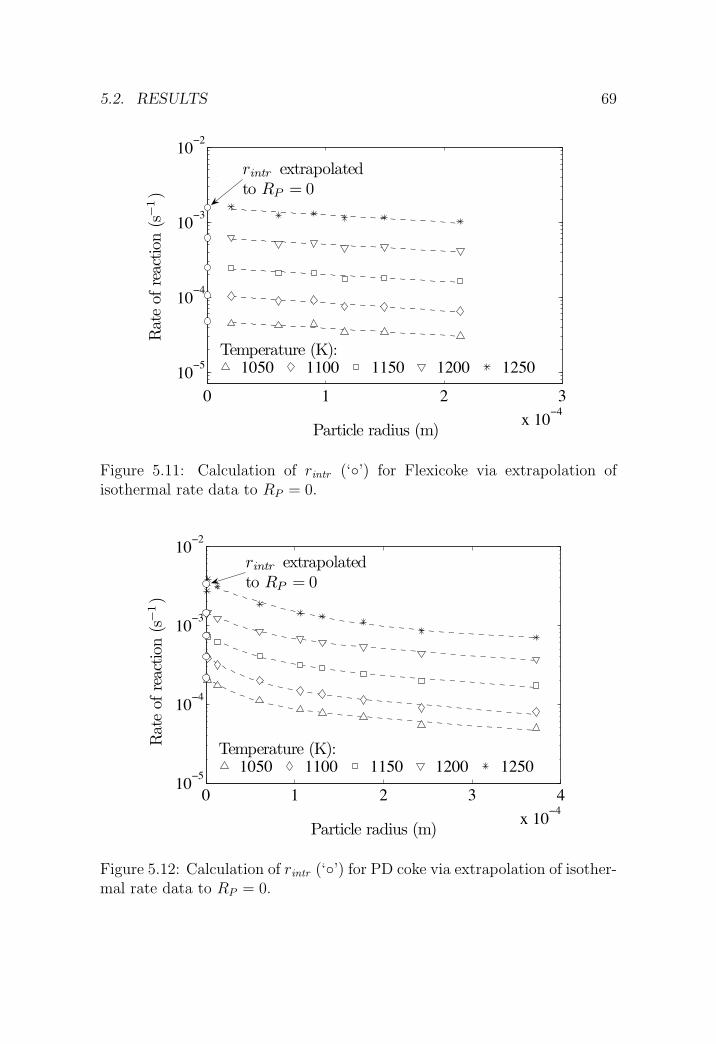
5.2. RESULTS 69
0 1 2 3
x 10!4
10!5
10!4
10!3
10!2
Particle radius (m)
Rat
eof
reac
tion
(s!
1)
1050 1100 1150 1200 1250
rintr extrapolatedto RP = 0
Temperature (K):
Figure 5.11: Calculation of rintr (‘◦’) for Flexicoke via extrapolation ofisothermal rate data to RP = 0.
0 1 2 3 4
x 10!4
10!5
10!4
10!3
10!2
Particle radius (m)
Rat
eof
reac
tion
(s!
1)
1050 1100 1150 1200 1250
rintr extrapolatedto RP = 0
Temperature (K):
Figure 5.12: Calculation of rintr (‘◦’) for PD coke via extrapolation of isother-mal rate data to RP = 0.

70 CHAPTER 5. RATE DATA FROM THERMOGRAVIMETRY
10!7
10!6
10!5
10!4
10!3
10!0.6
10!0.4
10!0.2
100
Particle radius (m)
Par
ticle
e!ec
tive
ness
!P
(!)
1050K
1100K
1150K
1200K
1250KPD coke
Flexicoke
Equation (5.4)model
Figure 5.13: Experimental particle effectiveness factor ηP for the steam gasi-fication of Flexicoke and PD coke.
of the temperature interval would certainly yield a different result, but thiswas not feasible with the setup at hand.
To calculate the rate of the reactive gasification in the chapters thatfollow, the experimental effectiveness shown in Figure 5.13 is correlated witha sum of exponentials according to
ηP = a exp(−bx) + c exp(−dx) (5.4)
The parameters in Equation (5.4) are calculated for the additional constrainta + c = 1 to force the curve through the point (0,1) since ηP = 1 for RP = 0.Numerical values for the parameters a, b, c and d are presented in Table 5.4,and the calculated fit is shown in Figure 5.13 as a solid line together withthe experimental data.
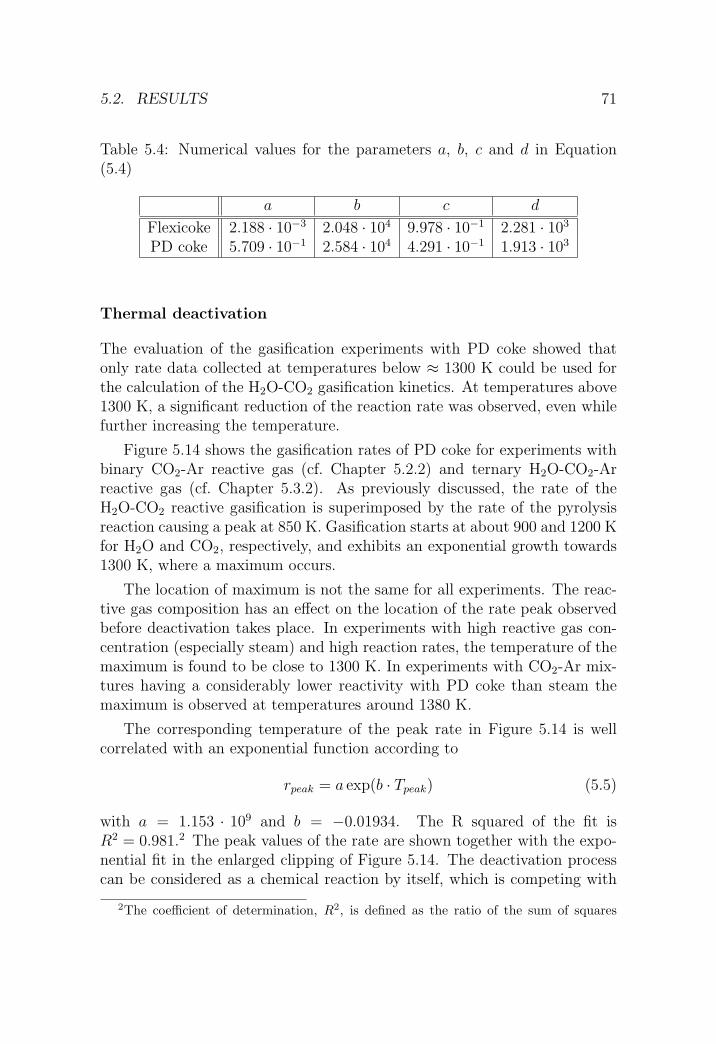
5.2. RESULTS 71
Table 5.4: Numerical values for the parameters a, b, c and d in Equation(5.4)
a b c d
Flexicoke 2.188 · 10−3 2.048 · 104 9.978 · 10−1 2.281 · 103
PD coke 5.709 · 10−1 2.584 · 104 4.291 · 10−1 1.913 · 103
Thermal deactivation
The evaluation of the gasification experiments with PD coke showed thatonly rate data collected at temperatures below ≈ 1300 K could be used forthe calculation of the H2O-CO2 gasification kinetics. At temperatures above1300 K, a significant reduction of the reaction rate was observed, even whilefurther increasing the temperature.
Figure 5.14 shows the gasification rates of PD coke for experiments withbinary CO2-Ar reactive gas (cf. Chapter 5.2.2) and ternary H2O-CO2-Arreactive gas (cf. Chapter 5.3.2). As previously discussed, the rate of theH2O-CO2 reactive gasification is superimposed by the rate of the pyrolysisreaction causing a peak at 850 K. Gasification starts at about 900 and 1200 Kfor H2O and CO2, respectively, and exhibits an exponential growth towards1300 K, where a maximum occurs.
The location of maximum is not the same for all experiments. The reac-tive gas composition has an effect on the location of the rate peak observedbefore deactivation takes place. In experiments with high reactive gas con-centration (especially steam) and high reaction rates, the temperature of themaximum is found to be close to 1300 K. In experiments with CO2-Ar mix-tures having a considerably lower reactivity with PD coke than steam themaximum is observed at temperatures around 1380 K.
The corresponding temperature of the peak rate in Figure 5.14 is wellcorrelated with an exponential function according to
rpeak = a exp(b · Tpeak) (5.5)
with a = 1.153 · 109 and b = −0.01934. The R squared of the fit isR2 = 0.981.2 The peak values of the rate are shown together with the expo-nential fit in the enlarged clipping of Figure 5.14. The deactivation processcan be considered as a chemical reaction by itself, which is competing with
2The coefficient of determination, R2, is defined as the ratio of the sum of squares
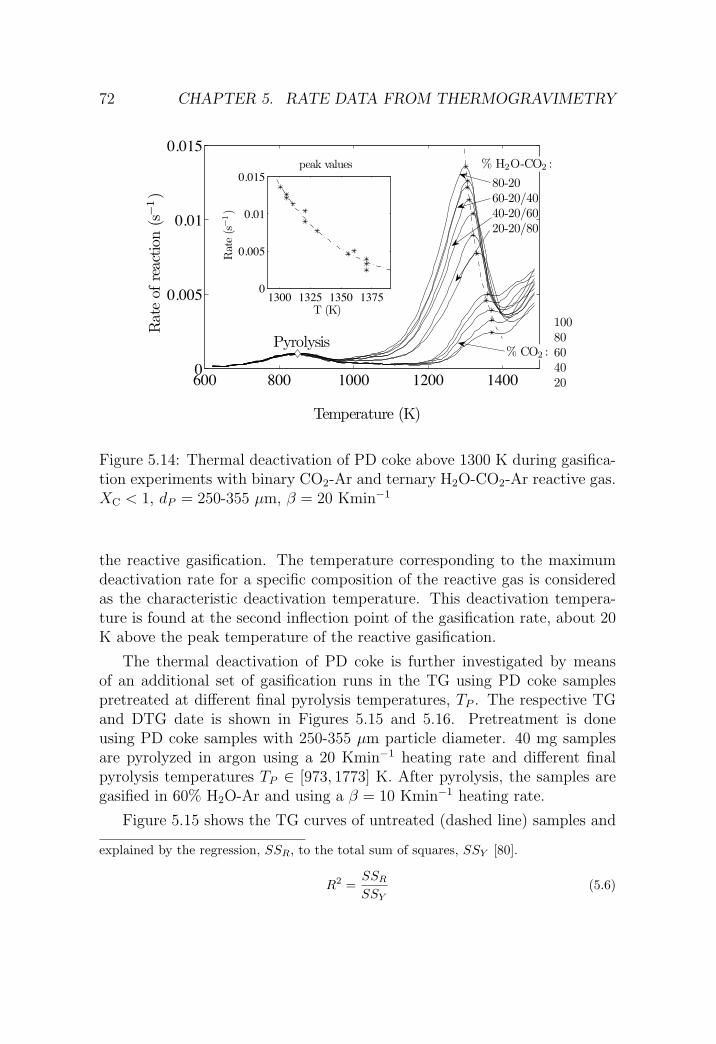
72 CHAPTER 5. RATE DATA FROM THERMOGRAVIMETRY
600 800 1000 1200 14000
0.005
0.01
0.015
Temperature (K)
Rat
eof
reac
tion
(s!
1)
1300 1325 1350 13750
0.005
0.01
0.015
T (K)
Rat
e(s!
1)
peak values
Pyrolysis
% H2O-CO2 :
% CO2 :
10080604020
80-2060-20/4040-20/6020-20/80
Figure 5.14: Thermal deactivation of PD coke above 1300 K during gasifica-tion experiments with binary CO2-Ar and ternary H2O-CO2-Ar reactive gas.XC < 1, dP = 250-355 µm, β = 20 Kmin−1
the reactive gasification. The temperature corresponding to the maximumdeactivation rate for a specific composition of the reactive gas is consideredas the characteristic deactivation temperature. This deactivation tempera-ture is found at the second inflection point of the gasification rate, about 20K above the peak temperature of the reactive gasification.
The thermal deactivation of PD coke is further investigated by meansof an additional set of gasification runs in the TG using PD coke samplespretreated at different final pyrolysis temperatures, TP . The respective TGand DTG date is shown in Figures 5.15 and 5.16. Pretreatment is doneusing PD coke samples with 250-355 µm particle diameter. 40 mg samplesare pyrolyzed in argon using a 20 Kmin−1 heating rate and different finalpyrolysis temperatures TP ∈ [973, 1773] K. After pyrolysis, the samples aregasified in 60% H2O-Ar and using a β = 10 Kmin−1 heating rate.
Figure 5.15 shows the TG curves of untreated (dashed line) samples and
explained by the regression, SSR, to the total sum of squares, SSY [80].
R2 =SSR
SSY(5.6)

5.2. RESULTS 73
500 750 1000 1250 15000
0.2
0.4
0.6
0.8
1
Temperature (K)
1!
XC
(!)
untreatedT-treated
973/10731173127313731473
1573/1673/1773
TP (K)
Figure 5.15: Weight loss as a function of temperature for the gasification ofthermally pretreated PD coke.dP = 250-355 µm, pH2O = 0.6 bar, β = 10 Kmin−1
500 750 1000 1250 15000
0.5
1
1.5x 10
!3
Temperature (K)
Rat
eof
reac
tion
(s!
1)
untreated
T-treated
1473/15731673/1773
973/1073/117312731373
Pyrolysis
TP (K)
Figure 5.16: Rate of reaction as a function of temperature for the gasificationof thermally pretreated PD coke.dP = 250-355 µm, pH2O = 0.6 bar, β = 10 Kmin−1

74 CHAPTER 5. RATE DATA FROM THERMOGRAVIMETRY
samples that were thermally treated (solid lines) at a maximum pyrolysistemperature, TP . Two effects can be observed:
1. Temperature pretreatment leads to an anticipation of the pyrolysis stepin the 700-900 K range.
2. The TG curves of samples pretreated at pyrolysis temperatures in the1273-1473 K interval show a shift of the TG curve up to 200 K towardshigher temperatures.
The rates of the gasification reaction presented in Figure 5.16 show amaximum at 1280 K as long as the pretreatment temperature did not exceedthe deactivation threshold temperature at about 1310 K. Maintaining thereactive gas composition and the heating rate constant, the correspondingtemperature of the peak rate is the same for all runs, independent of carbonconversion.
In experiments with Flexicoke, no thermal deactivation was observed atany temperature. It is assumed that the more severe conditions in the pro-duction process of Flexicoke result in a product being less affected by subse-quent temperature treatment. Flash pyrolysis experiments in H2O-Ar in thesolar furnace at PSI showed a possibility to avoid thermal deactivation alsofor PD coke.
TG and DTG error estimation
The detection limit for weight changes is affected by the background noiseof the TG signal and the accuracy of the electronic balance. To measure asignificant rate of reaction, the underlying weight change has to be biggerthan the background noise of the TG signal. As a measure for the backgroundnoise, the standard deviation
σx =
√√√√ 1
N
N∑i=1
(xi − x)2 (5.7)
of the TG signal before and after applying a low pass filter3 is used. Figure5.17 shows the noise for the experimental data presented in Chapters 5.2.1and 5.2.2. The calculated amplitudes |x− x| are neither depending on tem-perature nor on conversion, which is a strong function of temperature (in thehigh temperature range, conversions of 100% have been obtained).
3The applied filter is a locally weighted scatter plot smooth using least squares quadraticpolynomial fitting
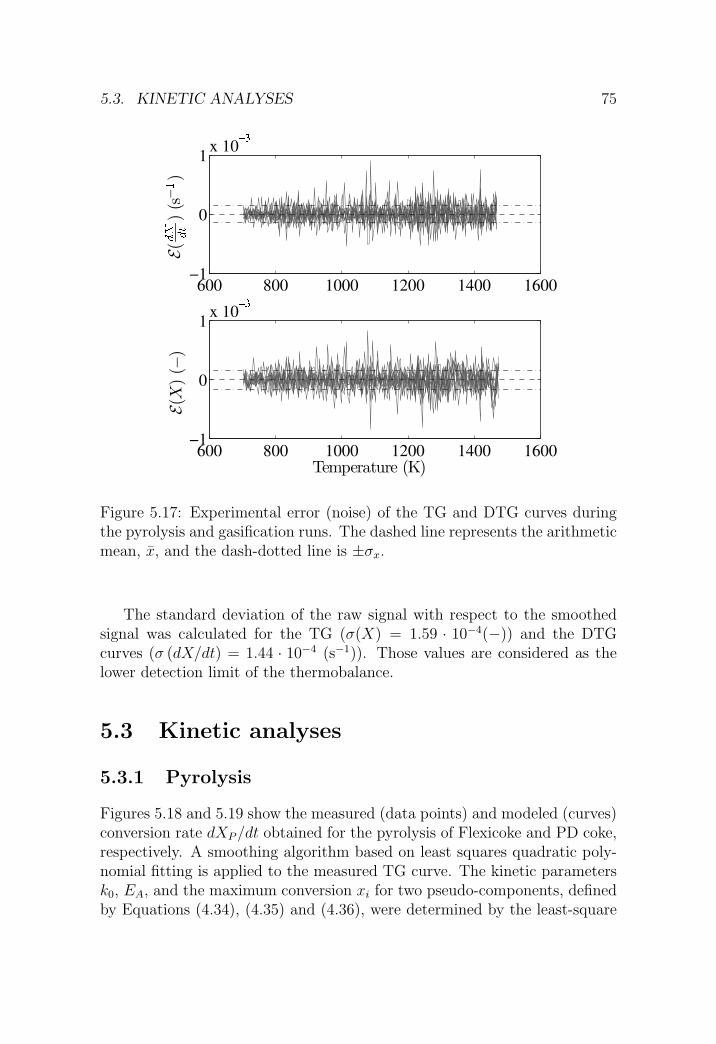
5.3. KINETIC ANALYSES 75
Figure 5.17: Experimental error (noise) of the TG and DTG curves duringthe pyrolysis and gasification runs. The dashed line represents the arithmeticmean, x, and the dash-dotted line is ±σx.
The standard deviation of the raw signal with respect to the smoothedsignal was calculated for the TG (σ(X) = 1.59 · 10−4(−)) and the DTGcurves (σ (dX/dt) = 1.44 · 10−4 (s−1)). Those values are considered as thelower detection limit of the thermobalance.
5.3 Kinetic analyses
5.3.1 Pyrolysis
Figures 5.18 and 5.19 show the measured (data points) and modeled (curves)conversion rate dXP /dt obtained for the pyrolysis of Flexicoke and PD coke,respectively. A smoothing algorithm based on least squares quadratic poly-nomial fitting is applied to the measured TG curve. The kinetic parametersk0, EA, and the maximum conversion xi for two pseudo-components, definedby Equations (4.34), (4.35) and (4.36), were determined by the least-square

76 CHAPTER 5. RATE DATA FROM THERMOGRAVIMETRY
1)
Figure 5.18: Measured (data points) and modeled (curves) conversion ratedXP /dt obtained for the pyrolysis of Flexicoke.
1)
Figure 5.19: Measured (data points) and modeled (curves) conversion ratedXP /dt obtained for the pyrolysis of PD coke.

5.3. KINETIC ANALYSES 77
Table 5.5: Kinetic parameters for the pyrolysis of petroleum coke.
k0 (s−1) EA (J/mol) xi (−)
r1 4.152·10−2 5.157·104 0.0136Flexicoke
r2 1.881·100 1.210·105 0.0207r1 1.905·10−1 5.087·104 0.0794
PD coker2 7.528·10−3 4.626·104 0.0393
method. The root mean square (RMS) of the absolute error between the ex-perimentally measured and the theoretically modeled reaction rate dXP /dtwas minimized with an algorithm of MATLAB [37]. The kinetic parametersare listed in Table 5.5 for Flexicoke and PD coke.
The weight losses of Flexicoke for the first and the second reactions are1.36 and 2.07%, respectively, giving a total of 3.43%. The weight losses of PDcoke for the first and the second reactions are 7.94 and 3.93%, respectively,giving a total mass loss of 11.87%. The RMS of the absolute error betweenthe measured and the modeled petcoke pyrolysis is 8.40 · 10−7 for Flexicokeand 2.24 · 10−6 for PD coke.
5.3.2 H2O-CO2 gasification
The calculation of the Arrhenius parameters for the reactive gasification inH2O-CO2 mixtures is based on the intrinsic rate, rintr , not affected by masstransfer limitations inside the particle. rintr is calculated with Equation(4.15)
rintr =robs
ηP
where ηP is the particle effectiveness factor calculated with Equation (5.4)and the data from Table 5.4, presented in the previous section. The overallrate of the reactive gasification, robs , is obtained by subtraction of the pyrol-ysis weight loss, XP , from the overall weight loss, X, according to Equation(5.1) and taking the time derivative.
The Arrhenius parameters of the rate constants defined by Equation(4.53) (derived by applying the oxygen-transfer mechanism) and Equation(4.83) (derived by applying the extended mechanism) were determined nu-merically using the same algorithm by MATLAB [37] for minimizing theRMS error between measured and modeled data as for the pyrolysis kinetics.The numerical procedure is carried out simultaneously for all temperatures

78 CHAPTER 5. RATE DATA FROM THERMOGRAVIMETRY
Table 5.6: Arrhenius parameters of the rate constants derived by applying theoxygen-exchange mechanism [Equation (4.53)] for the H2O-CO2 gasificationof PD coke. RMS = 3.80 · 10−5.
k′1 k′2 k′3(Pa−1s−1) (Pa−1s−1) (−)
k0 (k′i) 4.856·103 5.601·100 1.712·102
EA (J/mol) 2.851·105 1.866·105 9.929·104
and all combinations of partial pressures (H2O-CO2-Ar and CO2-Ar mix-tures) applied in the experiments of Table 5.3. Table 5.6 lists the best-fitkinetics parameters of the rate constants derived for the oxygen-exchangemechanism of the steam-gasification of PD coke. The results are in agree-ment with data presented in gasification studies with pure H2O or CO2 [47].Further, the gasification with H2O-CO2 mixtures can be described using therate constants obtained from experiments with pure gases, as claimed previ-ously [21].
As far as the steam gasification of Flexicoke is concerned, the oxygen-exchange mechanism is not capable of describing with reasonable accuracythe reaction rate. As it will be shown in the following Figures, the additionof CO2 to a reacting gas containing more than 60 % H2O does not result inan appreciable increase of the reaction rate, as predicted by Equation (4.53).Presumably, mass transfer is limited by slow diffusion of the reactive gas intothe interior of the particles through their pores [21].
Table 5.7 lists the best-fit kinetic parameters derived for the extendedmechanism of the H2O-CO2 gasification of Flexicoke and PD coke. Figure5.20 shows the comparison of the experimentally measured (data points) andthe theoretically modeled (curves) rate of reaction, −rC, as a function of tem-perature for various H2O-CO2 mixtures. The parameter is the compositionof the gaseous reactant, expressed in %H2O-%CO2 at 1 bar total pressure.
The extended model is closely obeyed over the 900-1300 K temperaturerange and over the complete range of H2O/CO2 concentrations. The rootmean square (RMS) of the absolute error between the experimental and themodeled rate of reaction is 2.31 ·10−5 s−1 for Flexicoke and 3.80 ·10−5 s−1 forPD coke. Taking into account the different empirical particle effectivenessbeing 0.709 and 0.334 for 250-355 µm Flexicoke and PD coke, respectively,the overall rate of the steam gasification is essentially the same for both coketypes, whereas the overall rate of the CO2 gasification is considerably faster

5.4. SUMMARY AND CONCLUSIONS 79
Table 5.7: Arrhenius parameters of the rate constants derived by applyingthe extended mechanism [Equation (4.83)] for the H2O-CO2 gasification ofFlexicoke and PD coke.
K1 K2 K4 K5
(Pa−1s−1) (Pa−1s−1) (Pa−1) (Pa−1)
k0 (Ki) 9.650·100 3.364·101 1.576·10−5 5.560·10−4
Flexicokea
EA (J/mol) 2.132·105 2.170·105 8.276·103 5.739·105
k0 (Ki) 1.158·103 4.978·10−1 4.033·10−8 8.152·10−6
PD cokeb
EA (J/mol) 2.707·105 1.615·105 7.068·103 4.551·102
a RMS = 2.305 · 10−5
b RMS = 3.796 · 10−5
for Flexicoke than for PD coke.
Figure 5.21 is a cross-plot of the previous figure at 1273 K and showsa contour of reaction rates, −rC (s−1), as a function of the H2O and CO2
partial pressures, for Flexicoke (a) and PD coke (b). The figure also showsthe different reactive gas compositions used for the TG experiments (‘⊗’) andcan be used to predict the effect of a change in the reactive gas composition onthe intrinsic reaction rate. For example, adding CO2 to a H2O-CO2 reactivegas at pH2O > 0.7 bar does not result in an increase of the reaction rate forFlexicoke, whereas it accelerates the reaction rate of PD coke assuming thesame conditions.
At 1273 K, the intrinsic reaction rate in 100% H2O at 1 bar is 6.5·10−3 s−1
for PD coke, almost twice of the value observed for Flexicoke. Taking intoaccount the particle effectiveness of a 300 µm sample (i.e. 0.709 for Flexicokeand 0.334 for PD coke) results in an overall reaction rate that is about thesame for both coke types. Despite the differences in the values of the kineticparameters K1 and K4 associated with the CO2 terms of Equation (4.83),the intrinsic reaction rate with 100% CO2 is similar for both types of coke,about 1.0 · 10−3 s−1.
5.4 Summary and conclusions
Kinetic rate laws for the combined pyrolysis-gasification of petcoke and de-termined experimentally the Arrhenius parameters were derived by dynamic

80 CHAPTER 5. RATE DATA FROM THERMOGRAVIMETRY
(a)
1000 1100 1200 1300
10!4
10!3
Temperature (K)
Rat
eof
reac
tion
(s!
1)
80-2060-4060-20
40-6040-20
20-8020-20
%H2O-%CO2
2040
6080
100
%CO2
(b)
900 1000 1100 1200 1300
10!4
10!3
Temperature (K)
Rat
eof
reac
tion
(s!
1)
80-2060-4060-20
40-6040-20
20-8020-20
%H2O-%CO2
10080
6040
20
%CO2
Figure 5.20: Experimentally measured (data points) and modeled (curves)reaction rate, −rC (s−1), as a function of temperature for the gasificationof (a) Flexicoke and (b) PD coke. The parameter is the composition of thereactive gas expressed in %H2O-%CO2. The overall pressure is 1 bar.

5.4. SUMMARY AND CONCLUSIONS 81
(a)
0 0.2 0.4 0.6 0.8 10
0.2
0.4
0.6
0.8
1
pCO2 (bar)
p H2O
(bar
)
0.0005 0.001
0.001
0.001
0.00150.0015
0.0015
0.002 0.002 0.002
0.0025 0.0025 0.0025
0.0030.003
0.003
TG experiments
(b)
0 0.2 0.4 0.6 0.8 10
0.2
0.4
0.6
0.8
1
pCO2 (bar)
p H2O
(bar
)
0.001 0.001 0.001
0.002 0.002 0.002
0.003 0.003 0.003
0.004 0.004 0.004
0.005 0.005 0.005
0.0060.006
0.006
0.007
TG experiments
Figure 5.21: Reaction rate, −rC (s−1), as a function of the H2O and CO2
partial pressures at 1273 K for (a) Flexicoke and (b) PD coke. The totalpressure is 1 bar. ‘⊗’ represents the conditions of the TG experiments.
82 CHAPTER 5. RATE DATA FROM THERMOGRAVIMETRY
thermogravimetric analyses of the Ar-pyrolysis and H2O-CO2-gasification oftwo types of Venezuelan petcokes (Flexicoke and PD coke). The pyrolysisis well described by applying a 2-pseudo-component decomposition mech-anism. The gasification kinetics is modeled by applying two mechanisms:an oxygen-transfer mechanism based on reversible O-transfer surface reac-tions and irreversible carbon gasification, and an extended mechanism thatconsiders, in addition, OH/H-sorption and H-transfer. The former, simpler,mechanism fails to describe the Flexicoke gasification, presumably becauseof mass transfer limitations inside the particle. The latter mechanism is ableto simulate, with good experimental agreement, the H2O-CO2 gasification ofboth types of petcoke.
Steam gasification runs at considerably higher rates than dry gasification:The intrinsic reaction rate with 100% H2O is 6.5 · 10−3 s−1 for PD coke,almost twice the value observed for Flexicoke. The intrinsic reaction ratewith 100% CO2 is similar for both types of coke, about 1.0 ·10−3 s−1. Takinginto account the differences in the empirical particle effectiveness being 0.709and 0.334 for 250-355 µm Flexicoke and PD coke, the overall rate of H2Ogasification is comparable for both types of cokes, whereas the overall rateof CO2 gasification is considerably faster for Flexicoke than for PD coke.
Main evolved gases during pyrolysis include C2H6, C2H4, CH4, CO2, CO,and H2 for PD coke, and CO, CO2, and H2 for Flexicoke. Besides the py-rolytic gas products, the main gasification products are H2, CO, CO2, andH2S for both cokes.
The dependence of the rate of the H2O-CO2-gasification on the particlesize was modeled empirically by means of a particle size dependent effec-tiveness parameter, ηP , which is the ratio of the observed overall rate andthe intrinsic rate in absence of mass transfer limitations. ηP is determinedexperimentally for both coke types.

Chapter 6
Experimental determination ofthe rate constants using labscale integral reactors1
This chapter presents two series of steam gasification experiments performedin laboratory scale fluidized bed reactors. Two different reactor setups wereused that differ with respect to the heat transfer mode from an externalradiation source to the petcoke particles in the fluidized bed:
• The direct irradiated fluidized bed (DFB) reactor consists of a trans-parent quartz fluidization tube including a porous disk acting as a bedsupport. The reactants being coke and steam are heated by direct irra-diation of the petcoke particles in the fluidized bed with concentratedthermal radiation from ETH’s solar simulator.
• The indirect irradiated fluidized bed (IFB) reactor features an opaquefluidization tube, offering the possibility to use fluidization tubes madeof different materials featuring different wall strength and optical prop-erties. The heat transfer from the solar simulator to the reactants isindirect and occurs via heating of the fluidization tube and subsequentradiative and convective heat transfer from the wall to the bed.
1The experimental data presented in this chapter were obtained in the framework oftwo master theses at the Professorship in Renewable Energy Carriers at ETH Zurich,performed by M. Fasciana, F. Noembrini [22] (DFB experiments in Chapter 6.1) andR. Alvarez [2] (IFB experiments in Chapter 6.2). Material from this chapter has beenpublished in ‘D. Trommer, F. Noembrini, M. Fasciana, et al. Hydrogen production bysteam gasification of petroleum coke using concentrated solar power - I. Thermodynamicand kinetic analyses. International Journal of Hydrogen Energy, 2005. 30(6): p. 605-618’.
83
84 CHAPTER 6. RATE CONSTANTS FROM INTEGRAL REACTORS
The gasification experiments with a direct and an indirect irradiated flu-idized bed reactor offer the possibility of analyzing if the heat transfer modehas an effect on the reaction kinetics. Because other experimental parametersincluding the properties of the radiation source, the fluidized bed parameters,and the type of fuel are the same for both reactors, the experimental config-urations described above permit a direct investigation of a possible effect ofthe heat transfer mode on the reaction kinetics.
Chapter 6.1 presents the DFB setup and the experimental results ob-tained for the gasification using direct irradiation of the reactants. Chapter6.2 discusses the IFB setup and the experimental results obtained for gasifica-tion using indirect irradiation. The gasification experiments with both setupsare performed isothermally using different bed temperatures in the range of1070-1405 K. The corresponding rate constants are calculated in Chapter6.3 by solving the mass balance for every species over a differential reactorelement and performing an Arrhenius analysis to derive the pre-exponentialfactors and activation energies.
6.1 Fluidized bed reactor with direct irradi-
ation
6.1.1 Reactor setup
The chemical reactor used for the kinetic study using direct irradiation con-sisted of a 25 mm-outer diameter, 1.5 mm-thickness, 25 cm-height quartztube containing a petcoke/steam fluidized bed directly exposed to concen-trated thermal irradiation. Figure 6.2 shows a photograph of the quartzfluidized bed reactor (QFBR) before (left) and after (right) an experimentalrun.
The reactor concept was previously used to analyze the steam gasificationof activated charcoal [63]. For the gasification experiments with coke, thereactor was added a new side access below the porous quartz disk acting asbed support. With this arrangement, the thermocouple enters the fluidizedbed from the bottom via the side access and through a pin-hole in the frit. Inopposition to the previous design featuring a top access, the thermocouple isnow protected from the intense thermal radiation, what leads to an increasedlifetime and a reduced failure rate.
Tests were conducted at the ETH’s high-flux solar simulator - a high-pressure argon arc close-coupled to precision elliptical-trough mirrors - de-
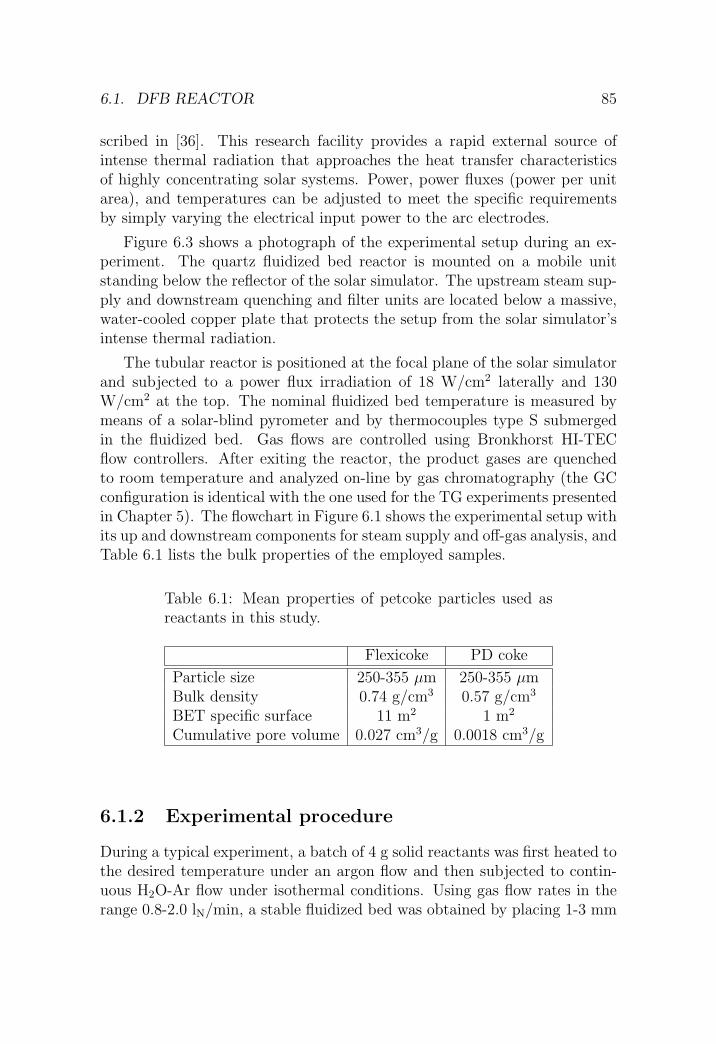
6.1. DFB REACTOR 85
scribed in [36]. This research facility provides a rapid external source ofintense thermal radiation that approaches the heat transfer characteristicsof highly concentrating solar systems. Power, power fluxes (power per unitarea), and temperatures can be adjusted to meet the specific requirementsby simply varying the electrical input power to the arc electrodes.
Figure 6.3 shows a photograph of the experimental setup during an ex-periment. The quartz fluidized bed reactor is mounted on a mobile unitstanding below the reflector of the solar simulator. The upstream steam sup-ply and downstream quenching and filter units are located below a massive,water-cooled copper plate that protects the setup from the solar simulator’sintense thermal radiation.
The tubular reactor is positioned at the focal plane of the solar simulatorand subjected to a power flux irradiation of 18 W/cm2 laterally and 130W/cm2 at the top. The nominal fluidized bed temperature is measured bymeans of a solar-blind pyrometer and by thermocouples type S submergedin the fluidized bed. Gas flows are controlled using Bronkhorst HI-TECflow controllers. After exiting the reactor, the product gases are quenchedto room temperature and analyzed on-line by gas chromatography (the GCconfiguration is identical with the one used for the TG experiments presentedin Chapter 5). The flowchart in Figure 6.1 shows the experimental setup withits up and downstream components for steam supply and off-gas analysis, andTable 6.1 lists the bulk properties of the employed samples.
Table 6.1: Mean properties of petcoke particles used asreactants in this study.
Flexicoke PD coke
Particle size 250-355 µm 250-355 µmBulk density 0.74 g/cm3 0.57 g/cm3
BET specific surface 11 m2 1 m2
Cumulative pore volume 0.027 cm3/g 0.0018 cm3/g
6.1.2 Experimental procedure
During a typical experiment, a batch of 4 g solid reactants was first heated tothe desired temperature under an argon flow and then subjected to contin-uous H2O-Ar flow under isothermal conditions. Using gas flow rates in therange 0.8-2.0 lN/min, a stable fluidized bed was obtained by placing 1-3 mm
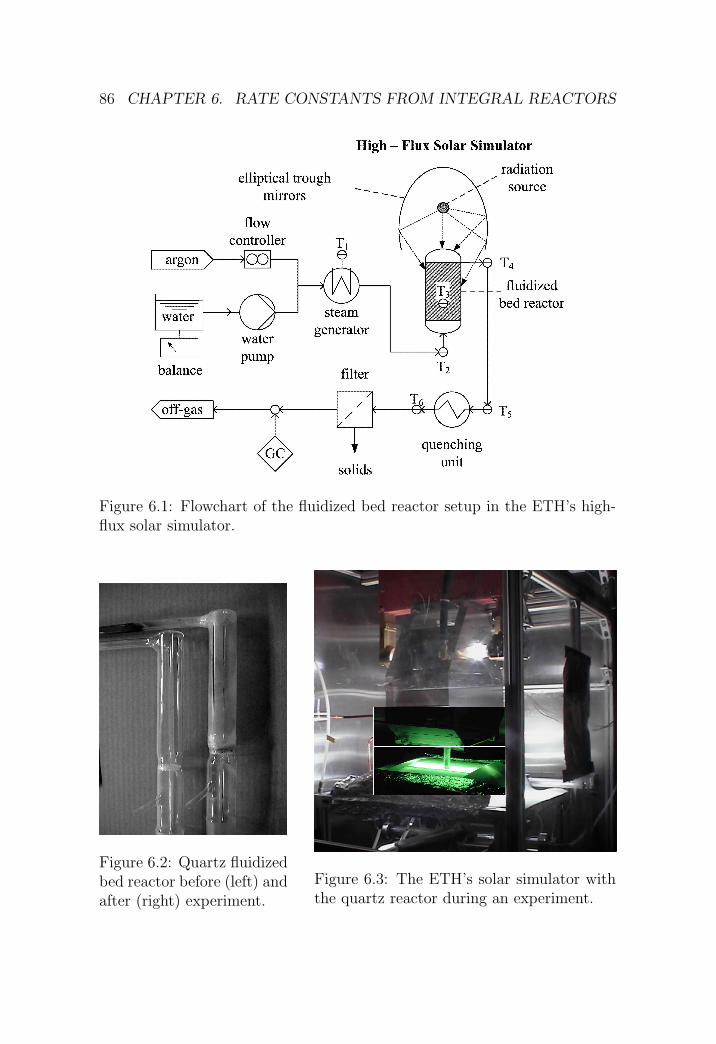
86 CHAPTER 6. RATE CONSTANTS FROM INTEGRAL REACTORS
Figure 6.1: Flowchart of the fluidized bed reactor setup in the ETH’s high-flux solar simulator.
Figure 6.2: Quartz fluidizedbed reactor before (left) andafter (right) experiment.
Figure 6.3: The ETH’s solar simulator withthe quartz reactor during an experiment.
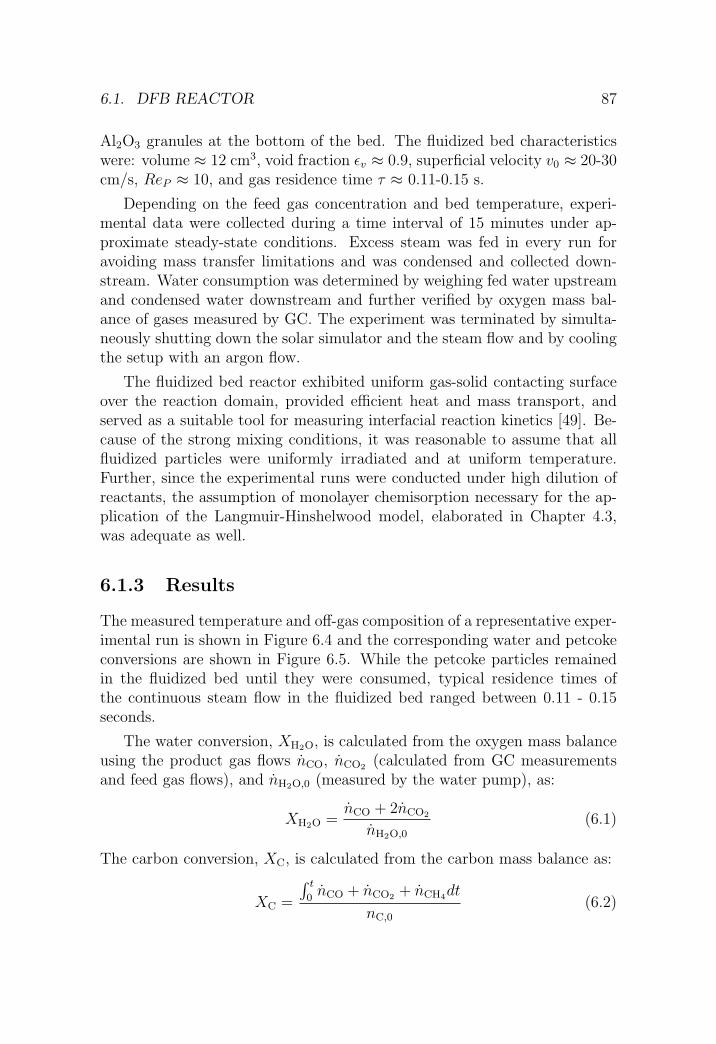
6.1. DFB REACTOR 87
Al2O3 granules at the bottom of the bed. The fluidized bed characteristicswere: volume ≈ 12 cm3, void fraction εv ≈ 0.9, superficial velocity v0 ≈ 20-30cm/s, ReP ≈ 10, and gas residence time τ ≈ 0.11-0.15 s.
Depending on the feed gas concentration and bed temperature, experi-mental data were collected during a time interval of 15 minutes under ap-proximate steady-state conditions. Excess steam was fed in every run foravoiding mass transfer limitations and was condensed and collected down-stream. Water consumption was determined by weighing fed water upstreamand condensed water downstream and further verified by oxygen mass bal-ance of gases measured by GC. The experiment was terminated by simulta-neously shutting down the solar simulator and the steam flow and by coolingthe setup with an argon flow.
The fluidized bed reactor exhibited uniform gas-solid contacting surfaceover the reaction domain, provided efficient heat and mass transport, andserved as a suitable tool for measuring interfacial reaction kinetics [49]. Be-cause of the strong mixing conditions, it was reasonable to assume that allfluidized particles were uniformly irradiated and at uniform temperature.Further, since the experimental runs were conducted under high dilution ofreactants, the assumption of monolayer chemisorption necessary for the ap-plication of the Langmuir-Hinshelwood model, elaborated in Chapter 4.3,was adequate as well.
6.1.3 Results
The measured temperature and off-gas composition of a representative exper-imental run is shown in Figure 6.4 and the corresponding water and petcokeconversions are shown in Figure 6.5. While the petcoke particles remainedin the fluidized bed until they were consumed, typical residence times ofthe continuous steam flow in the fluidized bed ranged between 0.11 - 0.15seconds.
The water conversion, XH2O, is calculated from the oxygen mass balanceusing the product gas flows nCO, nCO2 (calculated from GC measurementsand feed gas flows), and nH2O,0 (measured by the water pump), as:
XH2O =nCO + 2nCO2
nH2O,0
(6.1)
The carbon conversion, XC, is calculated from the carbon mass balance as:
XC =
∫ t
0nCO + nCO2 + nCH4dt
nC,0
(6.2)

88 CHAPTER 6. RATE CONSTANTS FROM INTEGRAL REACTORS
Figure 6.4: Fluidized bed temperature and product gas composition duringa representative experimental run with Flexicoke and 10% H2O-Ar.
Figure 6.5: Steam and carbon conversion for the experimental run of Figure6.4 with Flexicoke and 10% H2O-Ar.
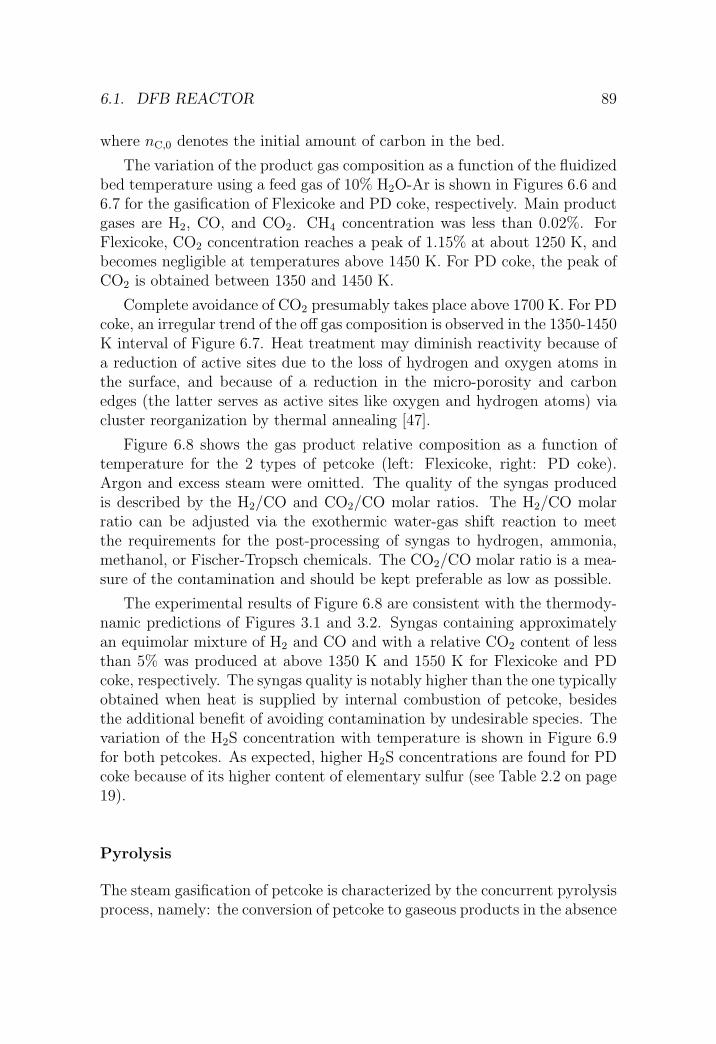
6.1. DFB REACTOR 89
where nC,0 denotes the initial amount of carbon in the bed.
The variation of the product gas composition as a function of the fluidizedbed temperature using a feed gas of 10% H2O-Ar is shown in Figures 6.6 and6.7 for the gasification of Flexicoke and PD coke, respectively. Main productgases are H2, CO, and CO2. CH4 concentration was less than 0.02%. ForFlexicoke, CO2 concentration reaches a peak of 1.15% at about 1250 K, andbecomes negligible at temperatures above 1450 K. For PD coke, the peak ofCO2 is obtained between 1350 and 1450 K.
Complete avoidance of CO2 presumably takes place above 1700 K. For PDcoke, an irregular trend of the off gas composition is observed in the 1350-1450K interval of Figure 6.7. Heat treatment may diminish reactivity because ofa reduction of active sites due to the loss of hydrogen and oxygen atoms inthe surface, and because of a reduction in the micro-porosity and carbonedges (the latter serves as active sites like oxygen and hydrogen atoms) viacluster reorganization by thermal annealing [47].
Figure 6.8 shows the gas product relative composition as a function oftemperature for the 2 types of petcoke (left: Flexicoke, right: PD coke).Argon and excess steam were omitted. The quality of the syngas producedis described by the H2/CO and CO2/CO molar ratios. The H2/CO molarratio can be adjusted via the exothermic water-gas shift reaction to meetthe requirements for the post-processing of syngas to hydrogen, ammonia,methanol, or Fischer-Tropsch chemicals. The CO2/CO molar ratio is a mea-sure of the contamination and should be kept preferable as low as possible.
The experimental results of Figure 6.8 are consistent with the thermody-namic predictions of Figures 3.1 and 3.2. Syngas containing approximatelyan equimolar mixture of H2 and CO and with a relative CO2 content of lessthan 5% was produced at above 1350 K and 1550 K for Flexicoke and PDcoke, respectively. The syngas quality is notably higher than the one typicallyobtained when heat is supplied by internal combustion of petcoke, besidesthe additional benefit of avoiding contamination by undesirable species. Thevariation of the H2S concentration with temperature is shown in Figure 6.9for both petcokes. As expected, higher H2S concentrations are found for PDcoke because of its higher content of elementary sulfur (see Table 2.2 on page19).
Pyrolysis
The steam gasification of petcoke is characterized by the concurrent pyrolysisprocess, namely: the conversion of petcoke to gaseous products in the absence
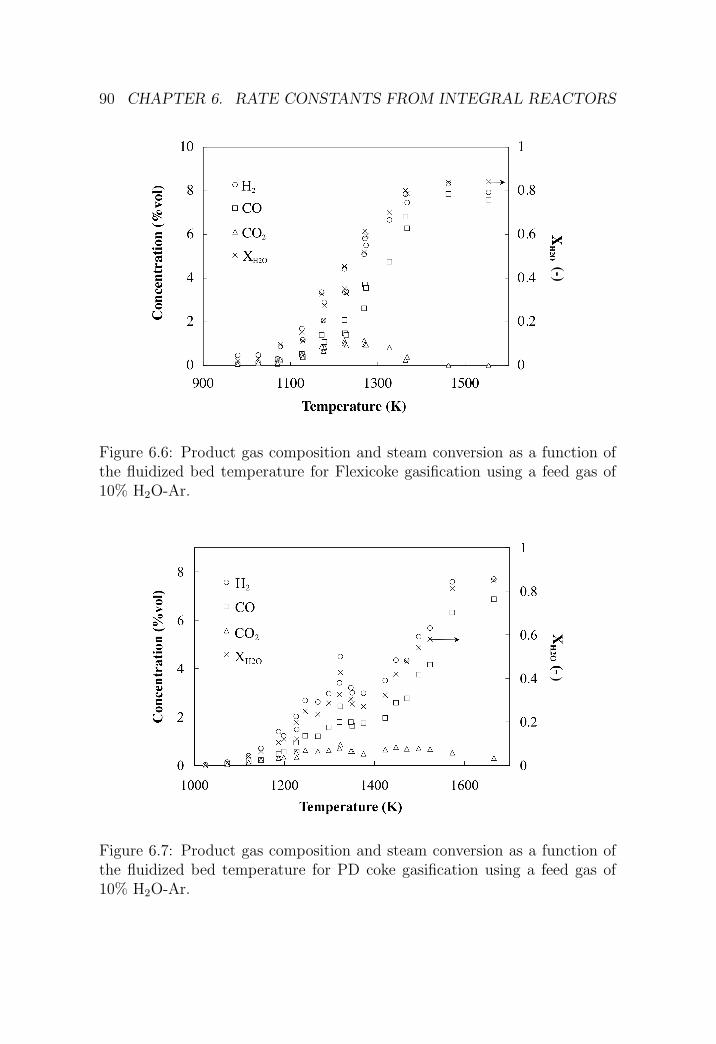
90 CHAPTER 6. RATE CONSTANTS FROM INTEGRAL REACTORS
(-)
Figure 6.6: Product gas composition and steam conversion as a function ofthe fluidized bed temperature for Flexicoke gasification using a feed gas of10% H2O-Ar.
)
Figure 6.7: Product gas composition and steam conversion as a function ofthe fluidized bed temperature for PD coke gasification using a feed gas of10% H2O-Ar.

6.1. DFB REACTOR 91
1000 1200 14000
0.2
0.4
0.6
0.8
1
Temperature (K)
Com
posit
ion,
XH
2O
(!)
(a)
1200 1400 16000
0.2
0.4
0.6
0.8
1
Temperature (K)
Com
posit
ion,
XH
2O
(!)
(b)
CO2
CO
H2
CO2
CO
H2
Figure 6.8: Product gas relative composition and steam conversion as a func-tion of temperature for the steam gasification of (a) Flexicoke and (b) PDcoke with direct irradiation of the fluidized bed. Argon and excess steam areomitted.
H2S
con
cen
trati
on
(%
vol)
Figure 6.9: Variation of H2S concentration in the product gas with temper-ature for the steam gasification of both petcokes.

92 CHAPTER 6. RATE CONSTANTS FROM INTEGRAL REACTORS
Table 6.2: Experimental parameters of hydrogen and oxy-gen released by pyrolysis during dry experimental runs.
Flexicoke PD coke
Fluidized bed temperature 1390 K 1420 KInitial sample weight 7.544 g 3.516 gH-weight fraction 0.0067 0.00414O-weight fraction 0.00915 0.00146nH2 0.0085 mol 0.000685 molnCO 0.0018 mol 0.000685 molFraction of H released 34% 75%Fraction of O released 41% 21%
of an oxidizing agent. In experiments performed with high heating rates(≈ 50 K/s), the rate of pyrolysis-related reactions appears to be significantlyhigher than that of H2O gasification-related reactions, as recorded by GC(see for example, Figures 6.4 and 6.5). Immediately after the turning on ofthe radiation source, but before the steam flow was injected into the reactor,sharp peaks of H2 and CO - attributed to pyrolysis and desorption processes- were observed in concentrations higher than those obtained during thereaction with steam.
Quantitative analysis of the pyrolysis gas production was determined indry experiments (100% Ar). Figure 6.10 shows the measured reactor tem-perature and product gas concentration during the pyrolysis of Flexicoke.Integration of the GC peaks over time yielded the fractions of hydrogen andoxygen released during pyrolysis, listed in Table 6.2. 34% and 75% of thehydrogen and 41% and 21% of the oxygen initially contained in the coke werereleased during pyrolysis of Flexicoke and PD coke, respectively.
The pyrolysis of PD coke was further investigated as a function of tem-perature: Figure 6.11 presents the variation of the elementary composition ofthe residual coke with temperature. Clearly recognizable is the progressivecarbonization with increasing bed temperature, reaching 95.6% at 1665 K.Hydrogen and oxygen content approached zero at above 1300 K.
Figures 6.12 and 6.13 show the specific surface, the micropore area andvolume, and the average pore diameter of PD coke. Vis-a-vis the raw PD cokehaving a BET specific surface 1 m2/g, an increase of specific surface was foundfor all samples subjected to the combined pyrolysis and steam gasification inthe quartz fluidized bed reactor. The highest specific surface (≈ 80 m2/g)

6.1. DFB REACTOR 93
Figure 6.10: Reactor temperature and product gas concentration during adry experimental run with Flexicoke.
Figure 6.11: Variation of the elementary composition of PD coke with tem-perature.

94 CHAPTER 6. RATE CONSTANTS FROM INTEGRAL REACTORS
Figure 6.12: Variation of the specific surface and micropore area of PD cokewith temperature.
Figure 6.13: Variation of the micropore volume and the average pore diam-eter of PD coke with temperature.
6.2. IFB REACTOR 95
as well as micropore area (≈ 40 m2/g) and volume (≈ 0.02 cm3/g) are ob-served for samples treated at temperatures below 1300 K. Higher reactortemperatures result in a dramatic loss of specific surface and the microporeparameters indicate an even stronger decrease of microporosity. At the sametime, the average pore diameter is increased by a factor of five from 2 to10 nm. The carbon conversion of all samples was below 20%. The resultscorrespond to DiPanfilo and Egiebor [18], who found that the surface area ofsynthetic crude coke is generally increased by activation with steam at 1123K and report values in the order of 100 m2/g for samples with a burn-off(carbon conversion) of 20%.
6.2 Fluidized bed reactor with indirect irra-
diation
6.2.1 Reactor setup
For the steam gasification experiments using indirect irradiation a new re-actor setup was designed based on the experiences with the quartz fluidizedbed reactor (QFBR) from the previous chapter. The new design is an op-timization with regard to mechanical stability and experimental flexibility.In opposition to the DFB setup from the previous chapter, the IFB setupallows to use any kind of fluidization tube with an outer diameter of 2.5cm. The reactor setup consisted of a water-cooled aluminum plate acting asradiation shield and base plate to mount the open fluidization tube and thesurrounding quartz dome separating the reactive atmosphere from ambientair.
Figure 6.14 shows a technical drawing of the reactor setup. The fluidiza-tion tube has an outer diameter of 2.5 cm and is 20 cm long. At 9 cm fromthe bottom end it contains a porous quartz disk acting as bed support. Thedisk features a lead-through for the bed thermocouple in the form of a pin-hole sealed with high temperature cement. The fluidization tube is mountedwith o-rings in the water-cooled radiation shield and can be fixed at an ar-bitrary height. The quartz dome mounted on top of the plate separates thefluidization tube with the reactive gas environment from the ambient. Boththe quartz dome and the fluidization tube are sealed against the base platewith o-rings fixed with a sealing unit from the bottom side. The annulusbetween the quartz dome and the fluidization tube is purged with a sweepargon flow to avoid dead volumes. All gases including the fluidization gaswith the gasification products leave the reactor through a horizontal quartz

96 CHAPTER 6. RATE CONSTANTS FROM INTEGRAL REACTORS
quartz dome
fluidized bedfluidization tube
thermocouple
off-gas tube
porous quartz disk
sealing unit
water cooledradiation shield
reactive gas (inlet) o-rings
outlet
Figure 6.14: Fluidized bed reactor setup for the use of opaque ceramicsfluidization tubes with radiation shield and quartz dome.
Table 6.3: Characteristics of the fluidizationtubes tested with the setup in Figure 6.14.
inner ∅ dwall k† ε†material
(mm) (mm) (W/m/K) (-)
Al2O3 22 1.5 5 0.21Al2O3 20 2.5 5 0.21SiC 18 3.5 35 0.94
quartz 22 1.5
† at 1000 ◦C.
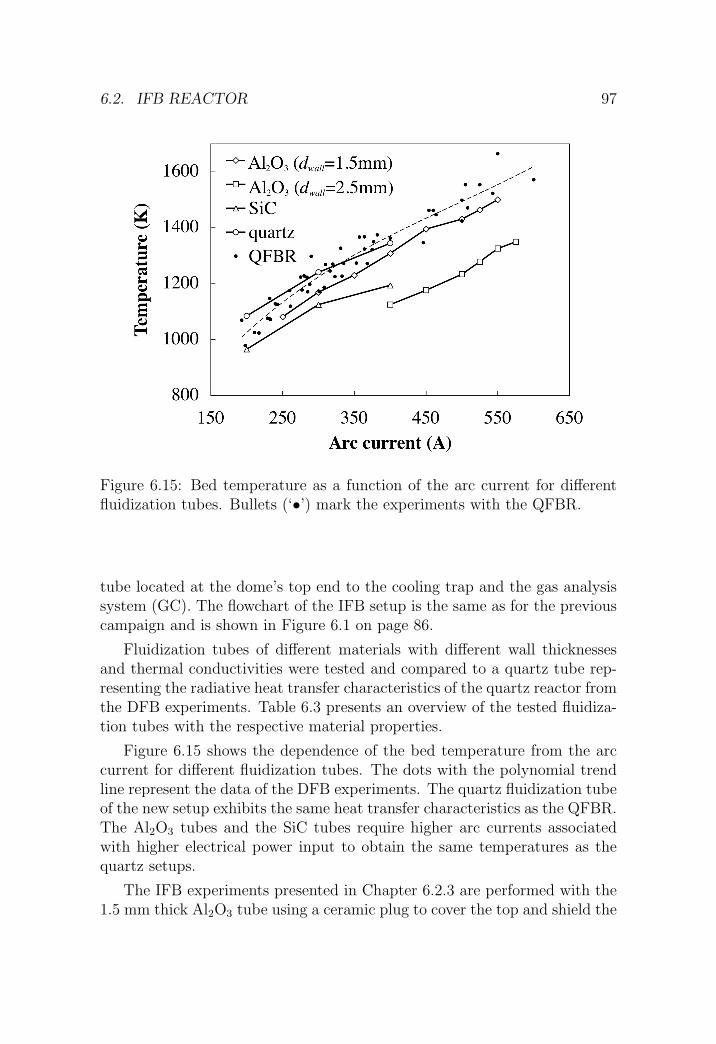
6.2. IFB REACTOR 97
Figure 6.15: Bed temperature as a function of the arc current for differentfluidization tubes. Bullets (‘•’) mark the experiments with the QFBR.
tube located at the dome’s top end to the cooling trap and the gas analysissystem (GC). The flowchart of the IFB setup is the same as for the previouscampaign and is shown in Figure 6.1 on page 86.
Fluidization tubes of different materials with different wall thicknessesand thermal conductivities were tested and compared to a quartz tube rep-resenting the radiative heat transfer characteristics of the quartz reactor fromthe DFB experiments. Table 6.3 presents an overview of the tested fluidiza-tion tubes with the respective material properties.
Figure 6.15 shows the dependence of the bed temperature from the arccurrent for different fluidization tubes. The dots with the polynomial trendline represent the data of the DFB experiments. The quartz fluidization tubeof the new setup exhibits the same heat transfer characteristics as the QFBR.The Al2O3 tubes and the SiC tubes require higher arc currents associatedwith higher electrical power input to obtain the same temperatures as thequartz setups.
The IFB experiments presented in Chapter 6.2.3 are performed with the1.5 mm thick Al2O3 tube using a ceramic plug to cover the top and shield the
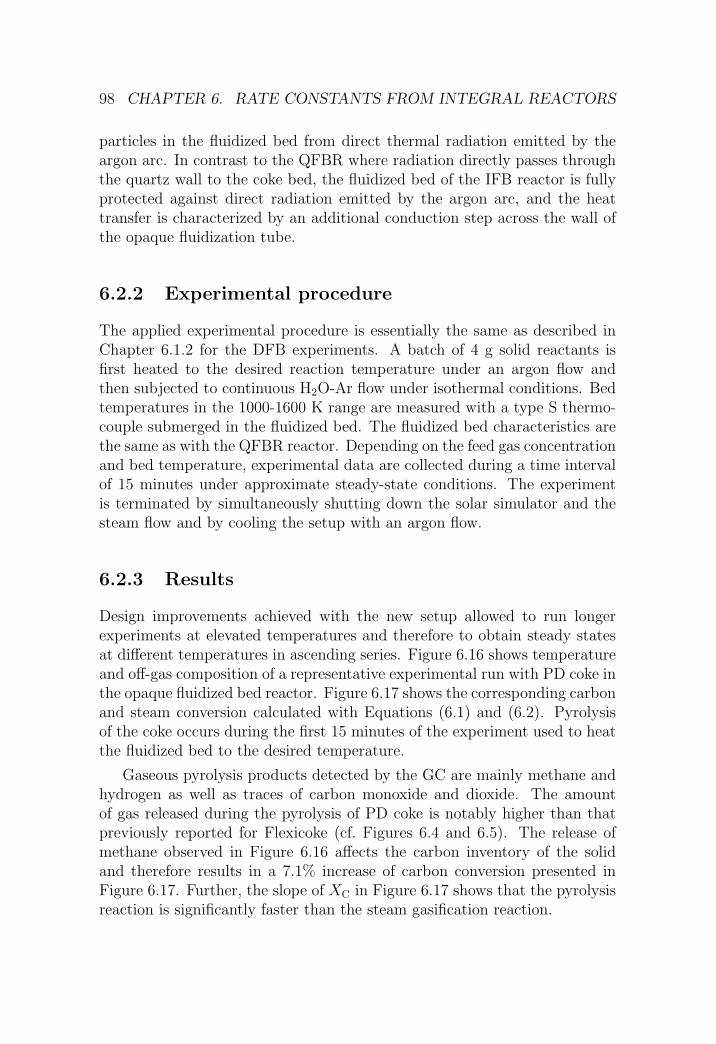
98 CHAPTER 6. RATE CONSTANTS FROM INTEGRAL REACTORS
particles in the fluidized bed from direct thermal radiation emitted by theargon arc. In contrast to the QFBR where radiation directly passes throughthe quartz wall to the coke bed, the fluidized bed of the IFB reactor is fullyprotected against direct radiation emitted by the argon arc, and the heattransfer is characterized by an additional conduction step across the wall ofthe opaque fluidization tube.
6.2.2 Experimental procedure
The applied experimental procedure is essentially the same as described inChapter 6.1.2 for the DFB experiments. A batch of 4 g solid reactants isfirst heated to the desired reaction temperature under an argon flow andthen subjected to continuous H2O-Ar flow under isothermal conditions. Bedtemperatures in the 1000-1600 K range are measured with a type S thermo-couple submerged in the fluidized bed. The fluidized bed characteristics arethe same as with the QFBR reactor. Depending on the feed gas concentrationand bed temperature, experimental data are collected during a time intervalof 15 minutes under approximate steady-state conditions. The experimentis terminated by simultaneously shutting down the solar simulator and thesteam flow and by cooling the setup with an argon flow.
6.2.3 Results
Design improvements achieved with the new setup allowed to run longerexperiments at elevated temperatures and therefore to obtain steady statesat different temperatures in ascending series. Figure 6.16 shows temperatureand off-gas composition of a representative experimental run with PD coke inthe opaque fluidized bed reactor. Figure 6.17 shows the corresponding carbonand steam conversion calculated with Equations (6.1) and (6.2). Pyrolysisof the coke occurs during the first 15 minutes of the experiment used to heatthe fluidized bed to the desired temperature.
Gaseous pyrolysis products detected by the GC are mainly methane andhydrogen as well as traces of carbon monoxide and dioxide. The amountof gas released during the pyrolysis of PD coke is notably higher than thatpreviously reported for Flexicoke (cf. Figures 6.4 and 6.5). The release ofmethane observed in Figure 6.16 affects the carbon inventory of the solidand therefore results in a 7.1% increase of carbon conversion presented inFigure 6.17. Further, the slope of XC in Figure 6.17 shows that the pyrolysisreaction is significantly faster than the steam gasification reaction.
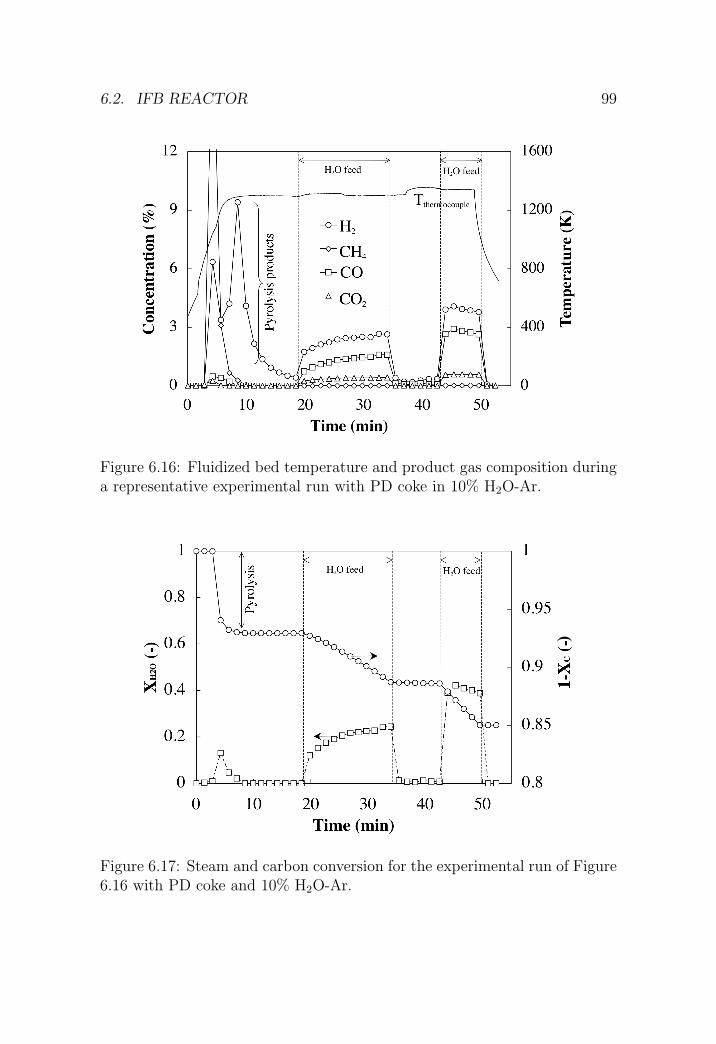
6.2. IFB REACTOR 99
Figure 6.16: Fluidized bed temperature and product gas composition duringa representative experimental run with PD coke in 10% H2O-Ar.
(
Figure 6.17: Steam and carbon conversion for the experimental run of Figure6.16 with PD coke and 10% H2O-Ar.
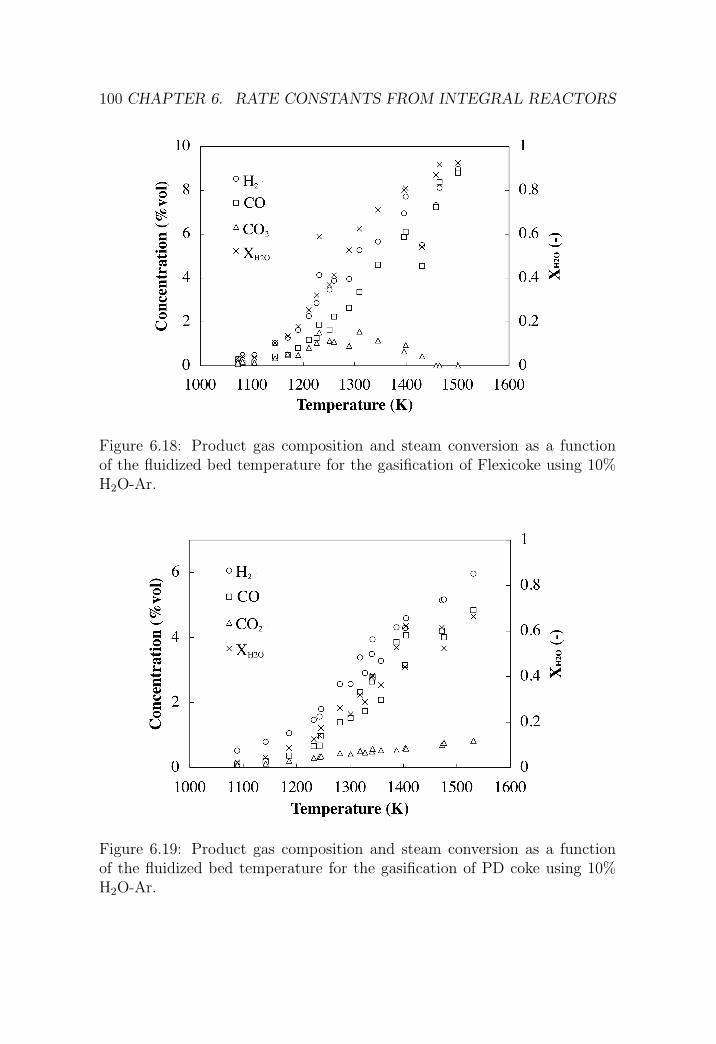
100 CHAPTER 6. RATE CONSTANTS FROM INTEGRAL REACTORS
(-)
Figure 6.18: Product gas composition and steam conversion as a functionof the fluidized bed temperature for the gasification of Flexicoke using 10%H2O-Ar.
(-)
Figure 6.19: Product gas composition and steam conversion as a functionof the fluidized bed temperature for the gasification of PD coke using 10%H2O-Ar.
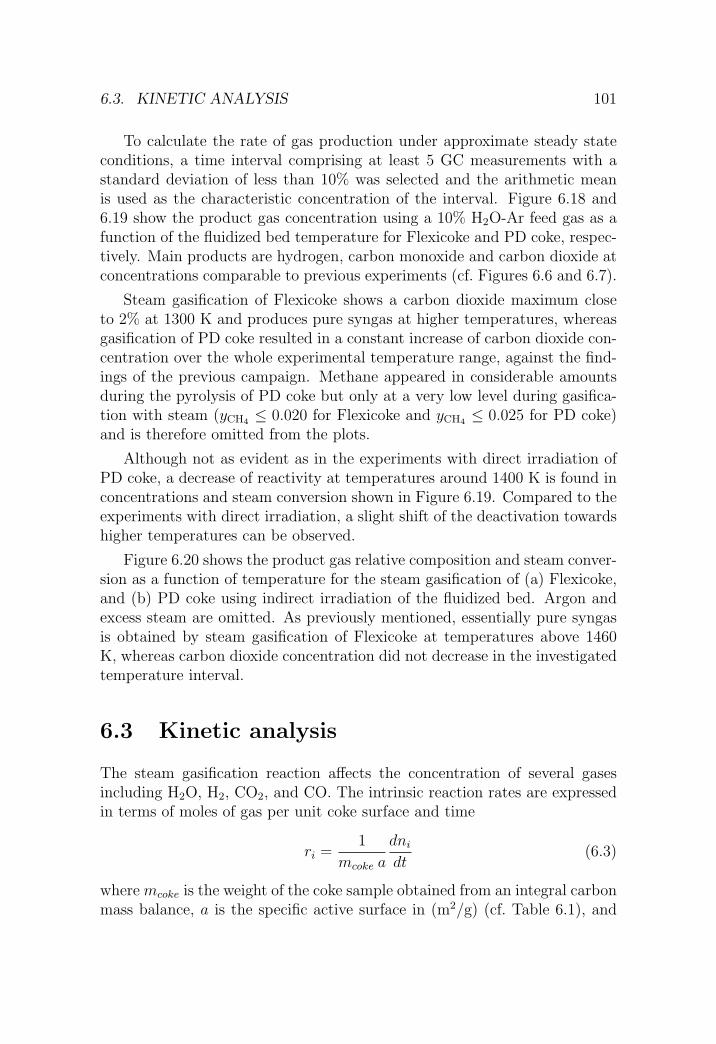
6.3. KINETIC ANALYSIS 101
To calculate the rate of gas production under approximate steady stateconditions, a time interval comprising at least 5 GC measurements with astandard deviation of less than 10% was selected and the arithmetic meanis used as the characteristic concentration of the interval. Figure 6.18 and6.19 show the product gas concentration using a 10% H2O-Ar feed gas as afunction of the fluidized bed temperature for Flexicoke and PD coke, respec-tively. Main products are hydrogen, carbon monoxide and carbon dioxide atconcentrations comparable to previous experiments (cf. Figures 6.6 and 6.7).
Steam gasification of Flexicoke shows a carbon dioxide maximum closeto 2% at 1300 K and produces pure syngas at higher temperatures, whereasgasification of PD coke resulted in a constant increase of carbon dioxide con-centration over the whole experimental temperature range, against the find-ings of the previous campaign. Methane appeared in considerable amountsduring the pyrolysis of PD coke but only at a very low level during gasifica-tion with steam (yCH4 ≤ 0.020 for Flexicoke and yCH4 ≤ 0.025 for PD coke)and is therefore omitted from the plots.
Although not as evident as in the experiments with direct irradiation ofPD coke, a decrease of reactivity at temperatures around 1400 K is found inconcentrations and steam conversion shown in Figure 6.19. Compared to theexperiments with direct irradiation, a slight shift of the deactivation towardshigher temperatures can be observed.
Figure 6.20 shows the product gas relative composition and steam conver-sion as a function of temperature for the steam gasification of (a) Flexicoke,and (b) PD coke using indirect irradiation of the fluidized bed. Argon andexcess steam are omitted. As previously mentioned, essentially pure syngasis obtained by steam gasification of Flexicoke at temperatures above 1460K, whereas carbon dioxide concentration did not decrease in the investigatedtemperature interval.
6.3 Kinetic analysis
The steam gasification reaction affects the concentration of several gasesincluding H2O, H2, CO2, and CO. The intrinsic reaction rates are expressedin terms of moles of gas per unit coke surface and time
ri =1
mcoke a
dni
dt(6.3)
where mcoke is the weight of the coke sample obtained from an integral carbonmass balance, a is the specific active surface in (m2/g) (cf. Table 6.1), and
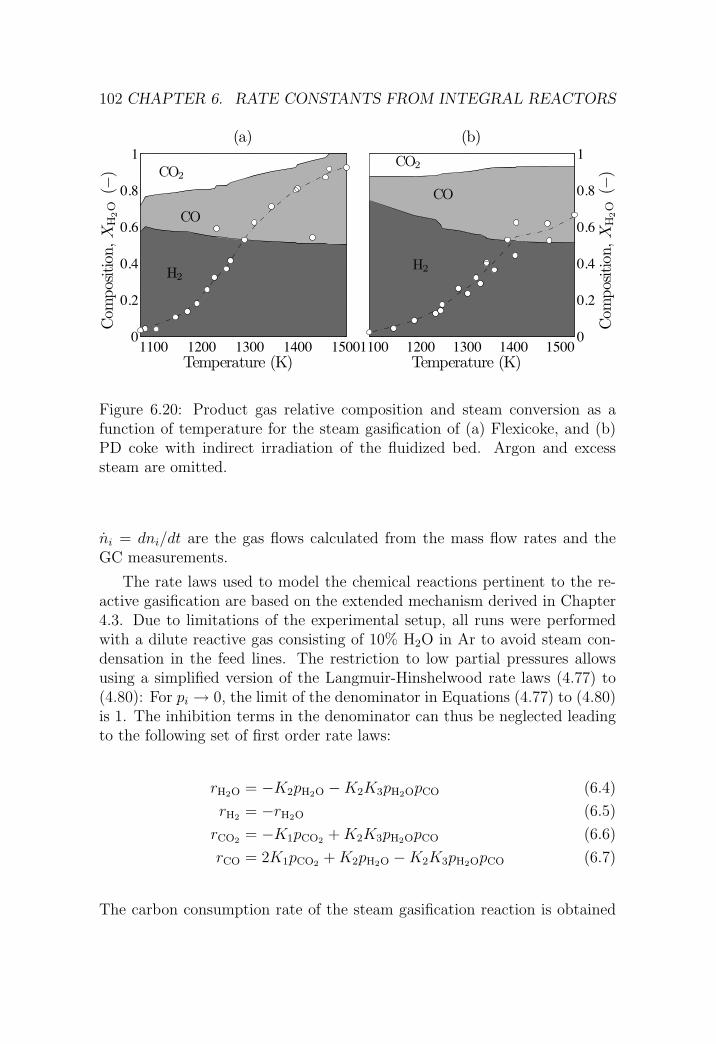
102 CHAPTER 6. RATE CONSTANTS FROM INTEGRAL REACTORS
1100 1200 1300 1400 15000
0.2
0.4
0.6
0.8
1
Temperature (K)
Com
posit
ion,
XH
2O
(!)
(a)
1100 1200 1300 1400 15000
0.2
0.4
0.6
0.8
1
Temperature (K)
Com
posit
ion,
XH
2O
(!)
(b)
CO2
CO
H2
CO2
CO
H2
Figure 6.20: Product gas relative composition and steam conversion as afunction of temperature for the steam gasification of (a) Flexicoke, and (b)PD coke with indirect irradiation of the fluidized bed. Argon and excesssteam are omitted.
ni = dni/dt are the gas flows calculated from the mass flow rates and theGC measurements.
The rate laws used to model the chemical reactions pertinent to the re-active gasification are based on the extended mechanism derived in Chapter4.3. Due to limitations of the experimental setup, all runs were performedwith a dilute reactive gas consisting of 10% H2O in Ar to avoid steam con-densation in the feed lines. The restriction to low partial pressures allowsusing a simplified version of the Langmuir-Hinshelwood rate laws (4.77) to(4.80): For pi → 0, the limit of the denominator in Equations (4.77) to (4.80)is 1. The inhibition terms in the denominator can thus be neglected leadingto the following set of first order rate laws:
rH2O = −K2pH2O −K2K3pH2OpCO (6.4)
rH2 = −rH2O (6.5)
rCO2 = −K1pCO2 + K2K3pH2OpCO (6.6)
rCO = 2K1pCO2 + K2pH2O −K2K3pH2OpCO (6.7)
The carbon consumption rate of the steam gasification reaction is obtained
6.3. KINETIC ANALYSIS 103
from a carbon mass balance:
−rC = rCO + rCO2 (6.8)
= K1pCO2 + K2pH2O (6.9)
The new Equations (6.4) to (6.7) are linearizations of the Langmuir-Hinshel-wood rate laws (4.77) to (4.80) that apply to experiments with low partialpressures only. The use of the linearized system can be justified by evaluatingthe inhibition term with the rate data obtained from the experiments in thethermobalance. Evaluation of the inhibition term assuming a reactive gaswith 10% H2O-Ar and using the Arrhenius parameters presented in Table5.7 results in a maximum linearization error of 7.8% for the gasification ofPD coke, whereas it is negligible for Flexicoke.
For the kinetic modeling the coke particles are assumed to be isothermal.Muller [63] showed for gasification experiments with activated charcoal par-ticles bigger than the coke used for this study that heat transfer resistancesin the particle can be neglected in the 1000-1300 K temperature range. Inopposition to heat transfer, the kinetic model accounts for mass transfer lim-itations inside the particle using the effectiveness model defined by Equation(4.15) in Chapter 4.1.1
ηP =robs
rintr
and the experimental correlation for ηP presented in Chapter 5.2.2.
The calculation of the rate constants from experimental rate data mea-sured at different bed temperatures is performed using a technique developedby [63]: The reactor is considered as a two phase fluidized bed assuming idealmixing for the solid phase and plug flow for the gas phase. Applying massbalance for each species i over a differential reactor element of particle massalong the reactor axis yields the performance equation for a plug flow reactor(cf. [49])
dni = ri dAcoke = ri a dmcoke (6.10)
with i = H2O, H2, CO2, CO
where ni (mol/s) are the molar flows in the axial direction, and ri are therates defined by Equations (6.4) to (6.7). The partial pressures in the rateexpressions are calculated assuming ideal gases
pi = Ptotni∑j nj
(6.11)
The system of four coupled differential Equations (6.10) is solved nu-merically using a variable order solver for stiff initial value problems, based

104 CHAPTER 6. RATE CONSTANTS FROM INTEGRAL REACTORS
0 0.5 1 1.5
x 10!4
0
0.5
1
1.5
x 10!4 H2O
Exp
erim
ent(m
ol/s
) RMS = 0.020
0 1 2
x 10!5
0
1
2
x 10!5CO2
Exp
erim
ent(m
ol/s
)RMS = 0.049
0 2 4 6 8
x 10!5
0
2
4
6
8x 10
!5 H2
Simulation (mol/s)
Exp
erim
ent(m
ol/s
) RMS = 0.113
0 2 4
x 10!5
0
2
4
x 10!5CO
Simulation (mol/s)
Exp
erim
ent(m
ol/s
)RMS = 0.036
Figure 6.21: Experimentally measured vs. modeled product flow rates(‘∗’ Flexicoke DFB, ‘◦’ Flexicoke IFB, ‘�’ PD coke DFB, ‘4’ PD coke IFB).
on the numerical differentiation formulas (MATLAB [37] ode15s). The Ar-rhenius parameters associated with the kinetic constants Ki are calculatediteratively by minimizing the difference between the theoretically calculatedand experimentally measured molar flow rates of reactants and products atthe reactor exit using the Nelder-Mead Simplex Method for multidimensionalunconstrained nonlinear minimization (MATLAB [37] fminsearch).
Figure 6.21 shows the theoretically modeled versus the experimentallymeasured product flow rates. The dashed line represents perfect match. Thedimensionless root mean square (RMS) relative error is 0.020 for H2O, 0.049for CO2, 0.113 for H2 and 0.036 for CO.
Figure 6.22 shows an example of a calculated concentration profile in

6.3. KINETIC ANALYSIS 105
0 0.2 0.4 0.6 0.8 10
2
4
6
8x 10
!5
Bed height, H/H0 (!)
Flo
w,n
i(m
ol/s
)
H2O CO2 H2 CO
! BC 1" BC 2• solution
Figure 6.22: Concentration profile along the dimensionless reactor axis andboundary conditions (/ and .) for the steam gasification of PD coke in 10%H2O-Ar at 1572 K.
the direction of the reactor axis for a gasification experiment with PD cokein the DFB reactor. The measured bed temperature is 1572 K and thefluidization gas is 10% H2O-Ar. Further, the x-axis is the dimensionless bedheight, H/H0, and the gas composition is reported in terms of the molarflow rates of H2O, H2, CO2, and CO. The triangles at the beginning and theend of the reactor mark the boundary conditions given by the experiment.The calculated solution of Equation (6.10) is indicated by lines across thebed region and bullets at H/H0 = 1 for H2O, H2, CO2, and CO. Right atthe reactor inlet, steam starts to react with the coke in the fluidized bedproducing H2 and CO. The rate of CO2 formation is zero at the reactor inletsince it is a secondary product requiring the presence of CO.
The pre-exponential factor, k0, and the apparent activation energy, EA,associated with the rate constants K1a, K2a, and K3 according to Equation(4.36) are obtained from an Arrhenius analysis. The respective plots areshown in Figures 6.23, 6.24 and 6.25 for the DFB and IFB experiments, eachincluding a data set for Flexicoke and PD coke, respectively. EA and k0 are

106 CHAPTER 6. RATE CONSTANTS FROM INTEGRAL REACTORS
7 7.5 8 8.5 9 9.5
x 10!4
!26
!24
!22
!20
!18
Temperature (1/K)
ln(K
1a)
DFB
IFBFlexicoke
PD coke
Figure 6.23: Arrhenius plots of K1a.∗ Flexicoke DFB, ◦ Flexicoke IFB, � PD coke DFB, 4 PD coke IFB.
obtained by robust linear regression using an iteratively re-weighted leastsquares algorithm. Numerical values are presented in Table 6.4 for Flexicokeand in Table 6.5 for PD coke, respectively.
Since the Ki represent complex reaction mechanisms rather than elemen-tary steps, a negative value for the apparent activation energy, as in the casefor K3, does not necessarily imply inconsistency with the transition statetheory. Following the definition of K3 in Equation (4.81), it rather impliesthat the activation energy for the rate of the elementary reaction of adsorbedoxygen with carbon to form CO (Equation 4.56) is higher than the one forthe rate of the elementary reaction of absorbed oxygen with CO to form CO2
(Equation 4.54) [63].
The error of the rate constants Ki in Tables 6.4 and 6.5 is reported interms of the root mean square (RMS) relative error between experimentaldata and regression and the coefficient of determination, R2 (cf. Equation(5.6) on page 72). The highest accuracy is found for K2a exhibiting smallrelative errors between 1.0 and 1.6% and determination coefficients between0.90 and 0.96. K2a relates to the formation of adsorbed hydrogen from steamand mainly controls the conversion of steam to hydrogen in the linear system(6.4) to (6.7).

6.3. KINETIC ANALYSIS 107
7 7.5 8 8.5 9 9.5
x 10!4
!25
!23
!21
!19
!17
Temperature (1/K)
ln(K
2a)
DFB
IFB
Flexicoke
PD coke
Figure 6.24: Arrhenius plots of K2a.∗ Flexicoke DFB, ◦ Flexicoke IFB, � PD coke DFB, 4 PD coke IFB.
7 7.5 8 8.5 9 9.5
x 10!4
!12
!10
!8
!6
!4
!2
Temperature (1/K)
ln(K
3)
DFB
IFB
Flexicoke
PD coke
Figure 6.25: Arrhenius plots of K3.∗ Flexicoke DFB, ◦ Flexicoke IFB, � PD coke DFB, 4 PD coke IFB.
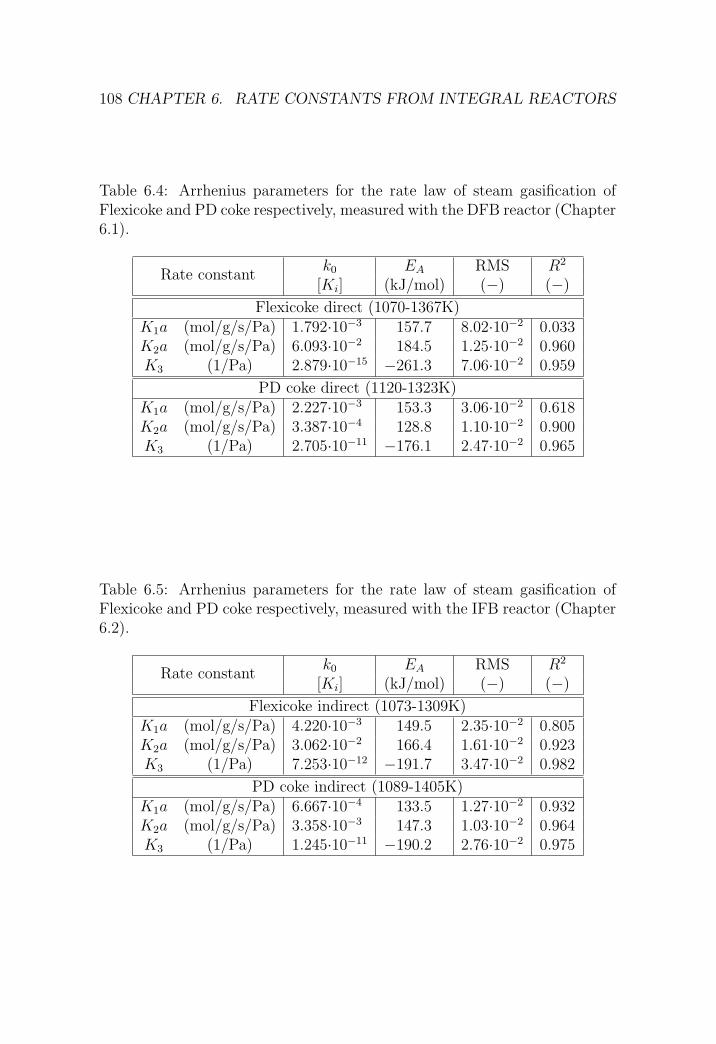
108 CHAPTER 6. RATE CONSTANTS FROM INTEGRAL REACTORS
Table 6.4: Arrhenius parameters for the rate law of steam gasification ofFlexicoke and PD coke respectively, measured with the DFB reactor (Chapter6.1).
k0 EA RMS R2
Rate constant[Ki] (kJ/mol) (−) (−)
Flexicoke direct (1070-1367K)K1a (mol/g/s/Pa) 1.792·10−3 157.7 8.02·10−2 0.033K2a (mol/g/s/Pa) 6.093·10−2 184.5 1.25·10−2 0.960K3 (1/Pa) 2.879·10−15 −261.3 7.06·10−2 0.959
PD coke direct (1120-1323K)K1a (mol/g/s/Pa) 2.227·10−3 153.3 3.06·10−2 0.618K2a (mol/g/s/Pa) 3.387·10−4 128.8 1.10·10−2 0.900K3 (1/Pa) 2.705·10−11 −176.1 2.47·10−2 0.965
Table 6.5: Arrhenius parameters for the rate law of steam gasification ofFlexicoke and PD coke respectively, measured with the IFB reactor (Chapter6.2).
k0 EA RMS R2
Rate constant[Ki] (kJ/mol) (−) (−)
Flexicoke indirect (1073-1309K)K1a (mol/g/s/Pa) 4.220·10−3 149.5 2.35·10−2 0.805K2a (mol/g/s/Pa) 3.062·10−2 166.4 1.61·10−2 0.923K3 (1/Pa) 7.253·10−12 −191.7 3.47·10−2 0.982
PD coke indirect (1089-1405K)K1a (mol/g/s/Pa) 6.667·10−4 133.5 1.27·10−2 0.932K2a (mol/g/s/Pa) 3.358·10−3 147.3 1.03·10−2 0.964K3 (1/Pa) 1.245·10−11 −190.2 2.76·10−2 0.975

6.3. KINETIC ANALYSIS 109
1100 1200 1300 1400
10!1
100
101
Temperature (K)
Mol
arflo
wra
tio
(!) H2/CO
CO2/CO
" Flexicoke DFB# Flexicoke IFB
$ PD coke DFB! PD coke IFB
Figure 6.26: Temperature dependence of the H2/CO and CO2/CO molarratio in the product gas for the experiments with the DFB and IFB reactor.
The relative errors of K1a and K3 are bigger. K1 is the rate constantassociated with the dry gasification, a reaction that is not measured directlybecause the feed gas contains no CO2. Further, low determination coefficientsindicate a poor quality of the linear regression for K1, especially for theexperiments with direct irradiation of the fluidized bed. K3 appears only asa product with K2 and is related with the CO shift [cf. Equation (3.6) on page24 and Equation (6.12)]. The calculated values for K3 are very small: Thepre-exponential factor associated with K3 is about ten orders of magnitudesmaller and the activation energy is the largest of all. Tests with K3 set tozero showed that the overall outcome of the kinetic model is hardly affectedby this rate constant.
Figure 6.26 shows the H2/CO and CO2/CO molar ratios considered asa quality indicator for the produced syngas [63]. In accordance with thethermodynamic considerations in Chapter 3.1, the H2/CO decreases withincreasing temperature and asymptotically reaches a value in the order ofone, depending on the stoichiometry of the gasified coke, while the CO2/COratio goes to zero. Figure 6.26 further shows that there is no difference withrespect to the temperature dependence of the off-gas composition for both
110 CHAPTER 6. RATE CONSTANTS FROM INTEGRAL REACTORS
the two coke types and the DFB and IFB experiments. The compositionof the produced gas depends only on the temperature, and the polynomialtrend-line anticipates essentially pure syngas above 1500 K.
The product composition can be further adjusted in a water-gas shiftreactor according to
H2O + COkwgs // CO2 + H2 (6.12)
to meet the requirements for the post processing of syngas to hydrogen,ammonia, methanol or Fischer-Tropsch chemicals.
6.3.1 Comparison of the DFB and IFB rate data
In order to enable a quantitative comparison of the DFB and IFB gasificationkinetics, the carbon consumption rate, −rC, is calculated for PD coke andFlexicoke using Equation (6.9) and the rate data presented in Tables 6.4(DFB) and 6.5 (IFB). Figure 6.27 shows the respective −rC in the 900-2000 Ktemperature interval for Flexicoke (a) and PD coke (b) under the assumptionof a reactive gas that contains 10% steam and 5% carbon dioxide in argon.The dashed line further marks the corresponding carbon consumption rateobtained from the TG experiments in Chapter 5, serving as a reference.
As long as the low temperature range is considered, the carbon consump-tion rate, −rC, shows reasonable consistency among the IFB, DFB, and TGexperimental data for both Flexicoke and PD coke. At temperatures ex-ceeding the interpolation domain ranging up to 1400 (DFB/IFB) and 1300K (TG), respectively, it is observed that the DFB and IFB rates fall behindthose measured with the TG. This observation is explained by the difficultiesassociated with the temperature measurement in the fluidized bed. Althoughthe coke particles in the bed shield the thermocouple from thermal radiation,a certain amount of radiation coming from the argon arc passes the fluidizedbed because of its high void fraction and hits the thermocouple.
The absorption of radiative energy is proportional to the fourth power oftemperature according to
q′′ = εσT 4 (6.13)
while the convective heat transfer is linearly depending from the temperaturedependence to the surrounding gas phase,
q′′ = h ·∆T (6.14)
Thus, the radiative contribution gets more important at higher temperaturesletting the error increase. The relative location of the IFB and DFB rate is

6.3. KINETIC ANALYSIS 111
1000 1500 200010
!6
10!4
10!2
100
Temperature (K)
Rat
e(s!
1)
(a)
1000 1500 200010
!6
10!4
10!2
100
Temperature (K)
Rat
e(s!
1)
(b)
TG TG
! Flexicoke DFB" Flexicoke IFB
# PD coke DFB! PD coke IFB
Figure 6.27: Comparison of the carbon consumption rate, −rC, assumingpH2O = 0.1 bar and pCO2 = 0.05 bar for the steam gasification of Flexicoke(a) and PD coke (b) using the TG as well as the DFB and IFB setups.
explained with the same arguments because the opaque fluidization tubeacts as a radiation shield, which reemits part of the incident radiation to thefluidized bed and the surroundings.
Based on the above conclusions it is found that the slight differencesbetween the DFB and IFB rate data observed for Flexicoke and PD coke,respectively, are not the evidence for a different chemistry, but rather ofexperimental nature, caused by the difficulties related with the exact mea-surement of the solid temperature. Because TG setup provides the mostunaltered temperature measurement, the TG data is assumed to be the mostreliable with regard to the temperature of the solid coke.
As Figure 6.26 further shows, the heat transfer mode does not have aneffect on the composition of the product gas. Also, it is important to considerthe differences between the Arrhenius parameters k0 and EA of the DFB andIFB experiments in front of the quality of the linear fit in Figures 6.23 to 6.25.At least part of the difference between the DFB and IFB rate for Flexicoke iscaused by the considerable spread in the respective experimental rate data.
112 CHAPTER 6. RATE CONSTANTS FROM INTEGRAL REACTORS
Summarizing the aforementioned findings, one can say that the differencesobserved between the two experimental series using the DFB and the IFBreactor setup are rather the consequence of limitations associated with theexperimental procedure than the consequence of a different chemistry. Thetwo setups are thus equivalent from a chemical point of view. Never the lessit is important to recognize that the heat transfer of the DFB setup is betterthan that of the IFB, having an economical impact, as the former generallyachieves a better performance with a given solar power input.
6.4 Summary and conclusions
Steam gasification of petroleum coke was investigated with laboratory scalefluidized bed reactors featuring two different allothermic heat transfer modes.The first reactor consisted of a quartz fluidization tube and the particles inthe fluidized bed are heated by direct irradiation from the ETH’s high-fluxsolar simulator. The second reactor allowed using different opaque fluidiza-tion tubes and heat is transferred by conduction across the tube wall. Theeffectiveness of the heat transfer from the argon arc to the fluidized bed isquantified in terms of the arc current. As expected, the DFB setup and theIFB setup with the quartz fluidization tubes achieved the best results.
Two different types of Venezuelan petroleum cokes, a Flexicoke and adelayed coke were ground and sieved to particle sizes in the 250-355 µmrange and gasified at temperatures between 1000 and 1600 K. Maximumsteam conversion in the order of 85-90% was obtained at temperatures above1500 and 1600 K for Flexicoke and PD coke, respectively, producing a syngasconsisting of an equimolar H2-CO mixture. Maximum CO2 production in theorder of 10-20% of the steam feed was observed at 1200-1300 K for Flexicokeand 1400-1600 K for PD coke. Despite a small temperature difference of theproduct and conversion maxima, the H2/CO and CO2/CO ratio consideredas a quality measure for the syngas do neither differ significantly from coketo coke nor from the indirect to the direct irradiated setup. Sulfur containedin the order of 2-4% of the raw coke is converted to mainly H2S at a rateincreasing in parallel to the carbon consumption.
A set of linearized rate laws based on the extended mechanism of Chapter4.3 was used to model the chemical reaction. The kinetic parameters andtheir Arrhenius-type temperature dependence are determined from experi-mental data assuming plug flow for the fluidization gas and solving the massbalance over a differential reactor element for every relevant component ofthe gas. The temperature interval for the evaluation of the rate data was

6.4. SUMMARY AND CONCLUSIONS 113
limited to values below 1400 K. At higher temperatures steam conversionwas going to completion and the reaction became mass transfer limited. PDcoke further showed a significant reactivity loss due to thermal deactivation,preventing the extraction of meaningful kinetic data.
The rate constants and the resulting reaction rates for the steam gasifica-tion of Flexicoke and PD coke that were obtained from the experiments withthe DFB and the IFB reactor setups, respectively, did not show a significantdifference. In fact, the differences found between the two types of petcokeis larger than the differences found between the experiments with direct andindirect irradiation of the fluidized bed.

114 CHAPTER 6. RATE CONSTANTS FROM INTEGRAL REACTORS

Chapter 7
SynPet 5 kW process reactor1
This chapter elaborates on the design and experimental performance of the5 kW SynPet reactor, which was used to demonstrate the solar thermalgasification of petcoke at the pilot scale. The reactor was successfully testedat PSI’s solar furnace during fall 2004 and served later on as a model for thescale-up to a nominal thermal power of 500 kW. The reactor design and theexperiments presented in this chapter will further serve as the experimentalboundary for the mathematical reactor model to be presented in Chapter 8.
7.1 Reactor design
Figure 7.1 shows a schematic of the reactor configuration. It consists of acylindrical cavity-receiver, 210 mm length, 120 mm inside diameter, thatcontains a 5 cm diameter opening - the aperture - to let in concentratedsolar power. The cavity-type geometry is designed to effectively capture theincident solar radiation; its apparent absorptance2 is estimated to exceed0.95.
1The SynPet reactor design and the experimental data obtained during the experi-mental campaign at PSI’s solar furnace [32] are the result of a joint group effort at theProfessorship in Renewable Energy carriers at ETH Zurich. Experimental testing of the re-actor in the solar furnace was performed during fall 2004 by P. Haueter, A. Z’Graggen, andthe author. Material from this chapter has been published in ‘A. Z’Graggen, P. Haueter,D. Trommer, et al. Hydrogen production by steam gasification of petroleum coke usingconcentrated solar power - II. Reactor design, testing and modeling. International Journalof Hydrogen Energy, 2006. 31(6): p. 797-811’.
2The apparent absorptance is defined as the fraction of energy flux emitted by a black-body surface stretched across the cavity opening that is absorbed by the cavity walls. Fora cylindrical cavity having a ratio of cavity diameter to aperture diameter equal 2 and aratio of cavity depth to aperture diameter equal 2.7, the apparent absorptance is greater
115
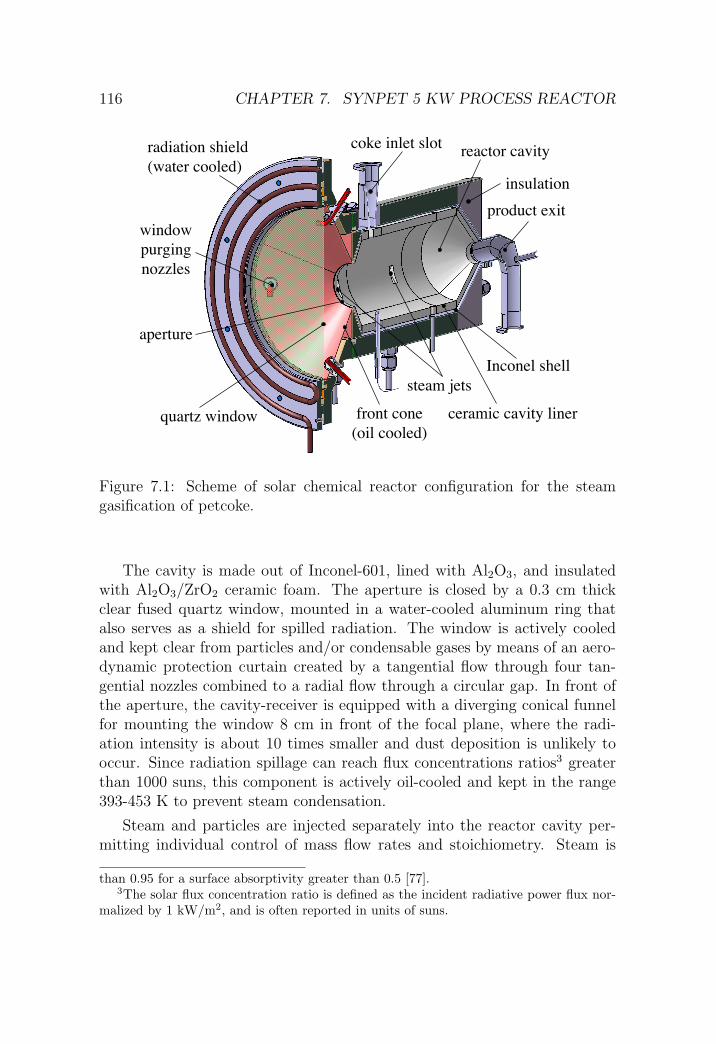
116 CHAPTER 7. SYNPET 5 KW PROCESS REACTOR
quartz window
radiation shield
(water cooled)
coke inlet slot
aperture
product exit
Inconel shell
ceramic cavity liner
steam jets
window
purging
nozzles
front cone
(oil cooled)
insulation
reactor cavity
Figure 7.1: Scheme of solar chemical reactor configuration for the steamgasification of petcoke.
The cavity is made out of Inconel-601, lined with Al2O3, and insulatedwith Al2O3/ZrO2 ceramic foam. The aperture is closed by a 0.3 cm thickclear fused quartz window, mounted in a water-cooled aluminum ring thatalso serves as a shield for spilled radiation. The window is actively cooledand kept clear from particles and/or condensable gases by means of an aero-dynamic protection curtain created by a tangential flow through four tan-gential nozzles combined to a radial flow through a circular gap. In front ofthe aperture, the cavity-receiver is equipped with a diverging conical funnelfor mounting the window 8 cm in front of the focal plane, where the radi-ation intensity is about 10 times smaller and dust deposition is unlikely tooccur. Since radiation spillage can reach flux concentrations ratios3 greaterthan 1000 suns, this component is actively oil-cooled and kept in the range393-453 K to prevent steam condensation.
Steam and particles are injected separately into the reactor cavity per-mitting individual control of mass flow rates and stoichiometry. Steam is
than 0.95 for a surface absorptivity greater than 0.5 [77].3The solar flux concentration ratio is defined as the incident radiative power flux nor-
malized by 1 kW/m2, and is often reported in units of suns.

7.2. EXPERIMENTAL SETUP 117
introduced through several ports. Based on flow visualization experimentsusing a plexiglas model and CFD simulations, best flow patterns in terms ofresidence time and flow stability were obtained with two sets of four symmet-rically distributed tangential nozzles, located in planes 3 and 8 cm behindthe aperture plane, as shown in Figure 7.1. The petcoke feeding unit is posi-tioned on the top of the reactor vessel with its inlet port located at the sameplane as the primary steam injection system, allowing for the immediate en-trainment of particles by the steam flow. Inside the cavity, the gas-particlestream forms a vortex flow that progresses towards the rear along a helicalpath.
With this arrangement, the petcoke particles are directly exposed to thehigh-flux solar irradiation, providing efficient heat transfer directly to thereaction site. Energy absorbed by the reactants is used to raise their tem-perature to above about 1300 K and to drive the gasification reaction. Reac-tion products exit through a 24 mm diameter outlet tube at the rear side ofthe cavity. This reactor concept has been applied successfully for the solarcombined ZnO-reduction and CH4-reforming [83] and for the solar thermalcracking of CH4 [35]. These and previous experimental and modeling studieshave pointed to the efficient solar energy absorption and heat transfer by thedirect solar irradiation of particle suspensions [10, 17, 45, 34].
7.2 Experimental setup
The complete experimental setup is depicted in Figure 7.2. Experimentationwas carried out at the PSI’s solar furnace [32]. This solar research facilityconsists of a 120 m2 sun-tracking heliostat in-axis with an 8.5 m diameterparaboloidal concentrator, and delivers up to 40 kW at peak concentrationratios exceeding 5000 suns. A Venetian blind-type shutter located betweenthe heliostat and the concentrator controls the power input to the reactor.Radiative solar flux intensities were measured optically with a calibratedCCD camera by recording the image of the sun on a water-cooled Al2O3-coated Lambertian (diffusely reflecting) plate positioned at the focal plane.
The reactor was positioned with its aperture at the focal plane and in-tercepting the regions of maximum solar flux intensity. Integration of theincident radiative flux over the reactors aperture yielded the solar power in-put, Qsolar. The accuracy of the optical measurement combined with thereactors misalignment4 led to an error of +9
−13% for Qsolar.
4Error due to the reactor’s misalignment has been estimated by Monte-Carlo ray tracing

118 CHAPTER 7. SYNPET 5 KW PROCESS REACTOR
Figure 7.2: Schematic of the experimental setup at PSI’s solar furnace.
Reactor wall temperatures were measured in 12 locations with thermo-couples type K, inserted in the Inconel walls and not exposed to direct ir-radiation. The nominal cavity temperature, Treactor , was measured with asolar-blind pyrometer that is not affected by the reflected solar irradiationbecause it measures in a narrow wavelength interval around 1.39 m wheresolar irradiation is mostly absorbed by the earth atmosphere [91].
Gas flows were controlled using Bronkhorst HI-TEC electronic flow con-trollers. The coke-feeding ratio was determined by measuring the weightdifference of the particle conveyor, with ±5% accuracy. The reactors pres-sure was monitored with pressure transducers, while a pressure safety valveprevented overpressure derived from a fivefolded volumetric growth due togas formation and thermal expansion. The gaseous products were analyzed
assuming up to 1 cm displacement between the apertures center and the location of peakradiative flux at the focal plane.

7.3. RESULTS 119
on-line by GC (the same instruments was used as for the experiment withthe TG setup, cf. Chapter 5.1.1 on page 57). Gas analysis was supplementedby IR-based detectors for CO, CO2, and CH4 (Ultramat-23 by Siemens), anda thermal conductivity-based detector for H2 (Calomat-6 by Siemens). Rep-resentative solid product samples collected at the filter downstream of thereactor were examined by scanning electron micrography.
The water conversion, XH2O, was calculated from the oxygen mass balanceusing the product gas flows nCO, nCO2 (calculated from GC measurementsand feed gas flows) as
XH2O =nCO + 2nCO2
nH2O,0
(7.1)
where nH2O,0 denotes the molar rate of water fed by the pump. The carbonconversion, XC, is calculated from the carbon mass balance as
XC =nCO + nCH4 + nCO2
nC,0
(7.2)
where nC,0 denotes the molar rate of carbon fed by the calibrated feeder.
7.3 Results
All runs were performed with PD coke particles of 1.2 µm mean diameterobtained by grinding raw PD coke in a jet mill. Reactants were continuouslyfed at a mass flow rate in the range of 1.85-4.45 g petcoke/min and 3.68-9.04g H2O/min. Feeding temperatures were at ambient and 423 K for petcokeand steam, respectively.
The average residence time of the reactants in the reactors cavity wascalculated with Equation (7.3) from [102] for a CO2-free syngas,
τ =P V
RT
(nAr + nH2O + nC
(1 +
XC
ln (1−XC)
))−1
(7.3)
τ varied between 0.69 and 1.55 s.
The solar power input through the aperture varied in the range 3.3-6.6kW. The nominal reactor temperatures varied in the range 1296-1843 K.Chemical conversions for petcoke and steam after a single pass [defined byEquations (7.1) and (7.2)] reached up to 87% and 69%, respectively.

120 CHAPTER 7. SYNPET 5 KW PROCESS REACTOR
Figure 7.3: Off-gas composition of the reference experiment measured byGC and IR spectroscopy for the steam gasification of PD coke in the SynPetreactor.
7.3.1 Reference experiment
Gas composition, chemical conversion and temperatures for a representativesolar run (number 20 of [102]) are shown in Figures 7.3, 7.4, and 7.5, respec-tively. In this run, the reactor was first heated to above 1400 K under anargon flow. Thereafter, reactants were introduced starting with steam and8.5 minutes later coke, indicated by dashed vertical lines in Figures 7.3 and7.4. Both reactants were fed during an interval of 12 min at a rate of 3.5g petcoke/min and 9 g H2O/min, corresponding to a H2O/C molar ratio of1.95.
Figure 7.3 shows the off-gas composition measured with the GC and IRdetector. Approximate steady state is observed about 7 minutes after startingthe coke feeder and maintained for another 5 minutes. Average values underapproximate steady state condition are calculated for a time period of 3minutes, indicated by gray boxes: nH2 = 0.32 mol/min, nCO = 0.13 mol/min,nCO2 = 0.06 mol/min, and nCH4 = 0.0089 mol/min. H2, CO and CO2 areprimary products of the steam gasification reaction (Equation 3.2). Methaneas well as the hatched part of the hydrogen signal are pyrolysis products of
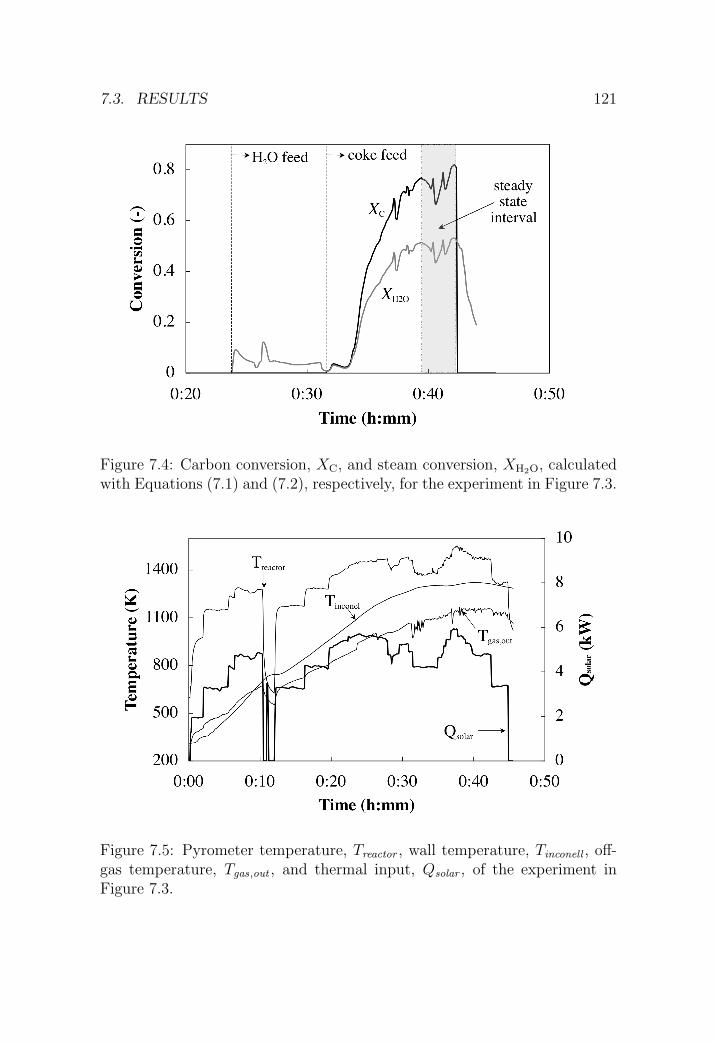
7.3. RESULTS 121
Figure 7.4: Carbon conversion, XC, and steam conversion, XH2O, calculatedwith Equations (7.1) and (7.2), respectively, for the experiment in Figure 7.3.
Figure 7.5: Pyrometer temperature, Treactor , wall temperature, Tinconell , off-gas temperature, Tgas,out , and thermal input, Qsolar , of the experiment inFigure 7.3.
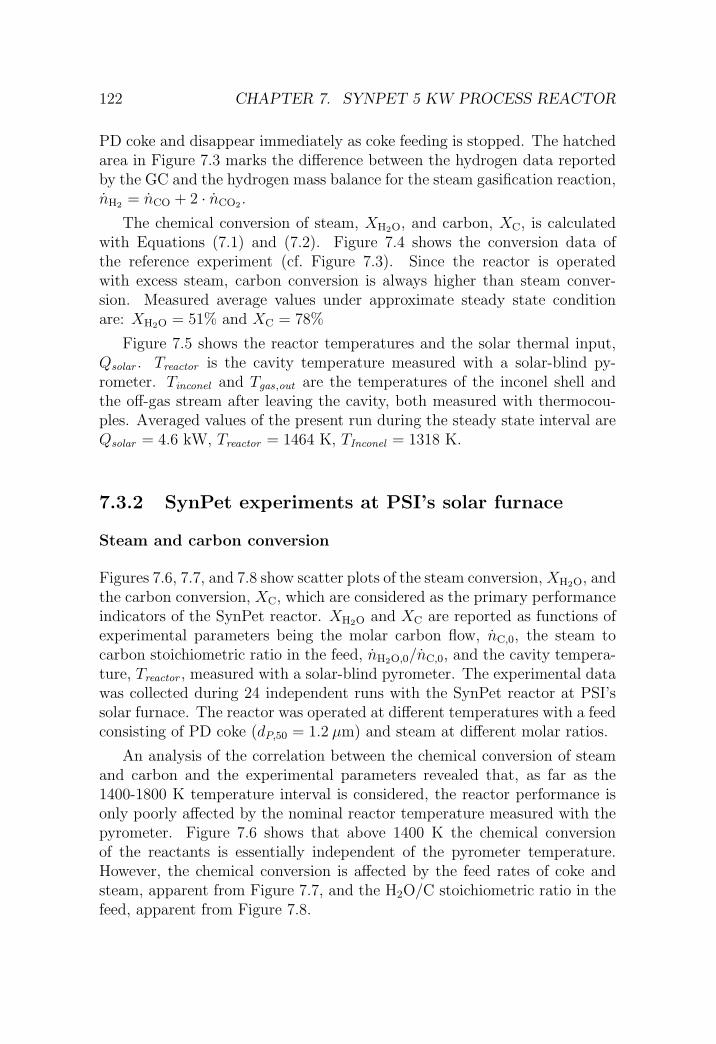
122 CHAPTER 7. SYNPET 5 KW PROCESS REACTOR
PD coke and disappear immediately as coke feeding is stopped. The hatchedarea in Figure 7.3 marks the difference between the hydrogen data reportedby the GC and the hydrogen mass balance for the steam gasification reaction,nH2 = nCO + 2 · nCO2 .
The chemical conversion of steam, XH2O, and carbon, XC, is calculatedwith Equations (7.1) and (7.2). Figure 7.4 shows the conversion data ofthe reference experiment (cf. Figure 7.3). Since the reactor is operatedwith excess steam, carbon conversion is always higher than steam conver-sion. Measured average values under approximate steady state conditionare: XH2O = 51% and XC = 78%
Figure 7.5 shows the reactor temperatures and the solar thermal input,Qsolar . Treactor is the cavity temperature measured with a solar-blind py-rometer. Tinconel and Tgas,out are the temperatures of the inconel shell andthe off-gas stream after leaving the cavity, both measured with thermocou-ples. Averaged values of the present run during the steady state interval areQsolar = 4.6 kW, Treactor = 1464 K, TInconel = 1318 K.
7.3.2 SynPet experiments at PSI’s solar furnace
Steam and carbon conversion
Figures 7.6, 7.7, and 7.8 show scatter plots of the steam conversion, XH2O, andthe carbon conversion, XC, which are considered as the primary performanceindicators of the SynPet reactor. XH2O and XC are reported as functions ofexperimental parameters being the molar carbon flow, nC,0, the steam tocarbon stoichiometric ratio in the feed, nH2O,0/nC,0, and the cavity tempera-ture, Treactor , measured with a solar-blind pyrometer. The experimental datawas collected during 24 independent runs with the SynPet reactor at PSI’ssolar furnace. The reactor was operated at different temperatures with a feedconsisting of PD coke (dP,50 = 1.2 µm) and steam at different molar ratios.
An analysis of the correlation between the chemical conversion of steamand carbon and the experimental parameters revealed that, as far as the1400-1800 K temperature interval is considered, the reactor performance isonly poorly affected by the nominal reactor temperature measured with thepyrometer. Figure 7.6 shows that above 1400 K the chemical conversionof the reactants is essentially independent of the pyrometer temperature.However, the chemical conversion is affected by the feed rates of coke andsteam, apparent from Figure 7.7, and the H2O/C stoichiometric ratio in thefeed, apparent from Figure 7.8.

7.3. RESULTS 123
Figure 7.6: Steam and carbon conversion as function of the pyrometer tem-perature (cf. Figure 7.5) for the SynPet experiments with PD coke.dP,50 = 1.2 µm, pH2O ∈ [0.54, 0.69] bar.
Figure 7.7: Steam and carbon conversion as function of the coke and steamfeed rates for the SynPet experiments with PD coke.dP,50 = 1.2 µm, pH2O ∈ [0.54, 0.69] bar, T ∈ [1300, 1840] K.

124 CHAPTER 7. SYNPET 5 KW PROCESS REACTOR
Figure 7.8: Steam and carbon conversion as function of the H2O/C molarratio (excess steam) in the feed for the SynPet experiments with PD coke.dP,50 = 1.2 µm, pH2O ∈ [0.54, 0.69] bar, T ∈ [1300, 1840] K.
Because the temperature at the reaction site is known to have an im-portant effect on the rate of the reaction and thereby on the chemical con-version, it is most probable that the relevant particle temperature of thereacting coke-steam mixture is not sufficiently correlated with the measuredwall temperature. The reason is that coke particles passing at locations withhigh radiative flux densities, as for example the cavity center near the aper-ture, exhibit much higher particle temperatures than the wall temperaturesrecorded by the pyrometer. It is therefore the combination of the solar ther-mal input, Qsolar, and the characteristics of the radiative heat transfer in theparticle cloud that controls the temperature at the reaction site rather thanthe wall temperature measured with the pyrometer.
Another reason for the poor correlation between the chemical conversionand the reactor shell temperature above 1400 K could be a possible masstransfer limitation at high temperatures. However, the particles used for thesolar steam gasification experiments are very small (dP,50 = 1.2 µm) makinga mass transfer limitation in the fluid film surrounding the particles unlikelyto happen. Chapter 8.4.2 gives further information about this issue.
Figure 7.7 shows the conversion of steam and carbon as a function ofthe molar feed rate of carbon, nC,0. The data are subdivided into 4 groups
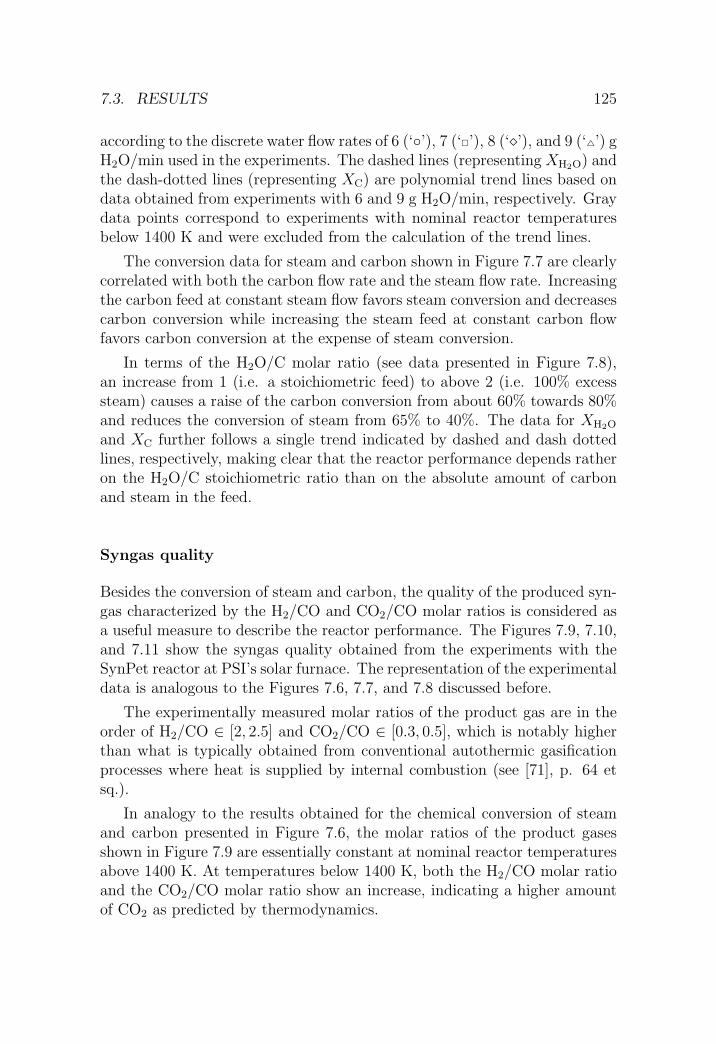
7.3. RESULTS 125
according to the discrete water flow rates of 6 (‘◦’), 7 (‘�’), 8 (‘�’), and 9 (‘4’) gH2O/min used in the experiments. The dashed lines (representing XH2O) andthe dash-dotted lines (representing XC) are polynomial trend lines based ondata obtained from experiments with 6 and 9 g H2O/min, respectively. Graydata points correspond to experiments with nominal reactor temperaturesbelow 1400 K and were excluded from the calculation of the trend lines.
The conversion data for steam and carbon shown in Figure 7.7 are clearlycorrelated with both the carbon flow rate and the steam flow rate. Increasingthe carbon feed at constant steam flow favors steam conversion and decreasescarbon conversion while increasing the steam feed at constant carbon flowfavors carbon conversion at the expense of steam conversion.
In terms of the H2O/C molar ratio (see data presented in Figure 7.8),an increase from 1 (i.e. a stoichiometric feed) to above 2 (i.e. 100% excesssteam) causes a raise of the carbon conversion from about 60% towards 80%and reduces the conversion of steam from 65% to 40%. The data for XH2O
and XC further follows a single trend indicated by dashed and dash dottedlines, respectively, making clear that the reactor performance depends ratheron the H2O/C stoichiometric ratio than on the absolute amount of carbonand steam in the feed.
Syngas quality
Besides the conversion of steam and carbon, the quality of the produced syn-gas characterized by the H2/CO and CO2/CO molar ratios is considered asa useful measure to describe the reactor performance. The Figures 7.9, 7.10,and 7.11 show the syngas quality obtained from the experiments with theSynPet reactor at PSI’s solar furnace. The representation of the experimentaldata is analogous to the Figures 7.6, 7.7, and 7.8 discussed before.
The experimentally measured molar ratios of the product gas are in theorder of H2/CO ∈ [2, 2.5] and CO2/CO ∈ [0.3, 0.5], which is notably higherthan what is typically obtained from conventional autothermic gasificationprocesses where heat is supplied by internal combustion (see [71], p. 64 etsq.).
In analogy to the results obtained for the chemical conversion of steamand carbon presented in Figure 7.6, the molar ratios of the product gasesshown in Figure 7.9 are essentially constant at nominal reactor temperaturesabove 1400 K. At temperatures below 1400 K, both the H2/CO molar ratioand the CO2/CO molar ratio show an increase, indicating a higher amountof CO2 as predicted by thermodynamics.
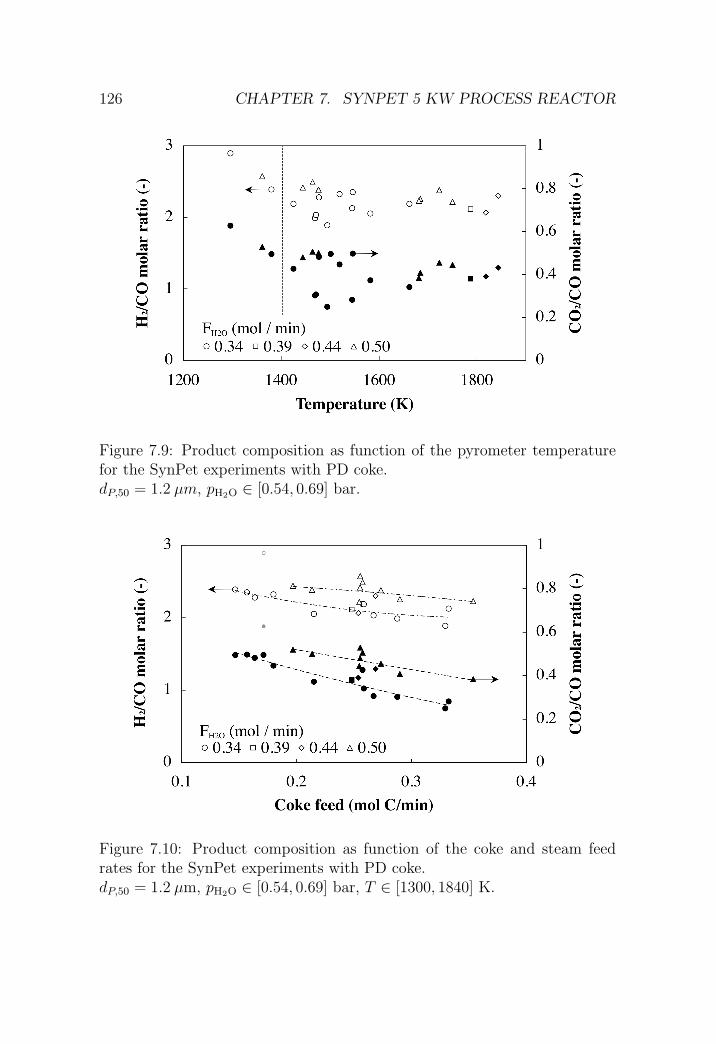
126 CHAPTER 7. SYNPET 5 KW PROCESS REACTOR
Figure 7.9: Product composition as function of the pyrometer temperaturefor the SynPet experiments with PD coke.dP,50 = 1.2 µm, pH2O ∈ [0.54, 0.69] bar.
Figure 7.10: Product composition as function of the coke and steam feedrates for the SynPet experiments with PD coke.dP,50 = 1.2 µm, pH2O ∈ [0.54, 0.69] bar, T ∈ [1300, 1840] K.
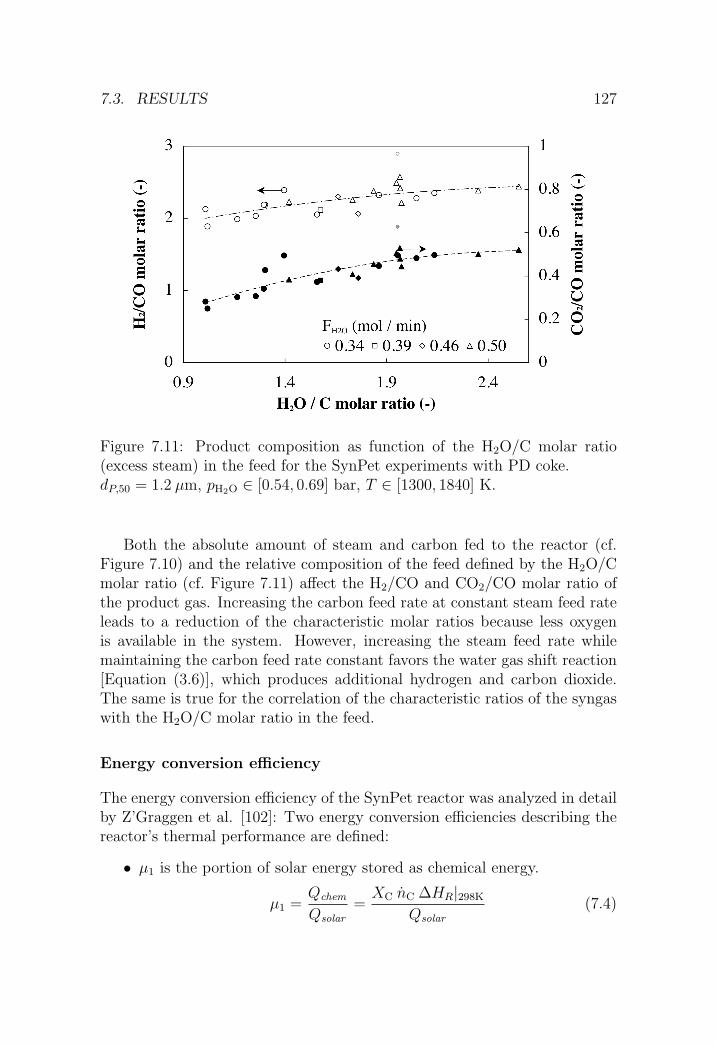
7.3. RESULTS 127
Figure 7.11: Product composition as function of the H2O/C molar ratio(excess steam) in the feed for the SynPet experiments with PD coke.dP,50 = 1.2 µm, pH2O ∈ [0.54, 0.69] bar, T ∈ [1300, 1840] K.
Both the absolute amount of steam and carbon fed to the reactor (cf.Figure 7.10) and the relative composition of the feed defined by the H2O/Cmolar ratio (cf. Figure 7.11) affect the H2/CO and CO2/CO molar ratio ofthe product gas. Increasing the carbon feed rate at constant steam feed rateleads to a reduction of the characteristic molar ratios because less oxygenis available in the system. However, increasing the steam feed rate whilemaintaining the carbon feed rate constant favors the water gas shift reaction[Equation (3.6)], which produces additional hydrogen and carbon dioxide.The same is true for the correlation of the characteristic ratios of the syngaswith the H2O/C molar ratio in the feed.
Energy conversion efficiency
The energy conversion efficiency of the SynPet reactor was analyzed in detailby Z’Graggen et al. [102]: Two energy conversion efficiencies describing thereactor’s thermal performance are defined:
• µ1 is the portion of solar energy stored as chemical energy.
µ1 =Qchem
Qsolar
=XC nC ∆HR|298K
Qsolar
(7.4)

128 CHAPTER 7. SYNPET 5 KW PROCESS REACTOR
• µ2 is the portion of solar energy net absorbed, both as chemical energyand sensible heat (which potentially can be recovered). Further, µ2
takes into account the heat required for steam generation.
µ2 =Qchem + Qsensible
Qsolar + Qsteam
(7.5)
The experimental efficiencies achieved during the SynPet experiments atPSI’s solar furnace are µ1 ∈ [5, 9]% and µ2 ∈ [10, 20]%. The complete energybalance for each experimental run in percent of the solar power input is foundin [102]. Heat losses were found to be principally due to attenuation by thewindow and re-radiation through the aperture (≈ 16% of Qsolar) as wellas conduction through the reactor walls (≈ 67% of Qsolar ). The radiativelosses showed to be strongly temperature dependent. A CPC is consideredto minimize radiative losses by augmenting the input solar power flux andallowing the use of a smaller aperture for capturing the same amount ofenergy. Increasing the reactor temperature further results in a higher reactionrate and a higher amount of chemical conversion, which in turn results inhigher energy conversion efficiencies.
7.4 Summary and conclusions
This chapter shows the design and testing of a solar chemical reactor for per-forming the solar steam gasification of petcoke to syngas. Solar experimentsin a high-flux solar furnace were performed for a solar power input in therange 3.3-6.6 kW, a nominal reactor temperatures in the range 1296-1818 K,and a reactant mass flow rate in the range of 1.85-4.45 g petcoke/min and3.68-9.04 g steam/min.
The chemical conversion reached up to 87% for petcoke and and up to 69%for steam. The syngas quality observed in the solar experiments was H2/CO∈ [2, 2.5] and CO2/CO ∈ [0.3, 0.5], respectively, which is notably higher thanwhat is typically obtained when heat is supplied by internal combustionof petcoke. The energy conversion efficiency, defined as the portion of solarenergy net absorbed (both as chemical energy and sensible heat), was between10 and 20%.
The chemical conversion of steam and carbon are considered as character-istic numbers for the reactor performance and their correlation with systemparameters such as the nominal reactor temperature measured with a py-rometer, the H2O/C molar ratio in the feed, and the steam and carbon feedflows is analyzed.
7.4. SUMMARY AND CONCLUSIONS 129
Increasing the molar feed rate of carbon, i.e. feeding more petcoke tothe reactor at a constant steam flow, increases the conversion of steam anddecreases both the conversion of carbon and the H2/CO and CO2/CO molarratios, meaning that CO being favored on the expenses of CO2. In opposi-tion to increasing the carbon feed rate, increasing the steam feed rate has apositive effect on the carbon conversion and reduces the conversion of steam.The molar ratios of the product gases are both increased because the higherwater partial pressure favors the water gas shift reaction [Equation (3.6)].
The correlation of chemical conversion and product gas composition withthe nominal reactor temperature is poor and the measured shell temperaturescan not be used to model the reactor performance. The reactor performancedepends to a large extent on the severe conditions in the directly irradiatedparticle cloud characterized by a temperature maximum close to the reactorcenter and a 600 K temperature drop towards the colder reactor wall, asit will be presented in Chapter 8 elaborating on the reactor model. In thenumerical model of the SynPet reactor, the temperatures of the reactantswill be estimated by means of a heat transfer model based on a Monte-Carloradiation heat transfer simulation.

130 CHAPTER 7. SYNPET 5 KW PROCESS REACTOR

Chapter 8
SynPet reactor modeling
8.1 Choosing the correct model
Depending on the reactor design, the flow behavior of a real chemical reactoris usually close to one of the two ideal flow patterns being mixed flow (MFR)and plug flow (PFR). The design of the SynPet reactor presented in Chapter7 features a cylindrical cavity of 10 cm inner diameter and 20 cm length.Flow visualization experiments in a plexiglas model showed that gas andparticles are entrained in a vortex flow with streamlines following a helicalpath. It is therefore reasonable to expect the SynPet reactor performanceclose to that of a PFR.
However, the vortex flow and turbulence caused by the nozzles for theinjection of steam and purge gas at the reactor inlet are reasons for a deviationfrom the idealized plug flow pattern. It is therefore indicated to considerdifferent reactor models that feature a higher complexity and enable thetreatment of vessels with real flow behavior.
Several models are available that account for small deviations from thePFR pattern characterized by the spread of a tracer moving along the reactor[49, 78]:
• The convection model for laminar flow is used for reactors with lowReynolds numbers and laminar flow. It features a parabolic velocityprofile and assumes that each element of fluid slides past its radialneighbor without interaction by molecular diffusion. The spread of theresidence time distribution (RTD) which is characteristic for real flowis caused by radial velocity gradients only.
• The axial dispersion model considers a plug flow of fluid superimposed
131

132 CHAPTER 8. SYNPET REACTOR MODELING
use pure
convection
model
use pure
axial dispersion
model
inte
rmed
iate
regi
me
pure
diffusion
regime D = D
103
102
101
100
102 104 106 10810010-210-4
Bo =u !2R
0
D
L0
2R0
SynPetreactor
Figure 8.1: Map showing which flow model should be used [49]. The ellipsemarks the location of the SynPet reactor with Bo ≈ 30 and L0/2/R0 = 2.
by some degree of back-mixing caused by slippage and eddies. Back-mixing is modeled with longitudinal dispersion in the direction of theflow. The parameter that characterizes this diffusion-like process isthe axial dispersion coefficient, D (m2/s). The overall mixing behaviorof the vessel is characterized by the dimensionless vessel dispersionnumber D
uL.
Levenspiel [49] presents a standard procedure to decide which of the afore-mentioned models should be used. The procedure is based on a mathematicalanalysis of Ananthakrishnan et al. [3] reproduced in Figure 8.1. The chartallows to identify the flow regime by means of the dimensionless Bodensteinnumber
Bo = Re · Sc =2R0uρ
µ
µ
ρD=
u2R0
D(8.1)
and the vessel geometry, L0/2/R0.
The location of the SynPet reactor (Bo ≈ 30 and L0/2/R0 = 2) is markedwith a hatched ellipse in the intermediate regime between the axial dispersionand the convection model. For systems falling in the no-man’s-land betweenregimes, Levenspiel [49] suggests to calculate the adjacent regimes and tryaveraging. Because gases are more likely to be in the dispersed regime than

8.2. ONE-DIMENSIONAL AXIAL DISPERSION MODEL 133
in the pure convection regime, the axial dispersion model will be used in thefollowing instead of the unfavorable averaging procedure.
8.2 One-dimensional axial dispersion model
The one-dimensional axial dispersion model assumes longitudinal dispersionin the direction of the flow (back-mixing) to account for the non-ideal charac-teristics of the flow. The primary parameter of the model is the dimensionlessvessel dispersion number
D
uL(8.2)
which is a function of the axial dispersion coefficient, D, the superficial ve-locity of the flow, u, and the length of the reactor vessel, L. The vesseldispersion number is a measure for the relative importance of convection anddispersion and characterizes the internal mixing which is represented by thespread of a tracer pulse traveling with the fluid through the reactor vessel.The limits to the real mixing behavior of the flow are given by the ideal flowpatterns PFR ( D
uL→ 0) and MFR ( D
uL→∞), respectively.
Several authors pointed out the mathematical equivalence between one-dimensional molecular diffusion and axial dispersion [49, 16]. The math-ematical treatment of a fluid undergoing fluctuations due to different flowvelocities and due to molecular and turbulent diffusion is therefore identicalto that of one-dimensional diffusion and convection. The only difference isthat the diffusion coefficient D is replaced by the dispersion coefficient Dhaving the same units but usually a different order of magnitude.
8.2.1 Governing equations
Conservation of mass. Using the aforementioned analogy between dis-persion and molecular diffusion, the performance equation for a reactor withdispersed plug flow is obtained from the general equation of mass conserva-tion for a multicomponent system incorporating chemical reaction [11]
∂(ρwi)
∂t= −∇m′′
i + r′′i Mi ,( g
m3 · s
)(8.3)
wi is the dimensionless mass fraction and m′′i is the mass flux of species i per
unit reactor cross section consisting of a convection and a dispersion term:
m′′i = ρuwi − ρD∇wi ,
( g
m2 · s
)(8.4)
134 CHAPTER 8. SYNPET REACTOR MODELING
Assuming steady state conditions and substituting Equation (8.4) for m′′i
simplifies the mass conservation equation to
∇ (ρuwi)−∇ (ρD∇wi) = r′′i Mi (8.5)
and for one-dimensional problems
d
dx(ρuwi)−
d
dx
(ρD
dwi
dx
)= r′′i Mi (8.6)
Equation (8.6) is the one-dimensional mass conservation equation for speciesi in a multicomponent system. To obtain the concentration and velocityprofiles along the reactor, u(x) and w(x) respectively, it is solved togetherwith the continuity equation [66]
d
dx(ρu) = 0 (8.7)
⇒ ρu = const. (8.8)
The reacting flow inside the reactor consists of a solid phase containingcarbon (coke) and a fluid phase containing the gaseous reactants and prod-ucts. To solve the differential mass conservation Equation (8.6) the solidphase is treated as pure carbon. The true composition and weight of thecoke is only used to calculate the rate of reaction per unit coke weight.
Composition and density of the reacting flow. The overall composi-tion of the two phase mixture is given in terms of the dimensionless massfraction wi
wi =mi∑j mj
(8.9)
The subscripts i and j denote the species in the mixture and are defined asfollows: 1 = Ar, 2 = H2O, 3 = H2, 4 = CO2, 5 = CO, 6 = CH4 and 7 = C.Components 1 to 6 are present the gas phase and carbon represents the solidphase.
The composition of the gas phase required for the calculation of the re-action source term, r′′i Mi, is given in terms of the molar fractions yi forcomponents 1 to 6
yi =wiM
−1i∑
j wjM−1j
(8.10)
The density of the two phase flow is defined in terms of the overall densityand the local phase densities. The local phase densities for the gas and solid

8.2. ONE-DIMENSIONAL AXIAL DISPERSION MODEL 135
phase with respect to the single phase are
ρS = ρcoke ∼ 0.8 · 103
(kg
m3
)1 (8.11)
ρG =mG
VG
=nG ·
∑i yiMi
VG
=P
R T
∑i
yiMi (8.12)
The overall density of the two phase flow with respect to the entire reactorvolume is calculated using the local phase densities according to
ρ = ρ′S + ρ′G (8.13)
ρ′S =mS
Vtot
=mS
VS + VG
=mS
mS
ρS+ mG
ρG
=wS
wS
ρS+ wG
ρG
(8.14)
ρ′G =mG
Vtot
=mG
VS + VG
=mG
mS
ρS+ mG
ρG
=wG
wS
ρS+ wG
ρG
(8.15)
8.2.2 Numerical methods
The one-dimensional axial dispersion model applied to the steam gasificationof petcoke results in a system of 7 coupled ordinary differential equationsplus one continuity equation. The nonlinear nature of the source term r′′i Mi
and the large number of equations prevents an analytical solution of theproblem. The system of equations is therefore solved numerically using thefinite volume method (FVM).
The concept of the FVM is to divide the calculation domain of a (par-tial) differential equation into a number of non-overlapping control volumessuch that there is one control volume surrounding each grid point and solvethe conservation equations in terms of the averaged values of the conservedquantities inside the control volumes. Figure 8.2 shows a schematic of a one-dimensional grid point cluster used to disctrize the axial reactor dimension(c.f. [66]).
The algebraic discretization equations are derived by integrating Equation(8.6) over the control volume:
(ρuwi)e − (ρuwi)w =
(ρD
dwi
dx
)e
−(
ρDdwi
dx
)w
+ r′′i Mi∆x (8.16)
The subscripts e and w in Equation (8.16) denote the properties at the eastand west face of the control volume.
1The bulk density of normal-quality petroleum coke is around 0.8 - 0.9 g/cm3 [14].

136 CHAPTER 8. SYNPET REACTOR MODELING
xW E
!x
w e
P
Figure 8.2: One-dimensional grid point cluster for the discretization. Thehatched area marks the control volume of a generic point P and x is the axialreactor dimension.
Convection: Upwind scheme. The upwind scheme is used for the nu-merical computation of the convection expression. Since the flow in thereactor is downstream-only, i.e. u(x) > 0 ∀ x, the concentrations at the facesof the control volume are approximated by the concentration of the upstreamadjacent center point:
(wi)w = (wi)W (8.17)
(wi)e = (wi)P (8.18)
and the convective part of Equation (8.16) becomes
(ρuwi)e − (ρuwi)w = (ρuwi)P − (ρuwi)W (8.19)
where P is the property at the control volume center and E and W representthe adjacent control volumes in the east and in the west.
Dispersion: Central difference scheme. The dispersion terms in Equa-tion (8.16) are calculated assuming a piecewise linear profile to calculate thegradients and the flow properties at the control volume faces:(
ρDdwi
dx
)w
= ρwDw
(dwi
dx
)w
= ρwDw(wi)P − (wi)W
∆x(8.20)(
ρDdwi
dx
)e
= ρeDe
(dwi
dx
)e
= ρeDe(wi)E − (wi)P
∆x(8.21)

8.2. ONE-DIMENSIONAL AXIAL DISPERSION MODEL 137
with
ρwDw =1
2(ρWDW + ρPDP ) (8.22)
ρeDe =1
2(ρPDP + ρEDE) (8.23)
leading to the following numerical scheme(ρD
dwi
dx
)e
−(
ρDdwi
dx
)w
= (8.24)
ρwDw
∆x(wi)W − ρeDe + ρwDw
∆x(wi)P +
ρeDe
∆x(wi)E
Final discretized transport equation. Substituting the numericalschemes (8.19) and (8.25) into (8.16) yields the final discretized transportequation for the chemical species
(ρuwi)P − (ρuwi)W = (8.25)
ρwDw
∆x(wi)W − ρeDe + ρwDw
∆x(wi)P +
ρeDe
∆x(wi)E + r′′i Mi∆x
Equation (8.26) can be expressed in a more general form as
aP wP = aW wW + aEwE + b (8.26)
where the coefficients aP , aE, aW and b take the form
aW = FW + Dw (8.27)
aP = FP + Dw + De (8.28)
aE = De (8.29)
b = r′′i (wP ) Mi∆x (8.30)
with the location dependent variables
D ≡ ρD
∆x(8.31)
F ≡ ρu (8.32)
Boundary conditions. For the control volumes 1 and N shown in Figure8.3 at the beginning and the end of the reactor, Equation (8.26) takes aspecial form.

138 CHAPTER 8. SYNPET REACTOR MODELING
x1 2 3 N-2 N-1 N
!x
u0
w0
uN
wN
Figure 8.3: Discretization scheme of the reactor with the boundary elements1 and N .
At the reactor inlet and outlet, the dispersion coefficients are zero in ac-cordance with the closed vessel boundary conditions. As a consequence thedispersion flux at the reactor boundaries are zero as well and mass trans-fer from and to the outside appears by convection only. Additionally, theconvective flux at the reactor inlet is known (u0, w0, ρ0).
The coefficients of the discretization equation at the reactor inlet (element1) take the form
a0 = 0 (8.33)
a1 = F1 + (D1 + D2)/2 (8.34)
a2 = (D1 + D2)/2 (8.35)
b1 = r′′i (w1) Mi∆x + ρ0u0w0︸ ︷︷ ︸F0
(8.36)
and the respective coefficients at the reactor outlet (element N) are:
aN−1 = FN−1 + (DN−1 + DN)/2 (8.37)
aN = FN + (DN−1 + DN)/2 (8.38)
aN+1 = 0 (8.39)
bN = r′′i (wN) Mi∆x (8.40)
8.3 Axial dispersion number and residence
time distribution
Two different methods are available to calculate the vessel dispersion numberfor a reactor with known flow properties: D
uLcan be obtained from correla-
tions found in the literature (cf. [49]) or experimentally from the spread of
8.3. AXIAL DISPERSION NUMBER AND RTD 139
a tracer pulse moving through the reactor [49, 78]. The second method wasused to calculate the dispersion number based on RTD measurements witha real size model of the SynPet reactor cavity.
Residence time distribution. The residence time distribution of a fluidflowing through a reactor vessel is characterized in terms of the distribu-tion function (E-curve) or the cumulative distribution function (F -curve).The cumulative distribution function F (t) denotes the share of the fluid thatstayed inside the vessel for a time period shorter than t and is obtained exper-imentally by measuring the response of a step experiment with a nonreactivetracer.
F =c(t)
c0
(8.41)
with F (0) = 0 (8.42)
F (∞) = 1
The corresponding probability density function (E-curve) is the normalizedtime derivative of the F -curve
E =dF
dt(8.43)
with
∞∫0
E dt = 1 (8.44)
Both the E and the F curve can be represented in terms of the absolute timet in seconds or the dimensionless reduced time θ = t
τ.
The parameters used to characterize the continuous residence time distri-bution are the predictand µ and the variance σ2. The predictand is definedas
µt =
∞∫0
t · E(t) dt (8.45)
with µt =V
v= τ (8.46)
µθ = 1 (8.47)
where τ is the hydrodynamic residence time of the reactor in seconds. τ isthe average time a fluid package stays in the reactor cavity.
140 CHAPTER 8. SYNPET REACTOR MODELING
The variance σ2 is calculated according to
σ2t =
∞∫0
(t− µt)2 E(t) dt (8.48)
with σ2θ =
σ2t
µ2t
(8.49)
Axial dispersion number from the RTD. For a vessel with a knownresidence time distribution that meets certain preconditions (i.e. a roughlysymmetrical, single peaked E-curve) the vessel dispersion number, D
uL, can
be calculated from the dimensionless variance, σ2θ . A detailed description of
this concept is presented by Levenspiel [49] for the case of an infinite tube.Van der Laan [93] further improved the theory of Levenspiel by adding othergeometries and boundary conditions such as vessels with closed boundaryconditions (no dispersion across boundaries, D|x=0 = D|x=L = 0):
σ2θ =
2
Pe2
[Pe− 1 + e−Pe
](8.50)
where Pe is the dimensionless Peclet number sometimes used equivalent tothe inverse of the axial dispersion number,
Pe =
(D
uL
)−1
(8.51)
Experimental RTD measurement.2 Figure 8.4 shows the flow chartof the experimental setup used to measure the residence time distribution.A three dimensional plexiglass model having the same dimensions as thereactor cavity was used to analyze the gas flows inside the reactor. A pairof Bronkhorst HiTec flow controllers connected to a logical board were usedto generate a concentration step in the feed line by switching the gas supplyfrom Ar to CO2. At the exit of the cavity, the CO2 concentration is measuredonline by means of a Siemens Ultramat 22P infrared detector.
The experimental setup in Figure 8.4 consisted of three independent flowunits, namely the upstream lines, the reactor cavity, and the downstreamlines. Each unit has its own residence time distribution that affects theoverall system response measured by the ULTRAMAT CO2-analyzer. µ andσ2 of the reactor cavity without upstream and downstream lines are obtained
2The experimental work was performed in the framework of a semester thesis by M.Meyer and M. Rusch [58].

8.3. AXIAL DISPERSION NUMBER AND RTD 141
Ar
CO2
SynPet
reactorvent
step
generator
Ultramat 22P
CO2 analyzer
control
& DAQ
IR
c0(t) c(t)
Figure 8.4: Flowchart of the experimental setup for the measurement of theRTD.
0.1 0.5 1 2 50
0.2
0.4
0.6
0.8
1
(a)
! (!)
F!
(!)
0.1 0.5 1 2 50
0.5
1
1.5
(b)
! (!)E
!(s
!1)
µ!±"!
µ!±"!
Figure 8.5: Experimentally determined residence time distribution of theSynPet reactor. (a) is the F -curve and (b) the corresponding E-curve.
Table 8.1: Distribution parameters and vessel dispersion number for theSynPet reactor.
experiment Ftot µt σ2t σ2
θDuL
(lN/min) (s) (s2) (−) (−)
F2027 6 8.63 11.33 0.152 0.0829F2033 6 8.85 13.28 0.170 0.0936F2041 8 6.57 5.94 0.138 0.0745

142 CHAPTER 8. SYNPET REACTOR MODELING
from the RTD data of the overall setup and using of the following expressionsthat relate µ and σ2 for products of distribution functions [49, 80]:
µcavity = µsetup − µpipes (8.52)(σ2
t
µ2t
)cavity
=
(σ2
t
µ2t
)setup
−(
σ2t
µ2t
)pipes
(8.53)
To determine the RTD of the SynPet reactor, a set of experiments wasselected that visually showed a stable vortex flow during experiments with foginjection to visualize the stream lines. Figure 8.5 shows the experimentallydetermined F and E curves for the geometry of the SynPet reactor cavitycalculated with Equations (8.41) and (8.43).
To calculate the distribution parameters µ and σ2 for the reactor cavity,every run is repeated 3 times and the effect of the tubing is subtracted fromthat of the entire setup using Equations (8.52) and (8.53). The correspondingdistribution parameters are listed in Table 8.1 for three different runs with atotal flow rate of 6 and 8 lN/min, respectively.
Equation (8.50) was used to calculate the axial dispersion number forthe reactor cavity based on σθ. The results are listed in Table 8.1 togetherwith the distribution parameters for every experiment. The obtained vesseldispersion numbers are in the range
0.075 <D
uL< 0.094 (8.54)
As a qualitative measure for the amount of back-mixing, Levenspiel [49]makes the following classification of flow regions with respect to D
uL:
• DuL
< 0.01: Small deviation from plug flow (PFR: DuL→ 0).
• DuL
> 0.01: Large dispersion (MFR: DuL→∞).
The dispersion number measured for the SynPet reactor cavity is locatedin the second category comprising vessels with significant deviation fromplug flow. It is therefore indicated to use a model that takes into accountdeviations from the PFR pattern caused by axial dispersion.

8.4. CHEMICAL REACTION 143
8.4 Chemical reaction
8.4.1 Reactivity correction for the solar experiments
First tests with the numerical model for the 5 kW SynPet reactor developed inChapter 8.2 were done using the rate data obtained from the TG experimentsin Chapter 5. However, the obtained results showed that the TG rate datacan not reproduce the experimentally observed performance of the SynPetreactor. The carbon conversion predicted by the TG kinetics (Equation(4.83) with the rate constants from Table 5.7) was unexpectedly low.
In order to find an explanation for the performance of the process reactorduring the solar experiments, additional TG runs were performed with cokeresidues collected in the off-gas cyclone (cf. Figure 7.2) after three differentsolar runs. The reactor samples were subsequently gasified in the TG apply-ing the same conditions as previously used for the determination of the rateconstants in Chapter 5.3.2 (i.e. a linear heating rate with β = 20 Kmin−1
from 470 to 1420 K and a reactive gas with 0.6 bar steam in argon).
The solid lines in Figure 8.6 represent the TG curves resulting from thegasification of PD coke residuals (dP,50 = 1.2 µm) that were collected af-ter three solar experiments performed with pH2O ∈ [0.6, 0.7] bar and T ∈[1580, 1680] K. The dashed lines are TG runs of the experimental campaignpresented in Chapter 5: The raw sample (dashed line) is recognized by meansof the pyrolysis step at around 900 K, the dash-dotted line is the TG curveof a sample that was pyrolyzed with 20 Kmin−1 and a maximum pyrolysistemperature of 1520 K in order to force thermal deactivation.
The data presented in Figure 8.6 clearly show that despite the exposi-tion to temperatures far beyond the level of ≈ 1300 K which is identified inChapter 5.2.2 as the threshold temperature towards significant thermal de-activation, the PD coke samples that passed through the hot SynPet reactorhave not been deactivated. The carbon-steam reaction of the reactor residu-als proceeds at similar temperatures as observed with raw PD coke samplesbut at higher rates. Further, the SynPet residuals do not show a pyrolysisstep meaning that pyrolysis in the solar reactor is essentially complete.
The lack of thermal deactivation of the PD coke in the solar furnace isthe result of the following circumstances:
• The residence time of the samples in the hot reactor cavity was τ ≈ 1 s.This is very short compared to the long duration of the TG experiments(≈ 1 h) used derive the rate data in Chapter 5. The characteristic timescale of the deactivation step is probably too big for the SynPet reactor.
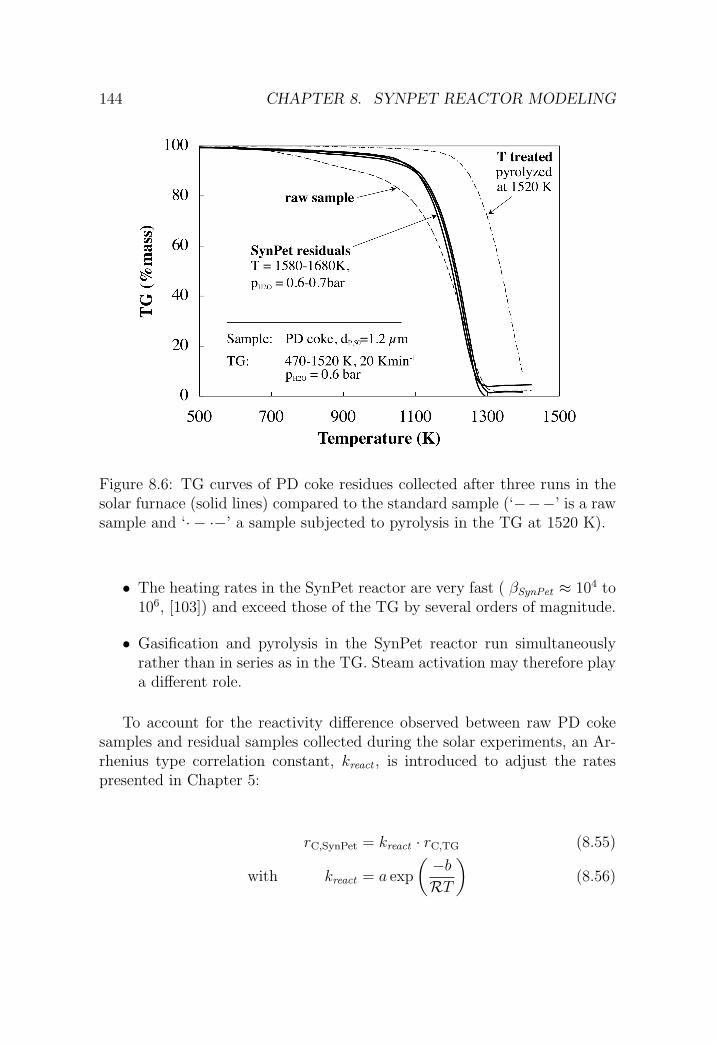
144 CHAPTER 8. SYNPET REACTOR MODELING
Figure 8.6: TG curves of PD coke residues collected after three runs in thesolar furnace (solid lines) compared to the standard sample (‘−−−’ is a rawsample and ‘· − ·−’ a sample subjected to pyrolysis in the TG at 1520 K).
• The heating rates in the SynPet reactor are very fast ( βSynPet ≈ 104 to106, [103]) and exceed those of the TG by several orders of magnitude.
• Gasification and pyrolysis in the SynPet reactor run simultaneouslyrather than in series as in the TG. Steam activation may therefore playa different role.
To account for the reactivity difference observed between raw PD cokesamples and residual samples collected during the solar experiments, an Ar-rhenius type correlation constant, kreact , is introduced to adjust the ratespresented in Chapter 5:
rC,SynPet = kreact · rC,TG (8.55)
with kreact = a exp
(−b
RT
)(8.56)
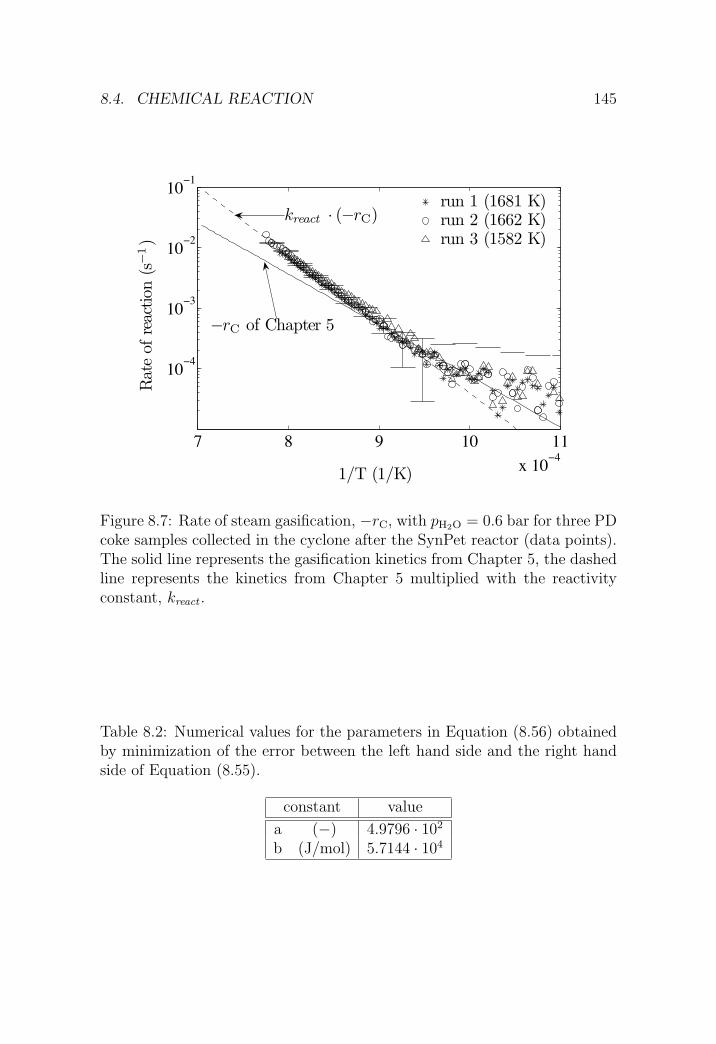
8.4. CHEMICAL REACTION 145
7 8 9 10 11
x 10!4
10!4
10!3
10!2
10!1
1/T (1/K)
Rat
eof
reac
tion
(s!
1)
run 1 (1681 K)run 2 (1662 K)run 3 (1582 K)
kreact · (!rC)
!rC of Chapter 5
Figure 8.7: Rate of steam gasification, −rC, with pH2O = 0.6 bar for three PDcoke samples collected in the cyclone after the SynPet reactor (data points).The solid line represents the gasification kinetics from Chapter 5, the dashedline represents the kinetics from Chapter 5 multiplied with the reactivityconstant, kreact .
Table 8.2: Numerical values for the parameters in Equation (8.56) obtainedby minimization of the error between the left hand side and the right handside of Equation (8.55).
constant value
a (−) 4.9796 · 102
b (J/mol) 5.7144 · 104

146 CHAPTER 8. SYNPET REACTOR MODELING
Figure 8.7 is a plot of ln(−rC) versus the inverse temperature showing theTG runs with SynPet residuals from Figure 8.6. The black solid line is thereaction rate calculated with Equation (4.83) and the Arrhenius parametersin Table 5.7 obtained for the gasification of PD coke with steam and carbondioxide in Chapter 5. The deviation between data and model is apparentand not explicable with the error in the TG data (bars mark the experimen-tally determined error from Chapter 5.2.2). The dashed line is the result ofEquation (8.56) using the parameters a and b of Table 8.2, obtained by min-imization of the RMS absolute error between the left hand side and the righthand side of Equation (8.55). Error minimization is performed numericallywith MATLAB’s [37] Nelder-Mead Simplex algorithm generally referred toas unconstrained nonlinear optimization.
8.4.2 Mass transfer in the gas phase
In general, mass transfer limitation in the gas phase becomes important forlarge particles and high temperatures, respectively. To identify the particlesize for which the influence of the gas phase diffusion resistance becomesimportant in the SynPet reactor, gas composition and carbon conversionalong the reactor axis are calculated for various particle sizes using the modelfrom Chapter 4.1.2. The results are then compared to the situation withoutgas phase diffusion limitation to see if there is an effect.
The reactor is assumed to operate isothermally at a cavity temperature of1800 K. This temperature is chosen because it corresponds to the minimumtemperature required to reach full conversion in a single pass with the feedcharacteristics of the experiments in Chapter 7. The results are shown inFigure 8.8 for particles with RP = 0.6, 10, 75, and 150 µm. RP = 0.6 µmis the particle size used for the experiments presented in Chapter 7 andRP = 75 and 150 µm, respectively, are of particular interest for industrialapplications.
Figure 8.8 shows the carbon conversion along the reactor axis (XC, dashedline) together with the gas phase concentrations in the bulk (yi,B, solid line)and at the particle surface (yi,I , solid line with marker) as well as the con-centration profile that would be obtained if diffusion in the gas phase wasinstantaneous (yi, dotted line).
The 0.6 µm plot in Figure 8.8 represents the initial particle diameter usedfor the SynPet experiments in the PSI solar furnace. The respective datashow that the gas phase concentrations at the particle surface and in thebulk are the same, perfectly matching the concentration profile for the case

8.4. CHEMICAL REACTION 147
0 0.2 0.4 0.6 0.8 10
0.1
0.2
0.3
0.4
0.5
0.6
L/L0 (!)
Mol
efra
ctio
ny i
(!)
0 0.2 0.4 0.6 0.8 10
0.2
0.4
0.6
0.8
1
Car
bon
conv
ersio
nX
C(!
)
RP = 0.6 µm
H2O XC
H2
CO
CO2
0 0.2 0.4 0.6 0.8 10
0.1
0.2
0.3
0.4
0.5
0.6
L/L0 (!)
Mol
efra
ctio
ny i
(!)
0 0.2 0.4 0.6 0.8 10
0.2
0.4
0.6
0.8
1
Car
bon
conv
ersio
nX
C(!
)
RP = 10 µm
H2OXC
H2
CO
CO2
0 0.2 0.4 0.6 0.8 10
0.1
0.2
0.3
0.4
0.5
0.6
L/L0 (!)
Mol
efra
ctio
ny i
(!)
0 0.2 0.4 0.6 0.8 10
0.2
0.4
0.6
0.8
1
Car
bon
conv
ersio
nX
C(!
)
RP = 75 µm
H2O
XC
H2
CO
CO2
0 0.2 0.4 0.6 0.8 10
0.1
0.2
0.3
0.4
0.5
0.6
L/L0 (!)
Mol
efra
ctio
ny i
(!)
0 0.2 0.4 0.6 0.8 10
0.2
0.4
0.6
0.8
1
Car
bon
conv
ersio
nX
C(!
)
RP = 150 µm
H2O
XC
H2
CO
CO2
Figure 8.8: Gas composition (yi) and carbon conversion (XC) axial profilesfor the SynPet reactor operated at 1800 K for four different particle sizes(RP = 0.6, 10, 75, 150 µm). The feed flow rates are those of the experimentpresented in Figure 7.3.Solid lines with marker represent the gas composition at the particle sur-face and solid lines without marker the corresponding bulk gas composition.Dotted lines represent the solution under the assumption of instantaneousdiffusion in the gas film (no diffusion limitation).

148 CHAPTER 8. SYNPET REACTOR MODELING
of instantaneous gas phase diffusion. As the particles grow, the differencebetween bulk and interface concentration increases. The gradients of theproducts are negative in the direction away from the particle because of thereaction stoichiometry.
Due to the reduction of the steam concentration at the particle surface,the diffusion resistance in the gas phase lowers the carbon conversion by3% for particles with RP = 150 µm. However, the difference between thecarbon conversion of a 0.6 µm and a 150 µm particle is 24% for the case ofinstantaneous gas phase diffusion. This points out that the performance lossobserved for big particles is not a consequence of diffusion resistance in the gasphase, but rather the result of diffusion resistance inside the porous particle.Diffusion resistance in the particle is modeled with the particle effectivenessfactor, ηP , which is ≈ 1 for 0.6 µm particles and drops to ηP = 0.33 for PDcoke particles with RP = 150 µm (cf. Figure 5.13).
Because diffusive mass transfer in the gas phase did not show any influenceon the gasification performance of a 0.6 µm PD coke particle at all in thetemperature interval required to attain full conversion, this effect is excludedfrom the numerical models of the SynPet reactor considered in the followingchapters.
8.4.3 Reaction source term
The chemical model for the gasification of PD coke with steam considers twodifferent reactions:
1. The pyrolysis of coke to form solid char and gaseous H2 and CH4.
2. The heterogeneous gas-solid reaction of the remaining char with H2Oand CO2 to form H2, CO and CO2.
The source term in Equation (8.6), r′′i Mi, is the rate of the chemical reactionwith units gram per reactor volume and second. r′′i represents the sum of thepyrolysis and the steam gasification reaction rates according to
r′′i = ρ′S
(r′i,P + a0 (1−XC)2/3 ri,G
)(8.57)
where r′i,P is the rate of the pyrolysis reaction with units mol per gram of solid(mol/g/s) and ri,G is the overall rate of the gasification reaction (mol/m2/s).The calculation of the pyrolysis and steam gasification rates, r′i,P and ri,G,respectively, is elaborated in the following subsections.

8.4. CHEMICAL REACTION 149
Pyrolysis
The PD coke pyrolysis kinetics presented in Chapter 5.3.1 did not producesufficiently fast reaction rates to predict the observed complete pyrolysisconversion in the SynPet process reactor (cf. Figure 8.6). The reason isthe extremely different heating rate of the TG setup compared to that ofthe SynPet reactor. The heating rate is known to have a strong effect onthe kinetics of the pyrolysis reaction [76], making the application of the TGkinetics to the SynPet reactor not feasible.
Therefore, pyrolysis is modeled as an instantaneous process taking placeat the reactor entrance, L = 0. The pyrolysis products are solid char andgaseous hydrogen and methane at rates obtained from averaging the overallamount of pyrolysis gas of all SynPet experiments in the solar furnace. Theoverall amount of products released from the pyrolysis reaction, r′i, is∫ τ
0
r′i,P δ(t) dt = r′i (8.58)
δ(t) is the Dirac delta function [δ(0) = ∞ and δ(t 6= 0) = 0] and the experi-mental ri are:
r′H2= 1.35 · 10−2 (8.59)
r′CH4= 2.42 · 10−3 (mol/g coke) (8.60)
−r′C = r′CH4(8.61)
The standard deviations of r′i are σH2 = 2.84 · 10−3 and σCH4 = 9.34 · 10−4.
Steam gasification
The overall rate of the steam gasification reaction, ri,G, is calculated from theintrinsic rate, ri ,intr , adjusted with the reactivity correction for the SynPetreactor, kreact , and the particle effectiveness factor, ηP . The overall rate is afunction of temperature, gas phase composition and particle size.
ri,G = ηP · kreact · ri ,intr (8.62)
ri ,intr is the intrinsic gasification rate for species i calculated with theLangmuir-Hinshelwood-type rate laws (4.77)-(4.80) derived from the extendedmechanism in Chapter 4. Rate constants are calculated using the rate dataobtained from gasification experiments with H2O-CO2 mixtures in the TGsetup presented in Chapter 5. The corresponding Arrhenius parameters arefound in Table 5.7.

150 CHAPTER 8. SYNPET REACTOR MODELING
To account for the reactivity difference observed for PD coke gasifiedwith the TG and samples gasified in the solar reactor, the intrinsic rate ofreaction is corrected with the temperature dependent proportionality factor,kreact , defined by Equations (8.55) and (8.56).
The particle effectiveness factor, ηP , is calculated with the experimentalcorrelation defined by Equation (5.4) and using the parameters in Table 5.4.The very small coke particles used for the SynPet experiments in the PSIsolar simulator have a effectivity close to 1: ηP (RP = 0.6µm) = 0.99.
Since the TG setup is considered as a differential reactor with negligibleconcentration gradients in the gas phase, the respective experiments couldnot provide data for the rate constant K3 associated with CO2-production bythe water gas shift reaction (3.6). This problem is circumvented by the use ofthe activation energy for K3 obtained from the gasification experiments in thequartz fluidized bed reactor and a pre-exponential factor that was determinedempirically by minimization of the sum of the relative errors between themeasured and simulated off-gas compositions yH2 , yCO, and yCO2 .
Thus,
K3,TG = 1.149 · 10−7 · exp
{176 100
R T
}(8.63)
8.5 Radial temperature profiles
Temperatures in the SynPet reactor were experimentally determined at vari-ous locations using different measurement techniques: Type K thermocouplesconnected to the reactor shell were used to measure the wall temperature.Type S thermocouples in the off-gas stream and inside a closed ceramic tubeinserted to the cavity measured off-gas and cavity temperature. Temperaturemeasurement by thermocouples was complemented with a solar blind pyrom-eter measuring the temperature inside the reactor cavity from the radiationleaving the reactor through the front window [102].
Both the SynPet reactor model of the present thesis and the more de-tailed model of Z’Graggen [102] unveiled that the reactor temperature ex-perimentally determined by thermocouples at various locations as well as bypyrometry can not be used to explain the experimentally observed reactorperformance. Neither the order of magnitude nor fluctuations of the chemi-cal conversion could be adequately predicted with models using experimentalwall temperature as the temperature of the reacting carbon-steam system.
To overcome the lack of suitable temperature data for the gas-particlemixture exposed to highly concentrated solar radiation, Z’Graggen developed

8.5. RADIAL TEMPERATURE PROFILES 151
a detailed model for the heat transfer inside the SynPet reactor featuringa 3D path length Monte-Carlo ray tracer [100]. The model was used tocalculate the temperature distribution of a static particle cloud in the reactorcavity based on the experimental conditions of the SynPet experiments (i.e.chemical composition wi and Qsolar having the characteristics of the PSI solarfurnace) presented in Chapter 7, taking into account radiation, convectionand conduction effects as well as chemical reaction.
Similar calculations with flowing systems [102] showed that gas and par-ticle temperatures inside the SynPet reactor reach a maximum close to thecoke inlet and stay essentially constant as the particle cloud passes the cav-ity towards the exit. It is therefore reasonable to assume that the reactor isisothermal in the axial direction and has a radial temperature profile.
Figure 8.9 shows the radial distribution of the particle temperature atthe reactor inlet for the conditions of the SynPet experiments in the solarfurnace, presented in Chapter 7. The data are calculated with the Monte-Carlo radiation model [100]. The calculated profiles are bell shaped with apronounced maximum at the cavity center. Temperature gradients in theradial direction are in the order of 600 K per 10 cm, whereas axial gradientsare negligible, pointing out that the reactor performance is controlled by theradial temperature distribution.
Figure 8.10 shows the peak temperature (‘4’), the integral mean temper-ature (‘◦’), and the wall temperature (‘5’) of the coke particles extractedfrom Figure 8.9. The experimental runs are ordered by increasing pyrome-ter temperature (‘∗’). The integral mean temperature over the reactor crosssection is calculated according to
x =2
R2
∫ R0
0
x(R) ·R dR (8.64)
Despite a monotonic increase of the experimentally determined pyrometertemperature (‘∗’), the calculated mean particle temperature (‘◦’) is essen-tially constant in all of the runs.
The exponential temperature dependence of the reaction rate originatingfrom Equation (4.36) prevented the use of an isothermal reactor model asit was considered in Chapter 8.2. The use of a radial mean temperature forthe performance calculation underestimates the substantial contribution ofthe hot reactor center where the Monte-Carlo model predicts temperaturesas high as 2300 K. Considering the particle temperatures predicted by theMonte-Carlo model, the innermost parts of the reactor easily reach 100% con-version, whereas the cold regions close to the wall yield very low conversions(cf. Chapter 8.6).

152 CHAPTER 8. SYNPET REACTOR MODELING
!1 !0.5 0 0.5 11200
1400
1600
1800
2000
2200
2400
R/R0 (!)
Tem
per
atur
e(K
)
reactor axisreactor wall
Figure 8.9: Radial distribution of the particle temperature for the conditionsof the SynPet experiments in the solar furnace (cf. Chapter 7). The data arecalculated with the Monte-Carlo radiation model [100].
0 5 10 15 20 251000
1200
1400
1600
1800
2000
2200
2400
Experiment (#)
Tem
pera
ture
(K)
Twall Tpeak Tparticle,mean
Tpyrometer
Figure 8.10: Peak temperature (‘4’), integral mean temperature (‘◦’), andwall temperature (‘5’) of the coke particles extracted from Figure 8.9. Theexperimental runs are ordered by increasing pyrometer temperature (‘∗’).
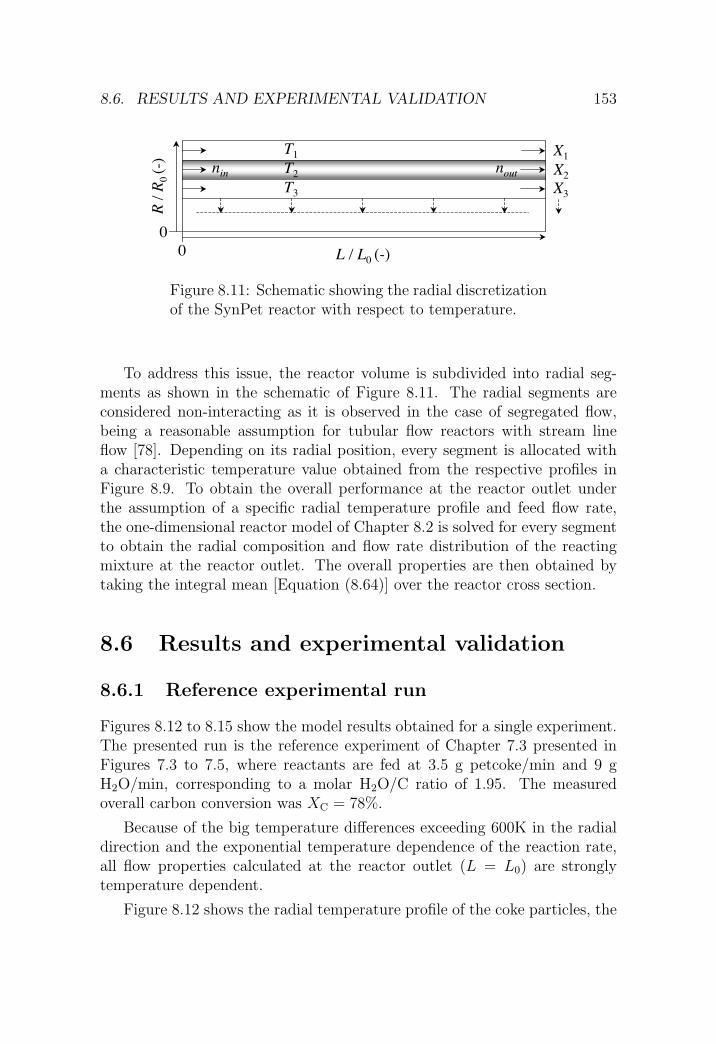
8.6. RESULTS AND EXPERIMENTAL VALIDATION 153
R /
R0
(-)
L / L0 (-)
T1
T2
T3
nin
nout
0
0
X1
X2
X3
Figure 8.11: Schematic showing the radial discretizationof the SynPet reactor with respect to temperature.
To address this issue, the reactor volume is subdivided into radial seg-ments as shown in the schematic of Figure 8.11. The radial segments areconsidered non-interacting as it is observed in the case of segregated flow,being a reasonable assumption for tubular flow reactors with stream lineflow [78]. Depending on its radial position, every segment is allocated witha characteristic temperature value obtained from the respective profiles inFigure 8.9. To obtain the overall performance at the reactor outlet underthe assumption of a specific radial temperature profile and feed flow rate,the one-dimensional reactor model of Chapter 8.2 is solved for every segmentto obtain the radial composition and flow rate distribution of the reactingmixture at the reactor outlet. The overall properties are then obtained bytaking the integral mean [Equation (8.64)] over the reactor cross section.
8.6 Results and experimental validation
8.6.1 Reference experimental run
Figures 8.12 to 8.15 show the model results obtained for a single experiment.The presented run is the reference experiment of Chapter 7.3 presented inFigures 7.3 to 7.5, where reactants are fed at 3.5 g petcoke/min and 9 gH2O/min, corresponding to a molar H2O/C ratio of 1.95. The measuredoverall carbon conversion was XC = 78%.
Because of the big temperature differences exceeding 600K in the radialdirection and the exponential temperature dependence of the reaction rate,all flow properties calculated at the reactor outlet (L = L0) are stronglytemperature dependent.
Figure 8.12 shows the radial temperature profile of the coke particles, the
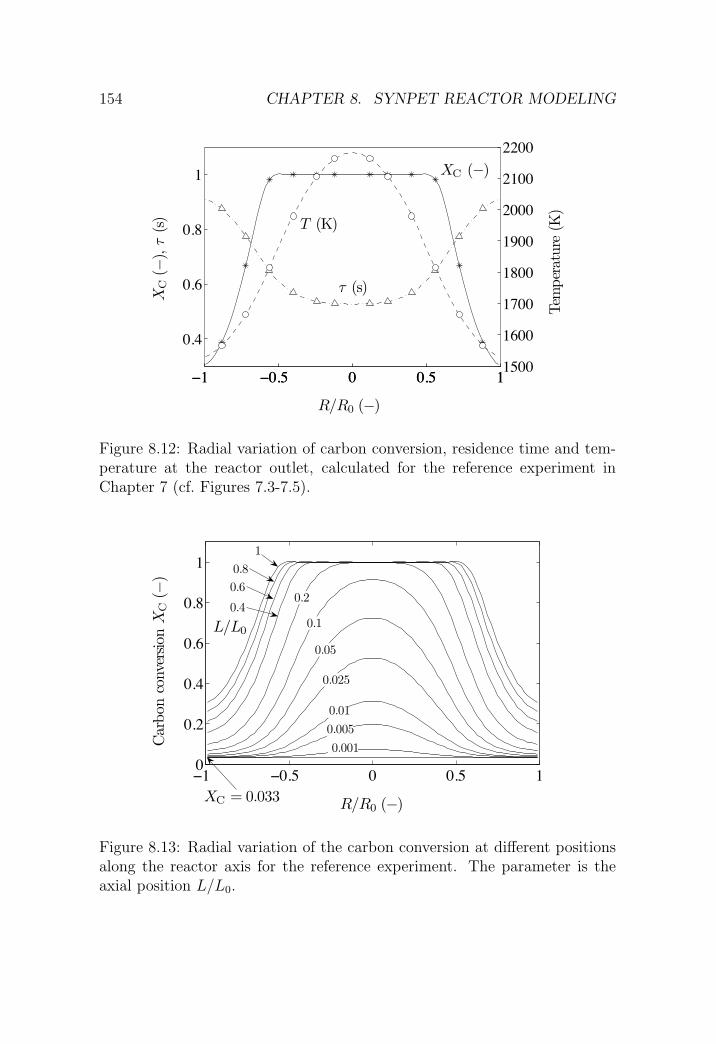
154 CHAPTER 8. SYNPET REACTOR MODELING
!1 !0.5 0 0.5 1
0.4
0.6
0.8
1
XC
(!),
!(s
)
!1 !0.5 0 0.5 11500
1600
1700
1800
1900
2000
2100
2200
Tem
per
atur
e(K
)
R/R0 (!)
! (s)
XC (!)
T (K)
Figure 8.12: Radial variation of carbon conversion, residence time and tem-perature at the reactor outlet, calculated for the reference experiment inChapter 7 (cf. Figures 7.3-7.5).
!1 !0.5 0 0.5 10
0.2
0.4
0.6
0.8
1
Car
bon
conv
ersion
XC
(!)
R/R0 (!)
0.001
0.005
0.01
0.025
0.05
0.1
0.2
L/L0
0.4
0.6
0.8
1
XC = 0.033
Figure 8.13: Radial variation of the carbon conversion at different positionsalong the reactor axis for the reference experiment. The parameter is theaxial position L/L0.

8.6. RESULTS AND EXPERIMENTAL VALIDATION 155
carbon conversion and the residence time as function of the dimensionlessradial position, R/R0, at the reactor outlet. The temperature maximum of2192 K is located at the cavity center. Carbon conversion reaches completionat temperatures above ≈ 1800 K. Since higher particle temperatures areachieved on the inner half of the reactor radius, this region yields 100%conversion of the coke, whereas it drops significantly in the vicinity of thereactor wall reaching a minimum in the order of XC ≈ 0.3. As the crosssectional area is proportional to the square of the radius, the contributionof the peripheral area is more important than that of the central area wherefull conversion is achieved.
The radial distribution of the residence time, τ , is strongly affected byconversion and thermal expansion. Due to the stoichiometry of the gasifica-tion reaction, the amount of gas is almost doubled per mole of carbon react-ing, leading to higher flow rates. The flow rates are further increased due tothe thermal expansion being higher in the hot zone at the cavity center. Theresidence time τ is minimal at the cavity center where gas production andthermal expansion have a maximum.
Figure 8.13 shows the radial distribution of the carbon conversion and itschange with the axial reactor position between the reactor inlet and outlet.The parameter is the axial reactor coordinate, denoted by the dimensionlessreactor length L/L0. L/L0 = 0 is the reactor inlet and L/L0 = 1 the reactoroutlet. The carbon conversion at the reactor inlet is 3.3% for any radialposition, because of the pyrolysis reaction assumed to take place in the firstcontrol volume, converting a small amount of the coke to methane and hydro-gen. Moving the axial position in the direction of the outlet results in highercarbon conversions, especially near the hot cavity center where 50% of thecoke is gasified at 0.025L0 and 100% between 0.1 and 0.2L0. However, thecarbon conversion in the reactor segments close to the reactor wall increasesonly little between reactor inlet and outlet, despite the higher residence timeclose to the wall compared to the reactor center.
Figures 8.14 and 8.15 show the modeled gas composition, yi, and carbonconversion, XC, inside the cylindrical reactor cavity at the reactor outlet andat the 1800 K isotherm with R/R0 ≈ 0.6, respectively.
The radial concentration profile at the reactor outlet is shown in Figure8.14. Composition of the product gas depends on chemical conversion andtemperature. Close to the reactor wall where conversion is low, the weightfraction of the reactants H2O and C has a maximum whereas steam gasifica-tion products H2, CO and CO2 are mainly found in the hot reactor center.Besides the conversion maximum at the reactor center, the high tempera-

156 CHAPTER 8. SYNPET REACTOR MODELING
!1 !0.5 0 0.5 10
0.1
0.2
0.3
0.4
0.5M
ole
frac
tion
y i(!
)
R/R0 (!)
!1 !0.5 0 0.5 10
0.2
0.4
0.6
0.8
1
Car
bon
conv
ersion
XC
(!)
L = L0
Ar H2O H2
CO2 CO CH4
XC
Figure 8.14: Radial profiles of the gas composition, yi, and the carbon con-version, XC, of the reference experiment at the reactor outlet (L = L0).
0 0.2 0.4 0.6 0.8 10
0.1
0.2
0.3
0.4
0.5
0.6
L/L0 (!)
Mol
efra
ctio
ny i
(!)
0 0.2 0.4 0.6 0.8 10
0.2
0.4
0.6
0.8
1
Car
bon
conv
ersio
nX
C(!
)T = 1800 KAr H2O H2
CO2 CO CH4XC
yH2O(feed )
yH2O(L = 0 )
Figure 8.15: Axial profiles of the gas composition, yi, and the carbon con-version, XC, of the reference experiment at R/R0 ≈ 0.6 having a calculatedtemperature of 1800 K.

8.6. RESULTS AND EXPERIMENTAL VALIDATION 157
tures have an effect on the CO/CO2 ratio of the syngas: A CO2-rich syngasis produced close to the cold wall while the hot center produces mainly COand H2.
Figure 8.15 is a plot of the axial concentration profile at a distanceR/R0 ≈ 0.6 from the cavity center, corresponding to a nominal reactortemperature of 1800 K. The feed composition (wAr = 0.464, wH2O = 0.393,wC = 0.143) is indicated in terms of the molar fraction by black symbols (e.g.‘�’ for steam) on the y-axis, representing the cavity front end at L = 0. Therespective gas composition along the cavity is marked with outlined symbols(‘�’).
Due to the dispersion term in the mass conservation Equation (8.6), thecomposition of the reactants inside the cavity at L = 0 differs from therespective feed composition. The axial dispersion causes a smoothening ofthe axial concentration gradients and an offset between the concentrationin the feed and the concentration inside the reactor. The size of the offsetdepends on the axial dispersion number and becomes maximal for mixed flowbehavior. The offset is further negative for reactants and positive for productsand continuously reduces the reactor performance as the flow pattern changesfrom plug flow to mixed flow.
Between the reactor inlet and the reactor outlet, the composition of thereactants and products changes due to the chemical reactions defined byto Equations (4.77) to (4.80). The observed concentration profile is similarto what is expected for an ideal plug flow reactor. At L = L0, essentiallyall carbon is converted to syngas resulting in a gas mixture consisting ofsyngas, argon, excess steam, methane from the pyrolysis reaction, and tracesof unreacted carbon (petcoke).
8.6.2 SynPet experiments in the PSI solar furnace
This section presents an experimental validation of the SynPet reactor modelelaborated in the previous sections. To estimate the accuracy of the model,the calculated product gas compositions and chemical conversions of car-bon and steam are compared with experimental data from the experimentsperformed at PSI’s solar furnace (cf. Chapter 7).
Product gas composition
Experimentally measured and modeled concentration data for the SynPetexperiments in the solar furnace are presented in Figure 8.16. The plots showthe molar composition of the relevant off-gas composition sorted according

158 CHAPTER 8. SYNPET REACTOR MODELING
0 10 200
0.2
0.4
H2O
y H2O
(!)
RMS = 0.331
0 10 200
0.2
0.4
H2
y H2
(!)
RMS = 0.168
data model
0 10 200
0.05
0.1
CO2
y CO
2(!
)
RMS = 0.16
data model0 10 20
0
0.1
0.2
CO
y CO
(!)
RMS = 0.206
data model
0 10 200
0.2
0.4
Ar
Experiment (#)
y Ar(!
)
RMS = 0.0531
data model0 10 20
0
0.01
0.02
0.03
CH4
Experiment (#)
y CH
4(!
)
RMS = 0.573
Figure 8.16: Experimental and simulated off-gas composition, yi, for theSynPet experiments in the solar furnace (cf. Chapter 7).
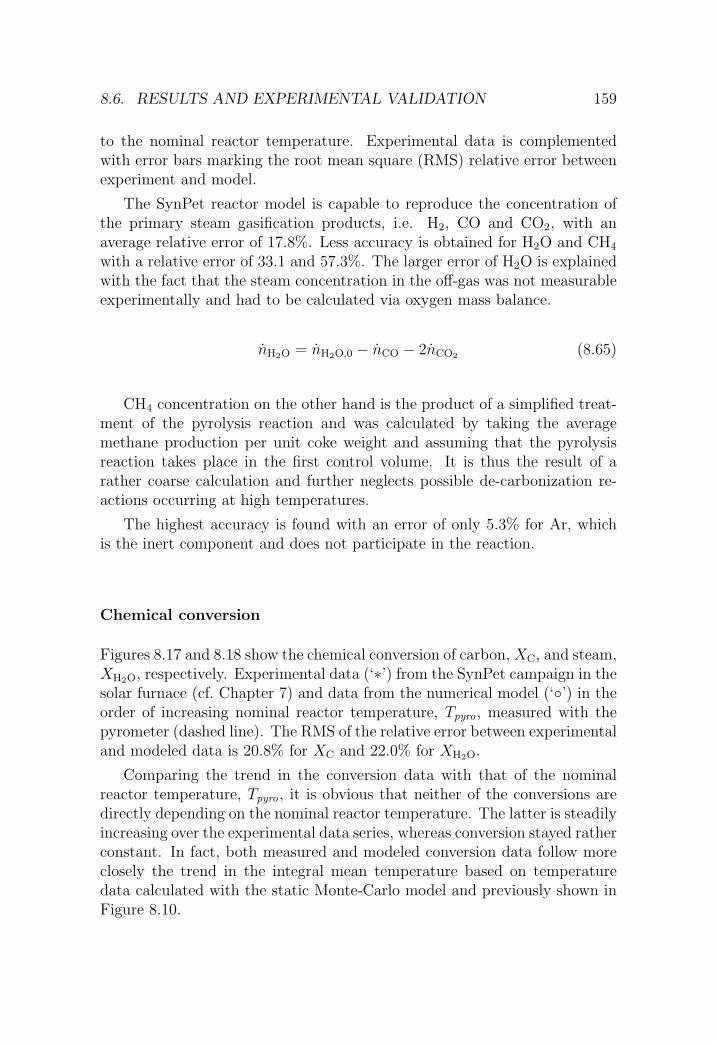
8.6. RESULTS AND EXPERIMENTAL VALIDATION 159
to the nominal reactor temperature. Experimental data is complementedwith error bars marking the root mean square (RMS) relative error betweenexperiment and model.
The SynPet reactor model is capable to reproduce the concentration ofthe primary steam gasification products, i.e. H2, CO and CO2, with anaverage relative error of 17.8%. Less accuracy is obtained for H2O and CH4
with a relative error of 33.1 and 57.3%. The larger error of H2O is explainedwith the fact that the steam concentration in the off-gas was not measurableexperimentally and had to be calculated via oxygen mass balance.
nH2O = nH2O,0 − nCO − 2nCO2 (8.65)
CH4 concentration on the other hand is the product of a simplified treat-ment of the pyrolysis reaction and was calculated by taking the averagemethane production per unit coke weight and assuming that the pyrolysisreaction takes place in the first control volume. It is thus the result of arather coarse calculation and further neglects possible de-carbonization re-actions occurring at high temperatures.
The highest accuracy is found with an error of only 5.3% for Ar, whichis the inert component and does not participate in the reaction.
Chemical conversion
Figures 8.17 and 8.18 show the chemical conversion of carbon, XC, and steam,XH2O, respectively. Experimental data (‘∗’) from the SynPet campaign in thesolar furnace (cf. Chapter 7) and data from the numerical model (‘◦’) in theorder of increasing nominal reactor temperature, Tpyro , measured with thepyrometer (dashed line). The RMS of the relative error between experimentaland modeled data is 20.8% for XC and 22.0% for XH2O.
Comparing the trend in the conversion data with that of the nominalreactor temperature, Tpyro , it is obvious that neither of the conversions aredirectly depending on the nominal reactor temperature. The latter is steadilyincreasing over the experimental data series, whereas conversion stayed ratherconstant. In fact, both measured and modeled conversion data follow moreclosely the trend in the integral mean temperature based on temperaturedata calculated with the static Monte-Carlo model and previously shown inFigure 8.10.
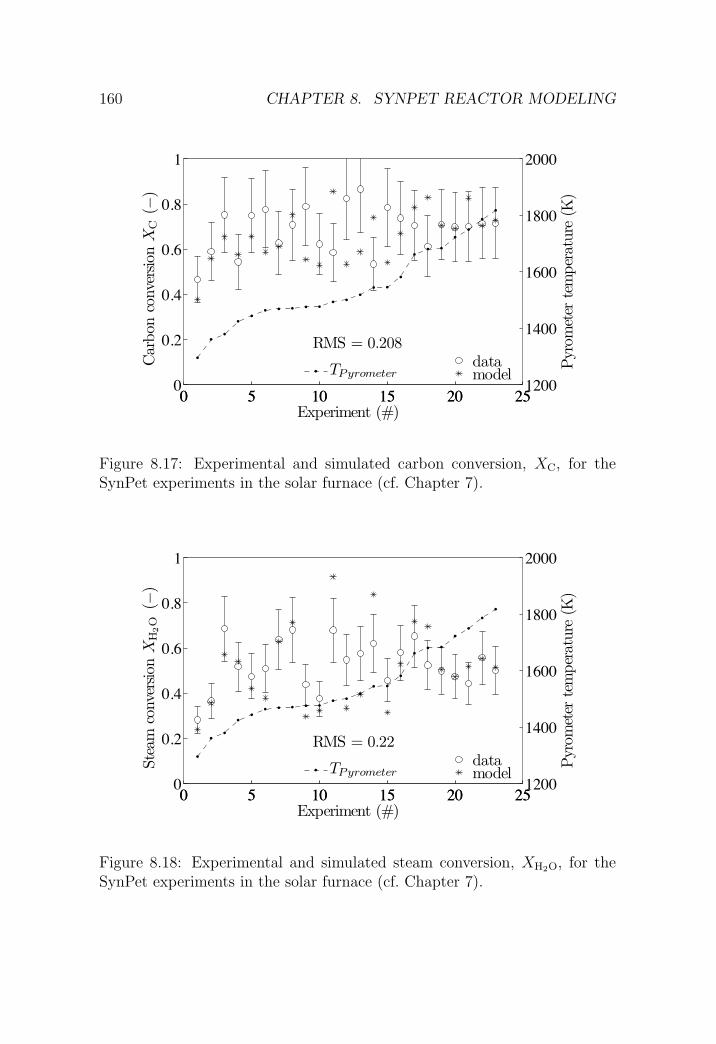
160 CHAPTER 8. SYNPET REACTOR MODELING
0 5 10 15 20 250
0.2
0.4
0.6
0.8
1
Experiment (#)
Car
bon
conv
ersio
nX
C(!
)
datamodel
0 5 10 15 20 251200
1400
1600
1800
2000
Pyro
met
erte
mpe
ratu
re(K
)
RMS = 0.208
TPyrometer
Figure 8.17: Experimental and simulated carbon conversion, XC, for theSynPet experiments in the solar furnace (cf. Chapter 7).
0 5 10 15 20 250
0.2
0.4
0.6
0.8
1
Experiment (#)
Stea
mco
nver
sion
XH
2O
(!)
datamodel
0 5 10 15 20 251200
1400
1600
1800
2000Py
rom
eter
tem
pera
ture
(K)
RMS = 0.22
TPyrometer
Figure 8.18: Experimental and simulated steam conversion, XH2O, for theSynPet experiments in the solar furnace (cf. Chapter 7).
8.7. SUMMARY AND CONCLUSIONS 161
8.7 Summary and conclusions
This chapter treats the numerical modeling of the SynPet 5 kW processreactor. A one-dimensional mathematical model is developed based on theaxial dispersion model. The model accounts for non-ideal flow behavior bysuperimposing plug flow with axial velocity fluctuations due to different flowvelocities and due to molecular and turbulent diffusion. The intensity ofback-mixing is characterized by the dimensionless vessel dispersion numberDuL
being a measure for the spread of a tracer pulse passing through the vessel.The vessel dispersion number is determined experimentally doing residencetime measurements with a reactor model having the same size and similarflow properties.
The one-dimensional dispersion model produces a system of nonlinearcoupled ordinary differential equations that is solved with the finite volumemethod using upwind and central difference schemes for the discretization ofthe convection and dispersion term, respectively. Since the dispersion termprevents a direct solution, the system of equation is solved iteratively for agiven temperature and feed composition.
Tests with an isothermal implementation of the model unveiled that theexperimental cavity temperatures measured with thermocouples and pyrom-eter can not be used to explain the observed reactor performance. The modelis therefore extended by radial temperature profiles calculated with a Monte-Carlo radiation model [102], taking into account radiation, convection andconduction effects as well as the heat of reaction. The static Monte-Carlomodel predicts significant radial temperature gradients in the order of 600 Kand peak temperatures exceeding 2200 K inside the reactive particle cloudproviding reasonable results with respect to the overall reactor performance.
The intrinsic rate of the chemical reaction is calculated using the Lang-muir-Hinshelwood rate laws (4.77)-(4.80) derived for the oxygen exchangemechanism in Chapter 4 with the rate data obtained for the H2O-CO2 gasifi-cation in the thermobalance presented in Chapter 5. Additional gasificationexperiments in the thermobalance performed with coke residuals from theSynPet campaign showed a systematic deviation of the intrinsic gasificationrates of raw coke samples and samples that passed the solar reactor. Thedifference is explained with the much lower residence time of the coke in theprocess reactor compared to the TG and is corrected with an Arrhenius typecorrelation parameter.
The overall rate of the chemical reaction is calculated according the mod-els presented in Chapter 4.1.1 and 4.1.2, taking into account mass transfer in
162 CHAPTER 8. SYNPET REACTOR MODELING
the solid particle and in the surrounding gas phase, respectively. Mass trans-fer limitation inside the particle is considered in the form of an experimentalcorrelation relating the particle effectiveness ηP with the particle diameter.Mass transfer of products and reactants between the particle surface andthe bulk phase is modeled as steady diffusion from a sphere into a stagnantgas, assuming particle entrainment with negligible gas particle relative ve-locity. Gas phase mass transfer was found to have no effect in the case of aparticle with RP = 0.6 µm as it was used for the SynPet campaign, up totemperatures as high as 1800 K and carbon conversions up to 100%. As aconsequence, only mass transfer limitations inside the particle are includedin the model and the net gas production is calculated from the sum of thepyrolysis and reactive gasification according to Equations (8.57) and (8.62).
Modeling results reported for the reference experiment at the reactor out-let show a strong radial variation of overall composition, chemical conversionand flow rates. Close to the reactor center, where the temperature pro-files show pronounced maxima exceeding 2200 K, 100% carbon conversionis achieved. The product gas has a low a low CO2/CO ratio because of thehigh temperatures and residence time is minimal due to gas production andthe thermal expansion. In the peripheral reactor regions the static Monte-Carlo model predicts lower temperatures between 1400 and 1700 K yieldingonly partial carbon conversion and a higher CO2 content. Axial concentra-tion profiles are similar to what is expected for a plug flow reactor with theexception of a concentration offset at the reactor inlet caused by dispersion.
The overall accuracy of the numerical model for the SynPet 5 kW processreactor is rated in terms of the RMS relative error between experimentallydetermined off-gas composition and carbon and steam conversion. The Syn-Pet reactor model is capable to reproduce the concentration of the primarysteam gasification products being H2, CO and CO2 with an average rela-tive error of 17.8%. The RMS relative error of steam and carbon conversionare 20.8 and 22%. There are several reasons for the aforementioned notablerelative errors:
• The model is considering chemical reaction and mass transfer only. Theenergy balance in particular is not included in the model as there is animportant contribution of radiative heat transfer which is beyond thescope of this thesis.
• At the time the experiments were done, it was not possible to measureexperimentally the temperature of the hot particle-gas mixture in thecavity under solar irradiation. The measured wall temperatures did notprovide a useful means to estimate the particle temperature. Because

8.7. SUMMARY AND CONCLUSIONS 163
of this, the latter was extracted from A. Z’Graggen’s model for the heattransfer inside the SynPet reactor featuring a 3D path length Monte-Carlo ray tracer.
• Key input parameters required to calculate the temperature profile inthe cavity and the reactor performance are itself subjected to consider-able errors: The solar power input Qsolar has an accuracy of + 9
−13% and
the initial coke feed nC,0 ±5% [102].
• The model assumes a constant input of solar power. However, solar ex-periments are performed under transient conditions of the solar powerinput. A dynamic simulation of a solar experiment (outside the scopeof this thesis) would require knowledge of the variation of power, tem-perature, and mass flow rates with time.

164 CHAPTER 8. SYNPET REACTOR MODELING

Chapter 9
Summary and outlook
This thesis was performed in the framework of a joint project of PDVSA,ETHZ and CIEMAT, aiming at the development of the required technologyfor the production of high quality syngas and hydrogen using extra-heavyOrinoco type of crude oil or derived residues such as petroleum coke usingsolar thermochemical processing.
The main objective of this research work is the experimental and the-oretical analysis of the reaction kinetics and thermodynamics of the solarthermal gasification of petroleum coke. This process is a hybrid solar/fossilendothermic process in which the solid is used exclusively as the source forhydrogen production and solar power is used exclusively as the source forhigh temperature process heat.
Gasification of carbonaceous solids is a clean technology suitable to con-vert low or negative-value feed stocks such as residues from the processing ofheavy and extra heavy crude oils into gaseous and liquid fuels. This processhas recently gained importance for several reasons:
• In parallel to the depletion of fossil resources, the API gravity andthe metal and sulfur content of the available feedstocks is increasing,making the use of nonconventional feedstocks such as high sulfur heavyoils, oil shales, tar, coke, and waste more important.
• The worldwide demand for refinery products and energy is increasing.
• Environmental restrictions for the combustion of carbonaceous fuelsincrease the importance of production processes for clean fuels. Gasifi-cation products are easily cleaned from contaminants and can serve asthe basis material for high quality fuels.
165

166 CHAPTER 9. SUMMARY AND OUTLOOK
The use of solar energy as a substitution of conventional internal com-bustion helps to preserve fossil resources. At the same time, the calorificvalue of the feedstock is upgraded and the release of pollutants to the envi-ronment is avoided. Solar gasification provides a viable transition path fromtodays fossil industry towards the long term goal of CO2-free solar hydrogenproduction.
This thesis is part of the development of a new reactor technology forthe solar thermal gasification of carbonaceous solids. The use of a state ofthe art high temperature entrained flow gasification reactor, as it is used innumerous conventional gasification facilities, extends traditional solar gasifi-cation concepts such as fluidized and packed bed reactors. High temperatureentrained flow gasification is proven to be an efficient and reliable technologyfor the gasification of a large amount of different feedstocks and minimizeson the same time the discharge of pollutants to the environment.
9.1 Summary
A thermodynamic analysis of the steam gasification of petcoke is presentedconsidering two types of petroleum coke, a Flexicoke and a delayed coke.Equilibrium computation of the stoichiometric system of petcoke and steamat 1 bar and 1300 K result in an equimolar mixture of H2 and CO. A 2nd-lawanalysis for generating electricity using the gasification products indicates thepotential of doubling the specific electrical output and halving the specificCO2 emissions vis-a-vis conventional petcoke-fired power plants.
Rate laws for the overall gasification process including pyrolysis and reac-tive gasification are derived: Pyrolysis is modeled as a linear combination offirst order decomposition reactions. The model for the reactive gasificationis based on a Langmuir-Hinshelwood type reaction mechanism consideringreversible sorption of gaseous species onto the carbon surface and irreversiblereactions among adsorbed species and with molecules from the gas phase. Astructural model for the porous solid (coke) and the surrounding gas film isused to account for mass transfer limitations.
The rate constants of the kinetic expressions were determined experimen-tally by dynamic thermogravimetry in the 900-1300 K temperature interval.Gasification experiments were performed in inert gas as well as Ar-H2O-CO2
mixtures with varying concentrations of the reactive gases. The gaseousproducts being H2, CO, CO2, CH4, C2H2, C2H4, C2H6, H2S, and COS wereanalyzed with a Varian Micro GC.

9.1. SUMMARY 167
The TG experiments further showed that the rate of the gasification re-action is significantly reduced once the samples are heated to temperatureshigher than 1310 K, which is explained by thermal annealing and an experi-mentally validated loss of active surface and pore volume.
The effect of the particle size on the reaction rate is modeled with anempirical particle effectiveness expression according to robs = ηP rintr , ex-pressing the overall rate of the gasification reaction, robs , in terms of aneffectivity constant and the intrinsic rate, rintr .
Experiments with laboratory scale fluidized bed reactors are performedusing two different modes of heat transfer to analyze possible effects on thereaction kinetics. A fluidized bed of coke particles is gasified using a quartzreactor and an opaque aluminum oxide reactor heated by concentrated ther-mal radiation from ETH’s high-flux solar simulator. The observed gasifica-tion rates and the product composition are essentially the same for the twoheat transfer modes, and consistent with the results from the TG experi-ments.
The thermodynamic and kinetic informations were used for the designof a 5 kW entrained flow prototype reactor. The so-called SynPet reactorconsists of a 20 × 10 cm cylindrical cavity receiver that contains a 5 cmdiameter opening closed with a quartz window to let in concentrated solarpower. The reactor is operated with a fine ground PD coke slurry and hasbeen successfully tested in the PSI solar furnace. Chemical conversion ofcarbon and steam reached up to 87% and 69%, respectively, for a solar powerinput in the range 3.3-6.6 kW and coke mass flow rate in the range 1.85-4.45g/min. During the operation with a stoichiometric feed (H2O/C = 1), thereactor produced a gas with H2/CO ≈ 2 and CO2/CO ≈ 0.3.
A mathematical model of the SynPet reactor is developed based on theaxial dispersion model, using axial back mixing to match the residence timedistribution of a non-ideal flow pattern. The axial dispersion number is ob-tained from residence time distribution measurements. The dispersion modelis further extended by means of radial temperature profiles calculated fromthe experimental parameters of the SynPet campaign in the solar furnace.Kinetic expressions and rate data elaborated in Chapters 4 and 5 are usedto calculate the rate of reaction. Mass transfer in the gas phase was ana-lyzed and found to have no effect for the used particle size and the calculatedtemperatures.
Rate data obtained from TG experiments are corrected for the use withthe process reactor in order to account for a large reactivity difference ob-served between coke samples gasified in the TG and those from the SynPet

168 CHAPTER 9. SUMMARY AND OUTLOOK
experiments. The higher reactivity of samples used in the process reactor isexplained with the strong differences between the temperature history of thesamples gasified in the SynPet reactor (τ ≈ 1 s) and those used in the TG(τ ≈ 1 h) and the DFB reactor (τ ≈ 15 min). Modeled data is compared withthe solar experiments and showed reasonable accuracy with respect to gascomposition and chemical conversion, keeping in mind the basic character ofthe model and the limitations associated with the temperature measurement.
In a subsequent experimental campaign [52, 101] it was demonstratedthat the results obtained with dry petcoke feeding are reproducible usingpetcoke slurries as feedstock.
9.2 Outlook
Within the framework of this project, a second thesis at the Professorshipin Renewable Energy Carriers at ETH Zurich is dedicated to the simulationof radiative heat transfer in chemically reacting systems in order to get abetter understanding of the heat transfer mechanisms occurring in the SynPetreactor.
Ongoing experimental work with the 5 kW prototype reactor is dedicatedto the implementation and testing of new feeder systems that are capable ofhandling petcoke slurries and liquid feedstocks including the direct use ofvacuum residues mixed with water. Experiments with coke slurries havebeen performed successfully providing results that are rather similar to thosepresented in this thesis for steam/coke feeding. An additional experimentalcampaign with vacuum residues is currently running at PSI’s solar furnace.
In parallel to the experiments with new feedstocks, a scale-up to a nominalthermal power of 500 kW is being performed. The new reactor has beendesigned by the ETH team and fabricated by CIEMAT. Figure 9.1 shows aphotograph of the new reactor shell before assembling. The complete pilotchemical plant is being assembled at the Plataforma Solar de Almerıa, wherethe 500 kW reactor will be installed on top of a central receiver system,showed in Figure 9.2. The new reactor is scheduled for operation in 2007 andmarks a further milestone in the development of a new gasification technologyfor the upgrading of refinery residues with concentrated solar energy.
As the reactor technology is demonstrated on the 500 kW scale, the ulti-mate objective is the construction of a solar gasification plant with multiplereceiver/mirror fields for the gasification of residues on an industrial MWscale.
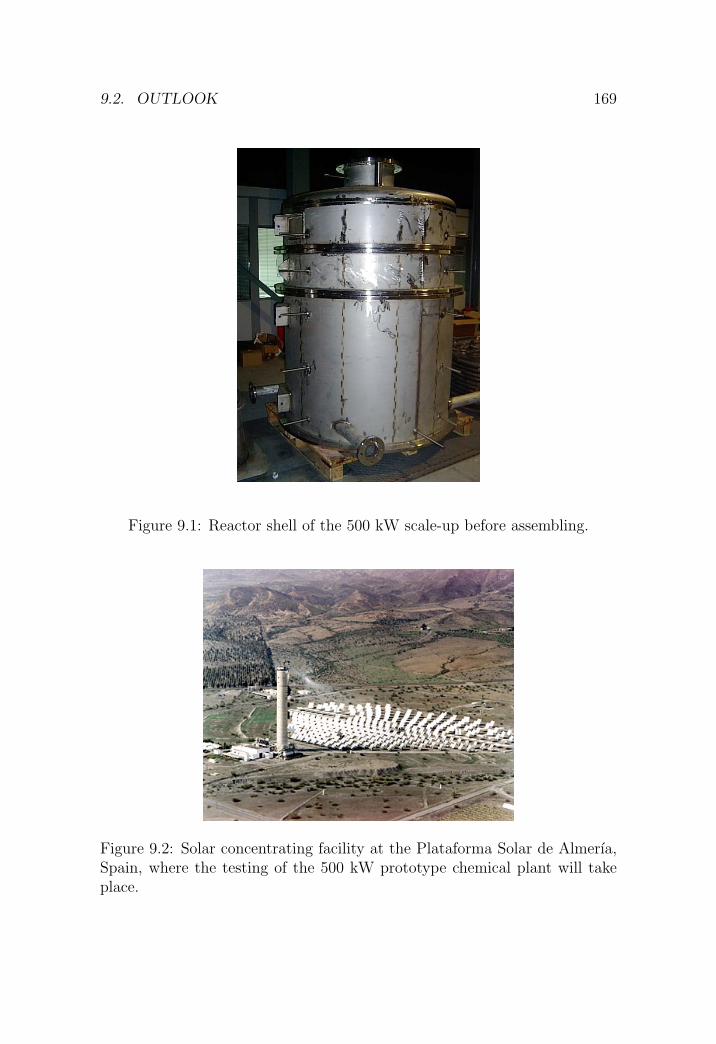
9.2. OUTLOOK 169
Figure 9.1: Reactor shell of the 500 kW scale-up before assembling.
Figure 9.2: Solar concentrating facility at the Plataforma Solar de Almerıa,Spain, where the testing of the 500 kW prototype chemical plant will takeplace.

170 CHAPTER 9. SUMMARY AND OUTLOOK

List of Figures
2.1 Gasifier types for autothermic gasification: (a) fixed bed, (b)fluidized bed, and (c) entrained flow gasifier. . . . . . . . . . . 10
2.2 Schematic of the solar thermal gasification of petcoke. . . . . . 13
2.3 SEM micrographs of PD coke particles at a magnification of200× and 1000×, respectively. . . . . . . . . . . . . . . . . . . 22
2.4 SEM micrographs of Flexicoke particles. (a) shows the rawmaterial, (b) are particles gasified in the DFB reactor withXC = 0.11. Magnification: (a) 200×, (b) 500 ×. . . . . . . . . 22
3.1 Variation of the thermodynamic equilibrium composition withtemperature of the system CHxOy + (1 − y)H2O at 1 bar forFlexicoke. . . . . . . . . . . . . . . . . . . . . . . . . . . . . . 25
3.2 Variation of the thermodynamic equilibrium composition withtemperature of the system CHxOy + (1 − y)H2O at 1 bar forPD coke. . . . . . . . . . . . . . . . . . . . . . . . . . . . . . . 25
3.3 Variation of the percent yield of H2 and CO with temperaturefor the gasification of Flexicoke and PD coke, assuming theequilibrium composition in Figures 3.1 and 3.2, respectively. . 26
3.4 Enthalpy change of reaction (3.2) as a function of tempera-ture T for the two types of petcoke, when the reactants arefed at 300 K and the products are obtained at T having theequilibrium composition given in Figures 3.1 and 3.2. . . . . . 26
3.5 Flow sheet diagram used for the 2nd-law analysis. . . . . . . . 29
4.1 Progressive-conversion and shrinking unreacted core model. . . 35
4.2 Schematic of a spherical particle with concentration gradientand spherical shell of thickness ∆R. . . . . . . . . . . . . . . . 37
171
172 LIST OF FIGURES
4.3 Schematic of the grain model. The coke particle is assumed tobe an aggregation of smaller grains. The grains are modeledas spheres of uniform size, each of which reacts with steamaccording to the SCM model. . . . . . . . . . . . . . . . . . . 38
4.4 Schematic of the mass transfer model for the gas phase: Steamis transfered from the bulk gas to the surface of a sphericalpetcoke particle, where it reacts with carbon to form H2, CO,and CO2. . . . . . . . . . . . . . . . . . . . . . . . . . . . . . 42
5.1 Cross-sectional schematics of the Netzsch steam furnace andhigh temperature furnace. . . . . . . . . . . . . . . . . . . . . 56
5.2 Empty crucible and crucible with mounted coke sample. . . . 56
5.3 TG and DTG data for the pyrolysis of Flexicoke and PD coke. 62
5.4 Weight loss and product gas composition as a function of tem-perature for the pyrolysis of PD coke. . . . . . . . . . . . . . . 62
5.5 Weight loss and product gas composition as a function of tem-perature for the steam gasification of Flexicoke. . . . . . . . . 64
5.6 Weight loss and product gas composition as a function of tem-perature for the steam gasification of PD coke. . . . . . . . . . 64
5.7 Weight loss as a function of temperature for the gasificationof Flexicoke in binary H2O-Ar and CO2-Ar mixtures. . . . . . 66
5.8 Weight loss as a function of temperature for the gasificationof PD coke in binary H2O-Ar and CO2-Ar mixtures. . . . . . . 66
5.9 Weight loss as a function of temperature for the steam gasifi-cation of Flexicoke. . . . . . . . . . . . . . . . . . . . . . . . . 67
5.10 Weight loss as a function of temperature for the steam gasifi-cation of PD coke. . . . . . . . . . . . . . . . . . . . . . . . . 67
5.11 Calculation of rintr for Flexicoke via extrapolation of isother-mal rate data to RP = 0. . . . . . . . . . . . . . . . . . . . . . 69
5.12 Calculation of rintr for PD coke via extrapolation of isothermalrate data to RP = 0. . . . . . . . . . . . . . . . . . . . . . . . 69
5.13 Experimental particle effectiveness factor ηP for the steamgasification of Flexicoke and PD coke. . . . . . . . . . . . . . . 70
5.14 Thermal deactivation of PD coke above 1300 K during gasifi-cation experiments with different reactive gas compositions. . 72
5.15 Weight loss as a function of temperature for the gasificationof thermally pretreated PD coke. . . . . . . . . . . . . . . . . 73
LIST OF FIGURES 173
5.16 Rate of reaction as a function of temperature for the gasifica-tion of thermally pretreated PD coke. . . . . . . . . . . . . . . 73
5.17 Experimental error (noise) of the TG during the pyrolysis andgasification runs . . . . . . . . . . . . . . . . . . . . . . . . . . 75
5.18 Measured and modeled conversion rate dXP /dt obtained forthe pyrolysis of Flexicoke . . . . . . . . . . . . . . . . . . . . . 76
5.19 Measured and modeled conversion rate dXP /dt obtained forthe pyrolysis of PD coke. . . . . . . . . . . . . . . . . . . . . . 76
5.20 Experimentally measured and modeled reaction rate as a func-tion of temperature for the gasification of Flexicoke and PDcoke. . . . . . . . . . . . . . . . . . . . . . . . . . . . . . . . . 80
5.21 Reaction rate, −rC (s−1), as a function of the H2O and CO2
partial pressures at 1273 K for the gasification of Flexicokeand PD coke. . . . . . . . . . . . . . . . . . . . . . . . . . . . 81
6.1 Flowchart of the fluidized bed reactor setup in the ETH’s high-flux solar simulator. . . . . . . . . . . . . . . . . . . . . . . . . 86
6.2 Quartz fluidized bed reactor before and after experiment. . . . 86
6.3 The ETH’s solar simulator with the quartz reactor during anexperiment. . . . . . . . . . . . . . . . . . . . . . . . . . . . . 86
6.4 Fluidized bed temperature and product gas composition dur-ing a representative experimental run with Flexicoke and 10%H2O-Ar. . . . . . . . . . . . . . . . . . . . . . . . . . . . . . . 88
6.5 Steam and carbon conversion for the experimental run of Fig-ure 6.4 with Flexicoke and 10% H2O-Ar. . . . . . . . . . . . . 88
6.6 Product gas composition and steam conversion as a function ofthe fluidized bed temperature for Flexicoke gasification usinga feed gas of 10% H2O-Ar. . . . . . . . . . . . . . . . . . . . . 90
6.7 Product gas composition and steam conversion as a functionof the fluidized bed temperature for PD coke gasification usinga feed gas of 10% H2O-Ar. . . . . . . . . . . . . . . . . . . . . 90
6.8 Product gas relative composition and steam conversion as afunction of temperature for the steam gasification of Flexicokeand PD coke with direct irradiation of the fluidized bed. Argonand excess steam are omitted. . . . . . . . . . . . . . . . . . . 91
6.9 Variation of H2S concentration in the product gas with tem-perature for the steam gasification of both petcokes. . . . . . . 91
174 LIST OF FIGURES
6.10 Reactor temperature and product gas concentration during adry experimental run with Flexicoke. . . . . . . . . . . . . . . 93
6.11 Variation of the elementary composition of PD coke with tem-perature. . . . . . . . . . . . . . . . . . . . . . . . . . . . . . . 93
6.12 Variation of the specific surface and micropore area of PD cokewith temperature. . . . . . . . . . . . . . . . . . . . . . . . . . 94
6.13 Variation of the micropore volume and the average pore di-ameter of PD coke with temperature. . . . . . . . . . . . . . . 94
6.14 Fluidized bed reactor setup for the use of opaque ceramicsfluidization tubes with radiation shield and quartz dome. . . . 96
6.15 Bed temperature as a function of the arc current for differentfluidization tubes. . . . . . . . . . . . . . . . . . . . . . . . . . 97
6.16 Fluidized bed temperature and product gas composition dur-ing a representative experimental run with PD coke in 10%H2O-Ar. . . . . . . . . . . . . . . . . . . . . . . . . . . . . . . 99
6.17 Steam and carbon conversion for the experimental run of Fig-ure 6.16 with PD coke and 10% H2O-Ar. . . . . . . . . . . . . 99
6.18 Product gas composition and steam conversion as a function ofthe fluidized bed temperature for the gasification of Flexicokeusing 10% H2O-Ar. . . . . . . . . . . . . . . . . . . . . . . . . 100
6.19 Product gas composition and steam conversion as a functionof the fluidized bed temperature for the gasification of PD cokeusing 10% H2O-Ar. . . . . . . . . . . . . . . . . . . . . . . . . 100
6.20 Product gas relative composition and steam conversion as afunction of temperature for the steam gasification of Flexicoke,and PD coke with indirect irradiation of the fluidized bed. . . 102
6.21 Experimentally measured vs. modeled product flow rates. . . . 104
6.22 Concentration profile along the dimensionless reactor axis andboundary conditions for the steam gasification of PD coke in10% H2O-Ar at 1572 K. . . . . . . . . . . . . . . . . . . . . . 105
6.23 Arrhenius plots of K1a. . . . . . . . . . . . . . . . . . . . . . . 106
6.24 Arrhenius plots of K2a. . . . . . . . . . . . . . . . . . . . . . . 107
6.25 Arrhenius plots of K3. . . . . . . . . . . . . . . . . . . . . . . 107
6.26 Temperature dependence of the H2/CO and CO2/CO molarratio in the product gas for the experiments with the DFB andIFB reactor. . . . . . . . . . . . . . . . . . . . . . . . . . . . . 109

LIST OF FIGURES 175
6.27 Comparison of the carbon consumption rate, rC for the steamgasification of Flexicoke and PD coke using the TG as well asthe DFB and IFB setups. . . . . . . . . . . . . . . . . . . . . 111
7.1 Scheme of solar chemical reactor configuration for the steamgasification of petcoke. . . . . . . . . . . . . . . . . . . . . . . 116
7.2 Schematic of the experimental setup at PSI’s solar furnace. . . 118
7.3 Off-gas composition of the reference experiment measured byGC and IR spectroscopy for the steam gasification of PD cokein the SynPet reactor. . . . . . . . . . . . . . . . . . . . . . . 120
7.4 Conversion of carbon and steam calculated with Equations(7.1) and (7.2), respectively, for the experiment in Figure 7.3. 121
7.5 Pyrometer temperature, Treactor , wall temperature, Tinconell ,off- gas temperature, Tgas,out , and thermal input, Qsolar , of theexperiment in Figure 7.3. . . . . . . . . . . . . . . . . . . . . . 121
7.6 Steam and carbon conversion as function of the pyrometertemperature (cf. Figure 7.5) for the SynPet experiments withPD coke. . . . . . . . . . . . . . . . . . . . . . . . . . . . . . . 123
7.7 Steam and carbon conversion as function of the coke and steamfeed rates for the SynPet experiments with PD coke. . . . . . 123
7.8 Steam and carbon conversion as function of the H2O/C molarratio in the feed for the SynPet experiments with PD coke. . . 124
7.9 Product composition as function of the pyrometer temperaturefor the SynPet experiments with PD coke. . . . . . . . . . . . 126
7.10 Product composition as function of the coke and steam feedrates for the SynPet experiments with PD coke. . . . . . . . . 126
7.11 Product composition as function of the H2O/C molar ratio inthe feed for the SynPet experiments with PD coke. . . . . . . 127
8.1 Map showing which flow model should be used. . . . . . . . . 132
8.2 One-dimensional grid point cluster for the discretization. . . . 136
8.3 Discretization scheme of the reactor with the boundary ele-ments 1 and N . . . . . . . . . . . . . . . . . . . . . . . . . . . 138
8.4 Flowchart of the experimental setup for the measurement ofthe RTD. . . . . . . . . . . . . . . . . . . . . . . . . . . . . . 141
8.5 Experimentally determined residence time distribution of theSynPet reactor (E and F curves). . . . . . . . . . . . . . . . . 141
176 LIST OF FIGURES
8.6 TG curves of PD coke residues collected after three runs inthe solar furnace compared to the standard sample. . . . . . . 144
8.7 Rate of steam gasification with pH2O = 0.6 bar for three PDcoke samples collected in the cyclone after the SynPet reactor. 145
8.8 Gas composition and carbon conversion axial profiles for theSynPet reactor operated at 1800 K with feed flow rates of theexperiment presented in Figure 7.3 for four different particlesizes. . . . . . . . . . . . . . . . . . . . . . . . . . . . . . . . . 147
8.9 Radial distribution of the particle temperature for the con-ditions of the SynPet experiments in the solar furnace (cf.Chapter 7). The data are calculated with the Monte-Carloradiation model [100]. . . . . . . . . . . . . . . . . . . . . . . . 152
8.10 Peak temperature, integral mean temperature, and wall tem-perature of the coke particles extracted from Figure 8.9. Theexperimental runs are ordered by increasing pyrometer tem-perature. . . . . . . . . . . . . . . . . . . . . . . . . . . . . . . 152
8.11 Schematic showing the radial discretization of the SynPet re-actor with respect to temperature. . . . . . . . . . . . . . . . . 153
8.12 Radial variation of carbon conversion, residence time and tem-perature at the reactor outlet, calculated for the reference ex-periment in Chapter 7. . . . . . . . . . . . . . . . . . . . . . . 154
8.13 Radial variation of the carbon conversion at different positionsalong the reactor axis for the reference experiment. . . . . . . 154
8.14 Radial profiles of the gas composition, yi, and the carbon con-version, XC, of the reference experiment at the reactor outlet(L = L0). . . . . . . . . . . . . . . . . . . . . . . . . . . . . . 156
8.15 Axial profiles of the gas composition, yi, and the carbon con-version, XC, of the reference experiment at R/R0 ≈ 0.6 havinga calculated temperature of 1800 K. . . . . . . . . . . . . . . . 156
8.16 Experimental and simulated off-gas composition, yi, for theSynPet experiments in the solar furnace (cf. Chapter 7). . . . 158
8.17 Experimental and simulated carbon conversion, XC, for theSynPet experiments in the solar furnace (cf. Chapter 7). . . . 160
8.18 Experimental and simulated steam conversion, XH2O, for theSynPet experiments in the solar furnace (cf. Chapter 7). . . . 160
9.1 Reactor shell of the 500 kW scale-up before assembling. . . . . 169

LIST OF FIGURES 177
9.2 Solar concentrating facility at the Plataforma Solar de Alme-rıa, Spain, where the testing of the 500 kW prototype chemicalplant will take place. . . . . . . . . . . . . . . . . . . . . . . . 169

178 LIST OF FIGURES

List of Tables
2.1 Proximate analysis for Flexicoke and PD coke. . . . . . . . . . 19
2.2 Approximate main elemental chemical composition (ultimateanalysis), low heating value, and elemental molar ratios ofH/C and O/C, for PD coke and Flexicoke. . . . . . . . . . . . 19
2.3 Coke samples used for the experiments. . . . . . . . . . . . . . 21
3.1 Exergy analysis of the solar steam gasification of petcoke usingthe process modeling shown in Figure 3.5. . . . . . . . . . . . 30
5.1 Analyzed gas mixtures used for the GC calibration . . . . . . 57
5.2 Pyrolysis runs in the high temperature furnace with the cor-responding experimental parameters. . . . . . . . . . . . . . . 60
5.3 Reactive gasification runs in the steam furnace with the cor-responding experimental parameters. . . . . . . . . . . . . . . 60
5.4 Numerical values for the parameters a, b, c and d in Equation(5.4) . . . . . . . . . . . . . . . . . . . . . . . . . . . . . . . . 71
5.5 Kinetic parameters for the pyrolysis of petroleum coke. . . . . 77
5.6 Arrhenius parameters of the rate constants derived by apply-ing the oxygen-exchange mechanism for the H2O-CO2 gasifi-cation of PD coke. . . . . . . . . . . . . . . . . . . . . . . . . 78
5.7 Arrhenius parameters of the rate constants derived by apply-ing the extended mechanism for the H2O-CO2 gasification ofFlexicoke and PD coke. . . . . . . . . . . . . . . . . . . . . . . 79
6.1 Mean properties of petcoke particles used as reactants in thisstudy. . . . . . . . . . . . . . . . . . . . . . . . . . . . . . . . 85
6.2 Experimental parameters of hydrogen and oxygen released bypyrolysis during dry experimental runs. . . . . . . . . . . . . . 92
179
180 LIST OF TABLES
6.3 Characteristics of the fluidization tubes tested with the setupin Figure 6.14. . . . . . . . . . . . . . . . . . . . . . . . . . . 96
6.4 Arrhenius parameters for the rate law of steam gasification ofFlexicoke and PD coke respectively, measured with the DFBreactor (Chapter 6.1). . . . . . . . . . . . . . . . . . . . . . . 108
6.5 Arrhenius parameters for the rate law of steam gasification ofFlexicoke and PD coke respectively, measured with the IFBreactor (Chapter 6.2). . . . . . . . . . . . . . . . . . . . . . . 108
8.1 Distribution parameters and vessel dispersion number for theSynPet reactor. . . . . . . . . . . . . . . . . . . . . . . . . . . 141
8.2 Numerical values for the parameters in Equation (8.56) ob-tained by minimization of the error between the left hand sideand the right hand side of Equation (8.55). . . . . . . . . . . . 145
Bibliography
[1] Y. K. Ahn and W. H. Fischer. Production of hydrogen from coal andpetroleum coke: thechnical and economic perspectives. InternationalJournal of Hydrogen Energy, 11(12):783–788, 1986.
[2] R. Alvarez. Solar thermal steam gasification of petcoke in an opaquefluidized bed reactor. Master thesis, Swiss Federal Institute of Technol-ogy (ETH), 2004.
[3] V. Anathakrishnan, W. N. Gill, and A. J. Barduhn. Laminar dispersionin capillaries. I. mathematical analysis. AIChE Journal, 11(6):1063–1072, 1965.
[4] M. J. Antal, L. Hofmann, J. R. Moreira, C. T. Brown, and R. Steenblik.Design and operation of a solar fired biomass flash pyrolysis reactor.Solar Energy, 30(4):299–312, 1983.
[5] D. B. Anthony and J. B. Howard. Coal devolatilization and hydrogasi-fication. AIChE Journal, 22(4):625–656, 1967.
[6] W. H. Beattie, R. Berjoan, and J. P. Coutures. High-temperature solarpyrolys of coal. Solar Energy, 31(2):137–143, 1983.
[7] A. Belghit and M. Daguenet. Study of heat and mass transfer in achemical moving bed reactor for gasification of carbon using an externalradiative source. Int. J. Heat Mass Transfer, 32(11):2015–2025, 1989.
[8] A. Belghit, M. Daguenet, and A. Reddy. Heat and mass transfer in ahigh temperature packed moving bed subject to an external radiativesource. Chemical Engineering Science, 55:3967–3978, 2000.
[9] R. Berber and E. A. Fletcher. Extracting oil from shale using solarenergy. Energy, 13(1):13–23, 1988.
181

182 BIBLIOGRAPHY
[10] R. Bertocchi, J. Karni, and A. Kribus. Experimental evaluation of anon-isothermal high temperature solar particle receiver. Energy, 29(5-6):687–700, 2004.
[11] R. B. Bird, W. E. Stewart, and E. N. Lightfoot. Transport phenomena.John Wiley & Sons, New York, 2nd edition, 2002.
[12] J. D. Blackwood and A. J. Ingeme. The reaction of carbon with carbondioxide at high pressure. Australian Journal of Chemistry, 13:194–209,1960.
[13] J. D. Blackwood and F. McGrory. The carbon-steam reaction at highpressure. Australian Journal of Chemistry, 11:16–33, 1957.
[14] M. Bohnet, editor. Ullmann’s encyclopedia of industrial chemistry.Wiley-VCH, Weinheim, 2003.
[15] R. W. Bryers. Utilization of petroleum coke and petroleum coke/coalblends as a means of steam rizing. Fuel Processing Technology, 44(1-3):121–141, 1995.
[16] E. L. Cussler. Diffusion: mass transfer in fluid systems. CambridgeUniversity Press, Cambridge etc., 2nd edition, 1997.
[17] J. K. Dahl, B. Karen, F. Ryan, T. Stanislaus, A. W. Weimer,A. Lewandowski, C. Binham, A. Smeets, and A. Schneider. Rapidsola-thermal dissociation of natural gas in an aerosol flow reactor. En-ergy, 29(5-6):715–725, 2004.
[18] R. DiPanfilo and N. O. Egiebor. Activated carbon production fromsynthetic crude coke. Fuel Processing Technology, 46:157–169, 1996.
[19] E. L. Doering and G. A. Cremer. The SHELL coal gasification process:the demkolec project and beyond. In Power-Gen Americas ’93, DallasTX, 1993.
[20] E. L. Doering and G. A. Cremer. Advances in the shell coal gasificationprocess. Preprints of Papers - American Chemical Society, Division ofFuel Chemistry, 40(2):312–317, 1995.
[21] S. Ergun. Kinetics of the reactions of carbon dioxide and steam withcoke. Technical report, U.S. Bureau of Mines, 1962.

BIBLIOGRAPHY 183
[22] M. Fasciana and F. Noembrini. Solar petcoke gasification - direct irra-diation. Master thesis, Swiss Federal Institute of Technology (ETH),2003.
[23] J. L. Figueiredo, J. A. Moulijn, and (editors). Carbon and coal gasifica-tion: science and technology. In Carbon and coal gasification: scienceand technology, Alvor, 1986.
[24] M. Flechsenhar and C. Sasse. Solar gasification of biomass using oilshale and coal as candidate materials. Energy, 20(8):803–810, 1995.
[25] E. Furimsky. Gasification in petroleum refinery of 21st century. Oil &Gas Science and Technology, 54(5):597–618, 1999.
[26] J. Gadsby, F. J. Long, P. Sleightholm, and K. W. Sykes. The mecha-nism of the carbon dioxide-carbon reaction. Proc. Roy. Soc. (London),A193:357–376, 1948.
[27] J. H. Gary and G. E. Handwerk. Petroleum refining. Marcel Dekker,New York, 4th edition, 2001.
[28] A. Gomez-Barea, P. Ollero, and R. Arjona. Reaction-diffusion model ofTGA gasification experiments for estimating diffusional effects. Fuel,84(12-13):1695–1704, 2005.
[29] D. W. Gregg. Apparatus and method for solar coal gasification. PatentUS 4’229’184, 1980.
[30] D. W. Gregg, W. R. Aiman, H. H. Otsuki, and C. B. Thorsness. Solarcoal gasification. Solar Energy, 24(3):313–321, 1980.
[31] D. W. Gregg, R. W. Taylor, J. H. Campbell, J. R. Taylor, and A. Cot-ton. Solar gasification of coal, activated carbon, coke and coal andbiomass mixtures. Solar Energy, 25(4):353–364, 1980.
[32] P. Haueter, T. Seitz, and A. Steinfeld. A new high-flux solar furnacefor high-temperature thermochemical research. Jounal for Solar EnergyEngineering, 121(1):77–80, 1999.
[33] W. F. Hemminger and H. K. Cammenga. Methoden der thermischenAnalyse, volume XXIV of Anleitungen fur die chemische Laboratori-umspraxis. Springer-Verlag, Berlin, 1989.

184 BIBLIOGRAPHY
[34] D. Hirsch and A. Steinfeld. Radiative transfer in a solar chemical reac-tor for the co-production of hydrogen and carbon by thermal decom-position of methane. Chemical Engineering Science, 59(24):5771–5778,2004.
[35] D. Hirsch and A. Steinfeld. Solar hydrogen production by thermaldecomposition of natural gas using a vortex-flow reactor. InternationalJournal of Hydrogen Energy, 29(1):47–55, 2004.
[36] D. Hirsch, P. v. Zedtwitz, T. Osinga, J. Kinamore, and A. Steinfeld.A new 75 kW high-flux solar simulator for high-temperature thermaland thermochemical research. ASME-Journal of Solar Engineering,125(1):117–120, 2003.
[37] The MathWorks Inc. Matlab R14, 2005.
[38] G. Ingel, M. Levy, and J. M. Gordon. Oil-shale gasification by con-centrated sunlight: An open-loop solar chemical heat pipe. Energy,17(12):1189–1197, 1992.
[39] H. Kabs. Operational experience with Siemens-Westinghouse SOFCcogeneration systems. In Fuel Cell Home Conference, pages 197–209,Switzerland: Luzern, 2001.
[40] S. Kajitani, S. Hara, and H. Matsuda. Gasification rate analysis of coalchar with a pressurized drop tube furnace. Fuel, 81(5):539–546, 2002.
[41] A. Karcz and S. Porada. Formation of C1-C3 hydrocarbons during pres-sure pyrolysis and hydrogasification in relation to structural changesin coal. Fuel, 76(6):806–809, 1995.
[42] R. E. Kirk and D. F. Othmer. Concise encyclopedia of chemical tech-nology. Wiley, New York, 1999.
[43] D. Kocaefe, A. Charette, and L. Castonguay. Green coke pyrolysis:investigation of simultaneous changes in gas and solid phases. Fuel,74(6):791–799, 1995.
[44] T. Kodoma, Y. Kondoh, T. Tamagawa, A. Funatoh, K. I. Shimizu, andY. Kitayama. Fluidized bed coal gasification with CO2 under directirradiation with concentrated visible light. Energy & Fuels, 16(5):1264–1270, 2002.
BIBLIOGRAPHY 185
[45] S. Kraeupl and A. Steinfeld. Operational performance of a 5 kW solarchemical reactor for the co-production of zinc and syngas. Journal ofSolar Energy Engineering, 125(1):124–126, 2003.
[46] H. Kubiak and H. Lohner. Study relating to the use of solar energy forthe allothermal gasification of coal. Sol. Therm. Energy Util., 6:327–340, 1992.
[47] N. M. Laurendeau. Heterogenous kinetics of coal char gasification andcombustion. Prog. Energy Combust. Sci, 4(4):221–270, 1978.
[48] S. Lee, J. C. Angus, R. V. Edwards, and N. C. Gardner. Noncatalyticcoal char gasification. AIChE Journal, 30(4):583–593, 1984.
[49] O. Levenspiel. Chemical reaction engineering. Wiley, New York, 3rdedition, 1999.
[50] F. J. Long and K. W. Sykes. The mechanism of the steam-carbonreaction. Proc. Roy. Soc. (London), A193:377–399, 1948.
[51] H. H. Lowry and M. A. Elliott, editors. Chemistry of coal utilization.Wiley, New York, 1981.
[52] G. Maag. Solar thermal gasification of petcoke. Semester thesis, SwissFederal Institute of Technology (ETHZ), 2006.
[53] W. Malburg and H. Treiber. Solar reactor. Patent DE 2836179, 1980.
[54] V. K. Mathur, R. W. Breault, and S. M. Lakshmanan. Synthesis gasproduction by the solar gas process. Energy Progress, 2(2):91–95, 1982.
[55] V. K. Mathur, S. Lakshmanan, F. K. Manasse, V. Venkataramanan,and R. W. Breault. A continuous two stage solar coal gasificationsystem. AIChE Symposium Series, 77(210):47–54, 1981.
[56] J. Matsunami, S. Yoshida, Y. Oku, O. Yokota, O. Yokota, Y. Tamaura,and M. Kitamura. Coal gasification with CO2 in molten salt for solarthermal/chemical energy conversion. Energy, 25:71–79, 2000.
[57] M. Mentser and S. Ergun. A study of the carbon dioxide-carbon re-action by oxygen exchange. Technical report, U.S. Bureau of Mines,1973.
[58] M. Meyer and R. Rusch. Optimierung von Reaktor-Stromung und Ver-weilzeit. Semester thesis, ETH, 2004.

186 BIBLIOGRAPHY
[59] A. Morales, Y. Araujo, and E. Lima. In International Forum on Tech-nology for Heavy and Extra-Heavy Oil, Puerto La Cruz, Venezuela,2003.
[60] H. J. Muhlen. Zum Einfluss der Produktgase auf die Kinetik derWasserdampfvergasung in Abhangigkeit von Druck und Temperatur.PhD thesis, Universitat Essen (D), 1983.
[61] H. J. Muhlen. High temperature, high pressure thermogravimetry ofcoal gasification - apparatus, data acquisition and numerical evaluation.Thermochimica Acta, 103(1):163–168, 1986.
[62] H. J. Muhlen, K. H. v. Heek, and H. Juntgen. Kinetic studies of thesteam gasification of char in the presence of H2, CO2 and CO. Fuel,64(7):944–949, 1985.
[63] R. Muller, P. v. Zedtwitz, A. Wokaun, and A. Steinfeld. Kinetic in-vestigation on steam gasification of charcoal under direct high fluxirradiation. Chemical Engineering Science, 58(22):5111–5119, 2003.
[64] J. P. Murray and E. A. Fletcher. Reaction of steam with cellulose ina fluidized bed using concentrated sunlight. Energy, 19(10):1083–1098,1993.
[65] P. Ollero, A. Serrera, R. Arjona, and S. Alcantarilla. Diffusional ef-fects in TGA gasification experiments for kinetic determination. Fuel,81(15):1899–2017, 2002.
[66] S. V. Patankar. Numerical heat transfer and fluid flow. Series in Comp-tutational and physical processes in mechanics and thermal sciences.Taylor & Francis, Oxford, 1980.
[67] G. J. Pitt. The kinetics of the evolution of volatile products from coal.Fuel, 41:267–274, 1962.
[68] B. E. Poling, J. M. Prausnitz, and J. P. O’Connell. The properties ofgases and liquids. McGraw-Hill, New York, 5 edition, 2001.
[69] A. S. Qader. Solar heated fluidized bed gasification system. Patent US150115, 1980.
[70] A. E. Reif. The mechanism of the carbon dioxide-carbon reaction. JPhys Chem, 56:785–788, 1952.
BIBLIOGRAPHY 187
[71] J. Rezaiyan and N. P. Cheremisinoff. Gasification technologies. Taylor& Francis, Boca Raton FL, 2005.
[72] A. Roine. Outokumpu HSC chemistry for Windows, 1997.
[73] D. Ruthven, S. Farooq, and K. S. Knaebel. Pressure swing adsorption.Wiley, New York, 1993.
[74] D. H. Sauter. Coal. In B. Elvers and S. Hawkins, editors, Ullmann’sencyclopedia of industrial chemistry, volume A7, pages 153–197. VCHVerlagsgesellschaft, Weinheim, Germany, 1986.
[75] R. H. Schlosberg, editor. Chemistry of coal conversion. Plenum Press,New York, London, 1985.
[76] V. Seebauer, J. Petek, and G. Staudinger. Effects of particle size, heat-ing rate and pressure on measurement of pyrolysis kinetics by thermo-gravimetric analysis. Fuel, 76(13):1277–1282, 1997.
[77] R. Siegel and J. Howell. Thermal radiation heat transfer. Taylor &Francis, New York, 4th edition, 2002.
[78] J. M. Smith. Chemical engineering kinetics. McGraw-Hill, New York,3rd edition, 1981.
[79] J. G. Speight and B. Ozum. Petroleum refining processes. MarcelDekker, Inc, New York, 2002.
[80] W. A. Stahel. Statistische Datenanalyse. Vieweg, Braunschweig (D),2nd edition, 1999.
[81] A. Steinfeld. Solar hydrogen production via a 2-step water splittingthermochemical cycle based on Zn/ZnO redox reactions. InternationalJournal of Hydrogen Energy, 27(6):611–619, 2002.
[82] A. Steinfeld. Solar thermochemical production of hydrogen - a review.Solar Energy, 78(5):603–615, 2005.
[83] A. Steinfeld, M. Brack, A. Meier, A. Weidenkaff, and D. Wuillemin.A solar chemical reactor for co-production of zinc and synthesis gas.Energy, 23(10):803–814, 1998.
[84] A. Steinfeld and A. Meier. Solar fuels and materials. In C. J. Cleve-land, editor, Encyclopedial of Energy, volume 5, pages 623–637. ElsevierAcademic Press, Amsterdam, 2004.

188 BIBLIOGRAPHY
[85] A. Steinfeld and R. Palumbo. Solar thermochemical process technology.In R. A. Meyers, editor, Encyclopedia of Physical Science and Technol-ogy, volume 15, pages 237–256. Academic Press, San Diego CA, 3rdedition, 2001.
[86] G. J. Stiegel and R. C. Maxwell. Gasification technologies: the pathto clean, affordable energy in the 21st century. Fuel Processing Tech-nology, 71:79–97, 2001.
[87] K. M. Sundaram. Catalyst effectiveness factor for Langmuir-Hinshelwood-Hougen-Watson kinetic expressions. Chemical Engineer-ing Communications, 15(5-6):305–311, 1982.
[88] J. Szekely and J. W. Evans. A structural model for gas-solid reacttionswith a moving boundary. Chemical Engineering Science, 25(6):1091–1107, 1970.
[89] J. Szekely and J. W. Evans. A structural model for gas-solid reac-tions with a moving boundary - II. Chemical Engineering Science,26(4):1901–1913, 1971.
[90] R. W. Taylor, R. Berjoan, and J. P. Coutures. Solar gasification ofcarbonaceous materials. Solar Energy, 30(6):513–525, 1983.
[91] H. R. Tschudi and G. Morian. Pyrometric temperature measurementsin solar furnaces. Jornal of Solar Energy Engineering, 123(2):164–170,2001.
[92] C. Ulloa, A. L. Gordon, and X. Garcıa. Distribution of activationenergy model applied to the rapid pyrolysis of coal blends. Journal ofAnalytical and Applied Pyrolysis, 71(2):465–483, 2004.
[93] E. T. v. d. Laan. Notes on the diffusion-type model for the longitudinalmixing in flow. Chemical Engineering Science, 7(3):187–191, 1958.
[94] P. v. Zedtwitz, J. Petrasch, D. Trommer, and A. Steinfeld. Hydrogenproduction via the solar thermal decarbonization of fossil fuels. SolarEnergy, 2005.
[95] P. v. Zedtwitz and A. Steinfeld. The solar thermal gasification of coal- energy conversion efficiency and CO2 mitigation potential. Energy,28(5):441–456, 2003.
[96] D. Vamvuka. Gasification of coal. Energy Exploration and Exploitation,17(6):515–581, 1999.
BIBLIOGRAPHY 189
[97] S. M. Walas. Reaction kinetics for chemical engineers. Butterworths,Boston, 1989.
[98] J. R. Welty. Fundamentals of momentum, heat and mass transfer.Wiley, New York, 4 edition, 2001.
[99] C. Y. Wen. Noncatalytic heterogeneous solid fluid reaction models.Industrial & Engineering Chemistry, 60(9):34–54, 1968.
[100] A. Z’Graggen. Static Monte-Carlo simulation of the SynPet solar re-actor. personal communication, 2006.
[101] A. Z’Graggen, P. Haueter, G. Maag, A. Vidal, and M. Romero. Hy-drogen production by steam gasification of petroleum coke using con-centrated solar power - reactor experimentation with slurry feeding. InR. Campbell-Howe, editor, Solar 2006, Denver, CO, 2006.
[102] A. Z’Graggen, P. Haueter, D. Trommer, M. Romero, J. C. d. Jesus, andA. Steinfeld. Hydrogen production by steam-gasification of petroleumcoke using concentrated solar power - II. reactor design, testing andmodeling. International Journal of Hydrogen Energy, 31(6):797–811,2006.
[103] A. Z’Graggen and A. Steinfeld. A two-phase reactor model for thesteam gasification of carbonaceous materials under concentrated ther-mal radiation. Chemical Engineering & Processing, submitted, 2007.

190 BIBLIOGRAPHY

Curriculum vitae
Name Dominic TrommerNationality SwissCitizen of Ramsen (SH)Date of birth December 17, 1977
6/2002 - today Doctoral study entitled ‘Solar thermal gasification ofpetroleum coke’ at the professorship for renewable en-ergy carriers, ETH Zurich.
10/2001 - 4/2002 Master thesis entitled ‘Solar thermal decarbonization ofmethane’ at the professorship for renewable energy car-riers, ETH Zurich.
10/1997 - 4/2002 Studies in chemical engineering at the department ofchemistry, ETH Zurich.
1997 Internship (3 months) at Prantner Verfahrenstechnik inReutlingen, Germany. Treatment of off-gas, water andsoil for environmental remediation.
1990 - 1997 Matura type B (grammar school) at the RealgymnasiumRamibuhl in Zurich.
191