thermal expansion of thermoelectric type-i-clathrates
TRANSCRIPT
Thermal expansion of thermoelectric type-I-clathratesM. Falmbigl,1 G. Rogl,1 P. Rogl,1,a� M. Kriegisch,2 H. Müller,2 E. Bauer,2 M. Reinecker,3
and W. Schranz3
1Institute of Physical Chemistry, University of Vienna, Währingerstrasse 42, A-1090 Wien, Austria2Institute of Solid State Physics, TU Vienna, Wiedner Hauptstrasse 8-10, A-1040 Wien, Austria3Physics of Functional Materials, University of Vienna, Boltzmanngasse 5, A-1090 Wien, Austria
�Received 12 April 2010; accepted 17 June 2010; published online 31 August 2010�
Thermal expansion was determined for two series of ternary compounds, Ba8MxGe46−x andBa8MxSi46−x, with M=Cu, Zn, Pd, Ag, Cd, Pt, and Au and for several quaternary compounds forwhich we investigated the influence of substitution by Zn/Ni in Ba8ZnxGe46−x as well as thedependence of thermal expansion on the Si/Ge ratio in Ba8Cu5SixGe41−x. In the temperature rangefrom 4.2 to 300 K the thermal expansion of all ternary compounds was measured with a capacitancedilatometer, whereas from 300 to 700 K for several selected samples a dynamic mechanical analyzerwas employed. The low temperature data compare well with the lattice parameters of single crystals,gained from measurements at three different temperatures �100, 200, and 300 K�. For a quantitativedescription of thermal expansion the semiclassical model of Mukherjee et al. �Phys. Rev. Lett. 76,1876 �1996�� was used, which also provided reliable accurate values of the Debye and Einsteintemperatures. Results in this respect show good agreement with the corresponding data derived fromtemperature dependent x-ray diffraction and specific heat measurements. Furthermore the presentpaper is a comprehensive collection and discussion of all thermal expansion data of intermetallictype-I-clathrate materials so far available in the literature including our results of thermal expansionmeasurements of the Ge- and Si-based type-I-clathrates listed above. © 2010 American Institute ofPhysics. �doi:10.1063/1.3465637�
I. INTRODUCTION
Since the development of the phonon glass-electroncrystal concept by Slack1 in 1995 the interest on the appli-cation of inclusion compounds as thermoelectric �TE� mate-rials significantly increased. Among high efficiency TE gen-erator materials, skutterudites, and intermetallic clathratesare most promising candidates. Besides the TE figure ofmerit ZT=S2T /�� �here S is the Seebeck coefficient, T is thetemperature, � is the electrical resistivity, and � is the ther-mal conductivity�, which is the most important characteristicof such materials, mechanical properties and thermal expan-sion are equally important parameters affecting the applica-bility in TE generator devices. To warrant a flawless long-term and cyclic temperature performance of TE devices thethermal expansion of p- and n-legs and of the metal elec-trodes should not differ substantially.
To summarize all data available so far on the thermalexpansion of clathrate-I compounds we performed a litera-ture search up to 2010 in two electronic libraries, namelychemical abstracts service and INSPEC �ISI Web of Knowl-edge�. Besides the publications, in which thermal expansioncoefficients were directly reported, thermal expansion forvarious cases was derived from temperature dependent lat-tice parameters.
II. EXPERIMENTAL DETAILS
Samples of the series Ba8MxGe46−x and Ba8MxSi46−x
with M=Zn and Cd and the two novel clathrate compounds
with nominal composition Ba8NiZn6.6Ge38.4 andBa8NiZn7Ge38 were prepared from elemental ingots bymelting/reaction in vacuum-sealed quartz tubes. For furtherdetails see Refs. 2–5. The samples Ba8Zn7Si39,Ba8NiZn6.6Ge38.4, and Ba8NiZn7Ge38 were hot pressed in agraphite die at 800 or 600 °C at a pressure of 56 MPa and
a�Electronic mail: [email protected].
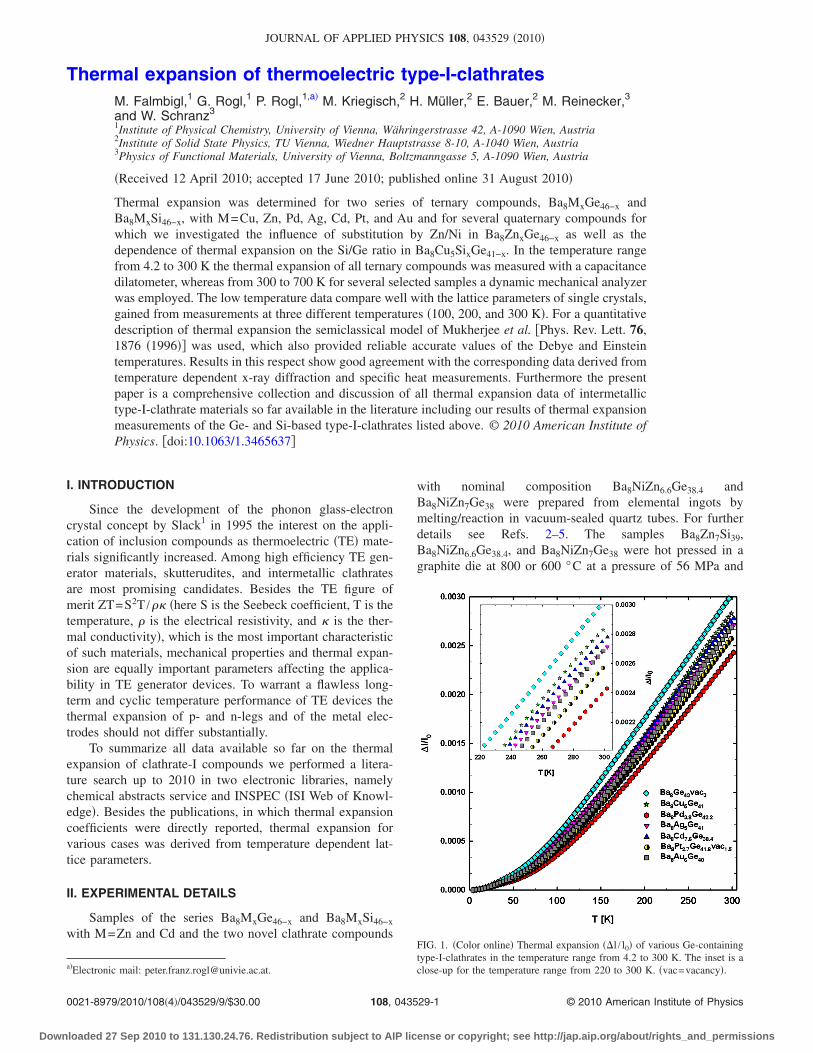
FIG. 1. �Color online� Thermal expansion ��l / l0� of various Ge-containingtype-I-clathrates in the temperature range from 4.2 to 300 K. The inset is aclose-up for the temperature range from 220 to 300 K. �vac=vacancy�.
JOURNAL OF APPLIED PHYSICS 108, 043529 �2010�
0021-8979/2010/108�4�/043529/9/$30.00 © 2010 American Institute of Physics108, 043529-1
Downloaded 27 Sep 2010 to 131.130.24.76. Redistribution subject to AIP license or copyright; see http://jap.aip.org/about/rights_and_permissions
afterwards annealed in a vacuum-sealed quartz tube �for fur-ther details see Refs. 4 and 5�. All alloy specimensBa8MxGe46−x and Ba8MxSi46−x �M=Cu, Pd, Ag, Au, and Pt�were synthesized from elemental ingots by argon arc meltingfollowed by heat treatment in vacuum-sealed quartztubes.6–10 After the heat treatment Ba8NiZn6.6Ge38.4,Ba8NiZn7Ge38, and the Ag- and Au-containing samples were
ball-milled in a planetary mill �Fritsch Pulverisette� and hotpressed applying a pressure of 56 MPa �Ge-containingsamples at 700 °C and Si-containing samples at 800 °C�.Single crystals of the samples Ba8Cu5SixGe41−x with x=6,18, and 41 were obtained by mechanical fragmentation ofalloys melted in a high frequency furnace and annealed invacuum-sealed quartz tubes at 800 °C for one month.11
Phase purity of all samples was checked by electron probemicroanalysis and XPD �x-ray powder diffraction Rietveldrefinement using the program FULLPROF �Ref. 12��. Preciselattice parameters at room temperature were obtained fromGuinier x-ray diffraction data, applying Cu K�1 radiation andusing Ge or Si as an internal standard. Only a few samplesshowed small amounts of impurity phases of less than 2mass %.
Thermal expansion measurements in the range from 4.2to 300 K were performed using a miniature capacitancedilatometer, based on the tilted plate technique. A detaileddescription of this instrument can be found in Ref. 13. Thethermal expansion in the temperature range from 300 to 700K was measured using a dynamic mechanical analyzer
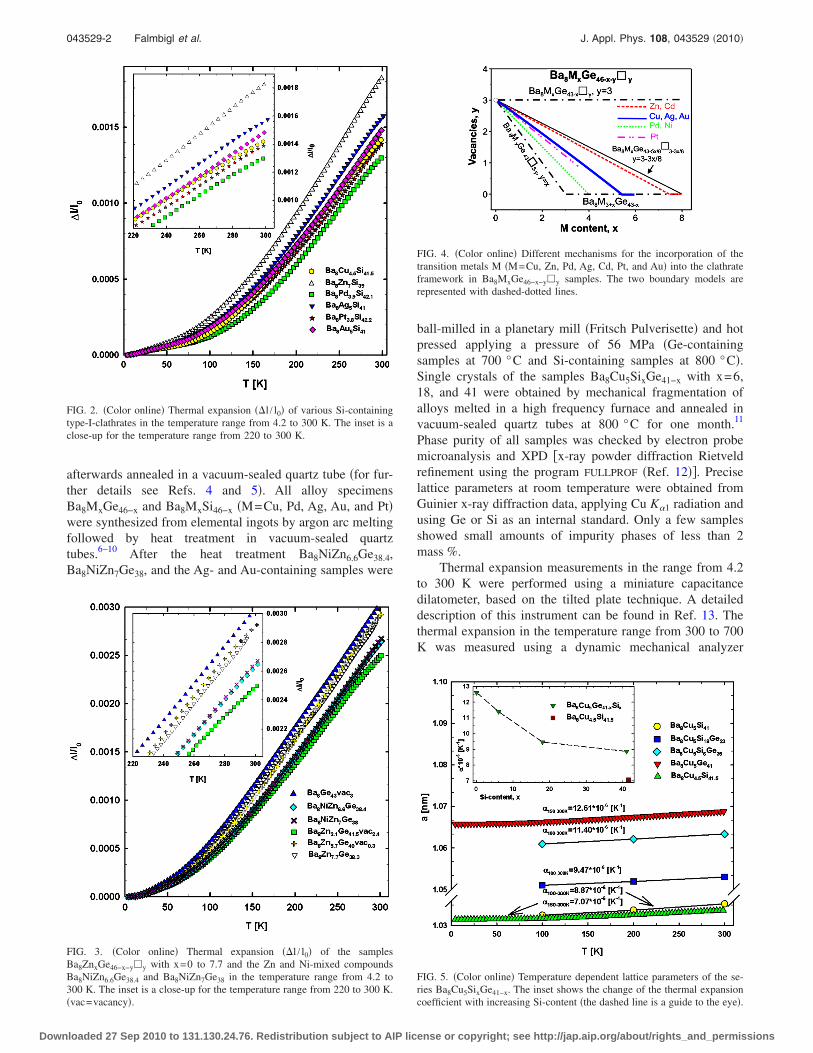
FIG. 2. �Color online� Thermal expansion ��l / l0� of various Si-containingtype-I-clathrates in the temperature range from 4.2 to 300 K. The inset is aclose-up for the temperature range from 220 to 300 K.
FIG. 3. �Color online� Thermal expansion ��l / l0� of the samplesBa8ZnxGe46−x−y�y with x=0 to 7.7 and the Zn and Ni-mixed compoundsBa8NiZn6.6Ge38.4 and Ba8NiZn7Ge38 in the temperature range from 4.2 to300 K. The inset is a close-up for the temperature range from 220 to 300 K.�vac=vacancy�.
FIG. 4. �Color online� Different mechanisms for the incorporation of thetransition metals M �M=Cu, Zn, Pd, Ag, Cd, Pt, and Au� into the clathrateframework in Ba8MxGe46−x−y�y samples. The two boundary models arerepresented with dashed-dotted lines.
FIG. 5. �Color online� Temperature dependent lattice parameters of the se-ries Ba8Cu5SixGe41−x. The inset shows the change of the thermal expansioncoefficient with increasing Si-content �the dashed line is a guide to the eye�.
043529-2 Falmbigl et al. J. Appl. Phys. 108, 043529 �2010�
Downloaded 27 Sep 2010 to 131.130.24.76. Redistribution subject to AIP license or copyright; see http://jap.aip.org/about/rights_and_permissions
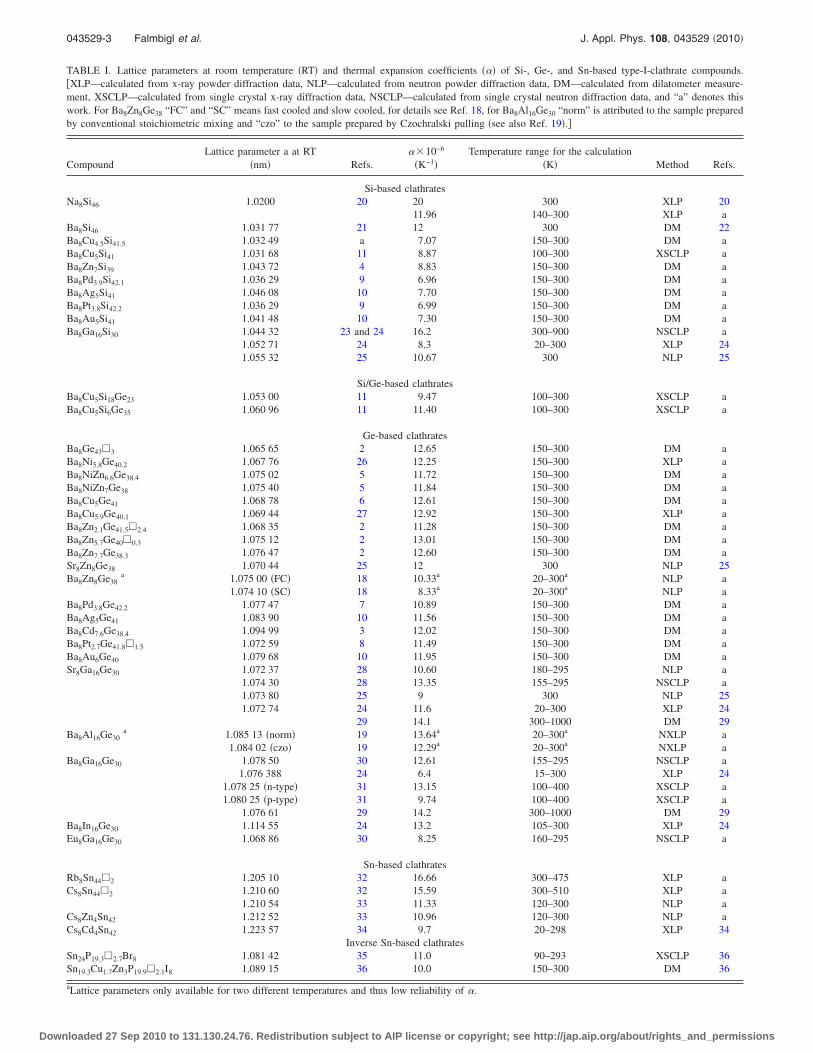
TABLE I. Lattice parameters at room temperature �RT� and thermal expansion coefficients ��� of Si-, Ge-, and Sn-based type-I-clathrate compounds.�XLP––calculated from x-ray powder diffraction data, NLP––calculated from neutron powder diffraction data, DM––calculated from dilatometer measure-ment, XSCLP––calculated from single crystal x-ray diffraction data, NSCLP––calculated from single crystal neutron diffraction data, and “a” denotes thiswork. For Ba8Zn8Ge38 “FC” and “SC” means fast cooled and slow cooled, for details see Ref. 18, for Ba8Al16Ge30 “norm” is attributed to the sample preparedby conventional stoichiometric mixing and “czo” to the sample prepared by Czochralski pulling �see also Ref. 19�.�
CompoundLattice parameter a at RT
�nm� Refs.��10−6
�K−1�Temperature range for the calculation
�K� Method Refs.
Si-based clathratesNa8Si46 1.0200 20 20 300 XLP 20
11.96 140–300 XLP aBa8Si46 1.031 77 21 12 300 DM 22Ba8Cu4.5Si41.5 1.032 49 a 7.07 150–300 DM aBa8Cu5Si41 1.031 68 11 8.87 100–300 XSCLP aBa8Zn7Si39 1.043 72 4 8.83 150–300 DM aBa8Pd3.9Si42.1 1.036 29 9 6.96 150–300 DM aBa8Ag5Si41 1.046 08 10 7.70 150–300 DM aBa8Pt3.8Si42.2 1.036 29 9 6.99 150–300 DM aBa8Au5Si41 1.041 48 10 7.30 150–300 DM aBa8Ga16Si30 1.044 32 23 and 24 16.2 300–900 NSCLP a
1.052 71 24 8.3 20–300 XLP 241.055 32 25 10.67 300 NLP 25
Si/Ge-based clathratesBa8Cu5Si18Ge23 1.053 00 11 9.47 100–300 XSCLP aBa8Cu5Si6Ge35 1.060 96 11 11.40 100–300 XSCLP a
Ge-based clathratesBa8Ge43�3 1.065 65 2 12.65 150–300 DM aBa8Ni5.8Ge40.2 1.067 76 26 12.25 150–300 XLP aBa8NiZn6.6Ge38.4 1.075 02 5 11.72 150–300 DM aBa8NiZn7Ge38 1.075 40 5 11.84 150–300 DM aBa8Cu5Ge41 1.068 78 6 12.61 150–300 DM aBa8Cu5.9Ge40.1 1.069 44 27 12.92 150–300 XLP aBa8Zn2.1Ge41.5�2.4 1.068 35 2 11.28 150–300 DM aBa8Zn5.7Ge40�0.3 1.075 12 2 13.01 150–300 DM aBa8Zn7.7Ge38.3 1.076 47 2 12.60 150–300 DM aSr8Zn8Ge38 1.070 44 25 12 300 NLP 25Ba8Zn8Ge38
a 1.075 00 �FC� 18 10.33a 20–300a NLP a1.074 10 �SC� 18 8.33a 20–300a NLP a
Ba8Pd3.8Ge42.2 1.077 47 7 10.89 150–300 DM aBa8Ag5Ge41 1.083 90 10 11.56 150–300 DM aBa8Cd7.6Ge38.4 1.094 99 3 12.02 150–300 DM aBa8Pt2.7Ge41.8�1.5 1.072 59 8 11.49 150–300 DM aBa8Au6Ge40 1.079 68 10 11.95 150–300 DM aSr8Ga16Ge30 1.072 37 28 10.60 180–295 NLP a
1.074 30 28 13.35 155–295 NSCLP a1.073 80 25 9 300 NLP 251.072 74 24 11.6 20–300 XLP 24
29 14.1 300–1000 DM 29Ba8Al16Ge30
a 1.085 13 �norm� 19 13.64a 20–300a NXLP a1.084 02 �czo� 19 12.29a 20–300a NXLP a
Ba8Ga16Ge30 1.078 50 30 12.61 155–295 NSCLP a1.076 388 24 6.4 15–300 XLP 24
1.078 25 �n-type� 31 13.15 100–400 XSCLP a1.080 25 �p-type� 31 9.74 100–400 XSCLP a
1.076 61 29 14.2 300–1000 DM 29Ba8In16Ge30 1.114 55 24 13.2 105–300 XLP 24Eu8Ga16Ge30 1.068 86 30 8.25 160–295 NSCLP a
Sn-based clathratesRb8Sn44�2 1.205 10 32 16.66 300–475 XLP aCs8Sn44�2 1.210 60 32 15.59 300–510 XLP a
1.210 54 33 11.33 120–300 NLP aCs8Zn4Sn42 1.212 52 33 10.96 120–300 NLP aCs8Cd4Sn42 1.223 57 34 9.7 20–298 XLP 34
Inverse Sn-based clathratesSn24P19.3�2.7Br8 1.081 42 35 11.0 90–293 XSCLP 36Sn19.3Cu1.7Zn3P19.9�2.1I8 1.089 15 36 10.0 150–300 DM 36
aLattice parameters only available for two different temperatures and thus low reliability of �.
043529-3 Falmbigl et al. J. Appl. Phys. 108, 043529 �2010�
Downloaded 27 Sep 2010 to 131.130.24.76. Redistribution subject to AIP license or copyright; see http://jap.aip.org/about/rights_and_permissions
DMA7 of Perkin Elmer Inc. A quartz rod is positioned on topof the parallelepiped-shaped sample and data are acquiredusing the thermodilatometric analysis �TDA�. This method isoften referred to as zero force thermomechanical analysis.During the TDA-measurement the length change of thesample caused by a temperature change is recorded via elec-tromagnetic inductive coupling without using any force. Theresolution of the length change achieved by the TDA methodis better than 10 nm.14–17 The resolution of the tilted platecapacitance dilatometer is 1�10−7 in �l / l0. The error bar forthe data gained from low temperature capacitance measure-ments is smaller than 3%. The reproducibility between twomeasurements is in the same range. Thermal expansion ofthe samples Ba8Cu5SixGe41−x was extracted from the latticeparameters of single crystal measurements at 100, 200, and300 K.
III. RESULTS AND DISCUSSION
Figures 1–3 show the thermal expansion ��l / l0� of allsamples measured with the capacitance dilatometer in thetemperature range 4.2–300 K. The �l / l0 values for bothgroups of compounds, Ge- and Si-based clathrates, increasealmost linearly with temperature from 150 to 300 K. Ge-based clathrates show a significantly larger thermal expan-sion as compared to the Si-compounds indicating strongSi–Si bonds in the framework. With a rather high lengthchange of 0.18% the values for Ba8Zn7Si39 deviate from thegeneral behavior of the Si-based clathrates characterized by atotal length change of �0.15% �see Fig. 2�. In both series thePd- and Pt-containing samples exhibit the smallest thermalexpansion. This behavior may be correlated with the distincttendency of these transition elements �Pd, Pt� to fill the va-cant 6d-positions of the binary Ba8�3Ge43 framework ��stands for a vacancy� before substituting for the group-IV-element in the 24 k-position �see Fig. 4�. Approaching the
end of the d-electron series this tendency fades and in case ofthe Zn- and Cd-containing compounds both mechanisms,filling of vacancies and framework substitution, are contrib-uting in almost equal parts.
Figure 3 compares the thermal expansion of the alloysBa8ZnxGe46−x−y�y �x=2.1, 5.7, and 7.7� to Ba8Ge43�3 andto two novel clathrate compounds with two different transi-tion metals substituting for Ge, Ba8NiZn6.6Ge38.4, andBa8NiZn7Ge38. It seems that two counteracting effects gov-
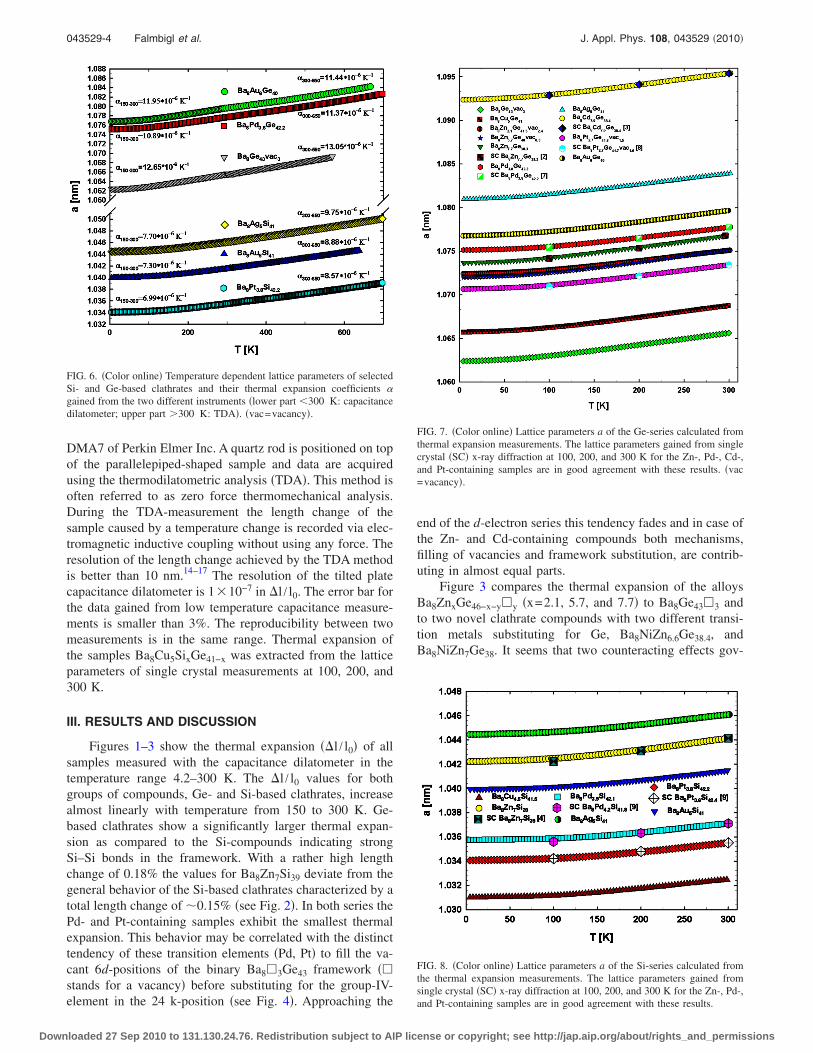
FIG. 6. �Color online� Temperature dependent lattice parameters of selectedSi- and Ge-based clathrates and their thermal expansion coefficients �gained from the two different instruments �lower part �300 K: capacitancedilatometer; upper part �300 K: TDA�. �vac=vacancy�.
FIG. 7. �Color online� Lattice parameters a of the Ge-series calculated fromthermal expansion measurements. The lattice parameters gained from singlecrystal �SC� x-ray diffraction at 100, 200, and 300 K for the Zn-, Pd-, Cd-,and Pt-containing samples are in good agreement with these results. �vac=vacancy�.
FIG. 8. �Color online� Lattice parameters a of the Si-series calculated fromthe thermal expansion measurements. The lattice parameters gained fromsingle crystal �SC� x-ray diffraction at 100, 200, and 300 K for the Zn-, Pd-,and Pt-containing samples are in good agreement with these results.
043529-4 Falmbigl et al. J. Appl. Phys. 108, 043529 �2010�
Downloaded 27 Sep 2010 to 131.130.24.76. Redistribution subject to AIP license or copyright; see http://jap.aip.org/about/rights_and_permissions
ern the Zn-substituted clathrates. The observation, thatBa8Ge43�3 exhibits the highest thermal expansion, can beexplained by the decrease in the average bonding strengthamong the framework building atoms caused by the threevacancies per unit cell. The reduction in the vacancy level bysmall Zn-contents �Ba8Zn2.1Ge41.5�2.4� drastically reducesthermal expansion, while higher Zn-levels, i.e., higheramounts of Zn replacing Ge-framework atoms although si-multaneously and gradually filling the remaining vacanciestend to revert to higher length changes as observed forBa8Zn7.7Ge38.3 and Ba8Zn5.7Ge40�0.3. Interestingly, addi-tional substitution of Ge by Ni significantly lowers the ther-mal expansion by 5% to 10% of the total length change.
In accordance with strong Si–Si bonds in the frameworkan increasing Si-content significantly decreases the thermalexpansion for the series Ba8Cu5SixGe41−x with x=0, 6, 18,and 41 �see Fig. 5�.
Table I summarizes the linear thermal expansion coeffi-cients for all measured samples in comparison to literaturedata. Linear thermal expansion coefficients are calculated forthe temperature region from 150 to 300 K according to thetemperature derivative of the length change, i.e.,
� = � ��l
�T�1
l, �1�
where T is the temperature and l is the length of the sample.In general, the linear thermal expansion coefficients of
the alloys determined within this work differ significantlybetween the Ge- and Si-series, but data from the literatureshow a wide scatter even for samples with the same nominalcomposition. This can be attributed to the fact, that theselinear thermal expansion coefficients were extracted out ofdifferent temperature ranges as well as different measuringtechniques. For example, the evaluation of the data forSr8Ga16Ge30, as presented in Ref. 28, demonstrates that �varies strongly when lattice parameters are taken either frompowder neutron diffraction or single crystal neutron diffrac-tion. For Ba8ZnxGe46−x−y�y we found that also slight differ-ences in the composition can lead to a change in thermalexpansion. In case of the Sn-based clathrates the values of �change dramatically from high temperature data to low tem-perature data. The thermal expansion coefficients of the in-verse Sn-clathrates compare well with the values of thepolyanionic Sn-containing compounds gained from measure-ments below 300 K.
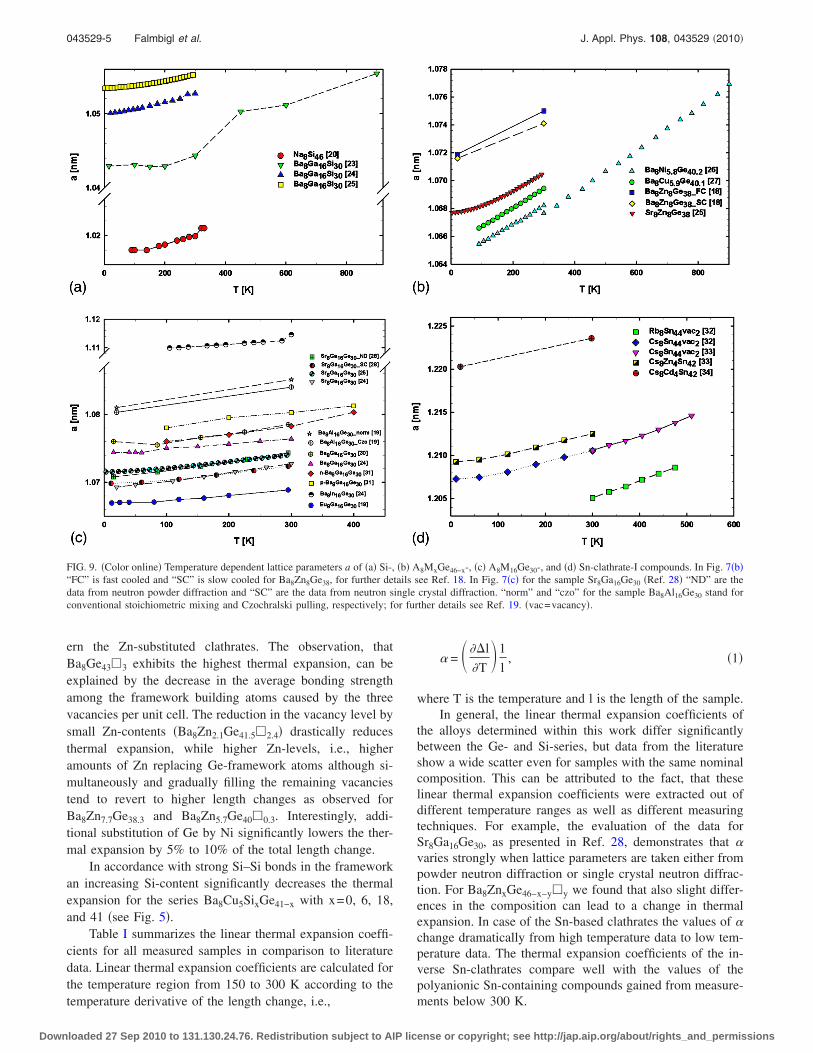
FIG. 9. �Color online� Temperature dependent lattice parameters a of �a� Si-, �b� A8MxGe46−x-, �c� A8M16Ge30-, and �d� Sn-clathrate-I compounds. In Fig. 7�b�“FC” is fast cooled and “SC” is slow cooled for Ba8Zn8Ge38, for further details see Ref. 18. In Fig. 7�c� for the sample Sr8Ga16Ge30 �Ref. 28� “ND” are thedata from neutron powder diffraction and “SC” are the data from neutron single crystal diffraction. “norm” and “czo” for the sample Ba8Al16Ge30 stand forconventional stoichiometric mixing and Czochralski pulling, respectively; for further details see Ref. 19. �vac=vacancy�.
043529-5 Falmbigl et al. J. Appl. Phys. 108, 043529 �2010�
Downloaded 27 Sep 2010 to 131.130.24.76. Redistribution subject to AIP license or copyright; see http://jap.aip.org/about/rights_and_permissions
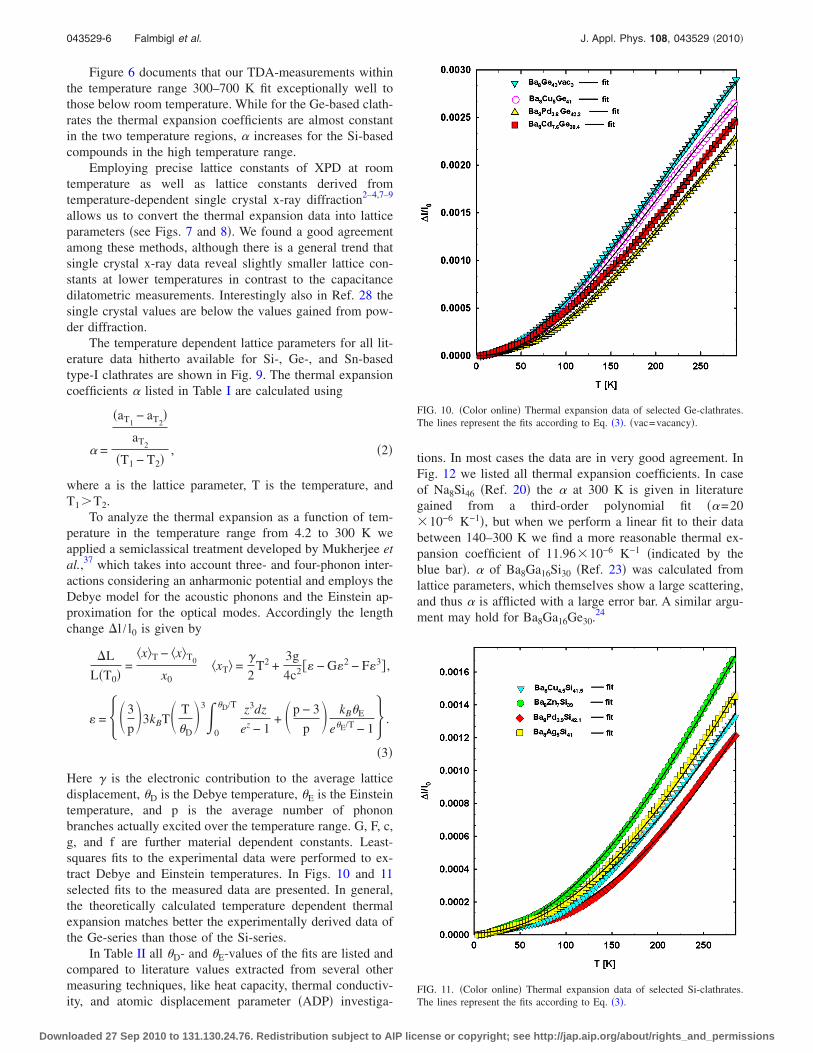
Figure 6 documents that our TDA-measurements withinthe temperature range 300–700 K fit exceptionally well tothose below room temperature. While for the Ge-based clath-rates the thermal expansion coefficients are almost constantin the two temperature regions, � increases for the Si-basedcompounds in the high temperature range.
Employing precise lattice constants of XPD at roomtemperature as well as lattice constants derived fromtemperature-dependent single crystal x-ray diffraction2–4,7–9
allows us to convert the thermal expansion data into latticeparameters �see Figs. 7 and 8�. We found a good agreementamong these methods, although there is a general trend thatsingle crystal x-ray data reveal slightly smaller lattice con-stants at lower temperatures in contrast to the capacitancedilatometric measurements. Interestingly also in Ref. 28 thesingle crystal values are below the values gained from pow-der diffraction.
The temperature dependent lattice parameters for all lit-erature data hitherto available for Si-, Ge-, and Sn-basedtype-I clathrates are shown in Fig. 9. The thermal expansioncoefficients � listed in Table I are calculated using
� =
�aT1− aT2
�
aT2
�T1 − T2�, �2�
where a is the lattice parameter, T is the temperature, andT1�T2.
To analyze the thermal expansion as a function of tem-perature in the temperature range from 4.2 to 300 K weapplied a semiclassical treatment developed by Mukherjee etal.,37 which takes into account three- and four-phonon inter-actions considering an anharmonic potential and employs theDebye model for the acoustic phonons and the Einstein ap-proximation for the optical modes. Accordingly the lengthchange �l / l0 is given by
�L
L�T0�=
xT − xT0
x0xT =
2T2 +
3g
4c2 � − G2 − F3� ,
= ��3
p�3kBT� T
�D�3�
0
�D/T z3dz
ez − 1+ �p − 3
p� kB�E
e�E/T − 1 .
�3�
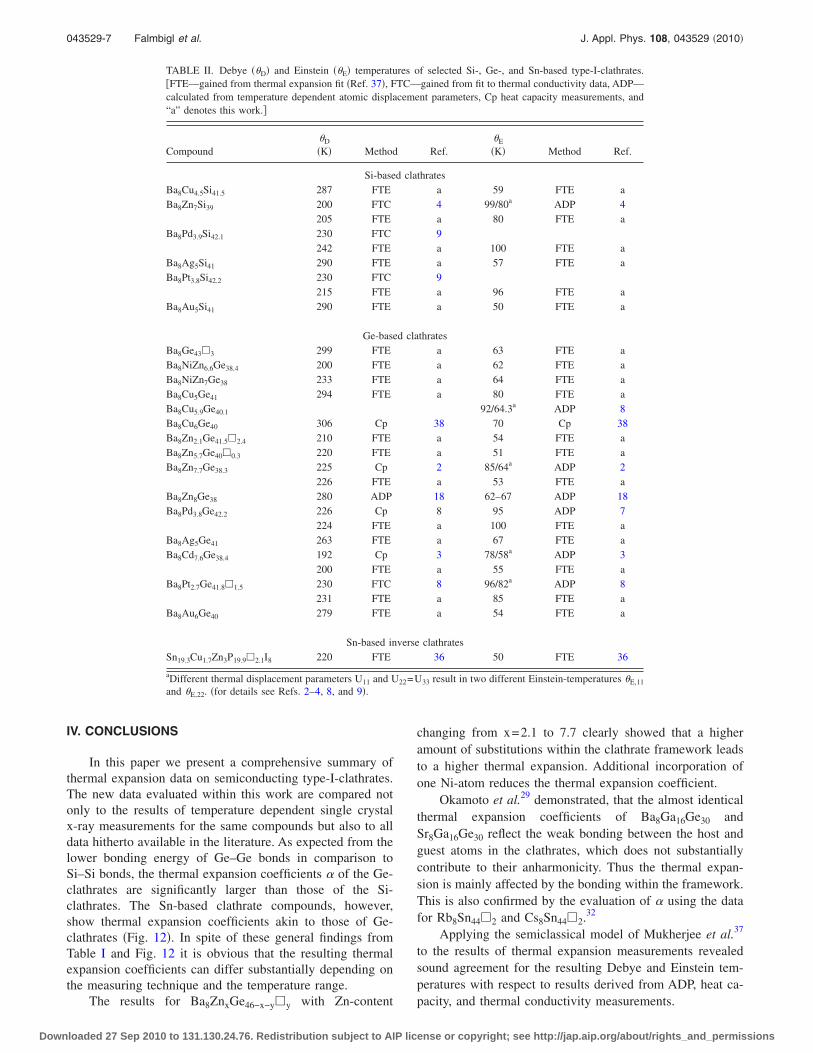
Here is the electronic contribution to the average latticedisplacement, �D is the Debye temperature, �E is the Einsteintemperature, and p is the average number of phononbranches actually excited over the temperature range. G, F, c,g, and f are further material dependent constants. Least-squares fits to the experimental data were performed to ex-tract Debye and Einstein temperatures. In Figs. 10 and 11selected fits to the measured data are presented. In general,the theoretically calculated temperature dependent thermalexpansion matches better the experimentally derived data ofthe Ge-series than those of the Si-series.
In Table II all �D- and �E-values of the fits are listed andcompared to literature values extracted from several othermeasuring techniques, like heat capacity, thermal conductiv-ity, and atomic displacement parameter �ADP� investiga-
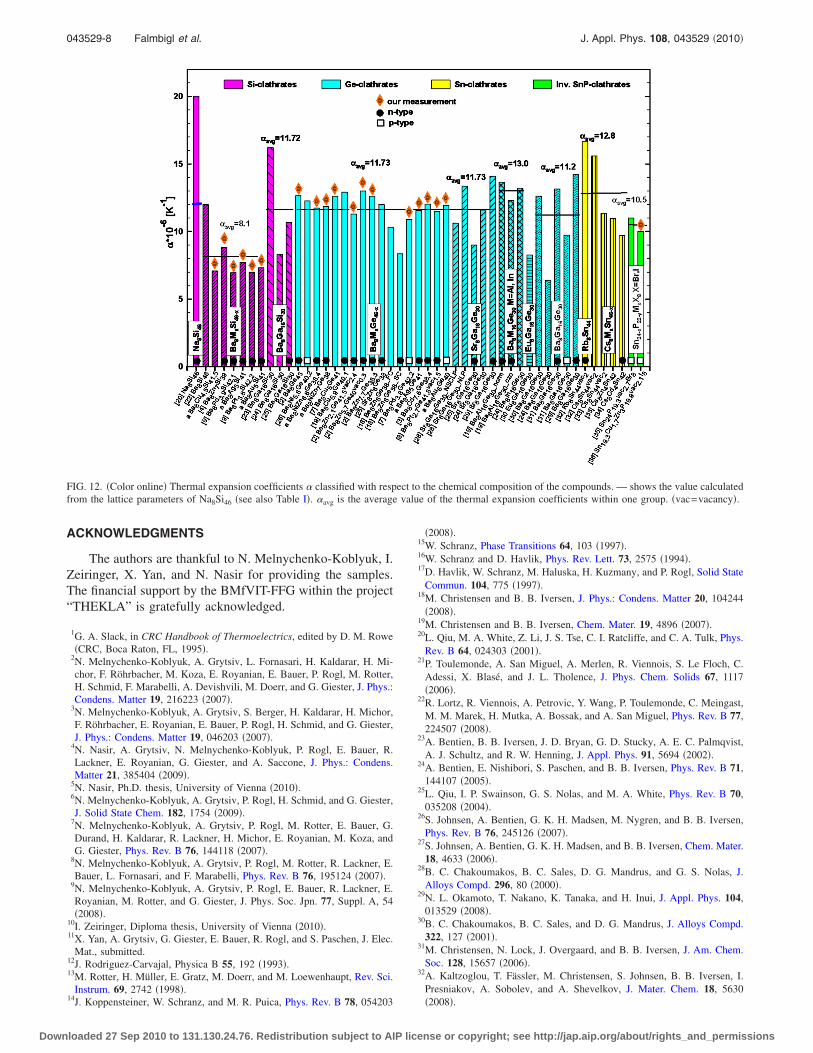
tions. In most cases the data are in very good agreement. InFig. 12 we listed all thermal expansion coefficients. In caseof Na8Si46 �Ref. 20� the � at 300 K is given in literaturegained from a third-order polynomial fit ��=20�10−6 K−1�, but when we perform a linear fit to their databetween 140–300 K we find a more reasonable thermal ex-pansion coefficient of 11.96�10−6 K−1 �indicated by theblue bar�. � of Ba8Ga16Si30 �Ref. 23� was calculated fromlattice parameters, which themselves show a large scattering,and thus � is afflicted with a large error bar. A similar argu-ment may hold for Ba8Ga16Ge30.
24
FIG. 10. �Color online� Thermal expansion data of selected Ge-clathrates.The lines represent the fits according to Eq. �3�. �vac=vacancy�.
FIG. 11. �Color online� Thermal expansion data of selected Si-clathrates.The lines represent the fits according to Eq. �3�.
043529-6 Falmbigl et al. J. Appl. Phys. 108, 043529 �2010�
Downloaded 27 Sep 2010 to 131.130.24.76. Redistribution subject to AIP license or copyright; see http://jap.aip.org/about/rights_and_permissions
IV. CONCLUSIONS
In this paper we present a comprehensive summary ofthermal expansion data on semiconducting type-I-clathrates.The new data evaluated within this work are compared notonly to the results of temperature dependent single crystalx-ray measurements for the same compounds but also to alldata hitherto available in the literature. As expected from thelower bonding energy of Ge–Ge bonds in comparison toSi–Si bonds, the thermal expansion coefficients � of the Ge-clathrates are significantly larger than those of the Si-clathrates. The Sn-based clathrate compounds, however,show thermal expansion coefficients akin to those of Ge-clathrates �Fig. 12�. In spite of these general findings fromTable I and Fig. 12 it is obvious that the resulting thermalexpansion coefficients can differ substantially depending onthe measuring technique and the temperature range.
The results for Ba8ZnxGe46−x−y�y with Zn-content
changing from x=2.1 to 7.7 clearly showed that a higheramount of substitutions within the clathrate framework leadsto a higher thermal expansion. Additional incorporation ofone Ni-atom reduces the thermal expansion coefficient.
Okamoto et al.29 demonstrated, that the almost identicalthermal expansion coefficients of Ba8Ga16Ge30 andSr8Ga16Ge30 reflect the weak bonding between the host andguest atoms in the clathrates, which does not substantiallycontribute to their anharmonicity. Thus the thermal expan-sion is mainly affected by the bonding within the framework.This is also confirmed by the evaluation of � using the datafor Rb8Sn44�2 and Cs8Sn44�2.32
Applying the semiclassical model of Mukherjee et al.37
to the results of thermal expansion measurements revealedsound agreement for the resulting Debye and Einstein tem-peratures with respect to results derived from ADP, heat ca-pacity, and thermal conductivity measurements.
TABLE II. Debye ��D� and Einstein ��E� temperatures of selected Si-, Ge-, and Sn-based type-I-clathrates.�FTE––gained from thermal expansion fit �Ref. 37�, FTC––gained from fit to thermal conductivity data, ADP––calculated from temperature dependent atomic displacement parameters, Cp heat capacity measurements, and“a” denotes this work.�
Compound�D
�K� Method Ref.�E
�K� Method Ref.
Si-based clathratesBa8Cu4.5Si41.5 287 FTE a 59 FTE aBa8Zn7Si39 200 FTC 4 99/80a ADP 4
205 FTE a 80 FTE aBa8Pd3.9Si42.1 230 FTC 9
242 FTE a 100 FTE aBa8Ag5Si41 290 FTE a 57 FTE aBa8Pt3.8Si42.2 230 FTC 9
215 FTE a 96 FTE aBa8Au5Si41 290 FTE a 50 FTE a
Ge-based clathratesBa8Ge43�3 299 FTE a 63 FTE aBa8NiZn6.6Ge38.4 200 FTE a 62 FTE aBa8NiZn7Ge38 233 FTE a 64 FTE aBa8Cu5Ge41 294 FTE a 80 FTE aBa8Cu5.9Ge40.1 92/64.3a ADP 8Ba8Cu6Ge40 306 Cp 38 70 Cp 38Ba8Zn2.1Ge41.5�2.4 210 FTE a 54 FTE aBa8Zn5.7Ge40�0.3 220 FTE a 51 FTE aBa8Zn7.7Ge38.3 225 Cp 2 85/64a ADP 2
226 FTE a 53 FTE aBa8Zn8Ge38 280 ADP 18 62–67 ADP 18Ba8Pd3.8Ge42.2 226 Cp 8 95 ADP 7
224 FTE a 100 FTE aBa8Ag5Ge41 263 FTE a 67 FTE aBa8Cd7.6Ge38.4 192 Cp 3 78/58a ADP 3
200 FTE a 55 FTE aBa8Pt2.7Ge41.8�1.5 230 FTC 8 96/82a ADP 8
231 FTE a 85 FTE aBa8Au6Ge40 279 FTE a 54 FTE a
Sn-based inverse clathratesSn19.3Cu1.7Zn3P19.9�2.1I8 220 FTE 36 50 FTE 36
aDifferent thermal displacement parameters U11 and U22=U33 result in two different Einstein-temperatures �E,11
and �E,22. �for details see Refs. 2–4, 8, and 9�.
043529-7 Falmbigl et al. J. Appl. Phys. 108, 043529 �2010�
Downloaded 27 Sep 2010 to 131.130.24.76. Redistribution subject to AIP license or copyright; see http://jap.aip.org/about/rights_and_permissions
ACKNOWLEDGMENTS
The authors are thankful to N. Melnychenko-Koblyuk, I.Zeiringer, X. Yan, and N. Nasir for providing the samples.The financial support by the BMfVIT-FFG within the project“THEKLA” is gratefully acknowledged.
1G. A. Slack, in CRC Handbook of Thermoelectrics, edited by D. M. Rowe�CRC, Boca Raton, FL, 1995�.
2N. Melnychenko-Koblyuk, A. Grytsiv, L. Fornasari, H. Kaldarar, H. Mi-chor, F. Röhrbacher, M. Koza, E. Royanian, E. Bauer, P. Rogl, M. Rotter,H. Schmid, F. Marabelli, A. Devishvili, M. Doerr, and G. Giester, J. Phys.:Condens. Matter 19, 216223 �2007�.
3N. Melnychenko-Koblyuk, A. Grytsiv, S. Berger, H. Kaldarar, H. Michor,F. Röhrbacher, E. Royanian, E. Bauer, P. Rogl, H. Schmid, and G. Giester,J. Phys.: Condens. Matter 19, 046203 �2007�.
4N. Nasir, A. Grytsiv, N. Melnychenko-Koblyuk, P. Rogl, E. Bauer, R.Lackner, E. Royanian, G. Giester, and A. Saccone, J. Phys.: Condens.Matter 21, 385404 �2009�.
5N. Nasir, Ph.D. thesis, University of Vienna �2010�.6N. Melnychenko-Koblyuk, A. Grytsiv, P. Rogl, H. Schmid, and G. Giester,J. Solid State Chem. 182, 1754 �2009�.
7N. Melnychenko-Koblyuk, A. Grytsiv, P. Rogl, M. Rotter, E. Bauer, G.Durand, H. Kaldarar, R. Lackner, H. Michor, E. Royanian, M. Koza, andG. Giester, Phys. Rev. B 76, 144118 �2007�.
8N. Melnychenko-Koblyuk, A. Grytsiv, P. Rogl, M. Rotter, R. Lackner, E.Bauer, L. Fornasari, and F. Marabelli, Phys. Rev. B 76, 195124 �2007�.
9N. Melnychenko-Koblyuk, A. Grytsiv, P. Rogl, E. Bauer, R. Lackner, E.Royanian, M. Rotter, and G. Giester, J. Phys. Soc. Jpn. 77, Suppl. A, 54�2008�.
10I. Zeiringer, Diploma thesis, University of Vienna �2010�.11X. Yan, A. Grytsiv, G. Giester, E. Bauer, R. Rogl, and S. Paschen, J. Elec.
Mat., submitted.12J. Rodriguez-Carvajal, Physica B 55, 192 �1993�.13M. Rotter, H. Müller, E. Gratz, M. Doerr, and M. Loewenhaupt, Rev. Sci.
Instrum. 69, 2742 �1998�.14J. Koppensteiner, W. Schranz, and M. R. Puica, Phys. Rev. B 78, 054203
�2008�.15W. Schranz, Phase Transitions 64, 103 �1997�.16W. Schranz and D. Havlik, Phys. Rev. Lett. 73, 2575 �1994�.17D. Havlik, W. Schranz, M. Haluska, H. Kuzmany, and P. Rogl, Solid State
Commun. 104, 775 �1997�.18M. Christensen and B. B. Iversen, J. Phys.: Condens. Matter 20, 104244
�2008�.19M. Christensen and B. B. Iversen, Chem. Mater. 19, 4896 �2007�.20L. Qiu, M. A. White, Z. Li, J. S. Tse, C. I. Ratcliffe, and C. A. Tulk, Phys.
Rev. B 64, 024303 �2001�.21P. Toulemonde, A. San Miguel, A. Merlen, R. Viennois, S. Le Floch, C.
Adessi, X. Blasé, and J. L. Tholence, J. Phys. Chem. Solids 67, 1117�2006�.
22R. Lortz, R. Viennois, A. Petrovic, Y. Wang, P. Toulemonde, C. Meingast,M. M. Marek, H. Mutka, A. Bossak, and A. San Miguel, Phys. Rev. B 77,224507 �2008�.
23A. Bentien, B. B. Iversen, J. D. Bryan, G. D. Stucky, A. E. C. Palmqvist,A. J. Schultz, and R. W. Henning, J. Appl. Phys. 91, 5694 �2002�.
24A. Bentien, E. Nishibori, S. Paschen, and B. B. Iversen, Phys. Rev. B 71,144107 �2005�.
25L. Qiu, I. P. Swainson, G. S. Nolas, and M. A. White, Phys. Rev. B 70,035208 �2004�.
26S. Johnsen, A. Bentien, G. K. H. Madsen, M. Nygren, and B. B. Iversen,Phys. Rev. B 76, 245126 �2007�.
27S. Johnsen, A. Bentien, G. K. H. Madsen, and B. B. Iversen, Chem. Mater.18, 4633 �2006�.
28B. C. Chakoumakos, B. C. Sales, D. G. Mandrus, and G. S. Nolas, J.Alloys Compd. 296, 80 �2000�.
29N. L. Okamoto, T. Nakano, K. Tanaka, and H. Inui, J. Appl. Phys. 104,013529 �2008�.
30B. C. Chakoumakos, B. C. Sales, and D. G. Mandrus, J. Alloys Compd.322, 127 �2001�.
31M. Christensen, N. Lock, J. Overgaard, and B. B. Iversen, J. Am. Chem.Soc. 128, 15657 �2006�.
32A. Kaltzoglou, T. Fässler, M. Christensen, S. Johnsen, B. B. Iversen, I.Presniakov, A. Sobolev, and A. Shevelkov, J. Mater. Chem. 18, 5630�2008�.
FIG. 12. �Color online� Thermal expansion coefficients � classified with respect to the chemical composition of the compounds. — shows the value calculatedfrom the lattice parameters of Na8Si46 �see also Table I�. �avg is the average value of the thermal expansion coefficients within one group. �vac=vacancy�.
043529-8 Falmbigl et al. J. Appl. Phys. 108, 043529 �2010�
Downloaded 27 Sep 2010 to 131.130.24.76. Redistribution subject to AIP license or copyright; see http://jap.aip.org/about/rights_and_permissions
33G. S. Nolas, B. C. Chakoumakos, B. Mahieu, G. J. Long, and T. J. R.Weakley, Chem. Mater. 12, 1947 �2000�.
34A. P. Wilkinson, C. Lind, R. A. Young, S. D. Shastri, P. L. Lee, and G. S.Nolas, Chem. Mater. 14, 1300 �2002�.
35K. A. Kovnir, J. V. Zaikina, L. N. Reshetova, A. V. Olenev, E. V. Dikarev,and A. V. Shevelkov, Inorg. Chem. 43, 3230 �2004�.
36M. Falmbigl, P. Rogl, E. Bauer, M. Kriegisch, H. Müller, and S. Paschen,
1166-N06-03, Materials and Devices for Thermal-to-Electric Energy Con-version, MRS Symposium Proceedings �Materials Research Society, Pitts-burgh, 2009�.
37G. D. Mukherjee, C. Bansal, and A. Chatterjee, Phys. Rev. Lett. 76, 1876�1996�.
38H. Zhang, J.-T. Zhao, M.-B. Tang, Z.-Y. Man, H.-H. Chen, and X.-X.Yang, J. Alloys Compd. 476, 1 �2009�.
043529-9 Falmbigl et al. J. Appl. Phys. 108, 043529 �2010�
Downloaded 27 Sep 2010 to 131.130.24.76. Redistribution subject to AIP license or copyright; see http://jap.aip.org/about/rights_and_permissions