the value of real voluntary associations
TRANSCRIPT

The value of real voluntary associations
Working papers
Giacomo Degli Antoni Gianluca Grimalda
N.37 June 2012
The value of real voluntary associations
Giacomo Degli Antoni♣ Gianluca Grimalda♦
PRELIMINARY DRAFT
Abstract
Many scholars have stressed the importance of membership in associations as one of the main
determinants of inter-personal trust (e.g. Zucker, 1986; Coleman, 1990; Lahno, 1995). In
particular, Olson (1982) and Putnam et al. (1993) provided two different accounts of the role of
private voluntary associations in affecting propensity to trust. Olson emphasized the tendency of
some groups to pursue private interests and lobby for preferential policies. From this point of
view, associations do not contribute to create a social fabric of trust, but instead increase
divisions. By contrast, Putnam et al. (1993: 88) stated that voluntary associations “instill in their
members habits of cooperation, solidarity and public-spiritedness”.
We carried out an experimental analysis aimed at investigating the propensity to cooperate of
voluntary members of different kinds of associations compared with propensity to cooperate of
people who have never been voluntary members. Association members came from typically
“Olsonian” association – i.e. trade unions – and typically “Putnamian” associations – i.e. cultural
and social welfare or health associations.
Our experimental design is based on a standard Investment Game (Berg et al. 1995). It comprises
an in-group treatment, where members interact with other members of their own association,
and an out-group treatment, in which members are paired with people from the general
population. All interactions are anonymous.
♣University of Parma - [email protected]. Corresponding author. ♦University Jaume I of Castellón- [email protected] We would like to thank Giuseppe Vittucci, the participants in the international conference “Socially Responsible Behavior, Social Capital and Firm Performance”, the participants in the “International Meeting on Experimental & Behavioral Economics – 2012”, and participants in the project n. 20085BHY5T sponsored by the Italian Ministry of University and Research, for useful comments and suggestions. We also thank Demoskopeas.r.l. for recruitment of participants in the research. Maria Grazia Ranzini and the staff of the library of the Faculty of Economics – University of Parma have assisted us during fieldwork. Finally, our thanks go to: Associazione Giocamico, Avis, A.vo.pro.ri.t, CGIL Parma, Comunità di Sant’Egidio, Corale Giuseppe Verdi, Coro Lirico Renata Tebaldi, Coro “Voci di Parma”, Forum Solidarietà, Terra di Danza, and UIL Parma. We acknowledge financial support from the following grants: Bancaixa P1-1A2010-17, and P1-1B2010-17, Ministerio de Ciencia e Innovación de España (ECO2011-23634), Junta de Andalucía (P07-SEJ-03155), and the Italian Ministry of University and Research under the national research project (PRIN) n. 20085BHY5T. Remaining errors are solely the responsibility of the authors.
To the best of our knowledge, the present study represents the first attempt to investigate the
relationship between voluntary participation in different kinds of associations and propensity to
cooperate by involving people of different age, education and socio-economic status (previous
contributions focused on samples of college students: Glaeser et al. 2000, Anderson et al. 2004).
Our preliminary evidence shows that:
• Voluntary members of associations contribute significantly more (around 50%) than non-
members, both in the in-group and in the out-group treatment; this is a much higher
proportion than what found by Ruffle and Sosis (2006) and Hargreaves-Heap and Zizzo
(2009), who on the contrary found no significant difference;
• The type of associations of which people are members affects the patterns of cooperation.
We find in-group favoritism for members of Olson-type associations, i.e. they cooperate
significantly more with their fellow members than with people from the general public. No
in-group favoritism is found for Putnam-type associations members. Moreover, Putnam-
type associates cooperate significantly more than non-members with people from the
general public, while members of Olson-type associations contribute as non-members
when paired with people from the general public. These results seem to confirm the
original intuition of the two authors.
Keywords: Propensity to trust; Voluntary membership; Olson-type and Putnam-type associations;
In-group favoritism; Out-group hostility; Natural groups; Field experiment.
JEL classification:C93- Field Experiments; L31 - Nonprofit Institutions; NGOs; A13 - Relation of
Economics to Social Values
1. Introduction
In their 2009 contribution, Hargreaves-Heap and Zizzo (HHZ henceforth) show that the presence of groups
may have a detrimental effect on social welfare. They used a series of trust game experiments in which
group belonging was artificially induced through the so-called minimal group paradigm (Tayfel, 1970). They
show that efficiency is highest when no group salience is induced. When groups are formed, trust towards
in-group members is no higher than when groups are absent, but trust toward out-group members is
significantly lower. They conclude that, at its most basic level, the existence of groups per se is negative.
People are however willing to pay positive sums of money to be part of a group, even if this is not
conducive to extra earnings. These results go against a relevant strand of literature in the organizational
theory literature (Zucker, 1986; Coleman, 1990; Lahno, 1995; Putnam, 2000), thus deserve further
investigation.
The present paper aims at investigating the effect of membership in real voluntary associations on
cooperative behavior. We adopt an experimental approach, since we share the same concerns as HHZ
(2009:317) about the reliability of answers to survey questions in measuring actual propensities to
cooperate1. Our sample includes people of different age, education and socio-economic status. This
represents an innovation with respect to previous studies investigating similar topics, which only focused
on a sample of college students (Glaeser et al. 2000, Anderson et al. 2004). About two thirds of our 376-
subject sample is made up of current association members, and one third has been recruited from people
from the general public who are not group members. We took care that the demographic characteristics of
association members matched those of non-association members. Association members are either
assigned to an in-group or an out-group condition. In the former, they are anonymously matched with
other members of the same association. In the out-group condition, they are matched with people from
the general public. Thus, the main novelty of our study is that such an in-group/out-group manipulation is
induced naturally thanks to membership in various types of real associations.
Olson (1982) and Putnam et al. (1993) provided two different accounts of the role of private voluntary
associations in affecting economic and social welfare. Olson emphasized the tendency of some groups to
pursue private interests and lobby for preferential policies. On the other hand, Putnam et al. (1993: 88)
stated that voluntary associations “instill in their members habits of cooperation, solidarity and public-
spiritedness”. Olson’s vision is one of groups generating costs to the society as a whole, whereas Putnam’s
approach attaches positive welfare consequences to groups. Groups typically classified as “Olson-type” in
the economics literature are trade unions, political parties or groups, and professional associations(Knack
and Keefer, 1997; Knack, 2003). “Putnam-like” associations have typically included education, arts, music,
or cultural activities, youth work, religious or church organizations, local community action on issues like 1For example, Glaeser et al. (2000) show that trust questions reflect the level of subjects’ trustworthiness instead of their trust.
poverty, employment, housing, racial equality, and sports or recreation associations. The theoretical
prediction is thus that Olson-type (Putnam-type) associations have a negative (positive) effect on
generalized trust. Nevertheless, empirical investigations carried out using country-level data, present
ambiguous conclusions2.
A recent contribution in the sociological literature (Paxton 2007) focuses on the role of participation in
different kinds of voluntary associations in promoting members’ generalized trust. By using individual level
data, Paxton (2007) shows that participation in voluntary associations connected to other voluntary
associations through members’ multiple memberships creates more trust than participation in associations
isolated from other voluntary associations. In her analysis, based on the World Values Survey (1994), trade
unions emerge as the least connected associations, social welfare and cultural associations have
intermediate levels of connections, while peace associations are the most connected.
Considering these theoretical and empirical analyses, we recruited members from three kinds of
associations: trade unions, social welfare and cultural associations. The former are Olson-type and little
connected associations, while the latter two are Putnam-type with a higher amount of connections.
The focus on real associations allows us to move a step forward from the analysis by HHZ. Their finding
provides a “lower boundary” to the “pure” effect of group membership in terms of social welfare. The
authors themselves suggest investigating the “contribution that comes from an actual group’s constitutive
norms” (HHZ: 296). The influence of real associations on social welfare may vary according to two main
directions with respect to the analysis considering minimal groups, i.e. groups formed on the basis of some
arbitrary characteristics of subjects, such as the fact of having received, when entering the lab, a blue or a
red card.
First, cooperation among members of the same group may be stronger when real groups are considered.
Shared norms and rules promote trust among members of the same associations because they increase the
predictability of others’ behavior (Zucker 1986). Moreover, the existence of stable networks, allows the
opportunity of sanctioning in future interactions (Axelrod 1984). Contributions in real groups do show
evidence of in-group favoritism3. This has been found to be the case for individuals randomly assigned to
different army platoons (Goette et al., 2006); Kibbutz members vis-à-vis city residents (Ruffle and Sosis,
2006; RS henceforth); different native groups from Papua New Guinea (Bernhard et al., 2006). However,
the novelty of the HHZ approach is the comparison between the treatments with and without groups.
2 Knack and Keefer (1997) find a surprisingly negative though not significant effect on generalized trust of Putnam-type associations and a positive effect of the Olson-type associations, while considering all the associations together no statistically significant effect emerges. Knack (2003) analyses a larger sample of countries and finds out a positive effect of associations on trust when all the associations are considered together, while when the distinction between Putnam and Olson groups is introduced, only the former presents a significant, and positive, effect on trust. 3 Starting with the pioneering study by Tajfel (1970), also several experimental contributions on minimal groups displays evidence of in-group favoritism: Tajfel, 1974; Brewer, 1979; Mullen, Brown, and Smith, 1992; Brewer, 1999; Charness et al., 2007.
Among the studies on real groups, only RS have a design that allows a comparison with the no-group
condition considered by HHZ. When paired with city residents, Kibbutz members display a level of
cooperation identical to those of city residents, while their level of cooperation is higher when paired with
other Kibbutz members. This seems to reveal a positive (in-group) effect of real groups on cooperation with
respect to the absence of groups which does not emerge in the HHZ experiment.
The second channel trough which influence of real associations on social welfare may differ from influence
of minimal groups is the possible effect of participation on the internalization process of roles, norms, and
values that may affect behavior of members (Akerlof and Kranton, 2005, Goette et al. 2006). In the specific
case of voluntary associations, these norms, roles and values could increase cooperation also towards
people outside the group (Tocqueville 1840; Putnam et al 1993; Paxton 2007). After having learned the
“virtues” of cooperation, group members would extend the compliance with such norms from the in-group
to the society at large. Trust in others would shift from being “personal” to being “generalized” (Yamagishi
and Yamagishi, 1994; Yuki et al, 2004). The experimental literature has shown that, when members of real
groups interact with members of other groups, and the existence of the two different groups is made
salient, out-group hostility seems to emerge (Goette et al. 2006, Bernhard et al. 2006). Moreover, when the
distinction between groups is not made highly salient (as in the out-group treatment proposed by RS4)
neither out-group hostility nor higher cooperation (by kibbutz members in the case of RS) towards out-
group members emerge. The result proposed by RS is a notable result, because the group considered
should in principle contribute to create a generalized spirit of cooperation.“The raison d’etre and lifestyle of
the kibbutz socialize individuals to cooperate not only with one another, but also with Israelis more
generally” (Ruffle and Sosis 2006: 148). Since this is not the case, RS, too, cast doubts on the possibility of
groups to inculcate in their members norms of cooperation with strangers.
The present paper implements an Investment Game (Berg et al. 1995) and uses a design similar to RS.
Members of trade unions, cultural associations and social welfare associations are alternatively paired with
other members of their own association (in-group treatment) or with people randomly drawn from the
general population (out-group treatment).
Our evidence shows that:
• voluntary members of associations contribute significantly more (around 50%) than non-members,
both in the in-group and in the out-group treatment;
• members’ propensity to cooperate in the two experimental conditions is not neutral to the type of
association of which one is currently member, in particular in-group favoritism emerges only with
respect to members of trade unions.
4- In this experiment subjects are simply told “that the person with whom they were paired was from another place” (RS: 152)
Section 2 describes the sample selected for our research. Section 3 describes the experimental design.
Section 4 and 5 presents the empirical results also discussing theself-selection issue. Section 6 concludes.
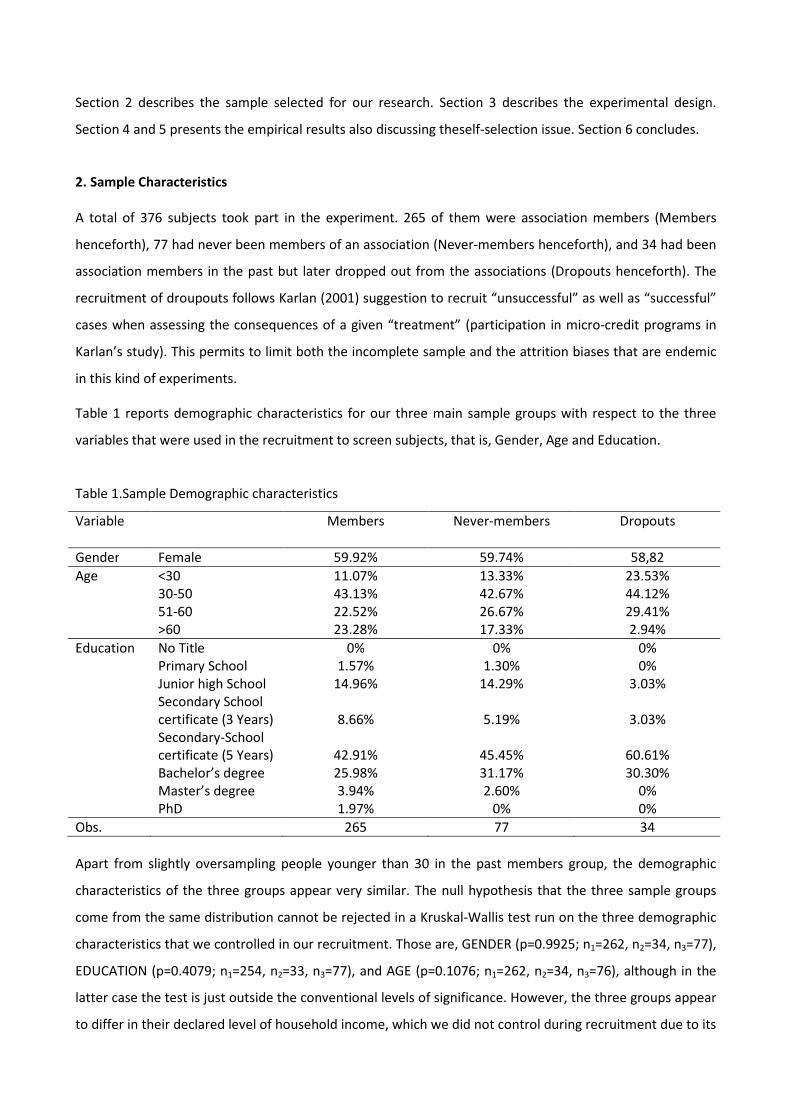
2. Sample Characteristics A total of 376 subjects took part in the experiment. 265 of them were association members (Members
henceforth), 77 had never been members of an association (Never-members henceforth), and 34 had been
association members in the past but later dropped out from the associations (Dropouts henceforth). The
recruitment of droupouts follows Karlan (2001) suggestion to recruit “unsuccessful” as well as “successful”
cases when assessing the consequences of a given “treatment” (participation in micro-credit programs in
Karlan’s study). This permits to limit both the incomplete sample and the attrition biases that are endemic
in this kind of experiments.
Table 1 reports demographic characteristics for our three main sample groups with respect to the three
variables that were used in the recruitment to screen subjects, that is, Gender, Age and Education.
Table 1.Sample Demographic characteristics
Variable Members
Never-members
Dropouts
Gender Female 59.92% 59.74% 58,82 Age <30
30-50 51-60 >60
11.07% 43.13% 22.52% 23.28%
13.33% 42.67% 26.67% 17.33%
23.53% 44.12% 29.41% 2.94%
Education
No Title Primary School Junior high School Secondary School certificate (3 Years) Secondary-School certificate (5 Years) Bachelor’s degree Master’s degree PhD
0% 1.57%
14.96%
8.66%
42.91% 25.98% 3.94% 1.97%
0% 1.30%
14.29%
5.19%
45.45% 31.17% 2.60%
0%
0% 0%
3.03%
3.03%
60.61% 30.30%
0% 0%
Obs. 265 77 34 Apart from slightly oversampling people younger than 30 in the past members group, the demographic
characteristics of the three groups appear very similar. The null hypothesis that the three sample groups
come from the same distribution cannot be rejected in a Kruskal-Wallis test run on the three demographic
characteristics that we controlled in our recruitment. Those are, GENDER (p=0.9925; n1=262, n2=34, n3=77),
EDUCATION (p=0.4079; n1=254, n2=33, n3=77), and AGE (p=0.1076; n1=262, n2=34, n3=76), although in the
latter case the test is just outside the conventional levels of significance. However, the three groups appear
to differ in their declared level of household income, which we did not control during recruitment due to its
sensitivity for subjects’ privacy (see next section). In this case, the null hypothesis that the three sample
groups came from the same distribution can be rejected, although only at weak levels of
significance(p=0.0577; n1=218, n2=28, n3=68). Overall, current members declared higher income levels than
others.
3. The experimental design 122 subjects were recruited by Demoskopea, an opinion polls and market research agency. The vast
majority of these subjects entered the Never member and the Dropouts groups5. 254 subjects were
recruited by the experimenters from ten different associations: four cultural associations (3 choruses and 1
ethnic and traditional dance association), four social welfare and health services associations(the Italian
association for blood donation, an association for medical research on cancer, an association assisting
hospitalized children and an association dedicated to charity and evangelization), and two trade unions
(two of the most important Italian trade unions in terms of number of subscribers), and they entered the
Members group. All participants were contacted following the same recruitment protocol. Subjects were
invited to participate in a research on inter-personal decision-making. It was specified that participants’
earnings could vary between sums greater than 50€ and 0€ depending on the participant and others’
choices. Moreover, the option of earning 25€ for sure was always available to subjects. As we shall see,
rather than giving participants a standard show-up fee, we gave subjects an “endowment” that could have
been used in the Investment Game as subjects desired. This procedure reproduces that used in the original
Berg et al.(1995) experiment. It was also made clear that the research aimed at recruiting a sample from
the general population of the province of Parma and surrounding provinces. Under no circumstances was
the research presented to prospective subjects as focusing on association members.
Contacted subjects were screened with respect to three demographic characteristics, that is, their gender,
age, and level of education attainment (See Table 1). We deemed inappropriate to screen subjects over
their income levels because of obvious confidentiality reasons. The medium of contact with subjects
differed between Demoskopea and the experimenters. Phone contacts were used by Demoskopea,
whereas experimenters were personally present at the beginning of association meetings. Although we
cannot rule out that the different form of contact induced different responses in subjects’ experimental
5Although Demoskopea was instructed to recruit only Never-members or Dropouts, eleven subjects recruited by Demoskopea answered in our questionnaire they were in fact currently active member. We believe this is due to the fact that during the recruitment interview subjects were asked generically if they were voluntary members of some associations or organizations. Only three examples of association types were given. In the questionnaire, instead, a whole list of 19 different types of associations was presented to subjects. It is quite likely that some people did not identify themselves as a “voluntary member” in the interview, but did so later when finding that their association was included in the list. Other forms of mistake during the phone interview, or absent-mindedness, cannot obviously be ruled out. In the data analysis, we treat these eleven subjects as part of the Member group, although some of the associations of which they are member is neither cultural, or social welfare, or trade unions.
behavior, the fact that recruitment was made following the same protocol, which was read to subjects,
ensures in our view that this effect is at most small6.
Experiments were conducted between May and October 2011. For each experimental session, two groups
of subjects were convened at two different locations of the University of Parma. One of the two
experimenters was present at each of the locations. Upon their arrival, subjects’ were asked to draw at
random an envelope, which included an ID number (reproduced on several stickers), and 5 paper tokens
representing 5 Euros each. It was explained to subjects that the ID number served to guarantee their
anonymity throughout the research, and that the tokens would have been used in the experimental
decisions. Handing subjects the tokens at the beginning of the session was functional to ensure subjects
that the promised guaranteed payment of 25 Euros would in fact take place.
The two groups were then separately conducted to two different rooms of the University library.
Experimental sessions were run in parallel by the two experimenters. After having been seated, instructions
were administered orally, but written instructions and diagrams representing the situation of choice were
also made available at subjects’ desk. Subjects were instructed they would participate in two decisions, and
that payments would be given by the payoff of only one of the two. The decision would have been
determined by a 50-50 random draw realized by the computer at the end of the session.
The rules of the Investment Game were then illustrated to subjects, making use of some graphs and
examples. Participants were told each of them would be paired with another participant present in the
other room. In case of an unbalanced number of people in the two groups, it was explained that some
randomly drawn participants from the least numerous group (let us call her Player A) would have been
matched with two participants from the most numerous group (let us call them Player Bs). In this way,
player A’s actions would determine the payoffs for both player Bs, and the actions of one randomly chosen
player between the Player Bs would have determined Player A’s payoff. Although the two groups did not
meet before the experiment to protect the anonymity of the choice, subjects were insured they could meet
the other experimenter and the other group at the end of the session. It was explained that individual
choices would have been transferred to the experimenter in the other room via an internet connection
available in the room.
In the first decision, subjects acted as senders. It was explained that both senders and receivers were
endowed with 25€. Senders’ choice consisted of placing their five 5€ tokens into two envelopes named
“Personal” and “Send”. Each token put into the Personal envelope would enter directly the sender’s final
6A different strategy might have been to obtain association members telephone contacts from the associations, pass these contacts to Demoskopea, and thus ensures that members and non-members were contacted in the same way. However, this strategy was unfeasible both for the considerable increase in costs, and because several associations are unable to pass their members’ contact details to external agencies.
account, whereas each token put into the “Send” envelope would have been multiplied by a factor of two
and transferred to the receiver.
In the second decision, subjects acted as receivers. We applied the strategy method, so subjects had to
indicate in a paper form the amount they wished to return for each of the possible six options available to
the sender. Receivers could send back any amount between zero and the sum of the amount transferred by
the sender, multiplied by two, and the 25€ endowment. We used a multiplicative factor of two, instead of
the customary value of three, mainly because of budget reasons. We included the 25€ endowment in the
sum the receivers could send back, because we thought computations may have been easier in this way.
Before making their choices, subjects were asked to complete a six-question comprehension test on a
paper sheet. These were collected by the experimenters and then the solution to the test was explained to
subjects. The experimenters made sure that every participant was clear on the instructions before decisions
were made. No feedback was given between the two decisions. So the receiver choice can be considered as
independent from the sender choice. In fact, it was specified that a player’s partner when acting as a
sender would have been different to the same player’s partner when acting as a receiver.
After the two experimental choices, we elicited subjects’ beliefs. First we asked how much the subject
expected the receiver with whom she was paired would return, given the amount the subject actually sent.
Second, we asked subjects to estimate the amount transferred by the sender with whom they were paired
in the second decision. Subjects were paid 1€ for each correct guess. In the first estimate we allowed for a
±3€ margin of error. The attitudinal and demographic questionnaire followed. During this time,
experimenters recorded subjects’ choices as senders and receivers on an Excel spreadsheet, and when
finished transferred the spreadsheet to the other experimenter via an internet connection. Final payoffs for
each subject were automatically determined by an Excel algorithm carrying out the random matching.
Payments were distributed by cash at the end of the session, after subjects had finished completing the
questionnaire. Payments were placed in an envelope bearing a label with each subject’s ID Number.
Subjects had to complete a receipt of their earnings, which had to be left in an envelope on their way out,
without the experimenters having to see the receipt.
Our main treatment consisted in varying the characteristics of the pair interacting in the Investment Game.
As is customary in in-group/out-group studies, in the in-group treatment members of the same association
were paired, whereas in the out-group treatment pairs were drawn from the population at large. At the
moment where the matching rules were explained, subjects were told they would be matched with a
person participating in the experiment in the other room. Then, subjects participating in the in-group
treatment were told that they would be matched with a member of the same association where they had
been contacted by experimenters. The name of the association was read aloud. It was specified that this
person was a resident of the province of Parma or surrounding provinces. This was done to avoid that
subjects members of associations active at the national level may be led to think that their partner would
come from Italian regions located far away from their own. This may have caused inter-cultural beliefs to
play a part in their choice, and we wanted to avoid this possibility.
In the out-group treatment, subjects were informed that their partner was a resident of the province of
Parma or surrounding provinces, and that s/he had been contacted within a large sample of people
residents in these provinces. It was specified that more than a thousand people, coming from different age
and socio-economic groups, had been contacted to participate in the research. One group of people in the
out-group treatment comprised people recruited through Demoskopea, while the other was formed by
association members recruited by the experimenters. To form the latter group, we mixed people coming
from several different associations, so that most of the people part of this group would, with high
probability, not be acquainted with each other. In this way, we believe that association members could see
in their own group a cross-section of Parma residents that, for the most part, was unacquainted to them.
That this was in fact the case can be confirmed by the results of a control question included in the
questionnaire, which asked people to state whether they thought they knew personally people present in
the other research room. Around 41% of Members participating in the in-group treatment answered
positively to such question, whereas positive answers dropped to 7% for Members recruited in the out-
group treatment. According to a Mann-Whitney test, the difference is statistically significant at less than
the 1% level. Each research session lasted around 75 minutes, with average payoffs of around 33€.
4. Descriptive statistics
In this paper we focus only on senders’ behavior, and leave receivers’ behavior to future analysis.
Table 2 shows senders’ transfers across different treatments and subjects’ membership type. Given the
similarity in their aims and activities, in what follows we group together the members of the four social
welfare and health services associations, of the four cultural associations, and of the two trade unions. This
decision also seems to be supported by our data. Kruskal-Wallis tests performed on the null hypothesis that
transfers are the same between members of the different associations tell us that there are no statistically
significant differences between members of the two trade unions (p=0.2126,n1=58, n2=19), between
members of the four social welfare and health services associations (p=0.4066,n1=23, n2=32, n3=26, n4=12)
and between members of the four cultural associations (p=0.1985,n1=16, n2=11, n3=18, n4=39) (Appendix A
shows descriptive statistics on level of senders’ contribution with respect to each single association).
Moreover, no difference in transfers emerges across each association pairs within these three groups, using
ordered logit regressions and controlling for demographic characteristics (results available upon request).
Columns 8 and 9 in Table 2 classify current members according to their participation in Olson-type or
Putnam-type associations. We consider as Olson-type associations trade unions, political parties or groups,
and professional associations, while we classify as Putnam-type associations all the other groups7.This is
largely consistent with the existing literature(see section 1). There seems to be general consensus that
Olson-type associations, i.e. those acting as “distributional coalitions” favoring their own members (Knack
and Keefer, 1997), should include these three groups. The literature is more divided as to which association
to consider as “Putnam-type”. Since existing classifications do not seem to be based on strong rationales –
it is difficult to classify groups on the basis of their presumed pro-sociality - we preferred not to make
arbitrary exclusions from this group8.
Table 2 – Senders’ contribution across treatments and membership
Never-
members
Dropouts Current members
Total
Total
Total
recruited in
social
welfare and
health
services
associations
recruited in
cultural
associations
recruited
in trade
unions
of at least 1
Putnam-
type
association
of at least
1 Olson-
type
association
In-
group
[0] [0] 15.32
(6.11)
[110]
15.83
(5.73)
[42]
14.34
(5.95)
[38]
15.83
(6.83)
[30]
15.33
(5.95)
[91]
16.46
(6.64)
[41]
Out-
group
10.65
(6.56)
[77]
10.15
(7.93)
[34]
14.48
(6.45)
[155]
15.39
(6.84)
[51]
14.89
(6.01)
[46]
13.94
(6.51)
[47]
14.52
(6.52)
[124]
13.54
(6.48)
[65]
Standard deviations in round brackets and number of observations in square brackets.
An even cursory look at the data reveals that sending rates are far superior among association members
than Never-members or Dropouts. Members send on average around 50% more than non-members, and
the percentages do not differ much between in-group and out-group treatments. This amount of “co-
operative” behavior is much higher than what found, for instance, in RS. All Wilcoxon tests performed on
the null hypothesis that contribution is the same between a member group (considering all the possible
groups presented in the table) and either a Never-member or Dropout group reject the null at less than the
1% level. The null cannot instead be rejected between Never-member and Dropouts. Members of Olson-
7These are social welfare services for elderly, handicapped or deprived people; religious or church organizations; cultural associations; sport associations; environmental associations; third world development or human rights; youth work – e.g scouts, guides, youth clubs; education; health associations; civil protection. 8 Knack and Keefer (1997) restrict Putnam-type associations to religious or church organizations; education, arts, or cultural activities; and youth work. Knack (2003) includes in Putnam-type associations: education, arts, music or cultural activities; local community action on issues like poverty, employment, housing, racial equality; youth work; and sports or recreation associations.
type associations send more in the in-group than in the out-group treatment (Wilcoxon p=0.044), whereas
no significant difference emerges for Putnam-type associations.
These results suggest a sizable membership effect on Senders’ behavior both in the out-group and in the in-
group treatment, and an in-group favoritism limited to Olson-type associations. The next section controls
for individual socio-demographic characteristics in econometric analysis.
5. Econometric results
As senders, subjects could choose among six amounts to be sent: 0,5,10, 15,20 and 25 euros. We study
their behavior performing ordered logit estimates.
5.1 The effect of mere membership
In this section we study the effect of current membership on senders’ behavior across the two treatments.
Table 3 shows the impact of being a member on the amount sent when a set of socio-demographic and
other control variables are included (see appendix B for variable legend and descriptive statistics).
Regressions 1 and 2 do not distinguish between the two treatments, while regressions 3 and 4 include two
interaction variables between a dummy variable identifying current membership and the participation in
either the in-group or the out-group treatment. Regressions 2 and 4 include measures of a subject’s beliefs
over others’ actions. The first measure (Belief_receiver_behavior) is a sender’s belief over the amount they
will receive back given the amount they sent. The second measure (Belief_sender_behavior) is the belief
over how much a sender would transfer in the interaction9. Both measures were monetarily incentivized.
We expect association members to hold beliefs that others are more trustworthy, that is, that they will
return higher sums, ceteris paribus (data on belief reported in appendix C seem to confirm this
expectation). If we can show that differences between members and non-members hold even controlling
for beliefs on others’ trustworthiness, we will have a proof that members higher sending rate is not only
caused by higher expectation of reciprocation, but also by some additional motivation – such as altruism or
efficiency-concerns.
9More specifically, this second measure made reference to the interaction in which subjects acted as receivers. Participants were asked to state their expectation over how much the sender with whom they had been matched transferred to them.
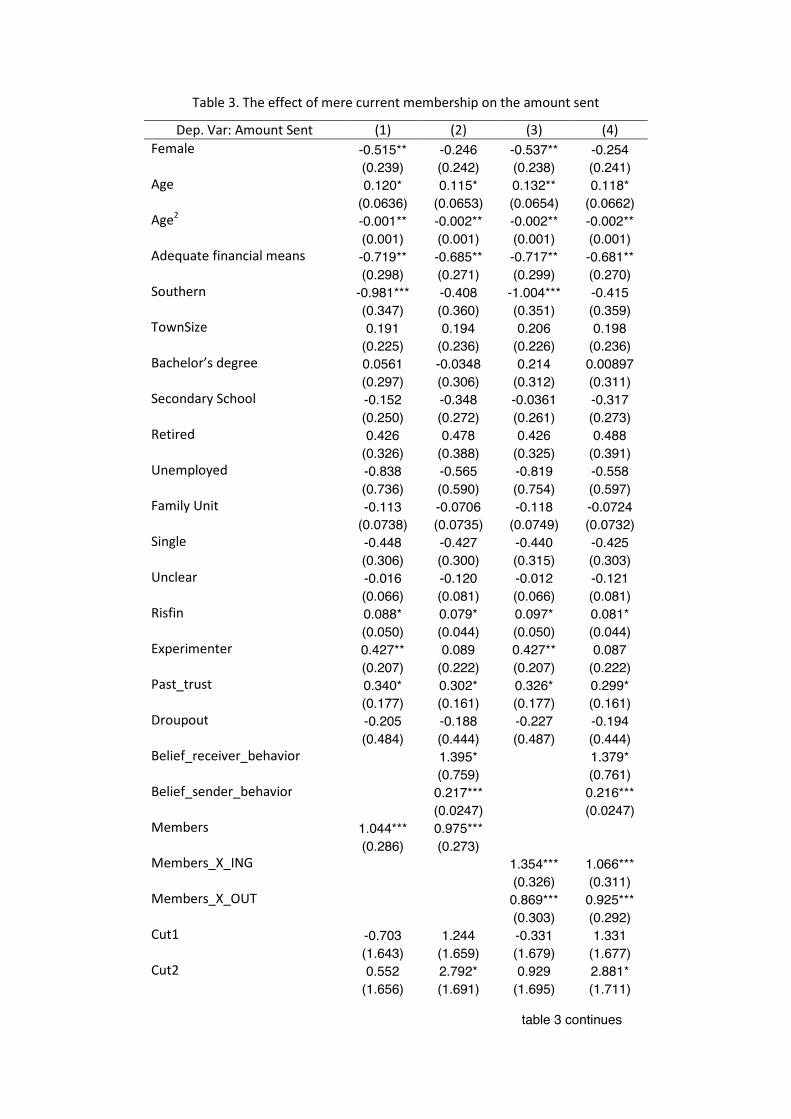
Table 3. The effect of mere current membership on the amount sent
Dep. Var: Amount Sent (1) (2) (3) (4) Female -0.515** -0.246 -0.537** -0.254 (0.239) (0.242) (0.238) (0.241) Age 0.120* 0.115* 0.132** 0.118* (0.0636) (0.0653) (0.0654) (0.0662) Age2 -0.001** -0.002** -0.002** -0.002** (0.001) (0.001) (0.001) (0.001) Adequate financial means -0.719** -0.685** -0.717** -0.681** (0.298) (0.271) (0.299) (0.270) Southern -0.981*** -0.408 -1.004*** -0.415 (0.347) (0.360) (0.351) (0.359) TownSize 0.191 0.194 0.206 0.198 (0.225) (0.236) (0.226) (0.236) Bachelor’s degree 0.0561 -0.0348 0.214 0.00897 (0.297) (0.306) (0.312) (0.311) Secondary School -0.152 -0.348 -0.0361 -0.317 (0.250) (0.272) (0.261) (0.273) Retired 0.426 0.478 0.426 0.488 (0.326) (0.388) (0.325) (0.391) Unemployed -0.838 -0.565 -0.819 -0.558 (0.736) (0.590) (0.754) (0.597) Family Unit -0.113 -0.0706 -0.118 -0.0724 (0.0738) (0.0735) (0.0749) (0.0732) Single -0.448 -0.427 -0.440 -0.425 (0.306) (0.300) (0.315) (0.303) Unclear -0.016 -0.120 -0.012 -0.121 (0.066) (0.081) (0.066) (0.081) Risfin 0.088* 0.079* 0.097* 0.081* (0.050) (0.044) (0.050) (0.044) Experimenter 0.427** 0.089 0.427** 0.087 (0.207) (0.222) (0.207) (0.222) Past_trust 0.340* 0.302* 0.326* 0.299* (0.177) (0.161) (0.177) (0.161) Droupout -0.205 -0.188 -0.227 -0.194 (0.484) (0.444) (0.487) (0.444) Belief_receiver_behavior 1.395* 1.379* (0.759) (0.761) Belief_sender_behavior 0.217*** 0.216*** (0.0247) (0.0247) Members 1.044*** 0.975*** (0.286) (0.273) Members_X_ING 1.354*** 1.066*** (0.326) (0.311) Members_X_OUT 0.869*** 0.925*** (0.303) (0.292) Cut1 -0.703 1.244 -0.331 1.331 (1.643) (1.659) (1.679) (1.677) Cut2 0.552 2.792* 0.929 2.881* (1.656) (1.691) (1.695) (1.711)
table 3 continues
table 3 (continued) Cut3 2.114 4.714*** 2.497 4.801*** (1.663) (1.701) (1.702) (1.720) Cut4 3.443** 6.467*** 3.830** 6.553*** (1.671) (1.705) (1.712) (1.724) Cut5 4.613*** 8.060*** 5.015*** 8.150*** (1.680) (1.728) (1.724) (1.748) Pseudo R2 0.071 0.201 0.074 0.201 Prob>χ2 0.000 0.000 0.000 0.000 Number of obs. 339 337 339 337
Robust standard errors in brackets. * Significant at 10%; ** significant at 5%; *** significant at 1%. Results of regression 1show that:
men contribute more than women10, but only when belief are not included in the regressions.
the age of subjects presents a quadratic effect on Senders’ contribution (Age and Age2)
the better subjects’ self-assessment of their financial situation, the more they contribute (Adequate
financial means);11
subjects born in South Italy tend to contribute less (Southern), but only when beliefs are not
considered;
contribution increases with the subjects willingness to take financial risks (Risfin), even though the
effect is only weakly significant;
no differences emerges between Dropouts and Never-members (Droupouts);
moreover, we observe a positive and significant effect of membership on transfer decisions. All
things considered (in regression 1), the predicted probability of observing the highest contribution
for Members is 0.079 greater than for Never-members.
Regression 3 shows that the effect of membership is greater in the in-group treatment than in the out-
group treatment, being the marginal effect of membership associated with the highest contribution equal
to 0.151 in the in-group treatment and equal to 0.080 in the out-group treatment. According to a Wald test
on the null hypothesis: = __ − __ = 0, members’ sending rate is weakly
10The empirical evidence on gender effects in experimental games is mixed -see Eckel and Grossman (2001) and Solnick (2001) for evidence from ultimatum games; Bolton et al. (1998), Bohnet and Frey (1999b) and Andreoni and Vesterlund (2001) with respect to dictator games; the survey by Ledyard (1995) with regard to public goods game experiments; and Ortmann and Tichy (1999) who consider a repeated prisoner’s dilemma. In relation to a trust game, Croson and Buchan’s (1999) show that women behave like men when they perform as trustors but they are more generous when they play as trustees. According to Eckel and Grossman (1998) women behave like men in more risky contexts, such as ultimatum games, but they are more socially oriented in less risky contexts, such as dictator games (see also Eckel, 2008; Eckel and Grossman, 2008). 11The variable “Household Income”, which asked subjects the monthly net income of their household, suffers from a high number of missing values. In subsequent analyses we then prefer to use the variable “Adequate Financial Means”, for which missing values are considerably fewer (see Appendix B for the exact wording of the question). The two variables are highly correlated (coefficient of linear correlation rho=0.41). Moreover, the results of the analyses remain substantially the same when replacing Income Satisfaction with Household Income. When this is not the case, the modification in the result is reported in a footnote.
significantly higher when interacting with fellow members vis-à-vis strangers (p=0.050). Interestingly,
members paired with non-members send significantly more than non-members (p=0.004). This result is in
stark contrast with both HHZ and RS.
Regressions 2 and 4 reveal, as expected, that senders’ decisions significantly depend on beliefs. In
particular, the inclusion of beliefs in the estimates significantly increases the variance explained by the
independent variables. The positive effect of membership on the amount sent remains even after the
inclusion of beliefs. It is worth noting that between the two measures of beliefs we used, it is the second
the one predicting transfers more accurately. Such measure reflects a sender’s view of the “social norm” in
sending behavior, i.e. a subject’s view over how much a sender is expected to send. Thus, social norms
seem to have more predictive power than a subject’s expectation over their partners’ trustworthiness.
Result 1: Members contribute significantly more than non-members. This is the case both when members
are paired with non-members and when they are paired with fellow members of their own association.
Members contribute more when paired with fellow members than when paired with non-members, but this
in-group favoritism effect is only weak.
5.2 The effect of current membership in social welfare and health services associations, cultural
associations and trade unions
Regressions in Table 4 study the effect of membership on Senders’ behavior by type of associations. In this
specification, we group together membership in individual associations into the three different types
illustrated in section 3 – that is, cultural, social welfare and health services, and trade unions. We only
consider membership in the association for which the subject has been recruited. This is somewhat
restrictive because, for instance, a subject contacted as a member of a cultural association may also be
member of a trade union. However, since the in-group treatment is only meaningful with respect to the
association for which the subject has been recruited, this specification is the most direct way to study in-
group effects per type of association. We leave to the next section the analysis of multiple membership. As
we shall see, results do not change significantly.
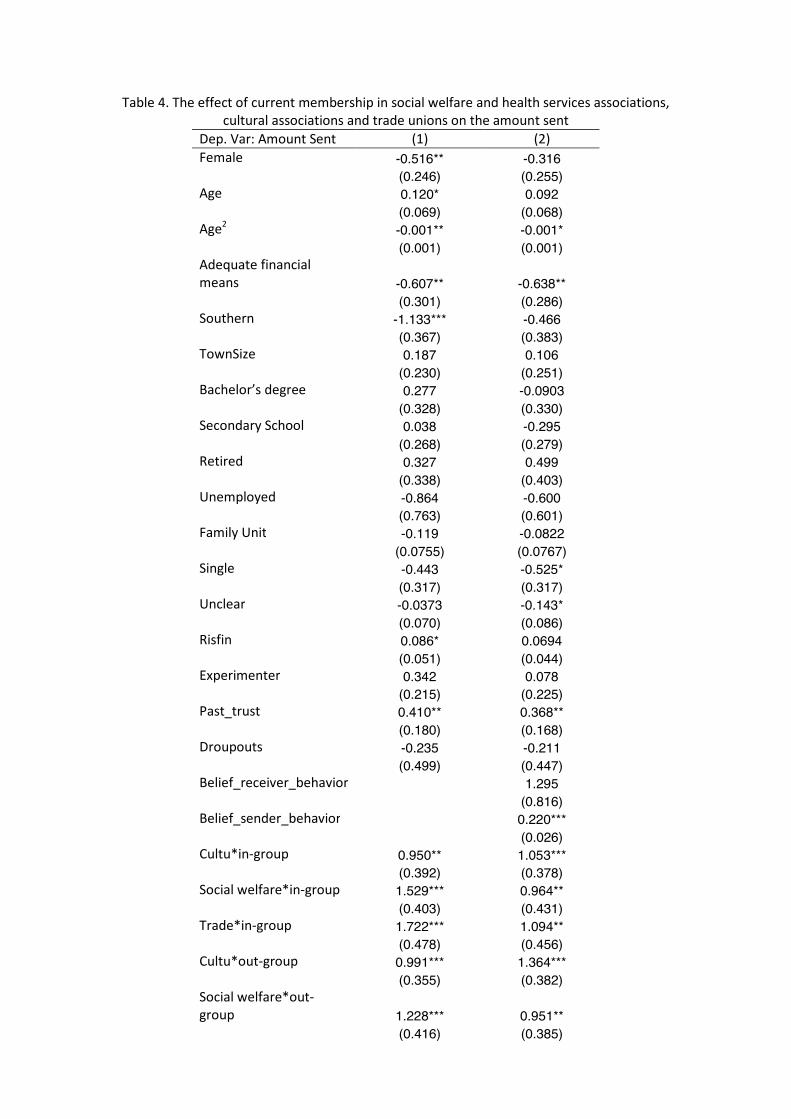
Table 4. The effect of current membership in social welfare and health services associations, cultural associations and trade unions on the amount sent
Dep. Var: Amount Sent (1) (2) Female -0.516** -0.316 (0.246) (0.255) Age 0.120* 0.092 (0.069) (0.068) Age2 -0.001** -0.001* (0.001) (0.001) Adequate financial means -0.607** -0.638** (0.301) (0.286) Southern -1.133*** -0.466 (0.367) (0.383) TownSize 0.187 0.106 (0.230) (0.251) Bachelor’s degree 0.277 -0.0903 (0.328) (0.330) Secondary School 0.038 -0.295 (0.268) (0.279) Retired 0.327 0.499 (0.338) (0.403) Unemployed -0.864 -0.600 (0.763) (0.601) Family Unit -0.119 -0.0822 (0.0755) (0.0767) Single -0.443 -0.525* (0.317) (0.317) Unclear -0.0373 -0.143* (0.070) (0.086) Risfin 0.086* 0.0694 (0.051) (0.044) Experimenter 0.342 0.078 (0.215) (0.225) Past_trust 0.410** 0.368** (0.180) (0.168) Droupouts -0.235 -0.211 (0.499) (0.447) Belief_receiver_behavior 1.295 (0.816) Belief_sender_behavior 0.220*** (0.026) Cultu*in-group 0.950** 1.053*** (0.392) (0.378) Social welfare*in-group 1.529*** 0.964** (0.403) (0.431) Trade*in-group 1.722*** 1.094** (0.478) (0.456) Cultu*out-group 0.991*** 1.364*** (0.355) (0.382) Social welfare*out-group 1.228*** 0.951** (0.416) (0.385)
table 4 (continued) Trade*out-group 0.621 0.629 (0.414) (0.430) Cut1 -0.617 0.386 (1.771) (1.776) Cut2 0.637 1.922 (1.775) (1.793) Cut3 2.238 3.893** (1.779) (1.786) Cut4 3.554** 5.598*** (1.788) (1.785) Cut5 4.780*** 7.233*** (1.801) (1.806) Pseudo R2 0.081 0.204 Prob>χ2 0.000 0.000 Number of obs. 329 327
Robust standard errors in brackets. * Significant at 10%; ** significant at 5%; *** significant at 1%.
Regression1 includes the interaction terms between the participation in the two different treatments and
the membership in social welfare and health services associations (Social welfare*out-group and Social
welfare*in-group), cultural associations (Cultu*out-group and Cultu*in-group) and trade unions (Trade*out-
group and Trade*in-group). Regression 2 takes into consideration the role of beliefs.
In the Investment Game, being paired with a member of one’s own association increases contribution with
respect to contributions by Never-members. This effect is statistically significant (at least at the 5% level)
and holds for all the types of associations considered. In respect to regression 1, it is greater for trade
unions members (marginal effect associated with the highest level of contribution equal to 0.255)than for
social welfare and health services associations (0.212) and cultural associations (0.111).
Moreover, when Members play in the out-group treatment, their contribution also tends to be higher than
Never-members’. This effect is significant at the 5% level for social welfare and health services associations’
and cultural associations’ members, and it is not statistically significant for trade unions’ members. In the
out-group scenario, the greater probability to observe the highest contribution for Members with respect
to Never-members is observed for members of social welfare and health services associations (marginal
effect equal to 0.151). The marginal effect for cultural associations’ members is equal to 0.116 and the one
related to trade unions equal to 0.065 but is not statistically significant.
A comparison between the coefficients of the interaction variables reveals an in-group favoritism effect for
trade unions members (Wald test between coefficient of Trade*in-group and Trade*out-group p=0.019)
while no effect emerges for cultural (p= 0.915) and social welfare and health services (p=0.466) associations
when their decisions in the in-group and out-group treatment are compared.
The introduction of beliefs among the control variables significantly changes a result related to
membership: the in-group favoritism effect for trade union members disappears. This seems to suggest
that a key reason behind lower contribution of trade union members in the out-group treatment is the
lower level of trust in non-members compared to trust in fellow trade union members. In fact, trade union
members expect on average 0.335 (std.dev 0.166) from receivers of their own group (belief normalized
given the amount sent by the sender), but expect considerably less (0.269, std.dev 0.151) when paired with
a non-member. Moreover, they expect other trade union members to behave more cooperatively as
senders (average expected contribution equal to 15, std.dev. 7.440) than non-members (mean 12.606,
std.dev. 5.289), also this belief contributes to generate the in-group favoritism effect.
Result 2: Current participation in social welfare and health services and cultural associations is significantly
associated with senders’ contribution both in the in-group and in the out-group treatment. Trade unions’
members contribute more than Never-members in the in-group treatment, while in the out-group treatment
the effect is not significant. In-group favoritism emerges only with respect to members of trade unions.
Beliefs over receivers’ and senders’ behavior, appear to mediate the trade unions’ in-group favoritism effect.
5.3 The effect of current membership when the distinction between Putnam-type and Olson-type
associations is considered
Following the empirical literature (Knack and Keefer 1997 and Knack 2003) that firstly operationalized the
different theoretical approaches proposed by Putnam et al. (1993) and Olson (1982), we distinguish
between participation in Olson-type and Putnam-type associations (see discussion in section 4). Olson*out-
group is a dummy variable taking the value of 1 when a subject played in the out-group treatment and is
member of at least one association between: trade unions, political parties or groups, and professional
associations. Putnam*out-group is a dummy variable that takes the value of 1 when the subject took part in
the out-group treatment and is member of at least a Putnam-type association as it was defined in section 4.
With respect to the in-group treatment, we must consider that people who took part in the treatment as
members of a specific association, say a trade union, could also be members of a Putnam-type association.
However, in this case, the in-group effect highlights the members’ behavior with respect to the other
members of the trade union. Indeed, if we are interested in the in-group effect when people interact with
other members of their own Olson-type or Putnam-type association, we have to consider their specific
membership with respect to the associations used to create the in-group sessions.
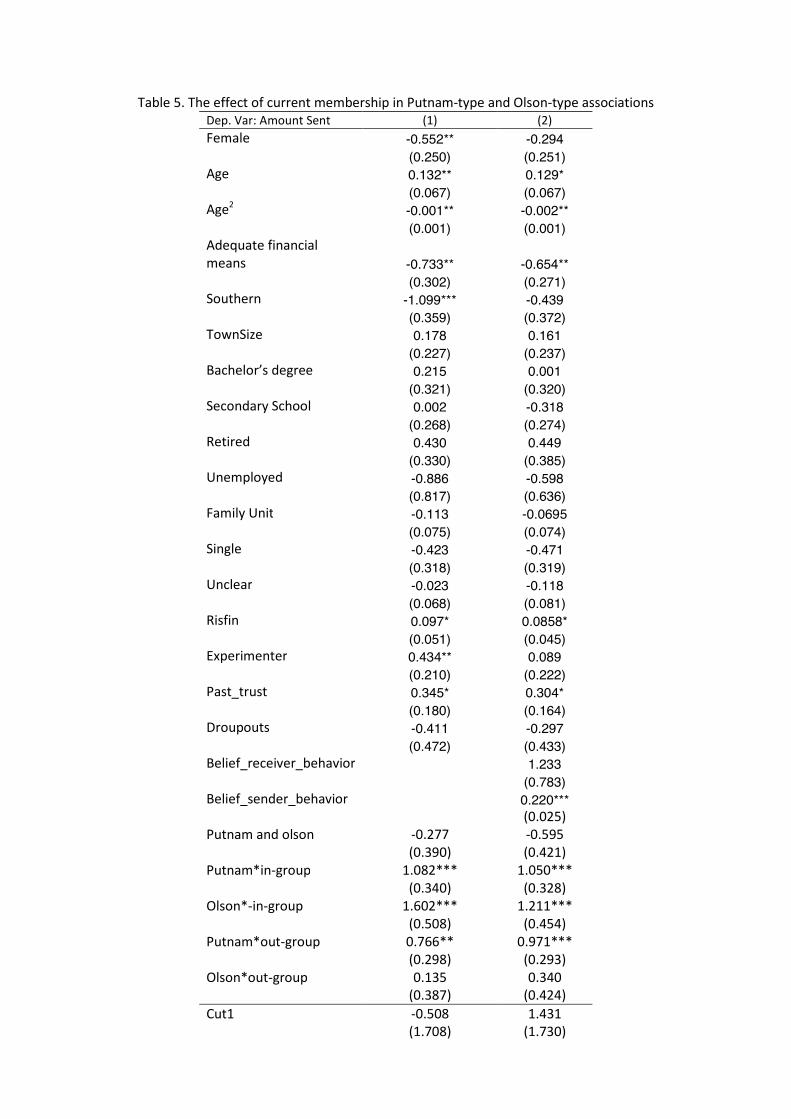
Table 5. The effect of current membership in Putnam-type and Olson-type associations Dep. Var: Amount Sent (1) (2) Female -0.552** -0.294 (0.250) (0.251) Age 0.132** 0.129* (0.067) (0.067) Age2 -0.001** -0.002** (0.001) (0.001) Adequate financial means -0.733** -0.654** (0.302) (0.271) Southern -1.099*** -0.439 (0.359) (0.372) TownSize 0.178 0.161 (0.227) (0.237) Bachelor’s degree 0.215 0.001 (0.321) (0.320) Secondary School 0.002 -0.318 (0.268) (0.274) Retired 0.430 0.449 (0.330) (0.385) Unemployed -0.886 -0.598 (0.817) (0.636) Family Unit -0.113 -0.0695 (0.075) (0.074) Single -0.423 -0.471 (0.318) (0.319) Unclear -0.023 -0.118 (0.068) (0.081) Risfin 0.097* 0.0858* (0.051) (0.045) Experimenter 0.434** 0.089 (0.210) (0.222) Past_trust 0.345* 0.304* (0.180) (0.164) Droupouts -0.411 -0.297 (0.472) (0.433) Belief_receiver_behavior 1.233 (0.783) Belief_sender_behavior 0.220*** (0.025) Putnam and olson -0.277 -0.595 (0.390) (0.421) Putnam*in-group 1.082*** 1.050*** (0.340) (0.328) Olson*-in-group 1.602*** 1.211*** (0.508) (0.454) Putnam*out-group 0.766** 0.971*** (0.298) (0.293) Olson*out-group 0.135 0.340 (0.387) (0.424) Cut1 -0.508 1.431 (1.708) (1.730)
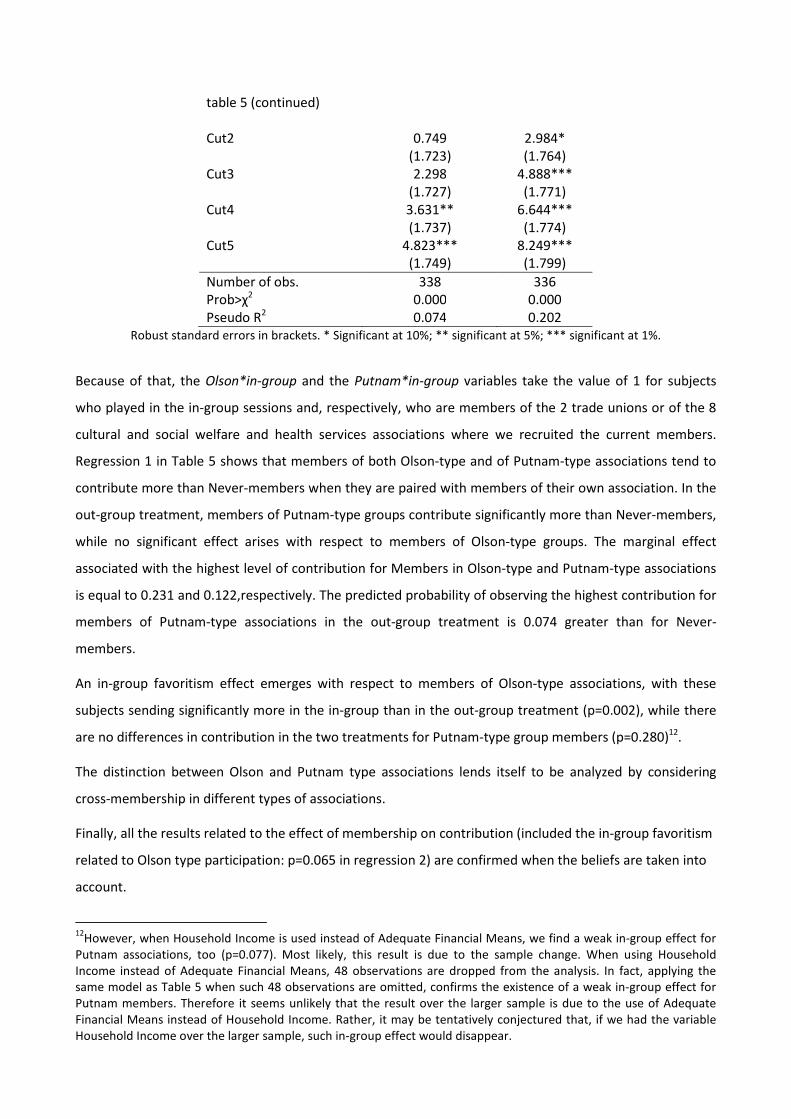
table 5 (continued) Cut2
0.749
2.984* (1.723) (1.764) Cut3 2.298 4.888*** (1.727) (1.771) Cut4 3.631** 6.644*** (1.737) (1.774) Cut5 4.823*** 8.249*** (1.749) (1.799) Number of obs. 338 336 Prob>χ2 0.000 0.000 Pseudo R2 0.074 0.202
Robust standard errors in brackets. * Significant at 10%; ** significant at 5%; *** significant at 1%.
Because of that, the Olson*in-group and the Putnam*in-group variables take the value of 1 for subjects
who played in the in-group sessions and, respectively, who are members of the 2 trade unions or of the 8
cultural and social welfare and health services associations where we recruited the current members.
Regression 1 in Table 5 shows that members of both Olson-type and of Putnam-type associations tend to
contribute more than Never-members when they are paired with members of their own association. In the
out-group treatment, members of Putnam-type groups contribute significantly more than Never-members,
while no significant effect arises with respect to members of Olson-type groups. The marginal effect
associated with the highest level of contribution for Members in Olson-type and Putnam-type associations
is equal to 0.231 and 0.122,respectively. The predicted probability of observing the highest contribution for
members of Putnam-type associations in the out-group treatment is 0.074 greater than for Never-
members.
An in-group favoritism effect emerges with respect to members of Olson-type associations, with these
subjects sending significantly more in the in-group than in the out-group treatment (p=0.002), while there
are no differences in contribution in the two treatments for Putnam-type group members (p=0.280)12.
The distinction between Olson and Putnam type associations lends itself to be analyzed by considering
cross-membership in different types of associations.
Finally, all the results related to the effect of membership on contribution (included the in-group favoritism
related to Olson type participation: p=0.065 in regression 2) are confirmed when the beliefs are taken into
account.
12However, when Household Income is used instead of Adequate Financial Means, we find a weak in-group effect for Putnam associations, too (p=0.077). Most likely, this result is due to the sample change. When using Household Income instead of Adequate Financial Means, 48 observations are dropped from the analysis. In fact, applying the same model as Table 5 when such 48 observations are omitted, confirms the existence of a weak in-group effect for Putnam members. Therefore it seems unlikely that the result over the larger sample is due to the use of Adequate Financial Means instead of Household Income. Rather, it may be tentatively conjectured that, if we had the variable Household Income over the larger sample, such in-group effect would disappear.
Result 3: When the distinction between Olson-type and Putnam-type groups is analyzed, we find members
of both group types sending more than Never-members in the in-group treatment, while only members of
Putnam-type associations send more in the out-group treatment. An in-group favoritism effect arises, but
only with respect to members of Olson-type associations.
5.4 The effect of intensity of voluntary participation
In this section we study the effect of four proxies for the intensity of voluntary participation on subjects’
behavior. Two proxies concern current participation: the average number of hours spent volunteering per
week (Hours_spent_vol) and the number of organizations of which a participant is currently member
(N_organ). Two proxies measure the intensity of participation during subjects’ lifetime: the total number of
years spent as a voluntary member (N_years), and the number of associations of which one is or was
member (N_organ_tot).
Table 6 shows the effect of these variables on the amount sent considering the two different treatments
(the variables are interacted with the treatment variables) and without distinguishing between the
different types of associations. Results do not significantly change when the distinction between the two
treatments is not considered, i.e. when proxies for intensity of participation are not interacted with the
treatment variables (and the treatment dummy is included or not) (analysis available upon request).
Regressions 1-4 in Table 6 investigate the existence of linear effects of the proxies of participation intensity
on senders’ contribution. Regression 5 includes dummy variables capturing current participation, across
treatments, in only one association (dummy_N_organ_X_in and dummy_N_organ_X_out) or in more than
one association (N_organ_X_in and N_organ_X_out). Regression 6 considers the same distinction of
regression 5 but with respect to the associations a subject has joined during all her lifetime.
Table 6 does not reveal general evidence of intensity effects of participation on senders’ decisions in the
game. The two statistically significant effects concern: a) the average number of hours spent volunteering
per week; however, the sign is here opposite to what we expected: the more time one spends in
associations, the lower the contributions to unknown others in the out-group treatment; b) the number of
associations of which one is or was member, but the effect is only weakly significant.
Regressions 5 and 6 show a positive effect of participation in one or more than one association with respect
to Never-members, but Wald tests do not reveal any appreciable effect of participating in more than one
vis-à-vis just one association (Wald test dummy_N_organ_X_in - N_organ_X_in p=0.617;
dummy_N_organ_X_out- N_organ_X_out p=0.902; dummy_N_organ_tot_X_in- N_organ_tot_X_in p=0.134;
dummy_N_organ_tot_X_out- N_organ_tot_X_out p=0.607)
Table 6. The effect of intensity of participation
Ologit (1)
Ologit (2)
Ologit (3)
Ologit (4)
Ologit (5)
Ologit (6)
Hours_spent_vol_X_in -0.063** (0.025) Hours_spent_vol_X_out 0.009 (0.010) N_organ_X_in 0.045 (0.096) N_organ_X_out 0.099 (0.149) N_years_X_in -0.011 (0.013) N_years_X_out -0.001 (0.015) N_organ_tot_X_in 0.126* (0.073) N_organ_tot_X_out 0.099 (0.110) dummy_N_organ_X_in 0.893** (0.364) dummy_N_organ_X_out 1.259*** (0.366) N_organ_X_in 0.855*** (0.322) N_organ_X_out 1.433*** (0.373) dummy_N_organ_tot_X_in 0.775* (0.396) dummy_N_organ_tot_X_out 0.986** (0.400) N_organ_tot_X_in 0.945*** (0.322) N_organ_tot_X_out 1.530*** (0.354) Pseudo R2 0.083 0.075 0.075 0.079 0.075 0.077 Prob>χ2 0.000 0.000 0.000 0.000 0.000 0.000 Number of obs. 322 338 331 329 339 329 Robust standard errors in brackets. * Significant at 10%; ** significant at 5%; *** significant at 1%. All the regressions include the following control variables: Female, Age, Age2, Adequate financial means, Southern, TownSize, Bachelor’s degree, Secondary School, Retired, Unemployed, Family Unit, Single, Unclear, Risfin, Experimenter, Droupouts, Trust_past.
Table 7 considers the effect of intensity of participation when the distinction between social welfare and
health services associations, cultural associations and trade unions only referred to the associations where
we recruited current member is taken into account.
Hours_in_ass_X_in and Hours_in_ass_X_out are the interaction variables between the number of hours
spent on average per year in the associations where we recruited current members and the in-group and
out-group treatment variables; Years_in_ass_X_in and Years_in_ass_X_out are the interaction terms
between the number of years one has already spent in these associations and the two treatment variables.
No significant effect of intensity of participation arises, either when we focus on participation in the
associations where we recruited actual members.
Table 7. The effect of intensity of participation in social welfare and health services associations, cultural associations and trade unions on the amount sent
Ologit (1)
Ologit (2)
Hours_in_ass_X_in 0.002 (0.002) Hours_in_ass_X_out 0.001 (0.002) Years_in_ass_X_in -0.002 (0.001) Years_in_ass_X_out 0.002 (0.002) Pseudo R2 0.096 0.093 Prob>χ2 0.000 0.000 Number of obs. 254 269 Robust standard errors in brackets. * Significant at 10%; ** significant at 5%; *** significant at 1%; All the regressions include the following control variables: Female, Age, Age2, Adequate financial means, Southern, TownSize, Bachelor’s degree, Secondary School, Retired, Unemployed, Family Unit, Single, Unclear, Risfin, Experimenter, Droupouts, Trust_past.
Table 8 shows results obtained when the distinction between Putnam-type and Olson-type associations is
introduced. We could explore the intensity of associational membership with respect to the Putnam/Olson
distinction only by using the number of associations one is, or was, member. In fact, we do not have clear-
cut information related to the number of hours or years spent in each type of association. Our measure of
multi-membership refers only to the out-group treatment since there is only one association for each
subject that was used to create the pairs in the in-group sessions. Regressions 1 and 2 show the results
when linear effects are analyzed. Regressions 3 and 4 include both (a) dummy variables associated with
subjects that participate in only one Putnam-type or Olson-type association (these variables are:
dummy_olson_gen_x_out_num and dummy_putnam_gen_x_out_num in regression 3 where only current
participation is considered and dummy_putnam_gen_x_out_ntot and dummy_olson_gen_x_out_ntot in
regression 4 where all the associations joined by subjects are taken into consideration), and (b) dummy
variables that capture the participation in more than one Putnam/Olson-type association
(olson_gen_x_out_num and putnam_gen_x_out_num in regression 3 and olson_gen_x_out_ntotand
putnam_gen_x_out_ntot in regression 4).
By considering the Putnam/Olson distinction, we find only two significant effects due to intensity of
participation: a) a linear effect when all the Putnam type associations joined by subjects are taken into
consideration (regression 2); b) when all the association joined by subjects in their life are considered
(regression 4) a significantly higher contribution is observed for senders who joined more than one Putnam
association with respect to senders who joined only one Putnam association (Wald test p=0.020)13.
Table 8. The effect of intensity of participation in Putnam-type and Olson-type associations on the amount sent
Ologit (1)
Ologit (2)
Ologit (3)
Ologit (4)
olson_gen_x_out_num 0.326 (0.996) putnam_gen_x_out_num 0.130 (0.108) olson_gen_x_out_ntot 0.179 (0.447) putnam_gen_x_out_ntot 0.203** (0.091) dummy_olson_gen_x_out_num -0.136 (0.320) dummy_putnam_gen_x_out_num 0.577* (0.343) olson_gen_x_out_num 0.631 (0.758) putnam_gen_x_out_num 0.810*** (0.301) dummy_olson_gen_x_out_ntot -0.131 (0.289) dummy_putnam_gen_x_out_ntot 0.0579 (0.396) olson_gen_x_out_ntot 0.550 (0.608) putnam_gen_x_out_ntot 0.873*** (0.291) Pseudo R2 0.074 0.077 0.075 0.079 Prob>χ2 0.000 0.000 0.000 0.000 Number of obs. 338 338 338 338
Robust standard errors in brackets. * Significant at 10%; ** significant at 5%; *** significant at 1%.All the regressions include the following control variables: Female, Age, Age2, Adequate financial means, Southern, TownSize, Bachelor’s degree, Secondary School, Retired, Unemployed, Family Unit, Single, Unclear, Risfin, Experimenter, Droupouts, Trust_past.
When we include in the regressions the proxies for intensity of participation not interacted with the
treatment variables, we find a positive and weakly significant effect of participation in more than 1
association with respect to participation in only one association both considering Olson type and Putnam
type associations (regression 4) (data available upon request). This holds whether or not we include
treatment dummies when we consider Putnam type associations. When we consider Olson type
associations, the test is just outside the conventional levels of significance if the treatment dummies are
included.
13However, this result disappears when Household Income replaces Adequate Financial Means.
Result 4: No robust evidence of an intensity effect of participation on senders behavior in the game arises.
6. Conclusions Our experimental analysis aimed at studying association members’ propensity to trust relative to people
who have never been voluntary members in their lifetime.
Our experimental design, based on a standard Investment Game (Berg et al. 1995), is characterized by an
in-group treatment, where members interact with other members of their own association, and an out-
group treatment, in which members are paired with people randomly drawn from the general population.
The present contribution places itself within two main strands of literature. On the one hand, it concerns
the in-group/out-group literature that originated from the seminal contribution by Tajfel (1970). On the
other hand it refers to the seminal contributions by Olson (1982) and Putnam et al. (1993), which also
inspired empirical works (Knack and Keefer 1997 and Knack 2003), on the participation in different types of
associations as a determinant of generalized trust.
To our knowledge, the present study represents the first attempt to investigate the relationship between
voluntary participation in different kinds of associations and propensity to cooperate by involving people of
different age, education and socio-economic status (previous contributions focused on samples of college
students: Glaeser et al. 2000, Anderson et al. 2004).
Evidence based on Senders’ behavior shows six main results:
1) Voluntary members of associations contribute significantly more than Never-members. Members
send on average around 50% more than Never-members, and the percentages do not differ much
between in-group and out-group treatments; this is in stark contrast with both HHZ and RS.
2) Members contribute more when paired with fellow members than when paired with non-
members, but overall in-group favoritism effect is only weak.
3) The type of association joined by subjects matters in explaining propensity to cooperate across the
two treatments:
a) current participation in social welfare and health services associations and cultural
associations (not characterized by particular distributional goals and then usually classified
as “Putnam-type” associations) is significantly associated with senders’ contribution both in
the in-group and in the out-group treatment;
b) members of trade unions (usually considered as “Olson-type” associations) contribute
more than non-members in the in-group treatment, while in the out-group treatment the
effect disappears;
c) in-group favoritism emerges only with respect to members of trade unions.
4) Result (3) is further confirmed when the whole range of associations of which an individual is
member is explicitly taken into account. We find members of both Olson-type and Putnam-type
associations sending more than Never-members in the in-group treatment, while only members of
Putnam-type associations send more in the out-group treatment; moreover, an in-group favoritism
effect arises, but only with respect to members of Olson-type associations.
5) We find hardly any evidence of an effect of the intensity/time of participation in association onto
propensity to trust others. In one case (total number of hours spent in association throughout one's
life) the effect is actually contrary to our hypothesis. Only in the case of number of associations do
we find a positive effect in line with Paxton (2007).
A key issue on the analysis between voluntary participation and propensity to trust concerns the
possibility of self-selection: does voluntary participation increase propensity to cooperate or are
cooperative people more likely to become voluntary members of associations? In this respect, the
absence of a clear intensity effect of participation (result 5) seems not to support the idea that staying
in association increases propensity to cooperate. We aim to further examine the issue of self-selection
by implementing other methods.
References
Andreoni, James and Lise Vesterlund.2001. “Which is the Fair Sex? Gender Differences in Altruism.”Quarterly
Journal of Economics,116: 293-312. Axelrod, Robert. 1984. The Evolution of Cooperation. Basic Books Akerlof, George A. and Rachel E. Kranton. 2005.“Identity and the Economics of Organizations.”Journal of
Economic Perspectives, 19(1): 9–32. Bernhard, Helen, Ernst Fehr and Urs Fischbacher. 2006. “Group Affiliation and Altruistic Norm
Enforcement.”American Economic Review, Papers and Proceedings, 96(2): 217–21. Bohnet, Iris and Bruno Frey.1999a.“The sound of silence in prisoner's dilemma and dictator games.”Journal of
Economic Behavior and Organization, 38: 47-57. Bohnet, Iris. and Bruno Frey. 1999b. “Social distance and other-regarding behavior in dictator games:
comment.” American Economic Review, 89: 335–339. Bolton, G.E., R.Zwick and E. Katok. 1998. “Dictator game giving: Rules of fairness versus acts of kindness.”
International Journal of Game Theory, 2:269-299. Brewer, M. B. 1979. “In-group bias in the minimal intergroup situation: A cognitive-motivational
analysis.”Psychological Bulletin, 86:307-324. Brewer, M. B. 1999. “The psychology of prejudice: Ingroup love or outgrouphate?.”Journal of Social Issues, 55
(3): 429-444. Charness, G., L. Rigotti and A. Rustichini. 2007. “Individual Behavior and Group Membership.” American
Economic Review, 97(4): 1340-1352. Croson, R. and N. Buchan. 1999. “Gender and Culture: International Experimental Evidence from Trust
Games.”American Economic Review, Papers and Proceedings, 89: 386-391. Eckel, C.C. 2008.“Experiments on Gender Differences.” In The New Palgrave Dictionary of Economics,
2ndedition, eds S.N. Durlauf and L.E. Blume. Palgrave Macmillan. Eckel, C.C and P.J. Grossman.1998. “Are Women Less Selfish than Men? Evidence from Dictator
Experiments.”Economic Journal, 108: 726-735. Eckel, C.C. and P.J. Grossman. 2001. “Chivalry and Solidarity in Ultimatum Games.”Economic Inquiry,39:171-
188. Eckel C. C. and P. J. Grossman.2008.“Differences in the Economic Decisions of Men and Women: Experimental
Evidence”. In Handbook of Experimental Economics Results, Volume 1, ed. Charles Plott and Vernon Smith, 509–19. New York: Elsevier.
Hargreaves Heap, Shaun P. and Daniel J.Zizzo. 2009. “The Value of Groups.”American Economic Review, 99(1): 295–323.
Knack, P. 2003.“Groups, growth and trust: cross-country evidence on the Olson and Putnam hypotesis.”Public
Choice, 117:341-355. Karlan, Dean S. (2001).Microfinance Impact Assessments: The Perils of Using New Members as a Control Group,
Journal of Microfinance, 3(2), 75-85.Knack, S. and Keefer P. 1997.“Does social capital have an economic payoff? A cross country investigation.”Quarterly Journal of Economics, 112:1251-1287.
Glaeser, Edward L., David I. Laibson, Jose A. Scheinkman, and Christine L. Soutter.2000.“Measuring Trust.”Quarterly Journal of Economics, 115(3): 811–46.
Goette, Lorenz; David Huffman and Meier, Stephan. 2006.“The Impact of Group Membership on Cooperation and Norm Enforcement: Evidence Using Random Assignment to Real Social Groups.”American Economic
Review, Papers and Proceedings,96(2): 212–16. Ledyard, J. 1995. “Public Goods: A Survey of Experimental Research.” In Handbook of Experimental Economics,
eds J. Kagel and A.E. Roth. Princeton University Press: New York. Mullen, B., R. Brown and C. Smith. 1992. “Ingroup bias as a function of salience, relevance, and status: An
integration.”European Journal of Social Psychology, 22:103–122. Olson, M. 1982.The rise and decline of nations. Yale University Press, New Haven Ortmann, A. and L. K. Tichy1999. “Gender differences in the laboratory: evidence from prisoner's dilemma
games.”Journal of Economic Behavior and Organization, 39: 327-339. Paxton, Pamela. 2007.“Association Memberships and Generalized Trust: A Multilevel Model Across 31
Countries.” Social Forces, 86(1): 47-76.
Putnam, R. R. Leonardi and R. Nanetti. 1993. Making democracy work. Princeton University Press, Princeton Rousseau, D.M. 1989.“Psychological and implied contracts in organizations.”Employee Rights and
Responsibilities Journal, 2: 121-139. Ruffle, Bradley J. and Richard Sosis. 2006. “Cooperation and the In-Group-Out-Group Bias: A Field Test on
Israeli Kibbutz Members and City Residents.”Journal of Economic Behavior and Organization, 60(2): 147-163.
Solnick, S. 2001. “Gender differences in the ultimatum game.”Economic Inquiry, 39:189-200. Tajfel, H. 1970. “Experiments in intergroup discrimination.”Scientific American, 5(223): 79–97. Tajfel, H. 1974. Social identity and intergroup behavior.SocialScienceInformation, 9:113-144. Tocqueville, A. 1840.De la démocratie en Amérique. English translation, Democracy in America.C hicago
University Press, Chicago 2000. Yamagishi T, Yamagishi M (1994). “Trust and Commitment in the United States and Japan.” Motivation and
Emotion, 18 (2):129-66. Yuki M, Maddux W, Brewer M, Takemura K. (2004) “Cross-Cultural Differences in Relationship and Group-
Based Trust,” Personality and Social Psychology Bulletin, 31 (1), 48-62. Zucker, Lynne G. 1986. “Production of Trust: Institutional Sources of Economic Structure, 1840-1920.” Research
in Organizational Behavior,8:53-111.
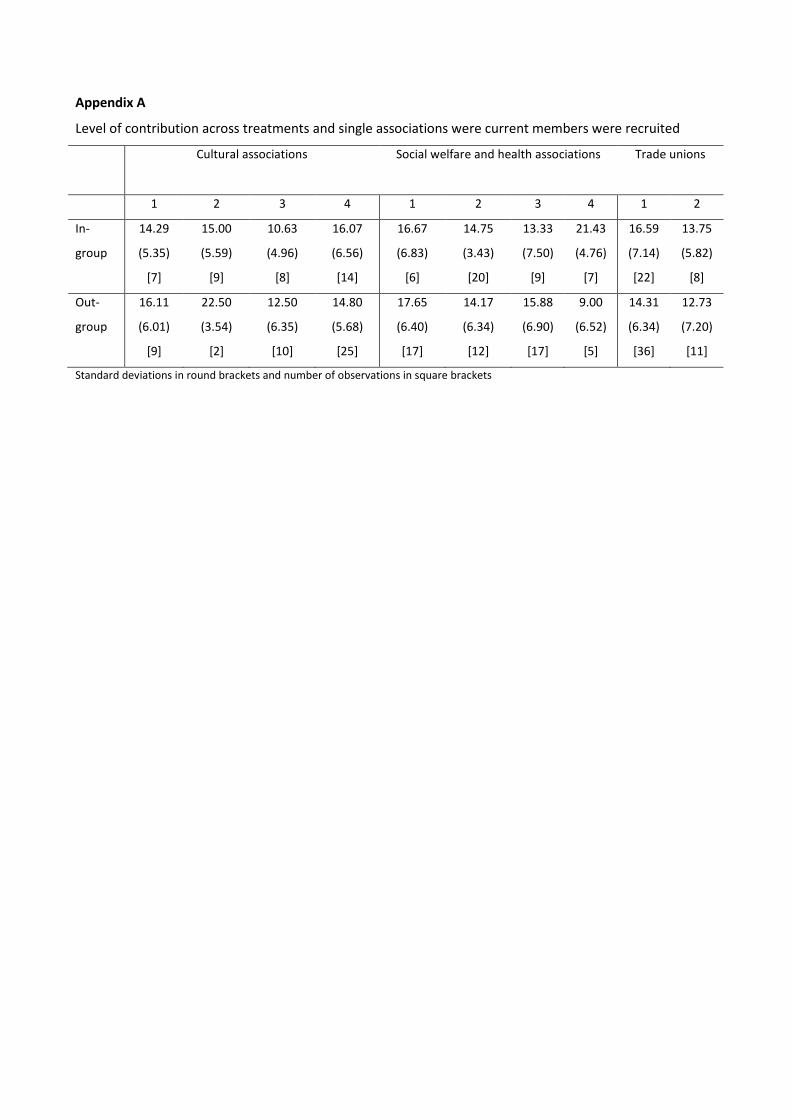
Appendix A
Level of contribution across treatments and single associations were current members were recruited
Cultural associations
Social welfare and health associations Trade unions
1 2 3 4 1 2 3 4 1 2
In-
group
14.29
(5.35)
[7]
15.00
(5.59)
[9]
10.63
(4.96)
[8]
16.07
(6.56)
[14]
16.67
(6.83)
[6]
14.75
(3.43)
[20]
13.33
(7.50)
[9]
21.43
(4.76)
[7]
16.59
(7.14)
[22]
13.75
(5.82)
[8]
Out-
group
16.11
(6.01)
[9]
22.50
(3.54)
[2]
12.50
(6.35)
[10]
14.80
(5.68)
[25]
17.65
(6.40)
[17]
14.17
(6.34)
[12]
15.88
(6.90)
[17]
9.00
(6.52)
[5]
14.31
(6.34)
[36]
12.73
(7.20)
[11]
Standard deviations in round brackets and number of observations in square brackets
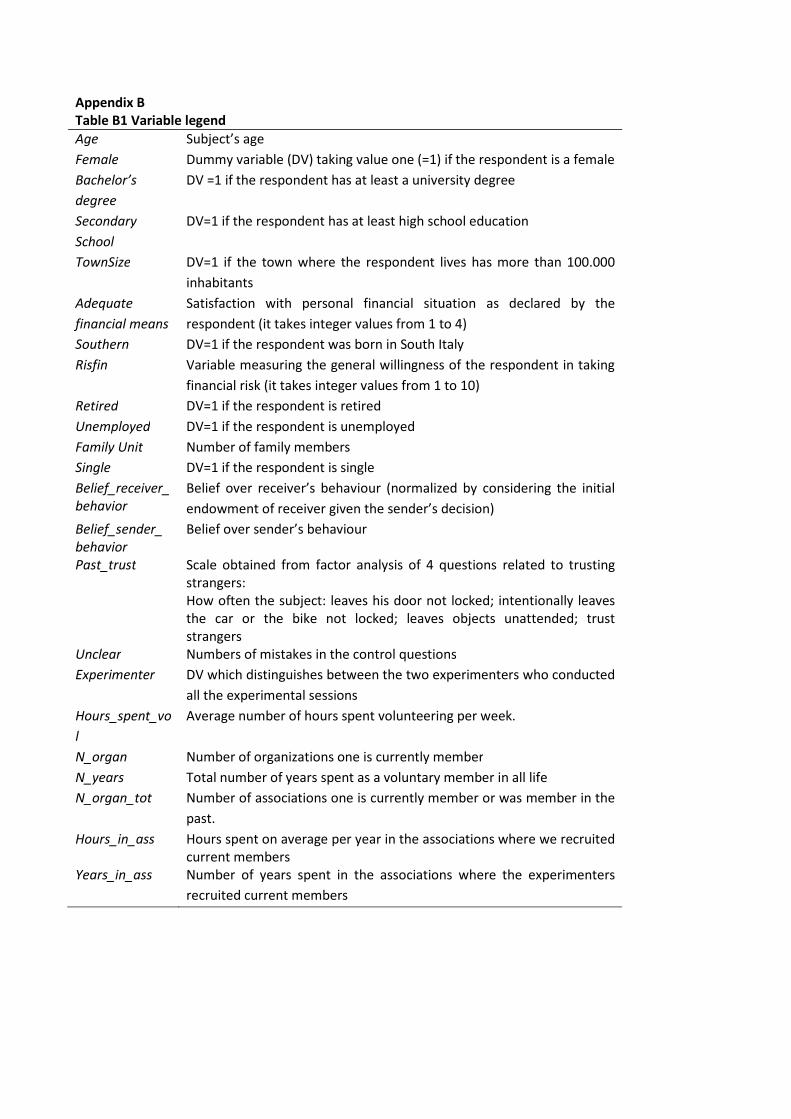
Appendix B Table B1 Variable legend Age Subject’s age
Female Dummy variable (DV) taking value one (=1) if the respondent is a female
Bachelor’s
degree
DV =1 if the respondent has at least a university degree
Secondary
School
DV=1 if the respondent has at least high school education
TownSize DV=1 if the town where the respondent lives has more than 100.000
inhabitants
Adequate
financial means
Satisfaction with personal financial situation as declared by the
respondent (it takes integer values from 1 to 4)
Southern DV=1 if the respondent was born in South Italy
Risfin Variable measuring the general willingness of the respondent in taking
financial risk (it takes integer values from 1 to 10)
Retired DV=1 if the respondent is retired
Unemployed DV=1 if the respondent is unemployed
Family Unit Number of family members
Single DV=1 if the respondent is single
Belief_receiver_
behavior
Belief over receiver’s behaviour (normalized by considering the initial
endowment of receiver given the sender’s decision)
Belief_sender_
behavior
Belief over sender’s behaviour
Past_trust Scale obtained from factor analysis of 4 questions related to trusting strangers: How often the subject: leaves his door not locked; intentionally leaves the car or the bike not locked; leaves objects unattended; trust strangers
Unclear Numbers of mistakes in the control questions
Experimenter DV which distinguishes between the two experimenters who conducted
all the experimental sessions
Hours_spent_vo
l
Average number of hours spent volunteering per week.
N_organ Number of organizations one is currently member
N_years Total number of years spent as a voluntary member in all life
N_organ_tot Number of associations one is currently member or was member in the
past.
Hours_in_ass Hours spent on average per year in the associations where we recruited current members
Years_in_ass Number of years spent in the associations where the experimenters
recruited current members
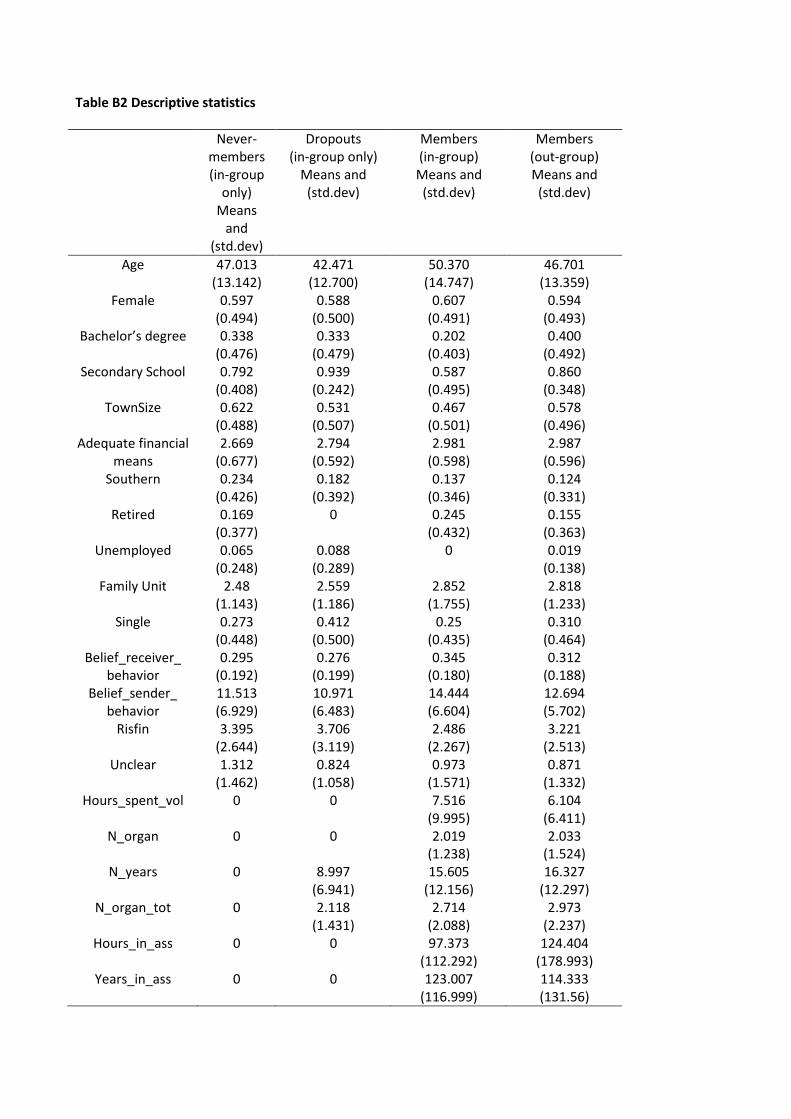
Table B2 Descriptive statistics Never-
members (in-group
only) Means
and (std.dev)
Dropouts (in-group only)
Means and (std.dev)
Members (in-group) Means and
(std.dev)
Members (out-group) Means and
(std.dev)
Age
47.013 (13.142)
42.471 (12.700)
50.370 (14.747)
46.701 (13.359)
Female
0.597 (0.494)
0.588 (0.500)
0.607 (0.491)
0.594 (0.493)
Bachelor’s degree 0.338 (0.476)
0.333 (0.479)
0.202 (0.403)
0.400 (0.492)
Secondary School 0.792 (0.408)
0.939 (0.242)
0.587 (0.495)
0.860 (0.348)
TownSize 0.622 (0.488)
0.531 (0.507)
0.467 (0.501)
0.578 (0.496)
Adequate financial means
2.669 (0.677)
2.794 (0.592)
2.981 (0.598)
2.987 (0.596)
Southern 0.234 (0.426)
0.182 (0.392)
0.137 (0.346)
0.124 (0.331)
Retired 0.169 (0.377)
0 0.245 (0.432)
0.155 (0.363)
Unemployed 0.065 (0.248)
0.088 (0.289)
0
0.019 (0.138)
Family Unit 2.48 (1.143)
2.559 (1.186)
2.852 (1.755)
2.818 (1.233)
Single 0.273 (0.448)
0.412 (0.500)
0.25 (0.435)
0.310 (0.464)
Belief_receiver_ behavior
0.295 (0.192)
0.276 (0.199)
0.345 (0.180)
0.312 (0.188)
Belief_sender_ behavior
11.513 (6.929)
10.971 (6.483)
14.444 (6.604)
12.694 (5.702)
Risfin 3.395 (2.644)
3.706 (3.119)
2.486 (2.267)
3.221 (2.513)
Unclear 1.312 (1.462)
0.824 (1.058)
0.973 (1.571)
0.871 (1.332)
Hours_spent_vol 0 0 7.516 (9.995)
6.104 (6.411)
N_organ 0 0 2.019 (1.238)
2.033 (1.524)
N_years 0 8.997 (6.941)
15.605 (12.156)
16.327 (12.297)
N_organ_tot 0 2.118 (1.431)
2.714 (2.088)
2.973 (2.237)
Hours_in_ass 0 0 97.373 (112.292)
124.404 (178.993)
Years_in_ass 0 0 123.007 (116.999)
114.333 (131.56)
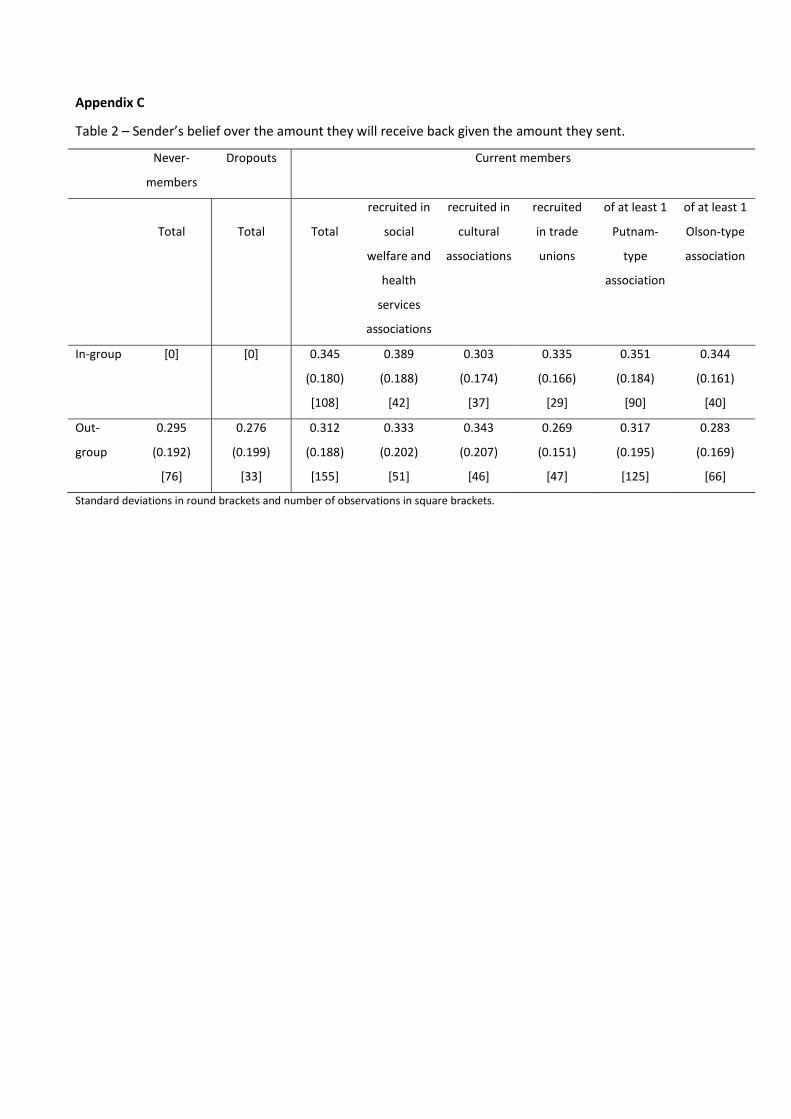
Appendix C
Table 2 – Sender’s belief over the amount they will receive back given the amount they sent.
Never-
members
Dropouts Current members
Total
Total
Total
recruited in
social
welfare and
health
services
associations
recruited in
cultural
associations
recruited
in trade
unions
of at least 1
Putnam-
type
association
of at least 1
Olson-type
association
In-group [0] [0] 0.345
(0.180)
[108]
0.389
(0.188)
[42]
0.303
(0.174)
[37]
0.335
(0.166)
[29]
0.351
(0.184)
[90]
0.344
(0.161)
[40]
Out-
group
0.295
(0.192)
[76]
0.276
(0.199)
[33]
0.312
(0.188)
[155]
0.333
(0.202)
[51]
0.343
(0.207)
[46]
0.269
(0.151)
[47]
0.317
(0.195)
[125]
0.283
(0.169)
[66]
Standard deviations in round brackets and number of observations in square brackets.