the value of international business travel
TRANSCRIPT

1
Falmouth University’s impact on Cornwall’s economy
the voice of business travel
Representing the industry.Influencing the future.the voice of business travelWe connect people, developing relationships and insight that enable a focused approach to lobbying.
We are the voice of UK business travel. We promote business travel as an investment, a commercial strategy and a driver of economic growth.
The GTMC is a highly respected Membership organisation and professional association representing the interests of the business travel community.
We promote the activities of our Members as delivering the best standards of service, quality and value to the business traveller.
THE VALUE OF INTERNATIONAL BUSINESS TRAVEL
MAY 2016
The value of international business travel
Oxford Economics
Oxford Economics was founded in 1981 as a commercial venture with Oxford University’s business college to provide economic forecasting and modelling to UK companies and financial institutions expanding abroad. Since then, we have become one of the world’s foremost independent global advisory firms, providing reports, forecasts and analytical tools on 200 countries, 100 industrial sectors and over 3,000 cities. Our best-of-class global economic and industry models and analytical tools give us an unparalleled ability to forecast external market trends and assess their economic, social and business impact.
Headquartered in Oxford, England, with regional centres in London, New York, and Singapore, Oxford Economics has offices across the globe in Belfast, Chicago, Dubai, Miami, Milan, Paris, Philadelphia, San Francisco, and Washington DC. We employ over 230 full-time people, including more than 150 professional economists, industry experts and business editors—one of the largest teams of macroeconomists and thought leadership specialists. Our global team is highly skilled in a full range of research techniques and thought leadership capabilities, from econometric modelling, scenario framing, and economic impact analysis to market surveys, case studies, expert panels, and web analytics. Underpinning our in-house expertise is a contributor network of over 500 economists, analysts and journalists around the world.
Oxford Economics is a key adviser to corporate, financial and government decision-makers and thought leaders. Our worldwide client base now comprises over 1000 international organisations, including leading multinational companies and financial institutions; key government bodies and trade associations; and top universities, consultancies, and think tanks.
May 2016
All data shown in tables and charts are Oxford Economics’ own data, except where otherwise stated and cited in footnotes, and are copyright © Oxford Economics Ltd.
This report is confidential to GTMC and may not be published or distributed without their prior written permission.
The modelling and results presented here are based on information provided by third parties, upon which Oxford Economics has relied in producing its report and forecasts in good faith. Any subsequent revision or update of those data will affect the assessments and projections shown.
To discuss the report further please contact: Twembi Rukandema
Oxford Economics
Broadwall House, 21 Broadwall, London, SE1 9PL, UK
Tel: +44 207 803 1400
The value of international business travel
TABLE OF CONTENTS
Executive summary .............................................................................................. 1
1. Introduction....................................................................................................... 3
2. UK trends in international business travel ........................................................ 7
2.1 The volume of international business travel ............................................. 7
2.2 Key international business travel markets ................................................ 8
2.3 Important sectors for international business travel ................................... 9
3. Business travel’s relationship to trade and FDI .............................................. 10
3.1 International business travel and trade ................................................... 10
3.2 International business travel and inward FDI .......................................... 13
4. The value of international business travel to the UK ..................................... 15
5. Methodological appendix ............................................................................... 16

The value of international business travel
1 | P a g e
EXECUTIVE SUMMARY As the only representative trade body for the travel management industry, the GTMC commissioned Oxford Economics to estimate the impact that international business travel has on the UK economy.
The relationship that business travel has with economic growth is best described in the context of greater air connectivity— a measure of the aviation linkages between countries and major cities and markets around the world. The evidence suggests that greater connectivity opens up new markets and fosters international trade. It encourages domestic and foreign investment, and facilitates the exchange of ideas and technology across the world. It also stimulates the tourism economy more broadly. Business is a major beneficiary of greater air connectivity, and the primary channel through which the associated benefits accrue to an economy. But can a robust relationship be demonstrated between international business travel per se and economic prosperity, as it can with connectivity?
This report takes a macroeconomic approach to show that it can. Using econometric techniques, this report estimates the impact of international business travel in two specific areas where the literature suggests a particular relationship may be identifiable: namely trade—measured as the sum of imports and exports—and inward foreign direct investment (FDI).
Confirming connectivity relationships found in the literature, our modelling shows that greater air connectivity leads to greater trade. A one percent increase in air connectivity was found to result in an increase in total trade of around 0.10 percent.1 To give a sense of scale, for the UK, this equates to an increase of around £600 million.2
In terms of business travel more specifically, the model shows that greater business travel also has the potential to boost trade, though by a smaller margin. Our results suggest that a one percent increase in business travel volumes boosts total trade by 0.05 percent. In value terms, for the UK, this amounts to an increase in trade of around £400 million.
The model also reveals that business travel plays a greater role in driving exports than imports.3 Our results show that exports are more sensitive to increasing business travel than imports. For the UK, this means that a one percent increase in total business travel increases exports by 0.05 percent and imports by 0.03 percent, around £160m and £125m respectively, when both are analysed in isolation. This result still holds when the effects of inbound and outbound business travel are modelled individually.
As with trade, the result suggest that international business travel attracts inward FDI, and again to a slightly lesser extent than the measure of air connectivity. An increase in business travel of one percent increases FDI by 0.3 percent, equivalent to providing a £100 million boost to the UK investment. Inbound and outbound travel also affected inward FDI in statistically significant ways when tested individually, to similar magnitudes. The results also show how greater connectivity
1 Rounded to 2 decimal places 2 Using ONS estimates of UK trade in 2015. 3 Using ‘exports’ and ‘imports’ as dependent variables in the model, in place of total trade, to test the impact of business travel on each separately
The value of international business travel
2 | P a g e
helps to attract inward FDI. A one percent increase in air connectivity is estimated to increase inward FDI by around 0.9 percent, or £300 million in the UK.
Despite these positive relationships, an analysis of international business travel shows that volumes have declined since 2006 and are yet to reach their pre-financial crisis levels. However, as this report shows, if volumes were to return to pre-crisis levels over the next five years, continuing an upward trend that started in 2010, this could add as much as £6.5 billion to the value of UK trade. This would equate to one percent of total trade in 2015. In terms of FDI we can quantify similar values: a return to pre-crisis levels of business travel could boost inward FDI by £1.6 billion—an amount that equates to 5 percent of total FDI in 2012.4
Finally, through its impact on productivity, this analysis also suggests that increasing international business travel by just one percent could increase UK GDP by £390 million. In the context of exports also increasing by £160m, these results suggest that on average each additional international business trip triggers some £14,000 of exports, which would primarily benefit individual UK firms investing directly in business travel. From an economy wide perspective, those trips would add £34,000 each to GDP.
4 The latest year that data is available
The value of international business travel
3 | P a g e
1. INTRODUCTION The GMTC is the only representative trade body for the travel management industry. With a membership that covers 80 per cent of all managed travel booked, it is the voice of business travel in the UK. As such, the GTMC commissioned Oxford Economics to explore the ways in which business travel makes a difference to UK Plc, and to provide an estimate of that value.
That a link exists between business travel and economic prosperity is intuitive. Earlier survey evidence, undertaken by Oxford Economics and commissioned by the World Travel and Tourism Council, showed the value of business travel from the executive perspective.5 It revealed that business travel was viewed as supporting company performance in four distinct but interconnected ways: by growing new sales; retaining customers; fostering partnerships and; enhancing innovation and developing human capital.6
This experience of business executives on the ground reflects earlier findings by Storper and Venables showing that face-to-face communication is central to the coordination of the economy.7 They argue that ‘powerful reasons’ exist for business people to meet face-to-face, even in a context of relatively high financial and opportunity cost of business travel. In particular, they argue that: ‘deal-making, evaluation and relationship adjustment are heavily dependent on face-to-face contact.’8
Even in a business environment that is increasingly characterised by electronic means of communication, face-to-face engagement seems to have an economic resonance that persists. Edward Glaeser’s work explores how business travel enables more meaningful forms of communication than can be replicated by, for example, phone or videoconference. His work with Jess Gaspar in the late 1990s predicted that ‘cyberspace connectivity could make face-to-face interactions […] more valuable than ever’.9 In economic terms this is because, as Glaeser is clear, but contrary to what is usually assumed, face-to-face interactions and electronic connections are complements not substitutes. This means that technologies ‘strengthen the value of interpersonal contact’ rather than weaken them.10
Such a complementary relationship between technological advance and economic prosperity is also evident in the relationship between air connectivity— a measure of the aviation linkages between countries and major cities and markets around the world—and economic growth. The evidence suggests that greater connectivity opens up new markets and fosters international trade. It encourages domestic and foreign investment, and facilitates the exchange of ideas and technology across the world. It also stimulates the tourism economy more broadly. A January 2015 econometric analysis by InterVISTAS deployed the most recent available data on European connectivity to isolate and quantify its relationship to economic growth, while controlling for other factors that may have an impact on GDP (such as education levels, research and development investment, capital spending,
5 Oxford Economics. “Business Travel: A Catalyst for Economic Performance” (2011). 6 Ibid. 7 M Storper and A J Venables, Buzz: Face-to-face contact and the urban economy (London: Centre for Economic Performance, LSE, 2003), p.2. 8 Ibid., p.3. 9 Edward L Glaeser, "E-ties that bind", The New York Times, 1 March 2011. 10 Ibid.
The value of international business travel
4 | P a g e
and institutional and regulatory factors).11 The research subsequently found that a 10 per cent increase in the ratio of connectivity to GDP was associated with an increase in GDP per capita of 0.5 percent.
Connectivity in the air transport network is clearly, then, a critical asset for a prosperous and vibrant economy. It represents one of the key infrastructures upon which modern globalised businesses depend, thereby supporting long-term sustainable economic growth. Business is a major beneficiary of greater air connectivity, and the primary channel through which the associated benefits accrue to an economy. But beyond its part in connectivity, what of the relationship between economic growth and business travel in particular? Can a robust relationship be demonstrated as it can with connectivity?
The background evidence points in that direction, suggesting that business travel and economic prosperity are interrelated. For example, business travel, and the face-to-face interaction it enables, might play an important role in opening up markets, boosting exports and imports, and encouraging cross-border investment, in particular by helping to bridge the information gaps and language barriers that can otherwise get in the way successful cross-border deals.12 The kinds of negotiations and deals described above in Storper and Venables’ work that are most effectively done face-to-face, are precisely the kinds of interaction that would seem to be vital in driving both trade and investment.
This report therefore explores whether a robust relationship between international business travel and both trade and FDI can be identified. It does so by undertaking a detailed econometric exploration of these relationships. It goes on to estimate, in the light of that evidence, what magnitude of economic contribution can be attributed to international business travel, and hence what the effect on the economy could be if business travel volumes regained their 2008 pre-crisis peak.
11 InterVISTAS for ACI, Economic Impact of European Airports; a Critical Catalyst to Economic Growth (Bath: InterVISTAS, 2015), xiii. 12 Poole, Jennifer. "Business travel as an input to international trade." UC Santa Cruz, mimeo (2010).
The value of international business travel
5 | P a g e
BACKGROUND LITERATURE
Survey evidence of business people’s experiences
As cited above, a 2011 survey of 500 global business travellers and executives found that that business travel was considered to support company performance in four distinct but interconnected ways.13
(1) Growing new sales—the survey found higher rates of sales conversations from in-person meetings. On average, nearly 30 percent of new sales were attributed to business travel.
(2) Helping to keep customers—business travel was found to be a key contributing factor that helped firms hold onto clients and prevent switching. Nearly 40 percent of business travellers in the survey thought their clients would switch to a competitor without an in-person meeting;
(3) Fostering partnerships—business travel was seen as a key enabler to developing the sorts of co-operative relationships between firms that are seen as integral to company performance. More than half of respondents indicated that meeting partners is “very” or “extremely” important to expanding into new markets, investing in new markets, and managing their company’s supply chain; and
(4) Enhancing innovation and developing human capital—the majority of survey respondents (70 percent) found business travel to be an important component in innovation and that it added to productivity and efficiency.
Connectivity and economic growth
By giving domestic firms greater access to overseas customers, and foreign firms better access to the domestic market, air connectivity raises competition, which encourages efficiency, innovation, and specialisation. Faced with more competition from around the world, firms are encouraged to specialise in the goods and services in which they hold a competitive advantage, and to exploit economies of scale, reducing costs and prices. Firms are also incentivised to innovate: for example by adopting better management practices and investing in modern production methods. Together, these forces ensure that scarce skills and resources are deployed where they are most productive, boosting productivity and economic growth.14
For consumers too there are benefits from greater global connectivity. More competition drives down prices and drives up both quality and choice. Connectivity opens up new destinations and encourages more tourism. This, in turn, has knock-on economic benefits as more people visit the UK and spend their money in the UK consumer economy.
Face-to-face communications in the digital age
Despite some predictions to the contrary, the advent of a digital and electronically interconnected world is not expected to make business travel obsolete. Evidence from the Committee on Climate Change, for example, suggested there was no chance of technologies like videoconferencing doing anything close to replacing face-to-face meetings any time soon. Indeed, it found that a modal shift to videoconferencing would only reduce aviation
13 Oxford Economics. “Business Travel: A Catalyst for Economic Performance” (2011). 14 Oxford Economics. “Economic Benefits from Air Transport in the UK” (2011).
The value of international business travel
6 | P a g e
passenger numbers by one percent by 2050.15
This is because, as touched on in the introduction, the value of business travel cannot be easily replicated at distance. As Glaeser has demonstrated, regardless of increasing electronic communications, ‘interpersonal contact-the sharing of knowledge at close quarters- remains an important ingredient in innovation, better electronic connections can make face-to-face contact, and innovation-assisting cities, more important.’16
In relation to business travel directly, his work sought to identify whether long-distance communication was a substitute or complement to face-to-face interaction enabled by business travel, by exploring the relationship between business travel volumes and the cost of electronic communications. They found that ‘business travel seemed to rise, rather than fall, as the costs of electronic connection fell’, and argue convincingly that this reflects ‘how cheaper electronic communications [have] led to a more connected world.’17
15 Committee on Climate Change ‘Meeting the UK aviation target – options for reducing emissions to 2050’ (2009). 16 Edward L Glaeser, "E-ties that bind", The New York Times, 1 March 2011. 17 Ibid.
The value of international business travel
7 | P a g e
2. UK TRENDS IN INTERNATIONAL BUSINESS TRAVEL
In exploring the role of international business travel in driving economic growth, it is useful to examine what the observable patterns of business travel have been in recent years. This is set against a backdrop of economic disruption caused by the 2008 crisis, and in a context of trends in connectivity, which have seen only modest growth in the period that we examine in this study (no doubt affected by the financial crisis and subsequent recession): the number of connected seats has risen from around 31.5 million in 2006 to 32.7 million in 2014, a modest increase of 4% percent.18
2.1 THE VOLUME OF INTERNATIONAL BUSINESS TRAVEL
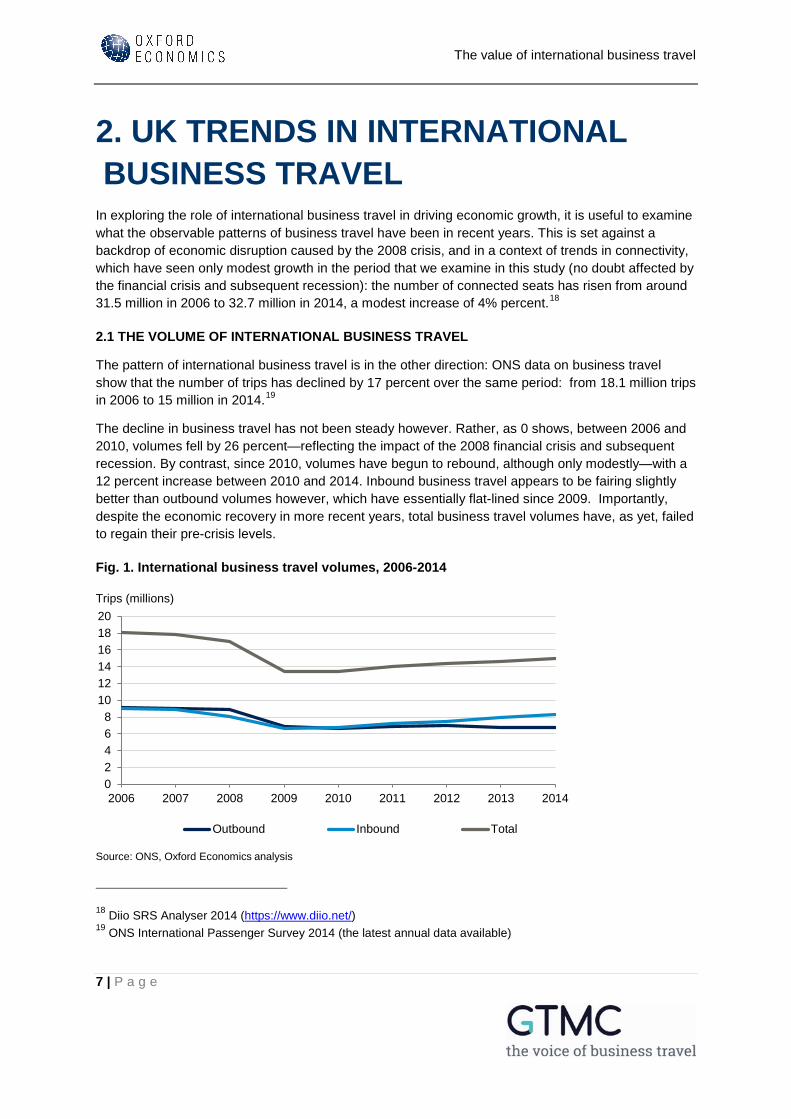
The pattern of international business travel is in the other direction: ONS data on business travel show that the number of trips has declined by 17 percent over the same period: from 18.1 million trips in 2006 to 15 million in 2014.19
The decline in business travel has not been steady however. Rather, as 0 shows, between 2006 and 2010, volumes fell by 26 percent—reflecting the impact of the 2008 financial crisis and subsequent recession. By contrast, since 2010, volumes have begun to rebound, although only modestly—with a 12 percent increase between 2010 and 2014. Inbound business travel appears to be fairing slightly better than outbound volumes however, which have essentially flat-lined since 2009. Importantly, despite the economic recovery in more recent years, total business travel volumes have, as yet, failed to regain their pre-crisis levels.
Fig. 1. International business travel volumes, 2006-2014
18 Diio SRS Analyser 2014 (https://www.diio.net/) 19 ONS International Passenger Survey 2014 (the latest annual data available)
02468
101214161820
2006 2007 2008 2009 2010 2011 2012 2013 2014
Outbound Inbound Total
Source: ONS, Oxford Economics analysis
Trips (millions)
The value of international business travel
8 | P a g e
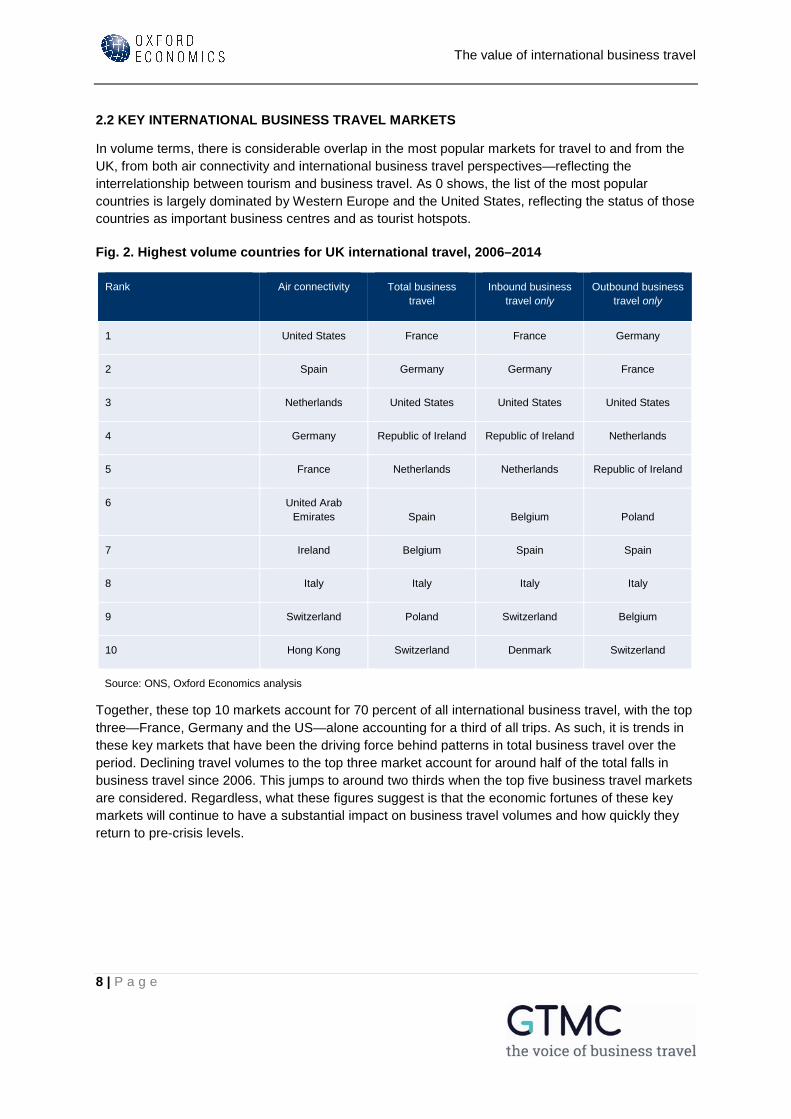
2.2 KEY INTERNATIONAL BUSINESS TRAVEL MARKETS
In volume terms, there is considerable overlap in the most popular markets for travel to and from the UK, from both air connectivity and international business travel perspectives—reflecting the interrelationship between tourism and business travel. As 0 shows, the list of the most popular countries is largely dominated by Western Europe and the United States, reflecting the status of those countries as important business centres and as tourist hotspots.
Fig. 2. Highest volume countries for UK international travel, 2006–2014
Rank Air connectivity Total business travel
Inbound business travel only
Outbound business travel only
1 United States France France Germany
2 Spain Germany Germany France
3 Netherlands United States United States United States
4 Germany Republic of Ireland Republic of Ireland Netherlands
5 France Netherlands Netherlands Republic of Ireland
6 United Arab Emirates Spain Belgium Poland
7 Ireland Belgium Spain Spain
8 Italy Italy Italy Italy
9 Switzerland Poland Switzerland Belgium
10 Hong Kong Switzerland Denmark Switzerland
Source: ONS, Oxford Economics analysis
Together, these top 10 markets account for 70 percent of all international business travel, with the top three—France, Germany and the US—alone accounting for a third of all trips. As such, it is trends in these key markets that have been the driving force behind patterns in total business travel over the period. Declining travel volumes to the top three market account for around half of the total falls in business travel since 2006. This jumps to around two thirds when the top five business travel markets are considered. Regardless, what these figures suggest is that the economic fortunes of these key markets will continue to have a substantial impact on business travel volumes and how quickly they return to pre-crisis levels.
The value of international business travel
9 | P a g e
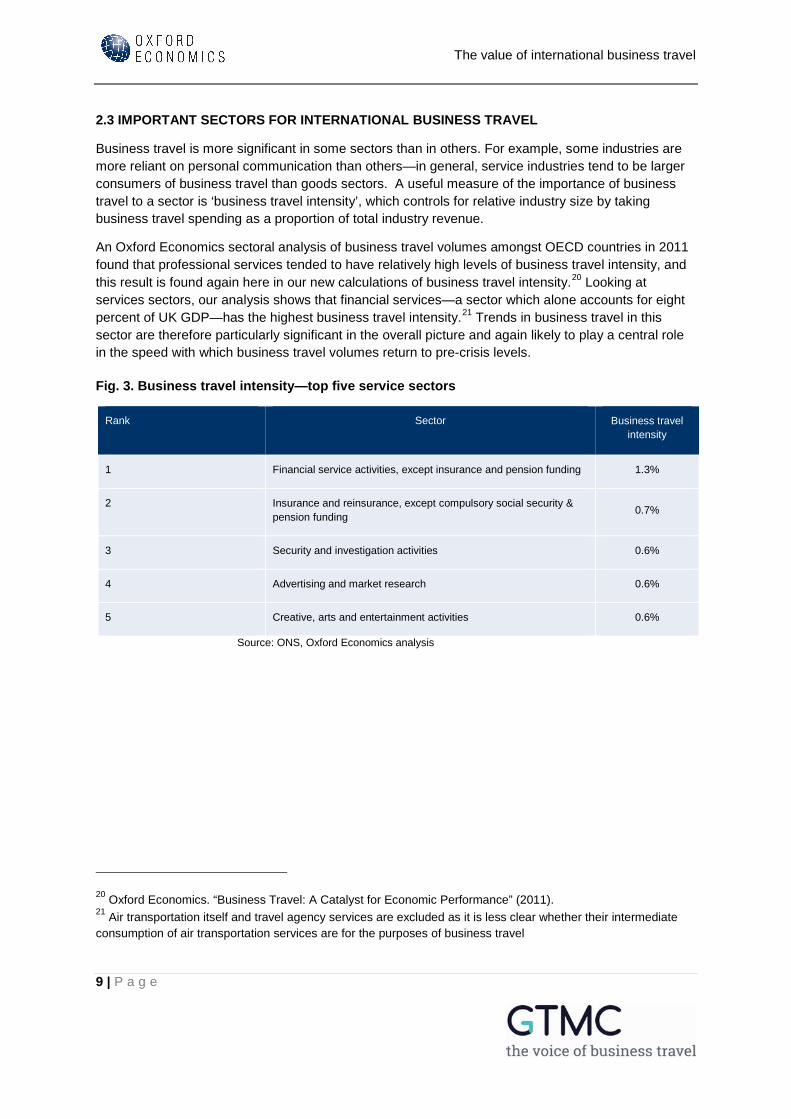
2.3 IMPORTANT SECTORS FOR INTERNATIONAL BUSINESS TRAVEL
Business travel is more significant in some sectors than in others. For example, some industries are more reliant on personal communication than others—in general, service industries tend to be larger consumers of business travel than goods sectors. A useful measure of the importance of business travel to a sector is ‘business travel intensity’, which controls for relative industry size by taking business travel spending as a proportion of total industry revenue.
An Oxford Economics sectoral analysis of business travel volumes amongst OECD countries in 2011 found that professional services tended to have relatively high levels of business travel intensity, and this result is found again here in our new calculations of business travel intensity.20 Looking at services sectors, our analysis shows that financial services—a sector which alone accounts for eight percent of UK GDP—has the highest business travel intensity.21 Trends in business travel in this sector are therefore particularly significant in the overall picture and again likely to play a central role in the speed with which business travel volumes return to pre-crisis levels.
Fig. 3. Business travel intensity—top five service sectors
Rank Sector Business travel intensity
1 Financial service activities, except insurance and pension funding 1.3%
2 Insurance and reinsurance, except compulsory social security & pension funding 0.7%
3 Security and investigation activities 0.6%
4 Advertising and market research 0.6%
5 Creative, arts and entertainment activities 0.6%
Source: ONS, Oxford Economics analysis
20 Oxford Economics. “Business Travel: A Catalyst for Economic Performance” (2011). 21 Air transportation itself and travel agency services are excluded as it is less clear whether their intermediate consumption of air transportation services are for the purposes of business travel
The value of international business travel
10 | P a g e
3. BUSINESS TRAVEL’S RELATIONSHIP TO TRADE AND FDI
As we have explored in chapter one, both the background literature and evidence around connectivity suggest that a relationship may be identifiable in terms of how business travel boosts economic growth. In order to test this, the study takes a macroeconomic approach to estimating the impact of business travel in two specific areas where the literature suggests a particular relationship may be identifiable: namely trade—measured as the sum of imports and exports—and inward foreign direct investment (FDI).
The specification and estimation of the econometric models presented in this report were informed by the existing literature on trade and FDI modelling. In particular, the gravity model has been used extensively in the trade literature to demonstrate, first that the larger and the closer together two countries are, the more strongly they will trade, and later to explore the importance of other determinants of trade—for example, in services trade, that common cultural links matter. The effects of trade partner characteristics, such as common border, common language and legal origin and colonial links tend to be accounted for using dummy variables. Here we use the same approach to explore the explanatory value of both connectivity generally and international business travel in particular on trade and FDI.
In each of the trade and FDI models, we report two types of elasticities. The first tell us the responsiveness of each to a one percent increase in air connectivity. The second looks more specifically at the effects of increasing business travel volumes by one percent. To measure air connectivity, we used data on the number of seats available from an airport or country, weighted by the importance of the destinations served. The weights reflect how “connected” each destination is. Business travel models on the other hand use data on inbound, outbound and total business between different countries.
3.1 INTERNATIONAL BUSINESS TRAVEL AND TRADE
As the above discussion makes clear, even if a relationship to trade can be identified, business travel will be just one of myriad factors that drive international trade patterns. As well as the size of an economy, and distance from it, cultural ties, national trade policy and multilateral trade negotiations, and of course local and global macroeconomic conditions, all have an influence on patterns of trade between countries over time. The onset of the financial crisis and the consequent fall in trade in 2008 is an example of this. The value of trade can also be affected by the exchange rate, which has been in general decline against the dollar and euro since 2008 (making UK exports to key markets relatively cheaper).
The value of international business travel
11 | P a g e
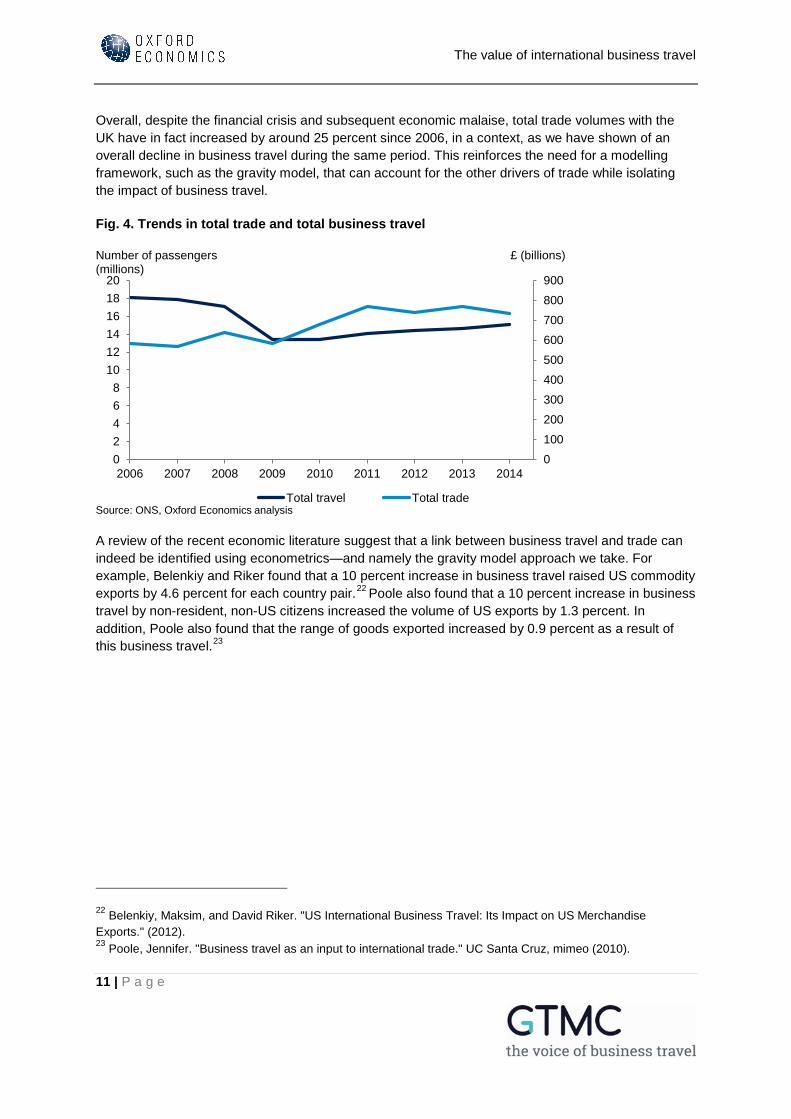
Overall, despite the financial crisis and subsequent economic malaise, total trade volumes with the UK have in fact increased by around 25 percent since 2006, in a context, as we have shown of an overall decline in business travel during the same period. This reinforces the need for a modelling framework, such as the gravity model, that can account for the other drivers of trade while isolating the impact of business travel.
Fig. 4. Trends in total trade and total business travel
A review of the recent economic literature suggest that a link between business travel and trade can indeed be identified using econometrics—and namely the gravity model approach we take. For example, Belenkiy and Riker found that a 10 percent increase in business travel raised US commodity exports by 4.6 percent for each country pair.22 Poole also found that a 10 percent increase in business travel by non-resident, non-US citizens increased the volume of US exports by 1.3 percent. In addition, Poole also found that the range of goods exported increased by 0.9 percent as a result of this business travel.23
22 Belenkiy, Maksim, and David Riker. "US International Business Travel: Its Impact on US Merchandise Exports." (2012). 23 Poole, Jennifer. "Business travel as an input to international trade." UC Santa Cruz, mimeo (2010).
0100200300400500600700800900
02468
101214161820
2006 2007 2008 2009 2010 2011 2012 2013 2014
Total travel Total tradeSource: ONS, Oxford Economics analysis
Number of passengers (millions)
£ (billions)
The value of international business travel
12 | P a g e
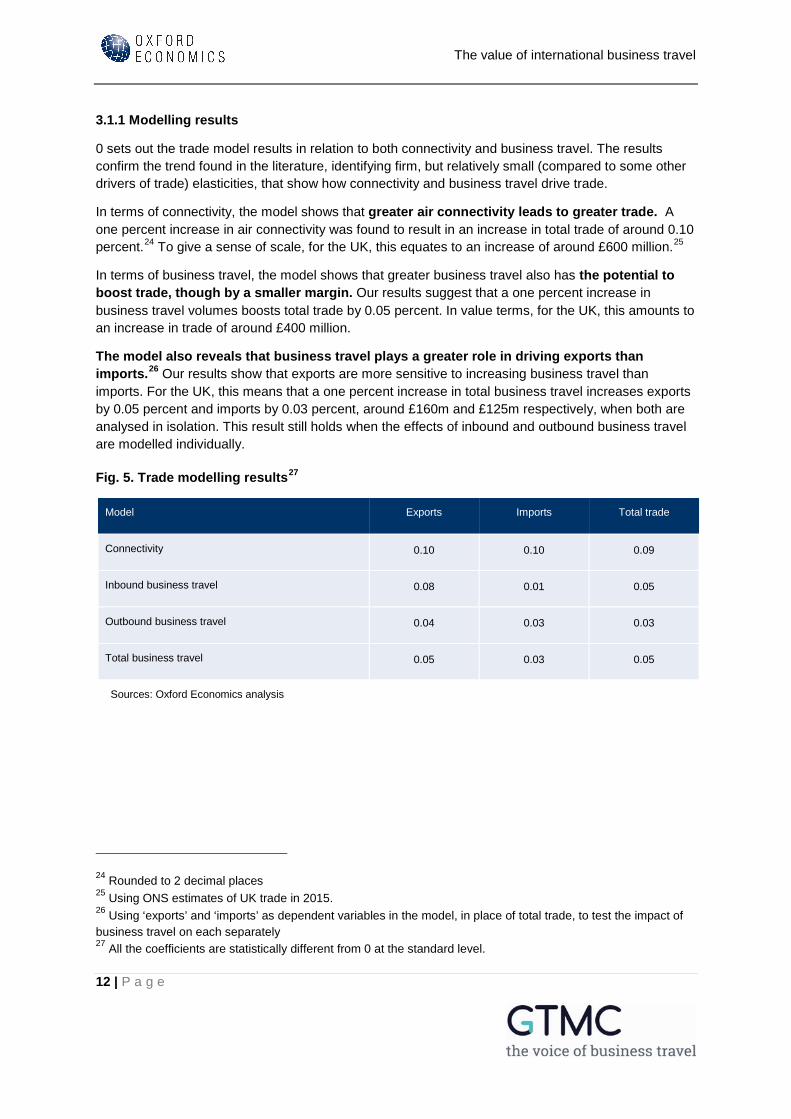
3.1.1 Modelling results
0 sets out the trade model results in relation to both connectivity and business travel. The results confirm the trend found in the literature, identifying firm, but relatively small (compared to some other drivers of trade) elasticities, that show how connectivity and business travel drive trade.
In terms of connectivity, the model shows that greater air connectivity leads to greater trade. A one percent increase in air connectivity was found to result in an increase in total trade of around 0.10 percent.24 To give a sense of scale, for the UK, this equates to an increase of around £600 million.25
In terms of business travel, the model shows that greater business travel also has the potential to boost trade, though by a smaller margin. Our results suggest that a one percent increase in business travel volumes boosts total trade by 0.05 percent. In value terms, for the UK, this amounts to an increase in trade of around £400 million.
The model also reveals that business travel plays a greater role in driving exports than imports.26 Our results show that exports are more sensitive to increasing business travel than imports. For the UK, this means that a one percent increase in total business travel increases exports by 0.05 percent and imports by 0.03 percent, around £160m and £125m respectively, when both are analysed in isolation. This result still holds when the effects of inbound and outbound business travel are modelled individually.
Fig. 5. Trade modelling results27
Model Exports Imports Total trade
Connectivity 0.10 0.10 0.09
Inbound business travel 0.08 0.01 0.05
Outbound business travel 0.04 0.03 0.03
Total business travel 0.05 0.03 0.05
Sources: Oxford Economics analysis
24 Rounded to 2 decimal places 25 Using ONS estimates of UK trade in 2015. 26 Using ‘exports’ and ‘imports’ as dependent variables in the model, in place of total trade, to test the impact of business travel on each separately 27 All the coefficients are statistically different from 0 at the standard level.
The value of international business travel
13 | P a g e
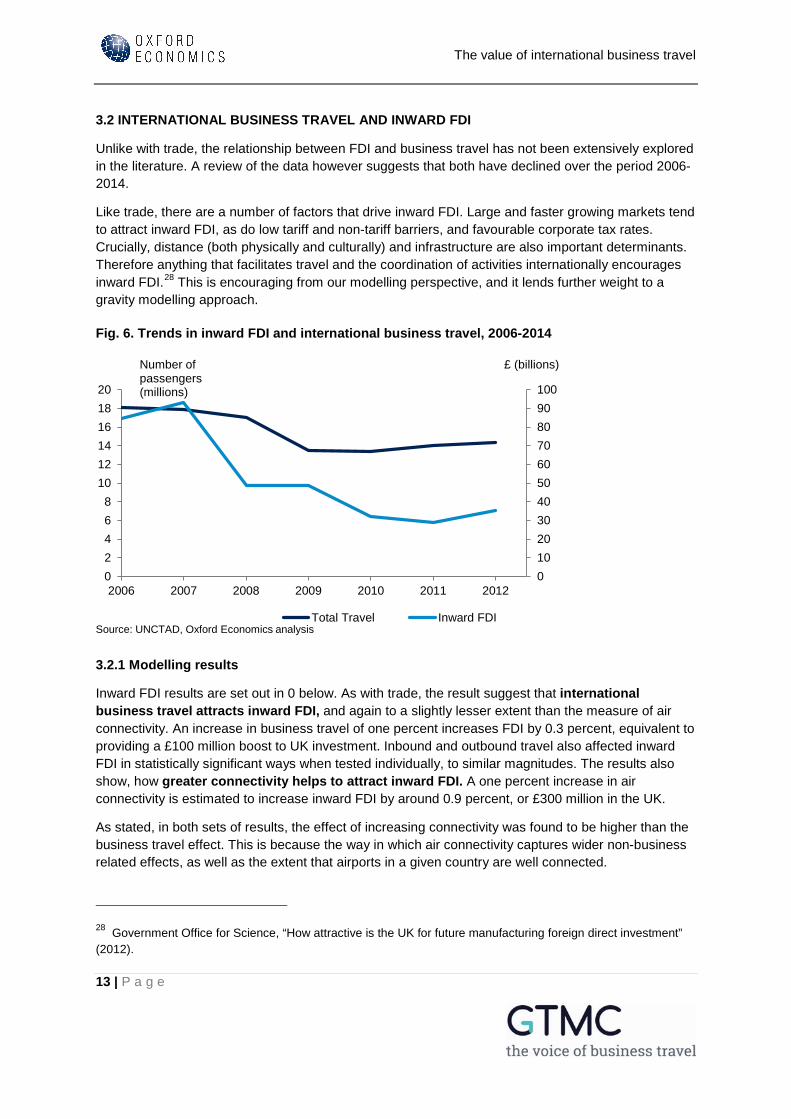
3.2 INTERNATIONAL BUSINESS TRAVEL AND INWARD FDI
Unlike with trade, the relationship between FDI and business travel has not been extensively explored in the literature. A review of the data however suggests that both have declined over the period 2006-2014.
Like trade, there are a number of factors that drive inward FDI. Large and faster growing markets tend to attract inward FDI, as do low tariff and non-tariff barriers, and favourable corporate tax rates. Crucially, distance (both physically and culturally) and infrastructure are also important determinants. Therefore anything that facilitates travel and the coordination of activities internationally encourages inward FDI.28 This is encouraging from our modelling perspective, and it lends further weight to a gravity modelling approach.
Fig. 6. Trends in inward FDI and international business travel, 2006-2014
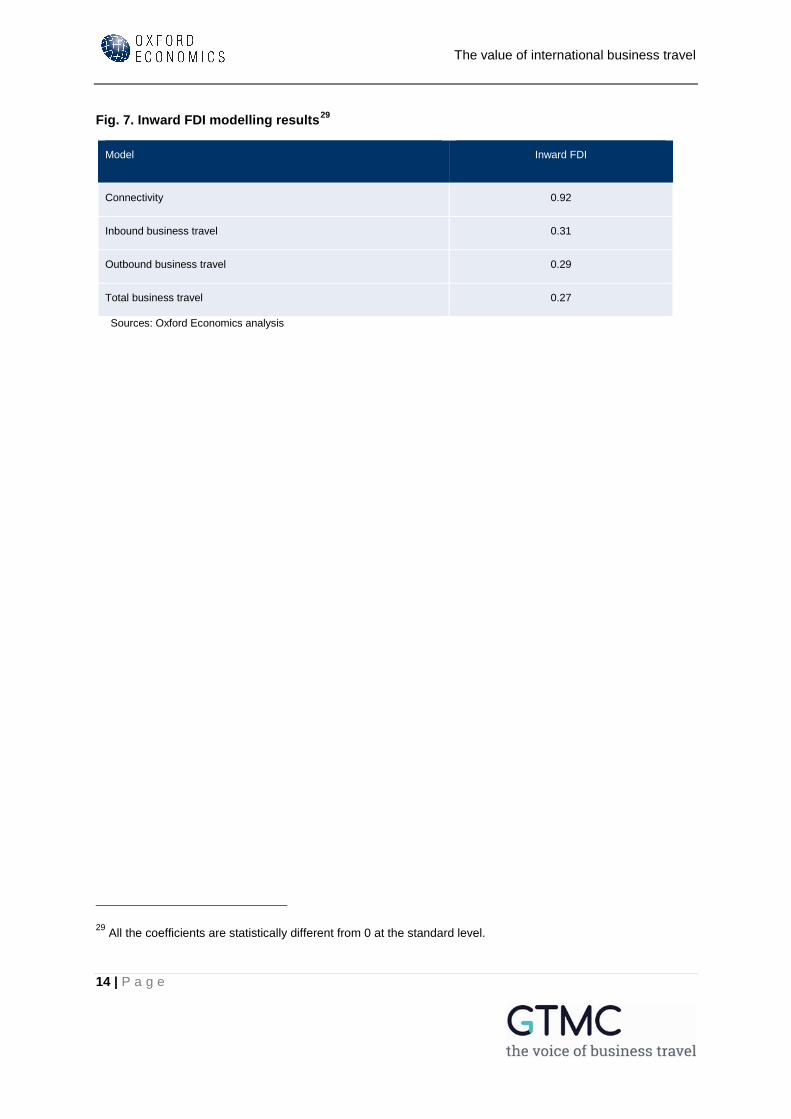
3.2.1 Modelling results
Inward FDI results are set out in 0 below. As with trade, the result suggest that international business travel attracts inward FDI, and again to a slightly lesser extent than the measure of air connectivity. An increase in business travel of one percent increases FDI by 0.3 percent, equivalent to providing a £100 million boost to UK investment. Inbound and outbound travel also affected inward FDI in statistically significant ways when tested individually, to similar magnitudes. The results also show, how greater connectivity helps to attract inward FDI. A one percent increase in air connectivity is estimated to increase inward FDI by around 0.9 percent, or £300 million in the UK.
As stated, in both sets of results, the effect of increasing connectivity was found to be higher than the business travel effect. This is because the way in which air connectivity captures wider non-business related effects, as well as the extent that airports in a given country are well connected.
28 Government Office for Science, “How attractive is the UK for future manufacturing foreign direct investment” (2012).
0102030405060708090100
02468
101214161820
2006 2007 2008 2009 2010 2011 2012
Total Travel Inward FDISource: UNCTAD, Oxford Economics analysis
Number of passengers (millions)
£ (billions)
The value of international business travel
14 | P a g e
Fig. 7. Inward FDI modelling results29
Model Inward FDI
Connectivity 0.92
Inbound business travel 0.31
Outbound business travel 0.29
Total business travel 0.27
Sources: Oxford Economics analysis
29 All the coefficients are statistically different from 0 at the standard level.
The value of international business travel
15 | P a g e
4. THE VALUE OF INTERNATIONAL BUSINESS TRAVEL TO THE UK
The econometric modelling we have undertaken has demonstrated that the effects of both international business travel and air connectivity can be isolated as drivers of economic growth—in terms of the impact on trade volumes and on inward FDI to the UK. Having identified the role of business travel in boosting trade and investment, we are able therefore to quantify the economic benefits that could arise for the UK economy if, for example, the level of business travel returned to the pre-crisis higher volumes.
Our estimates show that if the upward trend in business travel that has been seen since 2010 continues and business travel volumes return to pre-crisis levels, within the next five years, this could add as much as £6.5 billion to the value of UK trade. This would equate to 1 percent of total trade in 2015. In terms of FDI we can quantify similar values: a return to pre-crisis levels of business travel could boost inward FDI by £1.6 billion—an amount that equates to 5 percent of total FDI in 2012.30
Further, there is strong empirical evidence to show that trade and FDI also provide a boost to productivity, and we are able to quantify this over and above the direct impact of higher levels of trade and FDI.31 Our own analysis, in line with the broader literature, has found that a one percent increase in trade increases productivity growth by 0.11 percent, and a one percent increase in FDI increases productivity by 0.07 percent. These productivity effects can be used to quantify the value that would accrue to the UK economy as a result of increasing international business travel.
Using them, this suggests that the 0.05 percent increase in trade and the 0.27 percent increase in FDI, estimated in Chapter 3, together have the potential to expand output by 0.024 percent.32 Therefore, through its impact on productivity, this analysis suggests that increasing business travel by just one percent could increase UK output by £390 million. In the context of exports also increasing by £160m, these results suggest that on average each additional international business trip triggers some £14,000 of exports, which would primarily benefit individual UK firms investing directly in business travel. From an economy wide perspective, those trips would add £34,000 each to GDP.
In summary, this analysis demonstrates how business travel has an important role in the UK’s economic prosperity. If UK firms can maintain the upward trajectory that business travel volumes have enjoyed since 2010, and return to pre-crisis levels, then the returns to both them and to the wider UK economy could be significant.
30 The latest year that data is available 31 See Technical appendix for a review of the evidence. 32 The trade impact would be to increase output by 0.006%, while the FDI impact would expand output by 0.019%. The total effect is 0.024%.
The value of international business travel
16 | P a g e
5. METHODOLOGICAL APPENDIX The specification and estimation of the econometric models presented in this report were informed by the existing literature on trade and FDI modelling. This appendix set out the key parameters behind our econometric approach, namely:
• Using a panel data framework • Using a gravity model • Using and estimating a dynamic model • Dealing with endogeneity
This study takes a macroeconomic approach to estimating the impact of business travel in two specific areas where the literature suggests a particular relationship may be identifiable: namely trade—measured as the sum of imports and exports—and inward foreign direct investment (FDI).33 To test whether these relationships do in fact exist econometrically, a gravity model based on a panel of 34 countries over the period 2006-2014 has been used. Simulating Newton’s law of gravity, these models intuitively assume that the larger and the closer together two countries are, the more strongly they will trade. Or in other words, trade is a positive related to the relative sizes of the two countries, measured by GDP, and inversely related to distance between them. USING PANEL DATA FRAMEWORK
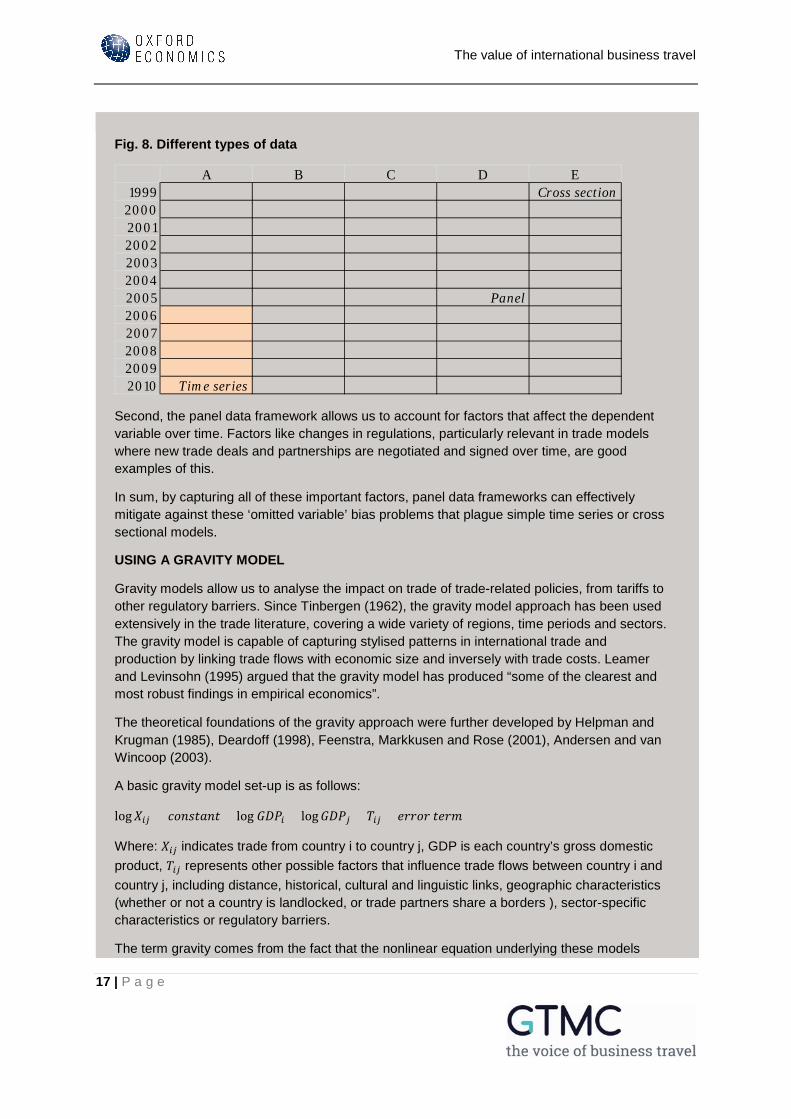
In econometric analysis of this kind of data are typically used, cross sectional data, time series and panel data. Both cross section and time series however are only one-dimensional. Cross section data record observations for each individual / household / firm / country in a single timeframe (like a single year), while time series data record repeated observations for one individual / household / firm / country over time. Panel datasets on the other hand is two dimensional, in that these data consist of repeated observations on the same cross section of individuals / households / firms / countries, over time as illustrated below in 0.
This brings with it a number of key advantages. First, in any cross country analysis, there will be cross country specific effects (also called country heterogeneity) which are unobserved or difficult to obtain accurate data for. Differences in political institutions, culture, and customs that exist between different each countries are examples of this. When these unobserved factors are important, cross sectional approaches suffer from biased coefficient estimates. The panel data framework however allows us to account for these factors, even though they are unobservable.
33 Tinbergen, Jan. 1962. Shaping the World Economy: Suggestions for an International Economic Policy. New York: Twentieth Century Fund. The first use of a gravity model to analyse international trade flows.
The value of international business travel
17 | P a g e
Fig. 8. Different types of data
Second, the panel data framework allows us to account for factors that affect the dependent variable over time. Factors like changes in regulations, particularly relevant in trade models where new trade deals and partnerships are negotiated and signed over time, are good examples of this.
In sum, by capturing all of these important factors, panel data frameworks can effectively mitigate against these ‘omitted variable’ bias problems that plague simple time series or cross sectional models.
USING A GRAVITY MODEL
Gravity models allow us to analyse the impact on trade of trade-related policies, from tariffs to other regulatory barriers. Since Tinbergen (1962), the gravity model approach has been used extensively in the trade literature, covering a wide variety of regions, time periods and sectors. The gravity model is capable of capturing stylised patterns in international trade and production by linking trade flows with economic size and inversely with trade costs. Leamer and Levinsohn (1995) argued that the gravity model has produced “some of the clearest and most robust findings in empirical economics”.
The theoretical foundations of the gravity approach were further developed by Helpman and Krugman (1985), Deardoff (1998), Feenstra, Markkusen and Rose (2001), Andersen and van Wincoop (2003).
A basic gravity model set-up is as follows:
log𝑋𝑋𝑖𝑖𝑖𝑖 = 𝑐𝑐𝑐𝑐𝑐𝑐𝑐𝑐𝑐𝑐𝑐𝑐𝑐𝑐𝑐𝑐 + log 𝐺𝐺𝐺𝐺𝐺𝐺𝑖𝑖 + log𝐺𝐺𝐺𝐺𝐺𝐺𝑖𝑖 + 𝑇𝑇𝑖𝑖𝑖𝑖 + 𝑒𝑒𝑒𝑒𝑒𝑒𝑐𝑐𝑒𝑒 𝑐𝑐𝑒𝑒𝑒𝑒𝑡𝑡
Where: 𝑋𝑋𝑖𝑖𝑖𝑖 indicates trade from country i to country j, GDP is each country’s gross domestic product, 𝑇𝑇𝑖𝑖𝑖𝑖 represents other possible factors that influence trade flows between country i and country j, including distance, historical, cultural and linguistic links, geographic characteristics (whether or not a country is landlocked, or trade partners share a borders ), sector-specific characteristics or regulatory barriers.
The term gravity comes from the fact that the nonlinear equation underlying these models
A B C D E1999 Cross section
200020012002200320042005 Panel20062007200820092010 Time series
The value of international business travel
18 | P a g e
resembles Newton’s law of gravity, in that trade is directly proportional to the exporting and importing countries’ economic mass (GDP), and inversely proportional to the distance between them. This suggests that we can expect country pairs with larger GDP to trade more, but countries that are further apart to trade less.
Since their inception, the use of gravity models has expanded beyond trade in goods to trade in services (Kimura and Lee, 2006). Grunfeld and Moxnes (2003), Kimura (2003), Kimura and Lee (2006) and Mirza and Nicoletti (2004) apply the gravity model framework on the OECD dataset on bilateral trade in services to assess the determinants of bilateral trade in services. These studies have generally found that the size of the host country’s market is an important determinant of trade flows, as well as common cultural links (Park, 2002). The effects of trade partner characteristics, such as common border, common language and legal origin and colonial links tend to be accounted for using dummy variables (Bhattacharya and Wolde, 2010, Bussiere et al., 2008, Trotignon, 2010).
Owing to its robustness, this gravity modelling framework was therefore chosen to test our key hypotheses.
USING AND ESTIMATING A DYNAMIC MODEL
Determining whether to use a dynamic or static model is an important econometric consideration since using the wrong functional form may result in biased coefficient estimates.34 In order to test whether our model should use lagged dependent variable or indeed explanatory variable, we used the Wooldridge test for serial correlation in panel data. This test indicates the presence of neglected dynamic elements in the dataset which ought to be accounted for in our trade model. We found no such evidence in our FDI model where a static model was therefore used.
There is a host of methods to estimate our models, including pooling regression with OLS, Random Effects (RE), Fixed Effects (FE) estimators, spatial panel regression with ML estimator, combined spatial and dynamic panel regression with Differenced and System GMM, and instrumental variable (IV) Poisson Maximum Likelihood Estimator.
We used different estimators depending on whether the tests we run indicated static or dynamic approach was appropriate. This is because, the simple pooled OLS estimate of the coefficient on the lagged dependent variable term is likely to be inconsistent and biased upwards owing to the positive correlation between the lagged dependent variable and the fixed effect term (Hsiao, 2003). The fixed effects (FE) estimator, although the within groups transformation wipes out the time-invariant country-specific effects, produces the opposite—a downward bias with the extent of attenuation increasing when exogenous covariates are added (Nickell, 1981). Bond, Hoettler and Temple (2001) and Caselli, Esquivel and Lefort (1996) suggest a bound for the coefficient on the lagged dependent variable: the observed biases in the OLS and within group estimators are used as references to define upper and lower bounds for this serial autoregressive parameter.
34 Using a static model when the true model is dynamic can cause bias in the coefficients estimates whereas using a dynamic model when the true model is static will lead to unbiased but inefficient coefficient estimates
The value of international business travel
19 | P a g e
To estimate the trade models, a direct application of GMM based approach was the best strategy as these estimators deal with the joint problem of serial and spatial endogeneity and corrects for the potential endogeneity of other explanatory variables. Whilst the Differenced GMM estimate the first difference of equation of interest, the basic idea of the system GMM is to estimate the relevant equation as a system of two equations. One is in first differences, which removes the fixed effects, and the other is in levels, which brings in the technical gains of additional level moment conditions and increased efficiency. In the Differenced GMM, lagged first differences are used as instruments whereas the System GMM approach uses lagged first differences and lagged levels as instruments for equations in levels and for equations in first differences, respectively. The use of instrumental variables allows consistent estimation of parameters even in the presence of measurement error and endogenous right-hand-side variables.
Consistency of the Difference and System GMM estimators requires the instruments they use to be valid and informative. An important condition for the validity of some of our instruments is that the error term is serially uncorrelated. The Arellano and Bond’s (1991) test for serial correlation in the first-differenced regression residuals is used to test this assumption. Because the number of available instruments is greater than the number of explanatory variables, the Sargan (1958)/Hansen (1982) test of over-identifying restrictions provides an additional tool for assessing the validity of the instruments.
In light of the above, we used a static Random Effect (RE) model to estimate our FDI models and a combination of IV Poisson Maximum Likelihood and Arellano Bond (1991) estimators for our trade models. We then used a series of model specification tests to ensure that our results were robust and fit for purpose.
DEALING WITH ENDOGENEITY
The value of international business travel
20 | P a g e
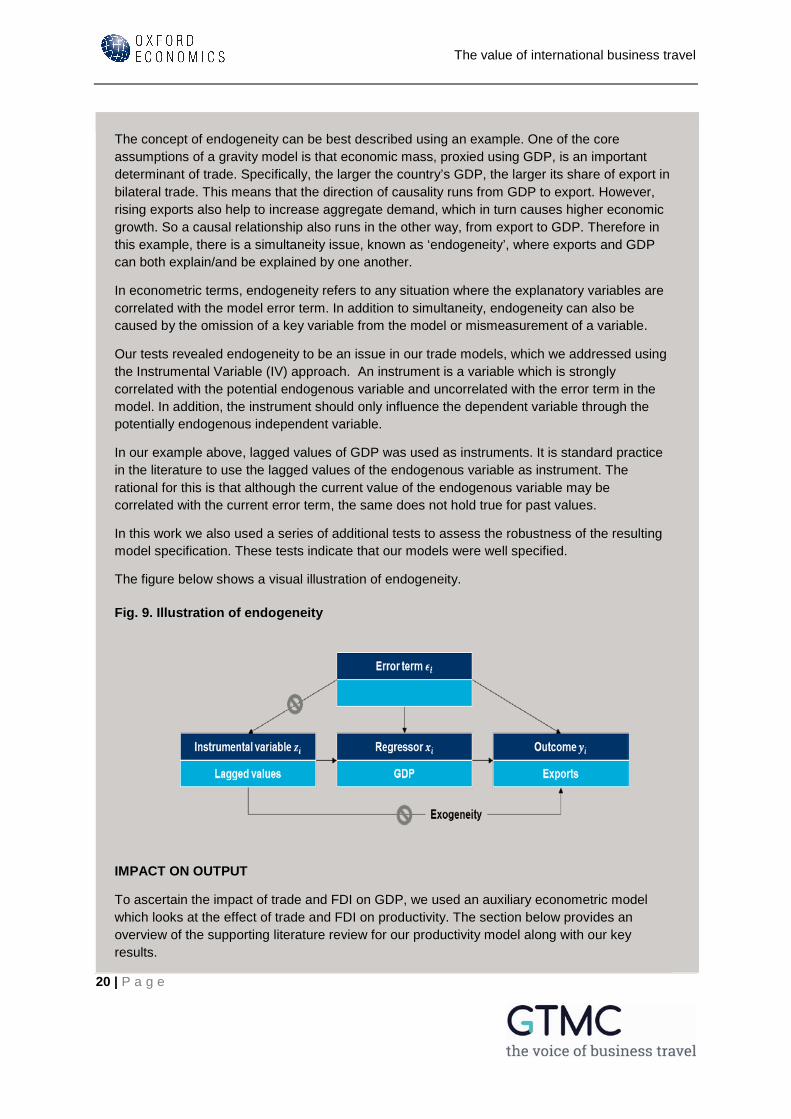
The concept of endogeneity can be best described using an example. One of the core assumptions of a gravity model is that economic mass, proxied using GDP, is an important determinant of trade. Specifically, the larger the country’s GDP, the larger its share of export in bilateral trade. This means that the direction of causality runs from GDP to export. However, rising exports also help to increase aggregate demand, which in turn causes higher economic growth. So a causal relationship also runs in the other way, from export to GDP. Therefore in this example, there is a simultaneity issue, known as ‘endogeneity’, where exports and GDP can both explain/and be explained by one another.
In econometric terms, endogeneity refers to any situation where the explanatory variables are correlated with the model error term. In addition to simultaneity, endogeneity can also be caused by the omission of a key variable from the model or mismeasurement of a variable.
Our tests revealed endogeneity to be an issue in our trade models, which we addressed using the Instrumental Variable (IV) approach. An instrument is a variable which is strongly correlated with the potential endogenous variable and uncorrelated with the error term in the model. In addition, the instrument should only influence the dependent variable through the potentially endogenous independent variable.
In our example above, lagged values of GDP was used as instruments. It is standard practice in the literature to use the lagged values of the endogenous variable as instrument. The rational for this is that although the current value of the endogenous variable may be correlated with the current error term, the same does not hold true for past values.
In this work we also used a series of additional tests to assess the robustness of the resulting model specification. These tests indicate that our models were well specified.
The figure below shows a visual illustration of endogeneity.
Fig. 9. Illustration of endogeneity
IMPACT ON OUTPUT
To ascertain the impact of trade and FDI on GDP, we used an auxiliary econometric model which looks at the effect of trade and FDI on productivity. The section below provides an overview of the supporting literature review for our productivity model along with our key results.
The value of international business travel
21 | P a g e
MODELLING TFP
The majority of published studies on the drivers of TFP use firms rather than countries as the units of analysis. Among the studies using cross country panel data, the relationship between TFP and its key determinants is somewhat mixed. The results seem to be largely driven by both the selection of the sample of country and the choice of econometric methodology including model specification. Furthermore, another important distinction between these studies is how the determinants of TFP are measured e.g. trade openness is often measured in different ways, either as an index, a ratio of export to GDP or a ratio of the sum of export and import to GDP. Overall, these distinctions are important when comparing our findings to the ones offered in the literature.
In several respects, our work is closely related to the studies conducted by Baltabaev (2012), Kose et al. (2008) and Woo (2009). We analyse the impact of FDI, trade openness and other key drivers on TFP growth as in Baltabaev (2012) and Woo (2009). However, unlike Woo (2009) whose econometric approach fails to control for endogeneity, we use a system GMM approach as in Baltabaev (2012) and Kose et al. (2008). All our coefficient estimates are in line with expectation in both their signs and magnitudes. Although, Alfaro et al. (2009) finds a negative and significant effect of FDI on TFP, this finding is to be expected given the sample of countries used by these authors. There is some evidence in the literature that FDI tends to have a positive effect on TFP growth in developed countries and negative effect in developing countries (See Borensztein et al., (1998), Wang and Wong (2009) and Baltabaev (2014)). Our final results are based on 25 countries the majority of which are OECD countries.
Our results reveal the following coefficients35 0.11***, 0.07** on the variables trade openness and FDI respectively. These coefficients are similar in both magnitudes and signs to the ones found by Baltabaev (2012) which are 0.105* on trade openness and 0.09*** on FDI. Furthermore, our coefficients also comfortably fall within the range of estimates reported by Baltabaev (2014) and Kose et al. (2008) for trade openness. Note that Kose et al. (2008) use a different measure of FDI. In addition, our results are also similar to Erken et al. (2014) and Edwards (1997) in that we found the variable human capital insignificant in our preferred model specification.
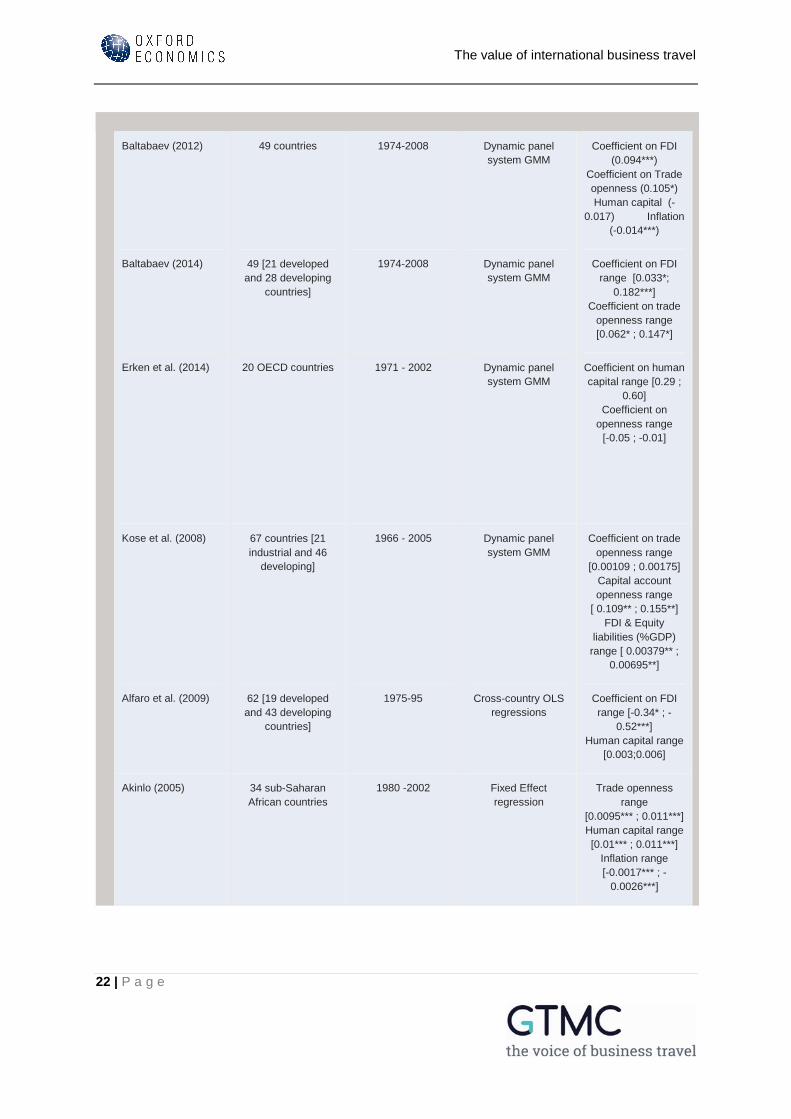
The table below shows the ranges of key coefficients based on our literature review.
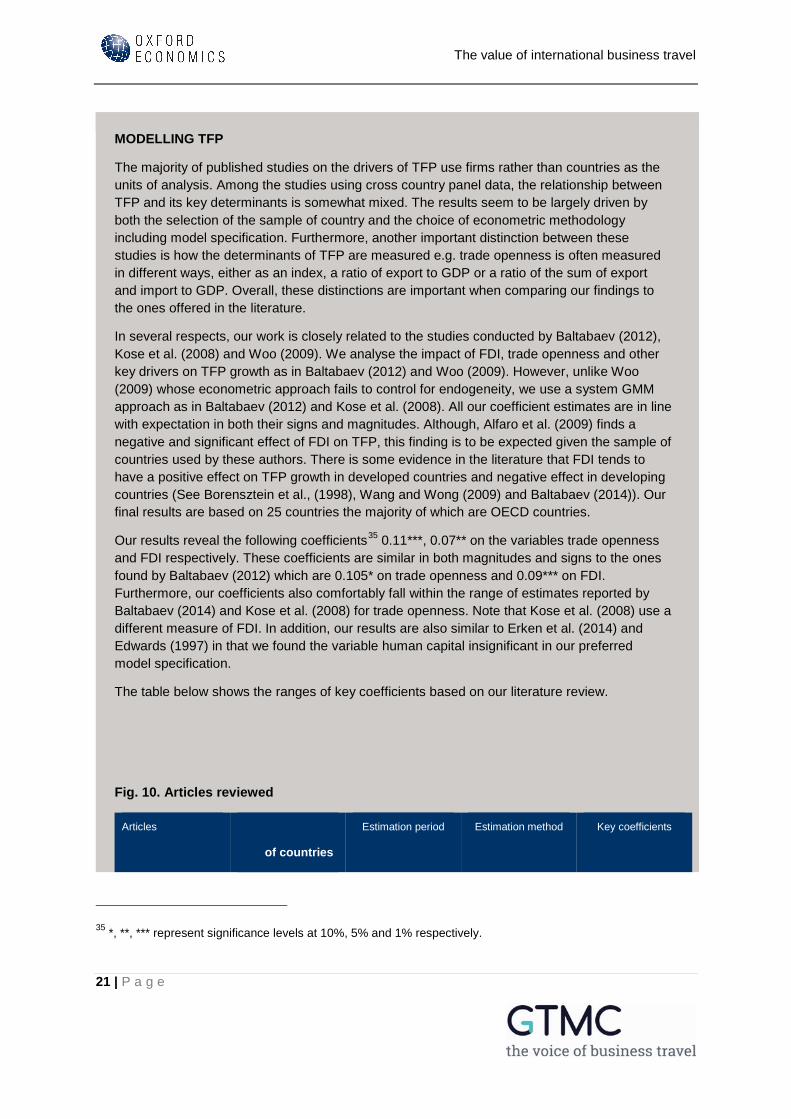
Fig. 10. Articles reviewed
Articles
of countries
Estimation period Estimation method Key coefficients
35 *, **, *** represent significance levels at 10%, 5% and 1% respectively.
The value of international business travel
22 | P a g e
Baltabaev (2012) 49 countries 1974-2008 Dynamic panel system GMM
Coefficient on FDI (0.094***)
Coefficient on Trade openness (0.105*) Human capital (-
0.017) Inflation (-0.014***)
Baltabaev (2014) 49 [21 developed and 28 developing
countries]
1974-2008 Dynamic panel system GMM
Coefficient on FDI range [0.033*;
0.182***] Coefficient on trade
openness range [0.062* ; 0.147*]
Erken et al. (2014) 20 OECD countries 1971 - 2002 Dynamic panel system GMM
Coefficient on human capital range [0.29 ;
0.60] Coefficient on
openness range [-0.05 ; -0.01]
Kose et al. (2008) 67 countries [21 industrial and 46
developing]
1966 - 2005 Dynamic panel system GMM
Coefficient on trade openness range
[0.00109 ; 0.00175] Capital account openness range
[ 0.109** ; 0.155**] FDI & Equity
liabilities (%GDP) range [ 0.00379** ;
0.00695**]
Alfaro et al. (2009) 62 [19 developed and 43 developing
countries]
1975-95 Cross-country OLS regressions
Coefficient on FDI range [-0.34* ; -
0.52***] Human capital range
[0.003;0.006]
Akinlo (2005) 34 sub-Saharan African countries
1980 -2002 Fixed Effect regression
Trade openness range
[0.0095*** ; 0.011***] Human capital range [0.01*** ; 0.011***]
Inflation range [-0.0017*** ; -
0.0026***]
The value of international business travel
23 | P a g e
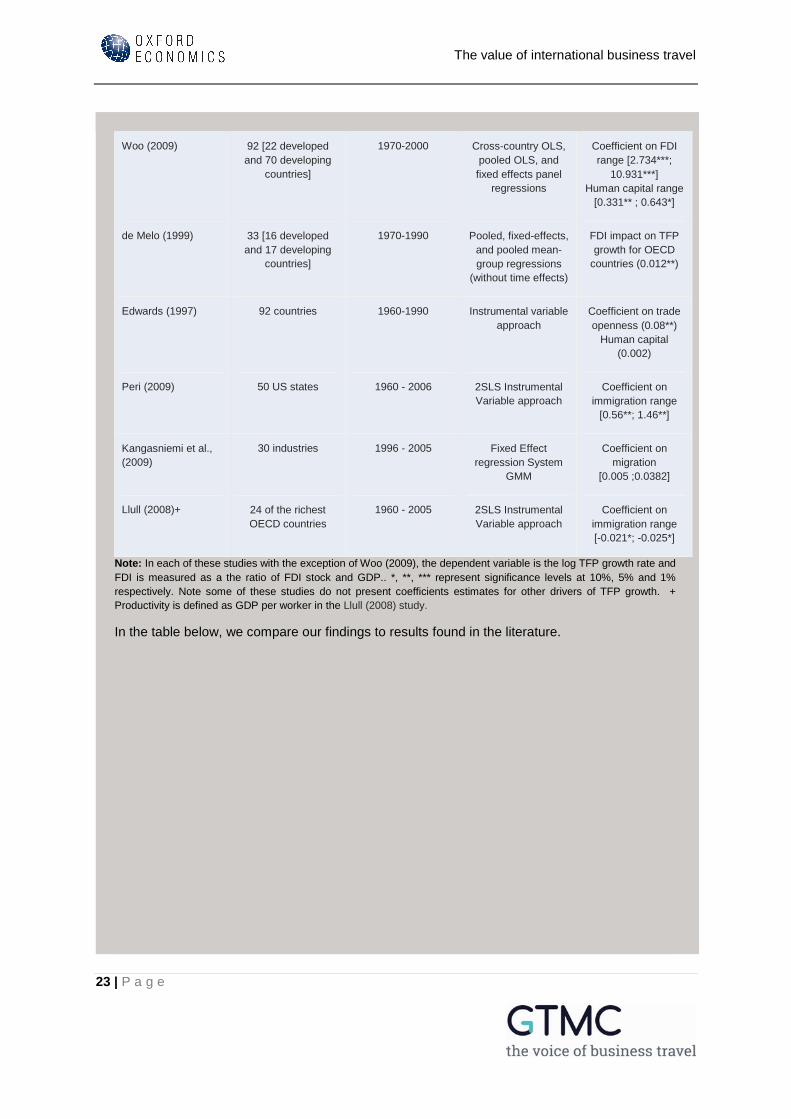
Woo (2009) 92 [22 developed and 70 developing
countries]
1970-2000 Cross-country OLS, pooled OLS, and fixed effects panel
regressions
Coefficient on FDI range [2.734***;
10.931***] Human capital range
[0.331** ; 0.643*]
de Melo (1999) 33 [16 developed and 17 developing
countries]
1970-1990 Pooled, fixed-effects, and pooled mean-group regressions
(without time effects)
FDI impact on TFP growth for OECD
countries (0.012**)
Edwards (1997) 92 countries 1960-1990 Instrumental variable approach
Coefficient on trade openness (0.08**)
Human capital (0.002)
Peri (2009) 50 US states 1960 - 2006 2SLS Instrumental Variable approach
Coefficient on immigration range
[0.56**; 1.46**]
Kangasniemi et al., (2009)
30 industries 1996 - 2005 Fixed Effect regression System
GMM
Coefficient on migration
[0.005 ;0.0382]
Llull (2008)+ 24 of the richest OECD countries
1960 - 2005 2SLS Instrumental Variable approach
Coefficient on immigration range [-0.021*; -0.025*]
Note: In each of these studies with the exception of Woo (2009), the dependent variable is the log TFP growth rate and FDI is measured as a the ratio of FDI stock and GDP.. *, **, *** represent significance levels at 10%, 5% and 1% respectively. Note some of these studies do not present coefficients estimates for other drivers of TFP growth. + Productivity is defined as GDP per worker in the Llull (2008) study.
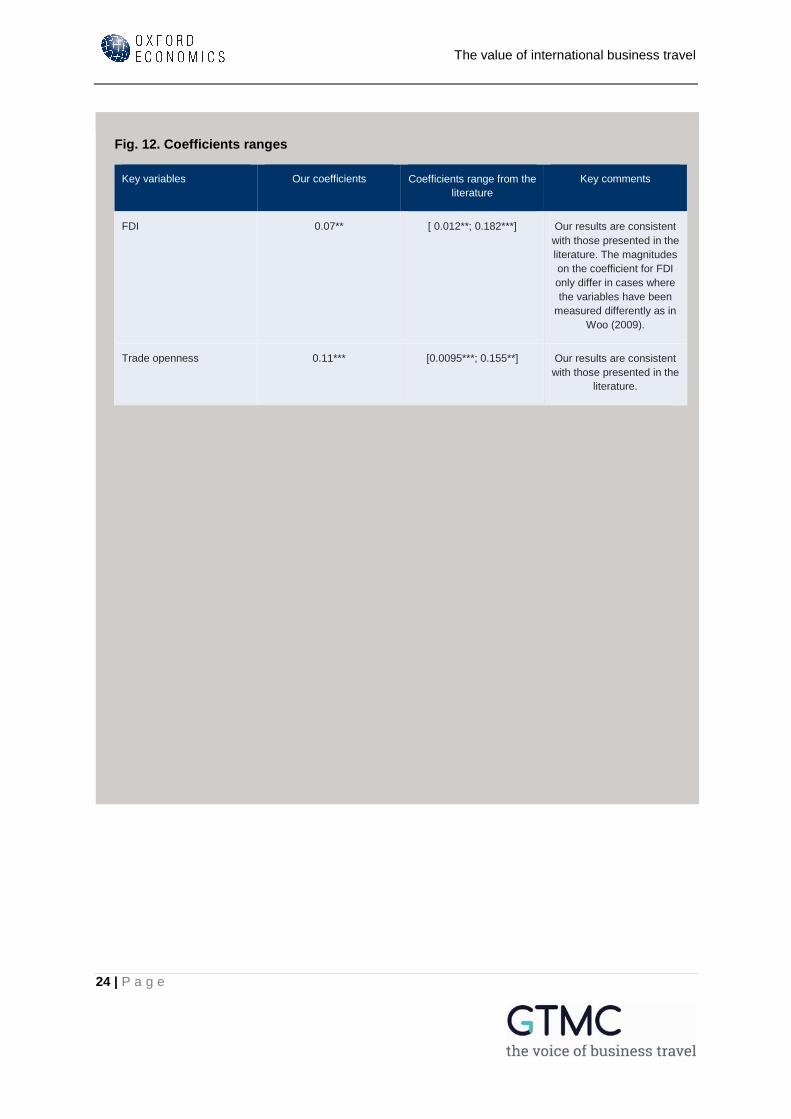
In the table below, we compare our findings to results found in the literature.
The value of international business travel
24 | P a g e
Fig. 12. Coefficients ranges
Key variables Our coefficients Coefficients range from the literature
Key comments
FDI 0.07** [ 0.012**; 0.182***] Our results are consistent with those presented in the literature. The magnitudes on the coefficient for FDI only differ in cases where the variables have been
measured differently as in Woo (2009).
Trade openness 0.11*** [0.0095***; 0.155**] Our results are consistent with those presented in the
literature.

2
Falmouth University’s impact on Cornwall’s economyGTMC | e-brochure 2016 3
Contents
We are the GTMC
Meet the Team
Conferences
Membership
Partnership
Testimonials
Survey Infographics
the voice of business travelWe connect people, developing relationships and insight that enable a focused approach to lobbying.
We are the voice of UK business travel. We promote business travel as an investment, a commercial strategy and a driver of economic growth.
The GTMC is a highly respected Membership organisation and professional association representing the interests of the business travel community.
We promote the activities of our Members as delivering the best standards of service, quality and value to the business traveller.
Join today at www.gtmc.org
the voice of business travel
Representing the industry.Infl uencing the future.the voice of business travel
3-4
5
7-8
9-10
11-12
13
15-20