the use of a phenology model and of risk analyses for planning buckwheat (fagopyrum esculentum)...
TRANSCRIPT

ELSEVIER
Agricultural Systems, Vol. 51, No. 4, pp. 551-569. 1998 CC’ 1998 Elsevier Science Ltd. All rights reserved
Printed in Great Britain PII: s0308-521x(98)00007-9 0308-521X/98 $19.00+0.00
The Use of a Phenology Model and of Risk Analyses for Planning Buckwheat (Fagopyrum esculentum) Sowing Dates
in Alpine Areas
Johann Baumgtirtner, *=t Per Schilperoord,b Paolo Basetti,’ Albert0 Baiocchid & Mauro Jermini’
“Agricultural Bureau of the Grisons. Grabenstr. 1, 7000 Chur, Switzerland bGenossenschaft ‘Gran Alpin’, 7492 Alvaneu, Switzerland
CAgricultural Research Station, 6593 Cadenazzo, Switzerland dFondazione Fojanini, 23100 Sondrio, Italy
(Received 6 May 1997; accepted 30 January 1998)
ABSTRACT
A published temperature-dependent phenology model constructed for representing buckwheat (Fagopyrum esculentum) development has been calibrated. The model considers the phenophases of sowing to emergence, of emergence to first anthesis, and ofjrst anthesis to physiological maturity’. It is used for the strategic planning of buckwheat production in Alpine areas and predicts the latest possible sowing dates in areas of the Swiss cantons of the Grisons and of the Ticino as well as of the Italian province of Sondrio. The area-specific date is calculated by taking into account a probability of I % for crop failure which occurs when the crop is exposed to temperatures < 2.5”C before it reaches physiological maturity. To account
for operational constraints, we have anticipated the calculated sowing date by 10 days. During a given year, buckwheat should be considered as the only crop at high altitudes, while it can be cultivated as a catch crop, after cereals for example, at low altitudes. The results show that the model
*To whom correspondence should be addressed. Fax: 00254 2860 110; e-mail: [email protected]
Present address: International Centre of Insect Physiology and Ecology, PO Box 30772, Nairobi, Kenya.
557

558 J. Baumgdrtner et al.
eficiently makes use of existing information and provides useful recom- mendations for experimental work. The model is also a valuable tool for farmers interested in growing buckwheat in the areas under study. 0 1998 Elsevier Science Ltd. All rights reserved
INTRODUCTION
Buckwheat (Fugopyrum esculentum) is a herb belonging to the Polygonaceae family with alternate leaves, clusters of apetalous pinkish white flowers and triangular seeds. Traditionally, the grains of buckwheat have been used as food and as feed for livestock.
From the Asian centers of origin, buckwheat production slowly expanded into Russia and reached Central and Western Europe in the 15th century (De Jong, 1972; Marshal and Pomeranz, 1982; Kreft, 1989). After a period of decline (De Jong, 1972) the crop recently received considerable attention by agronomists searching for alternative or supplementary crops to cereals with possible use as raw material for industrial processing (Jae Hak Lee, 1995). Moreover, buckwheat is of interest because of the possible agronomic potential, because of the reputed adaptation to poor growing conditions (Angus et al., 1982; Aufhammer and Ktibler, 1991) and because of suspected positive effects in landscape maintenance and species conservation programs (Baumgartner and Hartmann, 1998a).
In the Alpine areas located in the Swiss cantons of Ticino and of the Grisons as well as in the Italian province of Sondrio (Fig. l), buckwheat was traditionally grown as the only crop or as a catch crop sown after the harvest of cereals (Koblet, 1965). Despite a continuing demand for buckwheat grains, the farmers apparently gave up production in the 1960s. In a program supporting sustainable cropping systems, the canton of the Grisons recently attempted to re-introduce buckwheat production in Alpine arable produc- tion systems as already done in the province of Sondrio. In 1996, however, buckwheat production was not successful, primarily because the selected late sowing dates did not allow the tested cultivars to reach the stage of harvest. In some cases, the temperature apparently dropped below the critical value of 2.5”C (Jae Hak Lee, 1995) causing irreversible damage to the crop before it reached maturity.
A series of experiments carried out with different varieties at different locations characterized by climatic differences was considered to be a straightforward but inefficient method to optimize sowing dates of the buckwheat. Instead, the efficient use of existing information built into phe- nology models to plan experimental work and crop management procedures was considered a more promising approach for this purpose. Newly acquired

Planning buckwheat sowing dates in Alpine areas 559
Fig. 1. The locations in southeastern Switzerland and in the neighbouring Italian province of Sondrio in which strategic planning of buckwheat was carried out. The Alpine areas are situated approximately between the Lake Constance in the north and the Lakes Maggiore, Lugano, and Como in the south. The names of the locations (LM, Locarno-Magadino; S, Sondrio; P, Poschiavo; A, Alvaneu; C, Chur) generally refer to the locations of the weather
stations.
knowledge can easily be built into these models which may, thereby, become an increasingly useful tool for guiding agricultural activities and for the strategic planning of crop management.
The purpose of this work is to establish the latest possible sowing dates in Alpine areas located in southeastern Switzerland and in the neighbouring Italian province of Sondrio. For this purpose, a published phenology model is calibrated and used to simulate crop development by varying sowing dates in the different areas under study. The area-specific latest sowing date should account for a risk of crop failure which occurs if the crop is exposed to temperatures < 2.5”C before it reaches physiological maturity.
560 J. Baumgktner et al.
MATERIALS AND METHODS
The rate summation method
Phenology has been defined as the study of the timing of recurring biological events, the causes of their timing with regard to biotic and abiotic forces, and the interrelation among phases of the same or different species (Lieth, 1976). Here, we focus on the first two aspects and follow Angus et al. (1981, 1982) who considered emergence, first anthesis, and harvest as phenological events. The periods between these three events are referred to as phenophases (Table 1). We assume that the time (expressed in days) taken to pass through a phenophase is only dependent on temperature (Severini et al., 1990). Moreover, we assume that the passage is completed if the developmental rates integrated over time are equal to 1 (Curry and Feldman, 1987).
Though the rate integration method is the generally acknowledged method for computing poikilothermic development, the rate summation method is generally preferred (Curry and Feldman, 1987) and used in this study. Accordingly, a phenophase is terminated if:
$TJ = 1 I=1
(1)
where n = number of time increments per day, y1= 12 was considered adequate in this work, D = number of days until completion of a developmental phase, Ti = mean temperature during the i-th time interval, r = developmental rate in
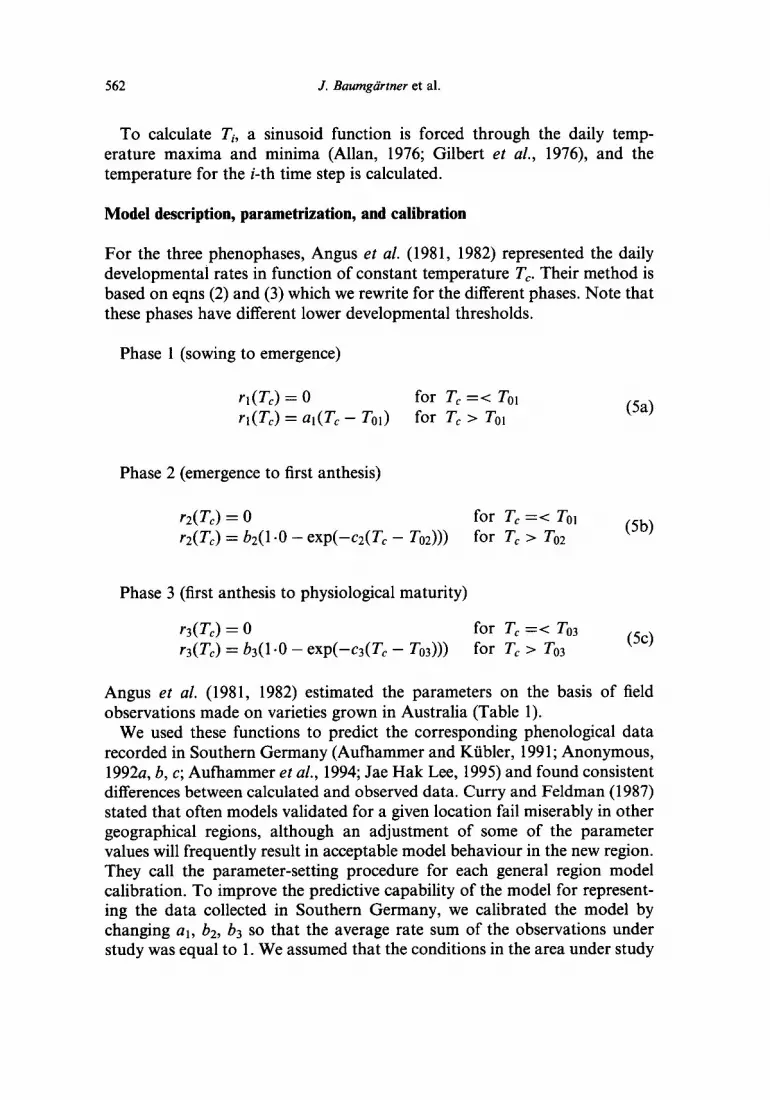
TABLE 1 Parameter Estimates for eqns (5a-5c) Describing Buckwheat Developmental Rate Per Day in
Function of Temperature for the Three Phenophasesj= 1,2,3
Phenophase Cj) Model Threshold Tsj aj bj cj
From sowing to (j= 1) emergence 1 11.1 0.0272 2 11.1 0.0325
From to first anthesis (j= emergence 2) 1 10.0 0.0536 0.2850 2 10.0 0.0673 0.2850
From first anthesis to physiological 1 11.4 0.0256 0.6460 maturity (j= 3) 2 11.4 0.0169 0.6460
The parameters of the original model developed in Australia by Angus et al. (1981, 1982) appear in Model 1, while Model 2 comprises the parameters of the calibrated model. Cali- bration procedures are based on observations made in Southern Germany. These observa- tions and temperature recordings were kindly made available by Dr E. Ktibler, Stuttgart- Hohenheim University, Germany.

Planning buckwheat sowing dates in Alpine areas 561
the i-th time interval with temperature Tj. This model assumes that the developmental rate instantaneously responds to Ti.
Two different approaches can be used to express Y as a function of con- stant temperatures T,. In the first approach, developmental rates are formulated as mechanistic representations of underlying physiological pro- cesses. For example, Sharpe and Demichele (1977) represented develop- mental rates on the basis of enzyme kinetics, while Gutierrez and Baumgartner (1997) used the supplydemand relationships in resource acquisition and allocation to build a population model for poikilothermic development. In the second approach, a descriptive rather than explicative function is used. Again, several approaches could be discussed, but we restrict them to the examples relevant for this study. Angus et al. (1981, 1982) expressed buckwheat developmental rates as nonlinear
r(T,) = b(1 - exp[-c(Tc - To])
and linear functions of constant temperatures T,
r(T,) = 4Tc - TO) (3)
above a lower threshold To. If we insert eqn (3) into the rate summation (eqn (1)) and if, f or simplicity reasons, we assume that n = 1, we obtain
b &Tc - To) = 1 kl
(4a)
and
D
C( i=l
T, - To) = f = C. (4b)
Equation (4b) says that the passage through a phase is completed if the sum of the effective temperatures per day (i.e. the day degrees) reaches the ther- mal threshold C (Gilbert et al., 1976). The concept of day degree summations or ‘heat sums’ can be traced back to Reaumur (1735) and has found wide application in ecological research, but a detailed discussion goes far beyond the scope of this work.
562 J. Baumgiirtner et al.
To calculate Ti, a sinusoid function is forced through the daily temp- erature maxima and minima (Allan, 1976; Gilbert et al., 1976), and the temperature for the i-th time step is calculated.
Model description, parametrization, and calibration
For the three phenophases, Angus et al. (198 1, 1982) represented the daily developmental rates in function of constant temperature T,. Their method is based on eqns (2) and (3) which we rewrite for the different phases. Note that these phases have different lower developmental thresholds.
Phase 1 (sowing to emergence)
n(Tc) = 0 for T, =-c TOI n(T,) = al(T, - TOI) for T, > TOI W
Phase 2 (emergence to first anthesis)
rz(Tc) = 0 for T, =< TOI r2(Tc) = bz(1.0 - exp(-c2(TC - TOM))) for T, > To2 (5b)
Phase 3 (first anthesis to physiological maturity)
r3Vc) = 0 for T, =< To3 r3(TC) = f~(1.0 - exp(-c3(T, - To3))) for T, > To3 (SC)
Angus et al. (1981, 1982) estimated the parameters on the basis of field observations made on varieties grown in Australia (Table 1).
We used these functions to predict the corresponding phenological data recorded in Southern Germany (A&hammer and Ktibler, 1991; Anonymous, 1992a, b, c; Auf-hammer et al., 1994; Jae Hak Lee, 1995) and found consistent differences between calculated and observed data. Curry and Feldman (1987) stated that often models validated for a given location fail miserably in other geographical regions, although an adjustment of some of the parameter values will frequently result in acceptable model behaviour in the new region. They call the parameter-setting procedure for each general region model calibration. To improve the predictive capability of the model for represent- ing the data collected in Southern Germany, we calibrated the model by changing al, b2, bs so that the average rate sum of the observations under study was equal to 1. We assumed that the conditions in the area under study
Planning buckwheat sowing dates in Alpine areas 563
(Fig. 1) were sufficiently close to the ones in neighbouring Southern Germany as to justify the use of the calibrated model for our purpose.
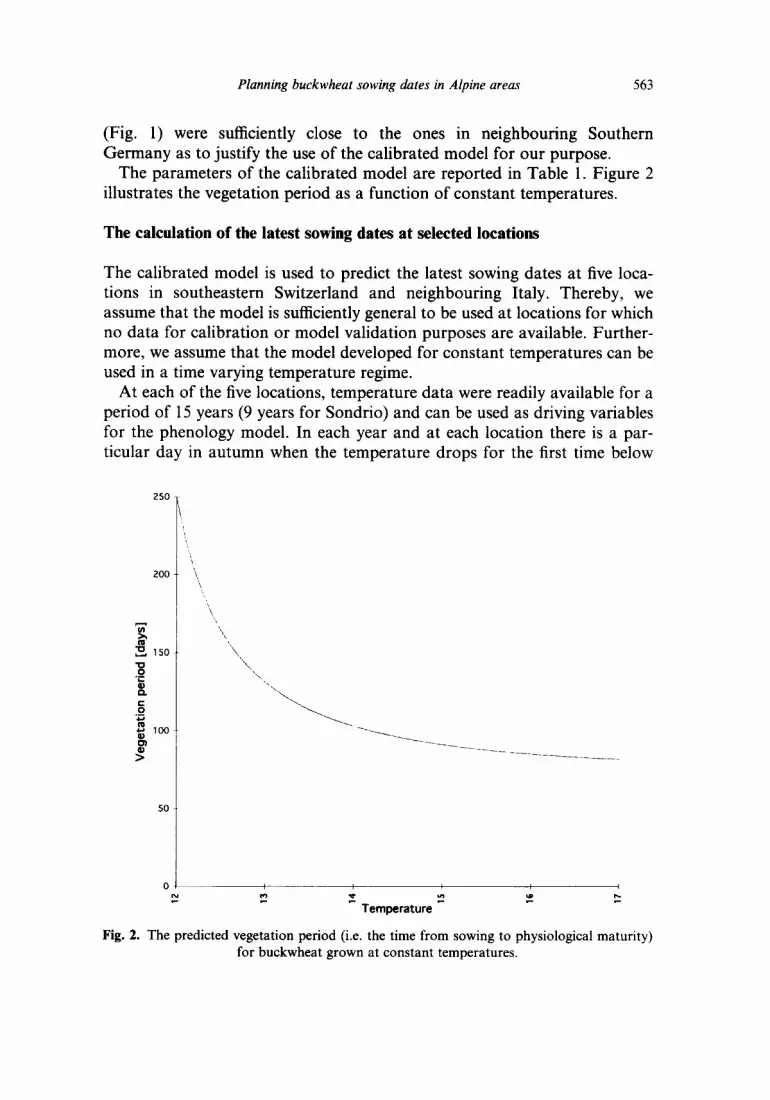
The parameters of the calibrated model are reported in Table 1. Figure 2 illustrates the vegetation period as a function of constant temperatures.
The calculation of the latest sowing dates at selected locations
The calibrated model is used to predict the latest sowing dates at five loca- tions in southeastern Switzerland and neighbouring Italy. Thereby, we assume that the model is sufficiently general to be used at locations for which no data for calibration or model validation purposes are available. Further- more, we assume that the model developed for constant temperatures can be used in a time varying temperature regime.
At each of the five locations, temperature data were readily available for a period of 15 years (9 years for Sondrio) and can be used as driving variables for the phenology model. In each year and at each location there is a par- ticular day in autumn when the temperature drops for the first time below
250
200
3 mx 3 150 -0 .o $ P
5 'E 2 s 100
3
50
0 N m s ” 5 E
Temperature
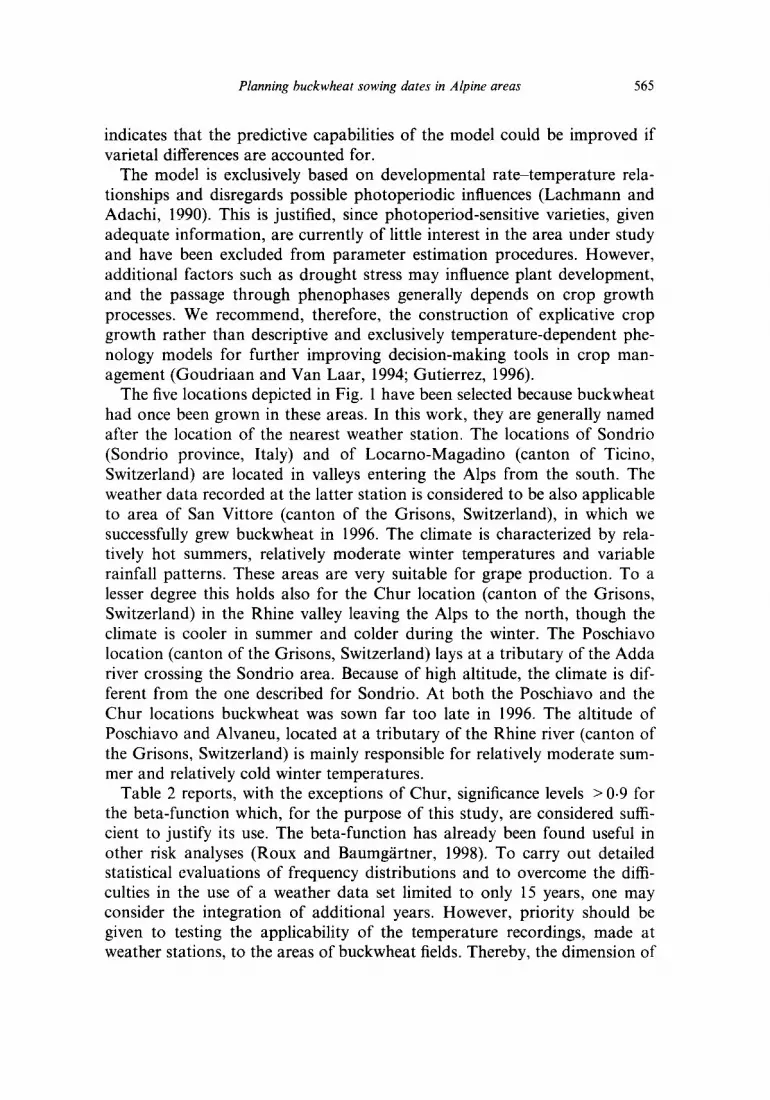
Fig. 2. The predicted vegetation period (i.e. the time from sowing to physiological maturity) for buckwheat grown at constant temperatures.

564 J. Baumgtirtner et al.
2.5”C. The model enables us to calculate the sowing dates, specific to year and location, which would allow the crop to reach physiological maturity before this temperature drop.
At each location, the calculated sowing dates are distributed over an arbi- trarily defined period beginning on 10 June and ending on 10 September. The capability of a beta-frequency distribution is evaluated, by means of a Kolmogorov-Smirnov test (Law and Kelton, 1982), to represent the loca- tion-specific frequency distributions for calculated sowing dates.
A location-specific frequency distribution enables us to calculate, by means of standard statistical software packages, the day on which the integral of the beta-function reaches 1%. This percentage represents the probability for the crop to be irreversibly damaged before reaching physiological maturity. A farmer selecting this date for sowing faces a 1% risk that his crop will fail. To account for operational constraints discussed later, we anticipated the recommended sowing date by 10 days.
RESULTS AND DISCUSSION
The predicted vegetation period in days at different constant temperatures is shown in Fig. 2. The shortest period of about 2.5 months occurs above 17°C; below this temperature buckwheat responds with increasing vegetation peri- ods to decreasing temperatures. At 12°C the predicted vegetation period is about 8 months. According to eqns (5a-5c), no development occurs at tem- peratures below 11.4”C. This lower developmental threshold appears to be high when compared with other crops. It is worth noting that the vegetation period approaches a value of 2.5 months at high temperatures, and there is no upper threshold for crop development. We assume that this model is adequate for the temperature conditions at the locations under study, but recommend reconsidering the model and making it more general as soon as detailed experimental data become available.
The parameter estimates given by Angus et al. (198 1, 1982) and the corre- sponding parameters of the calibrated model are given in Table 1. The cali- brated model predicts higher developmental rates and, thus, faster development in the first two phases but considerably slower development in the third phase than the original model. We suspect that systematic differ- ences in the definition and the recording of phenological events may be pri- marily responsible for this difference. Nevertheless, part of the difference may be attributed to the different varieties used to parametrize the original model in Australia (Angus et al., 1981, 1982) and to calibrate it with the data obtained from Southern Germany (Aufhammer and Ktibler, 1991; Anony- mous, 1992a, b, c; Aufhammer et al., 1994; Jae Hak Lee, 1995). This
Planning buckwheat sowing dates in Alpine areas 565
indicates that the predictive capabilities of the model could be improved if varietal differences are accounted for.
The model is exclusively based on developmental rate-temperature rela- tionships and disregards possible photoperiodic influences (Lachmann and Adachi, 1990). This is justified, since photoperiod-sensitive varieties, given adequate information, are currently of little interest in the area under study and have been excluded from parameter estimation procedures. However, additional factors such as drought stress may influence plant development, and the passage through phenophases generally depends on crop growth processes. We recommend, therefore, the construction of explicative crop growth rather than descriptive and exclusively temperature-dependent phe- nology models for further improving decision-making tools in crop man- agement (Goudriaan and Van Laar, 1994; Gutierrez, 1996).
The five locations depicted in Fig. 1 have been selected because buckwheat had once been grown in these areas. In this work, they are generally named after the location of the nearest weather station. The locations of Sondrio (Sondrio province, Italy) and of Locarno-Magadino (canton of Ticino, Switzerland) are located in valleys entering the Alps from the south. The weather data recorded at the latter station is considered to be also applicable to area of San Vittore (canton of the Grisons, Switzerland), in which we successfully grew buckwheat in 1996. The climate is characterized by rela- tively hot summers, relatively moderate winter temperatures and variable rainfall patterns. These areas are very suitable for grape production. To a lesser degree this holds also for the Chur location (canton of the Grisons, Switzerland) in the Rhine valley leaving the Alps to the north, though the climate is cooler in summer and colder during the winter. The Poschiavo location (canton of the Grisons, Switzerland) lays at a tributary of the Adda river crossing the Sondrio area. Because of high altitude, the climate is dif- ferent from the one described for Sondrio. At both the Poschiavo and the Chur locations buckwheat was sown far too late in 1996. The altitude of Poschiavo and Alvaneu, located at a tributary of the Rhine river (canton of the Grisons, Switzerland) is mainly responsible for relatively moderate sum- mer and relatively cold winter temperatures.
Table 2 reports, with the exceptions of Chur, significance levels > O-9 for the beta-function which, for the purpose of this study, are considered suffi- cient to justify its use. The beta-function has already been found useful in other risk analyses (Roux and Baumgartner, 1998). To carry out detailed statistical evaluations of frequency distributions and to overcome the diffi- culties in the use of a weather data set limited to only 15 years, one may consider the integration of additional years. However, priority should be given to testing the applicability of the temperature recordings, made at weather stations, to the areas of buckwheat fields. Thereby, the dimension of

566 J. Baumgcirtner et al.
TABLE 2 The Calculation of the Latest Buckwheat Sowing Dates for Different Locations in the Alpine
Cantons of the Grisons and Ticino, Switzerland, and in the Sondrio Province, Italy
Location Sign$cance a! B Latest sowing date Latest sowing date level (calculated) (recommended)
Alvaneu 0.9276 6.2196 8.1094 25 June 15 June Chur 0.6669 12.3438 4.3884 23 July 13 July Locarno-Magadino 0.9509 36.9489 4.9488 17 August 7 August Poschiavo 0.9249 8.7140 11.4627 28 June 18 June Sondrioa,b 0.9298 25.3442 5.0688 15 August 5 August
The significance levels and the parameters (Y and /J of the beta-function have been obtained by fitting this distribution to the calculated sowing dates assigned to a period from 10 June to 10 September (“to 20 September) from 1981 to 1995 (bfrom 1987 to 1995). The calculated latest sowing date corresponds to a 1% probability that the crop does not reach physiological maturity before the temperature, in autumn, drops below 2.5”C, while the recommended lat- est sowing date is anticipated by 10 days.
space can be added to the dimension of time and geographical information technology should be used for the development of decision-making tools for crop management (Baumgartner and Hartmann, 1998b).
We use a possibly conservative risk of 1% because factors other than temperature, such as drought stress, may slow down crop development, putting the farmer at higher risk. Once the crop was exposed to temperatures below 2.5°C harvest should not be much delayed. In practice, this require- ment is difficult to meet, however, because the number of machines is limited and wet weather may delay harvesting. To account for these operational problems we recommend anticipating the latest sowing date by 10 days (Table 2).
Table 2 also reports the calculated and the recommended sowing dates for the different locations. In the southernmost locations of Locarno-Magadino and Sondrio the latest possible sowing dates can be delayed until early August. As a consequence, buckwheat can easily be grown as a catch crop following cereals, for example. This is more difficult at Chur, the northern- most location: when sowing buckwheat as a catch crop, following cereals, physiological maturity is not reached before the temperature drops below 2.5”C and losses may occur. We recommend that crops other than cereals precede buckwheat so that the early July sowing date can be respected. At both the Alvaneu and the Poschiavo locations, situated at the highest alti- tudes (Alvaneu at 1200 m above sea level), buckwheat has to be sown in early June. Here, buckwheat can hardly be grown as a catch crop, at least not after cereals. Koblet (1965) observed that buckwheat was grown as the only crop at high altitudes. At these two locations, the temperature very rarely dropped below 2.5”C even during the summer months. To minimize the risk of exposure

Planning buckwheat sowing dates in Alpine areas 567
to temperatures below 2_5”C, we recommend the farmers to grow the crop on slopes rather than on the floor of the valley. We point out, however, that the temperatures in the Poschiavo valley are likely to be different from the recordings made at Poschiavo-Robbia. The average between Poschiavo- Robbia and Sondrio may be more adequate and the management con- siderations made for Chur may be adequate.
These recommendations are, in general, in contrast to the advice we were given when planning the buckwheat production in 1996. Obviously, the experience on buckwheat was limited, had been lost since the last time farmers had grown it in these areas, or was simply not adequate for the strategic planning of sowing times for the newly available varieties.
The results show that phenology models and risk analysis efficiently use existing information to provide a solid ground for planning future experi- mental work. Moreover, the model enables the farmers, who consider grow- ing buckwheat, to decide on sowing dates in general and on cropping systems in particular.
CONCLUSIONS
The development and use of phenology models is a very efficient method to integrate existing knowledge into the planning of crop management opera- tions. Even based on limited information, the risk analysis permitted a more precise definition of buckwheat planting schemes than reliance on empirical recommendations which, in the case under study, were based on experiences lost in the past 30 years. Thus, the phenology model proved to be useful for the strategic planning of buckwheat management.
Moreover, the phenology model has been found useful to define priorities for future studies. With the acquisition of new knowledge, the predictive capabilities of these models can gradually be improved. However, the limi- tations of descriptive and exclusively temperature-dependent phenology models have been recognized, and the use of explicative plant growth models combined with geographical information technology has been recommended.
ACKNOWLEDGEMENTS
We are grateful to Prof. I. Kreft, University of Ljubljana, Slovenia, for giv- ing advice on varieties and sowing dates. The temperature data for the Swiss locations have ben obtained from the Swiss Meteorological Institute, Zurich, Switzerland. We are particularly indebted to Dr E. Ktibler, University of Stuttgart-Hohenheim, Germany, who kindly sent us the published data on

568 J. Baumgiirtner et al.
buckwheat experiments as well as the temperature recordings. Model cali- bration was possible only because he generously made available this infor- mation.
REFERENCES
Allan, J. C. (1976) A modified sine wave for calculating degree days. Environ. Ent. 5, 388-396.
Angus, J. F., Cunningham, R. B., Moncur, M. W. and Mackenzie, D. H. (1981) Phasic development in field crops. I. Thermal response in the seedling phase. Field Crops Research 3, 365-378.
Angus, J. F., Mackenzie, D. H., Myers, R. J. K. and Foale, M. A. (1982) Phasic development in field crops. III. The pseudocereals, buckwheat and grain ama- ranth. Field Crops Research 5, 305-318.
Anonymous (1992a) Anbau und Verwertung von Buchweizen. Teil I: Eigenschaften und Kornertrage verschiedener Buchweizensorten. Schwabischer Bauer 44(16), 28-33.
Anonymous (19923) Anbau und Verwertung von Buchweizen. Teil II: Bestande- sentwicklung und Ertragsbildung. Schwabischer Bauer 44(17), 21-26.
Anonymous (1992~) Anbau und Verwertung von Buchweizen. Teil III. Korngutver- arbeitung und Deckungsbeitragsberechnung. Schwabischer Bauer 44( 18), 14-16.
A&hammer, W. and Ktibler, E. (1991) Zur Anbauwtirdigkeit von Buchweizen (Fagopyrum esculentum). Die Bodenkultur 42, 3143.
Aufhammer, W., Esswein, H. and Ktibler, E. (1994) Zur Entwicklung und Nutz- barkeit des Kornertragspotentials von Buchweizen (Fagopyrum esculentum). Die Bodenkultur 45, 37-47.
Baumgartner, J. and Hartmann, J. (1998a) Die Erhaltung von seltenen Blumen in den Wiesen und Weiden im Kanton Graubiinden. Vero@ztlichungen der Naturforschenden Gesellschaft Graubtinden (submitted 1998).
Baumgartner, J. and Hartmann, J. (19986) The timing of the earliest cutting date for conserving Narcissus radizflorus in Alpine meadows. Conservation Biology (sub- mitted 1998).
Curry, G. L. and Feldman, R. M. (1987) Mathematical Foundations of Population Dynamics. Texas A&M University Press, College Station. Texas.
De Jong, H. (1972) Buckwheat. Field Crop Abstracts 25, 389-396. Gilbert, N., Gutierrez, A. P., Frazer, B. D. and Jones, R. E. (1976) Ecological
Relationships. Freeman, Reading. Goudriaan, J. and Van Laar, H. H. (1994) Modelling Potential Growth Processes.
Kluwer, Dordrecht. Gutierrez, A. P. (1996) Applied Population Ecology: A Supply-Demand Approach.
Wiley, New York. Gutierrez, A. P. and Baumgartner, J. (1997) Poikilotherm growth based dynamics: a
comprehensive view. Environmental Entomology (submitted 1997). Jae Hak Lee (1995) Ertrag und Kornqualitat der Pseudogetreidearten Buchweizen
(Fagopyrum esculentum Moench), Reismelde (Chenopodium quinoa Willd.) und Amarant (Amaranthus hypochondriacus L. x A. hybridus) im Vergleich zur Getreideart Hafer (Avena sativa L.) in Abhangigkeit vom Anbauverfahren. PhD thesis, University of Hohenheim.
Planning buckwheat sowing dates in Alpine areas 569
Koblet, R. (1965) Landwirtschaftlicher PJanzenbau. Birkhauser, Basel. Kreft, I. (1989) Breeding of determinate buckwheat. Fagopyrum 9, 57-59. Lachmann, S. and Adachi, T. (1990) Studies on the influence of photoperiod and
temperature on floral traits in buckwheat (Fagopyrum esculentum Moench) under controlled stress conditions. Plant Breeding 105, 248-253.
Law, A. M. and Kelton, W. D. (1982) Simulation Modeling and Analysis. McGraw- Hill, New York.
Lieth, H. H. (1976) Contributions to phenology seasonality research. International Journal of Biometeorology 20, 197-199.
Marshal, H. G. and Pomeranz, Y. (1982) Buckwheat: description, breeding, pro- duction, and utilization. Advances in Cereal Science & Technology 5, 157-210.
Reaumur, R. A. F. (1735) Observations du thermometre, faites a Paris pendant l’annee 1735, compartes avec celles qui ont CtC faites sous la ligne, a 1’Isle de France, a Alger et en quelques’unes de nos isles de 1’AmCrique. Memoires de l’dcademie Royale des Sciences, Paris 1’735, 545-576.
Roux, 0. and Baumgartner, J. (1998) Evaluation of mortality factors and risk analysis for the design of an integrated pest management system. Ecological Modelling (in press).
Severini, M., Baumgartner, J. and Ricci, M. (1990) Theory and practice of para- meter estimation of distributed delay models for insect and plant phenologies. In Physical Climatology and Meteorology for Environmental Application, eds R. Guzzi, ‘4. Navarra and J. Shukla, pp. 674719. World Scientific Publishing, Singapore.
Sharpe, P. J. H. and Demichele, D. W. (1977) Reaction kinetics of poikilotherm development. Journal of Theoretical Biology 64, 649-670.