the transport of natural resources from latin america ... - cepal
TRANSCRIPT
Project Documents
The transport of natural resources from Latin America and the Caribbean
to Asia-Pacific
United Nations Economic and Social Commission for Asia and the Pacific (ESCAP) Economic Commission for Latin America and the Caribbean (ECLAC)
This document has been prepared by Division of Transport from the United Nations Economic and Social Commission for Asia and the Pacific and the Economic Commission for Latin America and the Caribbean (ECLAC) as part of the activities carried out under the project ECLAC/UNDA “Logistics integration for a more sustainable exploitation of natural resources in Latin America and the Caribbean” (SB-001324). The views expressed in this document, which has been reproduced without formal editing, are those of the authors and do not necessarily reflect the views of the Organization. Publicación de las Naciones Unidas LC/TS.2018/xx Distribución: Limitada Copyright © Naciones Unidas, marzo de 2018. Todos los derechos reservados Impreso en Naciones Unidas, Santiago S.17-xxxxx La autorización para reproducir total o parcialmente esta obra debe solicitarse a la Comisión Económica para América Latina y el Caribe (CEPAL), División de Publicaciones y Servicios Web, [email protected]. Los Estados Miembros de las Naciones Unidas y sus instituciones gubernamentales pueden reproducir esta obra sin autorización previa. Solo se les solicita que mencionen la fuente e informen a la CEPAL de tal reproducción.
ECLAC The transport of natural resources…
3
Contents
Contents .......................................................................................................................................... 3
Introduction ...................................................................................................................................... 7
I. Background .............................................................................................................................. 9
II. Exports of natural resources from Latin America to Asia-Pacific........................................... 13 A. Crude oil and natural gas ............................................................................................... 14 B. Metal ore ........................................................................................................................ 17 C. Coal ................................................................................................................................ 19 D. Summary ........................................................................................................................ 20
III. An overview of natural resources transportation from Latin America and the Caribbean to Asia-Pacific.......................................................................................... 23 A. Shipping route map ........................................................................................................ 23 B. Operation process of a bulk shipment ............................................................................ 28 C. Ports ............................................................................................................................... 29 D. Ships and freight market ................................................................................................ 30 E. Value added services ..................................................................................................... 31
1. Oil and gas industry ................................................................................................ 31 F. Inland transport of natural resources ............................................................................. 34
IV. Case Studies of natural resources logistics chains in Asia and the Pacific ........................... 35 A. The case of China .......................................................................................................... 35
1. Crude oil ................................................................................................................. 39 B. The case of India ............................................................................................................ 44 C. Japan .............................................................................................................................. 53 D. The case of the Republic of Korea ................................................................................. 56 E. Summary ........................................................................................................................ 59
1. Import and export ................................................................................................... 59 2. Logistics chain in importing countries ..................................................................... 60 3. Carrier strategy ....................................................................................................... 61 4. The strategy of buyers and shippers ...................................................................... 63
V. Best Practices for Transportation of Natural Resources from LAC to Asia-Pacific ............... 65 A. Practice initiated by shipper ........................................................................................... 65 B. Practice initiated by buyer .............................................................................................. 69
ECLAC The transport of natural resources…
4
C. Practice initiated by carrier ............................................................................................. 71 D. Summary ........................................................................................................................ 72 E. Strategic Level ................................................................................................................ 73 F. Operational Level ........................................................................................................... 77 G. Technological and infrastructure level............................................................................ 78
Conclusions ................................................................................................................................... 79
References .................................................................................................................................... 83
Tables Table 1 Import of natural resources by China, India, Japan and the Republic
of Korea, 2014 ..................................................................................................... 10 Table 2 Share of natural resources in the exports of major Latin American
countries, 2014 .................................................................................................... 11 Table 3 LAC exports share of selected countries, 1991 and 2014 ................................... 13 Table 4 Trade of main natural resources from LAC to Asia-Pacific, 2014 ........................ 14 Table 5 Crude oil import volume of Asia-Pacific countries from LAC, 2014 ..................... 15 Table 6 Natural gas imports volume of Asia-Pacific countries from LAC, 2014 ............... 16 Table 7 Volumes of iron ore imported by Asia-Pacific countries from LAC, 2014 ............ 18 Table 8 Volumes of copper ore imported by Asia-Pacific countries from LAC, 2014 ....... 19 Table 9 Coal imports volume of Asia-Pacific countries from LAC, 2014 .......................... 20 Table 10 Demand for natural resource of Asia-Pacific countries from LAC, 2014 ............. 21 Table 11 Distances between LAC and Asia-Pacific ports via different routes,
in nautical mile ..................................................................................................... 25 Table 12 The shortest routes between LAC and Asia-Pacific ports ................................... 26 Table 13 The estimation of crude oil and copper ore shipped from LAC
to Asia-Pacific through different routes (2014) ................................................... 27 Table 14 The advantages and disadvantages of each charter type ................................... 28 Table 15 Ranks of bulk ports in China, Republic of Korea, Japan and India ..................... 30 Table 16 Example of value creation of oil industry ............................................................. 33 Table 17 Major steel manufacturers with their year of founding ......................................... 37 Table 18 The major oil terminals and their corresponding operators ................................. 40 Table 19 The current and future refining capacity in Ningbo-Zhoushan region ................. 40 Table 20 Transshipment volume of crude oil at Ningbo Port .............................................. 42 Table 21 Liquid storage facilities around Kandla Complex ................................................. 48 Table 22 Liquid storage facilities around Kandla Complex ................................................. 48 Table 23 Crude oil imported from overseas through Kandla Port in 2015.......................... 49 Table 24 Oil product exports (overseas) through Kandla Port in 2015 by Essar Oil .......... 50 Table 25 Oil products transport from Kandla Port to other Indian ports in 2015-2016 by
Essar Oil ............................................................................................................... 51 Table 26 Imports of iron ore ................................................................................................ 53 Table 27 Annual throughputs of iron ore in Gwangyang Port ............................................. 57 Table 28 Volume sold by destination: Iron ore and pellets ................................................. 68 Table 29 Major steel producers of Asia-Pacific .................................................................. 69 Table 30 Australian coal exports by destination ................................................................. 78 Figures Figure 1 Crude oil export composition, 2014 ..................................................................... 14 Figure 2 Natural gas export composition, 2014 ................................................................. 15 Figure 3 Iron ore export composition, 2014 ....................................................................... 17 Figure 4 Copper ore export composition, 2014 .................................................................. 17 Figure 5 Coal export composition of LAC countries, 2014................................................. 20 Figure 6 China export destination of iron and steel, 2014 ................................................. 39 Figure 7 China export destination of oil products, 2014..................................................... 43
ECLAC The transport of natural resources…
5
Figure 8 China export destination of organic chemicals, 2014 .......................................... 44 Figure 9 India export destination of oil products, 2014 ...................................................... 45 Figure 10 Number of vessel handled in Kandla Port from 2013-2016 ................................. 47 Figure 11 DWT of vessels in Kandla Port from 2013-2016 .................................................. 47 Figure 12 Imports of crude oil from Venezuela at Kandla Port in 2013-2015 ...................... 49 Figure 13 India export destination of organic chemicals, 2014 ............................................ 52 Figure 14 Comparison of iron ore imports of China, Republic of Korea and Japan in 2015 59 Figure 15 Comparison of crude oil imports of China, Republic of Korea
and Japan in 2015 ............................................................................................... 60 Figure 16 Split of oil product exporting regions of major oil importers in Asia-Pacific ......... 60 Figure 17 Split of steel exporting regions of major iron ore importers in Asia-Pacific ......... 61 Figure 18 Number of ships transporting iron ore from Brazil in 2015 .................................. 62 Figure 19 Number of ships transporting iron ore from Brazil in 2016 .................................. 62 Diagrams Diagram 1 Operation process of a bulk shipment ................................................................. 29 Diagram 2 The oil and gas industry value chain ................................................................... 32 Diagram 3 The value chain of steel industry ......................................................................... 33 Diagram 4 Iron ore logistics chain in China ........................................................................... 37 Diagram 5 The hierarchical transshipment system of a bulk port ......................................... 38 Diagram 6 Crude oil logistics chain through Ningbo-Zhoushan Port .................................... 41 Diagram 7 The hierarchical transshipment system of crude oil at Kandla Port ..................... 52 Diagram 8 Overview of Port of Oita ....................................................................................... 54 Diagram 9 Steel production process through Oita port ......................................................... 54 Diagram 10 The hierarchical transshipment system of Oita Port ............................................ 55 Diagram 11 Hierarchical transshipment system of iron ore at Gwangyang port ..................... 58 Maps Map 1 Distribution of natural resource deposits in LAC and their paired
loading ports......................................................................................................... 24 Map 2 The shipping network of natural resource trade from LAC
to Asia-Pacific ...................................................................................................... 27 Map 3 The geographical location of Ningbo-Zhoushan Port .......................................... 36 Map 4 Geographic location of Kandla Port ..................................................................... 46 Map 5 The VALE iron ore shipping from Brazil ............................................................... 66 Map 6 The VALE iron ore distribution center in Malaysia ............................................... 67 Map 7 Proposed Colombia-Venezuela oil pipeline ......................................................... 76

ECLAC The transport of natural resources…
7
Introduction
Given the increasing trade in natural resources between the two regions and the dynamic trends in their
infrastructure and logistics development, the goal of this research is to understand the latest development
of natural resources transport between Latin America and Asia-Pacific, identify the best practices in
transporting natural resources, and explore the possible opportunities to further facilitate the trade
between the two regions from the perspective of transportation. Section 2 presents an overlook on the
natural resources trade between Latin America and Asia-Pacific. The function and role of transportation
in this trade are introduced in Section 3 in detail. Section 4 illustrates the natural resources logistics
chain in several major Asia-Pacific importing countries. Section 5 identifies the best practice of the
shipper, carrier and buyer respectively. Section 6 contains policy suggestions and implications for the
transport sector.

ECLAC The transport of natural resources…
9
I. Background
The Asia-Pacific region has become a very important partner of Latin America and the Caribbean
(LAC), as trade between countries in the two regions has grown at an annual average rate of 20.5 per
cent since 2000, reaching a historic high of over USD$500 billion dollars in 2014. This figure is
expected to grow to at least USD$750 billion by 2020 (Wignaraja, 2015). Along the way, Asia and the
Pacific’s share in LAC countries’ trade raised to an unprecedented 21 per cent, right behind the 34 per
cent of the United States (U.S.), the region’s main trading partner. Meanwhile, LAC countries’ share in
Asia and the Pacific’s trade more than doubled to 4.4 per cent.
The growth in interregional trade was visible during the global financial crisis of 2008-09, when
these exchanges provided a safe haven from declining markets in industrial economies. Another factor
triggering growth was buoyant demand for LAC commodities from the People’s Republic of China
(hereafter China), India and the ASEAN economies. Advances in information and communication
technology, better logistics and diminishing trade barriers have also fostered economic ties between Asia-
Pacific and LAC (Wignaraja, 2015).
Before the 1990s, there was little trade between the two regions. Latin America and the Caribbean,
whose goods were destined to the large North American market, used to view Asia-Pacific as a region
entailing high risks for business. Transport connections between these geographically remote regions were
poor, trade barriers were many and business ties barely existed. However, according to the World Bank,
East Asia’s poorer countries, whose Gross Domestic Product (GDP) per capita in the 1960s was a third of
Latin America’s, have almost caught up. Between the 1960s and the late 2000s their productivity growth
averaged more than 2 per cent a year, whereas in Latin America it was only just above zero. Lack of
investment remains one of Latin America’s main problems, with average investment rates having been
stuck around 20 per cent of GDP for decades, whereas in East Asia in the 1990s they averaged over 35 per
cent of GDP, with far denser electricity and transport networks as one of the consequences. East Asia has
also made progress in education, which has improved the quality of their workers (The Economist, 2014).
According to a joint research by the Asian Development Bank, the Inter-American
Development Bank, and the Asian Development Bank Institute, most of this increased trade relations
have been concentrated in only a few economies. On Asia and the Pacific’s side, China, Japan, Republic
of Korea, and India account for nearly 90 per cent of Asia and the Pacific’s total trade with LAC
countries, of which half is carried out by China. As for Latin American countries, Brazil, Mexico, Chile,
and Argentina account for approximately 80 per cent of the region’s total trade with Asia and the Pacific.
The study underlines that the surge has clearly been dominated by a commodity-for-manufacturing
pattern, deepening what has been a characteristic of this trade relationship since its early days despite
ECLAC The transport of natural resources…
10
profound structural changes taking place in the two regions. This pattern has translated into a high
concentration of Latin American countries’ exports on a small number of basic commodities: iron ore,
copper, soy, oil, sugar, paper pulp, and poultry; these goods correspond to 70 per cent of all exports. For
its part, Asia and the Pacific exports a wide range of manufactured goods, including ships, cars,
electronics, equipment, and parts and components.
Asia-Pacific is one of the fastest growing regions in the world, and many Asian countries have
been experiencing intensive industrialization during the recent decades. According to the International
Monetary Fund (IMF), world GDP expanded by 3.2 per cent in 2015 while the GDP growth rates of China
and India in 2015 were 6.9 per cent and 7.6 per cent respectively, ranking top two among the major
economies of the world. Other Asian developing countries that enjoyed middle to high GDP growth rates
in 2015 were Bangladesh (6.8 per cent), Indonesia (4.8 per cent), Malaysia (5.0 per cent), Pakistan (4.0
per cent), Philippines (5.9 per cent), Thailand (2.8 per cent), and Viet Nam (6.8 per cent). Asia-Pacific is
the most economic-active region in the world, with two developed countries - Japan and Republic of Korea
– ranking third and eleventh respectively in the world’s GDP in 2015. Because Asia-Pacific is a rising
manufacturing belt, the import of natural resources is crucial to countries in the region, especially to China
and India, the two rapidly growing giants, but also to Japan and Republic of Korea, the two matured major
economies in this region.
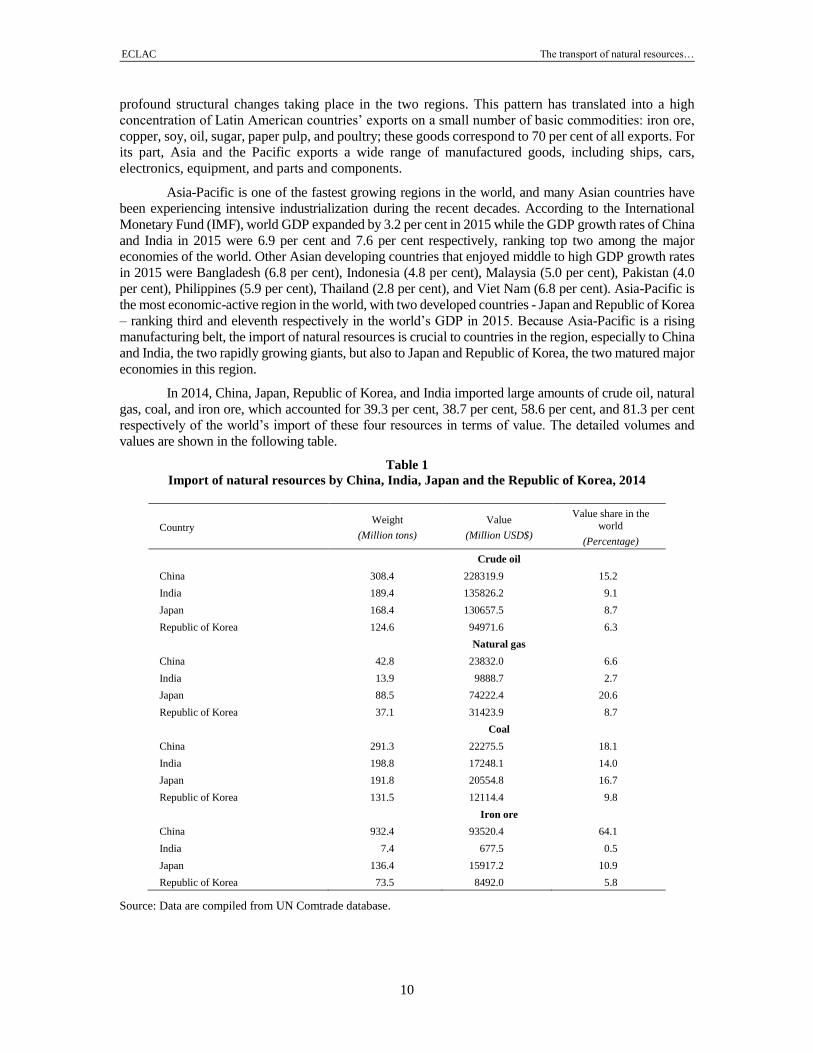
In 2014, China, Japan, Republic of Korea, and India imported large amounts of crude oil, natural
gas, coal, and iron ore, which accounted for 39.3 per cent, 38.7 per cent, 58.6 per cent, and 81.3 per cent
respectively of the world’s import of these four resources in terms of value. The detailed volumes and
values are shown in the following table.
Table 1
Import of natural resources by China, India, Japan and the Republic of Korea, 2014
Country Weight
(Million tons)
Value
(Million USD$)
Value share in the
world
(Percentage)
Crude oil
China 308.4 228319.9 15.2
India 189.4 135826.2 9.1
Japan 168.4 130657.5 8.7
Republic of Korea 124.6 94971.6 6.3
Natural gas
China 42.8 23832.0 6.6
India 13.9 9888.7 2.7
Japan 88.5 74222.4 20.6
Republic of Korea 37.1 31423.9 8.7
Coal
China 291.3 22275.5 18.1
India 198.8 17248.1 14.0
Japan 191.8 20554.8 16.7
Republic of Korea 131.5 12114.4 9.8
Iron ore
China 932.4 93520.4 64.1
India 7.4 677.5 0.5
Japan 136.4 15917.2 10.9
Republic of Korea 73.5 8492.0 5.8
Source: Data are compiled from UN Comtrade database.
ECLAC The transport of natural resources…
11
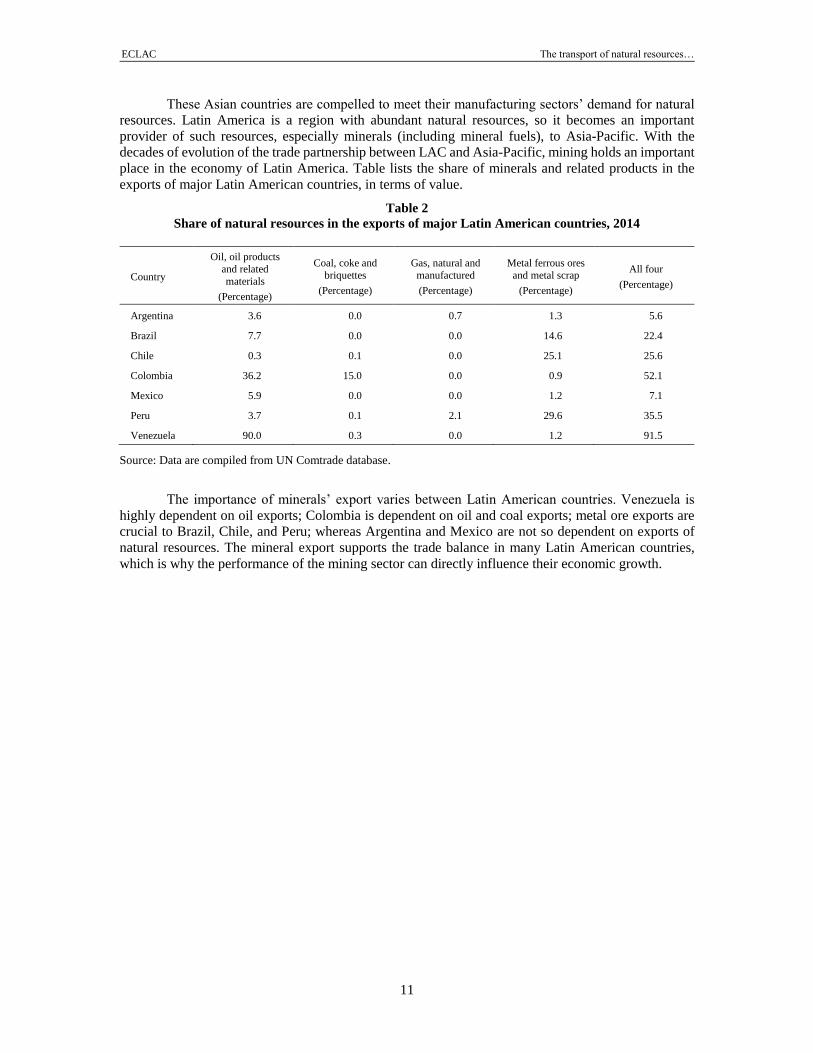
These Asian countries are compelled to meet their manufacturing sectors’ demand for natural
resources. Latin America is a region with abundant natural resources, so it becomes an important
provider of such resources, especially minerals (including mineral fuels), to Asia-Pacific. With the
decades of evolution of the trade partnership between LAC and Asia-Pacific, mining holds an important
place in the economy of Latin America. Table lists the share of minerals and related products in the
exports of major Latin American countries, in terms of value.
Table 2
Share of natural resources in the exports of major Latin American countries, 2014
Country
Oil, oil products
and related
materials
(Percentage)
Coal, coke and
briquettes
(Percentage)
Gas, natural and
manufactured
(Percentage)
Metal ferrous ores
and metal scrap
(Percentage)
All four
(Percentage)
Argentina 3.6 0.0 0.7 1.3 5.6
Brazil 7.7 0.0 0.0 14.6 22.4
Chile 0.3 0.1 0.0 25.1 25.6
Colombia 36.2 15.0 0.0 0.9 52.1
Mexico 5.9 0.0 0.0 1.2 7.1
Peru 3.7 0.1 2.1 29.6 35.5
Venezuela 90.0 0.3 0.0 1.2 91.5
Source: Data are compiled from UN Comtrade database.
The importance of minerals’ export varies between Latin American countries. Venezuela is
highly dependent on oil exports; Colombia is dependent on oil and coal exports; metal ore exports are
crucial to Brazil, Chile, and Peru; whereas Argentina and Mexico are not so dependent on exports of
natural resources. The mineral export supports the trade balance in many Latin American countries,
which is why the performance of the mining sector can directly influence their economic growth.

ECLAC The transport of natural resources…
13
II. Exports of natural resources from Latin America to Asia-Pacific
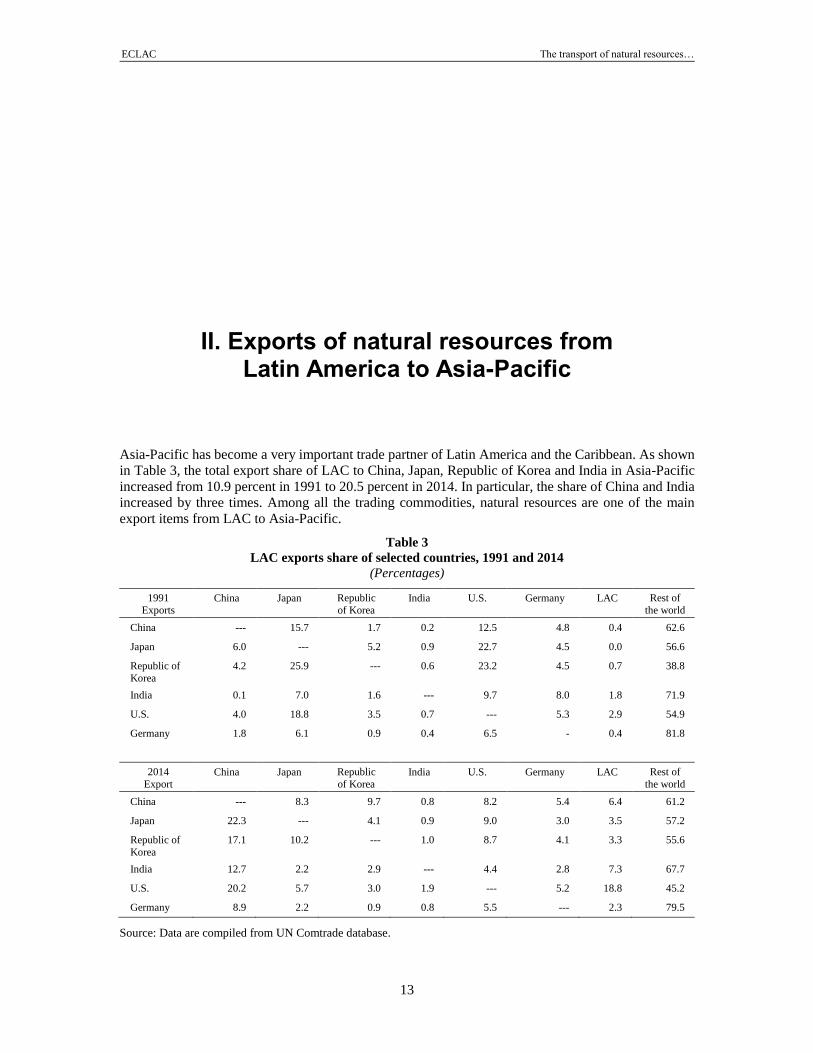
Asia-Pacific has become a very important trade partner of Latin America and the Caribbean. As shown
in Table 3, the total export share of LAC to China, Japan, Republic of Korea and India in Asia-Pacific
increased from 10.9 percent in 1991 to 20.5 percent in 2014. In particular, the share of China and India
increased by three times. Among all the trading commodities, natural resources are one of the main
export items from LAC to Asia-Pacific.
Table 3
LAC exports share of selected countries, 1991 and 2014
(Percentages)
1991
Exports China Japan Republic
of Korea India U.S. Germany LAC Rest of
the world
China --- 15.7 1.7 0.2 12.5 4.8 0.4 62.6
Japan 6.0 --- 5.2 0.9 22.7 4.5 0.0 56.6
Republic of
Korea
4.2 25.9 --- 0.6 23.2 4.5 0.7 38.8
India 0.1 7.0 1.6 --- 9.7 8.0 1.8 71.9
U.S. 4.0 18.8 3.5 0.7 --- 5.3 2.9 54.9
Germany 1.8 6.1 0.9 0.4 6.5 - 0.4 81.8
2014
Export China Japan Republic
of Korea India U.S. Germany LAC Rest of
the world
China --- 8.3 9.7 0.8 8.2 5.4 6.4 61.2
Japan 22.3 --- 4.1 0.9 9.0 3.0 3.5 57.2
Republic of
Korea
17.1 10.2 --- 1.0 8.7 4.1 3.3 55.6
India 12.7 2.2 2.9 --- 4.4 2.8 7.3 67.7
U.S. 20.2 5.7 3.0 1.9 --- 5.2 18.8 45.2
Germany 8.9 2.2 0.9 0.8 5.5 --- 2.3 79.5
Source: Data are compiled from UN Comtrade database.
ECLAC The transport of natural resources…
14
As table 4 highlights, the main types of natural resources exports from LAC to Asia-Pacific
cover a broad range of commodities including almost all the major trading resources such as crude oil,
natural gas, coal and iron ore. The exporting countries are diverse in term of types of resources, for
example, crude oil is exported from Venezuela, Colombia and Brazil, natural gas is exported from
Trinidad and Tobago and Panama, coal is exported from Chile and Colombia and iron ore is mainly
exported from Brazil.
Table 4
Trade of main natural resources from LAC to Asia-Pacific, 2014
Natural resources Countries
Crude oil Brazil, Colombia, Venezuela, Ecuador, Mexico
Iron Ore Brazil
Titanium Mexico
Aluminum Brazil, Dominican Republic
Coal Chile, Colombia
Copper Peru, Chile
Natural Gas Trinidad and Tobago, Peru, Panama
Source: Data are compiled from UN Comtrade database.
A. Crude oil and natural gas
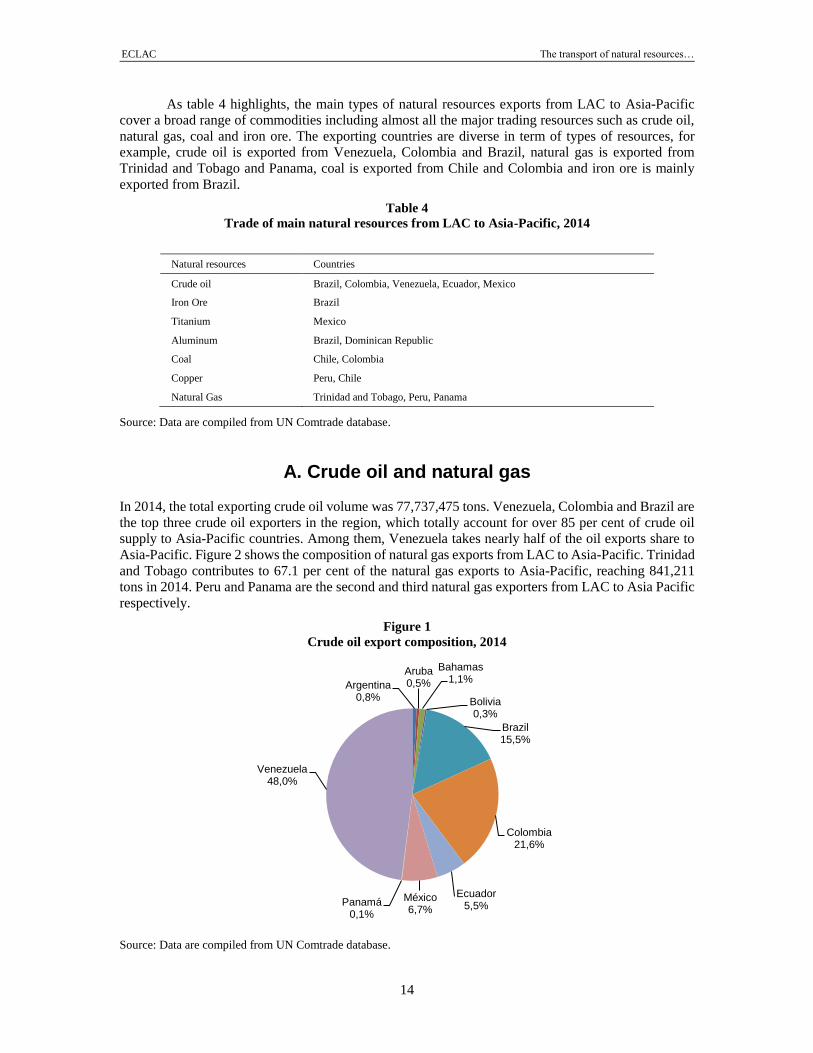
In 2014, the total exporting crude oil volume was 77,737,475 tons. Venezuela, Colombia and Brazil are
the top three crude oil exporters in the region, which totally account for over 85 per cent of crude oil
supply to Asia-Pacific countries. Among them, Venezuela takes nearly half of the oil exports share to
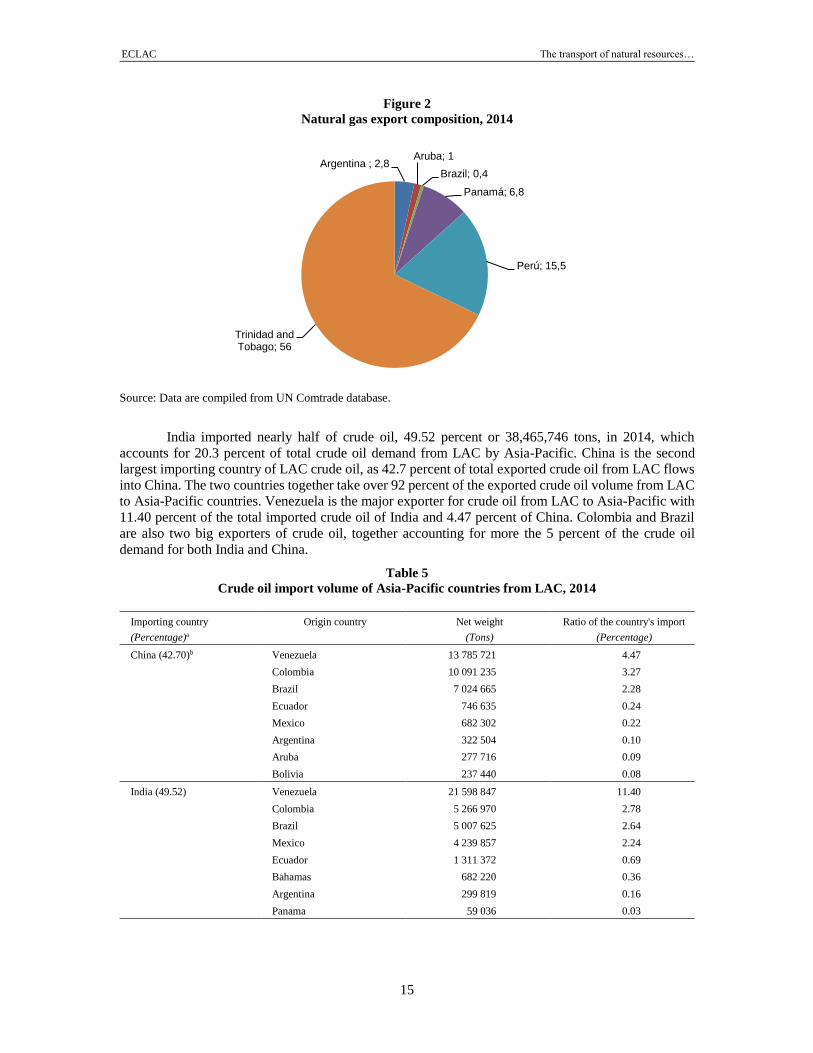
Asia-Pacific. Figure 2 shows the composition of natural gas exports from LAC to Asia-Pacific. Trinidad
and Tobago contributes to 67.1 per cent of the natural gas exports to Asia-Pacific, reaching 841,211
tons in 2014. Peru and Panama are the second and third natural gas exporters from LAC to Asia Pacific
respectively.
Figure 1
Crude oil export composition, 2014
Source: Data are compiled from UN Comtrade database.
Argentina0,8%
Aruba0,5%
Bahamas1,1%
Bolivia0,3%
Brazil15,5%
Colombia21,6%
Ecuador 5,5%
México6,7%
Panamá0,1%
Venezuela48,0%
ECLAC The transport of natural resources…
15
Figure 2
Natural gas export composition, 2014
Source: Data are compiled from UN Comtrade database.
India imported nearly half of crude oil, 49.52 percent or 38,465,746 tons, in 2014, which
accounts for 20.3 percent of total crude oil demand from LAC by Asia-Pacific. China is the second
largest importing country of LAC crude oil, as 42.7 percent of total exported crude oil from LAC flows
into China. The two countries together take over 92 percent of the exported crude oil volume from LAC
to Asia-Pacific countries. Venezuela is the major exporter for crude oil from LAC to Asia-Pacific with
11.40 percent of the total imported crude oil of India and 4.47 percent of China. Colombia and Brazil
are also two big exporters of crude oil, together accounting for more the 5 percent of the crude oil
demand for both India and China.
Table 5
Crude oil import volume of Asia-Pacific countries from LAC, 2014
Importing country
(Percentage)a
Origin country Net weight
(Tons)
Ratio of the country's import
(Percentage)
China (42.70)b Venezuela 13 785 721 4.47
Colombia 10 091 235 3.27
Brazil 7 024 665 2.28
Ecuador 746 635 0.24
Mexico 682 302 0.22
Argentina 322 504 0.10
Aruba 277 716 0.09
Bolivia 237 440 0.08
India (49.52)
Venezuela 21 598 847 11.40
Colombia 5 266 970 2.78
Brazil 5 007 625 2.64
Mexico 4 239 857 2.24
Ecuador 1 311 372 0.69
Bahamas 682 220 0.36
Argentina 299 819 0.16
Panama 59 036 0.03
Argentina ; 2,8Aruba; 1
Brazil; 0,4
Panamá; 6,8
Perú; 15,5
Trinidad and Tobago; 56
ECLAC The transport of natural resources…
16
Table 5 (conclusion)
Importing country
(Percentage)a
Origin country Net weight
(Tons)
Ratio of the country's import
(Percentage)
Japan (3.58)b
Ecuador 1 568 639 0.93
Colombia 554 480 0.33
Venezuela 375 286 0.22
Mexico 281 033 0.17
Malaysia (2.17) Venezuela 1 518 610 14.45
Bahamas 146 220 1.39
Ecuador 21 521 0.20
Republic of Korea (1.51) Colombia 609 791 0.49
Ecuador 387 727 0.31
Aruba 141 033 0.11
Bolivia 31 855 0.03
Source: Data are compiled from UN Comtrade database.
a Percentage of crude oil trade accounting for total crude oil trade from LAC to Asia-Pacific.
b The number in the bracket denotes the ratio of total importing volume from LAC.
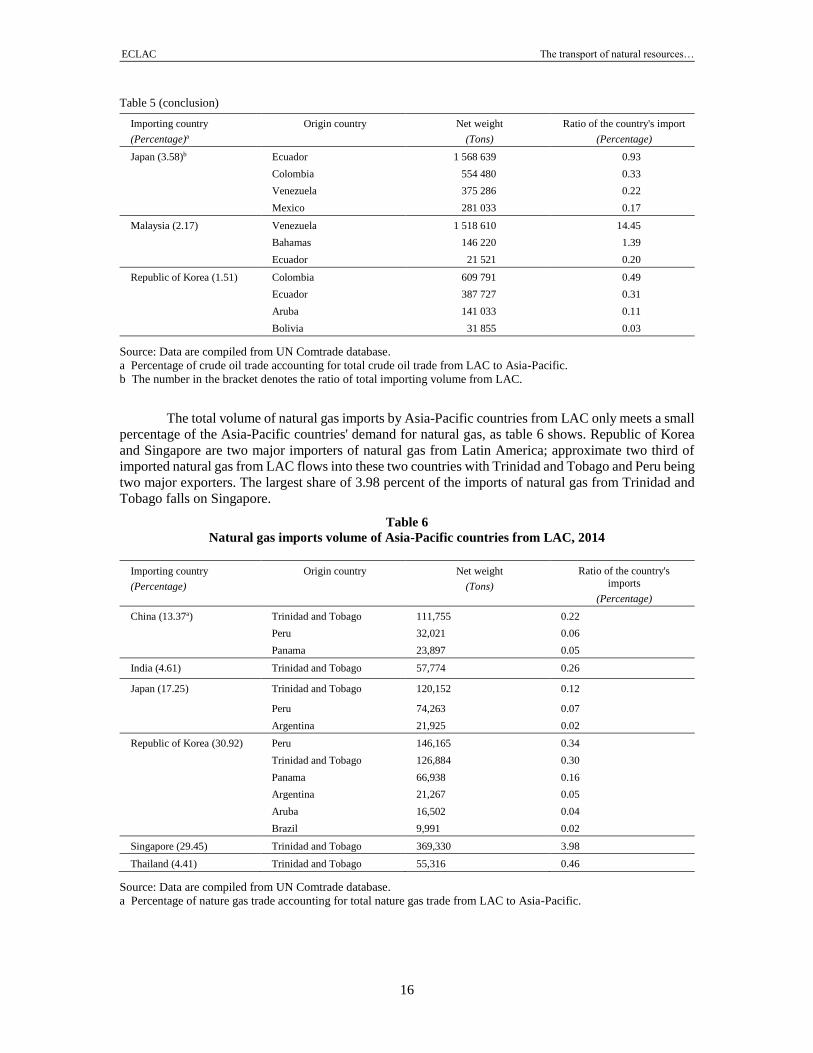
The total volume of natural gas imports by Asia-Pacific countries from LAC only meets a small
percentage of the Asia-Pacific countries' demand for natural gas, as table 6 shows. Republic of Korea
and Singapore are two major importers of natural gas from Latin America; approximate two third of
imported natural gas from LAC flows into these two countries with Trinidad and Tobago and Peru being
two major exporters. The largest share of 3.98 percent of the imports of natural gas from Trinidad and
Tobago falls on Singapore.
Table 6
Natural gas imports volume of Asia-Pacific countries from LAC, 2014
Importing country
(Percentage)
Origin country Net weight
(Tons)
Ratio of the country's
imports
(Percentage)
China (13.37a) Trinidad and Tobago 111,755 0.22
Peru 32,021 0.06
Panama 23,897 0.05
India (4.61) Trinidad and Tobago 57,774 0.26
Japan (17.25) Trinidad and Tobago 120,152 0.12
Peru 74,263 0.07
Argentina 21,925 0.02
Republic of Korea (30.92) Peru 146,165 0.34
Trinidad and Tobago 126,884 0.30
Panama 66,938 0.16
Argentina 21,267 0.05
Aruba 16,502 0.04
Brazil 9,991 0.02
Singapore (29.45) Trinidad and Tobago 369,330 3.98
Thailand (4.41) Trinidad and Tobago 55,316 0.46
Source: Data are compiled from UN Comtrade database.
a Percentage of nature gas trade accounting for total nature gas trade from LAC to Asia-Pacific.
ECLAC The transport of natural resources…
17
B. Metal ore
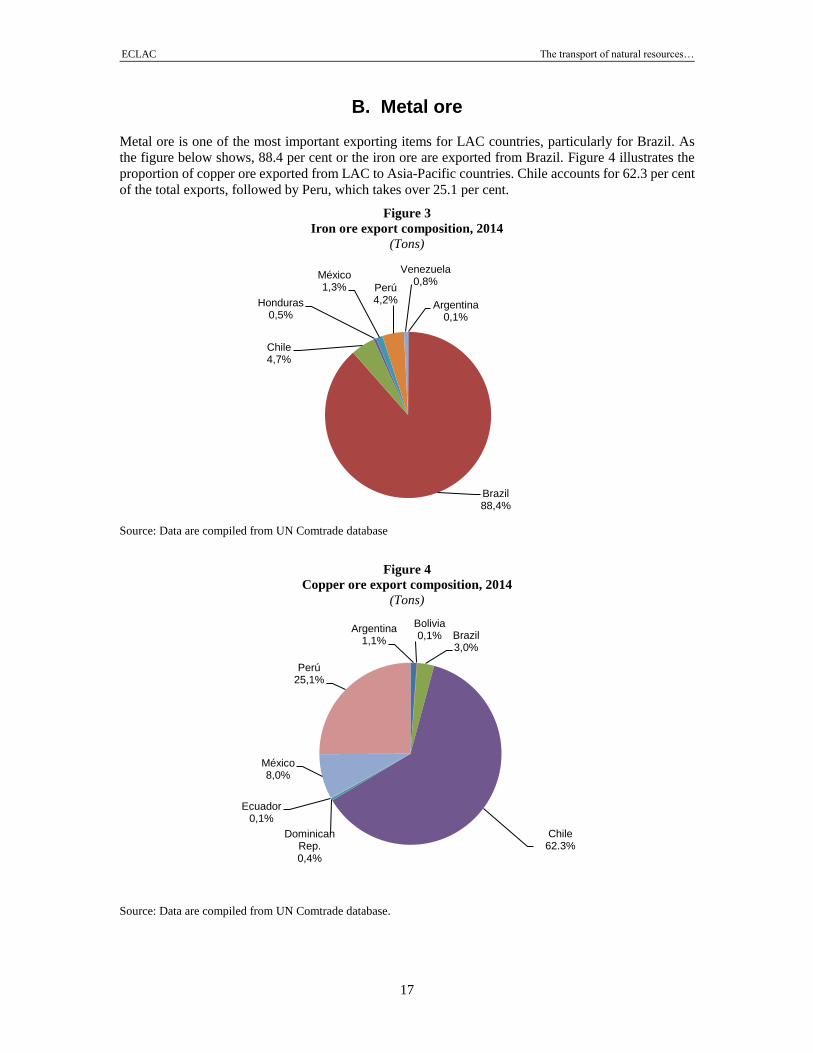
Metal ore is one of the most important exporting items for LAC countries, particularly for Brazil. As
the figure below shows, 88.4 per cent or the iron ore are exported from Brazil. Figure 4 illustrates the
proportion of copper ore exported from LAC to Asia-Pacific countries. Chile accounts for 62.3 per cent
of the total exports, followed by Peru, which takes over 25.1 per cent.
Figure 3
Iron ore export composition, 2014
(Tons)
Source: Data are compiled from UN Comtrade database
Figure 4
Copper ore export composition, 2014
(Tons)
Source: Data are compiled from UN Comtrade database.
Argentina0,1%
Brazil88,4%
Chile4,7%
Honduras0,5%
México1,3% Perú
4,2%
Venezuela0,8%
Argentina 1,1%
Bolivia0,1% Brazil
3,0%
Chile 62.3%
Dominican Rep.0,4%
Ecuador0,1%
México8,0%
Perú25,1%
ECLAC The transport of natural resources…
18
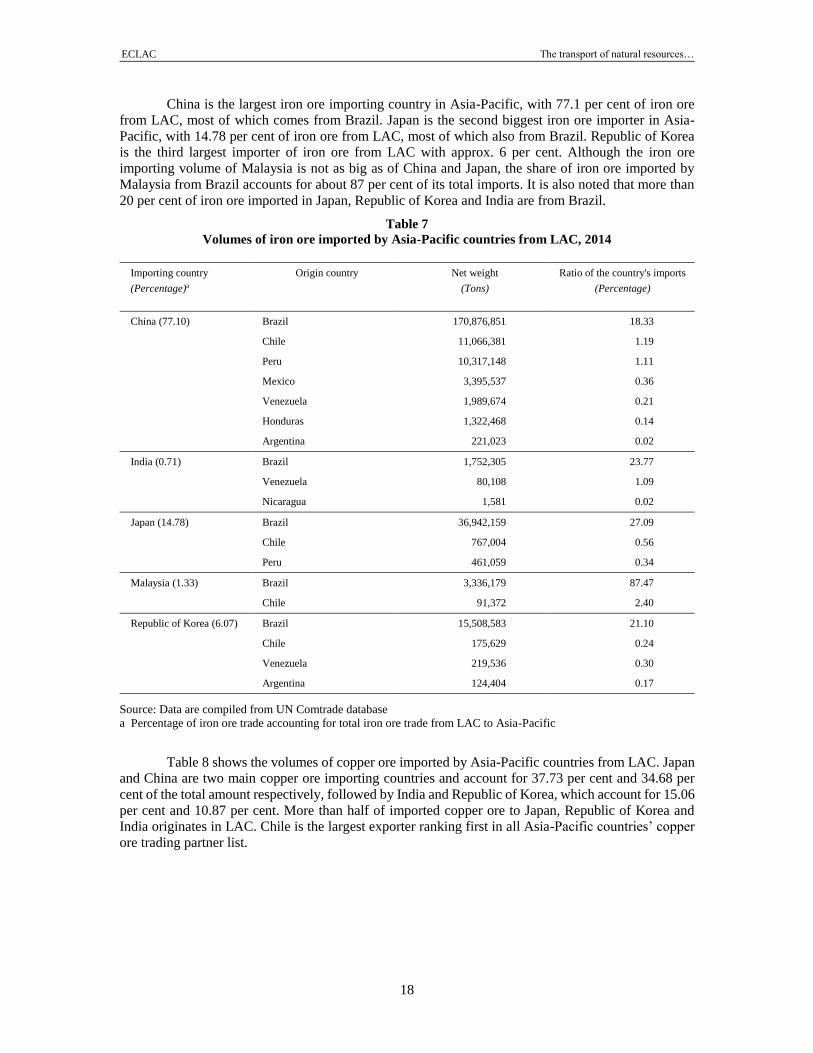
China is the largest iron ore importing country in Asia-Pacific, with 77.1 per cent of iron ore
from LAC, most of which comes from Brazil. Japan is the second biggest iron ore importer in Asia-
Pacific, with 14.78 per cent of iron ore from LAC, most of which also from Brazil. Republic of Korea
is the third largest importer of iron ore from LAC with approx. 6 per cent. Although the iron ore
importing volume of Malaysia is not as big as of China and Japan, the share of iron ore imported by
Malaysia from Brazil accounts for about 87 per cent of its total imports. It is also noted that more than
20 per cent of iron ore imported in Japan, Republic of Korea and India are from Brazil.
Table 7
Volumes of iron ore imported by Asia-Pacific countries from LAC, 2014
Importing country
(Percentage)a
Origin country Net weight
(Tons)
Ratio of the country's imports
(Percentage)
China (77.10) Brazil 170,876,851 18.33
Chile 11,066,381 1.19
Peru 10,317,148 1.11
Mexico 3,395,537 0.36
Venezuela 1,989,674 0.21
Honduras 1,322,468 0.14
Argentina 221,023 0.02
India (0.71) Brazil 1,752,305 23.77
Venezuela 80,108 1.09
Nicaragua 1,581 0.02
Japan (14.78) Brazil 36,942,159 27.09
Chile 767,004 0.56
Peru 461,059 0.34
Malaysia (1.33) Brazil 3,336,179 87.47
Chile 91,372 2.40
Republic of Korea (6.07) Brazil 15,508,583 21.10
Chile 175,629 0.24
Venezuela 219,536 0.30
Argentina 124,404 0.17
Source: Data are compiled from UN Comtrade database
a Percentage of iron ore trade accounting for total iron ore trade from LAC to Asia-Pacific
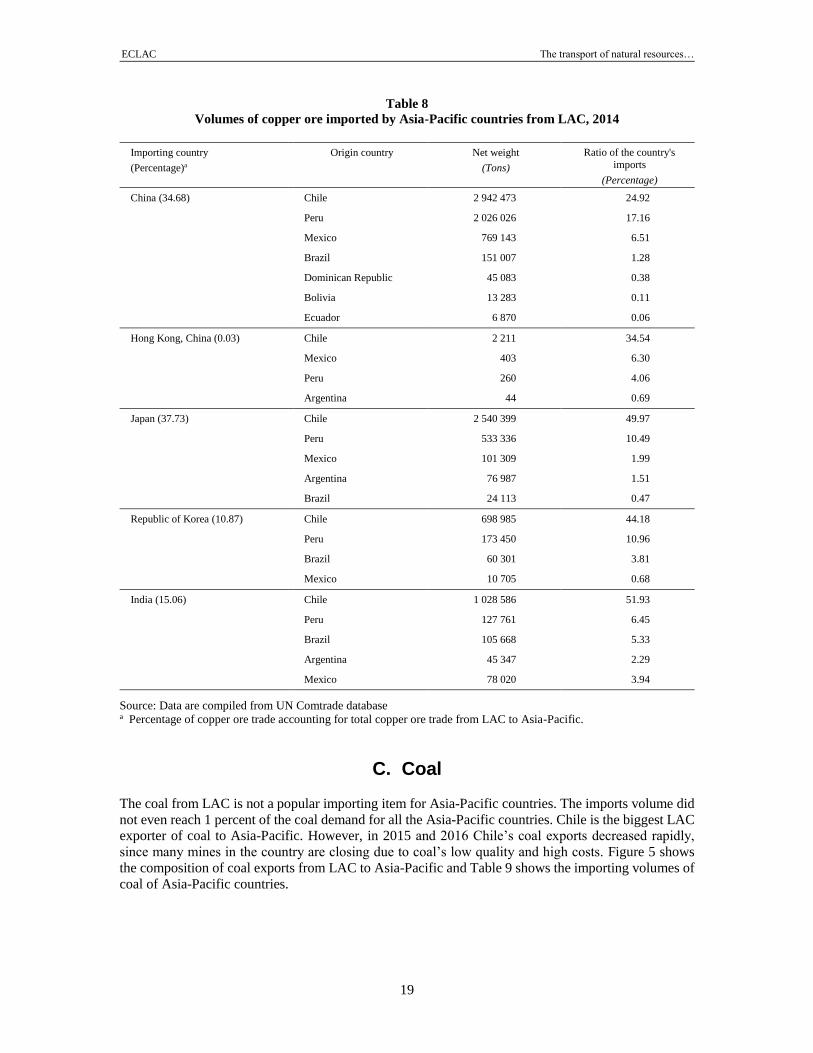
Table 8 shows the volumes of copper ore imported by Asia-Pacific countries from LAC. Japan
and China are two main copper ore importing countries and account for 37.73 per cent and 34.68 per
cent of the total amount respectively, followed by India and Republic of Korea, which account for 15.06
per cent and 10.87 per cent. More than half of imported copper ore to Japan, Republic of Korea and
India originates in LAC. Chile is the largest exporter ranking first in all Asia-Pacific countries’ copper
ore trading partner list.
ECLAC The transport of natural resources…
19
Table 8
Volumes of copper ore imported by Asia-Pacific countries from LAC, 2014
Importing country
(Percentage)a
Origin country Net weight
(Tons)
Ratio of the country's
imports
(Percentage)
China (34.68) Chile 2 942 473 24.92
Peru 2 026 026 17.16
Mexico 769 143 6.51
Brazil 151 007 1.28
Dominican Republic 45 083 0.38
Bolivia 13 283 0.11
Ecuador 6 870 0.06
Hong Kong, China (0.03) Chile 2 211 34.54
Mexico 403 6.30
Peru 260 4.06
Argentina 44 0.69
Japan (37.73) Chile 2 540 399 49.97
Peru 533 336 10.49
Mexico 101 309 1.99
Argentina 76 987 1.51
Brazil 24 113 0.47
Republic of Korea (10.87) Chile 698 985 44.18
Peru 173 450 10.96
Brazil 60 301 3.81
Mexico 10 705 0.68
India (15.06) Chile 1 028 586 51.93
Peru 127 761 6.45
Brazil 105 668 5.33
Argentina 45 347 2.29
Mexico 78 020 3.94
Source: Data are compiled from UN Comtrade database a Percentage of copper ore trade accounting for total copper ore trade from LAC to Asia-Pacific.
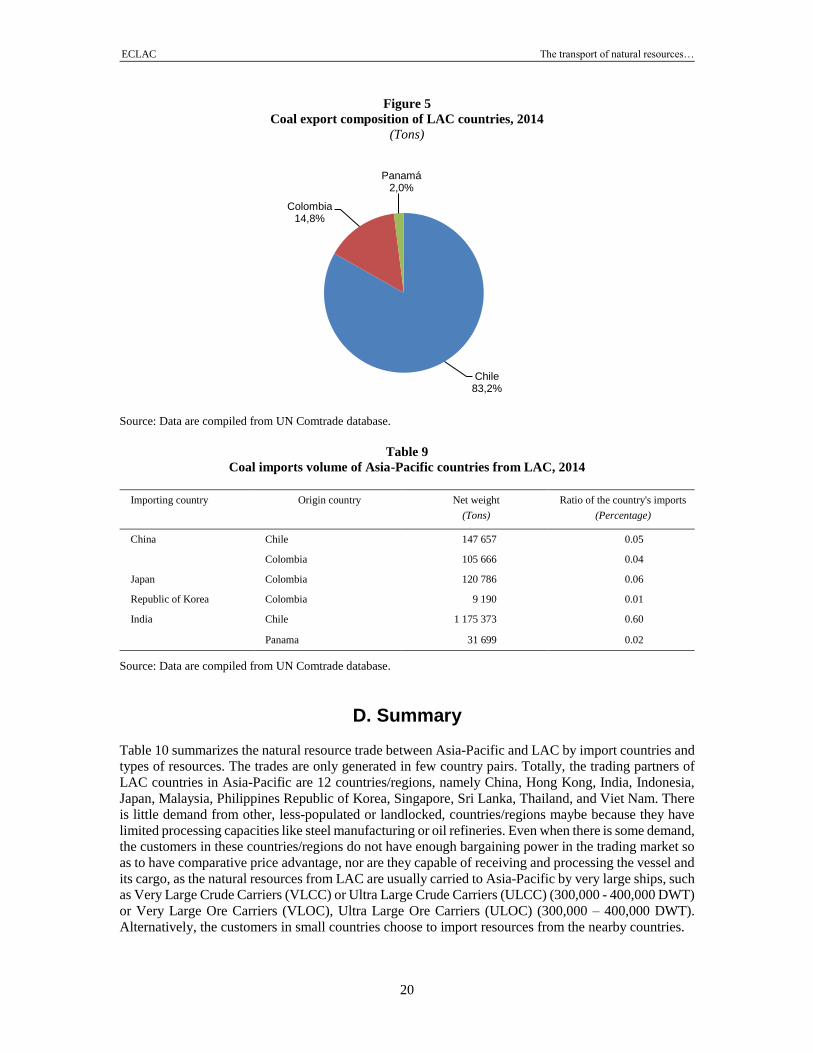
C. Coal
The coal from LAC is not a popular importing item for Asia-Pacific countries. The imports volume did
not even reach 1 percent of the coal demand for all the Asia-Pacific countries. Chile is the biggest LAC
exporter of coal to Asia-Pacific. However, in 2015 and 2016 Chile’s coal exports decreased rapidly,
since many mines in the country are closing due to coal’s low quality and high costs. Figure 5 shows
the composition of coal exports from LAC to Asia-Pacific and Table 9 shows the importing volumes of
coal of Asia-Pacific countries.
ECLAC The transport of natural resources…
20
Figure 5
Coal export composition of LAC countries, 2014
(Tons)
Source: Data are compiled from UN Comtrade database.
Table 9
Coal imports volume of Asia-Pacific countries from LAC, 2014
Importing country Origin country Net weight
(Tons)
Ratio of the country's imports
(Percentage)
China Chile 147 657 0.05
Colombia 105 666 0.04
Japan Colombia 120 786 0.06
Republic of Korea Colombia 9 190 0.01
India Chile 1 175 373 0.60
Panama 31 699 0.02
Source: Data are compiled from UN Comtrade database.
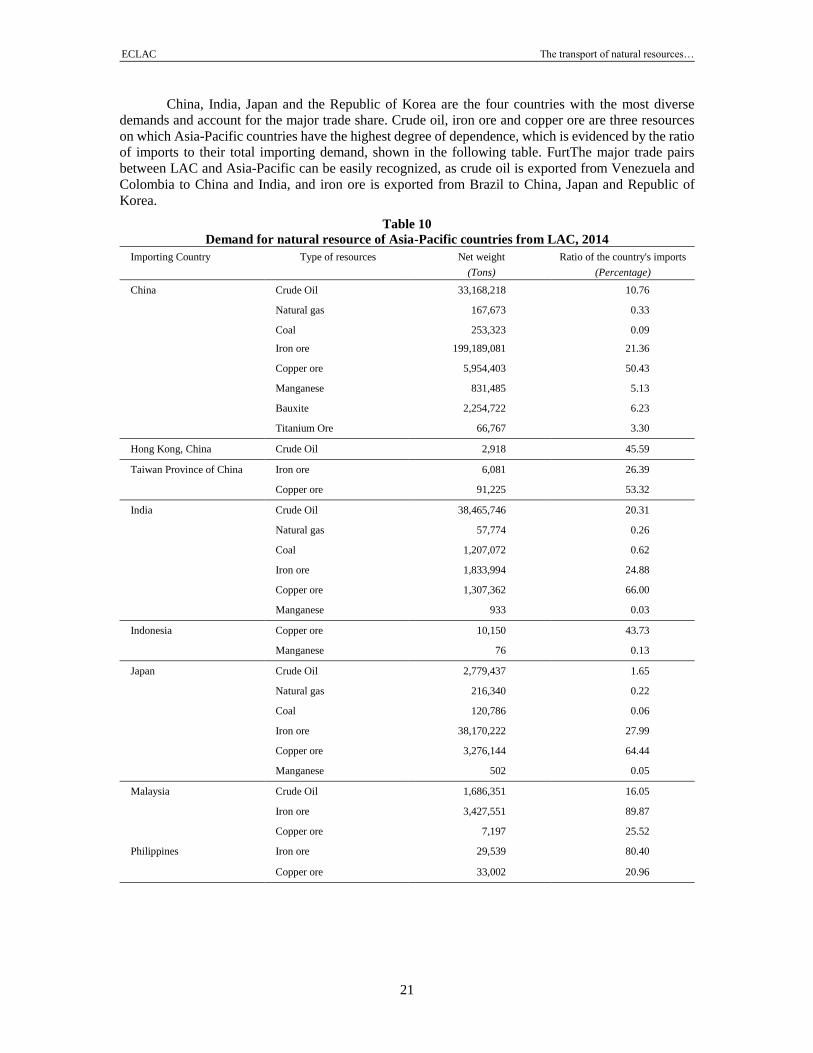
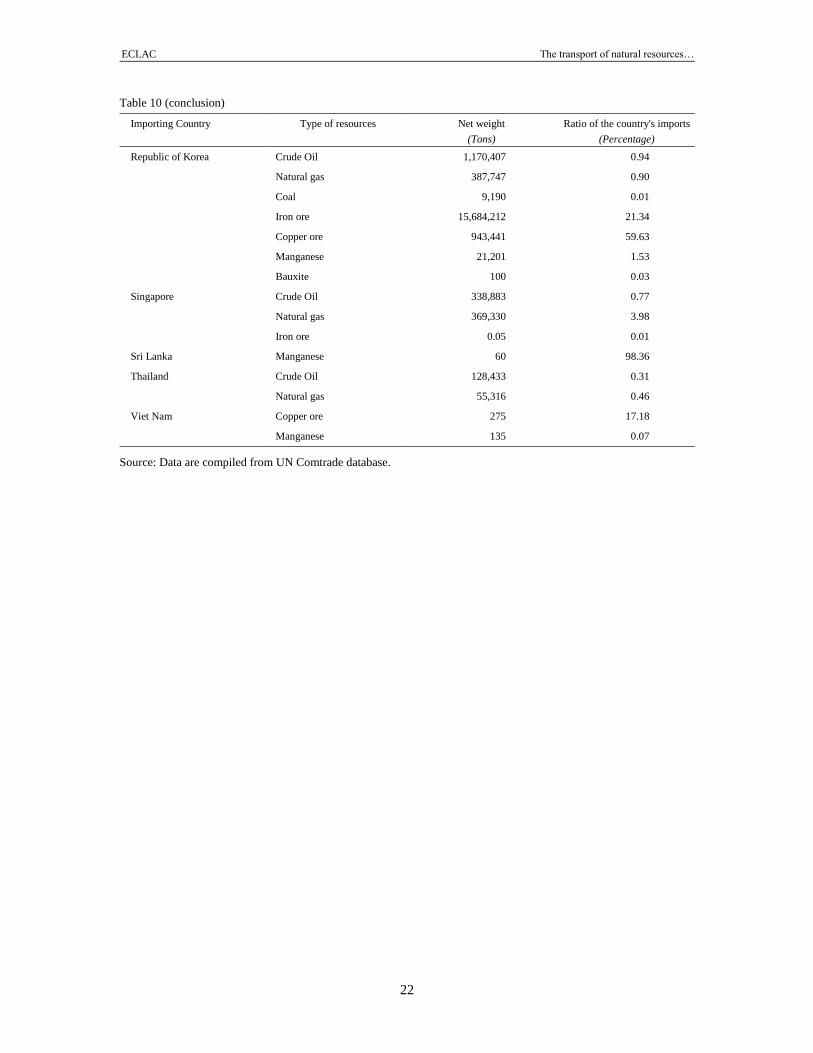
D. Summary
Table 10 summarizes the natural resource trade between Asia-Pacific and LAC by import countries and
types of resources. The trades are only generated in few country pairs. Totally, the trading partners of
LAC countries in Asia-Pacific are 12 countries/regions, namely China, Hong Kong, India, Indonesia,
Japan, Malaysia, Philippines Republic of Korea, Singapore, Sri Lanka, Thailand, and Viet Nam. There
is little demand from other, less-populated or landlocked, countries/regions maybe because they have
limited processing capacities like steel manufacturing or oil refineries. Even when there is some demand,
the customers in these countries/regions do not have enough bargaining power in the trading market so
as to have comparative price advantage, nor are they capable of receiving and processing the vessel and
its cargo, as the natural resources from LAC are usually carried to Asia-Pacific by very large ships, such
as Very Large Crude Carriers (VLCC) or Ultra Large Crude Carriers (ULCC) (300,000 - 400,000 DWT)
or Very Large Ore Carriers (VLOC), Ultra Large Ore Carriers (ULOC) (300,000 – 400,000 DWT).
Alternatively, the customers in small countries choose to import resources from the nearby countries.
Chile83,2%
Colombia14,8%
Panamá2,0%
ECLAC The transport of natural resources…
21
China, India, Japan and the Republic of Korea are the four countries with the most diverse
demands and account for the major trade share. Crude oil, iron ore and copper ore are three resources
on which Asia-Pacific countries have the highest degree of dependence, which is evidenced by the ratio
of imports to their total importing demand, shown in the following table. FurtThe major trade pairs
between LAC and Asia-Pacific can be easily recognized, as crude oil is exported from Venezuela and
Colombia to China and India, and iron ore is exported from Brazil to China, Japan and Republic of
Korea.
Table 10
Demand for natural resource of Asia-Pacific countries from LAC, 2014
Importing Country Type of resources Net weight
(Tons)
Ratio of the country's imports
(Percentage)
China
Crude Oil 33,168,218 10.76
Natural gas 167,673 0.33
Coal 253,323 0.09
Iron ore 199,189,081 21.36
Copper ore 5,954,403 50.43
Manganese 831,485 5.13
Bauxite 2,254,722 6.23
Titanium Ore 66,767 3.30
Hong Kong, China Crude Oil 2,918 45.59
Taiwan Province of China Iron ore 6,081 26.39
Copper ore 91,225 53.32
India Crude Oil 38,465,746 20.31
Natural gas 57,774 0.26
Coal 1,207,072 0.62
Iron ore 1,833,994 24.88
Copper ore 1,307,362 66.00
Manganese 933 0.03
Indonesia
Copper ore 10,150 43.73
Manganese 76 0.13
Japan
Crude Oil 2,779,437 1.65
Natural gas 216,340 0.22
Coal 120,786 0.06
Iron ore 38,170,222 27.99
Copper ore 3,276,144 64.44
Manganese 502 0.05
Malaysia
Crude Oil 1,686,351 16.05
Iron ore 3,427,551 89.87
Copper ore 7,197 25.52
Philippines
Iron ore 29,539 80.40
Copper ore 33,002 20.96
ECLAC The transport of natural resources…
22
Table 10 (conclusion)
Importing Country Type of resources Net weight
(Tons)
Ratio of the country's imports
(Percentage)
Republic of Korea
Crude Oil 1,170,407 0.94
Natural gas 387,747 0.90
Coal 9,190 0.01
Iron ore 15,684,212 21.34
Copper ore 943,441 59.63
Manganese 21,201 1.53
Bauxite 100 0.03
Singapore
Crude Oil 338,883 0.77
Natural gas 369,330 3.98
Iron ore 0.05 0.01
Sri Lanka Manganese 60 98.36
Thailand Crude Oil 128,433 0.31
Natural gas 55,316 0.46
Viet Nam Copper ore 275 17.18
Manganese 135 0.07
Source: Data are compiled from UN Comtrade database.
ECLAC The transport of natural resources…
23
III. An overview of natural resources transportation from Latin America and the Caribbean to Asia-Pacific
A. Shipping route map
The geographic distribution of the natural resource deposits is the determinant for the shipping routes
chosen. For the Asia-Pacific countries, the most important Latin American natural resources in terms of
trade volumes are the crude oil from Venezuela, Colombia, and Brazil; the iron ore from Brazil, Chile,
and Peru; and, the copper ore from Chile, Peru, and Mexico. shows these natural resource deposits and
their main loading ports in LAC.
ECLAC The transport of natural resources…
24
Map 1
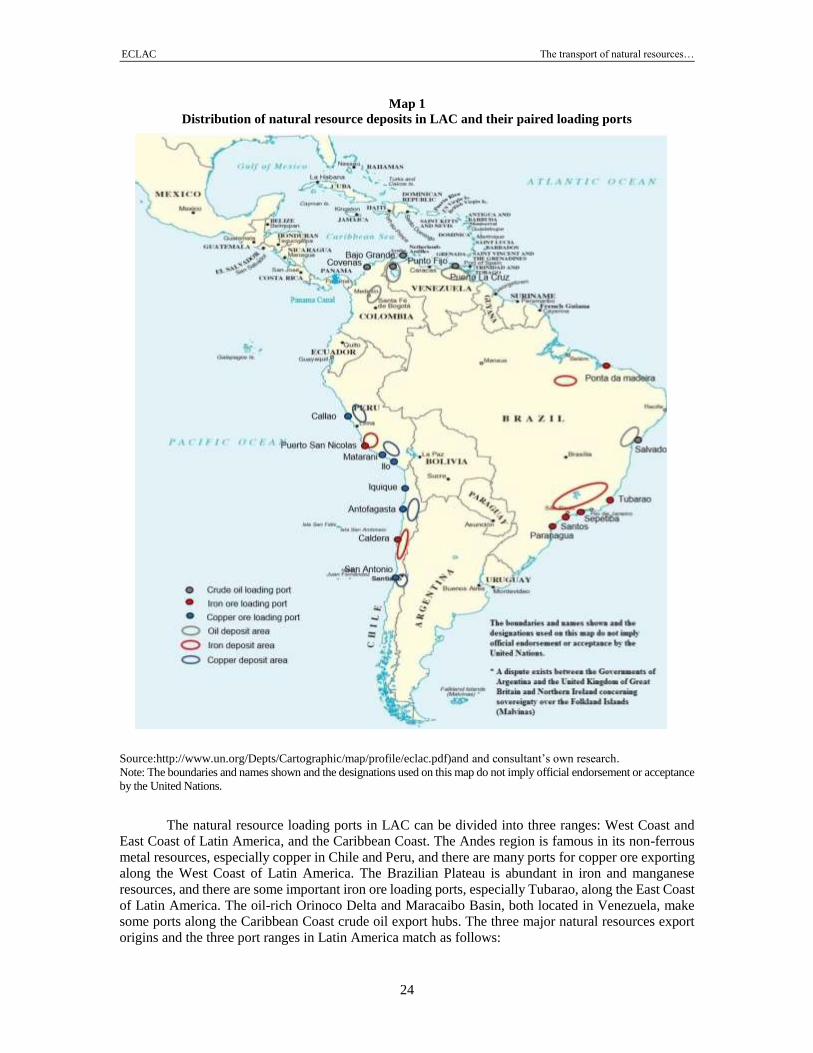
Distribution of natural resource deposits in LAC and their paired loading ports
Source:http://www.un.org/Depts/Cartographic/map/profile/eclac.pdf)and and consultant’s own research.
Note: The boundaries and names shown and the designations used on this map do not imply official endorsement or acceptance
by the United Nations.
The natural resource loading ports in LAC can be divided into three ranges: West Coast and
East Coast of Latin America, and the Caribbean Coast. The Andes region is famous in its non-ferrous
metal resources, especially copper in Chile and Peru, and there are many ports for copper ore exporting
along the West Coast of Latin America. The Brazilian Plateau is abundant in iron and manganese
resources, and there are some important iron ore loading ports, especially Tubarao, along the East Coast
of Latin America. The oil-rich Orinoco Delta and Maracaibo Basin, both located in Venezuela, make some ports along the Caribbean Coast crude oil export hubs. The three major natural resources export
origins and the three port ranges in Latin America match as follows:
ECLAC The transport of natural resources…
25
• Oil - Caribbean Coast
• Iron - East Coast of Latin America
• Copper - West Coast of Latin America
Each range may export other resources not included in the above in minor quantities. For
example, Salvador in the East Coast of Latin America exports crude oil, but it is relatively smaller than
Puerto La Cruz on the Caribbean Coast. Because of the different geographic position, these three port
ranges get connected to Asia-Pacific region by different shipping routes, to shorten the distance and
minimize the costs. Three routes generally connect these two regions, namely:
• the Cape route, which goes across the Atlantic Ocean, round the Cape of Good Hope, and
across the Indian Ocean;
• the Panama route, which goes through the Panama Canal, and then goes across the Pacific
Ocean (for Atlantic side ports) or the Atlantic Ocean and the Indian Ocean (for Pacific side
ports);
• the Pacific route, which goes through the Pacific Ocean.
The distance matrix corresponding to different routes is shown below:
Table 11
Distances between LAC and Asia-Pacific ports via different routes, in nautical mile
Range Loading Port via Cape via Panama
Oita Ningbo Kandla Oita Ningbo Kandla
CC Puerto La Cruz 13 513 13 300 10 400 9 100 9 800 14 400
ECLA Ponta da Madeira 12 031 11 800 8 900 10 598 11 300 16 000
ECLA Tubarao 11 207 10 900 8 000 12 091 12 800 17 500
via Pacific via Cape
WCLA San Antonio 9 643 10 100 13 000 13 147 12 804 10 208
WCLA Callao 8 826 9 400 13 500 14 424 13 991 11 485
WCLA Guaymas 6 354 7 000 11 700 17 140 16 707 14 201
Source: Calculated by Netpas Distance.
Note: CC: Caribbean Coast; ECLA: East Coast of Latin America; WCLA: West Coast of Latin America.
Table 11 lists different distances between port pairs. To make the comparison of distance more
straightforward,
Table 12 is established based on the matrix of Table 11. It shows the shortest routes between
LAC and Asia-Pacific ports as well as the saving distances compared to other option.
ECLAC The transport of natural resources…
26
Table 12
The shortest routes between LAC and Asia-Pacific ports
(in miles)
Range Loading port Unloading port Shortest route Saving distance
CC Puerto La Cruz Oita Panama 4 413
Ningbo Panama 3 500
Kandla Cape 4 000
ECLA Ponta da Madeira
Oita Panama 1 433
Ningbo Panama 500
Kandla Cape 7 100
ECLA Tubarao
Oita Cape 884
Ningbo Cape 1 900
Kandla Cape 9 500
WCLA San Antonio
Oita Pacific 3 504
Ningbo Pacific 2 704
Kandla Cape 2 792
WCLA Callao
Oita Pacific 5 598
Ningbo Pacific 4 591
Kandla Cape 2 015
WCLA Guaymas
Oita Pacific 10 786
Ningbo Pacific 9 707
Kandla Pacific 2 501
Source: Calculated by Netpas Distance.
It is clear that for the routes connecting East Asian ports (Oita and Ningbo), on the Atlantic side
of LAC (including the Caribbean Coast and the East Coast), ship departing from the ports located on
the west or north of Ponta da Madeira will use the Panama route, while ships from the ports on the east
or south of Ponta da Madeira will use the Cape route; and on the Pacific side, the Pacific route is always
better than the Cape route. However, for the routes connecting South Asian ports (see
Table 13 on the Atlantic side, the Cape route is always the first choice; and on the Pacific side,
even to the ports close enough to the Cape Horn (e.g. Callao and San Antonio), the Pacific route is
preferred, because that the wind is always strong in the Cape Horn.
Considering the different natural resources matching the ports, and based on the data in Table
11, we can make an estimate of the volume of resources shipped via different routes from LAC to Asia-
Pacific. However, it is difficult to estimate the iron ore flows of some items because some of the iron
ore is exported from Ponta da Madeira of Brazil, which may go through the Panama route, while the
iron ore from other Brazilian ports will generally go through the Cape route.
ECLAC The transport of natural resources…
27
Table 13
The estimation of crude oil and copper ore shipped from LAC to Asia-Pacific
through different routes (2014)
(million tons)
Route Crude oil Copper ore
Panama 30.1 0.2
Cape 44.4 0.5
Pacific 3.2 11.0
Total 77.7 11.6
Source: Calculated by Netpas Distance.
Furthermore, for the Cape route, not only the Malacca Strait, however, the Sunda Strait is also
used. Some ships choose to refuel at Singapore and finally reach their destinations in China, Japan, and
Republic of Korea. When the oil price is high, more ships choose this route because the carrier can save
a large cost by refueling the cheap fuel in Singapore. Of course, the distance is not the only factor
considered by carriers. The transit expenses (200,000 USD$ dollar/ship) and waiting time to pass
through the Panama Canal will make carriers reluctant to choose this route.
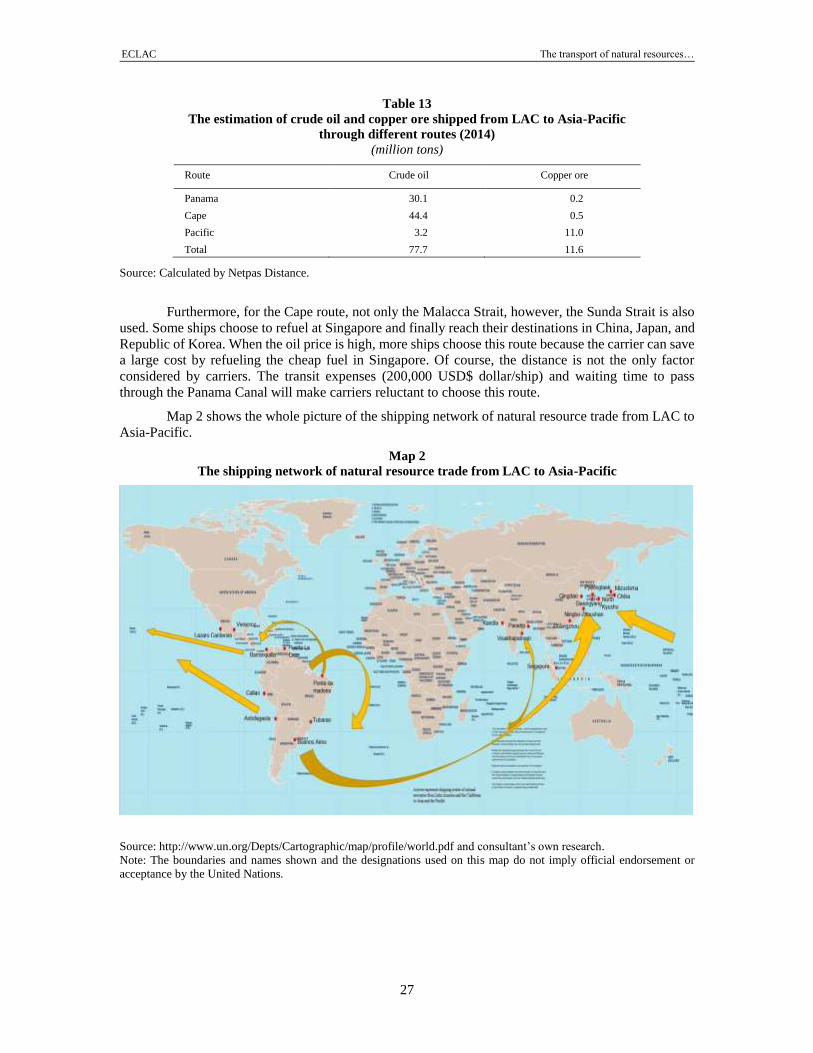
Map 2 shows the whole picture of the shipping network of natural resource trade from LAC to
Asia-Pacific.
Map 2
The shipping network of natural resource trade from LAC to Asia-Pacific
Source: http://www.un.org/Depts/Cartographic/map/profile/world.pdf and consultant’s own research.
Note: The boundaries and names shown and the designations used on this map do not imply official endorsement or
acceptance by the United Nations.
ECLAC The transport of natural resources…
28
B. Operation process of a bulk shipment
The shipping process of bulk cargoes is realized generally by ship chartering. Four types of Charter
Arrangements are generally used, which are Contracts of Affreightment (COA), Voyage Charter
Contracts (Spot Charter), Timecharters (TC) and Bareboat Charter (BBC) (Konstantinos, 2015). COA
is basically a contract between a ship-owner and the charterer, in which the ship-owner agrees to carry
goods for the charterer, or to give the charterer the right to use the whole or part of the ship's cargo-
carrying space for the carriage of goods for several voyages during a specific period of time. The COA
can be viewed as a number of voyage charters, agreed simultaneously and constituting one contract, a
specific ship for each cargo not regularly mentioned in the contract. Voyage Charter refers to a single
voyage, where the ship owner (or carrier) provides the master, crew, bunkers and supplies. Voyage
Charter is ideal for a small number of specific cargo that will be transported from a load port to a
discharge port. In Timecharters, the charterer takes the operational control of the ship for a specific time,
mainly hiring the ship for using it for his own interest. The hiring time can last from some days, which
is likely to be the same with a short-term voyage charter, to months or years. Bareboat Charter is a time
charter with difference that the charterer runs vessel with full management, that is, the charterer arranges
the crew, insurance and pay all the necessary fees. Bareboat charters are mainly used for a lengthy
period, which later may end up with the ownership being transferred to the charterer. The table below
summarizes the features of different charter types.
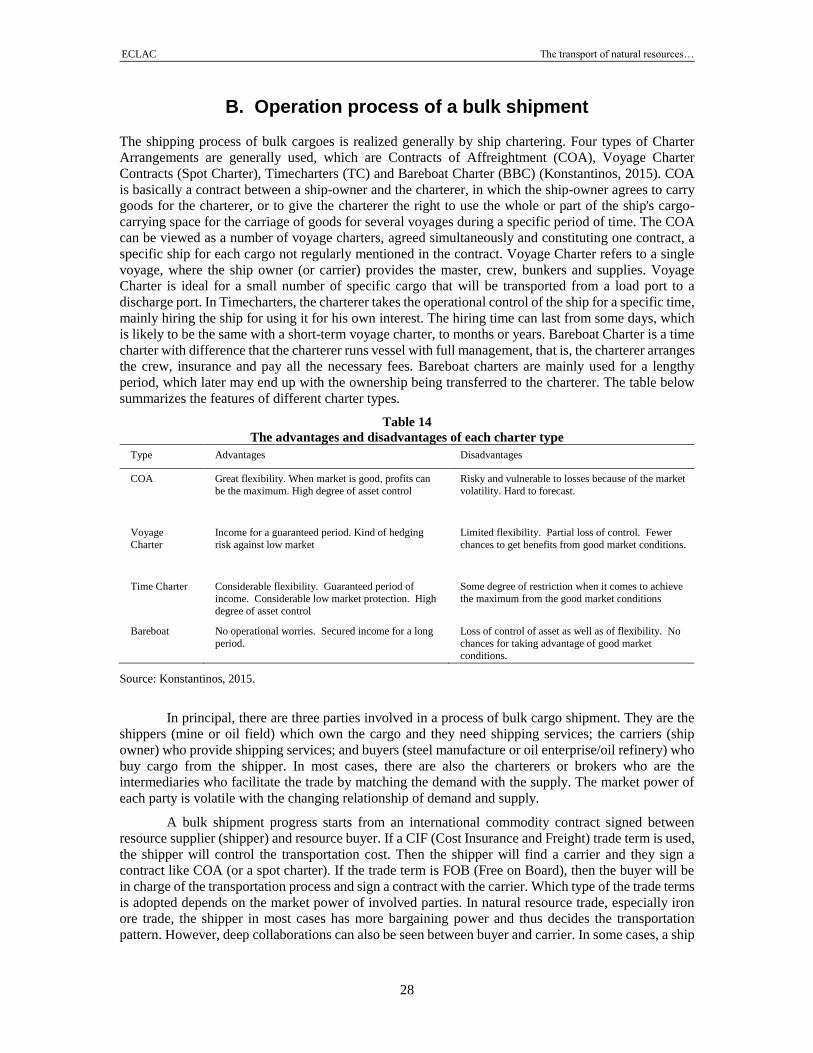
Table 14
The advantages and disadvantages of each charter type
Type Advantages Disadvantages
COA Great flexibility. When market is good, profits can
be the maximum. High degree of asset control
Risky and vulnerable to losses because of the market
volatility. Hard to forecast.
Voyage
Charter
Income for a guaranteed period. Kind of hedging
risk against low market
Limited flexibility. Partial loss of control. Fewer
chances to get benefits from good market conditions.
Time Charter Considerable flexibility. Guaranteed period of
income. Considerable low market protection. High
degree of asset control
Some degree of restriction when it comes to achieve
the maximum from the good market conditions
Bareboat No operational worries. Secured income for a long
period.
Loss of control of asset as well as of flexibility. No
chances for taking advantage of good market
conditions.
Source: Konstantinos, 2015.
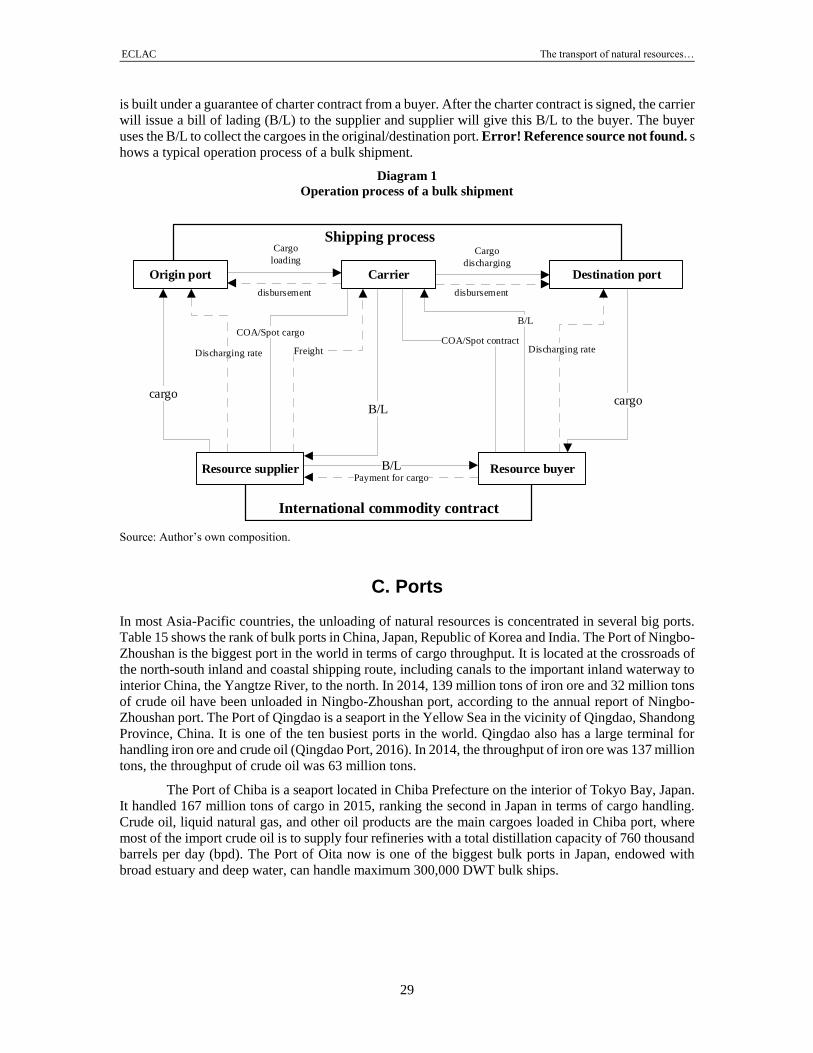
In principal, there are three parties involved in a process of bulk cargo shipment. They are the
shippers (mine or oil field) which own the cargo and they need shipping services; the carriers (ship
owner) who provide shipping services; and buyers (steel manufacture or oil enterprise/oil refinery) who
buy cargo from the shipper. In most cases, there are also the charterers or brokers who are the
intermediaries who facilitate the trade by matching the demand with the supply. The market power of
each party is volatile with the changing relationship of demand and supply.
A bulk shipment progress starts from an international commodity contract signed between
resource supplier (shipper) and resource buyer. If a CIF (Cost Insurance and Freight) trade term is used,
the shipper will control the transportation cost. Then the shipper will find a carrier and they sign a
contract like COA (or a spot charter). If the trade term is FOB (Free on Board), then the buyer will be
in charge of the transportation process and sign a contract with the carrier. Which type of the trade terms
is adopted depends on the market power of involved parties. In natural resource trade, especially iron ore trade, the shipper in most cases has more bargaining power and thus decides the transportation
pattern. However, deep collaborations can also be seen between buyer and carrier. In some cases, a ship
ECLAC The transport of natural resources…
29
is built under a guarantee of charter contract from a buyer. After the charter contract is signed, the carrier
will issue a bill of lading (B/L) to the supplier and supplier will give this B/L to the buyer. The buyer
uses the B/L to collect the cargoes in the original/destination port. Error! Reference source not found. s
hows a typical operation process of a bulk shipment.
Diagram 1
Operation process of a bulk shipment
cargocargo
B/L
B/L
B/L
Freight
Payment for cargo
Discharging rate Discharging rate
COA/Spot cargoCOA/Spot contract
Origin port Carrier Destination port
Resource supplier Resource buyer
Cargo
loadingCargo
discharging
disbursement disbursement
Shipping process
International commodity contract
Source: Author’s own composition.
C. Ports
In most Asia-Pacific countries, the unloading of natural resources is concentrated in several big ports.
Table 15 shows the rank of bulk ports in China, Japan, Republic of Korea and India. The Port of Ningbo-
Zhoushan is the biggest port in the world in terms of cargo throughput. It is located at the crossroads of
the north-south inland and coastal shipping route, including canals to the important inland waterway to
interior China, the Yangtze River, to the north. In 2014, 139 million tons of iron ore and 32 million tons
of crude oil have been unloaded in Ningbo-Zhoushan port, according to the annual report of Ningbo-
Zhoushan port. The Port of Qingdao is a seaport in the Yellow Sea in the vicinity of Qingdao, Shandong
Province, China. It is one of the ten busiest ports in the world. Qingdao also has a large terminal for
handling iron ore and crude oil (Qingdao Port, 2016). In 2014, the throughput of iron ore was 137 million
tons, the throughput of crude oil was 63 million tons.
The Port of Chiba is a seaport located in Chiba Prefecture on the interior of Tokyo Bay, Japan.
It handled 167 million tons of cargo in 2015, ranking the second in Japan in terms of cargo handling.
Crude oil, liquid natural gas, and other oil products are the main cargoes loaded in Chiba port, where
most of the import crude oil is to supply four refineries with a total distillation capacity of 760 thousand
barrels per day (bpd). The Port of Oita now is one of the biggest bulk ports in Japan, endowed with
broad estuary and deep water, can handle maximum 300,000 DWT bulk ships.
ECLAC The transport of natural resources…
30
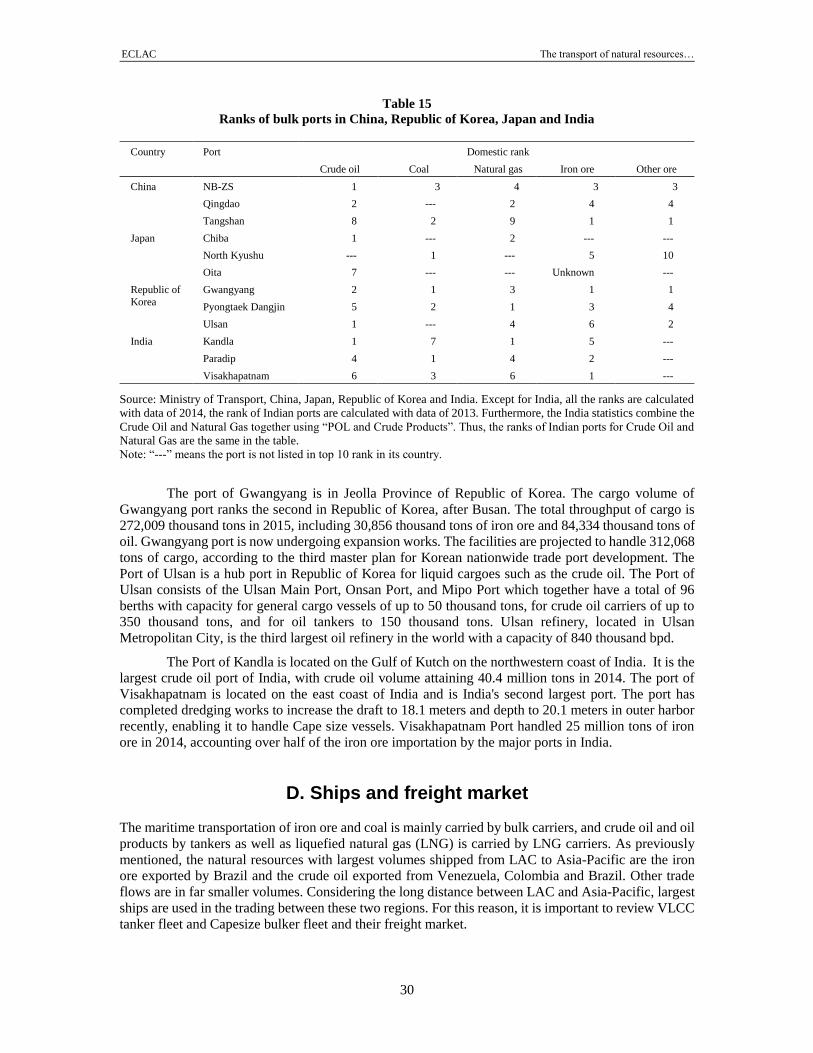
Table 15
Ranks of bulk ports in China, Republic of Korea, Japan and India
Country Port Domestic rank
Crude oil Coal Natural gas Iron ore Other ore
China NB-ZS 1 3 4 3 3
Qingdao 2 --- 2 4 4
Tangshan 8 2 9 1 1
Japan Chiba 1 --- 2 --- ---
North Kyushu --- 1 --- 5 10
Oita 7 --- --- Unknown ---
Republic of
Korea
Gwangyang 2 1 3 1 1
Pyongtaek Dangjin 5 2 1 3 4
Ulsan 1 --- 4 6 2
India Kandla 1 7 1 5 ---
Paradip 4 1 4 2 ---
Visakhapatnam 6 3 6 1 ---
Source: Ministry of Transport, China, Japan, Republic of Korea and India. Except for India, all the ranks are calculated
with data of 2014, the rank of Indian ports are calculated with data of 2013. Furthermore, the India statistics combine the
Crude Oil and Natural Gas together using “POL and Crude Products”. Thus, the ranks of Indian ports for Crude Oil and
Natural Gas are the same in the table.
Note: “---” means the port is not listed in top 10 rank in its country.
The port of Gwangyang is in Jeolla Province of Republic of Korea. The cargo volume of
Gwangyang port ranks the second in Republic of Korea, after Busan. The total throughput of cargo is
272,009 thousand tons in 2015, including 30,856 thousand tons of iron ore and 84,334 thousand tons of
oil. Gwangyang port is now undergoing expansion works. The facilities are projected to handle 312,068
tons of cargo, according to the third master plan for Korean nationwide trade port development. The
Port of Ulsan is a hub port in Republic of Korea for liquid cargoes such as the crude oil. The Port of
Ulsan consists of the Ulsan Main Port, Onsan Port, and Mipo Port which together have a total of 96
berths with capacity for general cargo vessels of up to 50 thousand tons, for crude oil carriers of up to
350 thousand tons, and for oil tankers to 150 thousand tons. Ulsan refinery, located in Ulsan
Metropolitan City, is the third largest oil refinery in the world with a capacity of 840 thousand bpd.
The Port of Kandla is located on the Gulf of Kutch on the northwestern coast of India. It is the
largest crude oil port of India, with crude oil volume attaining 40.4 million tons in 2014. The port of
Visakhapatnam is located on the east coast of India and is India's second largest port. The port has
completed dredging works to increase the draft to 18.1 meters and depth to 20.1 meters in outer harbor
recently, enabling it to handle Cape size vessels. Visakhapatnam Port handled 25 million tons of iron
ore in 2014, accounting over half of the iron ore importation by the major ports in India.
D. Ships and freight market
The maritime transportation of iron ore and coal is mainly carried by bulk carriers, and crude oil and oil
products by tankers as well as liquefied natural gas (LNG) is carried by LNG carriers. As previously
mentioned, the natural resources with largest volumes shipped from LAC to Asia-Pacific are the iron
ore exported by Brazil and the crude oil exported from Venezuela, Colombia and Brazil. Other trade
flows are in far smaller volumes. Considering the long distance between LAC and Asia-Pacific, largest
ships are used in the trading between these two regions. For this reason, it is important to review VLCC
tanker fleet and Capesize bulker fleet and their freight market.
ECLAC The transport of natural resources…
31
According to Clarkson’s Shipping Review and Outlook (Clarkson Research, 2017), at the
beginning of 2016, the global crude tanker fleet totaled 348.6 million DWT (deadweight), bulker fleet
totaled 776.6 million DWT, and other types totaled 680.3 million DWT. The DWT shares of crude
tankers and bulkers in global fleet were 19.3% and 43% respectively; however, two decades before, at
the start of 1996, their shares were 29.2% and 33.4%, respectively. This means that although the fleets
of crude tanker and bulker were both growing, the former grew much slower than the later. Notice that
during 2010 and 2011, a rapid growth of global bulker fleet occurred because the overoptimistic
atmosphere over the bulk freight market before the 2008 financial crisis let the ship-owners order more
bulkers, which were delivered in 2010 and 2011 as peak years. However, in 2010 and 2011 the bulk
freight market was in its trough, so the extra-delivery of bulkers made the situation worse. This was
reflected in the Baltic Dry Index (BDI). The average annual BDI was 2758 in 2010 and 1549 in 2011,
rapidly descending from its peak at 7071 in 2007, and hardly rebounded to the level before 2007 in
following years. The time charter rate of the Cape size bulkers displayed the same trend.
Unlike bulk freight market, the global crude oil market fluctuates much smoother. The
maximum annual average 1-year time charter rate of VLCC since 2000 is 73,413 US dollars per day,
which is about 3.7 times of its minimum. On the contrary, the maximum annual average 1-year time
charter rate of Capesize since 2000 is 111,529 US dollars per day, which is about 7.1 times of its
minimum. The reason is two-fold. On one hand, importers of iron ore (which has exceeded coal as the
largest dry bulk in 2007) is much more concentrated than the importers of crude oil. Considering that
China alone imported 68.3 per cent of the iron ore in the world in 2014. This made the bulk freight
market vulnerable to the business cycles of few countries. For example, China’s recent policy “Cut
Excessive Capacity” suppressed its iron ore import and deeply impacted the global bulk freight market.
One the other hand, the extent of market concentration is different. Top Ten tanker owners held 22.5
per cent of global tanker fleet in terms of DWT as of September 2016, meanwhile top 10 bulker ship
owners only held 16.1 per cent. A lower concentration made the bulker freight market more intensified
in competition, and in turn led to a more volatile charter rate.
The developments of average size of crude tankers and bulkers are also different. Although
crude tankers are larger than bulkers, generally speaking, the size of former grows more slowly than the
size of later. At the start of 2016, global crude tankers averaged 189148 DWT, as 113.4 per cent at the
start of 1996; whereas global bulkers averaged 72552 DWT, as 154.0 per cent at the start of 1996. This
is because the economies of scale in ship size is dimmer for larger ships, like the crude tankers.
The Panama Canal is a choke point to the route between the Caribbean coast and East Asia and
Southeast Asia, due to the limitation of the size of lock chambers on the canal. The ships with a beam
wider than 32.31m called “Panamax” could not pass the Panama Canal before the Panama Canal
Expansion Program was completed in June 2016 and the ships with a 49m beam can pass through so
the type of “New-Panamax” emerged. Since it was not long since New-Panamax type of ships appeared,
the majority exports of crude oil from Venezuela and iron ore from north Brazil to East Asia and
Southeast Asia have two choices of routes: one is via the Panama Canal with shorter distance by using
Panamax ships, the other is via the Atlantic Ocean and Indian Ocean with longer distance by using larger
ships. From this aspect, the expansion of the Panama Canal will allow more and more larger ships to be
used on the Latin-Asia-Pacific shipping route, especially VLOC.
E. Value added services
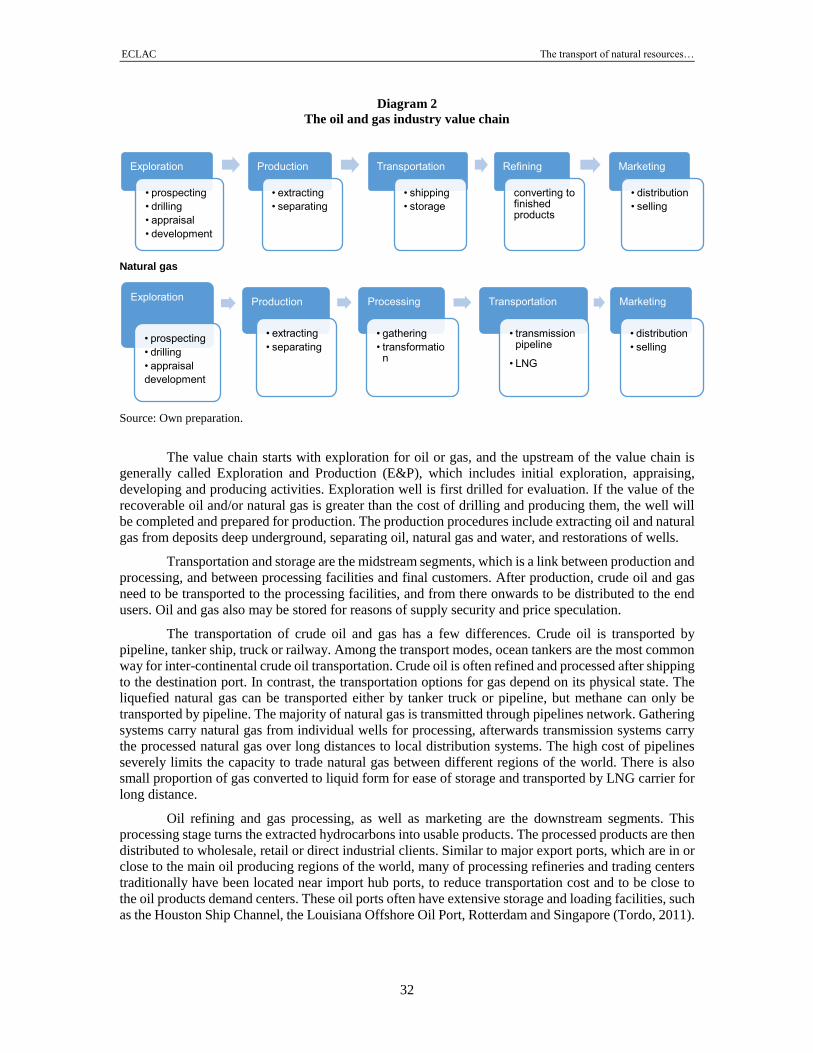
1. Oil and gas industry
The figure below outlines the general process of value creation in the oil and gas industry from
exploration to market. The process can be categorized broadly into the upstream, midstream and
downstream segments.
ECLAC The transport of natural resources…
32
Diagram 2
The oil and gas industry value chain
Natural gas
Source: Own preparation.
The value chain starts with exploration for oil or gas, and the upstream of the value chain is
generally called Exploration and Production (E&P), which includes initial exploration, appraising,
developing and producing activities. Exploration well is first drilled for evaluation. If the value of the
recoverable oil and/or natural gas is greater than the cost of drilling and producing them, the well will
be completed and prepared for production. The production procedures include extracting oil and natural
gas from deposits deep underground, separating oil, natural gas and water, and restorations of wells.
Transportation and storage are the midstream segments, which is a link between production and
processing, and between processing facilities and final customers. After production, crude oil and gas
need to be transported to the processing facilities, and from there onwards to be distributed to the end
users. Oil and gas also may be stored for reasons of supply security and price speculation.
The transportation of crude oil and gas has a few differences. Crude oil is transported by
pipeline, tanker ship, truck or railway. Among the transport modes, ocean tankers are the most common
way for inter-continental crude oil transportation. Crude oil is often refined and processed after shipping
to the destination port. In contrast, the transportation options for gas depend on its physical state. The
liquefied natural gas can be transported either by tanker truck or pipeline, but methane can only be
transported by pipeline. The majority of natural gas is transmitted through pipelines network. Gathering
systems carry natural gas from individual wells for processing, afterwards transmission systems carry
the processed natural gas over long distances to local distribution systems. The high cost of pipelines
severely limits the capacity to trade natural gas between different regions of the world. There is also
small proportion of gas converted to liquid form for ease of storage and transported by LNG carrier for
long distance.
Oil refining and gas processing, as well as marketing are the downstream segments. This
processing stage turns the extracted hydrocarbons into usable products. The processed products are then
distributed to wholesale, retail or direct industrial clients. Similar to major export ports, which are in or
close to the main oil producing regions of the world, many of processing refineries and trading centers
traditionally have been located near import hub ports, to reduce transportation cost and to be close to
the oil products demand centers. These oil ports often have extensive storage and loading facilities, such
as the Houston Ship Channel, the Louisiana Offshore Oil Port, Rotterdam and Singapore (Tordo, 2011).
Exploration
• prospecting
• drilling
• appraisal
• development
Production
• extracting
• separating
Transportation
• shipping
• storage
Refining
converting to finished products
Marketing
• distribution
• selling
Exploration
• prospecting
• drilling
• appraisal
development
Production
• extracting
• separating
Processing
• gathering
• transformation
Transportation
• transmission pipeline
• LNG
Marketing
• distribution
• selling
ECLAC The transport of natural resources…
33
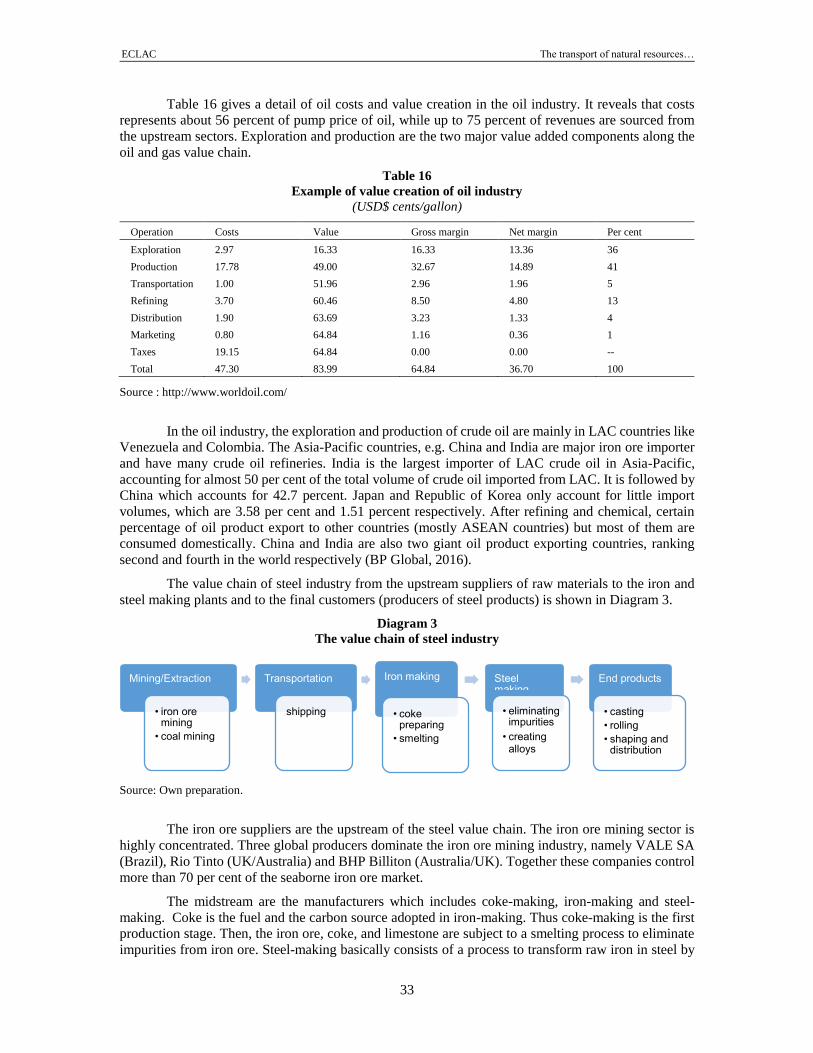
Table 16 gives a detail of oil costs and value creation in the oil industry. It reveals that costs
represents about 56 percent of pump price of oil, while up to 75 percent of revenues are sourced from
the upstream sectors. Exploration and production are the two major value added components along the
oil and gas value chain.
Table 16
Example of value creation of oil industry
(USD$ cents/gallon)
Operation Costs Value Gross margin Net margin Per cent
Exploration 2.97 16.33 16.33 13.36 36
Production 17.78 49.00 32.67 14.89 41
Transportation 1.00 51.96 2.96 1.96 5
Refining 3.70 60.46 8.50 4.80 13
Distribution 1.90 63.69 3.23 1.33 4
Marketing 0.80 64.84 1.16 0.36 1
Taxes 19.15 64.84 0.00 0.00 --
Total 47.30 83.99 64.84 36.70 100
Source : http://www.worldoil.com/
In the oil industry, the exploration and production of crude oil are mainly in LAC countries like
Venezuela and Colombia. The Asia-Pacific countries, e.g. China and India are major iron ore importer
and have many crude oil refineries. India is the largest importer of LAC crude oil in Asia-Pacific,
accounting for almost 50 per cent of the total volume of crude oil imported from LAC. It is followed by
China which accounts for 42.7 percent. Japan and Republic of Korea only account for little import
volumes, which are 3.58 per cent and 1.51 percent respectively. After refining and chemical, certain
percentage of oil product export to other countries (mostly ASEAN countries) but most of them are
consumed domestically. China and India are also two giant oil product exporting countries, ranking
second and fourth in the world respectively (BP Global, 2016).
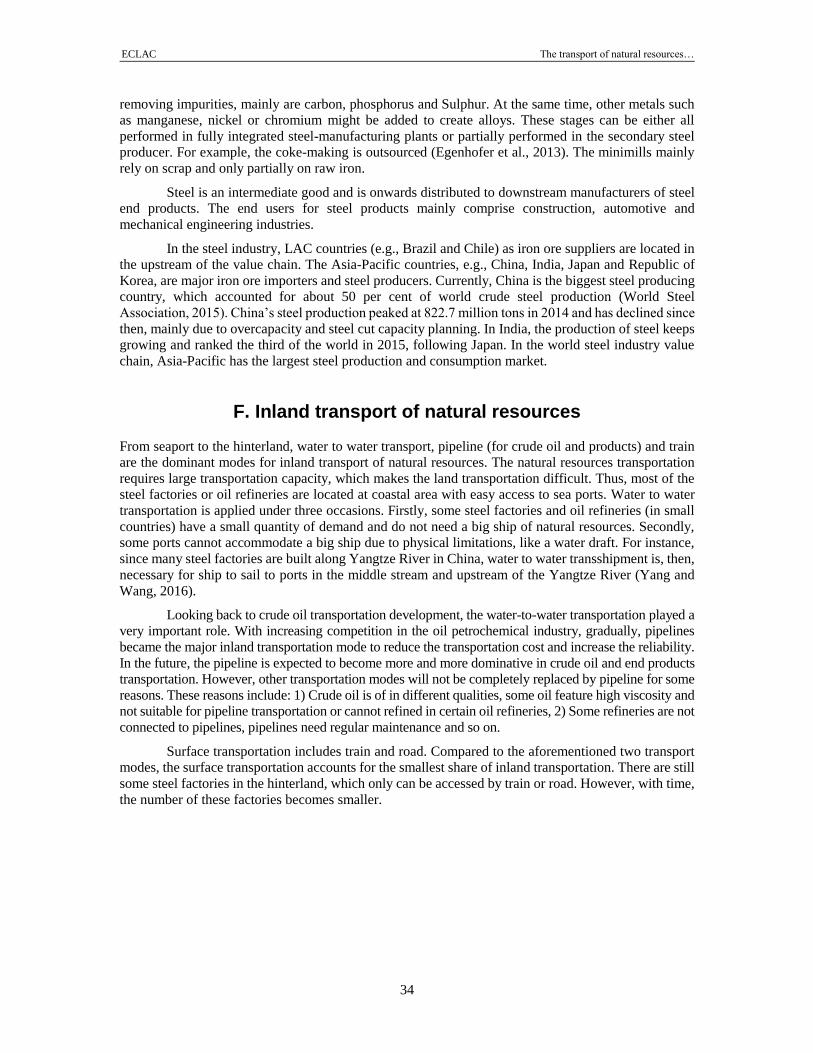
The value chain of steel industry from the upstream suppliers of raw materials to the iron and
steel making plants and to the final customers (producers of steel products) is shown in Diagram 3.
Diagram 3
The value chain of steel industry
Source: Own preparation.
The iron ore suppliers are the upstream of the steel value chain. The iron ore mining sector is
highly concentrated. Three global producers dominate the iron ore mining industry, namely VALE SA
(Brazil), Rio Tinto (UK/Australia) and BHP Billiton (Australia/UK). Together these companies control
more than 70 per cent of the seaborne iron ore market.
The midstream are the manufacturers which includes coke-making, iron-making and steel-
making. Coke is the fuel and the carbon source adopted in iron-making. Thus coke-making is the first
production stage. Then, the iron ore, coke, and limestone are subject to a smelting process to eliminate
impurities from iron ore. Steel-making basically consists of a process to transform raw iron in steel by
Mining/Extraction
• iron ore mining
• coal mining
Transportation
shipping
Iron making
• coke preparing
• smelting
Steel making
• eliminating impurities
• creating alloys
End products
• casting
• rolling
• shaping and distribution
ECLAC The transport of natural resources…
34
removing impurities, mainly are carbon, phosphorus and Sulphur. At the same time, other metals such
as manganese, nickel or chromium might be added to create alloys. These stages can be either all
performed in fully integrated steel-manufacturing plants or partially performed in the secondary steel
producer. For example, the coke-making is outsourced (Egenhofer et al., 2013). The minimills mainly
rely on scrap and only partially on raw iron.
Steel is an intermediate good and is onwards distributed to downstream manufacturers of steel
end products. The end users for steel products mainly comprise construction, automotive and
mechanical engineering industries.
In the steel industry, LAC countries (e.g., Brazil and Chile) as iron ore suppliers are located in
the upstream of the value chain. The Asia-Pacific countries, e.g., China, India, Japan and Republic of
Korea, are major iron ore importers and steel producers. Currently, China is the biggest steel producing
country, which accounted for about 50 per cent of world crude steel production (World Steel
Association, 2015). China’s steel production peaked at 822.7 million tons in 2014 and has declined since
then, mainly due to overcapacity and steel cut capacity planning. In India, the production of steel keeps
growing and ranked the third of the world in 2015, following Japan. In the world steel industry value
chain, Asia-Pacific has the largest steel production and consumption market.
F. Inland transport of natural resources
From seaport to the hinterland, water to water transport, pipeline (for crude oil and products) and train
are the dominant modes for inland transport of natural resources. The natural resources transportation
requires large transportation capacity, which makes the land transportation difficult. Thus, most of the
steel factories or oil refineries are located at coastal area with easy access to sea ports. Water to water
transportation is applied under three occasions. Firstly, some steel factories and oil refineries (in small
countries) have a small quantity of demand and do not need a big ship of natural resources. Secondly,
some ports cannot accommodate a big ship due to physical limitations, like a water draft. For instance,
since many steel factories are built along Yangtze River in China, water to water transshipment is, then,
necessary for ship to sail to ports in the middle stream and upstream of the Yangtze River (Yang and
Wang, 2016).
Looking back to crude oil transportation development, the water-to-water transportation played a
very important role. With increasing competition in the oil petrochemical industry, gradually, pipelines
became the major inland transportation mode to reduce the transportation cost and increase the reliability.
In the future, the pipeline is expected to become more and more dominative in crude oil and end products
transportation. However, other transportation modes will not be completely replaced by pipeline for some
reasons. These reasons include: 1) Crude oil is of in different qualities, some oil feature high viscosity and
not suitable for pipeline transportation or cannot refined in certain oil refineries, 2) Some refineries are not
connected to pipelines, pipelines need regular maintenance and so on.
Surface transportation includes train and road. Compared to the aforementioned two transport
modes, the surface transportation accounts for the smallest share of inland transportation. There are still
some steel factories in the hinterland, which only can be accessed by train or road. However, with time,
the number of these factories becomes smaller.
ECLAC The transport of natural resources…
35
IV. Case Studies of natural resources logistics chains in Asia and the Pacific
Crude oil and iron ore are the two most important natural resources exporting to Asia-Pacific in terms
of trade volume. In Asia-Pacific, China and India are the two leading importers of LAC crude oil,
together accounting for more than 90% of the total crude oil exported to Asia-Pacific from LAC. China,
Japan and the Republic of Korea are the three top LAC iron ore importing countries, they together also
account for more than 90% of the total LAC exports of iron ore to Asia-Pacific. Data from four ports
including Kandla in India, Ningbo-Zhoushan in China, Oita in Japan and Gwangyang in the Republic
of Korea are summarized for a deeper analysis. Kandla port is the first crude oil port in India, three giant
oil corporations like India Oil Corporation (IOC), Essar Global Fund Limited (Essar Oil), and Reliance
Industries Ltd (Reliance) have their oil refinery close to this port. Ningbo-Zhoushan port is the first port
for crude oil import and the third port for iron ore import in China. Oita is one of the biggest iron ore
ports for iron ore in Japan, the world third largest and Japan’s largest steel producer Nippon Steel &
Sumitomo Metal (NSSC) operate two terminals at Oita port. Gwangyang port is the first iron ore import
port in the Republic of Korea and the steel plant of Korean giant steel producer POSCO is located in
Gwangyang. Crude oil logistics chain operations through Kandla and Ningbo-Zhoushan, iron ore
logistic chain through Oita, Gwangyang and Ningbo-Zhoushan are explored further.
A. The case of China
China is the biggest importer of natural resources from LAC. Its volume of crude oil imported from
LAC ranked second in Asia-Pacific region in 2016, following India. China imported most of its LAC
crude oil from Venezuela. In addition, China’s import volume of LAC iron ore ranked first in Asia-
Pacific region, accounting for 77.1 percent of total LAC iron ore import to Asia-Pacific. Brazil is the
largest trade partner for iron ore in Latin America (UN Comtrade, 2016).
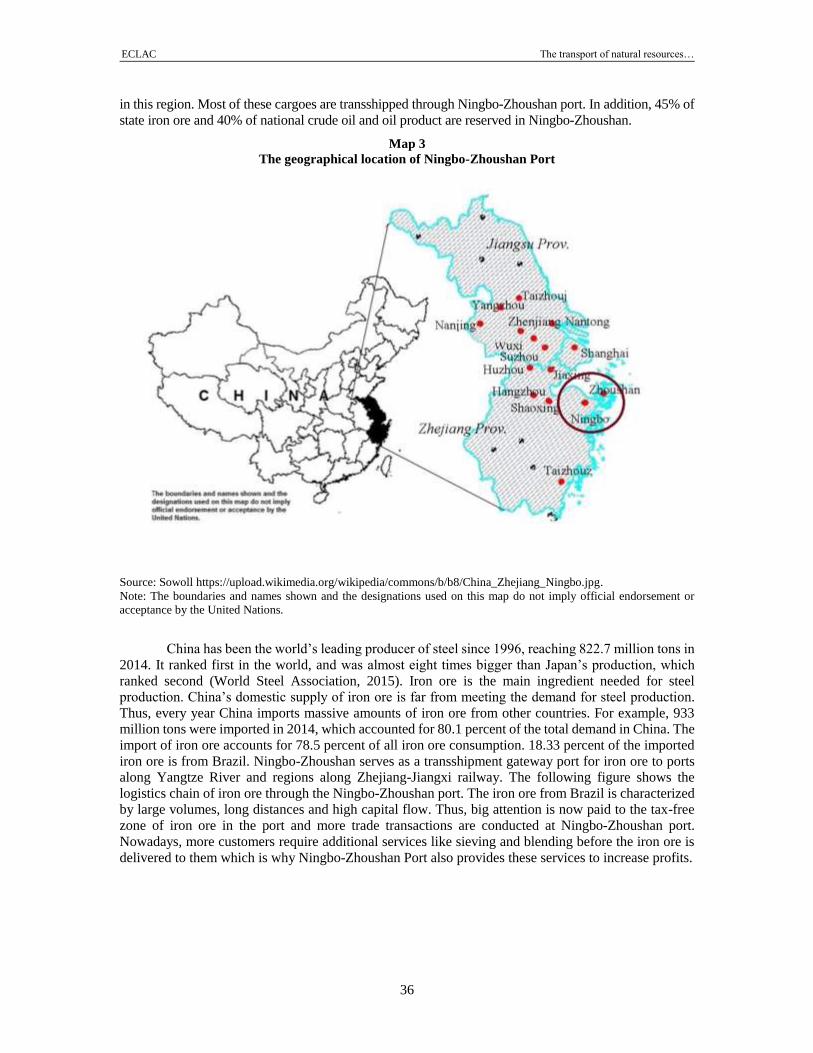
Ningbo-Zhoushan is composed of two ports which are Ningbo and Zhoushan Ports. These two
ports merged and the Ningbo-Zhoushan Port was formally founded in 2016. The Port of Ningbo-Zhoushan
is the busiest port in the world in terms of cargo tonnage. It handled 888.96 million tons cargoes in 2015,
ranking first among all the cargo ports around the world. As shown in the figure below, the port is located
at the crossroads of the north-south inland and coastal shipping route, including canals to the important
inland waterway to interior China, the Yangtze River, to the north. Yangtze River Delta is the most
developed region in China, more than 45% of iron ore and 90% of crude oil and oil produce are consumed
ECLAC The transport of natural resources…
36
in this region. Most of these cargoes are transshipped through Ningbo-Zhoushan port. In addition, 45% of
state iron ore and 40% of national crude oil and oil product are reserved in Ningbo-Zhoushan.
Map 3
The geographical location of Ningbo-Zhoushan Port
Source: Sowoll https://upload.wikimedia.org/wikipedia/commons/b/b8/China_Zhejiang_Ningbo.jpg.
Note: The boundaries and names shown and the designations used on this map do not imply official endorsement or
acceptance by the United Nations.
China has been the world’s leading producer of steel since 1996, reaching 822.7 million tons in
2014. It ranked first in the world, and was almost eight times bigger than Japan’s production, which
ranked second (World Steel Association, 2015). Iron ore is the main ingredient needed for steel
production. China’s domestic supply of iron ore is far from meeting the demand for steel production.
Thus, every year China imports massive amounts of iron ore from other countries. For example, 933
million tons were imported in 2014, which accounted for 80.1 percent of the total demand in China. The
import of iron ore accounts for 78.5 percent of all iron ore consumption. 18.33 percent of the imported
iron ore is from Brazil. Ningbo-Zhoushan serves as a transshipment gateway port for iron ore to ports
along Yangtze River and regions along Zhejiang-Jiangxi railway. The following figure shows the
logistics chain of iron ore through the Ningbo-Zhoushan port. The iron ore from Brazil is characterized
by large volumes, long distances and high capital flow. Thus, big attention is now paid to the tax-free
zone of iron ore in the port and more trade transactions are conducted at Ningbo-Zhoushan port.
Nowadays, more customers require additional services like sieving and blending before the iron ore is
delivered to them which is why Ningbo-Zhoushan Port also provides these services to increase profits.
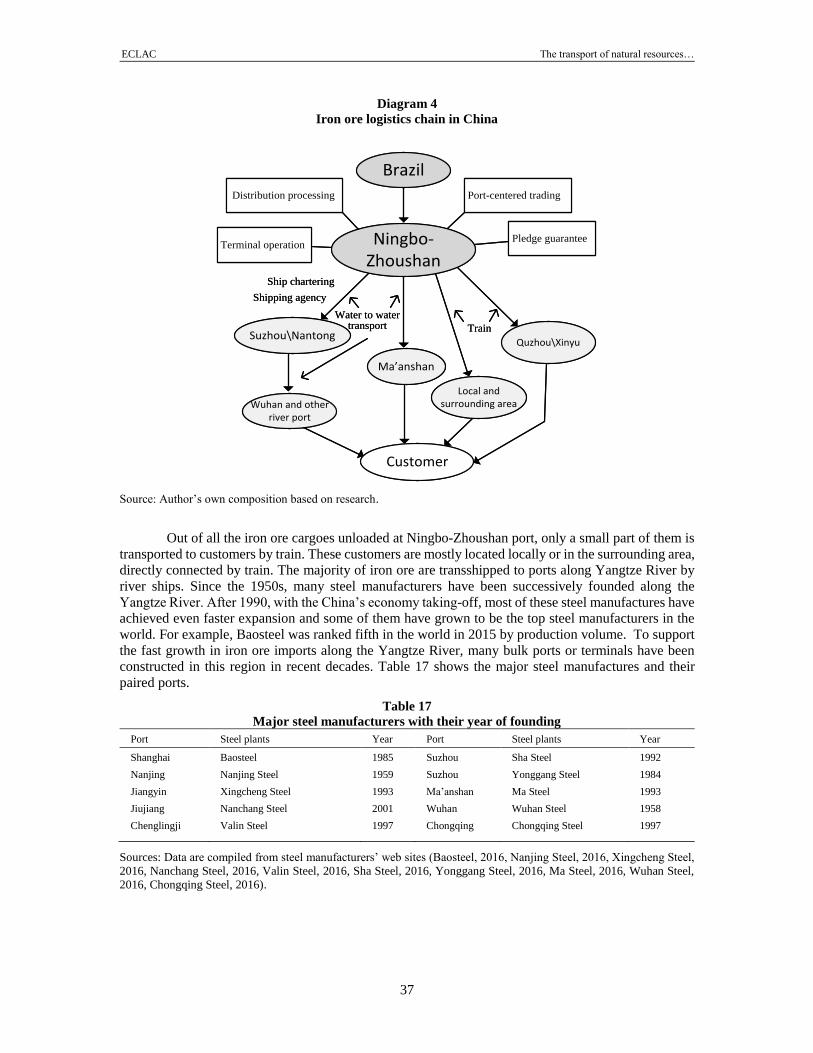
ECLAC The transport of natural resources…
37
Diagram 4
Iron ore logistics chain in China
Brazil
Ningbo-Zhoushan
Suzhou\Nantong
Ship chartering
Shipping agency
Ma anshan
Water to water transport
Wuhan and other river port
Local and surrounding area
Quzhou\Xinyu
Train
Customer
Port-centered trading
Pledge guarantee
Distribution processing
Terminal operation
Brazil
Ningbo-Zhoushan
Suzhou\Nantong
Ship chartering
Shipping agency
Ma anshan
Water to water transport
Wuhan and other river port
Local and surrounding area
Quzhou\Xinyu
Train
Customer
Port-centered trading
Pledge guarantee
Distribution processing
Terminal operation
Source: Author’s own composition based on research.
Out of all the iron ore cargoes unloaded at Ningbo-Zhoushan port, only a small part of them is
transported to customers by train. These customers are mostly located locally or in the surrounding area,
directly connected by train. The majority of iron ore are transshipped to ports along Yangtze River by
river ships. Since the 1950s, many steel manufacturers have been successively founded along the
Yangtze River. After 1990, with the China’s economy taking-off, most of these steel manufactures have
achieved even faster expansion and some of them have grown to be the top steel manufacturers in the
world. For example, Baosteel was ranked fifth in the world in 2015 by production volume. To support
the fast growth in iron ore imports along the Yangtze River, many bulk ports or terminals have been
constructed in this region in recent decades. Table 17 shows the major steel manufactures and their
paired ports.
Table 17
Major steel manufacturers with their year of founding
Port Steel plants Year Port Steel plants Year
Shanghai Baosteel 1985 Suzhou Sha Steel 1992
Nanjing Nanjing Steel 1959 Suzhou Yonggang Steel 1984
Jiangyin Xingcheng Steel 1993 Ma’anshan Ma Steel 1993
Jiujiang Nanchang Steel 2001 Wuhan Wuhan Steel 1958
Chenglingji Valin Steel 1997 Chongqing Chongqing Steel 1997
Sources: Data are compiled from steel manufacturers’ web sites (Baosteel, 2016, Nanjing Steel, 2016, Xingcheng Steel,
2016, Nanchang Steel, 2016, Valin Steel, 2016, Sha Steel, 2016, Yonggang Steel, 2016, Ma Steel, 2016, Wuhan Steel,
2016, Chongqing Steel, 2016).
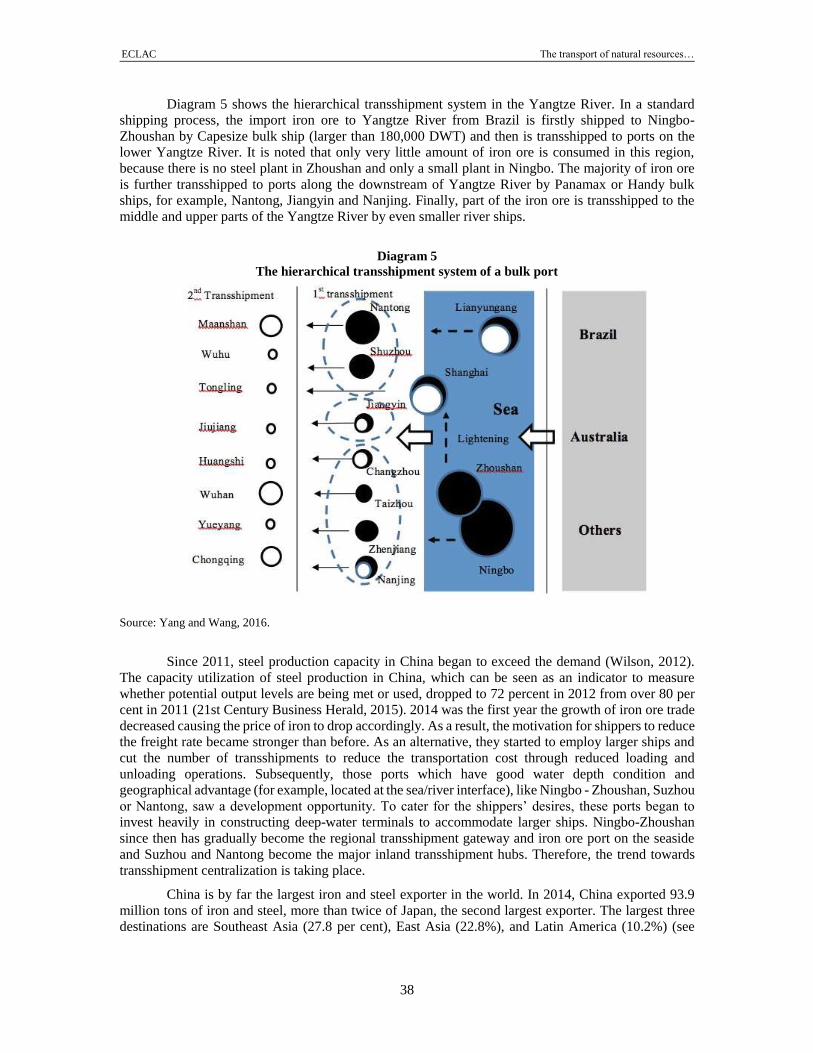
ECLAC The transport of natural resources…
38
Diagram 5 shows the hierarchical transshipment system in the Yangtze River. In a standard
shipping process, the import iron ore to Yangtze River from Brazil is firstly shipped to Ningbo-
Zhoushan by Capesize bulk ship (larger than 180,000 DWT) and then is transshipped to ports on the
lower Yangtze River. It is noted that only very little amount of iron ore is consumed in this region,
because there is no steel plant in Zhoushan and only a small plant in Ningbo. The majority of iron ore
is further transshipped to ports along the downstream of Yangtze River by Panamax or Handy bulk
ships, for example, Nantong, Jiangyin and Nanjing. Finally, part of the iron ore is transshipped to the
middle and upper parts of the Yangtze River by even smaller river ships.
Diagram 5
The hierarchical transshipment system of a bulk port
Source: Yang and Wang, 2016.
Since 2011, steel production capacity in China began to exceed the demand (Wilson, 2012).
The capacity utilization of steel production in China, which can be seen as an indicator to measure
whether potential output levels are being met or used, dropped to 72 percent in 2012 from over 80 per
cent in 2011 (21st Century Business Herald, 2015). 2014 was the first year the growth of iron ore trade
decreased causing the price of iron to drop accordingly. As a result, the motivation for shippers to reduce
the freight rate became stronger than before. As an alternative, they started to employ larger ships and
cut the number of transshipments to reduce the transportation cost through reduced loading and
unloading operations. Subsequently, those ports which have good water depth condition and
geographical advantage (for example, located at the sea/river interface), like Ningbo - Zhoushan, Suzhou
or Nantong, saw a development opportunity. To cater for the shippers’ desires, these ports began to
invest heavily in constructing deep-water terminals to accommodate larger ships. Ningbo-Zhoushan
since then has gradually become the regional transshipment gateway and iron ore port on the seaside
and Suzhou and Nantong become the major inland transshipment hubs. Therefore, the trend towards
transshipment centralization is taking place.
China is by far the largest iron and steel exporter in the world. In 2014, China exported 93.9
million tons of iron and steel, more than twice of Japan, the second largest exporter. The largest three destinations are Southeast Asia (27.8 per cent), East Asia (22.8%), and Latin America (10.2%) (see
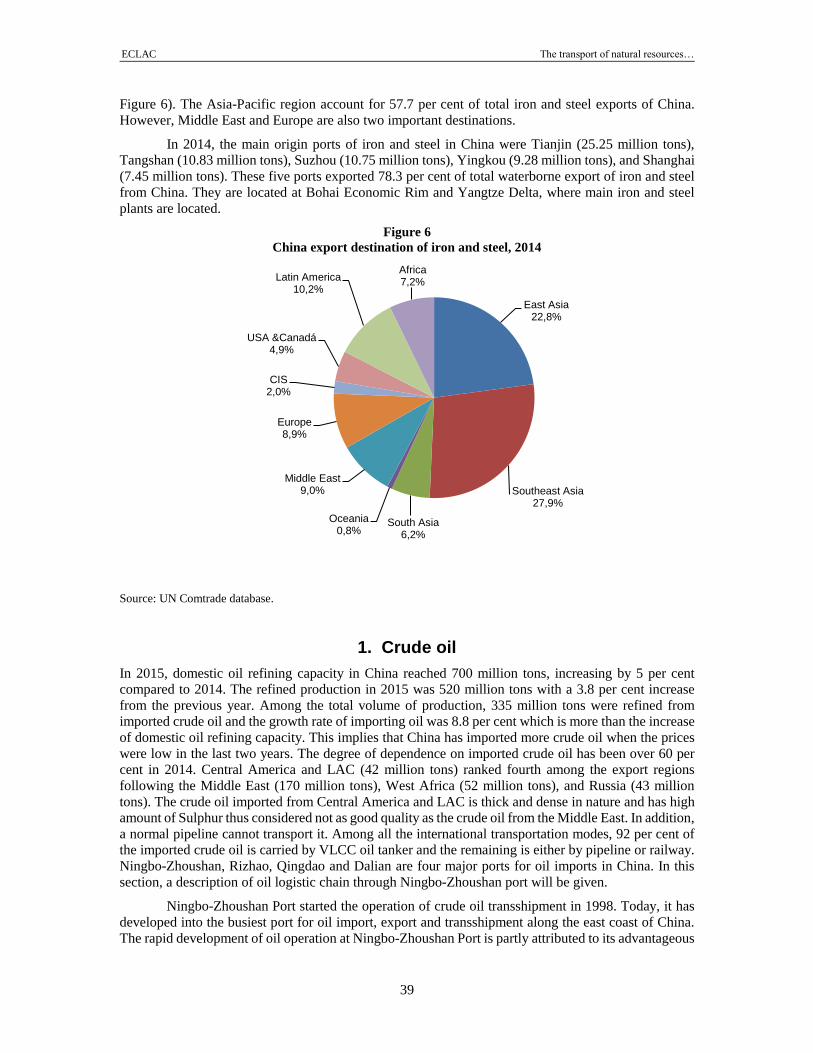
ECLAC The transport of natural resources…
39
Figure 6). The Asia-Pacific region account for 57.7 per cent of total iron and steel exports of China.
However, Middle East and Europe are also two important destinations.
In 2014, the main origin ports of iron and steel in China were Tianjin (25.25 million tons),
Tangshan (10.83 million tons), Suzhou (10.75 million tons), Yingkou (9.28 million tons), and Shanghai
(7.45 million tons). These five ports exported 78.3 per cent of total waterborne export of iron and steel
from China. They are located at Bohai Economic Rim and Yangtze Delta, where main iron and steel
plants are located.
Figure 6
China export destination of iron and steel, 2014
Source: UN Comtrade database.
1. Crude oil
In 2015, domestic oil refining capacity in China reached 700 million tons, increasing by 5 per cent
compared to 2014. The refined production in 2015 was 520 million tons with a 3.8 per cent increase
from the previous year. Among the total volume of production, 335 million tons were refined from
imported crude oil and the growth rate of importing oil was 8.8 per cent which is more than the increase
of domestic oil refining capacity. This implies that China has imported more crude oil when the prices
were low in the last two years. The degree of dependence on imported crude oil has been over 60 per
cent in 2014. Central America and LAC (42 million tons) ranked fourth among the export regions
following the Middle East (170 million tons), West Africa (52 million tons), and Russia (43 million
tons). The crude oil imported from Central America and LAC is thick and dense in nature and has high
amount of Sulphur thus considered not as good quality as the crude oil from the Middle East. In addition,
a normal pipeline cannot transport it. Among all the international transportation modes, 92 per cent of
the imported crude oil is carried by VLCC oil tanker and the remaining is either by pipeline or railway.
Ningbo-Zhoushan, Rizhao, Qingdao and Dalian are four major ports for oil imports in China. In this
section, a description of oil logistic chain through Ningbo-Zhoushan port will be given.
Ningbo-Zhoushan Port started the operation of crude oil transshipment in 1998. Today, it has
developed into the busiest port for oil import, export and transshipment along the east coast of China.
The rapid development of oil operation at Ningbo-Zhoushan Port is partly attributed to its advantageous
East Asia22,8%
Southeast Asia27,9%
South Asia6,2%
Oceania0,8%
Middle East9,0%
Europe8,9%
CIS2,0%
USA &Canadá4,9%
Latin America10,2%
Africa7,2%
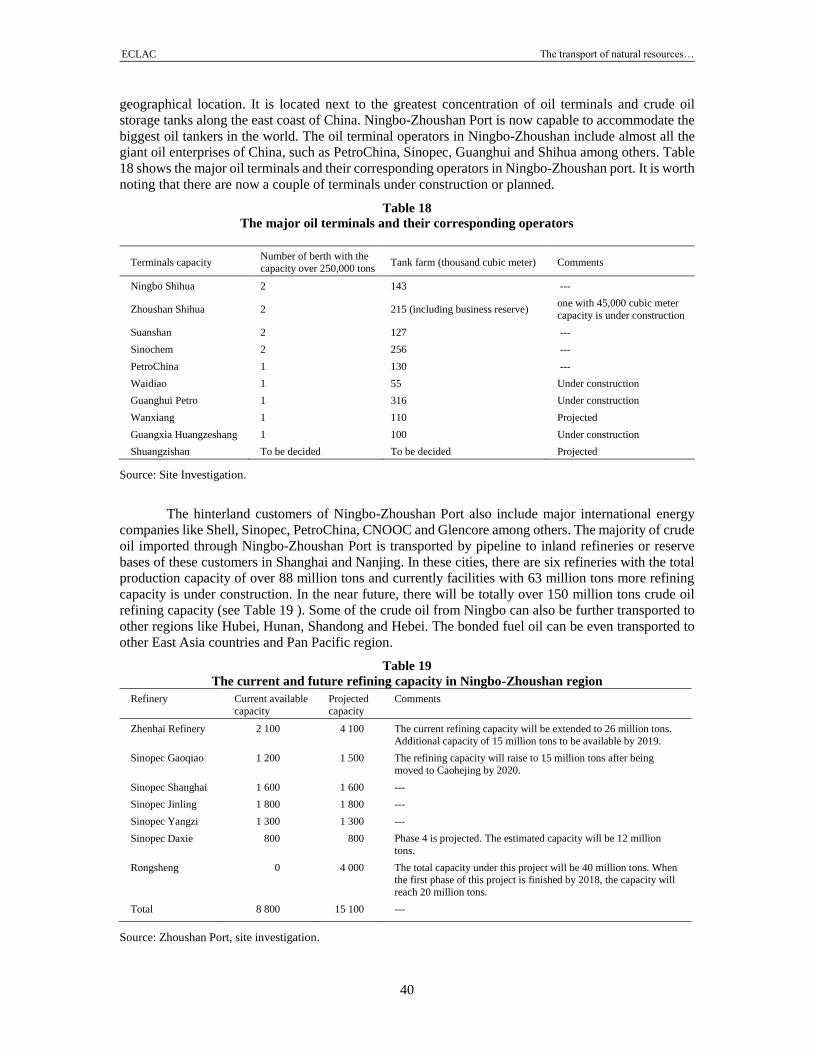
ECLAC The transport of natural resources…
40
geographical location. It is located next to the greatest concentration of oil terminals and crude oil
storage tanks along the east coast of China. Ningbo-Zhoushan Port is now capable to accommodate the
biggest oil tankers in the world. The oil terminal operators in Ningbo-Zhoushan include almost all the
giant oil enterprises of China, such as PetroChina, Sinopec, Guanghui and Shihua among others. Table
18 shows the major oil terminals and their corresponding operators in Ningbo-Zhoushan port. It is worth
noting that there are now a couple of terminals under construction or planned.
Table 18
The major oil terminals and their corresponding operators
Terminals capacity Number of berth with the
capacity over 250,000 tons Tank farm (thousand cubic meter) Comments
Ningbo Shihua 2 143 ---
Zhoushan Shihua 2 215 (including business reserve) one with 45,000 cubic meter
capacity is under construction
Suanshan 2 127 ---
Sinochem 2 256 ---
PetroChina 1 130 ---
Waidiao 1 55 Under construction
Guanghui Petro 1 316 Under construction
Wanxiang 1 110 Projected
Guangxia Huangzeshang 1 100 Under construction
Shuangzishan To be decided To be decided Projected
Source: Site Investigation.
The hinterland customers of Ningbo-Zhoushan Port also include major international energy
companies like Shell, Sinopec, PetroChina, CNOOC and Glencore among others. The majority of crude
oil imported through Ningbo-Zhoushan Port is transported by pipeline to inland refineries or reserve
bases of these customers in Shanghai and Nanjing. In these cities, there are six refineries with the total
production capacity of over 88 million tons and currently facilities with 63 million tons more refining
capacity is under construction. In the near future, there will be totally over 150 million tons crude oil
refining capacity (see Table 19 ). Some of the crude oil from Ningbo can also be further transported to
other regions like Hubei, Hunan, Shandong and Hebei. The bonded fuel oil can be even transported to
other East Asia countries and Pan Pacific region.
Table 19
The current and future refining capacity in Ningbo-Zhoushan region
Refinery Current available
capacity
Projected
capacity
Comments
Zhenhai Refinery 2 100 4 100 The current refining capacity will be extended to 26 million tons.
Additional capacity of 15 million tons to be available by 2019.
Sinopec Gaoqiao 1 200 1 500 The refining capacity will raise to 15 million tons after being
moved to Caohejing by 2020.
Sinopec Shanghai 1 600 1 600 ---
Sinopec Jinling 1 800 1 800 ---
Sinopec Yangzi 1 300 1 300 ---
Sinopec Daxie 800 800 Phase 4 is projected. The estimated capacity will be 12 million
tons.
Rongsheng 0 4 000 The total capacity under this project will be 40 million tons. When the first phase of this project is finished by 2018, the capacity will
reach 20 million tons.
Total 8 800 15 100 ---
Source: Zhoushan Port, site investigation.
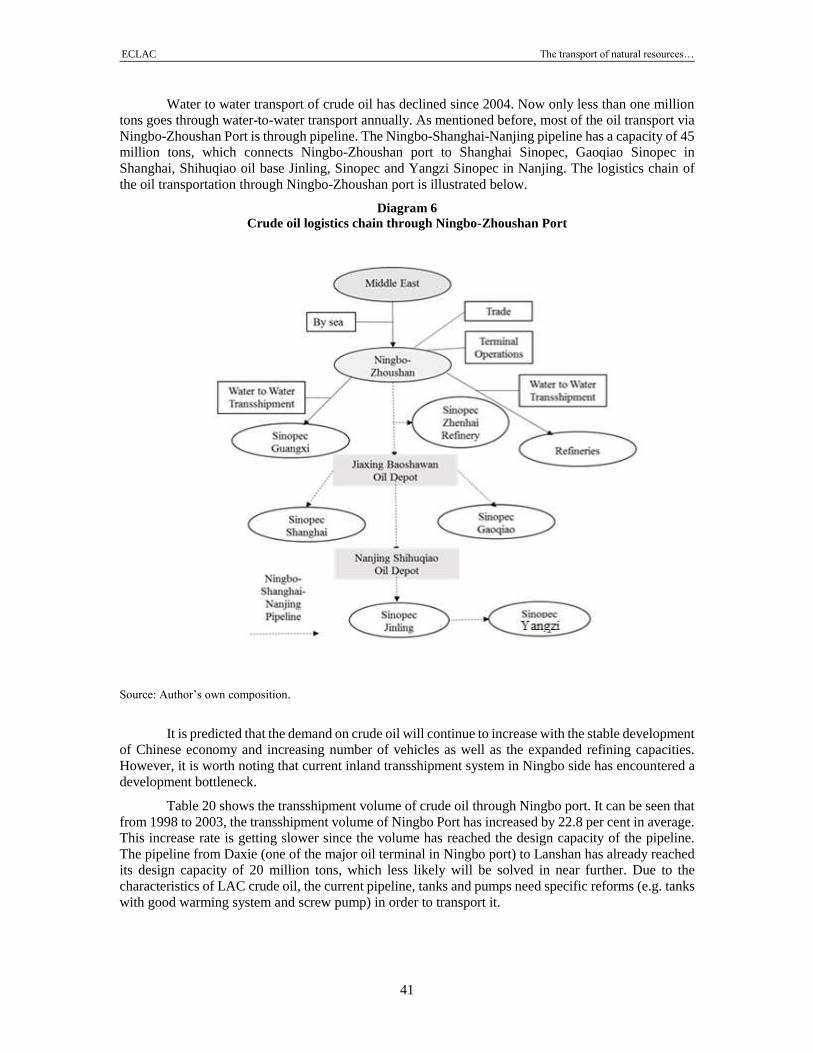
ECLAC The transport of natural resources…
41
Water to water transport of crude oil has declined since 2004. Now only less than one million
tons goes through water-to-water transport annually. As mentioned before, most of the oil transport via
Ningbo-Zhoushan Port is through pipeline. The Ningbo-Shanghai-Nanjing pipeline has a capacity of 45
million tons, which connects Ningbo-Zhoushan port to Shanghai Sinopec, Gaoqiao Sinopec in
Shanghai, Shihuqiao oil base Jinling, Sinopec and Yangzi Sinopec in Nanjing. The logistics chain of
the oil transportation through Ningbo-Zhoushan port is illustrated below.
Diagram 6
Crude oil logistics chain through Ningbo-Zhoushan Port
Source: Author’s own composition.
It is predicted that the demand on crude oil will continue to increase with the stable development
of Chinese economy and increasing number of vehicles as well as the expanded refining capacities.
However, it is worth noting that current inland transshipment system in Ningbo side has encountered a
development bottleneck.
Table 20 shows the transshipment volume of crude oil through Ningbo port. It can be seen that
from 1998 to 2003, the transshipment volume of Ningbo Port has increased by 22.8 per cent in average.
This increase rate is getting slower since the volume has reached the design capacity of the pipeline.
The pipeline from Daxie (one of the major oil terminal in Ningbo port) to Lanshan has already reached
its design capacity of 20 million tons, which less likely will be solved in near further. Due to the
characteristics of LAC crude oil, the current pipeline, tanks and pumps need specific reforms (e.g. tanks
with good warming system and screw pump) in order to transport it.
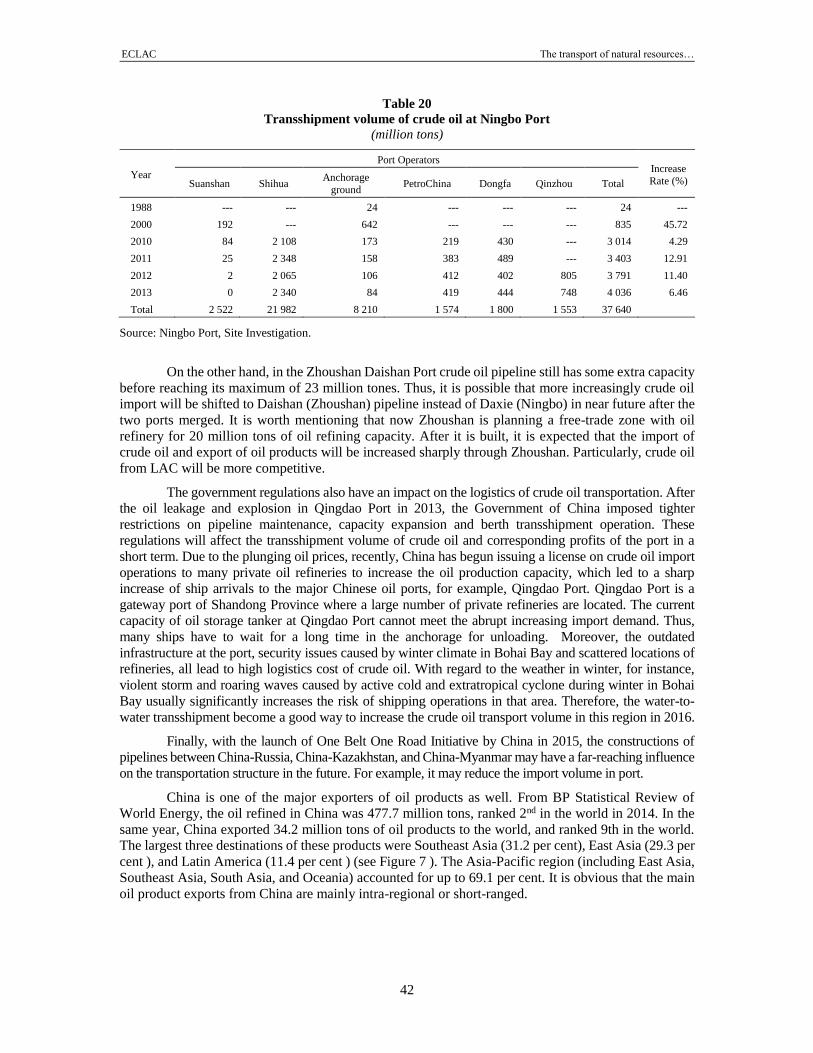
ECLAC The transport of natural resources…
42
Table 20
Transshipment volume of crude oil at Ningbo Port
(million tons)
Year
Port Operators Increase
Rate (%) Suanshan Shihua Anchorage
ground PetroChina Dongfa Qinzhou Total
1988 --- --- 24 --- --- --- 24 ---
2000 192 --- 642 --- --- --- 835 45.72
2010 84 2 108 173 219 430 --- 3 014 4.29
2011 25 2 348 158 383 489 --- 3 403 12.91
2012 2 2 065 106 412 402 805 3 791 11.40
2013 0 2 340 84 419 444 748 4 036 6.46
Total 2 522 21 982 8 210 1 574 1 800 1 553 37 640
Source: Ningbo Port, Site Investigation.
On the other hand, in the Zhoushan Daishan Port crude oil pipeline still has some extra capacity
before reaching its maximum of 23 million tones. Thus, it is possible that more increasingly crude oil
import will be shifted to Daishan (Zhoushan) pipeline instead of Daxie (Ningbo) in near future after the
two ports merged. It is worth mentioning that now Zhoushan is planning a free-trade zone with oil
refinery for 20 million tons of oil refining capacity. After it is built, it is expected that the import of
crude oil and export of oil products will be increased sharply through Zhoushan. Particularly, crude oil
from LAC will be more competitive.
The government regulations also have an impact on the logistics of crude oil transportation. After
the oil leakage and explosion in Qingdao Port in 2013, the Government of China imposed tighter
restrictions on pipeline maintenance, capacity expansion and berth transshipment operation. These
regulations will affect the transshipment volume of crude oil and corresponding profits of the port in a
short term. Due to the plunging oil prices, recently, China has begun issuing a license on crude oil import
operations to many private oil refineries to increase the oil production capacity, which led to a sharp
increase of ship arrivals to the major Chinese oil ports, for example, Qingdao Port. Qingdao Port is a
gateway port of Shandong Province where a large number of private refineries are located. The current
capacity of oil storage tanker at Qingdao Port cannot meet the abrupt increasing import demand. Thus,
many ships have to wait for a long time in the anchorage for unloading. Moreover, the outdated
infrastructure at the port, security issues caused by winter climate in Bohai Bay and scattered locations of
refineries, all lead to high logistics cost of crude oil. With regard to the weather in winter, for instance,
violent storm and roaring waves caused by active cold and extratropical cyclone during winter in Bohai
Bay usually significantly increases the risk of shipping operations in that area. Therefore, the water-to-
water transshipment become a good way to increase the crude oil transport volume in this region in 2016.
Finally, with the launch of One Belt One Road Initiative by China in 2015, the constructions of
pipelines between China-Russia, China-Kazakhstan, and China-Myanmar may have a far-reaching influence
on the transportation structure in the future. For example, it may reduce the import volume in port.
China is one of the major exporters of oil products as well. From BP Statistical Review of
World Energy, the oil refined in China was 477.7 million tons, ranked 2nd in the world in 2014. In the
same year, China exported 34.2 million tons of oil products to the world, and ranked 9th in the world.
The largest three destinations of these products were Southeast Asia (31.2 per cent), East Asia (29.3 per
cent ), and Latin America (11.4 per cent ) (see Figure 7 ). The Asia-Pacific region (including East Asia,
Southeast Asia, South Asia, and Oceania) accounted for up to 69.1 per cent. It is obvious that the main
oil product exports from China are mainly intra-regional or short-ranged.
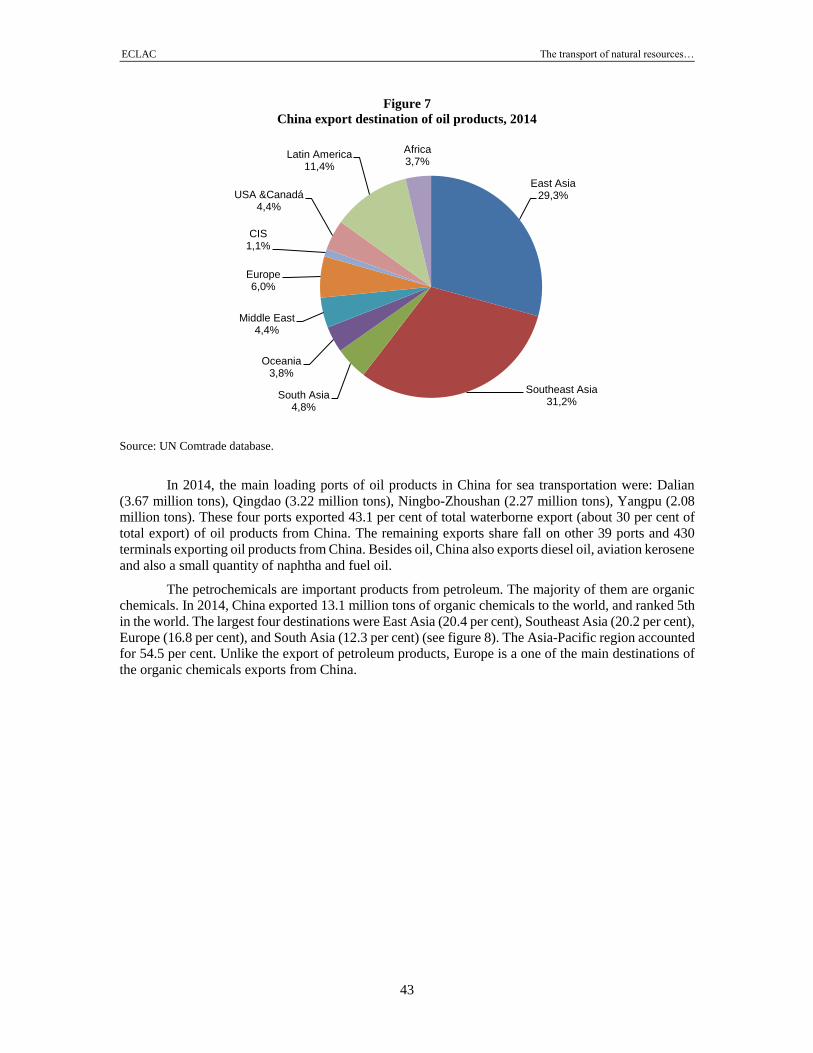
ECLAC The transport of natural resources…
43
Figure 7
China export destination of oil products, 2014
Source: UN Comtrade database.
In 2014, the main loading ports of oil products in China for sea transportation were: Dalian
(3.67 million tons), Qingdao (3.22 million tons), Ningbo-Zhoushan (2.27 million tons), Yangpu (2.08
million tons). These four ports exported 43.1 per cent of total waterborne export (about 30 per cent of
total export) of oil products from China. The remaining exports share fall on other 39 ports and 430
terminals exporting oil products from China. Besides oil, China also exports diesel oil, aviation kerosene
and also a small quantity of naphtha and fuel oil.
The petrochemicals are important products from petroleum. The majority of them are organic
chemicals. In 2014, China exported 13.1 million tons of organic chemicals to the world, and ranked 5th
in the world. The largest four destinations were East Asia (20.4 per cent), Southeast Asia (20.2 per cent),
Europe (16.8 per cent), and South Asia (12.3 per cent) (see figure 8). The Asia-Pacific region accounted
for 54.5 per cent. Unlike the export of petroleum products, Europe is a one of the main destinations of
the organic chemicals exports from China.
East Asia29,3%
Southeast Asia31,2%
South Asia4,8%
Oceania3,8%
Middle East4,4%
Europe6,0%
CIS1,1%
USA &Canadá4,4%
Latin America11,4%
Africa3,7%
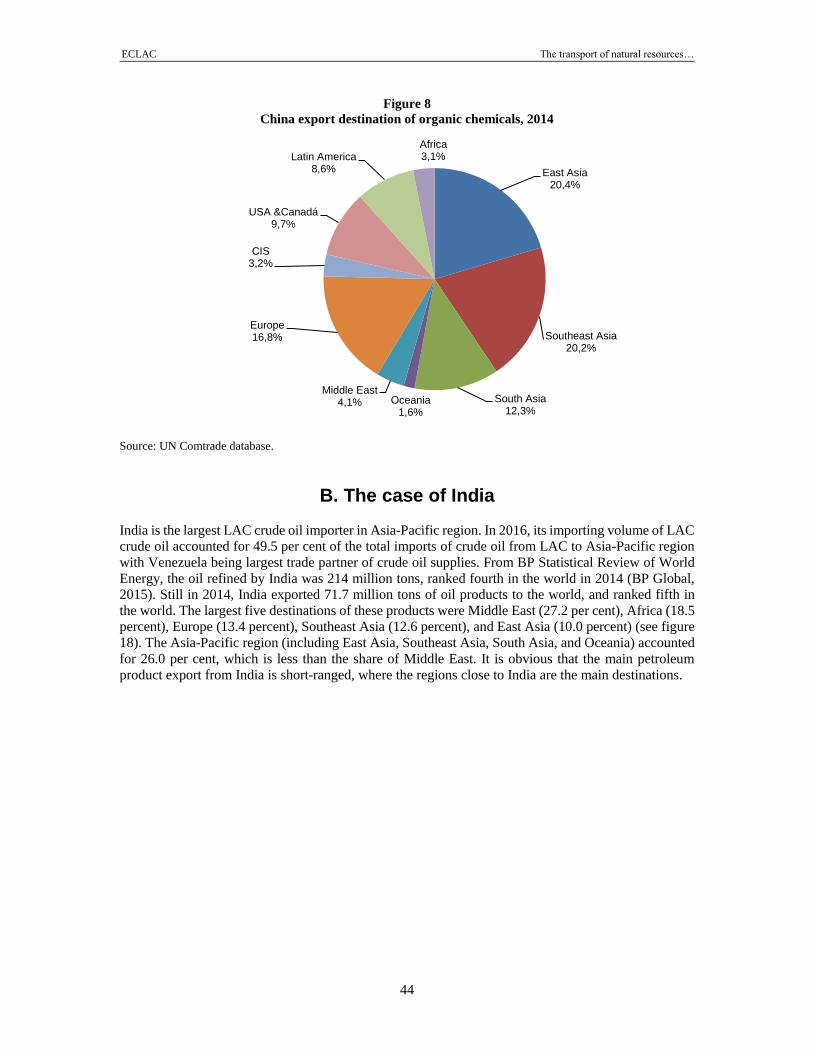
ECLAC The transport of natural resources…
44
Figure 8
China export destination of organic chemicals, 2014
Source: UN Comtrade database.
B. The case of India
India is the largest LAC crude oil importer in Asia-Pacific region. In 2016, its importing volume of LAC
crude oil accounted for 49.5 per cent of the total imports of crude oil from LAC to Asia-Pacific region
with Venezuela being largest trade partner of crude oil supplies. From BP Statistical Review of World
Energy, the oil refined by India was 214 million tons, ranked fourth in the world in 2014 (BP Global,
2015). Still in 2014, India exported 71.7 million tons of oil products to the world, and ranked fifth in
the world. The largest five destinations of these products were Middle East (27.2 per cent), Africa (18.5
percent), Europe (13.4 percent), Southeast Asia (12.6 percent), and East Asia (10.0 percent) (see figure
18). The Asia-Pacific region (including East Asia, Southeast Asia, South Asia, and Oceania) accounted
for 26.0 per cent, which is less than the share of Middle East. It is obvious that the main petroleum
product export from India is short-ranged, where the regions close to India are the main destinations.
East Asia20,4%
Southeast Asia20,2%
South Asia12,3%
Oceania1,6%
Middle East4,1%
Europe16,8%
CIS3,2%
USA &Canadá9,7%
Latin America8,6%
Africa3,1%
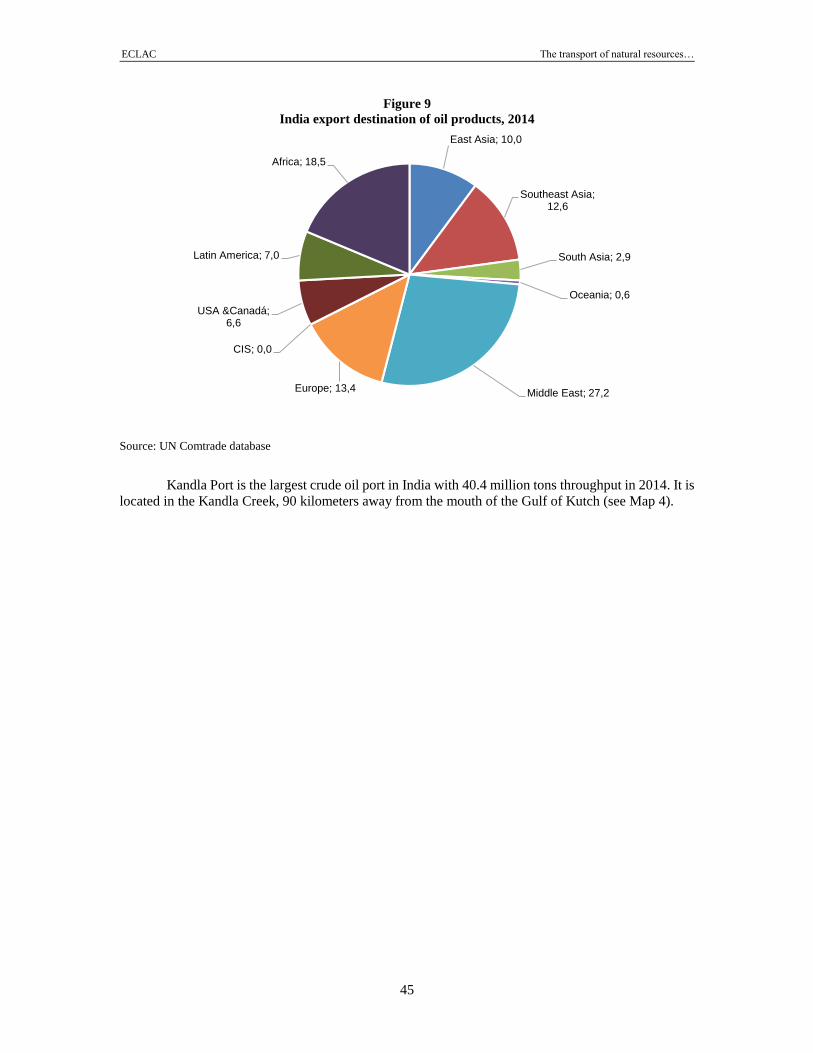
ECLAC The transport of natural resources…
45
Figure 9
India export destination of oil products, 2014
Source: UN Comtrade database
Kandla Port is the largest crude oil port in India with 40.4 million tons throughput in 2014. It is
located in the Kandla Creek, 90 kilometers away from the mouth of the Gulf of Kutch (see Map 4).
East Asia; 10,0
Southeast Asia; 12,6
South Asia; 2,9
Oceania; 0,6
Middle East; 27,2Europe; 13,4
CIS; 0,0
USA &Canadá; 6,6
Latin America; 7,0
Africa; 18,5
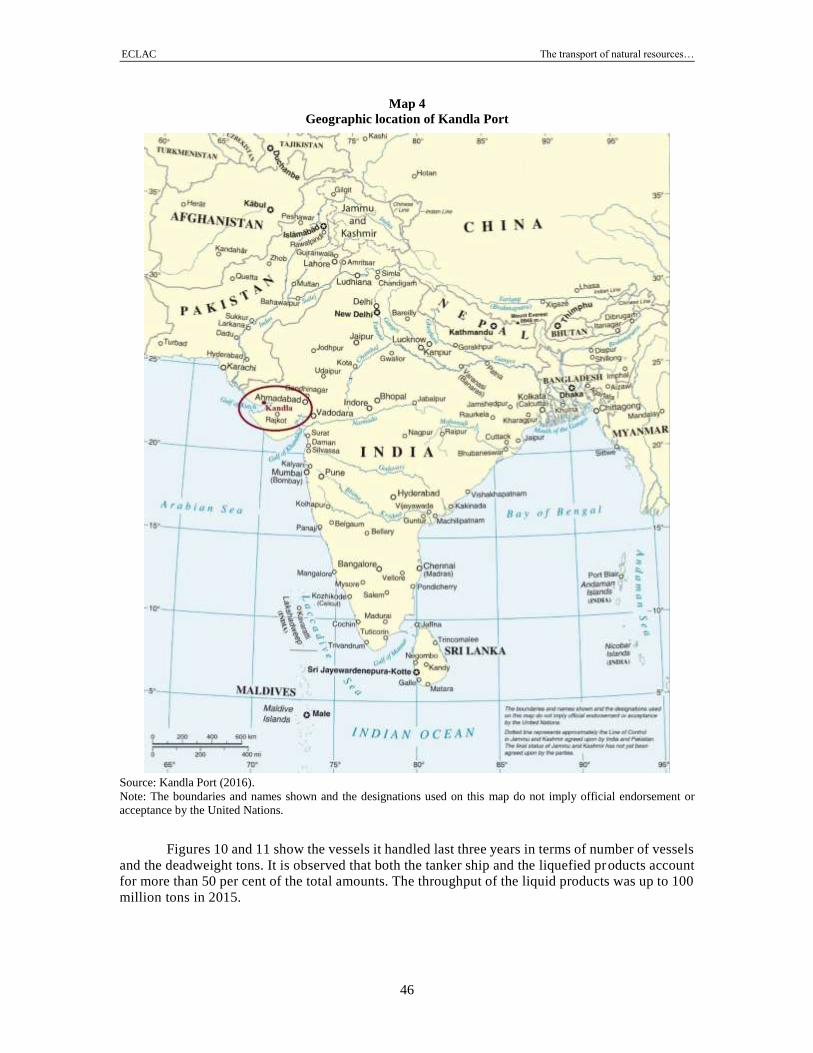
ECLAC The transport of natural resources…
46
Map 4
Geographic location of Kandla Port
Source: Kandla Port (2016).
Note: The boundaries and names shown and the designations used on this map do not imply official endorsement or
acceptance by the United Nations.
Figures 10 and 11 show the vessels it handled last three years in terms of number of vessels
and the deadweight tons. It is observed that both the tanker ship and the liquefied products account
for more than 50 per cent of the total amounts. The throughput of the liquid products was up to 100
million tons in 2015.
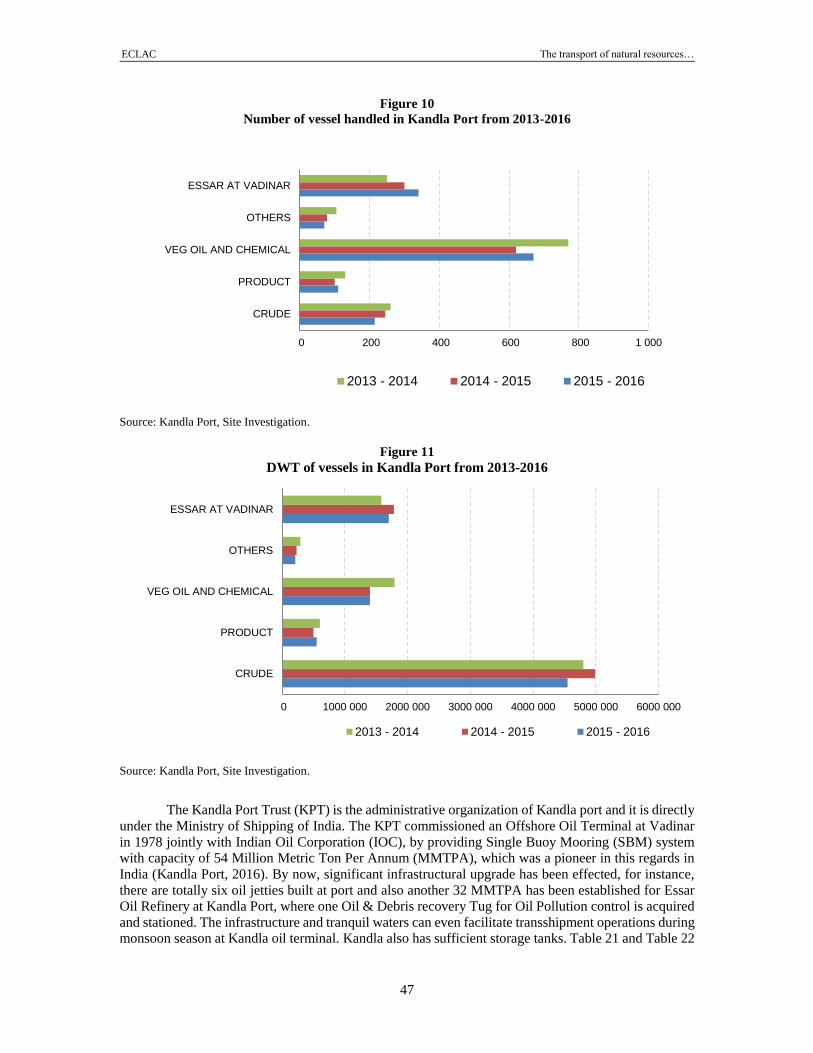
ECLAC The transport of natural resources…
47
Figure 10
Number of vessel handled in Kandla Port from 2013-2016
Source: Kandla Port, Site Investigation.
Figure 11
DWT of vessels in Kandla Port from 2013-2016
Source: Kandla Port, Site Investigation.
The Kandla Port Trust (KPT) is the administrative organization of Kandla port and it is directly
under the Ministry of Shipping of India. The KPT commissioned an Offshore Oil Terminal at Vadinar
in 1978 jointly with Indian Oil Corporation (IOC), by providing Single Buoy Mooring (SBM) system
with capacity of 54 Million Metric Ton Per Annum (MMTPA), which was a pioneer in this regards in
India (Kandla Port, 2016). By now, significant infrastructural upgrade has been effected, for instance,
there are totally six oil jetties built at port and also another 32 MMTPA has been established for Essar
Oil Refinery at Kandla Port, where one Oil & Debris recovery Tug for Oil Pollution control is acquired
and stationed. The infrastructure and tranquil waters can even facilitate transshipment operations during
monsoon season at Kandla oil terminal. Kandla also has sufficient storage tanks. Table 21 and Table 22
0 200 400 600 800 1 000
CRUDE
PRODUCT
VEG OIL AND CHEMICAL
OTHERS
ESSAR AT VADINAR
2013 - 2014 2014 - 2015 2015 - 2016
0 1000 000 2000 000 3000 000 4000 000 5000 000 6000 000
CRUDE
PRODUCT
VEG OIL AND CHEMICAL
OTHERS
ESSAR AT VADINAR
2013 - 2014 2014 - 2015 2015 - 2016
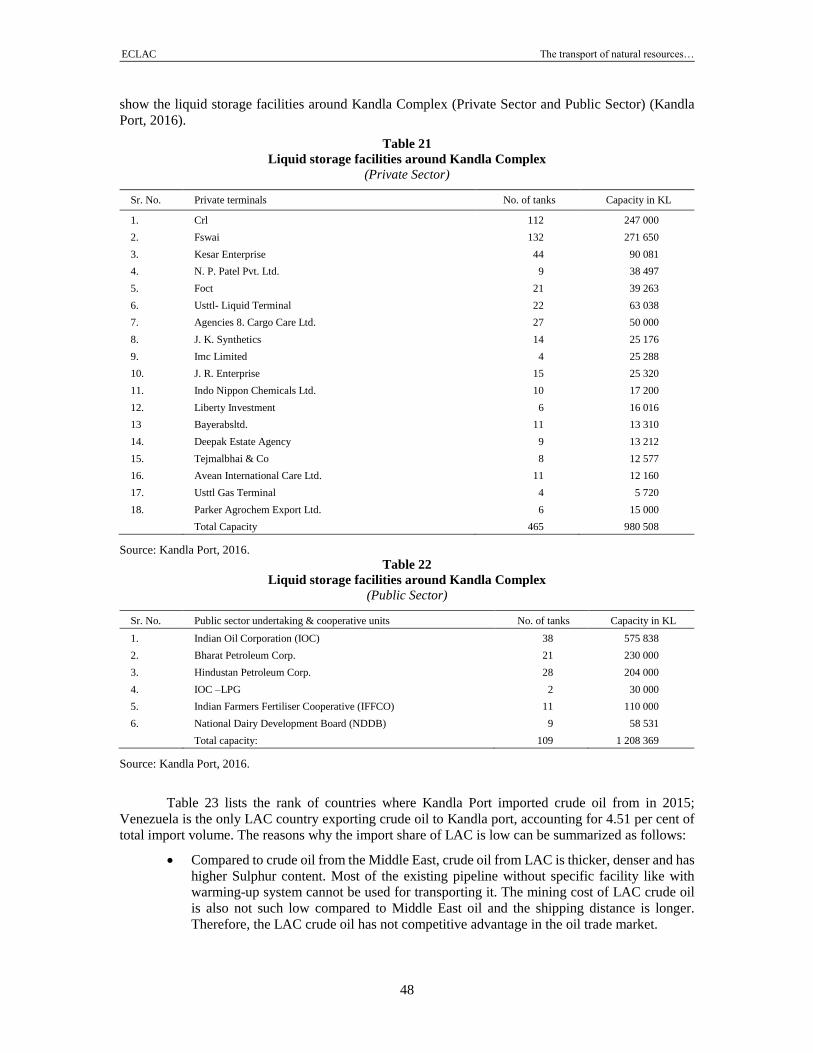
ECLAC The transport of natural resources…
48
show the liquid storage facilities around Kandla Complex (Private Sector and Public Sector) (Kandla
Port, 2016).
Table 21
Liquid storage facilities around Kandla Complex
(Private Sector)
Sr. No. Private terminals No. of tanks Capacity in KL
1. Crl 112 247 000
2. Fswai 132 271 650
3. Kesar Enterprise 44 90 081
4. N. P. Patel Pvt. Ltd. 9 38 497
5. Foct 21 39 263
6. Usttl- Liquid Terminal 22 63 038
7. Agencies 8. Cargo Care Ltd. 27 50 000
8. J. K. Synthetics 14 25 176
9. Imc Limited 4 25 288
10. J. R. Enterprise 15 25 320
11. Indo Nippon Chemicals Ltd. 10 17 200
12. Liberty Investment 6 16 016
13 Bayerabsltd. 11 13 310
14. Deepak Estate Agency 9 13 212
15. Tejmalbhai & Co 8 12 577
16. Avean International Care Ltd. 11 12 160
17. Usttl Gas Terminal 4 5 720
18. Parker Agrochem Export Ltd. 6 15 000
Total Capacity 465 980 508
Source: Kandla Port, 2016.
Table 22
Liquid storage facilities around Kandla Complex
(Public Sector)
Sr. No. Public sector undertaking & cooperative units No. of tanks Capacity in KL
1. Indian Oil Corporation (IOC) 38 575 838
2. Bharat Petroleum Corp. 21 230 000
3. Hindustan Petroleum Corp. 28 204 000
4. IOC –LPG 2 30 000
5. Indian Farmers Fertiliser Cooperative (IFFCO) 11 110 000
6. National Dairy Development Board (NDDB) 9 58 531
Total capacity: 109 1 208 369
Source: Kandla Port, 2016.
Table 23 lists the rank of countries where Kandla Port imported crude oil from in 2015;
Venezuela is the only LAC country exporting crude oil to Kandla port, accounting for 4.51 per cent of
total import volume. The reasons why the import share of LAC is low can be summarized as follows:
• Compared to crude oil from the Middle East, crude oil from LAC is thicker, denser and has
higher Sulphur content. Most of the existing pipeline without specific facility like with
warming-up system cannot be used for transporting it. The mining cost of LAC crude oil
is also not such low compared to Middle East oil and the shipping distance is longer.
Therefore, the LAC crude oil has not competitive advantage in the oil trade market.
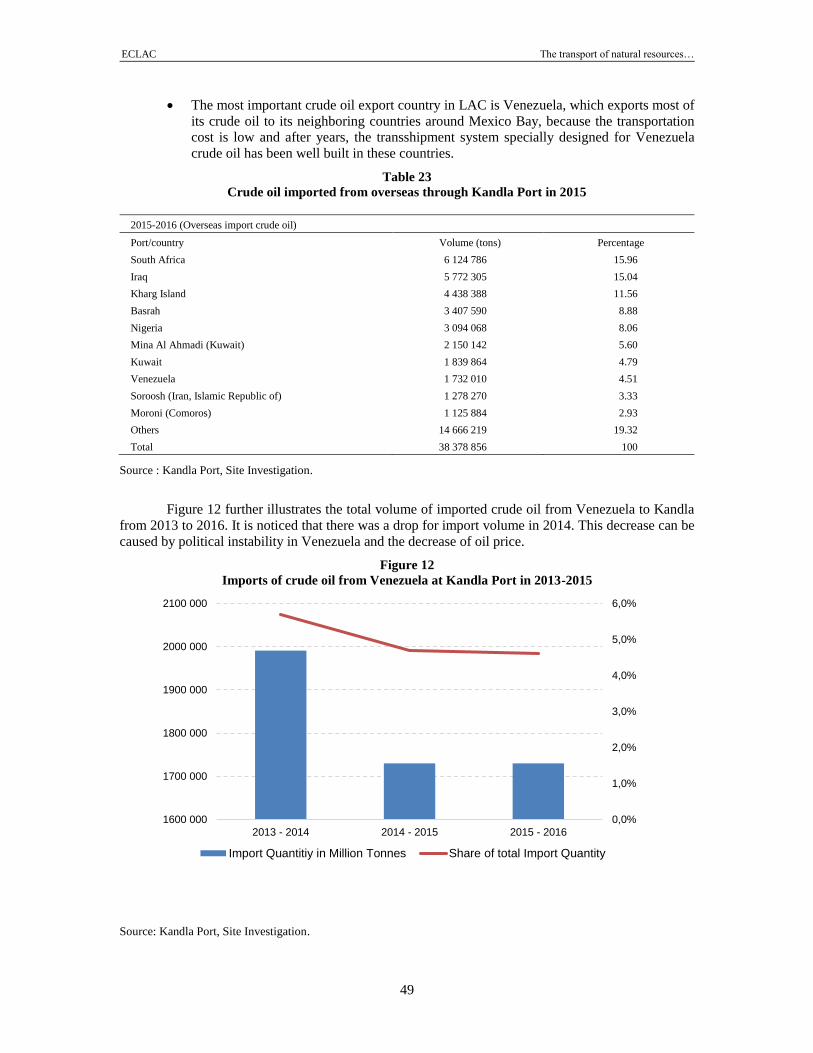
ECLAC The transport of natural resources…
49
• The most important crude oil export country in LAC is Venezuela, which exports most of
its crude oil to its neighboring countries around Mexico Bay, because the transportation
cost is low and after years, the transshipment system specially designed for Venezuela
crude oil has been well built in these countries.
Table 23
Crude oil imported from overseas through Kandla Port in 2015
2015-2016 (Overseas import crude oil)
Port/country Volume (tons) Percentage
South Africa 6 124 786 15.96
Iraq 5 772 305 15.04
Kharg Island 4 438 388 11.56
Basrah 3 407 590 8.88
Nigeria 3 094 068 8.06
Mina Al Ahmadi (Kuwait) 2 150 142 5.60
Kuwait 1 839 864 4.79
Venezuela 1 732 010 4.51
Soroosh (Iran, Islamic Republic of) 1 278 270 3.33
Moroni (Comoros) 1 125 884 2.93
Others 14 666 219 19.32
Total 38 378 856 100
Source : Kandla Port, Site Investigation.
Figure 12 further illustrates the total volume of imported crude oil from Venezuela to Kandla
from 2013 to 2016. It is noticed that there was a drop for import volume in 2014. This decrease can be
caused by political instability in Venezuela and the decrease of oil price.
Figure 12
Imports of crude oil from Venezuela at Kandla Port in 2013-2015
Source: Kandla Port, Site Investigation.
0,0%
1,0%
2,0%
3,0%
4,0%
5,0%
6,0%
1600 000
1700 000
1800 000
1900 000
2000 000
2100 000
2013 - 2014 2014 - 2015 2015 - 2016
Import Quantitiy in Million Tonnes Share of total Import Quantity
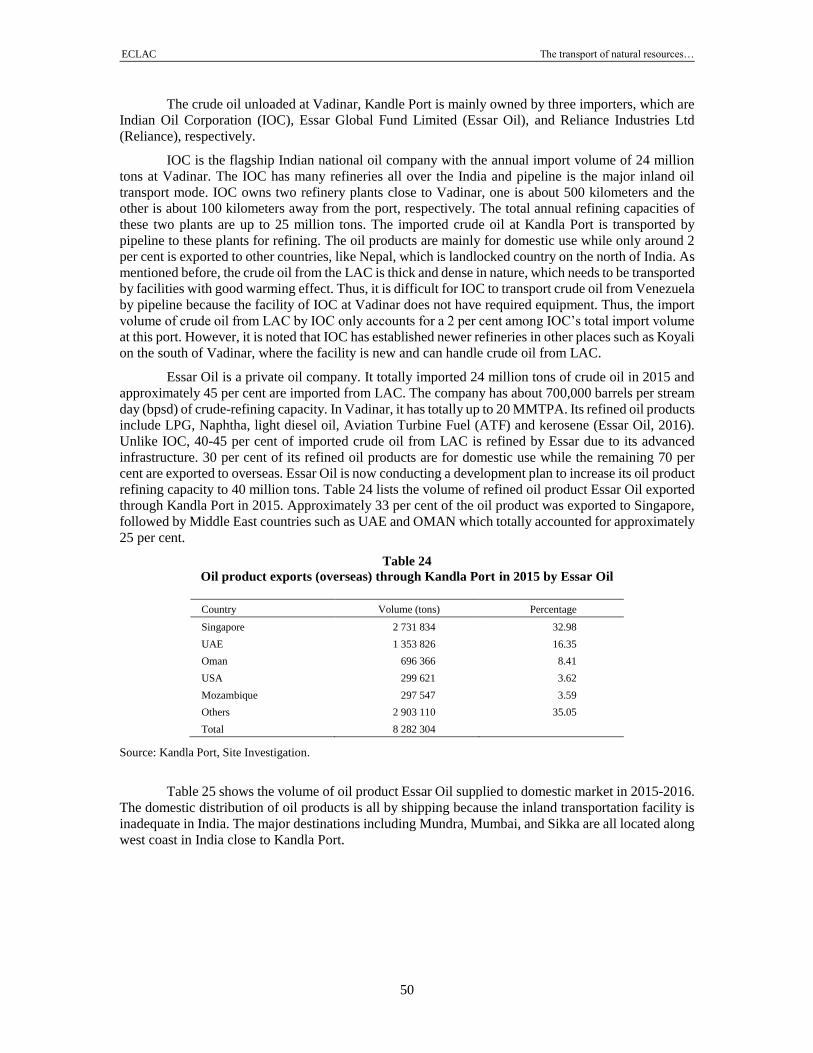
ECLAC The transport of natural resources…
50
The crude oil unloaded at Vadinar, Kandle Port is mainly owned by three importers, which are
Indian Oil Corporation (IOC), Essar Global Fund Limited (Essar Oil), and Reliance Industries Ltd
(Reliance), respectively.
IOC is the flagship Indian national oil company with the annual import volume of 24 million
tons at Vadinar. The IOC has many refineries all over the India and pipeline is the major inland oil
transport mode. IOC owns two refinery plants close to Vadinar, one is about 500 kilometers and the
other is about 100 kilometers away from the port, respectively. The total annual refining capacities of
these two plants are up to 25 million tons. The imported crude oil at Kandla Port is transported by
pipeline to these plants for refining. The oil products are mainly for domestic use while only around 2
per cent is exported to other countries, like Nepal, which is landlocked country on the north of India. As
mentioned before, the crude oil from the LAC is thick and dense in nature, which needs to be transported
by facilities with good warming effect. Thus, it is difficult for IOC to transport crude oil from Venezuela
by pipeline because the facility of IOC at Vadinar does not have required equipment. Thus, the import
volume of crude oil from LAC by IOC only accounts for a 2 per cent among IOC’s total import volume
at this port. However, it is noted that IOC has established newer refineries in other places such as Koyali
on the south of Vadinar, where the facility is new and can handle crude oil from LAC.
Essar Oil is a private oil company. It totally imported 24 million tons of crude oil in 2015 and
approximately 45 per cent are imported from LAC. The company has about 700,000 barrels per stream
day (bpsd) of crude-refining capacity. In Vadinar, it has totally up to 20 MMTPA. Its refined oil products
include LPG, Naphtha, light diesel oil, Aviation Turbine Fuel (ATF) and kerosene (Essar Oil, 2016).
Unlike IOC, 40-45 per cent of imported crude oil from LAC is refined by Essar due to its advanced
infrastructure. 30 per cent of its refined oil products are for domestic use while the remaining 70 per
cent are exported to overseas. Essar Oil is now conducting a development plan to increase its oil product
refining capacity to 40 million tons. Table 24 lists the volume of refined oil product Essar Oil exported
through Kandla Port in 2015. Approximately 33 per cent of the oil product was exported to Singapore,
followed by Middle East countries such as UAE and OMAN which totally accounted for approximately
25 per cent.
Table 24
Oil product exports (overseas) through Kandla Port in 2015 by Essar Oil
Country Volume (tons) Percentage
Singapore 2 731 834 32.98
UAE 1 353 826 16.35
Oman 696 366 8.41
USA 299 621 3.62
Mozambique 297 547 3.59
Others 2 903 110 35.05
Total 8 282 304
Source: Kandla Port, Site Investigation.
Table 25 shows the volume of oil product Essar Oil supplied to domestic market in 2015-2016.
The domestic distribution of oil products is all by shipping because the inland transportation facility is
inadequate in India. The major destinations including Mundra, Mumbai, and Sikka are all located along
west coast in India close to Kandla Port.
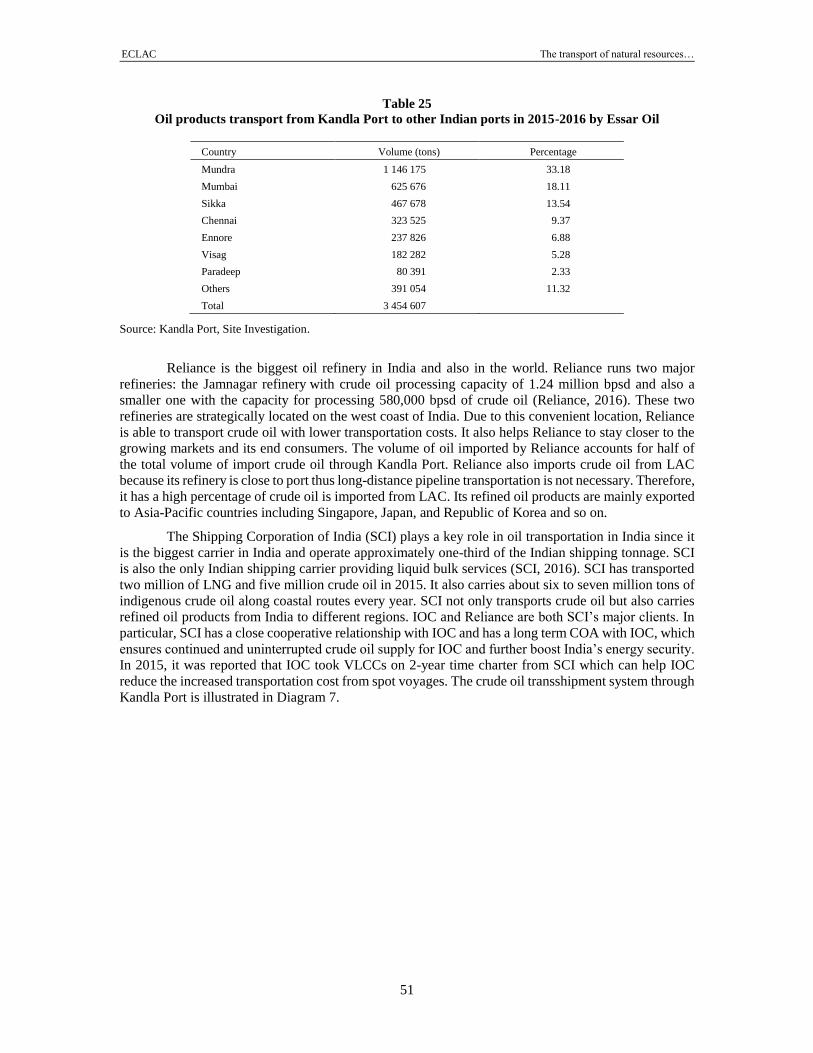
ECLAC The transport of natural resources…
51
Table 25
Oil products transport from Kandla Port to other Indian ports in 2015-2016 by Essar Oil
Country Volume (tons) Percentage
Mundra 1 146 175 33.18
Mumbai 625 676 18.11
Sikka 467 678 13.54
Chennai 323 525 9.37
Ennore 237 826 6.88
Visag 182 282 5.28
Paradeep 80 391 2.33
Others 391 054 11.32
Total 3 454 607
Source: Kandla Port, Site Investigation.
Reliance is the biggest oil refinery in India and also in the world. Reliance runs two major
refineries: the Jamnagar refinery with crude oil processing capacity of 1.24 million bpsd and also a
smaller one with the capacity for processing 580,000 bpsd of crude oil (Reliance, 2016). These two
refineries are strategically located on the west coast of India. Due to this convenient location, Reliance
is able to transport crude oil with lower transportation costs. It also helps Reliance to stay closer to the
growing markets and its end consumers. The volume of oil imported by Reliance accounts for half of
the total volume of import crude oil through Kandla Port. Reliance also imports crude oil from LAC
because its refinery is close to port thus long-distance pipeline transportation is not necessary. Therefore,
it has a high percentage of crude oil is imported from LAC. Its refined oil products are mainly exported
to Asia-Pacific countries including Singapore, Japan, and Republic of Korea and so on.
The Shipping Corporation of India (SCI) plays a key role in oil transportation in India since it
is the biggest carrier in India and operate approximately one-third of the Indian shipping tonnage. SCI
is also the only Indian shipping carrier providing liquid bulk services (SCI, 2016). SCI has transported
two million of LNG and five million crude oil in 2015. It also carries about six to seven million tons of
indigenous crude oil along coastal routes every year. SCI not only transports crude oil but also carries
refined oil products from India to different regions. IOC and Reliance are both SCI’s major clients. In
particular, SCI has a close cooperative relationship with IOC and has a long term COA with IOC, which
ensures continued and uninterrupted crude oil supply for IOC and further boost India’s energy security.
In 2015, it was reported that IOC took VLCCs on 2-year time charter from SCI which can help IOC
reduce the increased transportation cost from spot voyages. The crude oil transshipment system through
Kandla Port is illustrated in Diagram 7.
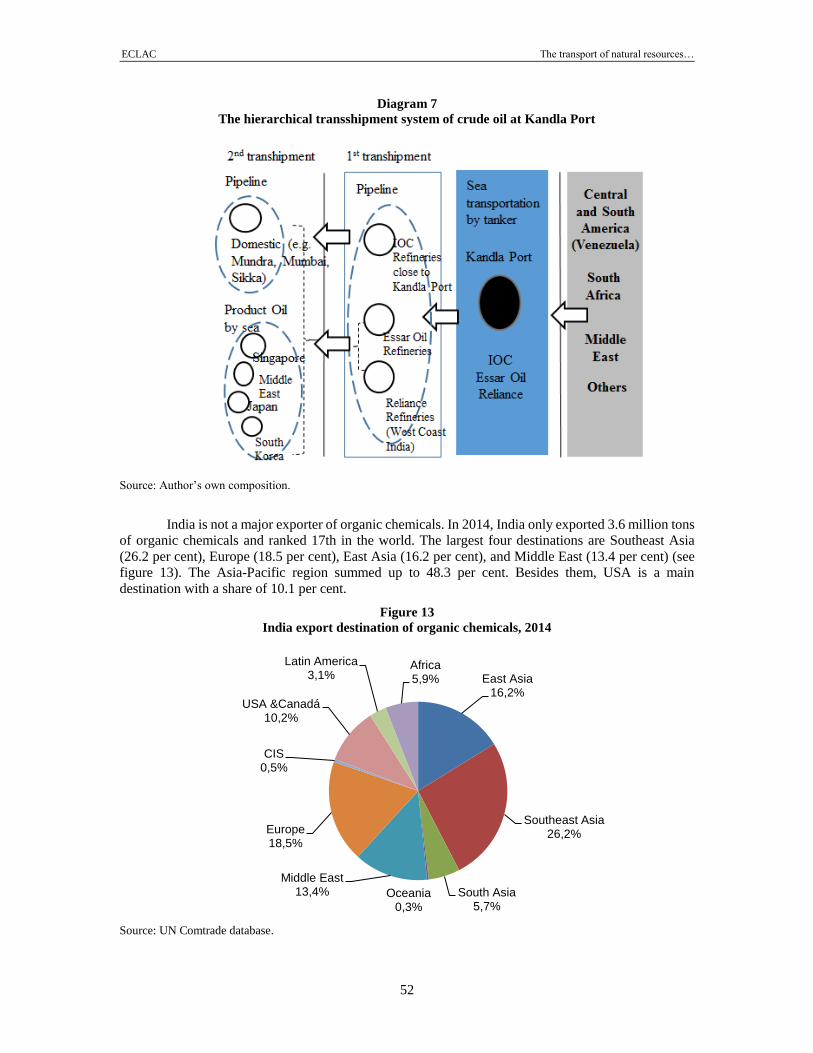
ECLAC The transport of natural resources…
52
Diagram 7
The hierarchical transshipment system of crude oil at Kandla Port
Source: Author’s own composition.
India is not a major exporter of organic chemicals. In 2014, India only exported 3.6 million tons
of organic chemicals and ranked 17th in the world. The largest four destinations are Southeast Asia
(26.2 per cent), Europe (18.5 per cent), East Asia (16.2 per cent), and Middle East (13.4 per cent) (see
figure 13). The Asia-Pacific region summed up to 48.3 per cent. Besides them, USA is a main
destination with a share of 10.1 per cent.
Figure 13
India export destination of organic chemicals, 2014
Source: UN Comtrade database.
East Asia16,2%
Southeast Asia26,2%
South Asia5,7%
Oceania0,3%
Middle East13,4%
Europe18,5%
CIS0,5%
USA &Canadá10,2%
Latin America3,1%
Africa5,9%
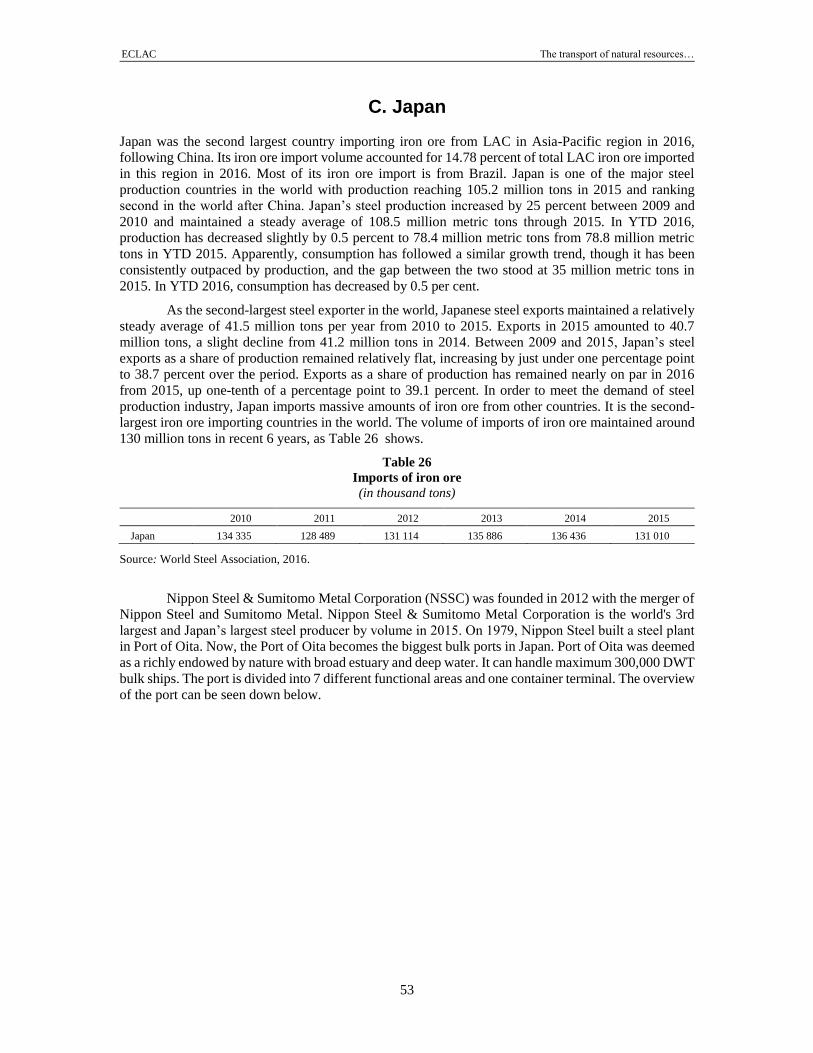
ECLAC The transport of natural resources…
53
C. Japan
Japan was the second largest country importing iron ore from LAC in Asia-Pacific region in 2016,
following China. Its iron ore import volume accounted for 14.78 percent of total LAC iron ore imported
in this region in 2016. Most of its iron ore import is from Brazil. Japan is one of the major steel
production countries in the world with production reaching 105.2 million tons in 2015 and ranking
second in the world after China. Japan’s steel production increased by 25 percent between 2009 and
2010 and maintained a steady average of 108.5 million metric tons through 2015. In YTD 2016,
production has decreased slightly by 0.5 percent to 78.4 million metric tons from 78.8 million metric
tons in YTD 2015. Apparently, consumption has followed a similar growth trend, though it has been
consistently outpaced by production, and the gap between the two stood at 35 million metric tons in
2015. In YTD 2016, consumption has decreased by 0.5 per cent.
As the second-largest steel exporter in the world, Japanese steel exports maintained a relatively
steady average of 41.5 million tons per year from 2010 to 2015. Exports in 2015 amounted to 40.7
million tons, a slight decline from 41.2 million tons in 2014. Between 2009 and 2015, Japan’s steel
exports as a share of production remained relatively flat, increasing by just under one percentage point
to 38.7 percent over the period. Exports as a share of production has remained nearly on par in 2016
from 2015, up one-tenth of a percentage point to 39.1 percent. In order to meet the demand of steel
production industry, Japan imports massive amounts of iron ore from other countries. It is the second-
largest iron ore importing countries in the world. The volume of imports of iron ore maintained around
130 million tons in recent 6 years, as Table 26 shows.
Table 26
Imports of iron ore
(in thousand tons)
2010 2011 2012 2013 2014 2015
Japan 134 335 128 489 131 114 135 886 136 436 131 010
Source: World Steel Association, 2016.
Nippon Steel & Sumitomo Metal Corporation (NSSC) was founded in 2012 with the merger of
Nippon Steel and Sumitomo Metal. Nippon Steel & Sumitomo Metal Corporation is the world's 3rd
largest and Japan’s largest steel producer by volume in 2015. On 1979, Nippon Steel built a steel plant
in Port of Oita. Now, the Port of Oita becomes the biggest bulk ports in Japan. Port of Oita was deemed
as a richly endowed by nature with broad estuary and deep water. It can handle maximum 300,000 DWT
bulk ships. The port is divided into 7 different functional areas and one container terminal. The overview
of the port can be seen down below.
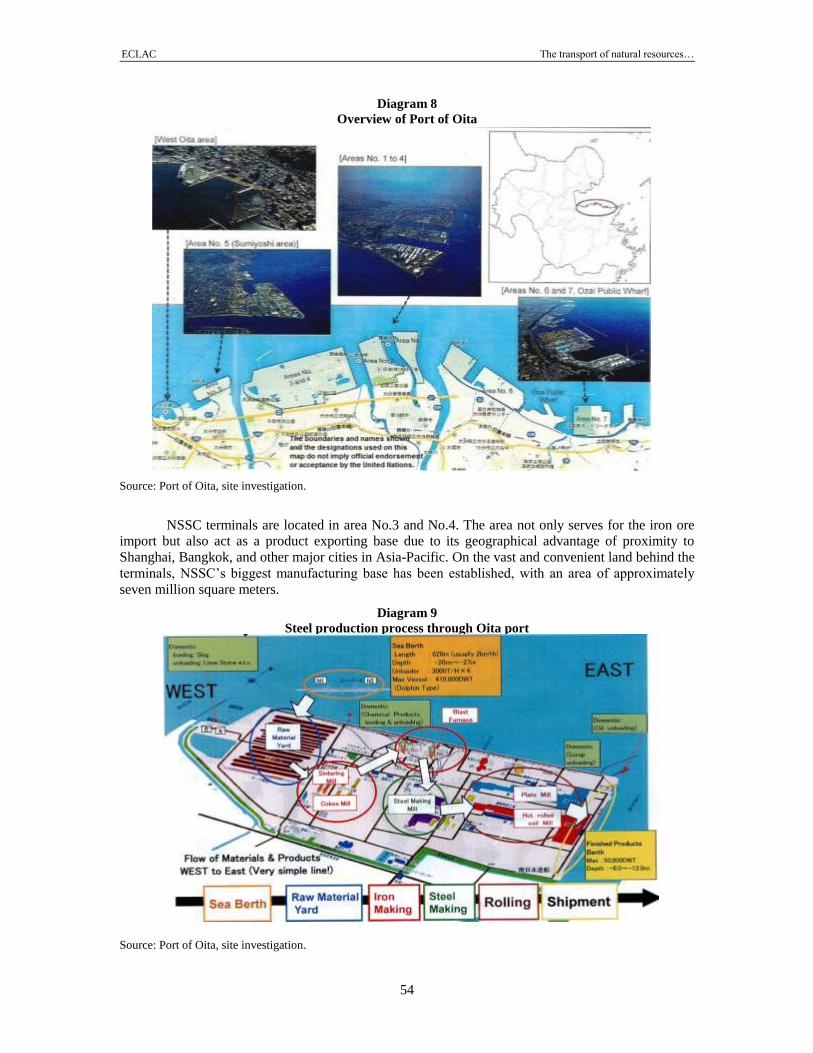
ECLAC The transport of natural resources…
54
Diagram 8
Overview of Port of Oita
Source: Port of Oita, site investigation.
NSSC terminals are located in area No.3 and No.4. The area not only serves for the iron ore
import but also act as a product exporting base due to its geographical advantage of proximity to
Shanghai, Bangkok, and other major cities in Asia-Pacific. On the vast and convenient land behind the
terminals, NSSC’s biggest manufacturing base has been established, with an area of approximately
seven million square meters.
Diagram 9
Steel production process through Oita port
Source: Port of Oita, site investigation.
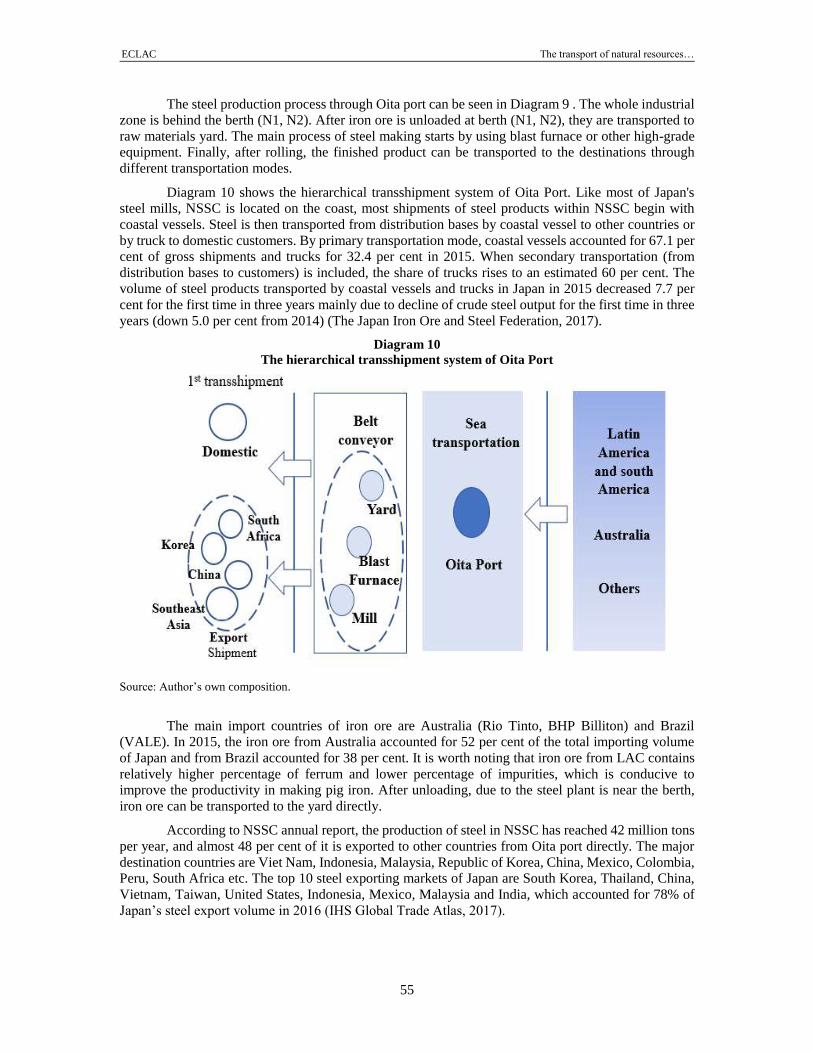
ECLAC The transport of natural resources…
55
The steel production process through Oita port can be seen in Diagram 9 . The whole industrial
zone is behind the berth (N1, N2). After iron ore is unloaded at berth (N1, N2), they are transported to
raw materials yard. The main process of steel making starts by using blast furnace or other high-grade
equipment. Finally, after rolling, the finished product can be transported to the destinations through
different transportation modes.
Diagram 10 shows the hierarchical transshipment system of Oita Port. Like most of Japan's
steel mills, NSSC is located on the coast, most shipments of steel products within NSSC begin with
coastal vessels. Steel is then transported from distribution bases by coastal vessel to other countries or
by truck to domestic customers. By primary transportation mode, coastal vessels accounted for 67.1 per
cent of gross shipments and trucks for 32.4 per cent in 2015. When secondary transportation (from
distribution bases to customers) is included, the share of trucks rises to an estimated 60 per cent. The
volume of steel products transported by coastal vessels and trucks in Japan in 2015 decreased 7.7 per
cent for the first time in three years mainly due to decline of crude steel output for the first time in three
years (down 5.0 per cent from 2014) (The Japan Iron Ore and Steel Federation, 2017).
Diagram 10
The hierarchical transshipment system of Oita Port
Source: Author’s own composition.
The main import countries of iron ore are Australia (Rio Tinto, BHP Billiton) and Brazil
(VALE). In 2015, the iron ore from Australia accounted for 52 per cent of the total importing volume
of Japan and from Brazil accounted for 38 per cent. It is worth noting that iron ore from LAC contains
relatively higher percentage of ferrum and lower percentage of impurities, which is conducive to
improve the productivity in making pig iron. After unloading, due to the steel plant is near the berth,
iron ore can be transported to the yard directly.
According to NSSC annual report, the production of steel in NSSC has reached 42 million tons
per year, and almost 48 per cent of it is exported to other countries from Oita port directly. The major
destination countries are Viet Nam, Indonesia, Malaysia, Republic of Korea, China, Mexico, Colombia,
Peru, South Africa etc. The top 10 steel exporting markets of Japan are South Korea, Thailand, China,
Vietnam, Taiwan, United States, Indonesia, Mexico, Malaysia and India, which accounted for 78% of
Japan’s steel export volume in 2016 (IHS Global Trade Atlas, 2017).
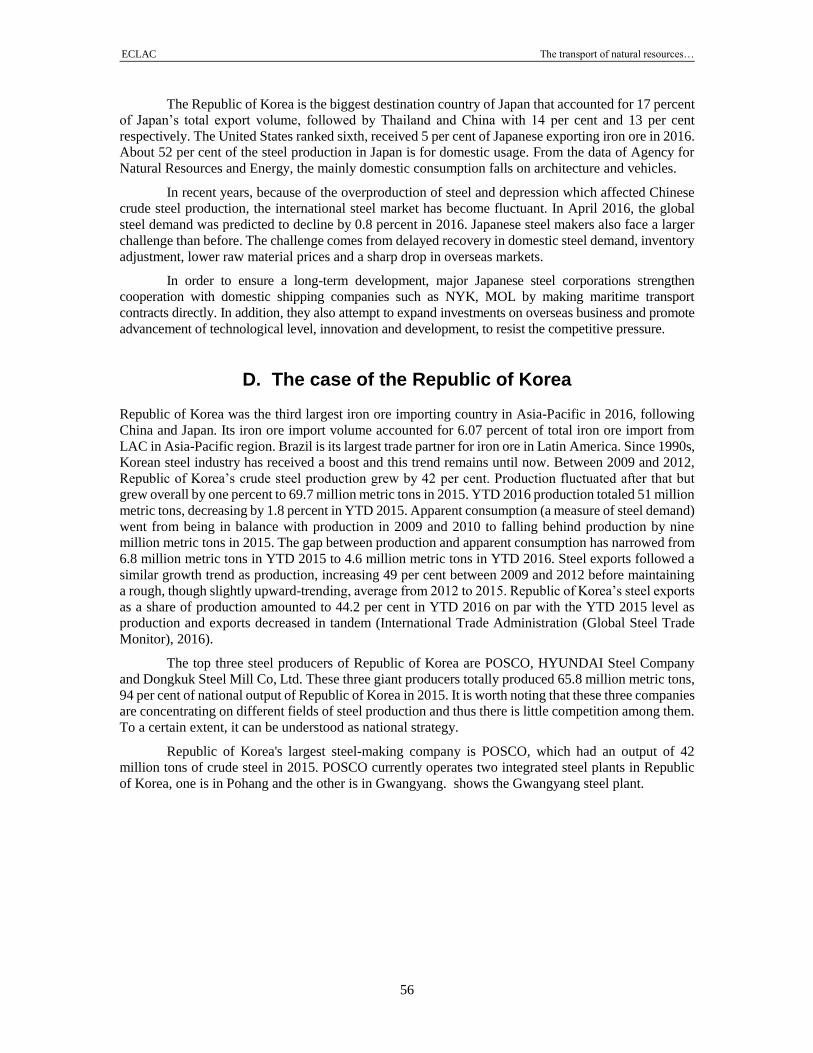
ECLAC The transport of natural resources…
56
The Republic of Korea is the biggest destination country of Japan that accounted for 17 percent
of Japan’s total export volume, followed by Thailand and China with 14 per cent and 13 per cent
respectively. The United States ranked sixth, received 5 per cent of Japanese exporting iron ore in 2016.
About 52 per cent of the steel production in Japan is for domestic usage. From the data of Agency for
Natural Resources and Energy, the mainly domestic consumption falls on architecture and vehicles.
In recent years, because of the overproduction of steel and depression which affected Chinese
crude steel production, the international steel market has become fluctuant. In April 2016, the global
steel demand was predicted to decline by 0.8 percent in 2016. Japanese steel makers also face a larger
challenge than before. The challenge comes from delayed recovery in domestic steel demand, inventory
adjustment, lower raw material prices and a sharp drop in overseas markets.
In order to ensure a long-term development, major Japanese steel corporations strengthen
cooperation with domestic shipping companies such as NYK, MOL by making maritime transport
contracts directly. In addition, they also attempt to expand investments on overseas business and promote
advancement of technological level, innovation and development, to resist the competitive pressure.
D. The case of the Republic of Korea
Republic of Korea was the third largest iron ore importing country in Asia-Pacific in 2016, following
China and Japan. Its iron ore import volume accounted for 6.07 percent of total iron ore import from
LAC in Asia-Pacific region. Brazil is its largest trade partner for iron ore in Latin America. Since 1990s,
Korean steel industry has received a boost and this trend remains until now. Between 2009 and 2012,
Republic of Korea’s crude steel production grew by 42 per cent. Production fluctuated after that but
grew overall by one percent to 69.7 million metric tons in 2015. YTD 2016 production totaled 51 million
metric tons, decreasing by 1.8 percent in YTD 2015. Apparent consumption (a measure of steel demand)
went from being in balance with production in 2009 and 2010 to falling behind production by nine
million metric tons in 2015. The gap between production and apparent consumption has narrowed from
6.8 million metric tons in YTD 2015 to 4.6 million metric tons in YTD 2016. Steel exports followed a
similar growth trend as production, increasing 49 per cent between 2009 and 2012 before maintaining
a rough, though slightly upward-trending, average from 2012 to 2015. Republic of Korea’s steel exports
as a share of production amounted to 44.2 per cent in YTD 2016 on par with the YTD 2015 level as
production and exports decreased in tandem (International Trade Administration (Global Steel Trade
Monitor), 2016).
The top three steel producers of Republic of Korea are POSCO, HYUNDAI Steel Company
and Dongkuk Steel Mill Co, Ltd. These three giant producers totally produced 65.8 million metric tons,
94 per cent of national output of Republic of Korea in 2015. It is worth noting that these three companies
are concentrating on different fields of steel production and thus there is little competition among them.
To a certain extent, it can be understood as national strategy.
Republic of Korea's largest steel-making company is POSCO, which had an output of 42
million tons of crude steel in 2015. POSCO currently operates two integrated steel plants in Republic
of Korea, one is in Pohang and the other is in Gwangyang. shows the Gwangyang steel plant.
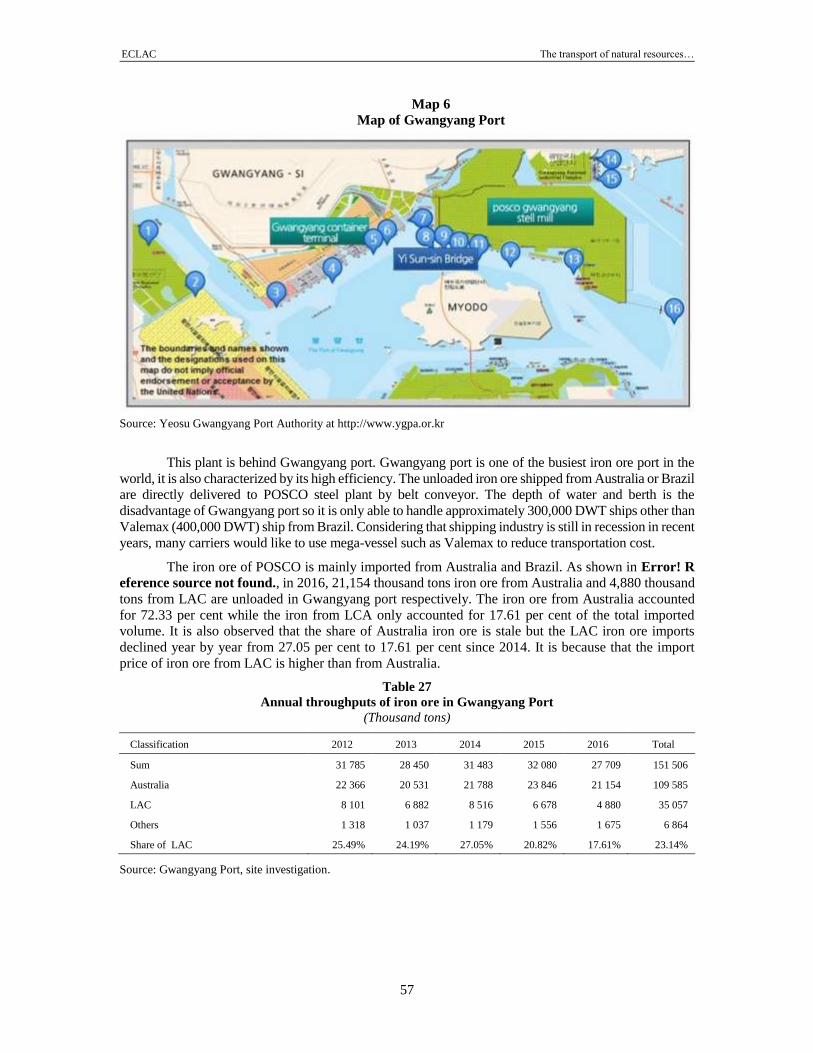
ECLAC The transport of natural resources…
57
Map 6
Map of Gwangyang Port
Source: Yeosu Gwangyang Port Authority at http://www.ygpa.or.kr
This plant is behind Gwangyang port. Gwangyang port is one of the busiest iron ore port in the
world, it is also characterized by its high efficiency. The unloaded iron ore shipped from Australia or Brazil
are directly delivered to POSCO steel plant by belt conveyor. The depth of water and berth is the
disadvantage of Gwangyang port so it is only able to handle approximately 300,000 DWT ships other than
Valemax (400,000 DWT) ship from Brazil. Considering that shipping industry is still in recession in recent
years, many carriers would like to use mega-vessel such as Valemax to reduce transportation cost.
The iron ore of POSCO is mainly imported from Australia and Brazil. As shown in Error! R
eference source not found., in 2016, 21,154 thousand tons iron ore from Australia and 4,880 thousand
tons from LAC are unloaded in Gwangyang port respectively. The iron ore from Australia accounted
for 72.33 per cent while the iron from LCA only accounted for 17.61 per cent of the total imported
volume. It is also observed that the share of Australia iron ore is stale but the LAC iron ore imports
declined year by year from 27.05 per cent to 17.61 per cent since 2014. It is because that the import
price of iron ore from LAC is higher than from Australia.
Table 27
Annual throughputs of iron ore in Gwangyang Port
(Thousand tons)
Classification 2012 2013 2014 2015 2016 Total
Sum 31 785 28 450 31 483 32 080 27 709 151 506
Australia 22 366 20 531 21 788 23 846 21 154 109 585
LAC 8 101 6 882 8 516 6 678 4 880 35 057
Others 1 318 1 037 1 179 1 556 1 675 6 864
Share of LAC 25.49% 24.19% 27.05% 20.82% 17.61% 23.14%
Source: Gwangyang Port, site investigation.
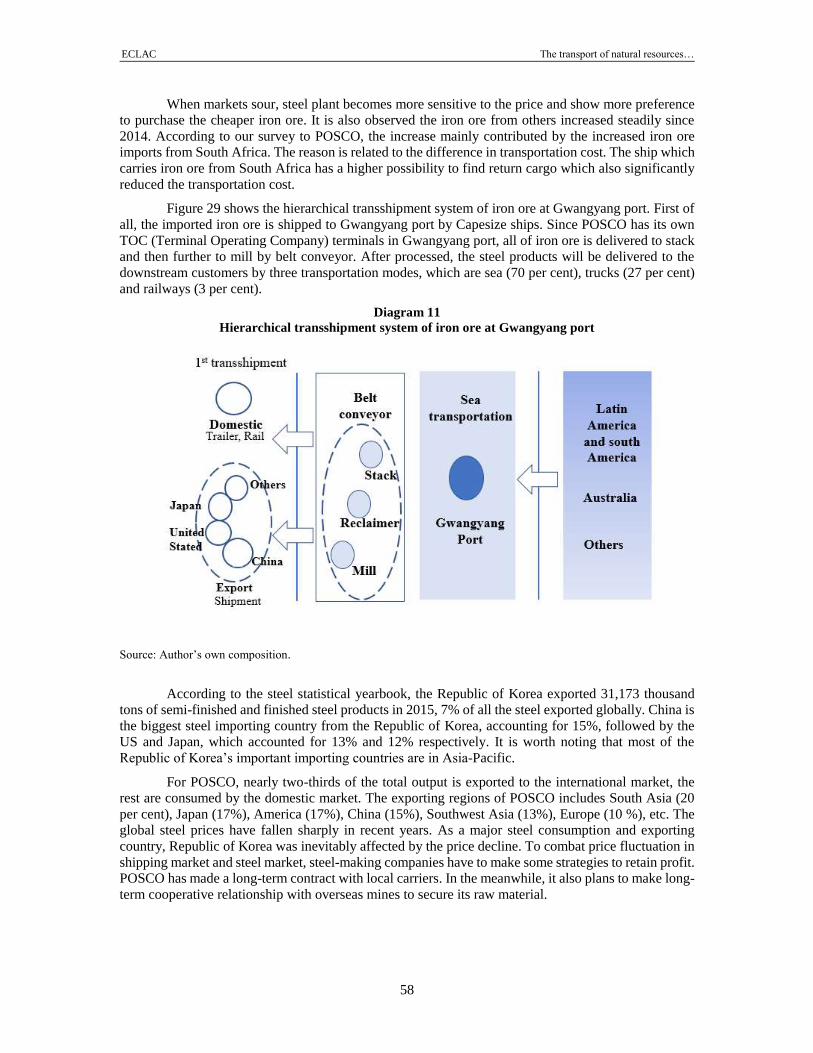
ECLAC The transport of natural resources…
58
When markets sour, steel plant becomes more sensitive to the price and show more preference
to purchase the cheaper iron ore. It is also observed the iron ore from others increased steadily since
2014. According to our survey to POSCO, the increase mainly contributed by the increased iron ore
imports from South Africa. The reason is related to the difference in transportation cost. The ship which
carries iron ore from South Africa has a higher possibility to find return cargo which also significantly
reduced the transportation cost.
Figure 29 shows the hierarchical transshipment system of iron ore at Gwangyang port. First of
all, the imported iron ore is shipped to Gwangyang port by Capesize ships. Since POSCO has its own
TOC (Terminal Operating Company) terminals in Gwangyang port, all of iron ore is delivered to stack
and then further to mill by belt conveyor. After processed, the steel products will be delivered to the
downstream customers by three transportation modes, which are sea (70 per cent), trucks (27 per cent)
and railways (3 per cent).
Diagram 11
Hierarchical transshipment system of iron ore at Gwangyang port
Source: Author’s own composition.
According to the steel statistical yearbook, the Republic of Korea exported 31,173 thousand
tons of semi-finished and finished steel products in 2015, 7% of all the steel exported globally. China is
the biggest steel importing country from the Republic of Korea, accounting for 15%, followed by the
US and Japan, which accounted for 13% and 12% respectively. It is worth noting that most of the
Republic of Korea’s important importing countries are in Asia-Pacific.
For POSCO, nearly two-thirds of the total output is exported to the international market, the
rest are consumed by the domestic market. The exporting regions of POSCO includes South Asia (20
per cent), Japan (17%), America (17%), China (15%), Southwest Asia (13%), Europe (10 %), etc. The
global steel prices have fallen sharply in recent years. As a major steel consumption and exporting
country, Republic of Korea was inevitably affected by the price decline. To combat price fluctuation in
shipping market and steel market, steel-making companies have to make some strategies to retain profit.
POSCO has made a long-term contract with local carriers. In the meanwhile, it also plans to make long-
term cooperative relationship with overseas mines to secure its raw material.
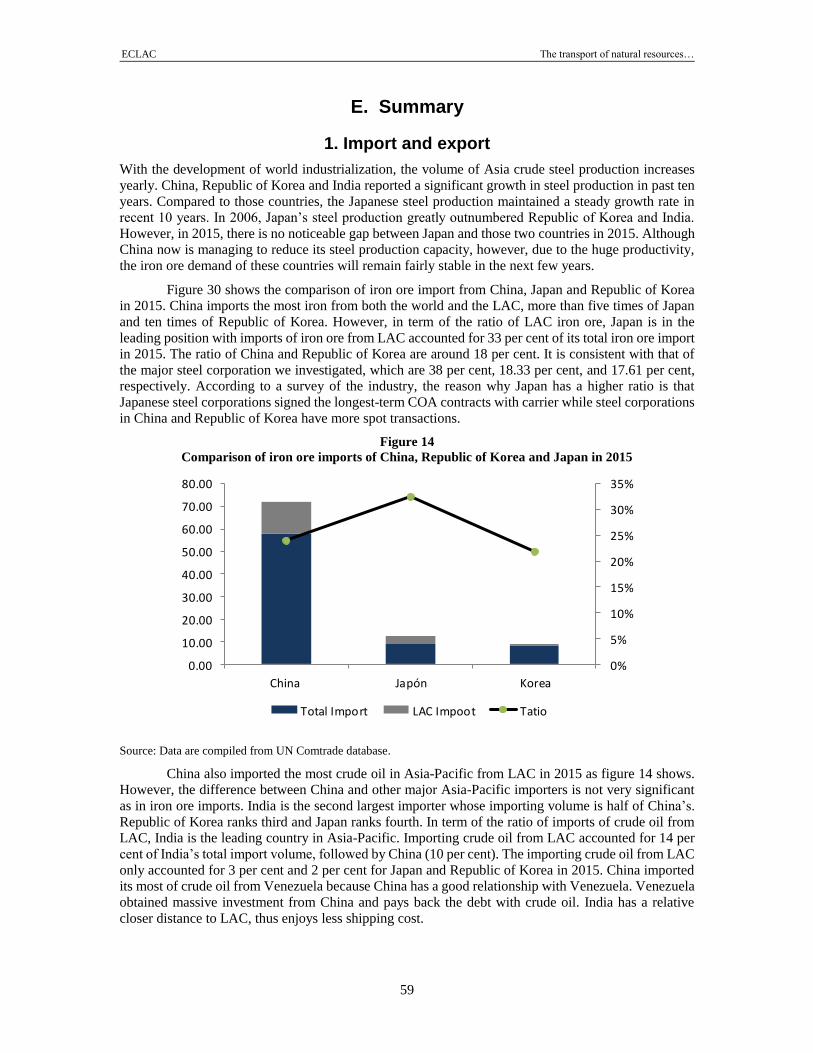
ECLAC The transport of natural resources…
59
E. Summary
1. Import and export
With the development of world industrialization, the volume of Asia crude steel production increases
yearly. China, Republic of Korea and India reported a significant growth in steel production in past ten
years. Compared to those countries, the Japanese steel production maintained a steady growth rate in
recent 10 years. In 2006, Japan’s steel production greatly outnumbered Republic of Korea and India.
However, in 2015, there is no noticeable gap between Japan and those two countries in 2015. Although
China now is managing to reduce its steel production capacity, however, due to the huge productivity,
the iron ore demand of these countries will remain fairly stable in the next few years.
Figure 30 shows the comparison of iron ore import from China, Japan and Republic of Korea
in 2015. China imports the most iron from both the world and the LAC, more than five times of Japan
and ten times of Republic of Korea. However, in term of the ratio of LAC iron ore, Japan is in the
leading position with imports of iron ore from LAC accounted for 33 per cent of its total iron ore import
in 2015. The ratio of China and Republic of Korea are around 18 per cent. It is consistent with that of
the major steel corporation we investigated, which are 38 per cent, 18.33 per cent, and 17.61 per cent,
respectively. According to a survey of the industry, the reason why Japan has a higher ratio is that
Japanese steel corporations signed the longest-term COA contracts with carrier while steel corporations
in China and Republic of Korea have more spot transactions.
Figure 14
Comparison of iron ore imports of China, Republic of Korea and Japan in 2015
0%
5%
10%
15%
20%
25%
30%
35%
0.00
10.00
20.00
30.00
40.00
50.00
60.00
70.00
80.00
China Japón Korea
Total Import LAC Impoot Tatio
Source: Data are compiled from UN Comtrade database.
China also imported the most crude oil in Asia-Pacific from LAC in 2015 as figure 14 shows.
However, the difference between China and other major Asia-Pacific importers is not very significant
as in iron ore imports. India is the second largest importer whose importing volume is half of China’s.
Republic of Korea ranks third and Japan ranks fourth. In term of the ratio of imports of crude oil from
LAC, India is the leading country in Asia-Pacific. Importing crude oil from LAC accounted for 14 per
cent of India’s total import volume, followed by China (10 per cent). The importing crude oil from LAC
only accounted for 3 per cent and 2 per cent for Japan and Republic of Korea in 2015. China imported
its most of crude oil from Venezuela because China has a good relationship with Venezuela. Venezuela
obtained massive investment from China and pays back the debt with crude oil. India has a relative
closer distance to LAC, thus enjoys less shipping cost.
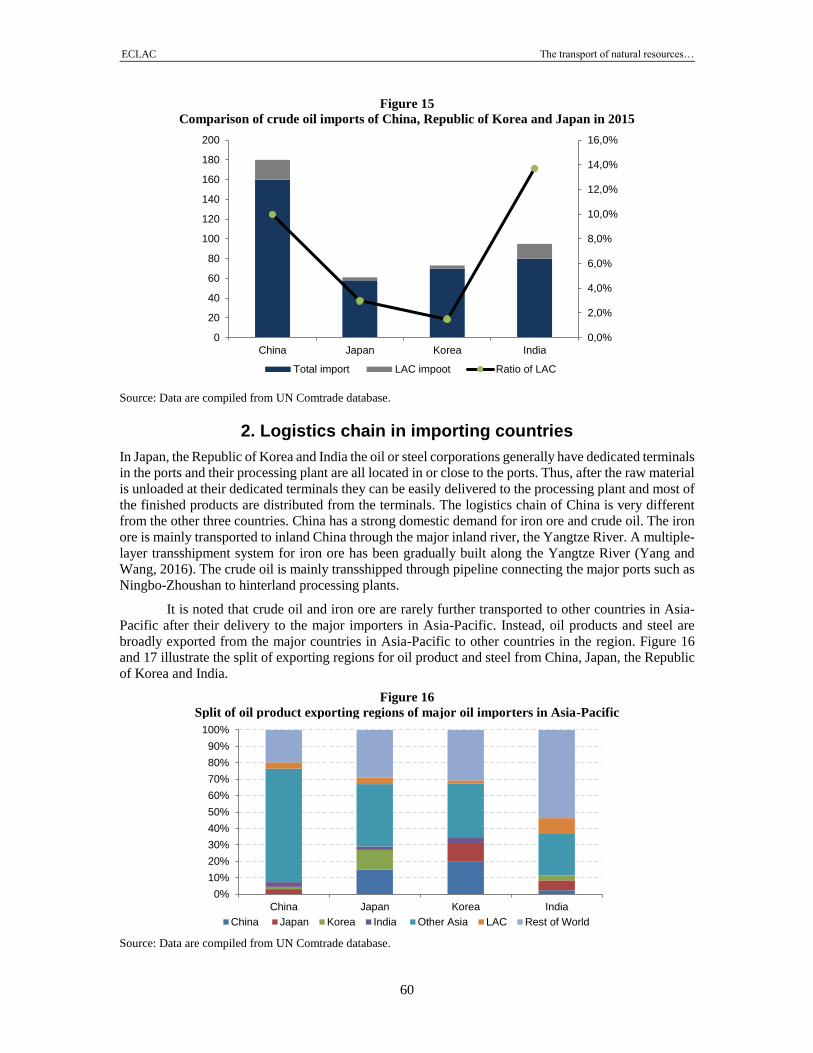
ECLAC The transport of natural resources…
60
Figure 15
Comparison of crude oil imports of China, Republic of Korea and Japan in 2015
Source: Data are compiled from UN Comtrade database.
2. Logistics chain in importing countries
In Japan, the Republic of Korea and India the oil or steel corporations generally have dedicated terminals
in the ports and their processing plant are all located in or close to the ports. Thus, after the raw material
is unloaded at their dedicated terminals they can be easily delivered to the processing plant and most of
the finished products are distributed from the terminals. The logistics chain of China is very different
from the other three countries. China has a strong domestic demand for iron ore and crude oil. The iron
ore is mainly transported to inland China through the major inland river, the Yangtze River. A multiple-
layer transshipment system for iron ore has been gradually built along the Yangtze River (Yang and
Wang, 2016). The crude oil is mainly transshipped through pipeline connecting the major ports such as
Ningbo-Zhoushan to hinterland processing plants.
It is noted that crude oil and iron ore are rarely further transported to other countries in Asia-
Pacific after their delivery to the major importers in Asia-Pacific. Instead, oil products and steel are
broadly exported from the major countries in Asia-Pacific to other countries in the region. Figure 16
and 17 illustrate the split of exporting regions for oil product and steel from China, Japan, the Republic
of Korea and India.
Figure 16
Split of oil product exporting regions of major oil importers in Asia-Pacific
Source: Data are compiled from UN Comtrade database.
0,0%
2,0%
4,0%
6,0%
8,0%
10,0%
12,0%
14,0%
16,0%
0
20
40
60
80
100
120
140
160
180
200
China Japan Korea India
Total import LAC impoot Ratio of LAC
0%
10%
20%
30%
40%
50%
60%
70%
80%
90%
100%
China Japan Korea India
China Japan Korea India Other Asia LAC Rest of World
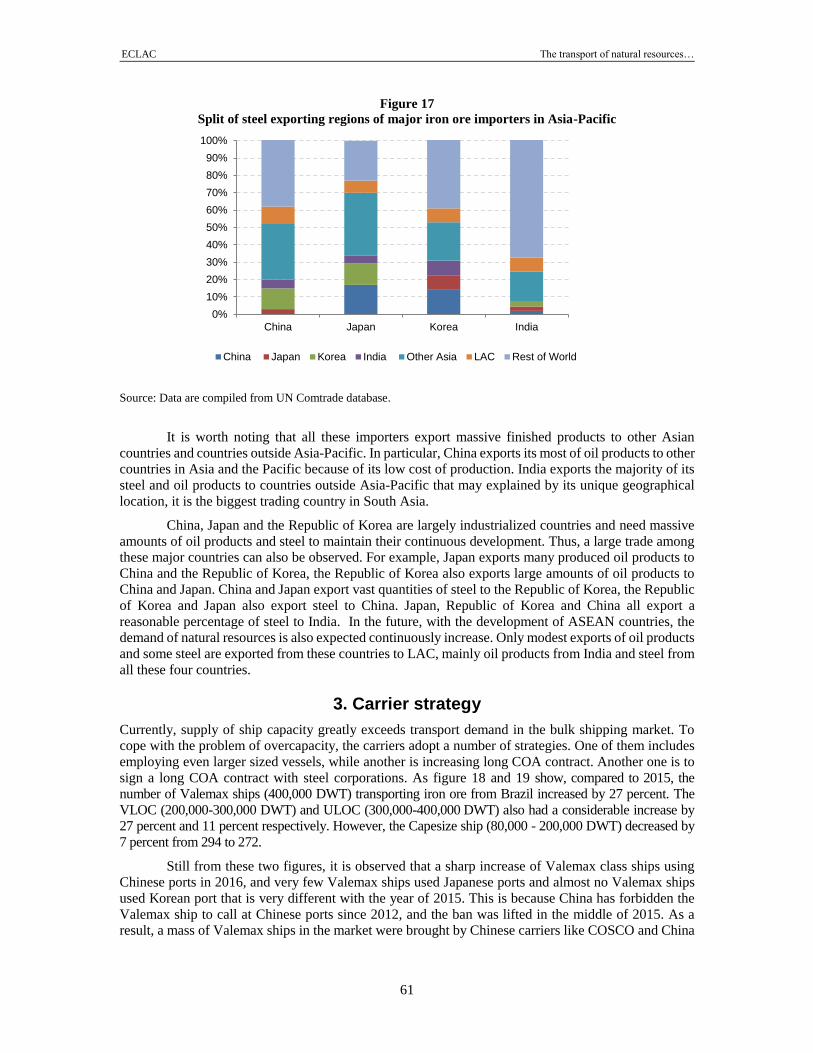
ECLAC The transport of natural resources…
61
Figure 17
Split of steel exporting regions of major iron ore importers in Asia-Pacific
Source: Data are compiled from UN Comtrade database.
It is worth noting that all these importers export massive finished products to other Asian
countries and countries outside Asia-Pacific. In particular, China exports its most of oil products to other
countries in Asia and the Pacific because of its low cost of production. India exports the majority of its
steel and oil products to countries outside Asia-Pacific that may explained by its unique geographical
location, it is the biggest trading country in South Asia.
China, Japan and the Republic of Korea are largely industrialized countries and need massive
amounts of oil products and steel to maintain their continuous development. Thus, a large trade among
these major countries can also be observed. For example, Japan exports many produced oil products to
China and the Republic of Korea, the Republic of Korea also exports large amounts of oil products to
China and Japan. China and Japan export vast quantities of steel to the Republic of Korea, the Republic
of Korea and Japan also export steel to China. Japan, Republic of Korea and China all export a
reasonable percentage of steel to India. In the future, with the development of ASEAN countries, the
demand of natural resources is also expected continuously increase. Only modest exports of oil products
and some steel are exported from these countries to LAC, mainly oil products from India and steel from
all these four countries.
3. Carrier strategy
Currently, supply of ship capacity greatly exceeds transport demand in the bulk shipping market. To
cope with the problem of overcapacity, the carriers adopt a number of strategies. One of them includes
employing even larger sized vessels, while another is increasing long COA contract. Another one is to
sign a long COA contract with steel corporations. As figure 18 and 19 show, compared to 2015, the
number of Valemax ships (400,000 DWT) transporting iron ore from Brazil increased by 27 percent. The
VLOC (200,000-300,000 DWT) and ULOC (300,000-400,000 DWT) also had a considerable increase by
27 percent and 11 percent respectively. However, the Capesize ship (80,000 - 200,000 DWT) decreased by
7 percent from 294 to 272.
Still from these two figures, it is observed that a sharp increase of Valemax class ships using
Chinese ports in 2016, and very few Valemax ships used Japanese ports and almost no Valemax ships
used Korean port that is very different with the year of 2015. This is because China has forbidden the
Valemax ship to call at Chinese ports since 2012, and the ban was lifted in the middle of 2015. As a result, a mass of Valemax ships in the market were brought by Chinese carriers like COSCO and China
0%
10%
20%
30%
40%
50%
60%
70%
80%
90%
100%
China Japan Korea India
China Japan Korea India Other Asia LAC Rest of World
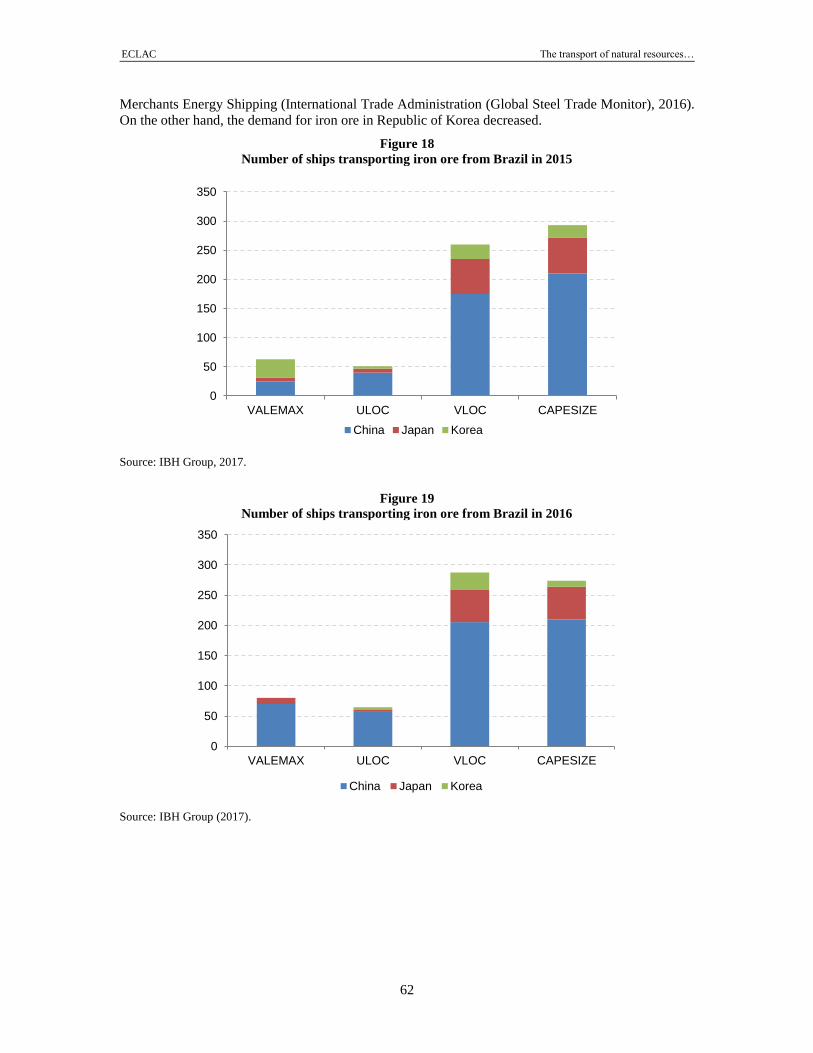
ECLAC The transport of natural resources…
62
Merchants Energy Shipping (International Trade Administration (Global Steel Trade Monitor), 2016).
On the other hand, the demand for iron ore in Republic of Korea decreased.
Figure 18
Number of ships transporting iron ore from Brazil in 2015
Source: IBH Group, 2017.
Figure 19
Number of ships transporting iron ore from Brazil in 2016
Source: IBH Group (2017).
0
50
100
150
200
250
300
350
VALEMAX ULOC VLOC CAPESIZE
China Japan Korea
0
50
100
150
200
250
300
350
VALEMAX ULOC VLOC CAPESIZE
China Japan Korea
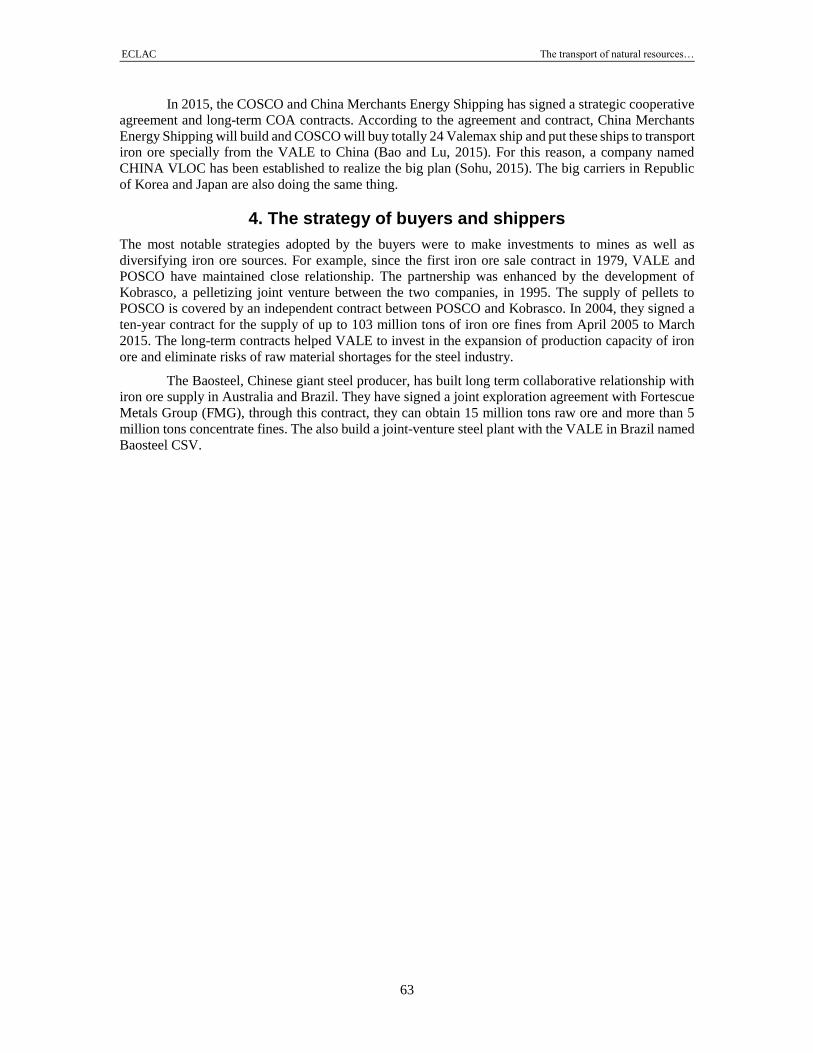
ECLAC The transport of natural resources…
63
In 2015, the COSCO and China Merchants Energy Shipping has signed a strategic cooperative
agreement and long-term COA contracts. According to the agreement and contract, China Merchants
Energy Shipping will build and COSCO will buy totally 24 Valemax ship and put these ships to transport
iron ore specially from the VALE to China (Bao and Lu, 2015). For this reason, a company named
CHINA VLOC has been established to realize the big plan (Sohu, 2015). The big carriers in Republic
of Korea and Japan are also doing the same thing.
4. The strategy of buyers and shippers
The most notable strategies adopted by the buyers were to make investments to mines as well as
diversifying iron ore sources. For example, since the first iron ore sale contract in 1979, VALE and
POSCO have maintained close relationship. The partnership was enhanced by the development of
Kobrasco, a pelletizing joint venture between the two companies, in 1995. The supply of pellets to
POSCO is covered by an independent contract between POSCO and Kobrasco. In 2004, they signed a
ten-year contract for the supply of up to 103 million tons of iron ore fines from April 2005 to March
2015. The long-term contracts helped VALE to invest in the expansion of production capacity of iron
ore and eliminate risks of raw material shortages for the steel industry.
The Baosteel, Chinese giant steel producer, has built long term collaborative relationship with
iron ore supply in Australia and Brazil. They have signed a joint exploration agreement with Fortescue
Metals Group (FMG), through this contract, they can obtain 15 million tons raw ore and more than 5
million tons concentrate fines. The also build a joint-venture steel plant with the VALE in Brazil named
Baosteel CSV.

ECLAC The transport of natural resources…
65
V. Best Practices for Transportation of Natural Resources from LAC to Asia-Pacific
As mentioned before, the shipper, carrier and customer are three main parties who function together and
determine the transportation process. They have different market power that is strongly related to the
changes between supply and demand. This section will illustrate the strategies adopted by the three
players to maximize their profit. These strategies, on the other hand, may promote the natural resources
transportation between LAC and Asia-Pacific.
A. Practice initiated by shipper
In the container transportation where the shippers and customers are small and scattered, thus the carrier
has strong barraging power and plays a crucial role in deciding the details of transportation process like
the size of vessel, route, and frequency and so on. On the other hand, the shippers in bulk shipping are
dominant as the resources are generally concentrated in the hand of a few shippers. For example, there
are three largest iron ore giants known as the “Big-3” - VALE, Rio Tinto and BHP Billiton, which
together contributed 39 per cent to the world production in 2014. Today, the iron ore production in
VALE of Brazil accounts for about 80 per cent of national iron ore production. It can be said that VALE
almost monopolized the Brazilian iron ore production market, becoming the dominator in Brazilian
mining industry.
As the shippers have the greatest impact on transportation process, they have the largest
potential to change the process. The deployment of Valemax class, the world’s largest cargo ships, with
capacity of up to 400,000 tons of iron ore, is a good example. Compared to Rio Tinto and BHP Billiton
whose mines are in Australia, the VALE in Brazil has a distance disadvantage to ship their iron ore to
Asia-Pacific Region. To overcome this disadvantage, the VALE has built Valemax class ships in a bid
to cut transport costs. Although the Valemax class ships seems to be a good attempt to facilitate the
trade of iron ore between LAC and Asia-Pacific, they were barred from entering the mainland China
since 2012 after authorities said the ships were a threat to safety in its ports. The true reason, though,
was widely believed to protect the interest of national carriers such as China Ocean Shipping Group
(COSCO). In January 2015, China removed the ban on VALE’s giant iron ore carriers, as speculated by
the media, due to the shift in the global iron ore trade from the shipper’s market to the buyer’s market.
Then China has regained pricing power it had lost in the previous decade over imports of iron ore. Now
there are totally seven terminals in four Chinese ports which can receive the Valemax class ships and
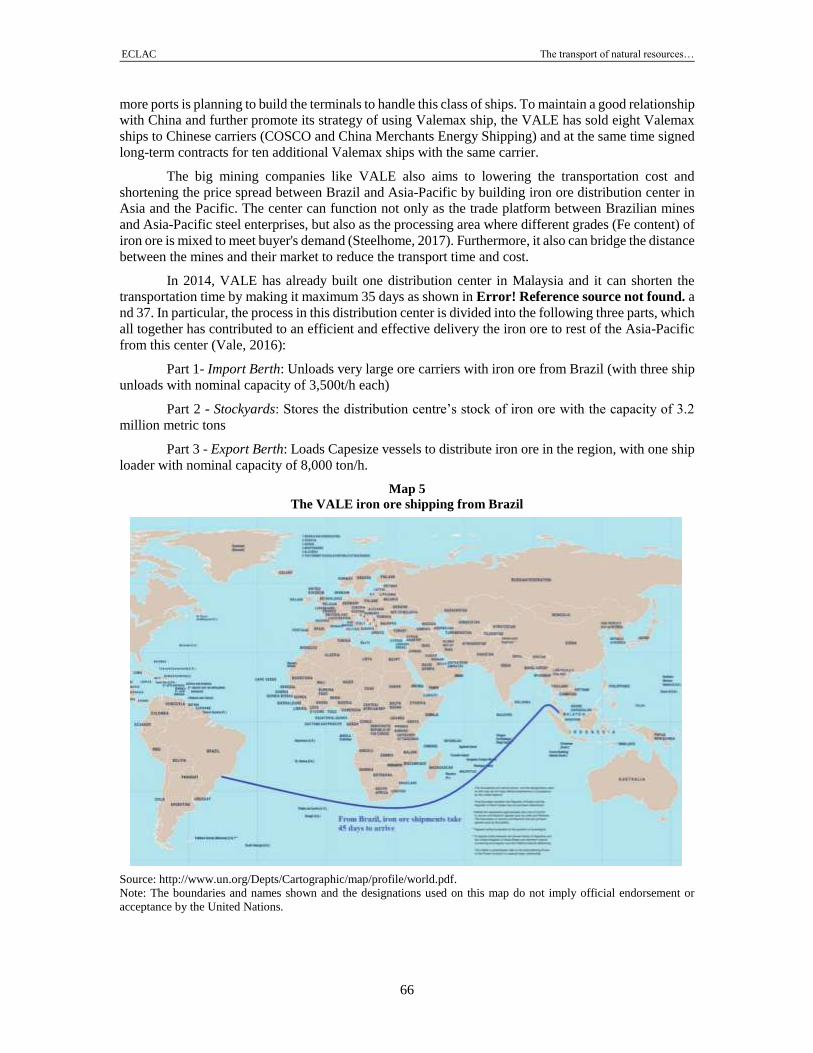
ECLAC The transport of natural resources…
66
more ports is planning to build the terminals to handle this class of ships. To maintain a good relationship
with China and further promote its strategy of using Valemax ship, the VALE has sold eight Valemax
ships to Chinese carriers (COSCO and China Merchants Energy Shipping) and at the same time signed
long-term contracts for ten additional Valemax ships with the same carrier.
The big mining companies like VALE also aims to lowering the transportation cost and
shortening the price spread between Brazil and Asia-Pacific by building iron ore distribution center in
Asia and the Pacific. The center can function not only as the trade platform between Brazilian mines
and Asia-Pacific steel enterprises, but also as the processing area where different grades (Fe content) of
iron ore is mixed to meet buyer's demand (Steelhome, 2017). Furthermore, it also can bridge the distance
between the mines and their market to reduce the transport time and cost.
In 2014, VALE has already built one distribution center in Malaysia and it can shorten the
transportation time by making it maximum 35 days as shown in Error! Reference source not found. a
nd 37. In particular, the process in this distribution center is divided into the following three parts, which
all together has contributed to an efficient and effective delivery the iron ore to rest of the Asia-Pacific
from this center (Vale, 2016):
Part 1- Import Berth: Unloads very large ore carriers with iron ore from Brazil (with three ship
unloads with nominal capacity of 3,500t/h each)
Part 2 - Stockyards: Stores the distribution centre’s stock of iron ore with the capacity of 3.2
million metric tons
Part 3 - Export Berth: Loads Capesize vessels to distribute iron ore in the region, with one ship
loader with nominal capacity of 8,000 ton/h.
Map 5
The VALE iron ore shipping from Brazil
Source: http://www.un.org/Depts/Cartographic/map/profile/world.pdf.
Note: The boundaries and names shown and the designations used on this map do not imply official endorsement or
acceptance by the United Nations.
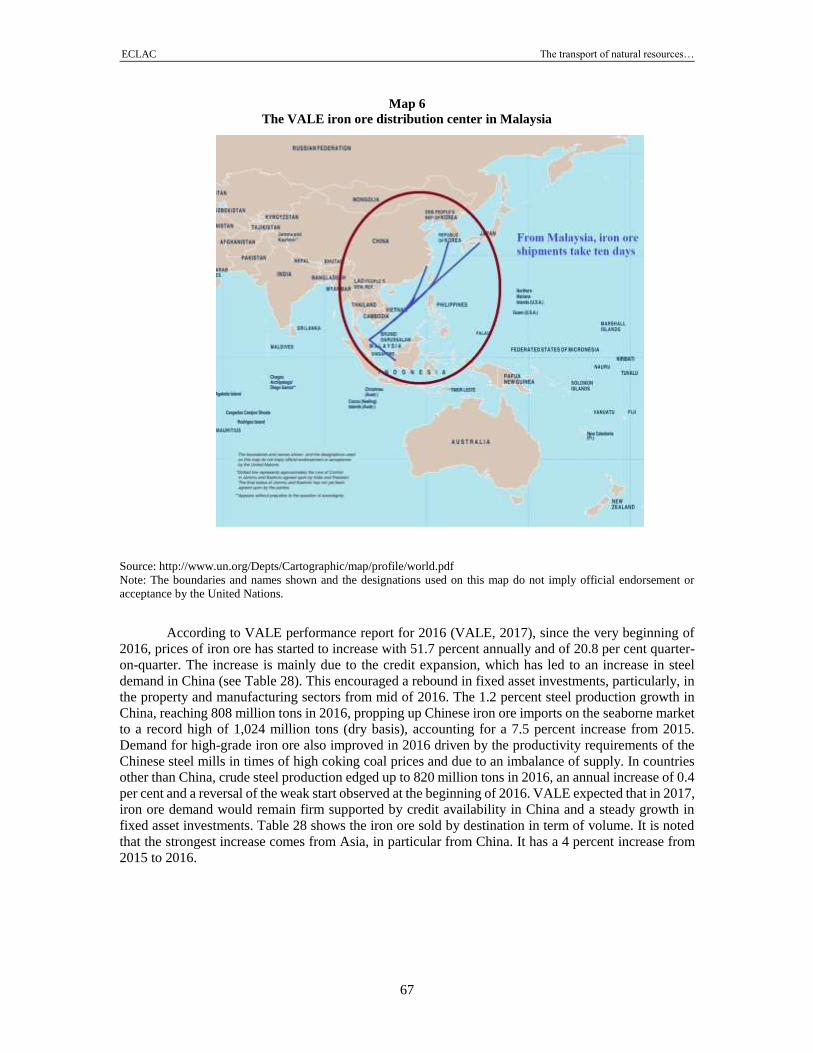
ECLAC The transport of natural resources…
67
Map 6
The VALE iron ore distribution center in Malaysia
Source: http://www.un.org/Depts/Cartographic/map/profile/world.pdf
Note: The boundaries and names shown and the designations used on this map do not imply official endorsement or
acceptance by the United Nations.
According to VALE performance report for 2016 (VALE, 2017), since the very beginning of
2016, prices of iron ore has started to increase with 51.7 percent annually and of 20.8 per cent quarter-
on-quarter. The increase is mainly due to the credit expansion, which has led to an increase in steel
demand in China (see Table 28). This encouraged a rebound in fixed asset investments, particularly, in
the property and manufacturing sectors from mid of 2016. The 1.2 percent steel production growth in
China, reaching 808 million tons in 2016, propping up Chinese iron ore imports on the seaborne market
to a record high of 1,024 million tons (dry basis), accounting for a 7.5 percent increase from 2015.
Demand for high-grade iron ore also improved in 2016 driven by the productivity requirements of the
Chinese steel mills in times of high coking coal prices and due to an imbalance of supply. In countries
other than China, crude steel production edged up to 820 million tons in 2016, an annual increase of 0.4
per cent and a reversal of the weak start observed at the beginning of 2016. VALE expected that in 2017,
iron ore demand would remain firm supported by credit availability in China and a steady growth in
fixed asset investments. Table 28 shows the iron ore sold by destination in term of volume. It is noted
that the strongest increase comes from Asia, in particular from China. It has a 4 percent increase from
2015 to 2016.
ECLAC The transport of natural resources…
68
Table 28
Volume sold by destination: Iron ore and pellets
Destinations 2016 Percentage 2015 Percentage Change in
Percentage
Americas 36 367 10.7 41 187 12.3 -1.6
Brazil 28 890 8.5 35 665 10.6 -2.1
Others 7 477 2.2 5 522 1.6 +0.6
Asia-Pacific 242 244 71.0 229 268 68.4 +2.6
China 196 348 57.6 179 470 53.6 +4.0
Japan 28 188 8.3 29 499 8.8 -0.5
Others 17 708 5.2 20 299 6.1 -0.9
Europe 49 421 14.5 53 385 15.9 -1.4
Germany 20 543 6.0 21 991 6.6 -0.6
France 609 1.9 5 814 1.7 +0.2
Others 22 269 6.5 25 580 7.6 -1.1
Middle East 8 999 2.6 9 745 2.9 -0.3
Rest of the world 3 996 0.2 1 360 0.4 +0.8.
Total 241 027 100 334 946 100
Source: VALE, 2017.
With more Valemax ships purchased by Chinese carriers and increase of demand of China,
VALE is now negotiating with the port of Qingdao (China) on building another distribution center
(VALE, 2017).
In the crude oil international trade market, the production of crude oil is controlled by the
OPEC, while the crude oil trade is actually dominated by the oil majors. Oil major is a name used to
describe the world's seven or eight largest publicly owned oil companies, namely BP, Chevron,
ExxonMobil Corporation, Shell, Total and Phillips. Recently, the import volume of crude oil in Asia-
Pacific region increases dramatically.
It is observed that except US, the other four are all Asian-Pacific countries. With the rise these
countries, the new emerging state-owned oil companies such as CNPC (China), Gazprom Neft (Russia),
National Iranian Oil Company (Iran), Petrobras (Brazil), PDVSA (Venezuela), Petronas (Malaysia) and
Saudi Aramco (Saudi Arabia) are also becoming more and more powerful in the oil trade market. In the
safety operation aspect, oil majors control the carriers via the TMSA (Tanker Management and Self-
Assessment) and SIRE (Ship Inspection Report) program. Meanwhile, the state-owned oil companies
mentioned above are also eager to manipulate the carriers via signing the long-term COA with them.
The VLCC has also been broadly employed in trading oil from LAC to Asia-Pacific. But it is
worth noting that the poor facilities of ports at LAC hinder the trend. A report from ECLAC (Economic
Commission for Latin America and the Caribbean) suggested that east and west coast of south
America’s port infrastructure, including transportation, power supply, communication level, freshwater
supply and sanitary, cannot meet the future demand. ECLAC encourage more investments in mentioned
area to ensure the ports’ competitive capability and logistics service level (MOC, 2011). Although
Venezuela has invested a vast money in building oil infrastructures in not only Venezuela but also
several Caribbean countries in recent year, the handling capacity in this region is still limited (Maritime
Executive, 2014). As a major oil terminal in Venezuela, Puerto José (Port Jose) oil terminal was reported
to be in poor condition in recent few years. The crude oil spill accident occurred in March of 2017 due
to the oil pipe leakage (Maritimeherald, 2017). The damage occurred in the pipeline connecting the Jose
oil terminal and a single buoy mooring facility, which was used for loading of large crude carriers. The
Brazil went a step ahead than Venezuela, absorbed foreign capital to improve the crude oil transshipment
facility in 2015. A company named Oiltanking acquired 20 per cent of Açu Port’s Oil Terminal, the
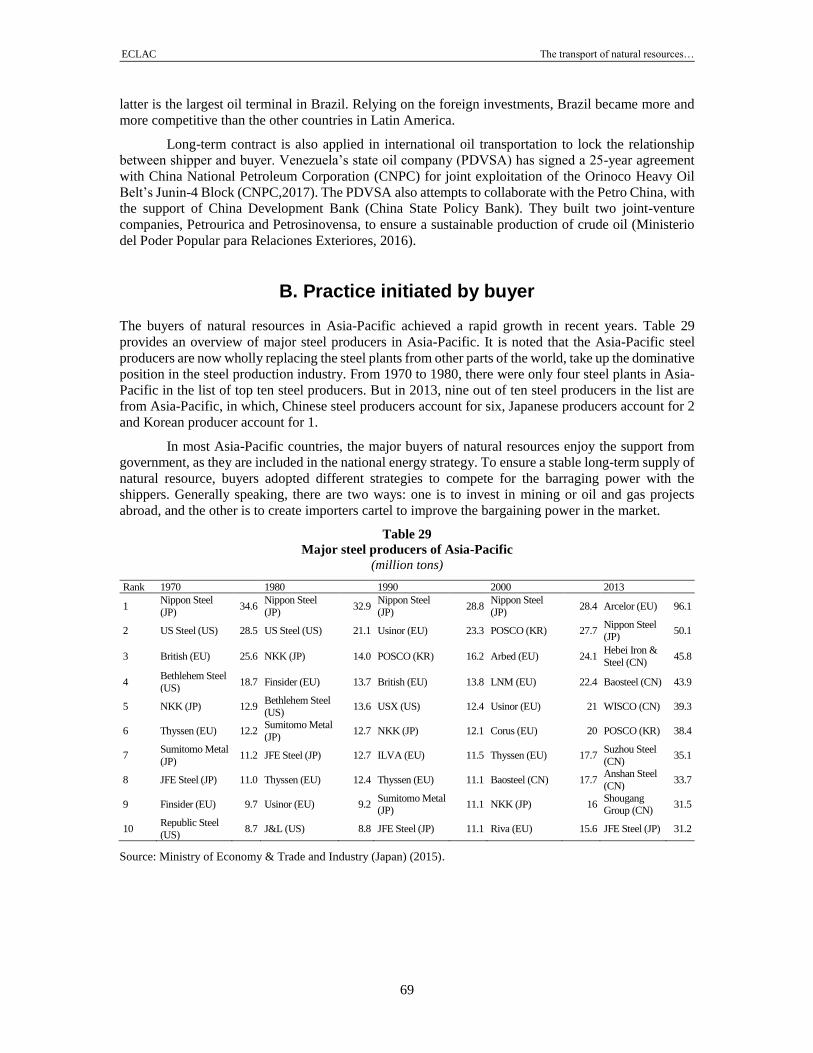
ECLAC The transport of natural resources…
69
latter is the largest oil terminal in Brazil. Relying on the foreign investments, Brazil became more and
more competitive than the other countries in Latin America.
Long-term contract is also applied in international oil transportation to lock the relationship
between shipper and buyer. Venezuela’s state oil company (PDVSA) has signed a 25-year agreement
with China National Petroleum Corporation (CNPC) for joint exploitation of the Orinoco Heavy Oil
Belt’s Junin-4 Block (CNPC,2017). The PDVSA also attempts to collaborate with the Petro China, with
the support of China Development Bank (China State Policy Bank). They built two joint-venture
companies, Petrourica and Petrosinovensa, to ensure a sustainable production of crude oil (Ministerio
del Poder Popular para Relaciones Exteriores, 2016).
B. Practice initiated by buyer
The buyers of natural resources in Asia-Pacific achieved a rapid growth in recent years. Table 29
provides an overview of major steel producers in Asia-Pacific. It is noted that the Asia-Pacific steel
producers are now wholly replacing the steel plants from other parts of the world, take up the dominative
position in the steel production industry. From 1970 to 1980, there were only four steel plants in Asia-
Pacific in the list of top ten steel producers. But in 2013, nine out of ten steel producers in the list are
from Asia-Pacific, in which, Chinese steel producers account for six, Japanese producers account for 2
and Korean producer account for 1.
In most Asia-Pacific countries, the major buyers of natural resources enjoy the support from
government, as they are included in the national energy strategy. To ensure a stable long-term supply of
natural resource, buyers adopted different strategies to compete for the barraging power with the
shippers. Generally speaking, there are two ways: one is to invest in mining or oil and gas projects
abroad, and the other is to create importers cartel to improve the bargaining power in the market.
Table 29
Major steel producers of Asia-Pacific
(million tons)
Rank 1970 1980 1990 2000 2013
1 Nippon Steel
(JP) 34.6
Nippon Steel
(JP) 32.9
Nippon Steel
(JP) 28.8
Nippon Steel
(JP) 28.4 Arcelor (EU) 96.1
2 US Steel (US) 28.5 US Steel (US) 21.1 Usinor (EU) 23.3 POSCO (KR) 27.7 Nippon Steel (JP)
50.1
3 British (EU) 25.6 NKK (JP) 14.0 POSCO (KR) 16.2 Arbed (EU) 24.1 Hebei Iron &
Steel (CN) 45.8
4 Bethlehem Steel
(US) 18.7 Finsider (EU) 13.7 British (EU) 13.8 LNM (EU) 22.4 Baosteel (CN) 43.9
5 NKK (JP) 12.9 Bethlehem Steel (US)
13.6 USX (US) 12.4 Usinor (EU) 21 WISCO (CN) 39.3
6 Thyssen (EU) 12.2 Sumitomo Metal
(JP) 12.7 NKK (JP) 12.1 Corus (EU) 20 POSCO (KR) 38.4
7 Sumitomo Metal
(JP) 11.2 JFE Steel (JP) 12.7 ILVA (EU) 11.5 Thyssen (EU) 17.7
Suzhou Steel
(CN) 35.1
8 JFE Steel (JP) 11.0 Thyssen (EU) 12.4 Thyssen (EU) 11.1 Baosteel (CN) 17.7 Anshan Steel
(CN) 33.7
9 Finsider (EU) 9.7 Usinor (EU) 9.2 Sumitomo Metal (JP)
11.1 NKK (JP) 16 Shougang Group (CN)
31.5
10 Republic Steel
(US) 8.7 J&L (US) 8.8 JFE Steel (JP) 11.1 Riva (EU) 15.6 JFE Steel (JP) 31.2
Source: Ministry of Economy & Trade and Industry (Japan) (2015).
ECLAC The transport of natural resources…
70
Japanese trading companies and industrial groups invest in mining and petroleum projects run
by international groups with the active support from the Japanese government through the Japan Bank
for International Cooperation (JBIC). The Japan Bank for International Cooperation (JBIC) signed the
USD$150 million loan agreement with VALE in October 2004 to improve the rail and port facilities
owned and operated by the company in Minas Gerais in southern Brazil. It also signed a loan agreement
with Aluminio Brasileiro (Albras), a subsidiary of VALE, in August 2005 to secure a stable supply of
aluminum ingot to Japan (Vale, 2016). As the company aimed to increase iron ore production at its mine
complex in the state, the proceeds of the loan were used to further develop the region's transport
infrastructure in order to increase the efficiency and capacity for the transport of iron ore (ECA
Financing: A review of export financing deals and export credit agency developments).
Different from Japan, the government of the Republic of Korea has set up two state run
corporations; the Korea Resource Corporation, KORES, for minerals, and the Korean National Oil
Corporation KNOC for oil and LNG. The two corporations take a leading role in choosing projects
though they do work in partnership with large Korean private sector groups. After the election in 2008,
President Lee Myung-bak put pressure on the public sector entities including the two corporations to
speed up investments in mining and petroleum projects (Armstrong et al., 2016).
In China, the government issued an Iron and Steel Industry Development Policy in 2005. The
Policy encourages steel firms to invest in iron ore projects overseas. This is assisted by the Chinese
state-owned bank system, which is to provide steel mills with loan financing on concessionary terms.
The policy also promotes coordination between Chinese steel firms, with the intention of improving the
industry’s bargaining position in annual benchmark price negotiations. This was delegated by China
Iron and Steel Association (CISA) (Armstrong et al., 2016). In the crude oil market, China National
Petroleum Corporation (CNPC) signed with the government of Costa Rica an agreement to build a
refinery in the country. This 25-year deal between CNPC and Recope (Refinadora Costarricense de
Petróleo) was intended to have a dual purpose. On the one hand, the joint venture is to help modernize
and expand the Moin refinery, increasing its annual oil refining capability to 3 million tons from the
current 1.2 million tons and contributing to product quality and pollution reduction. And secondly, both
companies were about to launch feasibility studies on a new refinery with a proposed annual crude
processing capability of 10 million tons (Iturre and Mendes, 2010). Unfortunately, for some reason, this
project ended in 2016 after being paralyzed for four years (CentralAmericaData, 2016).
Petrobras signed an agreement with the China Development Bank in 2009 to receive USD$10
billion over a ten-year period, while it committed to supply UNIPEC Asia (a subsidiary company of
Sinopec) with 150,000 barrels the first year and 200,000 barrels per year after that during the same period.
These strategies enhance and facilitate trade due to several reasons. Firstly, investments in
mining, oil and gas projects can help to improve the transportation infrastructure, for example the rail
between the mine and the port as well as the port facility among other. Secondly, the importer cartel
could build up on the demand to realize better economy of scale in transportation by using big ships or
improving the efficiency of the port. However, in practice, these strategies were rarely successful. For
example, the Republic of Korea made a few acquisitions, some of which did not live up to expectations.
The attempt of China Iron & Steel Association (CISA) to improve the industry’s bargaining position in
annual benchmark price negotiations, mentioned before, failed after two years due to the quick changes
of demand and supply patterns and the increase in the price of iron ore fourfold since the announcement
in 2005. These strategies can only be valid when the demand and supply is in a relative balance.
As another common strategy, many large resource buyers including oil corporations and steel
producers have invested in seaports to own their dedicated terminals. These ports and terminals are only
used for their own cargo. For example, Baosteel group, the biggest steel manufacturer in China, built
their own port at Majishan, located near the estuary of the Yangtze River. The port, operated by Baosteel
itself, has a 300,000-metric-ton capacity unloading berth and two loading berths with capacities of
10,000 and 50,000 metric tons, respectively. Majishan is 74 nautical miles from Baosteel's other major
unloading port at Beilun, Ningbo port and only 60 nautical miles from Shanghai itself. The terminal
offers significant cash savings compared to Beilun port of Ningbo, which can handle vessels only up to
ECLAC The transport of natural resources…
71
150,000 tons. The company intends to consume internally all the ore arriving at Majishan. The
throughput of Baosteel Majishan Port reaches 62 million tons in 2013. The buyers also purchase the
share of some public ports or negotiate with big ports for a long-term agreement on port fee. Soon after
Baosteel joint invested Guangdong Iron & Steel Group Corporation, they bought 8 percent shares of
Zhanjiang Port (Group) Co. Ltd, located close to their plant. By integrating their production with the
ports, the buyers can ensure the smooth and stability of their supply. As the largest oil tanker charterer
and buyer in the world, Sinopec also invested in nine oil terminals in China to receive the imported
crude oil, including Caofeidian, Tianjin, Huangdao (Qingdao), Rizhao, Daxie (Ningbo), Cezi
(Zhoushan), Maoming, Weizhou (Beihai), and Qinglanshan (Fujian). They plan to invest a new terminal
in Dongjiakou at Qingdao.
C. Practice initiated by carrier
In the international iron ore market, it is well recognized in both industry and academia that the carrier
has the weakest barraging power. The price is determined by annual negotiation or long-term contracts
between the shipper (miner) and buyer (steel plant). Thus, the carrier either goes over to the shipper or
aligns with the buyers.
In Japan, the carriers traditionally had deep collaboration with the steel manufacturers. When
the bulk ship is under construction, in many cases, it is under a cargo guarantee from some steel
manufacturers. For example, the world’s largest iron ore carrier third-generation Brazil Maru (327,180
MT DWT) was launched in 2007 and when under construction, it had already won a long-term contract
with Nippon Steel Corporation to transport Brazilian iron ore to Japan. Nippon Yusen K.K. has
concluded a 20-year contract with VALE of Brazil to transport iron ore from Brazil to China. The deal
represents the major Japanese shipping firm's first long- term contract with a LAC natural resource
company. Starting in 2011, Nippon Yusen annually transports about 1.3 million tons of Brazilian iron
ore to China by using a 300,000-ton carrier shuttle being built in China (Nippon Yusen Clinches 20-Yr
Shipping Deal with Brazil Iron Ore Firm).
Currently, the expanded mining capacity is irreversible, but demand for iron ore is slowing
down in most countries. The shipper has more motivations to sign freight contracts with national carriers
to get a head start in seizing market share, locking in sales for the expanded production. The VALE in
2015 struck 25-year freight contracts with COSCO and China Merchants Energy Shipping, both state-
owned, to ship iron ore to China. Under the deal, the COSCO buys four Valemax ships from the VALE
and builds ten more mega ships specially transport iron ore for the VALE. They agreed to found a joint-
venture named Chinese Mining Company to operate the ships.
Similar as the iron ore market, the international crude oil market is also dominated by few major
international oil corporations which are called oil majors. Therefore, the bargaining power of the crude
oil carrier is also weak. To survive in the market, the carriers have to take different strategies to cater to
these oil majors. The common strategies include signing a long contract (contract of affreightment),
providing customization or value-added service (for example, special freighter) and so on.
However, unlike the iron ore market, because the crude oil is regarded as important strategic
resource of a country, the transportation of crude oil is often included in a nation’s strategic development
plan thus is sometimes affected by the policy. Information available publicly shows that in 2006 the
proportion of Japanese oil shipped by national tankers accounted for 80-90 per cent, and United State
accounted for 70 per cent, while the proportion of China was much lower than this. Until 2010, only about
38 per cent of crude oil imported by sea was carried by Chinese own oil tanker fleet. In order to protect
the country's crude oil security, China, in conjunction with major oil producers and oil tanker companies,
started the policy "Chinese ships for Chinese oil". Chinese oil transportation enterprises should also
strengthen strategic alignment with oil tanker transportation companies, and promote the establishment of
a market balance mechanism by signing long-term COA with shippers. Due to the Chinese oil transport
strategy mentioned in the "Eleventh Five-Year", COSCO Shipping acquired Dalian Ocean Shipping
ECLAC The transport of natural resources…
72
Company and became a professional oil and gas transportation company with 39 VLCCs. Besides,
CNOOC, China Merchants Energy Shipping and Nanjing Tanker Corporation each ordered 10 VLCCs,
totally 30 VLCCs (about 16 million DWT). They will be put into operation by 2020. Sinopec, invested the
world largest VLCC fleet operator, China Merchants Shipping Company (CMES), to ensure its oil
transportation sustainability. According the Annual Report of China Merchants Shipping Company,
Sinopec holding the 20 per cent of shares, the second largest shareholders. Especially in 2012, CMES
directed additional from Sinopec collect 1.6 billion RMB to order 10 VLCCs. In addition, the order was
supported by the long term COA. Now, CMES have 39 VLCCs and hold 14 on the order book.
In India, the State-owned shipping company, SCI, has been playing a crucial role in oil
transportation since it is the biggest carrier in India and operates approximately one-third of the Indian
shipping tonnage. More importantly, SCI is also the only Indian shipping carrier providing liquid bulk
services (SCI, 2016). The two oil giants in India, IOC and Reliance, are both SCI’s major clients. In
particular, SCI has a close cooperative relationship with IOC and has a long term COA with IOC, which
ensures continued and uninterrupted crude oil supply for IOC and further boost India’s energy security.
In 2015, it was reported that IOC took VLCCs on 2-year time charter from SCI which can help IOC
reduce the increased transportation cost from spot voyages. This long-term and stable cooperation
between shipper and carrier will benefit India’s oil transportation.
On the other hand, the small-fleeted ship owners formed the tanker pools aiming to reduce cost
by consolidating assets and commercial operation, streamlining chartering function, negotiating with
bunkers and so on. Manager of tank pool generally have good reputation in the market. They usually
maintain a good relationship with the giant buyer, shipper and charterer in the market. By joining a
tanker pool, small-fleeted ship owners were also afforded participation in exclusive chartering
opportunities, such as coveted COA with large oil companies that were traditionally covered by larger
competitors. However, this strategy seemed to be not successful because the market share of the tanker
pool is low in the market. In the top 30 owners and operators of tanker list, most are occupied by the
giant tanker group or national owned fleet (Hin Leong, 2016).
It is also noted that the change of backhaul cargo can reduce the total transportation cost of
carrier thus also affect the choice of shipper. For example, POSCO imported more iron ore from South
Africa because the ship to South Africa have higher chance to find return cargo. Some bulk ships (less
than 18,000 DWT) have chances to find coal from Australia to India or to Europe when they sail to
Brazil to carry iron ore to Asia-Pacific. With the return cargoes, the transportation cost can be saved up
to 20 per cent. However, these chances are now still rare in practice.
D. Summary
It can be ascertained that saving on transportation cost is the common interests of shipper, carriers and
buyers. However, they all have their own reasons behind this. Shippers are concerned with the
competition against its rivals in cargo price, carriers want to make the maximum usage of their ships,
and buyers and the nations behind them expect a stable supply of natural resources. The shipper is the
most influential among the three parties. The buyer also has a very strong market power. The carrier
generally is the weakest part in the market. It can be noted that the bargaining power are different in
different natural resources market and it may shift between the shipper and buyer when the relation of
demand and supply changes in the market.
In the bulk cargo sector, shipper have stronger bargaining power than the buyer does. Thus, the
carrier always willing to sign a long-term contract with the shipper to maintain the sustainability of
transport demand. The buyer tries to extend its business to the upstream of value chain throughput
investment to the mines and joint venture with the mining companies. They also cooperate with each
other to increase the bargaining power. In addition, this cooperation gets support from the national
governments. To cope with the increasing power of buyer with the national government behind and
compete with its competitors, the shipper intends to build strategic cooperation relations with buyer.
ECLAC The transport of natural resources…
73
In contrast, in the crude oil industry buyers has stronger bargaining power than shippers have.
Thus, shippers always expect to extend its influence on the downstream of the value chain. Thus, they
welcome the buyers to invest the oil field and refinery. They sign the long-term COA with carrier and
sometimes invest in the carrier to control the transportation. They also help to build the transportation
infrastructure like terminals, shore tanker and pipelines.
Carrier has the weakest barraging power in the market. Thus, they always seek for cooperation
with either the shipper or the buyer to guarantee their benefit. The cooperation is realized by signing
long-term transportation contract (COA) with reasonable price.
The shipper, carrier and buyer to improve the transportation process in order to improve their
competitiveness in the market adopt different specific strategies. For example, shipper promotes the
deployment of mega ship, builds the distribution centers in the destination port; buyer invests in the
mine or oil filed and ally together to strengthen the bargaining power, they also invested the ports or
sign long-term contract with public ports to ensure the efficiency of their cargo supply; carrier seeks for
long term collaboration from either shipper or buyer. With the volatile relationship of demand and
supply in the market, the strategies adopted by the three parties produce a variety of effects.
Policy Suggestions and Implications on Transport
On the basis of the previous sections, this section will discuss the potential policy suggestions
and implications on transport to facilitate natural resources transportation between LAC and Asia-
Pacific region.
E. Strategic Level
According to OPEC, oil demand prospects in short and medium term will remain robust due to relatively
high global economic growth with Asia capturing more than 50% of the share in global growth. In the
long term, global energy demand is expected to increase by almost 50% in the period to 2040. Much of
this growth will continue to be concentrated in the developing countries in Asia as industrialization,
population growth and the unprecedented expansion of the middle class will propel the need for energy.
China and India are expected to maintain a steady economic development, although this may not be as
high as before. ASEAN countries, which represent an emerging market, are expected to achieve fast
economic development in the near future. Against this background, it can be predicted that the demand
for some natural resources in Asia-Pacific countries will show steady increase.
Some Asian natural resources importers, for example, oil corporations such as Sinopec and
CNOOC are becoming more and more influential in this market. Currently, the Chinese oil corporations
are the largest importers of crude oil from Venezuela. In the LAC side, the biggest crude oil producer
and exporter, Venezuela, has nationalized its oil field gradually in recent years. The crude oil export of
Venezuela becomes more and more relevant to its diplomatic relations. It is expected that Latin America
will continue to supply crude oil to India at growing rates as well driven by the increasing population
and consumption as well as the high economic growth rate.
However, there are numerous external challenges that may affect the transportation industry,
especially transportation of crude oil and LPG. Government regulation and intervention, volatile fuel
prices, sustainability issues, including efficiency improvements and energy conservation measures, oil
substitution through gas, biofuels and renewables present potentially negative implications for the
transportation industry and its customers.
The situation with iron ore is different from the crude oil. The demand of iron ore in Asia will
probably decrease gradually because China, the biggest importer, has already completed its
industrialization process. With the decrease of demand for iron ore in Asia-Pacific side, the bargaining power of iron ore will shift to the buyer side. Consequently, the shippers in LAC will have more
motivation to take the initiative to facilitate the iron ore trade to Asia-Pacific. Understanding these
ECLAC The transport of natural resources…
74
macroeconomic situations, we can propose the following suggestions on the strategic level for the
relevant stakeholders:
Inter-government agreements and strategic cooperative relations. Governments play a vital role
in facilitating natural resources trade between countries in LAC and Asia-Pacific region. For example,
the setup of bilateral or regional trade agreements can effectively facilitate the trade of natural resources.
Inter-government strategic cooperative relations can also be influential. It can promote a number of
long-term contracts between the buyers in Asia-Pacific and the shippers in LAC. These long contracts
on one hand can guarantee a stable supply for the buyers in Asia-Pacific and on the other hand can help
the shippers in LAC to cope with their disadvantage of long distance transportation. The involvement
of government in these business contracts can ensure the enforcement of the obligations under these
contracts with certain legal system. The bilateral or regional trade agreements and inter-government
strategic cooperative relations will give the buyers in Asia-Pacific region more chances to invest the
upstream infrastructures in LAC. The businesses in LAC can benefit from the investments by improving
their infrastructures.
Free Trade Zone (FTZ). It is noted that most of the natural resources are processed in one Asia-
Pacific country and then further exported to other countries and/or regions. The establishment of Free
Trade Zones (FTZ) can not only provide a more flexible trade transaction platform for both shipper and
buyer in both regions, but also a processing area where different grades (Fe content) of iron ore/oil
product is mixed or processed. These processed products can be traded from the FTZ to the end
customers in other regions without entering any countries. In this way, transport costs can be reduced
and the customer clearance can be simplified.
Potential linkages of value-added chains between both regions. It is important to take part in
the cooperation along the entire value-added chain relative with natural resources for Asia-Pacific and
LAC. Asia-Pacific has advantages in capital, technology, and labor force, which are pivotal for the
development of the mining industry in Latin America, and achieving the reciprocal development for
both regions. It is possible for Asian capitals to invest on metal mines, oil and gas fields, refineries,
shipping companies, and transportation infrastructures in Latin America. This will largely decrease the
costs spent on the value-added linkages if these sectors are integrated or synergized. Of course, the
resources from Latin America can help Asian manufacturers obtain more materials. Therefore, it is
advisable to encourage the capitals from these two regions to invest on the relevant sectors mutually.
For instance, to encourage Brazilian aircraft manufacturers to invest in Asia-Pacific, or to encourage
Chinese steel maker to invest on Latin American iron ore mines.
Geographic agglomeration of bigger refineries/steel plant: The geographic agglomeration of
giant refineries and steel plants in certain region can create a huge demand in this region. With these
demand, the local government is motivated to develop the infrastructure to support the further
development of the industry, for example terminal which is capable to accommodate Valemax ship and
thick crude oil from LAC.
National Strategy. The launch of the One Belt, One Road (OBOR) Initiative by China in 2015,
will have a potential positive influence on the increase of trade between Asia-Pacific and LAC countries.
The effect of OBOR will lead to a mass of infrastructure construction in Asia-Pacific region which will
create more demand for natural resources. For instance, Indonesia, one of major countries along the
OBOR route, has a national strategic development plan which includes the construction of 24 seaports,
15 airports, 18 economic zones, and also railway routes extending almost 10 thousand kilometers (Li et
al., 2015). These projects will be realized with the support of OBOR initiative. However, it is worth
noting that the current domestic production volume of steel, cements, and electrolytic aluminum of
Indonesia only reached seven million tones, six million tons, and 250 thousand tones, respectively,
which is far from being sufficient to meet the construction demand. This gap may be filled by the natural
resources imported from LAC in the future if good practices can be adopted.
Currently, approximately, 30 percent of China’s trading volume is generated inside free-trade
zones and most of its trading partners in the free-trade zones are countries in Asia-Pacific region. The
ECLAC The transport of natural resources…
75
OBOR initiative also aims to promote the free-trade zone/bilateral trade agreement between countries
in Asia-Pacific, the trading tariff among countries in this region can be significantly reduced if the free-
trade zones/trade agreement, for example, China-ASEAN Free Trade Agreement (China-ASEAN FTA),
China-Columbia FTA (under consideration), China-Sri Lanka FTA (under negotiation), and China-
India FTA (under consideration), can be built successfully (Li et al., 2015). This also will provide great
chance for LAC to export more natural resource to Asia-Pacific region.
All in all, the launch of the OBOR initiative will mostly trigger an increase of natural resources
import from LAC to Asia-Pacific. It is very important for LAC countries to develop strategic to seize
the opportunities.
Oil pipeline connecting the Pacific. As a complement to maritime petroleum transportation, the
land-based pipeline network is of great importance for oil transportation in Latin America. A potential
new oil pipeline, which could bypass the Panama Canal, would substantially facilitate the crude oil
transport from Colombia and Venezuela to East Asia and Southeast Asia. The eastern part of this new
route can rely on the existing Colombian domestic Caño Limón–Coveñas pipeline and extend a branch
at the border city Tibú into Venezuela to connect its oil-rich Maracaibo Basin, whereas the western part
can be laid down from Coveñas, the biggest Colombian oil loading port, along the Caribbean coast at
first, then across the Atrato valley and end at the Pacific coast. This new pipeline would be about 400
km, but a thick tropical jungle is the main obstacle to this project. If it is carried out, a large share of the
crude oil export from Venezuela and Colombia to East Asia and Southeast Asia can avoid the limitation
of the Panama Canal (however, Orinoco Belt, another major oil exporting region in Venezuela, cannot
be benefitted by this project). In 2011, Colombia and Venezuela planned to co-invest a 3000-km new
oil pipeline from Venezuelan Orinoco Belt to a Colombian Pacific port, but it was suspended in 2014
and it is unknown when it will be resumed. The new route proposed by this study would be much shorter
and, perhaps, more feasible (see Map 9). As a main Asia-Pacific oil importer from LAC, the buyer or
nations in Asia-Pacific region can consider providing capital and technology to this new project.
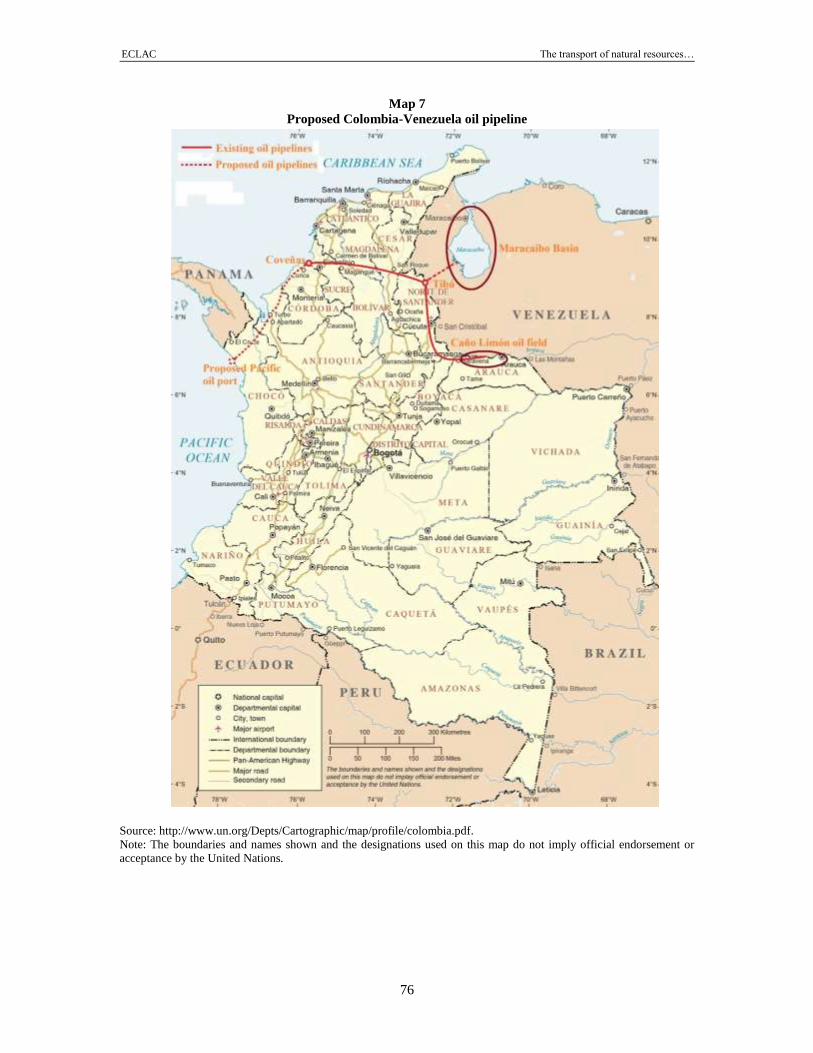
ECLAC The transport of natural resources…
76
Map 7
Proposed Colombia-Venezuela oil pipeline
Source: http://www.un.org/Depts/Cartographic/map/profile/colombia.pdf.
Note: The boundaries and names shown and the designations used on this map do not imply official endorsement or
acceptance by the United Nations.
ECLAC The transport of natural resources…
77
F. Operational Level
Unlike the strategic level, the operational-level improvements are fully in shipper, buyer and carrier’s
hands and entirely under their control. That makes them an excellent source of improvement in both
profitable and unprofitable periods.
Completion of the Panama Canal Expansion Program. The Panama Canal Expansion Program
was inaugurated in June 2016 (Canal de Panamá, 2016). This expansion not only allows for an increased
number of ships, but also allows larger cargo-carrying ships to pass the canal by increasing the width
and depth of the lanes and locks. This provides the carriers a new route option, which used to be subject
to the ship size limitation and congestion before. To pass through the Panama Canal, carrier can reduce
total delivery distance by half. The expansion may benefit the resource trade between countries like
China, Japan, Republic of Korea and Caribbean countries which are close to Panama Canal such as
Venezuela, Trinidad and Tobago, among others.
Establishment of offshore distribution centers. Establishment of distribution centers by LAC
big shippers in proper locations can benefit them not only for market risk control but also for fast intra-
Asia-Pacific transshipment.
Inter-regional value chain integration. LAC’s crude oil is difficult to transport by pipeline due
to its unique characteristics such as its high density. It could be one solution for this problem through
shifting the production and refining to LAC by joint-ventures between the buyers and shippers. Joint-
venture also can help the shipper to develop infrastructure in LAC so as to reduce the transportation cost
and transit time.
Vertical collaboration: Collaboration and partnership between firms is an increasingly common
approach for enterprises to explore and maintain shared competitive advantages (Mentzer, 1999). In
natural resource transportation, there are also two types of collaborations, which include vertical
collaboration between shippers and carriers, and horizontal collaboration between different carriers. It
is always beneficial to foster a long-term contract among shipper, buyer and carriers in order to reduce
the risk of market fluctuation. However, this long-term collaboration does not come easily under
complex market settings, rather the result of a joint effort of the shipper and carrier to attain mutual
benefit. It is necessary for every parts in the natural resources market to explore more vertical
collaborations and build a mutually beneficial and stable collaboration.
Optimization of shipping routes. Most bulk ships are empty when they sail to LAC to pick up
natural resources. Whether there is return cargo or not sometimes can be very influential factor for
carriers or buyers in selecting the supplier. The export of LAC resources is subject to the long distances
to Asia-Pacific region, if the giant carrier can optimize its shipping route by filling the ship in the
backhaul trip to LAC, the natural resources from LAC will become more competitive in the market. As
an example, the table below shows Australia’s coal exports by destinations. It is noted that India has
increasing demand for Australia coal. Geographically, India is located in the middle of the route from
East Asia to LAC thus could provide potential backhaul cargo for the carrier who transport iron ore
from LAC to East Asia. It will be a good opportunity for carrier to reduce the transport cost by seizing
suitable return cargoes, if its fleets and shipping routes can be well organized to take these cargoes
(Penney and Cronshaw, 2015).
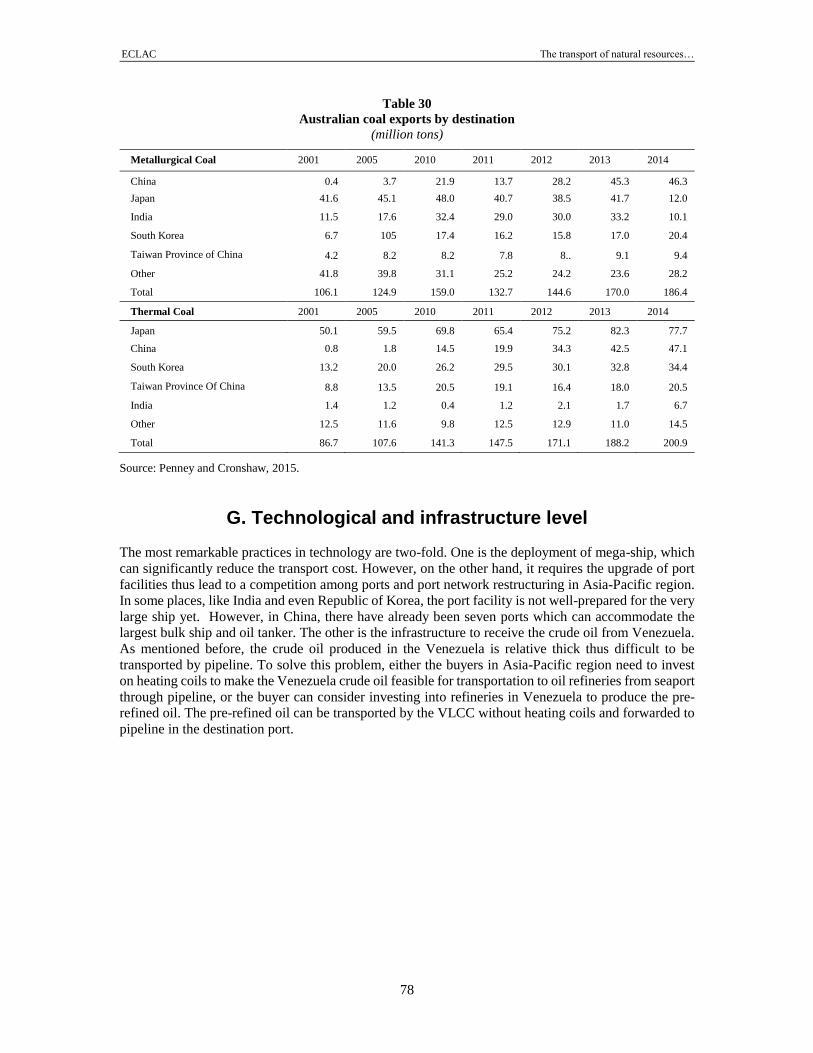
ECLAC The transport of natural resources…
78
Table 30
Australian coal exports by destination
(million tons)
Metallurgical Coal 2001 2005 2010 2011 2012 2013 2014
China 0.4 3.7 21.9 13.7 28.2 45.3 46.3
Japan 41.6 45.1 48.0 40.7 38.5 41.7 12.0
India 11.5 17.6 32.4 29.0 30.0 33.2 10.1
South Korea 6.7 105 17.4 16.2 15.8 17.0 20.4
Taiwan Province of China 4.2 8.2 8.2 7.8 8.. 9.1 9.4
Other 41.8 39.8 31.1 25.2 24.2 23.6 28.2
Total 106.1 124.9 159.0 132.7 144.6 170.0 186.4
Thermal Coal 2001 2005 2010 2011 2012 2013 2014
Japan 50.1 59.5 69.8 65.4 75.2 82.3 77.7
China 0.8 1.8 14.5 19.9 34.3 42.5 47.1
South Korea 13.2 20.0 26.2 29.5 30.1 32.8 34.4
Taiwan Province Of China 8.8 13.5 20.5 19.1 16.4 18.0 20.5
India 1.4 1.2 0.4 1.2 2.1 1.7 6.7
Other 12.5 11.6 9.8 12.5 12.9 11.0 14.5
Total 86.7 107.6 141.3 147.5 171.1 188.2 200.9
Source: Penney and Cronshaw, 2015.
G. Technological and infrastructure level
The most remarkable practices in technology are two-fold. One is the deployment of mega-ship, which
can significantly reduce the transport cost. However, on the other hand, it requires the upgrade of port
facilities thus lead to a competition among ports and port network restructuring in Asia-Pacific region.
In some places, like India and even Republic of Korea, the port facility is not well-prepared for the very
large ship yet. However, in China, there have already been seven ports which can accommodate the
largest bulk ship and oil tanker. The other is the infrastructure to receive the crude oil from Venezuela.
As mentioned before, the crude oil produced in the Venezuela is relative thick thus difficult to be
transported by pipeline. To solve this problem, either the buyers in Asia-Pacific region need to invest
on heating coils to make the Venezuela crude oil feasible for transportation to oil refineries from seaport
through pipeline, or the buyer can consider investing into refineries in Venezuela to produce the pre-
refined oil. The pre-refined oil can be transported by the VLCC without heating coils and forwarded to
pipeline in the destination port.
ECLAC The transport of natural resources…
79
Conclusions
The Asia-Pacific region has become a very important partner of Latin America and the Caribbean,
signaled by the trade annual growth rate of 20.5 percent average since 2000 between countries in both
regions. Most of this increased trade relations have been concentrated in only a few economies. On Asia
and the Pacific’s side, China, Japan, Republic of Korea, and India account for nearly 90 percent of Asia
and the Pacific’s total trade with LAC countries, of which half is carried out by China. As for Latin
American countries, Brazil, Mexico, Chile, and Argentina account for approximately 80 percent of the
region’s total trade with Asia and the Pacific. This increase in trade between these two regions has been
dominated by a commodity-for-manufacturing pattern, deepening what has been a characteristic of this
trade relationship since its early days despite profound structural changes taking place currently in both
regions. This pattern has translated into a high concentration of Latin American countries’ exports on a
small number of basic commodities such as iron ore, copper, soy, oil, sugar, paper pulp, and poultry,
most of which are exported as raw materials, without significant value added. On the other hand, Asia
and the Pacific exports a wide range of manufactured goods, including ships, cars, electronics,
equipment, parts and components, thus being situated within the higher value added nodes within the
global value chains.
Asia-Pacific, the most economic-active region in the world and a rising manufacturing belt, has
become heavily reliant in natural resources located in developing regions rich in natural resources such
as Latin America and the Caribbean. Consequently, LAC has become an important provider of such
resources, especially minerals (including mineral fuels), to Asia-Pacific. This mineral export supports
the trade balance in many Latin American countries, and as such, the performance of this sector directly
influences several LAC countries’ economic growth, in a newly framed dependency.
With the accelerating world industrialization, the volume of Asian crude steel production
increases yearly, as China, the Republic of Korea and India reported a significant growth in steel
production in the past ten years. China imports the most iron from both the world and LAC, whereas
India is the largest LAC crude oil importer in the Asia-Pacific region, mainly from Venezuela who
accounts for 4.51 percent of the total import volume. China also imports crude oil mostly from
Venezuela due to their good diplomatic relations. In this sense, China has invested massively in LAC
on natural resource development and infrastructure. Several of these loans are paid back partly, as is the
case of Venezuela, with crude oil, in a similar pattern as that taking place in the African continent to
secure a stable supply of critical minerals needed for China’s steady growth and development.
There are several reasons why the import share of LAC is low compared to the Middle East.
This is because crude oil from LAC is thicker, denser and has higher sulfide content. Most of the existing
ECLAC The transport of natural resources…
80
pipelines do not have specific facilities that include a warming-up system. The mining cost of LAC
crude oil is also not as low as the Middle East’s oil and the shipping distance is longer, not allowing
LAC’s crude oil to have a competitive advantage in the oil trade market. The most important crude oil
export country in LAC is Venezuela, which exports most of its crude oil to its neighboring countries
around Mexico Bay, because the transportation cost is low and after years, the transshipment system
specially designed for Venezuela crude oil has been well built in these countries, demonstrating the vital
link between infrastructure development and natural resources.
Government regulations have an important impact on the logistics of crude oil transportation.
After the oil leakage and explosion in Qingdao Port in 2013, the Government of China imposed tighter
restrictions on pipeline maintenance, capacity expansion and berth transshipment operation, impacting
on the transshipment volume of crude oil and the corresponding profits of the port in a short term. Just
as in many countries in LAC, the recent plunging oil prices, leading to an increase in oil production
capacity and a sharp increase of ship arrivals to the major Chinese oil ports has posed serious challenges.
In this sense, Qingdao Port cannot meet the abrupt increasing import demand leading to many ships
having to wait for a long time in the anchorage for unloading. Moreover, the outdated infrastructure at
the port, security issues caused by winter climate in Bohai Bay and scattered locations of refineries, all
lead to high logistics cost of crude oil.
In Asia Pacific, from seaport to the hinterland, water-to-water transshipment and train have
become the dominant modes for inland transport of natural resources. Natural resources transportation
requires large transportation capacity, which makes the land transportation difficult. Thus, most of the
steel factories or oil refineries are located at coastal area with easy access to seaports.
Oil demand prospects in short and medium term will remain robust and will continue to be
concentrated in the developing countries in Asia as industrialization, population growth and the
unprecedented expansion of the middle class will propel the need for energy. However, there are
numerous external challenges, mainly shaped by the geopolitics of natural resources that may affect the
transportation industry, especially transportation of crude oil and LPG. In these sense, volatile fuel
prices, sustainability issues including efficiency improvements and energy conservation measures, oil
substitution through gas, biofuels and renewables present potentially negative implications for the
transportation industry and its customers. The launch of the One Belt, One Road (OBOR) Initiative by
China in 2015, will have a potential positive influence on the increase of trade between Asia-Pacific and
LAC countries. The effect of OBOR will lead to mass infrastructure construction in Asia-Pacific region,
leading to a higher demand for natural resources. The OBOR initiative also aims to promote the free-
trade zone and bilateral trade agreements between countries in Asia-Pacific, reducing significantly
trading tariffs among countries within the region.
At the operational level, the completion of the Panama Canal Expansion Program, inaugurated
in June 2016, allows for an increased number of ships and larger cargo-carrying ships to pass the canal
by increasing the width and depth of the lanes and locks. This provides the carriers a new route option,
which used to be subject to the ship size limitation and congestion before. To pass through the Panama
Canal, carrier can reduce total delivery distance by half. The expansion may benefit the resource trade
between countries like China, Japan, Republic of Korea and Caribbean countries which are close to
Panama Canal such as Venezuela, Trinidad and Tobago and so on.
As most bulk ships are empty when they sail to LAC to pick up natural resources, shipping
routes should be optimize. The export of LAC resources is subject to the long distances to Asia-Pacific
region, if the giant carrier can optimize its shipping route by filling the ship in the backhaul trip to LAC,
the natural resources from LAC will become more competitive in the market. India, located in the middle
of the route from East Asia to LAC, could provide potential backhaul cargo for the carrier transporting
iron ore from LAC to East Asia, reducing transport costs by seizing suitable return cargoes
In a national scale, government regulation and intervention, as highlighted through the document, play an important role in the transport of natural resources, including inter-government
agreements and strategic cooperative relations. In these sense, Governments play a vital role in
ECLAC The transport of natural resources…
81
facilitating natural resources trade between countries in LAC and Asia-Pacific region, through the setup
of bilateral or regional trade agreements that can effectively facilitate the trade of natural resources.
It is important to take part in the co-operation in the entire natural resources global and regional
value-added chain between Asia-Pacific and LAC. Asia-Pacific has advantages in capital, technology,
and labor force, which are pivotal for development of the mining industry in LAC, and achieving the
reciprocal development for both regions. As such, currently Asian capitals, led by China, are investing
on metal mines, oil and gas fields, refineries, shipping companies, and transportation infrastructures in
Latin America. This will largely decrease the costs spent on the value-added linkages if these sectors
are integrated or synergized. In line with this, vertical and horizontal collaboration and partnership
between firms should be promoted to explore and maintain shared competitive advantages and reduce
the risk of market fluctuation.

ECLAC The transport of natural resources…
83
References
21st century business herald. 2015. Overcapacity in iron and steel industry in china: current situation and
countermeasure [online]. Available: http://finance.ifeng.com/a/20150318/13560714_0.shtml 2016].
Armstrong, m., d'arrigo, r., petter, c. & galli, a. 2016. How resource-poor countries in asia are securing stable
long-term reserves: comparing japan's and south korea's approaches. Resources policy, 47, 51-60.
Asian development bank; inter-american development bank; asian development bank institute.2012. Shaping
the future of the asia and the pacific-latin america and the caribbean relationship [online]. Available:
https://think-asia.org/handle/11540/165
Bao, z. & lu, x. 2015. Vale selling eight vloc to cosco and cm energy shipping [online]. Available:
http://companies.caixin.com/2015-05-20/100810773.html.
Baosteel. 2016. Baosteel [online]. Available: http://www.baosteel.com/group_en/.
Bp global 2015. Statistical review of world energy 2015.
Bp global 2016. Statistical review of world energy 2016.
Canal de panamá. 2016. Panama canal expansion [online]. Available: http://micanaldepanama.com/
expansion/.
Chongqing steel. 2016. Chongqing iron and steel company limited [online]. Available: http://www.cqgt.cn/.
Clarkson research 2017. Clarkson shipping database.
De desarrollo, b. I.-a. & de desarrollo, b. A. 2012. Shaping the future of the asia and the pacific—latin america
and the caribbean relationship. Manila, filipinas: banco interamericano de desarrollo, banco asiático
de desarrollo e instituto del banco asiático de desarrollo.
Egenhofer, c., schrefler, l., genoese, f., luchetta, g., mustilli, f., simonelli, f., colantoni, l., timini, j. &
wieczorkiewicz, j. 2013. The steel industry in the european union: composition and drivers of energy
prices and costs. Ceps special report.
Essar oil. 2016. Essar oil [online]. Available: http://www.essar.com/section_level1.aspx?
cont_id=fblwnpjhc0c=.
Hin leong. 2016. Hin leong [online]. Available: http://www.hinleong.com.sg/index.html.
Ibh group. 2017. Transporting iron ore from brazil [online]. Available: http://www.lbh-group.com/.
Ihs global trade atlas 2017. World steel association.
International trade administration (global steel trade monitor) 2016. Steel exports report: south korea.
Iturre, m. J. & mendes, c. A. 2010. Regional implications of china’s quest for energy in latin america. East
asia, 27, 127-143.
Kandla port. 2016. Kandla port overview [online]. Available: http://www.kandlaport.gov.in.
Konstantinos, p. 2015. Do tanker pool agreements give a comparative advantage to their members? Msc,
erasmus university rotterdam.
armstrong, m., d'arrigo, r., petter, c. & galli, a. 2016. How resource-poor countries in asia are securing stable
long-term reserves: comparing japan's and south korea's approaches. Resources policy, 47, 51-60.
ECLAC The transport of natural resources…
84
Centralamericadata. 2016. Costa rica announces end of refinery project with china [online]. Available:
http://www.centralamericadata.com/en/article/home/costa_rica_announces_end_of_refinery_proje
ct_with_china [accessed].
Clarkson research 2017. Clarkson shipping database.
Cnpc. 2017. Cnpc in venezuela [online]. Available: http://www.cnpc.com.cn/en/venezuela/
country_index.shtml [accessed].
Li, y., ling, y. & zheng, y. 2015. Understanding one belt one road, beijing, citic publishing group.
Maritime executive. 2014. Venezuelan oil ports struggle to handle tanker arrivals [online]. Available:
http://www.maritime-executive.com/article/venezuelan-oil-ports-struggle-to-handle-tanker-
arrivals-2014-11-13 [accessed 2017].
Maritimeherald. 2017. Crude oil spilled at venezuela’s main oil terminal [online]. Available:
http://www.maritimeherald.com/2017/crude-oil-spilled-at-venezuelas-main-oil-terminal/
[accessed].
Moc. 2011. Moc, china [online]. Available: http://www.mofcom.gov.cn/aarticle/i/jyjl/l/201110/
20111007804327.html [accessed 2016].
Opec. 2017. Opec [online]. Available: http://www.opec.org/opec_web/en/ [accessed].
Roumboutsos, a. & pantelias, a. 2015. Allocating revenue risk in transport infrastructure public private
partnership projects: how it matters. Transport reviews, 35, 183-203.
Un comtrade. 2016. Un comtrade database [online]. Available: https://comtrade.un.org/ [accessed].
Vale. 2016. Vale [online]. Available: www.vale.com [accessed].
Wu, t., zhao, h. & ou, x. 2014. Vehicle ownership analysis based on gdp per capita in china: 1963–2050.
Sustainability, 6, 4877-4899.
Ma steel. 2016. Maanshan iron & steel company limited [online]. Available: http://www.magang.com.hk/
eng/companypofile.asp.
Maritimeherald. 2017. Crude oil spilled at venezuela’s main oil terminal [online]. Available:
http://www.maritimeherald.com/2017/crude-oil-spilled-at-venezuelas-main-oil-terminal/
Maritime executive. 2014. Venezuelan oil ports struggle to handle tanker arrivals [online]. Available:
http://www.maritime-executive.com/article/venezuelan-oil-ports-struggle-to-handle-tanker-
arrivals-2014-11-13 2017].
Mentzer, j. T. 1999. Supplier partnering, thousand oaks, ca: sage publications, inc.
Ministerio del poder popular para relaciones exteriores. 2016. Establishment of oil joint ventures. Available:
http://china.embajada.gob.ve/index.php?option=com_content&view=article&id=23463avenezuela
-y-china-avanzan-en-la-creacion-de-empresas-petroleras-mixtas&catid=3%3anoticias-de-
venezuela-en-el-mundo&itemid=17&lang=zh 2017].
Ministry of economy & trade and industry (japan) 2015. Report of ministry of economy, trade and industry
2015, japan.
Moc. 2011. Moc, china [online]. Available: http://www.mofcom.gov.cn/aarticle/i/jyjl/l/201110/
20111007804327.html [accessed 2016].
Nanchang steel. 2016. Fangda special steel of science and technology co., ltd [online]. Available:
http://www.fangda-specialsteels.com/web/english/aboutus.aspx.
Nanjing steel. 2016. Nanjing iron & steel group limited [online]. Available: http://www.njsteel.com.cn/
portal/english/static.jsp?palias=english&alias=english_aboutus.
Ningbo-zhoushan port. 2016. Port overview [online]. Available: http://www.portnbzs.com.cn/
introduction/overview.
Opec secretariat.2016. World oil outlook (background paper). [online]. Available:
https://www.ief.org/_resources/files/pages/ief15/15th-ief_opec-secretariat-background-
paper_sep2016-final.pdf
Penney, k. & cronshaw, i. 2015. Coal in india the department of industry and science, australian government.
Qingdao port. 2016. Qingdao port business [online]. Available:
http://www.qdport.com/wlyw.aspx?id=b043f055-4dec-48d0-a689-00c85730d6a5.
Reliance. 2016. Petroleum refining & marketing [online]. Available:
http://www.ril.com/ourbusinesses/petroleumrefiningandmarketing.aspx.
Sci. 2016. The shipping corporation of india [online]. Available: http://www.shipindia.com/.
Sha steel. 2016. Jiangsu shagang group [online]. Available: http://www.sha-steel.com/eng/.
Sohu. 2015. Cm energy shipping establishing china vloc to build valemax [online]. Available:
http://mt.sohu.com/20150904/n420394340.shtml.
ECLAC The transport of natural resources…
85
Sowoll. 2016, port group distribution in china: yangtze river delta port group [online]. Available:
http://www.sowoll.com/en/blog/post/68-port-group-distribution-in-china-2-yangtze-river-delta-
port-group
Steelhome. 2017. Raw material - iron ore [online]. Available: http://newsen.steelhome.cn/material/var-051/.
The economist 2014. Pacific pumas: in america’s backyard, the pacific economies are learning from east asia.
The economist.
The japan iron ore and steel federation. 2017. The steel industry of japan 2015 - raw materials and logistics
[online]. Available: http://www.jisf.or.jp/en/ 2017].
Un comtrade. 2016. Un comtrade database [online]. Available: https://comtrade.un.org/.
Unctad. 2016. Unctad statistics [online]. Available: http://unctad.org/en/pages/statistics.aspx.
Vale. 2016. Vale [online]. Available: www.vale.com.
Vale 2017. Vale’s performance in 2016.
Valin steel. 2016. Hunan valin steel [online]. Available: http://www.valin.cn/.
Wignaraja, g. 2015. Asia’s growing ties with latin america [online]. East asia forum quarterly. Available:
http://www.eastasiaforum.org/2015/01/24/asiasgrowingtieswithlatinamerica/.
Wilson, j. D. 2012. Chinese resource security policies and the restructuring of the asia-pacific iron ore market.
Resources policy, 37, 331-339.
World steel association. 2015. World steel in figures 2015 [online]. Brussels. Available:
https://www.worldsteel.org/.
World steel association 2016. Steel statistical yearbook 2016.
Wu, t., zhao, h. & ou, x. 2014. Vehicle ownership analysis based on gdp per capita in china: 1963–2050.
Sustainability, 6, 4877-4899.
Wuhan steel. 2016. Wuhan iron & steel(group) corp [online]. Available: http://english.wisco.com.cn/.
Xingcheng steel. 2016. Jiangyin xingcheng special steel works co., ltd. [online]. Available:
http://en.jyxc.com/.
Yang, d. & wang, s. 2016. Analysis of the development potential of bulk shipping network on the yangtze
river. Maritime policy & management, 1-12.
Yonggang steel. 2016. Jiangsu yonggang group co., ltd [online]. Available: http://www.yong-
gang.com/englishweb/overview/1.asp