the structure of self-reported delinquency
TRANSCRIPT

221
The Structure of Self-Reported DelinquencyJohn B. Braithwaite and Henry G. LawUniversity of Queensland
An analysis of self-report delinquency data usingfour non-metric procedures for structural analysisrevealed support for the existence of a general de-linquency factor. However, offenses of low serious-ness and victimless offenses (drinking and drug-taking items) were only weakly related to this gen-eral factor. It is concluded that for almost all mea-sures of self-reported delinquency in the literature,most of the variance is accounted for by those itemswhich bear the weakest relationships to the generaldelinquency factor. The existence of specific factorsrepresenting "trivial delinquency," "drug use,""vehicle theft," and "vandalism" was indicated byall four procedures.
While the juvenile delinquency problem fre-quently grips public attention, empirical re-
search has failed to uncover consistently sup-ported correlates of delinquency. Labelling the-orists (Becker, 1963; Erikson, 1962) have arguedthat this failure is hardly surprising, since re-searchers implicitly (and wrongly) assume delin-quency to be a unidimensional construct. Does
the drug addict really have anything in commonwith the vandal or the rapist or the thief?
Perhaps consistently supported correlates of de-linquency cannot be found because each dis-parate behavior subsumed under the delin-
quency rubric is liable to have very different
correlates. Deviance, the labelling theorists indi-cate, is not a quality inherent in certain acts; it isa quality conferred upon diverse acts by agentsof social control. The failure of social science tomake any contribution to solving the delin-
quency problem may therefore stem from thenaive empirical treatment of delinquency as aunidimensional construct.
Criminologists continue to treat delinquencyas if it were a unidimensional construct, whilethere has been a dearth of empirical explora-tions of its dimensionality. This study attemptsto fill the vacuum by analyzing the structure ofdelinquent behavior reported in a confidentialinterview situation.
The Scaling of Delinquency
The most common practice in the measure-ment of self-reported delinquency has been toform an ad hoc scale without any empirical in-vestigation of the way in which the items in thescale intercorrelate (e.g., Christie et al., 1965;Hassall, 1974; Hirschi, 1969; McDonald, 1968;Scott, 1959; Williams & Gold, 1972). The othercommon practice has been to force unidimen-sionality upon the data by the uncritical use ofGuttman scalogram analysis (Dentler & Mon-
roe, 1961; Epps, 1967; Gould, 1969; Hirschi,1969; Lanphier & Faulkner, 1970; Nye et al.,1958; Reiss, 1962; Slocum & Stone, 1963; Smith
APPLIED PSYCHOLOGICAL MEASUREMENTVol. 2, No. 2 Spring 1978 pp. 221-238@ Copyright 1978 West Publishing Co.
at Australian National University on January 13, 2015apm.sagepub.comDownloaded from

222
& Cartwright, 1965; Voss, 1963, 1966). Crim-
inologists who use this procedure often reporthigh reproducibility coefficients; these probablyreflect the piling up of responses in one cate-gory-something which is a feature of the J-
shaped distribution of self-report scores. In thepresence of such extreme marginal distribu-
tions, spuriously high reproducibility coeffi-cients would be expected, regardless of the itemcontent (Guilford, 1954, p. 461).
More serious attempts to investigate the struc-ture of their items have been made by severalauthors who have used parametric statistical
procedures, such as cluster analysis (Hindelang,1971a, 1971b; Kulik, Stein, & Sabin, 1968) andprincipal component analysis (Arnold, 1965;Dembo, 1973; Gibson, 1971; Heise, 1968; Shortet al., 1963; Walberg et al., 1974). However, thevalue of these analyses is also questionable, sinceself-report delinquency data grossly abuses themetric and distributional assumptions of theseparametric techniques. Such techniques assumeinterval scaling. Yet it may be unreasonable toassume, for example, that the differencebetween not committing an offense and com-mitting it once is the same as the difference be-tween committing it once and committing it twoor three times and that, in turn, this equals thedifference between committing it two or threetimes and committing it more than three times.The best that can safely be assumed is an ordi-nal scaling of frequency of delinquent response.When product-moment correlations are cal-
culated between all pairs of items and the re-sulting matrix of correlations is analyzed bycluster analysis or factor analysis, there is an im-plicit assumption that the items are approxi-mately equivalent with respect to their extreme-ness. Variations in extremeness are likely to pro-duce &dquo;difficulty factors&dquo; (Carroll, 1961) whichare not directly related to the item content;rather, they are related to the extremeness of theitems. Self-report delinquency schedules are
characterized by a wide variation in the extreme-ness of items.
What is needed, then, is a procedure whichdoes not make unwarranted metric and distribu-tional assumptions about the data. In the re-search presented here, use is made of non-metricfactor analysis (SSA III; Lingoes & Guttman,1967), multidimensional scaling (SSA I;Lingoes, 1965), hierarchical cluster analysis(Johnson, 1967), and multidimensional scalo-
gram analysis (MSA II; Lingoes, 1967), all ofwhich satisfy these two conditions to varying de-grees. Each model provides somewhat differentinformation, and it is impossible to say in ad-vance which information will be most useful for
understanding the structure of delinquency.Of the four approaches, multidimensional
scalogram analysis is the most elegant: it oper-ates directly upon the data, makes no distribu-tional or metric assumptions, and produces ajoint space representation of persons and cate-gories of behavior. A problem with MSA II is
that while person types can usually be isolated,the scaling of items is not directly apparent. Thethree other methods of analysis do not operatedirectly on the raw data but require a matrix ofinter-item associations to be calculated first.
Moreover, they produce a spatial representationof the relationships among items only, instead ofthe joint space representation of items and per-sons. The extent to which metric and distribu-tional assumptions are required is determined
largely by the nature of the association coeffi-cient used. Napier (1972) recommends the use ofthe Goodman-Kruskal gamma coefficient as an
index of inter-item association when dealingwith rating scales of the type used in this study.The procedure assumes only that the variablesinvolved are measured on an ordinal scale. The
special features of each method of analysis willbe discussed later.
Faine (1974) has already used two of theseprocedures to investigate the structure of self-reported delinquency. Using non-metric factoranalysis and multidimensional scaling, Faine re-analyzed two well-known self-report studies. Hisefforts were directed explicitly at the &dquo;speciali-zation-versatility issue.&dquo; Are there distinct types
at Australian National University on January 13, 2015apm.sagepub.comDownloaded from

223
Table 1
Self-Report Items and Category Numbers for MSA II
at Australian National University on January 13, 2015apm.sagepub.comDownloaded from
224
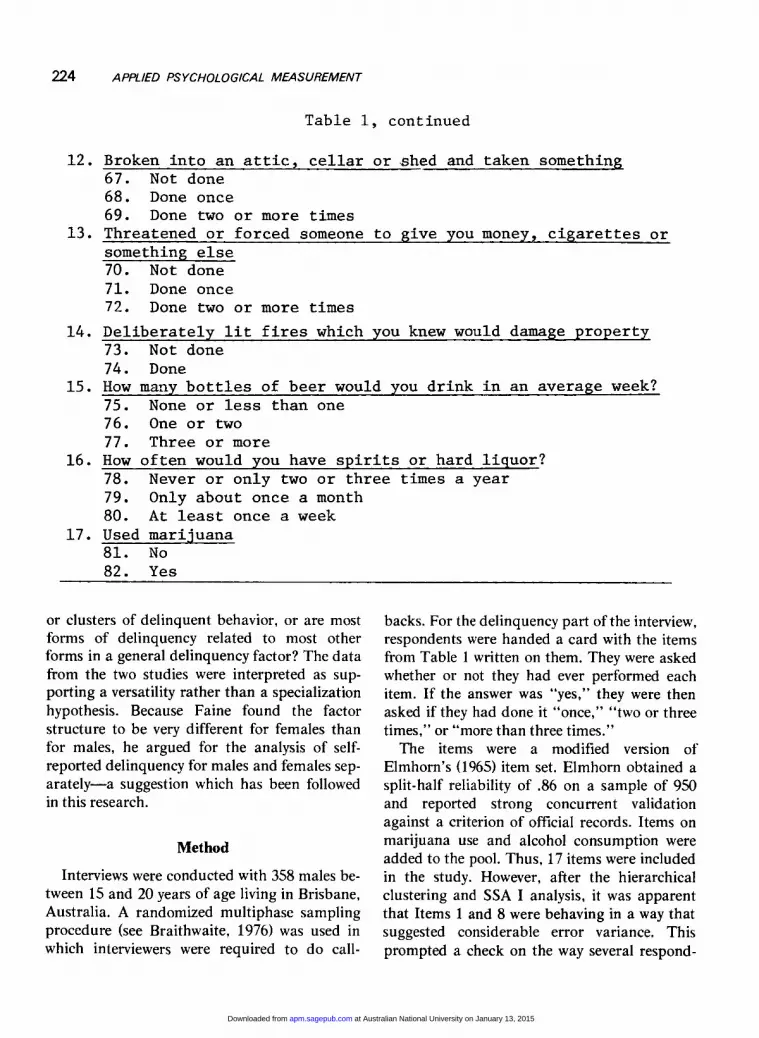
Table 1, continued
or clusters of delinquent behavior, or are mostforms of delinquency related to most otherforms in a general delinquency factor? The datafrom the two studies were interpreted as sup-porting a versatility rather than a specializationhypothesis. Because Faine found the factorstructure to be very different for females thanfor males, he argued for the analysis of self-reported delinquency for males and females sep-arately-a suggestion which has been followedin this research.
Method
Interviews were conducted with 358 males be-tween 15 and 20 years of age living in Brisbane,Australia. A randomized multiphase samplingprocedure (see Braithwaite, 1976) was used inwhich interviewers were required to do call-
backs. For the delinquency part of the interview,respondents were handed a card with the itemsfrom Table 1 written on them. They were askedwhether or not they had ever performed eachitem. If the answer was &dquo;yes,&dquo; they were thenasked if they had done it &dquo;once,&dquo; &dquo;two or three
times,&dquo; or &dquo;more than three times.&dquo;The items were a modified version of
Elmhom’s (1965) item set. Elmhom obtained asplit-half reliability of .86 on a sample of 950and reported strong concurrent validation
against a criterion of official records. Items onmarijuana use and alcohol consumption wereadded to the pool. Thus, 17 items were includedin the study. However, after the hierarchical
clustering and SSA I analysis, it was apparentthat Items 1 and 8 were behaving in a way thatsuggested considerable error variance. This
prompted a check on the way several respond-
at Australian National University on January 13, 2015apm.sagepub.comDownloaded from
225
ents were reacting to the items. Considerableambiguity was revealed, in that some respond-ents were endorsing the items for instances ofborrowing rather than theft. Items 1 and 8 weretherefore eliminated from subsequent analyses.
Results
Vector Model (SSA ill)
Through the SSA III analysis it was hopedthat underlying dimensions or factors whichsummarize the data could be found. The itemsare represented as vectors in space, and the con-figuration of the vectors is defined by the itemsimilarities or associations. Thus, vectors repre-senting similar items are separated by a smallerangle than those representing items that aremore dissimilar. The configuration of vectorschosen is not defined exactly by the gammamatrix. Instead, it is defined by an ordinal trans-formation of this matrix, which gives a solutionin the smallest number of dimensions. The aimof the procedure is to find the smallest spacerepresentation of the item similarities which
suitably minimizes a loss function called thecoefficient of alienation.The coefficient of alienation is an index of the
correspondence between the original matrix andthe computed (derived) matrix of coefficients ob-tained after the data has been monotonicallytransformed. For dimensionalities from one tosix, solutions were unacceptable because of highcoefficients of alienation. The coefficients of
alienation for the one- to six-factor solutionswere .63, .49, .35, .29, .17, .15 respectively. Theseven-dimensional solution, with coefficient of.14, satisfied Guttman’s (1968) rule of thumbthat an acceptable coefficient is one that is lessthan 15.
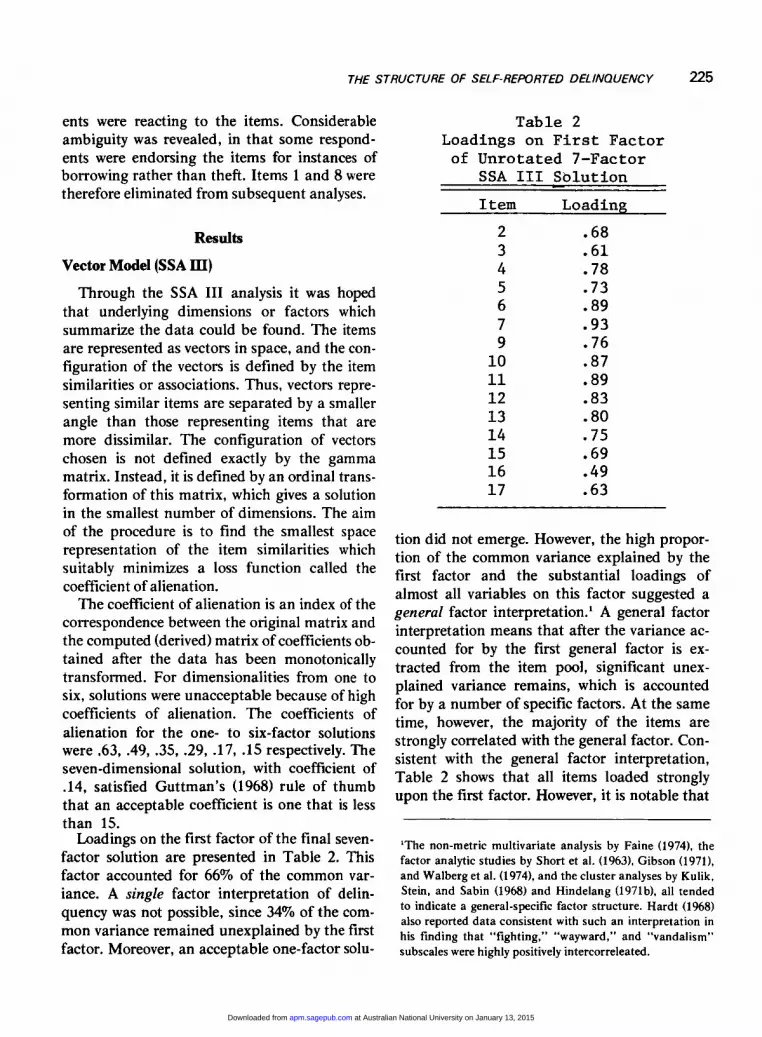
Loadings on the first factor of the final seven-factor solution are presented in Table 2. Thisfactor accounted for 66% of the common var-iance. A single factor interpretation of delin-quency was not possible, since 34% of the com-mon variance remained unexplained by the firstfactor. Moreover, an acceptable one-factor solu-
Table 2
Loadings on First Factorof Unrotated 7-Factor
SSA III Solution
tion did not emerge. However, the high propor-tion of the common variance explained by thefirst factor and the substantial loadings ofalmost all variables on this factor suggested ageneral factor interpretation.’ A general factorinterpretation means that after the variance ac-counted for by the first general factor is ex-tracted from the item pool, significant unex-plained variance remains, which is accountedfor by a number of specific factors. At the sametime, however, the majority of the items arestrongly correlated with the general factor. Con-sistent with the general factor interpretation,Table 2 shows that all items loaded stronglyupon the first factor. However, it is notable that
’The non-metric multivariate analysis by Faine (1974), thefactor analytic studies by Short et al. (1963), Gibson (1971),and Walberg et al. (1974), and the cluster analyses by Kulik,Stein, and Sabin (1968) and Hindelang (1971b), all tendedto indicate a general-specific factor structure. Hardt (1968)also reported data consistent with such an interpretation inhis finding that "fighting," "wayward," and "vandalism"subscales were highly positively intercorreleated.
at Australian National University on January 13, 2015apm.sagepub.comDownloaded from

226
the lowest loadings were for the two apparentlymost trivial delinquent acts (2 and 3) and thedrinking and drug-taking items (15, 16, 17).
In order to render factors more interpretable,a normalized varimax rotation was computed.The SSA III program rotated only the four fac-tors with eigenvalues greater than the averagecommunality. Loadings of items on the four ro-tated factors are presented in Table 3. These
factors accounted for 34, 25, 21, and 20 % of thecommon variance respectively.The first factor was labelled &dquo;vandalism&dquo; and
was clearly defined by the only three items whichreferred to the destruction of property withoutany intemion of securing financial gain for theactor (4, 5, and 14). Although these three itemsclearly had the highest loadings, a majority of allother items also had quite substantial loadingson the factor. This finding is consistent with theexistence of a general factor.The second factor, called &dquo;trivial delin-
quency,&dquo; was defined almost exclusively by theextremely high loadings of the two acts (2, 3)which appear to be of very low seriousness.
The third factor was difficult to interpret.Three of the four items with the highest loadingswere related to the theft of cars, motor bikes, orbicycles (6, 9, 10). Thus a &dquo;vehicle theft&dquo; inter-
pretation seems in order. However, the item withthe highest loading was marijuana use (17), andit was impossible to reconcile this with a &dquo;vehicletheft&dquo; interpretation. Consequently, no clear
interpretation could be placed upon this di-mension.The items with the highest loadings on the
fourth factor were beer consumption, spiritsconsumption, and marijuana use (15, 16, 17).The factor was therefore named &dquo;drug use.&dquo;
Distance Model (SSA I)
SSA I (multidimensional scaling) and SSA III(non-metric factor analysis) differ primarily withrespect to the way similarity coefficients anditems are represented in the geometric model.SSA III represents items as vectors, with thegamma coefficients being transformed into thecosines of the angles between vectors. In con-
Table 3
Four Factor SSA III Varimax Rotation Solution
at Australian National University on January 13, 2015apm.sagepub.comDownloaded from

227
trast, SSA I represents items as points andgamma coefficients as the inverse of the distancebetween points. That is, the closer together inspace are any two items, the stronger is the rela-tionship between them. In either procedure, thefinal solution does not represent the gamma co-efficients exactly, but rather a monotonic trans-formation of them.
In SSA III if the vectors representing twoitems in space are pointing in the same direc-tion, then there is a strong association betweenthem. Thus, the interpretation of results consistsof examining the extent to which variables lie
along the same dimension. In SSA I it is inter-point distances which are critical; clusters of
points rather than dimensions are sought.Since there are no guidelines for predicting
when it is more appropriate to use a distancerather than a vector model (Torgerson, 1965),the only real test for a given set of data is to useboth models and see which provides the bestsolution in terms of departure from mono-tonicity (low coefficient of alienation), reliability(replication when cross-validated on additionaldata sets), and interpretability (Shepard, 1972,pp. 9-10).The one-dimensional SSA I solution was de-
generate ; all of the subject points collapsed ontoa single point. The two-dimensional solution
produced an unacceptable coefficient of alien-ation of .23.2 The three-dimensional solutionshowed a coefficient of alienation of .10 in 25
iterations, which is considerably better thanGuttman’s criterion.
Three two-dimensional plots to represent thethree-dimensional solution are shown in Figures1, 2, and 3. Based on the results of SSA III, asmall number of clusters with a large numberof items in each cluster would not be expected.Rather, the SSA III suggested a large number ofspecific factors, with each defined by only a
small number of items. Consistent with this pic-ture, the only tight clusters which emerged in theSSA I analysis contained very small numbers ofitems in each.
Cluster 1. This contained the beer consump-tion, spirits consumption, and marijuana useitems (15, 16, 17) and thus was directly equiv-alent with the &dquo;drug use&dquo; factor from SSA III.Thus it was called a &dquo;drug use&dquo; cluster.
Cluster 2. The three items in this cluster re-lated to the theft of cars, motor bikes, or bicycles(6, 9, and 10), and it was thus called a &dquo;vehicletheft&dquo; cluster. This cluster was therefore verysimilar to the third SSA III factor. The confu-sion which arose in the interpretation of thelatter by the heavy loading of the marijuana useitem (17) was not a problem in the cluster inter-pretation.
Cluster 3. This was a &dquo;trivial delinquency&dquo;cluster, directly comparable with the SSA IIIfactor of the same name. Items 2 and 3 were inthe cluster.
Cluster 4. Items 14 and 5 formed another
tight two-item cluster which was called &dquo;van-
dalism.&dquo; The correspondence between this clus-ter and the SSA III &dquo;vandalism&dquo; factor was not
quite so good, since the third item which loadedon the vandalism factor (4) was not included inthe present cluster. Item 4, while reasonablyclose to the vandalism cluster, could by no rea-sonable stretching of the boundaries of the clus-ter be included in it.
Cluster 5. Items 12 and 4 were fairly close inspace and reasonably isolated from other items.No clear interpretation could be placed uponthis two-item cluster.
Cluster 6. A very tight two-item cluster wasformed by Items 7 and 11. At first, no similaritycould be ascertained between these two stronglyrelated items. However, it was noticeable thatthese two items fell right in the center of thespace bounded by the 17 items and that in theSSA III they had the highest and equal secondhighest loadings on the first (general) factor.Moreover, in the MSA II reported below, Item 7was one of the few items which, on its own, was
2Moreover, a plot of original vs. derived similarity coeffi-cients revealed a considerable number of tied ranks and a
wide scatter of points, indicating the high degree of depar-ture from monotonicity.
at Australian National University on January 13, 2015apm.sagepub.comDownloaded from

228
able to discriminate well between respondentslow and high in general delinquency. On theother hand, Item 11 was the best item in thepool for discriminating between general delin-quents and non-delinquents. It would appear,then, that what these two items had in commonwas that they were saturated with the generalfactor. Thus, this was called a &dquo;general factorsaturation&dquo; cluster.
Hierarchical Clustering
Johnson’s (1967) non-metric hierarchical clus-tering procedure has been used to provide an-other check on the conclusions which have beenreached about the structure of the self-reporteddelinquency items. While the procedure doesnot produce a spatial representation of the
items, it puts them into groups of similar items
f‘IGURE 1 . SSA1 ANALYSIS: DIMENSION 2PLOTTED AGAINST DIMENSION 1
at Australian National University on January 13, 2015apm.sagepub.comDownloaded from
229
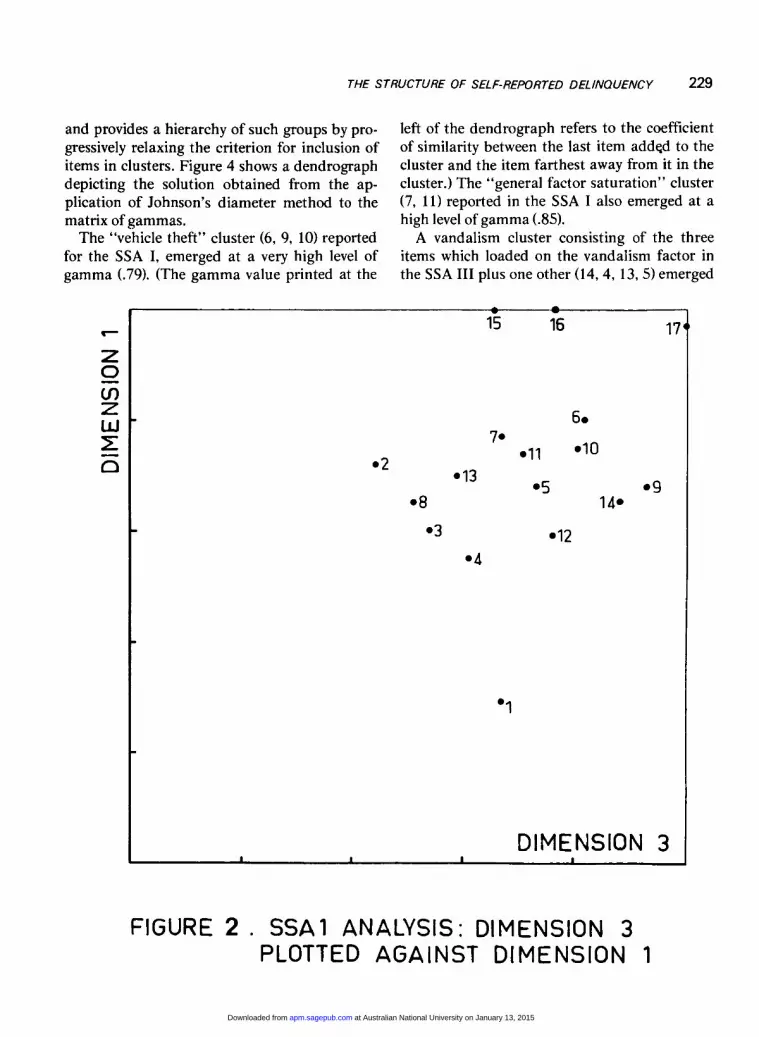
and provides a hierarchy of such groups by pro-gressively relaxing the criterion for inclusion ofitems in clusters. Figure 4 shows a dendrographdepicting the solution obtained from the ap-plication of Johnson’s diameter method to thematrix of gammas.The &dquo;vehicle theft&dquo; cluster (6, 9, 10) reported
for the SSA I, emerged at a very high level ofgamma (.79). (The gamma value printed at the
left of the dendrograph refers to the coefficientof similarity between the last item added to thecluster and the item farthest away from it in the
cluster.) The &dquo;general factor saturation&dquo; cluster(7, 11) reported in the SSA I also emerged at ahigh level of gamma (.85).A vandalism cluster consisting of the three
items which loaded on the vandalism factor inthe SSA III plus one other (14, 4, 13, 5) emerged
FIGURE 2 . SSA1 ANALYSIS: DIMENSION 3PLOTTED AGAINST DIMENSION 1
at Australian National University on January 13, 2015apm.sagepub.comDownloaded from

230
F’IGU RE 3 . SSA1 ANALYSIS: DIMENSION 2PLOTTED AGAINST DIMENSION 3
at a diameter gamma of .66. It is notable thatone of the first two items to be included in thiscluster (Item 4) is the item which, while it loadedstrongly on the SSA III vandalism factor, couldnot be included in the SSA I vandalism cluster.This item, therefore, earned its place in a van-dalism cluster through being strongly associatedwith the other vandalism items in two of thethree analyses. The two trivial items (2 and 3)
clustered at a somewhat lower, but still substan-tial, gamma value of .59.3
3There was, unfortunately, no opportunity for the confirma-tion of the "drug taking" cluster, since the scoring on thespirit drinking item (16) was reversed for the hierarchicalclustering computer run. A re-analysis with the scoring inthe same direction as the other items was not necessary,since the drug use cluster had been so clearly reaffirmed inthe other analyses.
at Australian National University on January 13, 2015apm.sagepub.comDownloaded from

231
Figure 4Dendrograph Depicting Clusters
Obtained from Hierarchical Clustering Analysis
Despite the use of disparate procedures forrepresenting the data, there seemed to be a con-vergence in the structuring of self-report itemsobtained. Not only has the hierarchical clus-
tering served to confirm the clusters obtained inthe early analyses, but also the joining togetherof these clusters to form larger clusters contain-ing most of the items in the pool at high valuesof gamma was consistent with a general factorinterpretation.
Multidimensional Scalogram Analysis (MSA H)
Like SSA I, MSA II is a distance model. How-ever, MSA II provides a geometric representa-tion of respondents as well as of variables (or,rather, categories within variables). The numberof categories for all items was collapsed as inTable 1 for this analysis. In most cases the cate-gories &dquo;done 2 or 3 times&dquo; and &dquo;done more than
three times&dquo; were joined together. This reduc-tion of categories was necessary because of theexcessive computing costs of MSA II analyses.
Also, for reasons of economy only a subset ofthe data could be analyzed by this method. Fortyrespondents were selected for inclusion in theanalysis, so that respondents with all types of de-linquency profiles were represented. The profilesimilarity index used to make this representativeselection is explained in detail elsewhere (Braith-waite, 1976). The small sample is not reason forgreat concern, since the subsample was meticu-lously representative of the wider sample and theresults of this analysis were checked against theresults obtained by the other methods on thetotal data set. Moreover, the purpose of usingMSA II was to look at a small number of re-
spondents intensively, without glossing over in-dividual differences between respondents as hadbeen done in the previous three analyses.
at Australian National University on January 13, 2015apm.sagepub.comDownloaded from

232
In the geometric representation provided byMSA II, each respondent is represented as apoint in space, each item partitions the space,and each category is represented as a circular re-gion within a partition. Respondents and cate-gories are mapped onto the same space by therequirement that all respondents who belong ina particular category, and only respondents whobelong in that category, must be positionedwithin the circular region surrounding that cate-gory. The extent of departure from this require-
ment is measured by a loss function which isminimized subject to the additional constraintof minimal dimensionality.The three-dimensional MSA II solution pro-
duced exceptionally good coefficients of alien-ation (.01 in 100 iterations) and stress (.01). Thelatter fell between &dquo;excellent&dquo; and &dquo;perfect&dquo; byKruskal’s (1964) criteria. Even on the basis ofthe work of Stenson and Knoll (1969), this valuewas far below the value of stress that could be
expected by chance for a three-dimensional rep-
FIGURE 5 . MSAII ANALYSIS: DIMENSION 2 PLOTTED AGAINSTDIMENSION 1
at Australian National University on January 13, 2015apm.sagepub.comDownloaded from

233
resentation of such a large number of points (N= 82). The three two-dimensional plots are pre-sented in Figures 5, 6, and 7.The most striking feature of the three-dimen-
sional representation is that there were three dis-tinct clusters of subjects. An inspection of thedelinquency profiles of respondents reveals thatthe cluster of respondents in the bottom left
quadrant of Figure 5 consisted of individualswho admitted to a number (at least four) of de-
linquent acts. This was called the &dquo;delinquent&dquo;
cluster. The second cluster (Respondents 21, 23,34, 25, 9, 14, 19) was a &dquo;non-delinquent&dquo; clus-ter, consisting of individuals who admitted tovery few delinquent acts. The third cluster (18, 6,4, 8, 5, 3, 7, 12) consisted of &dquo;trivial or drinkingdelinquents.&dquo; They frequently engaged in activ-ities which were either of low seriousness, i.e.,which do not normally involve heavy punish-ment, or involved the use of alcohol (Items 2, 3,15, 16). The &dquo;trivial or drinking delinquents&dquo;did not commit the remaining more serious de-
FIGURE 6 MSAII ANALYSIS DIMENSION 3 PLOTTED AGAINSTDIMENSION 1
at Australian National University on January 13, 2015apm.sagepub.comDownloaded from

234
linquent acts any more frequently than respond-ents in the &dquo;non-delinquent&dquo; cluster. In fact, theseven &dquo;trivial or drinking delinquents&dquo; admittedto a total of seven serious delinquent offenses,and the eight &dquo;non-delinquents&dquo; engaged in
eight serious delinquent offenses. However, forthe four trivial and drinking items, the compar-ison was 22 offenses with 7 offenses.The distinctiveness of the three clusters is il-
lustrated more vividly by photographs of a three-dimensional model of the space (see Braithwaite,
1976). A sample of 40 respondents might seeman inadequate sample from which to inducesuch a clear typology of subjects. However, itmust be remembered that each subject in theanalysis represented a number of other respond-ents with exactly the same, or nearly the same,delinquency profile.The emergence of clearly defined clusters of
persons contrasts with the distribution of cate-
gories in space, which do not fall into neat clus-ters. There is nothing puzzling about generating
FIG 7 MSAII ANALYSIS: DIMENSION 2 PLOTTED AGAINSTDIMENSION 3.
at Australian National University on January 13, 2015apm.sagepub.comDownloaded from

235
a clear typology of persons without having gen-erated a typology of categories (or variables). Itis possible for the factorial structure of cate-gories to be exceedingly complex, while the clus-tering of persons is simple.
In general, the space was arranged so that adirection running approximately from the topleft to the bottom right comer of Figure 5 indi-cated a greater degree of delinquency. As has al-ready been pointed out, the respondents who ad-mitted to the most delinquent acts were in thebottom left quadrant, and those who admittedto the least were in the top left. The most delin-
quent of all respondents was Respondent Num-ber 1. The non-delinquent (&dquo;not having done&dquo;)categories were primarily in the top left quad-rant of Figure 5. In general, categories repre-senting a great degree of delinquency, both interms of the seriousness of the offense embodiedin the category and the number of offenses em-bodied in the category, were to the bottom rightin Figure 5. For example, the category rep-
resenting the actual theft of a car (63) is to thebottom right of the categories representingmerely riding in a stolen car (54 and 55); and thecategory representing riding in a stolen car twoor more times (55) is to the bottom right of thecategory representing riding in a stolen car once(54).
The points were reasonably consistentlyaligned according to the frequency of offense bycategory, the apparent seriousness of offense bycategory, and the number of different offensesby respondent. This creates some grounds foroptimism that number, frequency, and serious-ness of offenses might be parts of the same uni-dimensional continuum of degree of delin-
quency. Thus, the common practice of placingnumber, frequency, and seriousness of delin-quency upon the same metric might not be sounreasonable as generally suspected. This
problem clearly requires more thorough anal-ysis. Nevertheless, the present finding may welllay the groundwork for putting upon a sounderbasis in delinquency measures the simultaneous
incorporation of number, frequency, and ser-
iousness of offenses.The emergence of general &dquo;delinquent&dquo; and
&dquo;non-delinquent&dquo; clusters of persons is consist-ent with a general factor interpretation of delin-quency. However, the separate &dquo;trivial and
drinking delinquents&dquo; cluster cautions that en-gaging in certain illegitimate activities of a non-serious nature may not be indicative of this gen-eralized delinquency. Activities such as &dquo;sneak-ing into a cinema or sports ground withoutpaying&dquo; and having an occasional beer may benormal activities in Australian adolescent cul-ture. As was pointed out in the discussion of theSSA III results, the four activities which heredefine &dquo;trivial or drinking delinquency&dquo; are
those with the lowest loadings (along with mari-juana use) on the general factor.An examination of the distribution of the
categories in space will not necessarily directlyconfirm or disconfirm the clustering of variableswhich have already been obtained, since the waycategories cluster is a separate question from theway variables cluster. Nevertheless, the clus-
tering of categories can reveal much of what liesbehind the clustering of variables. For example,it is clear that the relationship between the twotrivial variables (2 and 3) was strong at the levelof the most frequent categories (43, 46) butweaker at the level of low frequency (42, 45).That is, the strong association between the twotrivial items is attributable to the fact that
people who frequently perform one act are fre-quently likely to perform the other act. The asso-ciation between occasionally sneaking into themovies or a sports ground and stealing fruit
from a shop or orchard was, however, not nearlyso strong.
Similarly, there was virtually no associationamong drinking spirits infrequently, drinkingbeer infrequently, and drug use (Categories 76,79, 82); moreover, the former two appeared to betotally unrelated to general delinquency. Indeed,the category &dquo;drinking none or less than onebottle of beer a week&dquo; (75) was in the high delin-
at Australian National University on January 13, 2015apm.sagepub.comDownloaded from
236
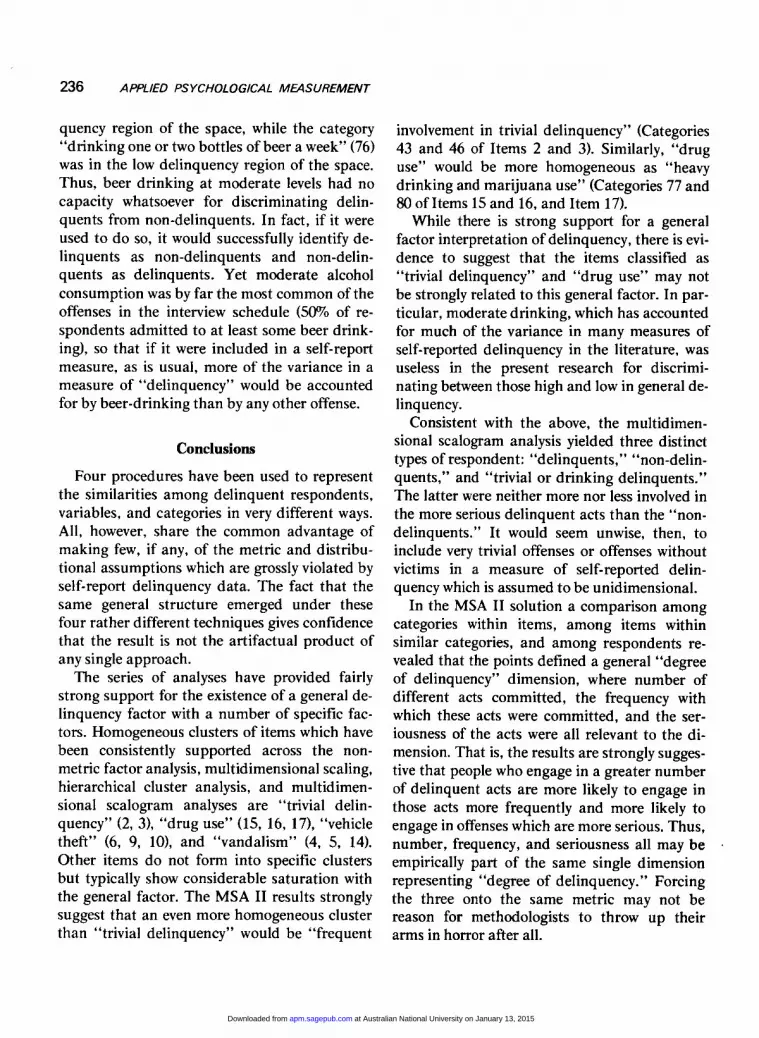
quency region of the space, while the category&dquo;drinking one or two bottles of beer a week&dquo; (76)was in the low delinquency region of the space.Thus, beer drinking at moderate levels had nocapacity whatsoever for discriminating delin-quents from non-delinquents. In fact, if it wereused to do so, it would successfully identify de-linquents as non-delinquents and non-delin-
quents as delinquents. Yet moderate alcoholconsumption was by far the most common of theoffenses in the interview schedule (SO°7o of re-spondents admitted to at least some beer drink-ing), so that if it were included in a self-reportmeasure, as is usual, more of the variance in ameasure of &dquo;delinquency&dquo; would be accountedfor by beer-drinking than by any other offense.
Conclusions
Four procedures have been used to representthe similarities among delinquent respondents,variables, and categories in very different ways.All, however, share the common advantage ofmaking few, if any, of the metric and distribu-tional assumptions which are grossly violated byself-report delinquency data. The fact that thesame general structure emerged under thesefour rather different techniques gives confidencethat the result is not the artifactual product ofany single approach.The series of analyses have provided fairly
strong support for the existence of a general de-linquency factor with a number of specific fac-tors. Homogeneous clusters of items which havebeen consistently supported across the non-
metric factor analysis, multidimensional scaling,hierarchical cluster analysis, and multidimen-sional scalogram analyses are &dquo;trivial delin-
quency&dquo; (2, 3), &dquo;drug use&dquo; (15, 16, 17), &dquo;vehicletheft&dquo; (6, 9, 10), and &dquo;vandalism&dquo; (4, 5, 14).Other items do not form into specific clustersbut typically show considerable saturation withthe general factor. The MSA II results stronglysuggest that an even more homogeneous clusterthan &dquo;trivial delinquency&dquo; would be &dquo;frequent
involvement in trivial delinquency&dquo; (Categories43 and 46 of Items 2 and 3). Similarly, &dquo;druguse&dquo; would be more homogeneous as &dquo;heavydrinking and marijuana use&dquo; (Categories 77 and80 of Items 15 and 16, and Item 17).While there is strong support for a general
factor interpretation of delinquency, there is evi-dence to suggest that the items classified as
&dquo;trivial delinquency&dquo; and &dquo;drug use&dquo; may notbe strongly related to this general factor. In par-ticular, moderate drinking, which has accountedfor much of the variance in many measures of
self-reported delinquency in the literature, wasuseless in the present research for discrimi-
nating between those high and low in general de-linquency.
Consistent with the above, the multidimen-sional scalogram analysis yielded three distincttypes of respondent: &dquo;delinquents,&dquo; &dquo;non-delin-quents,&dquo; and &dquo;trivial or drinking delinquents.&dquo;The latter were neither more nor less involved inthe more serious delinquent acts than the &dquo;non-delinquents.&dquo; It would seem unwise, then, toinclude very trivial offenses or offenses withoutvictims in a measure of self-reported delin-
quency which is assumed to be unidimensional.In the MSA II solution a comparison among
categories within items, among items withinsimilar categories, and among respondents re-vealed that the points defined a general &dquo;degreeof delinquency&dquo; dimension, where number ofdifferent acts committed, the frequency withwhich these acts were committed, and the ser-iousness of the acts were all relevant to the di-mension. That is, the results are strongly sugges-tive that people who engage in a greater numberof delinquent acts are more likely to engage inthose acts more frequently and more likely toengage in offenses which are more serious. Thus,number, frequency, and seriousness all may beempirically part of the same single dimensionrepresenting &dquo;degree of delinquency.&dquo; Forcingthe three onto the same metric may not bereason for methodologists to throw up theirarms in horror after all.
at Australian National University on January 13, 2015apm.sagepub.comDownloaded from

237
References
Arnold, W. R. Continuities in research: Scaling de-linquent behavior. Social Problems, 1965, 13,59-66.
Becker, H. S. Outsiders: Studies in the sociology ofdeviance. New York: Free Press, 1963.
Braithwaite, J. B. Inequality, public policy and crime.Unpublished Ph.D. dissertation, University ofQueensland, 1976.
Carroll, J. B. The nature of the data, or how to choosea correlation coefficient. Psychometrika, 1961, 26,347-372.
Christie, N., Andenaes, J., & Skirbeck, S. A study ofself-reported crime. Scandinavian Studies in
Criminology, 1965,1, 86-116.Dembo, R. A measure of aggression among working
class youth. British Journal of Criminology. 1973,13, 245-253.
Dentler, R. A., & Monroe, L. J. Social correlates ofearly adolescent theft. American Sociological Re-view, 1961, 26. 546-554.
Elmhorn, K. Study in self-reported delinquencyamong children in Stockholm. In K.O. Christian-sen (Ed.), Scandinavian Studies in Criminology,Volume 1. London: Tavistock Publications, 1965,86-116.
Epps, E. G. Socioeconomic status, race, level of as-piration and juvenile delinquency: A limited em-pirical test of Merton’s conception of deviation.Phylon, 1967, 28. 16-27.
Erikson, K. T. Notes on the sociology of deviance.Social Problems, 1962, 9, 308.
Faine, J. R. A multi-dimensional approach to under-standing varieties of delinquent behavior. Unpub-lished Ph.D. dissertation, University of Iowa,1974.
Gibson, H. B. The factorial structure of juvenile de-linquency : A study of self-reported acts. BritishJournal of Social and Clinical Psychology, 1971,10, 1-9.
Gould, L. C. Who defines delinquency: A comparisonof self-reported and officially reported delin-
quency for three racial groups. Social Problems,1969,17, 325-336.
Guilford, J. Psychometric methods (2nd ed.) NewYork: McGraw-Hill, 1954, 460-461.
Guttman, L. A general non-metric technique for find-ing the smallest co-ordinate space for a configur-ation of points. Psychometrika, 1968, 33, 469-506.
Hardt, R. H. Delinquency and social class: Bad kidsor good cops? In J. Deutscher & E. Thompson(Eds.), Among the people: Encounters with thepoor. New York: Basic Books, 1968.
Hassall, P. Schools and delinquency: A self-reportstudy of delinquency in Christchurch, New Zeal-and. Paper at the Sociological Association of Aus-tralian and New Zealand 1974 Conference. Uni-
versity of New England, Armidale, N.S.W., Aus-tralia, 1974.
Heise, D. Norms and individual patterns in studentdeviancy. Social Problems, 1968, 16. 78-92.
Hindelang, M. J. Age, sex, and the versatility of delin-quent involvements. Social Problems, 1971, 18,522-535. (a)
Hindelang, M. J. Estroversion, neuroticism, and self-reported delinquent involvement. Journal of Re-search in Crime and Delinquency, 1971, 8, 23-31.(b)
Hirschi, T. Causes of delinquency. Berkeley, CA:University of California Press, 1969.
Johnson, S. C. Hierarchical clustering schemes.
Psychometrika. 1967, 32, 241-254.Kruskal, J. B. Multidimensional scaling by opti-
mizing goodness of fit to a non-metric hypothesis.Psychometrika, 1964, 29, 1-27.
Kulik, J. A., Stein, K. B., & Sabin, T. R. Dimensionsand patterns of adolescent antisocial behavior.Journal of Consulting and Clinical Psychology,1968, 32, 375-382.
Lanphier, C. M., & Faulkner, J. E. Deviance in a
middle class community. International Journal ofComparative Sociology, 1970,11, 146.
Lingoes, J. C. An IBM-7090 program for Guttman-Lingoes Smallest Space Analysis-I. BehavioralScience, 1965, 10, 183-184.
Lingoes, J. C. An IBM-7090 program for Guttman-Lingoes Multidimensional Scalogram Analysis-II.Behavioral Science, 1967, 12, 268-270.
Lingoes, J. C., & Guttman, L. Nonmetric factor anal-ysis : A rank-reducing alternative to linear factoranalysis. Multivariate Behavioral Research, 1967,2, 485-505.
McDonald L. Social class and delinquency. London:Faber & Faber, 1968.
Napier, D. Nonmetric multidimensional techniquesfor summated ratings. In R. N. Shepard, A. K.Romney, & S. B. Newlove, Multidimensional scal-ing : Theory and application in the behavioral sci-ences (Vol. 1). New York: Seminar Press, 1972.
Nye, I. F., Short, J., & Olson, V. J. Socioeconomicstatus and delinquent behavior. American Journalof Sociology, 1958, 63, 381-389.
Reiss, I. L. Sociological studies of sexual standards.In G. Winokur (Ed.), Determinants of human sex-ual behavior. Springfield, IL.: Charles C. Thomas,1962.
at Australian National University on January 13, 2015apm.sagepub.comDownloaded from
238
Scott, J. F. Two dimensions of delinquent behavior.American Sociological Review, 1959, 24, 240-243.
Shepard, R. N. A taxonomy of some principal typesof data and of multidimensional methods for their
analysis. In R. N. Shepard, A. K. Romey & S.B. Newlove, Multidimensional scaling: Theoryand application in the behavioral sciences (Vol. 1).New York: Seminar Press, 1972.
Short, J. F., Tennyson, R. A., & Howard, K. I. Behav-ior dimensions of gang delinquency. AmericanSociological Review, 1963, 28, 411-428.
Slocum, W. L., & Stone, C. Family culture and pat-terns of delinquency type behavior. Marriage andFamily Living, 1963, 25, 202-208.
Smith, D. O., & Cartwright, D. Two measures of re-ported delinquent behavior. American Sociologi-cal Review, 1965, 30, 573-576.
Stenson, H. H., & Knoll, R. L. Goodness of fit forrandom rankings in Kruskal’s nonmetric scalingprocedure. Psychological Bulletin, 1969, 71,122-126.
Torgerson, W. S. Multidimensional scaling of sim-ilarity. Psychometrika, 1965, 30, 379-393.
Voss, H. L. Ethnic differentials in delinquency inHonolulu. Journal of Criminal Law, Criminologyand Police Science, 1963, 54, 325-326.
Voss, H. L. Socioeconomic status and reported delin-quent behavior. Social Problems, 1966, 13,314-324.
Walberg, H. J., Yeh, E. G., & Paton, S. M. Familybackground, ethnicity, and urban delinquency.Journal of Research in Crime and Delinquency,1974,11,80-87.
Williams, J. R., & Gold, M. From delinquent behav-ior to official delinquency. Social Problems, 1972,20, 209-229.
Author’s Address
J. Braithwaite, Department of Anthropology andSociology, University of Queensland, St. Lucia, Aus-tralia 4067.
at Australian National University on January 13, 2015apm.sagepub.comDownloaded from