the state of infrastructure public-private partnerships in
TRANSCRIPT
The State of Infrastructure Public-Private Partnerships in Countries Affected by Fragility, Conflict or Weak InstitutionsAPRIL 2018
© 2018 International Bank for Reconstruction and Development / The World Bank
1818 H Street NW Washington DC 20433
Telephone: +1-202-473-1000
www.worldbank.org
The findings, interpretations, and conclusions expressed in this report are entirely those of the authors and should not be attributed in any manner to the Public-Private Infrastructure Advisory Facility (PPIAF) or to The World Bank, to its affiliated organizations, or to members of its Board of Executive Directors or the countries they represent.
Neither PPIAF nor The World Bank guarantees the accuracy of the data included in this publication or accepts responsibility for any consequence of their use. The boundaries, colors, denominations, and other information shown on any map in this report do not imply on the part of PPIAF or The World Bank any judgment on the legal status of any territory or the endorsement or acceptance of such boundaries. For questions about this publication or information about ordering more copies, please visit our website.
Rights and Permissions
The material in this work is subject to copyright. Because The World Bank Group encourages dissemination of its knowledge, this work may be reproduced, in whole or in part, for noncommercial purposes, as long as full attribution to this work is given. Any queries on rights and licenses, including subsidiary rights, should be addressed to World Bank Publications, The World Bank, 1818 H Street, NW, Washington, DC 20433, USA; fax: +1-202-522-2625; e-mail: [email protected].
I I I
The State of Infrastructure Public-Private Partnerships in Countries Affected by Fragility, Conflict or Weak InstitutionsAPRIL 2018
I V
ACKNOWLEDGMENTS
This report was prepared by a team led by Fernanda Ruiz-Nuñez (TTL, Senior Economist, Infrastructure Analytics, IPG Group) under the general direction of Abha Joshi-Ghani (Senior Adviser, IPG Group). The core team included Anna Aghababyan (M&E specialist, GCPPF), Sara Ahmed (Operations Analyst, GCPPF), Junglim Hahm (Senior Infrastructure Specialist, GCPPF), Giulia Motolese (Operations Analyst, STC), Danett Song (Research Assistant, STT), and Jemima Sy (Senior Infrastructure Specialist, GCPPF). Daria Yurlova (Operational analyst, STC) provided support on data analysis for World Bank Group projects. This report was edited by Molly McCloskey and designed by Jeanine Delay and Lauren Kaley Johnson.
Funding for this publication was provided by the Public-Private Infrastructure Advisory Facility (PPIAF). Established in 1999, PPIAF is a multi-donor technical assistance facility housed inside the World Bank Group. PPIAF is a global facility dedicated to strengthening the policy, regulatory, and institutional underpinnings of private-sector investment in infrastructure in emerging markets and developing countries. PPIAF catalyzes private participation through public-private partnerships (PPPs); market-based financing of sub-national entities; and by supporting the generation, capture, and dissemination of best practices relating to private-sector involvement in infrastructure. For more information, visit www.ppiaf.org. The team is very grateful for comments received from Bledi Celiku, Jeff Delmon, Joanna Kata-Blackman, Henrike Klau Panhans, Nadia Fernanda Piffaretti, Alexandros Ragoussi, and Markus Scheuermaier.
V
CONTENTS
ACKNOWLEDGMENTS . . . . . . . . . . . . . . . . . . . . . . . . . . . . . . . . . . . . . . . . . . . . . . . . . . . . . . . . . . . . . . . . . . . . . . . . . IV
EXECUTIVE SUMMARY . . . . . . . . . . . . . . . . . . . . . . . . . . . . . . . . . . . . . . . . . . . . . . . . . . . . . . . . . . . . . . . . . . . . . . . . . . 1
1. INTRODUCTION . . . . . . . . . . . . . . . . . . . . . . . . . . . . . . . . . . . . . . . . . . . . . . . . . . . . . . . . . . . . . . . . . . . . . . . . . . . . . . . . 3
2. PROPOSED DEFINITION OF EFCS . . . . . . . . . . . . . . . . . . . . . . . . . . . . . . . . . . . . . . . . . . . . . . . . . . . . . . . . . . . 4
3. INFRASTRUCTURE PPP INVESTMENTS IN EFCS . . . . . . . . . . . . . . . . . . . . . . . . . . . . . . . . . . . . . . . . . . 7
Overall Investment Trends ...................................................................................................................... 7
Sector ...................................................................................................................................................... 10
Type of PPP ............................................................................................................................................ 13
Unsolicited Proposals and Award Method .......................................................................................... 15
Government Support and Guarantees ................................................................................................ 16
Multilateral and Bilateral Development Bank Support ....................................................................... 18
World Bank Group Support ................................................................................................................. 19
Financing ................................................................................................................................................ 24
Cancellations .......................................................................................................................................... 26
4. REGULATORY REFORMS IN EFCS . . . . . . . . . . . . . . . . . . . . . . . . . . . . . . . . . . . . . . . . . . . . . . . . . . . . . . . . . . 28
5. CONCLUSIONS AND FUTURE RESEARCH . . . . . . . . . . . . . . . . . . . . . . . . . . . . . . . . . . . . . . . . . . . . . . . . . 33
AI: LIST OF COUNTRIES CLASSIFIED AS EFCS DURING 2011-2015 . . . . . . . . . . . . . . . . . . . . . . . . 37
AII: WBG PPP-RELATED ACTIVITIES IN EFCS COUNTRIES APPROVED IN 2012-2016 . . . . 42
REFERENCES . . . . . . . . . . . . . . . . . . . . . . . . . . . . . . . . . . . . . . . . . . . . . . . . . . . . . . . . . . . . . . . . . . . . . . . . . . . . . . . . . . . . 45
V I
FIGURES
Figure 1: Number of EFCS and HL Countries With at Least One PPP Project (2007-2016) 8
Figure 2: PPP Investment by Sector and Number of Projects in EFCS and HL Countries, 2007-2016 8
Figure 3: PPP Investment as a Percentage of GDP (2007-2016) 9
Figure 4: PPP Projects by Sector (percentage of total), 2012-2016 11
Figure 5: PPP Investment by Sector and Number of Projects in EFCS and HL Countries, 2012-2016 12
Figure 6: Energy PPP Projects by Subsector (percentage of total), 2012-2016 12
Figure 7: Types of PPP Projects by Primary Sector in EFCS and HL countries (percentage of total), 2012-2016 13
Figure 8: PPP Award Methods (percentage of total), 2012-2016 15
Figure 9: Direct and Indirect Government Support (percentage of total), 2012-2016 17
Figure 10: Guarantees by Goverment or MDB/Bilateral agencies (percentage of total projects), 2012-2016 17
Figure 11: Multilateral Development Bank Support, 2012-2016 18
Figure 12a: Source of Financing for PPP Projects in Non-EFCS Countries (percentage of investments), 2012-2016 (N=313) 24
Figure 12b: Source of Financing for PPP Projects in EFCS Countries (percentage of investments), 2012-2016 (N=31) 25
Figure 12c: Source of Financing for PPP Projects in HL Countries (percentage of investments), 2012 - 2016 (N = 8) 25
Figure 13: Benchmarking PPP Procurement Scores by Area and Regional Average (score 1-100) 29
Figure 14: Benchmarking PPP Procurement Scores in EFCS countries by thematic coverage (score 1-100) 31
V I I
TABLES
Table 1: List of EFCS outcomes and associated indicators 5
Table 2: List of countries with a EFCS outcome indicator flagged between 2009 and 2015 that had at least one infrastructure PPP project reaching financial closure during the period 2011-2015. 6
Table 3: WBG PPP-related activities by sector (number of projects and share of total). 20
Table 4: Cancelled PPP Infrastructure projects reaching financial closure in 1991-2016 by sector and EFCS status (Number of projects and US$ Million Investments Commitments). 27
Table AI.1: Countries in the Harmonized List 2011-2015 that had at least one infrastructure PPP project reaching financial closure during the period 2011-2015. 37
Table AI.2: List of EFCS outcomes and associated indicators 38
Table AI.3: Countries with CPIA score of less than 3.2 between 2009 and 2015 that had at least one infrastructure PPP project reaching financial closure during the period 2011-2015. 39
Table AI.4: Countries with UN mission presence between 2009 and 2015 that had at least one PPP project reaching financial closure during the period 2011-2015. 39
Table AI.5: Countries with a refugee or IDP population that exceeds 10 percent of the total population between 2009 and 2015 and that had at least one infrastructure PPP project reaching financial closure during the period 2011-2015. 40
Table AI.6: List of countries classified as EFCS during 2011-2016, EFCS criteria, and number of PPP projects reaching financial closure 2011-2015 (14 out of 61 countries are not available for public disclosure). 40

V I I I THE STATE OF INFRASTRUCTURE PPPs IN COUNTRIES AFFECTED BY FRAGILITY, CONFLICT OR WEAK INSTITUTIONS
1ExEcutIVE SummARy
EXECUTIVE SUMMARY
Fragility, conflict, violence, and weak institutions are critical development challenges that have affected many countries. Using a set of outcome indicators (country policy and institutional assessment score of less than 3.2, presence of UN Missions, and refugees/internally displaced persons comprising more than 10 percent of the population), a total of 61 countries have been identified for this paper as an “Expanded list of Fragile and Conflict-Affected States (EFCS1).”
Economic and financial conditions, business environment, and rule of law are usually weaker in EFCS countries, raising private sector investment’s risk in infrastructure projects; PPP markets in these countries therefore tend to be less developed. Despite the less conducive environment, this report finds that for the period of analysis (2012-2016) some EFCS countries were able to bring projects to the market, and another few were able to create a PPP program.
These good performers are exceptions, however, and most EFCS countries have few or no PPP projects. Investments in EFCS countries remain low in absolute numbers and as a percentage of gross domestic product (GDP). Investment has increased in recent years, but the rise has been driven by a small number of countries – mainly Colombia. In the period 2012-2016, investments have remained concentrated in four countries: Colombia, Nepal, and two IBRD/Blend countries.
When assessing sectoral differences, some patterns emerge. The majority of projects and the volume of investments in EFCS countries in the period 2012-2016 have been concentrated in the energy sector, particularly in small renewable energy projects. Renewables are generally considered easier to off-grid. In EFCS countries where grid infrastructure is nonexistent or seriously damaged, new off-grid and mini-grid renewable energy technologies seem to play a significant role in the increase of energy connections. Another important pattern is that of energy projects bringing more new assets, as this is the sector with the highest share of greenfield projects.
The second largest sector in terms of the number of projects is transport, followed by water and sanitation. The share of transport projects in EFCS countries is significantly higher than in non-EFCS countries. This is explained by Colombia’s Fourth Generation Road Concession Program, which accounted for a quarter of all projects in EFCS countries. When Colombia is excluded, patterns are similar in EFCS and non-EFCS countries.
Due to the perception that EFCS countries may be more prone to less competitive and nontransparent bidding processes, the share of contracts awarded through direct negotiations was much higher among EFCS than in non-EFCS countries. However, projects originated through unsolicited proposals (USPs) had the same frequency in both groups.
The proportion of projects receiving direct government support was higher for EFCS countries than for non-EFCS, and the support in EFCS was almost exclusively in the form of capital subsidies. The proportion of projects receiving guarantees did not differ between the two groups. However, guarantees for exchange rate, interest rate, and construction cost risks were more frequent in projects in EFCS countries.
1 The term ECFS is used in this paper for analytical purposes only, and has not been formally adopted by the World Bank.
2 THE STATE OF INFRASTRUCTURE PPPs IN COUNTRIES AFFECTED BY FRAGILITY, CONFLICT OR WEAK INSTITUTIONS
Private financing was less significant in EFCS countries than in non-EFCS countries, due mainly to lower levels of commercial debt. International commercial banks had a significant role only in upper-middle-income EFCS countries. A large share of EFCS project financing comes from MDBs, and particularly from bilateral banks. The proportion of projects receiving MDB support as well as bilateral support was higher in EFCS countries than in non-EFCS countries for any type of support, with loans being the most common type of financial support.
While data on PPP outcomes is very limited, the PPI database collects information on cancellations. The share of PPP projects in EFCS countries terminated before the end of the contract was only slightly higher than in non-EFCS countries and was actually lower when cancellation rate was assessed as a percentage of investments – due to the number of performance-based management contracts without investments being cancelled.
One third of projects cancelled in EFCS countries were terminated during conflict. Among the cancelled projects, one fourth were cancelled due to the lack of security in project locations or were halted because of civil war. The overall picture shows that projects in EFCS countries do not underperform when compared to non-EFCS countries, and existing literature suggests that this could be explained by the fact that projects in EFCS have higher MDB and bilateral support.
Despite relatively low cancellation rates, the number of PPP projects and investments remains low in EFCS countries. Many of these countries have been strengthening their institutional and regulatory frameworks for PPPs in order to attract private sector investments, particularly for infrastructure projects. In recent years, some EFCS countries have approved new PPP laws or reformed public procurement laws. Nonetheless, the overall quality of PPP legal and regulatory frameworks in EFCS countries is lower than the regional averages in all four thematic areas (preparation, procurement, management of USPs, and management of contracts). Preparation and management of contracts are the areas most in need of improvement and that show the widest variation in performance across EFCS countries.
31. IntRoductIon
1. INTRODUCTION
Governments have long acknowledged the key role that infrastructure plays in economic growth and poverty reduction. The provision of public infrastructure can help governments build credibility with its citizens; therefore, infrastructure development is seen as a channel for building stability and prosperity in post-conflict states (OECD, 2008).
The role of the private sector in building infrastructure and managing infrastructure services is crucial. Porter’s paper (2011) explores how the private sector can positively contribute to peace-building and conflict prevention. The paper argues that the private sector contributes to livelihood and growth by providing jobs and generating income. Moreover, the private sector can also provide basic and new services, introduce innovation, and generate tax revenues for reconstruction efforts. However, most of the research on the contributions of private sector investments has been concentrated on the role that foreign direct investments (FDI) may have in stabilizing and preventing violence, and findings have been inconclusive (World Bank 2017e).
Foreign and local investors tend to leave the country during conflict, significantly reducing the presence of skills, jobs, and technology in the affected country. Those investors that do stay face important constraints – unsurprising, given that the World’s Bank Doing Business database shows that fragile states represent the world’s most challenging business environments. Among the bottom 25 economies in the Doing Business ranking for 2017, 20 are considered fragile and conflict-affected states (FCS). Moreover, the private sector operating in FCS faces difficulties in addition to those identified by Doing Business. Porter (2011) identifies the following challenges: asset destruction, macroeconomic instability, poor public institutions, corruption, lack of security, inadequate access to finance, unskilled labor, disputes over rightful land ownership, poor infrastructure or absence of infrastructure, market distortions, and poor tax enforcement. A recent survey conducted by the World Bank Group (WBG) of 27 professionals with experience implementing public-private dialogue in FCS countries points out that stakeholder management is the biggest challenge for these economies (World Bank, 2014).
In the absence of security, legal transparency, and clear property rights, the private sector will be reluctant to make long-term investments. The local financial sector is usually very weak, local investors are few, and foreign investors are extremely selective when considering engaging in FCS.
When it comes to large infrastructure projects, public-private partnerships (PPPs) continue to play a crucial role in improving efficiency in the delivery of public services, one of the key elements to narrowing the infrastructure gap. However, PPPs are long-term, complex projects that are usually difficult to prepare and implement even in mature and stable economies; implementing them in fragile environments is all the more challenging.
The literature on the determinants of infrastructure PPP investments confirms that strong macroeconomic, institutional, and regulatory conditions of a country are critical for PPP markets to grow (Moszoro et al. 2014). Given the high costs and risks investors face, it is essential that the institutional/regulatory environment meet a set of criteria that will enable projects to reach financial closure, and this is particularly important in FCS where economic, financial, and institutional conditions are often more tenuous.
4 THE STATE OF INFRASTRUCTURE PPPs IN COUNTRIES AFFECTED BY FRAGILITY, CONFLICT OR WEAK INSTITUTIONS
This report assesses infrastructure PPP investments in an expanded list of Fragile and Conflict-Affected States (EFCS2) as well as the PPP regulatory frameworks during the 2012-2016 period. In the following section, the report presents the definition of EFCS. Section 3 provides an assessment of the broad trends of PPP investments in EFCS countries in the transport, energy, and water and sanitation sectors. It also examines the use of financial instruments, the role of government support, multilateral development bank (MDB) assistance, the procurement process, and cancellation rates. In section 4, the report explores the links between regulatory reforms and infrastructure PPP investments. Finally, the main conclusions and areas for further research are presented in section 5.
2. PROPOSED DEFINITION OF EFCS
MDBs commonly use the Harmonized List3 of Fragile Situations, while recognizing its limitations. Looking at countries on the Harmonized List, it can be seen that low gross national income (GNI) per capita is linked to higher risk of fragile, conflictual, or violent outcomes.
An unpublished World Bank working paper (2015) that identified the main determinants of fragility noted that fragility and its manifestations impact development outcomes well beyond the impacts identified in those IDA-eligible countries listed as “fragile situations.” The working paper included a heterogeneous set of fragile situations, and included higher-capacity countries. While low income is a risk factor, fragility risks are also present in International Bank of Reconstruction and Development (IBRD) middle-income countries. Although not disclosed, the Country Policy and Institutional Assessment (CPIA) ratings of IBRD countries point to countries with weak policies and institutional arrangements in middle-income countries currently excluded from the Harmonized List.
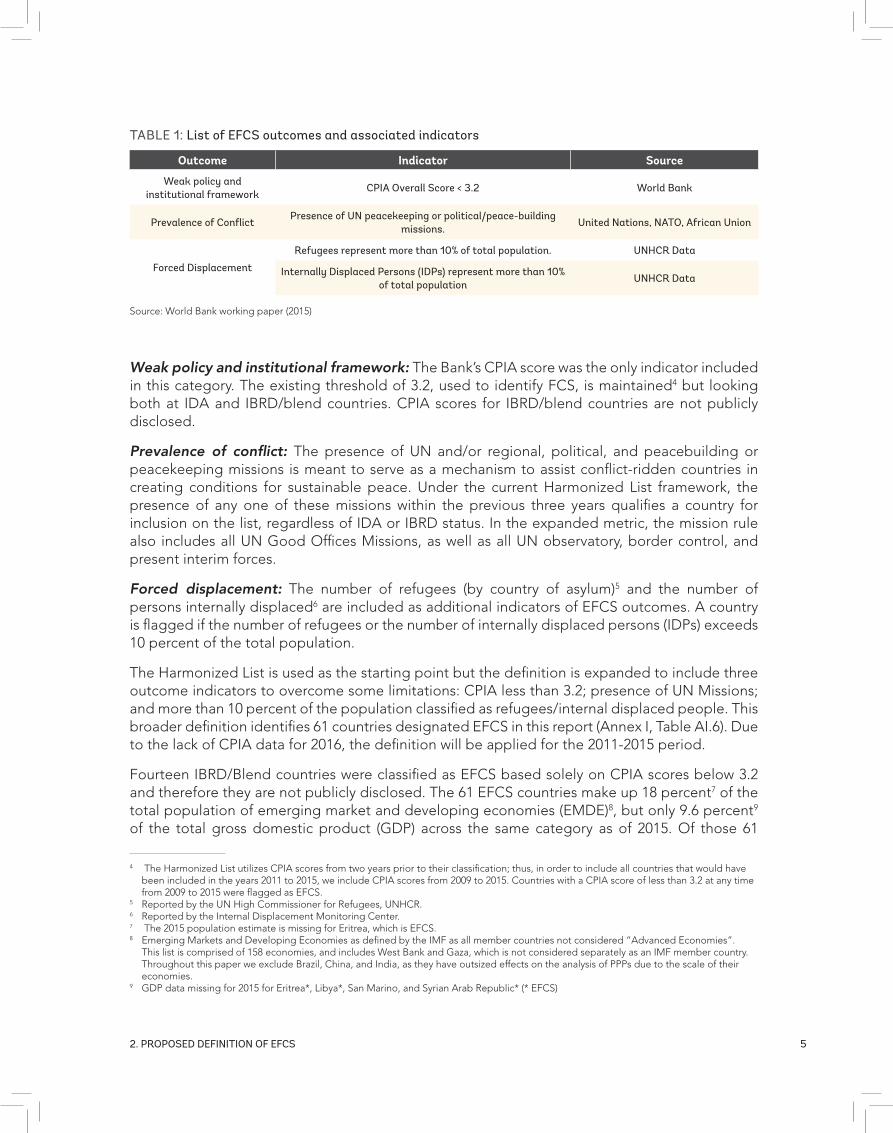
To overcome some of the limitations of the Harmonized List, the working paper suggested introducing an expanded metric framework that allows for more granularity. The framework expands the list of outcomes, and uses sub-dimensions of the CPIA to highlight risk from weak policies and institutions. For the purposes of this report, the definition of the Harmonized List has been expanded to include outcome indicators. This leads to the following EFCS outcomes metric (Table 1):
2 The term ECFS is used in this paper for analytical purposes only, and has not been formally adopted by the World Bank.3 The Harmonized CPIA score is an average of the CPIA scores from the World Bank (WB), the African Development Bank (AfDB), and the
Asian Development Bank (ADB).
52. PRoPoSEd dEfInItIon of EfcS
tABLE 1: List of EfcS outcomes and associated indicators
Outcome Indicator Source
Weak policy and institutional framework
cPIA overall Score < 3.2 World Bank
Prevalence of conflictPresence of un peacekeeping or political/peace-building
missions.united nations, nAto, African union
forced displacement
Refugees represent more than 10% of total population. unHcR data
Internally displaced Persons (IdPs) represent more than 10% of total population
unHcR data
4 The Harmonized List utilizes CPIA scores from two years prior to their classification; thus, in order to include all countries that would have been included in the years 2011 to 2015, we include CPIA scores from 2009 to 2015. Countries with a CPIA score of less than 3.2 at any time from 2009 to 2015 were flagged as EFCS.
5 Reported by the UN High Commissioner for Refugees, UNHCR.6 Reported by the Internal Displacement Monitoring Center.7 The 2015 population estimate is missing for Eritrea, which is EFCS.8 Emerging Markets and Developing Economies as defined by the IMF as all member countries not considered “Advanced Economies”.
This list is comprised of 158 economies, and includes West Bank and Gaza, which is not considered separately as an IMF member country. Throughout this paper we exclude Brazil, China, and India, as they have outsized effects on the analysis of PPPs due to the scale of their economies.
9 GDP data missing for 2015 for Eritrea*, Libya*, San Marino, and Syrian Arab Republic* (* EFCS)
Source: World Bank working paper (2015)
Weak policy and institutional framework: The Bank’s CPIA score was the only indicator included in this category. The existing threshold of 3.2, used to identify FCS, is maintained4 but looking both at IDA and IBRD/blend countries. CPIA scores for IBRD/blend countries are not publicly disclosed.
Prevalence of conflict: The presence of UN and/or regional, political, and peacebuilding or peacekeeping missions is meant to serve as a mechanism to assist conflict-ridden countries in creating conditions for sustainable peace. Under the current Harmonized List framework, the presence of any one of these missions within the previous three years qualifies a country for inclusion on the list, regardless of IDA or IBRD status. In the expanded metric, the mission rule also includes all UN Good Offices Missions, as well as all UN observatory, border control, and present interim forces.
Forced displacement: The number of refugees (by country of asylum)5 and the number of persons internally displaced6 are included as additional indicators of EFCS outcomes. A country is flagged if the number of refugees or the number of internally displaced persons (IDPs) exceeds 10 percent of the total population.
The Harmonized List is used as the starting point but the definition is expanded to include three outcome indicators to overcome some limitations: CPIA less than 3.2; presence of UN Missions; and more than 10 percent of the population classified as refugees/internal displaced people. This broader definition identifies 61 countries designated EFCS in this report (Annex I, Table AI.6). Due to the lack of CPIA data for 2016, the definition will be applied for the 2011-2015 period.
Fourteen IBRD/Blend countries were classified as EFCS based solely on CPIA scores below 3.2 and therefore they are not publicly disclosed. The 61 EFCS countries make up 18 percent7 of the total population of emerging market and developing economies (EMDE)8, but only 9.6 percent9 of the total gross domestic product (GDP) across the same category as of 2015. Of those 61
6 THE STATE OF INFRASTRUCTURE PPPs IN COUNTRIES AFFECTED BY FRAGILITY, CONFLICT OR WEAK INSTITUTIONS
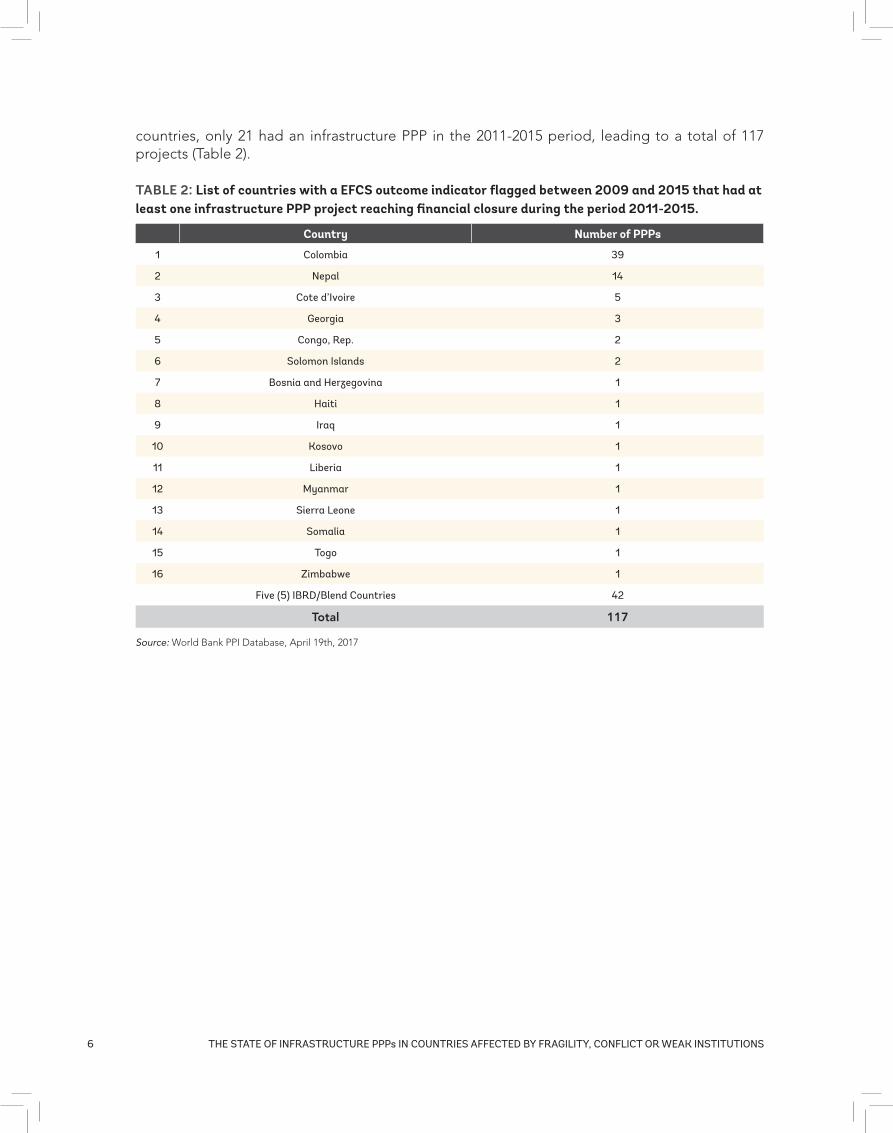
countries, only 21 had an infrastructure PPP in the 2011-2015 period, leading to a total of 117 projects (Table 2).
TABLE 2: List of countries with a EFCS outcome indicator flagged between 2009 and 2015 that had at least one infrastructure PPP project reaching financial closure during the period 2011-2015.
Country Number of PPPs
1 colombia 39
2 nepal 14
3 cote d’Ivoire 5
4 Georgia 3
5 congo, Rep. 2
6 Solomon Islands 2
7 Bosnia and Herzegovina 1
8 Haiti 1
9 Iraq 1
10 Kosovo 1
11 Liberia 1
12 myanmar 1
13 Sierra Leone 1
14 Somalia 1
15 togo 1
16 Zimbabwe 1
five (5) IBRd/Blend countries 42
Total 117
Source: World Bank PPI Database, April 19th, 2017
73. InfRAStRuctuRE PPP InVEStmEntS In EfcS
3. INFRASTRUCTURE PPP INVESTMENTS IN EFCS
This section presents the trends in investment commitments in PPP infrastructure projects (hereafter referred to as PPP infrastructure investments or PPP investments) in the 61 countries classified as EFCS during the period 2011-2015 (section 2). It also examines the use of financial instruments, the role of government support, MDB assistance, the procurement process, and cancellation rates. As a sensitivity analysis, the results for countries on the Harmonized List are presented throughout the different sections of the report.
The analysis that follows is based on the World Bank’s Private Participation in Infrastructure Database (www.ppi.worldbank.org). It includes PPP projects in the energy, transport, and water and sanitation sectors only.10 A PPP is defined as “a contractual arrangement between a public entity or authority and a private entity, for providing a public asset or service, in which the private party bears a significant risk and management responsibility.” (World Bank, 2017c) PPPs in the PPI database include projects classified as greenfield, brownfield, and performance-based management contracts; excluded are divestitures and merchant projects. All monetary values are expressed in U.S. dollars at 2015 prices (adjusted by the U.S. Consumer Price Index).
OVERALL INVESTMENT TRENDS
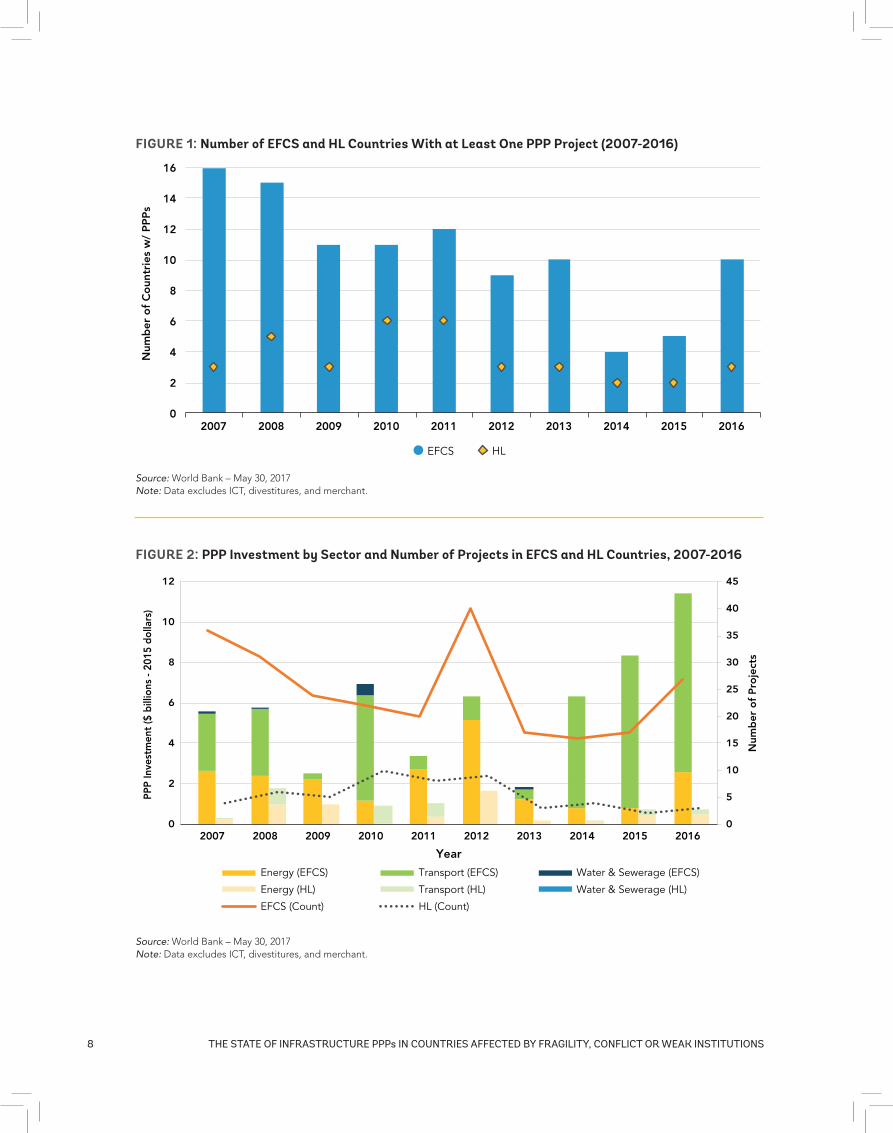
Of the 61 countries flagged as EFCS, only 35 had at least one infrastructure PPP project between 2007 and 2016. Narrowing the time frame to five years (2012-2016) shrinks the figure to 20 countries. When looking at each year individually, the maximum number of countries within a single year was 16 in 2007 (Figure 1).
Since 2007, the number of countries with at least one PPP project has decreased (Figure 1) to a low of four countries in 2014 (Colombia, Cote d’Ivoire, Haiti, and Nepal).11 One important pattern to notice is that except for Colombia, Nepal, and one IBRD/blend country, the remaining 17 countries had investments in only one or two years of the analyzed period and brought no project to financial closure during the remainder of the period. This illustrates the difficulty these countries had in maintaining a presence in the market.
10 Telecoms were excluded due to changes in the PPI database methodology in 2015 that do not allow for comparison after 2014. PPPs in the education and health sectors are not part of the PPI database and there is no comprehensive database for these sectors in EMDE countries.
11 While other countries may have been flagged as EFCS during the period 2007-2010, the analysis is restricted to the countries classified as EFCS during the 2011-2015 period.
PPP projects and investments in EFCS countries remain low in absolute numbers as well as in percentage of GDP. Investment has increased in the recent years, driven mainly by a few countries. Investments remain concentrated in Colombia, Nepal, and two IBRD/Blend countries.
8 THE STATE OF INFRASTRUCTURE PPPs IN COUNTRIES AFFECTED BY FRAGILITY, CONFLICT OR WEAK INSTITUTIONS
FIGURE 1: Number of EFCS and HL Countries With at Least One PPP Project (2007-2016)
0
2
4
6
8
10
12
14
16
2007 2008 2009 2010 2011 2012 2013 2014 2015 2016
Num
ber
of
Co
untr
ies
w/
PP
Ps
HLEFCS
Source: World Bank – May 30, 2017Note: Data excludes ICT, divestitures, and merchant.
FIGURE 2: PPP Investment by Sector and Number of Projects in EFCS and HL Countries, 2007-2016
0
5
10
15
20
25
30
35
40
45
0
2
4
6
8
10
12
2007 2008 2009 2010 2011 2012 2013 2014 2015 2016
Num
ber
of
Pro
ject
s
PPP
Inve
stm
ent
($ b
illio
ns -
2015
dol
lars
)
Year
Energy (EFCS) Transport (EFCS) Water & Sewerage (EFCS)
Energy (HL) Transport (HL) Water & Sewerage (HL)
EFCS (Count) HL (Count)
Source: World Bank – May 30, 2017Note: Data excludes ICT, divestitures, and merchant.
93. InfRAStRuctuRE PPP InVEStmEntS In EfcS
Among EFCS countries, there were only 116 PPP projects in 20 countries in the period 2012-2016, with an average of 20 projects per year (Figure 2). However, there is a high concentration of projects in a few countries. A total of 75 percent of the projects (87 out of 116) were concentrated in only four countries: Colombia (43 projects), Nepal (12 projects), and two IBRD countries.12 Colombia attracted 11 projects in 2014 and 2015, and 14 in 2016.
PPP investments in EFCS countries during the period 2012-2016 amounted to $34.2 billion, which represents only 6 percent of the total EMDE investment of $536 billion during the same period.13
PPP investments have fluctuated significantly in the past ten years, driven mainly by country-specific trends (Figure 2). For example, 63 percent of total PPP investment in 2012 was made up of only three countries (two IBRD countries and Nepal). Colombia is responsible for the drastic increase in PPPs after 2014, as it accounts for 93 percent of EFCS investments in 2014, 86 percent in 2015, and 65 percent in 2016. A total of 19 projects are part of the Colombia’s Fourth Generation Road Concession Program. However, it is important to note that Colombia was a small player in the preceding years, accounting for only 20 percent, on average, of total PPP investments during the 2007-2013 period.
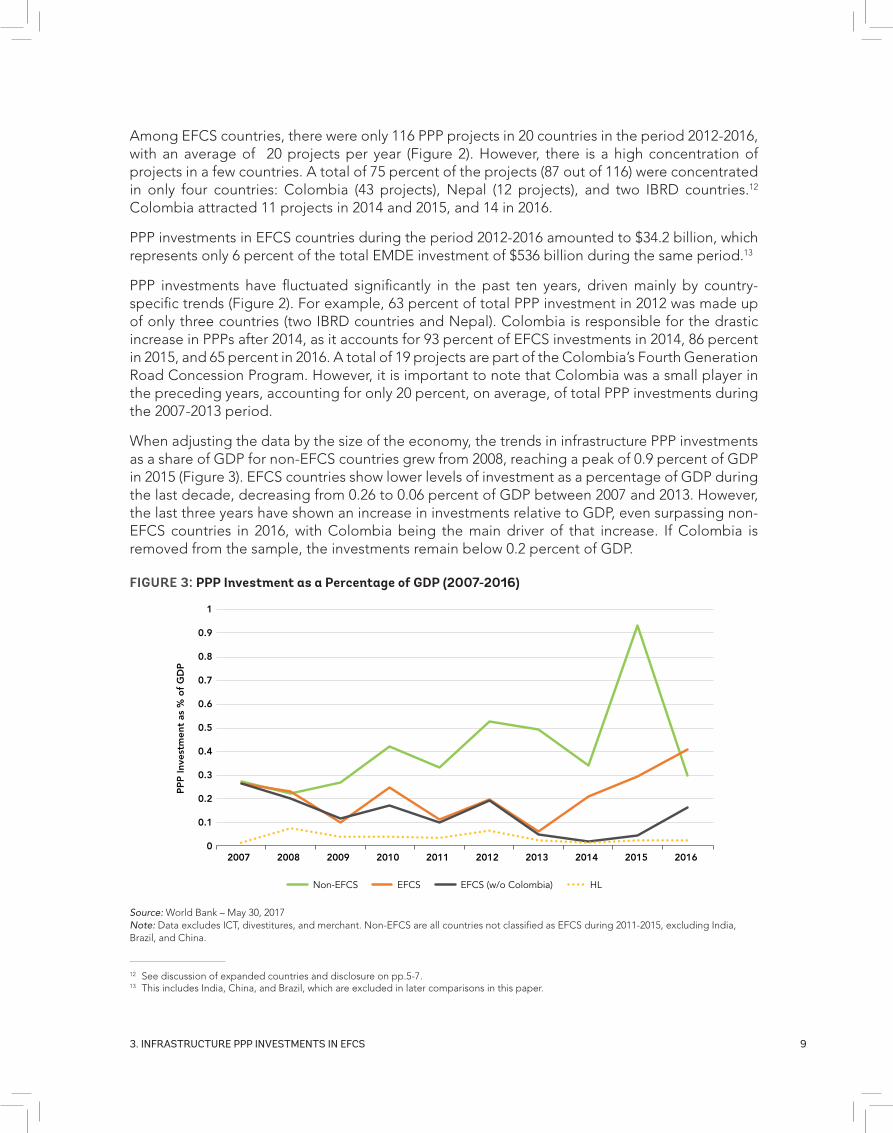
When adjusting the data by the size of the economy, the trends in infrastructure PPP investments as a share of GDP for non-EFCS countries grew from 2008, reaching a peak of 0.9 percent of GDP in 2015 (Figure 3). EFCS countries show lower levels of investment as a percentage of GDP during the last decade, decreasing from 0.26 to 0.06 percent of GDP between 2007 and 2013. However, the last three years have shown an increase in investments relative to GDP, even surpassing non-EFCS countries in 2016, with Colombia being the main driver of that increase. If Colombia is removed from the sample, the investments remain below 0.2 percent of GDP.
12 See discussion of expanded countries and disclosure on pp.5-7.13 This includes India, China, and Brazil, which are excluded in later comparisons in this paper.
FIGURE 3: PPP Investment as a Percentage of GDP (2007-2016)
0
0.1
0.2
0.3
0.4
0.5
0.6
0.7
0.8
0.9
1
2007 2008 2009 2010 2011 2012 2013 2014 2015 2016
PP
P In
vest
men
t as
% o
f G
DP
Non-EFCS EFCS EFCS (w/o Colombia) HL
Source: World Bank – May 30, 2017Note: Data excludes ICT, divestitures, and merchant. Non-EFCS are all countries not classified as EFCS during 2011-2015, excluding India, Brazil, and China.
1 0 THE STATE OF INFRASTRUCTURE PPPs IN COUNTRIES AFFECTED BY FRAGILITY, CONFLICT OR WEAK INSTITUTIONS
SECTOR
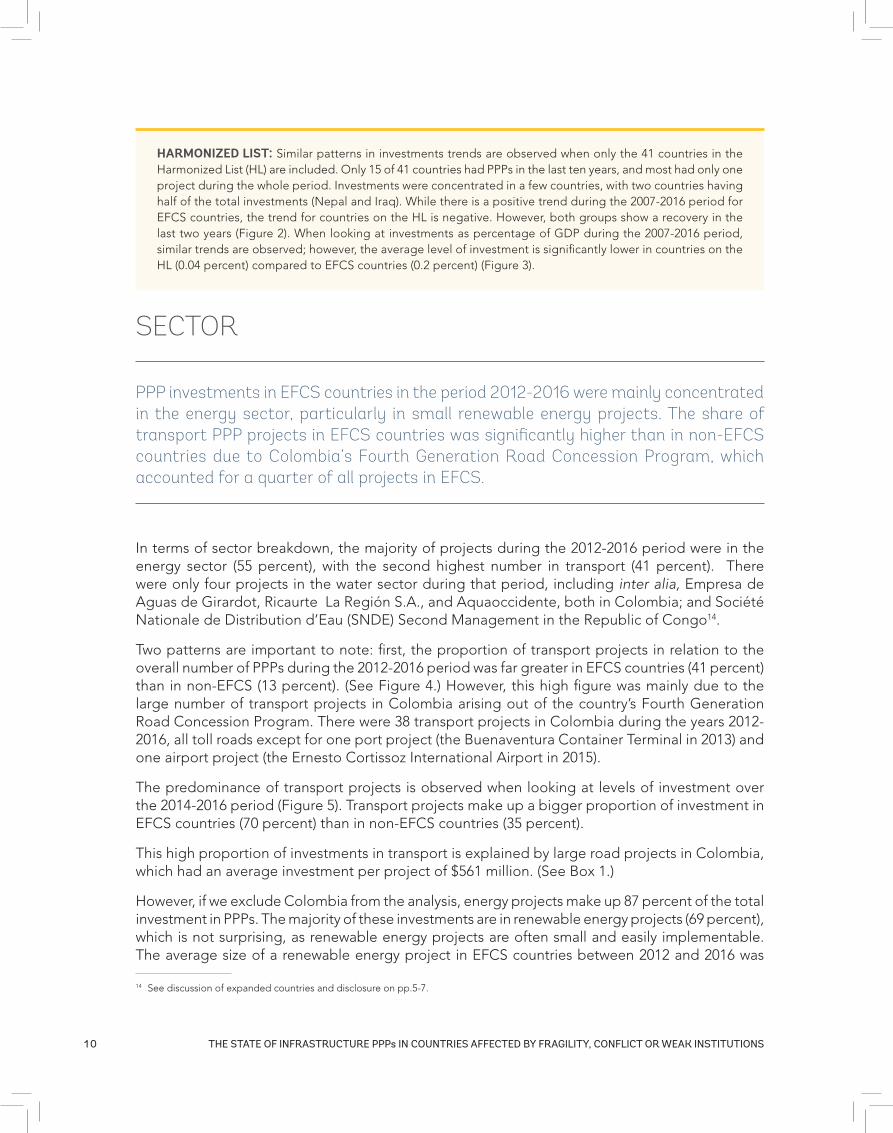
In terms of sector breakdown, the majority of projects during the 2012-2016 period were in the energy sector (55 percent), with the second highest number in transport (41 percent). There were only four projects in the water sector during that period, including inter alia, Empresa de Aguas de Girardot, Ricaurte La Región S.A., and Aquaoccidente, both in Colombia; and Société Nationale de Distribution d’Eau (SNDE) Second Management in the Republic of Congo14.
Two patterns are important to note: first, the proportion of transport projects in relation to the overall number of PPPs during the 2012-2016 period was far greater in EFCS countries (41 percent) than in non-EFCS (13 percent). (See Figure 4.) However, this high figure was mainly due to the large number of transport projects in Colombia arising out of the country’s Fourth Generation Road Concession Program. There were 38 transport projects in Colombia during the years 2012-2016, all toll roads except for one port project (the Buenaventura Container Terminal in 2013) and one airport project (the Ernesto Cortissoz International Airport in 2015).
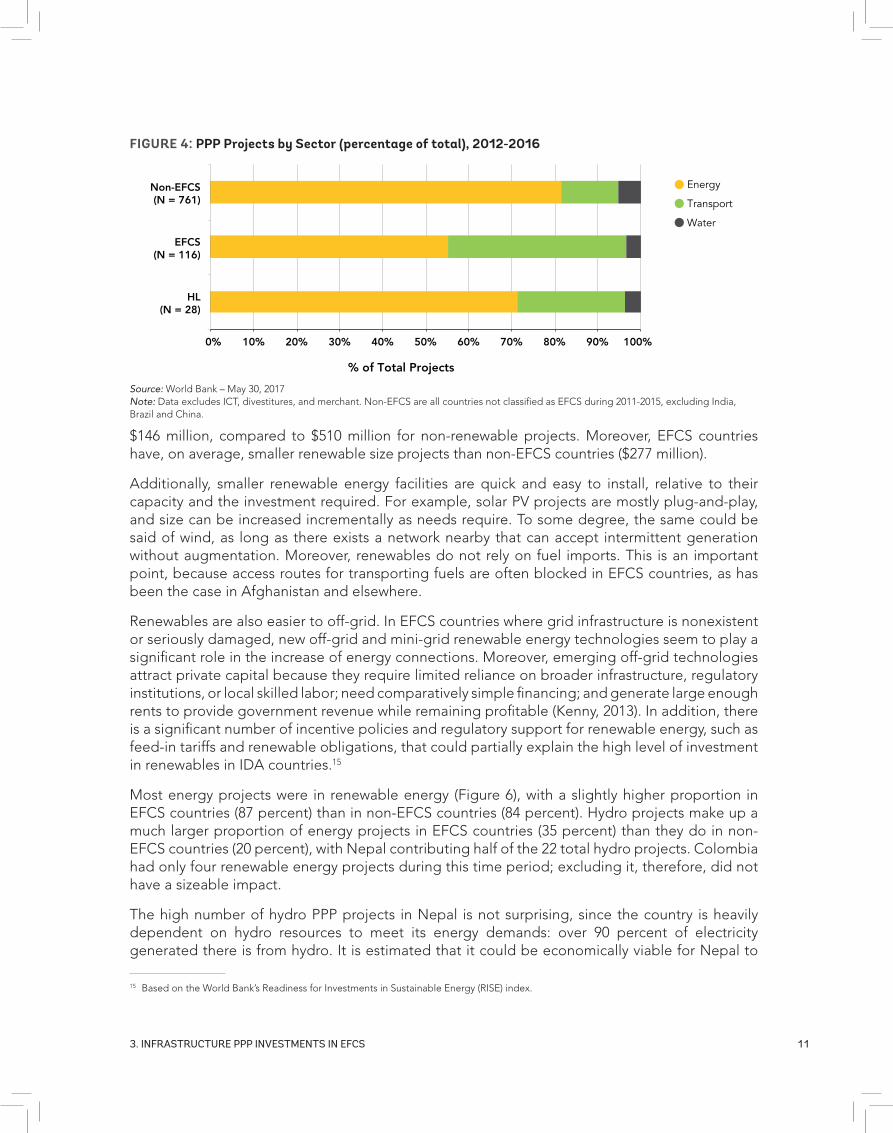
The predominance of transport projects is observed when looking at levels of investment over the 2014-2016 period (Figure 5). Transport projects make up a bigger proportion of investment in EFCS countries (70 percent) than in non-EFCS countries (35 percent).
This high proportion of investments in transport is explained by large road projects in Colombia, which had an average investment per project of $561 million. (See Box 1.)
However, if we exclude Colombia from the analysis, energy projects make up 87 percent of the total investment in PPPs. The majority of these investments are in renewable energy projects (69 percent), which is not surprising, as renewable energy projects are often small and easily implementable. The average size of a renewable energy project in EFCS countries between 2012 and 2016 was
14 See discussion of expanded countries and disclosure on pp.5-7.
PPP investments in EFCS countries in the period 2012-2016 were mainly concentrated in the energy sector, particularly in small renewable energy projects. The share of transport PPP projects in EFCS countries was significantly higher than in non-EFCS countries due to Colombia’s Fourth Generation Road Concession Program, which accounted for a quarter of all projects in EFCS.
HARMONIZED LIST: Similar patterns in investments trends are observed when only the 41 countries in the Harmonized List (HL) are included. Only 15 of 41 countries had PPPs in the last ten years, and most had only one project during the whole period. Investments were concentrated in a few countries, with two countries having half of the total investments (Nepal and Iraq). While there is a positive trend during the 2007-2016 period for EFCS countries, the trend for countries on the HL is negative. However, both groups show a recovery in the last two years (Figure 2). When looking at investments as percentage of GDP during the 2007-2016 period, similar trends are observed; however, the average level of investment is significantly lower in countries on the HL (0.04 percent) compared to EFCS countries (0.2 percent) (Figure 3).
1 13. InfRAStRuctuRE PPP InVEStmEntS In EfcS
$146 million, compared to $510 million for non-renewable projects. Moreover, EFCS countries have, on average, smaller renewable size projects than non-EFCS countries ($277 million).
Additionally, smaller renewable energy facilities are quick and easy to install, relative to their capacity and the investment required. For example, solar PV projects are mostly plug-and-play, and size can be increased incrementally as needs require. To some degree, the same could be said of wind, as long as there exists a network nearby that can accept intermittent generation without augmentation. Moreover, renewables do not rely on fuel imports. This is an important point, because access routes for transporting fuels are often blocked in EFCS countries, as has been the case in Afghanistan and elsewhere.
Renewables are also easier to off-grid. In EFCS countries where grid infrastructure is nonexistent or seriously damaged, new off-grid and mini-grid renewable energy technologies seem to play a significant role in the increase of energy connections. Moreover, emerging off-grid technologies attract private capital because they require limited reliance on broader infrastructure, regulatory institutions, or local skilled labor; need comparatively simple financing; and generate large enough rents to provide government revenue while remaining profitable (Kenny, 2013). In addition, there is a significant number of incentive policies and regulatory support for renewable energy, such as feed-in tariffs and renewable obligations, that could partially explain the high level of investment in renewables in IDA countries.15
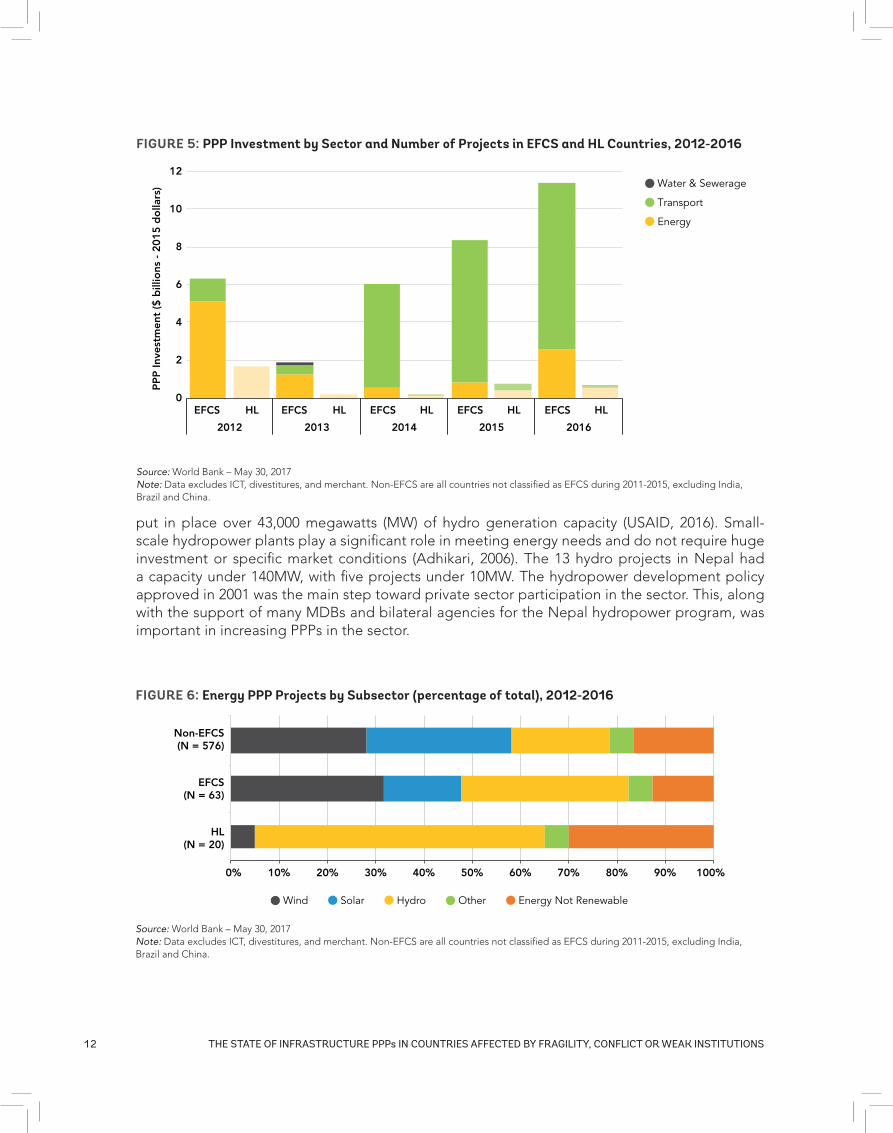
Most energy projects were in renewable energy (Figure 6), with a slightly higher proportion in EFCS countries (87 percent) than in non-EFCS countries (84 percent). Hydro projects make up a much larger proportion of energy projects in EFCS countries (35 percent) than they do in non-EFCS countries (20 percent), with Nepal contributing half of the 22 total hydro projects. Colombia had only four renewable energy projects during this time period; excluding it, therefore, did not have a sizeable impact.
The high number of hydro PPP projects in Nepal is not surprising, since the country is heavily dependent on hydro resources to meet its energy demands: over 90 percent of electricity generated there is from hydro. It is estimated that it could be economically viable for Nepal to
15 Based on the World Bank’s Readiness for Investments in Sustainable Energy (RISE) index.
FIGURE 4: PPP Projects by Sector (percentage of total), 2012-2016
0% 10% 20% 30% 40% 50% 60% 70% 80% 90% 100%
Non-EFCS(N = 761)
EFCS(N = 116)
HL(N = 28)
% of Total Projects
Energy
Transport
Water
Source: World Bank – May 30, 2017Note: Data excludes ICT, divestitures, and merchant. Non-EFCS are all countries not classified as EFCS during 2011-2015, excluding India, Brazil and China.
1 2 THE STATE OF INFRASTRUCTURE PPPs IN COUNTRIES AFFECTED BY FRAGILITY, CONFLICT OR WEAK INSTITUTIONS
FIGURE 5: PPP Investment by Sector and Number of Projects in EFCS and HL Countries, 2012-2016
Water & Sewerage
Transport
Energy
0
2
4
6
8
10
12
EFCS HL EFCS HL EFCS HL EFCS HL EFCS HL
2012 2013 2014 2015 2016
PP
P In
vest
men
t ($
bill
ions
- 2
015
do
llars
)
Source: World Bank – May 30, 2017Note: Data excludes ICT, divestitures, and merchant. Non-EFCS are all countries not classified as EFCS during 2011-2015, excluding India, Brazil and China.
put in place over 43,000 megawatts (MW) of hydro generation capacity (USAID, 2016). Small-scale hydropower plants play a significant role in meeting energy needs and do not require huge investment or specific market conditions (Adhikari, 2006). The 13 hydro projects in Nepal had a capacity under 140MW, with five projects under 10MW. The hydropower development policy approved in 2001 was the main step toward private sector participation in the sector. This, along with the support of many MDBs and bilateral agencies for the Nepal hydropower program, was important in increasing PPPs in the sector.
FIGURE 6: Energy PPP Projects by Subsector (percentage of total), 2012-2016
Wind Solar Hydro Other Energy Not Renewable
0% 10% 20% 30% 40% 50% 60% 70% 80% 90% 100%
Non-EFCS(N = 576)
EFCS(N = 63)
HL(N = 20)
Source: World Bank – May 30, 2017Note: Data excludes ICT, divestitures, and merchant. Non-EFCS are all countries not classified as EFCS during 2011-2015, excluding India, Brazil and China.
1 33. InfRAStRuctuRE PPP InVEStmEntS In EfcS
HARMONIZED LIST: Energy is still the sector with the largest number of projects in countries on the HL, but the share (71 percent) is even larger than for EFCS countries (55 percent) and closer to the level of non-EFCS (81 percent). The percentage of renewables among energy projects (70 percent) is lower than both EFCS (87 percent) and non-EFCS (83 percent) countries. Since Nepal is on the HL and has a large hydropower program, most of the renewable energy projects in HL countries were in hydropower energy.
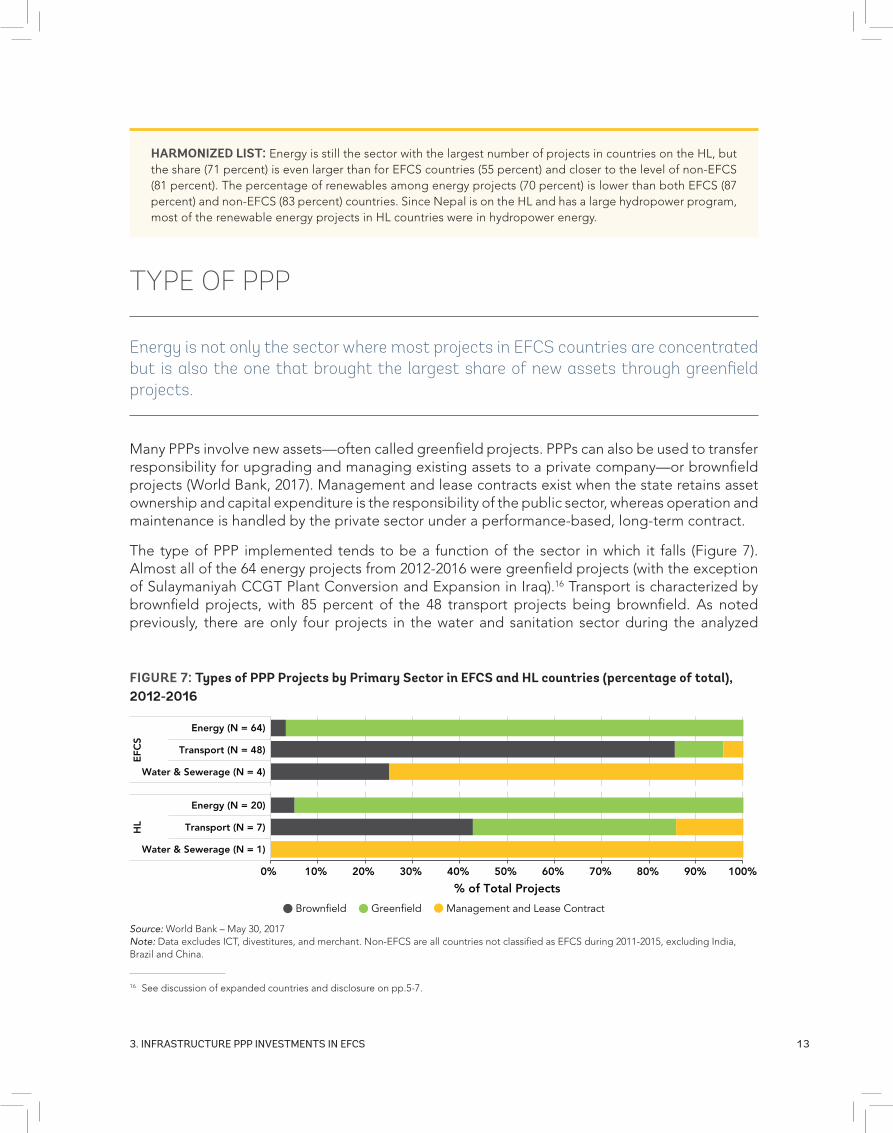
TYPE OF PPP
Many PPPs involve new assets—often called greenfield projects. PPPs can also be used to transfer responsibility for upgrading and managing existing assets to a private company—or brownfield projects (World Bank, 2017). Management and lease contracts exist when the state retains asset ownership and capital expenditure is the responsibility of the public sector, whereas operation and maintenance is handled by the private sector under a performance-based, long-term contract.
The type of PPP implemented tends to be a function of the sector in which it falls (Figure 7). Almost all of the 64 energy projects from 2012-2016 were greenfield projects (with the exception of Sulaymaniyah CCGT Plant Conversion and Expansion in Iraq).16 Transport is characterized by brownfield projects, with 85 percent of the 48 transport projects being brownfield. As noted previously, there are only four projects in the water and sanitation sector during the analyzed
16 See discussion of expanded countries and disclosure on pp.5-7.
Energy is not only the sector where most projects in EFCS countries are concentrated but is also the one that brought the largest share of new assets through greenfield projects.
FIGURE 7: Types of PPP Projects by Primary Sector in EFCS and HL countries (percentage of total), 2012-2016
Brownfield Management and Lease ContractGreenfield
0% 10% 20% 30% 40% 50% 60% 70% 80% 90% 100%
Energy (N = 64)
Transport (N = 48)
Water & Sewerage (N = 4)
Energy (N = 20)
Transport (N = 7)
Water & Sewerage (N = 1)
EFC
SH
L
% of Total Projects
Source: World Bank – May 30, 2017Note: Data excludes ICT, divestitures, and merchant. Non-EFCS are all countries not classified as EFCS during 2011-2015, excluding India, Brazil and China.
1 4 THE STATE OF INFRASTRUCTURE PPPs IN COUNTRIES AFFECTED BY FRAGILITY, CONFLICT OR WEAK INSTITUTIONS
period and three of them are simple management and lease contract. The link between sector and type of PPP is also observed in the non-EFCS countries, but to a lesser extent.
The exclusion of Colombia changes the percentage breakdown depicted in Figure 7. The most important impact is observed in the transport sector, where the number of projects decreased from 48 to 10; as all of these projects were brownfield, the share of brownfield projects in transport dropped from 85 percent to 60 percent.
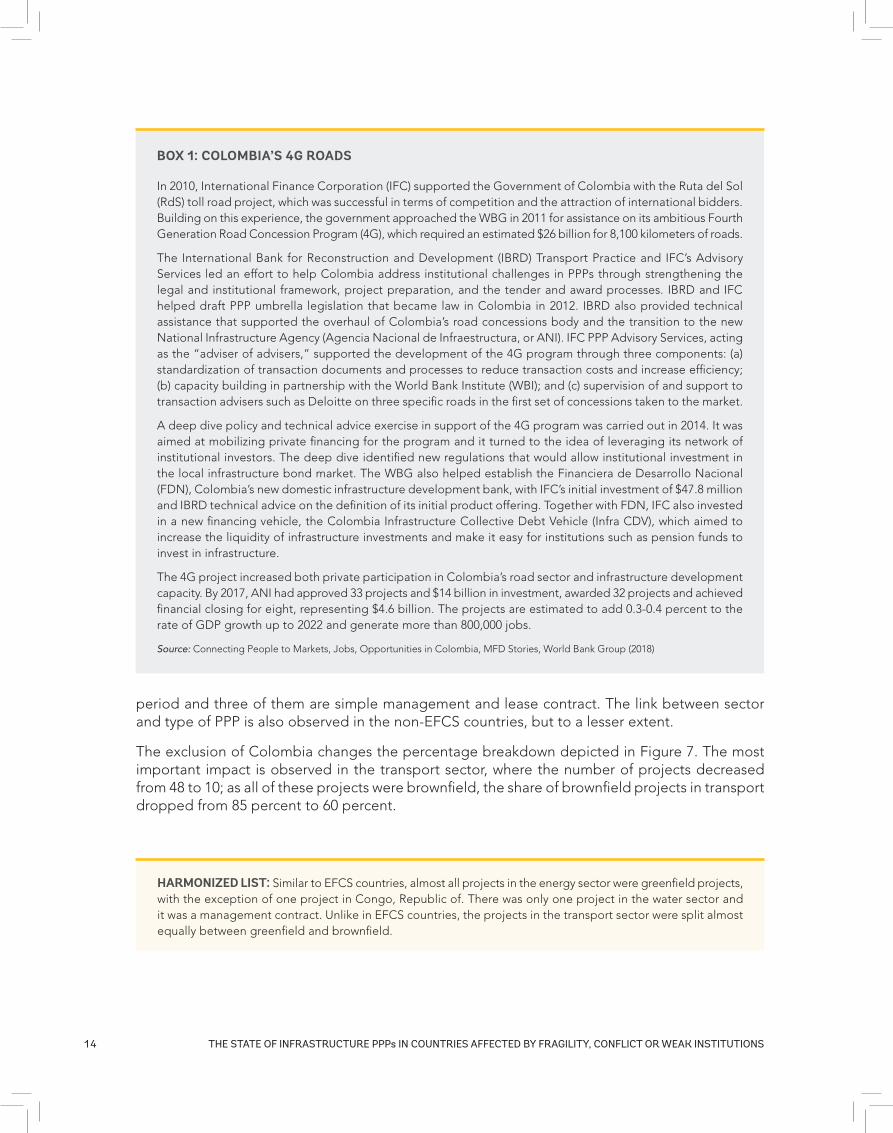
BOX 1: COLOMBIA’S 4G ROADS
In 2010, International Finance Corporation (IFC) supported the Government of Colombia with the Ruta del Sol (RdS) toll road project, which was successful in terms of competition and the attraction of international bidders. Building on this experience, the government approached the WBG in 2011 for assistance on its ambitious Fourth Generation Road Concession Program (4G), which required an estimated $26 billion for 8,100 kilometers of roads.
The International Bank for Reconstruction and Development (IBRD) Transport Practice and IFC’s Advisory Services led an effort to help Colombia address institutional challenges in PPPs through strengthening the legal and institutional framework, project preparation, and the tender and award processes. IBRD and IFC helped draft PPP umbrella legislation that became law in Colombia in 2012. IBRD also provided technical assistance that supported the overhaul of Colombia’s road concessions body and the transition to the new National Infrastructure Agency (Agencia Nacional de Infraestructura, or ANI). IFC PPP Advisory Services, acting as the “adviser of advisers,” supported the development of the 4G program through three components: (a) standardization of transaction documents and processes to reduce transaction costs and increase efficiency; (b) capacity building in partnership with the World Bank Institute (WBI); and (c) supervision of and support to transaction advisers such as Deloitte on three specific roads in the first set of concessions taken to the market.
A deep dive policy and technical advice exercise in support of the 4G program was carried out in 2014. It was aimed at mobilizing private financing for the program and it turned to the idea of leveraging its network of institutional investors. The deep dive identified new regulations that would allow institutional investment in the local infrastructure bond market. The WBG also helped establish the Financiera de Desarrollo Nacional (FDN), Colombia’s new domestic infrastructure development bank, with IFC’s initial investment of $47.8 million and IBRD technical advice on the definition of its initial product offering. Together with FDN, IFC also invested in a new financing vehicle, the Colombia Infrastructure Collective Debt Vehicle (Infra CDV), which aimed to increase the liquidity of infrastructure investments and make it easy for institutions such as pension funds to invest in infrastructure.
The 4G project increased both private participation in Colombia’s road sector and infrastructure development capacity. By 2017, ANI had approved 33 projects and $14 billion in investment, awarded 32 projects and achieved financial closing for eight, representing $4.6 billion. The projects are estimated to add 0.3-0.4 percent to the rate of GDP growth up to 2022 and generate more than 800,000 jobs.
Source: Connecting People to Markets, Jobs, Opportunities in Colombia, MFD Stories, World Bank Group (2018)
HARMONIZED LIST: Similar to EFCS countries, almost all projects in the energy sector were greenfield projects, with the exception of one project in Congo, Republic of. There was only one project in the water sector and it was a management contract. Unlike in EFCS countries, the projects in the transport sector were split almost equally between greenfield and brownfield.
1 53. InfRAStRuctuRE PPP InVEStmEntS In EfcS
UNSOLICITED PROPOSALS AND AWARD METHOD
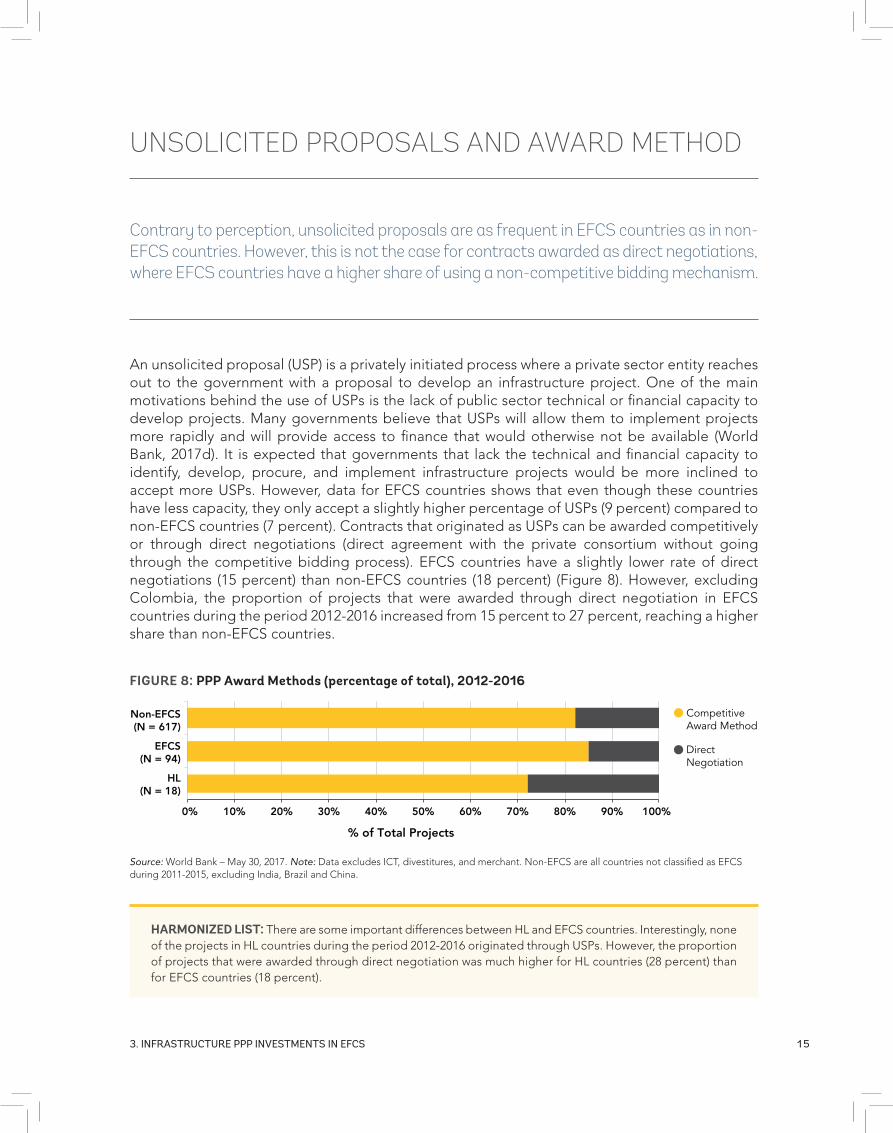
An unsolicited proposal (USP) is a privately initiated process where a private sector entity reaches out to the government with a proposal to develop an infrastructure project. One of the main motivations behind the use of USPs is the lack of public sector technical or financial capacity to develop projects. Many governments believe that USPs will allow them to implement projects more rapidly and will provide access to finance that would otherwise not be available (World Bank, 2017d). It is expected that governments that lack the technical and financial capacity to identify, develop, procure, and implement infrastructure projects would be more inclined to accept more USPs. However, data for EFCS countries shows that even though these countries have less capacity, they only accept a slightly higher percentage of USPs (9 percent) compared to non-EFCS countries (7 percent). Contracts that originated as USPs can be awarded competitively or through direct negotiations (direct agreement with the private consortium without going through the competitive bidding process). EFCS countries have a slightly lower rate of direct negotiations (15 percent) than non-EFCS countries (18 percent) (Figure 8). However, excluding Colombia, the proportion of projects that were awarded through direct negotiation in EFCS countries during the period 2012-2016 increased from 15 percent to 27 percent, reaching a higher share than non-EFCS countries.
Contrary to perception, unsolicited proposals are as frequent in EFCS countries as in non-EFCS countries. However, this is not the case for contracts awarded as direct negotiations, where EFCS countries have a higher share of using a non-competitive bidding mechanism.
FIGURE 8: PPP Award Methods (percentage of total), 2012-2016
DirectNegotiation
CompetitiveAward Method
0% 10% 20% 30% 40% 50% 60% 70% 80% 90% 100%
Non-EFCS(N = 617)
EFCS(N = 94)
HL(N = 18)
% of Total Projects
Source: World Bank – May 30, 2017. Note: Data excludes ICT, divestitures, and merchant. Non-EFCS are all countries not classified as EFCS during 2011-2015, excluding India, Brazil and China.
HARMONIZED LIST: There are some important differences between HL and EFCS countries. Interestingly, none of the projects in HL countries during the period 2012-2016 originated through USPs. However, the proportion of projects that were awarded through direct negotiation was much higher for HL countries (28 percent) than for EFCS countries (18 percent).
1 6 THE STATE OF INFRASTRUCTURE PPPs IN COUNTRIES AFFECTED BY FRAGILITY, CONFLICT OR WEAK INSTITUTIONS
GOVERNMENT SUPPORT AND GUARANTEES
Depending on the country and the project, government support takes different forms. Support can range from financial to contingent to in-kind (such as provision of land or equipment), or include broader financial mechanisms that can support the country’s PPP program or encourage financial markets to lend to projects. These latter mechanisms are particularly useful when the project does not achieve bankability or financial viability or is otherwise subject to specific risks that private investors or lenders are not well placed to manage (World Bank, 2017b). Direct government support entails government liabilities that directly cover project costs, either in cash (capital or revenue subsides) or in-kind (e.g., land). Guarantees are contingent liabilities and include: guarantees of payments, debt, revenues, exchange rate, construction cost, interest rate, and tariff rates provided by the government directly to protect the private entity or by multilateral and bilateral institutions (i.e., including political risk coverage and partial credit guarantees).
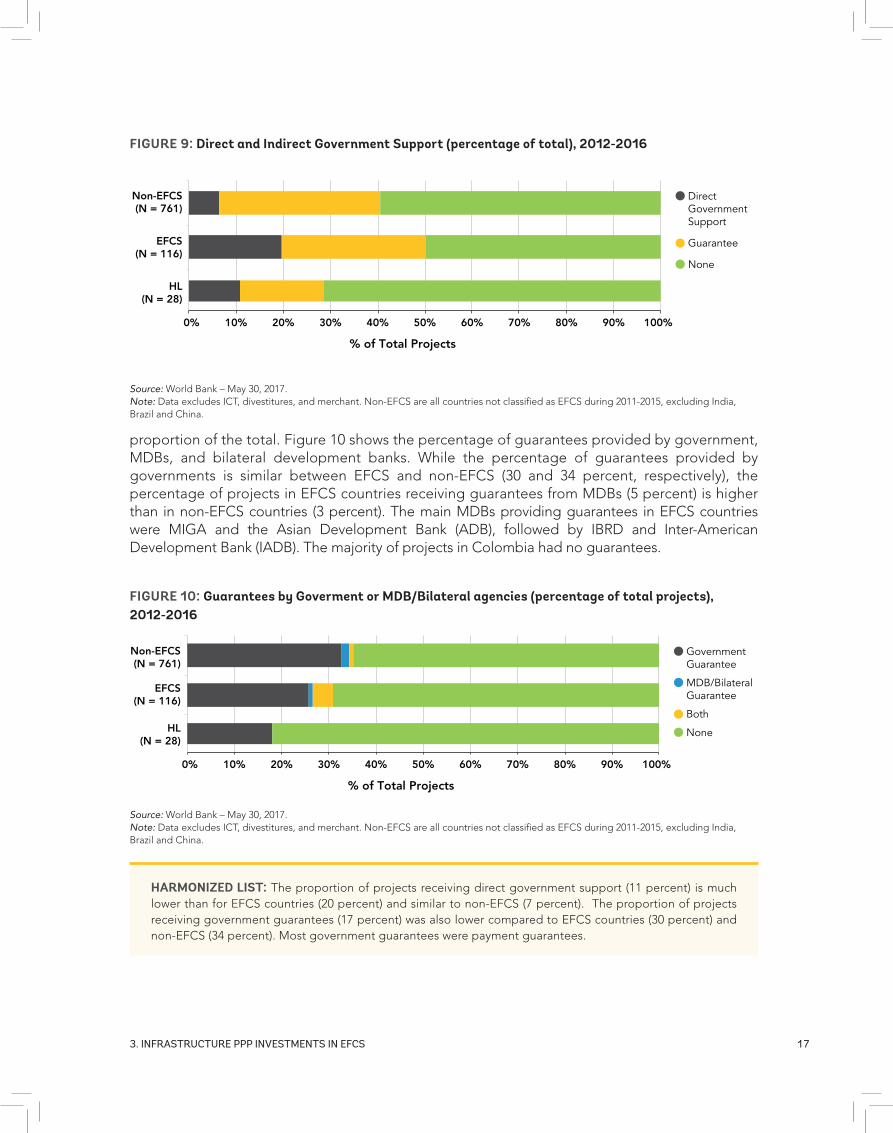
The proportion of projects receiving direct government support was higher on average for EFCS countries (20 percent) than for non-EFCS (7 percent) (Figure 9). Of 23 projects in EFCS receiving government support, 22 had incorporated a capital subsidy into the project, while one project received revenue subsidies. In non-EFCS countries, the proportion was similar between projects receiving capital and revenue subsidies. This high proportion of direct government support was due mainly to projects in Colombia; without Colombia, the proportion of projects receiving such support dropped to 7 percent, similar to that of non-EFCS countries.
Indirect government support has also played an important role in the financial structuring of PPP projects in EFCS countries. However, the percentage of projects receiving government guarantees in EFCS countries (30 percent) is very similar to the percentage of projects in non-EFCS (34 percent). According to the Multilateral Investment Guarantee Agency (MIGA) presentation delivered at the WBG Donor Forum in Paris (May 2010), it is clear that existing political risk insurance options are not adequate to mobilize large amounts of investment in these countries. More businesses are interested in investing in FCS than are currently doing so; high risk and limited risk-mitigating options discourage them from engaging in these countries (Porter, 2011).
The breakdown of guarantees shows that the majority of guarantees in EFCS countries are payment guarantees (72 percent), with revenue guarantees the next most frequent (13 percent), a pattern that it is also observed in non-EFCS. However, exchange rate and interest rate guarantees were more frequent in projects in EFCS countries. There was only one project with construction cost guarantees in the period 2012-2016 (Loboguerrero - Buga Toll Road) and it was in Colombia.
In addition to government guarantees, international financial institutions (IFIs) have been growing in their support of PPP projects through guarantees; however, IFI guarantees still make up a small
The proportion of projects receiving direct government support was higher for EFCS countries than for non-EFCS and the support in EFCS was almost exclusively capital subsidies. The proportion of projects receiving guarantees did not differ between the two groups. However, exchange rate, interest rate, and construction cost guarantees were more frequent in projects in EFCS countries.
1 73. InfRAStRuctuRE PPP InVEStmEntS In EfcS
proportion of the total. Figure 10 shows the percentage of guarantees provided by government, MDBs, and bilateral development banks. While the percentage of guarantees provided by governments is similar between EFCS and non-EFCS (30 and 34 percent, respectively), the percentage of projects in EFCS countries receiving guarantees from MDBs (5 percent) is higher than in non-EFCS countries (3 percent). The main MDBs providing guarantees in EFCS countries were MIGA and the Asian Development Bank (ADB), followed by IBRD and Inter-American Development Bank (IADB). The majority of projects in Colombia had no guarantees.
FIGURE 10: Guarantees by Goverment or MDB/Bilateral agencies (percentage of total projects), 2012-2016
Both
GovernmentGuarantee
MDB/BilateralGuarantee
None
0% 10% 20% 30% 40% 50% 60% 70% 80% 90% 100%
Non-EFCS(N = 761)
EFCS(N = 116)
HL(N = 28)
% of Total Projects
Source: World Bank – May 30, 2017.Note: Data excludes ICT, divestitures, and merchant. Non-EFCS are all countries not classified as EFCS during 2011-2015, excluding India, Brazil and China.
HARMONIZED LIST: The proportion of projects receiving direct government support (11 percent) is much lower than for EFCS countries (20 percent) and similar to non-EFCS (7 percent). The proportion of projects receiving government guarantees (17 percent) was also lower compared to EFCS countries (30 percent) and non-EFCS (34 percent). Most government guarantees were payment guarantees.
FIGURE 9: Direct and Indirect Government Support (percentage of total), 2012-2016
Guarantee
DirectGovernmentSupport
None
0% 10% 20% 30% 40% 50% 60% 70% 80% 90% 100%
Non-EFCS(N = 761)
EFCS(N = 116)
HL(N = 28)
% of Total Projects
Source: World Bank – May 30, 2017.Note: Data excludes ICT, divestitures, and merchant. Non-EFCS are all countries not classified as EFCS during 2011-2015, excluding India, Brazil and China.
1 8 THE STATE OF INFRASTRUCTURE PPPs IN COUNTRIES AFFECTED BY FRAGILITY, CONFLICT OR WEAK INSTITUTIONS
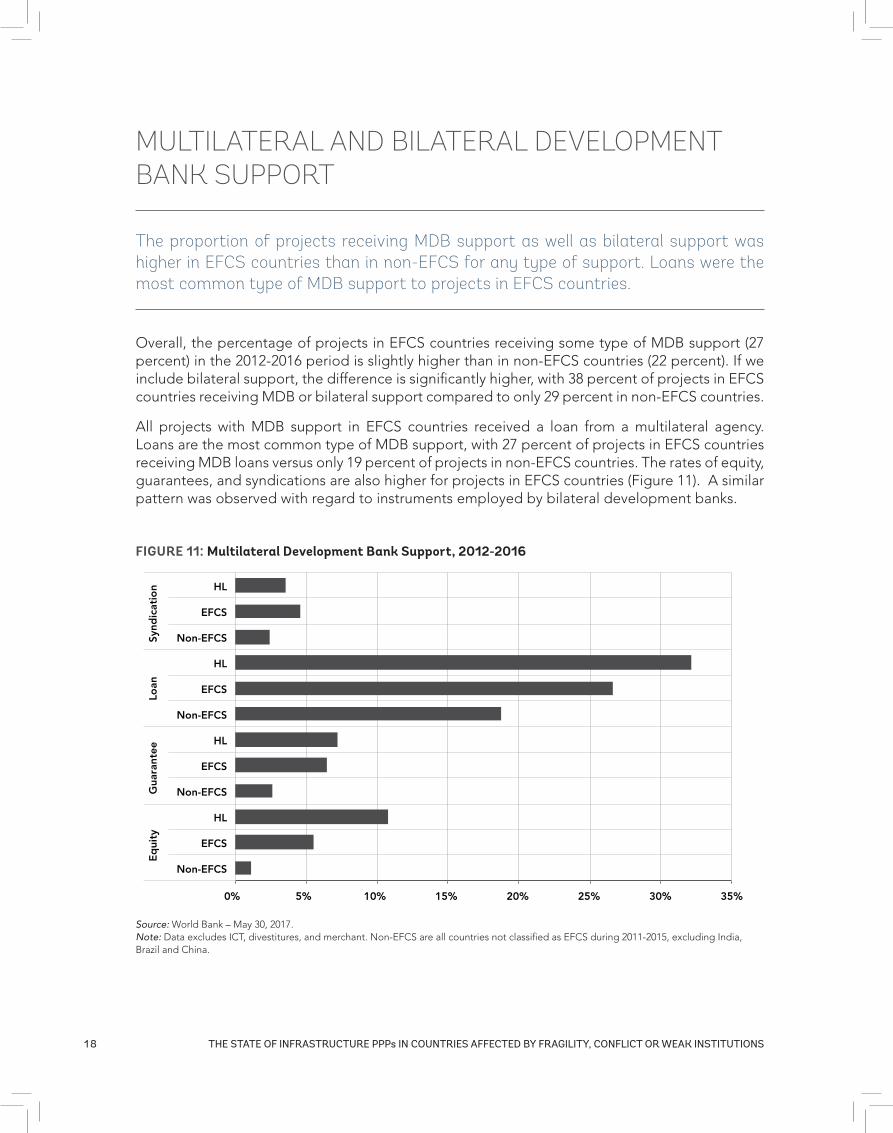
MULTILATERAL AND BILATERAL DEVELOPMENT BANK SUPPORT
Overall, the percentage of projects in EFCS countries receiving some type of MDB support (27 percent) in the 2012-2016 period is slightly higher than in non-EFCS countries (22 percent). If we include bilateral support, the difference is significantly higher, with 38 percent of projects in EFCS countries receiving MDB or bilateral support compared to only 29 percent in non-EFCS countries.
All projects with MDB support in EFCS countries received a loan from a multilateral agency. Loans are the most common type of MDB support, with 27 percent of projects in EFCS countries receiving MDB loans versus only 19 percent of projects in non-EFCS countries. The rates of equity, guarantees, and syndications are also higher for projects in EFCS countries (Figure 11). A similar pattern was observed with regard to instruments employed by bilateral development banks.
The proportion of projects receiving MDB support as well as bilateral support was higher in EFCS countries than in non-EFCS for any type of support. Loans were the most common type of MDB support to projects in EFCS countries.
FIGURE 11: Multilateral Development Bank Support, 2012-2016
0% 5% 10% 15% 20% 25% 30% 35%
Non-EFCS
EFCS
HL
Non-EFCS
EFCS
HL
Non-EFCS
EFCS
HL
Non-EFCS
EFCS
HL
Eq
uity
G
uara
ntee
Lo
an
Synd
icat
ion
Source: World Bank – May 30, 2017.Note: Data excludes ICT, divestitures, and merchant. Non-EFCS are all countries not classified as EFCS during 2011-2015, excluding India, Brazil and China.
1 93. InfRAStRuctuRE PPP InVEStmEntS In EfcS
MDB support for projects in EFCS countries was mainly concentrated in renewable energy. Only three out of the 31 projects receiving MDB support in the 2012-2016 period were in low-income countries: Nepal (2) and Haiti (1). Most of the support went to projects in lower-middle-income countries (16), with the next highest level of support seen in upper-middle-income countries (13). The countries receiving MDB support included Colombia (6 projects), Cote d’Ivoire (3), Georgia (1), Haiti (1), Iraq (1), and Myanmar (1). The remaining projects belong to countries that cannot be publicly disclosed.17
The top three MDBs providing support for PPP projects in EFCS countries were IFC (12 projects), ADB (10 projects), and Islamic Development Bank (IDB) (5 projects).
WORLD BANK GROUP SUPPORT
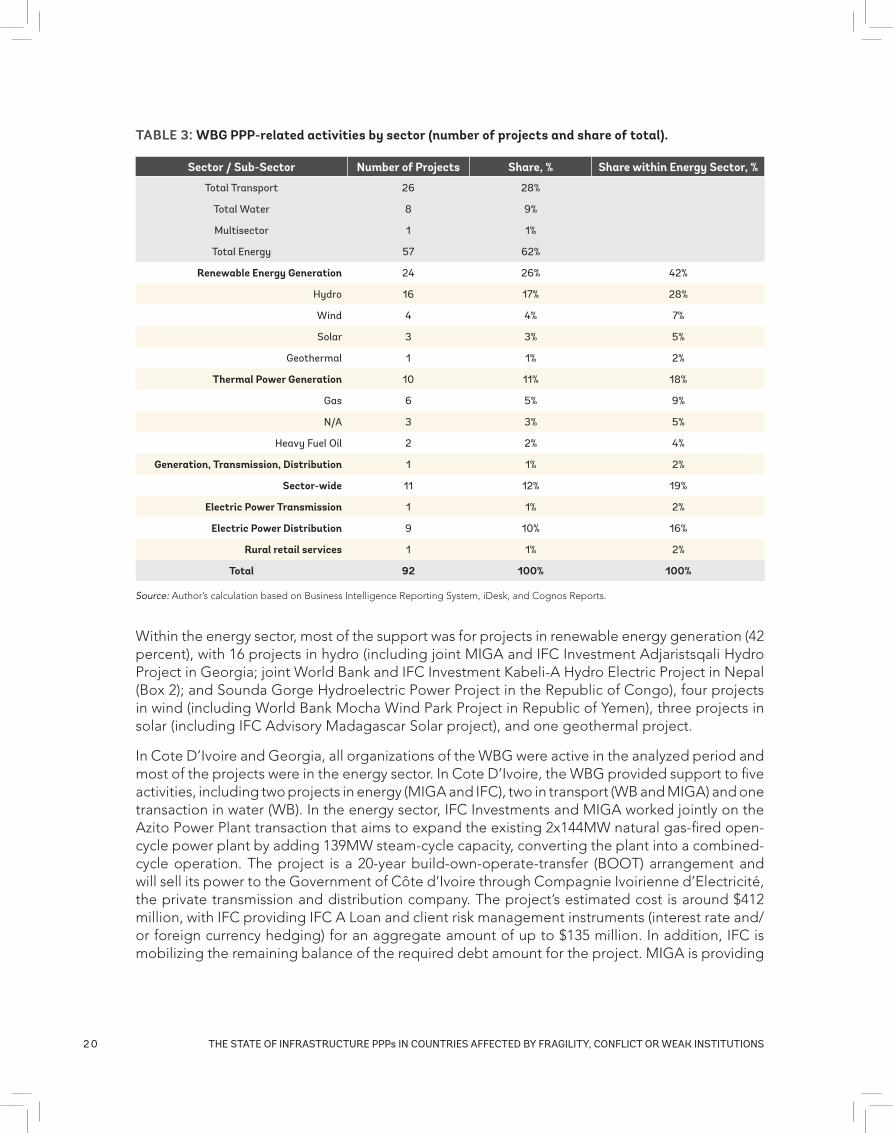
While the PPI database presents financial support provided by the MDBs in projects that have reached financial closure, data from the WBG for energy, transport, and water and sanitation shows that support for the development of PPP markets in FCS countries went beyond financial support. During the same period of analysis (2012-2016), the WBG has approved a total of 92 activities (technical support and investments for PPPs) in 35 of the 61 FCS countries. All agencies of the WBG had PPP-related activities: 47 WBG activities; 20 IFC Advisory; 17 IFC Investments; and 8 MIGA guarantees against risks of transfer restriction, expropriation, war and civil disturbance, and breach of contract. (See Annex II.)
Some interesting patterns emerge from the data. As also observed in the PPI database, the majority of WBG support in infrastructure has been concentrated in the energy sector (62 percent), followed by transport (28 percent), and water and sanitation (9 percent). (See table 3.) The largest projects in terms of commitments from the WBG were also in the energy sector, and included Mass Global Energy Sulimaniya (MGES) Power in Iraq; National Electrification Project in Myanmar; Ciprel IV transaction in Cote d’Ivoire; Azito Phase 3 in Cote d’Ivoire; and Adjaristsqali Hydro Project in Georgia.
17 See discussion of expanded countries and disclosure on pp.5-7.
The WBG provided technical support in addition to financial assistance. All agencies of the WBG had activities during the analyzed period and one third of the activities were concentrated in 15 countries that did not have any PPP reaching financial closure in the 2012-2016 period.
HARMONIZED LIST: The proportion of projects receiving MDB support (32 percent) is higher than for EFCS countries (27 percent), a share that increases when both MDB and bilateral support (46 percent compared to 38 percent for EFCS) are included. As in the case of EFCS, the majority of MDB and bilateral support was in the form of loans.
2 0 THE STATE OF INFRASTRUCTURE PPPs IN COUNTRIES AFFECTED BY FRAGILITY, CONFLICT OR WEAK INSTITUTIONS
TABLE 3: WBG PPP-related activities by sector (number of projects and share of total).
Sector / Sub-Sector Number of Projects Share, % Share within Energy Sector, %
total transport 26 28%
total Water 8 9%
multisector 1 1%
total Energy 57 62%
Renewable Energy Generation 24 26% 42%
Hydro 16 17% 28%
Wind 4 4% 7%
Solar 3 3% 5%
Geothermal 1 1% 2%
Thermal Power Generation 10 11% 18%
Gas 6 5% 9%
n/A 3 3% 5%
Heavy fuel oil 2 2% 4%
Generation, Transmission, Distribution 1 1% 2%
Sector-wide 11 12% 19%
Electric Power Transmission 1 1% 2%
Electric Power Distribution 9 10% 16%
Rural retail services 1 1% 2%
Total 92 100% 100%
Source: Author’s calculation based on Business Intelligence Reporting System, iDesk, and Cognos Reports.
Within the energy sector, most of the support was for projects in renewable energy generation (42 percent), with 16 projects in hydro (including joint MIGA and IFC Investment Adjaristsqali Hydro Project in Georgia; joint World Bank and IFC Investment Kabeli-A Hydro Electric Project in Nepal (Box 2); and Sounda Gorge Hydroelectric Power Project in the Republic of Congo), four projects in wind (including World Bank Mocha Wind Park Project in Republic of Yemen), three projects in solar (including IFC Advisory Madagascar Solar project), and one geothermal project.
In Cote D’Ivoire and Georgia, all organizations of the WBG were active in the analyzed period and most of the projects were in the energy sector. In Cote D’Ivoire, the WBG provided support to five activities, including two projects in energy (MIGA and IFC), two in transport (WB and MIGA) and one transaction in water (WB). In the energy sector, IFC Investments and MIGA worked jointly on the Azito Power Plant transaction that aims to expand the existing 2x144MW natural gas-fired open-cycle power plant by adding 139MW steam-cycle capacity, converting the plant into a combined-cycle operation. The project is a 20-year build-own-operate-transfer (BOOT) arrangement and will sell its power to the Government of Côte d’Ivoire through Compagnie Ivoirienne d’Electricité, the private transmission and distribution company. The project’s estimated cost is around $412 million, with IFC providing IFC A Loan and client risk management instruments (interest rate and/or foreign currency hedging) for an aggregate amount of up to $135 million. In addition, IFC is mobilizing the remaining balance of the required debt amount for the project. MIGA is providing
2 13. InfRAStRuctuRE PPP InVEStmEntS In EfcS
guarantees for $116 million covering an investment of the project sponsor for a period of up to 20 years against risk of breach of contract.
Similarly, in Georgia, all organizations within the WBG were involved in the energy sector (two projects), and there was one activity in transport. In energy, IFC Investments and MIGA together supported the Shuakhevi Hydropower Project. (See Box 3.)
IFC Advisory provided transaction support to the Nenskra Hydro Power Plant (HPP), which is a high head 210MW hydropower project on the Nenskra River in the Svaneti District in Georgia. IFC stepped in with options for development of the HPP as an independent power producer (IPP) after a detailed feasibility study was produced in May 2011 by the Swiss engineering consulting firm Stucky.
Importantly, one third of the activities approved by the WBG during the 2012-2016 period were concentrated in 15 countries that did not have any infrastructure PPP projects reaching financial closure in the 2012-2016 period (Afghanistan; Burundi; the Democratic Republic of Congo; Djibouti; Guinea; Guinea-Bissau; Lebanon; Libya; Madagascar; Malawi; Mali; Myanmar; Tajikistan;
BOX 3: SHUAKHEVI HYDROPOWER PROJECT IN GEORGIA
A joint IFC Investments and MIGA operation in Georgia, Shuakhevi Hydropower Project, involves construction and operation of a 188 MW power plant, consisting of the 179 MW Shuakhevi plant and the 9 megawatt Skhalta plant.
This is a multi-donor operation, as the European Bank for Reconstruction and Development (EBRD) and the ADB are providing debt financing for the project.
Total project cost is estimated at $427 million ($367 million, excluding financing costs), and is expected to be financed via: senior loans from IFC, EBRD, and ADB for $80 million, $90 million, and $90 million respectively; IFC B loan and parallel loans of $40 million; and sponsor equity of $127 million.
MIGA first supported this project in 2015 via a 15-year guarantee of $63 million covering an equity investment in the project. In 2016, the investor applied for a MIGA guarantee of up to $50 million for up to 15 years against the risks of expropriation, war and civil disturbance, and breach of contract.
BOX 2: KABELI-A HYDRO ELECTRIC PROJECT IN NEPAL
A joint World Bank/IFC investment, the Kabeli project in Nepal, is a peaking run-of-river hydropower project with an installed capacity of 37.6 MW and average annual saleable energy output of 205.2 GWh to be developed on a build-own-operate-transfer (BOOT) basis with energy sold under a 25-year PPA with a national power utility as an off-taker. It is located at Panchthar District in the Eastern Development Region of Nepal. The energy output will be evacuated via 132 kV transmission line, a separate project under construction with IDA financing.
The total cost of the proposed operation, including funding for a senior debt service reserve account of $2.63 million, is estimated at $102.6 million. The proposed financing plan includes: (a) a KEL (private project developer) equity of $23.1 million (22.5 percent); (b) an IDA Credit of $40.0 million (38.9 percent) for on-lending to KEL as a subordinated loan; (c) an IFC senior loan of up to $38.6 million to KEL (37.6 percent, including an A Loan of up to $19.3 million and a senior CCCP Loan of up to $19.3 million); and (d) a senior local commercial bank loan of $1 million to KEL (1.0 percent).
2 2 THE STATE OF INFRASTRUCTURE PPPs IN COUNTRIES AFFECTED BY FRAGILITY, CONFLICT OR WEAK INSTITUTIONS
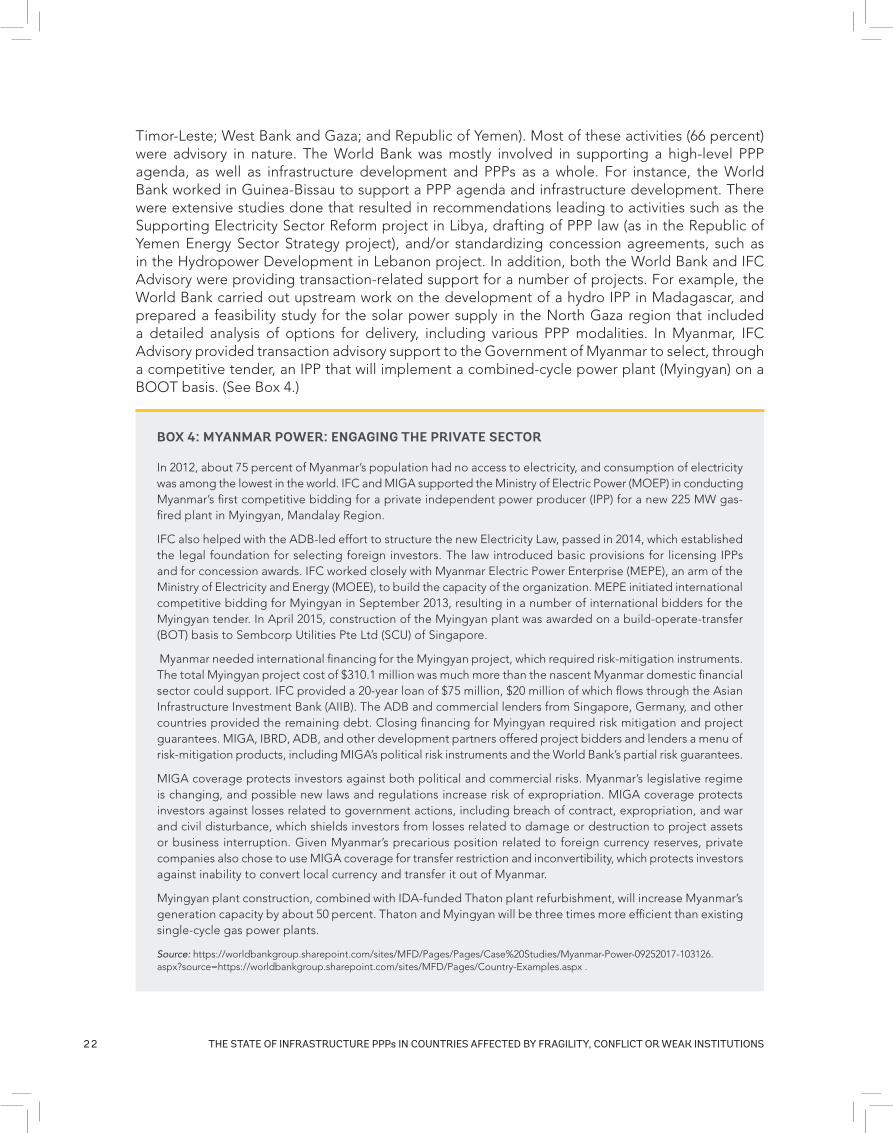
Timor-Leste; West Bank and Gaza; and Republic of Yemen). Most of these activities (66 percent) were advisory in nature. The World Bank was mostly involved in supporting a high-level PPP agenda, as well as infrastructure development and PPPs as a whole. For instance, the World Bank worked in Guinea-Bissau to support a PPP agenda and infrastructure development. There were extensive studies done that resulted in recommendations leading to activities such as the Supporting Electricity Sector Reform project in Libya, drafting of PPP law (as in the Republic of Yemen Energy Sector Strategy project), and/or standardizing concession agreements, such as in the Hydropower Development in Lebanon project. In addition, both the World Bank and IFC Advisory were providing transaction-related support for a number of projects. For example, the World Bank carried out upstream work on the development of a hydro IPP in Madagascar, and prepared a feasibility study for the solar power supply in the North Gaza region that included a detailed analysis of options for delivery, including various PPP modalities. In Myanmar, IFC Advisory provided transaction advisory support to the Government of Myanmar to select, through a competitive tender, an IPP that will implement a combined-cycle power plant (Myingyan) on a BOOT basis. (See Box 4.)
BOX 4: MYANMAR POWER: ENGAGING THE PRIVATE SECTOR
In 2012, about 75 percent of Myanmar’s population had no access to electricity, and consumption of electricity was among the lowest in the world. IFC and MIGA supported the Ministry of Electric Power (MOEP) in conducting Myanmar’s first competitive bidding for a private independent power producer (IPP) for a new 225 MW gas-fired plant in Myingyan, Mandalay Region.
IFC also helped with the ADB-led effort to structure the new Electricity Law, passed in 2014, which established the legal foundation for selecting foreign investors. The law introduced basic provisions for licensing IPPs and for concession awards. IFC worked closely with Myanmar Electric Power Enterprise (MEPE), an arm of the Ministry of Electricity and Energy (MOEE), to build the capacity of the organization. MEPE initiated international competitive bidding for Myingyan in September 2013, resulting in a number of international bidders for the Myingyan tender. In April 2015, construction of the Myingyan plant was awarded on a build-operate-transfer (BOT) basis to Sembcorp Utilities Pte Ltd (SCU) of Singapore.
Myanmar needed international financing for the Myingyan project, which required risk-mitigation instruments. The total Myingyan project cost of $310.1 million was much more than the nascent Myanmar domestic financial sector could support. IFC provided a 20-year loan of $75 million, $20 million of which flows through the Asian Infrastructure Investment Bank (AIIB). The ADB and commercial lenders from Singapore, Germany, and other countries provided the remaining debt. Closing financing for Myingyan required risk mitigation and project guarantees. MIGA, IBRD, ADB, and other development partners offered project bidders and lenders a menu of risk-mitigation products, including MIGA’s political risk instruments and the World Bank’s partial risk guarantees.
MIGA coverage protects investors against both political and commercial risks. Myanmar’s legislative regime is changing, and possible new laws and regulations increase risk of expropriation. MIGA coverage protects investors against losses related to government actions, including breach of contract, expropriation, and war and civil disturbance, which shields investors from losses related to damage or destruction to project assets or business interruption. Given Myanmar’s precarious position related to foreign currency reserves, private companies also chose to use MIGA coverage for transfer restriction and inconvertibility, which protects investors against inability to convert local currency and transfer it out of Myanmar.
Myingyan plant construction, combined with IDA-funded Thaton plant refurbishment, will increase Myanmar’s generation capacity by about 50 percent. Thaton and Myingyan will be three times more efficient than existing single-cycle gas power plants.
Source: https://worldbankgroup.sharepoint.com/sites/MFD/Pages/Pages/Case%20Studies/Myanmar-Power-09252017-103126.aspx?source=https://worldbankgroup.sharepoint.com/sites/MFD/Pages/Country-Examples.aspx .
2 33. InfRAStRuctuRE PPP InVEStmEntS In EfcS
In Afghanistan, IFC Advisory provided transaction advisory support to the national power utility to assist a private sector operator in operating, managing, and maintaining the electrical transmission and distribution network. The aims under the management contract are to reduce technical distribution and transmission losses, improve the management of donor-funded capital enhancements programs, and improve billing and collections.
In Timor-Leste, IFC Advisory was supporting the transport sector to structure and implement PPP projects for the Dili Airport and the Tibar Bay port. (See Box 5.)
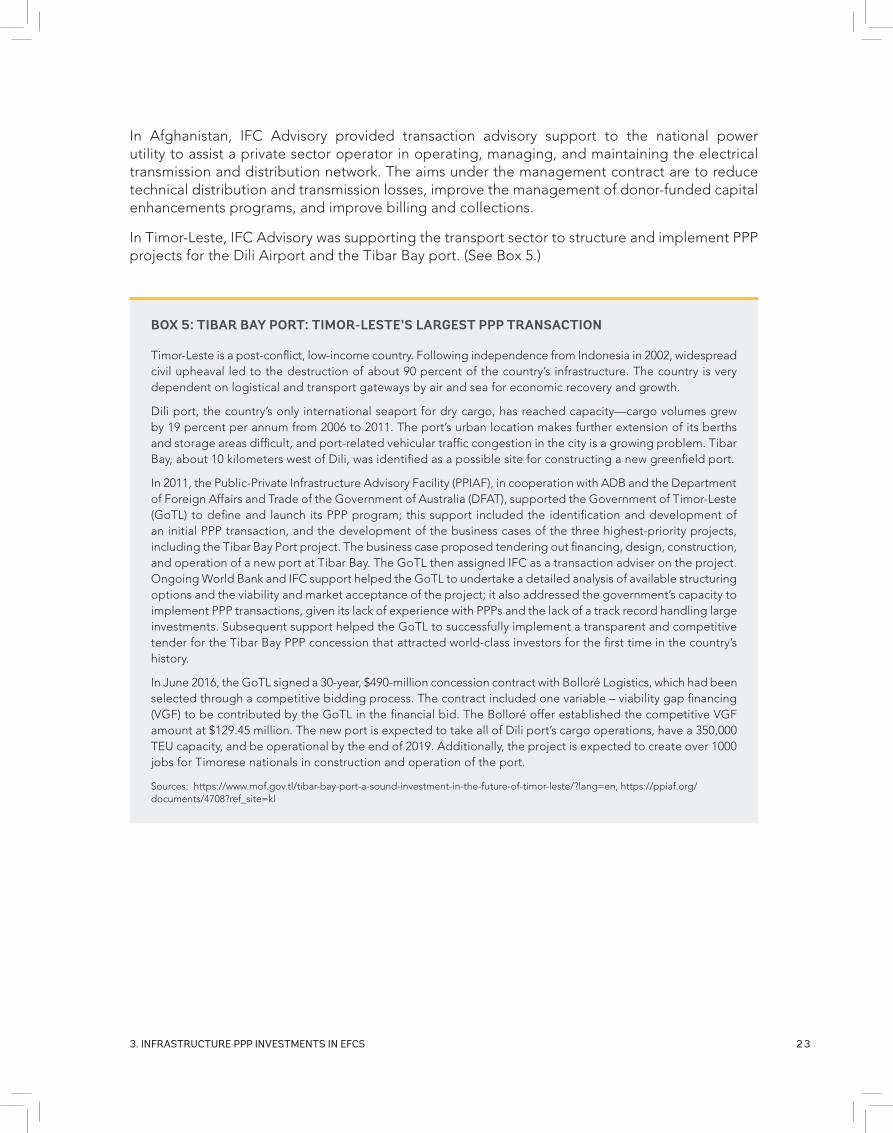
BOX 5: TIBAR BAY PORT: TIMOR-LESTE’S LARGEST PPP TRANSACTION
Timor-Leste is a post-conflict, low-income country. Following independence from Indonesia in 2002, widespread civil upheaval led to the destruction of about 90 percent of the country’s infrastructure. The country is very dependent on logistical and transport gateways by air and sea for economic recovery and growth.
Dili port, the country’s only international seaport for dry cargo, has reached capacity—cargo volumes grew by 19 percent per annum from 2006 to 2011. The port’s urban location makes further extension of its berths and storage areas difficult, and port-related vehicular traffic congestion in the city is a growing problem. Tibar Bay, about 10 kilometers west of Dili, was identified as a possible site for constructing a new greenfield port.
In 2011, the Public-Private Infrastructure Advisory Facility (PPIAF), in cooperation with ADB and the Department of Foreign Affairs and Trade of the Government of Australia (DFAT), supported the Government of Timor-Leste (GoTL) to define and launch its PPP program; this support included the identification and development of an initial PPP transaction, and the development of the business cases of the three highest-priority projects, including the Tibar Bay Port project. The business case proposed tendering out financing, design, construction, and operation of a new port at Tibar Bay. The GoTL then assigned IFC as a transaction adviser on the project. Ongoing World Bank and IFC support helped the GoTL to undertake a detailed analysis of available structuring options and the viability and market acceptance of the project; it also addressed the government’s capacity to implement PPP transactions, given its lack of experience with PPPs and the lack of a track record handling large investments. Subsequent support helped the GoTL to successfully implement a transparent and competitive tender for the Tibar Bay PPP concession that attracted world-class investors for the first time in the country’s history.
In June 2016, the GoTL signed a 30-year, $490-million concession contract with Bolloré Logistics, which had been selected through a competitive bidding process. The contract included one variable – viability gap financing (VGF) to be contributed by the GoTL in the financial bid. The Bolloré offer established the competitive VGF amount at $129.45 million. The new port is expected to take all of Dili port’s cargo operations, have a 350,000 TEU capacity, and be operational by the end of 2019. Additionally, the project is expected to create over 1000 jobs for Timorese nationals in construction and operation of the port.
Sources: https://www.mof.gov.tl/tibar-bay-port-a-sound-investment-in-the-future-of-timor-leste/?lang=en, https://ppiaf.org/documents/4708?ref_site=kl
2 4 THE STATE OF INFRASTRUCTURE PPPs IN COUNTRIES AFFECTED BY FRAGILITY, CONFLICT OR WEAK INSTITUTIONS
FIGURE 12A: Source of Financing for PPP Projects in Non-EFCS Countries (percentage of investments), 2012-2016 (N=313)
Public Equity1%
Commercial36%
Bilateral15%
Multilateral9%
Public12%
Debt72%
Direct GovernmentSupport
26%
FINANCING
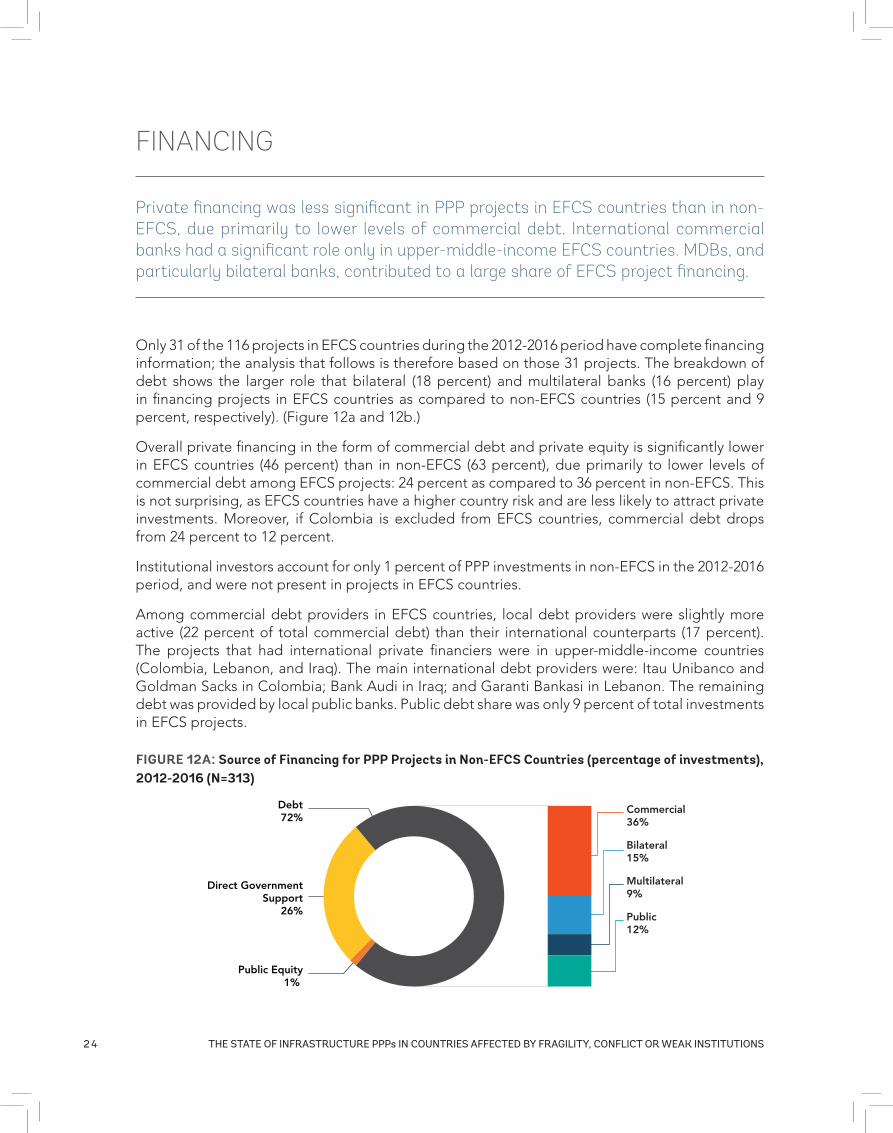
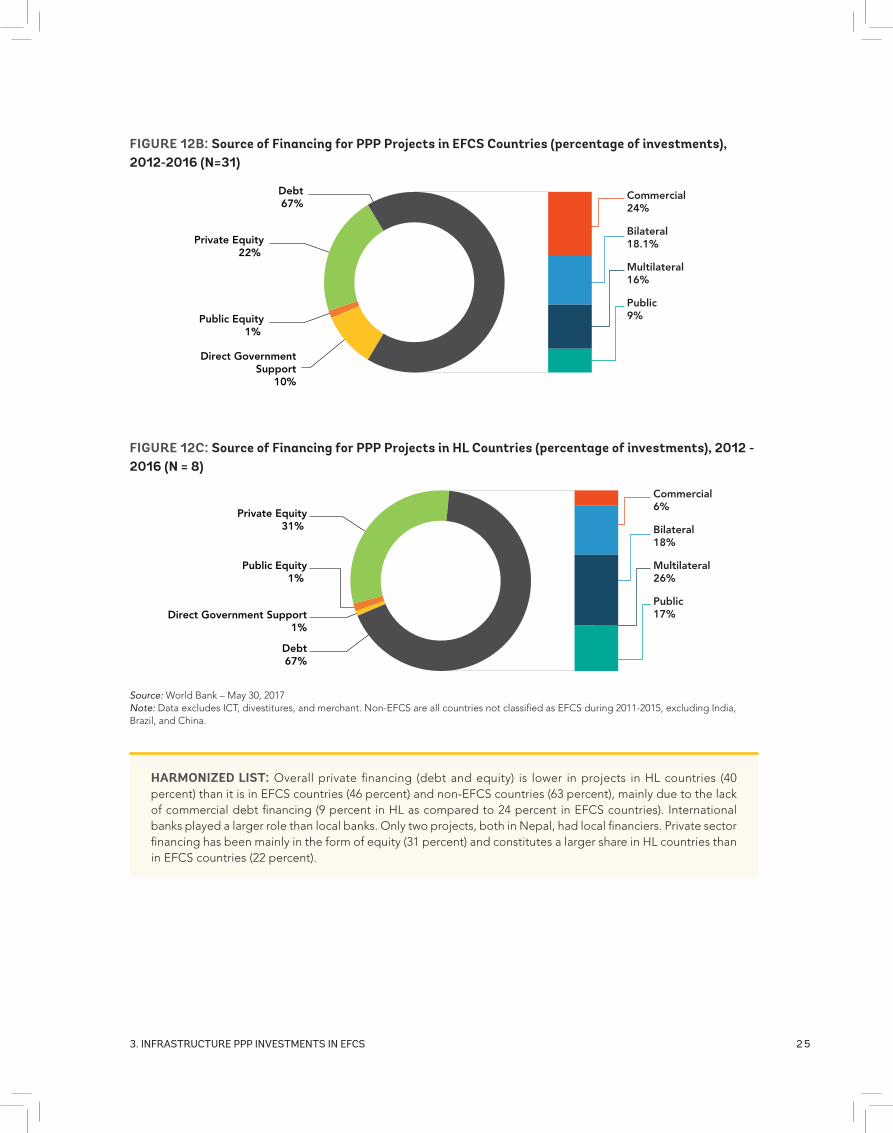
Only 31 of the 116 projects in EFCS countries during the 2012-2016 period have complete financing information; the analysis that follows is therefore based on those 31 projects. The breakdown of debt shows the larger role that bilateral (18 percent) and multilateral banks (16 percent) play in financing projects in EFCS countries as compared to non-EFCS countries (15 percent and 9 percent, respectively). (Figure 12a and 12b.)
Overall private financing in the form of commercial debt and private equity is significantly lower in EFCS countries (46 percent) than in non-EFCS (63 percent), due primarily to lower levels of commercial debt among EFCS projects: 24 percent as compared to 36 percent in non-EFCS. This is not surprising, as EFCS countries have a higher country risk and are less likely to attract private investments. Moreover, if Colombia is excluded from EFCS countries, commercial debt drops from 24 percent to 12 percent.
Institutional investors account for only 1 percent of PPP investments in non-EFCS in the 2012-2016 period, and were not present in projects in EFCS countries.
Among commercial debt providers in EFCS countries, local debt providers were slightly more active (22 percent of total commercial debt) than their international counterparts (17 percent). The projects that had international private financiers were in upper-middle-income countries (Colombia, Lebanon, and Iraq). The main international debt providers were: Itau Unibanco and Goldman Sacks in Colombia; Bank Audi in Iraq; and Garanti Bankasi in Lebanon. The remaining debt was provided by local public banks. Public debt share was only 9 percent of total investments in EFCS projects.
Private financing was less significant in PPP projects in EFCS countries than in non-EFCS, due primarily to lower levels of commercial debt. International commercial banks had a significant role only in upper-middle-income EFCS countries. MDBs, and particularly bilateral banks, contributed to a large share of EFCS project financing.
2 53. InfRAStRuctuRE PPP InVEStmEntS In EfcS
HARMONIZED LIST: Overall private financing (debt and equity) is lower in projects in HL countries (40 percent) than it is in EFCS countries (46 percent) and non-EFCS countries (63 percent), mainly due to the lack of commercial debt financing (9 percent in HL as compared to 24 percent in EFCS countries). International banks played a larger role than local banks. Only two projects, both in Nepal, had local financiers. Private sector financing has been mainly in the form of equity (31 percent) and constitutes a larger share in HL countries than in EFCS countries (22 percent).
FIGURE 12B: Source of Financing for PPP Projects in EFCS Countries (percentage of investments), 2012-2016 (N=31)
Public Equity1%
Private Equity22%
Commercial24%
Bilateral18.1%
Multilateral16%
Public9%
Debt67%
Direct GovernmentSupport
10%
FIGURE 12C: Source of Financing for PPP Projects in HL Countries (percentage of investments), 2012 - 2016 (N = 8)
Public Equity1%
Private Equity31%
Commercial6%
Bilateral18%
Multilateral26%
Public17%
Debt67%
Direct Government Support1%
Source: World Bank – May 30, 2017Note: Data excludes ICT, divestitures, and merchant. Non-EFCS are all countries not classified as EFCS during 2011-2015, excluding India, Brazil, and China.
2 6 THE STATE OF INFRASTRUCTURE PPPs IN COUNTRIES AFFECTED BY FRAGILITY, CONFLICT OR WEAK INSTITUTIONS
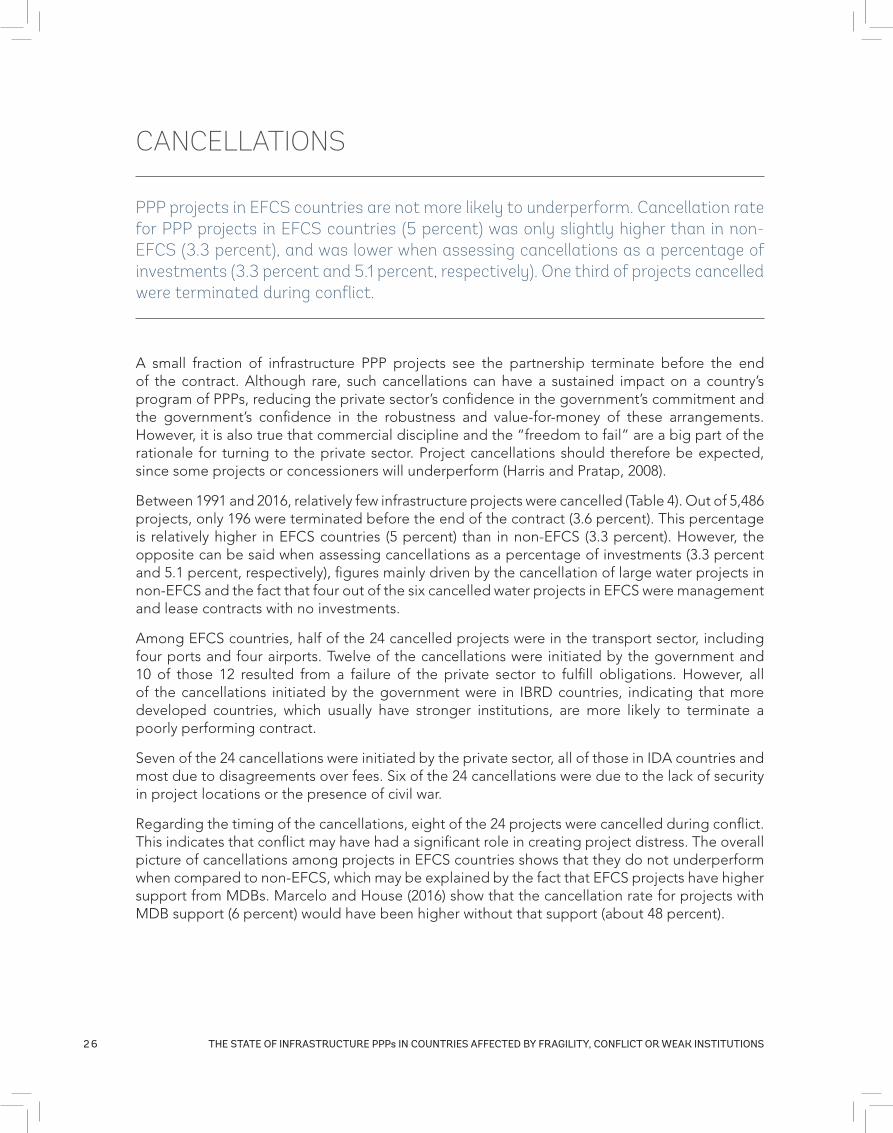
CANCELLATIONS
A small fraction of infrastructure PPP projects see the partnership terminate before the end of the contract. Although rare, such cancellations can have a sustained impact on a country’s program of PPPs, reducing the private sector’s confidence in the government’s commitment and the government’s confidence in the robustness and value-for-money of these arrangements. However, it is also true that commercial discipline and the “freedom to fail” are a big part of the rationale for turning to the private sector. Project cancellations should therefore be expected, since some projects or concessioners will underperform (Harris and Pratap, 2008).
Between 1991 and 2016, relatively few infrastructure projects were cancelled (Table 4). Out of 5,486 projects, only 196 were terminated before the end of the contract (3.6 percent). This percentage is relatively higher in EFCS countries (5 percent) than in non-EFCS (3.3 percent). However, the opposite can be said when assessing cancellations as a percentage of investments (3.3 percent and 5.1 percent, respectively), figures mainly driven by the cancellation of large water projects in non-EFCS and the fact that four out of the six cancelled water projects in EFCS were management and lease contracts with no investments.
Among EFCS countries, half of the 24 cancelled projects were in the transport sector, including four ports and four airports. Twelve of the cancellations were initiated by the government and 10 of those 12 resulted from a failure of the private sector to fulfill obligations. However, all of the cancellations initiated by the government were in IBRD countries, indicating that more developed countries, which usually have stronger institutions, are more likely to terminate a poorly performing contract.
Seven of the 24 cancellations were initiated by the private sector, all of those in IDA countries and most due to disagreements over fees. Six of the 24 cancellations were due to the lack of security in project locations or the presence of civil war.
Regarding the timing of the cancellations, eight of the 24 projects were cancelled during conflict. This indicates that conflict may have had a significant role in creating project distress. The overall picture of cancellations among projects in EFCS countries shows that they do not underperform when compared to non-EFCS, which may be explained by the fact that EFCS projects have higher support from MDBs. Marcelo and House (2016) show that the cancellation rate for projects with MDB support (6 percent) would have been higher without that support (about 48 percent).
PPP projects in EFCS countries are not more likely to underperform. Cancellation rate for PPP projects in EFCS countries (5 percent) was only slightly higher than in non-EFCS (3.3 percent), and was lower when assessing cancellations as a percentage of investments (3.3 percent and 5.1 percent, respectively). One third of projects cancelled were terminated during conflict.
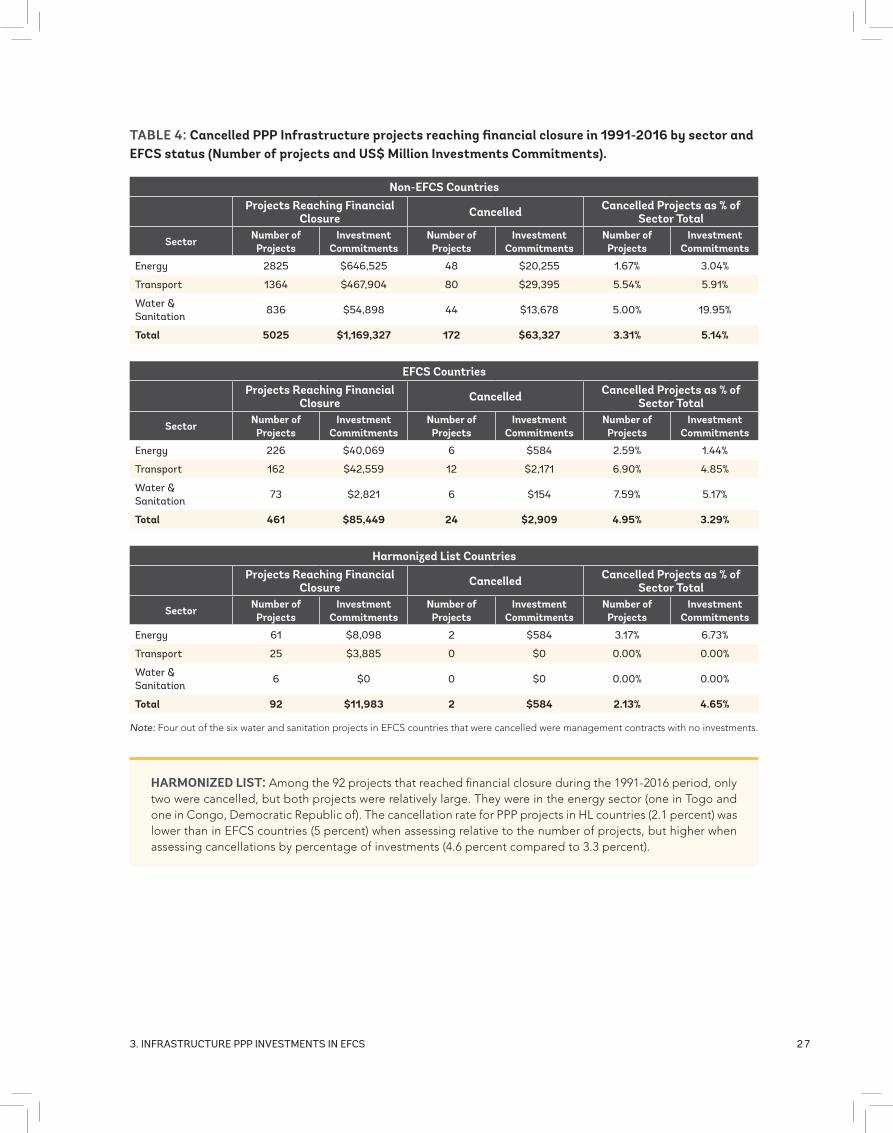
2 73. InfRAStRuctuRE PPP InVEStmEntS In EfcS
TABLE 4: Cancelled PPP Infrastructure projects reaching financial closure in 1991-2016 by sector and EFCS status (Number of projects and US$ Million Investments Commitments).
Non-EFCS CountriesProjects Reaching Financial
Closure Cancelled Cancelled Projects as % of Sector Total
Sector Number of Projects
Investment Commitments
Number of Projects
Investment Commitments
Number of Projects
Investment Commitments
Energy 2825 $646,525 48 $20,255 1.67% 3.04%
transport 1364 $467,904 80 $29,395 5.54% 5.91%
Water & Sanitation
836 $54,898 44 $13,678 5.00% 19.95%
Total 5025 $1,169,327 172 $63,327 3.31% 5.14%
EFCS CountriesProjects Reaching Financial
Closure Cancelled Cancelled Projects as % of Sector Total
Sector Number of Projects
Investment Commitments
Number of Projects
Investment Commitments
Number of Projects
Investment Commitments
Energy 226 $40,069 6 $584 2.59% 1.44%
transport 162 $42,559 12 $2,171 6.90% 4.85%
Water & Sanitation
73 $2,821 6 $154 7.59% 5.17%
Total 461 $85,449 24 $2,909 4.95% 3.29%
Harmonized List CountriesProjects Reaching Financial
Closure Cancelled Cancelled Projects as % of Sector Total
Sector Number of Projects
Investment Commitments
Number of Projects
Investment Commitments
Number of Projects
Investment Commitments
Energy 61 $8,098 2 $584 3.17% 6.73%
transport 25 $3,885 0 $0 0.00% 0.00%
Water & Sanitation
6 $0 0 $0 0.00% 0.00%
Total 92 $11,983 2 $584 2.13% 4.65%
Note: Four out of the six water and sanitation projects in EFCS countries that were cancelled were management contracts with no investments.
HARMONIZED LIST: Among the 92 projects that reached financial closure during the 1991-2016 period, only two were cancelled, but both projects were relatively large. They were in the energy sector (one in Togo and one in Congo, Democratic Republic of). The cancellation rate for PPP projects in HL countries (2.1 percent) was lower than in EFCS countries (5 percent) when assessing relative to the number of projects, but higher when assessing cancellations by percentage of investments (4.6 percent compared to 3.3 percent).
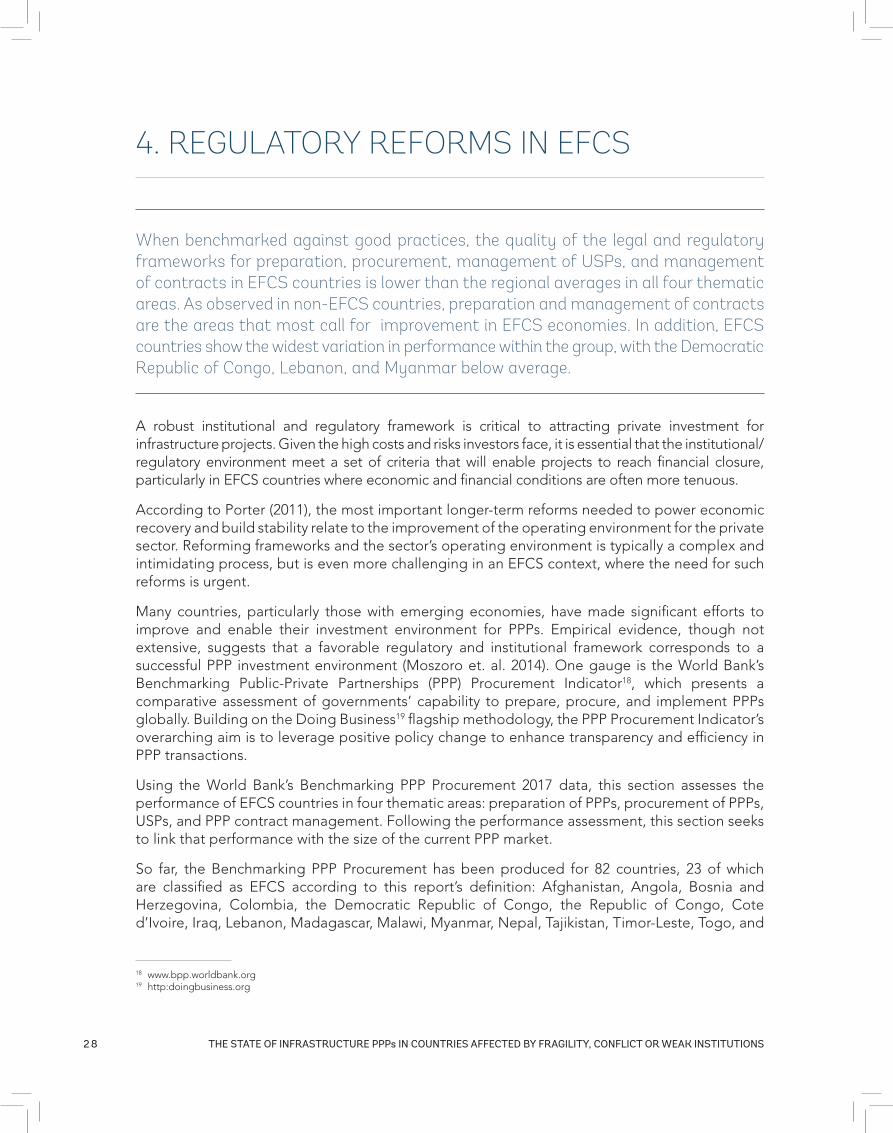
2 8 THE STATE OF INFRASTRUCTURE PPPs IN COUNTRIES AFFECTED BY FRAGILITY, CONFLICT OR WEAK INSTITUTIONS
4. REGULATORY REFORMS IN EFCS
A robust institutional and regulatory framework is critical to attracting private investment for infrastructure projects. Given the high costs and risks investors face, it is essential that the institutional/regulatory environment meet a set of criteria that will enable projects to reach financial closure, particularly in EFCS countries where economic and financial conditions are often more tenuous.
According to Porter (2011), the most important longer-term reforms needed to power economic recovery and build stability relate to the improvement of the operating environment for the private sector. Reforming frameworks and the sector’s operating environment is typically a complex and intimidating process, but is even more challenging in an EFCS context, where the need for such reforms is urgent.
Many countries, particularly those with emerging economies, have made significant efforts to improve and enable their investment environment for PPPs. Empirical evidence, though not extensive, suggests that a favorable regulatory and institutional framework corresponds to a successful PPP investment environment (Moszoro et. al. 2014). One gauge is the World Bank’s Benchmarking Public-Private Partnerships (PPP) Procurement Indicator18, which presents a comparative assessment of governments’ capability to prepare, procure, and implement PPPs globally. Building on the Doing Business19 flagship methodology, the PPP Procurement Indicator’s overarching aim is to leverage positive policy change to enhance transparency and efficiency in PPP transactions.
Using the World Bank’s Benchmarking PPP Procurement 2017 data, this section assesses the performance of EFCS countries in four thematic areas: preparation of PPPs, procurement of PPPs, USPs, and PPP contract management. Following the performance assessment, this section seeks to link that performance with the size of the current PPP market.
So far, the Benchmarking PPP Procurement has been produced for 82 countries, 23 of which are classified as EFCS according to this report’s definition: Afghanistan, Angola, Bosnia and Herzegovina, Colombia, the Democratic Republic of Congo, the Republic of Congo, Cote d’Ivoire, Iraq, Lebanon, Madagascar, Malawi, Myanmar, Nepal, Tajikistan, Timor-Leste, Togo, and
18 www.bpp.worldbank.org19 http:doingbusiness.org
When benchmarked against good practices, the quality of the legal and regulatory frameworks for preparation, procurement, management of USPs, and management of contracts in EFCS countries is lower than the regional averages in all four thematic areas. As observed in non-EFCS countries, preparation and management of contracts are the areas that most call for improvement in EFCS economies. In addition, EFCS countries show the widest variation in performance within the group, with the Democratic Republic of Congo, Lebanon, and Myanmar below average.
2 94. REGuLAtoRy REfoRmS In EfcS
seven IBRD/Blend countries. Unfortunately, there is no information for 38 of the 61 EFCS countries considered in this report.
Benchmarking PPP Procurement 2017 shows that performance varies significantly across the 82 countries assessed, with preparation and contract management being the two thematic areas most in need of improvement. EFCS countries score lower than the regional average in all four thematic areas (see Figure 13). The only exception is preparation, where the average score for the Middle East and North Africa (MENA) region is below the EFCS average score.
FIGURE 13: Benchmarking PPP Procurement Scores by Area and Regional Average (score 1-100)
0
10
20
30
40
50
60
70
80
90
High
incom
e: O
ECD
ECA
SAR
LAC
EAP
SSA
FCV
MEN
A
High
incom
e: O
ECD
ECA
LAC
SAR
EAP
MEN
A SS
A FC
V
High
incom
e: O
ECD
LAC
ECA
SAR
MEN
A EA
P SS
A FC
V
High
incom
e: O
ECD
LAC
ECA
EAP
SSA
MEN
A SA
R FC
V
Preparation Procurement Unsolicited Proposals Contract Management
Sco
re
Global average
Source: Benchmarking PPP Procurement 2017.Note: Based on 82 countries, of which 23 are EFCS countries.
Some EFCS countries are actively building PPP frameworks, with an uptick in new laws since 2010, but implementation has lagged. Thirteen of the 23 EFCS countries included in Benchmarking PPP, including Malawi; Procurement have recently put PPP-specific legal frameworks in place20, including Malawi (2010); Angola, and Bosnia and Herzegovina (2011); Colombia, Côte d’Ivoire, and Tajikistan (2012); Timor-Leste and Togo (2014); and Madagascar (2015). Of the remainder, Afghanistan and Lebanon have draft PPP laws. In the case of Afghanistan, there have been recent efforts to formulate a national PPP policy. The draft PPP law has yet to be issued, and the current regulatory basis for PPPs is governed mainly by annex 6 of the public procurement law, which lacks key elements that are considered good practice. In the case of Lebanon, two draft PPP laws were submitted in 2010 by the Council of Ministers to the Parliament for review and adoption, but neither has been approved. A third improved version of the draft law was prepared by the Higher Council for Privatization but has yet to be submitted. In three countries – the Democratic Republic of Congo, Iraq, and Myanmar – there is there no clear roadmap for preparing PPP laws. While Nepal has no PPP law, a special act passed in 2006 makes a provision for private financing in building and operation of infrastructure that is quite comprehensive, particularly in terms of procurement for PPPs. As a result, Nepal performs significantly higher than other EFCS countries in this thematic area.
20 Seven out of the eight IBRD/Blend countries which were on the expanded list have a specific PPP law, ordinance, or policy that governs PPPs. The term ECFS is used in this paper for analytical purposes only, and has not been formally adopted by the World Bank.
3 0 THE STATE OF INFRASTRUCTURE PPPs IN COUNTRIES AFFECTED BY FRAGILITY, CONFLICT OR WEAK INSTITUTIONS
Colombia merits special consideration. Despite being an EFCS, it was able to bring to the market 43 projects in the 2012-2016 period and had the highest level of investments: 37 percent of total projects in EFCS countries during this period were in Colombia. The country has undertaken reforms in its regulatory and legal environment for PPPs, including a PPP law and its associated regulations in 2012. In 2015, a presidential decree compiled all regulations related to PPPs. (Attempts to establish a comprehensive regulatory framework in Colombia date back to 1975, with Decree 1670, which related to state contracts.) These regulations have enabled progress in structuring specific sectors under the PPP umbrella21 and have helped to enhance institutional arrangements within the governmental bodies that have PPP-related roles.22
Cote d’Ivoire passed the PPP Promotion Law in 2012 and created the National Steering Committee for Public-Private Partnerships (CNP-PPP), which promotes and oversees PPP activities. The country saw a significant increase in PPP investments in 2013, but investment has slowed in the years since. One of the landmark projects for the country has been the Compagnie Ivoirienne de Production d’Electricite (CIPREL), a 99MW diesel power plant. This is a greenfield project (BOT) that reached financial closure in 2013 for a total investment amount of $350 million.
There is significant variation among EFCS countries in all four thematic areas, as presented in Figure 14 below. The area with the widest variation in performance is preparation of PPPs. Benchmarking PPP Procurement 2017 data measures whether governments conduct six assessments: socio-economic analysis, affordability, risk identification, financial viability or bankability, comparative, and market. Some countries (e.g., Colombia and Malawi) conduct almost all of the six, although even in those countries there is room for improvement, as not all the assessments have a well-defined methodology for implementing the assessments. Other countries conduct only one of the assessments (the Democratic Republic of Congo, the Republic of Congo, Iraq, Myanmar and Togo (PPPs)), or none at all (Lebanon). In Iraq, Lebanon, Myanmar, and Togo (PPPs), the government is not required to integrate the prioritization of PPP projects with other public investment projects or to seek the central budgetary authority’s approval. These latter two are critical requirements for ensuring that PPP projects emerge within the infrastructure public investment planning process and are fiscally sustainable.
Procurement is the area where there was greatest similarity in the scores of EFCS economies; however, there is still a big gap between the best performer (Bosnia and Herzegovina, 85 out of 100) and the worst performer (the Democratic Republic of Congo, 28 out of 100). While Bosnia and Herzegovina scores are fairly high, some transparency elements are missing from the regulations, such as publishing PPP contracts and including a detailed procedure that guarantees transparency and efficiency when only one proposal is received during the tendering process.
Wide disparity exists with regard to unsolicited proposals (USPs), for which Colombia has enacted comprehensive regulations, including most of the elements that are considered good practice: ensuring competitive procurement procedure for projects originated through USPs, guaranteeing a minimum number of days (180) for additional prospective bidders to submit their bids that is higher than the recognized good practice of 90 days, and assessing USPs to determine whether they are consistent with government priorities. However, the last of these does not specify the procedure to follow the assessment.
21 See, for example, Decree 063 of 2015, 1/14/2015, regulating particularities of PPPs in the water and sanitation sector; Decree 1026 of 2014, 5/28/2014, regulating the use of PPPs in tunnels; and Law 1608 of 2013, 11/22/2013, on transportation infrastructure.
22 See, for example, Decree 1610 of 2013, 7/30/2013, regulating the authority of the Superior Fiscal Council.
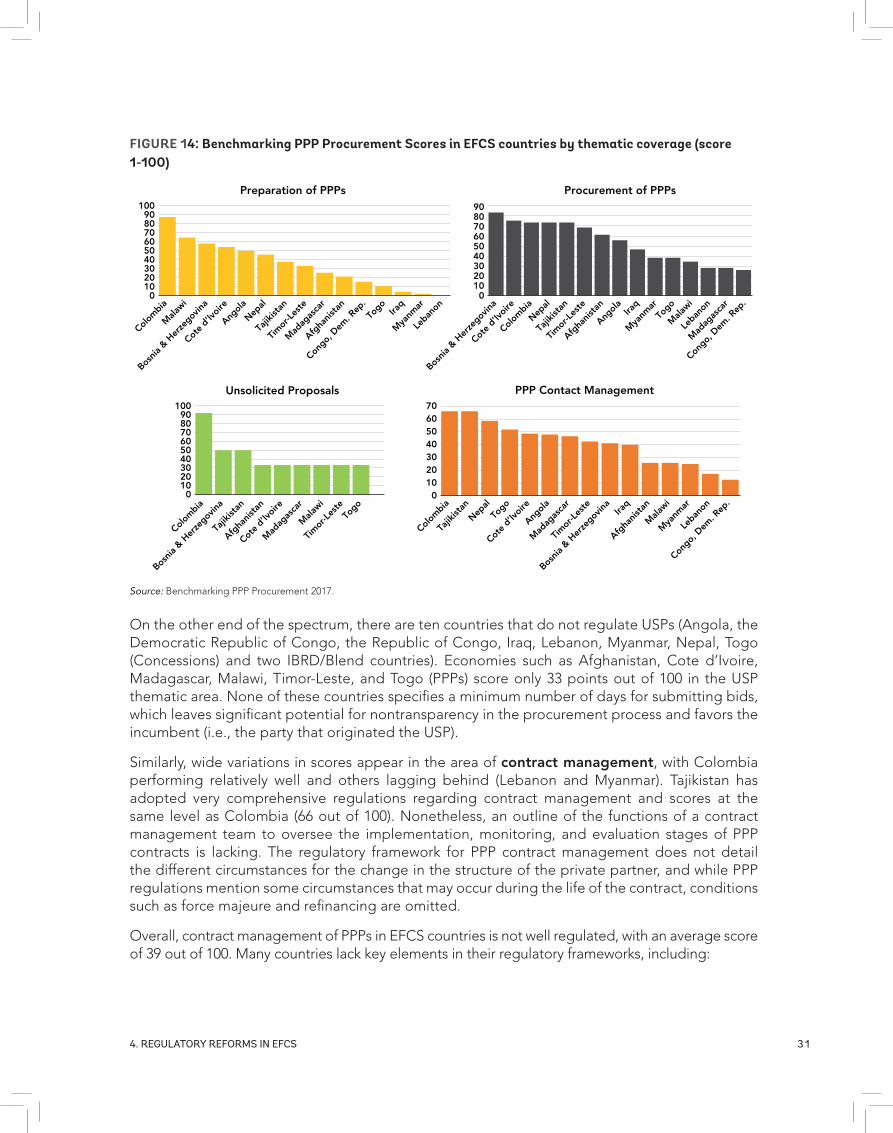
3 14. REGuLAtoRy REfoRmS In EfcS
On the other end of the spectrum, there are ten countries that do not regulate USPs (Angola, the Democratic Republic of Congo, the Republic of Congo, Iraq, Lebanon, Myanmar, Nepal, Togo (Concessions) and two IBRD/Blend countries). Economies such as Afghanistan, Cote d’Ivoire, Madagascar, Malawi, Timor-Leste, and Togo (PPPs) score only 33 points out of 100 in the USP thematic area. None of these countries specifies a minimum number of days for submitting bids, which leaves significant potential for nontransparency in the procurement process and favors the incumbent (i.e., the party that originated the USP).
Similarly, wide variations in scores appear in the area of contract management, with Colombia performing relatively well and others lagging behind (Lebanon and Myanmar). Tajikistan has adopted very comprehensive regulations regarding contract management and scores at the same level as Colombia (66 out of 100). Nonetheless, an outline of the functions of a contract management team to oversee the implementation, monitoring, and evaluation stages of PPP contracts is lacking. The regulatory framework for PPP contract management does not detail the different circumstances for the change in the structure of the private partner, and while PPP regulations mention some circumstances that may occur during the life of the contract, conditions such as force majeure and refinancing are omitted.
Overall, contract management of PPPs in EFCS countries is not well regulated, with an average score of 39 out of 100. Many countries lack key elements in their regulatory frameworks, including:
FIGURE 14: Benchmarking PPP Procurement Scores in EFCS countries by thematic coverage (score 1-100)
10 0
20 30 40 50 60 70 80 90
100
Preparation of PPPs
Colom
bia
Mala
wi
Bosnia
& H
erze
govina
Cote
d’Ivoi
re
Angol
a
Nepal
Tajik
istan
Timor
-Leste
Mad
agas
car
Afgha
nista
n
Congo,
Dem
. Rep
.
Togo
Iraq
Mya
nmar
Leban
on
10 0
20 30 40 50 60 70
PPP Contact Management
Colom
bia
Tajik
istan
Nepal
Togo
Cote
d’Ivoi
re
Angol
a
Mad
agas
car
Timor
-Leste
Bosnia
& H
erze
govina Ira
q
Afgha
nista
n
Mala
wi
Mya
nmar
Leban
on
Congo,
Dem
. Rep
.
10 0
20 30 40 50 60 70 80 90
100
Unsolicited Proposals
Colom
bia
Bosnia
& H
erze
govina
Tajik
istan
Afgha
nista
n
Cote
d’Ivoi
re
Mad
agas
car
Mala
wi
Timor
-Leste
Togo
Colom
bia
Mala
wi
Bosnia
& H
erze
govina
Cote
d’Ivoi
re
Angol
a
Nepal
Tajik
istan
Timor
-Leste
Mad
agas
car
Afgha
nista
n
Congo,
Dem
. Rep
.
Togo
Iraq
Mya
nmar
Leban
on
10 0
20 30 40 50 60 70 80 90
Procurement of PPPs
Source: Benchmarking PPP Procurement 2017.
3 2 THE STATE OF INFRASTRUCTURE PPPs IN COUNTRIES AFFECTED BY FRAGILITY, CONFLICT OR WEAK INSTITUTIONS
• a system to manage the implementation of the PPP contract (Afghanistan, the Republic of Congo, Iraq, Lebanon, Madagascar, Myanmar)
• gathering performance information through a monitoring and evaluation system and making it available to the public (the Democratic Republic of Congo, Iraq, Lebanon)
• expressly regulating potential changes in the structure of the private partner (Afghanistan, the Democratic Republic of Congo, the Republic of Congo, Cote d’Ivoire, Lebanon, Madagascar, Malawi), as well as modification and renegotiation of the contracts (Bosnia and Herzegovina, the Democratic Republic of Congo, the Republic of Congo, Lebanon, Malawi, Myanmar)
• dispute resolution mechanisms (Afghanistan, Colombia, Lebanon)
• step-in rights for lenders when the private partner is at risk of default (Afghanistan, Angola, Bosnia and Herzegovina, the Democratic Republic of Congo, the Republic of Congo, Cote d’Ivoire, Iraq, Lebanon, Malawi, Myanmar, Timor-Leste)
• clearly defined grounds for termination and its consequences (Angola, the Democratic Republic of Congo, the Republic of Congo, Lebanon, Malawi, Myanmar, Timor-Leste, Togo (PPPs))
There is a significant positive correlation between the average Benchmarking PPP Procurement score and the number of PPP projects in the 2012-2016 period among EFCS countries (a simple probit regression confirms this result).23 One IBRD country and Nepal have strong regulatory frameworks (average scores of 59 and 60, respectively) and were able to mobilize a significant number of projects in the past five years (15 and 14, respectively). On the other end of the spectrum, countries such the Republic of Congo and Myanmar were able to bring PPPs to the market (two and three, respectively) even though they had significantly weak regulatory frameworks (average scores of 18 and 22, respectively). The Republic of Congo had the Pointe-Noire Container Port Terminal in 201124 and the Société Nationale de Distribution d’Eau (SNDE) Second Management (water management contract) in 2013. Myanmar had the Michuang and Lemro Hydropower Plants in 2012, the Ahlone (natural gas) Power Plant in 2013, and the Myanmar Industrial Port Modernization in 2016.25 While these countries were able to bring projects to financial closure despite their weak regulatory environments, the performance of the projects remains to be seen.
23 Colombia was excluded from the analysis since it was an outlier in terms of number of projects reaching financial closure in the period 2011-2015.
24 This project received a $42 million loan from EIB.25 This project received a $40 million loan from IFC.
3 35. concLuSIonS And futuRE RESEARcH
5. CONCLUSIONS AND FUTURE RESEARCH
EFCS countries face significant development challenges that limit the role of the private sector in infrastructure PPP markets. EFCS countries are characterized by weak regulations and institutions, which results in a risky investment environment. Investing in infrastructure is challenging, mainly due to the long-term nature of infrastructure, which requires large upfront investments and several years of positive cash flow to recover the initial investment. In the case of infrastructure PPPs, the challenges are even larger, as these are complex long-term contracts that require the private sector to bear a significant part of the risk. Countries affected by fragility and conflict present even riskier environments, making PPP projects difficult to implement.
As illustrated in this paper, the number and volume of investments in PPPs remains very low among EFCS countries; among those projects that reached financial closure, private sector financing has been very limited due to low commercial debt. While each country faces its own unique situation, some patterns emerge across EFCS economies.
Only half of EFCS countries were able to bring infrastructure PPPs to financial closure in the last ten years, and most of these economies had investments only in one or two years. These low numbers illustrate the difficulty of maintaining a presence in the market. Learning how EFCS countries can move from sporadic PPP projects to more consistent implementation of PPP programs is an important subject for further research.
When benchmarked against good practices, the quality of the legal and regulatory frameworks for preparation, procurement, management of USPs, and management of contracts in EFCS countries is lower than the regional averages. EFCS countries as a group show a wider variation in performance within the group than non-EFCS countries. Understanding the legal, institutional, and regulatory frameworks needed to develop PPP markets in fragile states requires empirical evidence beyond case studies.
The high share of small renewable energy PPP projects indicates that this subsector has characteristics that make it more feasible for PPPs, and may serve as a starting point for PPPs in EFCS countries. Understanding better those characteristics and the optimal sequencing of PPP programs is a critical area for future research.
Cancellation rates show that projects in EFCS countries are as likely to be terminated before the end of the contract as projects in non-EFCS countries – a fact that could be explained, in part, by larger MDB and bilateral support in EFCS. However, this comparison of cancellation rates presents an incomplete picture, and data on renegotiation of contracts could lead to a different conclusion.
While the PPI database enables an assessment of trends and the identification of patterns in infrastructure PPP projects in EFCS countries, the information it contains refers only to the financial closure stage; therefore, the quality of project preparation, implementation, and achievement of any expected efficiency gains of such projects remain unknown. Data collection efforts in these areas could prove valuable, particularly in identifying the most successful sectors or types of projects for EFCS countries.
3 4 THE STATE OF INFRASTRUCTURE PPPs IN COUNTRIES AFFECTED BY FRAGILITY, CONFLICT OR WEAK INSTITUTIONS
The literature on infrastructure PPPs and the economic impact of infrastructure in EFCS countries is limited. Infrastructure has the potential to work as a tool supporting conflict resolution or to help countries avoid lapsing into conflict again; however, as pointed out by Jones and Howarth (2012), there is a need for further primary research and evaluation on the impact of infrastructure programs in EFCS countries, particularly to better understand their channels of influence.
3 5
ANNEXES

3 6
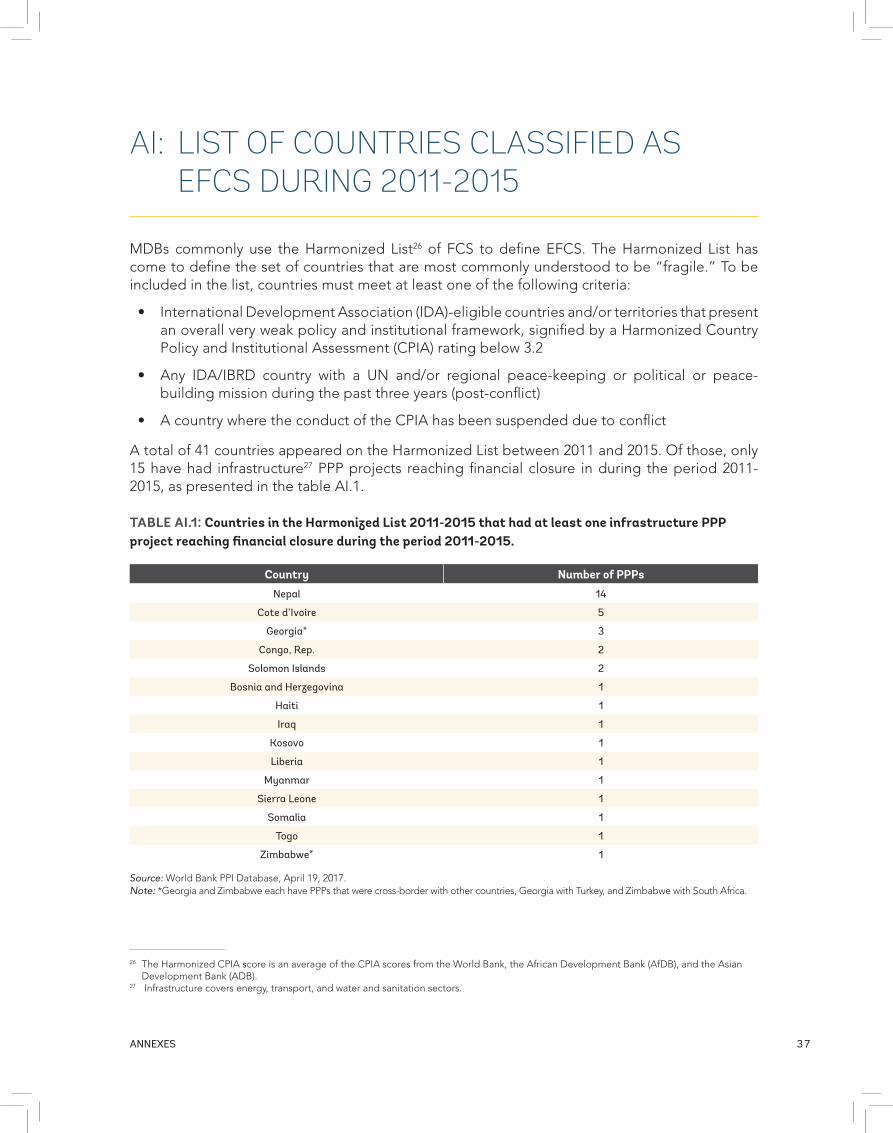
3 7ANNEXES
AI: LIST OF COUNTRIES CLASSIFIED AS EFCS DURING 2011-2015
MDBs commonly use the Harmonized List26 of FCS to define EFCS. The Harmonized List has come to define the set of countries that are most commonly understood to be “fragile.” To be included in the list, countries must meet at least one of the following criteria:
• International Development Association (IDA)-eligible countries and/or territories that present an overall very weak policy and institutional framework, signified by a Harmonized Country Policy and Institutional Assessment (CPIA) rating below 3.2
• Any IDA/IBRD country with a UN and/or regional peace-keeping or political or peace-building mission during the past three years (post-conflict)
• A country where the conduct of the CPIA has been suspended due to conflict
A total of 41 countries appeared on the Harmonized List between 2011 and 2015. Of those, only 15 have had infrastructure27 PPP projects reaching financial closure in during the period 2011-2015, as presented in the table AI.1.
26 The Harmonized CPIA score is an average of the CPIA scores from the World Bank, the African Development Bank (AfDB), and the Asian Development Bank (ADB).
27 Infrastructure covers energy, transport, and water and sanitation sectors.
TABLE AI.1: Countries in the Harmonized List 2011-2015 that had at least one infrastructure PPP project reaching financial closure during the period 2011-2015.
Country Number of PPPsnepal 14
cote d’Ivoire 5
Georgia* 3
congo, Rep. 2
Solomon Islands 2
Bosnia and Herzegovina 1
Haiti 1
Iraq 1
Kosovo 1
Liberia 1
myanmar 1
Sierra Leone 1
Somalia 1
togo 1
Zimbabwe* 1
Source: World Bank PPI Database, April 19, 2017.Note: *Georgia and Zimbabwe each have PPPs that were cross-border with other countries, Georgia with Turkey, and Zimbabwe with South Africa.
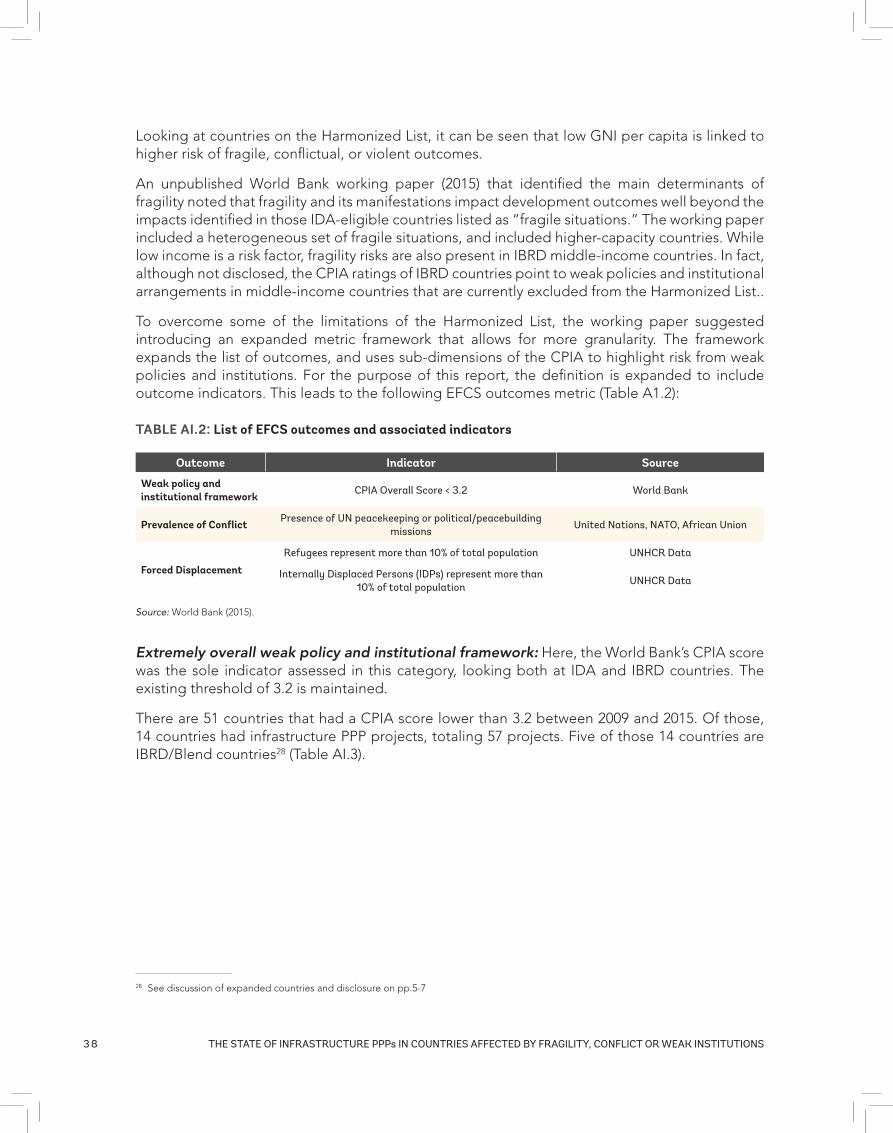
3 8 THE STATE OF INFRASTRUCTURE PPPs IN COUNTRIES AFFECTED BY FRAGILITY, CONFLICT OR WEAK INSTITUTIONS
Looking at countries on the Harmonized List, it can be seen that low GNI per capita is linked to higher risk of fragile, conflictual, or violent outcomes.
An unpublished World Bank working paper (2015) that identified the main determinants of fragility noted that fragility and its manifestations impact development outcomes well beyond the impacts identified in those IDA-eligible countries listed as “fragile situations.” The working paper included a heterogeneous set of fragile situations, and included higher-capacity countries. While low income is a risk factor, fragility risks are also present in IBRD middle-income countries. In fact, although not disclosed, the CPIA ratings of IBRD countries point to weak policies and institutional arrangements in middle-income countries that are currently excluded from the Harmonized List..
To overcome some of the limitations of the Harmonized List, the working paper suggested introducing an expanded metric framework that allows for more granularity. The framework expands the list of outcomes, and uses sub-dimensions of the CPIA to highlight risk from weak policies and institutions. For the purpose of this report, the definition is expanded to include outcome indicators. This leads to the following EFCS outcomes metric (Table A1.2):
28 See discussion of expanded countries and disclosure on pp.5-7
TABLE AI.2: List of EFCS outcomes and associated indicators
Outcome Indicator Source
Weak policy and institutional framework cPIA overall Score < 3.2 World Bank
Prevalence of Conflict Presence of un peacekeeping or political/peacebuilding missions
united nations, nAto, African union
Forced DisplacementRefugees represent more than 10% of total population unHcR data
Internally displaced Persons (IdPs) represent more than 10% of total population
unHcR data
Source: World Bank (2015).
Extremely overall weak policy and institutional framework: Here, the World Bank’s CPIA score was the sole indicator assessed in this category, looking both at IDA and IBRD countries. The existing threshold of 3.2 is maintained.
There are 51 countries that had a CPIA score lower than 3.2 between 2009 and 2015. Of those, 14 countries had infrastructure PPP projects, totaling 57 projects. Five of those 14 countries are IBRD/Blend countries28 (Table AI.3).
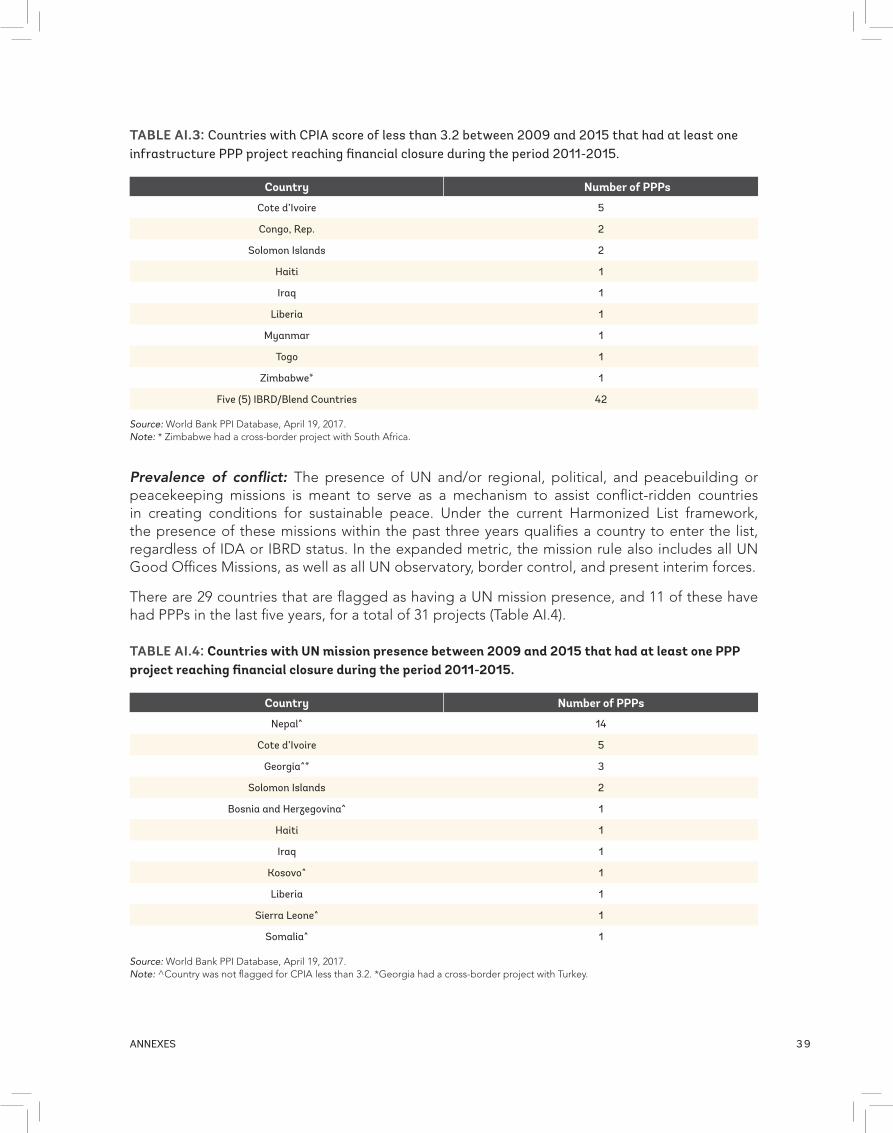
3 9ANNEXES
TABLE AI.3: countries with cPIA score of less than 3.2 between 2009 and 2015 that had at least one infrastructure PPP project reaching financial closure during the period 2011-2015.
Country Number of PPPs
cote d’Ivoire 5
congo, Rep. 2
Solomon Islands 2
Haiti 1
Iraq 1
Liberia 1
myanmar 1
togo 1
Zimbabwe* 1
five (5) IBRd/Blend countries 42
Source: World Bank PPI Database, April 19, 2017.Note: * Zimbabwe had a cross-border project with South Africa.
Prevalence of conflict: The presence of UN and/or regional, political, and peacebuilding or peacekeeping missions is meant to serve as a mechanism to assist conflict-ridden countries in creating conditions for sustainable peace. Under the current Harmonized List framework, the presence of these missions within the past three years qualifies a country to enter the list, regardless of IDA or IBRD status. In the expanded metric, the mission rule also includes all UN Good Offices Missions, as well as all UN observatory, border control, and present interim forces.
There are 29 countries that are flagged as having a UN mission presence, and 11 of these have had PPPs in the last five years, for a total of 31 projects (Table AI.4).
TABLE AI.4: Countries with UN mission presence between 2009 and 2015 that had at least one PPP project reaching financial closure during the period 2011-2015.
Country Number of PPPs
nepal^ 14
cote d’Ivoire 5
Georgia^* 3
Solomon Islands 2
Bosnia and Herzegovina^ 1
Haiti 1
Iraq 1
Kosovo^ 1
Liberia 1
Sierra Leone^ 1
Somalia^ 1
Source: World Bank PPI Database, April 19, 2017.Note: ^Country was not flagged for CPIA less than 3.2. *Georgia had a cross-border project with Turkey.
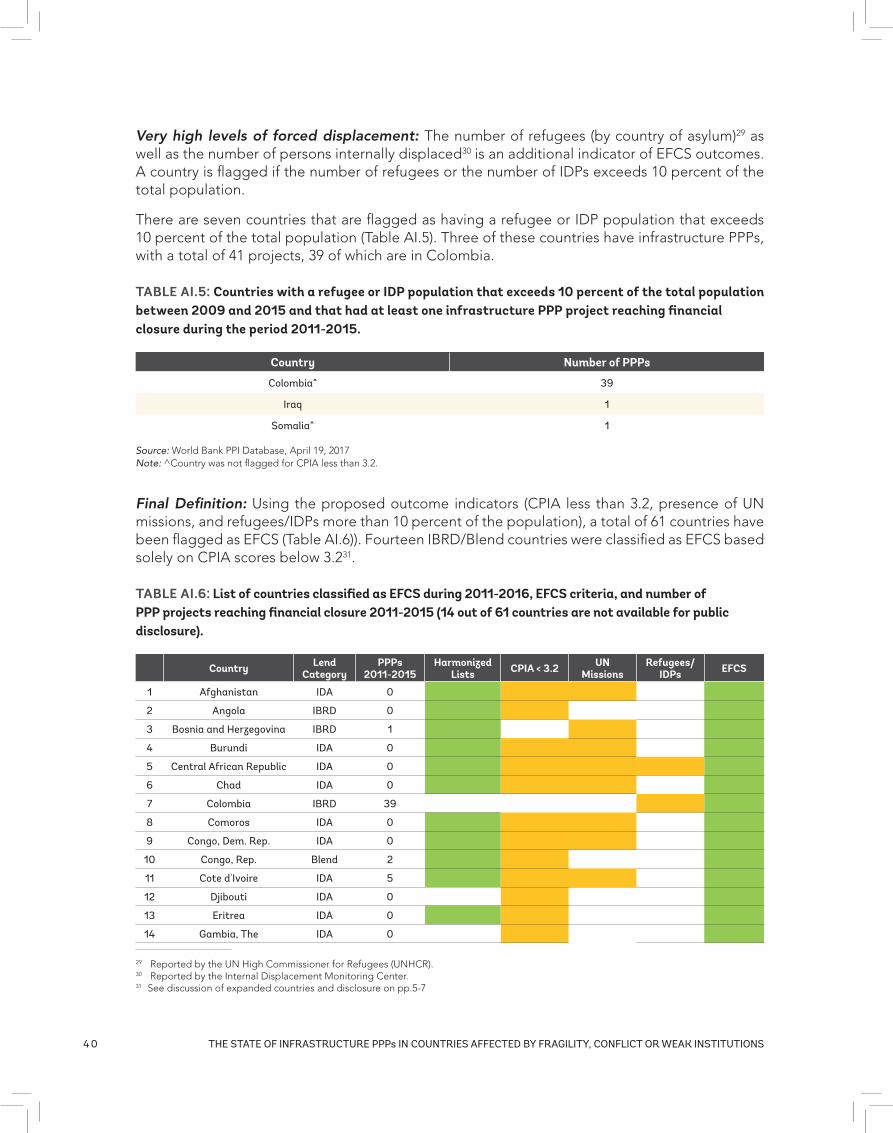
4 0 THE STATE OF INFRASTRUCTURE PPPs IN COUNTRIES AFFECTED BY FRAGILITY, CONFLICT OR WEAK INSTITUTIONS
Very high levels of forced displacement: The number of refugees (by country of asylum)29 as well as the number of persons internally displaced30 is an additional indicator of EFCS outcomes. A country is flagged if the number of refugees or the number of IDPs exceeds 10 percent of the total population.
There are seven countries that are flagged as having a refugee or IDP population that exceeds 10 percent of the total population (Table AI.5). Three of these countries have infrastructure PPPs, with a total of 41 projects, 39 of which are in Colombia.
29 Reported by the UN High Commissioner for Refugees (UNHCR).30 Reported by the Internal Displacement Monitoring Center.31 See discussion of expanded countries and disclosure on pp.5-7
TABLE AI.5: Countries with a refugee or IDP population that exceeds 10 percent of the total population between 2009 and 2015 and that had at least one infrastructure PPP project reaching financial closure during the period 2011-2015.
Country Number of PPPs
colombia^ 39
Iraq 1
Somalia^ 1
Source: World Bank PPI Database, April 19, 2017Note: ^Country was not flagged for CPIA less than 3.2.
Final Definition: Using the proposed outcome indicators (CPIA less than 3.2, presence of UN missions, and refugees/IDPs more than 10 percent of the population), a total of 61 countries have been flagged as EFCS (Table AI.6)). Fourteen IBRD/Blend countries were classified as EFCS based solely on CPIA scores below 3.231.
TABLE AI.6: List of countries classified as EFCS during 2011-2016, EFCS criteria, and number of PPP projects reaching financial closure 2011-2015 (14 out of 61 countries are not available for public disclosure).
Country Lend Category
PPPs 2011-2015
Harmonized Lists CPIA < 3.2 UN
MissionsRefugees/
IDPs EFCS
1 Afghanistan IdA 0
2 Angola IBRd 0
3 Bosnia and Herzegovina IBRd 1
4 Burundi IdA 0
5 central African Republic IdA 0
6 chad IdA 0
7 colombia IBRd 39
8 comoros IdA 0
9 congo, dem. Rep. IdA 0
10 congo, Rep. Blend 2
11 cote d'Ivoire IdA 5
12 djibouti IdA 0
13 Eritrea IdA 0
14 Gambia, the IdA 0
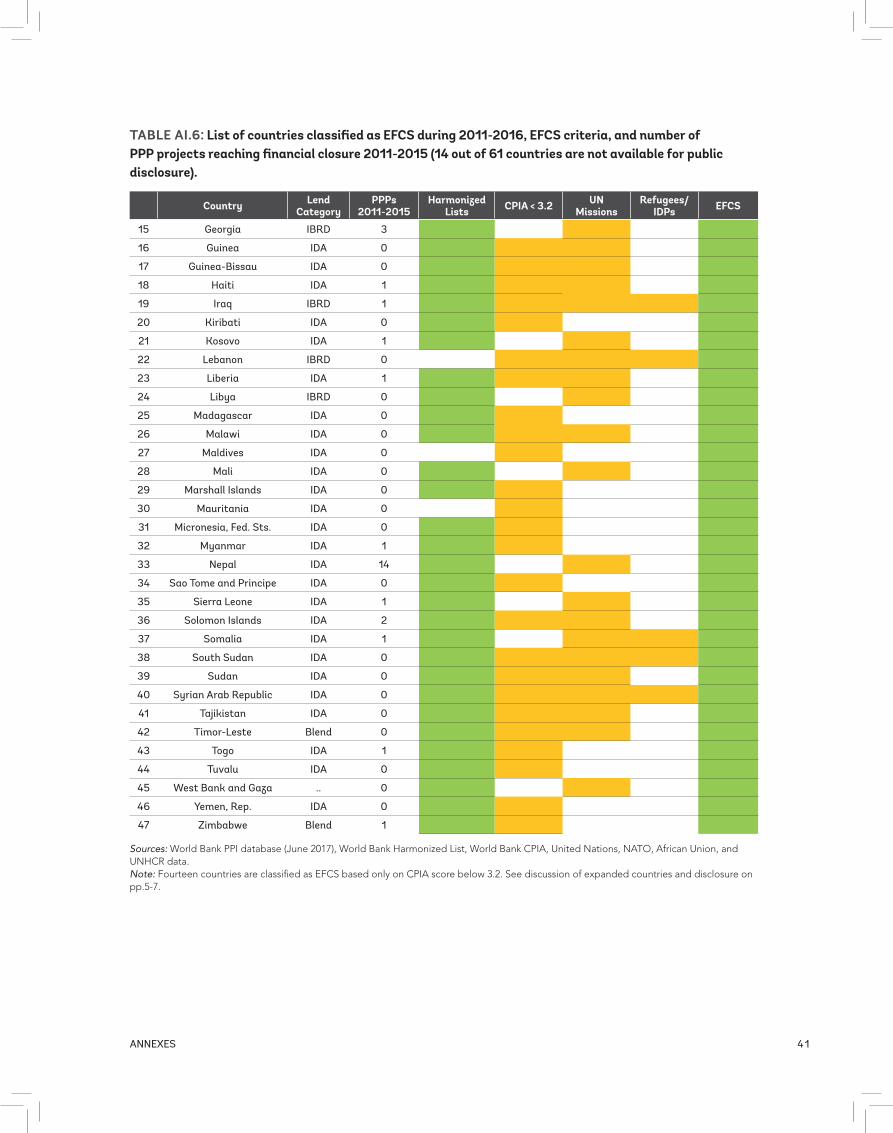
41ANNEXES
Country Lend Category
PPPs 2011-2015
Harmonized Lists CPIA < 3.2 UN
MissionsRefugees/
IDPs EFCS
15 Georgia IBRd 3
16 Guinea IdA 0
17 Guinea-Bissau IdA 0
18 Haiti IdA 1
19 Iraq IBRd 1
20 Kiribati IdA 0
21 Kosovo IdA 1
22 Lebanon IBRd 0
23 Liberia IdA 1
24 Libya IBRd 0
25 madagascar IdA 0
26 malawi IdA 0
27 maldives IdA 0
28 mali IdA 0
29 marshall Islands IdA 0
30 mauritania IdA 0
31 micronesia, fed. Sts. IdA 0
32 myanmar IdA 1
33 nepal IdA 14
34 Sao tome and Principe IdA 0
35 Sierra Leone IdA 1
36 Solomon Islands IdA 2
37 Somalia IdA 1
38 South Sudan IdA 0
39 Sudan IdA 0
40 Syrian Arab Republic IdA 0
41 tajikistan IdA 0
42 timor-Leste Blend 0
43 togo IdA 1
44 tuvalu IdA 0
45 West Bank and Gaza .. 0
46 yemen, Rep. IdA 0
47 Zimbabwe Blend 1
Sources: World Bank PPI database (June 2017), World Bank Harmonized List, World Bank CPIA, United Nations, NATO, African Union, and UNHCR data.Note: Fourteen countries are classified as EFCS based only on CPIA score below 3.2. See discussion of expanded countries and disclosure on pp.5-7.
TABLE AI.6: List of countries classified as EFCS during 2011-2016, EFCS criteria, and number of PPP projects reaching financial closure 2011-2015 (14 out of 61 countries are not available for public disclosure).
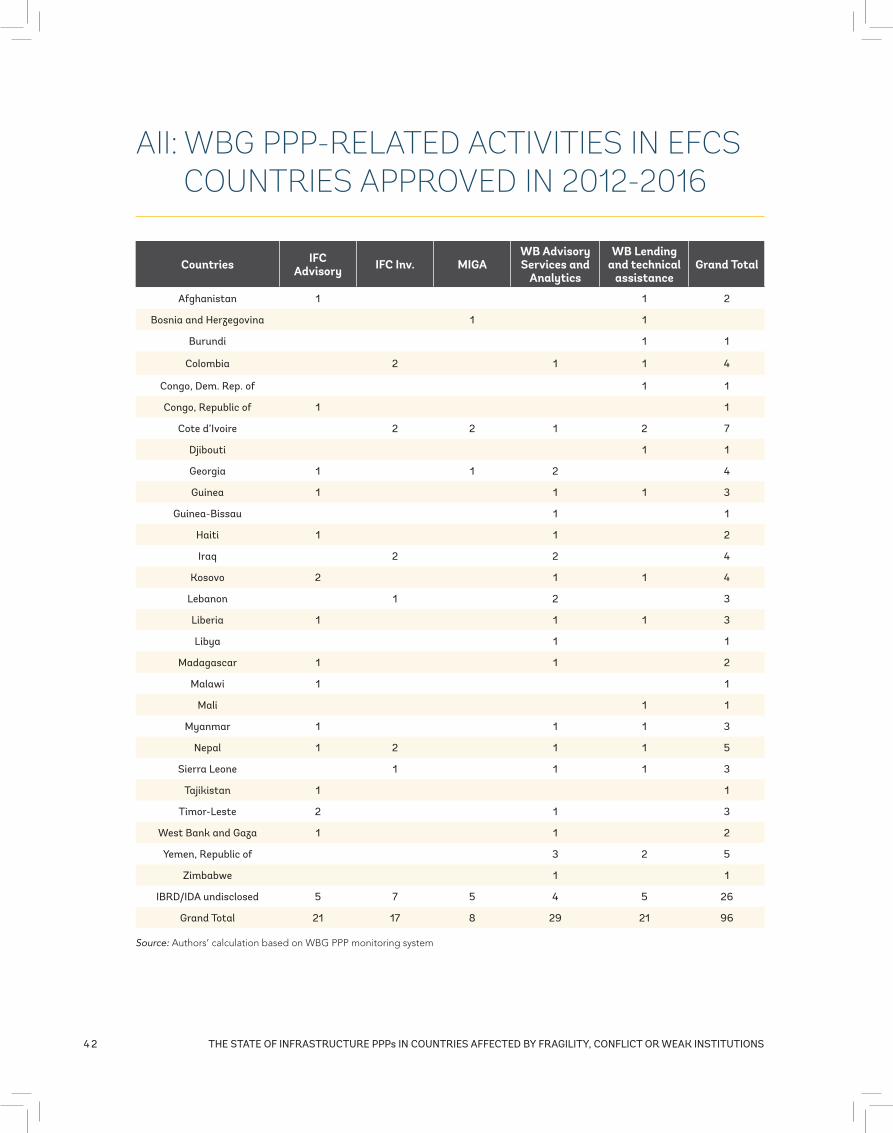
4 2 THE STATE OF INFRASTRUCTURE PPPs IN COUNTRIES AFFECTED BY FRAGILITY, CONFLICT OR WEAK INSTITUTIONS
AII: WBG PPP-RELATED ACTIVITIES IN EFCS COUNTRIES APPROVED IN 2012-2016
Countries IFC Advisory IFC Inv. MIGA
WB Advisory Services and
Analytics
WB Lending and technical
assistanceGrand Total
Afghanistan 1 1 2
Bosnia and Herzegovina 1 1
Burundi 1 1
colombia 2 1 1 4
congo, dem. Rep. of 1 1
congo, Republic of 1 1
cote d’Ivoire 2 2 1 2 7
djibouti 1 1
Georgia 1 1 2 4
Guinea 1 1 1 3
Guinea-Bissau 1 1
Haiti 1 1 2
Iraq 2 2 4
Kosovo 2 1 1 4
Lebanon 1 2 3
Liberia 1 1 1 3
Libya 1 1
madagascar 1 1 2
malawi 1 1
mali 1 1
myanmar 1 1 1 3
nepal 1 2 1 1 5
Sierra Leone 1 1 1 3
tajikistan 1 1
timor-Leste 2 1 3
West Bank and Gaza 1 1 2
yemen, Republic of 3 2 5
Zimbabwe 1 1
IBRd/IdA undisclosed 5 7 5 4 5 26
Grand total 21 17 8 29 21 96
Source: Authors’ calculation based on WBG PPP monitoring system

4 3
REFERENCES

4 4
4 5REfEREncES
REFERENCES
Adhikari, Deepak. 2006. “Hydropower development in Nepal.” Nepal Rastra Bank Economic Review 18 (article 4): 70-94. https://www.nrb.org.np/ecorev/pdffiles/vol18_art4.pdf
Ballentine, K in Bray, J. 2007. “The Role of Private Sector Development in Post-Conflict Economic Recovery.” UNDP 2007. p 3.
Bruckner, M. 2011. “Country Fixed Effects and Unit Roots: A Comment on Poverty and Civil War: Revisiting the Evidence.” University of Adelaide School of Economics Research Paper 2011-17. http://www.economics.adelaide.edu.au/research/papers/doc/wp2011-17.pdf
Center for Strategic and international Studies. 2013. “Private-Sector Development in Fragile, Conflict-affected and Violent Countries.” CSIS working group on Private-Sector Development in Fragile States. https://csis-prod.s3.amazonaws.com/s3fs-public/legacy_files/files/publication/130617_Hameed_PrivateSecDevel_WEB.pdf
Collier, P., and A. Hoeffler. 1998. “On the Economic Causes of Civil War.” Oxford Economic Papers 50: 563-73.
Djankov, S., and M. Reynal Querol. 2010. “Poverty and Civil Wars: Revisiting the Evidence.” Review of Economics and Statistics 92 (4).
Harris, C, and Kumar, P.V. 2008. “What Drives Private Sector Exit from Infrastructure? An Analysis of the Cancellation of Private Infrastructure Projects.” Discussion paper, World Bank, Washington, DC.
Jones, S., and S. Howarth. (2012). “Supporting Infrastructure Development in Fragile and Conflict-Affected States: Learning from Experience.” Department for International Development (DFID). https://assets.publishing.service.gov.uk/media/57ebe67de5274a0eba000011/FCAS_infrastructure_final_report_0.pdf
Kenny, C. 2013. “Moving Beyond Mines and Mobiles: How can IFC add Value in Fragile States.” Center for Global Development (CDG) Policy Paper 030. https://www.cgdev.org/sites/default/files/moving-beyond-mines_wcover_0.pdf
Marcelo Gordillo, D., and R.S. House. 2016. “Effects of multilateral support on infrastructure PPP contract cancellation.” Policy Research Working Paper WPS 7751, World Bank, Washington, DC. http://documents.worldbank.org/curated/en/434361468942595220/Effects-of-multilateral-support-on-infrastructure-PPP-contract-cancellation
Mills, R., and Q. Fan. 2006. “The Investment Climate in Post-Conflict Situations.” Policy Research Working Paper 4055, World Bank, Washington, DC. http://www.value-chains.org/dyn/bds/docs/556/MillsFanwps4055.pdf
Moszoro, M., G. Araya, F. Ruiz-Nuñez, and J. Schwartz. 2014. “Institutional and Political Determinants of Private Participation in Infrastructure.” In Public Private Partnerships for Transport Infrastructure: Renegotiations, How to Approach Them and Economic Outcomes. Discussion Paper 15, International Transport Forum Roundtable, Washington, DC.
OECD. 2008. Concepts and Dilemmas of State Building in Fragile Situations: From Fragility to Resilience. https://www.oecd.org/dac/conflict-fragility-resilience/docs/41100930.pdf
Piaretti, N. F. “From Rent-seeking to Profit-creation: Private Sector Development and Economic Turnaround in Fragile States.” Working paper, World Bank. November 2010. p 3.
4 6 THE STATE OF INFRASTRUCTURE PPPs IN COUNTRIES AFFECTED BY FRAGILITY, CONFLICT OR WEAK INSTITUTIONS
Porter Peschka, M. 2011. “The role of the private sector in Fragile and Conflict-affected States.” Background Paper. World Development Report 2011. http://web.worldbank.org/archive/website01306/web/pdf/wdr_background_paper_peschka_0.pdf
UNDP. 2008. “Crisis Prevention and Recovery Report: Post-Conflict Economic Recovery: Enabling Local Ingenuity.” http://www.undp.org/content/dam/undp/library/crisis%20prevention/undp-cpr-post-conflict-economic-recovery-enable-local-ingenuity-report-2008.pdf
USAID. 2016. “Nepal Hydropower Development Program (NHDP).” Fact sheet. https://www.usaid.gov/sites/default/files/documents/1861/Nepal_FactSheet_NHDP.pdf
World Bank. 2009. “What Drives Private Sector Exit from Infrastructure? Economic Crisis and Other Factors in the Cancellation of Private Infrastructure Projects in Developing Countries.” Gridlines, Note No. 46. Washington, DC: World Bank.
World Bank. 2011. World Development Report 2011: Security and Development. Washington, DC: World Bank.
World Bank Group. 2014. Public-Private Dialogue in Fragile and Conflict-Affected Situations: Experiences and Lessons Learned. Washington, DC: World Bank.
World Bank. 2015. “Identifying Fragility and Its Impact on Development.” Working Paper (unpublished), November 14, 2015. Washington, DC: World Bank.
World Bank. 2016. Development Finance Forum: Unlocking Opportunities in Fragile Markets. Summary Report. Washington, DC: World Bank. http://siteresources.worldbank.org/CFPEXT/Resources/299947-1455899750489/9879783-1466443871961/DFF2016FinalReport_Distribution.pdf
World Bank. 2017a. “Benchmarking PPP Procurement 2017.” Washington, DC: World Bank. http://bpp.worldbank.org/~/media/WBG/BPP/Documents/Reports/BenchmarkingPPP2017Fullreport.pdf?la=en
World Bank. 2017b. “Government Support in Financing PPPs.” Public-Private Partnership in Infrastructure Resource Center (PPPIRC). Extracted on July 27, 2017 https://ppp.worldbank.org/public-private-partnership/financing/government-support-subsidies. Washington, DC: World Bank.
World Bank. 2017c. “Public-Private Partnership Reference Guide: Version 3.” https://pppknowledgelab.org/guide/sections/1
World Bank. 2017d. “Review of Experiences with Unsolicited Proposals in Infrastructure Projects.” Washington, DC: World Bank. http://pubdocs.worldbank.org/en/246961488983068025/Experience-Review-Report-Final-Draft-March-7-2017.pdf
World Bank. 2017/2018. “FDI in Fragile and Conflict-Affected Situations.” In Global Investment Competitiveness Report 2017/2018: Foreign Investor Perspectives and Policy Implications, 135-159. Washington, DC: World Bank. http://pubdocs.worldbank.org/en/874311508856697692/GICR-05.pdf

2018
@WBG_PPPworldbank.org/ppp
The World Bank Group provides assistance to governments in developing countries to improve access to infrastructure and basic services through public-private partnerships (PPP). When designed well and implemented in a balanced regulatory environment, PPPs can bring greater efficiency and sustainability to the provision of such public services as water, sanitation, energy, transport, telecommunications, health care and education.
The World Bank Group’s unique value proposition rests with its capacity to provide support along the entire PPP cycle—upstream policy and regulatory guidance, transaction structuring advice, as well as financing and guarantees to facilitate implementation.