the social value of carbon sequestered in great britain's woodlands
TRANSCRIPT

The social value of carbon sequestered in Great Britain’s woodlands
by
Julii Brainard, Ian J. Bateman and
Andrew A. Lovett
CSERGE Working Paper EDM 05-03
The social value of carbon sequestered in Great Britain’s woodlands
by
Julii Brainard, Ian J. Bateman and Andrew A. Lovett
Centre for Social and Economic Research on the Global Environment School of Environmental Sciences, University of East Anglia, Norwich, NR4 7TJ, UK
Author contact details:
Julii Brainard: email - [email protected] Tel. +44 (0) 1603 591363
Ian J. Bateman: email – [email protected] Tel. +44 (0) 1603 593125
Andrew Lovett: email – [email protected] Tel. +44 (0) 1603 593126
Acknowledgements
The support of the Economic and Social Research Council (ESRC) is gratefully acknowledged. This work was part of the interdisciplinary research programme of the ESRC Research Centre for Social and Economic Research on the Global Environment (CSERGE). The Forestry Commission funded part of this work for which we are grateful. Many thanks to Ronnie Milne at the Centre for Ecology and Hydrology, Edinburgh, UK for giving us data from his chronosequence models describing C releases on afforested peat. Colin Price of University of Wales, Bangor, also made many helpful comments. ISSN 0967-8875
Abstract: One tactic for mitigating climate change associated with human-origin CO2 releases is to promote C storage in biomass, particularly trees. The economic value of C storage associated with woodland can be compared to the costs (or benefits) of other strategies for mitigating climate change. Models were developed to calculate the rates of marginal carbon storage (or release) associated with live trees, forest floor litter, soils, wood products, harvest, fossil fuel used in manufacturing and C displacement from bio-fuels and products for representative British plantation species: Sitka spruce (Picea Sitchensis) and beech (Fagus sylvatica). Map databases of public and privately-owned woodlands were compiled for Great Britain. Marginal carbon gains (or losses) were determined for each woodland in the datasets. C flux was monetised using candidate parameters for the social discount rate (1, 3, 3.5 or 5%) and social value of carbon (US$109.5, $1, $10 or $17.10/metric tonne). A conventional discount function was applied. Final results were expressed as Net Present Values, base year 2001. The modelling suggests that the minimum NPV (assuming discount rate=3% and social value of carbon = $1) of carbon sequestering in GB woodlands existing in 2001 was $82 million, with a expected further $72 million that might be added by subsequent afforestation. These figures rise dramatically if a discount rate of 1% and social value of sequestered carbon = $109.5/tonne are assumed. The total value of C stored in British woodland depends very much on the assumptions about appropriate discount rate and social value of sequestered carbon. Key words: Carbon sequestration, woodlands, Forestry Commission, green-house gases, peat.
1
1. INTRODUCTION It is widely accepted that adverse climate change in the next two centuries is very likely due to anticipated rises in global temperatures. The anthropogenic emission of greenhouse gases (GHGs) is considered a significant cause of this global warming. The main focus of efforts to reduce GHG emissions in the UK has been on carbon dioxide, which is believed to comprise about 84% of the total global warming potential of GHG releases in the United Kingdom (DEFRA, 2002). One tactic for reducing atmospheric CO2 is to create more woodlands, as both trees and woodland soils take up and store more atmospheric CO2 than many other land uses. Much research has already been undertaken to estimate the total C sequestration into GB woodlands (Cannell and Dewar 1995; Cannell and Milne 1995; Cannell 1999). Our work is novel in that it incorporates a detailed lifetime analysis of woodland products, and is more thorough than previous inventory exercises by including C displacement from products, C storage in thinning products, harvesting and manufacture-related releases of CO2 and post-afforestation changes of C levels in different types of soils. This analysis also allows for C sequestration under different types of woodland (ancient/semi-natural woods, commercial plantations, Christmas trees and coppice). Moreover, ours is the only body of work to place an economic value on carbon storage benefits associated with woodland in all of GB. This is important because the UK government is committed to cost-benefit analysis as a policy making tool (HM Treasury 2003). Although storing carbon in British woodlands would only be a small stopgap strategy to threatened climate change (Cannell 1999), the UK government agency responsible for forestry throughout Great Britain (Forestry Commission=FC), receives a substantial public grant (projected to be £94 million annually, in the period 2003-2006; HM Treasury 2002) for running costs. It is therefore appropriate to assess the social benefits of woodlands (including the carbon sequestration function) when calculating the true cost of this tax-payer funded subsidy. This study calculates and values marginal C flux for all woodlands in Great Britain (GB), including England, Wales, Scotland, and immediate offshore islands, but not the Channel Islands, Isle of Man, Northern Ireland or Scilly Isles. Separate statistics are presented for woodland managed under the auspices of either the Forestry Commission (FC) or other bodies. Three species groups in the FC estate were selected for individual analysis: Sitka spruce (Picea sitchensis), oak (Quercus species) and beech (Fagus sylvatica). Sitka spruce is the softwood species with greatest areal coverage (about 49% of the total Forestry Commission area in GB that is planted in conifers; FC 2001). Oaks are the most common broadleaf species in the FC estate, comprising approximately 10% of hardwood plantings, with beech making up another 3.5% of broadleaf areas. When considering carbon stocks in British woodland, or their potential to mitigate global warming, Sitka spruce and beech are the species most commonly used as surrogates for other conifers or broadleaves (e.g. Cannell et al. 1996; Milne et al. 1998). Compared to many countries, carbon inventories and calculation of the value of C sequestered in woodlands is a particularly credible exercise for Britain, due to the completeness of public records on the planting dates and locations of woodland sites.
2
2. METHODOLOGY Our description of methodology, data sources, model construction and verification is necessarily brief. Readers are referred to Brainard et al. (2003; forthcoming) for more detail. Carbon storage in live wood is dependent on stand-specific variables. Many of these data were available as part of detailed forest records, but other factors had to be assumed or predicted from covariates. Because the work necessarily involved a large number of assumptions, we conducted thorough sensitivity analyses that are described in Brainard et al. (2003; forthcoming) which address the variability introduced by individual model parameters and assumptions. The implications are discussed in later sections of this paper. Forest inventory records were linked with other mapped environmental data within a geographic information system. Mean numerical climate and topography variables, as well as majority categorical soil characteristics were determined for each woodland record. Monetising carbon stocks requires the specification of various economic parameters, all of which have inspired lengthy academic debate. We include a range of suggestions for the social value per tonne of C (svtC), and the discount rate. Computer programs written in the Perl language (Christiansen and Torkington 1998) calculated the corresponding amounts of sequestered carbon and to derive Net Present Values (NPV) under different economic assumptions. The next section describes both data sources and model assumptions and how these were incorporated into models of carbon storage/release. This work builds upon other studies published previously (Bateman and Lovett 2000; Brainard et al. 2003; Brainard et al., forthcoming). The analysis calculates the total value of carbon stored in soils, trees and wood products, by species group (conifer or broadleaves), per hectare. The calculations yield ‘Net Present Values’ (NPVs) which are the present gains from carbon sequestration, plus all future benefits minus both initial and future costs (carbon losses in some cases, as on disturbed peat soils).
3
3. DATA AND MODEL 3.1 Data on Woodland Cover Digital woodland cover in GB came from three data sources: the FC sub-compartment database (FC SCDB), the Woodland Inventory (WI)1, and ancient woodland cover in England. The FC SCDB is a digital catalogue of all land overseen by the FC’s management arm, Forest Enterprise. The data were provided in 2001 and are nominally accurate to that year. The FC SCDB includes information on SC size, yield class, proportion of area planted in trees, planting year for trees currently on site and rotation (whether this is the first, second or later crop of trees in this SC). The WI was derived from aerial photography, dated from 1988 to 2001. Only areas two ha or larger were mapped in the WI, which is believed to exclude no more than 5% of GB woodland. The data categorise woodlands using feature codes and descriptors that usually give some indication of likely species and age. We treat individual, contiguous WI areas with the same descriptor code as WI “sub-compartments” (i.e., WI SCs), although it is unlikely that most such areas were actually managed as single units. We assumed that any ancient woodland site being managed under the auspices of the FC would already be recorded in the FC SCDB, with complete and accurate records for current planting date and number of previous rotations. Therefore, we were mostly concerned about identifying ancient woodlands on WI (non-FC) land. Point grid references for 22,572 ancient woodlands (AW) in England were downloaded from the National Digital Archive of Datasets (ndad.ulcc.ac.uk) held at the University of London computer centre on behalf of National Archives. The NDAD data were originally compiled by English Nature in the period 1986-2002, and designate areas in England that were in continuous woodland cover from the year 1600 or earlier, until at least the 1920s. Attributes provided with the AW data included total afforested area and current condition (“Good”, “Unknown” or “Poor”). Boundary information was unavailable. Instead, we approximated the boundaries by assuming that each AW had a perfectly circular shape with the given point grid reference at its centre. The given total area of a specific AW was used to derive the circle radius. Centroids for WI areas were overlain with AW circles to identify WI sites that our model treats as ancient woodlands. If no WI centroid fell within an AW area, we assumed that the land use at that site was no longer woodland, and the record was ignored for carbon accounting purposes. Four woodland types are recognized: plantation, coppice, Christmas trees and ancient. These distinctions have most impact on rotation length and release period for products. Except where specified differently, we treat most stands as actively managed plantation: expected to grow to maturity, clear-felled and restocked according to economic criteria. We assume that 60% of stands are unthinned or only sporadically thinned, while 40% of sites are actively managed and regularly (intermediate intensity) thinned2. How felling and thinning dates were calculated for plantation woodlands is described at length in (Bateman and Lovett 2000). Following advice from FC staff and the British Christmas Tree Growers Association (BCTGA), the models assume coppicing every 12 years, and that Christmas trees are felled every 10 years. We assume that carbon in coppice products has a release period of 22 years, of which 50% is within the first three years. It is assumed that nine previous rotations have occurred among coppice, and four among Christmas trees plantations. All carbon in Christmas trees is released in the year of harvest. After consultation with the BCTGA, we assumed that 10,000 ha of WI areas are in Christmas tree production, but acknowledge that the true figure may be 30-40% more or less. The justifications for these assumptions are explained in greater detail in Brainard et al. (2003). 1 This is an extract of a larger database, the National Inventory of Woodland and Trees (NIWT): FC (2003). 2 The percentage of unthinned forests is not accurately known, but approximate figures of 50-70% have been suggested by colleagues (Price, pers. comm., 2005).
4
Where the WI codes indicated mature trees, ancient woodlands were assigned a planting date of 1874 (this accords with age profiles of non-FC woodland in FC 2001). If the site was also labeled as being in “Good” condition, a very long rotation period (350 years) was assumed. If stocked with mature trees but labeled as “Poor” or “Unknown” condition, the model cut the trees down in 2002. When the WI codes indicated a site stocked with young trees, these were assigned recent planting dates (1980 for broadleaves, 1990 for conifers), and presumed to be managed like any commercial plantation, although rotation value was still set at 3. Tree productivity, species, planting year and rotation data were vital inputs to the carbon sequestration models. Modelling to predict yield from other environmental characteristics was undertaken. Where certain variables were missing, we generally assigned values using the observed proportions as recorded in the FC SCDB or FC (2001). Brainard et al. (2003) give extensive details of variable assignments where data were otherwise missing or ambiguous. Our final estimate of total woodland area and for specific species types, corresponded closely to FC (2001). 3.2 Carbon Uptake in Live Trees The approach relied on underlying assumptions about carbon accrual in beech woodlands at yield class (YC)=4, and Sitka spruce at YC=12. These YCs are believed to be adequately representative of all conifers and broadleaves in the UK (Cannell and Dewar 1995; Milne et al. 1998). Bateman and Lovett (2000) modelled sequestration rates using regression analysis on published data on the carbon gains in these species at these YC, both before and after thinning, from storage data in Cannell and Cape (1991) and yield data from Edwards and Christie (1981) on merchantable volume (MV). MV can be related directly to total carbon storage (Corbyn et al. 1988, Matthews 1991). The models use the actual planting year where known, or an estimate of likely afforestation year. Likely afforestation year was derived by using estimates of optimal rotation lengths at the given YC and discount rates (as calculated by the Forestry Commission’s own woodland management software), and (except for coppice, ancient and Christmas trees) an assumption of no more than two previous rotations prior to the current planting. 3.3 C Storage and Release from Products Bateman et al. (2003) undertook a detailed lifetime analysis of UK domestic production of hardwood and softwood products. This included study of the proportion of wood that went into products with different life-times, and the C release rates from these. About 50% of C from all domestic production (from both thinnings and fellings) is estimated to be released by year 31 (conifers) and year 28 (beech) post harvest. 100% release periods are 200 and 300 years for soft- and hardwoods respectively3. Bateman et al. summed C release curves for products of varying lifetimes, using proportions for the entire UK annual domestic production. Regression analysis was undertaken on these data to generate an inverse power function predicting the proportion of C released from the total carbon in harvested timber, as a function of years after felling. The function related to the total UK domestic production, from records indicating that 49.3% of such production is sawn logs (long-life products), and 21.8% board or other medium-life products. The half-life (when 50% of the C will be released) from 3 Shorter C release half lives for British domestic timber were assumed by Cannell and Dewar (1995) and Matthews and Heaton (2001). However, Cannell and Dewar admit that their figure is little more than a guess, and Matthews and Heaton appear to have adopted the most conservative value possible from sources they consulted. Wood product release functions that are very similar to ours are given in Karjalainen et al. (1994, applicable to Finland) and Skog and Nicholson (2000, a North American study).
5
all softwood production (when YC=10) is 31 years. The half-life from hardwood products (YC=4) is 51 years. We adapted the basic C in products release function for harvest or thinning for specific YCs. Hamilton and Christie (1971) categorise forest products by log diameter: 24 cm (sawn logs, expected to be used in long-life products), 18 cm (medium-life products) and 7cm (short-life products). These data are presented for Sitka spruce yield classes 6-24, at both felling (Table 28) and thinning (Table 61). From these data we can observe, for instance, that a Sitka spruce stand of YC=12 would be expected to yield 49% of its products as sawn logs (long-life products) and 33% its products as hardboard, pallets and other medium life products (top diameter = 18cm). This makes for a total of 82% of products as medium or long-life products. Similarly, thinning a sitka spruce, YC=12 stand ten years before felling (50-51 years), is forecast (in Hamilton and Christie) to yield 10% 24 cm logs, 40% 18 cm logs, and 50% 7cm-diameter logs.
We use the percentages of short, medium and long life products to scale the products function reported in Bateman and Lovett. The release period for the predicted percentage of short-life products remains six years, but the exact percentage of the harvest that is released in this six years varies according to the schedule information in Hamilton and Christie (for that YC and species). The remaining products (medium+long life) are assumed to be released entirely in years 7-200 (for softwoods) or 7-300 (for hardwoods) after harvest, and the total release period is still 200 (softwood) or 300 (hardwood) years. The half-life of C release from the scaled product functions thus varies, depending on the proportions of short and medium-life products that went into each thinning or harvest. For instance, C half-lives from products from felling Sitka spruce YC=10, 12, 16 and 20 are respectively 37, 44, 53 and 56 years. The C half-lives for thinning Sitka spruce, same YCs, ten years before felling date, are much shorter at (respectively) 3, 6, 23 and 32 years. Under an intermediate, marginal thinning regime, optimal thinning intervals for YC=8-18 (typical of conifers) is given in Hamilton and Christie as every 5 years. It is suggested that optimal thinning frequencies for YC=2-6 (typical of broadleaves) would be about 10 years. We only consider thinnings starting at 25 years before felling; products extracted earlier are overwhelmingly short-lived (eg., paper) and therefore expected to have negligible impact on long-term C stores.4 We used the harvest schedule given in Hamilton and Christie to estimate how much (volume) would be removed at each thinning date (as a percentage of what was left behind). This translates directly as an estimate of what percentage (typically about 15%) of the C in live wood that would be expected to be removed at each thinning date. The exact percentage increases with YC and number of years before felling. 3.4 Soils Woodland tends to have higher equilibrium levels of soil carbon than pasture or farmland, which means that a period of C gains into soils often occurs post afforestation. Some soils emit C post-afforestation, however. The decomposition of carbon from decaying organic matter is severely delayed under anaerobic conditions, such as when soils are poorly drained or frequently waterlogged, forming peat (Askew et al. 1985). In consequence, most undisturbed British peat bogs have an ongoing net annual increase of soil carbon. Drainage of peat (necessary as a precursor to afforestation) therefore has two detrimental effects with regard to carbon sequestration. It removes both an existing sink, and the anaerobic
4 It seems likely that thinnings from more than 25 years before felling date, because of their overwhelming input into paper products, have a small net negative impact on C stores.
6
conditions that otherwise cause C to be retained, leading to an extended period of carbon release. Data from the National Soil Resources Institute and Macaulay Land Use Research Institute were used to indicate the presence of mineral (i.e., non-peat), shallow (or ‘thin’, <45 cm depth) and deep (or ‘thick’, >45cm depth) organic soils in 1x1 km squares. We treat organic and peat soils as equivalent. Each woodland area (FC or WI SC) was assigned the soil status (non-peat, thin peat or thick peat) of the area coinciding with the majority of that SC. Adger et al. (1992) reported equilibrium soil carbon levels for a variety of soils and land uses. From these data we concluded (Brainard et al. 2003) that post afforestation gains on non-peat soils might typically be about 100 tC ha-1 on lowlands (<150m elevation), and 50 tC ha-1 in upland areas (≥150m elevation). This distinction between upland and lowland is inevitably somewhat arbitrary, but a map of these areas has close correspondence with upland and lowland habitats as identified by the Countryside Survey 2000 (Haines-Young et al., 2000). The rate of gain in non-peat soils was modelled by consulting published sources and soil science experts. Robert Sheil (pers. comm., 1994) suggested that about 95% of the net gains in soil carbon will occur within 200 years of planting. Bateman and Lovett (2000) undertook regression analysis of published soil carbon uptake curves (Sampson 1992, Dewar and Cannell 1992, Matthews 1993), to produce a model predicting percentage of per annum soil carbon gain over time. The cumulative gain was constrained to equal 95% at two hundred years post afforestation. The model predicted 100% of total carbon gain at 265 years post afforestation, From various sources Bateman and Lovett (2000) concluded that the maximum C release from newly afforested deep peat bogs was 750 tC ha-1. However, no information specific to possible cumulative total C releases on thin peat soils was available. Lacking further information about carbon releases from thin peat soils, we assume that these are approximately 15% of the suggested maximum from thick peat soils, or 112 tC ha-1, which is consistent (Zerva et al. 2005) with observations of C soil levels pre- and post-afforestation on peaty gley (a common shallow organic soil in northern England). From original field measurements and computer modelling, Hargreaves et al. (2003) constructed a descriptive model of carbon exchanges on afforested peat soils in Scotland. The models indicate, based on a chronosequence, that afforested deep peat might emit carbon long term at a rate of about 0.3 t ha-1 per year. We treat this value (0.3tC ha-1) as the expected annual C release on afforested peat (either thick or thin peat) after 26 years. This loss continues in perpetuity, or until the total expected maximum is reached, i.e., 750 tC ha-1 for deep peat soils, 112 tC/ha for shallow peat. Hargreaves et al. (2003) observed actual carbon accumulation rates on undisturbed deep peat of 0.22 and 0.25 tC ha-1 yr-1 at two Scottish sites. Accordingly we assume that the usual sink in British peat bogs is about 0.25 tC ha-1 yr-1. Lacking further information we assume that the usual C sink on thin peat is half of that for thick peat (0.125 tC ha-1 yr-1). However, peat soils may lose their carbon fixing function as global temperatures rise (Chapman and Thurlow 1998; Bousquet et al. 2000), which could theoretically happen as soon as the year 2024. The sinks of 0.25/0.125 tC ha-1 yr-1 are thus directly subtracted from possible C gains in woodlands planted on deep peat, but only until the year 2024. Sensitivity analysis in Brainard et al. (forthcoming) showed that varying these assumptions (by +/ 25%, or +/- 10 years) only has very small impacts on final valuations.
7
3.5 Other C Sources and Sinks Associated with Woodlands Litter Conifer woodlands in the UK accrue carbon in forest floor litter at a rate around 0.25-0.32 t ha-1 per annum (Milne and Brown 2002). Annually, up to 50% of C in this deposition may be transferred into soils (Milne et al. 1998). At the same time, forest floor litter releases CO2 back to the atmosphere at rates that may be accelerated by global warming (Richey et al. 2002). In contrast to this complex reality, we treat carbon deposition in the forest floor simplistically. We assume that carbon gains in forest floor litter are proportional to increases in live wood carbon, scaled such that the maximum rate of net gain into leaf litter is 0.25 tC ha-1 yr-1, for a stand with YC=12. The long term equilibrium is assumed to be 12 tC ha-1 (middle estimate by Dewar and Cannell 1992). The model thus ceases C accrual into leaf litter when the cumulative total C reaches 12 tC ha-1 for YC=14. Equilibrium levels for C in leaf litter at other yield classes are scaled as a proportion of YC14. The addition of C in litter applies only to non-peat soils; the chronosequence developed by Hargreaves et al. (2003) included C in leaf litter and ground flora. Harvest and primary transport Harvesting and management of a timber site creates its own carbon emissions. Karjalainen and Asikainen (1996) estimated that annual harvest-related releases were 1.4% of the amount of carbon in harvested Finnish timber. We believe that harvest-related releases in the UK are somewhat lower, due to milder climate and shorter transport distances. We assume that C releases associated with harvest are slightly less, at 1.25% of the C in the harvested timber. This only refers to primary silvicultural and harvesting activities. Displacement in, medium-life, long-life and fuel products Wood products often displace carbon releases from the use of other materials (such as fuel, plastic, steel or aluminium). Marland et al. (1997) provide estimates of the displaced C associated with different types of wood products. They compared the C required (in energy use) to manufacture wood versus substitute products, concluding that about 25% of the carbon in medium-lived products (such as packaging, pallets and board) would displace the C used for substitutes. However, estimates for the carbon displaced by long-term wood products (such as construction beams, which may replace concrete or steel) varied widely, from 50% to 230% of the C in harvested wood products. We adopt a value of 50% for long-lived products, which is what Marland et al. used in their own work, and is relatively conservative whilst being in approximate agreement with other sources (Brainard et al. forthcoming). Biofuels are another benefit, particularly of coppice woodlands. For each 1 kg of carbon in wood fuels, Marland et al. estimated that 60% (600g) displaces fossil fuels that might otherwise have been used. In our models, this displacement only applies to the first 50% (released in the first three years) of C in coppice products, and to 3% of the total hardwood or conifer harvest on plantation stands. The model treats the C displacement as occurring during the first three years after harvest for coppice biofuels, and during the year after felling for other products. Energy to manufacture paper The displacement factors estimated by Marland et al. (1997) for medium- and long-life products account for secondary (manufacturing-related) C emissions. Only the fossil fuel use required to manufacture short-lived (overwhelming paper) products is unaccounted for. It is difficult to confidently calculate the fossil fuel inputs required to make paper. Although it has been claimed that virgin paper production is energy self-sufficient (e.g., waste
8
byproducts such as bark and black liquor can be burnt for electricity and heat; Collins 1996), most sources (e.g., Ogilvie 1992; Personen 1995; Sundin et al. 1996; Grieg-Gran 1999; Klungness et al. 1999) agree that fossil fuel burning is usually required to make paper products. Drying consumes most of that energy requirement (Farla et al. 1997). The efficiency and types of energy sources vary greatly from one mill to the next (Grieg-Gran 1999), making it difficult to generalise about the energy uptake. Moreover, the energy efficiency of paper-making in the UK is expected to improve in the near future (Sundin et al. 1996; Farla et al. 1997), which adds uncertainty when applying to the industry today any estimate based on historical data of energy offsets and usage. For our purposes we needed estimates of the energy requirement that related directly to the amount of C in the original or end products. Pingoud and Lehtilä (2002) estimated that, in Finland, paper production resulted in C releases (from fossil fuel burning) equivalent to 30-60% of the C stored in the end product. The percentage varied depending on the type of paper product and the assumptions about energy sources at individual paper mills. The analysis included consumption of fossil fuels for harvest and transport as well as heating of facilities, drying and other manufacturing activities. It is hard to know how applicable the 30-60% figures are for Britain. The data in Pingoud and Lehtilä do not separate harvest/transport releases (which are known to be a quite small part of the energy total, and which we account for elsewhere) from manufacture. We opt for a central estimate of C releases associated with fossil fuel consumption to make paper (45% of the C in end product). Note that using a 45% figure, long term C storage in thinning products is negative (Figure 1). Empirically, we find that if the fossil fuel consumption for paper manufacture is assumed to be 25-38% of the C in the final products, then thinnings have negligible net impact on final valuations; what C storage they provide in products is entirely (or almost entirely) offset by fossil fuel consumption required for harvest and to make paper.5 The model only considers thinnings starting at 25 years before felling date, which probably means that our estimates of C storage in thinnings is somewhat over-estimated. 3.6 The Social Value of Carbon The “social value” per metric tonne (1000kg) of sequestered Carbon (svtC) can be defined as the benefit in savings from damage avoidance. This benefit is calculated by observation of compensatory costs to reveal its cost to society, or “shadow price”. There is considerable debate about both the true social value of sequestered C, as well as the appropriate discount rate and function (Weitzman 1998; Pearce 2003). Here we employ a conventional discount function (Price 1993), and experiment with a range of discount rates and social values of C. We consider four candidate discount rate/svtC combinations, all expressed in US dollars (base year=2001): 3%/$1 (Mendelsohn 2003; pers. comm., 2005), 3.5% (UK government’s preferred discount rate for projects with social benefits, HM Treasury 2003) and $10 (a notional svtC), 5%/$17.1 (Tol 1999) and 1%/$109.5 (Clarkson and Deyes 2002). The Clarkson and Deyes figure ($109.5) was for a brief period, the preferred (by the UK
5 The body of work by Cannell and colleagues (see references for examples), ignores thinnings on the basis that their main products (paper) are over-whelmingly short-lived. Price (pers. comm., 2005) argued that thinnings should not be ignored; there is a high percentage of longer-lived products in late thinnings. Our assessment (also see Brainard et al. forthcoming) is that the assumption by Cannell et al. that thinnings could validly be ignored in C accounting was possibly defensible, but not for the reason they believed it was. Thinnings sometimes do hold significant amounts of carbon, but they also mostly go into short-lived products (e.g., paper) that require high fossil fuel inputs for manufacture. The net effect (Brainard et al. forthcoming) is that thinnings from stands with the most common YC values (10-16) contribute little or even possibly negative net long-term C storage.
9
Treasury) svtC for cost benefit analysis in the UK (Pearce 2003). In our modelling, the svtC increments 1% each year for the first 30 years, based on expected increases in the magnitude of GHG-related damages. Values are held constant from 2031 in the assumption that the trend towards increased damages will be mitigated by adaptive change. 3.7 Woodland Created in Future The woodland data records only referred to planting before 2002. It is important to consider later plantings, as well. FC (2001) stated that an additional 13.4 kha of new broadleaf and 4.7 kha of new conifer woodlands were created in 2001, which is broadly consistent with longer-term trends (Cannell 1999). Our own map overlays (Brainard et al. 2003) suggest that among new Sitka spruce plantings in the period 1980-2001, 4% were on lowland non-peat, 11% on upland non-peat, 68% on thin peat and 17% on thick peat. Corresponding percentages for broadleaves in all planting years were 56% on lowlands, 33% on upland and 11% on thin peat. These observations are probably somewhat biased by the resolution of our digital data, but they are consistent with the findings of others (Chapman et al. 2001). We therefore assume that these percentages and total planting areas and rates in each species in 2001 will hold true in future plantings, and that all new plantings will be Sitka spruce, average YC=12, or beech, average YC=6. 3.8 Other Model Assumptions Carbon gains in live trees are assumed to stop when a rotation reaches the age of 200 years (conifers) or 300 years (broadleaves). We include only the marginal gains in carbon sequestered in soils, litter, live wood, and products, during the year 2001 (base year) and thereafter. Discounting only occurs from the year 2001 onwards, until the year 3001, when final tallies are taken. This long period should provide ample time to calculate net carbon sequestration over multiple rotations. The year 3001 is only used as a consistent endpoint, and is not significant in itself. At felling, only 70% of the C in live wood is retained in products (merchantable wood). 30% of the C in living trees – found in bark, foliage, roots and harvest shavings not otherwise input to products – is wasted and the C in these waste by-products is presumed to be released back to the atmosphere almost immediately. About 2.4% of harvested wood biomass is used immediately as fuel (Bateman and Lovett 2000). We assume that some other wood products also have a secondary usage (disposed of by burning to generate heat or energy) as fuel. Our model assumes that a total of 3% of products are used primarily or secondarily as fuel. We do not consider the energy requirements to recycle or reuse paper products.
10
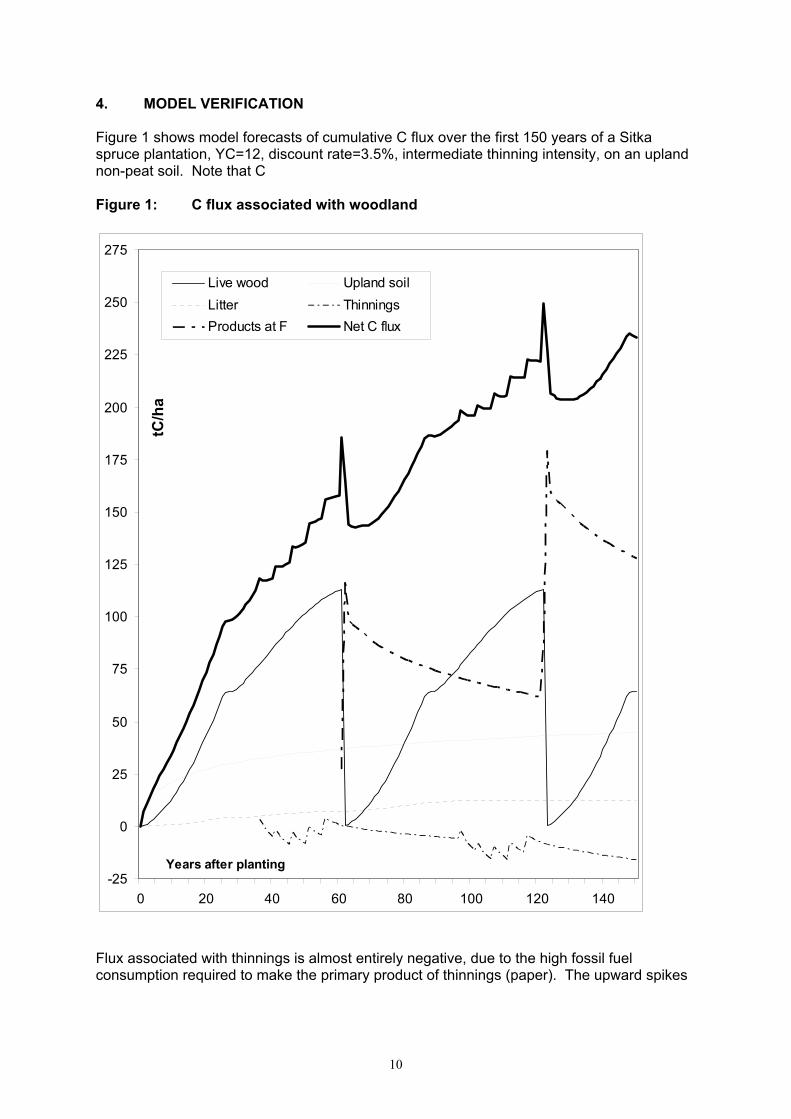
4. MODEL VERIFICATION Figure 1 shows model forecasts of cumulative C flux over the first 150 years of a Sitka spruce plantation, YC=12, discount rate=3.5%, intermediate thinning intensity, on an upland non-peat soil. Note that C Figure 1: C flux associated with woodland
-25
0
25
50
75
100
125
150
175
200
225
250
275
0 20 40 60 80 100 120 140
Years after planting
tC/h
a
Live wood Upland soilLitter ThinningsProducts at F Net C flux
Flux associated with thinnings is almost entirely negative, due to the high fossil fuel consumption required to make the primary product of thinnings (paper). The upward spikes
11
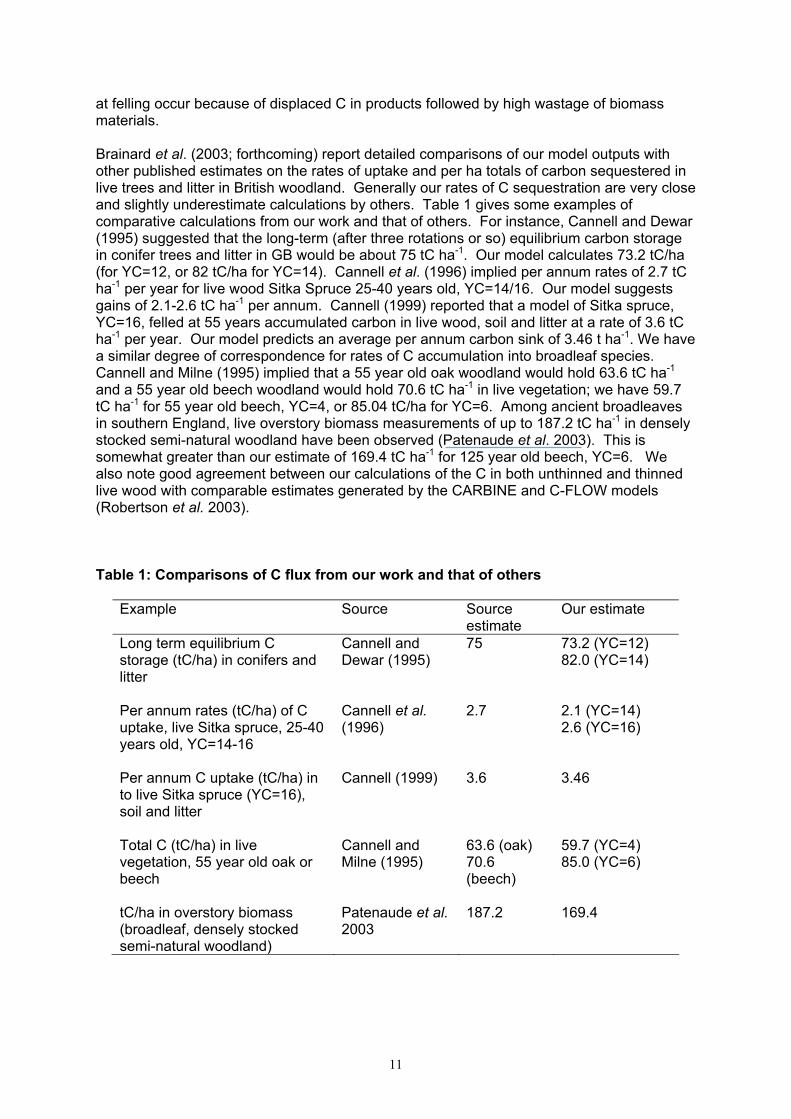
at felling occur because of displaced C in products followed by high wastage of biomass materials. Brainard et al. (2003; forthcoming) report detailed comparisons of our model outputs with other published estimates on the rates of uptake and per ha totals of carbon sequestered in live trees and litter in British woodland. Generally our rates of C sequestration are very close and slightly underestimate calculations by others. Table 1 gives some examples of comparative calculations from our work and that of others. For instance, Cannell and Dewar (1995) suggested that the long-term (after three rotations or so) equilibrium carbon storage in conifer trees and litter in GB would be about 75 tC ha-1. Our model calculates 73.2 tC/ha (for YC=12, or 82 tC/ha for YC=14). Cannell et al. (1996) implied per annum rates of 2.7 tC ha-1 per year for live wood Sitka Spruce 25-40 years old, YC=14/16. Our model suggests gains of 2.1-2.6 tC ha-1 per annum. Cannell (1999) reported that a model of Sitka spruce, YC=16, felled at 55 years accumulated carbon in live wood, soil and litter at a rate of 3.6 tC ha-1 per year. Our model predicts an average per annum carbon sink of 3.46 t ha-1. We have a similar degree of correspondence for rates of C accumulation into broadleaf species. Cannell and Milne (1995) implied that a 55 year old oak woodland would hold 63.6 tC ha-1 and a 55 year old beech woodland would hold 70.6 tC ha-1 in live vegetation; we have 59.7 tC ha-1 for 55 year old beech, YC=4, or 85.04 tC/ha for YC=6. Among ancient broadleaves in southern England, live overstory biomass measurements of up to 187.2 tC ha-1 in densely stocked semi-natural woodland have been observed (Patenaude et al. 2003). This is somewhat greater than our estimate of 169.4 tC ha-1 for 125 year old beech, YC=6. We also note good agreement between our calculations of the C in both unthinned and thinned live wood with comparable estimates generated by the CARBINE and C-FLOW models (Robertson et al. 2003). Table 1: Comparisons of C flux from our work and that of others
Example Source Source estimate
Our estimate
Long term equilibrium C storage (tC/ha) in conifers and litter
Cannell and Dewar (1995)
75 73.2 (YC=12) 82.0 (YC=14)
Per annum rates (tC/ha) of C uptake, live Sitka spruce, 25-40 years old, YC=14-16
Cannell et al. (1996)
2.7 2.1 (YC=14) 2.6 (YC=16)
Per annum C uptake (tC/ha) in to live Sitka spruce (YC=16), soil and litter
Cannell (1999) 3.6 3.46
Total C (tC/ha) in live vegetation, 55 year old oak or beech
Cannell and Milne (1995)
63.6 (oak) 70.6 (beech)
59.7 (YC=4) 85.0 (YC=6)
tC/ha in overstory biomass (broadleaf, densely stocked semi-natural woodland)
Patenaude et al. 2003
187.2 169.4
12
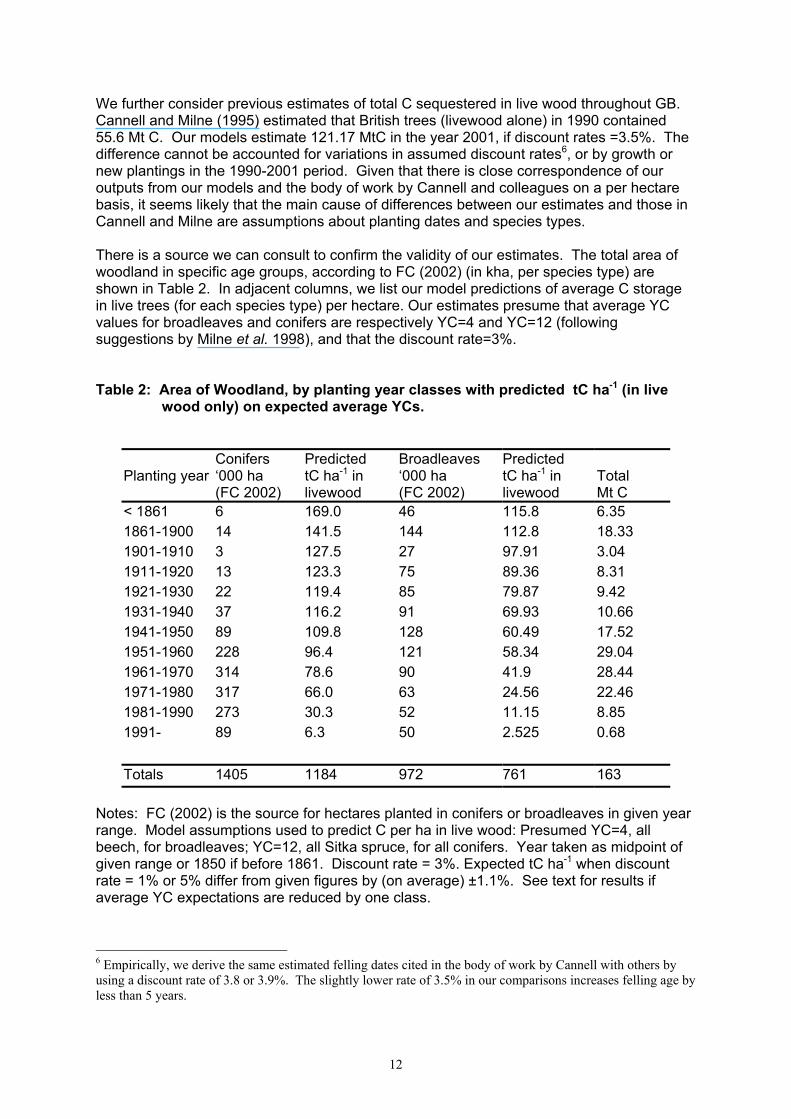
We further consider previous estimates of total C sequestered in live wood throughout GB. Cannell and Milne (1995) estimated that British trees (livewood alone) in 1990 contained 55.6 Mt C. Our models estimate 121.17 MtC in the year 2001, if discount rates =3.5%. The difference cannot be accounted for variations in assumed discount rates6, or by growth or new plantings in the 1990-2001 period. Given that there is close correspondence of our outputs from our models and the body of work by Cannell and colleagues on a per hectare basis, it seems likely that the main cause of differences between our estimates and those in Cannell and Milne are assumptions about planting dates and species types. There is a source we can consult to confirm the validity of our estimates. The total area of woodland in specific age groups, according to FC (2002) (in kha, per species type) are shown in Table 2. In adjacent columns, we list our model predictions of average C storage in live trees (for each species type) per hectare. Our estimates presume that average YC values for broadleaves and conifers are respectively YC=4 and YC=12 (following suggestions by Milne et al. 1998), and that the discount rate=3%. Table 2: Area of Woodland, by planting year classes with predicted tC ha-1 (in live
wood only) on expected average YCs.
Planting year
Conifers ‘000 ha (FC 2002)
Predicted tC ha-1 in livewood
Broadleaves ‘000 ha (FC 2002)
Predicted tC ha-1 in livewood
Total Mt C
< 1861 6 169.0 46 115.8 6.35 1861-1900 14 141.5 144 112.8 18.33 1901-1910 3 127.5 27 97.91 3.04 1911-1920 13 123.3 75 89.36 8.31 1921-1930 22 119.4 85 79.87 9.42 1931-1940 37 116.2 91 69.93 10.66 1941-1950 89 109.8 128 60.49 17.52 1951-1960 228 96.4 121 58.34 29.04 1961-1970 314 78.6 90 41.9 28.44 1971-1980 317 66.0 63 24.56 22.46 1981-1990 273 30.3 52 11.15 8.85 1991- 89 6.3 50 2.525 0.68 Totals 1405 1184 972 761 163
Notes: FC (2002) is the source for hectares planted in conifers or broadleaves in given year range. Model assumptions used to predict C per ha in live wood: Presumed YC=4, all beech, for broadleaves; YC=12, all Sitka spruce, for all conifers. Year taken as midpoint of given range or 1850 if before 1861. Discount rate = 3%. Expected tC ha-1 when discount rate = 1% or 5% differ from given figures by (on average) ±1.1%. See text for results if average YC expectations are reduced by one class. 6 Empirically, we derive the same estimated felling dates cited in the body of work by Cannell with others by using a discount rate of 3.8 or 3.9%. The slightly lower rate of 3.5% in our comparisons increases felling age by less than 5 years.

13
The far right column in Table 2 gives the expected total MtC (from our models) for trees in the given age brackets, net of thinnings (Cannell and Milne also omit C in thinnings). Thus, among trees planted before 1861, our model suggests 6.35 Mt C (=(6*169+46*115.8)/103). The total expected C in all live wood present in 2001 in GB is 163 Mt in 2001. Recall that this is based on the suggestions made by Milne et al. (1998) for representative conifer and broadleaf YCs (respectively 12 and 4) in the UK. However, if the presumed average YC values are dropped to 10 (conifers) and 2 (broadleaves) the total estimated C in live wood in 2001 falls to 117.3 Mt, using the per ha data in Table 2 (and our model predictions based on per ha C storage for the specified YC). 117.3 Mt is extremely close to the figure our model calculates from individual records. This crude analysis suggests that YC values of 10 (conifers) and 2 (broadleaves) may be more representative of woodland in the UK than the YC values suggested by Milne et al. We are left with the impression that our estimates of total C storage presently in British woodland, and of its economic value, are realistic estimates, although still significantly higher than the work by Cannell and Milne (1995) might have lead us to expect.
14
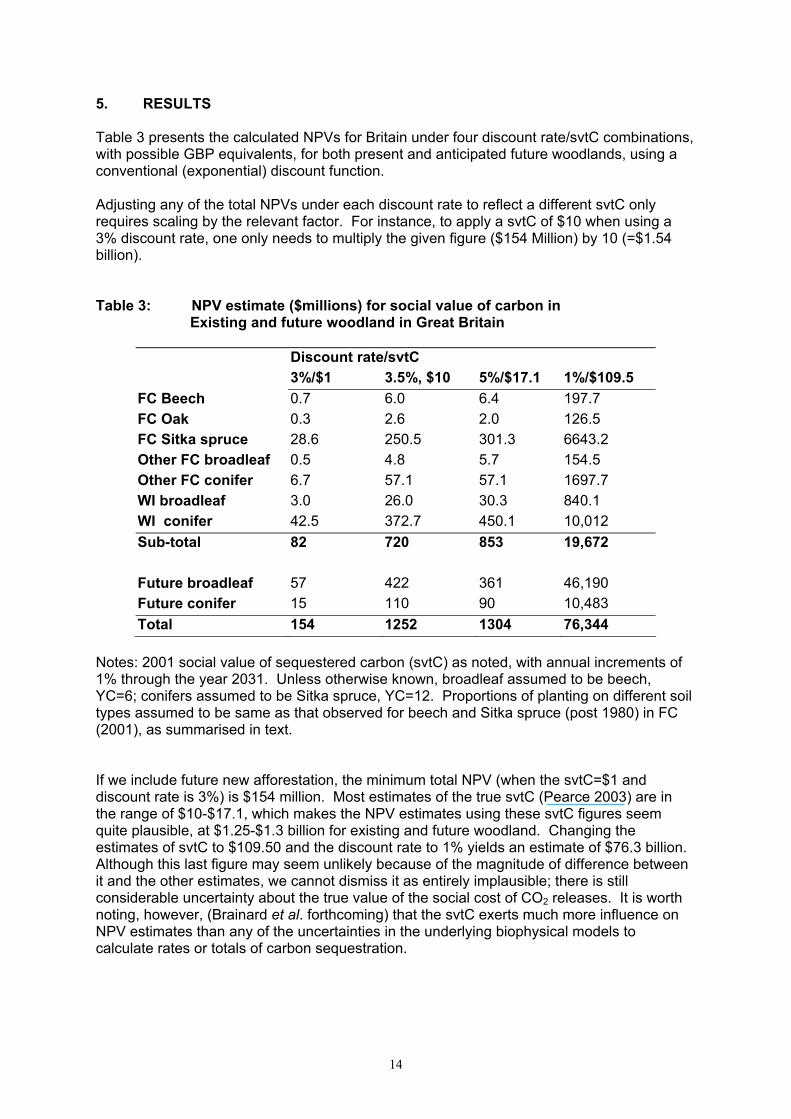
5. RESULTS Table 3 presents the calculated NPVs for Britain under four discount rate/svtC combinations, with possible GBP equivalents, for both present and anticipated future woodlands, using a conventional (exponential) discount function. Adjusting any of the total NPVs under each discount rate to reflect a different svtC only requires scaling by the relevant factor. For instance, to apply a svtC of $10 when using a 3% discount rate, one only needs to multiply the given figure ($154 Million) by 10 (=$1.54 billion). Table 3: NPV estimate ($millions) for social value of carbon in
Existing and future woodland in Great Britain
Discount rate/svtC 3%/$1 3.5%, $10 5%/$17.1 1%/$109.5 FC Beech 0.7 6.0 6.4 197.7 FC Oak 0.3 2.6 2.0 126.5 FC Sitka spruce 28.6 250.5 301.3 6643.2 Other FC broadleaf 0.5 4.8 5.7 154.5 Other FC conifer 6.7 57.1 57.1 1697.7 WI broadleaf 3.0 26.0 30.3 840.1 WI conifer 42.5 372.7 450.1 10,012 Sub-total 82 720 853 19,672 Future broadleaf 57 422 361 46,190 Future conifer 15 110 90 10,483 Total 154 1252 1304 76,344
Notes: 2001 social value of sequestered carbon (svtC) as noted, with annual increments of 1% through the year 2031. Unless otherwise known, broadleaf assumed to be beech, YC=6; conifers assumed to be Sitka spruce, YC=12. Proportions of planting on different soil types assumed to be same as that observed for beech and Sitka spruce (post 1980) in FC (2001), as summarised in text. If we include future new afforestation, the minimum total NPV (when the svtC=$1 and discount rate is 3%) is $154 million. Most estimates of the true svtC (Pearce 2003) are in the range of $10-$17.1, which makes the NPV estimates using these svtC figures seem quite plausible, at $1.25-$1.3 billion for existing and future woodland. Changing the estimates of svtC to $109.50 and the discount rate to 1% yields an estimate of $76.3 billion. Although this last figure may seem unlikely because of the magnitude of difference between it and the other estimates, we cannot dismiss it as entirely implausible; there is still considerable uncertainty about the true value of the social cost of CO2 releases. It is worth noting, however, (Brainard et al. forthcoming) that the svtC exerts much more influence on NPV estimates than any of the uncertainties in the underlying biophysical models to calculate rates or totals of carbon sequestration.
15
6. DISCUSSION AND CONCLUSION The work presents a model that calculates the social value of carbon sequestration in woodlands. To our knowledge, no such analysis has been previously undertaken with such a complete inventory of actual species types, planting dates and management regimes. The study is also especially thorough in including many aspects of carbon accounting that have often been over-looked in previous studies, including C in thinning products, C-displacement in wood products, harvesting and manufacture releases and the lost C sink on disturbed peat soils. The work helps place in context the annual publicly-funded subsidy that the Forestry Commission receives. It should also inform any other attempts to undertaken cost-benefit analysis of woodland in the UK. The minimum social value of C sequestration associated with existing woodland is $82 million, while a valuation of $720-$853 is quite plausible. We cannot dismiss the possibility that the true value of C storage associated with existing woodland may be as high as $19.7 billion. Future new afforestation would also increase these figures considerably. As with any model, there are things we omit and things we might improve. A more complete assessment of the global-warming impacts of forestry would need to consider forestry or soil greenhouse-gas (GHG) emissions other than carbon dioxide. For instance, peat soils may act as a sink or source of other important GHGs: methane (CH4) and nitrous oxide (N2O). The global warming potential (GWP) of methane is roughly 21 times as high as carbon dioxide, nitrous oxide has about 300 times the GWP of CO2. Undisturbed peat is generally a net source of methane emissions, while disturbed peat (including afforested peat) is likely to become a methane sink. Whilst many soils have been observed to emit N2O, drained peatlands are noted as particularly important sources (Leffelaar et al. 2000; Chapman et al. 2001). The picture is complicated by nitrous oxide and related NOx emissions from routine forestry operations; i.e., from thinning, harvesting and milling machinery. Moreover, climate change (including warmer temperatures and higher atmospheric concentrations of CO2) may increase timber yields and the rate of carbon uptake in living trees, as well as nitrogen deposition in GB woodlands (Murray et al. 2002). CH4 is also relevant with regard to disposal options. We assume that all C in disposed of wood products quickly and entirely decays to CO2. In reality, disposal options significantly affect how C is released. For instance, burning wood products results in immediate release of almost all C as CO2. In reality, most solid wood and paper products are buried in landfill, where decay is very slow: some C will effectively never be released at all, while a small proportion is released as CH4, due to complex physical and chemical processes (Skog and Nicholson 2000). Methane can be captured and used as fuel; burning CH4 for fuel has the benefits of both displacing fossil fuel sources, and releasing C in the less potent GHG form of CO2. However, only a minority of UK landfills have capture facilities, and there is great uncertainty about what percentage of CH4 releases can potentially be collected (UKHL 1998). Barlaz (2004) summarises previous studies which calculated that 50-84% of the carbon in paper and other wood products may remain long-term in landfills. Reviewing Barlaz, Miner (2003) concluded that, even adjusting for methane releases, approximately 40% of the C (or equivalents, including un-captured CH4) in paper/wood products is stored at least 100 years. Unfortunately, as Barlaz highlights, understanding of C storage functions and decay processes in landfills is still poor. Such research has not progressed to a point that we could confidently include different disposal options in the modelling in this paper. Moreover, there are high social costs of waste disposal in landfills (Powell and Brisson 1994) that might need to be accounted for. We ignore C in ground flora, which is significant on some semi-natural woodland sites (Patenaude et al. 2003). It can also be argued that increases in the carbon stocks in GB
16
woodlands serve only to displace carbon in woodland stocks overseas, and thus growing more trees in the UK does nothing on a global scale to reduce global warming. We do not attempt to address how changes in this trade balance might impact our results. The mapped database generally omitted woodland on sites of less than about 2 ha. This means small groups of trees (including most in urban areas or lining roads) were unaccounted for. It is unclear what the net effect might be of these omitted factors: disposal options, C in ground flora, imports displacement, overlooked trees. Sensitivity analysis in Brainard et al. (2003; forthcoming) suggests that wide confidence intervals apply to the valuations here. Much of this uncertainty comes from imprecise information about species type, underlying soil, planting year, rotation, management regime and other variables on non-FC woodlands. However, the ongoing disputes in the environmental economics community over the correct social value of carbon (per tonne), appropriate discount rate and even the right form for the discounting function (Henderson and Bateman 1995; Weitzman 1998) have the most dramatic impacts on attempts to value the C-sequestration function of woodlands. This is amply demonstrated by the wide range of NPV estimates in Table 3.
17
References Adger, W.N., Brown, K., Sheil, R.S. and Whitby, M. C. (1992), Carbon dynamics of land use
in Great Britain, Jounral of Environmental Management 36:117-133. Askew, G.P., Payton, R.W. and Sheil, R.S. (1985), Upland soils and land clearance in Britain
during the second millennium BC. In: Upland Settlement in Britain: The Second Millennium BC and After, Spratt, D. and Burgess, C. (eds). British Archaeological Report, British Series 143, 5-33.
Barlaz M (2004) Critical Review of Forest Products Decomposition in Municipal Solid Waste
Landfills. Technical Bulletin 872, National Council for Air and Stream Improvement, March 2004. http://www.ncasi.org/Publications/Detail.aspx?id=97.
Bateman, I.J. and Lovett, A.A. (2000) Estimating and valuing the carbon sequestered in
softwood and hardwood trees, timber products and forest soils in Wales. Journal of Environmental Management 60: 301-323.
Bateman, I.J., Lovett, A.A. and Brainard, J.S. 2003 Applied Environmental Economics: A GIS
Approach to Cost-benefit Analysis, Cambridge University Press, Cambridge. Bousquet, P., Peylin, P., Ciais, P., Le Quere, C., Friedlingstein P and Tans P.P. (2000),
Regional changes in carbon dioxide fluxes of land and oceans since 1980, Science 290:1342-1346.
Brainard, J., Lovett, A. and Bateman, I. (2003), Carbon sequestration benefits of Woodland,
Report to the Forestry Commission. Social and Environmental Benefits of Forestry Phase 2. At www.forestry.gov.uk/website/pdf.nsf/pdf/ carbonseqrep0603.pdf/
Brainard, J., Lovett, A. and Bateman, I., (forthcoming). Sensitivity analysis in calculating the
social value of carbon sequestered in British grown Sitka spruce. Cannell, M.G.R. (1999), Growing trees to sequester carbon in the UK: answers to some
common questions, Forestry 72: 237-247. Cannell, M. and Cape, J. (1991), International environmental impacts: acid rain and the
greenhouse effect, in: Forestry Expansion: a Study of Technical, Economic and Ecological Factors: Paper No. 2, Forestry Commission, Alice Holt Lodge Research Station, Farnham, Surrey.
Cannell, M.G.R., Cruickshank, M.M. and Mobbs, D.C. (1996), Carbon storage and
sequestration in the forests of Northern Ireland, Forestry 69: 155-165. Cannell, M.G.R. and Dewar, R.C. (1995), The carbon sink provided by plantation forests
and their products in Britain, Forestry 68: 35-48. Cannell, M.G.R. and Milne, R. (1995), Carbon pools and sequestration in forest ecosystems
in Britain, Forestry 68: 361-378. Chapman, S.J. and Thurlow, M. (1998), Peat respiration at low temperatures, Soil Biology
and Biochemistry 30:1013-1021.
18
Chapman, S.J., Towers, W., Williams, B.L., Coull, M.C. and Paterson, E. (2001), Review Of The Contribution to Climate Change of Organic Soils Under Different Land Uses, Scottish Executive Central Research Unit, Edinburgh. Also at http://www.scotland.gov.uk/cru/kd01/lightgreen/rccs-00.asp.
Christiansen T and Torkington N (1998) Perl Cookbook. O’Reilly and Associates, Inc.
Sebastopol, CA, USA. http://www.perl.com. Clarkson, R. and Deyes, K. (2002), Estimating the Social Cost of Carbon Emissions,
Government Economic Service Working Paper 140, Department of Environment, Food and Rural Affairs: London.
Collins, L. (1996). Recycling and the environmental debate: a question of social conscience
or scientific reason? Journal of Environmental Planning and Management, 39(3), 335-355
Corbyn, I.N., Crockford, K.J. and Savill, P.S. (1988), The estimation of the branchwood
component of broadleaved woodlands, Forestry 61(3): 193-204. DEFRA (Department for Environment, Food and Rural Affairs) (2002), Digest of
Environmental Statistics. http://www.defra.gov.uk/environment/statistics/ des/index.htm.
Dewar, R.C. and Cannell, M.G.R. (1992), Carbon sequestration in the trees, products and
soils of forest plantations: An analysis using UK examples, Tree Physiolology 11: 49-72.
Edwards, P.N. and Christie, J.M. (1981), Yield models for forest management Forestry
Commission Booklet 48, HMSO, London. Farla J, Blok K and Schipper L (1997) Energy efficiency developments in the pulp and paper
industry, Energy Policy 25: 745-758. FC (Forestry Commission) (2001), Forestry Statistics, Economics and Statistics Unit,
Forestry Commission, Edinburgh. FC (Forestry Commission) (2002), Forestry Statistics, Economics and Statistics Unit,
Forestry Commission, Edinburgh. FC (Forestry Commission) (2003), National Inventory of Woodland and Trees – Great
Britain, Forestry Commission, Edinburgh. Grieg-Gran M. (1999) Final Report to the Newspaper Recycling Working Group International
Institute for Environment and Development, Edinburgh, UK. HM Treasury (2002), 2002 Spending Review Opportunity and Security for all: Investing in an
Enterprising, Fairer Britain, New Public Spending Plans 2003-2006, HM Treasury/The Stationery Office Ltd, London.
HM Treasury (2003), The Green Book Appraisal and Evaluation in Central Government. Her
Majesties Stationary Office, London. Haines-Young, R.H., Barr, C.J., Black, H.I.J., Briggs, D.J., Bunce, R.G.H., Clarke, R.T.,
Cooper, A., Dawson, F.H., Firbank, L.G., Fuller, R.M., Furse, M.T., Gillespie, M.K.,
19
Hill, R., Hornung, M., Howard, D.C., McCann, T., Morecroft, M.D., Petit, S., Sier, A.R.J., Smart. S.M., Smith, G.M.,. Stott, A.P., Stuart, R.C. and Watkins, J.W. (2000), Accounting for Nature: Assessing Habitats in the UK Countryside DETR, London ISBN 1 85112 460 8. Also on http://www.cs2000.org.uk/.
Hamilton G.J. & Christie J. M. (1971) Forest Management Tables (Metric). Forestry
Commission Booklet No. 34. London. Hargreaves, K.J., Milne, R. and Cannell, M.G.R. (2003), Carbon balance of afforested
peatland in Scotland, Forestry 76: 299-317. Henderson, N. and Bateman, I. J. (1995), Empirical and public choice evidence for
hyperbolic social discount rates and the implications for intergenerational discounting, Environmental and Resource Economics 5: 413-423.
Karjalainen, T. and Asikainen, A. (1996), Greenhouse gas emissions from the use of primary
energy in forest operations and long-distance transportation of timber in Finland, Forestry 69: 215-228.
Karjalainen, T., Kellomäki, S. and Pussinen, A (1994), Role of wood-based products in
absorbing atmospheric carbon, Silva Fennica 28: 67-80. Klungness JH, Pianta F, Stroika ML, Sykes M, Tan F and AbuBakr S (1999) Lightweight,
High-Opacity Paper: Process Costs and Energy Use Reduction, Fundamental Advances in the Pulp and Paper Industry, AIChE Symposium Series No. 322, 95: 99-102.
Leffelaar, P.A., Langeveld, C.A., Hofman, J.E., Segers, R., Pol-Dasselaar van den, A. van,
Goudriaan, J., Rabbinge, R. and Oenema, O. (2000), Het geintegreerde lachgas en methaan grasland project (“The integrated nitrous oxide and methane grassland project”) NOP Rapport 410200038. Available at NOP. Order by e-mail [email protected] or at www.nop.nl.
Marland, G. Schlamadinger, B. and Leiby, P. (1997), Forest/biomass based mitigation
strategies: does the timing of carbon reductions matter?, Critical Reviews in Environmental Science and Technology 27: S213-S226.
Matthews, G. (1993), The carbon content of trees. Technical Paper 4. Forestry Commission,
Edinburgh. Matthews, R.W. (1991), Biomass production and carbon storage by British forests, mimeo,
Mensuration Branch, Forestry Commission, Alice Holt Lodge Research Station, Farnham, Surrey.
Matthews, R. and Heaton, R. (2001) Effectiveness of carbon accounting methodologies for
LULUCF and harvested wood products in supporting climate-conscious policy measures. in UK Emissions by Sources and Removals by Sinks due to Land Use, Land Use Change and Forestry Activities, Report April 2001. Centre for Ecology & Hydrology, Edinburgh. At http://www.nbu.ac.uk/ukcarbon/docs/DETR%20Contract%20Report %202001%20-%20section%2010.pdf
20
Mendelsohn, R. (2003), The social cost of carbon: An unfolding value. Social Cost of Carbon conference, London, 7 July 2003.
Milne, R. and Brown, T.A.W. (2002), Mapping of carbon uptake in British woodlands and
forests using EuroBiota and C-Flow. in UK Emissions by Sources and Removals by Sinks due to Land Use, Land Use Change and Forestry Activities, Report, May 2002. Centre for Ecology & Hydrology, Edinburgh.
Milne, R., Brown, T.A.W. and Murray, T.D. (1998), The effect of geographical variation of
planting rate on the uptake of carbon by new forests of Great Britain, Forestry 71: 297-310.
Miner R (2003) Characterizing Carbon Sequestration in Forest Products Along the Value
Chain. Paper prepared for the Climate Change Working Group of the International Council of Forest and Paper Associations. http://www.pscleanair.org/specprog/globclim/cpsp/pdf/513a_co2seq1.pdf
Murray, M.B., Thornley, J. and Cannell, M. G. R. (2002), Modelling the impact of climate
change and nitrogen deposition on carbon sequestration of UK plantation forests. . in UK Emissions by Sources and Removals by Sinks due to Land Use, Land Use Change and Forestry Activities, Report May 2002. Centre for Ecology & Hydrology, Edinburgh.
Ogilvie, S.M. (1992). A Review of the Environmental Impact of Recycling. Warren Springs
Laboratory, Stevenage Patenaude, G.L., Briggs, B.D.J., Milne, R., Rowland, C.S., Dawson, T.P. and Pryor, S.N.
(2003), The carbon pool in a British semi-natural woodland, Forestry 76, 109-119. Pearce, D.W. (2003) The Social Cost of Carbon and its Policy Implications, Oxford Review
of Economic Policy 19: 362-384. Personen, K.V. (1995). Recycled vs virgin-energy and manufacturing cost differentials: four
hypothetical case- studies, pp. 251-265 in Focus 95+ Recycling Symposium 19-21 March 1995. Tappi Press, Atlanta, Georgia..
Pingoud K. and Lehtilä A. (2002) Fossil carbon emissions associated with carbon flows of wood products. Mitigation and Adaptation Strategies for Global Change 7: 63-83.
Powell JC and Brisson I (1994) The Assessment of Social Costs and Benefits of
Waste Disposal. Centre for Social and Economic Research on the Global Environment Working Paper WM-94-06. ISSN 0967-8875 University of East Anglia, Norwich, UK. http://www.uea.ac.uk/env/cserge/pub/wp/wm /wm_1994_06.pdf.
Price, C. (1993), Time, Discounting and Value. Blackwell Publishers. Richey, J.E., Melack, J.M., Aufdenkampe, A.K., Ballester, V.M. and Hess, L.L. (2002),
Outgassing from Amazonian rivers and wetlands as a large tropical source of atmospheric CO2 , Nature 416:617-620.
Robertson, K., Ford-Robertson, J., Matthews, R.W. and Milne, R. (2003) Evaluation of the C-
FLOW and CARBINE carbon accounting models in UK Emissions by Sources and Removals by Sinks due to Land Use, Land Use Change and Forestry Activities,
21
Report, April 2003. Centre for Ecology & Hydrology, Edinburgh. http://www.nbu.ac.uk/ukcarbon/docs/DEFRA_Report_2003_ Section03_web.pdf.
Sampson, R.N. (1992), Forestry operations in the United Sates to mitigate the effects of
global warming, Water, Air and Soil Pollution 64:157-180. Skog KE and Nicholson GA (2000) Carbon Sequestration in Wood and Paper Products. In
USDA Forest Service General Technical Report rmrs-gtr-59, 79-88. Sundin E. Svensson N., McLaren J. and Jackson T. (2001) Materials and energy flow
analysis of paper consumption in the UK, 1987-2010. J. of Industrial Ecology, 5(3):89-105.
Tol, R 1999. The marginal costs of greenhouse gas emissions, The Energy Journal, 20,1, 61-81. UKHL (United Kingdom House of Lords) (1998) European Communities Seventeenth
Report, 17 May 1998. Weitzman, M.L. (1998), Why the far-distant future should be discounted at its lowest
possible rate, Journal of Environmental Economics and Management 36:201-208. Zerva A, Ball T, Smith KA and Mencuccini M. (2005) Soil carbon dynamics in a Sitka spruce
(Picea sitchensis (Bong.) Carr.) chronosequence on a peaty gley, Forest Ecology and Management, 205: 227-240.