the signatures of autozygosity among patients with colorectal cancer
TRANSCRIPT
The Signatures of Autozygosity among Patients with
Colorectal Cancer
Manny D. Bacolod,1Gunter S. Schemmann,
7Shuang Wang,
2Richard Shattock,
1Sarah F. Giardina,
1
Zhaoshi Zeng,3Jinru Shia,
4Robert F. Stengel,
7Norman Gerry,
10Josephine Hoh,
11Tomas Kirchhoff,
5
Bert Gold,9Michael F. Christman,
10Kenneth Offit,
5William L. Gerald,
4Daniel A. Notterman,
8
Jurg Ott,6Philip B. Paty,
3and Francis Barany
1
1Department of Microbiology, Weill Medical College of Cornell University; 2Department of Biostatistics, Mailman School of Public Health,Columbia University; Departments of 3Surgery, 4Pathology, and 5Medicine, Memorial Sloan-Kettering Cancer Center; 6Laboratory ofStatistical Genetics, Rockefeller University, New York, New York; 7School of Engineering and Applied Science and 8Department ofMolecular Biology, Princeton University, Princeton, New Jersey; 9Laboratory of Genomic Diversity, National Cancer Institute atFrederick, Frederick, Maryland; 10Department of Genetics and Genomics, Boston University, Boston, Massachusetts; and11School of Public Health, Yale University, New Haven, Connecticut
Abstract
Previous studies have shown that among populations with ahigh rate of consanguinity, there is a significant increase in theprevalence of cancer. Single nucleotide polymorphism (SNP)array data (Affymetrix, 50K XbaI) analysis revealed longregions of homozygosity in genomic DNAs taken from tumorand matched normal tissues of colorectal cancer (CRC)patients. The presence of these regions in the genome mayindicate levels of consanguinity in the individual’s familylineage. We refer to these autozygous regions as identity-by-descent (IBD) segments. In this study, we compared IBDsegments in 74 mostly Caucasian CRC patients (mean age of66 years) to two control data sets: (a) 146 Caucasian indi-viduals (mean age of 80 years) who participated in an age-related macular degeneration (AMD) study and (b) 118cancer-free Caucasian individuals from the FraminghamHeart Study (mean age of 67 years). Our results show thatthe percentage of CRC patients with IBD segments (z4 Mblength and 50 SNPs probed) in the genome is at least twiceas high as the AMD or Framingham control groups. Also,the average length of these IBD regions in the CRC patients ismore than twice the length of the two control data sets.Compared with control groups, IBD segments are found to bemore common among individuals of Jewish background. Webelieve that these IBD segments within CRC patients are likelyto harbor important CRC-related genes with low-penetranceSNPs and/or mutations, and, indeed, two recently identifiedCRC predisposition SNPs in the 8q24 region were confirmed tobe homozygous in one particular patient carrying an IBDsegment covering the region. [Cancer Res 2008;68(8):2610–21]
Introduction
Colorectal cancer (CRC) is one of the four most prevalentcancers in the United States. In 2007, there will be 153,760 newcases of CRC in the United States, resulting in 52,180 deaths (1).According to a recent worldwide statistical compilation, over a
million people suffered from the disease in 2002, with the majorityof cases in industrialized countries (2). Genetics aside, theincidence of CRC correlates with diets rich in fat and calories,and low in vegetables, fruits, and fibers as well as alcoholconsumption and smoking (3). Traditionally, CRC cases are dividedinto two categories: sporadic and familial (or hereditary; ref. 4).Approximately 70% of the cases are classified as sporadic, afflictingpeople with apparently no family history of the disease. Of thefamilial cases, the two most commonly occurring are familialadenomatous polyposis (FAP) and hereditary nonpolyposis CRC(HNPCC). FAP, characterized by formation of polyps within thegastrointestinal tracts of affected individuals, is caused by highlypenetrant, autosomal dominant germ line mutations in theadenomatous polyposis coli (APC) gene, and can account forf1% of all CRCs (5). HNPCC (Lynch syndrome) cases, seen in asmany as 2.5% of all CRCs, are caused by highly penetrant mutationsin DNA mismatch repair genes (primarily MLH1 and MSH2 ; ref. 6).Much less common genetically linked CRCs are those arising fromhamartomatous polyp syndromes such as juvenile polyposis, Peutz-Jeghers, and Cowden’s, which are caused by mutations in SMAD4(7), STK11 (8), and PTEN (9), respectively. However, the exactgenetic causes of a great percentage of familial CRCs remainundiscovered and likely due to low penetrating alleles. Moreover,the distinction between spontaneous and familial CRCs may beunderstated. Some cancers classified as sporadic cases may in facthave underlying genetic components (4, 10). Several statisticalanalyses of huge cancer databases have attempted to quantify theheritable components of cancers. The cohort studies from Sweden(11) and Utah (12) showed that the CRC family risk ratios, which isa direct measure of heritability (13), are 4.41 (considered high) and2.54 (considered moderate), respectively. In addition, the Scandi-navian twin study (involving a little less than 45,000 pairs of twins)showed that hereditary factors affect colon cancer 35% of the time(14). Therefore, a significant proportion of heritable CRC remainsunaccounted for.Our research group aims to characterize CRCs using a variety of
molecular techniques, including expression profiling (15, 16),methylation profiling (17), mutational scanning (18, 19), and singlenucleotide polymorphism (SNP) array-based chromosomal analysis(15). The latter technique (Affymetrix Human Mapping array)readily reveals cancer tissue chromosomal aberrations such asamplifications and loss of heterozygosity (LOH). Indeed, we initiallyset out to identify regions of varying amplification and todetermine if any correlation existed between these chromosomal
Note: Supplementary data for this article are available at Cancer Research Online(http://cancerres.aacrjournals.org/).
Requests for reprints: Francis Barany, Department of Microbiology andImmunology, Cornell University Weill Medical College, New York, NY 10021. Phone: 212-746-6509; Fax: 212-746-7983; E-mail: [email protected].
I2008 American Association for Cancer Research.doi:10.1158/0008-5472.CAN-07-5250
Cancer Res 2008; 68: (8). April 15, 2008 2610 www.aacrjournals.org
Research Article
Published Online First on March 28, 2008 as 10.1158/0008-5472.CAN-07-5250
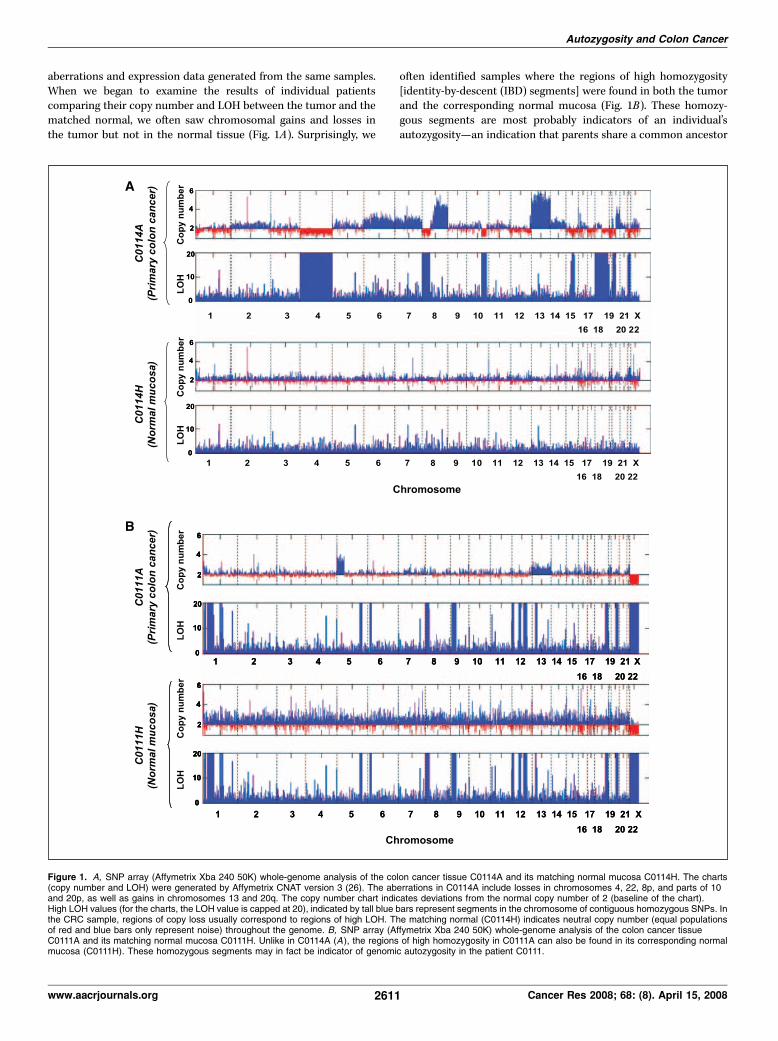
aberrations and expression data generated from the same samples.When we began to examine the results of individual patientscomparing their copy number and LOH between the tumor and thematched normal, we often saw chromosomal gains and losses inthe tumor but not in the normal tissue (Fig. 1A). Surprisingly, we
often identified samples where the regions of high homozygosity[identity-by-descent (IBD) segments] were found in both the tumorand the corresponding normal mucosa (Fig. 1B). These homozy-gous segments are most probably indicators of an individual’sautozygosity—an indication that parents share a common ancestor
Figure 1. A, SNP array (Affymetrix Xba 240 50K) whole-genome analysis of the colon cancer tissue C0114A and its matching normal mucosa C0114H. The charts(copy number and LOH) were generated by Affymetrix CNAT version 3 (26). The aberrations in C0114A include losses in chromosomes 4, 22, 8p, and parts of 10and 20p, as well as gains in chromosomes 13 and 20q. The copy number chart indicates deviations from the normal copy number of 2 (baseline of the chart).High LOH values (for the charts, the LOH value is capped at 20), indicated by tall blue bars represent segments in the chromosome of contiguous homozygous SNPs. Inthe CRC sample, regions of copy loss usually correspond to regions of high LOH. The matching normal (C0114H) indicates neutral copy number (equal populationsof red and blue bars only represent noise) throughout the genome. B, SNP array (Affymetrix Xba 240 50K) whole-genome analysis of the colon cancer tissueC0111A and its matching normal mucosa C0111H. Unlike in C0114A (A ), the regions of high homozygosity in C0111A can also be found in its corresponding normalmucosa (C0111H). These homozygous segments may in fact be indicator of genomic autozygosity in the patient C0111.
Autozygosity and Colon Cancer
www.aacrjournals.org 2611 Cancer Res 2008; 68: (8). April 15, 2008
(20). The question was then raised whether these signatures ofautozygosity occur more frequently among CRC patients. Severalstudies have shown that cancer occurs more frequently amonggroups with higher degrees of consanguinity, that is, groups thatshare a common ancestor. Among these studies is the comparisonof incidence of cancer and other late-onset complex diseasesbetween individuals from genetically isolated islands in middleDalmatia, Croatia, and a control population (21). The investigatorsconcluded that inbreeding can be a positive predictor for a numberof late-onset diseases such as heart disease, stroke, and cancer. Thesame observations were noted in a Pakistani study where cancerpatients, on average, have higher coefficient of inbreeding comparedwith the general population (22). In another study involvingdescendants of an Italian immigrant group in Wisconsin, 94% ofthe subjects with reported adenocarcinomas (mostly colorectal)were products of consanguineous parentage (23). The detrimentaleffects of inbreeding have been known throughout mankind’shistory, but most studies have focused on how inbreeding causesrare Mendelian diseases. The effect of inbreeding on cancer islikely more complex than a simple Mendelian genetics, with manymore genetic components involved. Nonetheless, studying thesegenetically isolated populations may eventually lead to discovery ofother genes that contribute to cancer predisposition. It is the sameargument backed by a growing number of researchers who believethat studying the genetics of purebred dogs known to have highincidence of cancer may eventually help in the discovery of cancer-related genes in humans (24).There are a number of ways to measure an individual’s degree of
consanguinity (25). Rudan and coworkers (21) used Wright’s path
method in measuring average inbreeding coefficients for both thecase and control populations. Using short tandem repeat poly-morphisms (STRP) as markers, Broman and Weber described thepresence of homozygous segments in some individuals fromreference families genotyped by Centre d’Etude du PolymorphismeHumain (CEPH). With the advent of high-density human SNParrays (also known as genotyping arrays), the process of identifyingthe homozygous segments in the genome has become easier (26).In this study,12 we show that signatures of autozygosity correlate toCRC incidence and that these IBD regions may be the locations ofgenes that contribute to CRC heritability.
Materials and Methods
Tissue Acquisition, Sample Selection, and DNA ExtractionTissue acquisitions followed the protocols of the institutional review
boards of Memorial Sloan Kettering Cancer Center (MSKCC) and Cornell
University Weill Medical College (institutional review board nos. 0201005297
and 9807003424). Our initial objective was to study the chromosomal
aberrations (copy number changes, LOH) in CRCs using high-density SNPmapping arrays (Affymetrix). Based on the pathologist reports (MSKCC),
74 CRC samples showing z70% pure tumor cells were chosen for SNP array
analysis. Most of these samples were from Caucasian patients (average age
12 We previously reported these observations in the following scientific meetings:(a ) AACR special conference: Advances in Colon Cancer Research (posterpresentation, Cambridge, MA, November 14–17, 2007); (b) AACR Colorectal Cancer:Molecular Pathways and Therapies (poster presentation, Dana Point, CA, October19–23, 2005); and (c) Chips-to-Hits IBC Meeting (F. Barany as invited speaker; Boston,MA; September 27, 2006).
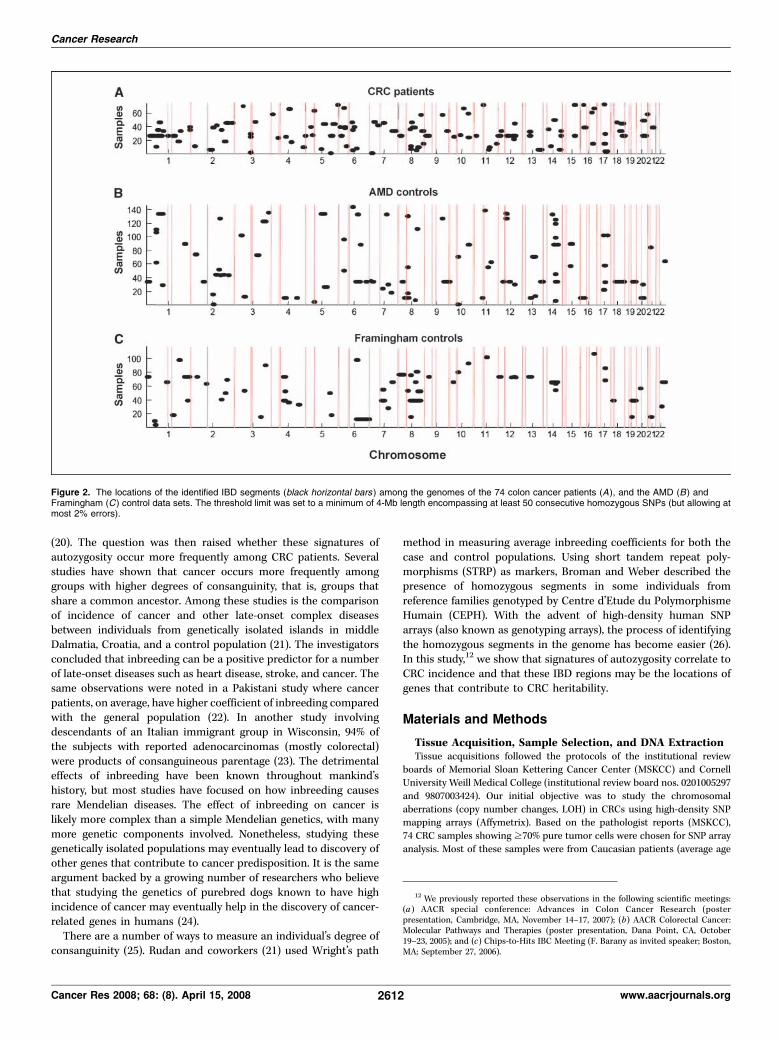
Figure 2. The locations of the identified IBD segments (black horizontal bars ) among the genomes of the 74 colon cancer patients (A), and the AMD (B) andFramingham (C) control data sets. The threshold limit was set to a minimum of 4-Mb length encompassing at least 50 consecutive homozygous SNPs (but allowing atmost 2% errors).
Cancer Research
Cancer Res 2008; 68: (8). April 15, 2008 2612 www.aacrjournals.org
of 66 F 12 years), described in detail in Supplements S-A1 and S-A2. Weinitially examined the chromosomal aberration profiles (copy number, LOH)
of these 74 tumor samples using the Affymetrix copy number analysis tool
(CNAT). The presence of long stretches of homozygous segments (with
CNAT LOH values of f20, examples of which are shown in Fig. 1B) in copyneutral regions in the genomes of these samples prompted us to examine
the chromosomal profiles of the normal tissues matching these tumors as
well. Evidently, 22 of the 74 CRC samples did not exhibit these long stretches
of homozygosity. For cost-reducing purposes, it was decided not to run thematching normal tissues for these 22 samples. Therefore, the IBD segment
analysis of the 74 patients would come from Affymetrix SNP array data from
(a) the 22 low LOH CRC tissues and (b) normal tissues (normal mucosa,
normal lung, or normal liver) of the remaining 52 patients. The inclusion ofdata from those 22 CRC samples is explained in Supplements S-B2 and
S-C2. All genomic DNAs were extracted from snap-frozen tissues that had
been prepared and stored at MSKCC as described in previous studies(17, 19).
SNP Array ProcedureThe procedure for the Affymetrix GeneChip Human Mapping 50K SNP
array was carried out according to the manufacturer’s guidelines. Briefly,0.25 Ag of genomic DNA was digested with XbaI. The digests were then
ligated to oligonucleotide adapters, PCR-amplified (such that the amplicons
were in the range of 250–2,000 bp), fragmented, biotin-labeled, and
hybridized to the array for 16 h. Following hybridization, the array chipswere washed and then stained with streptavidin-phycoerythrin and a
biotinylated anti-streptavidin antibody in the Affymetrix Fluidics Station
450. The arrays were scanned in GeneChip Scanner 3000 to generate theimage (DAT) and cell intensity (CEL) files. The CEL files were imported to
GeneChip Genotyping Analysis Software 4.0 (GTYPE 4.0, Affymetrix) to
generate the SNP calls using the dynamic model mapping algorithm (27).
It should be noted that the analyses of the current study were undertakenbefore the release of GTYPE 4.1 and its new Bayesian robust linear model
with Mahalanobis distance classifier algorithm.
Use of Other Control Data SetsTo determine the frequency of IBD on the general population, we used
the following controls: (a) The age-related macular degeneration (AMD)
data set representing the 146 non-Hispanic Caucasian individuals who
participated in AMD study (28). These include the 96 cases (mean age 79 F5.2 years old) and the 50 controls (mean age 82 F 2.2 years old). (b) TheFramingham data set: 118 Caucasian individuals who are a subset of the
National Heart, Lung, and Blood Institute Framingham Heart Study (ages
61–81 years; ref. 29). Clinical data indicate that the individuals in theFramingham data set had no known cancer at the time they participated in
the study. Other control data sets used were SNP array data from (a) 30
Ashkenazi Jewish group afflicted with breast cancer (AJBC), (b) 133
Ashkenazi Jewish group with no incidence of cancer (AJNC), and (c) thesubgroup of 48 Caucasian individuals in the Affymetrix reference data set.
The last control group did not have any available clinical information.
Detailed analyses of the Ashkenazi Jewish data sets are to be described
elsewhere.13 We also examined the possibility of population stratificationbetween our CRC cohort and either the AMD and Framingham data set
using the EIGENSTRAT method (30).
Identifying the IBD SegmentsMethod 1: homozygosity detection. In the Affymetrix CNAT program,
the fraction of homozygous SNPs (AA or BB) among all the Affymetrix
reference samples at a given base position is the same as the probability the
same SNP will be homozygous in the sample in question (26). With thispremise, the measure of LOH in the CNAT program is specifically defined as
‘‘�log of the probability that contiguous SNPs from m to n are all
homozygous.’’ One of the shortcomings of this algorithm is its high
sensitivity to erroneous calls. We therefore used an alternative way tomeasure homozygosity. Our algorithm looks for regions of autozygosity by
searching for consecutive homozygous SNPs in the region, taking into
account a 2% error (where at most 2% of SNP calls within the region are
heterozygous). We also set the minimum length of the autozygous regionsto be 4 Mb in length, with at least 50 probed SNPs (see Supplement S-D1
for further explanation). These values were chosen to provide adequate
coverage of the genome (f75%) while also allowing for a low false
discovery rate. When shorter regions are considered, they cannot beuniformly detected across the genome due to the SNP density of the chip
used. This method is applied to both the CRC and control data sets. A
filter is then applied to eliminate regions in the CRC patients’ genomes,
which are completely covered in the controls (i.e., the start of the controlregion is at or before the start of the patient’s region and the end of the
control region is at or after the end of the control region). This filter
allows the isolation of regions that are unique or more frequent in theCRC patients compared with the controls. A second filter is applied to
look for a given degree of overlap among the CRC regions (e.g., 2, 3, 4, etc.,
samples). This whole procedure will be discussed in detail in a companion
article.14
Method 2: logarithm of the odds calculation. Another statistical
method we used in identifying the IBD segments is an extension of the
Broman and Weber approach (20), in which the autozygosity logarithm of
the odds (LOD, base 10) score for a 5-Mb segment (ranging from SNPposition j to SNP position k) in the genome was calculated. As defined in
that article,
LODðj; kÞ ¼Xk
i¼j
logR;
R ¼ ½P ðgijautozygous at iÞ=P ðgijnot autozygous at iÞ� ðAÞ
P (gi | autozygous at i) refers to the probability of the observed genotype g
at the ith position in the genome, given that the ith position is autozygous,
whereas P (gi | not autozygous at i) refers to the probability of the observed
genotype g at the ith position in the genome, given that the ith position isnot autozygous. If the SNP call (genotype) at position i is AA or BB, then
R = (1 � e) / PA + e , or (1 � e) / PB + e , respectively (20). On the other hand,
if the genotype is AB, then R = e , where e denotes the combined rate of
genotyping error and mutations (maximum of 2%). PA and PB are thefrequencies of alleles A and B, respectively, in the study group (i.e., CRC or
control population separately). Described in detail in a separate manu-
script,15 the algorithm used a sliding window method (5 Mb from one endof a chromosome to the other with 0.5 Mb step size) to form segments
along the genome.
Verification of SNPs by Direct DNA SequencingTumors containing IBD segments covering SNPs that are recently
associated with colon cancer and Crohn’s disease were subjected to
dideoxy-sequencing to genotype the associated SNP and to verify
homozygosity at that region. DNA sequencing was performed using the
Applied Biosystems Automated 3730 DNA Analyzer, along with Big DyeTerminator chemistry and AmpliTaq-FS DNA Polymerase (Applied Bio-
systems). Universal primers ( forward: 5¶-CGTCACGACACGAAAAC-3¶ andreverse: 5¶-CGTCACGACACGAAACA-3¶) were used for the sequencing
and the following DNA-specific primers were used to amplify theDNA segment covering the SNP in question: rs9469220 ( forward:
5¶-CAGAGTCACTTGTCTCTGGCAGTCCAAGCTACTA-3¶, reverse: 5¶-AATAAGTCAGCCACTGCACCTGGA-3¶), rs17234657 ( forward: 5¶-AGTGCT-GAAGCGGAATTGAGCTCC-3¶, reverse: 5¶-AGGGACACAAGGGATTT-GACTGTG-3¶), rs11805303 ( forward: 5¶-AGTAGTGCCTTTCACCACCC-ATCA-3¶, reverse: 5¶-ACGTTGTTCCCAGGTGCTGTTATC-3¶), rs10883365
13 A. Olshen, et al. Analysis of genetic variation in Ashkenazi Jews by high densitySNP genotyping, submitted for publication.
14 G. Schemmann, et al., in preparation.15 S. Wang, et al. Genome-wide autozygosity mapping in human populations,
submitted for publication.
Autozygosity and Colon Cancer
www.aacrjournals.org 2613 Cancer Res 2008; 68: (8). April 15, 2008
( forward: 5¶-TGCTGTTCCCTGGCTGATTCTGA-3¶, reverse: 5¶-ACGTTG-TTCCCAGGTGCTGTTATC-3¶), rs10505477 ( forward: 5¶-GTGGTGAAC-TTTGCAGTGGTCCAA-3¶, reverse: 5¶-GACTCCTTGTTCCTCCACTTCTGC-CAAA-3¶).
The PCR reaction (25 AL) contained 20 mmol/L Tricine (pH 8.7),
16 mmol/L (NH4)2SO4, 2.5 mmol/L MgCl2, 0.2 mmol/L deoxynucleotide
triphosphate, 0.2 Amol/L of each gene-specific primer, 2.5 units of
AmpliTaq Gold DNA polymerase, and 100 ng of genomic DNA.
Thermocycling conditions were as follows: 95jC for 10 min to activate
AmpliTaq Gold polymerase; followed by 25 cycles of 94jC for 30 s, 60jCfor 1 min, 72jC for 1 min; followed by a final extension step at 72jC for
30 min.
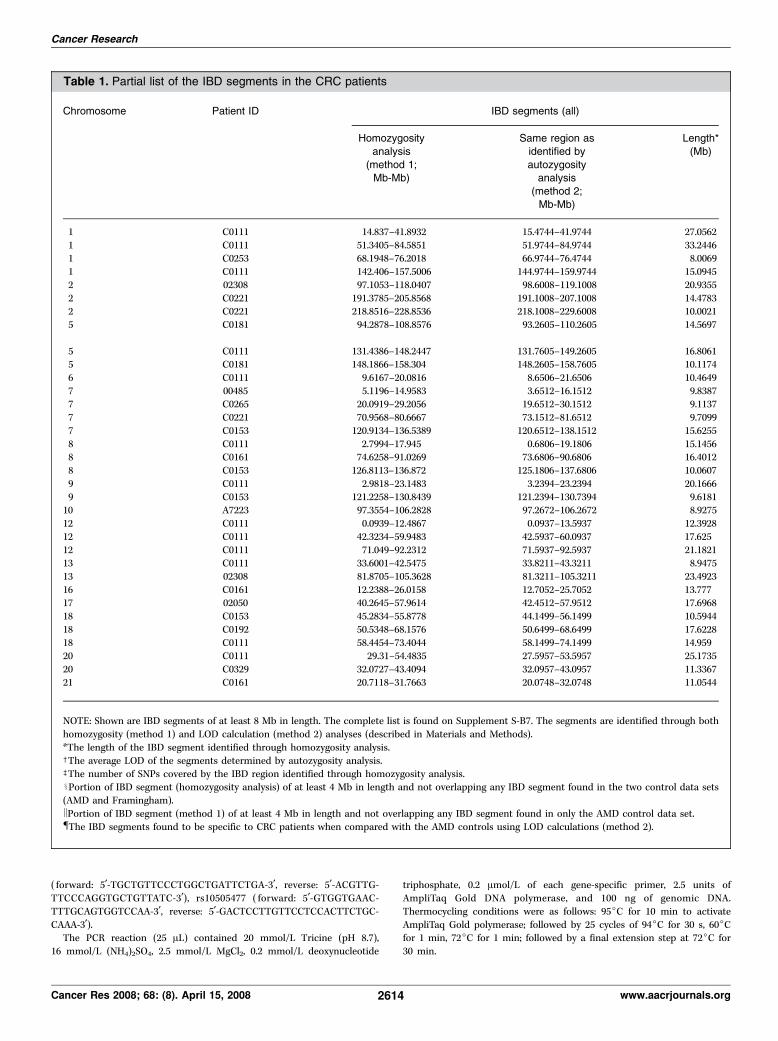
Table 1. Partial list of the IBD segments in the CRC patients
Chromosome Patient ID IBD segments (all)
Homozygosity
analysis
(method 1;Mb-Mb)
Same region as
identified by
autozygosityanalysis
(method 2;
Mb-Mb)
Length*
(Mb)
1 C0111 14.837–41.8932 15.4744–41.9744 27.0562
1 C0111 51.3405–84.5851 51.9744–84.9744 33.24461 C0253 68.1948–76.2018 66.9744–76.4744 8.0069
1 C0111 142.406–157.5006 144.9744–159.9744 15.0945
2 02308 97.1053–118.0407 98.6008–119.1008 20.9355
2 C0221 191.3785–205.8568 191.1008–207.1008 14.47832 C0221 218.8516–228.8536 218.1008–229.6008 10.0021
5 C0181 94.2878–108.8576 93.2605–110.2605 14.5697
5 C0111 131.4386–148.2447 131.7605–149.2605 16.80615 C0181 148.1866–158.304 148.2605–158.7605 10.1174
6 C0111 9.6167–20.0816 8.6506–21.6506 10.4649
7 00485 5.1196–14.9583 3.6512–16.1512 9.83877 C0265 20.0919–29.2056 19.6512–30.1512 9.1137
7 C0221 70.9568–80.6667 73.1512–81.6512 9.7099
7 C0153 120.9134–136.5389 120.6512–138.1512 15.6255
8 C0111 2.7994–17.945 0.6806–19.1806 15.14568 C0161 74.6258–91.0269 73.6806–90.6806 16.4012
8 C0153 126.8113–136.872 125.1806–137.6806 10.0607
9 C0111 2.9818–23.1483 3.2394–23.2394 20.1666
9 C0153 121.2258–130.8439 121.2394–130.7394 9.618110 A7223 97.3554–106.2828 97.2672–106.2672 8.9275
12 C0111 0.0939–12.4867 0.0937–13.5937 12.3928
12 C0111 42.3234–59.9483 42.5937–60.0937 17.625
12 C0111 71.049–92.2312 71.5937–92.5937 21.182113 C0111 33.6001–42.5475 33.8211–43.3211 8.9475
13 02308 81.8705–105.3628 81.3211–105.3211 23.4923
16 C0161 12.2388–26.0158 12.7052–25.7052 13.77717 02050 40.2645–57.9614 42.4512–57.9512 17.6968
18 C0153 45.2834–55.8778 44.1499–56.1499 10.5944
18 C0192 50.5348–68.1576 50.6499–68.6499 17.6228
18 C0111 58.4454–73.4044 58.1499–74.1499 14.95920 C0111 29.31–54.4835 27.5957–53.5957 25.1735
20 C0329 32.0727–43.4094 32.0957–43.0957 11.3367
21 C0161 20.7118–31.7663 20.0748–32.0748 11.0544
NOTE: Shown are IBD segments of at least 8 Mb in length. The complete list is found on Supplement S-B7. The segments are identified through both
homozygosity (method 1) and LOD calculation (method 2) analyses (described in Materials and Methods).
*The length of the IBD segment identified through homozygosity analysis.cThe average LOD of the segments determined by autozygosity analysis.bThe number of SNPs covered by the IBD region identified through homozygosity analysis.xPortion of IBD segment (homozygosity analysis) of at least 4 Mb in length and not overlapping any IBD segment found in the two control data sets
(AMD and Framingham).kPortion of IBD segment (method 1) of at least 4 Mb in length and not overlapping any IBD segment found in only the AMD control data set.{The IBD segments found to be specific to CRC patients when compared with the AMD controls using LOD calculations (method 2).
Cancer Research
Cancer Res 2008; 68: (8). April 15, 2008 2614 www.aacrjournals.org
Results
IBD segments as extended runs of homozygous SNPs. Thefirst approach to score regions of autozygosity (method 1) was toisolate the long stretches of homozygosity in the genomic DNAstaken from mostly noncancerous tissues (explained in Materialsand Methods). We set the threshold limit to a minimum of 4-Mblength encompassing at least 50 consecutive homozygous SNPs,but allowing at most 2% heterozygous SNPs. These identified IBDregions (on chromosomes 1 to 22) are indicated as bars in Fig. 2(A , CRC patients; B , AMD controls; C , Framingham controls). Apartial list (at least 8 Mb in length) of these IBD segments areshown in Table 1. The longest IBD segment is the chromosome 1region from 51.3405 to 84.5851 Mb found in patient C0111, who hasa total of 271.6 Mb of homozygous segments distributed in 19 IBDsegments (see Supplements S-B3, S-B4, and S-B5) for the total IBD
segment lengths of every CRC patient, as well as all the AMD, andFramingham control individuals. As shown in Table 1, the sameIBD regions in chromosome 1 of patient C0111 is also identified bythe autozygosity (method 2) analysis, having an average LOD scoreof 23.5. Within this segment is a region (51.34045–63.01534 Mb) notoverlapping with any of the IBD regions in both control data sets.In all, the homozygosity analysis identified a total of 117 IBDsegments of at least 4 Mb in length (Supplement S-B7). In anotherapproach (Method 2), a LOD score was calculated to compare thestrength of autozygosity versus nonautozygosity for a definedgenomic region. This calculation was able to identify the 5 Mbregions (many regions were overlapping, and further inspectionidentified these autozygous regions as contiguous) in the CRCpatients’ genome with LOD values of at least 5 (see SupplementS-B8). Of the 34 IBD segments identified by homozygosity analysis
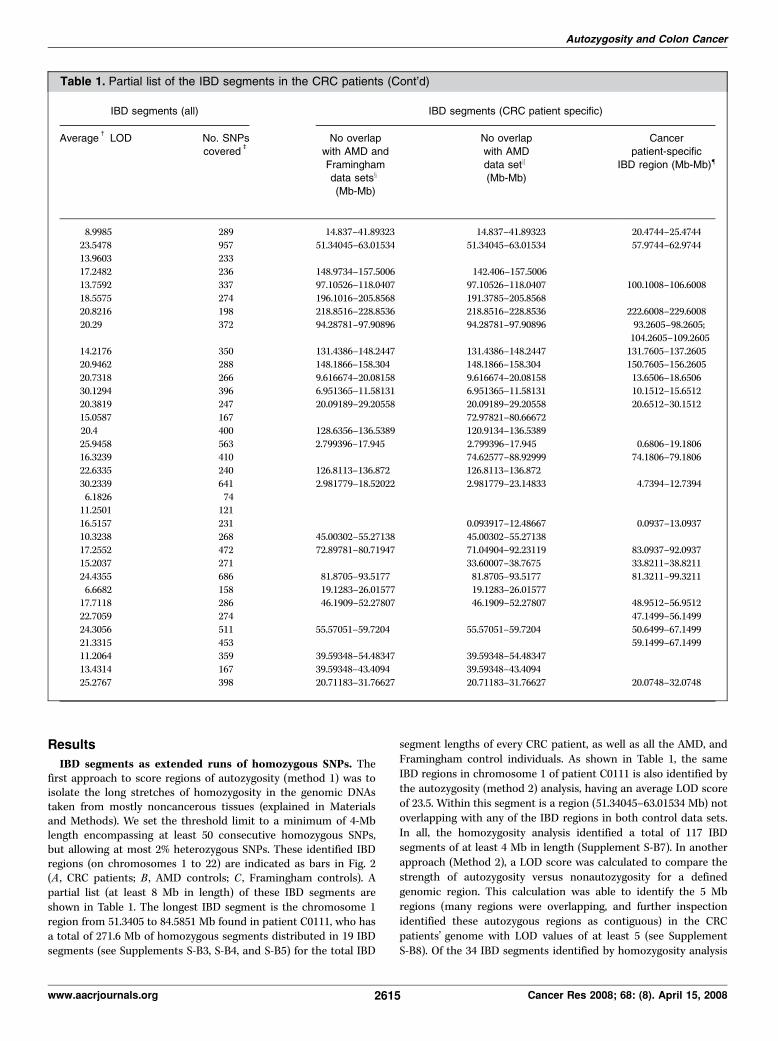
Table 1. Partial list of the IBD segments in the CRC patients (Cont’d)
IBD segments (all) IBD segments (CRC patient specific)
Averagec
LOD No. SNPs
coveredb
No overlap
with AMD and
Framinghamdata setsx
(Mb-Mb)
No overlap
with AMD
data setk
(Mb-Mb)
Cancer
patient-specific
IBD region (Mb-Mb){
8.9985 289 14.837–41.89323 14.837–41.89323 20.4744–25.4744
23.5478 957 51.34045–63.01534 51.34045–63.01534 57.9744–62.974413.9603 233
17.2482 236 148.9734–157.5006 142.406–157.5006
13.7592 337 97.10526–118.0407 97.10526–118.0407 100.1008–106.6008
18.5575 274 196.1016–205.8568 191.3785–205.856820.8216 198 218.8516–228.8536 218.8516–228.8536 222.6008–229.6008
20.29 372 94.28781–97.90896 94.28781–97.90896 93.2605–98.2605;
104.2605–109.2605
14.2176 350 131.4386–148.2447 131.4386–148.2447 131.7605–137.260520.9462 288 148.1866–158.304 148.1866–158.304 150.7605–156.2605
20.7318 266 9.616674–20.08158 9.616674–20.08158 13.6506–18.6506
30.1294 396 6.951365–11.58131 6.951365–11.58131 10.1512–15.651220.3819 247 20.09189–29.20558 20.09189–29.20558 20.6512–30.1512
15.0587 167 72.97821–80.66672
20.4 400 128.6356–136.5389 120.9134–136.5389
25.9458 563 2.799396–17.945 2.799396–17.945 0.6806–19.180616.3239 410 74.62577–88.92999 74.1806–79.1806
22.6335 240 126.8113–136.872 126.8113–136.872
30.2339 641 2.981779–18.52022 2.981779–23.14833 4.7394–12.7394
6.1826 7411.2501 121
16.5157 231 0.093917–12.48667 0.0937–13.0937
10.3238 268 45.00302–55.27138 45.00302–55.27138
17.2552 472 72.89781–80.71947 71.04904–92.23119 83.0937–92.093715.2037 271 33.60007–38.7675 33.8211–38.8211
24.4355 686 81.8705–93.5177 81.8705–93.5177 81.3211–99.3211
6.6682 158 19.1283–26.01577 19.1283–26.0157717.7118 286 46.1909–52.27807 46.1909–52.27807 48.9512–56.9512
22.7059 274 47.1499–56.1499
24.3056 511 55.57051–59.7204 55.57051–59.7204 50.6499–67.1499
21.3315 453 59.1499–67.149911.2064 359 39.59348–54.48347 39.59348–54.48347
13.4314 167 39.59348–43.4094 39.59348–43.4094
25.2767 398 20.71183–31.76627 20.71183–31.76627 20.0748–32.0748
Autozygosity and Colon Cancer
www.aacrjournals.org 2615 Cancer Res 2008; 68: (8). April 15, 2008
(method 1) to be at least 8 Mb in length, all 34 (100%) segmentswere also identified by autozygosity analysis (method 2; Table 1).For the 56 segments of at least 6 Mb in length identified by method1, 53 (95%) were also identified by method 2. The concordance wasdown to 80% (94 of 117) if all the method 1–identified IBD regionsare considered. Copy number/LOH analysis (Supplements S-B1 andS-B11) showed that IBD segments can easily be distinguished fromactual LOH and uniparental disomy (UPD) regions, with the lattertwo occurring frequently in tumor samples but not in the matchingnormals. Only 17 of the 117 identified IBD segments were from the22 CRC samples and all of these were shorter than 6 Mb. InSupplements S-B2 and S-C2, we present a clear explanation tojustify the use of the data from these 22 CRC samples.Higher percentage of IBD regions in CRC patients compared
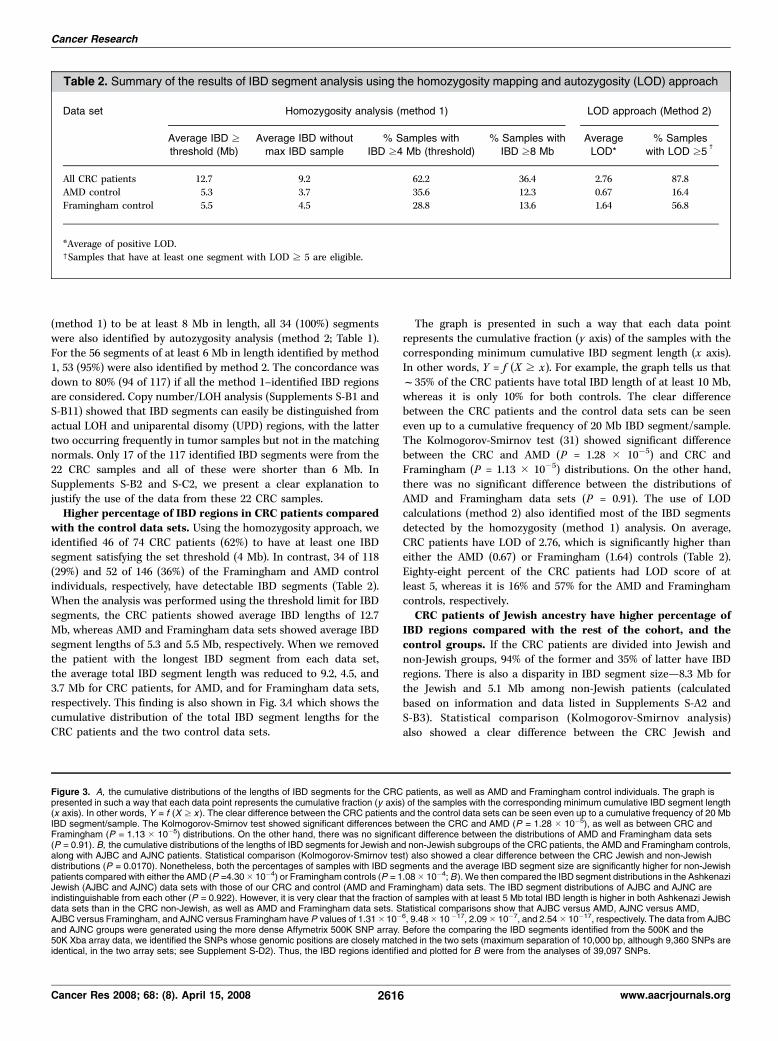
with the control data sets. Using the homozygosity approach, weidentified 46 of 74 CRC patients (62%) to have at least one IBDsegment satisfying the set threshold (4 Mb). In contrast, 34 of 118(29%) and 52 of 146 (36%) of the Framingham and AMD controlindividuals, respectively, have detectable IBD segments (Table 2).When the analysis was performed using the threshold limit for IBDsegments, the CRC patients showed average IBD lengths of 12.7Mb, whereas AMD and Framingham data sets showed average IBDsegment lengths of 5.3 and 5.5 Mb, respectively. When we removedthe patient with the longest IBD segment from each data set,the average total IBD segment length was reduced to 9.2, 4.5, and3.7 Mb for CRC patients, for AMD, and for Framingham data sets,respectively. This finding is also shown in Fig. 3A which shows thecumulative distribution of the total IBD segment lengths for theCRC patients and the two control data sets.
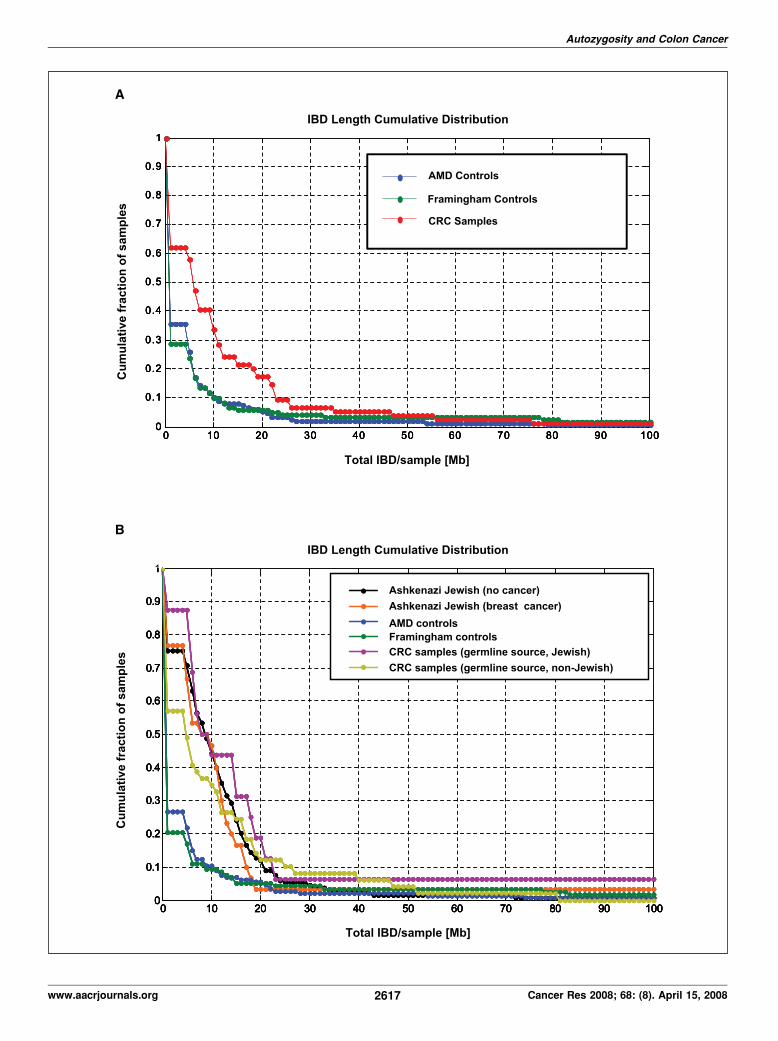
The graph is presented in such a way that each data pointrepresents the cumulative fraction (y axis) of the samples with thecorresponding minimum cumulative IBD segment length (x axis).In other words, Y = f (X z x). For example, the graph tells us thatf35% of the CRC patients have total IBD length of at least 10 Mb,whereas it is only 10% for both controls. The clear differencebetween the CRC patients and the control data sets can be seeneven up to a cumulative frequency of 20 Mb IBD segment/sample.The Kolmogorov-Smirnov test (31) showed significant differencebetween the CRC and AMD (P = 1.28 � 10�5) and CRC andFramingham (P = 1.13 � 10�5) distributions. On the other hand,there was no significant difference between the distributions ofAMD and Framingham data sets (P = 0.91). The use of LODcalculations (method 2) also identified most of the IBD segmentsdetected by the homozygosity (method 1) analysis. On average,CRC patients have LOD of 2.76, which is significantly higher thaneither the AMD (0.67) or Framingham (1.64) controls (Table 2).Eighty-eight percent of the CRC patients had LOD score of atleast 5, whereas it is 16% and 57% for the AMD and Framinghamcontrols, respectively.CRC patients of Jewish ancestry have higher percentage of
IBD regions compared with the rest of the cohort, and thecontrol groups. If the CRC patients are divided into Jewish andnon-Jewish groups, 94% of the former and 35% of latter have IBDregions. There is also a disparity in IBD segment size—8.3 Mb forthe Jewish and 5.1 Mb among non-Jewish patients (calculatedbased on information and data listed in Supplements S-A2 andS-B3). Statistical comparison (Kolmogorov-Smirnov analysis)also showed a clear difference between the CRC Jewish and
Table 2. Summary of the results of IBD segment analysis using the homozygosity mapping and autozygosity (LOD) approach
Data set Homozygosity analysis (method 1) LOD approach (Method 2)
Average IBD zthreshold (Mb)
Average IBD without
max IBD sample
% Samples with
IBD z4 Mb (threshold)
% Samples with
IBD z8 Mb
Average
LOD*
% Samples
with LOD z5c
All CRC patients 12.7 9.2 62.2 36.4 2.76 87.8
AMD control 5.3 3.7 35.6 12.3 0.67 16.4
Framingham control 5.5 4.5 28.8 13.6 1.64 56.8
*Average of positive LOD.cSamples that have at least one segment with LOD z 5 are eligible.
Figure 3. A, the cumulative distributions of the lengths of IBD segments for the CRC patients, as well as AMD and Framingham control individuals. The graph ispresented in such a way that each data point represents the cumulative fraction (y axis) of the samples with the corresponding minimum cumulative IBD segment length(x axis). In other words, Y = f (X z x ). The clear difference between the CRC patients and the control data sets can be seen even up to a cumulative frequency of 20 MbIBD segment/sample. The Kolmogorov-Smirnov test showed significant differences between the CRC and AMD (P = 1.28 � 10�5), as well as between CRC andFramingham (P = 1.13 � 10�5) distributions. On the other hand, there was no significant difference between the distributions of AMD and Framingham data sets(P = 0.91). B, the cumulative distributions of the lengths of IBD segments for Jewish and non-Jewish subgroups of the CRC patients, the AMD and Framingham controls,along with AJBC and AJNC patients. Statistical comparison (Kolmogorov-Smirnov test) also showed a clear difference between the CRC Jewish and non-Jewishdistributions (P = 0.0170). Nonetheless, both the percentages of samples with IBD segments and the average IBD segment size are significantly higher for non-Jewishpatients compared with either the AMD (P =4.30� 10�4) or Framingham controls (P = 1.08� 10�4;B ). We then compared the IBD segment distributions in the AshkenaziJewish (AJBC and AJNC) data sets with those of our CRC and control (AMD and Framingham) data sets. The IBD segment distributions of AJBC and AJNC areindistinguishable from each other (P = 0.922). However, it is very clear that the fraction of samples with at least 5 Mb total IBD length is higher in both Ashkenazi Jewishdata sets than in the CRC non-Jewish, as well as AMD and Framingham data sets. Statistical comparisons show that AJBC versus AMD, AJNC versus AMD,AJBC versus Framingham, and AJNC versus Framingham have P values of 1.31�10�6, 9.48� 10 �17, 2.09� 10�7, and 2.54� 10�17, respectively. The data from AJBCand AJNC groups were generated using the more dense Affymetrix 500K SNP array. Before the comparing the IBD segments identified from the 500K and the50K Xba array data, we identified the SNPs whose genomic positions are closely matched in the two sets (maximum separation of 10,000 bp, although 9,360 SNPs areidentical, in the two array sets; see Supplement S-D2). Thus, the IBD regions identified and plotted for B were from the analyses of 39,097 SNPs.
Cancer Research
Cancer Res 2008; 68: (8). April 15, 2008 2616 www.aacrjournals.org
Autozygosity and Colon Cancer
www.aacrjournals.org 2617 Cancer Res 2008; 68: (8). April 15, 2008
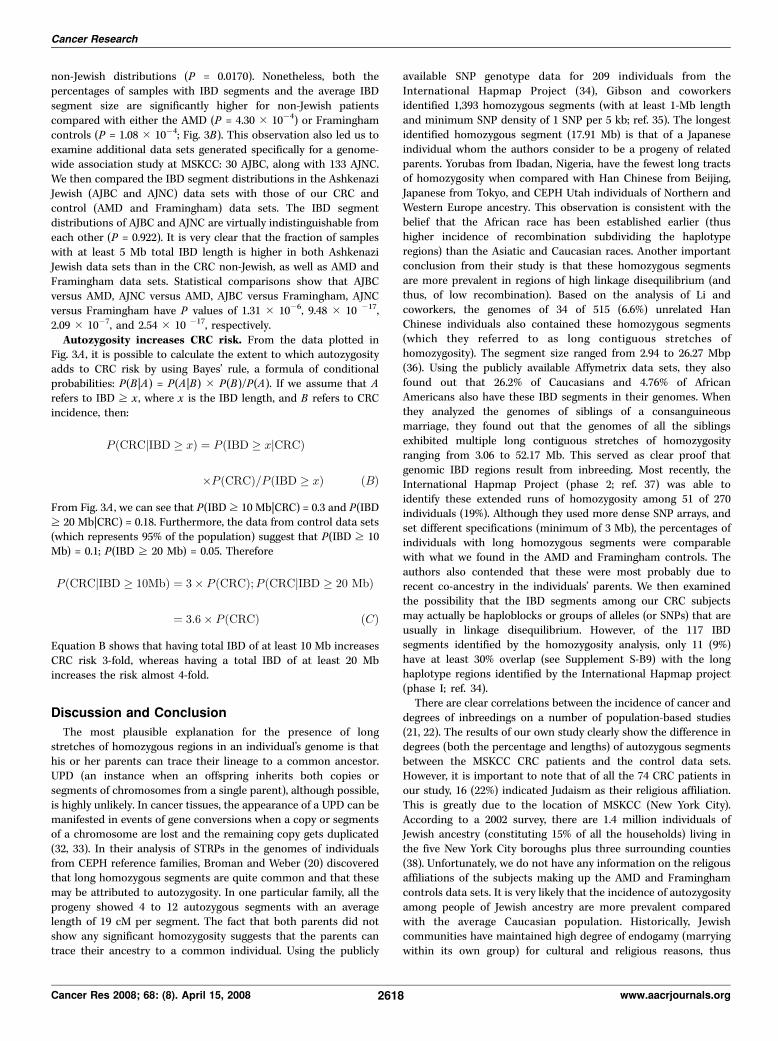
non-Jewish distributions (P = 0.0170). Nonetheless, both thepercentages of samples with IBD segments and the average IBDsegment size are significantly higher for non-Jewish patientscompared with either the AMD (P = 4.30 � 10�4) or Framinghamcontrols (P = 1.08 � 10�4; Fig. 3B). This observation also led us toexamine additional data sets generated specifically for a genome-wide association study at MSKCC: 30 AJBC, along with 133 AJNC.We then compared the IBD segment distributions in the AshkenaziJewish (AJBC and AJNC) data sets with those of our CRC andcontrol (AMD and Framingham) data sets. The IBD segmentdistributions of AJBC and AJNC are virtually indistinguishable fromeach other (P = 0.922). It is very clear that the fraction of sampleswith at least 5 Mb total IBD length is higher in both AshkenaziJewish data sets than in the CRC non-Jewish, as well as AMD andFramingham data sets. Statistical comparisons show that AJBCversus AMD, AJNC versus AMD, AJBC versus Framingham, AJNCversus Framingham have P values of 1.31 � 10�6, 9.48 � 10 �17,2.09 � 10�7, and 2.54 � 10 �17, respectively.Autozygosity increases CRC risk. From the data plotted in
Fig. 3A , it is possible to calculate the extent to which autozygosityadds to CRC risk by using Bayes’ rule, a formula of conditionalprobabilities: P(B |A) = P(A|B) � P(B)/P(A). If we assume that Arefers to IBD z x , where x is the IBD length, and B refers to CRCincidence, then:
P ðCRCjIBD � xÞ ¼ P ðIBD � xjCRCÞ
�P ðCRCÞ=P ðIBD � xÞ ðBÞ
From Fig. 3A , we can see that P(IBD z 10 Mb|CRC) = 0.3 and P(IBDz 20 Mb|CRC) = 0.18. Furthermore, the data from control data sets(which represents 95% of the population) suggest that P(IBD z 10Mb) = 0.1; P(IBD z 20 Mb) = 0.05. Therefore
P ðCRCjIBD � 10MbÞ ¼ 3� P ðCRCÞ;P ðCRCjIBD � 20 MbÞ
¼ 3:6� P ðCRCÞ ðCÞ
Equation B shows that having total IBD of at least 10 Mb increasesCRC risk 3-fold, whereas having a total IBD of at least 20 Mbincreases the risk almost 4-fold.
Discussion and Conclusion
The most plausible explanation for the presence of longstretches of homozygous regions in an individual’s genome is thathis or her parents can trace their lineage to a common ancestor.UPD (an instance when an offspring inherits both copies orsegments of chromosomes from a single parent), although possible,is highly unlikely. In cancer tissues, the appearance of a UPD can bemanifested in events of gene conversions when a copy or segmentsof a chromosome are lost and the remaining copy gets duplicated(32, 33). In their analysis of STRPs in the genomes of individualsfrom CEPH reference families, Broman and Weber (20) discoveredthat long homozygous segments are quite common and that thesemay be attributed to autozygosity. In one particular family, all theprogeny showed 4 to 12 autozygous segments with an averagelength of 19 cM per segment. The fact that both parents did notshow any significant homozygosity suggests that the parents cantrace their ancestry to a common individual. Using the publicly
available SNP genotype data for 209 individuals from theInternational Hapmap Project (34), Gibson and coworkersidentified 1,393 homozygous segments (with at least 1-Mb lengthand minimum SNP density of 1 SNP per 5 kb; ref. 35). The longestidentified homozygous segment (17.91 Mb) is that of a Japaneseindividual whom the authors consider to be a progeny of relatedparents. Yorubas from Ibadan, Nigeria, have the fewest long tractsof homozygosity when compared with Han Chinese from Beijing,Japanese from Tokyo, and CEPH Utah individuals of Northern andWestern Europe ancestry. This observation is consistent with thebelief that the African race has been established earlier (thushigher incidence of recombination subdividing the haplotyperegions) than the Asiatic and Caucasian races. Another importantconclusion from their study is that these homozygous segmentsare more prevalent in regions of high linkage disequilibrium (andthus, of low recombination). Based on the analysis of Li andcoworkers, the genomes of 34 of 515 (6.6%) unrelated HanChinese individuals also contained these homozygous segments(which they referred to as long contiguous stretches ofhomozygosity). The segment size ranged from 2.94 to 26.27 Mbp(36). Using the publicly available Affymetrix data sets, they alsofound out that 26.2% of Caucasians and 4.76% of AfricanAmericans also have these IBD segments in their genomes. Whenthey analyzed the genomes of siblings of a consanguineousmarriage, they found out that the genomes of all the siblingsexhibited multiple long contiguous stretches of homozygosityranging from 3.06 to 52.17 Mb. This served as clear proof thatgenomic IBD regions result from inbreeding. Most recently, theInternational Hapmap Project (phase 2; ref. 37) was able toidentify these extended runs of homozygosity among 51 of 270individuals (19%). Although they used more dense SNP arrays, andset different specifications (minimum of 3 Mb), the percentages ofindividuals with long homozygous segments were comparablewith what we found in the AMD and Framingham controls. Theauthors also contended that these were most probably due torecent co-ancestry in the individuals’ parents. We then examinedthe possibility that the IBD segments among our CRC subjectsmay actually be haploblocks or groups of alleles (or SNPs) that areusually in linkage disequilibrium. However, of the 117 IBDsegments identified by the homozygosity analysis, only 11 (9%)have at least 30% overlap (see Supplement S-B9) with the longhaplotype regions identified by the International Hapmap project(phase I; ref. 34).There are clear correlations between the incidence of cancer and
degrees of inbreedings on a number of population-based studies(21, 22). The results of our own study clearly show the difference indegrees (both the percentage and lengths) of autozygous segmentsbetween the MSKCC CRC patients and the control data sets.However, it is important to note that of all the 74 CRC patients inour study, 16 (22%) indicated Judaism as their religious affiliation.This is greatly due to the location of MSKCC (New York City).According to a 2002 survey, there are 1.4 million individuals ofJewish ancestry (constituting 15% of all the households) living inthe five New York City boroughs plus three surrounding counties(38). Unfortunately, we do not have any information on the religousaffiliations of the subjects making up the AMD and Framinghamcontrols data sets. It is very likely that the incidence of autozygosityamong people of Jewish ancestry are more prevalent comparedwith the average Caucasian population. Historically, Jewishcommunities have maintained high degree of endogamy (marryingwithin its own group) for cultural and religious reasons, thus
Cancer Research
Cancer Res 2008; 68: (8). April 15, 2008 2618 www.aacrjournals.org
increasing the chances of autozygotic signatures in their genomes.The patient C0111 who has the most IBD segments of all theMSKCC patients is of Jewish descent. We can only speculatewhether the incidence of autozygosity is a contributing factor tothe fact that Ashkenazi Jews have the highest incidence of coloncancer of any ethnic group in the world (39). Aside from dietaryfactors, genetics can also play a major role. The APC variantI1307K, almost unique to Ashkenazi Jews, has been identified as aCRC susceptibility factor among this group (40). The results of ourprincipal components analysis (EIGENSTRAT method) did notidentify population stratification between those CRC patients ofJewish ancestry and the rest of the CRC cohort (Supplement S-C4).Whereas there is no clear genetic variation between the CRCpatients and Framingham control group, the opposite is true whencomparing the CRC patients and the AMD control group. Althoughall of the individuals in the AMD data set are Caucasians, as is themajority of our CRC patients, the results of principal componentsanalysis suggest that the Framingham data set is the moreappropriate control group. The observed difference in IBDincidence between the CRC patients and the AMD control groupmay then be partly due to population stratification. It also appearsthat there is practically no difference between the AJBC and AJNCgroup in terms of the incidence of autozygosity (both of which havemore IBD segments compared with either AMD or Framinghamdata sets). It should be noted that the AJBC individuals werechosen to be part of a genome-wide association study because oftheir family history of breast cancer. The increased predispositionto the disease for this group may have been brought by a dominantgenetic factor and that longer IBD segments may not have played amajor role in breast cancer predisposition. On the other hand,when comparing CRC Jewish and non-Jewish patients, we wereessentially comparing two groups in which family history of CRCwas much less common (Supplement S-A2). Among non-JewishCRC patients, 7 of 49 (14.3%) had at least one first-degree relative,
and 4 of 49 (8.2%) had at least one second-degree relative who alsosuffered from CRC. For the Jewish CRC patients, these numbers are2 of 16 (12.6%) and 0 of 16 (0%), respectively. Nonetheless, theseobservations are not necessarily contradictory to our hypothesisthat the cumulative effects of autozygosity may contribute to theincidence of spontaneous CRCs.Is there a simple model to explain how autozygosity increases
CRC risk at the molecular level? One approach requires us todistinguish between the high- and low-penetrance classes ofcancer-predisposing genes. The former includes the dominantlyinherited mutations in APC, MLH1 , and MSH2 . Such mutationsonly need to be heterozygous to contribute to cancer predisposi-tion (reviewed in ref. 6) and have been identified with much helpfrom classic genetic analyses. On the other hand, finding low-penetrance cancer-predisposing mutations often requires geneticassociation studies (4). A short list of genes identified to havevariants belonging to the latter category includes APC (I1307Kvariant), TGFBR1 (6 Ala variant), HRAS1 (variable number oftandem repeats variant), and MTHFR (677V variant). TGFBR1(6 Ala variant), which is classified as a tumor suppressor, is foundto be dose dependent, meaning the allele is more effective inpredisposing cancer in homozygous than in heterozygous state(41). The base excision repair gene MYH , which has been linked toan FAP-like syndrome (42), can also have variants that can betransmitted in a dose-dependent manner, albeit differently. In thecase of this gene, two mutations (Y165C and G382D) have beenidentified to be highly penetrant when in biallelic state (eitherhomozygous or compound heterozygous; reviewed in ref. 43).However, it has also been shown that monoallelic mutations ofMYH can also predispose for CRC at lower penetrance (44).Likewise, if dose-dependent, low-penetrance genes are locatedin IBD regions, the influence on cancer initiation or progres-sion would be doubled. Longer IBD segments would have ahigher probability of containing such alleles in homozygous
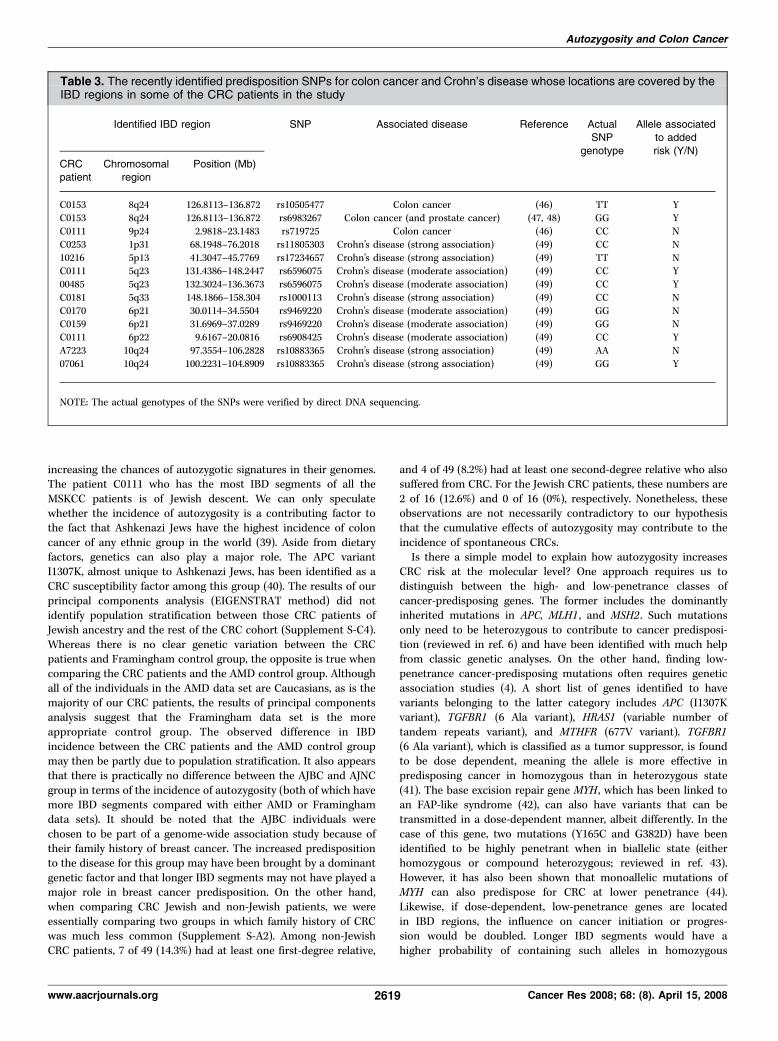
Table 3. The recently identified predisposition SNPs for colon cancer and Crohn’s disease whose locations are covered by theIBD regions in some of the CRC patients in the study
Identified IBD region SNP Associated disease Reference ActualSNP
genotype
Allele associatedto added
risk (Y/N)
CRCpatient
Chromosomalregion
Position (Mb)
C0153 8q24 126.8113–136.872 rs10505477 Colon cancer (46) TT YC0153 8q24 126.8113–136.872 rs6983267 Colon cancer (and prostate cancer) (47, 48) GG Y
C0111 9p24 2.9818–23.1483 rs719725 Colon cancer (46) CC N
C0253 1p31 68.1948–76.2018 rs11805303 Crohn’s disease (strong association) (49) CC N
10216 5p13 41.3047–45.7769 rs17234657 Crohn’s disease (strong association) (49) TT NC0111 5q23 131.4386–148.2447 rs6596075 Crohn’s disease (moderate association) (49) CC Y
00485 5q23 132.3024–136.3673 rs6596075 Crohn’s disease (moderate association) (49) CC Y
C0181 5q33 148.1866–158.304 rs1000113 Crohn’s disease (strong association) (49) CC N
C0170 6p21 30.0114–34.5504 rs9469220 Crohn’s disease (moderate association) (49) GG NC0159 6p21 31.6969–37.0289 rs9469220 Crohn’s disease (moderate association) (49) GG N
C0111 6p22 9.6167–20.0816 rs6908425 Crohn’s disease (moderate association) (49) CC Y
A7223 10q24 97.3554–106.2828 rs10883365 Crohn’s disease (strong association) (49) AA N
07061 10q24 100.2231–104.8909 rs10883365 Crohn’s disease (strong association) (49) GG Y
NOTE: The actual genotypes of the SNPs were verified by direct DNA sequencing.
Autozygosity and Colon Cancer
www.aacrjournals.org 2619 Cancer Res 2008; 68: (8). April 15, 2008
state. Moreover, longer IBD segments may also cover multiple low-penetrance, dose-dependent genes that have additive effects, whichis now believed to occur in both sporadic and familial types of CRC(4). We can only presume that functionally, such low-penetrance,dose-dependent alleles do not necessarily have to be associatedwith tumor suppressors. For instance, it is possible that a mutationin the regulatory region of a proto-oncogene may result in proteinoverexpression or the dysregulation during stress.This is an exploratory study on the possibility that autozygosity
increases the risk of cancer, and there are limitations in our study.First, there is the lack of information on the cancer status of theAMD control subjects. The average age of AMD subjects is 80 years.According to the statistics provided by National Cancer InstituteSurveillance Epidemiology and End Results, which is accessiblethrough the Web site,16 the incidence of CRC in the United States( for all races between 1975 and 2003) is 0.322%, 0.377%, and 0.416%for age groups 75 to 79, 80 to 84, and 85+, respectively (45). Thus,there is only a small chance that an AMD study participant has alsobeen afflicted with CRC. All of the subjects in the other control dataset (Framingham) did not have any cancer at the time of theirparticipation according to clinical records. Second, our cohort wasenriched for patients of Jewish ancestry, and the work would havebenefited from availability of another sizable set of controlindividuals of Jewish ancestry who had not been diagnosed ofCRC at a late age (75 years or older). Third, we chose to evaluatecopy number and alleles only among matched normal and tumorsamples, where the tumor samples had <30% stromal infiltrates.Such samples may have had more homogenous tumors, which, inturn, may have had a higher incidence of underlying genetic factors.None of the widely recognized CRC predisposing genes (APC,
MLH1, MSH2) fall within our identified IBD regions. Most recently,several laboratories have performed large-scale, genome-wideassociation studies and identified several loci associated withincreased risk to colon cancer (46–48). All of the three newlyidentified colon cancer–associated SNPs of highest risk (46, 47) arewithin the IBD regions of two of our CRC patients: rs10505477(8q24) in C0153; rs6983267 (8q24) in C0153; and rs719725 (9p24) inC0111 (Table 3). The SNP rs6983267 has also been identified to be a
common risk factor for CRC and prostate cancer (48). Direct DNAsequencing of C0153 DNA revealed that the two 8q24 SNPs(rs10505477 and rs6983267) are indeed homozygous for the CRC-predisposing alleles. However, the 9p24 SNP was found to behomozygous for the non-CRC predisposition SNP. According to ourclinical records, both patients C0111 and C0153 did not have anyfamily history of CRC. We also examined the genotypes of IBDregion SNPs that have been associated to Crohn’s disease (49), apossible precursor of colon cancer (50). The Crohn’s disease–associated SNPs were interrogated despite the fact that none of ourCRC patients had any clinical documentation for the disease(Supplement S-A2). Of the seven Crohn’s disease–associated SNPslocated within the identified IBD regions among the CRC patients,three (among four patients) were found to be homozygous for theCrohn’s disease–predisposing SNPs: rs6596075 (within IBD regionsof C0111H and 00485K), rs6908425 (within IBD region of C0111H),and rs10883365 (within IBD region of 07061). However, SNPsrs11805303 (C0253K), rs17234657 (10216H), rs1000113 (C0181H),rs9469220 (C0170H and C0159H), and rs10883365 (A7223H) were allgenotyped to be homozygous for the non–disease-associated alleles.We have shown that there is a higher frequency and a longer
length of IBD segments within our CRC patients compared with anumber of control groups. Whether these IBD segments result incancer or lead to the progression of cancer has yet to bedetermined. There is clearly a need to expand this study to includethe sampling of a wider cohort and just as importantly to examinethe identified IBD regions for potential cancer-causing genes.
Disclosure of Potential Conflicts of Interest
No potential conflicts of interest were disclosed.
Acknowledgments
Received 9/6/2007; revised 1/15/2008; accepted 1/30/2008.Grant support: National Cancer Institute grant P01-CA65930, the Gilbert Family
Foundation, and generous funding from the Ludwig Institute for Cancer Research/Conrad N. Hilton Foundation joint Hilton-Ludwig Cancer Metastasis Initiative.
The costs of publication of this article were defrayed in part by the payment of pagecharges. This article must therefore be hereby marked advertisement in accordancewith 18 U.S.C. Section 1734 solely to indicate this fact.
We thank Dr. Jenny Xiang and her team at the Microarray Core Facilities,Department of Microbiology, Cornell University Weill Medical College, New York, NY,for the help and services and Shoshana Rosenberg of MSKCC for all the valuableassistance.16 http://seer.cancer.gov
References1. Jemal A, Siegel R, Ward E, Murray T, Xu J, Thun MJ.Cancer statistics, 2007. CA Cancer J Clin 2007;57:43–66.
2. Parkin DM, Bray F, Ferlay J, Pisani P. Global cancerstatistics, 2002. CA Cancer J Clin 2005;55:74–108.
3. Ahmed FE. Colon cancer: prevalence, screening, geneexpression and mutation, and risk factors and assess-ment. J Environ Sci Health C Environ CarcinogEcotoxicol Rev 2003;21:65–131.
4. de la Chapelle A. Genetic predisposition to colorectalcancer. Nat Rev Cancer 2004;4:769–80.
5. Segditsas S, Tomlinson I. Colorectal cancer andgenetic alterations in the Wnt pathway. Oncogene2006;25:7531–7.
6. Nagy R, Sweet K, Eng C. Highly penetrant hereditarycancer syndromes. Oncogene 2004;23:6445–70.
7. Howe JR, Roth S, Ringold JC, et al. Mutations in theSMAD4/DPC4 gene in juvenile polyposis. Science 1998;280:1086–8.
8. Hemminki A, Markie D, Tomlinson I, et al. A serine/
threonine kinase gene defective in Peutz-Jeghers syn-drome. Nature 1998;391:184–7.
9. Liaw D, Marsh DJ, Li J, et al. Germline mutations of thePTEN gene in Cowden disease, an inherited breast andthyroid cancer syndrome. Nat Genet 1997;16:64–7.
10. Naccarati A, Pardini B, Hemminki K, Vodicka P.Sporadic colorectal cancer and individual susceptibility:a review of the association studies investigating the roleof DNA repair genetic polymorphisms. Mutat Res 2007;635:118–45.
11. Dong C, Hemminki K. Modification of cancer risks inoffspring by sibling and parental cancers from 2,112,616nuclear families. Int J Cancer 2001;92:144–50.
12. Goldgar DE, Easton DF, Cannon-Albright LA, SkolnickMH. Systematic population-based assessment of cancerrisk in first-degree relatives of cancer probands. J NatlCancer Inst 1994;86:1600–8.
13. Risch N. The genetic epidemiology of cancer:interpreting family and twin studies and their implica-tions for molecular genetic approaches. Cancer Epide-miol Biomarkers Prev 2001;10:733–41.
14. Lichtenstein P, Holm NV, Verkasalo PK, et al.Environmental and heritable factors in the causationof cancer—analyses of cohorts of twins from Sweden,Denmark, and Finland. N Engl J Med 2000;343:78–85.
15. Tsafrir D, Bacolod M, Selvanayagam Z, et al.Relationship of gene expression and chromosomalabnormalities in colorectal cancer. Cancer Res 2006;66:2129–37.
16. Wen Y, Giardina SF, Hamming D, et al. GROa ishighly expressed in adenocarcinoma of the colon anddown-regulates fibulin-1. Clin Cancer Res 2006;12:5951–9.
17. Cheng YW, Shawber C, Notterman D, Paty P, BaranyF. Multiplexed profiling of candidate genes for CpGisland methylation status using a flexible PCR/LDR/Universal Array assay. Genome Res 2006;16:282–9.
18. Pincas H, Pingle MR, Huang J, et al. High sensitivityEndoV mutation scanning through real-time ligaseproofreading. Nucleic Acids Res 2004;32:e148.
19. Favis R, Huang J, Gerry NP, et al. Harmonizedmicroarray/mutation scanning analysis of TP53
Cancer Research
Cancer Res 2008; 68: (8). April 15, 2008 2620 www.aacrjournals.org
mutations in undissected colorectal tumors. Hum Mutat2004;24:63–75.
20. Broman KW, Weber JL. Long homozygous chromo-somal segments in reference families from the centred’Etude du polymorphisme humain. Am J Hum Genet1999;65:1493–500.
21. Rudan I, Rudan D, Campbell H, et al. Inbreeding andrisk of late onset complex disease. J Med Genet 2003;40:925–32.
22. Shami SA, Qaisar R, Bittles AH. Consanguinity andadult morbidity in Pakistan. Lancet 1991;338:954.
23. Lebel RR, Gallagher WB. Wisconsin consanguinitystudies. II: Familial adenocarcinomatosis. Am J MedGenet 1989;33:1–6.
24. Sutter NB, Ostrander EA. Dog star rising: the caninegenetic system. Nat Rev Genet 2004;5:900–10.
25. Rousset F. Inbreeding and relatedness coefficients:what do they measure? Heredity 2002;88:371–80.
26. Huang J, Wei W, Zhang J, et al. Whole genome DNAcopy number changes identified by high densityoligonucleotide arrays. Hum Genomics 2004;1:287–99.
27. Di X, Matsuzaki H, Webster TA, et al. Dynamic modelbased algorithms for screening and genotyping over100 K SNPs on oligonucleotide microarrays. Bioinfor-matics 2005;21:1958–63.
28. Klein RJ, Zeiss C, Chew EY, et al. Complement factorH polymorphism in age-related macular degeneration.Science 2005;308:385–9.
29. KannelWB. The FraminghamStudy: ITS 50-year legacyand future promise. J Atheroscler Thromb 2000;6:60–6.
30. Price AL, Patterson NJ, Plenge RM, Weinblatt ME,Shadick NA, Reich D. Principal components analysis
corrects for stratification in genome-wide associationstudies. Nat Genet 2006;38:904–9.
31. Riffenburgh RH. Statistics in Medicine. San Diego(CA): Academic Press; 1999. p. 581.
32. Andersen CL, Wiuf C, Kruhoffer M, Korsgaard M,Laurberg S, Orntoft TF. Frequent occurrence ofuniparental disomy in colorectal cancer. Carcinogenesis2007;28:38–48.
33. Teh MT, Blaydon D, Chaplin T, et al. Genomewidesingle nucleotide polymorphism microarray mapping inbasal cell carcinomas unveils uniparental disomy as akey somatic event. Cancer Res 2005;65:8597–603.
34. International_Hapmap_Consortium. A haplotypemap of the human genome. Nature 2005;437:1299–320.
35. Gibson J, Morton NE, Collins A. Extended tracts ofhomozygosity in outbred human populations. Hum MolGenet 2006;15:789–95.
36. Li LH, Ho SF, Chen CH, et al. Long contiguousstretches of homozygosity in the human genome. HumMutat 2006;27:1115–21.
37. International_Hapmap_Consortium. A second gen-eration human haplotype map of over 3.1 million SNPs.Nature 2007;449:851–61.
38. Ukeles J, Miller R. Jewish Community Study of NewYork: 2002; 2004.
39. Feldman GE. Do Ashkenazi Jews have a higher thanexpected cancer burden? Implications for cancercontrol prioritization efforts. Isr Med Assoc J 2001;3:341–6.
40. Laken SJ, Petersen GM, Gruber SB, et al. Familialcolorectal cancer in Ashkenazim due to a hypermutabletract in APC. Nat Genet 1997;17:79–83.
41. Kaklamani VG, Hou N, Bian Y, et al. TGFBR1*6A andcancer risk: a meta-analysis of seven case-controlstudies. J Clin Oncol 2003;21:3236–43.
42. Al-Tassan N, Chmiel NH, Maynard J, et al. Inheritedvariants of MYH associated with somatic G:C->T:Amutations in colorectal tumors. Nat Genet 2002;30:227–32.
43. Lipton L, Tomlinson I. The genetics of FAP and FAP-like syndromes. Fam Cancer 2006;5:221–6.
44. Peterlongo P, Mitra N, Sanchez de Abajo A, et al.Increased frequency of disease-causing MYH mutationsin colon cancer families. Carcinogenesis 2006;27:2243–9.
45. Ries L, Harkins D, Krapcho M, et al. SEER cancerstatistics review, 1975-2003; 2006.
46. Zanke BW, Greenwood CM, Rangrej J, et al. Genome-wide association scan identifies a colorectal cancersusceptibility locus on chromosome 8q24. Nat Genet2007;39:989–94.
47. Tomlinson I, Webb E, Carvajal-Carmona L, et al. Agenome-wide association scan of tag SNPs identifies asusceptibility variant for colorectal cancer at 8q24.21.Nat Genet 2007;39:984–8.
48. Haiman CA, Le Marchand L, Yamamato J, et al. Acommon genetic risk factor for colorectal and prostatecancer. Nat Genet 2007;39:954–6.
49. Wellcome_Trust_Case_Control_Consortium. Ge-nome-wide association study of 14,000 cases of sevencommon diseases and 3,000 shared controls. Nature2007;447:661–78.
50. Bernstein CN, Blanchard JF, Kliewer E, Wajda A.Cancer risk in patients with inflammatory bowel disease:a population-based study. Cancer 2001;91:854–62.
Autozygosity and Colon Cancer
www.aacrjournals.org 2621 Cancer Res 2008; 68: (8). April 15, 2008