the rheology of crystal-bearing basaltic magmas from stromboli and etna
TRANSCRIPT
Available online at www.sciencedirect.com
www.elsevier.com/locate/gca
Geochimica et Cosmochimica Acta 75 (2011) 3214–3236
The rheology of crystal-bearing basaltic magmasfrom Stromboli and Etna
A. Vona a,⇑, C. Romano a, D.B. Dingwell b, D. Giordano c
a Dipartimento di Scienze Geologiche, Universita degli Studi Roma Tre, L.go San leonardo Murialdo 1, 00146 Rome, Italyb Department of Earth and Environmental Sciences, Ludwig Maximilians University, Theresienstr. 41/III, 80333 Munich, Germany
c Institute of Earth Sciences “Jaume Almera”, CSIC, Lluis Sole i Sabaris s/n, 08028 Barcelona, Spain
Received 23 July 2010; accepted in revised form 10 March 2011; available online 25 March 2011
Abstract
Our ability to forecast volcanic hazards at active volcanoes stems from our knowledge of parameters affecting eruptiondynamics. Persistent activity displayed by basaltic volcanic systems, such as Etna and Stromboli, is governed mainly bythe textural evolution and rheological properties of eruptive products. Here, we investigate the high temperature(1131 �C < T < 1187 �C) rheological behavior and textural evolution of remelted natural basaltic magmas from Stromboliand Etna volcanic systems upon cooling and crystallization at atmospheric conditions. The pure liquid and subliquidus iso-thermal viscosities are investigated using a concentric cylinder apparatus by varying strain rate applied to the investigatedmaterials. Detailed textural analysis has been performed in order to evaluate the effect of crystal distribution on the rheolog-ical evolution of magmas. At subliquidus conditions, the mineralogical assemblage is dominated by the presence of spinel andplagioclase with the occurrence of stable clinopyroxene only at the lowest temperatures (1157 and 1131 �C for the Stromboliand the Etna samples, respectively). The overall crystal fraction (/) varies between 0.06 and 0.27. In the high T regime theviscous response to applied stress and strain rate is strongly affected by the presence of even small amounts of crystals. Largediscrepancies between measured and predicted viscosities obtained using the Einstein–Roscoe (ER) equation are also found atlow crystal fractions. We find here that, at the investigated conditions, the physical effect caused by the presence of elongatedcrystals is orders of magnitude higher than that predicted by existing models which only account for spherical particles. It alsoappears that a weak shear thinning behavior occurs at the lowest temperatures investigated. Crystal shape and, with it, thestrain-rate dependence of the rheological properties appear to play primary roles in influencing the transport properties ofthese basaltic magmas.� 2011 Elsevier Ltd. All rights reserved.
1. INTRODUCTION
Viscosity is a critical property governing the efficiency oftransport processes of molten geomaterials. It controlseruption dynamics and affects physico-chemical processessuch as degassing and crystallization in magmas (e.g., Car-icchi et al., 2007; Giordano et al., 2008, 2010). The viscosityof naturally-occurring magmas can span in fact more than
0016-7037/$ - see front matter � 2011 Elsevier Ltd. All rights reserved.
doi:10.1016/j.gca.2011.03.031
⇑ Corresponding author. Tel.: +39 06 57338082; fax: +39 0657338201.
E-mail address: [email protected] (A. Vona).
15 orders of magnitude (10�1–1014 Pa s) primarily in re-sponse to variations in melt composition (X), volatile con-tent, temperature (T), pressure (P), as well as variation inthe proportions and distributions of suspended solids andvesicles (Webb and Dingwell, 1990; Dingwell et al., 1992;Dingwell, 1996; Papale, 1999; Llewellin et al., 2002; Llewel-lin and Manga, 2005; Vetere et al., 2006; Ardia et al., 2008;Giordano et al., 2009). Heat production (viscous heating)or loss, due to either friction or cooling at the conduit wallduring ascent of magma toward the surface, are also fea-tures observed in natural environments strongly affectingmagma viscosity (Rosi et al., 2004; Costa et al., 2007;Giordano et al., 2007). A large number of experimental

Rheology of crystal-bearing magmas from Stromboli and Etna 3215
studies (e.g., Dingwell et al., 1996; Richet et al., 1996; Ste-venson et al., 1998; Whittington et al., 2000, 2001; Romanoet al., 2003; Vetere et al., 2007, 2008; Ardia et al., 2008;Giordano et al., 2009) and numerical models (e.g., Russellet al., 2003; Giordano and Dingwell, 2003; Giordanoet al., 2006, 2008; Hui and Zhang, 2007) on the P–T–X
dependence of the viscosity of silicate melts have recentlydemonstrated the considerable progress in our understand-ing of magmatic liquids. Nevertheless, a comprehensivemethod for predicting the flow properties of magmatic sus-pensions appears far from being available.
With few exceptions, previous experimental determina-tions on the effect of crystals on the rheology of liquids havebeen performed either on materials related to ceramics oron simplified systems such as (a) synthetic analogs (e.g., syr-ups, gelatins, silicon oils) with mono- or bi-disperse particlesize distribution of simple morphology (e.g., Marti et al.,2005; Pabst et al., 2006; Mueller et al., 2010) or (b) high-T compositionally simplified silicate liquids with single crys-talline phases of various shape from sub-rounded to elon-gated (e.g., Lejeune and Richet, 1995; Caricchi et al.,2007; Champallier et al., 2008).
Very few studies have evaluated the multiphase rheologyof crystal-bearing natural silicate melts (e.g., Ryerson et al.,1988; Pinkerton and Stevenson, 1992; Pinkerton and Nor-ton, 1995; Sato, 2005; Ishibashi and Sato, 2007; Caricchiet al., 2008; Ishibashi, 2009; Petford, 2009). Even fewer dataare available describing the rheology of crystal-plus bubble-bearing melts (e.g., Lavallee et al., 2007).
The major effect of suspended crystals on magma viscos-ity is to increase the viscosity through both hydrodynamicand mechanical interaction among crystals. A high crystalcontent may also induce non-Newtonian behavior. The in-crease in viscosity and the non-Newtonian flow depend ontextural features and deformation regimes (e.g., Costa et al.,2009; Petford, 2009; Mueller et al., 2010).
Given these complex dependencies, experiments devotedto the parameterization of suspension rheology have to becarefully planned (1) under variable deformational regimesand (2) for variable crystal content, shape, size and orienta-tion. Further, the accurate characterization of textural fea-tures of the investigated samples before and afterexperimental deformation is essential. It is not infrequentthat the different textural and compositional features ofsamples to be investigated determine the experimental tech-nique to be adopted. For example, the presence of largecrystals, common for lava dome products, requires theinvestigation of large samples in order for the results tobe representative of the natural magmas. These lavas arecommonly erupted at temperatures corresponding to highviscosity values (close to the glass transition interval) andthus the experiments must involve the application of highstresses of the order of several hundred MPa (e.g., Caricchiet al., 2007, 2008; Lavallee et al., 2008; Cordonnier et al.,2009) in order to induce flow.
A common experimental technique employed in thedetermination of rheological properties of crystal- and vol-atile-bearing samples (e.g., Caricchi et al., 2007, 2008;Champallier et al., 2008) at elevated temperature and con-fining pressure under both compressional and torsional
modes is the Paterson-type deformation apparatus (Pater-son and Olgaard, 2000). Uniaxial compression deviceswhich allow for unconfined stresses can also be used toinvestigate the rheological response of multiphase materials(Quane et al., 2004; Lavallee et al., 2008; Robert et al.,2008a,b; Cordonnier et al., 2009). The techniques abovementioned allow viscosity determinations between 108 and1014 Pa s at strain rates of 10�6–10�2 s�1 (Caricchi et al.,2007, 2008; Robert et al., 2008a,b). In addition, to ourknowledge, Robert et al. (2008a) is the only study whichinvestigated the deformation of vesicle-bearing sintered vol-canic materials under water pressure conditions.
The high-temperature low-viscosity rheology of crystal-and/or bubble-bearing magmatic mixtures is commonlyinvestigated by applying a constant rotational stress orstrain-rate at subliquidus conditions using concentric cylin-der methods (e.g., Stein and Spera, 2002; Ishibashi, 2009).On the other hand, concentric cylinders or cone–plate rhe-ometers can also be used to determine low-T low-viscosityrheology of synthetic analogs (e.g., Llewellin et al., 2002;Pabst et al., 2006; Mueller et al., 2010). These techniquesare used to measure viscosities between 10�2 and 105 Pa sand deformation rates ranging from approximately 10�4 to10�1 s�1, depending on the specific experimental geometry.
Here, we have investigated the high temperature rheo-logical behavior of natural magmas from Stromboli andEtna volcanic systems during cooling and crystallizationin a concentric cylinder apparatus. Our results show thatthe presence of crystals and, even more, their shape and dis-tribution, result in an apparent viscosity increase of morethan two orders of magnitude at a crystal fraction of ca./ = 0.3. Our observations confirm the need of accuratedetermination of textural parameters (e.g., average particleshape, size and orientation distribution) of the suspensionfor describing magma flow.
2. REVIEW OF PAST STUDIES ON SUSPENSION
RHEOLOGY
Viscosity is defined as the resistance to flow under spe-cific applied stress (r) conditions and it is expressed by com-plex functions of applied stress and resulting strain (c) andstrain-rates (e.g., Herschel and Bulkley, 1926). For a New-tonian liquid, r ¼ g _c where g is the Newtonian viscosity.The presence of a solid phase or a gaseous phase to forma solid or bubble suspension can yield non-Newtonianbehavior, expressed in the more general equation:
r ¼ r0 þ K _cn ð1Þ
where r0 is a stress threshold to be overcome in order tohave flow, namely the yield stress; K is the flow consistency
(which corresponds to shear viscosity at _c ¼ 1 s�1) and n isthe flow index which describes the degree of non-Newtonianbehavior being equal to 1 for Newtonian fluids, n > 1 forshear-thickening and n < 1 for shear-thinning fluids. Theapparent viscosity is defined as g ¼ r= _c measured at a par-ticular stress or strain rate.
From Eq. (1), assuming zero yield stress, the relative vis-cosity (ratio between stress and strain rate divided by theviscosity of the suspending liquid, gl) can be written as:
3216 A. Vona et al. / Geochimica et Cosmochimica Acta 75 (2011) 3214–3236
gr ¼Kgl
_cn�1 ð2Þ
where Kr = K/gl represent the relative consistency.As stated above, complex rheological behavior can be
related to the presence of gaseous or solid particles in theliquid. Solid particles strongly affect the viscosity of liquids.In general, an increasing crystal content of suspensions gen-erates a sigmoidal increase in viscosity (Lejeune and Richet,1995). For low solid fractions, the viscosity increases slowlywith the particle volume fraction (/), close to the geometri-cal mean (“Reuss bound”; Reuss, 1929), and the suspensionmaintains a Newtonian rheological behavior (strain-rateindependence). When / exceeds a critical value (/c), parti-cles start to interact with each other and a solid network ofparticles begins to form, causing a strong increase in viscos-ity and the onset of non-Newtonian flow, characterized byBingham-like rheology (with yield strength) and/or shearthinning effects. As the solid fraction is further increasedanother rheological threshold, corresponding to the maxi-mum packing density of solid particles (/m), causes the vis-cosity to approach the Voigt bound (Voigt, 1928). At thispoint the system behaves essentially as a single phase solidmaterial and flow ceases, eventually culminating in brittlefailure if additional stress is applied to the material.
It is thus useful to distinguish the three following con-centration regimes (cf. Rutgers, 1962a,b; Thomas, 1965;Pabst et al., 2006; Mueller et al., 2010): (1) a dilute flow re-gime, where the viscosity increase is nearly linear and rheol-ogy is Newtonian; (2) a semi-dilute regime, where theviscosity exhibits a higher order dependence on crystal con-tent, but rheology remains Newtonian and (3) a concen-trated regime, where the suspension shows a rapidincrease in viscosity and the onset of non-Newtonianbehavior. These regimes are defined not only on the basisof crystal concentration, but also on the basis of crystalshape, crystal size and shape distribution and orientationof particles. The effects of those parameters are discussedin this section.
For suspensions of spherical particles, Rutgers (1962a,b)and Thomas (1965) found the upper limit for the dilute re-gime at / 6 0.02 and / 6 0.01, respectively, and that of thesemi-dilute regime at /c 6 0.25. For monodisperse suspen-sions of elongated particles, Doi and Edwards (1978) de-fined these regimes as functions of particle aspect ratios(R = long axis/short axis).
To predict the viscosity of liquids containing solid sus-pended particles in the dilute and semi-dilute concentrationregimes, different derivations of the equations of Einstein(1906) and Roscoe (1952) are commonly used.
For the simplest system of a very dilute suspension of so-lid spherical monodisperse particles (/ < 0.03), Einstein(1906) calculated that the viscosity follows the equation:
gr ¼ ð1þ B/Þ ð3Þ
where gr is the relative viscosity and B is the Einstein coef-ficient, an adjustable parameter which is commonly as-sumed to be equal to 2.5, although, alternative valuesranging from 1.5 to 5.5 have been given (e.g., Jeffrey andAcrivos, 1976; Pabst et al., 2006).
To expand the range of applicability to higher crystalfractions, incorporating the effects of hydrodynamicallyinteracting particles (in the semi-dilute regime), Roscoe(1952) introduced an equation known as the Einstein–Ros-coe (ER) equation, which considers the maximum packingdensity of solid particles (/m):
gr ¼ 1� //m
� ��2:5
ð4Þ
For monodisperse spherical particles, /m ranges from amaximum of 0.74 when the particles show the most com-pact ordered hexagonal arrangement (Shaw, 1965) to 0.60for less compact, disordered arrangements (Marsh, 1981).The ER equation set with the value of /m = 0.60 (deter-mined empirically by Marsh (1981) using Shaw (1969) vis-cosity data), is appropriate to describe relative viscosityincrease for particle fraction / < ca. 0.3–0.4 (below the on-set of non-Newtonian behavior) for a suspension contain-ing uniform spherical or equantly shaped particles, andhas been used extensively in the simulation of natural mag-mas (e.g., Ryerson et al., 1988; Pinkerton and Stevenson,1992; Lejeune and Richet, 1995). However, as demon-strated by Sato (2005), the ER equation is not applicableto natural magmas containing elongated crystals (i.e., tabu-lar plagioclase), as both /m and the exponent Eq. (4) varyas functions of the textural attributes of the particles andthe total applied stress, r.
In order to represent relative viscosity of monodispersefiber suspensions Maron and Pierce (1956, MP) found thatusing an exponent value of 2 instead of 2.5 as in the ERequation provided better data representation. This valuehas been recently applied in rheological modeling in Pabstet al. (2006) and Mueller et al. (2010).
Krieger and Dougherty (1959) provided the followinggeneral KD-equation which takes into account the presenceof non-spherical particle:
gr ¼ 1� //m
� ��B/m
ð5Þ
For values of B/m = 2 and 2.5, Eq. (5) yields the MP andER equations, respectively. It has been observed that bothB (sometime referred to as “intrinsic viscosity”) and /m arevery sensitive to the axial ratio (R) of spheroids. Overall, B,contrarily to /m, increases as the particles shape deviatesfrom an isotropic form (Jeffery, 1922). Based on the MPequation (having an exponent value of 2) and measure-ments on monodisperse particles of varying aspect ratios,Kitano et al. (1981), Pabst et al. (2006), and Mueller et al.(2010), respectively, propose different expressions for thedependence of the /m from R-parameter which correlatelinearly and via a first order inverse function to such aparameter. These are single parameter expressions. Com-pared to Kitano et al. (1981) and Pabst et al. (2006), theexpression formulated by Mueller et al. (2010) (Eq. (6)),has the advantage of always providing positive values forboth B and /m.
/m ¼2
0:321Rþ 0:302ð6Þ
Rheology of crystal-bearing magmas from Stromboli and Etna 3217
The effect of the particle size distribution on the viscosityof spherical suspensions was studied by Farris (1968). In histheory, the finer particles in a bimodal suspension behaveessentially as a fluid with respect to the coarser particles ifthe size ratio (small to large) is <0.1 and interactions arenegligible. Using this concept, the viscosity of bimodaland multimodal suspensions can be calculated from the uni-modal viscosity data of each size. From this theory, thedependence of bimodal particle sizes (expressed as thediameters of the smaller and the bigger particles) on /m
was found experimentally by Chong et al. (1971). Kansalet al. (2002) performed numerical simulations on the effectof the particle size distribution on /m for spherical particlesand showed that /m increases for wide size distribution (upto /m = 0.87 for a polydisperse random sphere packing).
Orientation of anisotropic particles also has an impor-tant effect on suspension rheology. Donev et al. (2004)showed that anisotropic particles with a preferred orienta-tion have a higher /m, providing a more ordered packingstructure with /m increasing from 0.64 to 0.74 as dispersionof particle orientation decreases.
None of the above equations account for the strain ratedependence of viscosity. For concentrated suspensions it isobserved that the rate of deformation strongly affects therheological response. At high crystal fractions, increasingdeformation rate yields the transition from Newtonian tonon-Newtonian rheological behavior (Krieger, 1972; Vander Werff and de Kruif, 1989; Bruckner and Deubener,1997; Deubener and Bruckner, 1997; Caricchi et al.,2007). At low strain rates (Bruckner and Deubener, 1997;Scott and Kohlstedt, 2006; Caricchi et al., 2007), theincrease of relative viscosity depends mainly on the texturalcharacteristics of the crystalline phases (Newtonianbehavior). Increasing the strain rate above a certain thresh-old results in a decrease of the apparent viscosity, anon-Newtonian behavior known as shear thinning (e.g.,Webb and Dingwell, 1990) until a minimum value isreached. This minimum represents the onset of pseudo-Bingham behavior in which the relative viscosity is lowerthan in the Newtonian field but is no longer dependenton the strain rate.
Starting from Eq. (2), Ishibashi (2009) and Mueller et al.(2010) proposed two parameterizations obtained by modifi-cations of the above reported strain rate independent KDand MP equations, respectively, to take into account theshear thinning effect on the rheology of suspensions.
On the basis of their study on monodisperse suspensionswith different aspect ratios, Mueller et al. (2010) providedrelationships for K and n as a function of ///m and ///m
and R, respectively:
Kgl
¼ 1� //m
� ��2
ð7Þ
n ¼ 1� 0:2R//m
� �4
ð8Þ
With these expressions the relative consistency of mono-disperse suspensions is completely described by the Maron–Pierce equation (MP), while the flow index n captures therole of shear thinning on the suspension rheology.
Ishibashi (2009) provided a modified strain rate depen-dent KD equation based on rheological measurements onnatural basaltic magmas:
gr ¼ 1� //m
� ��B1/m ½1þk lnð1�/=/mÞ ln _c�
ð9Þ
where /m = 0.6 (as in the ER equation), B1 = 5.46 repre-sents the intrinsic viscosity at _c ¼ 1 s�1 and k = 0.118 isan empirical constant which takes the shear thinning effectinto account. However, the fitting parameters are not re-lated in any way to the textural features of their suspension,such as crystal shape, crystal shape dispersion, crystal sizedispersion and orientation dispersion, such that the param-eterization cannot be further generalizable to othersuspensions.
A more empirical parameterization of the relative vis-cosity, valid for low to medium-high concentrated suspen-sions of spherical particles was proposed by Costa (2005)and then modified by Caricchi et al. (2007) and Costaet al. (2009) to take into account the strain rate ð _cÞ depen-dence of the suspension rheology. The relation between rel-ative viscosity and the solid fraction is given by:
gð/Þ ¼ 1þ ud
½1� F ðu; e; cÞ�B/�ð10Þ
where
F ¼ ð1� nÞerfffiffiffipp
2ð1� nÞuð1þ ucÞ� �
ð11Þ
with u = ///* where /*, n, c and d are empirical parame-ters that depend on the deformation rate and B is the Ein-stein coefficient. Although this model can successfullypredict the multiphase rheology of suspensions varyingfrom / = 0.1–0.8 isotropic particles for a wide range ofstrain rates, it fails when the aspect ratio of the solidsincreases.
To date, a general model predicting the rheologicalbehavior of magmatic suspension as a function of crystalcontent, crystal anisotropy, crystal size distribution andstrain rate has yet to be formulated. In this study we havedetermined the subliquidus viscosity of Stromboli and Etnabasalts and compared the results with existing predictivemodels. With this knowledge, we address the relativeimportance of temperature, residual melt evolution, crystal-lizing phases and their textural features on the rheologicalbehavior of magmas.
3. STARTING MATERIALS
The viscosity measurements were performed on re-melted samples of natural rocks derived from two activevolcanic systems (Stromboli and Etna).
3.1. Stromboli
Two different types of magma have been recognizedfeeding the present-day activity of Stromboli (Rosi et al.,2000; Metrich et al., 2001; Francalanci et al., 2004; Landiet al., 2009). Despite a similar bulk composition, ranging

3218 A. Vona et al. / Geochimica et Cosmochimica Acta 75 (2011) 3214–3236
from HK to shoshonitic basalt, they show strong differencesin terms of texture and matrix glass composition.
Highly porphyritic (HP; Landi et al., 2009) degassedshoshonitic basalt is erupted either as dense scoriae or lavaflows during normal activity and effusive episodes. It con-tains about 50% phenocrysts, including, on average,33 vol% plagioclase An60–90, 12 vol% clinopyroxeneMg# = 0.73–0.91 and 5 vol% olivine Fo70–73.
In contrast, a nearly aphyric volatile-rich high-K basalt(low porphyritic, LP; Landi et al., 2009) is erupted as pumi-ceous material, exclusively during paroxysmal events.
The HP magma, which feeds the normal activity, residesin the upper part of the volcano. It is continuously refilledby deeper hot volatile-rich LP magma batches, which peri-odically intrude the shallow reservoir, crystallizing bydecompression and volatile loss at low pressure (Metrichet al., 2001; Francalanci et al., 2005). Evidence of continu-ous mixing between LP and the HP magmas have been ob-served in textural, mineralogical, chemical and isotopicstudies (Francalanci et al., 1999, 2004, 2005; Landi et al.,2004, 2006, 2008; Armienti et al., 2007; Fornaciai et al.,2009). According to this model, the steady state behaviorof the plumbing system is a consequence of the balance be-tween magma refilling and magma expulsion.
The present study has been carried out on a pumiceoussample emitted during the 15th March 2007 paroxysmaleruption, collected a few months after the explosion on Piz-zo Sopra la Fossa site. The explosion, generated by the ra-pid ascent of volatile-rich LP magma, occurred after 16days of HP lava emission and produced a plume whichdeposited ash and pomiceous lapilli/bombs. The pumicesare nearly aphyric (<5% crystals), with microphenocrystof clinopyroxene (Fs5–8, Wo45–48) and olivine (Fo82–91) ina HK-basaltic glassy matrix. In terms of bulk rock compo-sition, they belong to the high-K calc-alkaline suite and theyhave similar composition characteristics of the pumicesfrom the previous paroxysm on the 5th April 2003 (Landiet al., 2009).
3.2. Etna
The samples used for viscosity measurement in thisstudy is the same studied by Giordano and Dingwell(2003) and was collected from the 1991–1993 eruption fromthe lava flow field in Val Calanna ca. 6.5 km from the erup-tive fissure (Calvari et al., 1994). The 1991–1993 Etna erup-tion represents one of the most prolonged andvolumetrically significant observed at Etna in the last threecenturies (Armienti et al., 1994; Calvari et al., 1994). A de-tailed study of the petrography of the lavas belonging tothis eruption has been provided by Armienti et al. (1994).They observed that most of the analyzed samples show aPorphyritic Index in the range between 30 and 33 vol% ofphenocrysts, although lower values were found for the firsttwo lava flows that spread at the base of South East Crater(�19 vol%) and higher values were found sporadically inthe Valle del Bove flow field (�35 vol%). The most abun-dant phase as phenocryst is plagioclase (�17–20 vol%) fol-lowed by olivine and clinopyroxene (�6–11 and �2–4 vol%,respectively). The only exception is represented by the less
porphyritic samples from the base of the South East Craterwhich showed a reversed plagioclase/mafic mineral ratio.All minerals are present also as microlites with variableamounts of glass in the groundmass.
4. EXPERIMENTAL METHODS
Natural materials were first melted in a large thin-walledPt crucible in a Nabertherm MoSi2 box furnace atT = 1400 �C for a few hours, until visual inspection indi-cated homogenization and the complete loss of bubblesfrom the samples. The melts were quenched in air, andthe samples were removed from the crucibles by drillingand percussion. Chips of glass were loaded into a Pt80Rh20
cylindrical crucible (5.1 cm in height, 2.56 cm inner diame-ter, 0.1 cm wall thickness) and remelted in a box furnaceheated by MoSi2 elements. High temperature viscosity mea-surements were carried out using a Brookfield DV-III+ vis-cometer head (full range torque of 7.2 � 10�2 N m)following the methods and procedures described by Ding-well (1986, 1989a,b). The spindle used for this study wassimilar to the one described by Dingwell and Virgo (1988)with dimensions 3.2 mm in diameter, 42 mm in length witha 45� conical tip to reduce end effects. The viscometer wascalibrated against DGG-1 standard glass, for which thetemperature–viscosity relationship is accurately known.With this equipment, viscosity can be measured in the rangefrom 0.1 to 105 Pa s, with an accuracy of ±logg = 0.05 Pa s(Hess et al., 1996).
In this study, the ratio of the inner to outer radius of thecylinder (Ri/Ro = 0.125) corresponds to a “wide-gap geom-etry” for concentric cylinder measurements. This geometryis preferred to the narrow-gap system (Ri/Ro > 0.97) as itdoes not present problems of achieving parallel alignmentand it works better with suspensions containing large parti-cles. As suggested by Krieger and Maron (1954), the shearstress/shear rate relationship over the interval of shear ratesin the gap can be described by the following simplified Her-schel and Bulkley (1926) power law equation Eq. (1):
r ¼ K _cn ð12Þ
For this geometrical assemblage the values of shearstress and shear rate taken at the inner cylinder are givenby:
_c ¼ 2X
nð1� ðRi
RoÞ2=nÞ
ð13Þ
r ¼ M
2pR2i h
ð14Þ
where X is the angular velocity (rad/s), M the measured tor-que and h the effective immersed length of the spindle.However, the wide gap setup has the disadvantage thatthe shear rate is not only dependent on the geometricalcharacteristics of the adopted assembly but it also dependson the flow index value (n). Using Eqs. (13) and (14) a flowcurve (r– _c) can be built to describe the rheological behaviorof the studied suspensions. The value of n can be deter-mined by plotting M vs. X on a double logarithmic basisand taking the slope at the value of X under consideration

Rheology of crystal-bearing magmas from Stromboli and Etna 3219
(e.g., Ishibashi, 2009). The results obtained for our mea-surements, using this method, are given in Section 5.
The pure liquid viscosity was measured in steps ofdecreasing temperature of 25 �C/min and one hour equili-bration time for each step. Once the required steps werecompleted the temperature was increased to the initial valueto check if any instrumental drift had occurred. No suchdrift was observed (see procedures in Dingwell and Virgo,1988).
Prior to initiation of the subliquidus experiments, themelt was stirred continuously at 1400 �C, for ca. 5 h to en-sure that the crystalline phases of the natural mineral
Fig. 1. Time variation of viscosity for Stromboli HK-basalt (a) and Etntime axis on the (b) graph is broken between 2.5 and 4 � 105 s. The right Y
deformation rates). The rotational speed decreases in a step-wise fashiomaximum torque allowed) is reached. The value of viscosity comprisedhighest of the two.
assemblage were fully dissolved. Subsequently, the temper-ature of the melt was lowered rapidly to that of the mea-surement dwell temperature and held constant until astable reading of the viscosity value was achieved. The ini-tial rotational speed was set to x = 20 rpm for experimentscarried out on Stromboli material and to x = 2.5 rpm forEtna samples (translating into a maximum strain rate ofca. 4.3 s�1 and ca.0.5 s�1). The software controlling thespindle speed automatically halves the speed when maxi-mum torque is reached (due to crystallization). The viscos-ity reading typically achieved a steady value after 104–105 s(interpreted here as equilibrium in the crystallization
a trachybasalt (b) at subliquidus conditions. For a clearer view, thescale refers to the values of rotational speed adopted (expression ofn, halving each time a maximum viscosity (corresponding to the
between two rotational speed values must be always related to the

3220 A. Vona et al. / Geochimica et Cosmochimica Acta 75 (2011) 3214–3236
process at that temperature). Once equilibrium conditionswere reached, the rotational speed was varied to evaluateits effect on the rheological response of our suspension.The rotational speed was allowed to decrease stepwiseand subsequently increase to its original value and was leftin the new position for a long enough time (transient) to ob-tain a new stable reading (on the order of tens of minutes).No drift in the viscosity reading due to the variation ofrotational speed was observed in any of our experimentsallowing us to conclude that our measurements were highlyreproducible. Before the samples were removed from thefurnace we checked that no residual torque, indicative ofyield strength, was present at the no-stir condition(x = 0 rpm). At the end of each experiment, the stirringspindle was removed and the melt attached to the spindlewas quenched in water. A comparison between the materi-als quenched in water and in air indicated that no apprecia-ble crystallization took place during cooling in the crucible.The post-run products were then drilled and the cylindricalcores (20 mm diameter � 40 mm length) were sectioned atsurfaces parallel and perpendicular to the rotational axis,to permit subsequent chemical and textural analyses.
5. RESULTS
5.1. Rheology
The temporal evolution of apparent viscosity readingsduring the isothermal crystallization experiments are re-ported in Fig. 1. We can observe a non-linear viscosity in-crease with time for all of the analyzed curves. The curvesare constituted by successive series of ramps and plateaus.The first early stage (<0.1 � 105 s) ramp, likely to be
Table 1Results of subliquidus viscosity measurements.
Sample Stromboli
Run SGP7 SGP5 SGP4 SGP1 ST (�C) 1187.5 1182.3 1177.2 1172.1 1
_ci (s�1) 4.26 4.26 4.26 4.26 4_cf (s�1) 2.18 2.24 1.13 0.56 0logg0
a (Pa s) 2.28 2.33 2.38 2.41 2gapp (Pa s) – I 263 (2.18) 364 (2.24) 602 (1.13) 901 (0.56) 9gapp (Pa s) – II 267 (1.09) 377 (1.12) 628 (0.56) 935 (0.27) 1gapp (Pa s) – III 271 (0.54) 391 (0.56) 657 (0.27) 970 (0.13) 1gapp (Pa s) – IV – 406 (0.27) – – –K (Pa s) 268 379 606 874 9n 0.98 0.95 0.94 0.95 0R2 0.999 0.999 0.999 0.999 0KR (K/g0) 1.42 1.78 2.50 3.40 3/Glass 0.890 0.875 0.861 0.863 0/Plagioclase 0.107 0.122 0.134 0.130 0/Pyroxene – – – – –/Spinel 0.003 0.003 0.005 0.006 0Rb 6.13 6.98 6.91 6.85 6/m
c 0.4010 0.3801 0.3817 0.3831 0
Note: Number in brackets correspond to the applied strain rate in s�1.a Viscosities of residual melts (g0) have been calculated using GRD mode
(see text).b Calculated via Eq. (18).c Calculated after Mueller et al. (2010).
attributed to the thermal relaxation of the melt to thenew temperature conditions (from T = 1400 �C to the tem-perature of the measurement), is commonly followed by aplateau, whose length typically exhibits an overall decreasewith increasing undercooling. After this stage, an extensiveviscosity increase is observed followed by a secondary pla-teau and, in one case, additional plateaus and ramps. Rota-tional speeds during crystallization are reported in Fig 1.Measurements were terminated when a stable value ofapparent viscosity was achieved in a time range between0.7 and 4.8 � 105 s (from ca. 1 day to 1 week). Table 1 re-ports the shear rate values at the final stable reading stageð _cfÞ together with those corresponding to the maximum val-ues ð _ciÞ as observed at the beginning of each measurement.
On Stromboli HK-basalt, seven isothermal crystalliza-tion experiments were performed in the temperature rangebetween T = 1187.5–1151.5 �C (Fig. 1a). The experimentrun at the lowest temperature (T = 1151 �C) showed a rapidincrease in apparent viscosity and the reading reached theinstrumental limit after ca. 3 � 104 s. For this reason, themeasurement automatically stopped and it could not beused in the present study, as no sample was collected. Allof the other experiments reached stable values of viscosityin a time span between 0.7 and 1 � 105 s. At the end ofthe measurement the viscosity increased by a factor rangingfrom 2 to 37 times; as an inverse function of temperature.The largest increase was observed at T = 1156.7 �C. The fi-nal viscosity ranged between 2.3 and 3.7 log Pa s.
Fig. 1b displays the results of three isothermal crystalli-zation experiments performed on Etna trachybasalt. Vis-cosity reached stable values of 2.50, 3.07, and3.79 log Pa s, at T = 1182.4, 1156.7, and 1131 �C,respectively.
Etna
GP3 SGP6 E92-1 E92-2 E92-3167.0 1156.7 1182.4 1156.7 1131
.26 4.26 0.53 0.53 0.53
.58 0.14 0.54 0.56 0.14
.44 2.54 2.61 2.70 2.9164 (0.58) 5180 (0.14) 355 (1.09) 1127 (0.56) 6264 (0.14)032 (0.28) 5503 (0.07) 361 (0.54) 1172 (0.27) 6699 (0.07)099 (0.14) 5702 (0.05) 366 (0.26) 1216 (0.13) 6967 (0.05)
6058 (0.02) – 1262 (0.07) –18 4360 356 1092 5181.91 0.91 0.98 0.95 0.90.998 0.998 0.999 0.999 0.999.35 12.63 0.88 2.20 6.40.821 0.728 0.934 0.842 0.794.172 0.229 0.057 0.133 0.176
0.027 – – 0.043.007 0.016 0.009 0.025 0.020.90 7.25 5.57 6.15 6.57.3820 0.3741 0.4160 0.4004 0.3900
l by Giordano et al. (2008) with a correction factor of +0.2 log units

Rheology of crystal-bearing magmas from Stromboli and Etna 3221
The effect of varying the deformation rate of the equilib-rium suspensions is reported in Fig. 2; a slight decrease in
Fig. 2. Variation of the logarithm of the apparent visc
Table 2Chemical composition of starting materials and residual melts.
Sample Startingmaterial
Stromboli
Run SGP7 SGP5 SGP4 SGP1 SGT
(�C)1187.5 1182.3 1177.2 1172.1 11
SiO2 50.35(0.16)
51.13(0.12)
51.26(0.13)
51.35(0.19)
51.36(0.21)
51(0.
TiO2 0.92 (0.05) 1.03(0.03)
1.03(0.05)
1.05(0.04)
1.07(0.04)
1.0(0.
Al2O3 17.18(0.10)
15.59(0.11)
15.39(0.12)
15.29(0.10)
15(0.
15.28(0.30)
FeOtot 8.47(0.11)
8.44(0.10)
8.41(0.16)
8.4(0.
8.82(0.28)FeO 1.71 (0.11)
Fe2O3 7.04(0.12)
MnO 0.18 (0.04) 0.2(0.03)
0.21(0.03)
0.19(0.04)
0.2(0.05)
0.2(0.
MgO 6.28 (0.06) 7.15(0.12)
7.25(0.07)
7.27(0.12)
7.47(0.09)
7.5(0.
CaO 11.64(0.16)
11.43(0.12)
11.35(0.13)
11.35(0.10)
11.39(0.11)
11(0.
Na2O 2.33 (0.04) 2.34(0.06)
2.37(0.07)
2.34(0.06)
2.35(0.07)
2.3(0.
K2O 1.85 (0.05) 2.05(0.04)
2.09(0.05)
2.12(0.05)
2.13(0.06)
2.1(0.
P2O5 0.53 (0.07) 0.6(0.05)
0.6(0.04)
0.61(0.06)
0.53(0.09)
0.5(0.
Total 99.17 99.27 99.22 99.50 98.61 99
Note: Oxide compositions are normalized to a total of 100 wt%. Number ialso reported.
viscosity with increasing shear rate has been observed forlow temperature experiments for both Etna and Stromboli
osity with respect to the logarithm of strain rate.
Startingmaterial
Etna
P3 SGP6 E92-1 E92-2 E92-367.0 1156.7 1182.4 1156.7 1131
.2940)
51.42(0.62)
48.16(0.23)
51.09(0.13)
50.70(0.49)
50.55(0.35)
805)
1.15(0.05)
1.69 (0.06) 1.82(0.04)
1.78(0.05)
1.93(0.04)
.0913)
14.91(0.11)
14.49(0.17)
17.10(0.11)
16.34(0.08)
15.73(0.16)
117)
8.59(0.42)
8.65 (0.56) 8.01(0.11)
8.56(0.47)
2.49 (0.10)8.60(0.10)
04)0.23(0.04)
0.19 (0.02) 0.22(0.03)
0.21(0.04)
0.22(0.04)
810)
7.77(0.12)
5.38 (0.08) 5.43(0.08)
6.02(0.16)
6.08(0.23)
.2608)
11.12(0.16)
10.36(0.07)
10.36(0.13)
10.17(0.20)
10.05(0.31)
305)
2.3(0.05)
3.69 (0.05) 4.07(0.08)
3.98(0.04)
4.09(0.16)
906)
2.22(0.08)
1.91 (0.03) 2.05(0.04)
2.20(0.03)
2.27(0.18)
505)
0.65(0.06)
0.43 (0.06) 0.61(0.04)
0.64(0.04)
0.71(0.06)
.21 99.34 99.41 98.96 99.14 99.36
n brackets correspond to 1r standard deviation. Measured totals are
3222 A. Vona et al. / Geochimica et Cosmochimica Acta 75 (2011) 3214–3236
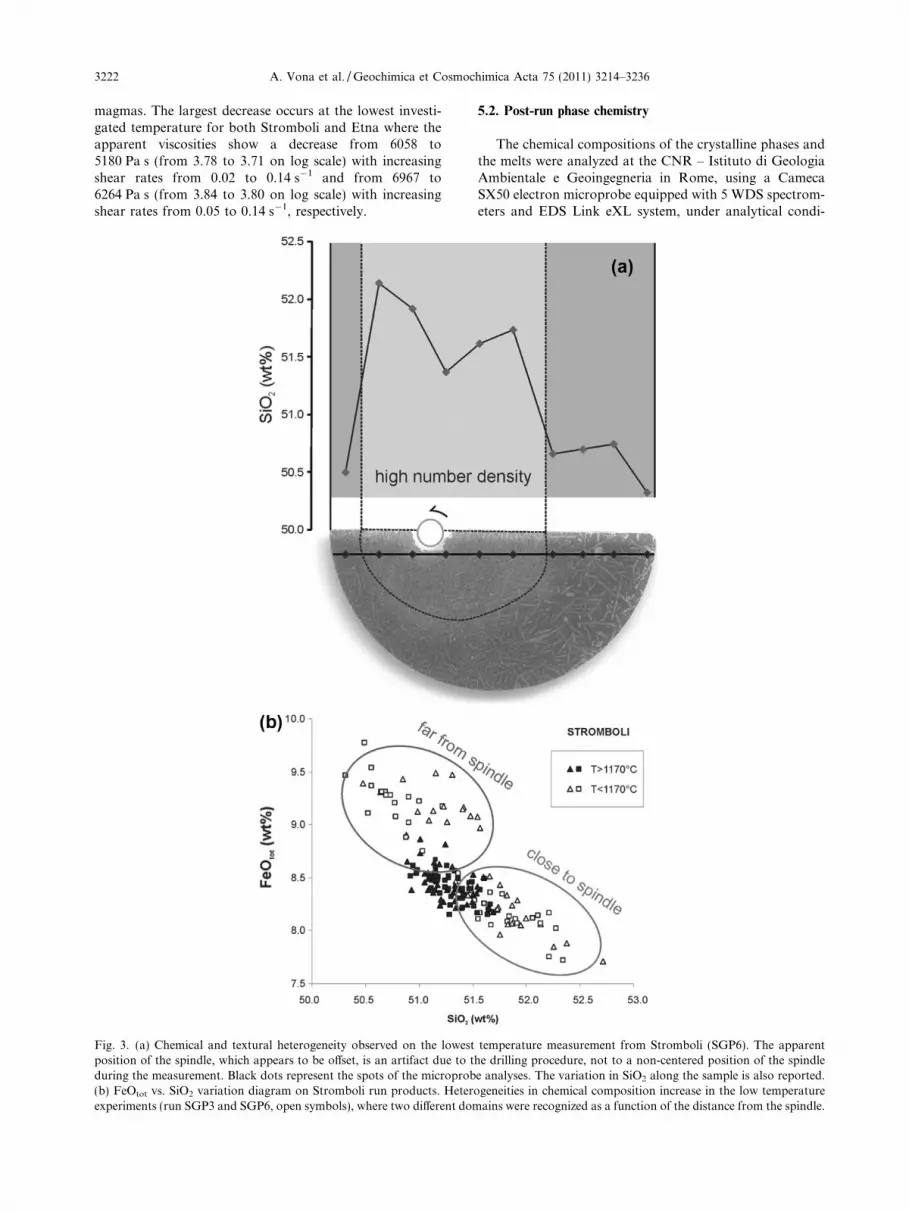
magmas. The largest decrease occurs at the lowest investi-gated temperature for both Stromboli and Etna where theapparent viscosities show a decrease from 6058 to5180 Pa s (from 3.78 to 3.71 on log scale) with increasingshear rates from 0.02 to 0.14 s�1 and from 6967 to6264 Pa s (from 3.84 to 3.80 on log scale) with increasingshear rates from 0.05 to 0.14 s�1, respectively.
Fig. 3. (a) Chemical and textural heterogeneity observed on the lowestposition of the spindle, which appears to be offset, is an artifact due to tduring the measurement. Black dots represent the spots of the microprob(b) FeOtot vs. SiO2 variation diagram on Stromboli run products. Heteroexperiments (run SGP3 and SGP6, open symbols), where two different dom
5.2. Post-run phase chemistry
The chemical compositions of the crystalline phases andthe melts were analyzed at the CNR – Istituto di GeologiaAmbientale e Geoingegneria in Rome, using a CamecaSX50 electron microprobe equipped with 5 WDS spectrom-eters and EDS Link eXL system, under analytical condi-
temperature measurement from Stromboli (SGP6). The apparenthe drilling procedure, not to a non-centered position of the spindlee analyses. The variation in SiO2 along the sample is also reported.geneities in chemical composition increase in the low temperatureains were recognized as a function of the distance from the spindle.

Rheology of crystal-bearing magmas from Stromboli and Etna 3223
tions of 15 kV accelerating voltage, 15 nA beam currentand 10 lm beam diameter to reduce K and Na volatiliza-tion. To better investigate possible chemistry variationswithin each sample, analyses were performed systematicallyalong profiles orthogonal to the spindle direction.
5.2.1. Melt chemistry
The analyses of the chemical compositions of theresidual melts are reported in Table 2. For Strombolianmagmas, with decreasing temperature, the crystallizationprocess generates liquid compositions showing increasingSiO2, MgO and K2O, and decreasing Al2O3 and CaOcontent. The concentration of FeOtot, TiO2 and K2O re-mains approximately constant for all samples. The exper-iments run at the lower temperatures (SGP3 and SGP6)show some heterogeneity in chemical composition asdemonstrated by their higher standard deviations in Ta-ble 2. Such variability is related to inhomogeneous spatialdistribution of the crystalline phases in the samples (seebelow). This effect is most evident in the sample SGP6(at the lowest investigated temperature) where the chem-ical variation of the residual melt results from an inho-mogeneous spatial distribution of clinopyroxene andiron oxides, both of which are only present near the stir-ring spindle (Fig. 3a).
In the SGP3 experiments clinopyroxene is absent. Theheterogeneity, evident in a SiO2–FeOtot variation diagram(Fig. 3b) is the result of an heterogeneous distribution ofiron oxides in the samples. For lower temperature runs(SGP3 and SGP6) two different domains are recognizableas a function of the distance from the spindle: a silica-richiron-poor zone in the inner part of the core (close to thespindle) and a silica-poor iron-rich zone toward the wallof the core (far from the spindle).
The same kinds of variations have been observed on thelow temperature runs of products from Etna samples (E92-2 and E92-3), but are absent in the sample run atT = 1182.4 (E92-1). Decreasing temperature causes slightdecreases in SiO2, Al2O3 and CaO, whereas MgO, TiO2
and K2O display slight enrichment trends.
Table 3Results of textural analysis.
Run Stromboli
SGP7 SGP5 SGP4 SGP1 SG
Investigated area (mm2) 37.365 50.450 57.495 28.545 51.Phase plg plg plg plg plgNumber of crystals 753 1568 2387 960 392Number density (mm�2) 20.153 31.080 41.517 33.631 76.Surface area (mm2) 2.630 4.500 6.000 2.880 7.3Mean size L (mm) 0.114 0.109 0.990 0.096 0.0Min. size L (mm) 0.007 0.007 0.007 0.007 0.0Max. size L (mm) 0.875 0.923 0.997 0.848 0.9Mean size W (mm) 0.028 0.260 0.024 0.024 0.0Min. size W (mm) 0.003 0.003 0.003 0.003 0.0Max. size W (mm) 0.151 0.170 0.176 0.168 0.1Intercept ln(n0) (mm�4) 10.79 11.42 11.74 12.00 12.Slope (mm�1) 74.9 80.8 84.9 90.9 99.R2 0.984 0.992 0.984 0.988 0.9
5.2.2. Crystal chemistry
Spinel and plagioclase are the high-T mineralogicalassemblage. Plagioclase composition ranges betweenAn79–72 for Stromboli and between An72–64 for Etna, wellwithin the range of natural magmas. The anorthite contentis found to be a direct function of temperature. Low tem-perature experiments also exhibit the formation of augite,occurring only at 1157 �C on Stromboli (SGP6) and at1131 �C (E92-3) on Etna, the lowest temperature at whichmeasurements could be performed within the allowed vis-cosity range. Olivine was not observed, despite its presencein natural samples of both Stromboli and Etna materials.The absence of olivine can be explained by the high oxygenfugacity conditions adopted in the present study, which fa-vor the crystallization of the spinel phase.
5.3. Textural analysis
Backscattered electron images (BSE) of the longitudinalthin sections were collected with a Philips XL30 SEM at theLIME laboratory of Roma Tre University. Picture profileswere taken at ca. 1 cm from the top and ca. 1 cm from thebottom of the core. For each experimental run, an area be-tween 25 and 55 mm2 has been digitally analyzed. Depend-ing on the magnification used (between 40� and 100� forthe more crystalline samples), the lowest measurable sizeranged between 4 and 1.7 lm. Between 100 and 4000 pla-gioclase, clinopyroxene and spinel crystals were contouredfor each sample using Corel Draw� and ImageJ software,and binary images were obtained. Adjacent crystals form-ing clusters were then separated by drawing white lines inorder to isolate the single crystals. For each crystal, theintersection length, width, area and orientation were thenmeasured with ImageJ software. Length and width are ex-pressed as the major and minor axis of the equivalent areaellipse. The results of the analyses are reported in Table 3.
The overall crystal fraction (Table 1) varies between /= 0.06 at 1182 �C (Etna) and / = 0.27 at 1157 �C (Strom-boli). Heterogeneities have been investigated along profilesperpendicular to the rotational axis (Fig. 4). While high
Etna
P3 SGP6 E92-1 E92-2 E92-3
056 24.302 46.394 43.183 23.159plg cpx plg plg plg cpx
7 3293 692 102 1048 1027 388916 135.503 28.475 2.199 24.269 44.346 16.75480 3.510 0.526 1.765 4.750 2.202 0.35988 0.066 0.047 0.282 0.140 0.104 0.03907 0.004 0.031 0.030 0.010 0.006 0.00652 0.512 0.125 1.266 1.069 0.853 0.24321 0.016 0.028 0.061 0.030 0.019 0.02203 0.002 0.017 0.006 0.004 0.003 0.00211 0.104 0.081 0.210 0.188 0.108 0.12576 13.66 7.31 11.01 12.288 123.6 40.3 73.9 106.896 0.994 0.881 0.986 0.977
3224 A. Vona et al. / Geochimica et Cosmochimica Acta 75 (2011) 3214–3236
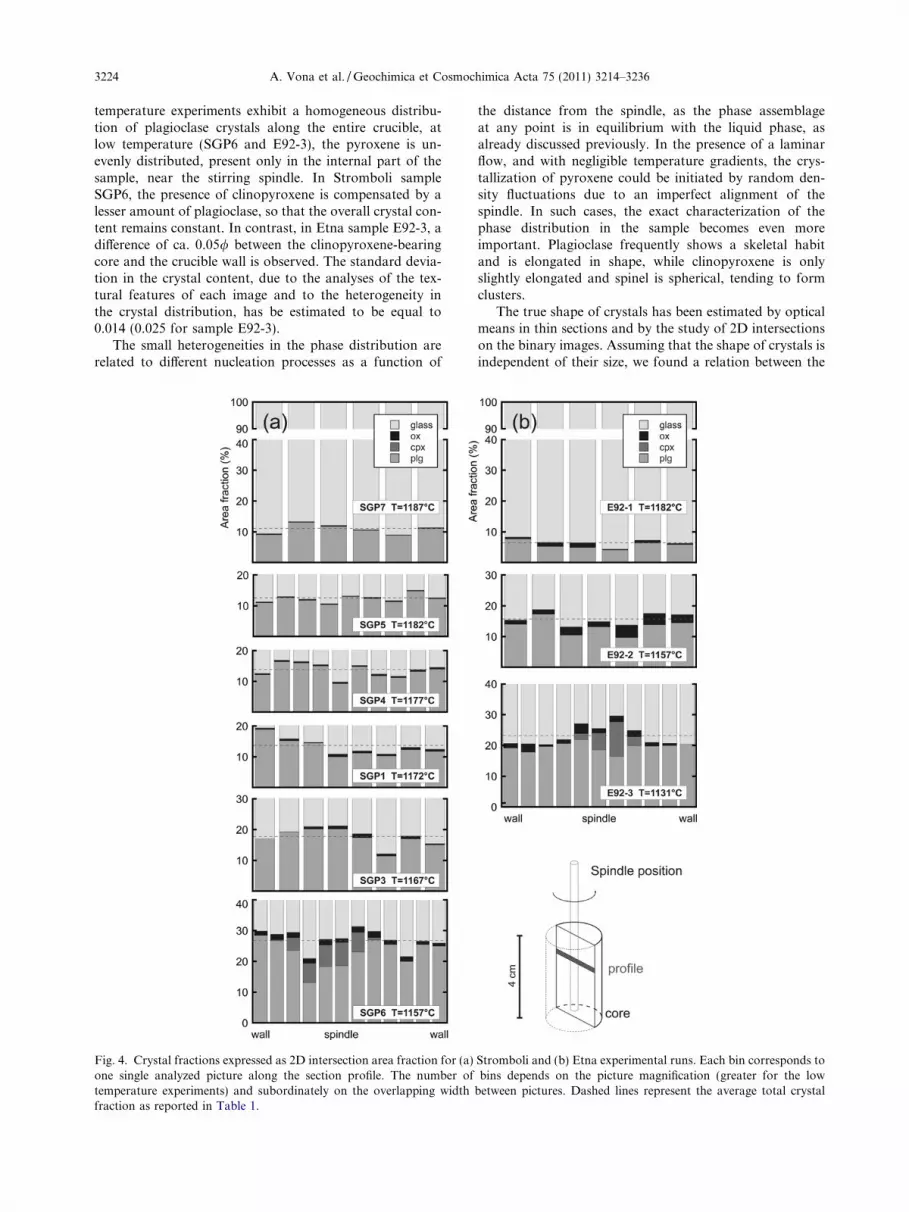
temperature experiments exhibit a homogeneous distribu-tion of plagioclase crystals along the entire crucible, atlow temperature (SGP6 and E92-3), the pyroxene is un-evenly distributed, present only in the internal part of thesample, near the stirring spindle. In Stromboli sampleSGP6, the presence of clinopyroxene is compensated by alesser amount of plagioclase, so that the overall crystal con-tent remains constant. In contrast, in Etna sample E92-3, adifference of ca. 0.05/ between the clinopyroxene-bearingcore and the crucible wall is observed. The standard devia-tion in the crystal content, due to the analyses of the tex-tural features of each image and to the heterogeneity inthe crystal distribution, has be estimated to be equal to0.014 (0.025 for sample E92-3).
The small heterogeneities in the phase distribution arerelated to different nucleation processes as a function of
Fig. 4. Crystal fractions expressed as 2D intersection area fraction for (a)one single analyzed picture along the section profile. The number oftemperature experiments) and subordinately on the overlapping widthfraction as reported in Table 1.
the distance from the spindle, as the phase assemblageat any point is in equilibrium with the liquid phase, asalready discussed previously. In the presence of a laminarflow, and with negligible temperature gradients, the crys-tallization of pyroxene could be initiated by random den-sity fluctuations due to an imperfect alignment of thespindle. In such cases, the exact characterization of thephase distribution in the sample becomes even moreimportant. Plagioclase frequently shows a skeletal habitand is elongated in shape, while clinopyroxene is onlyslightly elongated and spinel is spherical, tending to formclusters.
The true shape of crystals has been estimated by opticalmeans in thin sections and by the study of 2D intersectionson the binary images. Assuming that the shape of crystals isindependent of their size, we found a relation between the
Stromboli and (b) Etna experimental runs. Each bin corresponds tobins depends on the picture magnification (greater for the low
between pictures. Dashed lines represent the average total crystal

Fig. 5. Frequency distribution of 2D interception width/length (w/l) ratios of plagioclase (a–d) and clinopyroxene (e and f) crystals, cut onsections parallel to the spindle direction. (a–d) High and low temperature plagioclase interception for Stromboli (a and c) and Etna (b and d).A decrease in the mode value with decreasing temperature is observed on both starting materials. (e and f) Clinopyroxene interceptiondistributions observed at low temperature experiments on both Stromboli and Etna indicate a less elongated shape.
Rheology of crystal-bearing magmas from Stromboli and Etna 3225
axis measured on selected oriented crystals and the mode ofthe width/length ratio of all crystal intersection through theplane oriented parallel to the spindle direction (Fig. 5). Forplagioclase, although the shape of the curves remains al-most constant, a slight decrease in the mode value can beobserved (from 0.16 to 0.12) as the temperature decreases,which we interpret as indicative of increasing average aspectratio from ca. 7 to 8.3. Clinopyroxene and spinel are moreequant and have average aspect ratios of 2 and 1,respectively.
Plagioclase crystals tend to be aligned according to theflow direction at low temperature as shown in Fig. 6, wherethe high-intermediate- and low-temperature experiments onStromboli are reported (SGP7, SGP4 and SGP6, respec-tively). The orientation of the particles could be due to par-ticle rotation in shearing flow. At lower T, where both
volume fraction and aspect ratio of the plagioclase crystalare higher, we observe a slightly higher alignment of parti-cles. This agrees well with the observation (Mueller et al.,2010) that the expected particle orientation distribution isa function of aspect ratio: more anisotropic particles rotatefaster when perpendicular to the flow lines (therefore spend-ing less time in this position) and slower when aligned to theflow lines (more time). We observe statistically a higher pro-portion of aligned particles in the case of more elongatedcrystals (low T) than in the case of more equant particle(high T) as illustrated in Fig. 6. At equilibrium conditions,the viscosity response to rotational speed variation is imme-diate, and no shear weakening behavior (decrease in viscos-ity with time) is observed. We infer that, at equilibriumconditions, the orientation of crystals does not change withtime.
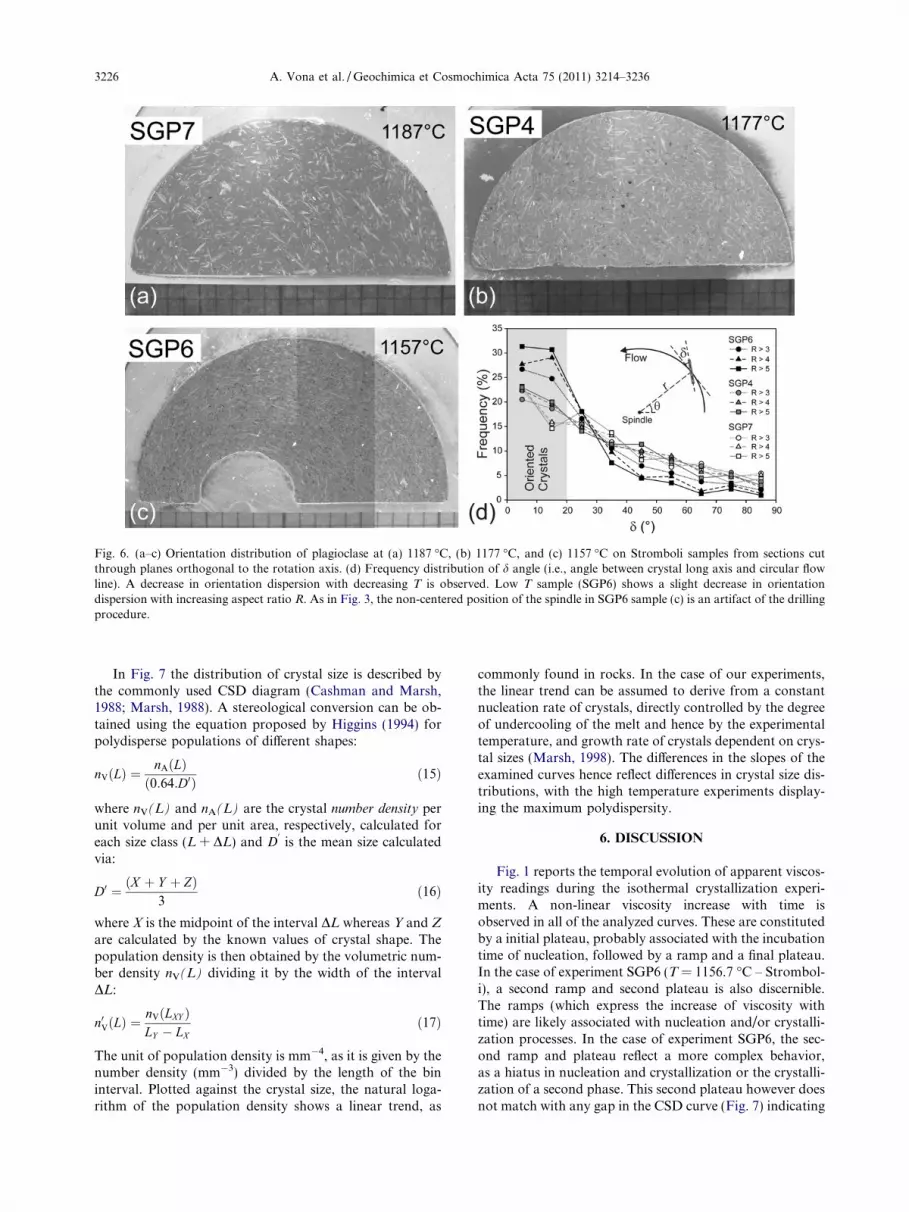
Fig. 6. (a–c) Orientation distribution of plagioclase at (a) 1187 �C, (b) 1177 �C, and (c) 1157 �C on Stromboli samples from sections cutthrough planes orthogonal to the rotation axis. (d) Frequency distribution of d angle (i.e., angle between crystal long axis and circular flowline). A decrease in orientation dispersion with decreasing T is observed. Low T sample (SGP6) shows a slight decrease in orientationdispersion with increasing aspect ratio R. As in Fig. 3, the non-centered position of the spindle in SGP6 sample (c) is an artifact of the drillingprocedure.
3226 A. Vona et al. / Geochimica et Cosmochimica Acta 75 (2011) 3214–3236
In Fig. 7 the distribution of crystal size is described bythe commonly used CSD diagram (Cashman and Marsh,1988; Marsh, 1988). A stereological conversion can be ob-tained using the equation proposed by Higgins (1994) forpolydisperse populations of different shapes:
nVðLÞ ¼nAðLÞð0:64:D0Þ ð15Þ
where nV(L) and nA(L) are the crystal number density perunit volume and per unit area, respectively, calculated foreach size class (L + DL) and D
0is the mean size calculated
via:
D0 ¼ ðX þ Y þ ZÞ3
ð16Þ
where X is the midpoint of the interval DL whereas Y and Z
are calculated by the known values of crystal shape. Thepopulation density is then obtained by the volumetric num-ber density nV(L) dividing it by the width of the intervalDL:
n0VðLÞ ¼nVðLXY ÞLY � LX
ð17Þ
The unit of population density is mm�4, as it is given by thenumber density (mm�3) divided by the length of the bininterval. Plotted against the crystal size, the natural loga-rithm of the population density shows a linear trend, as
commonly found in rocks. In the case of our experiments,the linear trend can be assumed to derive from a constantnucleation rate of crystals, directly controlled by the degreeof undercooling of the melt and hence by the experimentaltemperature, and growth rate of crystals dependent on crys-tal sizes (Marsh, 1998). The differences in the slopes of theexamined curves hence reflect differences in crystal size dis-tributions, with the high temperature experiments display-ing the maximum polydispersity.
6. DISCUSSION
Fig. 1 reports the temporal evolution of apparent viscos-ity readings during the isothermal crystallization experi-ments. A non-linear viscosity increase with time isobserved in all of the analyzed curves. These are constitutedby a initial plateau, probably associated with the incubationtime of nucleation, followed by a ramp and a final plateau.In the case of experiment SGP6 (T = 1156.7 �C – Strombol-i), a second ramp and second plateau is also discernible.The ramps (which express the increase of viscosity withtime) are likely associated with nucleation and/or crystalli-zation processes. In the case of experiment SGP6, the sec-ond ramp and plateau reflect a more complex behavior,as a hiatus in nucleation and crystallization or the crystalli-zation of a second phase. This second plateau however doesnot match with any gap in the CSD curve (Fig. 7) indicating

Fig. 7. Crystal size distribution diagram of plagioclase crystals for Stromboli (a) and Etna (b) experimental runs. The dispersion of crystalsizes decrease with temperature as shown by the decreasing of the slope of the linear regression (solid lines, Table 3).
Rheology of crystal-bearing magmas from Stromboli and Etna 3227
that the nucleation of a second phase (clinopyroxene)rather than a pulsatory behavior in the crystallization pro-cess is the more likely explanation. The lengths and shapesof plateaus and ramps describing the viscosity variationwith time for all experiments do not correlate simply withtemperature. A further potential complication affectingthe shape of the apparent viscosity–time curve is given bythe deformation regime during crystallization. As men-
tioned above, the viscometer automatically halves the rota-tional speed when the torque reaches its maximum valueduring viscosity increase, thus yielding different strain ratevs. time patterns, which in turn may influence crystalliza-tion kinetics at the different stages. The change in the crys-tallization pattern induced by halving the strain rate couldresult in a viscosity variation and possibly be recorded inthe slope of the viscosity–time curve. However, within the

3228 A. Vona et al. / Geochimica et Cosmochimica Acta 75 (2011) 3214–3236
sensitivity of our measurements, we do not observe anyappreciable systematic variation of viscosity vs. time vs.strain rate (shown as rotational speed in Fig. 1) which couldbe related to this mechanism.
Measurements were terminated when a stable value ofapparent viscosity was achieved. At the equilibrium condi-tions, T trends correlate perfectly with both viscosity andcrystal content, as high temperatures correspond to lowerviscosity and lower crystal contents (Table 1). The experi-mental time needed to achieve a steady value was longerfor Etna than for the Stromboli samples, up to 4.8 � 105 sfor the highest temperature experiment (T = 1182.4 �C).Such differences in steady state achievement time mightbe attributed to slower crystallization kinetics in Etna trac-hybasalt, due to lower initial deformation rates (=0.5 s�1)and higher incubation times for crystal nuclei (Kouchi
Fig. 8. (a) Flow consistency K (equal to Newtonian viscosity at _c = 1 stemperatures. The measured pure liquid viscosities at high and low T arcircles) and from Giordano and Dingwell (2003) for Etna (gray squares). Dline), Giordano et al. (2008; GRD, dashed lines) and with the equatiomeasurements on Stromboli (black circles) and Etna (white squares) are aand models from Giordano et al. (2008; GRD) and equation obtained bbetter reproduce the experimental data compared to the GRD model. (suspensions. The subliquidus measurements on Stromboli (black circlesdeparture from the pure liquid viscosity of the starting material. Also repocalculated with the GRD model with a 0.2 log units correction (see texStromboli (black circles) and Etna (white squares) are plotted against the rbehavior with decreasing temperature.
et al., 1986). We cannot rule out that at longer measure-ment times, crystallization could proceed leading to furtherviscosity increases, (especially for the lower temperatureexperiments). However, it should be stressed that theachievement of phase equilibria is not the aim of this studyand that on the contrary, rheological equilibrium, in theform of stable values of apparent viscosity, was reachedin all experiments.
The chemical and textural analyses performed on thepost-run charges correspond only to the final stable viscos-ity readings. The transient behavior, i.e., the plateaus andramps related to the crystallizing liquid are not furtherinvestigated in this paper.
The net effect of crystals on the viscosities of magmaticsuspensions is commonly expressed in terms of relative vis-cosities, defined as the ratio between the measured apparent
�1) and viscosity of the investigated basalts against the reciprocale from Giordano et al. (2006) and the present for Stromboli (gray
ata are compared to the viscosity models from Shaw (1972; dottedn obtained by Giordano et al. (2009; solid lines). The subliquidus
lso reported. (b) Low T liquid viscosity data for Stromboli and Etnay Giordano et al. (2009). The equations of Giordano et al. (2009)c) High T viscosity of the liquid and consistency of the magmatic) and Etna (white squares) are also reported and show a strongrted the viscosity of the residual melt composition as a function of T
t). (d) The flow index (n) values of subliquidus measurements oneciprocal temperatures, showing the onset of a slight shear-thinning
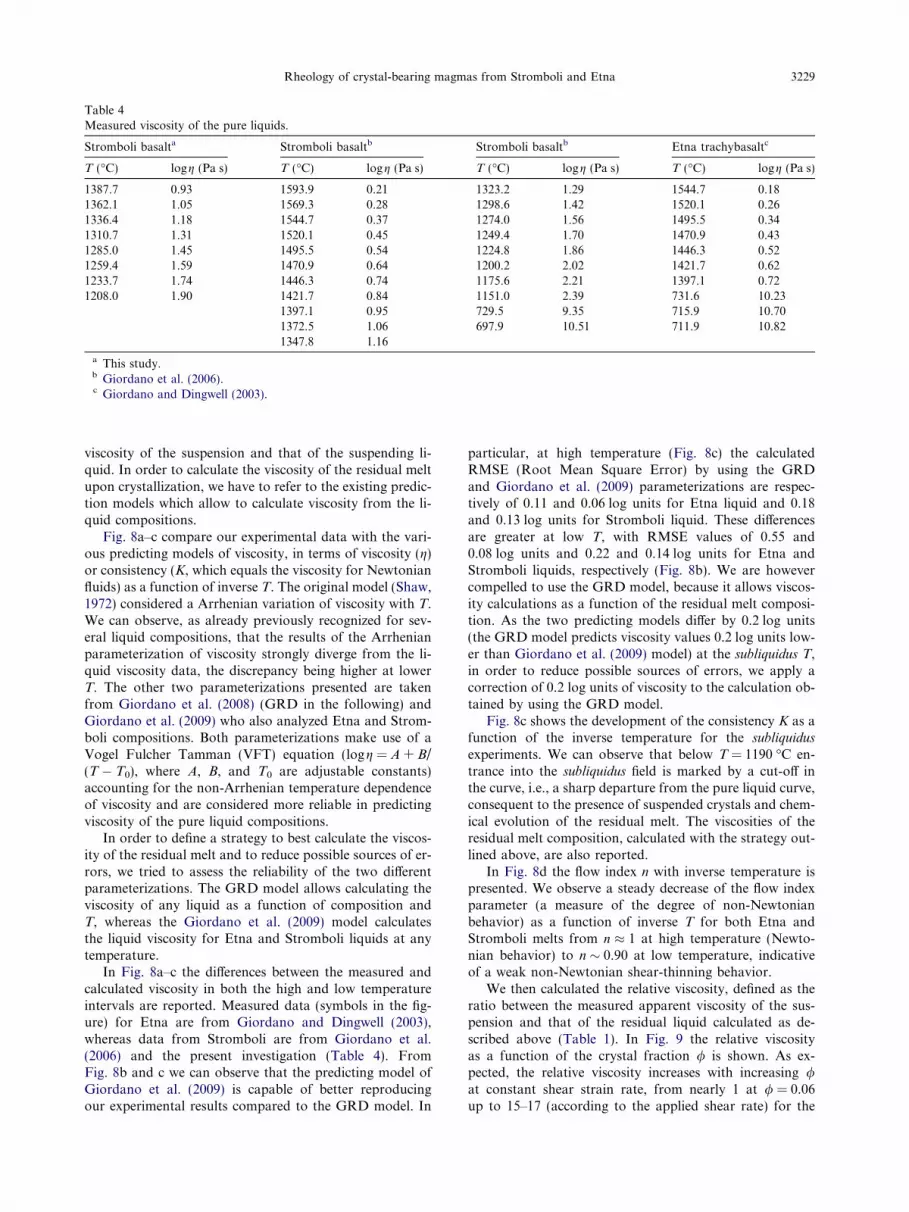
Table 4Measured viscosity of the pure liquids.
Stromboli basalta Stromboli basaltb Stromboli basaltb Etna trachybasaltc
T (�C) logg (Pa s) T (�C) logg (Pa s) T (�C) logg (Pa s) T (�C) logg (Pa s)
1387.7 0.93 1593.9 0.21 1323.2 1.29 1544.7 0.181362.1 1.05 1569.3 0.28 1298.6 1.42 1520.1 0.261336.4 1.18 1544.7 0.37 1274.0 1.56 1495.5 0.341310.7 1.31 1520.1 0.45 1249.4 1.70 1470.9 0.431285.0 1.45 1495.5 0.54 1224.8 1.86 1446.3 0.521259.4 1.59 1470.9 0.64 1200.2 2.02 1421.7 0.621233.7 1.74 1446.3 0.74 1175.6 2.21 1397.1 0.721208.0 1.90 1421.7 0.84 1151.0 2.39 731.6 10.23
1397.1 0.95 729.5 9.35 715.9 10.701372.5 1.06 697.9 10.51 711.9 10.821347.8 1.16
a This study.b Giordano et al. (2006).c Giordano and Dingwell (2003).
Rheology of crystal-bearing magmas from Stromboli and Etna 3229
viscosity of the suspension and that of the suspending li-quid. In order to calculate the viscosity of the residual meltupon crystallization, we have to refer to the existing predic-tion models which allow to calculate viscosity from the li-quid compositions.
Fig. 8a–c compare our experimental data with the vari-ous predicting models of viscosity, in terms of viscosity (g)or consistency (K, which equals the viscosity for Newtonianfluids) as a function of inverse T. The original model (Shaw,1972) considered a Arrhenian variation of viscosity with T.We can observe, as already previously recognized for sev-eral liquid compositions, that the results of the Arrhenianparameterization of viscosity strongly diverge from the li-quid viscosity data, the discrepancy being higher at lowerT. The other two parameterizations presented are takenfrom Giordano et al. (2008) (GRD in the following) andGiordano et al. (2009) who also analyzed Etna and Strom-boli compositions. Both parameterizations make use of aVogel Fulcher Tamman (VFT) equation (logg = A + B/(T � T0), where A, B, and T0 are adjustable constants)accounting for the non-Arrhenian temperature dependenceof viscosity and are considered more reliable in predictingviscosity of the pure liquid compositions.
In order to define a strategy to best calculate the viscos-ity of the residual melt and to reduce possible sources of er-rors, we tried to assess the reliability of the two differentparameterizations. The GRD model allows calculating theviscosity of any liquid as a function of composition andT, whereas the Giordano et al. (2009) model calculatesthe liquid viscosity for Etna and Stromboli liquids at anytemperature.
In Fig. 8a–c the differences between the measured andcalculated viscosity in both the high and low temperatureintervals are reported. Measured data (symbols in the fig-ure) for Etna are from Giordano and Dingwell (2003),whereas data from Stromboli are from Giordano et al.(2006) and the present investigation (Table 4). FromFig. 8b and c we can observe that the predicting model ofGiordano et al. (2009) is capable of better reproducingour experimental results compared to the GRD model. In
particular, at high temperature (Fig. 8c) the calculatedRMSE (Root Mean Square Error) by using the GRDand Giordano et al. (2009) parameterizations are respec-tively of 0.11 and 0.06 log units for Etna liquid and 0.18and 0.13 log units for Stromboli liquid. These differencesare greater at low T, with RMSE values of 0.55 and0.08 log units and 0.22 and 0.14 log units for Etna andStromboli liquids, respectively (Fig. 8b). We are howevercompelled to use the GRD model, because it allows viscos-ity calculations as a function of the residual melt composi-tion. As the two predicting models differ by 0.2 log units(the GRD model predicts viscosity values 0.2 log units low-er than Giordano et al. (2009) model) at the subliquidus T,in order to reduce possible sources of errors, we apply acorrection of 0.2 log units of viscosity to the calculation ob-tained by using the GRD model.
Fig. 8c shows the development of the consistency K as afunction of the inverse temperature for the subliquidus
experiments. We can observe that below T = 1190 �C en-trance into the subliquidus field is marked by a cut-off inthe curve, i.e., a sharp departure from the pure liquid curve,consequent to the presence of suspended crystals and chem-ical evolution of the residual melt. The viscosities of theresidual melt composition, calculated with the strategy out-lined above, are also reported.
In Fig. 8d the flow index n with inverse temperature ispresented. We observe a steady decrease of the flow indexparameter (a measure of the degree of non-Newtonianbehavior) as a function of inverse T for both Etna andStromboli melts from n � 1 at high temperature (Newto-nian behavior) to n � 0.90 at low temperature, indicativeof a weak non-Newtonian shear-thinning behavior.
We then calculated the relative viscosity, defined as theratio between the measured apparent viscosity of the sus-pension and that of the residual liquid calculated as de-scribed above (Table 1). In Fig. 9 the relative viscosityas a function of the crystal fraction / is shown. As ex-pected, the relative viscosity increases with increasing /at constant shear strain rate, from nearly 1 at / = 0.06up to 15–17 (according to the applied shear rate) for the
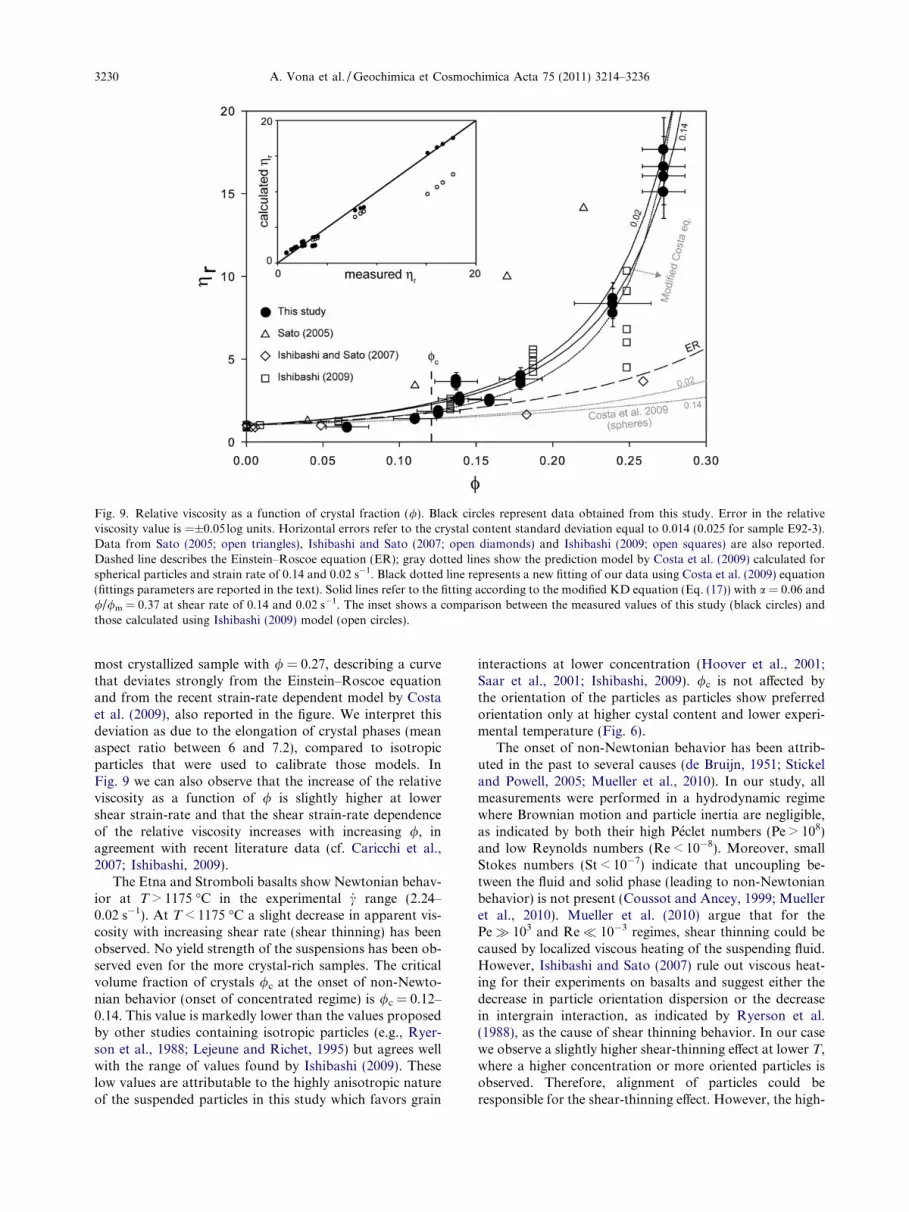
Fig. 9. Relative viscosity as a function of crystal fraction (/). Black circles represent data obtained from this study. Error in the relativeviscosity value is =±0.05log units. Horizontal errors refer to the crystal content standard deviation equal to 0.014 (0.025 for sample E92-3).Data from Sato (2005; open triangles), Ishibashi and Sato (2007; open diamonds) and Ishibashi (2009; open squares) are also reported.Dashed line describes the Einstein–Roscoe equation (ER); gray dotted lines show the prediction model by Costa et al. (2009) calculated forspherical particles and strain rate of 0.14 and 0.02 s�1. Black dotted line represents a new fitting of our data using Costa et al. (2009) equation(fittings parameters are reported in the text). Solid lines refer to the fitting according to the modified KD equation (Eq. (17)) with a = 0.06 and///m = 0.37 at shear rate of 0.14 and 0.02 s�1. The inset shows a comparison between the measured values of this study (black circles) andthose calculated using Ishibashi (2009) model (open circles).
3230 A. Vona et al. / Geochimica et Cosmochimica Acta 75 (2011) 3214–3236
most crystallized sample with / = 0.27, describing a curvethat deviates strongly from the Einstein–Roscoe equationand from the recent strain-rate dependent model by Costaet al. (2009), also reported in the figure. We interpret thisdeviation as due to the elongation of crystal phases (meanaspect ratio between 6 and 7.2), compared to isotropicparticles that were used to calibrate those models. InFig. 9 we can also observe that the increase of the relativeviscosity as a function of / is slightly higher at lowershear strain-rate and that the shear strain-rate dependenceof the relative viscosity increases with increasing /, inagreement with recent literature data (cf. Caricchi et al.,2007; Ishibashi, 2009).
The Etna and Stromboli basalts show Newtonian behav-ior at T > 1175 �C in the experimental _c range (2.24–0.02 s�1). At T < 1175 �C a slight decrease in apparent vis-cosity with increasing shear rate (shear thinning) has beenobserved. No yield strength of the suspensions has been ob-served even for the more crystal-rich samples. The criticalvolume fraction of crystals /c at the onset of non-Newto-nian behavior (onset of concentrated regime) is /c = 0.12–0.14. This value is markedly lower than the values proposedby other studies containing isotropic particles (e.g., Ryer-son et al., 1988; Lejeune and Richet, 1995) but agrees wellwith the range of values found by Ishibashi (2009). Theselow values are attributable to the highly anisotropic natureof the suspended particles in this study which favors grain
interactions at lower concentration (Hoover et al., 2001;Saar et al., 2001; Ishibashi, 2009). /c is not affected bythe orientation of the particles as particles show preferredorientation only at higher cystal content and lower experi-mental temperature (Fig. 6).
The onset of non-Newtonian behavior has been attrib-uted in the past to several causes (de Bruijn, 1951; Stickeland Powell, 2005; Mueller et al., 2010). In our study, allmeasurements were performed in a hydrodynamic regimewhere Brownian motion and particle inertia are negligible,as indicated by both their high Peclet numbers (Pe > 108)and low Reynolds numbers (Re < 10�8). Moreover, smallStokes numbers (St < 10�7) indicate that uncoupling be-tween the fluid and solid phase (leading to non-Newtonianbehavior) is not present (Coussot and Ancey, 1999; Muelleret al., 2010). Mueller et al. (2010) argue that for thePe� 103 and Re 10�3 regimes, shear thinning could becaused by localized viscous heating of the suspending fluid.However, Ishibashi and Sato (2007) rule out viscous heat-ing for their experiments on basalts and suggest either thedecrease in particle orientation dispersion or the decreasein intergrain interaction, as indicated by Ryerson et al.(1988), as the cause of shear thinning behavior. In our casewe observe a slightly higher shear-thinning effect at lower T,where a higher concentration or more oriented particles isobserved. Therefore, alignment of particles could beresponsible for the shear-thinning effect. However, the high-
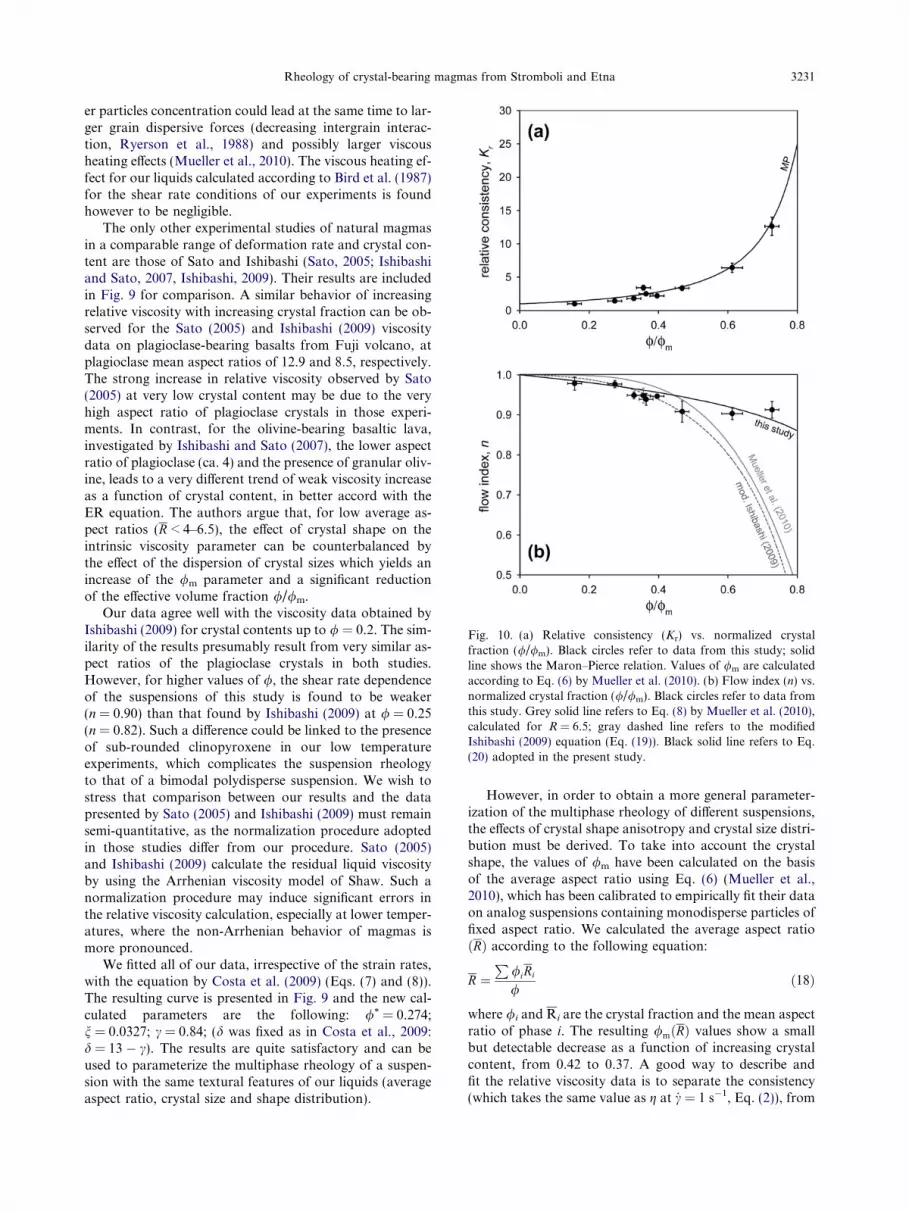
Fig. 10. (a) Relative consistency (Kr) vs. normalized crystalfraction (///m). Black circles refer to data from this study; solidline shows the Maron–Pierce relation. Values of /m are calculatedaccording to Eq. (6) by Mueller et al. (2010). (b) Flow index (n) vs.normalized crystal fraction (///m). Black circles refer to data fromthis study. Grey solid line refers to Eq. (8) by Mueller et al. (2010),calculated for R = 6.5; gray dashed line refers to the modifiedIshibashi (2009) equation (Eq. (19)). Black solid line refers to Eq.(20) adopted in the present study.
Rheology of crystal-bearing magmas from Stromboli and Etna 3231
er particles concentration could lead at the same time to lar-ger grain dispersive forces (decreasing intergrain interac-tion, Ryerson et al., 1988) and possibly larger viscousheating effects (Mueller et al., 2010). The viscous heating ef-fect for our liquids calculated according to Bird et al. (1987)for the shear rate conditions of our experiments is foundhowever to be negligible.
The only other experimental studies of natural magmasin a comparable range of deformation rate and crystal con-tent are those of Sato and Ishibashi (Sato, 2005; Ishibashiand Sato, 2007, Ishibashi, 2009). Their results are includedin Fig. 9 for comparison. A similar behavior of increasingrelative viscosity with increasing crystal fraction can be ob-served for the Sato (2005) and Ishibashi (2009) viscositydata on plagioclase-bearing basalts from Fuji volcano, atplagioclase mean aspect ratios of 12.9 and 8.5, respectively.The strong increase in relative viscosity observed by Sato(2005) at very low crystal content may be due to the veryhigh aspect ratio of plagioclase crystals in those experi-ments. In contrast, for the olivine-bearing basaltic lava,investigated by Ishibashi and Sato (2007), the lower aspectratio of plagioclase (ca. 4) and the presence of granular oliv-ine, leads to a very different trend of weak viscosity increaseas a function of crystal content, in better accord with theER equation. The authors argue that, for low average as-pect ratios (R < 4–6.5), the effect of crystal shape on theintrinsic viscosity parameter can be counterbalanced bythe effect of the dispersion of crystal sizes which yields anincrease of the /m parameter and a significant reductionof the effective volume fraction ///m.
Our data agree well with the viscosity data obtained byIshibashi (2009) for crystal contents up to / = 0.2. The sim-ilarity of the results presumably result from very similar as-pect ratios of the plagioclase crystals in both studies.However, for higher values of /, the shear rate dependenceof the suspensions of this study is found to be weaker(n = 0.90) than that found by Ishibashi (2009) at / = 0.25(n = 0.82). Such a difference could be linked to the presenceof sub-rounded clinopyroxene in our low temperatureexperiments, which complicates the suspension rheologyto that of a bimodal polydisperse suspension. We wish tostress that comparison between our results and the datapresented by Sato (2005) and Ishibashi (2009) must remainsemi-quantitative, as the normalization procedure adoptedin those studies differ from our procedure. Sato (2005)and Ishibashi (2009) calculate the residual liquid viscosityby using the Arrhenian viscosity model of Shaw. Such anormalization procedure may induce significant errors inthe relative viscosity calculation, especially at lower temper-atures, where the non-Arrhenian behavior of magmas ismore pronounced.
We fitted all of our data, irrespective of the strain rates,with the equation by Costa et al. (2009) (Eqs. (7) and (8)).The resulting curve is presented in Fig. 9 and the new cal-culated parameters are the following: /* = 0.274;n = 0.0327; c = 0.84; (d was fixed as in Costa et al., 2009:d = 13 � c). The results are quite satisfactory and can beused to parameterize the multiphase rheology of a suspen-sion with the same textural features of our liquids (averageaspect ratio, crystal size and shape distribution).
However, in order to obtain a more general parameter-ization of the multiphase rheology of different suspensions,the effects of crystal shape anisotropy and crystal size distri-bution must be derived. To take into account the crystalshape, the values of /m have been calculated on the basisof the average aspect ratio using Eq. (6) (Mueller et al.,2010), which has been calibrated to empirically fit their dataon analog suspensions containing monodisperse particles offixed aspect ratio. We calculated the average aspect ratioðRÞ according to the following equation:
R ¼P
/iRi
/ð18Þ
where /i and Ri are the crystal fraction and the mean aspectratio of phase i. The resulting /mðRÞ values show a smallbut detectable decrease as a function of increasing crystalcontent, from 0.42 to 0.37. A good way to describe andfit the relative viscosity data is to separate the consistency(which takes the same value as g at _c = 1 s�1, Eq. (2)), from

3232 A. Vona et al. / Geochimica et Cosmochimica Acta 75 (2011) 3214–3236
n, which captures the role of shear thinning. In this way, thetwo separate contributions to viscosity are easily visualizedand the relative viscosity can then be obtained by the com-bination of these two quantities.
The relative consistencies (Kr = K/gl) are reported inFig. 10a as a function of the calculated ///m. With this rep-resentation, all our measured values collapse onto the curveusing the Maron–Pierce equation confirming that crystalshape is a first order parameter that affects the increase insuspension viscosity, through the dependency of axial ratioon /m, compared to other observed textural parameters.The effects of the observed crystal size distributions andthat of the orientation dispersions on /m appear to be neg-ligible compared to the effect of crystal shape. In fact, all ofour measured values and the Mueller et al. (2010) data per-taining to monodisperse particles present different crystalsize distributions and orientation dispersions and despitethis, they all converge into a single master curve relating as-pect ratio to suspension consistencies.
As illustrated previously (Fig. 8d), with increasing crys-tallization a weak shear thinning (n < 1) effect has been ob-served. The observed values of flow index (n) as a functionof crystal fraction are shown in Fig. 10b. In Fig. 10b theequation proposed by Mueller et al. (2010, Eq. (8)) for aR = 6.5 is also reported. Moreover, from the equation pro-posed by Ishibashi (2009, Eq. (9)) a relation for n(///m)can be derived if B/m = 2 is assumed (as in MP-equation)as:
n ¼ 1� 2k ln 1� //m
� �� �2
ð19Þ
where k = 0.118 as in the Ishibashi (2009) study. Eq. (19) isalso reported in Fig. 10b.
Our data are consistent with both equations, except atcrystal content ///m > 0.5. The reason for this discrepancyis probably the difference in the suspensions of the studies,therefore differences in crystal size, crystal shape and orien-tation distribution, although those dependencies are diffi-cult to constrain. Whereas the consistency of theinvestigated suspensions seem to be perfectly described byonly one parameter, /m, which in turn is only affected bythe crystal shape, the non-Newtonian character of the sus-pension has indeed a more complex relation with the tex-tural features of the suspension. We empirically fitted ourdata in Fig. 10b to the following equation:
n ¼ 1þ 2a log 1� //m
� �ð20Þ
We stress that given the paucity of existing experimentaldata on polydisperse suspensions, a general functional formfor the effect of textural parameters on the non-Newtoniancharacter of the suspension does not exist nor can one beprovided at the moment. This equation is only valid forour specific polydispersity, as far as the non-Newtoniancharacter is concerned.
To visualize the results of the parameterization in termsof relative viscosity and to allow a easier comparison withliterature data, we combined the two equations (7) and(20) for consistency and n, into a general equation. From
the comparison of Eqs. (2) and (5), we obtain the followingequation (Ishibashi, 2009):
�B/m ¼logðKrÞ
log 1� //m
� �þ ðn� 1Þ log _c
log 1� //m
� � ð21Þ
Substitution of Eqs. (7) and (20) into Eq. (21) produces theexpression:
�B/m ¼ �2½1� a logð _cÞ� ð22Þ
Substituting Eq. (22) into the KD equation (Eq. (5)) the fol-lowing general expression can be derived:
gr ¼ 1� //m
� ��2½1�a logð _cÞ�
ð23Þ
Eq. (23) was used to fit our data leaving a as an adjust-able parameter, in order to account for errors due to theMaron–Pierce approximation (B/m = 2) and errors dueto the calculation of the flow index n. The /m values werecalculated using Eq. (6), which takes into account the crys-tal shape factor. The a value obtained is =0.06 withR2 = 0.995. The results of the modeling are reported inFig. 9 for the low T strain rates (where shear thinning ef-fects are visible). The quality of the fitting is difficult to visu-alize in this type of representation as neither strain ratevariations nor /m variations are visible. As an example,two curves are shown, referring to maximum and minimumshear strain rates and /m conditions of the low T data ofStromboli liquids.
In the insert, calculated vs. measured relative viscositiesfor our data are reported using the modeling presented hereand the Ishibashi (2009) model. As it can be seen, the modelequation reproduces very well all the experimental data. Athigh crystal content, the Ishibashi (2009) model underesti-mates the relative viscosity in comparison with our data.The discrepancy between the two model equations is dueto the use of a fixed /m = 0.6 in the Ishibashi (2009) param-eterization. Decreasing values of /m as the particles becomemore elongated, as parameterized in Eq. (6), yields a highervalue of relative viscosity with respect to that predicted byIshibashi (2009).
We stress that the differences in the various functionalform of the equation presented in Fig. 10b refers only toshear thinning effects which, in the case of our experiments,are minor compared to the effect of crystals on consistency.
Our results demonstrate that the crystal shape factor isof paramount importance, through the /m dependency onaspect ratio, in influencing the rheological behavior of acrystal-bearing magma and thus should not be neglected.Any numerical simulation of magma dynamics should takeinto account the shape of crystals as it can drastically affectthe rheological behavior and hence the eruptive style of avolcano (explosive vs. effusive). The effects of crystal sizedispersion, crystal shape dispersion (bimodal in our lowtemperature experiments) and orientation dispersion seemto be minor on /m and therefore K, but can be incorporatedin the a parameter, which in turn controls the shear-ratedependence of the magma suspension rheology. Furtherexperiments with different crystal size and crystal shape dis-
Rheology of crystal-bearing magmas from Stromboli and Etna 3233
persion will be needed, in order to evaluate such a depen-dency for different suspensions.
Compared to previous studies on the high temperaturerheological behavior of magmatic suspensions (Sato,2005; Ishibashi and Sato, 2007; Ishibashi, 2009), the meth-od we utilize in this study allows better control of importantexperimental constraints: (1) continuous viscosity readingsduring isothermal crystallization allow detection of theachievement of a constant viscosity value with time, indic-ative of equilibrium in the crystallization process. At thesestable conditions, it is safe to perform measurements undervarying deformation regimes, as the changes of the suspen-sion features (driven by crystallization) are negligible; (2)textural features of crystal phases are not perturbed fromperiodically inserting and removing the measuring spindlewith varying experimental conditions. In this manner, timedependent behavior (thixotropy), caused by rearrangementof elongated particles and possible disequilibrium condi-tions caused by re-crystallization due to spindle insertioncan be minimized. (3) the present method also allows foranalysis of nearly the entire post run product, whose tex-tural attributes can be thus accurately characterized.
7. SUMMARY
Viscosity measurements have been performed on basal-tic melts from Stromboli and Etna during crystallization.At the investigated subliquidus temperatures(1131 �C < T < 1187 �C) a strong increase in viscosity hasbeen observed as a consequence of the presence of crystals(/ = 0.06–0.27). At T > 1175 �C and / up to 0.12–0.14both studied compositions behave as Newtonian liquids,while at lower temperature, the increase in crystal contentleads to the onset of a weak shear thinning behavior(n = 0.9). A strong departure from the well-known(strain-rate independent) Einstein–Roscoe equation andfrom the strain-rate dependent model by Costa et al.(2009) for spherical particles has been observed. The originof this discrepancy is ascribed primarily to the effect ofelongated plagioclase in increasing crystal interactions atlow /.
The effect of crystal shape can be evaluated using theequation proposed by Mueller et al. (2010) to derive the va-lue of /m assuming a mean aspect ratio R. Such a depen-dence can be modeled effectively with a Maron–Pierceequation (Maron and Pierce, 1956). Using this representa-tion we confirm that crystal shape is a first order parameterthat affects the increase in suspension viscosity (relative toother observed textural parameters). The crystal size distri-bution and crystal shape heterogeneity (at low T experi-ments) could be controlling parameters of the strain-ratedependence of the investigated suspensions.
We present a new parameterization of the relative vis-cosity as a function of crystal content which combines theMueller et al. (2010) equation for consistency with a mod-elization of the non-Newtonian character of the liquid sus-pension which takes into account the crystal shape effectand the polydispersity of the suspension.
Crystal size distributions and crystal shape heterogene-ities are included in the a parameter, an empirical constant
which takes into account the shear thinning effect. Thecombination of these equations permits us to parameterizefor the first time the effect of crystal shape on the rheologyof natural magmatic suspensions.
The explosive vs. effusive eruptive style of a volcanostrongly depends on the rheology of magma which is in turncontrolled by the concentration and shape of crystals. Anymodeling pertaining to magma dynamics in the conduits,from convection and crystal settling in the magma chamberto volatile exsolution, degassing and fragmentation alongthe conduit and emplacement rate and dimensions of lavaand pyroclastic flows, should therefore take into accountthe complexity of the rheology of magmatic suspensions,as revealed by this study.
ACKNOWLEDGMENTS
This work has been supported by the Italian Project PRIN2007M4K94A and 2007–2011 FIRB Air Plane RBPR05B2ZJ.We like to thank E. Lewellin, A. Costa and an anonymous reviewerfor comments and suggestions that helped improve thismanuscript.
REFERENCES
Ardia P., Giordano D. and Schmidt M. W. (2008) A model for theviscosity of rhyolite as a function of H2O-content and pressure:a calibration based on centrifuge piston cylinder experiments.Geochim. Cosmochim. Acta 72, 6103–6123.
Armienti P., Clocchiatti R., D’Orazio M., Innocenti F., Petrini R.,Pompilio M., Tonarini S. and Villari L. (1994) The long-standing 1991–1993 Mount Etna eruption: petrography andgeochemistry of lavas. Acta Vulcanol. 4, 15–28.
Armienti P., Francalanci L. and Landi P. (2007) Textural effects ofsteady state behaviour of the Stromboli feeding system. J.
Volcanol. Geoth. Res. 160, 86–98.
Bird R. B., Armstrong R. C. and Hassager O. (1987) Dynamics of
Polymeric Liquids: Vol. 1. Fluid Mechanics. Wiley and Sons,New York, NY.
Bruckner R. and Deubener J. (1997) Description and interpretationof the two phase flow behaviour of melts with suspendedcrystals. J. Non-Cryst. Solids 209, 283–291.
Calvari S., Coltelli M., Neri M., Pompilio M. and Scrivano V.(1994) The 1991–1993 Etna eruption: chronology and lava flow-field evolution. Acta Vulcanol. 4, 1–14.
Caricchi L., Burlini L., Ulmer P., Gerya T., Vassalli M. and PapaleP. (2007) Non-Newtonian rheology of crystal-bearing magmasand implications for magma ascent dynamics. Earth Planet. Sci.
Lett. 264, 402–419.
Caricchi L., Giordano D., Burlini L., Ulmer P. and Romano C.(2008) Rheological properties of magma from the 1538 eruptionof Monte Nuovo (Phlegrean Fields, Italy): an experimentalstudy. Chem. Geol. 256, 158–171.
Cashman K. V. and Marsh B. D. (1988) Crystal size distribution(CSD) in rocks and the kinetics and dynamics of crystallization:II. Makaopuhi lava lake. Contrib. Mineral. Petrol. 99, 292–305.
Champallier R., Bystricky M. and Arbaret L. (2008) Experimentalinvestigation of magma rheology at 300 MPa: from purehydrous melt to 76 vol.% of crystals. Earth Planet. Sci. Lett.
267, 571–583.
Chong J. S., Christiansen E. B. and Baer A. D. (1971) Rheologyof concentrated suspensions. J. Appl. Polym. Sci. 15, 2007–
2021.
3234 A. Vona et al. / Geochimica et Cosmochimica Acta 75 (2011) 3214–3236
Cordonnier B., Hess K. U., Lavallee Y. and Dingwell D. B. (2009)Rheological properties of dome lavas: case study of Unzenvolcano. Earth Planet. Sci. Lett. 279, 263–272.
Costa A. (2005) Viscosity of high crystal content melts: dependenceon solid fraction. Geophys. Res. Lett. 32, L22308.
Costa A., Melnik O. and Vedeneeva E. (2007) Thermal effectsduring magma ascent in conduits. J. Geophys. Res. 112, B12205.
Costa A., Caricchi L. and Bagdassarov N. (2009) A model for therheology of particle-bearing suspensions and partially moltenrocks. Geochem. Geophys. Geosyst. 10.
Coussot P. and Ancey A. (1999) Rheophysical classification ofconcentrated suspensions and granular pastes. Phys. Rev. E 59,
4445–4457.
de Bruijn H. (1951) General discussion. Discuss. Faraday Soc. 11,
86.
Deubener J. and Bruckner R. (1997) Influence of nucleation andcrystallisation on the rheological properties of lithium disilicatemelt. J. Non-Cryst. Solids 209, 96–111.
Dingwell D. B. (1986) Viscosity–temperature relationships in thesystem Na2Si2O5–Na4Al2O5. Geochim. Cosmochim. Acta 50,
1261–1265.
Dingwell D. B. (1989a) Effect of fluorine on the viscosity ofdiopside liquid. Am. Mineral. 74, 333–338.
Dingwell D. B. (1989b) Shear viscosities of ferrosilicate liquids.Am. Mineral. 74, 1038–1044.
Dingwell D. B. (1996) Volcanic dilemma: flow or blow? Science
273, 1054–1055.
Dingwell D. B. and Virgo D. (1988) Melt viscosities in the Na2O–FeO–Fe2O3–SiO2 system and factors controlling the relativeviscosities of fully polymerized silicate melts. Geochim. Cosmo-
chim. Acta 52, 395–403.
Dingwell D. B., Knoche R., Webb S. L. and Pichavant M. (1992)The effect of B2O3 on the viscosity of haplogranitic liquids. Am.
Mineral. 77, 457–461.
Dingwell D. B., Romano C. and Hess K. U. (1996) The effect ofwater on the viscosity of a haplogranitic melt under P–T–X
conditions relevant to silicic volcanism. Contrib. Mineral.
Petrol. 124, 19–28.
Doi M. and Edwards S. F. (1978) Dynamics of rod-like macro-molecules in concentrated-solution – 1. J. Chem. Soc.: Faraday
Trans. II 74, 560–570.
Donev A., Cisse I., Sachs D., Variano E., Stillinger F. H., ConnellyR., Torquato S. and Chaikin P. M. (2004) Improving thedensity of jammed disordered packings using ellipsoids. Science
303, 990–993.
Einstein A. (1906) Eine neue Bestimmung der Molekul-dimensio-nen. Ann. Phys. 19, 289–306.
Farris R. J. (1968) Prediction of the viscosity of multimodalsuspensions from unimodal viscosity data. Trans. Soc. Rheol.
12, 281–301.
Fornaciai A., Landi P. and Armienti P. (2009) Dissolution/crystallization kinetics recorded in the 2002–2003 lavas ofStromboli (Italy). Bull. Volcanol. 71, 631–641.
Francalanci L., Tommasini S., Conticelli S. and Davies G. R.(1999) Sr isotope evidence for short magma residence time forthe 20th century activity at Stromboli volcano, Italy. Earth
Planet. Sci. Lett. 167, 61–69.
Francalanci L., Tommasini S. and Conticelli S. (2004) The volcanicactivity of Stromboli in the 1906–1998 AD period: mineralog-ical, geochemical and isotope data relevant to the understand-ing of the plumbing system. J. Volcanol. Geoth. Res. 131, 179–
211.
Francalanci L., Davies G. R., Lustenhouwer W., Tommasini S.,Mason P. R. D. and Conticelli S. (2005) Intra-grain Sr isotopeevidence for crystal recycling and multiple magma reservoirs in
the recent activity of Stromboli volcano, southern Italy. J.
Petrol. 46, 1997–2021.
Giordano D. and Dingwell D. B. (2003) Non-Arrhenian multi-component melt viscosity: a model. Earth Planet. Sci. Lett. 208,
337–349.
Giordano D., Mangiacapra A., Potuzak M., Russell J. K.,Romano C., Dingwell D. B. and Di Muro A. (2006) Anexpanded non-Arrhenian model for silicate melt viscosity: atreatment for metaluminous, peraluminous and peralkalineliquids. Chem. Geol. 229, 42–56.
Giordano D., Polacci M., Longo A., Papale P., Dingwell D. B.,Boschi E. and Kasereka M. (2007) Thermo-rheological magmacontrol on the impact of highly fluid lava flows at Mt.Nyiragongo viscosity of trachytes, and comparison with bas-alts, phonolites, and rhyolites. Geophys. Res. Lett. 34, L06301.
doi:10.1029/2006GL028459.
Giordano D., Russell J. K. and Dingwell D. B. (2008) Viscosity ofmagmatic liquids: a model. Earth Planet. Sci. Lett. 271, 123–
134.
Giordano D., Ardia P., Romano C., Dingwell D. B., Di Muro A.,Schmidt M. W., Mangiacapra A. and Hess K. U. (2009) Therheological evolution of alkaline Vesuvius magmas and com-parison with alkaline series from the Phlegrean Fields, Etna,Stromboli and Teide. Geochim. Cosmochim. Acta 73, 6613–
6630.
Giordano D., Polacci M., Papale P. and Caricchi L. (2010)Rheological control on the dynamics of explosive activity in the2000 summit eruption of Mt. Etna. Solid Earth 1, 61–69.
Herschel W. H. and Bulkley R. (1926) Konsistenzmessungen vonGummi-Benzollosungen. Kolloid Z. 39, 291–300.
Hess K. U., Dingwell D. B. and Rossler E. (1996) Parameterizationof viscosity–temperature relations of aluminosilicate melts.Chem. Geol. 128, 155–163.
Higgins M. D. (1994) Numerical modeling of crystal shapes in thin-sections – estimation of crystal habit and true size. Am. Mineral.
79, 113–119.
Hoover S. R., Cashman K. V. and Manga M. (2001) The yieldstrength of subliquidus basalts – experimental results. J.
Volcanol. Geoth. Res. 107, 1–18.
Hui H. J. and Zhang Y. X. (2007) Toward a general viscosityequation for natural anhydrous and hydrous silicate melts.Geochim. Cosmochim. Acta 71, 403–416.
Ishibashi H. (2009) Non-Newtonian behavior of plagioclase-bearing basaltic magma: subliquidus viscosity measurement ofthe 1707 basalt of Fuji volcano, Japan. J. Volcanol. Geoth. Res.
181, 78–88.
Ishibashi H. and Sato H. (2007) Viscosity measurements ofsubliquidus magmas: alkali olivine basalt from the Higashi-Matsuura district, Southwest Japan. J. Volcanol. Geoth. Res.
160, 223–238.
Jeffery G. B. (1922) The motion of ellipsoidal particles immersed ina viscous fluid. Philos. Trans. R. Soc. Lond. A 102, 161–179.
Jeffrey D. J. and Acrivos A. (1976) The rheological properties ofsuspensions of rigid particles. AIChE J. 23, 417–432.
Kansal A. R., Torquato S. and Stillinger F. H. (2002) Computergeneration of dense polydisperse sphere packings. J. Chem.
Phys. 117, 8212–8218.
Kitano T., Kataoka T. and Shirota T. (1981) An empiricalequation of the relative viscosity of polymer melts filled withvarious inorganic fillers. Rheol. Acta 20, 207–209.
Kouchi A., Tsuchiyama A. and Sunagawa I. (1986) Effect ofstirring on crystallization kinetics of basalt: texture and elementpartitioning. Contrib. Mineral. Petrol. 93, 429–438.
Krieger I. M. (1972) Rheology of monodisperse latices. Adv.
Colloid Interface Sci. 3, 111–136.
Rheology of crystal-bearing magmas from Stromboli and Etna 3235
Krieger I. M. and Maron S. H. (1954) Direct determination of theflow curves of non-Newtonian fluids: III. Standardized treat-ment of viscometric data. J. Appl. Phys. 25, 72–75.
Krieger I. M. and Dougherty T. J. (1959) A mechanism for non-Newtonian flow in suspensions of rigid spheres. J. Rheol. 3,
137–152.
Landi P., Metrich N., Bertagnini A. and Rosi M. (2004) Dynamicsof magma mixing and degassing recorded in plagioclase atStromboli (Aeolian Archipelago, Italy). Contrib. Mineral.
Petrol. 147, 213–227.
Landi P., Francalanci L., Pompilio M., Rosi M., Corsaro R. A.,Petrone C. M., Nardini I. and Miraglia L. (2006) The December2002 July 2003 effusive event at Stromboli volcano, Italy:insights into the shallow plumbing system by petrochemicalstudies. J. Volcanol. Geoth. Res. 155, 263–284.
Landi P., Metrich N., Bertagnini A. and Rosi M. (2008) Recyclingand “re-hydration” of degassed magma inducing transientdissolution/crystallization events at Stromboli (Italy). J. Volc-
anol. Geoth. Res. 174, 325–336.
Landi P., Corsaro R. A., Francalanci L., Civetta L., Miraglia L.,Pompilio M. and Tesoro R. (2009) Magma dynamics during the2007 Stromboli eruption (Aeolian Islands, Italy): mineralogical,geochemical and isotopic data. J. Volcanol. Geoth. Res. 182,
255–268.
Lavallee Y., Hess K. U., Cordonnier B. and Dingwell D. B. (2007)Non-Newtonian rheological law for highly crystalline domelavas. Geology 35, 843–846.
Lavallee Y., Meredith P. G., Dingwell D. B., Hess K. U.,Wassermann J., Cordonnier B., Gerik A. and Kruhl J. H.(2008) Seismogenic lavas and explosive eruption forecasting.Nature 453, 507–510.
Lejeune A. M. and Richet P. (1995) Rheology of crystal-bearingsilicate melts – an experimental study at high viscosities. J.
Geophys. Res.: Solid Earth 100, 4215–4229.
Llewellin E. W., Mader H. M. and Wilson S. D. R. (2002) Therheology of a bubbly liquid. Philos. Trans. R. Soc. Lond. A 458,
987–1016.
Llewellin E. W. and Manga M. (2005) Bubble suspension rheologyand implications for conduit flow. J. Volcanol. Geoth. Res. 143,
205–217.
Maron S. H. and Pierce P. E. (1956) Application of ree-eyringgeneralized flow theory to suspensions of spherical particles. J.
Colloid Sci. 11, 80–95.
Marsh B. D. (1981) On the crystallinity, probability of occurrence,and rheology of lava and magma. Contrib. Mineral. Petrol. 78,
85–98.
Marsh B. D. (1988) Crystal size distribution (CSD) in rocks and thekinetics and dynamics of crystallization. Contrib. Mineral.
Petrol. 99, 277–291.
Marsh B. D. (1998) On the interpretation of crystal size distribu-tions in magmatic systems. J. Petrol. 39, 553–599.
Marti I., Hofler O., Fischer P. and Windhab E. J. (2005) Rheologyof concentrated suspensions containing mixtures of spheres andfibres. Rheol. Acta 44, 502–512.
Metrich N., Bertagnini A., Landi P. and Rosi M. (2001)Crystallization driven by decompression and water loss atStromboli volcano (Aeolian Islands, Italy). J. Petrol. 42, 1471–
1490.
Mueller S., Llewellin E. W. and Mader H. M. (2010) The rheologyof suspensions of solid particles. Philos. Trans. R. Soc. Lond. A
466, 1201–1228.
Pabst W., Gregorova E. and Berthold C. (2006) Particle shape andsuspension rheology of short-fiber systems. J. Eur. Ceram. Soc.
26, 149–160.
Papale P. (1999) Strain-induced magma fragmentation in explosiveeruptions. Nature 397, 425–428.
Paterson M. S. and Olgaard D. L. (2000) Rock deformation tests tolarge shear strains in torsion. J. Struct. Geol. 22, 1341–1358.
Petford N. (2009) Which effective viscosity? Mineral. Mag. 73, 167–
191.
Pinkerton H. and Norton G. (1995) Rheological properties ofbasaltic lavas at sub-liquidus temperatures: laboratory and fieldmeasurements on lavas from Mount Etna. J. Volcanol. Geoth.
Res. 68, 307–323.
Pinkerton H. and Stevenson R. J. (1992) Methods of determiningthe rheological properties of magmas at sub-liquidus temper-atures. J. Volcanol. Geoth. Res. 53, 47–66.
Quane S. L., Russell J. K. and Kennedy L. A. (2004) A low-load,high-temperature deformation apparatus for volcanologicalstudies. Am. Mineral. 89, 873–877.
Reuss A. (1929) Berechnung der Fließgrenze von Mischkristallenauf Grund der Plastizitatsbedingung fur Einkristalle. Z. Angew.
Math. Mech. 9, 49–58.
Richet P., Lejeune A. M., Holtz F. and Roux J. (1996) Water andthe viscosity of andesite melts. Chem. Geol. 128, 185–197.
Robert G., Russell J. K. and Giordano D. (2008a) Rheology ofporous volcanic materials: high-temperature experimentationunder controlled water pressure. Chem. Geol. 256, 216–230.
Robert G., Russell J. K., Giordano D. and Romano C. (2008b)High-temperature deformation of volcanic materials in thepresence of water. Am. Mineral. 93, 74–80.
Romano C., Giordano D., Papale P., Mincione V., Dingwell D. B.and Rosi M. (2003) The dry and hydrous viscosities of alkalinemelts from Vesuvius and Phlegrean Fields. Chem. Geol. 202,
23–38.
Roscoe R. (1952) The viscosity of suspensions of rigid spheres. Br.
J. Appl. Phys. 3, 269–367.
Rosi M., Bertagnini A. and Landi P. (2000) Onset of the persistentactivity at Stromboli Volcano (Italy). Bull. Volcanol. 62, 294–
300.
Rosi M., Landi P., Polacci M., Di Muro A. and Zandomeneghi D.(2004) Role of conduit shear on ascent of the crystal-richmagma feeding the 800-year B.P. Plinian eruption of QuilotoaVolcano (Ecuador). Bull. Volcanol. 66, 307–321.
Russell J. K., Giordano D. and Dingwell D. B. (2003) High-temperature limits on viscosity of non-Arrhenian silicate melts.Am. Mineral. 88, 1390–1394.
Rutgers I. R. (1962a) Relative viscosity of suspensions of rigidspheres in Newtonian liquids. Rheol. Acta 2, 202–210.
Rutgers I. R. (1962b) Relative viscosity and concentration. Rheol.
Acta 2, 305–348.
Ryersonm F. J., Weed H. C. and Piwinskii A. J. (1988) Rheology ofsubliquidus magmas: 1. Picritic compositions. J. Geophys. Res.:
Solid Earth 93, 3421–3436.
Saar M. O., Manga M., Cashman K. V. and Fremouw S. (2001)Numerical models of the onset of yield strength in crystal–meltsuspensions. Earth Planet. Sci. Lett. 187, 367–379.
Sato H. (2005) Viscosity measurement of subliquidus magmas:1707 basalt of Fuji volcano. J. Mineral. Petrol. Sci. 100, 133–
142.
Scott T. and Kohlstedt D. L. (2006) The effect of large melt fractionon the deformation behavior of peridotite. Earth Planet. Sci.
Lett. 246, 177–187.
Shaw H. R. (1965) Comments on viscosity, crystal settling, andconvection in granitic magmas. Am. J. Sci. 263, 120–152.
Shaw H. R. (1969) Rheology of basalt in the melting range. J.
Petrol. 10, 510–535.
Shaw H. R. (1972) Viscosities of magmatic silicate liquids –empirical method of prediction. Am. J. Sci. 272, 870–893.
Stevenson R. J., Bagdassarov N. S., Dingwell D. B. and RomanoC. (1998) The influence of trace amounts of water on theviscosity of rhyolites. Bull. Volcanol. 60, 89–97.

3236 A. Vona et al. / Geochimica et Cosmochimica Acta 75 (2011) 3214–3236
Stein D. J. and Spera F. J. (2002) Shear viscosity of rhyolite-vaporemulsions at magmatic temperatures by concentric cylinderrheometry. J. Volcanol. Geoth. Res. 113, 243–258.
Stickel J. J. and Powell R. L. (2005) Fluid mechanics and rheologyof dense suspensions. Annu. Rev. Fluid Mech. 37, 129–149.
Thomas D. G. (1965) Transport characteristics of suspension: VIII.A note on the viscosity of Newtonian suspensions of uniformspherical particles. J. Colloid Sci. 20, 267–277.
Van der Werff J. C. and de Kruif C. G. (1989) Hard-sphere colloidaldispersions: the scaling of rheological properties with particlesize, volume fraction, and shear rate. J. Rheol. 33, 421–454.
Vetere F., Behrens H., Holtz F. and Neuville D. R. (2006) Viscosityof andesitic melts – new experimental data and a revisedcalculation model. Chem. Geol. 228, 233–245.
Vetere F., Behrens H., Misiti V., Ventura G., Holtz F., De Rosa R.and Deubener J. (2007) The viscosity of shoshonitic melts(Vulcanello Peninsula, Aeolian Islands, Italy): insight on themagma ascent in dikes. Chem. Geol. 245, 89–102.
Vetere F., Behrens H., Schuessler J. A., Holtz F., Misiti V. andBorchers L. (2008) Viscosity of andesite melts and its implica-tion for magma mixing prior to Unzen 1991–1995 eruption. J.
Volcanol. Geoth. Res. 175, 208–217.
Voigt W. (1928) Lehrbuch der Kristallphysik. Leipzig, Germany.Webb S. L. and Dingwell D. B. (1990) Non-Newtonian rheology of
igneous melts at high stresses and strain rates – experimentalresults for rhyolite, andesite, basalt, and nephelinite. J.
Geophys. Res.: Solid Earth 95, 15695–15701.
Whittington A., Richet P. and Holtz F. (2000) Water and theviscosity of depolymerized aluminosilicate melts. Geochim.
Cosmochim. Acta 64, 3725–3736.
Whittington A., Richet P., Linard Y. and Holtz F. (2001) Theviscosity of hydrous phonolites and trachytes. Chem. Geol. 174,
209–223.
Associate editor: Peter Ulmer