the relationships between science, technologies and their industrial exploitation: an illustration...
TRANSCRIPT

The Relationships between Science, Technologiesand Their Industrial Exploitation
An Illustration Through the Myths and Realities of the So-Called ’European Paradox’∗
Giovanni Dosi† Patrick Llerena‡ Mauro Sylos Labini†
December 1, 2005
Abstract
This paper discusses, first, the properties of scientific and technologicalknowledge and the institutions supporting its generation and its economicapplications. The evidence continues to support the broad interpretationwhich we call the ”Stanford-Yale-Sussex” synthesis. Second, such patternsbear important implications with respect to the so-called ”European Para-dox”, i.e. the conjecture that EU countries play a leading global role interms of top-level scientific output, but lag behind in the ability of con-verting this strength into wealth-generating innovations. Some descriptiveevidence shows that, contrary to the ”paradox” conjecture, European weak-nesses reside both in its system of scientific research and in a relatively weakindustry. The final part of the work suggests a few normative implications:much less emphasis should be put on various types of ”networking” andmuch more on policy measures aimed to both strengthen frontier researchand strengthen European corporate actors.
JEL Classification: D80, O33, O38.Keywords: Open Science, Technological Learning, International Oligopolies, Eu-ropean Paradox, Science and Technology Policy, Industrial Policy.
∗The work leading to this paper has been supported by the Italian Ministry of University andResearch (grant 2004133370 003). Comments by Paul David, Edward Lorenz, Paul Nightingale,Michele Salvati, the participants to the ”Triple Helix Conference” (Turin, May 18-21, 2005), twoanonymous referees, and in particular by Henry Etzkowitz are gratefully acknowledged. Theusual disclaimers apply.
†LEM - S.Anna School of Advanced Studies, Pisa.‡BETA - Universite Louis Pasteur, Strasbourg.
1

1 Introduction
The present paper is intended to reappraise the tangled relationships between sci-
ence, technologies and their industrial exploitation with reference to a popular
interpretation concerning European weaknesses in industrial innovation known as
the ”European Paradox”. Such a paradox — which sounds quite similar to an ear-
lier ”UK paradox”, fashionable around thirty years ago — refers to the conjecture
that EU countries play a leading global role in terms of top-level scientific output,
but lag behind in the ability of converting this strength into wealth-generating
innovations. We shall argue, first, that the paradox mostly appears just in the
flourishing business of reporting to and by the European Commission itself rather
than in the data. Second, both the identification of the purported paradox, and
the many proposed recipes suited to eliminate it, happen to be loaded with several,
often questionable, assumptions regarding the relationship between scientific and
technological knowledge, and between both of them and the search and production
activities of business enterprizes.
We begin and set the scene by recalling what we consider to be the main prop-
erties of scientific and technological knowledge and of the institutions supporting
its generation (section 2). The proposed framework, we suggest, fits quite well
with a series of robust ”stylized facts” (sections 3). Having spelled out the inter-
pretative tools, we turn to the evidence supporting the existence of a ”European
paradox” (or a lack of it) (section 4) and discuss the European comparative per-
formance in terms of scientific output, higher education characteristics, proxies for
technological innovation, and actual production and export in those lines of busi-
2

ness which draw more directly on scientific advances.1 Indeed, one does not find
much of a paradox. Certainly one observes significant differences across scientific
and technological fields, but the notion of an overall ”European excellence” finds
little support. At the same time one does find ample evidence of a widespread
European corporate weakness, notwithstanding major success stories.
The interpretation bears also far reaching normative implications (section 5).
If we are right, much less emphasis should be put on various types of ”networking”,
”interactions with the local environment”, ”attention to user need” — current ob-
sessions of European policy makers — and much more on policy measures aimed to
both strengthen ”frontier” research and, at the opposite end, strengthen European
corporate actors.
2 Science and technology: some interpretative
yardsticks
Our interpretative framework stems from what one could call the Stanford-Yale-
Sussex (SYS) synthesis, sure to displease almost everyone, as a shorthand for
the confluence between works on the economics of information (including Arrow
(1962); Nelson (1959); David (1993, 2004))2 and works focussing on the specific
features of technological knowledge (including Freeman (1982, 1994); Freeman and
Soete (1997); Nelson and Winter (1982); Nelson (1959); Pavitt (1987, 1999); Rosen-
berg (1976, 1982); Winter (1982, 1987); and also Dosi (1982, 1988)). In such a
1Throughout this paper we focuss on industrial innovation, with a relative neglect of theservice sectors forced by lack of reliable data. Note, however, that most advances in the servicesectors continue to be the result of technological innovation which occurs in manufacturing.
2Note that Richard Nelson was at Yale when he produced the seminal contribution we referto.
3
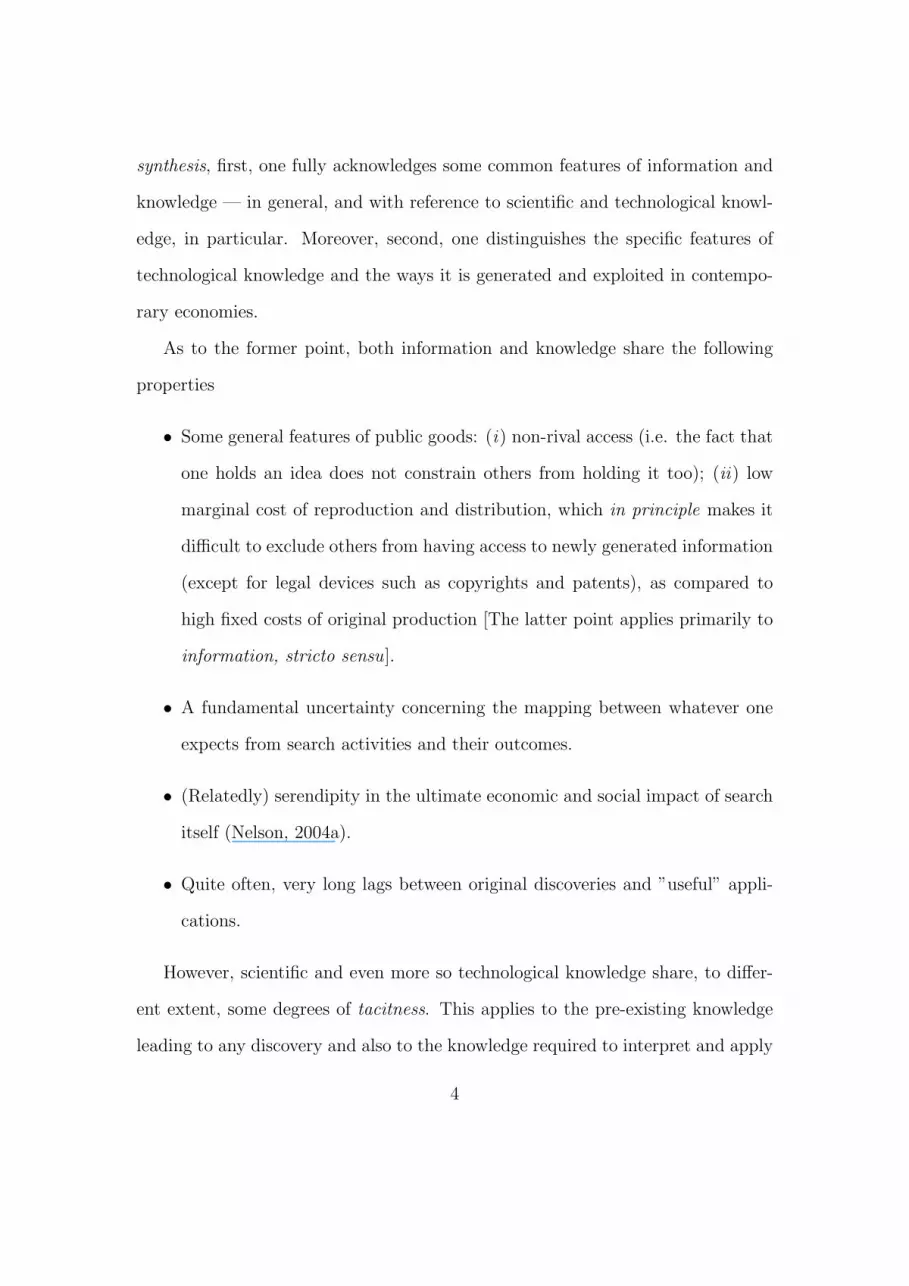
synthesis, first, one fully acknowledges some common features of information and
knowledge — in general, and with reference to scientific and technological knowl-
edge, in particular. Moreover, second, one distinguishes the specific features of
technological knowledge and the ways it is generated and exploited in contempo-
rary economies.
As to the former point, both information and knowledge share the following
properties
• Some general features of public goods: (i) non-rival access (i.e. the fact that
one holds an idea does not constrain others from holding it too); (ii) low
marginal cost of reproduction and distribution, which in principle makes it
difficult to exclude others from having access to newly generated information
(except for legal devices such as copyrights and patents), as compared to
high fixed costs of original production [The latter point applies primarily to
information, stricto sensu].
• A fundamental uncertainty concerning the mapping between whatever one
expects from search activities and their outcomes.
• (Relatedly) serendipity in the ultimate economic and social impact of search
itself (Nelson, 2004a).
• Quite often, very long lags between original discoveries and ”useful” appli-
cations.
However, scientific and even more so technological knowledge share, to differ-
ent extent, some degrees of tacitness. This applies to the pre-existing knowledge
leading to any discovery and also to the knowledge required to interpret and apply
4

whatever codified information is generated. As Pavitt (1987) puts it with regards
to technological knowledge
• ”most technology is specific, complex . . . cumulative in its development”.
”Specificity” applies in two senses: ”It is specific to firms where most tech-
nological activity is carried out, and it is specific to products and processes,
since most of the expenditures is not on research, but on development and
production engineering, after which knowledge is also accumulated through
experience in production and use on what has come to be known as ”learning
by doing” and ”learning by using”” (Pavitt, 1987) (p.9).
• Moreover ”the combination of activities reflects the essentially pragmatic na-
ture of most technological knowledge. Although a useful input, theory is rarely
sufficiently robust to predict the performance of a technological artefact under
operating conditions and with a high enough degree of certainty, to eliminate
costly and time-consuming construction and testing of prototype and pilot
plant”(Pavitt, 1987)(p.9).
A distinct issue regards the relations between scientific knowledge, technolog-
ical innovation, and their economic exploitation. In this respect, note that the
SYS synthesis is far form claiming any linear relation going from the former to
the latter. On the contrary many contributors to the SYS view have been in the
forefront in arguing that the relationships go both ways (see Freeman (1982, 1994);
Rosenberg (1982); Kline and Rosenberg (1986); Pavitt (1999), among others).
In particular one has shown that, first, technological innovations have some-
times preceded science in that practical inventions came about before the scientific
understanding of why they worked (the steam engine is a good case for the point
5

and another one is the airplane, whose aerodynamic equations have come only
after the actual development of the artifact).
Second, it is quite common that scientific advances have been made possible
by technological ones especially in the fields of instruments (e.g. think of the
importance of the microscope or, in the field of theoretical physics, of accelerators).
Third, one typically observes complementarities between science and technol-
ogy, which however ”varies considerably amongst sectors of application, in terms
of the direct usefulness of academic research results, and of the relative importance
attached to such results and to training” (Pavitt, 1987)(p.7).
Having said that, it is also the case that since the Industrial Revolution, the
relative contribution of science to technology has been increasing and its impact
has become more and more pervasive, while the rates of innovation have often been
shaped by the strength of the science base from which they draw (Nelson, 1993;
Mowery and Nelson, 1999; Mokyr, 2002). In turn, ”this science base largely is the
product of publicly funded research and the knowledge produced by that research
is largely open and available for potential innovations to use. That is, the market
part of the Capitalist Engine [of technological progress] rests on a publicly supported
scientific commons”. (Nelson, 2004a)(p.455).
Together, the fundamental vision underlying and supporting such a view of
publicly supported open science throughout a good part of the 20th century en-
tailed (i) a sociology of the scientists community largely relying on self-governance
and peer evaluation, (ii) a shared culture of scientists emphasizing the importance
of motivational factors other than economic ones and (iii) an ethos of disclosure
of search results driven by ”winner takes all” precedence rules.3
3On those points following the classic statements in Bush (1945); Polanyi (1962) and Merton
6

3 Some Persistent ’Stylized Facts’
Both the factual implications of the SYS synthesis and the normative implications
of the Open Science institutional arrangements are supported by a broad set of
persistent ’Stylized Facts’.
Consider the following pieces of evidence partly drawn from Pavitt (2001) and
Pavitt (2003).
1. Contrary to the claim that scientific and technological knowledge can be
increasingly reduced to sheer ”information”, the distinction between the two
continues to be highly relevant. A good deal of knowledge is and is likely
to continue to be rather ”sticky”, organization- and people-embodied and
often also spatially clustered. Related to this is the persistence of widespread
agglomeration phenomena driven by top level research (see Jaffe et al. (1993)
among many others and Breschi and Lissoni (2001) for a critical review).
2. Useful academic research is good academic research. ”Systematic evidence
from the US shows that the academic research that corporate practitioners
find most useful is publicly funded, performed in research universities, pub-
lished in prestigious referred journals” (Pavitt, 2001)(p.90) and frequently
cited by academic themselves (on these points see Mansfield (1995), Narin
et al. (1997) and Hicks et al. (2000)).
3. Government funding of basic research is responsible, especially in the US,
for most major scientific advances, including in the fields od information
sciences and bio-sciences (Pavitt (2001) and the references cited therein).
(1973), see the more recent appraisals in Dasgupta and David (1994); David (2004); Nelson(2004a) and the conflicting views in Geuna et al. (2003).
7

4. The proportion of university research that is business financed is very low
everywhere (typically less than 10%) and lower in the US than in Europe
(see Table 10 and the discussion below).
5. The expansion of US university patenting has resulted in a rapid decline of
the patent quality and value (Henderson et al., 1998)).
6. Increases in licensing income in leading US universities are concentrated in
biotech and software, and have preceded the Bayh-Dole act. · Moreover,
income flows from licensing are quite small as compared to the overall uni-
versity budget: in most cases they are unable to cover even the administrative
costs of the ”technology transfer office” in charge of them!
· At the same time still anecdotal evidence begins to hint at the ways the
new appropriation regimes for public research tends to corrupt the ethos of
researchers and twist their research agendas and in the US even
”[s]ome of the nations largest and most technology-intensive firms are begin-
ning to worry aloud that increased industrial support for research is disrupting,
distorting, and damaging the underlying educational and research missions of
the university, retarding advances in basic science that underlie these firms
longterm future” (Florida, 1999). [On many of the foregoing points see also
Nelson (2004a)].
7. Interestingly, only very rarely a critique of the Open Science System and
public funding of basic research has come from corporate users, except for
peripheral countries and peripheral entrepreneurs (such as e.g. Italian ones,
hoping to transform universities in sorts of free training subsidiaries). On the
contrary, notably, ”in the UK, where critical rhetoric is among the strongest,
8

it comes mainly from government sources... In the US, companies like IBM
have complained recently about the potentially armful effects on future com-
petitiveness of reduction in public support to academic research in the phys-
ical sciences” (Pavitt, 1999) (p.90). At the same time there is an increasing
perception also among business firms that ”too much appropriability” hurts
also firms themselves. In fact, as noted by Florida (1999),
”[l]arge firms are most upset that even though they fund research up front, uni-
versities and their lawyers are forcing them into unfavorable negotiations over
intellectual property when something of value emerges. Angered executives at
a number of companies are taking the position that they will not fund research
at universities that are too aggressive on intellectual property issues.... One
corporate vice president for industrial R&D recently summed up the sentiment
of large companies, saying, ”The university takes this money, then guts the
relationship”. [But also] [s]maller companies are concerned about the time de-
lays in getting research results, which occur because of protracted negotiations
by university technology-transfer offices or attorneys over intellectual property
rights. The deliberations slow the process of getting new technology to highly
competitive markets, where success rests on commercializing innovations and
products as soon as possible”.
More generally, both upstream researchers and downstream product devel-
opers begin to perceive what Heller and Eisenberg (1998) have called the
anticommons tragedy: the excessive fragmentation of Intellectual Property
Rights among too many owners can slow down research activities and prod-
uct development because all owners can block each other.
With this general background in mind let us turn to the comparative assess-
ment of the mechanisms of generation and economic exploitation of scientific and
9

technological knowledge in the EU.
4 In search of the purported ”European Para-
dox”
The central point of the ”paradox”, to repeat, is the claim that the EU scientific
performance is ”excellent” compared with its principal competitors, while Europe’s
major weakness lies in its difficulties in transforming the results of research into
innovations and competitive advantages.
One of the first official documents that popularized the ”paradox” was the
Green Paper on Innovation (EC, 1995). The two pieces of evidence provided
therein in support of it, and thereafter too often taken for granted, were, first,
the (slightly) higher number of EU publications per euro spent in non-business
enterprise R&D (nonBERD) and, second, the lower number of granted patents per
euro spent in BERD vis-a-vis the US and Japan. Those phenomena, as important
as they can be, do not shed much light on the substance of the ”paradox” and, as a
matter of fact, even the European Commission seems to admit in its Third Report
on Science and Technology Indicators (EC, 2003) that the ”paradox is vanishing”.4
What does indeed the overall evidence tell us? In what follows, we shall illus-
trate some of the strengths and weaknesses of European Science and Technology
(S&T) system, arguing that the paradox is nowhere to be seen.
First, let us briefly consider the claim on ”scientific excellence”.
4One of the documents published by the Commission that present the results has the revealingtitle: ”From the ’European Paradox’ to declining competitiveness”.
10

The pieces of evidence and myths on the European scientific leadership
A central part of the ”Paradox” regards the width, depth and originality of Euro-
pean Science. Discerning whether the the data support the claims of a purported
European leadership5 is not an easy task. Bibliometric analysis offers important
insights, but also presents drawback and biases, which we discuss at somewhat
greater length in Dosi et al. (2005). That notwithstanding measuring the scien-
tific Impact of Nations continues to be a revealing exercise. And indeed, as we
show below, the picture that emerges from data on publications and citations is
far from pinpointing a European leadership in science.
Advocates of the ”paradox” notion have emphasized that, during the second
half of the nineties, Europe has overtaken the US in the total number of published
research papers. However, the latter indicator needs to be adjusted by a scaling
factor due to sheer size: otherwise one could claim that Italian science base is
better than Swiss one given the higher total number of papers published! The first
column of Table 1 shows that, if one adjusts for population, European claimed
leadership in publication disappears.6
Moreover, in science, together with the numbers of publications, at least equally
important, are the originality and the impact of scientific output upon the relevant
research communities. Two among the most used proxies of such an impact are
articles’ citations7 and the shares in the top 1% most cited publications.
5A view, again voicefully endorsed by most of the EU Commission: so, the chapter of theThird Report devoted to measure the European performance in knowledge production is titled”Scientific output and impact: Europe’s leading role in world science”(EC, 2003).
6Certainly normalization by population is a very rough proxy which also averages acrossvery different entities, ranging from Sweden, Germany and the UK all the way to Italy, Greeceand Portugal (just sticking to EU-15). However also the US average over Massachusetts andCalifornia but also Mississippi and Idaho.
7Typically, they are very skewed: only a few publications are highly cited, while the over-
11

Table 1: Publications and Citations weighted by Population and Univer-sity Researchers
PubblicationsPopulation = Publications
Researchers × ResearchersPopulation
UK 5.84 6.99 0.84Germany 3.88 4.77 0.81France 3.96 4.09 0.97Italy 2.58 5.83 0.44US 4.64 6.80 0.68EU-15 3.60 4.30 0.84
CitationsPopulation = Citations
Researchers × ResearchersPopulation
UK 42.60 51.00 0.84Germany 26.82 32.98 0.81France 25.81 26.68 0.97Italy 16.89 38.25 0.44US 39.75 58.33 0.68EU-15 23.03 27.52 0.84
Top1%publicationsPopulation = Top1%publications
Researchers × ResearchersPopulation
UK 0.08 0.10 0.84Germany 0.05 0.06 0.81France 0.04 0.05 0.97Italy 0.03 0.06 0.44US 0.09 0.13 0.68EU-15 0.04 0.04 0.84
Notes: Our calculations based on numbers reported by King (2004) and OECD (2004a). Number of publications, citations andtop 1% publications refers to 1997-2001. Population (measured in thousands) and number of university researchers (measured infull time equivalent) refer to 1999.
12

As shown in Table 1, the US is well ahead with respect to both indicators. In
particular, controlling for population, the outstanding EU scientific output is still
less than half than the US one.
In the second and third column of the same table, we decompose output (i.e.
number of publications, citations, and top 1% publications) per population in-
dicator, into two components: a measure of scientific productivity of university
researchers (i.e. output per university researcher) and a ratio of university re-
searchers to population. The table clearly shows that US leadership is due to the
quality of research published rather than to the sheer number of researchers.
In line with the above is the evidence concerning Nobel Prize winners reported
in EC (2004). After the Second World War the gap between US and EU has been
growing at an impressive rate.
Of course, despite the variety of ways of categorizing scientific disciplines, there
is a high inter-disciplinary variation in the revealed quality of European research.
According to EC (2003), NAFTA (US plus Canada and Mexico) vis-a-vis to EU-
15, performs better in clinical medicine, biomedicine, and does especially well
in chemistry and the basic life sciences. Using a different and more aggregate
classification and comparing citations shares, King (2004) also finds US superiority
in life and medical sciences, while Europe performs slightly better in physical
sciences and engineering (see Figure 1). Incidentally, a few important distinctive
patterns within the EU also emerge: for example France is strong in math, while
Germany and UK do relatively well in physical and life sciences respectively.8
The general message from bibliometric data is therefore far from suggesting any
whelming majority of articles receives zero citations.8See King (2004) for further details on this point.
13

Figure 1: Strengths in different disciplines
Notes: Plot shows research footprints based on the shares of citations. The distance from the origin is citation share. See King(2004) for sources (ISI Thompson) and details.Source: King (2004).
generalized European leadership. On the contrary, one observes a structural lag
in top level science vis-a-vis the US, together with (i) some average catching up,
(ii) a few sectoral outliers in physical sciences and engineering and (iii) few single
institutional outliers (such as Cambridge also in computer science and several other
disciplines: but outliers are precisely outliers).
The first fact on which the ”paradox” should be based is simply not there.
Rather a mayor EU challenge regards how to catch up with the US in scientific
excellence.
US-EU differences in their higher education systems
A natural candidate for explaining the US leadership in scientific productivity is
the excellence of its research universities. Important insights for cross-national
comparison are offered by the huge case study literature together with few quan-
14

titative indicators (Mowery and Sampat, 2005).
First, despite historically research universities emerged for the first time in the
mid 19th century Prussia, with what has been known as the Humbolt model, today
universities seem to occupy a more significant position as basic research perform-
ers within the United States than in any other industrialized country (Mowery
and Rosenberg, 1993). In fact, for instance, in France public non-university in-
stitutions such the CNRS (National Center for Scientific Research), the INSERM
(National Institute for Health and Medical Research), the CEA (the Atomic En-
ergy Commission), and the Institute Pasteur play a central role as basic research
performers. Similarly, German basic research is mainly concentrated in the Max
Plank institutes. On the contrary, after the Second World War, in tune with the
influential Vannevar Bush (1945) report, US universities have been picked as the
most appropriate institutional locus for basic research. This difference is likely
to be important, given the strong complementarities between basic research and
teaching activities.
Second, the available data on enrolment reveal that, since the beginning of the
twentieth century, the US higher education institutions have constantly absorbed
larger shares of the relevant cohorts of population than the European ones. So,
for instance, European universities enrollment exceeded 10% only in the sixties,
when US rates by the same time were reaching 50% (Burn et al., 1971). This has
been probably due also to a sharp US distinction between research-cum-graduate
teaching universities, undergraduate liberal art colleges, and technical colleges.
Conversely, Europe (especially Continental Europe) often offers in most universi-
ties a confused mix of the three. Anecdotal evidence suggests that this is neither
good for research nor for mass-level training.
15

Table 2: Shares of HERD by country and S&E field: 1998 or 1999
Country NS&E Natural sci. Engin. Medical sci. Agricultural sci. Social sci. & Huma.Germany 78,4 29,2 20,3 24,7 4,2 20,6Spain 77,9 39,4 18,7 14,2 5,6 22,1Sweden 76,3 21,0 21,9 27,4 6,1 17,6US 93,7 41,8 15,5 29,1 7,4 6,3
Note: NS&E natural sciences and engineering.Source: OECD, Science and Technology Statistics database, 2003.
Third, an interesting exercise is to brake down R&D carried on by the academic
sector (HERD) according to the field of performance.9 Table 2 on a selected
number of EU countries, shows a larger proportion of Higher Education R&D to
engineering, social sciences, and humanities than does the US. Conversely, the
US academic R&D effort concentrates on the medical and natural sciences. The
latter is consistent with the evidence on scientific output presented in the previous
section.
Fourth, detailed survey based studies have shown that, with the possible excep-
tion of pharmaceuticals, US industrial firms report to benefit more from ”public
research” accessed through conferences, publications and mobility of PhD’s than
from university prototypes, patents and licences (Cohen et al., 2002).
Finally, at a complementary level, as we shall show more extensively below,
the evidence that university-industry links are stronger in the U.S. than in Europe
is at least mixed: if, on the one hand, qualitative evidence on labor mobility
between university and industry supports to some extent the common wisdom,
data concerning industry support to higher education R&D point to the opposite
direction.
9Incidentally, US and EU-25 investment in HERD as percentage of GDP are very similar(0.40 and 0.39 respectively in 2001).
16

Figure 2: Gross Domestic Expenditure on R&D as (%) of GDP
Source: OECD (2004a)
Poorer technological performances: R&D inputs and innovative outputs
of the EU
In order to explore in detail the European performance in technology and inno-
vation, one also needs to match European investments in science and technology
(i.e. inputs typically proxied by education and R&D expenditures) with outputs
(typically proxied by patents).
First, as shown in Figure 2, at aggregate levels the EU under-invests in R&D
with respect with both the US and Japan and, notwithstanding wide variation
within the EU itself, the gap is not shrinking.
Second, the usual claim concerning the higher share of government funded
R&D in the EU as compared to the US is simply groundless.10 On the contrary if
10The misunderstanding is usually based on the use of the share of publicly funded R&D ontotal R&D expenditures, which does not carry much economic sense. The meaningful figures
17

Table 3: Government Financed GERD as a Percentage of GDP
Country 1998 1999 2000 2001
Finland 0.87 0.94 0.89 0.87France 0.81 0.80 0.84 0.82Germany 0.81 0.78 0.78 0.79Italy 0.51 . . . . . . . . .Spain 0.35 0.36 0.36 0.38Sweden . . . 0.89 . . . 0.90United Kingdom 0.55 0.55 0.53 0.53EU-15 0.65 0.65 0.65 0.66EU-25 0.63 0.63 0.63 0.63US 0.79 0.76 0.71 0.76
Notes: OECD (2004a). Italian percentage refers to 1996
one compares the shares of government financed R&D on GDP (Table 3), the EU
is still lagging behind.
Publicly supported of R&D may be categorized into several components. As
showed in Table 4 the US government, compared to the EU ones, spends more
both in R&D carried out by firm (business enterprise R&D (BERD)) and in other
forms of R&D (i.e. higher education, government, etc.). However, the bulk of the
difference is in publicly financed BERD.
However, government financed BERD underestimates the full amount of public
support for industrial technology, because it does not include (i) fiscal incentives
and loans and (ii) R&D financed by the government in support to industry, but
carried outside the firms themselves.
More generally, three broad categories of public support for industrial technol-
ogy can be identified: first, all programmes designed to encourage industrial firms
to carry out R&D by reducing its costs, through grants, loans, and fiscal mea-
regard normalization with the economic size of the economy.
18

Table 4: Decomposing 2001 Government funded R&D: BERD and nonBERD
Country Government Financed BERD on GDP(%) Government Financed nonBERD on GDP(%)EU-15 9,369 0.10 53,352 0.56EU-25 9,868 0.09 55,073 0.52US 18,849 0.19 57,533 0.57
Notes: Our calculations on OECD (2004a). Gross expenditures are expressed in million 2000 dollars - constant prices and PPP.
sures; second, government payments to industrial firms financing R&D as part of
procurement programs, notably for defence or space objectives; and third, public
support to ”research infrastructures” specifically aimed at industrial development
not involving however any financial transfer to private firms (e.g. applied research
undertaken in public institutes and universities).
Unfortunately international statistics on the above are hardly available, even
for industrialized countries. However, Young (2001), exploiting the data from a
Pilot Study run by OECD using such categories, finds that the pattern of sup-
port varies considerably across countries. In particular, the US federal support
for industrial technology is almost entirely paid to firms (public institutes and
universities do not seem to receive public funds for industrial technology!), with
the largest share in the form of mission-oriented contracts and procurement. This
fact, to a good extent, stems from the large US military and space programs. As
far as EU countries are concerned, in France and the United Kingdom mission ori-
ented contracts are also relatively important, although clearly of a much smaller
size than the US. On the other hand, in Germany and the Netherlands funds are
distributed evenly across the three categories.
Third, one observes a wide gap in industry financed R&D as a percentage of
19

Table 5: Industry Financed GERD as a Percentage of GDP
Country 1998 1999 2000 2001
Finland 1.84 2.16 2.39 2.41France 1.16 1.18 1.14 1.21Germany 1.44 1.59 1.65 1.65Italy 0.43 . . . . . . . . .Spain 0.44 0.43 0.47 0.45Sweden . . . 2.47 . . . 3.07United Kingdom 0.86 0.91 0.91 0.88EU-15 0.98 1.04 1.06 1.08EU-25 0.93 0.98 1.00 1.02US 1.70 1.77 1.88 1.84
Notes: EC (2004). Italian Percentage refers to 1996
GDP (see Table 5). Again, despite diverse countries patterns, there is no sign of
overall European catching up. Part of this apparent gap is due to inter-sectoral
differences (which tend to hold worldwide) in the propensity to undertake R&D.
This in turn is partly due to inter-sectoral differences in technological opportunities
and partly in the way the latter are tapped — which in some industries involves
formal R&D activities and in others more informal processes of learning-by-doing,
learning-by-using and learning-by-interacting with suppliers and customers.11 It
happens that Europe is largely penalized by a composition effect, in that it is rela-
tively strong in technologies (such as mechanical engineering) wherein a good deal
of search is not recorded under the ”R&D” heading. However, even after control-
ling for intersectoral differences, the European gap does not entirely disappear.12
Moreover, one observes also a lower ratio of ”knowledge workers” in the total
workforce in Europe as compared with the US: cf. Table 6 depicting the per-
11Within an enormous literature, on these points see Dosi (1988); Klevorick et al. (1995);Malerba (2004).
12See EC (2003) on page 116 for data and discussions.
20

Table 6: Population with Tertiary Education (% of 25-64 years age class),New Science & Engineering graduates (per 1000 population aged 20-29),and Total Researchers (per Thousand of Total Employment)
Country Tertiary Education S&E graduates Researchers1999 2001 2003 1999 2001 2003 1999 2001 2002
France 20.9 22.6 23.1 19.0 20.2 22.2 6.8 7.2 7.5Germany 23.0 23.5 24.3 8.6 8.0 8.4 6.7 6.8 6.9Italy 9.5 10.0 10.8 5.5 6.1 7.4 2.9 2.8 . . .Spain 21.1 23.6 25.2 9.6 11.3 12.6 4.0 5.0 5.1Sweden 28.5 25.5 27.2 9.7 12.4 13.9 9.6 10.6 . . .UK 27.5 28.7 30.6 15.6 19.5 21.0 5.5 . . . . . .EU-15 20.5 21.5 22.5 10.2 11.9 . . . 5.6 5.9 . . .EU-25 19.4 20.1 21.2 9.4 11.0 . . . 5.3 5.6 5.8US 35.8 37.3 38.1 9.3 9.9 10.9 8.6 . . . . . .
Note: US indicator for tertiary education in 2003 refers to 2002. Italian number for S&E graduates in 2003 refers to 2002, EU-25to 2000. UK number of researchers refer to 1998.Source: EIS 2005 indicators and OECD (2004a).
centage of tertiary level graduates and researchers on population and the labor
force respectively.13 Note, however, that Europe has a higher ration of Science &
Engineering graduates.
Complementary to proxies for the intensities of innovative search efforts and
for the skills of workforce involved, patent-based indicators are generally used to
shed light on the technological Output of Nations. Needless to say, institutional
differences, distinct corporate appropriability strategies, and different propensity
to patent across sectors may bias the international comparisons. Moreover, these
indicators are generally constructed on the basis of patent applications issued by
national patent offices having an ”home advantage” bias. However, the OECD has
developed ”patent families” (i.e. patent filed in different countries to protect the
same invention) that try to mitigate this latter bias and generally capture patents
13This data should be taken however with some care, given the uneven state of secondaryeducation across different countries.
21

Table 7: Shares in ”triadic” patent families
1994 1996 1998 2000
EU-25 34 32 33 32US 35 37 35 35
Source: OECD (2004a).
of relatively high economic value.14 In Table 7 we report EU-25 and US shares
in ”triadic” patent families (i.e. inventions filed with the European Patent Office
(EPO), the Japanese Patent Office (JPO), and the US Patent and Trademark
Office (USPTO)). Shares are relatively stable with a slight European decline.
Again, EU performance varies significantly in distinct technology fields. The
upper part of Table 8 depicts the shares of US and EU patents filed at the European
patent office in five main fields. It shows that EU has a relative strength in Pro-
cesses and Mechanics and, conversely, major weaknesses in Electricity/Electronics,
Instruments, and Chemistry. At a more disaggregated level, the lower part of
the same table focuses on six selected subfield whose technological dynamism (as
revealed by total patent growth) has been particularly high. It suggests that in
Information Technologies, Pharmaceutical and Biotech the US is well ahead, while
Europe has comparable shares of patents in Telecommunication and does partic-
ularly well in Material technologies (especially due to Germany).
To sum up, both R&D expenditures and patent indicators pinpoint a European
lag in terms of both lower search investments and lower innovative output. This
is largely the effect of the weaknesses in technological fields that are considered
14The downside is that triadic patents are usually owned by big corporations and thereforesmall firms innovation activity is likely to be underestimated. See ? for a discussion.
22

Table 8: Shares of patents filed with EPO for different fieds
Electricity Instruments Chemistry Processes Mechanics All Fields
EU-15 36.3 36.5 37.5 50 54.1 42.6US 35.2 39.7 39.9 27.1 22.1 33.1
Telecom IT Semiconductor Pharma Biotech MaterialsEU-15 37.9 26.9 29.2 35.7 28.3 55.1US 35.7 49.3 36.2 43.5 51.3 19
Source: EC (2003).
as the engine of the contemporary ”knowledge economy”. On the other hand,
data show a few points of strength related to mechanical technologies and new
materials.
Structural weaknesses of European corporations and science-industry
interaction
The third angle to explore the paradox conjecture concerns the limits and weak-
nesses that European business enterprises display in innovating and competing in
the world economy. The evidence, in our view, suggests that the fundamental fac-
tors underlying the worsening European performance rest, first, as discussed ear-
lier, in the commitment of European firms to research and international patenting
and, second and relatedly in several sectors, on their relatively weak participation
to the core international oligopolies. All this, at least in first approximation, is
quite independent from any imagined weaknesses in the industry-university links.
Let us focus in particular on those industries where the consequences of Euro-
pean lags in science and technological innovation are likely to be more severe.
23

Figure 3 shows the production shares in several ICT sectors. If the overall
rankings of EU-15, US and Japan have remained more or less stable, variations in
individual shares shows that the EU lost the lead even in the telecommunications
industry, where in the nineties it had a big advantage. Europe has also declined
relative to the United States in office equipment. On the other hand, in radio
communications and radar equipment the United States has somewhat lessened
its lead relative to Europe (in turn, this has probably been the outcome of the
formation of few European companies especially in the military sector with sizes
and capabilities which begin to be comparable with their American counterparts).
A somewhat similar picture comes from the data measuring trade performances
in mayor high tech sectors. Table 9 depicts export market shares of selected EU
countries not considering intra EU trade. While in aerospace the US has lost
some ground and EU has grown, the opposite has happened in Instruments and
Pharmaceuticals.
Combining different sources, the 2004 OECD Information Technology Outlook
(OECD, 2004b) explores the performance of the top 250 ICT firms and the top 10
ones in four subsectors (communication equipment and systems, electronics and
components, IT equipment and systems, IT services, software and telecommuni-
cations). It turns out that 139 of the top 250 firms (56%) are based in the United
States and only 33 (13%) in the EU, confirming an overall weak EU amongst the
world industrial leaders, notwithstanding subsectoral exceptions. So, six EU firms
appear in the top 10 of telecommunication services firms, three in the top 10 of
communications equipment and systems firms, two in the top 10 of electronics and
components firms, and only one in the top 10 of software ones. Finally, there are
no European firms among the 10 larger firms in IT equipment and systems.
24

Figure 3: Share of World ICT Production
Note: Abbreviated sectors stand for: Electronic data processing, Office equipment, Control and instrumentation, Radiocommunications (including mobiles) and radar, Telecommunications, Consumer audio and video, Components, and Total ICT.Note: The shares are calculated in current USD, and relative exchange rates (strong USD in 2000-01) will have a large short-terminfluence on calculations of relative shares of ICT production. No data were available for Greece, Luxembourg and Portugal in1990. Luxembourg is also not available for the other years.Source: Reed Electronics Research, various years. Reproduced in OECD (2004b).
25
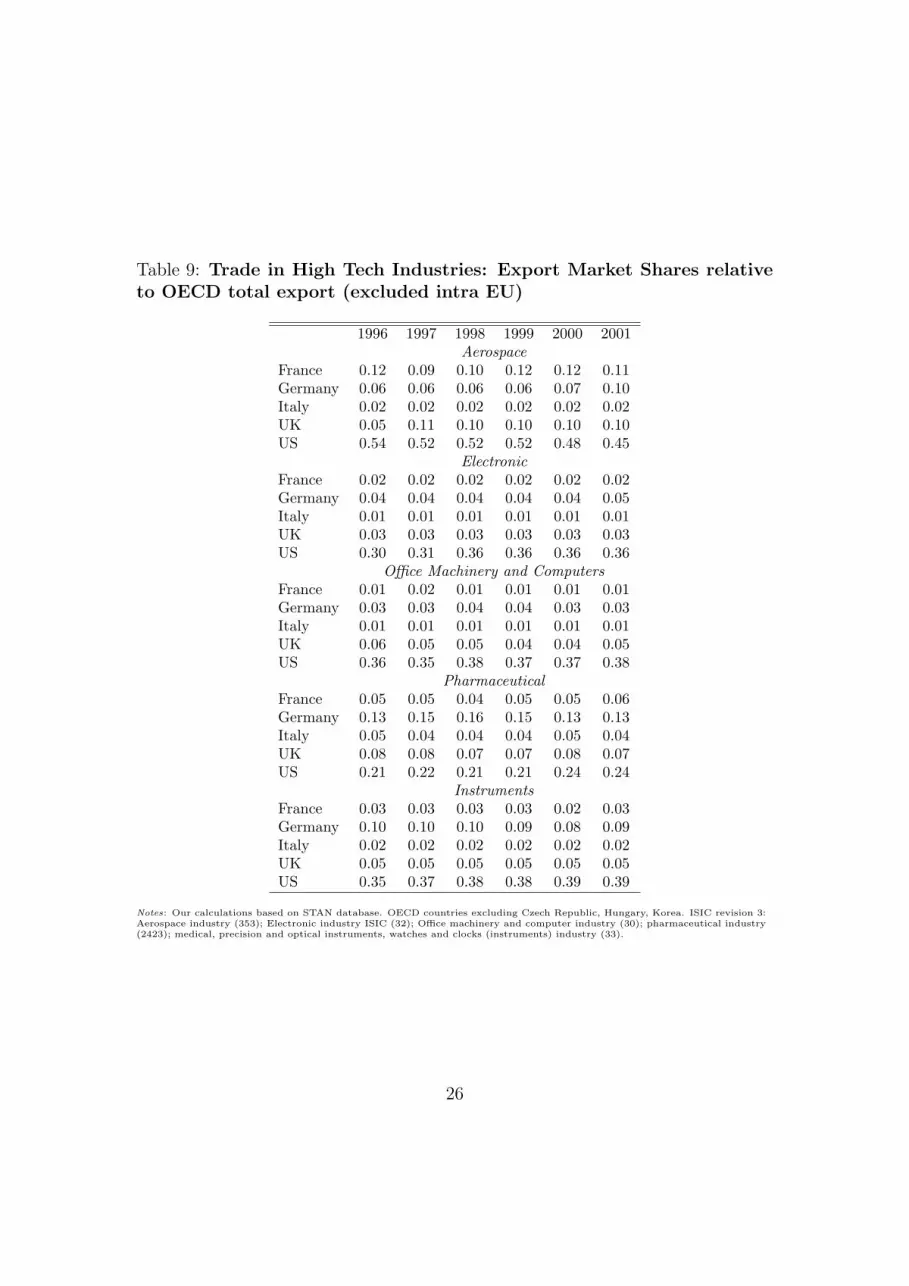
Table 9: Trade in High Tech Industries: Export Market Shares relativeto OECD total export (excluded intra EU)
1996 1997 1998 1999 2000 2001Aerospace
France 0.12 0.09 0.10 0.12 0.12 0.11Germany 0.06 0.06 0.06 0.06 0.07 0.10Italy 0.02 0.02 0.02 0.02 0.02 0.02UK 0.05 0.11 0.10 0.10 0.10 0.10US 0.54 0.52 0.52 0.52 0.48 0.45
ElectronicFrance 0.02 0.02 0.02 0.02 0.02 0.02Germany 0.04 0.04 0.04 0.04 0.04 0.05Italy 0.01 0.01 0.01 0.01 0.01 0.01UK 0.03 0.03 0.03 0.03 0.03 0.03US 0.30 0.31 0.36 0.36 0.36 0.36
Office Machinery and ComputersFrance 0.01 0.02 0.01 0.01 0.01 0.01Germany 0.03 0.03 0.04 0.04 0.03 0.03Italy 0.01 0.01 0.01 0.01 0.01 0.01UK 0.06 0.05 0.05 0.04 0.04 0.05US 0.36 0.35 0.38 0.37 0.37 0.38
PharmaceuticalFrance 0.05 0.05 0.04 0.05 0.05 0.06Germany 0.13 0.15 0.16 0.15 0.13 0.13Italy 0.05 0.04 0.04 0.04 0.05 0.04UK 0.08 0.08 0.07 0.07 0.08 0.07US 0.21 0.22 0.21 0.21 0.24 0.24
InstrumentsFrance 0.03 0.03 0.03 0.03 0.02 0.03Germany 0.10 0.10 0.10 0.09 0.08 0.09Italy 0.02 0.02 0.02 0.02 0.02 0.02UK 0.05 0.05 0.05 0.05 0.05 0.05US 0.35 0.37 0.38 0.38 0.39 0.39
Notes: Our calculations based on STAN database. OECD countries excluding Czech Republic, Hungary, Korea. ISIC revision 3:Aerospace industry (353); Electronic industry ISIC (32); Office machinery and computer industry (30); pharmaceutical industry(2423); medical, precision and optical instruments, watches and clocks (instruments) industry (33).
26
These data support indeed the conjecture that, quite independently of the
”bridges” between scientific research and industrial applications, potential corpo-
rate recipient are smaller weaker and slower in seizing novel technological oppor-
tunities than transatlantic counterparts.
This is well highlighted also by those revealing cases where science is world top
class, all the ”transfer mechanisms” are in place but hardly any European firm is
there to benefit. A striking example of this is computer sciences at Cambridge,
England : an excellent scientific output is most exploited by non-European firms
(from Fujitsu to Microsoft and many others).
Note that the presumed feeble links between science and industry should be one
of the most important aspect of the paradox conjecture. Surprisingly, the evidence
here is simply non-existent. Curiously the European Commission Third Report on
Science and Technology Indicators does not address the issue explicitly, but just
discusses the ”science content” of EU technology, which is a rather distinct issue
(EC, 2003) (p.422). Concerning the latter, the number of citations to scientific
journal articles in patents that cite science is indeed higher in the US, but this
hardly suggests the hypothesis that this reflects the EU weaknesses in Science-
Industry interactions. Rather, it might primarily reveal the different composition
of European technological output, with patterns of specialization which tend to be
less ”science based”.
In fact, the few indicators available which may be considered more direct mea-
sures of the interaction between business and higher education pinpoint to conclu-
sions opposite to the conventional wisdom. As Table 10 shows the share of private
investment in higher education R&D, while low everywhere, is marginally higher in
the EU than in the US and much higher than Japan. Similar results are obtained
27

Table 10: Shares of Higher education Expenditure on R&D (HERD)financed by industry
Country 1998 1999 2000 2001
Belgium 11.1 10.5 11.8 12.7France 3.4 3.4 2.7 3.1Germany 10.5 11.3 11.6 12.2Spain 7.0 7.7 6.9 8.7UK 7.3 7.3 7.1 6.2EU-15 6.4 6.5 6.6 6.8EU-25 6.4 6.5 6.5 6.7US 6.1 6.1 6.0 5.5
Source: OECD (2004a).
if one considers the private sectors annual investment in the public research sector
(i.e. the sum of higher education and government R&D) (King, 2004).
5 Wrong diagnoses and Misguided policies: Some
Modest Alternative Proposals By Way of a
Conclusion
The European pieces of evidence on the interactions between scientific advances,
technological innovations, and industrial evolution (as such central elements of
the ”triple helix” linking government policies, scientific research and industry (Et-
zkowitz and Leytesdorff, 1997)) do indeed highlight dynamics well in tune with
what we have called earlier the ”SYS” synthesis. Implications of the latter in-
clude (i) the continuing paramount importance of basic science shaping the ever-
expanding pool of (notional) technological opportunities, which however, (ii) tend
28

to be actually tapped also as a function of the capabilities and strategic orientation
of business firms (in primis, ”proximate ones”, in terms of geographical location,
nationality, knowledge ”nearness”).
Indeed the European picture shows worrying signs of weakness with respect to
the generation of both scientific knowledge and technological innovation. However,
no overall ”European paradox” with a leading science but weak ”downstream” links
is there to be seen. On the contrary, significant weaknesses reside precisely at the
two extreme with, first, a European system of scientific research lagging behind the
US in several areas and, second, a relatively weak European industry. The latter,
we have argued, is characterized on average by comparatively lower presence in
the sectors based on new technological paradigms — such as ICT and biotechnolo-
gies —, a lower propensity to innovate and a relatively weak participation to the
international oligopolies in many activities.
In turn, such a picture as we shall argue below, calls for strong science policies
and industrial policies. However, this is almost the opposite of what has happened.
The belief into a purported paradox together with the emphasis on ”usefulness”
of research has led to a package of policies whereby EU support to basic research
is basically non-existent:
”Research proposals are expected to identify possible practical as well as scientific
benefits; higher priority is being given to user involvement (including partial fund-
ing), universities are being invited to extract more revenue from licensing their
intellectual properly, and substantial public funds have been spent on ”foresight”
exercises designed to create exchange and consensus around future opportunities of
applications” (Pavitt, 2001) (p.768).
The ”Frame Programmes” have all being conceived with such a philosophy,
29
which in the most recent one is pushed to the extreme with the ”Networks of
Excellence”: not only they do not support research but they explicit prohibit the
use of EU money for that purpose!!
Similarly, with regards to industrial R&D, the focus on ”pre-competitive” re-
search has meant the emergence of a sort of limbo wherein firms — often in combi-
nation with academics — try to tap community money in areas that are marginal
enough not to justify the investment of their own funds. Moreover, the networking
frenzy has gone hand in hand with the growth in number and power of research
bureaucrats (both at European and National level) whose main competence is
precisely in ”networking”, ”steering”, writing lengthy reports and demanding re-
searchers to do the same. Here again the extreme is in social sciences. A bit
like the old Soviet Union where even papers in mathematics had to begin with
”according to the clever intuition of comrade Breznev...”, in many areas one has
to begin each research proposal by arguing that what follows is crucial in order
to match fashionable keywords such as ”cohesion”, ”enlargement”, ”citizenship”,
etc. even if in fact the real scientific interest goes to, say, the econometrics of panel
data or the transmissions mechanisms of monetary shocks... And with all this goes
yet another type of corruption of the ethos of the researchers who have to develop
the skills of camouflage and peddling...
If our diagnosis is correct, this state of affairs is bad for the research, wasteful
for society and also bad for business.
Given this state of affairs, what can be done? Let us conclude with some policy
implications of the foregoing analysis.
First, increase support to high quality basic science, through agile institutions
much alike the American National Science Foundation (NSF) relying on world-
30
class peer-review (and also physically located far away from Brussels — as May
(2004) suggests!). In that direction the constitution of a European Science Council
is a welcome development.
Second, fully acknowledge the difference within the higher education system
between research-cum-graduate teaching universities and other forms of tertiary
education discussed above. The well placed emphasis of the role of the first type
of institutions comes often under the heading of ”Humbold model” as pioneered
by Germany more than a century ago. However, nowadays the practice is mostly
American, while the confused bland of the functions nowadays offered in Europe
(especially Continental Europe) is neither good for research nor for mass-level
training.
Third, push back the boundaries between public open research and appropriable
one. One often forgets that appropriability is socially justified only in so far it
is an incentive to innovation itself. As we have argued above, appropriation of
the output of public research does not perform that role. Of course this applies
primarily to basic research while the picture is much more blurred for practically
oriented disciplines such as engineering. Hence a lot of pragmatism is required.
However we would stand by the general point that too much of an emphasis on
appropriability and IPR is likely to exert a pernicious influence on both the rates
and directions of search. Moreover, we suggested above, it might also represent a
significant hinderance to business-led innovation.
The European lag in the institutional changes leading to a much more property-
based system of research as compared to the US for once might be a blessing in
that it might be easier for Europe to stop and reverse the tendency (for a through
discussion of the forgoing appropriability-related points, see Nelson (2004a)).
31

Fourth, build large scale, technologically daring missions justifiable for their
intrinsic social and political value and able to match in terms of size and ambition
the US (more military oriented) programs. As Pavitt (2001) reminds us ”Scandi-
navian countries and Switzerland are able to mobilize considerable resources for
high quality basic research without the massive defense and health expenditures
of the world’s only superpower”: hence, he suggests, ”also the larger European
countries and the European Union itself, have more to learn from them than from
the USA” (p.776). Granted that, however, one should not overlook the importance
of large scale far-reaching European programs with ambitious and technologically
challenging objectives in the fields of e.g. energy conservation, health care, en-
vironmental protection (and perhaps also the European re-armament, although
there a much more controversial issue whose discussion is beyond the scope of this
paper).
Fifth, re-discover the use of industrial policies as a device to foster a stronger,
more innovative, European industry. We are fully aware that nowadays ”indus-
trial policy” is a bad word which cannot be mentioned in a respectable company
without being accused supporting Jurassic-era ”national-champions”, distorting
competition, fostering production patterns which go against ”revealed” compara-
tive advantages, etc. We are tempted to answer ”why not”?! Certainly the period
— until the late seventies / early eighties — characterized by discretionary in-
tervention of policy makers on the very structure of various industries has been
characterized by many failures, but also by several successes. For instance, the
European strength in telecommunications, the remarkable presence in semicon-
ductors, the growing competitiveness in aircrafts, etc. are also the outcomes of the
policy measures of the ”interventionist” era. Today, even within the constraints of
32

the new trade arrangements, much more, we think, can be done in order to foster
the European strength (or, for that matter, multiple regional points of strength) in
the most promising technological paradigms, were it not for a self-inflicted market
worship (yet another commodity largely exported by the US, but consumed there
quite parsimoniously and pragmatically!).
We are well aware that these modest proposals might be accused of conser-
vatism. However, for once we do not mind at all be in the camp of those who
try to defend and strengthen a system producing top level publicly funded open
science — too often under threat by both the ”property right” colonization and
the ”practical usefulness” advocates —, and, together, a pragmatic view of the
role that public policies might have in fostering the growth of corporate actors
able to efficiently tap an ever-growing pool of innovative opportunities.
References
Arrow, K.J. (1962). ”Economics of Welfare and the Allocation of Resources for
Invention.” In The Rate and Direction of Inventive Activity, edited by R. Nelson,
609-25. Princeton, N.J.: Princeton University Press.
Breschi S. and F. Lissoni (2001). ”Knowledge Spillovers and Local Innovation
Systems: A Critical Survey.” Industrial and Corporate Change, 10(4), 975-1005.
Burn, B.B, P.G. Altbach, C. Kerr, and J.A. Perkins (1971). Higher Education in
Nine Countries. New York: McGraw-Hill.
Bush, V. (1945). ”Science: The Endless Frontier.” Washington D.C.: Government
Printing Office.
33

Cohen, W.M., R.R. Nelson, and J.P. Walsh (2002). ”Links and Impacts: The
Influence of Public Research on Industrial R&D.” Management Science, 48(1),
1-23.
Dasgupta, P. and P. A. David (1994). ”Toward a new economics of science.” Re-
search Policy, 23, 487-521.
David, P.A. (1993). ”Knowledge property and the system dynamics of techno-
logical change.” In Proceeding of the World Bank Conference on Development
Economics, edited by L. Summers and S. Shah. p.215-248.
David, P.A. (1997). ”From market magic to calypso sciencepolicy. A review of
Terence Kealey’s The Economic Laws of Scientific Research.” Research Policy,
26, 229-255.
David, P.A. (2004). ”Understanding the emergence of open science institutions:
functionalist economics in historical context.” Industrial and Corporate Change,
13(3), 571-589.
Dernis, H., D. Guellec and B. van Pottelsberghe (2001), Using Patent Counts for
Cross-country Comparisons of Technology Output, STI Review No. 27, OECD,
Paris.
Dosi, G. (1982). ”Technological Paradigms and Technological Trajectories: A Sug-
gested Interpretation.” Research Policy, 11, 147-62.
Dosi, G. (1988). ”Sources, Procedures and Microeconomic Effects of Innovation.”
Journal of Economic Literature, 26, 1120-71.
34

Dosi, G., P. Llerena and M. Sylos Labini (2005). ”Science-Technology-Industry
Links and the ”European Paradox”: Some Notes on the Dynamics of Scientific
and Technological Research in Europe.” LEM Working Paper.
European Commission (1995). Green Paper on Innovation.
European Commission (2003). Third European Report on Science & Technology
Indicators. Directorate-General for Research.
European Commission (2004). ”Europe and Basic Research.” Comminicarion from
the Commission, November.
Etzkowitz, H. and L. Leytesdorff (1997). Universities in the Global Economy: A
Triple Helix of academic-industry-government relation. London, Croom Helm.
Florida, R. (1999). ”The Role of the University: Leveraging Talent, Not Technol-
ogy.” Issues in Science and Technology. Summer, 67-63.
Freeman, C. (1982). The Economics of Industrial Innovation. London, Francis
Pinter.
Freeman, C. (1994). ”The economics of technical change: a critical survey.” Cam-
bridge Journal of Economics, 18, 1-50.
Freeman, C. and L. Soete (1997). The Economics of Industrial Innovation. Third-
Edition. Cambridge, MIT Press.
Garfield, E. (1996). ”How can impact factors be improved?” British Medical Jour-
nal, 313, 411-13.
35

Geuna, A., A. Salter and W.E. Stainmuller (2003). Science and Innovation: Re-
thinking the Rationale for Funding and Governance. Cheltenham, Edward Elgar.
Henderson, R., A.B. Jaffe and M. Trajitenberg (1998). ”Universities as a Source
of Commercial Technology: a Detailed Analysis of University Patenting, 1965-
1988.” Review of Economics and Statistics, 80(1), 119-127.
Jaffe, A.B., M. Trajitenberg and R. Henderson (1993). ”Geographical Location of
Knowledge Spillovers as Evidenced by Patent Citations.” Quarterly Journal of
Economics, 108(3), 577-598.
Heller, M. and R. Eisenberg (1998). ”Can Patents Deter Innovation? The Anti-
commons in Biomedical Research.” Science 280, 698-701.
Hicks, D., A. Breitzman Sr, K. Hamilton and F. Narin (2000). ”Research Excel-
lence and Patented Innovation.” Science and Public Policy 27: 310-320.
King, D.A. (2004). ”The Scientific Impact of Nations.” Nature, 430, 311-316.
Klevorick, A.K., R.C. Levin, R.R. Nelson and S.G. Winter (1995). ”On the sources
and significance of interindustry differencies in technological opportunities.” Re-
search Policy, 24(2), 185-205.
Kline, S.J. and N. Rosenberg (1986). ”An Overview of Innovation.” In The Positive
Sum Strategy: Harnessing Technology for Economic Growth, Washington DC,
National Academy Press.
Malerba, F. (2004). Sectoral Systems of Innovation. Cambridge, Cambridge Uni-
versity Press.
36

Mansfield, E. (1995). ”Academic Research Underlying Industrial Innovations:
Sources, Characteristics, and Financing.” The Review of Economics and Statis-
tics, 77(1), 55-65.
May, R.M. (2004). ”Raising Europes Game.” Nature, 430, 831-832.
Merton, R.K. (1973). The Sociology of Science: Theoretical and Empirical Inves-
tigations. Chicago, University of Chicago Press.
Mokyr, J. (2002). The Gifts of Athena: Historical Origins of the Knowledge Econ-
omy. Princeton, Princeton University Press.
Mowery, D.C. and R.R. Nelson (1999). Sources of Industrial Leadership Cam-
bridge, Cambridge University Press.
Mowery, D.C. and B.N. Sampat (2005). ”Universities in National Innovation Sys-
tems.” In The Oxford Handbook of Innovation edited by J. Fagerberg, D.C.
Mowery, and R.R. Nelson. Oxford, Oxford Univerity Press. 209-239.
Mowery, D.C. and N. Rosenberg (1993). ”The U.S. National Innovation System.”
In Nelson (1993).
Narin, F., K. Hamilton and D. Olivastro (1997). ”The Increasing Linkage between
U.S. Technology and Public Science.” Research Policy 26: 317-330.
Nelson, R.R. (1959). ”The Simple Economics of Basic Scientific Research.” Journal
of Political Economy 67(2), 297-306.
Nelson, R.R. (1993). National Systems of Innovation: A Comparative Analysis.
New York, Oxford University Press.
37

Nelson, R.R. (2003). ”On the uneven evolution of human know-how.” Research
Policy, 32(6), 909-922.
Nelson, R.R. (2004a) ”The Market Economy, and the Scientific Commons.” Re-
search Policy, 33(3), 455-471.
Nelson, R.R. (2004b). ”Perspectives on Technological Evolution.” Forthcoming in
Principles of Evolutionary Economics, edited by K. Dopfer. Cambridge, Cam-
bridge University Press.
Nelson, R.R. and S.G. Winter (1982). An Evolutionary theory of Economic Change.
Cambridge, the Belknap Press of Harvard University Press.
OECD (2003). OECD Science, Technology and Industry Scoreboard. Organization
for Economic Co-operationand Development.
OECD (2004a). Main Science and Technology Indicators. Organization for Eco-
nomic Co-operationand Development.
OECD (2004b). OECD Information Technology Outlook. Organization for Eco-
nomic Co-operationand Development.
Pavitt, K. (1987). ”The Objectives of Technology Policy.” Science and Public Pol-
icy, 14, 182-188. Reprinted in Pavitt (1999) as ”The nature of Technology.”
3-14.
Pavitt, K. (1999). Technology, Management and Systems of Innovation. Northamp-
ton, Elgar.
38

Pavitt, K. (2001). ”Public Policies to Support Basic Research: What Can the Rest
of the World Learn from US Theory and Practice? (And What they Should not
Learn).” Industrial and Corporate Change, 10(3), 761-779.
Pavitt, K. (2003). ”Commentaries.” in Geuna et al. (2003).
Polanyi, M. (1962). ”The Republic of Science.” Minerva, 1, 54-74.
Rosenberg, N. (1976). Perspectives on Technology. Cambridge, Cambridge Univer-
sity Press.
Rosenberg, N. (1982). Inside the Black Box: Technology and Economics. Cam-
bridge, Cambridge University Press.
Saxenian, A. (1988) ”The Cheshire Cat’s Grin: Innovation and Regional Develop-
ment in England.” Technology Review 91, 67-75.
Winter, S.G. (1982). ”An essay on the theory of production.” in Economics and
the World Around It edited by S.H. Hymans. Ann Arbor, University of Michain
Press.
Winter, S.G. (1987). ”Knowledge and Competences as Strategic Assets.” In The
Competitive Challenge edited by D. Teece. Cambridge Mass, Ballinger.
Young, A. (2001). ”Improving Measures of Government Support to Industrial
Technology.” Science Technology Industry Review, 27, 147-183.
39