the relationship between workplace incivility
TRANSCRIPT

THE RELATIONSHIP BETWEEN WORKPLACE INCIVILITY AND STRAIN: EQUITY SENSITIVITY AS A MODERATOR
Jason Matthew Kain
A Thesis
Submitted to the Graduate College of Bowling Green State University in partial fulfillment of
The requirements for the degree of
Master of Industrial/Organizational Psychology
August 2008
Committee
Steve Jex, Advisor
Mike Zickar
Eric Dubow
ii
ABSTRACT
Steve Jex, Advisor
The current study tested the influence of equity sensitivity on the relationship
between experienced and perpetrated incivility and health outcomes (affective well-being
and depression). More specifically, it was hypothesized that “entitlement” would
moderate the relationship between both experienced and perpetrated incivility and
affective well-being and depression. Due to measurement limitations with the Equity
Sensitivity Instrument (ESI), a new measure, the Equity Sensitivity Questionnaire (ESQ)
was developed and tested to use in this study. Data was collected from 225 university
employees in 179 departments. Results indicated that people who are more highly
“entitled” tend to experience more incivility. Additionally, people who experience more
incivility tend to have lower levels of affective well-being. Results also showed that
people who experience more incivility also tend to engage in perpetrated incivility more
frequently. Moderator hypotheses were not supported using either the ESQ or ESI.

iii
I dedicate this thesis to those who lost their life in the Virginia Tech massacre on
April 16, 2007. In particular, I would like to name Ryan Clark and Maxine Turner, who
were close friends with my sister. I would also like to name Leslie Sherman, who was
raised in my home town of Springfield, VA. It is my hope that the wonderful lives these
people lived will be remembered forever, and that researchers will continue doing work
on incivility in an effort to one day eliminate needless violence.

iv
ACKNOWLEDGEMENTS
First and foremost, I would like to acknowledge my advisor Dr. Steve Jex.
Without his guidance, I would not have been able to complete this paper. I would also
like to thank him for being patient with me, and for helping me grow and develop as a
researcher. Additionally, I would like to thank Mike Zickar and Eric Dubow for their
helpful feedback, and for asking hard questions to help ensure this paper was as well
written as possible. I would also like to thank my family for their support throughout the
process. I would like to thank my grandfather Bernard Kain for offering me a home
away from home, for always being optimistic, and for teaching me that life can be fun
and challenging no matter what happens. I would also like to thank my parents and sister
for their unconditional love and support throughout the graduate school process. Finally,
I would like to thank my friends Kimberly and Tony Laurene, Jesse Erdheim, Heather
Forrester, Alina Foo, Sarah Peterson, and Byron Jose for being there for me throughout
this process. I could not have done this without their friendship and unconditional
support.

v
TABLE OF CONTENTS
Page
CHAPTER I: INTRODUCTION...............................................................................……………1
Potential Causes of Incivility .......................................................................……………2
Negative Effects of Workplace Incivility ....................................................……………4
The “Incivility Spiral” .................................................................................……………5
The Influence of Gender and Organizational Power ...................................……………6
Equity Sensitivity.........................................................................................……………8
The Current Study........................................................................................……………13
CHAPTER II: Methods..........................................................................................................……18
Participants…...........................................................................................................……18
Materials…….. ........................................................................................................……18
Procedure…….. .......................................................................................................……21
CHAPTER III: Results ..........................................................................................................……23
Descriptive Statistics……........................................................................................……23
Main Effects…….....................................................................................................……24
Moderated Hypothesis…….. ...................................................................................……25
CHAPTER IV: Discussion ....................................................................................................……29
Strengths/Limitations……......................................................................................……31
Ideas for Future Research…….. .............................................................................……32
Practical Implications……......................................................................................……34
REFERENCES ......................................................................................................................……35

vi
APPENDIX A. Results for the development of the Equity Sensitivity Questionnaire ........……56
Introduction.............................................................................................................…56
Method ........................................................................................……………….…...57
Participants..............................................................................................……….…...57
Materials .....................................................................................……………….…...57
Procedure ....................................................................................……………….…...58
Results.........................................................................................……………….…...58
Inter-Item Correlation Matrix for the “Entitled” Sub-Dimension ...........……….…...60
Means and Standard Deviations for the “Entitled” Sub-Dimension....………….…...61
Scree Plot for “Entitled” Sub-Dimension .............................................................…...62
Equity Sensitivity Questionnaire ..........................................................................…...63
APPENDIX B. Equity Sensitivity Instrument ......................................................................…...66
APPENDIX C. Experienced Workplace Incivility Scale .....................................................…...67
APPENDIX D. Instigated Workplace Incivility Scale ..........................................................…...68
APPENDIX E. Job-related Affective Well-being Scale........................................................…...69
APPENDIX F. The Depression Scale....................................................................................…...70
APPENDIX G. PANAS……………………………………………………….………...............71

vii
LIST OF FIGURES/TABLES
Figure/Table Page
1 Bivariate Correlations ……………………………………………………………… 44
2 Descriptive Statistics.................................................................................................. 45
3 Results of Moderated Multiple Regression: Interaction Between Experienced
Incivility and ESQ “Entitlement”. Affective Well-Being is the Outcome
Variable ….................................................................................................................. 46
4 Results of Moderated Multiple Regression: Interaction Between Experienced
Incivility and ESI “Entitlement”. Affective Well-Being is the Outcome
Variable…………………………………………………………………………....... 47
5 Results of Moderated Multiple Regression: Interaction Between Experienced
Incivility and ESQ “Entitlement”. Depression is the Outcome
Variable………………………………………………………………….................... 48
6 Results of Moderated Multiple Regression: Interaction Between Experienced
Incivility and ESI “Entitlement”. Depression is the Outcome
Variable ………….………………………………………………………………...... 49
7 Results of Moderated Multiple Regression: Interaction Between Experienced
Incivility and ESQ “Entitlement”. Perpetrated Incivility is the Outcome
Variable …………………………………………………………………………...... 50
8 Results of Moderated Multiple Regression: Interaction Between Experienced
Incivility and ESI “Entitlement”. Perpetrated Incivility is the Outcome
Variable ……………………………………………………………………….......... 51

viii
9 Results of Moderated Multiple Regression: Interaction Between Perpetrated
Incivility and ESQ “Entitlement”. Affective Well-Being is the Outcome
Variable …………………………………………………………………………....... 52
10 Results of Moderated Multiple Regression: Interaction Between Perpetrated
Incivility and ESI “Entitlement”. Affective Well-Being is the Outcome
Variable …………………………………………………………………………....... 53
11 Results of Moderated Multiple Regression: Interaction Between Perpetrated
Incivility and ESQ “Entitlement”. Depression is the Outcome
Variable …………........................................................................................................ 54
12 Results of Moderated Multiple Regression: Interaction Between Perpetrated
Incivility and ESI “Entitlement”. Depression is the Outcome
Variable …................................................................................................................... 55

CHAPTER I: INTRODUCTION
Discourteous behaviors in the workplace such as rude comments, thoughtless acts,
and negative gestures are becoming more prevalent (Blau & Anderson, 2005; Andersson
& Pearson, 1999; Cortina, Magley, Williams, & Langhout, 2001; Johnson & Indivik,
2001). This type of behavior is known as workplace deviance, and can result in harm to
both the individuals in an organization, and the organization itself (Robinson & Bennett,
2005). Workplace deviance can range from mild behavior such as ignoring someone to
more severe behaviors such as violence.
Andersson and Pearson (1999) defined mild workplace deviance behaviors as
workplace incivility. More specifically, workplace incivility is “low intensity behavior
with ambiguous intent to harm in violation of the workplace norms for respect”
(Andersson & Pearson, 1999, p.456). Often times people who are highly emotionally
reactive (sensitive to insults, easily offended, perceiving threats in seemingly innocent
exchanges) are more likely to be both victims and perpetrators of incivility (Blau &
Andersson, 2005). Examples of workplace incivility include ignoring a colleague,
spreading rumors, writing disrespectful E-mails to co-workers, or addressing someone
unprofessionally. Incivility has been shown to lead to a wide variety of negative
consequences including lower levels of affective well-being and higher levels of
depression (Bowling & Beehr, 2006; Pearson, Andersson, & Wegner, 2001).
In addition to perceiving higher rates of incivility, emotionally reactive people
have also been shown to perceive equity differently (Huseman, Hatman, & Miles, 1987;
King & Miles, 1994). Adams (1965) proposed that people desire an equal ratio between
effort and rewards among their colleagues; when people do not perceive an equal ratio,

2
they restore equity by changing their own effort and rewards or the efforts and rewards of
the people they compare themselves to. Adams (1965) also mentioned that there might
be individual differences in the way people perceive equity. Huseman, Hatfield, & Miles
(1987), built the preference component into equity theory by developing the concept of
equity sensitivity. Equity sensitivity explains that the individual differences in people’s
perceptions of equity that can be measured by three sub-dimensions. More specifically,
some people perceive equity as giving more than they receive (“benevolent”), some
people perceive equity as giving as much as they receive (“equity sensitive”), and some
people perceive equity as receiving more than they give (“entitled”) (Huseman, et al,
1987; King et al, 1994). In general, research shows that people who rate themselves as
more highly “entitled” tend to be more emotionally reactive when they perceive they are
not receiving the largest reward for their effort relative to others (Huseman et al, 1987;
King et al, 1994).
Although it has been shown that perpetrators and victims of incivility as well as
people who are more highly “entitled” have characteristics such as emotional reactivity in
common (Anderrson et al, 1999; Blau et al, 2005; Cortina et al, 2001; Huseman et al,
1987; King et al, 1994), no research to date has examined the relationship between equity
sensitivity and incivility. The purpose of the current study is to examine how
“entitlement” influences the relationship between incivility and both affective well-being
and depression.
Potential causes of incivility
People’s temperament can make them more prone to be both victims and
perpetrators of incivility (Andersson & Pearson, 1999; Blau & Andersson, 2005). For

3
example, individuals with a low ability to self-regulate can be impulsive and are more
likely to use verbal slurs and coercive actions when they experience incivility (Andersson
& Pearson, 1999). Also, people who are highly emotionally reactive are more likely to
commit acts of incivility because they are more sensitive to insults, more likely to
experience violations of interactional injustice, and experience higher levels of negative
affect (Blau & Andersson, 2005).
In addition to temperament, Pearson, Andersson, and Porath (2005) outline many
environmental factors that lead to perceived incivility such as less company loyalty, low
retention, short-term profitability, and informality. These environmental factors lead to
less confidence and trust among workers, resulting in employees who are much more
concerned with meeting their own needs than the needs of their colleagues (Pearson,
Andersson, & Porath, 2005). In addition, organizational cultures are becoming more
informal, which is making uncivil actions more tolerable. For example, Andersson and
Pearson (1999) point out that in more formal cultures, management enforces regulations
for employees to regulate their speech, exhibit emotional restraint, and keep a
professional demeanor by keeping information about employee’s private lives outside the
company. When companies create informal cultures, there is more ambiguity about what
is considered acceptable interpersonal interaction, which can make incivility more
tolerable.
Other factors leading to increased incivility include change initiative such as
downsizing, contract labor, freelancing, outsourcing, and job hopping (Blau & Anderson,
2005). These pressures have led to less job security which may make employees angry,
tense, and fearful (Andersson et al, 1999). In addition, technology such as E-mail allows

4
for impersonal interactions and makes people less nervous about saying negative things
about colleagues (Pearson, Andersson, & Porath, 2005).
Negative Effects of Workplace Incivility
In a poll reported by one study on incivility, 90 percent of respondents believed
that incivility was a problem and 75 percent believed that it was getting worse (Pearson,
Andersson, & Porath, 2000). Even though incivility is low-intensity, it diminishes the
effectiveness of the target and co-workers around them. For example, one-half of victims
in the poll indicated that they wasted time thinking about the perpetrator and one-fourth
of them reported wasting time avoiding the perpetrator (Pearson et al, 2000).
In addition to decreasing effectiveness, incivility also leads to poorer health
among employees. There are generally three attributions victims make about the causes
of incivility that can result in different health outcomes; that the incivility is caused by
their own actions because they are the only victim, the incivility is caused by the
perpetrator because he/she is engaging in incivility behaviors towards multiple people,
and the incivility is caused by the organization because there are multiple perpetrators
and victims (Bowling & Beehr, 2006). If victims blame themselves for the incivility,
they usually have increased levels of depression and decreased self-esteem (Bowling &
Beehr, 2006). When victims attribute the cause of the incivility to the perpetrator, they
experience perceptions of unfairness or interactional injustice. As a result of these
perceptions, victims feel ignored, withdraw from, distanced, depressed, and moody
(Bowling & Beehr, 2006; Pearson, Andersson, & Wegner, 2001).
When the victims are blaming the organization for incivility occurring in the
workplace, it is not uncommon to see mass participation in incivility throughout the

5
organization, which decreases productivity, satisfaction, cooperation, and collaboration
on a larger scale (Bies, 2000; Bies & Moag, 1986; Pearson et al, 2001). Any of the
multiple forms of the three attributions of incivility over a repeated time period can lead
to poor interpersonal relationships at work, higher levels of negative affect, absenteeism,
reduced commitment, anxiety, depression, burnout, decreased productivity, stealing from
the organization, and turnover (Bowling & Beehr, 2006; Pearson et al, 2000).
There are also costs of incivility associated with being a perpetrator. For
example, if the perpetrator is working on a team project with the victim and the
performance of each person is dependent on each other, the decreased performance of the
victim also hurts the performance of the perpetrator (Pearson & Porath, 2001). Any time
the perpetrator spends hurting the victim is time away from the tasks they are supposed to
be performing, but usually the amount of time is trivial. Also, the victims have a
tendency to avoid the perpetrator, which decreases necessary contact in a context where
they need to work as a team (Pearson & Porath, 2001).
The “Incivility Spiral”
It is not uncommon for victims to respond to incivility by becoming perpetrators
themselves. For starters, Andersson and Pearson (1999) point out that violence in the
workplace is usually due to a series of escalating incivility episodes rather than just
spontaneous acts of violence. For example, one-fourth of incivility perpetrators were
reported making threats to their targets, and in response it was not uncommon for victims
to report stealing items from the perpetrator (Pearson et al, 2000). A series of incivility
episodes starts when someone breeches the norms of respect causing the person on the
receiving end of the breech to perceive a violation of interactional injustice (Bies &

6
Moag, 1986). Interactional justice is when people perceive that communication norms
have been violated (Cropanzano & Byrne, 2001). Employees who are highly emotionally
reactive tend to be more likely to see behaviors as violations of interactional injustice.
Emotionally reactive employees see more violations of interactional injustice because
they tend to inflate the severity of their interpretations of actions that might be uncivil,
and they perceive these actions as an attack on their attributes and social identity
(Andersson & Pearson, 1999).
When initial actions of incivility are seen as unprovoked and interpreted as
stronger than they were intended to be, the victim will sometimes choose to engage in
more severe actions to get revenge on the perpetrator. Andersson and Pearson (1999)
referred to these types of interactions as “incivility spirals”. If “incivility spirals” escalate
far enough, they reach what is referred to as a “tipping point” at which employees
become aggressive and even violent towards each other (Andersson & Pearson, 1999).
An example of an incivility spiral with a tipping point would begin with worker A
ignoring worker B, who responds by insulting worker A over a period of time. In return,
worker A would become increasingly frustrated and retaliate by stealing from worker B,
which results in worker B retaliating by destroying property belonging to working A
(Pearson, Andersson, & Porath, 2000). If “incivility spirals” escalate too far and for too
long, they can lead to more severe forms of workplace deviance such as violence
(Andersson et al, 1999).
The Influence of Gender and Organizational Power
Although men and women are equally as likely to be targets of incivility, male
targets tend to respond more aggressively than female targets toward the perpetrator of

7
the incivility (Tedeschi & Felson, 1994. For example, male targets are more likely to
respond to incivility by withholding information and attempting to ruin the perpetrators’
reputation, whereas women are more likely to avoid the perpetrator. Males often times
attempt to ruin the reputation of the perpetrator by telling their subordinates and other
colleagues about what the perpetrator is doing to them (Pearson, Andersson, & Porath,
2005). Male interactions of incivility are more likely to produce incivility spirals that
can actually lead to violent actions (Neuman & Barron, 1998).
For females, experienced incivility is often closely linked to sexual harassment
(Lim & Cortina, 2005). The similarity in incivility and sexual harassment that links them
together is the idea that in both forms of mistreatment, the perpetrator is attempting to
debase their victim and increase their social advantage and dominance. Although both
incivility and sexual harassment are associated with negative mood, cognitive distraction,
fear, decreased productivity, anxiety, depression, and turnover, these outcomes are
increased in severity when sexual harassment and incivility co-occur (Lim & Cortina,
2005).
Victims of workplace incivility are also more likely to be individuals in positions
of lower power (Aquino, Galperin, & Bennett, 2004; Cortina, Magley, Williams, &
Langhout, 2001; Lim & Cortina, 2005; Pearson, 2000). People with higher status and
more resources are more resistant to workplace incivility. People of lower status are
more defensive of their status, and do not necessarily have the resources to resist the
incivility (Pearson, Andersson, & Wegner, 2001). When they perceive a threat to their
status, they feel shame and are more likely to retaliate against the person who caused
8
them problems (Aquino, Galperin, & Bennett, 2004). People frequently targeted are
reported being younger, single, female, and or ethnic minority.
When employees engaging in intentional workplace incivility behaviors are
supervisors, the behavior is known as abusive supervision (Tepper, 2000). Abusive
supervision is a subordinate’s perception of the extent to which their supervisors engage
in hostile behaviors towards them like lying, coercion, public criticism, and rudeness,
(Tepper, 2000). Higher levels of abusive supervision lead to lower organizational based
self-esteem, which is the extent to which employees have their job-based needs satisfied.
Abusive supervision and incivility, lead to many consequences for the victims
including higher levels of psychological strain, decreased work effort, and avoiding co-
workers (Blau & Andersson, 2005; Cortina & Magley, 2001; Johnson & Indivik, 2001;
Stoner & Perrewe, 2006). Abusive supervision has also been linked to lower job
satisfaction and commitment, and higher levels of counterproductive behavior and
turnover (Cox, 1991). Although abusive supervision and incivility share many of the
same consequences, abusive supervision is a different construct that was not included in
the study.
Equity Sensitivity
One of the motivational theories that could help explain why people engage in
discourteous behavior is equity theory. Equity theory states that people compare the ratio
of their efforts and their rewards to the perceived ratio of referent others and experience
tension when these ratios are not equal (Adams, 1965). People are motivated to decrease
the tension by changing their own effort, changing the referent other they compare
themselves to, or influencing the efforts of referent others. For example, if someone’s

9
inputs are greater than their output, they may ask for more rewards, decrease their effort,
change their referent other, or try to decrease the reward of their referent other. If
people’s outputs are greater than their inputs, they feel guilt and may work harder to even
the ratio or change their referent other. Adams (1965) initial definition of equity theory
stated that one reason employees might engage in deviant acts involves individual
differences in the perception of equity, but did not elaborate on what these individual
differences and their antecedents and consequences were.
One area that helped to build a greater understanding of equity theory is
organizational justice (Cropanzano, et al, 2001). Organizational justice addresses
whether or not members of the organization feel they are being treated fairly. There are
three events that are judged in terms of fairness: Outcomes, process, and personal
interactions. Distributive justice is when people judge the fairness of outcomes,
procedural justice is when people judge processes, and interactional justice and
informational justice is when people judge interactions. Judgments of interactional
justice as based on respectfulness of communication with supervisors and fellow
employees and judgments of informational justice are based on how well supervisors
justify their decisions to employees.
Perceptions of injustice can partially be explained by equity theory (Cropanzano
et al, 2001). For example, when an employees’ referent other is making more money
than them for the same amount of work, they may perceive the situation as a violation of
distributive justice (Cropanzano et al, 2001). When an employee must go through three
interviews to get a promotion whereas their referent other gets one without any
interviews, the employee may perceive the situation as a violation of procedural justice.
10
When an employee’s boss gives more attention, assistance, and praise to his or her
referent other for doing the same amount and quality of work, the employee may perceive
the situation as a violation of interactional justice. When an employee’s boss makes a
decision to promote an employees referent other instead of them and does not explain
why, the employee would perceive the situation as a violation of informational justice.
Although violations of justice can partially be explained by equity theory, equity
theory does not completely explain people’s differences in preferences and tolerance of
inequity. To build a preference component into equity theory, Huseman, Hatfield, and
Miles (1987) took equity theory one step further by introducing the construct of equity
sensitivity. Equity sensitivity is based on the notion that not all people conform equally
to the norms of the equity theory. For example, Leventhal (1976) outlined three different
norms for reward distribution rules: The contribution (equity) rule, the needs rule, and the
equality rule. The contribution, or equity rule conforms to equity theory but the needs
and equality rules do not. The needs rule states that rewards should be distributed based
on people’s needs and the equality rule states that rewards should be distributed equally
regardless of people’s inputs.
Due to demographic and personality variables, people do not necessarily conform
to the contribution (equity) rule. Demographic variables such as nationality, age and sex,
and personality traits such as the protestant work ethic, Machiavellianism, self-esteem,
and interpersonal orientation all influence the equity rules that people endorse (Huseman
Hatfield, & Miles, 1987). Nationality has been shown to influence how people perceive
equity in that when Dutch employees were compared to American employees, the
Americans were more concerned with self-gain (Weick, Bougon, & Maruyama, 1976).

11
Age has been shown to influence how people perceive equity in that children under 13 do
not conform to the rules of equity ratios. Children do not conform because they are using
other standards such as needs to base their equity decisions or because they are not
cognitively developed enough to calculate equity ratios (Hook & Cook, 1979). Gender
has been consistently shown to influence how people perceive equity in that females are
more likely to reward themselves less and work harder for the same output as males
(Austin & McGinn, 1977; Callihan, Levy & Messe, 1979; Major, McFarlin, & Gagnon,
1984). People who are high on Machiavellianism value gaining the most even when they
do not have to work for it, but those high in the protestant work ethic and self-esteem
tend to value working hard for their money (Greenburg, 1979). People with a higher
interpersonal orientation are interested and reactive to the needs of others but people with
a low interpersonal orientation are more concerned with economic gain than with the
needs of others (Swap & Rubin, 1983). Also, individual differences in whether or not
employees view ambiguous job elements as incomes or as outcomes effect their
perceived income to outcome ratio. People who see ambiguous job elements as outcomes
will tend to try and compensate for the outcome by putting in more effort (Huseman et al,
1987). Employees who see ambiguous job elements as incomes will have higher
expectations for their outcomes. Based on demographic and personality variables, people
seek out situations that match their internal standards for equity.
The concept of equity sensitivity is based on the idea that there are individual
differences in the ways people perceive and respond to equity, and that these preferences
are influenced by characteristics such as nationality, age and sex, protestant work ethic,
Machiavellianism, and self-esteem, (Huseman et al, 1987; King et al, 1994). Equity

12
sensitivity explains individual differences in equity in terms of three sub-dimensions:
“benevolent”, “equity sensitive”, and “entitled” employees. Employees who are highly
“benevolent” prefer their ratio of inputs to outputs to be lower than others (Huseman et
al, 1987). Individuals who are more highly “benevolent” prefer this equity ratio because
of one of three reasons: They are cooperative and want the organization to do well, they
experience other peoples’ emotions vicariously and want to help them out, or they are
concerned with their own self-interest and want social approval and to improve their own
image (Huseman et al, 1987). Employees who are highly “equity sensitive” prefer for
their ratio of inputs and outputs to be equal to others. They generally prefer this equity
ratio because they feel distress when they are under-rewarded and guilt when they are
over-rewarded. Employees who are highly “entitled” have higher standards which lead
to preferring a greater output relative to others (Huseman et al, 1987). In general, people
who are highly “entitled” are higher in negative affect, have a higher sensitivity to
differences in rewards, are more emotionally reactive, and are willing to lie or cheat or
receive the highest reward (Huseman et al, 1987; King, Miles, & Day, 1994; Mudrack,
Mason, & Stepanski, 1999). People who are highly “entitled” prefer an equity ratio in
their favor for three reasons: A change in cultural values after World War II that
promoted getting ahead while doing as little as possible, an overly permissive parenting
style that promotes receiving instead of giving, and the fact that we live in an “age of
anxiety” where the future is uncertain encouraging some people to get as much as they
can while they can (Huseman, Hatman, & Miles, 1987).
King, Miles, and Day (1993) modified the idea of equity sensitivity by changing
the idea of preferring to be under-rewarded or over-rewarded to tolerating it. According

13
to this modification, people who are highly “benevolent” do not prefer, enjoy, or perceive
being under-rewarded as equitable, but they have a much higher tolerance for being
under-rewarded than people who are highly “equity sensitive” or highly “entitled”. For
example, employees who are highly “benevolent” do not prefer to be under-rewarded and
may even feel distress when they are, but because they have a higher tolerance for being
under-rewarded than highly “equity sensitive” or “entitled” employees they are much less
likely to taken action to restore equity. Employees who are highly “entitled” are more
tolerant towards being over-rewarded and less tolerant towards being under-rewarded
than “equity sensitive” or “benevolent” employees (King et al, 1993).
Equity sensitivity has been studied in a variety of contexts including personality
(Huseman et al, 1987; Konovsky & Organ, 1996; Miles, Hatfield, & Huseman, 1994;
Mudrack, Mason, & Stepanski, 1999), teamwork (Bing & Burroughs, 2001; Colquitt,
2004), leadership, cross-culturally (Allen Takeda, & White, 2005; Ambrose & Kulick,
1999; Fok, Hartman, Villere, & Friebert, 1996; VanDierendock, Shaufeli, & Sixma,
1994; Weick, Bougon, & Maruyama, 1976; Yamaguchi, 2003), organizational justice
(Blakely, Andrews, & Moorman, 2005; Colquitt, 2005), and reactions to inputs/outputs
(Allen & White, 2002; Miles et al, 1989; Shore, 2004)
The Current Study
People who are highly “entitled”, and people who are victims and perpetrators of
incivility are both emotionally reactive, perceive lower levels of organizational injustice,
and engage in deviant behaviors (Andersson & Pearson, 1999; Blakely et al, 2005;
Colquitt, 2005; Huseman et al, 1987; King et al, 1994; Pearson et al, 2001). In fact,
Mudrack, Mason, and Stepanski (1999) even outline the fact that employees who are

14
highly “entitled” are more likely to engage in deviant behavior such as lying and
cheating. Because of these similarities, equity sensitivity and incivility should be related
to each other, but no current research to date has focused on how they might be related.
The purpose of the proposed study is to establish the relationship between equity
sensitivity and workplace incivility.
Because employees who are highly “entitled” and employees who rate themselves
higher in experienced and perpetrated incivility tend to be emotionally reactive (having a
higher sensitivity to behavior that might be considered insulting or unclear), are generally
higher in negative affect (Blau et al, 2005; Andersson et al, 1999; Hunter et al, 2007;
Huseman et al, 1987; King et al, 1994) and are willing to engage in deviant behavior
(Bowling et al, 2006; Blau et al, 2005; Huseman et al, 1987; King et al, 1994; Mudrack et
al, 1999), they should be more likely to experience and perpetrate incivility.
Hypothesis 1a: High levels of “entitlement” will be related to higher amounts of
perceived experienced incivility
Hypothesis 1b: High levels of “entitlement” will be related to higher amounts of
perceived perpetrated incivility
Past studies have shown that high levels of psychological strain such as anxiety
and depression are associated with workplace incivility (Blau & Andersson, 2005;
Cortina & Magley, 2001; Johnson & Indivik, 2001; Rossi, Perrewe, & Sauter, 2006).
Because of these past findings, higher levels of experienced incivility should lead to
higher levels of depression and lower levels of affective well-being.
Hypothesis 2a: Employees who have higher levels of experienced incivility will
report higher levels of depression.

15
Hypothesis 2b: Employees who have higher levels of experienced incivility will
report lower levels of affective well-being.
Often times perpetrators of incivility (Andersson et al, 1999) are attempting to
protect their social identity, especially when they are retaliating, so levels of perpetrated
incivility should be related to lower levels of depression and higher levels of affective
well-being.
Hypothesis 3a: Employees who have higher levels of perpetrated incivility will
report lower levels of depression.
Hypothesis 3b: Employees who have higher levels of perpetrated incivility will
report higher levels of well-being.
According to the “incivility spiral”, people who experience incivility often times
reciprocate in order to protect their social identity (Andersson et al, 1999; Hunter et al,
2007). It is expected that this research finding will be replicated in the current study
Hypothesis 4: Higher levels of experienced incivility will be significantly
positively related to higher levels of perpetrated incivility.
Both higher levels of “entitlement” and incivility have been associated with
higher levels of negative affect and having a higher sensitivity to behavior that might be
considered insulting or unclear (Andersson et al, 1999; Cortina et al, 2001; Huseman et
al, 1987; King et al, 1994); Because of these similarities, levels of “entitlement” should
influence the relationship between incivility and its negative outcomes such as depression
and lower levels of affective well-being.
Hypothesis 5a: The relationship between incivility and affective well-being will
be moderated by the “entitlement” dimension of equity sensitivity. More

16
specifically, the relationships between incivility and affective well-being will be
strongest among employees who report high levels of “entitlement” and weakest
among employees who report low levels of “entitlement”. For employees who
report moderate levels of “entitlement”, the relationship should be moderate.
Hypothesis 5b: The relationship between incivility and depression will be
moderated by the “entitlement” dimension of equity sensitivity. More
specifically, the relationships between incivility and depression will be strongest
for employees who report higher levels of “entitlement” and weakest among
employees who report low levels of “entitlement”. For employees who report
moderate levels of “entitlement”, the relationship should be moderate.
Past research on the “incivility spiral” indicates that people who experience
incivility often times retaliate and become perpetrators themselves (Andersson et al,
1999; Hunter, Penney, Raghurum, Ugaz, & Malka, 2007). What happens is emotionally
reactive victims tend to perceive more behaviors as uncivil and as an attack on their
social identity; In order to protect that social identity they retaliate (Andersson et al,
1999; Hunter et al, 2007). The result of the retaliation is that the original perpetrator
retaliates back and the “incivility spiral” begins (Andersson et al, 1999; Hunter et al,
2007). As noted earlier, people who are highly “entitled” also tend to be more
emotionally reactive (likely to perceive interpersonal interactions as insulting) and are
likely to engage in deviant behaviors such as lying and cheating to restore equity
(Huseman et al, 1989; Mudrack at al, 1999). Because people who are highly “entitled”,
as well as perpetrators of incivility, are more likely to retaliate against behavior they
perceive to be insulting in order to restore their social identity and/or equity (Andersson

17
et al, 1999; Hunter et al, 2007; Mudrack et al, 1999), higher levels of “entitlement”
should influence the relationship between perpetrated incivility and affective well-being
and depression
Hypothesis 6a: The relationship between experienced incivility and perpetrated
incivility will be moderated by the “entitlement” dimension of equity sensitivity.
More specifically, the relationships between experienced incivility and
perpetrated incivility will be strongest among employees who report high levels
of “entitlement” and weakest among employees who report low levels of
“entitlement”. For employees who report moderate levels of “entitlement”, the
relationship should be moderate.
Hypothesis 6b: The relationship between perpetrated incivility and affective well-
being will be moderated by the “entitlement” dimension of equity sensitivity.
More specifically, the relationships between perpetrated incivility and affective
well-being will be strongest among employees who report high levels of
“entitlement” and weakest among employees who report low levels of
“entitlement”. For employees who report moderate levels of “entitlement”, the
relationships should be moderate.
Hypothesis 6c: The relationship between perpetrated incivility and depression will
be moderated by the “entitlement” dimension of equity sensitivity. More
specifically, the relationships between perpetrated incivility and depression will
be strongest among employees who report higher levels of “entitled” and weakest
among employees who report low levels of “entitlement”. For employees who
report moderate levels of “entitlement”, the relationship should be moderate.

18
CHAPTER II: METHODS
Participants
The sample for the current study was recruited from faculty and staff at a mid-
western University. In order to participate, each subject must have been currently
employed by the University. The sample included 225 university employees.
Participants were between the age of 19 and 68 and the sample was 23.8% male and
68.2% female. 193 different job titles from 179 different departments were included with
Secretaries (N=38), Directors (N=22), Associate professors (N=10), Managers (N=12),
and Janitors (N=11) being the most frequent participants.
Materials
One instrument used to measure the “entitled” dimension of equity sensitivity was
the Equity Sensitivity Instrument (ESI) (King & Miles, 1994). The entire Equity
Sensitivity Instrument is contained in appendix B. The other measure used for equity
sensitivity, the Equity Preference Questionnaire (Sauley et al, 2000) was not used
because research notes that the only study to ever use it was its development study and it
has been criticized for measuring alternative constructs (Foot et al, 2006). The Equity
Sensitivity Instrument is a five item measure in which each item contains one
“benevolent” statement and one “entitled” statement. Examples of questions include “It
would be more important for me to A) help others or B) Look out for my own good”.
Participants are asked to allocate 10 points between the two statements for every item.
“Entitled” scores were calculated by tabulating the amount of points allocated to the
entitlement dimension of each question and dividing by the number of questions.

19
For the current study, the “entitled” dimension of equity sensitivity was also
measured with the newly developed Equity Sensitivity Questionnaire (ESQ). Foot and
Harmon (2006) noted problems in the current equity sensitivity measures that were
serious enough to warrant developing a new measure such as sample dependent cut
scores and tapping into alternative constructs. A new measure known as the Equity
Sensitivity Questionnaire was developed for the current study to address these issues.
Information on the development of the ESQ is contained in appendix A. The Equity
Sensitivity Questionnaire (ESQ) is a 13 item questionnaire on equity sensitivity with 4
items designed to measure the “benevolent” sub-dimension, 5 items designed to measure
the “equity sensitive” sub-dimension, and 4 items designed to measure the “entitlement”
sub-dimension. Respondents are asked to indicate on a 5 point likert scale ranging from
1(least) to 5(most) how consistent the item is with their attitudes towards
work/employment. An example of a “benevolent” question is “I do not mind giving
more to the organization than I get back in return”, an example of an “equity sensitive”
question is “I should receive and contribute to the organization equally”, and an example
of an “entitled” question is “I don’t mind receiving more than I give to the organization”.
Experienced incivility was measured with the Workplace Incivility Scale (WIS)
(Cortina et al., 2001). The entire Workplace Incivility Scale is contained in appendix C.
The Workplace Incivility Scale (WIS) is a seven item scale on a 4 point likert scale. The
scale asks the following question: How often has someone at work (supervisor, co-
worker, other employee) done the following to you in the past year …1) Put you down or
act condescending toward you 2) paid little attention to statements you make and show
little interest in your opinion 3) Made rude or demeaning remarks about you 4) addressed

20
you in unprofessional terms either privately or publicly 5) Ignored or excluded you from
professional camaraderie 6) Doubted your judgment in a matter over which you have
responsibility 7) Made unwanted attempts to draw you into personal matters. On the
likert scale, 1=hardly ever (once every few months or less), 2= rarely (about once a
month), 3= sometimes (at least once a week), and 4=frequently (at least once a day).
Perpetrated incivility was measured using the Instigated Workplace Incivility
Scale (WIS) (Blau & Anderson, 2005). The entire Instigated Workplace Incivility Scale
is contained in appendix D. The Instigated Workplace Incivility Scale a seven item scale
on a 4 point likert scale. The scale asks the following question: How often have you
exhibited the following behaviors in the past year to someone at work…1) Put you down
or act condescending towards you 2) paid little attention to statements you make and
show little interest in your opinion 3) Made rude or demeaning remarks about you 4)
addressed you in unprofessional terms either privately or publicly 5) Ignored or excluded
you from professional camaraderie 6) Doubted your judgment in a matter over which you
have responsibility 7) Made unwanted attempts to draw you into personal matters. On
the likert scale, 1=hardly ever (once every few months or less), 2= rarely (about once a
month), 3= sometimes (at least once a week), and 4=frequently (at least once a day).
Affective well-being was measured using the Job Related Affective Well-Being
Scale (JAWS) (Van Katwyk, Fox, Spector, & Kelloway, 2000). The entire JAWS is
contained in appendix E. The JAWS is a 30 item scale that assesses people’s affective
feelings towards their job. Items are scored on a 1-5 likert scale with the anchors of
never, rarely, sometimes, quite often, and extremely often or always. Some sample items

21
are “My job made me feel annoyed”, “my job made me feel anxious”, and “my job made
me feel frustrated”.
Depression was measured using the Depression Scale (Quinn & Shephard, 1974).
The entire Depression Scale is contained in appendix F. The Depression Scale is a scale
asking participants about their experiences with 20 depression symptoms at work during
the previous 30 days. Some of the symptoms items reported on include “I get tired for no
reason,” “I am more irritable than usual” and “I feel downhearted, blue, and sad.”
Participants rank these items on a 1-4 likert scale. The scores from the 20 scores are
summed up and converted into percentages by the “SDS” index. Percentages under 50
are considered not depressed, 50-59 is considered mild depression, 60-69 is moderate
depression, and 70 or above is considered severe depression.
Negative affect was measured using The Positive and Negative Affect Schedule
(PANAS) (Watson, Clark, & Tellegen, 1988) The entire PANAS is contained in
appendix G. The PANAS is an instrument that assessing positive and negative affect by
listing a number of words such as “upset” and asking participants to rate how they feel at
the present moment on a likert scale of 1-5. The likert scale ranges from very slightly or
not at all (1) to extremely (5). The instrument is divided into two parts: one assessing 10
positive words such as “proud” and one assessing 10 negative words such as “distressed”.
Procedure
For participants, faculty members were recruited by E-mail. E-mails were sent to
93 department heads with a request for the E-mail to be forwarded to their faculty
members. If the faculty were interested in participating, they responded to the E-mail.
After receiving the E-mail indicating interest, the researcher E-mailed the consent form
22
along with copies of the surveys to the faculty member. Faculty members either returned
their survey through E-mail or through campus mail. Only ten faculty members
responded from eight departments. Three faculty members responded from the consumer
science department, and one faculty member from the psychology, history, popular
culture, college of health and human services, sociology, women’s studies, and human
services departments responded. It is unknown whether all of the department heads
actually chose to forward the E-mail so for the faculty the response rate is unknown. For
University staff, the surveys and consent form were mailed out through campus mail to
1200 staff members with a return envelope. People interested in participating filled out
the survey, signed the consent form, put the documents in the return envelope, and mailed
the envelope back to the researcher. In total, 201 staff members participated, which
yielded approximately a 17% response rate.

23
CHAPTER III: RESULTS
Results were analyzed using both the newly developed Equity Sensitivity
Questionnaire (ESQ) and the Equity Sensitivity Instrument (ESI) to examine where there
would be differences in results. Cronbach’s alpha for the four ESQ items was .82.
Cronbach’s alpha for the five items used to assess entitlement on the ESI was .65. Item 3
was not included in the analysis, which increased Cronbach’s alpha to .80. For all
hypothesis, age, gender, and negative affect were used as control variables because past
research indicates these variables influence both equity sensitivity and experienced and
perpetrated incivility (Allen Takeda, & White, 2005; Ambrose & Kulick, 1999;
Andersson & Pearson, 1999; Cortina et al., 2001; Fok, Hartman, Villere, & Friebert,
1996; Huseman et al, 1987; Lim & Cortina, 2005; Pearson et al., 2000; Pearson et al.,
2001; VanDierendock, Shaufeli, & Sixma, 1994; Weick, Bougon, & Maruyama, 1976;
Yamaguchi, 2003).
Descriptive Statistics
Bivariate correlations are presented in Table 1 and descriptive statistics are
presented in table 2. As can be seen in table 1, there were significant correlations
between ESQ “entitlement” and experienced incivility (r= .23), experienced incivility and
affective well-being (r=-.20), experienced incivility and perpetrated incivility (r=.41), and
perpetrated incivility and affective well-being (r=.22). There was some range restriction
for the negative affect (M=1.45, SD=.62), experienced incivility (M=1.81, SD=.70),
perpetrated incivility (M=2.31, SD=1.22), and ESQ entitled (M=1.94,SD=1.51) scales.
For all scales, cronbach’s alpha ranged from .76 to .90. Although the correlations were
significant, all hypotheses were reported using regression because variables that influence

24
incivility and “entitlement such as age, gender, and negative affect could be controlled
for (Allen Takeda et al, 2005; Ambrose et al, 1999; Andersson et al, 1999; Cortina et al.,
2001; Fok, et al, 1996; Huseman et al, 1987; Lim et al, 2005; Pearson et al., 2000;
Pearson et al., 2001; VanDierendock, et al, 1994; Weick, et al, 1976; Yamaguchi, 2003).
Main Effects
Hypothesis 1a tested whether higher levels of “entitlement” predicted higher
levels of experienced incivility. For analysis using the ESQ, “entitlement” significantly
predicted experienced incivility (ΔR² =.03, ΔF = 6.35, p =.01), supporting hypothesis 1a.
Hypothesis 1b tested whether or not higher levels of “entitlement” predicted higher levels
of perpetrated incivility. Higher levels of ESQ “entitlement” did not predict higher levels
of perpetrated incivility (ΔR² <.01, ΔF <.01, p =.99), so hypothesis 1b was not supported.
For analysis using the ESI, higher levels of “entitlement” did not predict higher levels of
experienced incivility (ΔR² =.01, ΔF = 2.43, p =.12), so hypothesis 1a was not supported.
Also, higher levels of ESI entitlement did not predict higher levels of perpetrated
incivility (ΔR² =.01, ΔF = 1.26, p =.26), so hypothesis 1b was not supported.
Hypothesis 2a tested whether higher levels of experienced incivility predict lower
levels of depression. Higher levels of experienced incivility did not predict lower levels
of depression (ΔR² =.01, ΔF =1.05, p =.31), so hypothesis 2a was not supported.
Hypothesis 2b tested whether higher levels of experienced incivility would predict lower
levels of affective well-being. Higher levels of experienced incivility did predict higher
levels of affective well-being, so hypothesis 2b was supported (ΔR² =.02, ΔF =4.61, p
=.03). Hypothesis 3a tested whether higher levels of perpetrated incivility predict lower
levels of depression. Higher levels of perpetrated incivility did not lead to lower levels of

25
depression (ΔR² =.01, ΔF =1.55, p =.22), so hypothesis 3a was not supported.
Hypothesis 3b tested whether higher levels of perpetrated incivility predict higher levels
of affective well-being. Higher levels of perpetrated incivility did not predict lower
levels of affective well-being, so hypothesis 3b was not supported (ΔR² =.01, ΔF =1.75, p
=.19). Hypothesis 4 tested whether higher levels of experienced incivility predict higher
levels of perpetrated incivility. Higher levels of experienced incivility did predict higher
levels of perpetrated incivility (ΔR² =.11, ΔF =26.97, p <.01), so hypothesis 4 was
supported.
Moderated Hypotheses
Hypotheses 5a, 5b, 6a, 6b, and 6c were tested using hierarchical moderated
multiple regression (Cohen & Cohen, 1988). Negative affect, age, and gender were
entered as control variables because past studies indicated these variables can influence
levels of perceived incivility (Andersson & Pearson, 1999; Cortina et al., 2001; Lim &
Cortina, 2005; Pearson et al., 2000; Pearson et al., 2001).
Hypothesis 5a tested whether “entitlement” moderated the relationship between
experienced incivility and affective well-being. For the ESQ, there was a significant
main effect for the experienced incivility (ΔR² =.02, ΔF =4.20, p =.04) but not for
“entitlement” (ΔR² <.01, ΔF <.01, p =.99) on affective well-being. The interaction
between experienced incivility and “entitlement” in predicting affective well-being was
not significant (ΔR²=.01, ΔF =2.52, p =.14), so hypothesis 5a was not supported.
Standardized coefficients are presented in table 3. For analysis using the ESI, there was a
significant main effect for the experienced incivility (ΔR² =.02, ΔF =4.20, p =.04) but not
for “entitlement” (ΔR² <.01, ΔF <.01, p =.49) on affective well-being. The interaction

26
between experienced incivility and “entitlement” in predicting affective well-being was
not significant (ΔR² =.01, ΔF =1.23, p=.270), so hypothesis 5a was not supported.
Standardized coefficients are presented in table 4. In other words, there were negligible
differences in the way “entitlement” influenced the relationship between experienced
incivility and affective well-being for both the ESQ and the ESI.
Hypothesis 5b tested whether “entitlement” moderated the relationship between
experienced incivility and depression. Analysis using the ESQ found no main effects for
experienced incivility (ΔR² =.01, ΔF =1.51, p =.22) or “entitlement” (ΔR² <.01, ΔF =.35,
p =.56) on depression. The interaction between “entitlement” and experienced incivility
in predicting depression was not significant (ΔR² =.02, ΔF =1.70, p =.20), so hypothesis
5b was not supported. Standardized coefficients are presented in table 5. For analysis
using the ESI, there was also no main effect for experienced incivility (ΔR² =.01, ΔF
=1.36, p =.24) or “entitlement” (ΔR² <.01, ΔF =.41, p =.52). The interaction between
experienced incivility and “entitlement” in predicting depression was not significant (ΔR²
=.02, ΔF =3.93, p=.06), so hypothesis 5a was not supported. Standardized coefficients
are presented in table 6. There were negligible differences in the way “entitlement”
influenced the relationship between incivility and depression. In other words, there were
negligible differences in the way “entitlement” influenced the relationship between
experienced incivility and depression for both the ESQ and ESI.
Hypothesis 6a tested whether “entitlement” moderated the relationship between
experienced and perpetrated incivility. For analysis using the ESQ, there was a
significant main effect for experienced incivility (ΔR² =.12, ΔF =29.32, p<.01) but not for
“entitlement” (ΔR² <.01, ΔF =1.23, p=.27) on perpetrated incivility. The interaction

27
between experienced incivility and “entitlement” in predicting perpetrated incivility was
not significant (ΔR² <.01, ΔF =.42, p=.52), so hypothesis 6a was not supported.
Standardized coefficients are presented in table 7. There were negligible differences in
the way “entitlement” influenced the relationship between experienced incivility and
perpetrated incivility. For analysis using the ESI, there was a significant main effect for
experienced incivility (ΔR² =.12, ΔF =29.32, p<.01) but not for “entitlement (ΔR² <.01,
ΔF =.84, p=.36) on perpetrated incivility. The interaction between experienced incivility
and “entitlement” in predicting perpetrated incivility was also not significant (ΔR² <.01,
ΔF <.01, p=.99), so hypothesis 6a was not supported. Standardized coefficients are
presented in table 8. In other words, there were negligible differences in the way
“entitlement” influenced the relationship between experienced incivility and perpetrated
incivility for both the ESQ and ESI.
Hypothesis 6b tested whether “entitlement” moderated the relationship between
perpetrated incivility and affective well-being. Analysis using the ESQ found no main
effects for perpetrated incivility (ΔR² =.02, ΔF =3.37, p =.06) or “entitlement” (ΔR² <.01,
ΔF =.19, p =.67) on affective well-being. The interaction between “entitlement” and
perpetrated incivility in predicting affective well-being was not significant (ΔR² <.01, ΔF
=.11, p =.75), so hypothesis 6b was not supported. Standardized coefficients are
presented in table 9. There were negligible differences in the way “entitlement”
influenced the relationship between perpetrated incivility and affective well-being. For
analysis using the ESI, there were no main effects for perpetrated incivility (ΔR² =.02, ΔF
=3.37, p =.06) or “entitlement” (ΔR² <.01, ΔF =.39, p =.53) on affective well-being. The
interaction between perpetrated incivility and “entitlement” in predicting affective well-

28
being was also not significant (ΔR² =.02, ΔF =3.68, p=.06), so hypothesis 6b was not
supported. Standardized coefficients are presented in table 10. In other words, there were
negligible differences in the way “entitlement” influenced the relationship between
perpetrated incivility and affective well-being for both the ESQ and ESI.
Hypothesis 6c tested whether “entitlement” moderated the relationship between
perpetrated incivility and depression. Analysis using the ESQ found no main effect of
perpetrated incivility (ΔR² =.01, ΔF =.89, p =.40) or “entitlement” (ΔR² <.01, ΔF =.69, p
=.41) on depression. The interaction between “entitlement” and perpetrated incivility in
predicting depression was not significant (ΔR² <.01, ΔF =.38, p =.54), so hypothesis 6c
was not supported. Standardized coefficients are presented in table 11. Analysis using the
ESI found no main effects for perpetrated incivility (ΔR² =.01, ΔF =.89, p =.40) or
“entitlement” (ΔR² <.01, ΔF =.35, p =.56) on depression. The interaction between
“entitlement” and perpetrated incivility in predicting depression was significant (ΔR²
<.01, ΔF =.60, p =.44), so hypothesis 6c was not supported. Standardized coefficients are
presented in table 12. In other words, there were negligible differences in the way
“entitlement” influenced the relationship between perpetrated incivility and depression
for both the ESQ and ESI.

29
CHAPTER IV: DISCUSSION
The purpose of the present study was to examine how the “entitlement” sub-
dimension of equity sensitivity influences the relationship between experienced and
perpetrated incivility and affective well-being and depression. Due to some of the
limitations past research has pointed out on the measurement of equity sensitivity (Foote
& Harman, 2006), the equity sensitivity questionnaire was developed for use in this
study. Results found a significant positive relationship between ESQ “entitlement” and
experienced incivility, a significant negative relationship between experienced incivility
and affective well-being, and a significant positive relationship between experienced and
perpetrated incivility. Significant main effects were also found for these same
relationships in the moderated regression analysis. None of the interactive hypotheses
were supported.
The significant main effects are consistent with the patterns of behavior
associated with incivility that was proposed by Andersson and Pearson (1999). Both
People who are highly “entitled” and people who experience high levels of incivility tend
to be emotionally reactive (sensitive to insults, easily offended, perceiving threats in
seemingly innocent exchanges) (Andersson et al, 1999; Huseman et al, 1987; Hunter et
al, 2007), so it comes as no surprise that people who are more highly “entitled” tend to
experience more incivility. According to the “incivility spiral”, when emotionally
reactive individuals experience incivility, they have lower levels of affective well-being
and strong feelings of negative affect because they feel like their social identity has been
threatened (Andersson et al, 1999; Hunter et al, 2007). These lower levels of affective
well-being and increased feelings of negative affect often times motivate victims of

30
incivility to reciprocate (Andersson et al, 1999; Hunter et al, 2007). These findings were
supported in the current study because higher levels of experienced incivility predicted
higher levels of perpetrated incivility.
One reason that could explain why the moderated hypotheses were not significant
is that depression and affective well-being may not be the most appropriate dependent
variables for this type of relationship. Depression and affective well-being were chosen
as dependent variables for the current study because past research has shown that they are
outcomes of incivility (Andersson et al, 1999; Bowling & Beehr, 2006; Cortina et al,
2001; Pearson et al, 2001). However, “entitlement” did not moderate the relationship
between incivility and affective well-being and depression. Perhaps depression and
affective well-being were not significant because theoretically they may not have been
appropriate outcomes for the current study. More specifically, people who are more
highly “entitled” tend to be more emotionally reactive in situations where they do not
receive the highest output (Huseman et al, 1987; King et al, 1984); Emotionally reactive
people are more likely to perceive incivility because they are more sensitive to insults,
more likely to experience violations of interactional injustice, and experience higher
levels of negative affect (Blau & Andersson, 2005). Based on these findings from past
research, perhaps variables such as interactional justice, anger, negative affect, and
frustration would have been more appropriate dependent variables than depression and
affective well-being.
Another reason that could help to explain why most of the hypotheses were not
supported is social desirability. Social desirability is defined as a tendency for the
participant to choose responses that are considered more socially desirable by society

31
regardless of what is asked or how true their response actually is (Crowne & Marlow,
1964; Spector, 1987; Thomas & Killman, 1975). In the current study, low means for
negative affect (M=1.45), experienced incivility (M=1.81), perpetrated incivility
(M=2.31), and ESQ “entitlement” (M=1.94) suggest that social desirability may have
influenced participants’ responses to these items. Past research indicates that social
desirability can be a suppressor variable that actually hides relationships between
variables, especially in likert scales such as the ESQ (Ganster, Hennessey, & Luthans,
1983).
Although it hasn’t been examined in the literature, an additional possible
explanation for the findings of the current study may be that there are not equal
proportions of people who are more “benevolent”, “equity sensitive”, “entitled” or people
who experience and perpetrate incivility. More specifically, many of the current
participants may not have considered themselves to be more highly “entitled” or
perpetrators of incivility, which would explain the low reported means on these variables.
Strengths/Limitations of the Current Study
One major limitation to the current study is the fact that the data was cross-
sectional, which raises concern about the causality of the relationships found in the
current study. Andersson and Pearson’s (1999) “incivility spiral” indicates that victims
become perpetrators over time. Although a significant relationship between experienced
and perpetrated incivility was found in the current study, these findings would have been
much stronger if the data was collected longitudinally. Another limitation was the use of
self-report measures, which can lead to response inflation due to common method
variance (Podsakoff, MacKenzie, Lee, & Podsakoff, 2003; Spector, 1987). However, the

32
fact that there is variability in the correlations and the averages of the scales are not above
average indicates that there is limited to no inflation due to common method variance.
Also, as mentioned earlier, responses to the ESQ and ESI may have been influenced by
social desirability, which may have masked some potentially significant relationships
(Crowne et al, 1965; Ganster et al,1983; Spector, 1987; Thomas et al, 1975). However,
the strengths of the study are the fact that the demographics indicate diversity of people
and professions, which limits the weakness due to range restriction. In addition, equity
sensitivity, depression, affective well-being, and incivility are individuals’ perceptions,
and therefore self-report is an appropriate measure of these variables despite the potential
limitations.
Ideas for Future Research
Because the “incivility spiral” happens over time (Andersson et al, 1999; Hunter
et al, 2007), it would be highly beneficial to conduct future research on incivility
longitudinally. More specifically, future research could test to see if the finding in the
current study that higher levels of “entitlement” predicts higher levels of experienced
incivility, higher levels of experienced incivility predicts lower levels of affective well-
being, and higher levels of experienced incivility predicts higher levels of perpetrated
incivility is stable over time.
Additionally, past research indicates that both highly “entitled” individuals as
well as people who experience and are perpetrators are higher in negative affect, strongly
emotionally reactive, and more likely to perceive violations of interactional justice
(Andersson & Pearson, 1999; Blakely et al, 2005; Blau & Andersson, 2005; Bowling et
al, 2006; Cortina et al, 2001; Huseman et al, 1987; King et al, 1984). That being said,

33
future studies should focus on different dependent variables such as interactional justice
and negative affect. More specifically, future studies could test whether “entitlement”
moderates the relationship between both experienced and perpetrated incivility and
interactional justice and negative affect. These relationships should be tested
longitudinally to establish causation and figure out whether or not variables such as
interactional justice and negative affect influence the “incivility spiral”
As mentioned earlier, social desirability can be a suppressor variable that actually
hides relationships between variables, especially in likert scales such as the ESQ (Crowne
et al, 1964; Ganster et al, 1983; Thomas et al, 1975). One suggestion for future research
is to control for social desirability when measuring variables such as “entitlement” or
perpetrated incivility. That being said, it might be beneficial to replicate this study in the
future with social desirability as a control variable to test whether some of the
relationships were suppressed by social desirability.
Future research could also focus on finding the distribution of “entitled”
employees or perpetrators of incivility in the general working population. More
specifically, the reason that the means were so low for the “entitled” and perpetrated
incivility measures may be because the distribution of these types of employees in the
general population is not normal. Future research could be conducted to find out what
the distribution of highly “entitled” employees and perpetrators of incivility are in the
general population. Regarding the problem of distributions of highly “entitled” people
or perpetrators of incivility in the current study, this study could be repeated with these
populations over-sampled in an effort to isolate how these characteristics influence
variables such as affective well-being and depression.

34
Practical Implications
The current study provides some evidence that higher levels of experienced
incivility are related to higher levels of perpetrated incivility. Additionally, people who
are more highly “entitled” tend to experience more incivility. People experiencing more
levels of incivility also had lower levels of affective well-being. The current study also
found that “entitlement” does not moderate the relationship between experienced and
perpetrated incivility and affective well-being and depression.
Because “entitlement” has a significant relationship with experienced incivility
and because experienced and perpetrated incivility clearly has an impact on employees,
employers should be cognizant of the negative impacts of “entitlement” and incivility and
attempt to minimize it. One suggestion for minimizing “entitlement” and incivility
would be to develop assessment to screen for highly “entitled” employees and
perpetrators of incivility in the selection process. Another suggestion for minimizing
incivility is maximizing interactional justice by respecting the organizational norms for
interpersonal respect (Cropanzano et al, 2001). Because incivility is a consequence of
perceived violations of interactional justice (Andersson et al, 1999), maximizing
interactional justice should successfully reduce incivility as well as the negative
consequences that result from incivility.

35
REFERENCES
Adams, J. S. (1965). Inequity in social exchange. In L. Berdowitz (Ed.), Advances in
Experimental Social Psychology (Vol. 2, pp. 267-299). New York: Academic
Press
Allen, R. S., Takeda, M., & White, C. S. (2005). Cross-cultural equity sensitivity: A test
of differences between the United States and Japan. Journal of Managerial
Psychology, 20(8), 641-662.
Allen, R. S., & White, C. S. (2002). Equity sensitivity theory: A test of responses to two
types of under-reward situations. Journal of Managerial Issues, 14(4), 435-451.
Ambrose, M. L. & Kulick, C. T. (1999). Old friends, new faces: Motivation research of
the 1990s. Journal of Management, 25(3), 231-292.
Andersson, L. M., & Pearson, C. M. (1999). Tit for tat? The spiraling effect of incivility
in the workplace. Academy of Management Review,24(3), 452-471.
Aquino, K., Galperin, B. L., & Bennett, R. J. (2004). Social status and aggressiveness as
moderators of the relationship between interactional justice and workplace
deviance. Journal of Applied Social Psychology, 34(5), 1001-1029.
Austin, W. & McGinn, M. C. (1977). Sex differences in choice of distribution rules.
Journal of Personality, 45(3), 379-394.
Bandura, 1969. Principles of behavior modification. New York: Holt, Rinehart &
Winston.
Barron, R. A., & Neuman, J. H. (1996). Workplace violence and workplace aggression:
Evidence on their relative frequency and potential causes. Aggressive Behavior,
22, 161-173.

36
Bennett, R. J. & Robinson, S. L. (2000). Development ofa measure of workplace
deviance. Journal of Applied Psychology, 85(3), 349-360.
Bies, R. J., & Moag, J. S. (1986). Interactional justice: Communications criteria of
fairness. In R. Lewicki & B. Sheppard (Eds.), Research on negotiation in
organizations (Vol.1, pp. 43-55). Greenwich, CT: JAI Press.
Bies, R. J. (2000). Interactional (in)justice: The sacred and the profane. In J. Greenberg &
R. Cropanzano (Eds.), Advances in organizational justice (pp. 89-118). Palo Alto,
CA: Stanford University Press.
Bing, M. N. & Burroughs, S. N. (2001). The predictive and interactive effects of equity
sensitivity in teamwork-oriented organizations. Journal of Organizational
Behavior, 22, 271-290.
Blakely, G. L, Andrew, M. C. & Mooreman, R. H. (2005). The moderating effects of
equity sensitivity on the relationship between organizational justice and
organizational citizenship behaviors. Journal of Business and Psychology, 20(2)
259-273.
Blau, G. & Andersson, L. (2005). Testing a measure of instigated workplace incivility.
Journal of Occupational and Organizational Psychology, 78, 595-614.
Bowling, N. A., & Beehr, T. A. (2006). Workplace harassment from the victim’s
perspective: A theoretical model and meta-analysis. Journal of Applied
Psychology, 91, 998-1012.
Callahan-Levy, C. M., & Messe, L. A. (1979). Sex differences in the allocation of pay.
Journal of Personality and Social Psychology, 37(3), 433-446.
37
Clark, O. L., Burnfield, J. L., Barger, P. B., Broadfoot, A., & Yugo, J. E. (in prep).
Outcomes of abusive supervision: The mediating role of organization-based self-
esteem.
Cohen, J., & Cohen, P. (1983). Applied multiple regressiuon/correlation for the
behavioral sciences. Hillsdale, NJ: Lawrence Elbaum Associates, Publishers.
Colquitt, J. A. (2004). Does the justice of the one interact with the justice of the team?
Reactions to procedural justice in teams. Journal of Applied Psychology, 89(4),
633-646.
Cooper, C. L., Dewe, P. J., & O’Driscoll, P.O. (2001). Organizational Stress: A Review
and Critique of Theory, Research, and Application. London: Sage Publications.
Cortina, L. M., & Magley, V. J. (2001). Incivility in the workplace: Incidence and
impact. Journal of Occupational Health Psychology, 6(1), 64-80.
Cortina, L. M., Magley, V. J.,Williams, J. H., & Langhout, R. D. (2001). Incivility in the
workplace: Incidence and impact. Journal of Occupational Health Psychology,
6(1), 64-80.
Cropanzano, R., Byrne, Z. S., Bobocel, D. R., & Rupp, D. E. (2001). Moral virtues,
fairness heuristics, social entities, and other denizens of organizational justice.
Journal of Vocational Behavior, 58, 164-209.
Crowne, D., & Marlow, D. (1964). The approval motive: Studies in evaluative
dependence. New York: Wiley
Fok, L. Y., Hartman, S. J. Patti, A. L. & Razek, J. R. (1999). The relationship between
equity sensitivity, growth needs strength, organizational citizenship behavior, and

38
perceived outcomes in the quality environment: A study of accounting
professionals. Journal of Social Behavior and Personality, 15(1), 99-120.
Fok, L.Y., Hartman, S. J., Villere, M. F., Freibert, R. C. (1996). A study of the impact of
cross-cultural differences on perceptions of equity and organizational citizenship
behaviors, International Journal of Management, 13, 3-14.
Foote, D. A. & Harmon, S. (2006). Measuring equity sensitivity. Journal of Management
Psychology, 21(2), 90-108.
Ganster, D. C., Hennessey, H. W., & Luthans, F. (1983). Social desirability response
effects: Three alternative models. Academy of Management Journal, 26(2), 321-
331.
Greenburg, J. (1979). Protestant ethic endorsement and the fairness of equity inputs.
Journal of Research and Personality, 13, 81-90.
Hinken, T. R. (1998). A brief tutorial on the development of measures for use in survey
questionnaires. Organizational Research Methods, 1, 104-121.
Hook, J. G., & Cook, T. D. (1979). Equity theory and the cognitive ability of children.
Psychological Bulletin, 86(3), 429-445.
Hunter, E. M., Penney, L. M., Raghuram, A., Ugaz, A., & Malka, A. A. (2007). A
qualitative investigation of escalating aggression within the service encounter.
Poster presented at the Society for Industrial and Organizational Psychology, New
York, NY.
Huseman, R.C., Hatfield, J. D., & Miles, E. W. (1987). A new perspective on equity
theory: The equity sensitivity construct. The Academy of Management Review,
12(2), 222-234.
39
Jex, S. M. & Elacqua, T. C. (1999). Self-esteem as a moderator: A comparison of global
and organization-based measures. Journal of Occupational and Organizational
Psychology, 72, 71-81.
Johnson, P. R. & Indvik, J. (2001). Slings and arrows of rudeness: Incivility in the
workplace. Journal of Management Development, 20(8), 705-713.
Kickel, J. & Lester, S. W. (2001). Broken promises: Equity sensitivity as a moderator
between psychological contract breech and employee attitudes and behavior.
Journal of Business and Psychology, 16(2), 191-217.
King, W. C., & Miles, E. W. (1994). The measurement of equity sensitivity. Journal of
Occupationa land Organizational Psychology, 67, 133-142.
King, W., Miles, E., & Day, D. D. (1993). A test and refinement of the equity sensitivity
construct. Journal of Organizational Behavior, 14,( 4), 301-317.
Konovsky, M. A., & Organ, D. W. (1996). Dispositional and contextual determinants of
organizational citizenship behavior. Journal of Organizational Behavior, 17, 253-
266.
Leventhal, G. S. (1976). Fairness in Social Relationships. Morristown, NJ: General
Learning Press.
Lim, S. & Cortina, L. M. (2005). Interpersonal mistreatment in the workplace: The
interface and impact of general incivility and sexual harassment. Journal of
Applied Psychology, 90(3), 483-496.
Major, B., & McFarlin, D. B., & Gagnon, D. (1984). Overworked and overpaid: On the
nature of gender differences in personal entitlement. Journal of Personality and
Social Psychology, 47(6), 1399-1412.

40
Miles, E. W., Hatfield, J. D., & Huseman, R. C. (1989). The equity sensitivity construct:
Potential implications for worker performance. Journal of Management, 15(4),
581-588.
Miles, E. W., Hatfield, J. D., & Huseman, R. C. (1994). Equity sensitivity and outcome
importance. Journal of Organizational Behavior, 15, 585-596.
Mudrack, P. E., Mason, S. E., & Stepanski, K. M. (1999). Equity sensitivity and business
ethics. Journal of Occupational and Organizational Psychology, 72, 539-560.
Neuman, J. H., & Baron, R. A. (1998). Workplace violence and workplace aggression:
Evidence concerning specific forms, potential causes, and preferred targets.
Journal of Management, 24, 394-419.
O’Neal, B. S. & Mone, M. A. (1998). Investigating equity sensitivity as a moderator of
relations between self-efficacy and workplace attitudes. Journal of Applied
Psychology, 83(5), 805-816.
Pearson, C. M., Andersson, L. M., & Porath, C. L. (2000). Assessing and attacking
workplace incivility. Organizational Dynamics, 29(2), 123-137.
Pearson, C. M., Andersson, L. M., & Wegner, J. W. (2001). When workers flout
convention: A study of workplace incivility. Human Relations, 54(11), 1387-
1419.
Pearson, C. M., Andersson, L. M., & Porath, C. L. (2005). Workplace incivility. In S.
Fox, & P. E. Spector (Ed.), Counterproductive work behavior: Investigations of
actors and targets, (pp. 177-201). Washington DC: American Psychological
Association.
41
Pearson, C. M., & Porath, C. L. (2001, August). Effects of incivility on the target: Fight,
flee or take care of “me”? Paper presented at the annual meeting of the Academy
of Management, Washington, DC.
Penny, L. M. & Spector, P. E. (2005). Job stress, incivility, and counterproductive work
behavior (CWB): The moderating role of negative affectivity, Journal of
Organizational Behavior, 26, 777-796.
Podsakoff, P. M., MacKenzie, S. B., Lee, J. Y., & Podsakoff, N. P. (2003). Common
method biases in behavioral research: A critical review of the literature and
recommended remedies. Journal of Applied Psychology, 88(5), 879-903.
Quinn, R.P., & Shephard, L. (1974). The 1972-1973 quality of employment survey. Ann
Arbor: Survey Research Center, University of Michigan.
Sauley, K. S., & Bediean, A. G. (2000). Equity sensitivity: Construction of a measure and
examination of its psychometric properties. Journal of Management, 26(5), 885-
910
Schat, A. C. & Kelloway, K. E. (2003). Reducing the adverse consequences of workplace
aggression and violence: The buffering effects of organizational support, 8(2),
110-122.
Schaubroeck, J., Jones, J. R., & Xie, J. L. (2001). Individual differences in utilizing
control to cope with job demands: Effects of susceptibility to infectious disease.
Journal of Applied Psychology, 86(2), 265-278.
Shore, T. H. (2004). Equity sensitivity theory: Do we all want more than we deserve?
Journal of Managerial Psychology, 19(7), 722-728.

42
Shore, T., & Strauss, J. (2006). Leader responsiveness, equity sensitivity, and employee
attitudes and behavior. Journal of Business and Psychology, 21(2), 227-241.
Spector, P. E. (1987). Method variance as an artifact in self-reported affect and
perceptions at work: Myth or significant problem? Journal of Applied
Psychology, 72(3), 438-443.
Stoner, J. & Perrewe, P. L. (2006). Consequences of depressed mood at work: The
importance of supportive superiors. In A. M. Rossi, P. L. Perrewe, & S. L. Sauter
(Ed.), Stress and Quality of Working Life, (pp. 87-100). Greenwich, Connecticut:
Information Age Publishing.
Swap, W. C., & Rubin, J. Z. (1983). Measurement of interpersonal orientation. Journal of
Personality and Social Psychology, 44(1), 208-219.
Tang, T. L., & Smith-Brandon, V. L. (2001). From welfare to work: The endorsement of
the money ethic and the work ethic among welfare recipients, welfare recipients
in training programs, and employed past welfare recipients. Public Personnel
Management, 30(2), 241-260.
Tedeschi, J. T., & Felson, R. B. (1994). Violence, aggression, and coercive actions.
Washington, DC: American Psychological Association.
Tepper, B. J. (2000). Consequences of abusive supervision. Academy of Management
Journal, 43(2), 178-190.
Thomas, K. W., & Killman, R. H. (1975). The social desirability variable in
organizational research: An alternative explanation for reported findings.
Academy of Management Journal, 18, 741-752.

43
Van DierenDonck, D., Shaufeli, W. B., & Sixma, H. J. (1994). Burnout from general
practitioners: A perspective from equity theory. Organizational Behavior and
Human Performance, 15, 32-65.
Van Katwyk, P. T., Fox, S., Spector, P. E., & Kelloway, E. K. (2000). Using the Job-
related Affective Well-being Scale (JAWS) to investigate affective responses to
work stressors. Journal of Occupational Health Psychology, 5, 219-230.
Vogt, P. W. (2007). Quantitative Research Methods for Professionals. Boston: Pearson
Education, Inc.
Watson, D., Clark, L.A. and Tellegen, A. (1988), “Development and validation of a brief
measure of positive and negative affect: the PANAS scales”, Journal of
Personality and Social Psychology, 54, 1063-70.
Weick, K.E., Bougon, M. E., & Maruyama, G. (1976). The equity context.
Organizational Behavior and Human Performance, 15, 32-65.
Yamaguchi, I. (2003). The relationships among individual differences, needs, and equity
sensitivity. Journal of Management Psychology, 18(4), 324-344.

44
Table 1
Bivariate correlations
Note: * Correlation is significant at the 0.05 level (2-tailed). ** Correlation is significant at the 0.01 level (2-tailed).
Variables 1) 2) 3) 4) 5) 6) 7) 8) 9)
1) Age ___
2) Sex .06 ___
3) Negative affect
-.07 -.10 ___
4)Experienced Incivility
-.10 <.01 .19** ___
5) Perpetrated incivility
.03 .04 .39** .41** ___
6) ESQentitled -.04 -.18** .14** .23** .02 ___
7) ESIentitled -.01 .02 -.05 .06 .05 .26** ___
8) Affective well-being
-.04 <-.01 .25** -.20** .22** .05 -.03 ___
9) Depression .01 <-.01 -.12 .06 .02 .06 -.03 .24** ___

45
Table 2
Descriptive statistics
Variables Mean SD Possible Range
Observed range
Cronbach’s alpha
1) Age 44.67 11.08 18-70 19-68
2) Sex
1-2 1-2
3) Negative affect 1.45 .62 1-5 1-4.9 .90 4)Experienced Incivility 1.81 .70 1-5 1-5 .76 5) Perpetrated incivility 2.31 1.22 1-5 1-5 .77 6) ESQ “entitled” 1.94 1.51 1-5 1-4 .82
7) ESI “entitled” 3.71 1.35 0-10 0-7.25 .80
8) Affective Well-Being 2.75 .34 1-5 1-4 .72
9) Depression 2.91 .39 1-5 1-4 .86
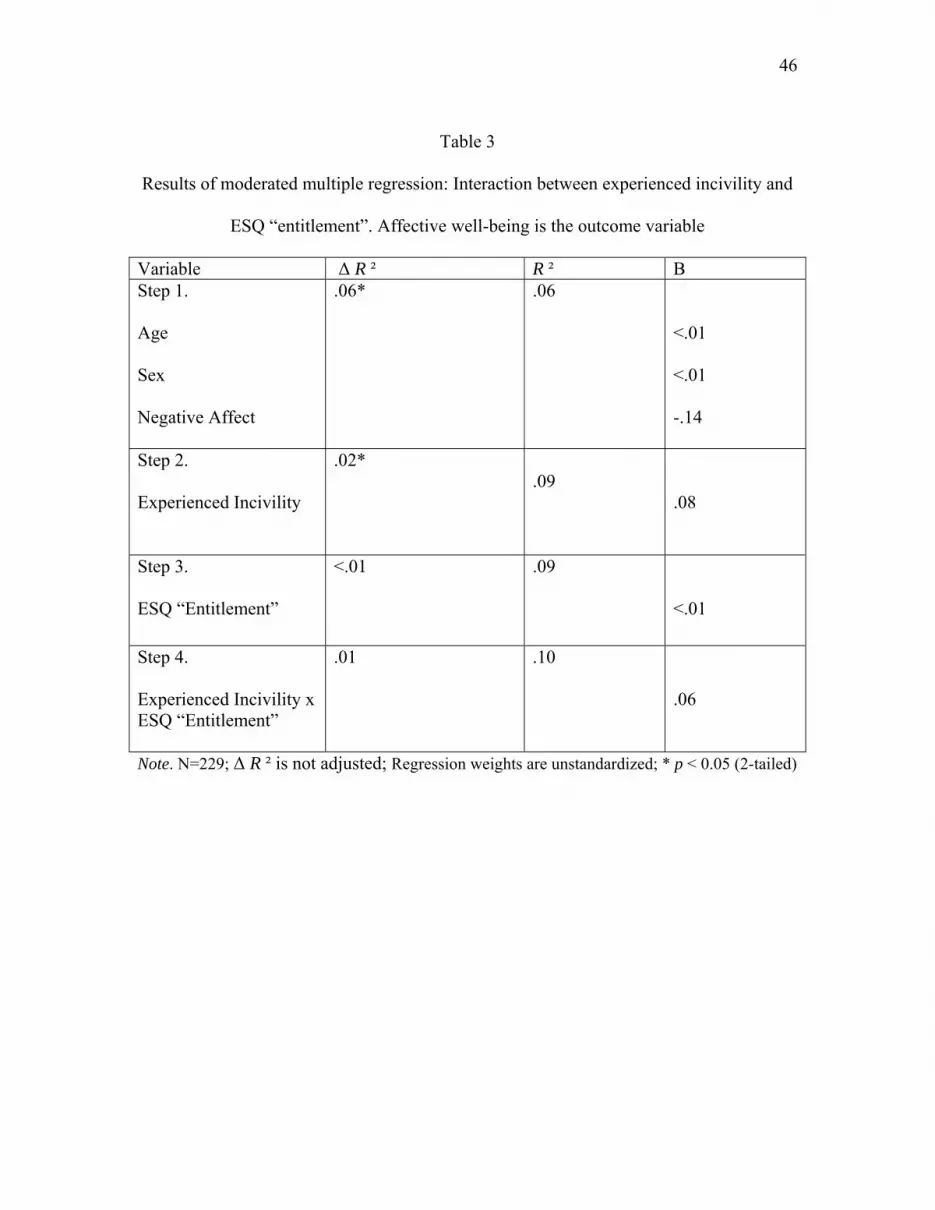
46
Table 3
Results of moderated multiple regression: Interaction between experienced incivility and
ESQ “entitlement”. Affective well-being is the outcome variable
Variable Δ R ² R ² B Step 1.
Age
Sex
Negative Affect
.06*
.06 <.01 <.01 -.14
Step 2. Experienced Incivility
.02* .09
.08
Step 3. ESQ “Entitlement”
<.01 .09 <.01
Step 4. Experienced Incivility x ESQ “Entitlement”
.01 .10 .06
Note. N=229; Δ R ² is not adjusted; Regression weights are unstandardized; * p < 0.05 (2-tailed)

47
Table 4
Results of moderated multiple regression: Interaction between experienced incivility and
ESI “entitlement”. Affective well-being is the outcome variable
Variable Δ R ² R ² B Step 1.
Age
Sex
Negative Affect
.06* .06 <.01 <.01 -.14
Step 2. Experienced Incivility
.02* .09 .08
Step 3. ESI “Entitlement”
<.01 .09 -.01
Step 4. Experienced Incivility x ESI “Entitlement”
.01 .10 .03
Note. N=229; Δ R ² is not adjusted; Regression weights are unstandardized; * p < 0.05 (2-tailed)

48
Table 5
Results of moderated multiple regression: Interaction between experienced incivility and
ESQ “entitlement”. Depression is the outcome variable
Variable Δ R ² R ² B Step 1.
Age
Sex
Negative Affect
.02 .02 <.01 <.01 -.08
Step 2. Experienced Incivility
.01 .02 .05
Step 3. ESQ “Entitlement”
<.01 .03 .02
Step 4. Experienced Incivility x ESQ “Entitlement”
.02 .03 .06
Note. N=229; Δ R ² is not adjusted; Regression weights are unstandardized; * p < 0.05 (2-tailed)

49
Table 6
Results of moderated multiple regression: Interaction between experienced incivility and
ESI “entitlement”. Depression is the outcome variable
Variable Δ R ² R ² B Step 1.
Age
Sex
Negative Affect
.02
.02 <.01 <.01 -.08
Step 2. Experienced Incivility
.01
.02 .05
Step 3. ESI “Entitlement”
<.01
.03 -.01
Step 4. Experienced Incivility x ESI “Entitlement”
.02
.05 .05
Note. N=229; Δ R ² is not adjusted; Regression weights are unstandardized; * p < 0.05 (2-tailed)

50
Table 7
Results of moderated multiple regression: Interaction between experienced incivility and
ESQ “entitlement”. Perpetrated incivility is the outcome variable
Variable Δ R ² R ² B Step 1.
Age
Sex
Negative Affect
.15* .15 <.01 <.01 .66
Step 2. Experienced Incivility
.12* .27 .54
Step 3. ESQ “Entitlement”
<.01 .27 -.10
Step 4. Experienced Incivility x ESQ “Entitlement”
<.01 .28 -.08
Note. N=229; Δ R ² is not adjusted; Regression weights are unstandardized; * p < 0.05 (2-tailed)

51
Table 8
Results of moderated multiple regression: Interaction between experienced incivility and
ESI “entitlement”. Perpetrated incivility is the outcome variable
Variable Δ R ² R ² B Step 1.
Age
Sex
Negative Affect
.15* .15 <.01 <.01 .66
Step 2. Experienced Incivility
.12* .27 .54
Step 3. ESI “Entitlement”
<.01 .27 .05
Step 4. Experienced Incivility x ESI “Entitlement”
<.01 .27 <.01
Note. N=229; Δ R ² is not adjusted; Regression weights are unstandardized; * p < 0.05 (2-tailed)

52
Table 9
Results of moderated multiple regression: Interaction between perpetrated incivility and
ESQ “entitlement”. Affective well-being is the outcome variable
Variable Δ R ² R ² B Step 1.
Age
Sex
Negative Affect
.06* .06 <.01 <.01 -.14
Step 2. Perpetrated Incivility
.02 .08 .05
Step 3. ESQ “Entitlement”
<.01 .08 .01
Step 4. Perpetrated Incivility x ESQ “Entitlement”
<.01 .08 -.01
Note. N=229; Δ R ² is not adjusted; Regression weights are unstandardized; * p < 0.05 (2-tailed)
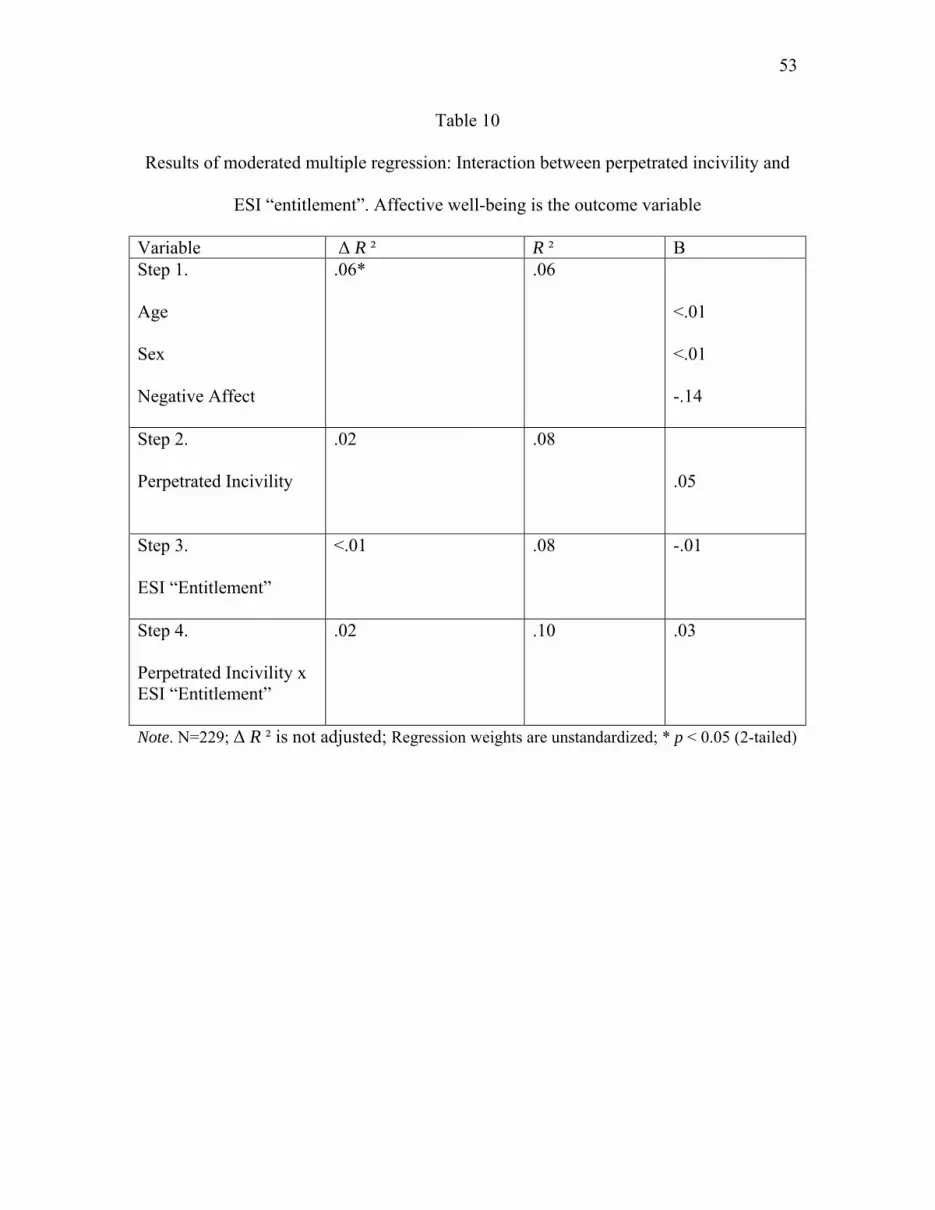
53
Table 10
Results of moderated multiple regression: Interaction between perpetrated incivility and
ESI “entitlement”. Affective well-being is the outcome variable
Variable Δ R ² R ² B Step 1.
Age
Sex
Negative Affect
.06* .06 <.01 <.01 -.14
Step 2. Perpetrated Incivility
.02 .08 .05
Step 3. ESI “Entitlement”
<.01 .08 -.01
Step 4. Perpetrated Incivility x ESI “Entitlement”
.02 .10 .03
Note. N=229; Δ R ² is not adjusted; Regression weights are unstandardized; * p < 0.05 (2-tailed)

54
Table 11
Results of moderated multiple regression: Interaction between perpetrated incivility and
ESQ “entitlement”. Depression is the outcome variable
Variable Δ R ² R ² B Step 1.
Age
Sex
Negative Affect
.02
.02 <.01 <.01 -.08
Step 2. Perpetrated Incivility
.01 .02 .03
Step 3. ESQ “Entitlement”
<.01 .03 .03
Step 4. Perpetrated Incivility x ESQ “Entitlement”
<.01 .03 .02
Note. N=229; Δ R ² is not adjusted; Regression weights are unstandardized; * p < 0.05 (2-tailed)

55
Table 12
Results of moderated multiple regression: Interaction between perpetrated incivility and
ESI entitlement. Depression is the outcome variable
Variable Δ R ² R ² B Step 1.
Age
Sex
Negative Affect
.02
.02 <.01 <.01 -.08
Step 2. Perpetrated Incivility
.01 .02 .03
Step 3. ESI “Entitlement”
<.01 .03 -.01
Step 4. Perpetrated Incivility x ESI “Entitlement”
<.01 .03 .02
Note. N=229; Δ R ² is not adjusted; Regression weights are unstandardized; * p < 0.05 (2-tailed)

56
Appendix A
Results for the development of the Equity Sensitivity Questionnaire
Introduction
There are two primary instruments used to measure equity sensitivity: The Equity
Sensitivity Instrument (ESI) (Huseman et al, 1987) and the Equity Preference
Questionnaire (EPQ) (Sauley & Bediean, 2000). When Foote and Harman (2006)
examined these two primary instruments for measuring equity sensitivity, they found
serious flaws with both measures. The ESI is a forced-choice inventory where
participants are given a “benevolent” statement and an “entitlement” statement and asked
to allocate 10 points to each statement. It is scored using breaking points from the means
and standard deviations of the groups. The problem with basing breaking points on the
sample is that if the sample is strongly skewed, then people could be falsely classified
(Foote et al, 2006). The problem with the EPQ is that a factor analysis indicated it was
multidimensional and only one dimension was supported as measuring equity sensitivity
(Foote et al, 2006). In addition, the EPQ yields different results when given to groups of
students vs. non-students (Foote et al, 2006). Foote and Harman (2006) conclude that the
EQP is not a valid measure, but the ESI can be modified to compensate for its
shortcomings in past studies because Cronbach’s alpha was acceptable (.79) when they
tested it and has been consistently acceptable in past studies using the instrument
(Blakely, Andrews, & Moorman, 2005; Huseman, Hatfield, & Miles, 1989; Huseman et
al, 1985; King & Miles, 1994; King, Miles, & Day, 1993; O’neill & Mone, 1998; Shore,
2004).

57
In order to modify the instrument, the construct was reexamined and a series of
questions was generated on a 1-5 likert scale (See appendix B). The new instrument was
created using a likert scale in order to make the measurement more precise because the
range allows for assessing specific information as well as composite scores (Vogt, 2007).
Since problems with the Equity Sensitivity Instrument and Equity Preference
Questionnaire have been noted (Foot et al, 2006), the purpose of the first study was to
generate and test a list of items for a new measure of equity sensitivity that was used in
the current study.
Method
Participants
The sample for the current study was recruited through classes at a mid-western
University. In order to participate, each subject must currently be enrolled at the
University. The sample included 266 participants with ages ranging from 18 to 44
(M=19.5). 133 participants were freshman, 80 were sophomores, 28 were juniors, and 7
were seniors. There were 193 females and 73 males. Forty-six different majors were
represented with education (32), psychology (24), and business (24) representing the
most.
Materials
The Equity Sensitivity Questionnaire (ESQ) was initially tested as a 37 item
questionnaire on equity sensitivity with 8 items designed to measure the “benevolent”
sub-dimension, 19 items designed to measure the equity sensitive sub-dimension, and 10
items designed to measure the “entitlement” sub-dimension. Respondents are asked to
indicate on a 5 point likert scale ranging from 1(least) to 5(most) how consistent the item

58
is with their attitudes towards work/employment. Examples of questions designed to
measure each sub-dimension include “I do not mind giving more to the organization than
I get back in return”, “I should receive and contribute to the organization equally”, and “I
don’t mind receiving more than I give to the organization”.
Procedure
Initially, items were generated by two researchers based on reading past literature
on how the equity sensitivity construct was defined. After generating the items, 5 experts
reviewed the items and judged whether or not they properly represented the construct.
After the judges came to a consensus on which items were good, a pilot study was
conducted and the data was analyzed using confirmatory factor analysis.
Results
Item-total correlations are presented in table 1 and mean and standard deviations
for each question are presented in table 2. A confirmatory factor analysis was conducted
and results indicate a good fit for the three factor model (Chi Square = 966.956, df=492).
The fit indices met acceptable criteria (Bentler-Bonnett normed fit index; NFI=.9,
standardized RMR=.05, root mean squared error of adjustment; RMSEA = .06). In order
to obtain this fit, a number of items were deleted from the initial instrument presented
below. The items retained in the CFA model for the “benevolent” sub-factor include
items 9, 16, 27, and 33. The items retained for the “equity sensitive” sub-factor include
items 14, 17, 32, 35, and 37. The items retained for the “entitled” sub-factor include
items 11, 18, 21, and 36. The results for the current study using “entitlement” were
conducted using these four items.

59
The Dimensionality of the ESQ was also tested using a principal axis factor
analysis. The scree plot, presented in figure 1, indicates that three factors were extracted.
The first factor extracted had an eigenvalue of 3.53 and accounted for 24.47% of the
variance, the second factor extracted had an eigenvalue of 2.61 and accounted for an
additional 16.21% of the variance, and the third factor extracted had an eigenvalue of 2
and accounted for an additional 13.12% of the variance.

60
Appendix A table 1
Inter-Item Correlation Matrix for the “Entitled” Sub-Dimension
1 2 3 4 5 6 7 8 9 10 11 12 13
1
2 .50
3 .48 .57
4 .83 .65 .65
5 .51 .53 .66 .54
6 -.03 .05 .17 -.05 .32
7 -.13 -.15 <.01 -.15 .16 .67
8 -.11 -.17 -.14 -.13 -.05 .45 .51
9 -.07 -.12 .07 -.13 -11 .69 .67 .37
10 -.04 -.05 -.14 -.04 -.33 -.21 -.11 -.05 -.28
11 .15 .15 0 .07 -.17 -.07 -.10 -.11 -.02 .41
12 -.02 .09 -.09 -.13 -.12 -.13 -.14 -.08 -.18 .33 .57
13 -.-58 -.01 -.07 -.22 -.11 -.22 .02 -.04 .03 .28 .47 .46
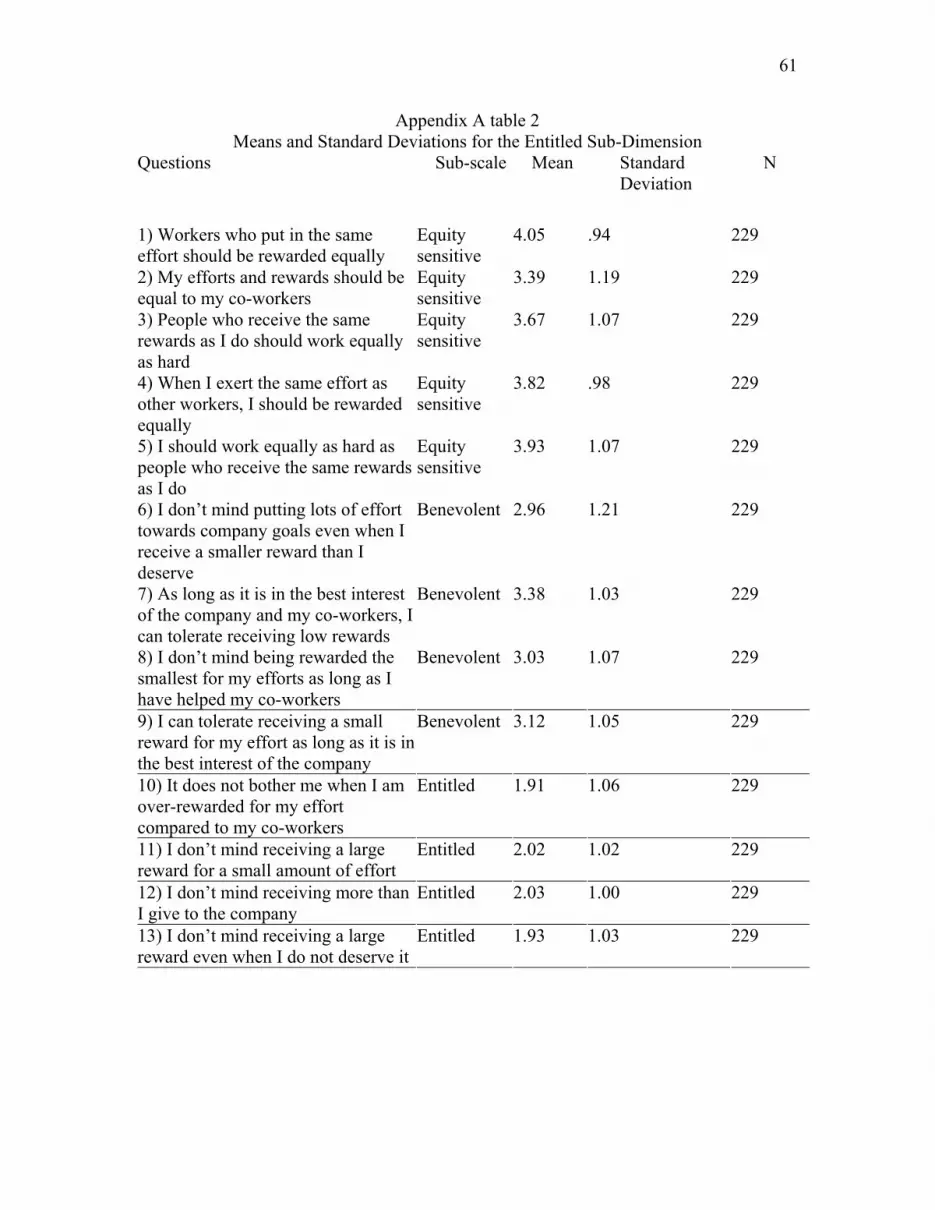
61
Appendix A table 2 Means and Standard Deviations for the Entitled Sub-Dimension
Questions Sub-scale Mean Standard Deviation
N
1) Workers who put in the same effort should be rewarded equally
Equity sensitive
4.05 .94 229
2) My efforts and rewards should be equal to my co-workers
Equity sensitive
3.39 1.19 229
3) People who receive the same rewards as I do should work equally as hard
Equity sensitive
3.67 1.07 229
4) When I exert the same effort as other workers, I should be rewarded equally
Equity sensitive
3.82 .98 229
5) I should work equally as hard as people who receive the same rewards as I do
Equity sensitive
3.93 1.07 229
6) I don’t mind putting lots of effort towards company goals even when I receive a smaller reward than I deserve
Benevolent 2.96 1.21 229
7) As long as it is in the best interest of the company and my co-workers, I can tolerate receiving low rewards
Benevolent 3.38 1.03 229
8) I don’t mind being rewarded the smallest for my efforts as long as I have helped my co-workers
Benevolent 3.03 1.07 229
9) I can tolerate receiving a small reward for my effort as long as it is in the best interest of the company
Benevolent 3.12 1.05 229
10) It does not bother me when I am over-rewarded for my effort compared to my co-workers
Entitled 1.91 1.06 229
11) I don’t mind receiving a large reward for a small amount of effort
Entitled 2.02 1.02 229
12) I don’t mind receiving more than I give to the company
Entitled 2.03 1.00 229
13) I don’t mind receiving a large reward even when I do not deserve it
Entitled 1.93 1.03 229

62
Appendix A figure 1 Scree Plot for the ESQ “Entitled” Sub-Dimension
13121110987654321
Factor Number
4
3
2
1
0
Eige
nval
ue
Scree Plot

63
Equity Sensitivity Questionnaire Please respond to these items consistent with your attitude towards work/employment. Choose the answer most consistent with your view. 1=Least 2=Somewhat 3=Moderately 4=Frequent 5=Most 1) In an ideal working situation, people 1 2 3 4 5 receiving equal rewards also exert equal amounts of effort towards work tasks 2) I don’t mind giving more to the organization than I get back in return 1 2 3 4 5 3) My rewards should be equal to co-workers 1 2 3 4 5 who put in the same effort 4) I feel anger when I am not given 1 2 3 4 5 the reward I deserve 5) In the fairest working situation, people 1 2 3 4 5 putting in the same effort should be rewarded equally 6) I’m happy to help others even when they do not help me back 1 2 3 4 5 7) When I help out my co-workers, I expect them 1 2 3 4 5 to help me back in the same way 8) I enjoy receiving more rewards for my 1 2 3 4 5 effort from the organization than I deserve 9) I do not mind being rewarded the smallest for my effort as long as I’ve helped my 1 2 3 4 5 co-workers 10) I should receive and contribute to the 1 2 3 4 5 company equally 11) It does not bother me when I am 1 2 3 4 5 over-rewarded for my effort compared to my co-workers 12) I can tolerate receiving lower rewards for my effort than I deserve 1 2 3 4 5

64
13) I feel distress when my efforts are larger 1 2 3 4 5 than my rewards 14) Workers who put in the same effort 1 2 3 4 5 should be rewarded equally 15) I feel distress when I do not receive the 1 2 3 4 5 largest reward for my effort relative to my co-workers 16) I can tolerate receiving a small reward 1 2 3 4 5 for my effort as long as it is in the best interest of the company. 17) My efforts and rewards should 1 2 3 4 5 be equal to my co-workers 18) I don’t mind receiving a large reward for a small 1 2 3 4 5 amount of effort 19) I expect to be rewarded equally to those who 1 2 3 4 5 put in the same effort as I do 20) I feel guilt when my rewards are larger 1 2 3 4 5 than my efforts 21) I don’t mind receiving more than I give to the company 1 2 3 4 5 22) When I help others, I am tolerant 1 2 3 4 5 when they do not help me back. 23) I should receive the same rewards 1 2 3 4 5 as others who put in the same effort as I have 24) I am most satisfied when I receive larger 1 2 3 4 5 rewards for my effort from the company than my co-workers 25) I should help out my co-workers and take care 1 2 3 4 5 of my own needs equally 26) It wouldn’t bother me to receive a larger reward than others who put in the 1 2 3 4 5 same effort 27) I don’t mind putting lots of effort 1 2 3 4 5

65
toward company goals even when I receive a smaller reward than I deserve 28) It bothers me when my rewards are not exactly 1 2 3 4 5 equal to co-workers who put in the same effort 29) After receiving a large reward 1 2 3 4 5 I do not feel the need to increase my effort 30) I am most satisfied when my efforts and 1 2 3 4 5 rewards are the same as my co-workers 31) I feel distressed when I do not receive a 1 2 3 4 5 larger reward than my co-workers 32) People who receive the same rewards 1 2 3 4 5 as I do should work equally as hard 33) As long as it is in the best interest of the 1 2 3 4 5 company and my co-workers, I can tolerate receiving low rewards 34) I feel guilt when I am given a larger 1 2 3 4 5 reward than I deserve 35) When I exert the same effort as other, 1 2 3 4 5 workers, I should be rewarded equally 36) I don’t mind receiving a large reward even 1 2 3 4 5 when I do not deserve it 37) I should work equally as hard as people who 1 2 3 4 5 receive the same rewards as I do

66
Appendix B
Equity Sensitivity Instrument The questions below ask what you would for your relationships to be with any organization for which you might work. On each question, divide 10 points between the two choices (choice A and choice B) by giving the most points to the choice that is most like you and the fewest points to the choice that is the least like you. You can if you’d like, give the same amount of points to each choice (For example, 5 points to choice A and 5 points to choice B). And you can use zeros if you’d like. Just make sure to allocate all 10 points per question between each pair of possible responses. In any organization I work for: 1) It would be more important for me to: _____A. Get from the organization _____B. Give to the organization 2) It would be more important for me to: _____A. Help others _____B. Watch out for my own good 3) I would be more concerned about: _____A. What I received from the organization _____B. What I contributed to the organization 4) The hard work I do should: _____A. Benefit the organization _____B. Benefit me 5) My personal philosophy in dealing with the organization would be: _____A. If I don’t look out for myself, nobody else will _____B. It’s better for me to give than to receive

67
Appendix C
Experienced Workplace Incivility Scale
Please indicate on a scale of 1-5 often someone at work has done the following to you in the past year:
1) Put you down or was 1 2 3 4 5 condescending to you in some
way 2) Paid little attention to a statement 1 2 3 4 5 you made or showed little interest in your opinion
3) Made demeaning, rude, or 1 2 3 4 5
derogatory remarks about you
4) Addressed you in unprofessional , 1 2 3 4 5 terms, either publicly or privately
5) Ignored or excluded you from 1 2 3 4 5 professional camaraderie (e.g. social conversation)
6) Doubted your judgment over a matter 1 2 3 4 5
in which you have responsibility
7) Made unwanted attempts to draw 1 2 3 4 5 you into a discussion of personal matters

68
Appendix D
Instigated Workplace Incivility Scale Please indicate on a scale of 1-5 often you have exhibited the following behaviors to someone at work in the past year:
1) Put down others or was 1 2 3 4 5 condescending to them in some
way 2) Paid little attention to a statement 1 2 3 4 5 someone made or showed little interest in their opinion
3) Made demeaning, rude, or 1 2 3 4 5
derogatory remarks about someone
4) Addressed someone in unprofessional 1 2 3 4 5 terms, either publicly or privately
5) Ignored or excluded someone from 1 2 3 4 5 professional camaraderie (e.g. social conversation)
6) Doubted someone’s judgment 1 2 3 4 5
over a matter in which they had responsibility
7) Made unwanted attempts to draw 1 2 3 4 5
someone into a discussion of personal matters

69
Appendix E
Job-related Affective Well-being Scale, JAWS
Below are a number of statements that describe different emotions that a job can make a person feel. Please indicate the amount to which any part of your job (e.g., the work, coworkers, supervisor, clients, pay) has made you feel that emotion in the past 30 days. Please check one response for each item that best indicates how often you've experienced each emotion at work over the past 30 days.
Nev
er
Rar
ely
Som
etim
es
Qui
te o
fter
Extre
mel
y of
ten
1. My job made me feel at ease 2. My job made me feel angry 3. My job made me feel annoyed 4. My job made me feel anxious 5. My job made me feel bored 6. My job made me feel cheerful 7. My job made me feel calm 8. My job made me feel confused 9. My job made me feel content 10. My job made me feel depressed 11. My job made me feel disgusted 12. My job made me feel discouraged 13. My job made me feel elated 14. My job made me feel energetic 15. My job made me feel excited 16. My job made me feel ecstatic 17. My job made me feel enthusiastic 18. My job made me feel frightened 19. My job made me feel frustrated 20. My job made me feel furious 21. My job made me feel gloomy 22. My job made me feel fatigued 23. My job made me feel happy 24. My job made me feel intimidated 25. My job made me feel inspired 26. My job made me feel miserable 27. My job made me feel pleased 28. My job made me feel proud 29. My job made me feel satisfied 30. My job made me feel relaxed

70
Appendix F
The Depression Scale
How often do you feel this way at work? Please circle the answer using the scale provided. 1=Very slightly 2=A little 3=Moderately 4=Quite a lot 5=Extremely 1) I feel downhearted and blue 1 2 3 4 5 2) I get tired for no reason 1 2 3 4 5 3) I find myself restless and can’t keep still 1 2 3 4 5 4) I find it easy to do the things I used to do 1 2 3 4 5 5) My mind is as clear as it used to be 1 2 3 4 5 6) I feel hopeful about the future 1 2 3 4 5 7) I find it easy to make decisions 1 2 3 4 5 8) I am more irritable than usual 1 2 3 4 5 9) I still enjoy the things I used to 1 2 3 4 5 10) I feel that I am useful and needed 1 2 3 4 5

71
Appendix G
PANAS This scale consists of a number of words that describe different feelings and emotions. Read each item and then mark the appropriate answer in the space next to that word. Indicate to what extent you feel this way right now, that is, at the present moment. Use the following scale to record your answers. 1 2 3 4 5 very slightly a little moderately quit a bit extremely Or not at all _____ interested _____ irritable _____ distressed _____ alert _____ excited _____ ashamed _____ upset _____ inspired _____ strong _____ nervous _____ guilty _____ determined _____ scared _____ attentive _____ hostile _____ jittery _____ enthusiastic _____ active _____ proud _____ afraid