the publishing market in germany
TRANSCRIPT

The Publishing Market in Germany
Summer School School of Information Management Nanjing University Svenja Hagenhoff Institute for the Study of the Book Epublishing and Digital Markets Group August 2012

Svenja Hagenhoff short CV
● 2011 – Present: Professor for E-Publishing and Digital Markets at Friedrich-Alexander University Erlangen-Nuremberg, Germany
● 2011 - 2012: Lecturer for Media Management at University of Applied Sciences St. Pölten, Sankt Pölten, Austria
● 2010 - 2011: Head of the Institute of Media Economics at University of Applied Sciences St. Pölten, Sankt Pölten, Austria
● 2009 - 2010: Lecturer for Information Systems at Welfenakademie Braunschweig, Braunschweig, Germany
● 2007 – 2007: Lecturer für E-Commerce at International School of New Media at the University of Lübeck, Lübeck, Germany
● 2006 – 2006: Guest Researcher at UCLA Anderson School of Management, Los Angeles, California, United States
● 2004 – 2005: Interims Professor of Information Systems at Universität Hildesheim - University of Hildesheim, Hildesheim, Germany
● 2004 – 2004: Lecturer for Information Systems at Universität Hildesheim - University of Hildesheim, Hildesheim, Germany
● 2002 – 2010: Assistant Professor in Application Systems and E-Business at Georg-August University, Göttingen, Germany
● 2002 – 2010: Head of the Research Group "Internet Economics" at Georg-August University, Göttingen, Germany
● 1997 – 2001: Lecturer for Information at Leibniz-Akademie Hannover, Hanover, Germany
● 1997 – 2002: Research Assistant at Georg-August Universität, Göttingen, Germany
● 1992 – 1997: Studying Business Administration and Information Systems at Georg-August University Göttingen, Germany
2
Outline
● Media Market in General
● Markets for Specific Types of Media
● E-Publishing and Paid Digital Content
● Regulatory Aspects
● Innovative Business Models
● Results of a Survey: Crossmedia Publishing
3

Media Market in General
● Structure
● Revenues
● Media Usage
4

costs
revenue
Structure of the German media market
5
media markets
markets for non-electronic
media (print)
Markets for elektronic media
newspaper markets
magazine markets
book markets
Movie markets
TV markets
Radio markets
Music markets
Video and computer game markets
Internet markets
recipients
advertisement
procurement
Similar to: Wirtz, B.: Medien- und Internetmanagement, Wiesbaden 2006.
Out of home markets

Media Market in General
● Structure
● Revenues
● Media Usage
6

Different kinds of revenues
7
0% 20% 40% 60% 80% 100%
Free newspaper
Free-TV
Newspaper
Scientific magazine
Pay-TV
Book
Recipient‘s revenues Advertising revenues
Part of total revenues
Data from PricewaterhouseCoopers: German Entertainment and Media Outlook: 2011-2015. Frankfurt 2012

Revenue trend total (advertisement & recipients)
8
14970
15949
15988
14484
15239
15718
16300
16799
17322
17800
33100
33603
34054
34880
35046
35397
35907
36714
37410
38048
-1.00
0.00
1.00
2.00
3.00
4.00
5.00
6.00
0
10,000
20,000
30,000
40,000
50,000
60,000
70,000
2006 2007 2008 2009 2010 2011 2012 2013 2014 2015
delta
in %
Reve
nue
in m
illio
n Eu
ro
Recipient revenues (million Euro)
Advertising revenues (million Euro)
delta in %
2012-2015 estimated
Data from PricewaterhouseCoopers: German Entertainment and Media Outlook: 2011-2015. Frankfurt 2012

Revenue trend total (print & electronic)
9
22,397
23,456
24,165
24,712
25,529
26,187
27,082
28,142
29,160
30,115
25,673
26,096
25,877
24,652
24,756
24,928
25,134
25,371
25,572
25,733
-2
-1
0
1
2
3
4
5
6
7
0
10,000
20,000
30,000
40,000
50,000
60,000
2006 2007 2008 2009 2010 2011 2012 2013 2014 2015
delta
in %
Reve
nues
in m
illio
n Eu
ro
Revenue Print (in million Euro)
Revenue electronic (in million Euro)
delta in %
2012-2015 estimated
Data from PricewaterhouseCoopers: German Entertainment and Media Outlook: 2011-2015. Frankfurt 2012
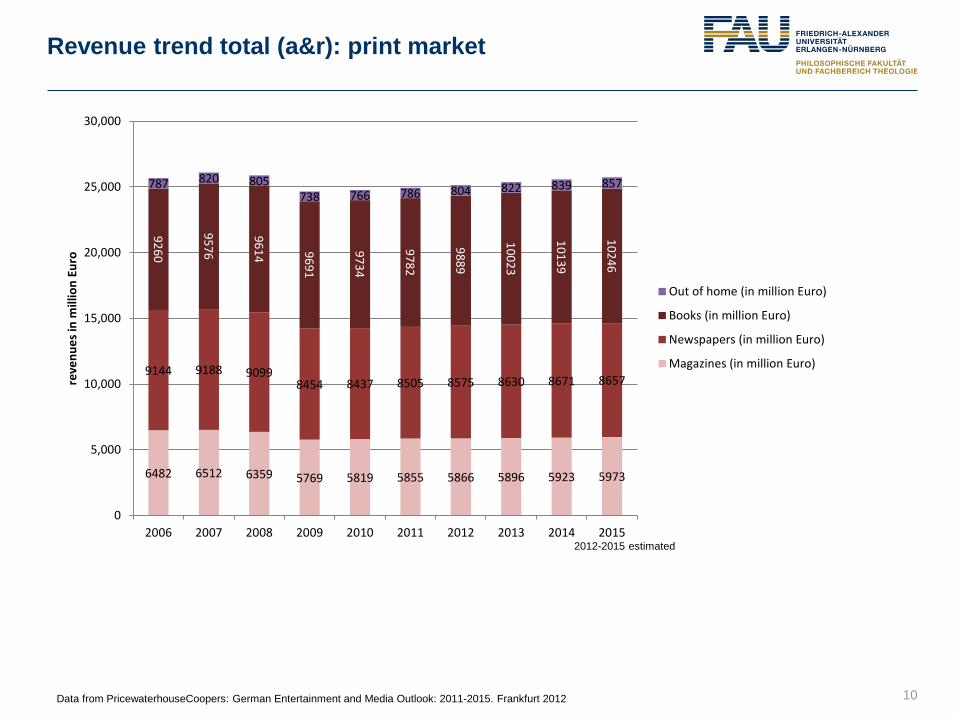
Revenue trend total (a&r): print market
10
2012-2015 estimated
6482 6512 6359 5769 5819 5855 5866 5896 5923 5973
9144 9188 9099 8454 8437 8505 8575 8630 8671 8657
9260
9576
9614
9691
9734
9782
9889
10023
10139
10246
787 820 805 738 766 786 804 822 839 857
0
5,000
10,000
15,000
20,000
25,000
30,000
2006 2007 2008 2009 2010 2011 2012 2013 2014 2015
reve
nues
in m
illio
n Eu
ro
Out of home (in million Euro)
Books (in million Euro)
Newspapers (in million Euro)
Magazines (in million Euro)
Data from PricewaterhouseCoopers: German Entertainment and Media Outlook: 2011-2015. Frankfurt 2012

Revenue trend total (a&r): electronic market
11 PricewaterhouseCoopers: German Entertainment and Media Outlook: 2011-2015. Frankfurt 2012
2012-2015 estimated
6482
6512
6359
5769
5819
5855
5866
5896
5923
5973
11854
11885
11910
11981
12485
12720
13061
13365
13603
13790
1705 1652 1623 1575 1489 1422 1373 1345 1332 1330
3322
3393
3365
3448
3442
3426
3404
3491
3512
3520
1762
2521
3019
3216
3610
4023
4490
4989
5493
5968 1347 1639
1891 1863 1913
1984 2074 2191 2329
2494
0
5,000
10,000
15,000
20,000
25,000
30,000
35,000
2006 2007 2008 2009 2010 2011 2012 2013 2014 2015
reve
nues
in m
illio
n Eu
ro
Videogames (in million Euro)
Online advertisement (in million Euro)
Radio (in million Euro)
Music (in million Euro)
TV (million Euro)
Movies (in million Euro)

Revenue trend advertising: total
12
6,578
7,454
7,820
7,583
8,311
8,794
9,435
10,005
10,618
11,176
8,392
8,495
8,168
6,901
6,928
6,924
6,865
6,794
6,704
6,624
0
2,000
4,000
6,000
8,000
10,000
12,000
14,000
16,000
18,000
20,000
2006 2007 2008 2009 2010 2011 2012 2013 2014 2015
Revenue Print (in million Euro)
Revenue electronic (in million Euro)
Data from PricewaterhouseCoopers: German Entertainment and Media Outlook: 2011-2015. Frankfurt 2012
2012-2015 estimated
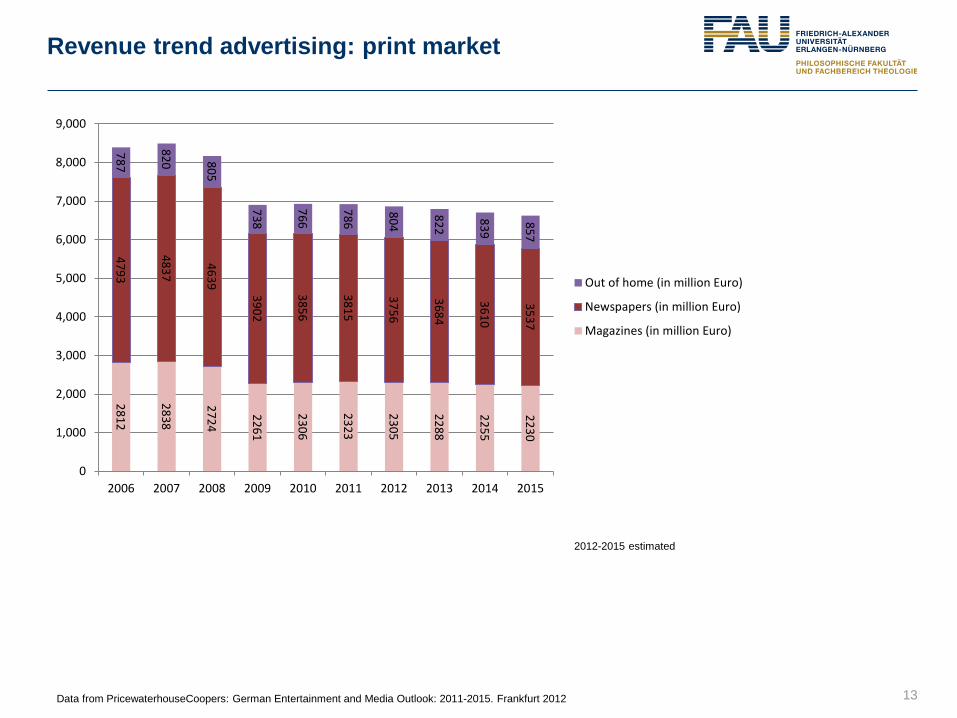
Revenue trend advertising: print market
13
2812
2838
2724
2261
2306
2323
2305
2288
2255
2230
4793
4837
4639 3902
3856
3815
3756
3684
3610
3537
787
820 805
738
766
786
804
822
839
857
0
1,000
2,000
3,000
4,000
5,000
6,000
7,000
8,000
9,000
2006 2007 2008 2009 2010 2011 2012 2013 2014 2015
Out of home (in million Euro)
Newspapers (in million Euro)
Magazines (in million Euro)
Data from PricewaterhouseCoopers: German Entertainment and Media Outlook: 2011-2015. Frankfurt 2012
2012-2015 estimated

Revenue trend advertising: electronic market
14
4114
4156
4036
3640
3954
4000
4150
4200
4280
4350
680
743
720 678
692
705
719
732
753
761
1762
2521
3019
3216
3610
4023
4490
4989
5493
5968
22 34
45 49 55
66 76
84 92
97
0
2,000
4,000
6,000
8,000
10,000
12,000
2006 2007 2008 2009 2010 2011 2012 2013 2014 2015
Videogames (in million Euro)
Online advertisement (in million Euro)
Radio (in million Euro)
TV (million Euro)
Data from PricewaterhouseCoopers: German Entertainment and Media Outlook: 2011-2015. Frankfurt 2012
2012-2015 estimated

Revenue trend recipients: print market
15
3670
3674
3635
3508
3513
3532
3561
3608
3668
3743
4351
4351
4460
4552
4581
4690
4819
4946
5061
5120
9260
9576
9614
9691
9734
9782
9880
10023
10139
10246
0
2,000
4,000
6,000
8,000
10,000
12,000
14,000
16,000
18,000
20,000
2006 2007 2008 2009 2010 2011 2012 2013 2014 2015
Books (in million Euro)
Newspapers (in million Euro)
Magazines (in million Euro)
Data from PricewaterhouseCoopers: German Entertainment and Media Outlook: 2011-2015. Frankfurt 2012
2012-2015 estimated

Revenue trend recipients: electronic market
16
2407
2366
2357
2629
2590
2612
2680
2761
2891
3013
7740
7729
7874
8341
8531
8720
8911
9165
9323
9440
1705
1652
1623
1575
1489
1422
1373
1345
1332
1330
2642
2650
2645
2770
2750
2721
2685
2759
2759
2759
1325
1605
1846
1814
1858
1918
1998
2107
2237
2397
0
2,000
4,000
6,000
8,000
10,000
12,000
14,000
16,000
18,000
20,000
2006 2007 2008 2009 2010 2011 2012 2013 2014 2015
Videogames (in million Euro)
Radio (in million Euro)
Music (in million Euro)
TV (million Euro)
Movies (in million Euro)
Data from PricewaterhouseCoopers: German Entertainment and Media Outlook: 2011-2015. Frankfurt 2012
2012-2015 estimated
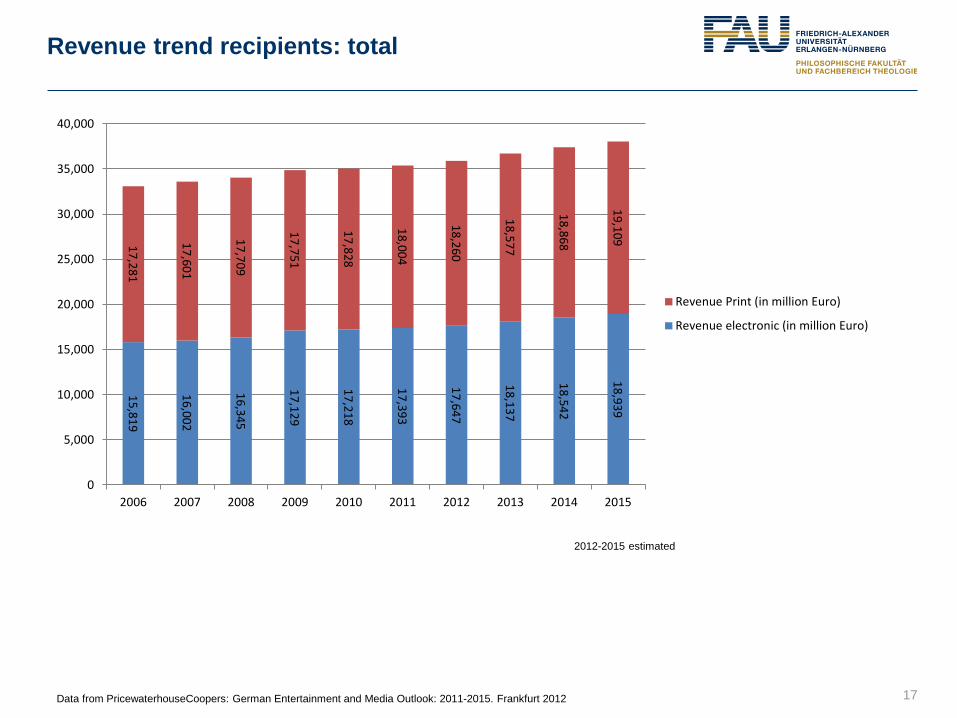
Revenue trend recipients: total
17
15,819
16,002
16,345
17,129
17,218
17,393
17,647
18,137
18,542
18,939
17,281
17,601
17,709
17,751
17,828
18,004
18,260
18,577
18,868
19,109
0
5,000
10,000
15,000
20,000
25,000
30,000
35,000
40,000
2006 2007 2008 2009 2010 2011 2012 2013 2014 2015
Revenue Print (in million Euro)
Revenue electronic (in million Euro)
Data from PricewaterhouseCoopers: German Entertainment and Media Outlook: 2011-2015. Frankfurt 2012
2012-2015 estimated

Economic growth and revenue trends
18
Growth media industry Economic growth nominal
grow
th in
%
Data from PricewaterhouseCoopers: German Entertainment and Media Outlook: 2011-2015. Frankfurt 2012
2012-2015 estimated
Media Market in General
● Structure
● Revenues
● Media Usage
19

Media use in Germany
20 Data from: Verbraucher Analyse Klassik Märkte III 2011, Axel Springer AG, Bauer Media Group
0% 10% 20% 30% 40% 50% 60% 70% 80% 90% 100%
Listening to audiobooks
Playing video / computer games
Reading books
Reading magazines
Using internet
Reading newspaper
Watching television
strongly like
like
dislike
strongly dislike

Media use 2011 in minutes per day
21
TV Radio Newspaper Audio Book
Average 14-19 years 20-29 years 30-49 years ≥ 50 years
PricewaterhouseCoopers: German Entertainment and Media Outlook: 2011-2015. Frankfurt 2012
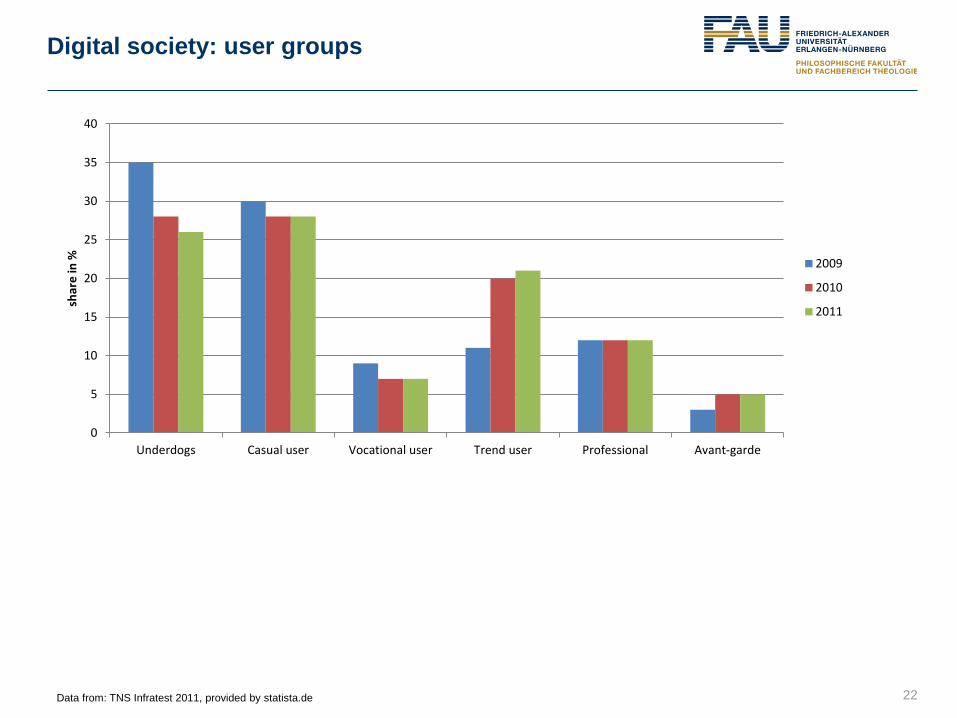
Digital society: user groups
22
0
5
10
15
20
25
30
35
40
Underdogs Casual user Vocational user Trend user Professional Avant-garde
shar
e in
%
2009
2010
2011
Data from: TNS Infratest 2011, provided by statista.de
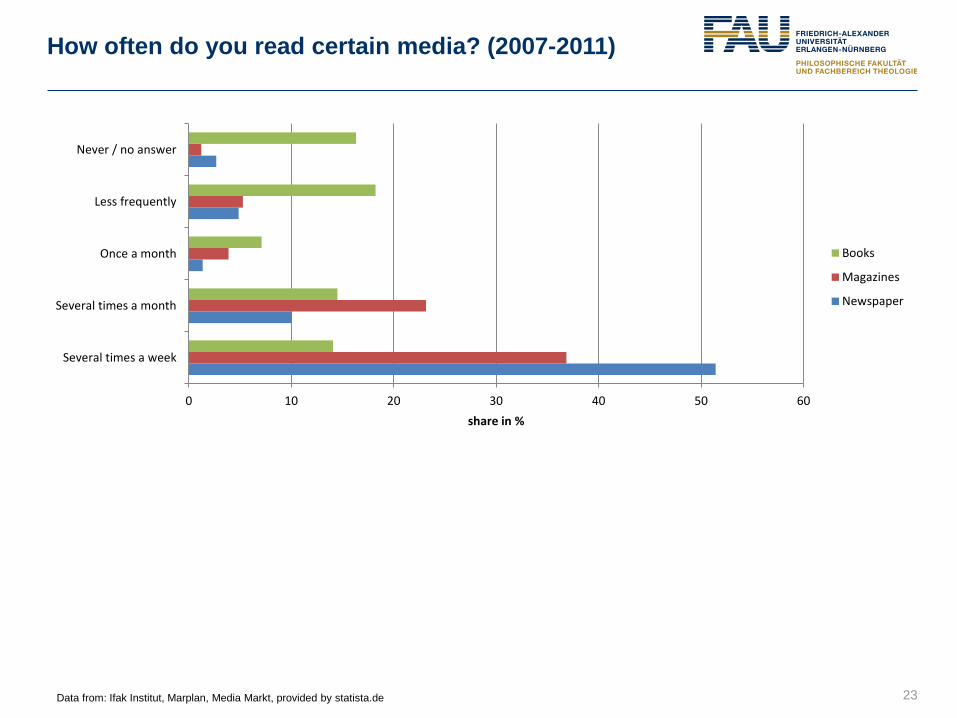
How often do you read certain media? (2007-2011)
23
0 10 20 30 40 50 60
Several times a week
Several times a month
Once a month
Less frequently
Never / no answer
share in %
Books
Magazines
Newspaper
Data from: Ifak Institut, Marplan, Media Markt, provided by statista.de

Book reading in Germany (2011)
24
0% 10% 20% 30% 40% 50% 60% 70% 80% 90% 100%
60–69 yrs.
50–59 yrs.
40–49 yrs.
30–39 yrs.
20–29 yrs.
14–19 yrs.
strongly like
like
dislike
strongly dislike
Data from: Verbraucher Analyse Klassik Märkte III 2011, Axel Springer AG, Bauer Media Group
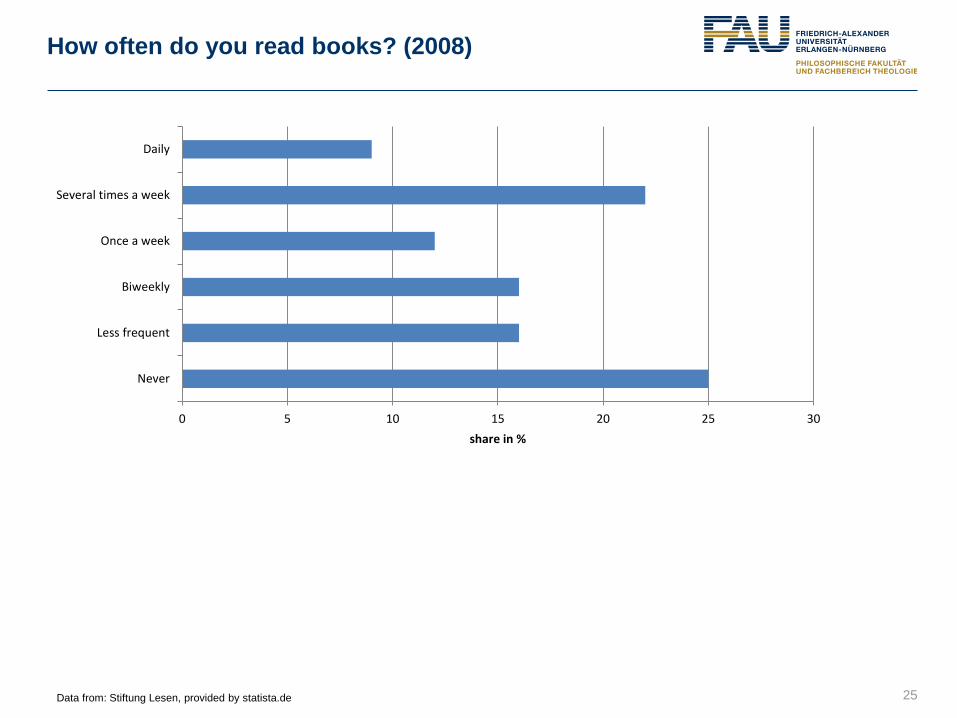
How often do you read books? (2008)
25
0 5 10 15 20 25 30
Never
Less frequent
Biweekly
Once a week
Several times a week
Daily
share in %
Data from: Stiftung Lesen, provided by statista.de

When do you read books? (2008)
26 Data from: TNS Emnid, provided by statista.de
0 10 20 30 40 50 60 70 80 90
Leisure time
Holidays
Before going to bed
On my way to work
Other opportunities
Never
I do not know
share in %
female
male

How many books do you have at home? (2008)
27
57
23
12
6
0
10
20
30
40
50
60
less than 50 50 to 100 100 to 250 more than 250
In %
Data from: German Publishers and Book Sellers Association, provided by statista.de

Outline
● Media Market in General
● Markets for Specific Types of Media
● E-Publishing and Paid Digital Content
● Regulatory Aspects
● Innovative Business Models
● Results of a Survey: Crossmedia Publishing
28

Markets for Specific Types of Media
● TV and Radio Markets
● Newspaper Markets
● Magazine Markets
● Book Markets
29
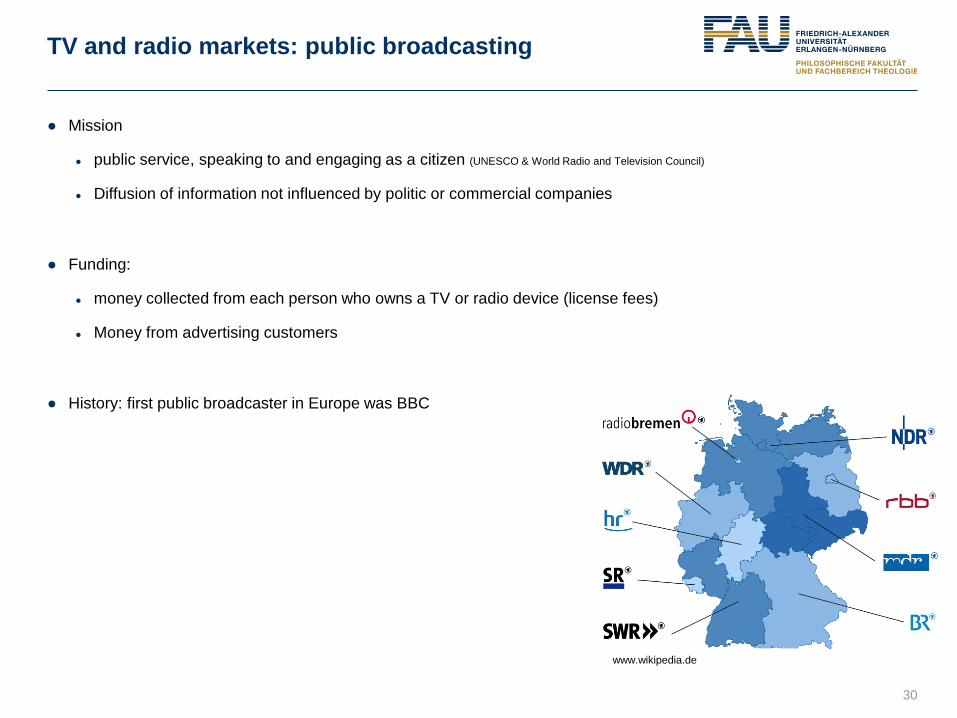
TV and radio markets: public broadcasting
30
● Mission
● public service, speaking to and engaging as a citizen (UNESCO & World Radio and Television Council)
● Diffusion of information not influenced by politic or commercial companies
● Funding:
● money collected from each person who owns a TV or radio device (license fees)
● Money from advertising customers
● History: first public broadcaster in Europe was BBC
www.wikipedia.de

TV and radio markets: private broadcasting
31
● Mission:
● Very different concepts
● often specialized programs (e.g. only sports, only movies,…)
● Funding:
● Money from advertising customers
● Pay TV
● History: beginning of 1980ies deregulation of the broadcasting market in Europe started

Markets for Specific Types of Media
● TV and Radio Markets
● Newspaper Markets
● Magazine Markets
● Book Markets
32

Revenue trend newspaper market
33 Data from PricewaterhouseCoopers: German Entertainment and Media Outlook: 2011-2015. Frankfurt 2012
4793
4837
4639
3902
3856
3815
3756
3684
3610
3537
96 126 155
162 186 215 245 270 299 331
4261
4261
4373 4470
4473
4568
4671
4747
4800
4823
0 0 0 0 22 37.2 63.2 115.5 174.6 209.3
90 90 87 82 86 85 84 84 86 88
0
1000
2000
3000
4000
5000
6000
7000
8000
9000
10000
2006 2007 2008 2009 2010 2011 2012 2013 2014 2015
Supplements
Recipients digital
Recipients print
Advertisement digital
Advertisement print
2012-2015 estimated
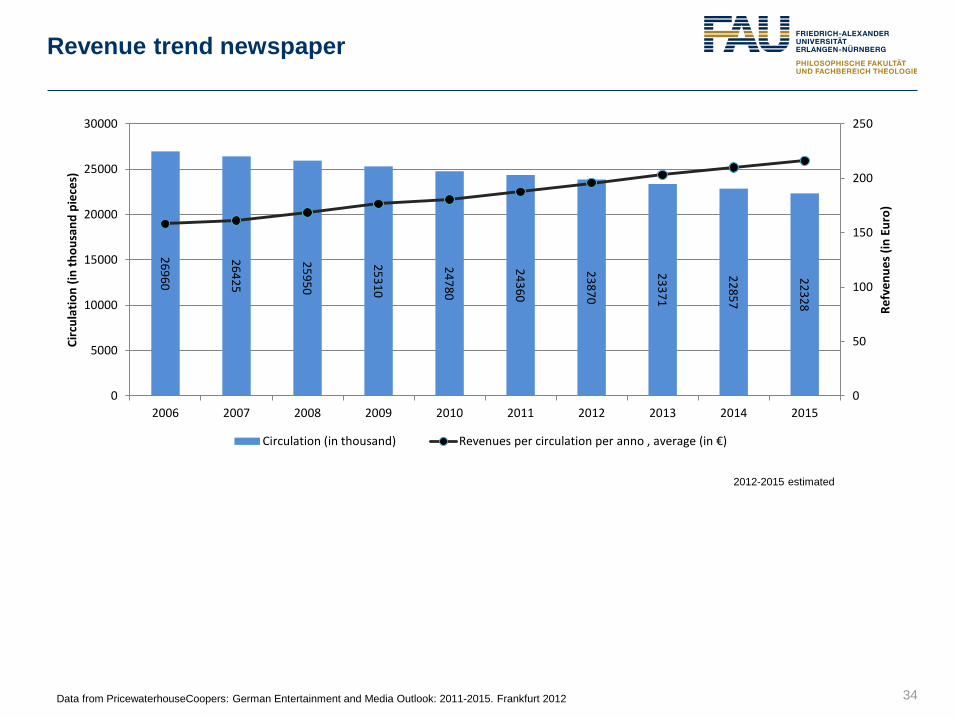
Revenue trend newspaper
34
26960
26425
25950
25310
24780
24360
23870
23371
22857
22328
0
50
100
150
200
250
0
5000
10000
15000
20000
25000
30000
2006 2007 2008 2009 2010 2011 2012 2013 2014 2015
Refv
enue
s (in
Eur
o)
Circ
ulat
ion
(in th
ousa
nd p
iece
s)
Circulation (in thousand) Revenues per circulation per anno , average (in €)
Data from PricewaterhouseCoopers: German Entertainment and Media Outlook: 2011-2015. Frankfurt 2012
2012-2015 estimated

Regularly readers of newspapers
35
40
45
50
55
60
65
70
75
80
85
90
2005 2006 2007 2008 2009 2010
part
of p
erso
ns in
%
14-19
20-29
30-39
40-49
50-59
60-69
>69
Total (in %)
Data from PricewaterhouseCoopers: German Entertainment and Media Outlook: 2011-2015. Frankfurt 2012
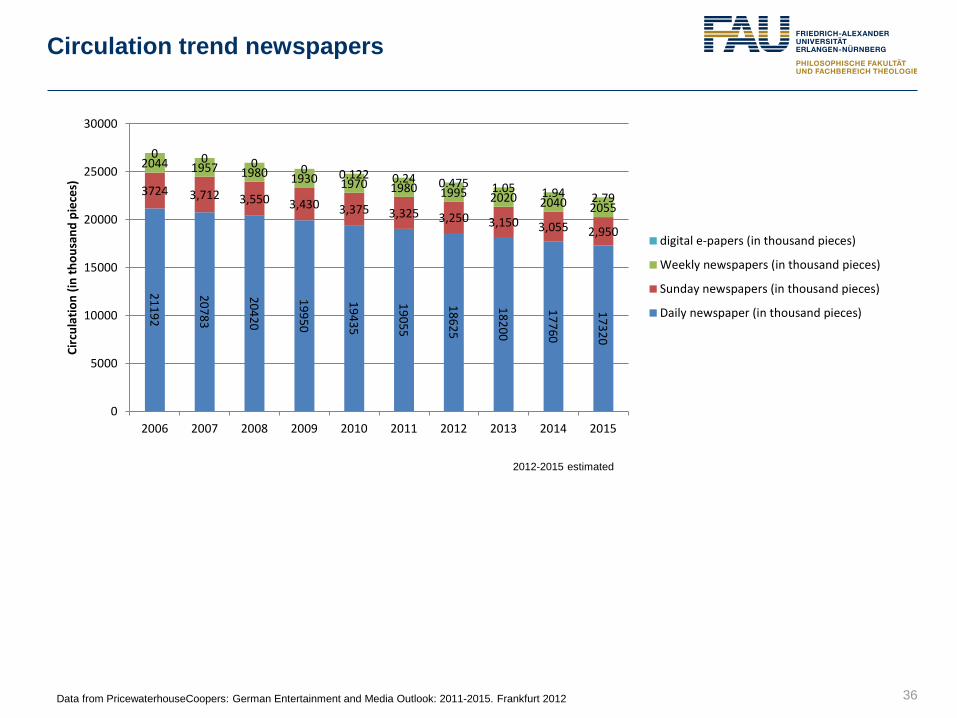
Circulation trend newspapers
36
21192
20783
20420
19950
19435
19055
18625
18200
17760
17320
3724 3,712 3,550 3,430 3,375 3,325 3,250 3,150 3,055 2,950
2044 1957 1980 1930 1970 1980 1995 2020 2040 2055
0 0 0 0 0.122 0.24 0.475 1.05 1.94 2.79
0
5000
10000
15000
20000
25000
30000
2006 2007 2008 2009 2010 2011 2012 2013 2014 2015
Circ
ulat
ion
(in th
ousa
nd p
iece
s)
digital e-papers (in thousand pieces)
Weekly newspapers (in thousand pieces)
Sunday newspapers (in thousand pieces)
Daily newspaper (in thousand pieces)
Data from PricewaterhouseCoopers: German Entertainment and Media Outlook: 2011-2015. Frankfurt 2012
2012-2015 estimated

Revenue trend (recipients) digital newspapers
37
122 240
475
1050
1940
2790
0
20
40
60
80
100
120
140
160
180
200
0
500
1000
1500
2000
2500
3000
2010 2011 2012 2013 2014 2015
Reve
nues
per
circ
ulat
ion
(in m
illio
n €)
Circ
ulat
ion
(in th
ousa
nd p
iece
s)
Circulation (in thousand pieces)
Revenues per circulation per anno, average (in million €)
Data from PricewaterhouseCoopers: German Entertainment and Media Outlook: 2011-2015. Frankfurt 2012
2012-2015 estimated
Markets for Specific Types of Media
● TV and Radio Markets
● Newspaper Markets
● Magazine Markets
● Book Markets
38
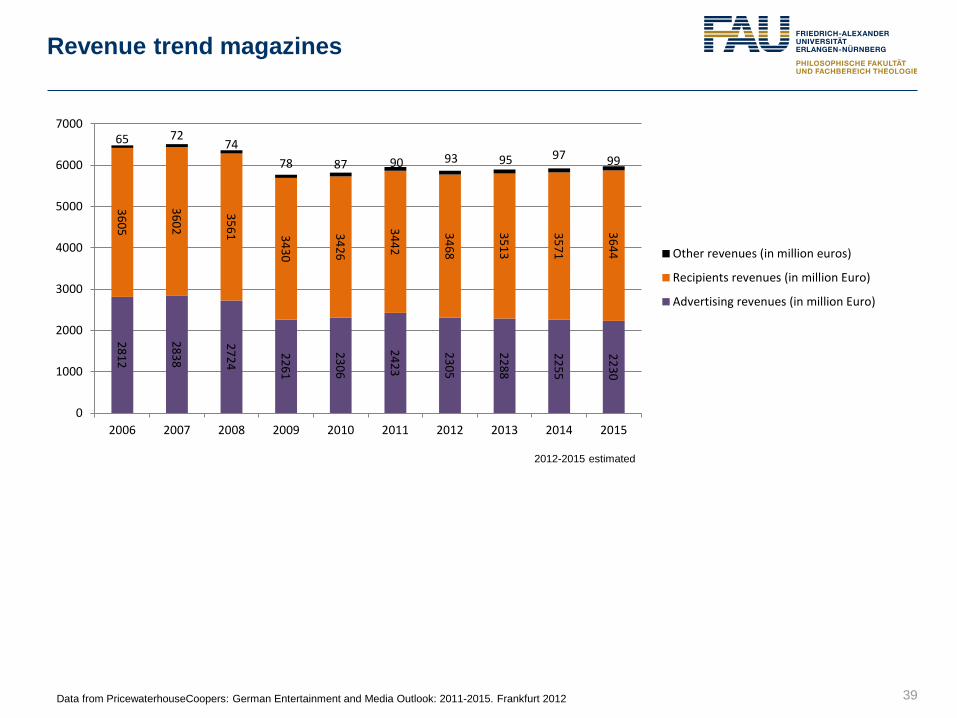
Revenue trend magazines
39 Data from PricewaterhouseCoopers: German Entertainment and Media Outlook: 2011-2015. Frankfurt 2012
2812
2838
2724
2261
2306
2423
2305
2288
2255
2230
3605
3602
3561 3430
3426
3442
3468
3513
3571
3644
65 72 74
78 87 90 93 95 97 99
0
1000
2000
3000
4000
5000
6000
7000
2006 2007 2008 2009 2010 2011 2012 2013 2014 2015
Other revenues (in million euros)
Recipients revenues (in million Euro)
Advertising revenues (in million Euro)
2012-2015 estimated
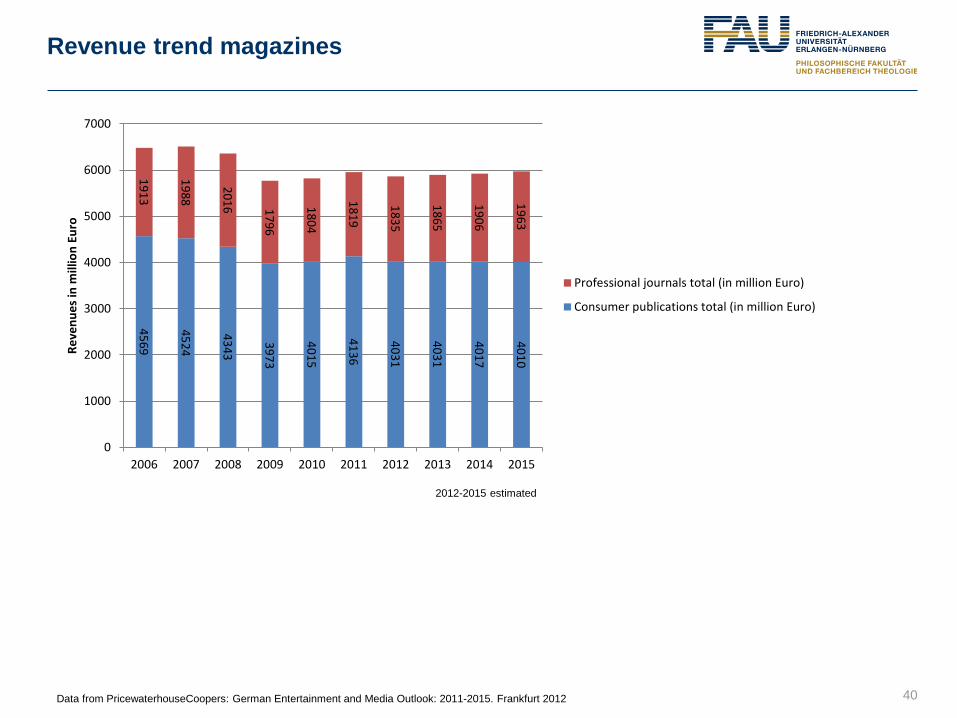
Revenue trend magazines
40 Data from PricewaterhouseCoopers: German Entertainment and Media Outlook: 2011-2015. Frankfurt 2012
4569
4524
4343
3973
4015
4136
4031
4031
4017
4010
1913
1988
2016 1796
1804
1819
1835
1865
1906
1963 0
1000
2000
3000
4000
5000
6000
7000
2006 2007 2008 2009 2010 2011 2012 2013 2014 2015
Reve
nues
in m
illio
n Eu
ro
Professional journals total (in million Euro)
Consumer publications total (in million Euro)
2012-2015 estimated
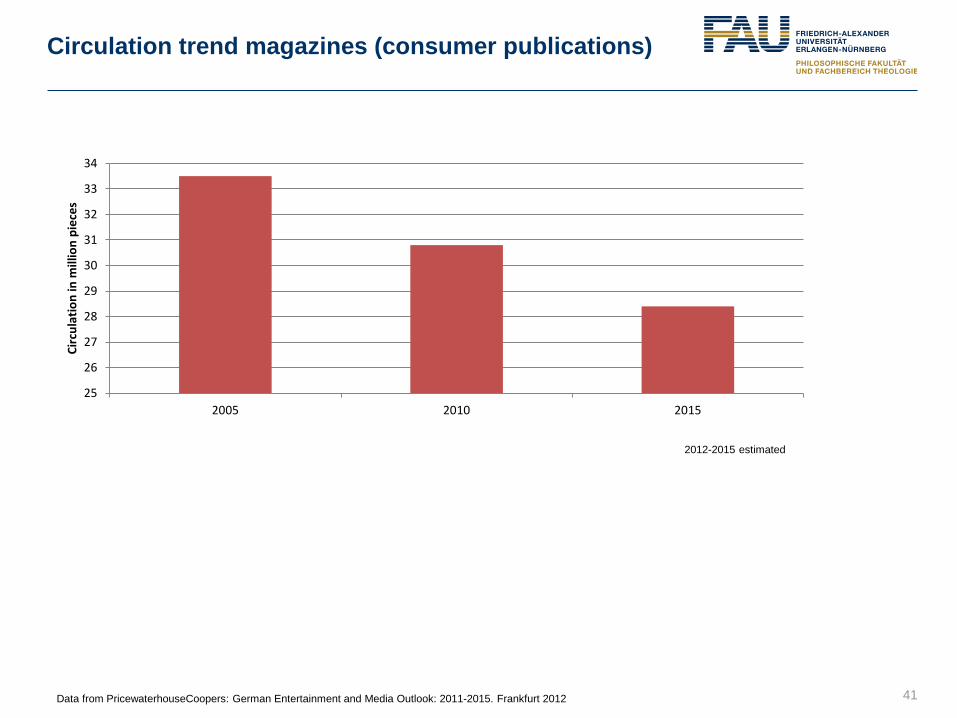
Circulation trend magazines (consumer publications)
41 Data from PricewaterhouseCoopers: German Entertainment and Media Outlook: 2011-2015. Frankfurt 2012
25
26
27
28
29
30
31
32
33
34
2005 2010 2015
Circ
ulat
ion
in m
illio
n pi
eces
2012-2015 estimated
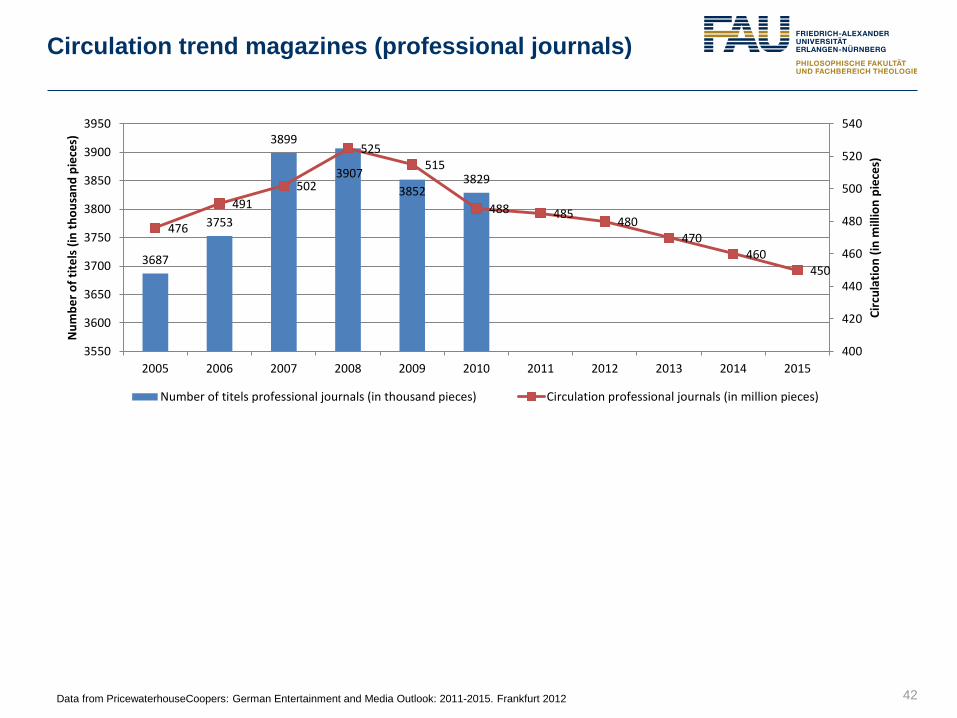
Circulation trend magazines (professional journals)
42 Data from PricewaterhouseCoopers: German Entertainment and Media Outlook: 2011-2015. Frankfurt 2012
3687
3753
3899
3907 3852
3829
476
491 502
525 515
488 485 480 470
460 450
400
420
440
460
480
500
520
540
3550
3600
3650
3700
3750
3800
3850
3900
3950
2005 2006 2007 2008 2009 2010 2011 2012 2013 2014 2015
Circ
ulat
ion
(in m
illio
n pi
eces
)
Num
ber o
f tite
ls (i
n th
ousa
nd p
iece
s)
Number of titels professional journals (in thousand pieces) Circulation professional journals (in million pieces)

Markets for Specific Types of Media
● TV and Radio Markets
● Newspaper Markets
● Magazine Markets
● Book Markets
43
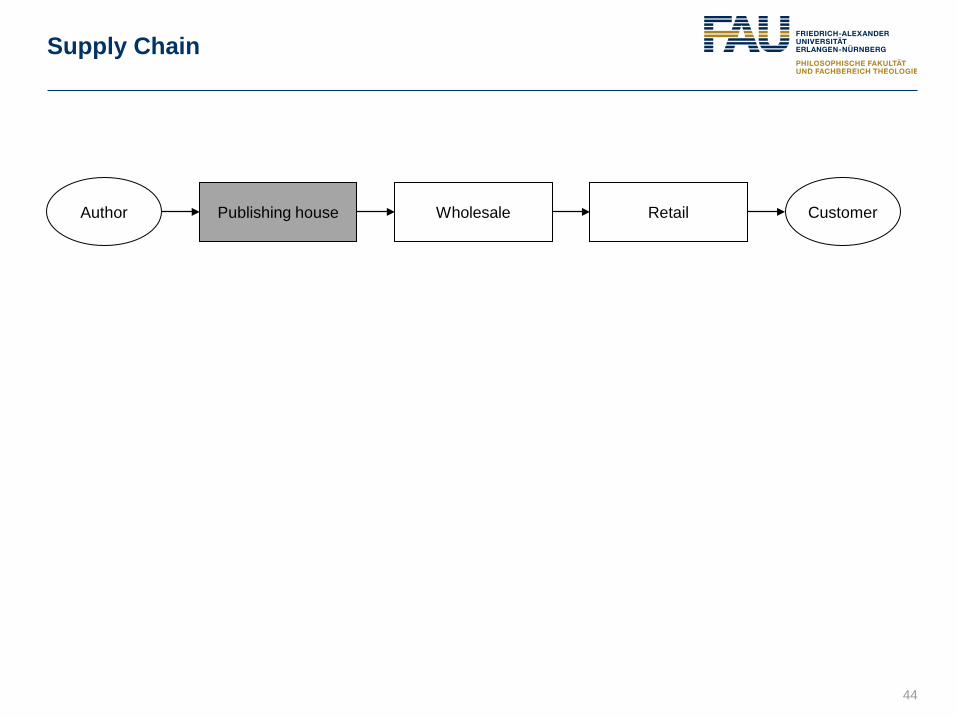
Supply Chain
44
Publishing house Wholesale Retail Customer Author
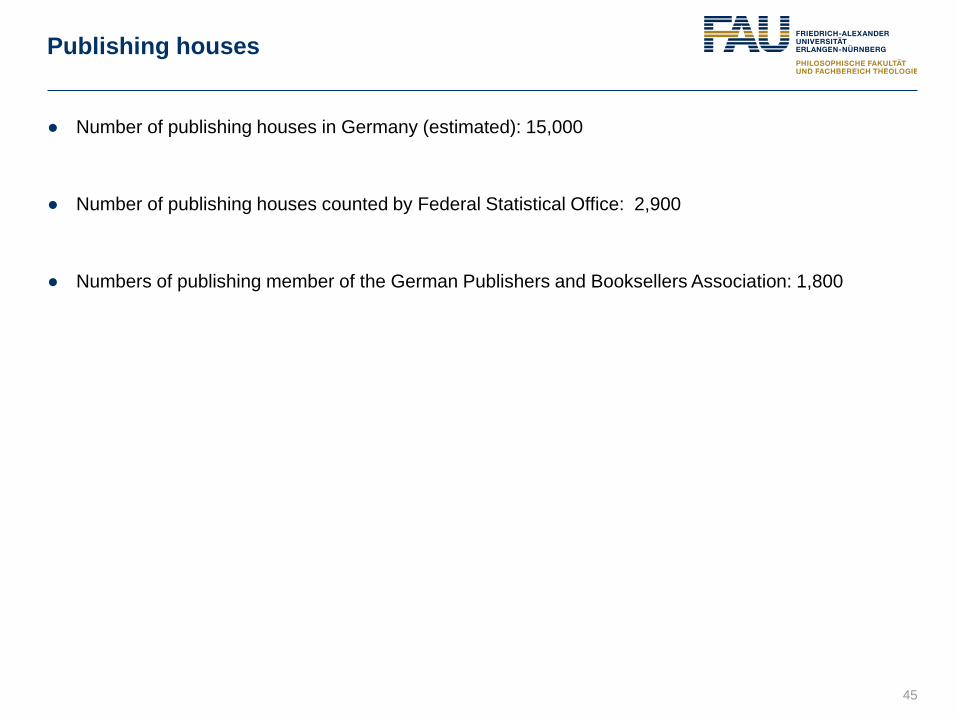
Publishing houses
● Number of publishing houses in Germany (estimated): 15,000
● Number of publishing houses counted by Federal Statistical Office: 2,900
● Numbers of publishing member of the German Publishers and Booksellers Association: 1,800
45
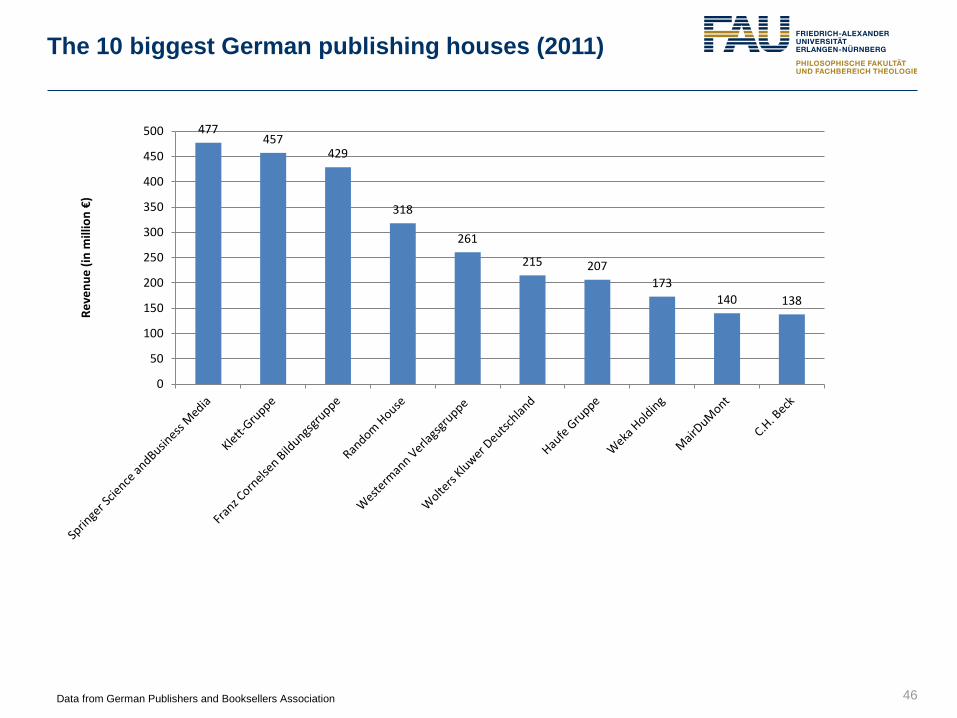
The 10 biggest German publishing houses (2011)
46 Data from German Publishers and Booksellers Association
477 457
429
318
261
215 207 173
140 138
0
50
100
150
200
250
300
350
400
450
500
Reve
nue
(in m
illio
n €)

New book titles trend
47
59,916 61,538
74,074 78,082
81,177 86,084
83,381 81,793 84,351
82,048
0
10,000
20,000
30,000
40,000
50,000
60,000
70,000
80,000
90,000
2002 2003 2004 2005 2006 2007 2008 2009 2010 2011
Num
bre
of n
ew ti
tles
Data from German Publishers and Booksellers Association
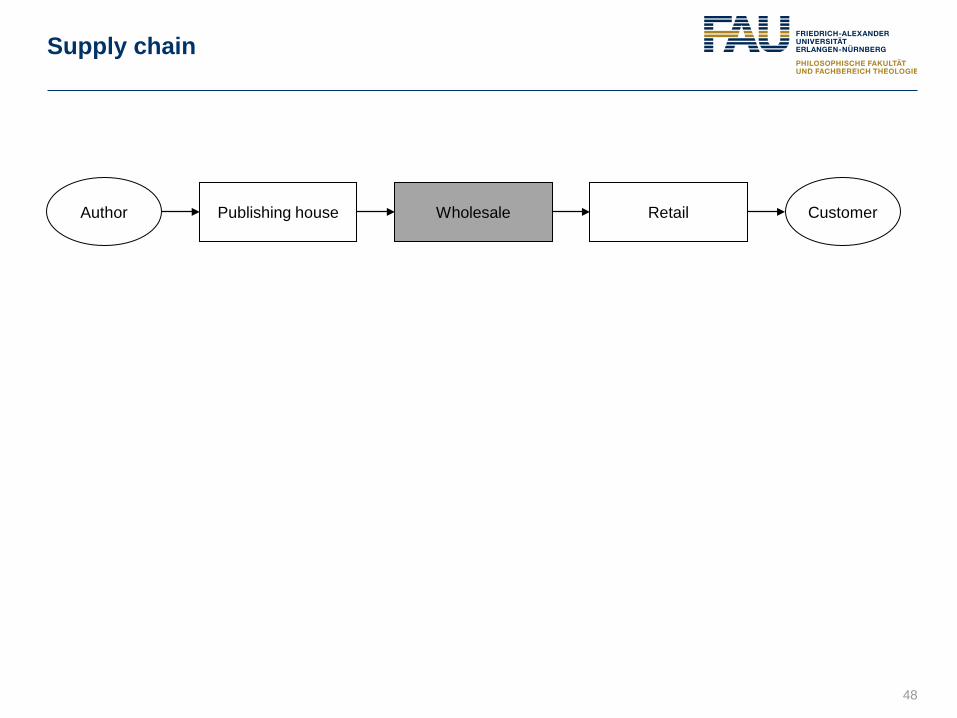
Supply chain
48
Publishing house Wholesale Retail Customer Author
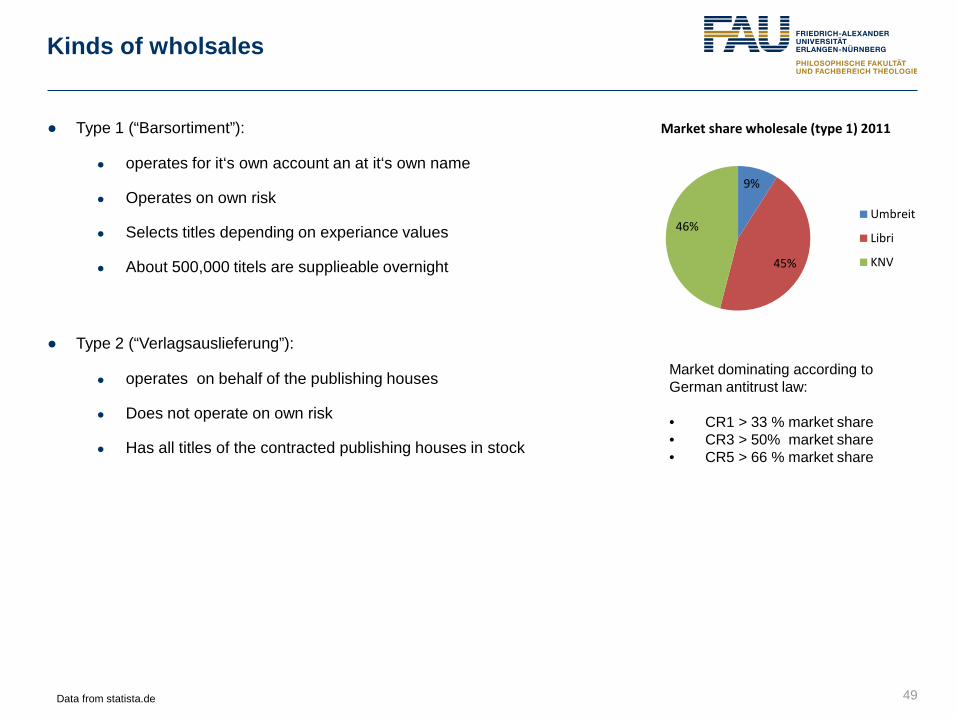
Kinds of wholsales
● Type 1 (“Barsortiment”):
● operates for it‘s own account an at it‘s own name
● Operates on own risk
● Selects titles depending on experiance values
● About 500,000 titels are supplieable overnight
● Type 2 (“Verlagsauslieferung”):
● operates on behalf of the publishing houses
● Does not operate on own risk
● Has all titles of the contracted publishing houses in stock
49
9%
45%
46%
Market share wholesale (type 1) 2011
Umbreit
Libri
KNV
Market dominating according to German antitrust law: • CR1 > 33 % market share • CR3 > 50% market share • CR5 > 66 % market share
Data from statista.de

Supply chain
50
Publishing house Wholesale Retail Customer Author
Kinds of retail
51
● Retail bookshops
● Department stores
● Catalogue selling
● Antiquarian bookshops
● Special bookshops
● Book shops in railway stations
● Book clubs
● Secondary markets
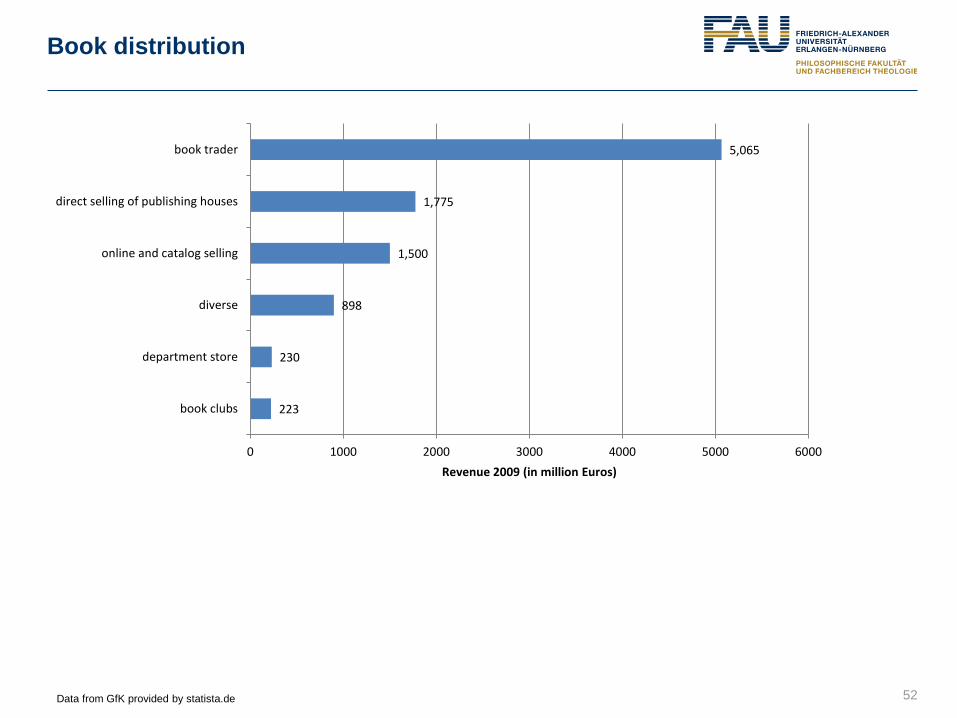
Book distribution
52
223
230
898
1,500
1,775
5,065
book clubs
department store
diverse
online and catalog selling
direct selling of publishing houses
book trader
0 1000 2000 3000 4000 5000 6000Revenue 2009 (in million Euros)
Data from GfK provided by statista.de
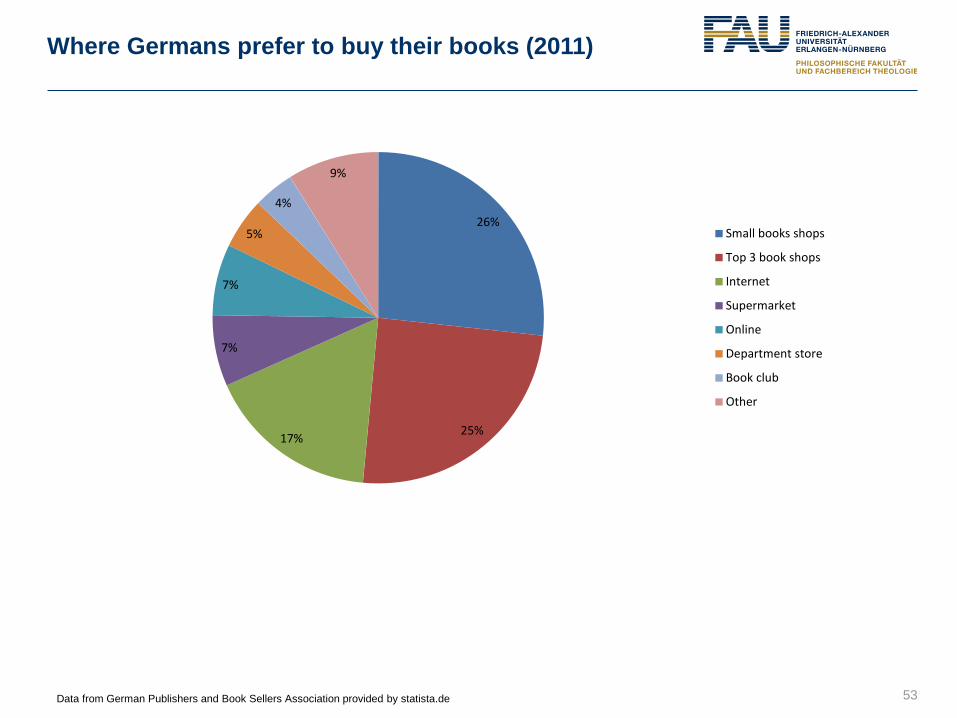
Where Germans prefer to buy their books (2011)
53
26%
25% 17%
7%
7%
5%
4%
9%
Small books shops
Top 3 book shops
Internet
Supermarket
Online
Department store
Book club
Other
Data from German Publishers and Book Sellers Association provided by statista.de
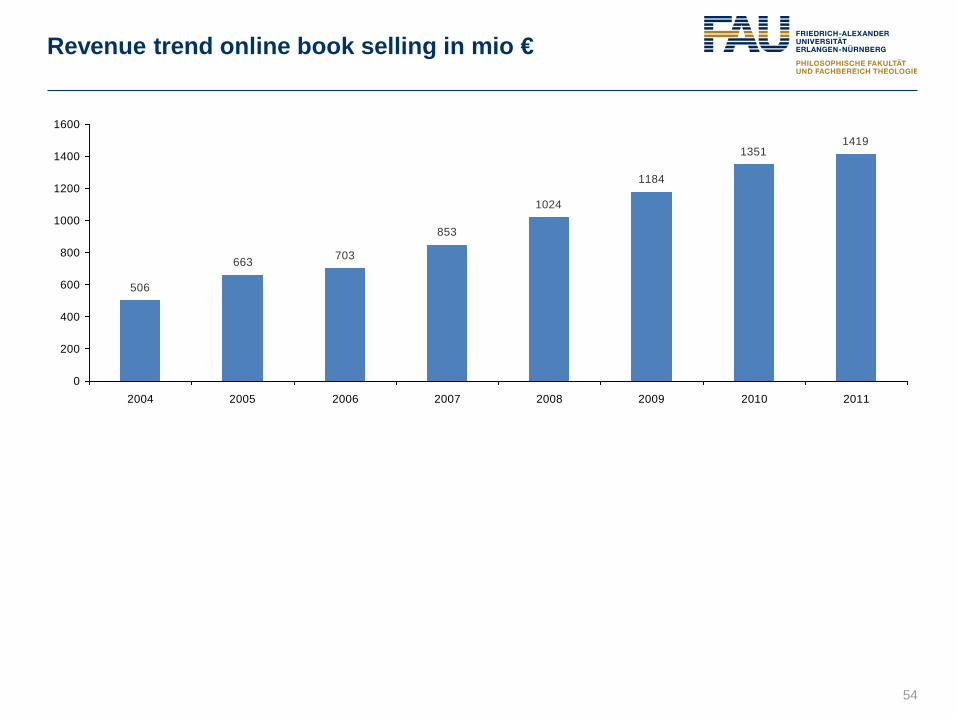
Revenue trend online book selling in mio €
54
663 703
853
1024
1184
13511419
506
0
200
400
600
800
1000
1200
1400
1600
2004 2005 2006 2007 2008 2009 2010 2011

Retail bookshops
55
● Kind of shops
● General assortment (wide assortment)
● Specialized assortment (deep assortment: scientific books, special interests)
● Trends (general assortment shops)
● Step 1: large area bookshops
● Step 2: downsizing as well as non-book assortments (toys, paper, cookies,…)
223 230
898
1,500
1,775
5,065
Revenues 2009 (in million Euros)
book clubs
department store
diverse
online and catalog selling
direct selling of publishing houses
book trader

Retail bookshops
56 Photos: Svenja Hagenhoff, August 8th, 2012; Bookshop Rupprecht, Erlangen, Germany
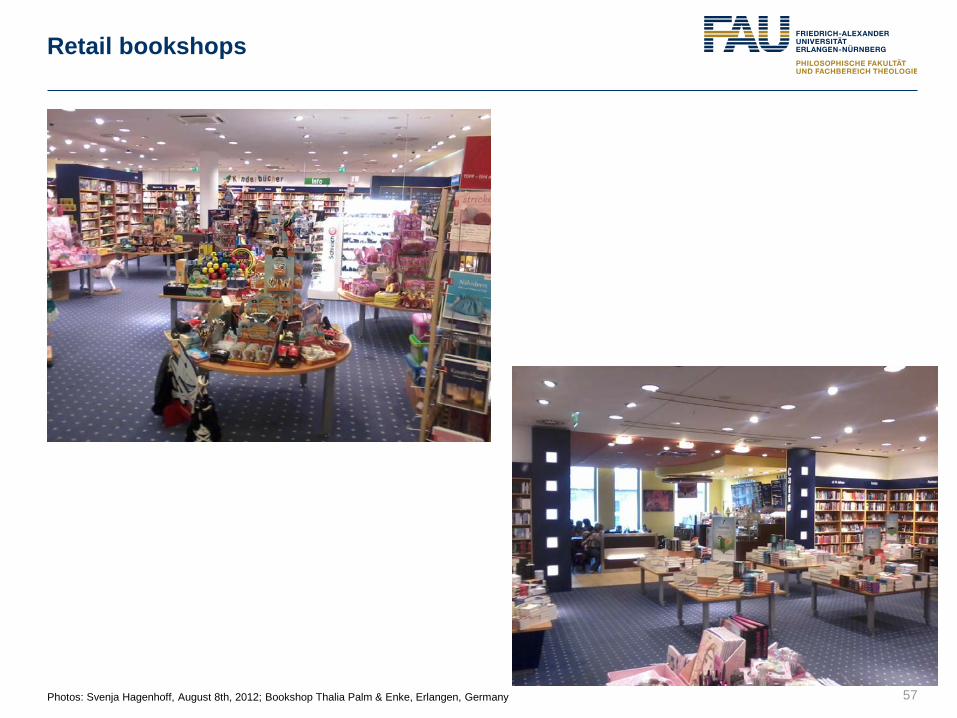
Retail bookshops
57 Photos: Svenja Hagenhoff, August 8th, 2012; Bookshop Thalia Palm & Enke, Erlangen, Germany
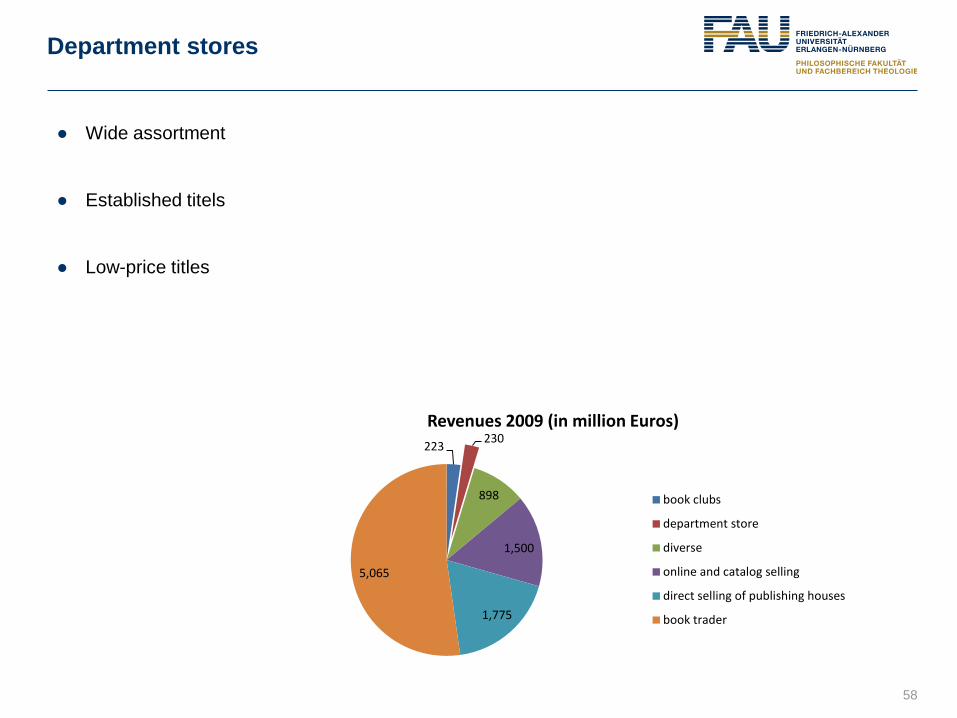
Department stores
58
223 230
898
1,500
1,775
5,065
Revenues 2009 (in million Euros)
book clubs
department store
diverse
online and catalog selling
direct selling of publishing houses
book trader
● Wide assortment
● Established titels
● Low-price titles

Department stores
59 Photos: Svenja Hagenhoff, August 8th, 2012; Department store Galeria Kaufhof, Erlangen, Germany

Online trading
60
223 230
898
1,500
1,775
5,065
Revenues 2009 (in million Euros)
book clubs
department store
diverse
online and catalog selling
direct selling of publishing houses
book trader
● Electronic market places
● Online warehouses, e.g. amazon
● All kinds of goods
● E.g. amazon.de, otto.de
● Online book stores
● Only books
● E.g. libreka.de, buecher.de
● Online book stores of traditional book stores
● E.g. Thalia.de, rupprecht.de, hugendubel.de
● Digital marketplaces for ebooks (only digital goods), e.g. iTunes, PagePlace, textunes

Online warehouses
61

Online bookshops
62

Online book stores of traditional book stores
63

Digital market places
64
iTunes from Apple PagePlace from T-Online
Textunes
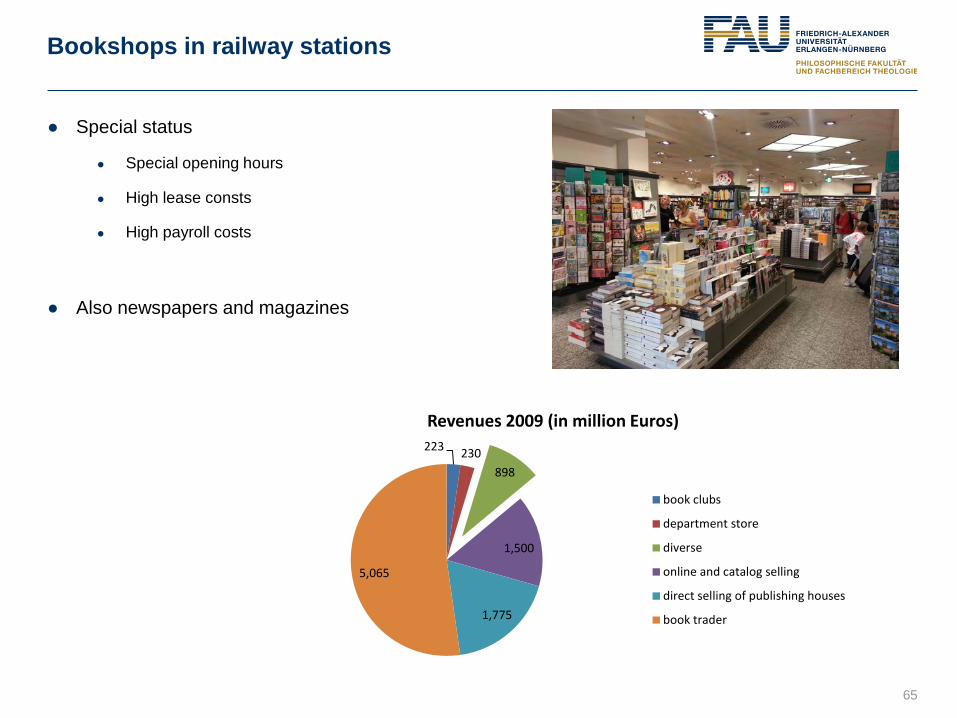
Bookshops in railway stations
65
● Special status
● Special opening hours
● High lease consts
● High payroll costs
● Also newspapers and magazines
223 230 898
1,500
1,775
5,065
Revenues 2009 (in million Euros)
book clubs
department store
diverse
online and catalog selling
direct selling of publishing houses
book trader
Antiquarian bookshop
66
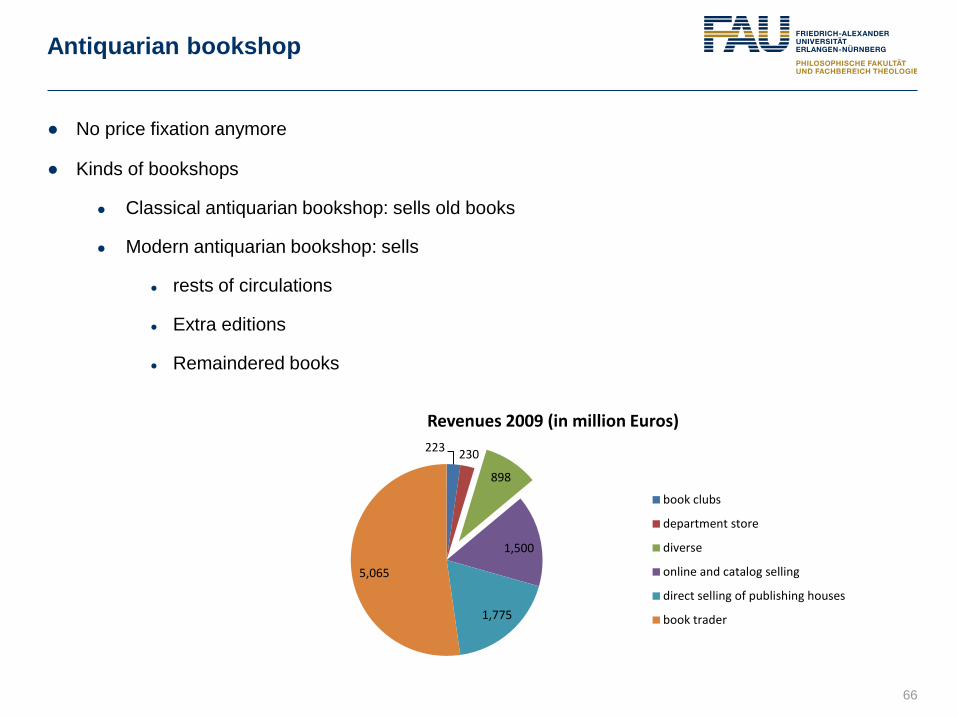
● No price fixation anymore
● Kinds of bookshops
● Classical antiquarian bookshop: sells old books
● Modern antiquarian bookshop: sells
● rests of circulations
● Extra editions
● Remaindered books
223 230
898
1,500
1,775
5,065
Revenues 2009 (in million Euros)
book clubs
department store
diverse
online and catalog selling
direct selling of publishing houses
book trader

Secondary markets
67 Photos: Svenja Hagenhoff, August 8th, 2012; drugstore Müller, Erlangen, Germany
Books as additional assortment in supermarkets, drugstores etc.
223 230
898
1,500
1,775
5,065
Revenues 2009 (in million Euros)
book clubs
department store
diverse
online and catalog selling
direct selling of publishing houses
book trader

Book clubs
68 Photos: Svenja Hagenhoff, August 8th, 2012; drugstore Müller, Erlangen, Germany
● Subscription model
● Customer
● needs to be member of the club
● Has to buy at least a certain number of books per time
223
230
898
1,500
1,775
5,065
Revenues 2009 (in million Euros)
book clubs
department store
diverse
online and catalog selling
direct selling of publishing houses
book trader

Book revenues: trade groups (2011, in %)
69 Data from PricewaterhouseCoopers: German Entertainment and Media Outlook: 2011-2015. Frankfurt 2012
34
16 14
10
9
6
5 5 3
Fiction books
Children and youth books
Advice booklets
Non-fiction books
School and learning
Travel
Natural Sciences, Medicine, Computer Sciences
Humanities, Arts, Music
Social Sciences, Economics, Law

Revenue trend book market
70
9,067 9,076 9,159
9,260
9,576 9,614 9,691 9,734 9,782
9,889 10,023
10,139 10,246
8,400
8,600
8,800
9,000
9,200
9,400
9,600
9,800
10,000
10,200
10,400
2003 2004 2005 2006 2007 2008 2009 2010 2011 2012 2013 2014 2015
Reve
nues
in m
illio
n Eu
ro
Data from PricewaterhouseCoopers: German Entertainment and Media Outlook: 2011-2015. Frankfurt 2012
2012-2015 estimated

The biggest German book traders 2009
71
910
743
170 165 88 85 74 72
0
100
200
300
400
500
600
700
800
900
1,000
Revenues in million Euro (total 2,300 million Euro)
Data from PricewaterhouseCoopers: German Entertainment and Media Outlook: 2011-2015. Frankfurt 2012
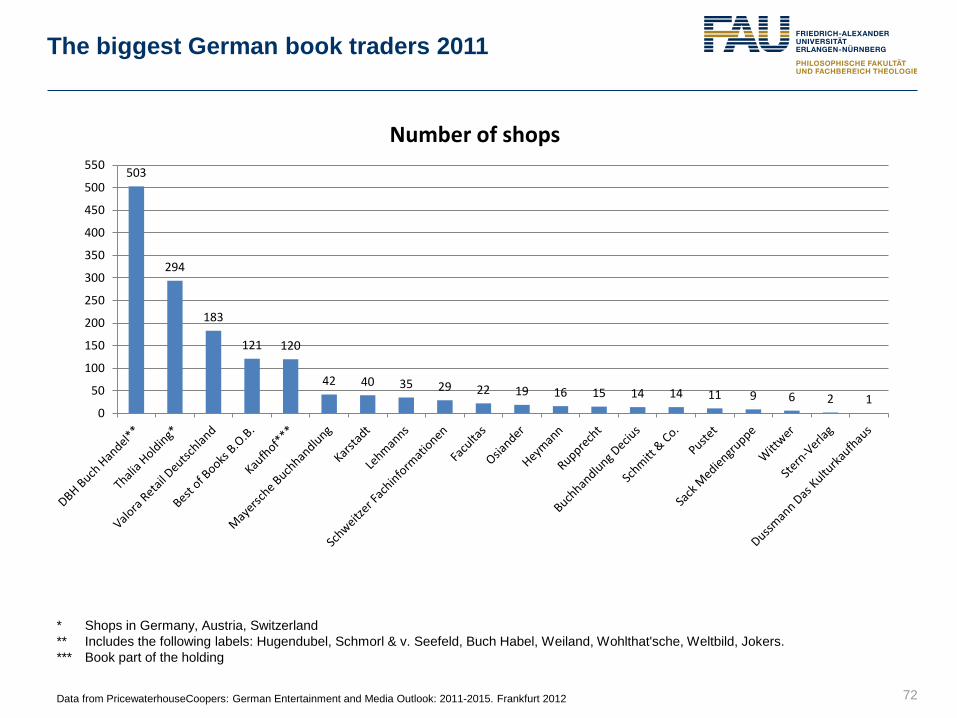
72
* Shops in Germany, Austria, Switzerland ** Includes the following labels: Hugendubel, Schmorl & v. Seefeld, Buch Habel, Weiland, Wohlthat'sche, Weltbild, Jokers. *** Book part of the holding
503
294
183
121 120
42 40 35 29 22 19 16 15 14 14 11 9 6 2 1 0
50
100
150
200
250
300
350
400
450
500
550
Number of shops
The biggest German book traders 2011
Data from PricewaterhouseCoopers: German Entertainment and Media Outlook: 2011-2015. Frankfurt 2012

Revenue trend books
73
4,195
4,388
4,507
4,797
4,779
4,867
4,974
5,086
5,185
5,278
2,778
2,126
2,144
2,060
2,015
2,000
2,015
2,025
2,032
2,037
2,287
3,062
2,963
2,834
2,940
2,915
2,900
2,912
2,922
2,931
0
2000
4000
6000
8000
10000
12000
2006 2007 2008 2009 2010 2011 2012 2013 2014 2015
Revenue non-fiction books print (in million €)
Revenue school and lecture books (in million €)
Revenue fiction books total (in million €)
Data from PricewaterhouseCoopers: German Entertainment and Media Outlook: 2011-2015. Frankfurt 2012
Outline
● Media Market in General
● Markets for Specific Types of Media
● E-Publishing and Paid Digital Content
● Regulatory Aspects
● Innovative Business Models
● Results of a Survey: Crossmedia Publishing
74
E-Publishing and Paid Digital Content
● Market Data E-Publishing
● Reader‘s behaviour
● Publishing Houses‘ behaviour
● Paid Digital Content and Services as a Challenge
75

Ebook market 2011
76
Values Revenues in million € 38
Revenue trend (basis: 2010) in % 77
Sold ebooks in million 4.70
Ebook share of sales of total revenues in % 1
Data from statista.de

Ebook revenues fictional books
77
Revenues in Millionen Euro (data 2012-2015 estimated)
21
67
137
216
287
355
30
50
100
150
200
250
300
350
400
2009 2010 2011 2012 2013 2014 2015
Data PwC, German Entertainment and Media Outlook: 2011-2015
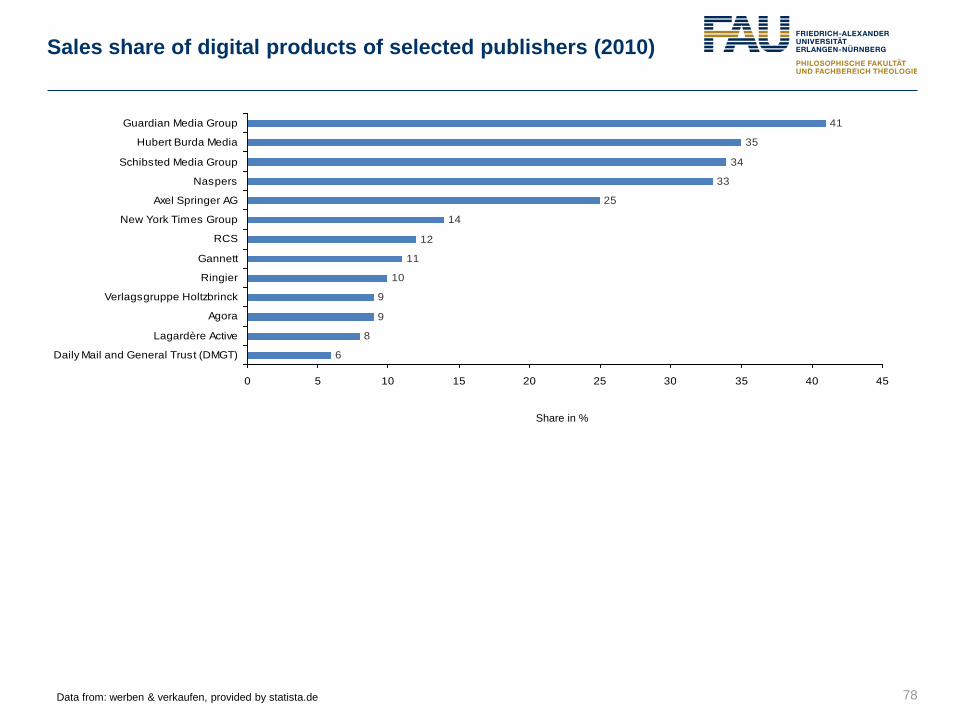
Sales share of digital products of selected publishers (2010)
78 Data from: werben & verkaufen, provided by statista.de
6
8
9
9
10
11
12
14
25
33
34
35
41
0 5 10 15 20 25 30 35 40 45
Daily Mail and General Trust (DMGT)
Lagardère Active
Agora
Verlagsgruppe Holtzbrinck
Ringier
Gannett
RCS
New York Times Group
Axel Springer AG
Naspers
Schibsted Media Group
Hubert Burda Media
Guardian Media Group
Share in %

E-Book devices
79
Kindle 4 Oyo 2 SONY PRS T1 Kobo Reade Touch
TouchMe iPad Samsung Galaxy
Date of appearance
2011 2011 2011 2011 2011 2011 2011
Manufacturer Amazon Thalia / Medion Sony Kobo Thalia/Smartscreens
Apple Samsung
Disitribution Online via Amazon
Thalia Booktrader Diverse shops Diverse shops Thalia booktrader Diverse shops Diverse shops
File transfer WIFI, PC WIFI, PC WIFI, PC WIFI, PC PC
WIWI, 3G, PC WIWI, 3G, PC
File formats AZW, TXT, PDF, unprotected MOBI, PRC, HTML, DOC
EPUB, PDF, TXT, HTML
EPUB, PDF, TXT, HTML
EPUB, PDF, MOBI, PDF, TXT, HTML, RTF, CBZ, CBR
ePub, PDF, Mobi, HTML, TXT, PDB, RTF, LRC, FB2, TVT, MPG, AVI
via Apps every format possible
via Apps every format possible
Shopping facilities
Amazon kindle store
via WIFI at Thalia.de and via PC at every independent
via WIFI at the Sony e-book store and via PC at every independent
at the Kobo e-book store and at every independent
via WIFI at Thalia.de and via PC at every independent
Every online bookstore
Every online bookstore
Operation 10 physical buttons
Touchscreen, 4 physical Buttons
Touchscreen and 5 physical buttons
Touchscreen and 5 physical buttons
Touchscreen and 4 physical buttons
Touchscreen and 3 physical buttons
Touchscreen and 3 physical buttons
Additional functions
MP3 player MP3 player MP3 player
MP3 Player MP3 player, camera, videos
MP3 player, camera, videos
Price in Euro 99 139 149 139 60 500 - 800 460-630
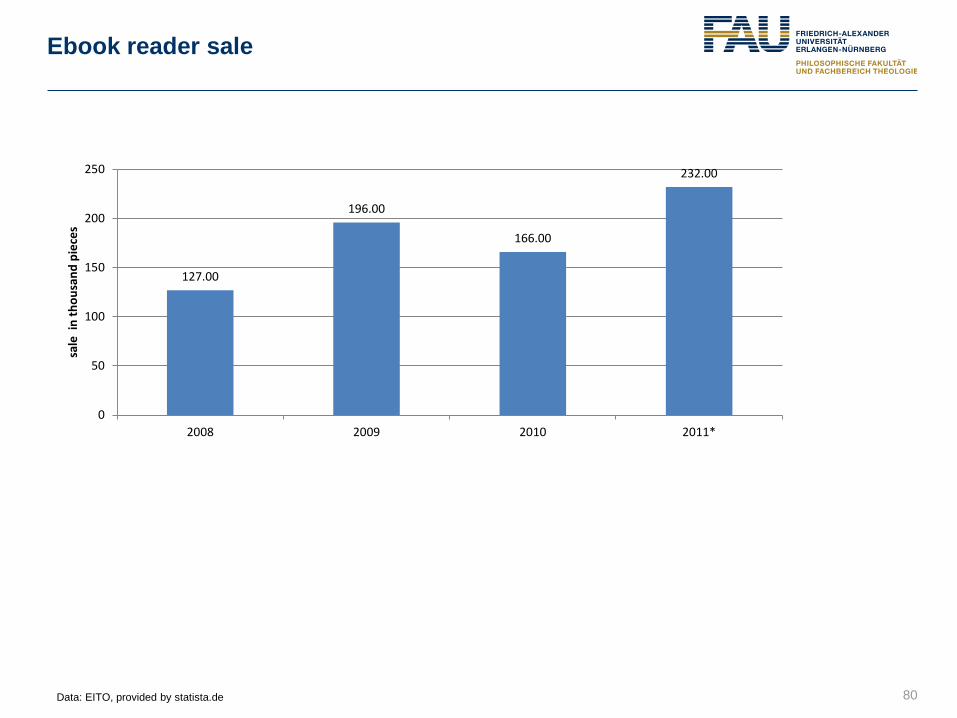
Ebook reader sale
80
127.00
196.00
166.00
232.00
0
50
100
150
200
250
2008 2009 2010 2011*
sale
in
thou
sand
pie
ces
Data: EITO, provided by statista.de
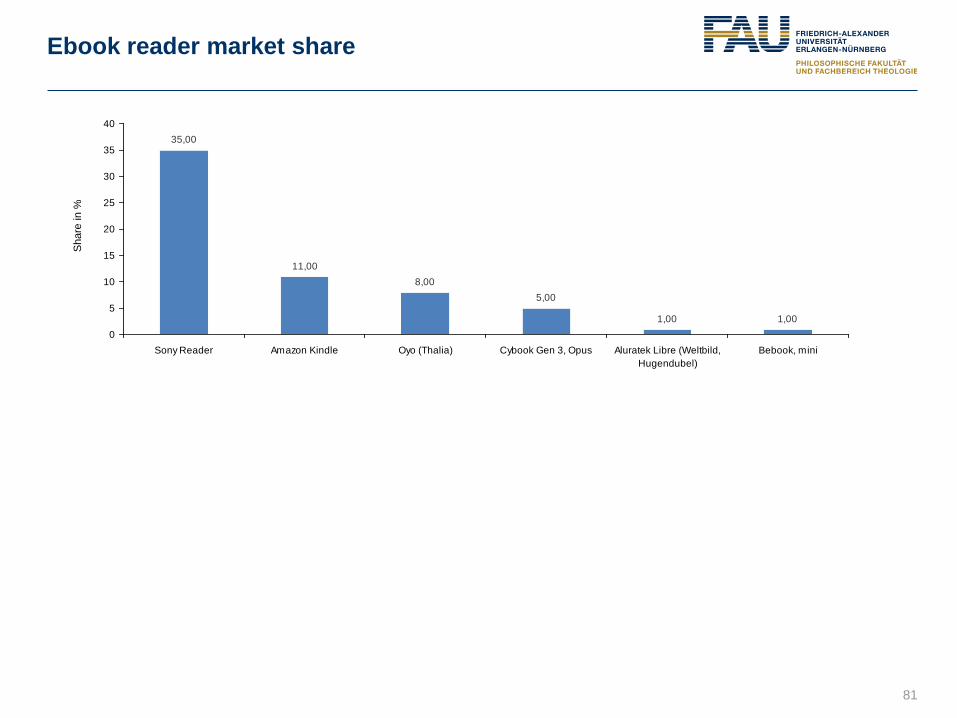
Ebook reader market share
81
11,008,00
5,00
1,00 1,00
35,00
0
5
10
15
20
25
30
35
40
Sony Reader Amazon Kindle Oyo (Thalia) Cybook Gen 3, Opus Aluratek Libre (Weltbild,Hugendubel)
Bebook, mini
Sha
re in
%
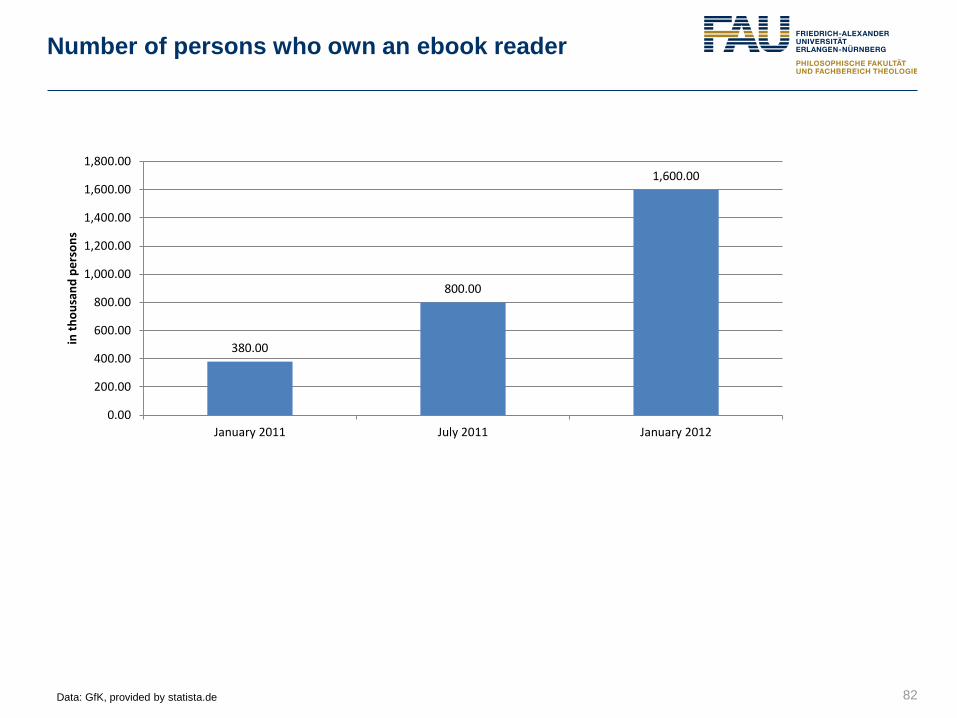
Number of persons who own an ebook reader
82 Data: GfK, provided by statista.de
380.00
800.00
1,600.00
0.00
200.00
400.00
600.00
800.00
1,000.00
1,200.00
1,400.00
1,600.00
1,800.00
January 2011 July 2011 January 2012
in th
ousa
nd p
erso
ns

Willingness to pay for an ebook reader (2011)
83
1%
3%
11%
22%
41%
22%
0% 5% 10% 15% 20% 25% 30% 35% 40% 45%
more than €300
€200–€300
€150–€200
€100–€150
€50–€100
up to €50
Data from: GfK Media*Scope
Average price of an ebook reader: 135 €
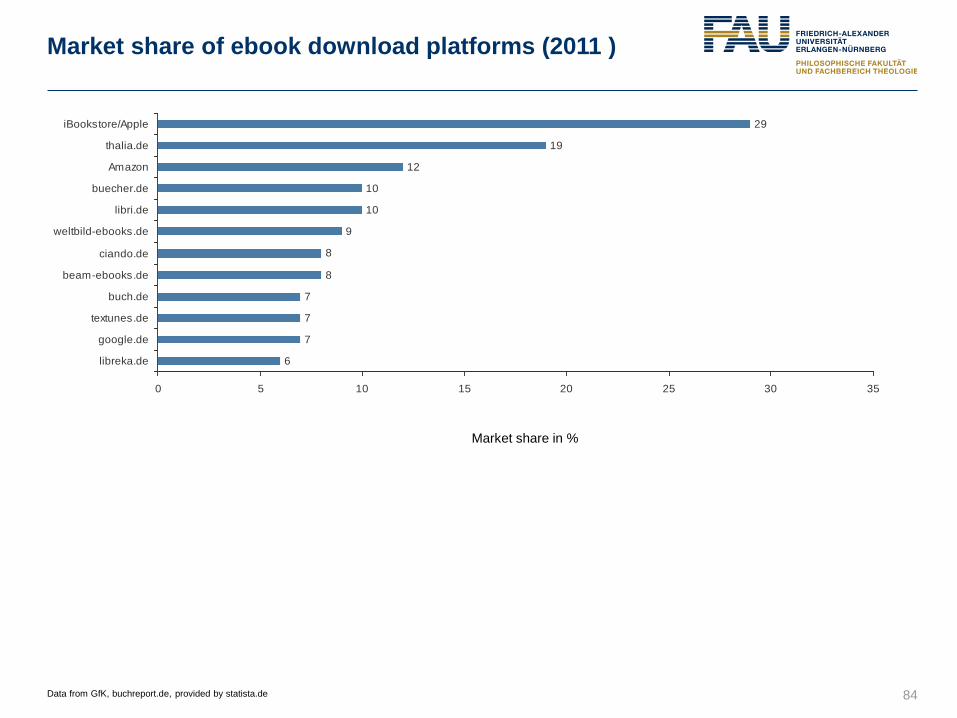
Market share of ebook download platforms (2011 )
84
Market share in %
6
7
7
7
8
8
9
10
10
12
19
29
0 5 10 15 20 25 30 35
libreka.de
google.de
textunes.de
buch.de
beam-ebooks.de
ciando.de
weltbild-ebooks.de
libri.de
buecher.de
Amazon
thalia.de
iBookstore/Apple
Data from GfK, buchreport.de, provided by statista.de

E-Publishing and Paid Digital Content
● Market Data E-Publishing
● Reader‘s behaviour
● Publishing Houses‘ behaviour
● Paid Digital Content and Services as a Challenge
85
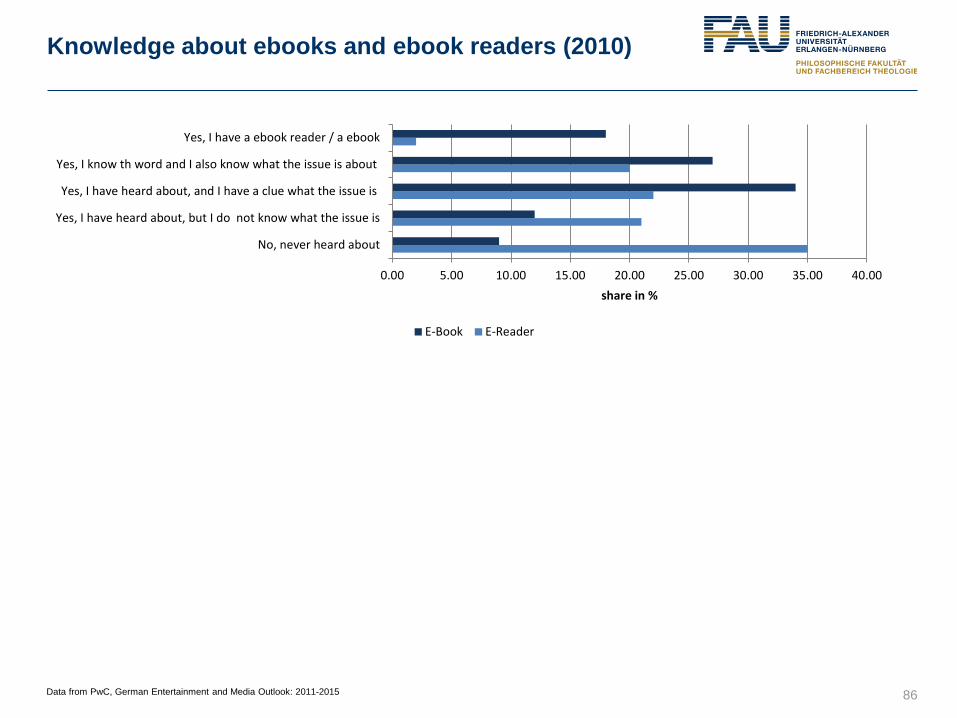
Knowledge about ebooks and ebook readers (2010)
86
0.00 5.00 10.00 15.00 20.00 25.00 30.00 35.00 40.00
No, never heard about
Yes, I have heard about, but I do not know what the issue is
Yes, I have heard about, and I have a clue what the issue is
Yes, I know th word and I also know what the issue is about
Yes, I have a ebook reader / a ebook
share in %
E-Book E-Reader
Data from PwC, German Entertainment and Media Outlook: 2011-2015

Printed books or ebooks buying behaviour (2012)
87
0.00 5.00 10.00 15.00 20.00 25.00 30.00 35.00 40.00 45.00 50.00
I only buy printed books
I usually buy printed books
I buy printed books as well as ebooks
I do not / I seldom buy books in general
I usually buy ebooks
no answer
I only buy ebooks
Share in %
Data from German Publishers and Book Sellers Association , Markt mit Perspektiven - Das E-Book in Deutschland 2011, provided by statista.de

Agreement to statements
88
0 10 20 30 40 50 60 70 80 90 100
I like it having books at home in my shelf
I love printed books. Electronic devices have nothing on thereading experiance
I prefer to invest in printed books
I do not want to read from displays
I think that reading from screens is not good for the eyes (even ifit is flickerfree)
E-Books are ecofriendly because thy save paper
E-books can be sold cheaper than the printed book
I can solve my space problems with ebooks
E-Books are modern and thy will be the new way of reading
Share in % of all asked persons
2009
2010
2011
2012
Data from GfK Panel Services Deutschland (Media*Scope Buch), provided by statista.de

For what purpose do you use your tablet? (2011)
89 Data from: PWC, provided by statista.de
0 10 20 30 40 50 60 70 80 90 100
Search engines
News of the day
using the internet without a specific intention
Watching videos
Using social networks
Onlinebanking
Playing games
Blogging
Using the telephone
share in %

Frequency of usage of digital magazines on iPads
90
0 5 10 15 20 25 30 35 40
Many times a week
Daily / nearly daily
Once a week
Many times a month
Once a month
I never used a digital magzine on my ipad
share in%
Data from: Kirchner + Robrecht; pangea labs, provided by statista.de

Mobile applications: usage (2011)
91 Data from: IP Deutschland, provided by statista.de
0 10 20 30 40 50 60 70 80
News
Weather
Games
Entertainment
Social media
Music
Search engines
Sport
Personal information (e.g. photos)
Price check
Books and education
Travel
share in %

Arguments against ebook reader (2010)
92
0
10
20
30
40
50
60
Too expensive Dependency(energy)
Haptic: no bookto hold in the
hand
Cannot place itinto the
bookshelf
Do not want tohave moreelectronic
devices
Not enoughebook choice
Too complicated None of thementioned
aspects above
shar
e in
%
Data from: Gesellschaft für innovative Marktforschung mbH, provided by statista.de

E-Publishing and Paid Digital Content
● Market Data E-Publishing
● Reader‘s behaviour
● Publishing Houses‘ behaviour
● Paid Digital Content as a Challenge
93
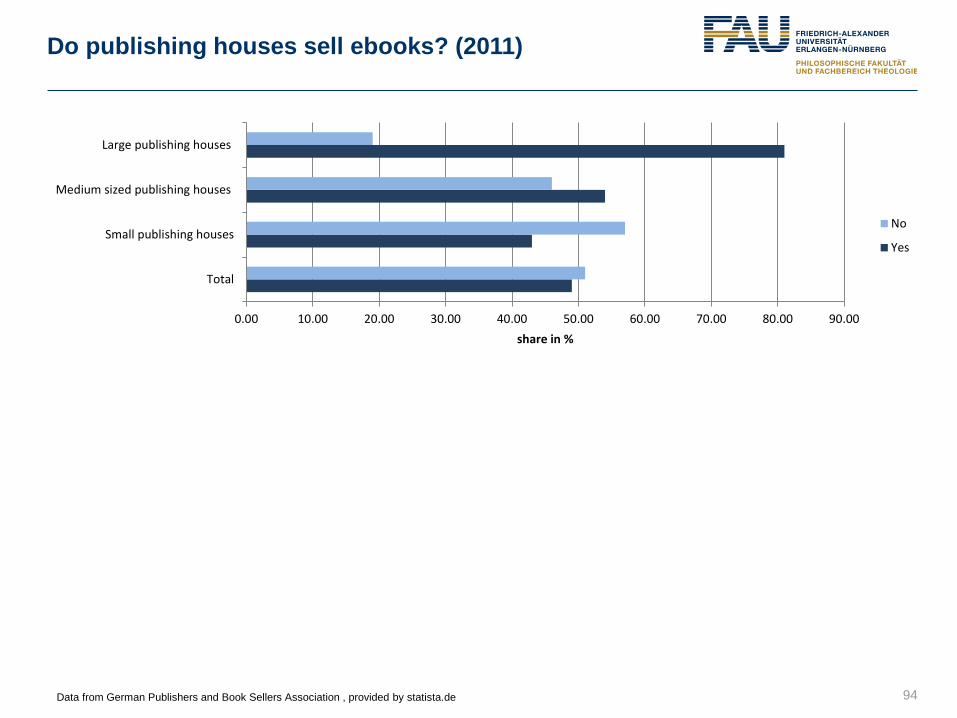
Do publishing houses sell ebooks? (2011)
94
0.00 10.00 20.00 30.00 40.00 50.00 60.00 70.00 80.00 90.00
Total
Small publishing houses
Medium sized publishing houses
Large publishing houses
share in %
No
Yes
Data from German Publishers and Book Sellers Association , provided by statista.de

Challenges concerning launching ebooks in your publishing house (2011)
95 Data from German Publishers and Book Sellers Association, provided by statista.de
0 5 10 15 20 25 30
Organisational structure and culture
Missing standards in formats
Missing acceptance by customers
Piracy
Missing know-how
Ebook reader too expensive
Missing budget
Fixed price agreements
share in %

Ebook investments in publishing houses (2010)
96 Data from German Publishers and Book Sellers Association , provided by statista.de
0.00
10.00
20.00
30.00
40.00
50.00
60.00
70.00
80.00
90.00
100.00
Total Small publishinghouses
medium sizedpublishing houses
Large publishinghouses
Shar
ein
%
Yes
No, but we will within the next 2 years
No, and we neither want
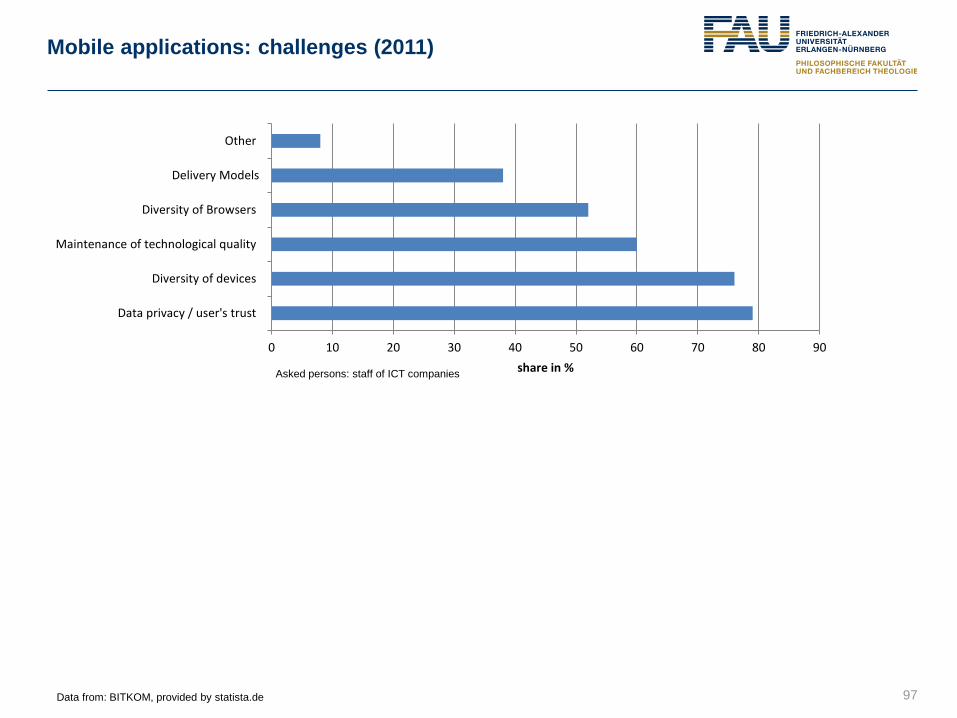
Mobile applications: challenges (2011)
97 Data from: BITKOM, provided by statista.de
0 10 20 30 40 50 60 70 80 90
Data privacy / user's trust
Diversity of devices
Maintenance of technological quality
Diversity of Browsers
Delivery Models
Other
share in % Asked persons: staff of ICT companies

E-Publishing and Paid Digital Content
● Market Data E-Publishing
● Reader‘s behaviour
● Publishing Houses‘ behaviour
● Paid Digital Content and Services as a Challenge
98
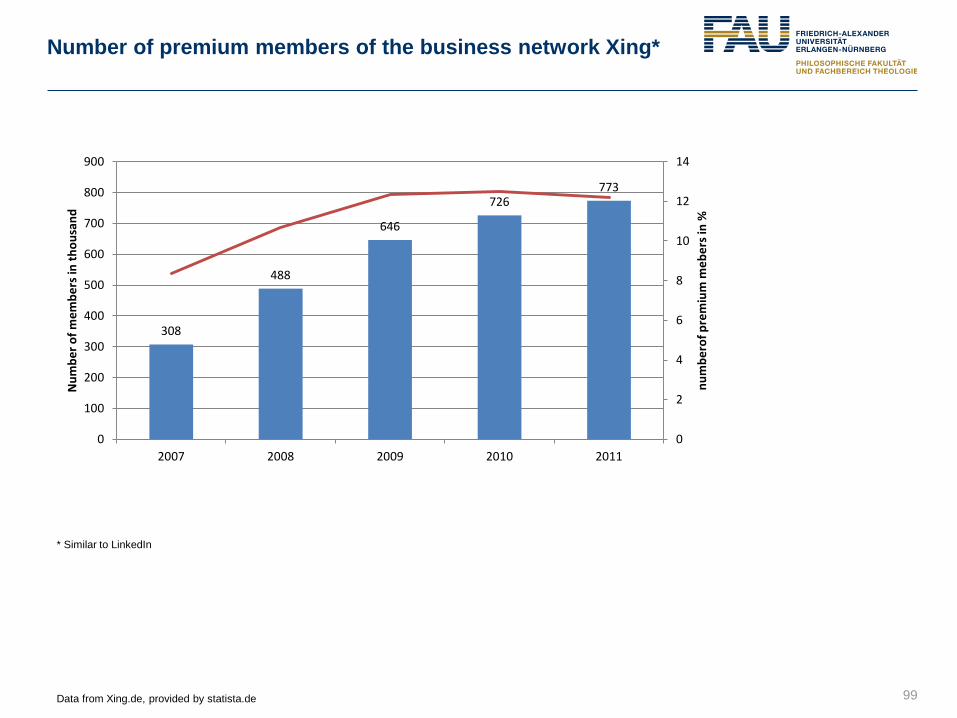
Number of premium members of the business network Xing*
99
308
488
646
726 773
0
2
4
6
8
10
12
14
0
100
200
300
400
500
600
700
800
900
2007 2008 2009 2010 2011
num
bero
f pre
miu
m m
eber
s in
%
Num
ber o
f mem
bers
in th
ousa
nd
Data from Xing.de, provided by statista.de
* Similar to LinkedIn

Paid content on www.test.de
100
860,000
815,000
770,000 756,000
0.00
0.50
1.00
1.50
2.00
2.50
700,000
720,000
740,000
760,000
780,000
800,000
820,000
840,000
860,000
880,000
2007 2008 2009 2010
reve
nue
usag
e
Usage of charged content Revenue by usage of charged content in million €
“Stiftung Warentest (www.test.de) is a German consumer organisation and foundation involved in investigating and comparing goods and services in an unbiased way” (wikipedia.de)
Data from Stiftung Warentest, provided by statista.de

What people think about paid online content (2009)
101 Data from GfK, provided by statista.de
05
101520253035404550
All content should befree, but I would accept
advertisement
All content should befree, and there should
not be anyadvertisement as well
I would pay for content,but I do not want
advertisement
I would pay for content,and I also acceptadvertisement
None of thesestatements matches to
my opinion
shar
ein
%
Germany
Europe

Agreement to statements
102
0 10 20 30 40 50 60 70 80 90
Newspaper and magazine ipad apps are good for an exceptionalmultimedia experience
I think I would read more newspapers and magazines as appsthan as printed product (only reader of charged digital papers
were asked)
Reading newspapers or magaines is more fun than readingprinted products
share in %
Data from Axel Springer, provided by statista.de

Barriers concerning paying for online content
103
0 10 20 30 40 50 60 70 80
Costs too highNo acceptance in society
Technical challengesMissing standards
Problems with data privacyMissing innovation culture
Inadequate educationToo less investment in infrastructure
Too less investments by companiesInvestments are hampered by regulatory parameters
Missing interdisciplinarityLong product life cycles
Public investments in R&D are too smallSkilled worker shortage
share in %
Data from TNS Infratest, provided by statista.de

Outline
● Media Market in General
● Markets for Specific Types of Media
● E-Publishing and Paid Digital Content
● Regulatory Aspects
● Innovative Business Models
● Results of a Survey: Crossmedia Publishing
104

Fixed book price agreement (FBPA)
● Publishing houses set the price of a book
● All traders have to sell the book at that price for at least 18 month
● Regulated by the German law on fixed book prices
● Core idea (www.wikipedia.de):
● “a dense network of well-stocked, high quality bookshops is a necessary condition for the publication of a large variety
of books
● A large variety itself deemed desirable for the cultural life of a country
● Such bookshops have additional costs that are not borne by discounters, who just stock their shelves with the current
blockbusters.
● Since the latter represent a large proportion of book sales, price competition between high-quality bookshops and
discounters reduces bookshops' profitability”.
● FBPA does not apply to
● Audio books
● Used books
● Ramaindered books
● Closing-down sale
105

Sales tax in Europe (selected countries)
106
Country Sales tax % Reduced sales tax % Sales tax for e-books % FBPA Duration FP
Germany 19 7 19 Law 18 month
Austria 20 10 20 Law 24 month
Switzerland 8 2.5 7 Free prices -
U.K 20 0 20 Law 24 month
Denmark 25 25 25 Free prices -
Sweden 25 6 25 No -
Netherlands 19 6 19 Law 12 month
Spain 18 4 18 Law 24 month
France 19.6 7 7 Law 24 month
Luxemburg 15 3 3 Law
Data from German Publishers and Booksellers Association

Outline
● Media Market in General
● Markets for Specific Types of Media
● E-Publishing and Paid Digital Content
● Regulatory Aspects
● Innovative Business Models
● Results of a Survey: Crossmedia Publishing
107
E-Publishing and Paid Digital Content
● Ebook cards
● Epubli
● Skoobe
● Paper C
108

Idea
● www.ebookcards.de
● Voucher for giving away an ebook
● Revenue remains at traditional book store

Customers view
110
Buy a ebook card Go to the website
www.ebookcard.de
Enter the code
(or scan the QR with
your mobile)
Enter your mailadress
and download the
ebook
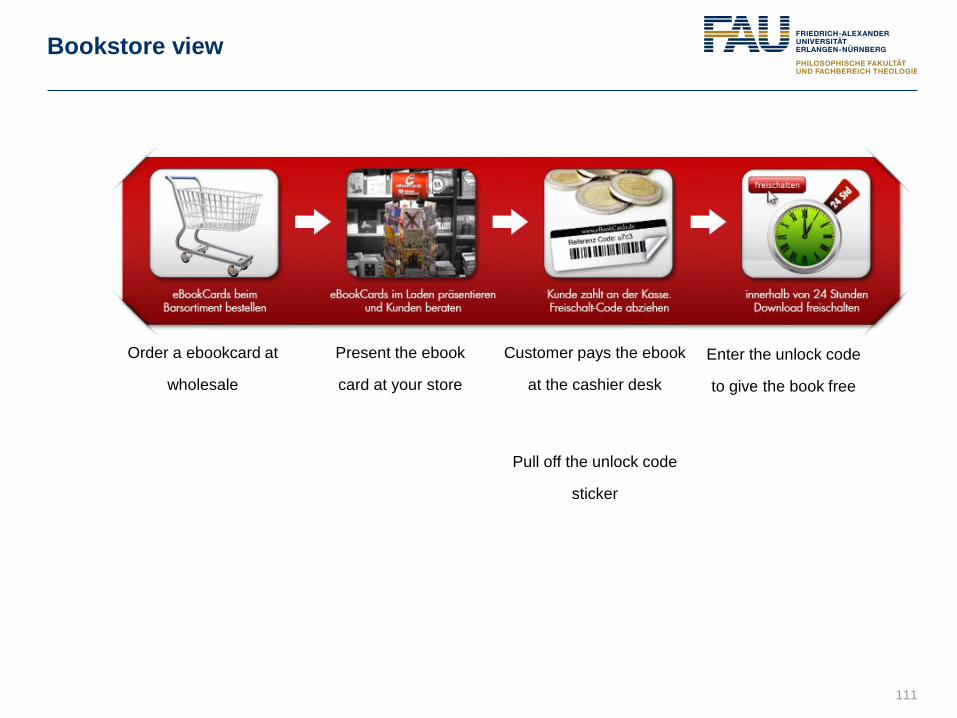
Bookstore view
111
Order a ebookcard at
wholesale
Present the ebook
card at your store
Customer pays the ebook
at the cashier desk
Pull off the unlock code
sticker
Enter the unlock code
to give the book free
E-Publishing and Paid Digital Content
● Ebook cards
● Epubli
● Skoobe
● Paper C
112

Idea
113
● www.epubli.de
● Self publishing platform
● Company of the publishing group Holtzbrinck
● Reactions of established publishing houses
● None (silence)
● Badmouthing (it cannot work, it only produces bad or trivial titles)
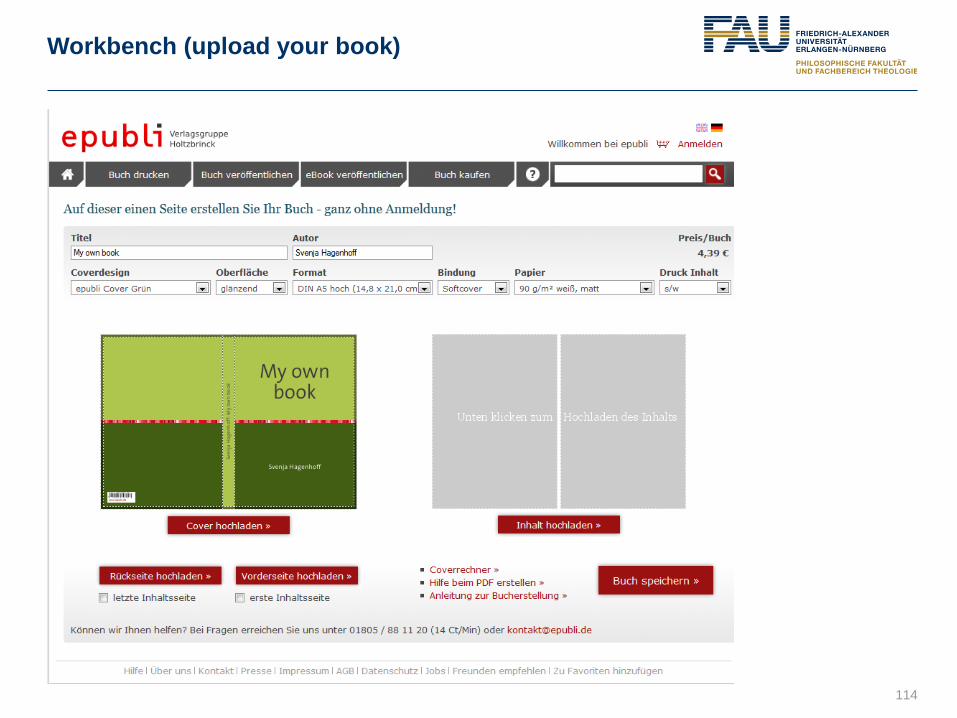
Workbench (upload your book)
114

Calculate your royalty
115

E-Publishing and Paid Digital Content
● Ebook cards
● Epubli
● Skoobe
● Paper C
116

Idea
● www.skoobe.de
● Digital store for ebooks
● Flat rate revenue model
● Customer pays 9.99 Euro a month
● Customer can borrow 5 books concurrently
● Customer pays for access to the books and not for possession
● Each book can be used offline for 30 days
● The private library will be synchronized to all devices
117

Library
118

E-Publishing and Paid Digital Content
● Ebook cards
● Epubli
● Skoobe
● Paper C
119

Idea
● www.paperc.de
● Online platform for textbooks
● Price model: Freemium
● Reading is free
● Additional features are priced (e.g. 10 cents per page for printing, tagging, etc.)
● Contains about 15.000 E-Books from 90 national and international publishing houses
120
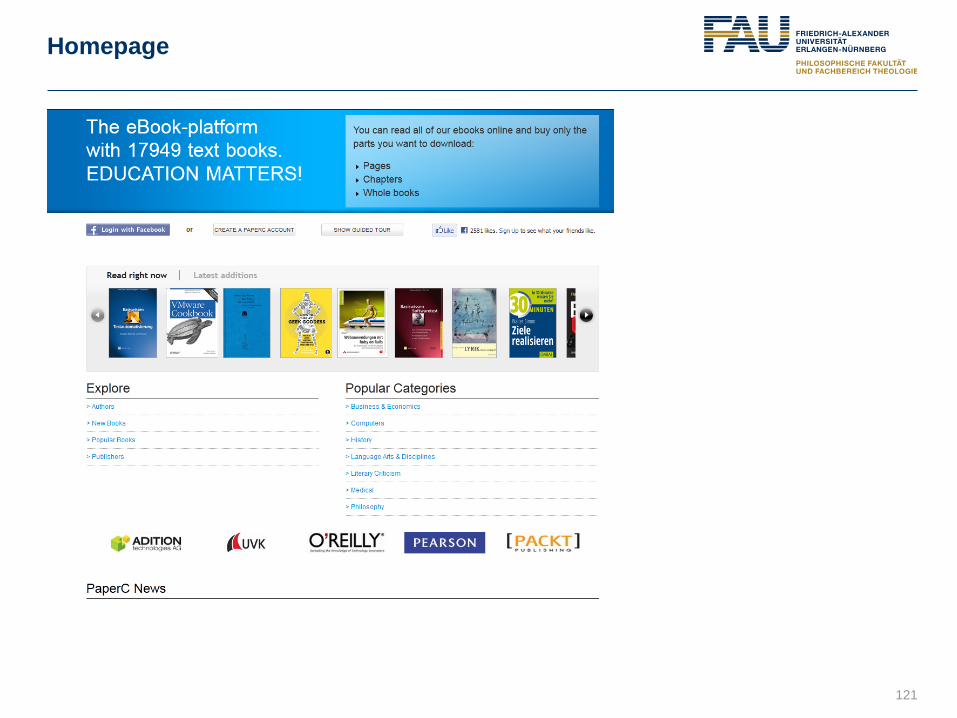
Homepage
121

A book
122

Outline
● Media Market in General
● Markets for Specific Types of Media
● E-Publishing and Paid Digital Content
● Regulatory Aspects
● Innovative Business Models
● Results of a Survey: Crossmedia Publishing
123

Survey setting
• Topic: crossmedia publishing in specialist publishing houses
• Aim of the survey: to find out about the state of the art of crossmedia publishing
• Questions:
• Do publishers crossmedia publishing?
• How do they do it?
• Are there different degrees of maturity depending on kinds of products or size of the publishing house
• What are the most challenges in crossmedia publishing
• Survey was conducted spring to autumn 2011
• Methodology:
• Qualitative survey: interviews with 13 experts from 13 publishing houses
• Quantitative survey: written questionnaires (441 publishing houses)
• Response rate 17 % (73 datasets)

Characeristics of the sample
Very small companies: < 10 employees, small companies: < 50 employees, medium size companies <250 employees
Very small companies: ≤ 2 Mio. €, small companies: ≤ 10 Mio. €, medium size companies ≤ 50 Mio. €
Size of the publishing house (number of employees) (n=73, failure quota 0.00 %)
Data absolute
Size of the publishing house (revenue) (n=73, failure quota 8.22 %)
Data absolute
Very small companies
Small companies
Medium size companies
Large companies
Not assignable
Very small companies
Small companies
Medium size companies
Large companies
What is your primary source of revenue? (n=73, failure quota 26.03 %)
Data absolute
Professionals (B2B)
Laypersons
Scientific customer
Other
Books (print & electronic)
Magazines (print & electronic)
Loos-leaf collections (print & electronic)
Other
The biggest part of your revenue do come from which kind of customers? (n=73, failure quota 8.22 %)
Data absolute

Kinds of products
126
56
69
8 18
9
25
6
01020304050607080
Books Magazines Newspapers Loose-leafcollections
calendars Newsletter other
num
ber o
f ans
wer
s
Which kinds of products do you produce (print)? (n = 73, failure quota: 0,00 %)
26 25
5
32
17
28
50
17 21
50
10 4
0102030405060
num
ber o
f ans
wer
s Which kinds of products do you produce (electronic)?
(n = 73, failure quota 5,48 %)
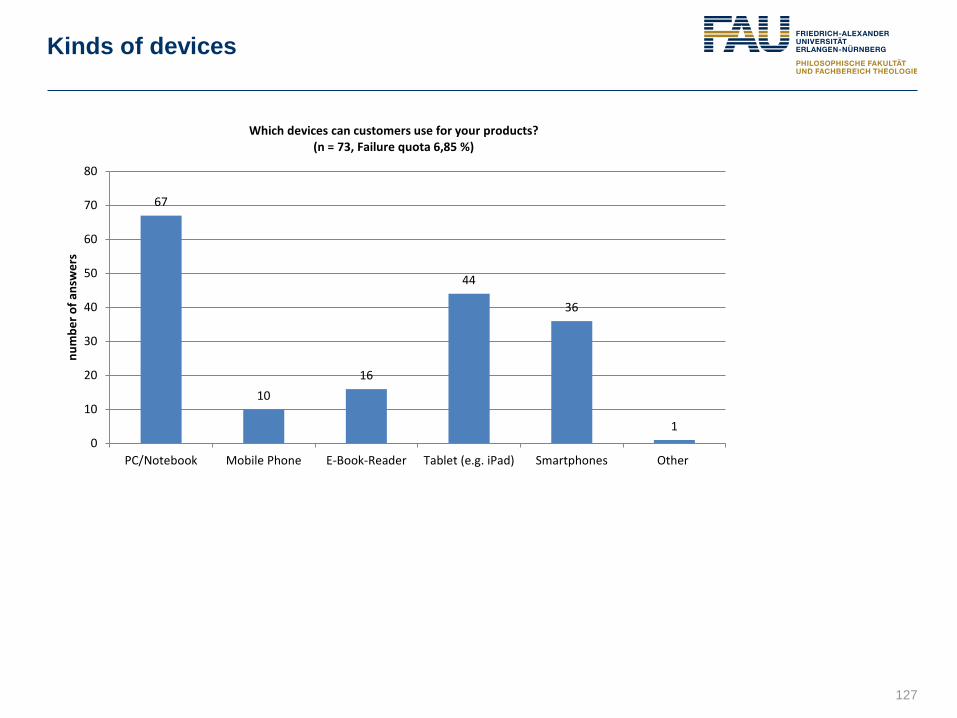
Kinds of devices
127
67
10 16
44
36
1 0
10
20
30
40
50
60
70
80
PC/Notebook Mobile Phone E-Book-Reader Tablet (e.g. iPad) Smartphones Other
num
ber o
f ans
wer
s
Which devices can customers use for your products? (n = 73, Failure quota 6,85 %)

Usage of content management systems (1)
25
48
Do you have a content management system in your publishing house?
(n = 73, failure quota 0,00 %) data absolute
yes
no 1 1 1
4
2 2 2
3
2
0
1
2
3
4
5
2000 2002 2004 2005 2006 2008 2009 2010 2011
num
ber o
f ans
wer
s
When did you start using the software? (n=18, FQ: 28,00 %)

Usage of content management systems (2)
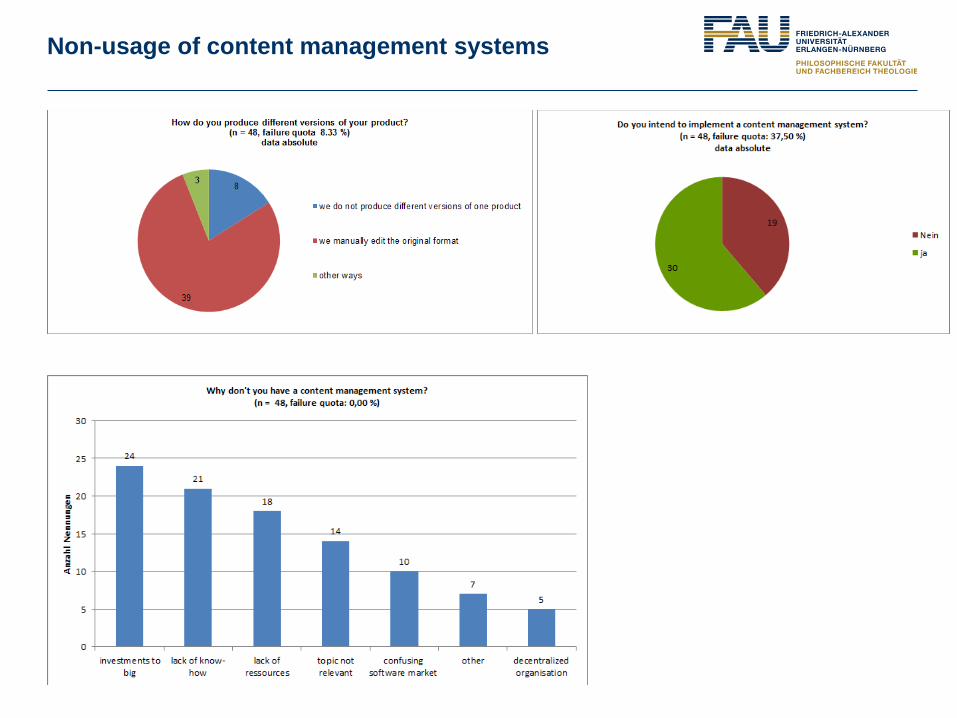
Non-usage of content management systems

The biggest challenge in crossmedia publishing is…
0: I cannot estimate 1: I do not agree 2: I do rather not agree 3: I do rather agree 4: I do agree
1
6
3
1
0
2
2
4
17
28
47
24
34
49
49
27
54
37
23
48
39
21
21
42
0% 10% 20% 30% 40% 50% 60% 70% 80% 90% 100%
still thinking in print (n=72, FQ: 1,37 %)
technical aspects (n=73, FQ: 2,74 %)
legal aspects (n=73, FQ: 0,00 %)
lacking of proceeds (=73, FQ: 0,00 %)
characteristics of the product der Produkte (n=73, FQ:0,00 %)
consequences for organisation are not assessable (n=73,FQ: 0,00 %)
consequences for organisation are not controllable(n=72, FQ: 1,37 %)
big investments (n=73, FQ: 0,00 %)
Agreement to the statement: the biggest challenge in crossmedia publishing is ... (Scale normalized, values absolute)
Abstention
negative statement
postitive statement