the porosity and wettability properties of hydrogen ion treated polytetrafluoroethylene
TRANSCRIPT
1
The Porosity and Wettability Properties of Hydrogen
Ion Treated Polytetrafluoroethylene
Hernando S. Salapare III*, Gene Q. Blantocas, Virginia R. Noguera, and Henry J. Ramos
Plasma Physics Laboratory, National Institute of Physics,
University of the Philippines, Diliman, Quezon City 1101, Philippines
Telefax: +63-2-9204475, +63-2-9280296
*Corresponding author: [email protected]
ABSTRACT
The porosity and wettability properties of hydrogen ion treated polytetrafluoroethylene
(PTFE) materials are related using contact angle, scanning electron microscopy (SEM),
and ellipsometry tests. PTFE are irradiated using a low energy hydrogen ion shower
(LEHIS) produced by a Gas Discharge Ion Source (GDIS). The plasma discharge current
(Id) is varied at intervals of 1 mA. Results show that treatment using lower Id enhances
the hydrophobic property of the PTFE material with contact angle value of as high as
118.6. It also becomes less porous as indicated by the increase in the index of
refraction, decrease in optical transmittance, and increased scissions and striations in the
SEM images. Opposite effects are observed for higher Id.
PACS CODES: 81.65.-b, 68.35.bm, 61.80.-x, 68.08.Bc, 07.60.Fs
2
KEYWORDS: Polytetrafluoroethylene (PTFE), porosity, low energy hydrogen ion
shower (LEHIS), gas discharge ion source (GDIS), wettability, contact angle,
ellipsometry, scanning electron microscopy (SEM).
1. INTRODUCTION
Surface modification of polymer materials has been of great interest in most researches
for the past years because of its importance in the field of materials science, electronics
and biomedical physics. Surface modification technology allows for the change and
improvement of the property of a material, consequently making the processed material
more useful in various aspects [1-4]. Different characterization techniques that determine
the change in the surface of the material include X-ray photoelectron spectroscopy and
atomic force microscopy, which provide surface profiles of the polymers [5-6]. Other
characterization techniques involve ellipsometry and flourophotometry in which the
dielectric function and structure of the material could be obtained [7]. The most common
technique to assess the surface modification of a material is through contact angle
measurements.
Modified porosity and wettability surfaces of polymer materials find usefulness in
orthopedic science [8], tissue engineering [9], immobilization of lipase [10-13], cell
culture [14], and drug delivery [14].
The material being modified in this study is a polytetrafluoroethylene (PTFE)
commonly known as Teflon. It is the chosen material because it is the simplest organic
polymer that is analogous to polyethylene. Changing the wettability of PTFE is of great
3
importance because of its applications in biosensors, hemo-compatible materials,
immobilized enzymes, MEMS, and electronics [15-22]. PTFE materials’ wettability is
changed to either hydrophilic or hydrophobic depending on its intended application [23].
In this study, PTFE materials are treated using a low energy hydrogen ion shower
(LEHIS) system. The effect of the treatment on the porosity and wettability of the
material is investigated using contact angle measurements, scanning electron microscopy
(SEM), and ellipsometry tests.
2. METHODOLOGY
2.1 Experimental Device and Procedures
The PTFE tape of size 1 cm x 2 cm is wrapped around a 2 x 2 cm2 stainless steel plate
holder. The surface of the clean samples was blown-dried to prevent the formation of
moisture on the surface. It is not subjected to ultrasonic cleaning because of the fragile
condition of the samples. PTFE are then irradiated using a low energy hydrogen ion
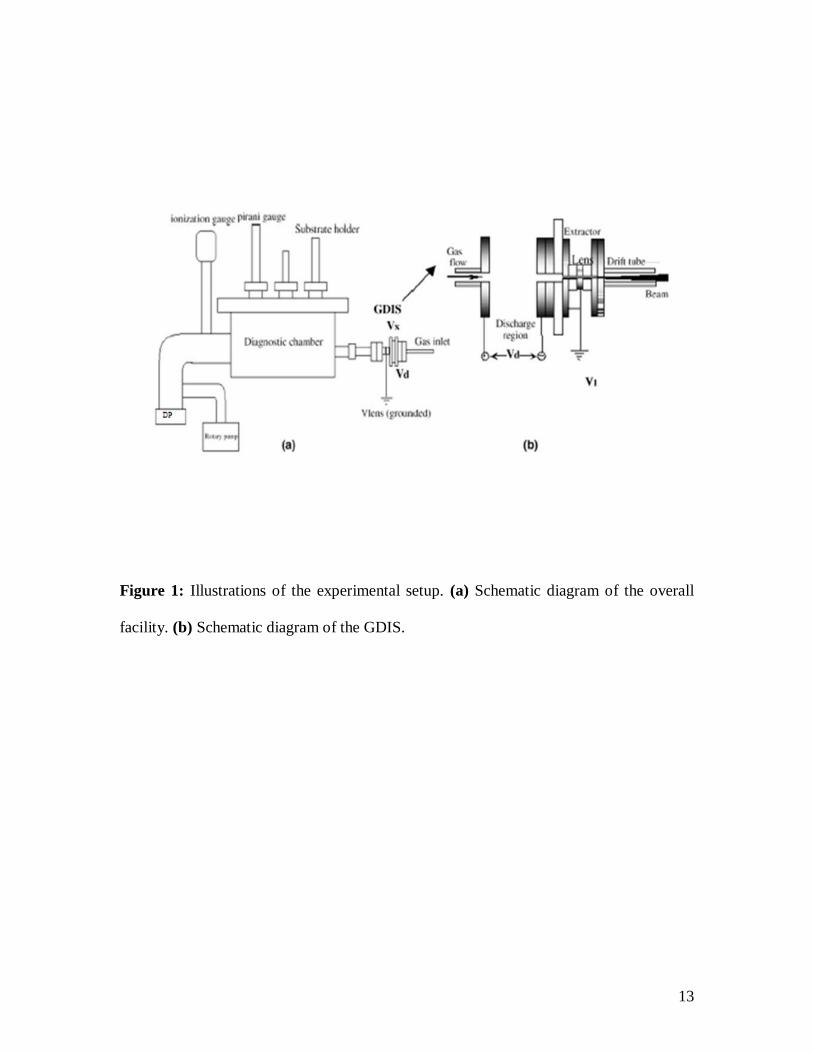
shower (LEHIS) of a gas discharge ion source (GDIS) system. Figure 1(a) shows the
schematic diagram of the experimental set-up and figure 1 (b) shows the schematic
diagram of the GDIS. It has a compact discharge region of volume of 0.8 cm3 and an exit
aperture of 2.0 mm in diameter. The extraction and focusing electrodes are grounded to
ensure a diffused ion shower configuration. The GDIS fits a standard 70 mm knife-edge
flange coupled to the diagnostic chamber whose volume is about 2400 cm3. A 10.16 cm
oil diffusion pump coupled to an 8 m3/h rotary pump evacuates the system. Complete
details of the facility and its operation are described in references [1-2] and [24-25].
4
Pirani and ionization gauges monitor the pressure inside the chamber. The base
pressure is ~ 1.0 x 10⁻⁶ Torr. The total hydrogen gas filling pressure is kept at 3 mTorr for
all the experimental runs. Plasma is produced when a potential difference, Vd, is applied
across the discharge region. The PTFE samples are placed on a holder positioned 70 mm
downstream from the entrance port of the processing chamber. This is the position
determined to give maximum ion current density [1]. The irradiation time is set to 30
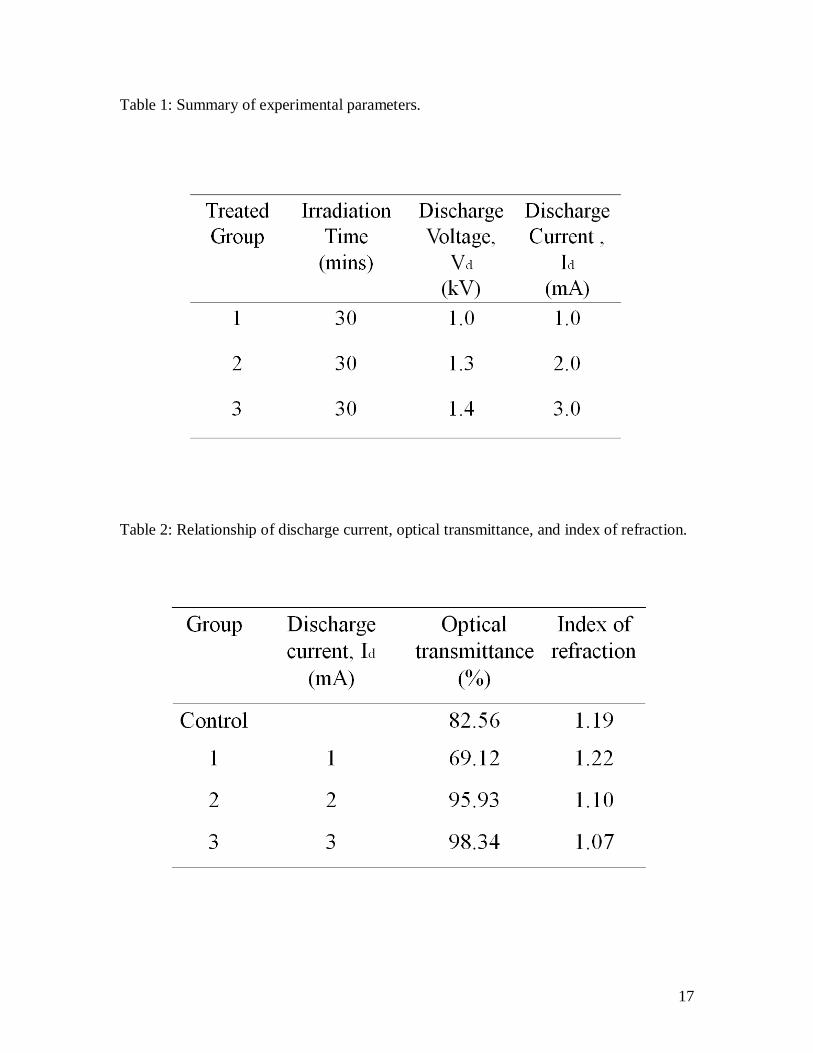
minutes. Treatment conditions are summarized in Table 1.
2.2 Characterizations
2.2.1 Ion Beam Detection
The ion species are determined using a cast steel mass spectrometer. The mass
spectrometer is then replaced by a Faraday cup system, which consists of an isolated
brass disk of 2.0 cm diameter and is connected to an electrometer. The Faraday cup is
used to determine the total ion current density [24].
2.2.2 Contact Angle Measurements
The treated and untreated samples are subjected to contact angle test using an Intel®
Play™ QX3™ Computer Microscope. The absorption of the water droplet on the sample
is recorded at one frame per 5 seconds.
The video of the absorption of water is processed using AVS DVD Media Player to get
the images of the absorption every 5 seconds. ImageJ is used to measure the contact angle
of each frame of the absorption of deionized water. Contact angle is then plotted against
absorption time to show the dynamics of the water droplet on the surface of the sample.
Three replicates for each experimental condition are considered.
5
2.2.3 Ellipsometry Characterization
A VASE M-44 ellipsometer (J. A. Woolam Co.) is used to determine the transmission
of light through the sample and index of refraction. The transmittance and the index of
refraction are considered at 594nm wavelength. This is done to compare the result of the
optical transmittance with a previous study [1].
2.2.4 Scanning Electron Microscopy
The substrates are coated with gold using a Jeol (JFC-1100) Fine Coat Ion Sputter to
avoid the accumulation of electrons on the surface of the material because of its fragile
state and because the sample is a non-conducting polymer. A Leica S440 Scanning
Electron Microscope (SEM) is used to determine the structure of the surface of the
material.
3. RESULTS AND DISCUSSION
3.1 Ion Beam Characterization
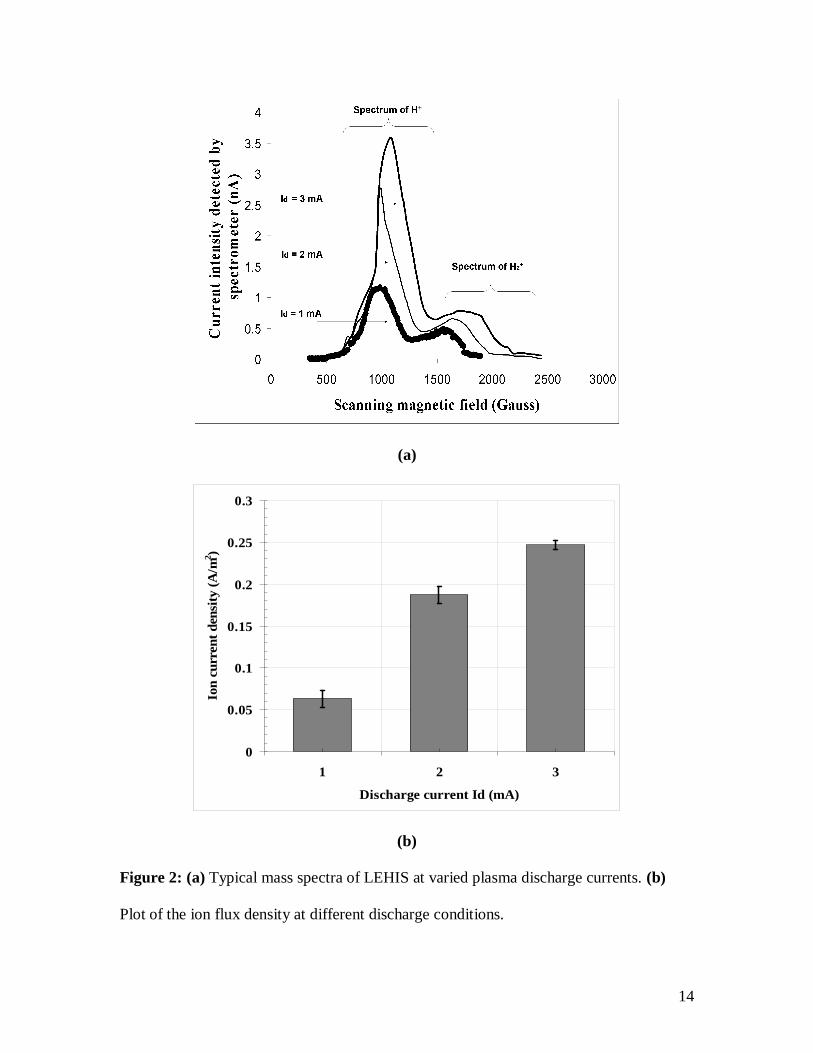
The typical hydrogen ion peaks detected by the cast steel mass spectrometer is shown
in figure 2(a). The ion intensities (nA) of the hydrogen beam are plotted against the
scanning magnetic field (G). Figure 2(b) shows the ion flux density for different
discharge conditions registering a high of 0.25 A/m2 and a low of 0.06 A/m2. Monatomic
H+ ions dominate the 2H ions of the beam produced by the gas discharge ion source for
discharge currents of 1 mA, 2 mA, and 3 mA. Hence, there is reason to believe that the
monatomic ions play an active role in the surface modification process.

6
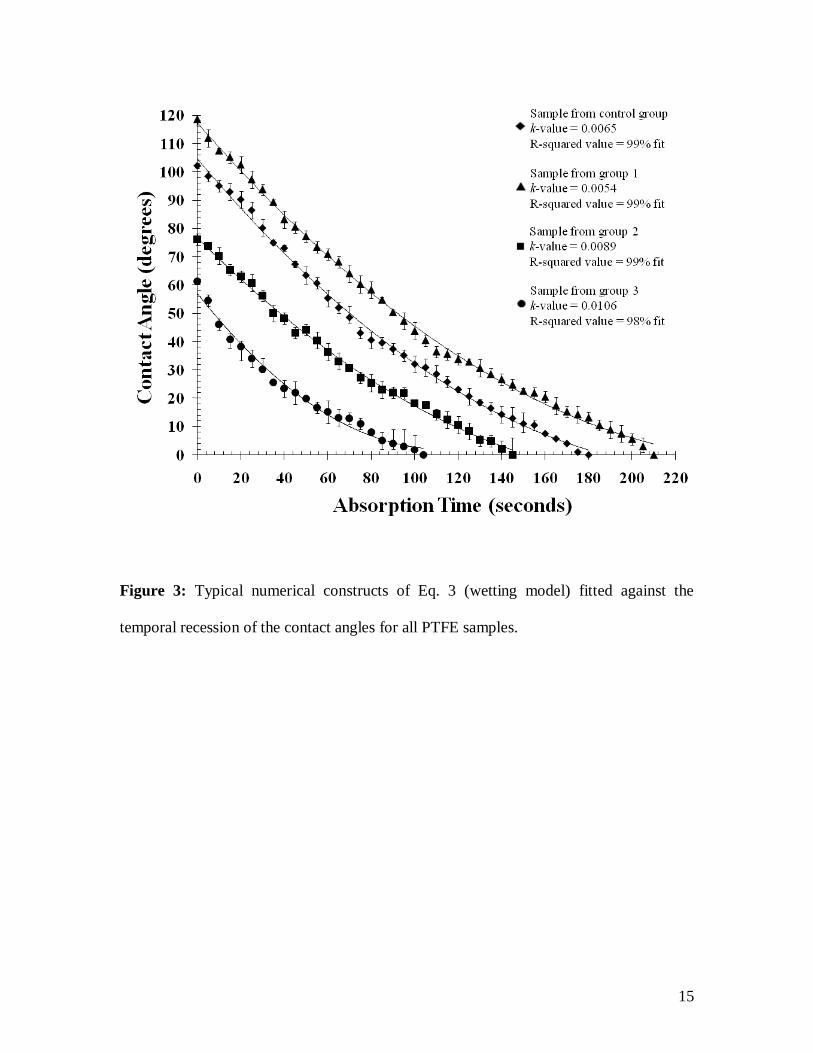
3.2 Contact Angle Measurement
Temporal recessions of the contact angles for some representative samples are shown in
Figure 3. Wettability is quantified by fitting the wetting dynamics model used in [1, 24]
to actual data. The model is expressed mathematically as
kdtd
(1)
where θ is the contact angle between the supporting solid surface and the tangent to the
drop-shape of the liquid, and k being the change rate constant or the quantity that
describes the angle’s temporal recession in units of per second [1]. The increase in the
value of k signifies increasing surface wettability. Using the R-squared method it shows
that the experimental data is in correlation with the wetting model as indicated by the
high values of R2 for all experimental conditions. Samples from the control group and
samples from group 1 shows lower values of k which indicates that samples treated using
low discharge current are hydrophobic samples. Samples from groups 2 and 3 show
higher values of k; this indicates that samples treated at higher discharge currents become
hydrophilic. Wettability properties are determined by the initial contact angle (α). The
90o angle separates the hydrophilic and hydrophobic zones [26]. Wetting occurs at α <
90o and non-wetting if α > 90o.
The cause for the increased hydrophilicity of the samples can be attributed to the
increased surface roughness [27-30] and porosity of the material. Hydrophobication by
ion irradiation is not yet understood and further experiments are being conducted to
explain the phenomena. This result is in correlation with the work of Blantocas, et.al. on
the ion irradiation of wood samples [31].
7
3.3 Ellipsometry Test
Table 2 summarizes the result obtained from the ellipsometry test. It shows the optical
transmittance and the index of refraction of the sample at 594 nm wavelength.
The optical transmittance investigates material porosity by measuring the transmittance
of light through the samples. Transmittance may be regarded as porosity indices of the
samples. A porous material tends to have a high transmittance value and at the same time
is also likely to have higher water-absorbency. In this sense, transmittance may be
regarded as an indicator of material wettability. In Table 2, samples irradiated by low
energy ion showers (Id = 1 mA) exhibit the least transmittance meaning the material is
also the least porous. Samples from group 1 give the lowest transmittance of 69.12%, and
also the least wettable having the lowest k value. The opposite effect is seen for samples
irradiated by higher energy beams. Samples from group 3 have the highest transmittance
of 98.34% and the most wettable as well.
The index of refraction of samples treated with low discharge current is higher than
those of the index of refraction of samples treated with high discharge current for the 594
nm wavelength. High index of refraction indicates that the density of the material is also
high [31]. This would imply that the samples treated with low discharge current has a low
density as compared with samples treated with high discharge current.
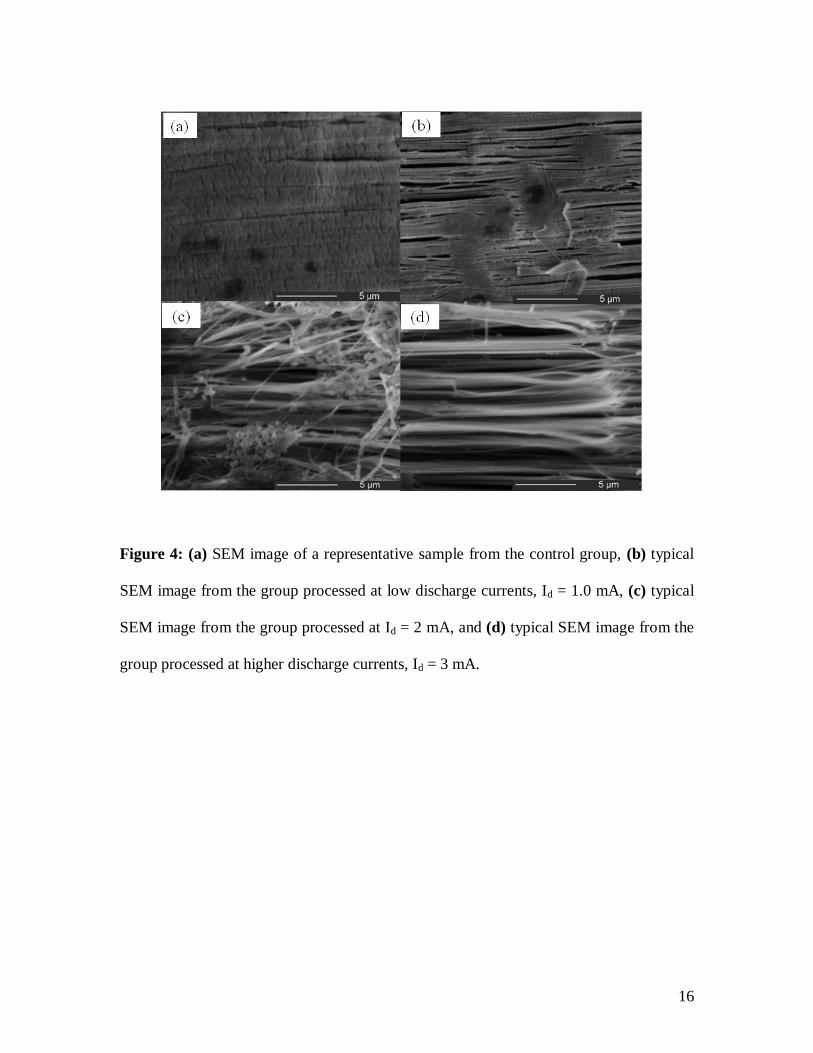
3.4 SEM Characterization
Figure 4 shows the SEM images of the untreated and treated samples. All the SEM
images are observed at 20k x magnifications. Figure 4(a) shows the surface of samples
from group 1 subjected to lower energy ion showers (Id = 1 mA) that are much smoother
8
than the rest of the specimens. Samples from group 3 and 4 subjected to higher energy
ion showers (Id ≥ 2 mA, 3mA) shows surfaces that are rough and have striations and
scissions as seen in figures 4(c) and 4(d). The surface deterioration of group 3 looks more
pervasive than that of sample 2 possibly due higher discharge current. It becomes clear
from the figure vis-à-vis wettability and porosity parameters that, generally a surface
becomes more wettable and optically transmissive as it roughens. Roughening by high
energy ion irradiation leads to surfaces becoming more hydrophilic and porous. The
observed striations and scissions on the surface account for their higher optical
transmittances. This finding is in consonance with the work of Tzeng et al. on the
roughening of Teflon samples using wet processes [28]. Conversely, low energy ion
irradiation results in relatively smooth, hydrophobic surfaces. PTFE materials become
thinner when bombarded by higher flux density ion showers [1]. Porosity can also be
analyzed in relation with the thickness of the material. The optical transmittance in % as
described by the Beer-Lambert law is
T = P/P0 = e -bc (2)
where Po and P are the power of the incident and transmitted light, respectively, is the
molar absorptivity of the absorber, b is the path length of the sample which is also the
thickness, and c is the concentration of the absorbing species in the material. Thinner
samples results in higher transmission of light. Cross-sectional SEM images of the
samples are reported in [1]. The density and the index of refraction of the material
changed due to the air gaps created by the striations as seen from the SEM images. The
produced striations and scissions indicate that the material becomes more porous when
irradiated by higher energy ion showers.

9
4. CONCLUSIONS
The porosity and wettability properties of hydrogen ion treated PTFE materials were
evaluated using contact angle, ellipsometry and SEM tests. Low discharge LEHIS
treatment produces hydrophobic, smooth, less porous surfaces while high discharge
LEHIS produces hydrophilic, rough, optically transmissive, more porous surfaces.
ACKNOWLEDGMENTS
The financial support of the project from the Department of Science and Technology
(DOST) – Philippine Council for Advanced Science and Technology Research and
Development (PCASTRD) is gratefully acknowledged.
REFERENCES
[1] H.S. Salapare III, G. Q. Blantocas, V.R. Noguera, and H.J. Ramos, " Low energy
hydrogen ion shower (LEHIS) treatment of polytetrafluoroethylene (PTFE) materials",
Applied Surface Science (2008) doi:10.1016/j.apsusc.2008.08.079.
[2] H.J. Ramos, J. L. C. Monasterial, G. Q. Blantocas, Nucl. Instru. and Meth. in Phys.
Res. B 242 (2006) 41-44.
[3] M. S. Sheu, D. M.Hudson, I. H. Loh, The Encyclopedic Handbook of Biomaterials
and Bio-engineering: Part A; Marcel Dekker, New York, 1 (1995) 865.
[4] C. M. Chan, T. M. Ko, Surf Sci Rep (24) (1996) 1.
[5] P.G. de Gennes, Rev. of Mod. Phys. 57 (3) (1985) 827-863.
[6] J. Israelachvili, Intermolecular and Surface Forces, Academic Press, New York, 2004.
10
[7] R. Mohammadi, W.H. Finlay, W. Roa, A. Amirfazli, Determination of Contact Angle
Microspheres by Microscopy Methods, Proceedings of the International Conference on
MEMS, NANO and Smart Systems, 2003.
[8] J. Glodek, P. Milka, I. Krest, M. Keusgen, Sens Actuators B 83 (426) (2002) 82-89.
[9] J. Chakraborty, S. D. Sarkar, S. Chatterjee, M. K. Sinha, D. Basu, Colloids and
Surfaces B: Biointerfaces 66 (2) (2008) 295-298.
[10] C. Erisken, D. M. Kalyon, H. Wang, Biomaterials 29 (30) (2008) 4065-4073.
[11] S. Gao, Y. Wang, T. Wang, G. Luo, Y. Dai, Bioresource Technology (2008)
doi:10.1016/j.biortech.2008.06.060.
[12] L. F. Zhang, R. Sun, L. Xu, J. Du, Z. C. Xiong, H. C. Chen, C. D. Xiong, Materials
Science and Engineering: C 28 (1) (2008) 141-149.
[13] L. Safinia, N. Datan, M. Höhse, A. Mantalaris, A. Bismarck, Biomaterials 26 (36)
(2005) 7537-7547.
[14] M.T. Khorasani, H. Mirzadeh, Z. Kermani, Applied Surface Science 242 (3-4)
(2005) 339-345.
[15] T. Białopiotrowicz, B. Jańczuk, Applied Surface Science 201 (1-4) (2002) 146-153.
[16] W. Prissanaroon, N. Brack, P. J. Pigram. P. Hale, P. Kappen, J. Liesegang, Synth
Met 154 (2005) 105-108.
[17] V. N. Vasilets, G. Hermel, U. Konig, C. Wener, M. Muller, F. Simon, et. al.,
Biomaterials 18 (1997) 1139-1145.
[18] J. M. Li, M. J. Singh, P. R. Nelson, C. M. Hendricks, M. Itani, M. J. Rohrer, et. al, J
Surg Res 105 (2002) 200-208.
11
[19] M. Crombez, P. Chevallier, R. C. Gaudreault, E. Petitclerc, D. Mantovani, G.
Laroche, Biomaterials 26 (2005)1402-1409.
[20] P. Chevallier, R. Janvier, D. Mantovani, G. Laroche, Macromol Bio Sci 5 (2005)
829-839.
[21] E. T. Kang, K. L. tan, K. Kato, Y. Uyama, Y. Ikada, Macromolecules 29 (1996)
6872-6879.
[22] R. K. Y. Fu, Y. F. Mei, G. J. Wan, G. G. Siu, P. K. Chu, Y. X. Huang, X. B. Tian,
S. Q. Yang and J. Y. Chen, Surface Science 573 (3) (2004) 426-432.
[23] H. Y. Kwong, M.H. Wonga, Y.W. Wong, Appl. Surf. Sci. 253 (22) (2007) 8841-
8845.
[24] G. Q. Blantocas, H. J. Ramos and M. Wada, Rev. of Sci. Instru. 75 (9) (2004) 2848-
2853.
[25] G. Q. Blantocas, H. J. Ramos, M. Wada, Jpn. J. Appl. Phys., 45 (10B) (2006) 8525–
8530
[26] J.M. Goddard, J.H. Hotchkiss, Prog. Polym. Sci. 32 (2007) 698-725.
[27] S. Guruvenket, M. Kumath, S. P. Vijayalakshmi, A. M. Raichur and G. M. Rao: J.
Appl. Polym. Sci. 90 (2003) 1618
[28] G. S. Tzeng, H. J. Chen, Y. Y. Wang, C. C. Wan, Surf. and Coatings Technol. 89
(1997) 108-113. [38] D. W. Dwight, W. M. Riggs, J Colloid Interface Sci 48 (1974) 650.
[29] F. Garbassi, M. Morra, E. Occhiello, Chapter 4, Polymer Surfaces: From Physics to
Technology, Wiley: New York, 1994.
12
[30] G. Q. Blantocas , P. E. R. Mateum, R. W. M. Orille, R. J. U. Ramos, J. L. C.
Monasterial, H. J. Ramos, L. M.T. Bo-ot, Nucl. Instru. and Meth. in Phys. Res. B 259 (2)
(2007) 875–883.
[31] F. Wooten, Optical Properties of Solids, Academic Press, New York, 1972.
FIGURE CAPTIONS
Figure 1: Illustrations of the experimental setup. (a) Schematic diagram of the overall
facility. (b) Schematic diagram of the GDIS.
Figure 2: (a) Typical mass spectra of LEHIS at varied plasma discharge currents. (b)
Plot of the ion flux density at different discharge conditions.
Figure 3: Typical numerical constructs of Eq. 3 (wetting model) fitted against the
temporal recession of the contact angles for all PTFE samples.
Figure 4: (a) SEM image of a representative sample from the control group, (b) typical
SEM image from the group processed at low discharge currents, Id = 1.0 mA, (c) typical
SEM image from the group processed at Id = 2 mA, and (d) typical SEM image from the
group processed at higher discharge currents, Id = 3 mA.
TABLE CAPTIONS
Table 1: Summary of experimental parameters.
Table 2: Relationship of discharge current, optical transmittance, and index of refraction.
13
Figure 1: Illustrations of the experimental setup. (a) Schematic diagram of the overall
facility. (b) Schematic diagram of the GDIS.
14
(a)
0
0.05
0.1
0.15
0.2
0.25
0.3
1 2 3
Discharge current Id (mA)
Ion
curr
ent d
ensi
ty (A
/m2 )
(b)
Figure 2: (a) Typical mass spectra of LEHIS at varied plasma discharge currents. (b)
Plot of the ion flux density at different discharge conditions.
15
Figure 3: Typical numerical constructs of Eq. 3 (wetting model) fitted against the
temporal recession of the contact angles for all PTFE samples.
16
Figure 4: (a) SEM image of a representative sample from the control group, (b) typical
SEM image from the group processed at low discharge currents, Id = 1.0 mA, (c) typical
SEM image from the group processed at Id = 2 mA, and (d) typical SEM image from the
group processed at higher discharge currents, Id = 3 mA.
17
Table 1: Summary of experimental parameters.
Table 2: Relationship of discharge current, optical transmittance, and index of refraction.