the politics of the service class
TRANSCRIPT

THE POLITICS OF THE SERVICE CLASSThe homology of positions and position-takings
Magne FlemmenDepartment of Sociology, University of Bergen, Norway
ABSTRACT: Claims of the demise of class were in part fuelled by problems
facing a class analysis of contemporary politics. Central to this was the
emergence of the ‘new middle class’. Debates revolved around whether it
would constitute a source of radicalism or conservatism. John Goldthorpe’sconcept of the service class has proven to be the most enduring contribution
to these debates. The service class, Goldthorpe held, would constitute an
essentially conservative element in contemporary society. Deviations from
this expected conservatism were supposedly an intermittent, transitory
phenomenon, devoid of structural basis. In this paper, I investigate the
political attitudes of the Norwegian service class. Adhering to Clark and
Lipset’s insistence on the need for a more complex analysis of both class and
politics, I take a multidimensional approach: political attitudes are seenwithin the two dimensions of economic and ‘post-materialist’ issues, and
class divisions in terms of the two dimensions of volume and composition of
capital, following Bourdieu. By applying Multiple Correspondence Analysis,
I uncover a significant political heterogeneity with a structural basis in the
different forms of capital, pace Goldthorpe. The fractions relying on cultural
capital are markedly leftist, while their counterparts possessing economic
capital constitute a right-wing. Also, service-class members with the most
capital are more liberal than their counterparts with less overall capital.I argue that this points to the significance of a multidimensional concept of
class, which in turn necessitates further work on how ‘Bourdieusian’
concepts can be synthesised with class analysis.
Key words: class analysis; forms of capital; politics; service class;
social space; cultural capital
From its inception by Karl Marx, sociological class analysis has been tiedto questions of conflict and political alignments. The overall idea has beenthat differential positions within the production and distribution ofsocieties’ goods and rewards produce different position-takings towardsthe organisation of this production and distribution. The working classwould favour policies to promote the equal distribution of these goods and
– 2013 Taylor & Francis 543
European Societies,2014
Vol. 16, No. 4, 543�569,http://dx.doi.org/
10.1080/14616696.2013.817597
rewards and policies providing workers with more control over theproduction process, whereas the higher classes would opt for the opposite.Even though there has been considerable debate about the extent andpermanency of these proclivities, they have been evident throughout thepost-war period (Evans 2000; van der Waal et al. 2007).
Researchers and commentators alike were puzzled, however, when the‘new’ middle classes arrived on the scene accompanied by forms of ‘new’politics. What would be the political leanings of groups that foundthemselves at neither pole of the hierarchy? And, crucially, how is thisexplicable in terms of their position in the social structure? This is animportant issue, since the ‘new middle class’ constitutes a sizeable segmentin most Western countries, and one that is relatively privileged andinfluential. The puzzle was complicated by the emergence of new forms ofradicalism linked to issues of warfare and environmentalism, as opposed tothe bread-and-butter issues of the labour movement (Parkin 1968).
This produced a startling plurality of perceptions, fears and hopes.Several commentators expected these new middle classes to represent anew source of radicalism, as they were regarded as less tied to themechanisms providing the power and privileges of the old middle class(Ehrenreich and Ehrenreich 1977a; Gouldner 1979). Alternatively, theywere also conceived of as a ‘new working class’ and expected to align withthe traditional one (Mallet 1975). These hopes were mirrored inconservative American writers’ fears of the same (see the bulk of thecontributions in Bruce-Briggs 1979).
Commentators of a liberal bent emphasised that the rise of the middleclasses flew in the face of Marxist expectations of a polarised classstructure and corresponding political landscape. In fact, the growinginfluence of the values of professionalism and managerialism would createa more humane ‘post-capitalist’ social order, rendering the socialist projectirrelevant. On this count, the rise of the new middle class was associatedwith liberal progress rather than revolution (Dahrendorf 1959; Kerr et al.1960). Then came the 1960s, with its outbursts of radicalism among theranks of these new middle classes (see the classic account in Parkin 1968).The emergence of the distinctively middle-class New Left lent at leastsome credence to the hopes and fears of the radical and conservative new-class theorists.
How could the same phenomenon be given such divergent accounts andinterpretations? Probably because the social group or social groups inquestion do not exhibit one unitary political profile. Those who want toemphasise either the conservatism or the radicalism of the middle classwill find at least some support in the evidence. The complexities involvedin a differentiation of class structures and political landscapes nurturedclaims about the decline or even the death of class (Clark and Lipset 1991;
544
EUROPEAN SOCIETIES
Pakulski and Waters 1996). In this paper, I argue that in order to understandmiddle-class politics, we need a more complex conception of both class andpolitics, as alluded to by Clark and Lipset. Taking Goldthorpe’s (1982,1995, 2007) account of the service class as a point of departure, I show thatpolitical divisions within this class are related to its internal social divisions.The data analysed is the Norwegian 2009 Electoral Survey.
1. A conservative service class?
Any account of the politics of the middle class hinges on how ‘the middleclass’ is conceptualised. Although numerous accounts have been suggested(for example Ehrenreich and Ehrenreich 1977b; Giddens 1981; Aber-crombie and Urry 1983; Wright 1985; Lash and Urry 1987), Goldthorpe’stheory of the service class (1982) appeared to be the most enduringcontribution, owing much to the success of the EGP class scheme moregenerally. The service class is seen as a class of employed executives,managers and various professionals. Goldthorpe originally conceptualisedthe service class as distinct because of the trust installed in them by theiremployers to ensure that their execution of management tasks andknowledge applications was in the firm’s best interest. In later formula-tions this is expressed in terms of a differentiation of employmentcontracts (Goldthorpe 2007).
The service class, Goldthorpe argued, was in a sense similar to the oldmiddle class in that its members were relatively privileged by the currentstate of affairs. They would thus seem to have little real incentive to optfor a radical recasting of the institutional order. Goldthorpe’s view wasaccordingly that this middle class is ‘an essentially conservative elementwithin modern societies’, and that ‘white-collar radicalism will remainminoritarian, intermittent and localised’, since it lacks a structural basis(Goldthorpe 1982: 180, 183). This position was maintained in the face ofempirically based criticism (Goldthorpe 1995). It is significant to note thatGoldthorpe does not deny the existence of some political heterogeneitywithin the service class; his point is that these variations are not related totheir class position, but only to differences in situs.
The debate about middle-class politics was complicated by theemergence of ‘new politics’. Parkin’s (1968) pioneering study of middle-class radicalism underlined that it was in fact quite distinct from thebread-and-butter politics of the working class. The increased salience ofquestions relating to the environment and climate change, (nuclear) war,rights for homosexuals, racism and xenophobia and other issues of a more‘non-material’ nature is often seen as a redrawing of the politicallandscape. The coming of ‘post-materialist’ politics (Inglehart 1990) and
545
The politics of the service class FLEMMEN

the politics of life-style, as opposed to that of life-chances (Giddens 1994),are seen as either supplanting or supplementing the old-fashioned left-right economic divide. Many authors thus argue that political attitudesshould be understood two-dimensionally, as involving a classical economicleft-right axis and a ‘post-materialist’, ‘new-political’ value dimension(Flanagan 1982; Clark and Lipset 1991; Borre 1995).
The challenge for class analysis is to account for how position-takingsrelate to social positions. Goldthorpe’s postulate of an essentiallyconservative service class has proved highly contestable. Two centralexamples will suffice. Prior to Goldthorpe’s introduction of the concept,Giddens argued that the groups of professional employees should be seenas distinct from managers and executives because of their differentpositions in the ‘paratechnical relations’, regardless of their similar marketsituation (Giddens 1981: 187�8). Goldthorpe’s erstwhile chief antagonist,Erik Olin Wright, argued for the necessity of distinguishing betweengroups based on their type of asset � property, organisational or skill assets(Wright 1985). This perspective implies that the service class is system-atically divided by the type of assets members rely on. The British serviceclass was indeed found to be politically divided by type of asset (Heath andSavage 1995). Goldthorpe was characteristically unmoved by thesefindings (1995: 324), maintaining it to be more fruitful to investigatepolitical divisions between the higher and lower echelons of the serviceclass (1995: 329, n. 10).
From outside the ranks of traditional class analysis, Bourdieu showed inDistinction that what he called the dominant class � which roughlycorresponds to the service class � was internally fractured by the form ofcapital dominant in one’s holdings. Notably, the propensity for rightistversus leftist sympathies was structured by this principle of capitalcomposition (Bourdieu 1984: 452). In this scheme, the service class wouldbe systematically heterogeneous: teachers and artistic producers, rich incultural capital, adopted leftist positions, whereas those engaged inmanufacturing and commerce, thus richest in economic capital, leanedto the right.
The service class is on average economically right-wing in manycountries (Svallfors 2006: 52�102). However, there is much evidence ofsome political polarisation within this class too. Some studies point todifferences between different occupational groups � notably variousprofessionals as opposed to managers and executives (Brooks and Manza1997; Kriesi 1998: 168�72; Guveli et al. 2007; Oesch 2008), and otherspoint to a distinction between service-class members in the public asopposed to the private sector (Knutsen 2005). A third group of scholarshas identified the type of assets or capitals as important (Heath 1991;Heath and Savage 1995; Rosenlund 2009; Harrits et al. 2010). These
546
EUROPEAN SOCIETIES
differing accounts have a good deal in common, proposing similarexplanations. In this paper, I expand on this research by modelling amultidimensional space of political attitudes within the service class,whereas most other analyses restrict themselves to socialist versus non-socialist voting patterns. This allows one to investigate the differentiationin terms of attitudes to both ‘old’ and ‘new’ politics. The construction ofan internal social space allows for a fine-grained analysis of how internalpolitical and social differentiation are related.
1.1 Homology I: On positions and position-takings
The crux is then whether the internal political heterogeneity of the serviceclass has any meaningful social structure, i.e., more than what can beattributed to the idiosyncrasies of its members. In what follows, Iendeavour to show that the political divisions in the service class arehomologous to its social division.
In Distinction Bourdieu argued that what he called the space of life-styles was homologous to the space of social positions, i.e., thestratification structure, meaning that a correspondence could be observedbetween social and symbolic divisions (Bourdieu 1984: 257�371). Thisclaim is properly understood as pertaining to the relationship between twodistinct structures � social and symbolic � and one cannot ‘reduce thehomologies between systems of differences to direct, mechanical relation-ships between groups and properties’. The space of positions and thespace of position-takings (life-styles) are claimed to be structured alongthe same lines. Hence, Bourdieu suggests that between these two spaceslies a third space of habitus, of the generative formulae ‘which underlieeach of the classes of practices and properties’ (Bourdieu 1984: 126). Theresearch design must therefore inspect the relationship between structures� that is, spaces.
This analytical strategy involves the independent constructions of twospaces � one of position-takings and one of positions, so that thestructures of the two can be compared. This has the advantage ofanalysing position-takings as a space in its own right with its own logic,without reducing it to a ‘dependent variable’ or an effect of class divisions.
2. Data and method
Optimal data for a research design such as this would include goodindicators of political attitudes to economic and cultural issues, as well asgood indicators of the various forms of capital. For practical purposes, one
547
The politics of the service class FLEMMEN

must be prioritised over the other as no suitable dataset containing both is
accessible for secondary analysis. I have analysed the nationally repre-
sentative Norwegian Electoral Survey of 2009,1 which contains excellent
questions about political attitudes, but fewer indicators of social position.
This facilitates the construction of a fine-grained space of position-takings
at the expense of a coarser space of positions.The Electoral Survey was conducted in connection with the 2009
parliamentary election. A subset of this data is used, consisting of
respondents’ classified as belonging to service class I and II. These are
constructed by adapting the Trento-program syntax (Leiulfsrud et al.2005), amounting to an operationalisation based solely on occupation,
since the other indicators are unavailable or unsatisfactory. The sample
analysed is hence systematically drawn from a representative sample, and
is therefore considered representative of the Norwegian service class.
However, the small n means that certain subdivisions to be analysed below
may not readily be generalised. Table 1 shows the distribution of
occupational groups � the two first digits of the ISCO-88 based STYRK
code (SSB 1998) � within the service class.The analysis proceeds by constructing two spaces: one of political
position-takings � attitudes to a range of political issues � and one of
social positions, hereafter called political and social space. These are
constructed by Multiple Correspondence Analysis (MCA; Lebart et al.1984: 81�108; Greenacre 2007: 137�44; Le Roux and Rouanet 2010).
MCA is a multivariate technique for the analysis of categorical data. It
seeks to reveal the central latent contrasts or oppositions in the data and
represent them as orthogonal axes. I use a variant called specific MCA (Le
Roux and Rouanet 2010: 61�4), which allows some categories to be set as
passive and thereby not influence the space. This is useful for categories
such as ‘missing’ or ‘refusal [to answer]’. The variant of MCA used here
produces two principal results � a cloud of individuals and a cloud of
categories. In the cloud of individuals, distance reflects dissimilarity in
individual response patterns: individuals that appear close have similar
responses. In the cloud of categories, distance reflects the composition of
the categories, so that categories appear close in the map when they often
appear among the same individuals (Le Roux and Rouanet 2010).
1. The data applied in the analysis in this publication are based on ‘Electoral Survey
2009’. The data are provided by Statistics Norway (SSB), and prepared and made
available by the Norwegian Social Science Data Services (NSD). Prof. Bernt Aardal
and the Institute of Social Research (ISF) were responsible for the original studies and
Statistics Norway collected the data. Bernt Aardal, ISF, SSB and NSD are not
responsible for the analyses and interpretation of the data presented here.
548
EUROPEAN SOCIETIES

In addition to the variables that are active in the construction of thespace, one can use supplementary variables for further analysis. Thesevariables do not affect the structure of the space, but are projected ontothe space once it is constructed. Lebart et al. (1984) refer to this as usingthe space as a predictive map, a ‘visual regression analysis’. The spaceconstructed by active questions can be thought of as an ‘independentvariable’, and the supplementary variables as the ‘dependent’ ones.
2.1 Homology II: The Rosenlund approach
Lennart Rosenlund (2009) developed a direct test of the homologyargument, by drawing on the ‘reciprocal approach’ recommended byLebart et al. (1984: 108). They suggest that in the analysis of survey dataon the relationship between socio-demographics and attitudes, theresearcher should follow a double strategy. Firstly, they recommendconducting an MCA of the relevant socio-demographic variables, and thenproject attitude questions onto the space as supplementary variables. Thisproduces a ‘lattice’ of the socio-demographic variables and then the ‘weavedesign’ of attitude questions is placed onto it. Secondly, they recommenddoing the reverse, conducting an MCA of the relevant attitude questionsand then projecting the socio-demographics onto it.
Accordingly, Rosenlund constructed the space of life-styles and thespace of social positions independently, using separate MCA procedures.He then projected coordinates from one space onto the other using avariable capturing coordinates from the space of positions as a supple-mentary variable in the space of life-styles. Hence he could show that the
TABLE 1. Occupational groups within the service class
Count Percent
Legislators and senior officials in public administration and interestorganisations
7 1.2
Corporate managers of large and medium-sized enterprises 121 21.3General managers of small enterprises 34 6.0Physical, mathematical and engineering science professionals 62 10.9Life science and health professionals 31 5.4Teaching professionals 34 6.0Public service administrative professionals 48 8.4Other professionals 51 9.0Engineering science associate professionals 72 12.7Life science and health associate professionals 17 3.0Executive officers in administration, business services, social work
and entertainment91 16.0
Total 568 100.0
549
The politics of the service class FLEMMEN

principal axes accounting for the variance in life-style indeed corre-sponded to those accounting for the variance in social positions(Rosenlund 2009). He was thus able to compare their structures. Harritset al. (2010) applied the same logic to the issue of class and politics. A two-dimensional space of political position-takings � ‘old’ and ‘new’ politics �was shown to be homologous with a space of social positions: the volumeand composition of capital are structuring principles of both. This lastapplication serves as a key inspiration for the present study.
2.2 Variables: Indicators of position-takings
In order to measure both old and new politics, 13 questions about politicalissues are analysed. These are listed in Table 2, along with variable shortnames (used in the maps) and an indication of the categories of response.The choice of questions is inspired by Borre (1995: 190) but is expandedupon to produce a richer picture. Questions thus tap core ideologicalissues such as egalitarianism and state control over business, as well as core‘new politics’ issues such as immigration, environmentalism and Christianvalues.
In the analysis, several categories are passive (Le Roux and Rouanet 2010:61�2). This means that they are given no weight in the analysis and do notinfluence the structure of the space. This is the case for all missing values, aswell as categories of ‘don’t know’, ‘do not want to answer’ and so forth. Moresignificant is that all ‘neither agree nor disagree’ categories are set as passive,because they destabilise the results by creating one separate dimension thatdistinguishes individuals with mostly ‘mixed’ opinions. This phenomenonhas thus been excluded from further analysis in the present context.
2.3 Variables: Indicators of social position
The social space should capture the main divisions in the ‘capitalportfolios’ of service-class members, based on the working hypothesisthat the relative weight of economic and cultural capital is crucial. Thisrequires indicators of the forms of capital and the data is less than optimalhere. My selection has been inspired by Rosenlund and colleagues’interpretation of Bourdieu (Prieur et al. 2008: 56; Rosenlund 2009: 88).
The five variables used for the social space are presented in Table 3.The most direct measure of economic capital is total household income.This has been recoded from an open question to a categorical variable.Education level is used to measure the scholastic component of culturalcapital. Occupational group plays a key part: occupation indicates
550
EUROPEAN SOCIETIES

possession of economic capital, but also cultural capital. Occupations are
coded with respect to the qualifications required (formal and technical).
Typically, occupations also provide differential career prospects, including
different prospects of salary increases. Hence, occupation is a good proxy
measure of one’s capital. As an indicator of capital composition, I use a
TABLE 2. Active questions for the construction of the political space of the serviceclass
Variable short name Question Categories
red_econ_diff* Economic differences are still so large in thiscountry that the government must see it as a maintask to reduce them.
5 (Likert-scale)
red_gov_ctrl_bus We should reduce state control over privatebusiness.
5 (Likert-scale)
effort_inc_wage_diff To exhort people to greater effort, we should bewilling to accept bigger differences in wage levels.
5 (Likert-scale)
soc_ctrl_elite_power If society cannot control private business, theleaders of banks and industry will have too muchinfluence.
5 (Likert-scale)
full_emp_ctrl_bus Full employment can be more readily secured if thestate has more influence over banks andbusinesses.
5 (Likert-scale)
public_vs_tax It is more important to develop public services thanto reduce taxation.
(5 Likert)
defense_strengthen We should strengthen the Norwegian armed forces 5 (Likert)Imm_cult_thret Immigration represents a grave threat to our
nation’s character5 (Likert)
aid Some people think that the amount of aid Norwaygives to poor countries, the so-called developingcountries, should be cut back, while others believeit should be maintained at the present level, oreven increased. What is your position?
3 (cut/asnow/increase)
Environ_std_living First, we have the issue concerning natureconservation and environmental protection. Thevalue 0 expresses the desire that environmentalprotection measures should not be taken so far asto affect our standard of living, while the value 10expresses the desire to see more done forenvironmental protection, even if it means aconsiderable reduction in the standard of living foreverybody, yourself included. Where would youplace yourself on this scale?
5 (recodedfrom 10 pointscale)
homo_adopt There should be equal adoption rights forhomosexuals and heterosexuals
5 (Likert)
internationalize We should go for a society that has a moreinternational orientation, with less emphasis onboundaries between peoples and countries
5 (Likert-scale)
christian_values We should promote a society where Christianvalues are more prominent
5 (Likert-scale)
551
The politics of the service class FLEMMEN

question about whether one supervises the work of others. This is significantdue to the rationale behind the theory of the service class: it comprisesemployees privileged because of their exercising of authority or applica-tion of specialist knowledge. People who do not supervise others’ work areincluded in the service class because of their application of specialistknowledge, which indicates cultural capital. Additionally, this variable canbe expected to relate to the volume of capital, since supervisoryresponsibility typically entails more authority and a higher salary. Finally,I include a question about employment by sector � private, public ororganisation/foundation. The public sector is a key component of thestructural foundation of cultural capital, as in Norway large parts of therelevant labour markets are within it.
In the analysis, a number of categories are set as passive. This involvesall missing categories, as well as ‘don’t knows’, ‘refusals’ and so forth.Additionally, some occupational groups are set as passive due to their lowfrequencies, because rare categories unduly affect the analysis anddestabilise results.
In all the graphical representations that follow, some axes are visuallyflipped in order ease interpretation and comparison across analyses. Thisinvolves no tampering with the data analysis.
3. Results
3.1 Political space
The political space is three-dimensional. Its first dimension is a classical,economic left-right axis, contrasting ‘socialist’ with ‘laissez-faire’ views. Itssecond axis is an intensity of opinion one � this separates moderate fromstrong views, irrespective of the issues in question. The third axis is a ‘newpolitics’ dimension, separating liberals from anti-liberals. These three axesaccount for 92.36% of the variance in the active questions: the first
TABLE 3. Variables used to construct the social space
Variable shortname Question
No. ofcategories
hh_income Household’s gross income (categorised) 6Edu_level Highest completed general education 5sector Employer description (sector � recoded) 3supervise Respondent supervised work of others (yes/no) 2occup_group Two first digits of respondent’s occupation code 11 (1 passive)
552
EUROPEAN SOCIETIES

accounts for 57.27%, the second for 26.86% and the third for 8.23%.2 Inwhat follows, I focus on plane 1�3, because the second axis is irrelevantfor present purposes. Figure 1 shows the cloud of individuals � eachrespondent’s position � in plane 1�3. A table of ‘explaining points’,categories with contributions above average, may be found in AppendixTable A1.
Figure 2 shows the active categories � the responses to the questionsanalysed � in plane 1�3. The first horizontal axis is primarily shaped byquestions about economic issues, contributing 71.36% of the axis’ totalvariance. To the left on the map we find support for the following views:that full employment is best secured by government control over business;that societal control over business is necessary to prevent the leaders ofindustry and finance from becoming too powerful; that the public sectorshould be expanded even if this means raising taxes; and, that thegovernment should seek to reduce economic inequalities. Similarly, wefind disagreement with the views that we should accept greater economicinequalities to stimulate effort and that government control over businessshould be reduced. However, we also find disagreement with the view thatthe Norwegian Armed Forces should be strengthened and that Christianvalues should be more important. Significantly, the question about theenvironment versus the standard of living contributes most to this axis (asopposed to the third), with the more uncompromising support for
Figure 1. Political space: Cloud of individuals in plane 1�3.
2. The number of axes is determined by inspecting a scree plot of eigenvalues. This
indicates that relatively little information would be gained by focusing on an extra
dimension. Explained variance refers to the rates of modified eigenvalues, since
ordinary eigenvalues underestimate the variance accounted for (Le Roux and Rouanet
2010: 39).
553
The politics of the service class FLEMMEN
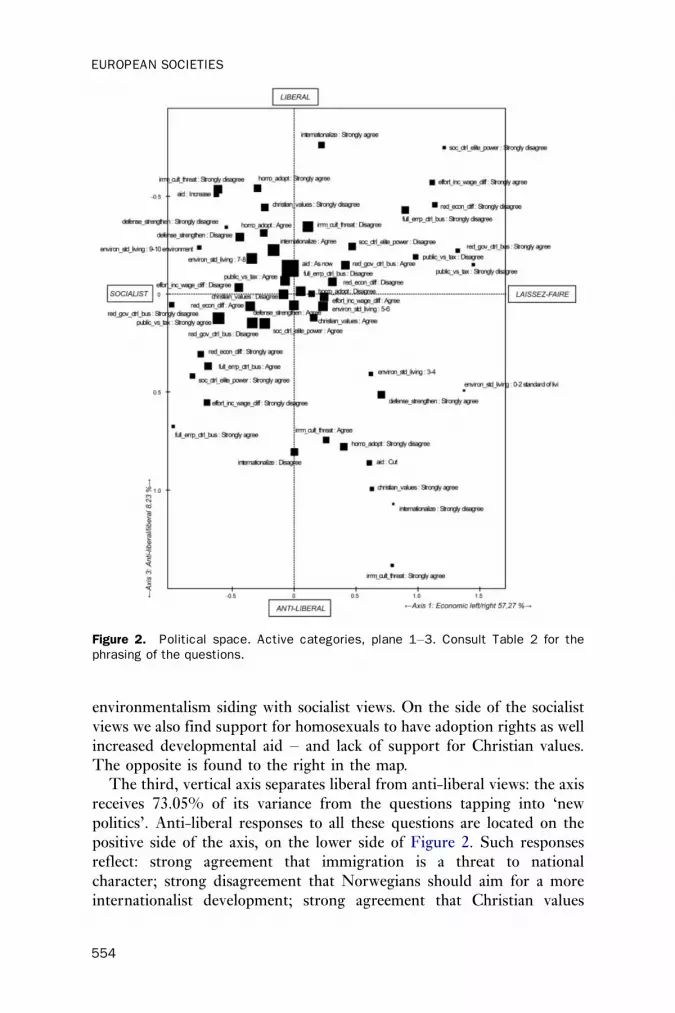
environmentalism siding with socialist views. On the side of the socialistviews we also find support for homosexuals to have adoption rights as wellincreased developmental aid � and lack of support for Christian values.The opposite is found to the right in the map.
The third, vertical axis separates liberal from anti-liberal views: the axisreceives 73.05% of its variance from the questions tapping into ‘newpolitics’. Anti-liberal responses to all these questions are located on thepositive side of the axis, on the lower side of Figure 2. Such responsesreflect: strong agreement that immigration is a threat to nationalcharacter; strong disagreement that Norwegians should aim for a moreinternationalist development; strong agreement that Christian values
Figure 2. Political space. Active categories, plane 1�3. Consult Table 2 for thephrasing of the questions.
554
EUROPEAN SOCIETIES

should be central; support for cutting developmental aid; strong
disagreement with adoption rights for homosexuals; strong agreement
that the military should be strengthened; and, an unwillingness to
prioritise environmental protection at the expense of the standard of
living.Plane 1�3 can thus be read as follows: in its lower-right quadrant we
find respondents with ‘laissez-faire’ views of economic issues and
generally anti-liberal attitudes. In the upper-right quadrant we find
respondents who are economically rightist but liberal on value issues. In
the upper left quadrant we find liberal socialists, and in the lower left we
find their less liberal counterparts. This interpretation is corroborated by
projecting party-political preferences onto the space, using the political
space to ‘predict’ party preferences. Norway’s multi-party system allow
for the nuances in political attitudes in both dimensions to emerge: in
Figure 3, the question ‘which party best represents your views?’ is
projected as a supplementary variable onto plane 1�3. Along the
horizontal left�right axis, the parties are ranked according to conventional
wisdom, from socialist left to laissez-faire right. Along the third,
(anti-)liberal dimension, we can see that the Socialist Left Party (a typical
new-left party founded in the 1960s in opposition to Norwegian NATO
membership), the social-liberal Liberal Party and the Conservatives are
preferred by the service class’ liberal elements, whereas the Centre Party,
the Christian Democratic Party and the new rightist Progress Party are
Figure 3. Supplementary variable: which party best represents your views? Meanpoints in plane 1�3. Size of the dots is proportional to frequency.
555
The politics of the service class FLEMMEN

preferred at the opposite end. The Labour Party occupies the middle
ground on axis 3 and is only slightly to the left on axis 1.
3.2 Social space
The social space is two-dimensional, the first representing the composi-
tion and the second the volume of capital. These account for 80.87% of
the variance � 55.36 and 25.05%, respectively.3 The cloud of individuals
and the cloud of categories are shown in Figure 4, and explaining points
are shown in Appendix Table A2.The horizontal axis 1 is shaped particularly by occupation (36.96%),
sector (27.28%) and supervision (22.01%), and less so by educational
level. Four occupational groups contribute above average: corporate
managers, public service administration professionals, life science and
health professionals and teaching professionals. This constitutes a clear
pattern of differentiation according to the relative weight of cultural
capital.Axis 2 (volume of capital) is shaped by occupation (35.68%), educational
level (27.56%), household income (19.56%) and supervision (10.78%).
Four occupational groups contribute above average to axis 2 as well:
corporate managers, teaching professionals, engineering science associate
professionals and executive officers in administration, business services,
Figure 4. Social space � cloud of individuals and cloud of categories plane 1�2.Lines drawn for household income and educational level. Percentages on axes refer toexplained variance (rates of modified eigenvalues).
3. In terms of variance, a third axis should be included, but this has proven difficult to
interpret.
556
EUROPEAN SOCIETIES

social work and entertainment. This constitutes a clear hierarchicaldifference, a division by the volume of capital.
The space of positions encompasses the public/private sector divide, socentral to recent debates on voter behaviour. Nevertheless, it is clear thataxis 1 is not reducible to the sector divide, given the large part played byboth occupation and supervision. The constructed space is theoreticallymeaningful and provides a good summary of central measures of socialposition, but as a social space of capitals, it is a suboptimal construction,owing to the limited range of indicators available.
3.3 Homology of the two spaces
I described homology as meaning that position-takings and positions arestructured along similar lines. The two spaces constructed should thenexhibit clear similarity of structure. In what follows, I will compare thetwo spaces. The social space is sliced into nine fractions, based oncoordinates in the cloud of individuals. Specifically, this is performed bycutting each of the axes of interest into three equally sized categories. Allthree-by-three combinations are coded into nine class fractions. Thissplitting of the clouds of individuals is shown in Figure 5. This merelylogical division serves to compare the structures of the spaces.
The next step is to project the class fractions onto the political space.This is performed by using the class fractions as supplementary variables in
Figure 5. Constructing class fractions by cutting the cloud of individuals of thesocial space.
557
The politics of the service class FLEMMEN
the political space. The homology is thus examined by inspecting the mean
points of the class fraction in the political space, and vice versa. As a rule of
thumb, distances less than 0.5 should be considered small, above 0.5 as
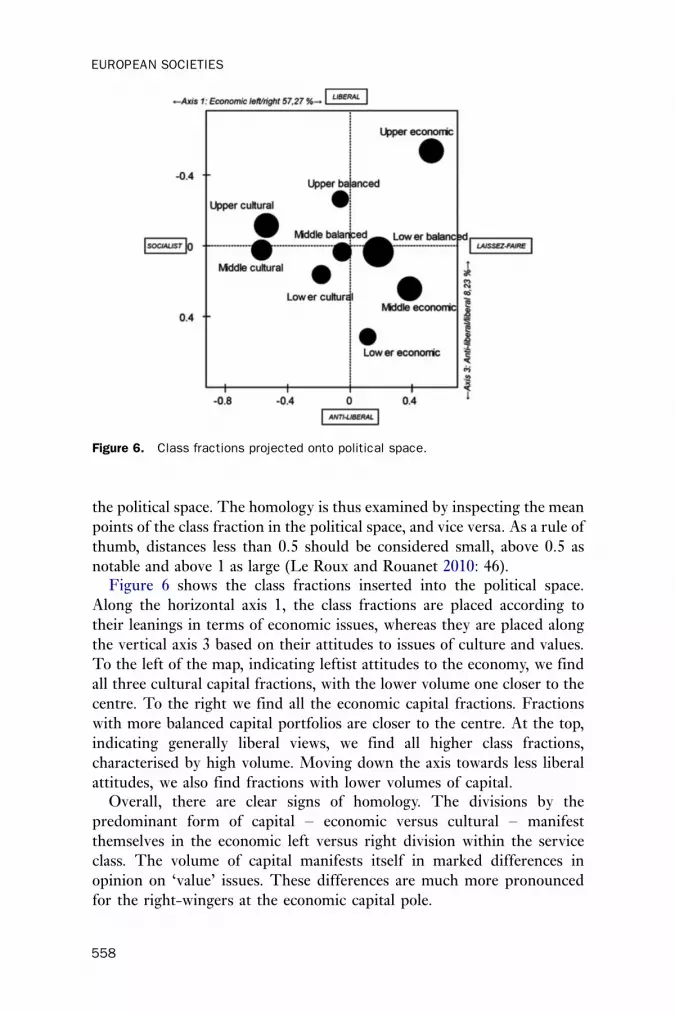
notable and above 1 as large (Le Roux and Rouanet 2010: 46).Figure 6 shows the class fractions inserted into the political space.
Along the horizontal axis 1, the class fractions are placed according to
their leanings in terms of economic issues, whereas they are placed along
the vertical axis 3 based on their attitudes to issues of culture and values.
To the left of the map, indicating leftist attitudes to the economy, we find
all three cultural capital fractions, with the lower volume one closer to the
centre. To the right we find all the economic capital fractions. Fractions
with more balanced capital portfolios are closer to the centre. At the top,
indicating generally liberal views, we find all higher class fractions,
characterised by high volume. Moving down the axis towards less liberal
attitudes, we also find fractions with lower volumes of capital.Overall, there are clear signs of homology. The divisions by the
predominant form of capital � economic versus cultural � manifest
themselves in the economic left versus right division within the service
class. The volume of capital manifests itself in marked differences in
opinion on ‘value’ issues. These differences are much more pronounced
for the right-wingers at the economic capital pole.
Figure 6. Class fractions projected onto political space.
558
EUROPEAN SOCIETIES

A t-test of the class fractions on the two dimensions of the politicalspace4 indicates that five groups exhibit distinct profiles. Upper andmiddle cultural fractions are markedly more leftist than the mean. All theeconomic fractions are also distinct: The upper and middle are distinct onboth dimensions, while the lower economic is only significantly distinct intheir opposition to liberal values. While not every category is foundstatistically significantly different from the mean, we find significantdifferences along both dimensions. The homology is thus likely to apply tothe service class and not simply the sample analysed, even if the small nwarrants cautionary conclusions.
The analyses demonstrate a clear and systematic relationship betweensocial and political divisions within the service class. But how strong is it?Norway’s historical Red-Green coalition government (Labour, theSocialist Left and the Centre party) came to power in 2005 and was re-elected in 2009. According to the survey, almost twice as many in thecultural capital fractions than in the economic one reported voting for thatgovernment (63.4 versus 33.1%).5 Hence, the fractions of the service classnot only express different opinions, but seemingly also act on them in thepolling booth (Table 4).
4. Concluding discussion
This paper has shown that the social divisions in the service class appearhomologous to its political divisions in ways that resonate well with earlierstudies. This is similar to what has been found in the broader populationin Norway (Haakestad 2012) and the Danish city of Aalborg (Harrits et al.2010). There is a systematic heterogeneity in the political leanings of theservice class that follow the divisions constituted by the possession offorms of capital.
The Norwegian service class is thus similar to the American, British,German, Dutch and Danish ones in that it is systematically split oneconomic issues, and not ‘essentially conservative’ as Goldthorpe claimed.In 1982 he could reasonably argue that heterogeneity in the service classcould be chalked up to its newness: because of its expansion during the
4. The t-test is used to test whether the class fractions constructed have statistically
significantly different political opinions on both axes of the political space. Two t-tests
are therefore done: one where the nine fractions are tested against the economic
left�right axis, and one where the nine fractions are tested against the liberal/anti-
liberal axis.
5. This includes votes for Red Election Alliance, which announced it would support the
establishment of the Red-Green government. Please note, however, that we are dealing
with a small number of respondents here.
559
The politics of the service class FLEMMEN

TABLE 4. Capital composition and party voted for
Red Electoral Alliance Socialist Left Labour Venstre (Liberal) Christian Democrat Centre Conservative Progress Party
Economic 0.6% (1) 1.8% (3) 28.5% (47) 3.6% (6) 6.1% (10) 3.0% (5) 40.0% (66) 14.5% (24)Balanced 0.6% (1) 6.9% (11) 36.9% (59) 7.5% (12) 3.1% (5) 1.9% (3) 28.1% (45) 15.0% (24)Cultural 1.2% (2) 16% (26) 38.9% (63) 11.1% (18) 5.6% (9) 6.8% (11) 17.3% (28) 2.5% (4)OVERALL 0.8% (4) 8.2% (40) 34.7%(169) 7.4% (36) 4.9% (24) 3.9% (19) 28.5% (139) 10.7% (52)
Percentages by row; counts in parenthesis. Missing, no reply and ‘other’ not shown.
560
EU
RO
PEA
NSO
CIE
TIE
S

preceding decades, many service-class members were necessarily fromlower-class origins, and hence the class had not yet been properly formed(Goldthorpe 1982: 174�5).6 Thirty years later this seems less convincing.But if this were to explain the leftism of the cultural capital fractions � thedeviant case in Goldthorpe’s view � one would have to postulate that thesegroups were relatively more often of lower-class origin, and hence lessprone to the laissez-faire attitudes deemed natural for the higher classes.Evidence about class mobility in Norway does not support this: the ratesof self-recruitment in the cultural and economic fractions are quite similar(Hansen and Wiborg 2010: 204). Class theory will need to account for thesources of structured heterogeneity within classes, which have been inevidence for decades.
This study has expanded upon earlier research into the middle classesby analysing political attitudes as multidimensional and revealing how‘new’ politics followed the internal differentiation by volume of capital.The hierarchical differentiation of attitudes to ‘value’ issues is yesterday’snews (Lipset 1959; Kohn 1969). It is, however, remarkable that this is sopronounced within the generally liberal service class (Svallfors 2006:130�9). Goldthorpe, dismissive of any ‘horizontal’ divisions, suggested itwould be more fruitful to investigate the difference between the higherand lower echelons of the service class (1995: 329, n. 10). Indeed, adivision along these lines does show up in the analyses above. Two types ofexplanations are generally offered for the hierarchical side of the valueissues. Those following Kohn point to aspects of the work situation:workers are less liberal because of their lack of self-direction. Othersfollow Lipset in explaining liberal attitudes with level of education,claiming that high education produces liberal attitudes and low or noeducation the opposite. (Houtman 2003: 24�65; Svallfors 2006: 121�43).In the case of the Norwegian service class, explanations in terms of one’swork situation seem less pertinent: anti-liberal attitudes are most clearlyrelated to low education, and the most markedly anti-liberal occupationalgroup is general managers of small firms.7 Whatever may be said of suchgeneral managers of small firms, they are arguably not marked by the lackof occupational self-direction pointed to by Kohn.
The most significant finding, however, is the correspondence betweenthe composition of capital and the socialist versus laissez-faire dimension.This supports Bourdieu’s emphasis on the multidimensionality of class� which is overlooked even in the most comprehensive follow-up of his
6. As noted above, he does not retreat from this position in the 1995 paper � nor in any
other publication that I know of.
7. This emerges from projecting indicators of social position onto the political space (not
shown).
561
The politics of the service class FLEMMEN

work on culture and class (Bennett et al. 2009). This calls for further workon whether and how this applies for populations at large, relating thesefindings to the upper and lower class(es).
Given the connection between capital composition and the public/private sector divide, this is in a sense in line with recent politologicalwork (e.g., Knutsen 2001, 2005). However, the leftism associated withcultural capital cannot be wholly attributed to sector affiliation. Employeesin the public sector are also diverse: there are significant politicaldifferences between, say, bureaucrats and teaching professionals. Therelative leftism of the latter compared to the former is intelligible in termsof capital composition, but not sector.
The leftism of teachers and other health and cultural professionalsconstitutes a challenge to the power of economic capital. Redistribution,various efforts by the state to counter inequalities and the expansion ofvarious state services, especially in the intersection between welfareservices and the labour market, lessen the potency of economic divisions.In extension of this, such efforts attack the power of economic capital,specifically in terms of transactions on the labour market. Hence, culturalcapital leftism may be interpreted as a strategy in the struggles in the fieldof power (see the brief discussion in Lamont 1987).8
The claims of the death of class were fuelled in part by the difficulties ofaccounting for contemporary politics with the old-fashioned classschemes. I have shown how this can be more satisfactorily dealt with bydrawing on Bourdieu’s conception of social space and forms of capital.However, this raises a fundamental question: what is the relation betweenthese concepts and class theory?
The service class has distinct market situations and employmentrelationships in common, but this manifestly does not ‘translate’ into aunified class along the lines suggested by Goldthorpe. While the groupsthat make up the service class are similar in these respects, they aresituated in different fields � (higher) education fields, the bureaucraticfield, the economic field and so forth � and thus they rely on differentforms of capital. Because of this, the service class becomes systematicallyfractured by the principle of capital composition. Certain fractions of theservice class are privileged primarily through their possession of culturalcapital, whereas others base their position on the possession of, and/or
8. I shall not revisit the debates as to what extent self-selection creates this pattern � i.e.,
whether socio-cultural professionals are leftist because leftists take these jobs, or
whether people in these jobs become leftist (see Parkin 1968; Bagguley in Heath and
Savage 1995). There is nothing in the data to investigate this. Furthermore, the way in
which the homology comes about is not crucial to the present theme: the affinity
between positions and position-takings is still the case.
562
EUROPEAN SOCIETIES

control over, economic capital. Goldthorpe’s differentiation between thehigher and lower echelons of the service class, while certainly important, isinsufficient to account for its systematic heterogeneity.
In this paper, I have shown that Bourdieu’s theoretical and methodicaltoolbox can be used to account for the fractioning of the service class.However, sociologists who take their main lead from Bourdieu pay littleattention to the types of issues that animated the theorisation of the serviceclass. The force of Goldthorpe’s theory was his account of the genesis ofthe particular positions in the social structure, through an interpretation ofthe development of Western capitalism in the twentieth century �particularly the rise of impersonal ownership, increased bureaucratisation(including the internal division of labour) and an increased demand forspecialised expertise. Such an account cannot be replaced by describing themiddle class in terms of their capital portfolios. In my view, this points to aneed to combine core features of ‘traditional’ class analysis � of which thetheory of the service class is an excellent example � with the ‘Bourdieusian’emphasis on fields, capitals and the multi-dimensionality of class (Flemmen2013). One way of conceptualising this is to see it as the intersection of classstructuration (Giddens 1981: 105�12) with the dynamics in different fields.This, however, is an issue that calls for more work.
Acknowledgements
I would like to thank Marianne Nordli Hansen and Vegard Jarness forimportant comments on the paper, and Johs Hjellbrekke for crucial criticalfeedback on the analysis. I am grateful to the participants at the SCUDworkshop on Field analysis, boundary drawing and socio-cultural inequalityin York 23�25 May 2011 for comments on an earlier version. GitteSommer Harrits and Tor Bjørklund gave generous advice on literature. Iwould also like to acknowledge the crucial inspiration from Harrits,Annick Prieur, Lennart Rosenlund and Jakob Skjøtt-Larsen.
References
Abercrombie, N. and Urry, J. (1983) Capital, Labour and the MiddleClasses, London: Allen & Unwin.
Bennett, T., Savage, M., Silva, E., Warde, A., Gayo-Cal, M. and Wright,D. (2009) Culture, Class, Distinction, London: Routledge.
Borre, O. (1995) ‘Old and new politics in Denmark’. Scandinavian PoliticalStudies 18, 187�205.
Bourdieu, P. (1984) Distinction: A Social Critique of the Judgement of Taste,London: Routledge.
563
The politics of the service class FLEMMEN
Brooks, C. and Manza, J. (1997) ‘The social and ideological bases ofmiddle-class political realignment in the United States, 1972 to 1992’,American Sociological Review 62: 191�208.
Bruce-Briggs, B. (ed.) (1979). The New Class?, New Brunswick, NJ:Transaction Books.
Clark, T. N. and Lipset, S. M. (1991) ‘Are social classes dying?’.International Sociology 6: 397�410.
Dahrendorf, R. (1959) Class and Class Conflict in Industrial Society,London: Routtledge & Kegan Paul.
Ehrenreich, B. and Ehrenreich, J. (1977a) ‘The new left: A case study inprofessional-managerial class radicalism’, Radical America 11: 7�22.
Ehrenreich, B. and Ehrenreich, J. (1977b) ‘The professional-managerialclass’, Radical America 11: 7�31.
Evans, G. (2000) ‘The continued significance of class voting’, AnnualReview of Political Science 3: 401�17.
Flanagan, S. C. (1982) ‘Changing values in advanced industrial societies:Inglehart’s silent revolution from the perspective of Japanese findings’,Comparative Political Studies 14: 403�44.
Flemmen, M. (2013) ‘Putting Bourdieu to work for class analysis:Reflections on some recent contributions’, British Journal of Sociology64: 325�43.
Giddens, A. (1981) The Class Structure of the Advanced Societies (2nd edn),London: Unwin Hyman.
Giddens, A. (1994) Beyond Left and Right, Stanford, CA: StanfordUniversity Press.
Goldthorpe, J. H. (1982) ‘On the service class, its formation and future’ inA. Giddens and G. Mackenzie (eds), Social Class and the Division ofLabour, London: Cambridge University Press.
Goldthorpe, J. H. (1995) ‘The service class revisited’, in T. Butler andM. Savage (eds), Social Change and the Middle Classes, London:Routledge.
Goldthorpe, J. H. (2007) ‘Social class and the differentiation of employ-ment contracts’, in On Sociology (2nd edn), Stanford, CA: StanfordUniversity Press.
Gouldner, A. W. (1979) The Future of Intellectuals and the Rise of the NewClass, London: Macmillan.
Greenacre, M. J. (2007) Correspondence Analysis in Practice, Boca Raton,FL: Chapman & Hall.
Guveli, A., Need, A. and De Graaf, N. D. (2007) ‘The rise of "new" socialclasses within the service class in the Netherlands: Political orientationof social and cultural specialists and technocrats between 1970 and2003’, Acta Sociologica 50: 129�46.
564
EUROPEAN SOCIETIES

Haakestad, H. (2012). Standpunkt: En Todimensjonal Analyse Av ForholdetMellom Klasse Og Politiske Holdninger [Standpoint: A Two-DimensionalAnalysis of the Relationship between Class and Political Attitudes]. MA,University of Oslo.
Hansen, M. N. and Wiborg, Ø. N. (2010) ‘Klassereisen � Mer Vanlig IDag? [the ‘Class Journey’ � More Common Today?]’, in J. Ljunggrenand K. Dahlgren (eds), Klassebilder: Ulikhet Og Sosial Mobilitet I Norge,Oslo: Universitetsforlaget.
Harrits, G. S., Prieur, A., Rosenlund, L. and Skjott-Larsen, J. (2010)‘Class and politics in Denmark: Are both old and new politicsstructured by class?’. Scandinavian Political Studies 33: 1�27.
Heath, A. (1991) Understanding Political Change: The British Voter1964�1987, Oxford: Pergamon.
Heath, A. and Savage, M. (1995) ‘Political alignments within the middleclasses, 1972�89’, in T. Butler and M. Savage (eds), Social Change andthe Middle Classes, London: Routledge.
Houtman, D. (2003) Class and Politics in Contemporary Social Science, NewYork: Aldine de Gruyter.
Inglehart, R. (1990) Culture Shift in Advanced Industrial Society, Princeton,NJ: Princeton University Press.
Kerr, C., Dunlop, J. T., Harbison, F. and Myers, C. A. (1960) Industrialismand Industrial Man: The Problems of Labor and Management in EconomicGrowth, Cambridge, MA: Harvard University Press.
Knutsen, O. (2001) ‘Social class, sector employment, and gender as partycleavages in the Scandinavian countries: A Comparative LongitudinalStudy, 1970�95’, Scandinavian Political Studies 24: 311�50.
Knutsen, O. (2005) ‘The impact of sector employment on party choice: Acomparative study of eight West European countries’, European Journalof Political Research 44: 593�621.
Kohn, M. L. (1969) Class and Conformity, Homewood, IL: The DorseyPress.
Kriesi, H. (1998) ‘The transformation of cleavage politics: The 1997 SteinRokkan Lecture’, European Journal of Political Research 33: 165�85.
Lamont, M. (1987) ‘Cultural capital and the liberal political attitudes ofprofessionals: Comment on Brint’, American Journal of Sociology 92:1501�6.
Lash, S. and Urry, J. (1987) The End of Organized Capitalism, Cambridge:Polity Press.
Le Roux, B. and Rouanet, H. (2010) Multiple Correspondence Analysis,Thousand Oaks, CA: Sage.
Lebart, L., Morineau, A. and Warwick, K. M. (1984) MultivariateDescriptive Statistical Analysis: Correspondence Analysis and RelatedTechniques for Large Matrices, New York: Wiley.
565
The politics of the service class FLEMMEN

Leiulfsrud, H., Bison, I. and Jensberg, H. (2005) Social Class in Europe,Trondheim: NTNU Samfunnsforskning.
Lipset, S. M. (1959) ‘Democracy and working-class authoritarianism’,American Sociological Review 24: 482�501.
Mallet, S. (1975) The New Working Class, Nottingham: Spokesman Books.Oesch, D. (2008) ‘The changing shape of class voting’, European Societies
10: 329�55.Pakulski, J. and Waters, M. (1996) The Death of Class, London: Sage.Parkin, F. (1968) Middle Class Radicalism: The Social Bases of the British
Campaign for Nuclear Disarmament, Manchester: Manchester UniversityPress.
Prieur, A., Rosenlund, L. and Skjott-Larsen, J. (2008) ‘Cultural capitaltoday: A case study from Denmark’, Poetics 36: 45�71.
Rosenlund, L. (2009). Exploring the City with Bourdieu: Applying PierreBourdieu’s Theories and Methods to Study the Community, VDM VerlagDr. Muller.
SSB (1998) Standard for Yrkesklassifisering. Norges offisielle statistikkOslo-Kongsvinger: SSB.
Svallfors, S. (2006) The Moral Economy of Class, Stanford, CA: StanfordUniversity Press.
Van Der Waal, J., Achterberg, P. and Houtman, D. (2007) ‘Class is notdead*It has been buried alive: Class voting and cultural voting inpostwar western societies (1956�1990)’, Politics & Society 35: 403�26.
Wright, E. O. (1985) Classes, London: Verso.
Magne Flemmen (b. 1980) is Researcher at the Department of Sociology,University of Bergen. His research interests are in class theory, social
stratification and sociological theory.
Address for correspondence: Magne Flemmen, c/o, Department of Sociology
and Human Geography, University of Oslo, P.O Box 1096, Blindern, Oslo
0317, Norway.
E-mail: [email protected]
566
EUROPEAN SOCIETIES

APPENDIX A1. Table of contributions for the political space. All contributions above average by axis, sorted in declining order by contributionseparately for positive and negative side of axis.
Axis 1: Socialist vs. laissez-faire Axis 2: Intensity of opinions Axis 3: Anti-liberal vs. liberal
� Increase wage differences to increaseeffort: Strongly agree
6.68 Full employment best secured bygovernment control: Disagree
6.00
4.10
More international development:DisagreeImmigration threatens nationalcharacter: Strongly agree
8.91
8.86Reduce government control overbusiness: Strongly agree
6.45 Increase wage differences to increaseeffort: Agree
2.84 Adoption for homosexuals: Stronglydisagree
8.31Full employment best secured bygovernment control: Strongly disagree
6.36 Christian values should be more central:Disagree
2.15 Aid: Cut 6.78Reduce economic differences: Stronglydisagree
5.55 Societal control over business needed tocounter elite power: Disagree
1.92 Immigration threatens nationalcharacter: Agree
5.82Expand social services even if increasedtaxes: Disagree
4.59
Christian values should be more central:Strongly agree
4.86Expand social services even if increasedtaxes: Strongly disagree
4.37
Strengthen defence: Strongly agree 3.29Societal control over business needed tocounter elite power: Strongly disagree
4.03
Increase wage differences to increaseeffort: Strongly disagree
3.10
More international development: Stronglydisagree
2.60
Strengthen defence: Strongly agree 3.49
Standard of living vs. environment(0�10): 0�2 standard of living
2.53
Aid: Cut 1.92
} Reduce government control overbusiness: Strongly disagree
4.59 Increase wage differences to increaseeffort: Strongly disagree
Expand social services even if increasedtaxes: Strongly agree
4.59 Expand social services even if increasedtaxes: Agree
5.76 More international development: Stronglyagree
6.04
567
The
politic
sof
the
servic
ecla
ssFLE
MM
EN

APPENDIX A1. (Continued )
Axis 1: Socialist vs. laissez-faire Axis 2: Intensity of opinions Axis 3: Anti-liberal vs. liberal
Full employment best secured bygovernment control: AgreeSocietal control over business needed tocounter elite power: Strongly agree
3.43
3.66
Societal control over business needed tocounter elite power: Strongly agree
5.16 Immigration threatens nationalcharacter: Strongly disagree
4.36
Immigration threatens nationalcharacter: Strongly disagree
3.28
Christian values should be morecentral:Strongly disagree
4.78 Adoption for homosexuals: Stronglyagree
3.53
Reduce economic differences: Stronglyagree
3.15
Full employment best secured bygovernment control:Strongly agree
4.67 Increase wage differences to increaseeffort: Strongly agree
3.05
Standard of living vs. environment(0�10): 9�10 environmentIncrease wage differences to increaseeffort: Strongly disagree
1.99
2.80
Reduce government control over business:Strongly agree
4.46 Societal control over business needed tocounter elite power: Strongly disagree
2.68
Reduce government control over business:Strongly disagree
4.19 Christian values should be more central:Strongly disagree
2.66
More international development: Stronglyagree
3.96 Full employment best secured bygovernment control: Strongly disagree
2.53
Reduce economic differences: Stronglyagree
3.76 Immigration threatens nationalcharacter: Disagree
2.27
Expand social services even if increasedtaxes: Strongly disagree
3.75 Aid: IncreaseAdoption for homosexuals: Agree
2.171.30
Societal control over business needed tocounter elite power: Strongly disagree
2.99
Reduce economic differences: Stronglydisagree
2.28
Adoption for homosexuals: Strongly agree 2.15Expand social services even if increasedtaxes: Strongly agree
2.05
Full employment best secured bygovernment control: Strongly disagree
2.01
Standard of living vs. environment (0�10):9�10 environment
1.78
Strengthen defence: Strongly agree 1.52
568
EU
RO
PEA
NSO
CIE
TIE
S

APPENDIX A2. Table of contributions for the social space. All contributions above average by axis, sorted in declining order by contributionseparately for positive and negative side of axis.
Axis 1: Composition of capital Axis 2: Volume of capital
� Public sector 15.14 Executive officers in administration, business services, social work andentertainment
14.90
Not supervise 10.89 Education level 12�13 years 5.78Teaching professionals 7.20 Household income: 401,000�800,000 4.43Public service administrative professionals 6.05 Education level B� 10 years 3.92Life science and healing professionals 5.42 Engineering science 3.83Education level 12�13 years 4.65
} Private sector 12.11 Education level 5� years university 12.90Corporate managers of large and medium-sizedenterprises
11.35 Corporate managers of large and medium-sized enterprises 5.72
Supervise 11.12 Household income: 1,000,001�1,500,000 5.41Teaching professionals 3.90Household income: 1,500,000 �� 3.77
569
The
politic
sof
the
servic
ecla
ssFLE
MM
EN