the pierre auger observatory
TRANSCRIPT

Name of Institute, Faculty, Department1 KIT – University of the State of Baden-Wuerttemberg and
National Research Center of the Helmholtz Association
Institute of Nuclear Physics (IKP), Karlsruhe Institute of Technology (KIT)
www.kit.edu
A. M. Botti1,2
Research Technique Seminar 09/10/2019
1 Instituto de Tecnologías en Detección y Astropartículas, CNEA-CONICET-UNSAM2 Institute of Nuclear Physics (IKP), Karlsruhe Institute of Technology (KIT)
Ana Martina Botti – [email protected]
The Pierre Auger Observatory: upgrade and prospects in the EeV region.

Outline
1
● Introduction: - Ultra High Energy Cosmic Rays. - Extensive Air Showers.
● The Pierre Auger Observatory:- Detectors.- Summary of physical results.
● AugerPrime.
● Underground Muon Detector:- Silicon photomultipliers.- Noise sources.- Calibration and performance.

Ultra High Energy Cosmic Rays
2

(Ultra High Energy) Cosmic Rays
3
CERN LHC (14 TeV)
FNAL Tevatron (2 TeV)
1 particle/m2 sec
1 particle/m2 year
1 particle/km2 year
1 particle/km2 century
Adapted from PDG

Extensive air showers
4 2003 Rep. Prog. Phys. 66 1145

Extensive air showers
5 2003 Rep. Prog. Phys. 66 1145

Extensive air showers
6 2003 Rep. Prog. Phys. 66 1145
Muon content Mass composition and energy
Depth of EAS Maximum development (X
max)
Mass composition and energy
Electromagnetic content Energy
The Pierre Auger Observatory
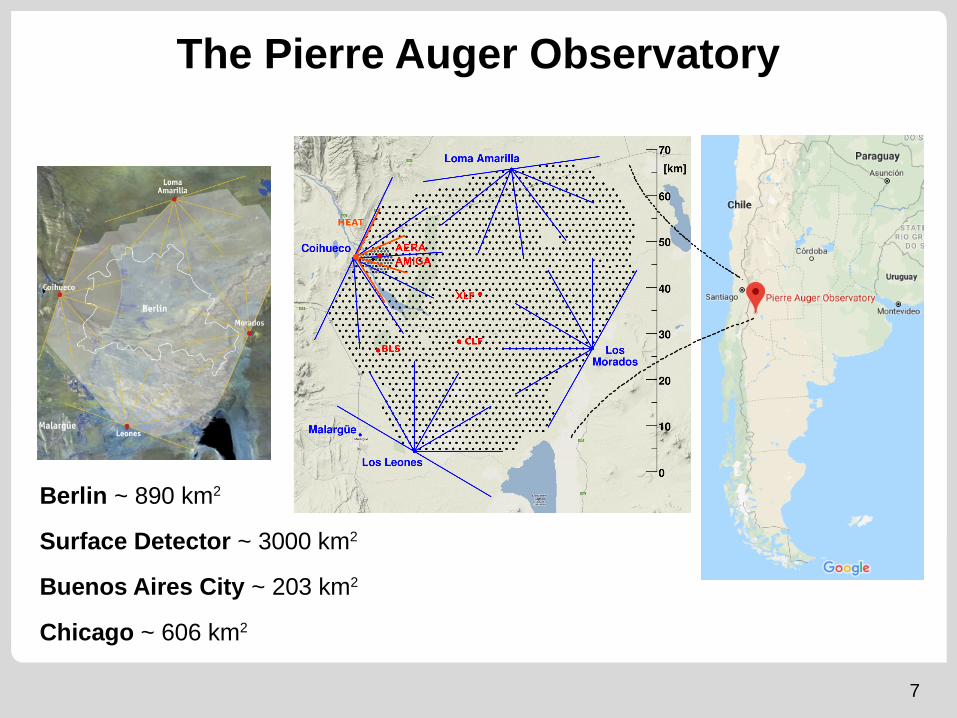
7
Berlin ~ 890 km2
Surface Detector ~ 3000 km2
Buenos Aires City ~ 203 km2
Chicago ~ 606 km2

The Pierre Auger Observatory
FD
27 fluorescence
telescopes 4 buildings
SD
3000 km2 array 1660 WCD 3.6 m x 1.2 m 1.5 km between WCD
8

Surface Detector (1660 WCD)
9
3.6 m diamater1.2 m height12000 l water3x 9-in diameter PMTs530 kg
S1000
Energy estimator
* NIM A, 798 (2015) 172-213 & CERNCOURIER

Fluorescence Detector
10
30º x 30º field of view.
Each building 180º.
20x22 PMTs.
* NIM A, 798 (2015) 172-213 & CERNCOURIER

Fluorescence Detector
11
Calorimetric energy.
Xmax Energy and composition.
* NIM A, 798 (2015) 172-213 & EPJ Web of Conferences 53 04009(2013)

12
Hybrid detection
E = (4.7 ± 0.1) 1019 eVCombine detectors to reduce systematics.
Cross calibrate.
* NIM A, 798 (2015) 172-213 & EPJ Web of Conferences 53 04009(2013)

Low energy enhancements
13* PoS(ICRC2017)492 & 10 7529/ICRC2011/V03/0761

Results
14
Spectrum:
Flux suppresion confirmed.
2nd knee was observed.
Highest statistics at UHE.
Anisotropy:
Dipole away from galactic center Strong evidence of extragalactic origin @ E > 8 1018 ev.
* PoS(ICRC2019)450 & Science paper

Results
14
"To the Pierre Auger Observatory collaboration for showing that ultra-high-energy cosmic rays come from outside the Milky Way."
Spectrum:
Flux suppresion confirmed.
2nd knee was observed.
Highest statistics at UHE.
Anisotropy:
The Pierre Auger Collaboration, Science 357, 1266–1270 (2017)
* PoS(ICRC2019)450 && Science paper

Results
15
Cross section proton-air (and proton-proton):
Photon and neutrino flux:
Study hadronic models at energies above LHC (57 ± 0.3 ± 6) TeV
* Phys.Rev.Lett. 109 (2012) 062002 & PoS(ICRC2019)979 & PoS(ICRC2019)398
Results
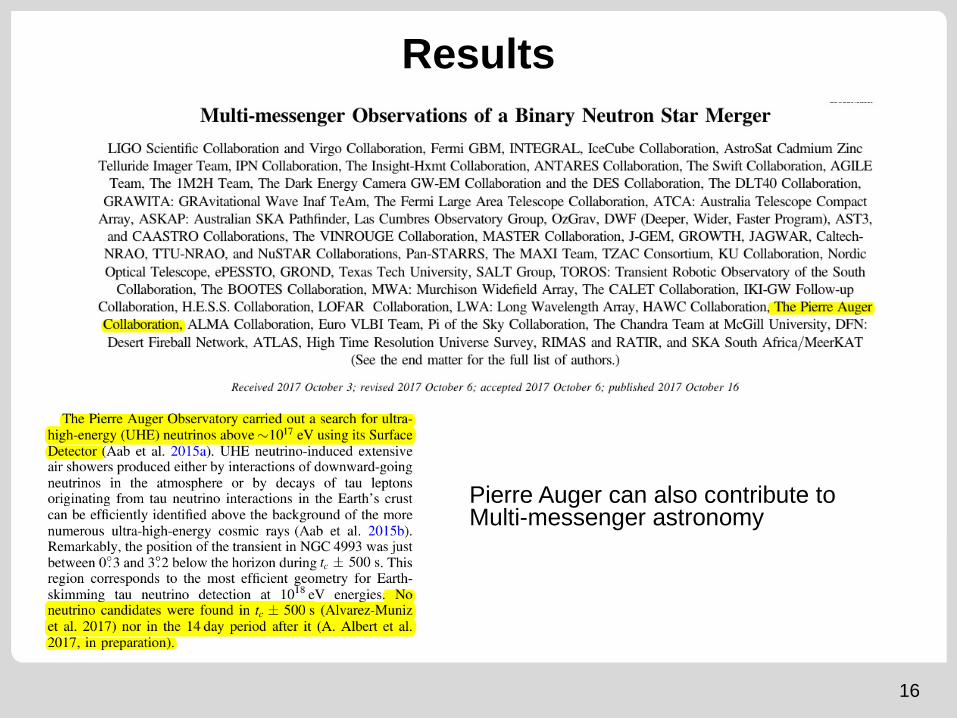
16
Pierre Auger can also contribute to Multi-messenger astronomy

AugerPrime motivation arXiv:1604.03637
Fe
N
He
p
17
Mass composition cosmic rays with E > 1019 eV.
Protons with E > 1019 eV. Hadronic models.
Improve statistics and
mass discrimination
Datos FD
Fe N He p
1018 1019 1020

Motivation: muon content in EAS
18PoSICRC2019)214 + PoS(ICRC2019)411
Upgrade components
19
SSD
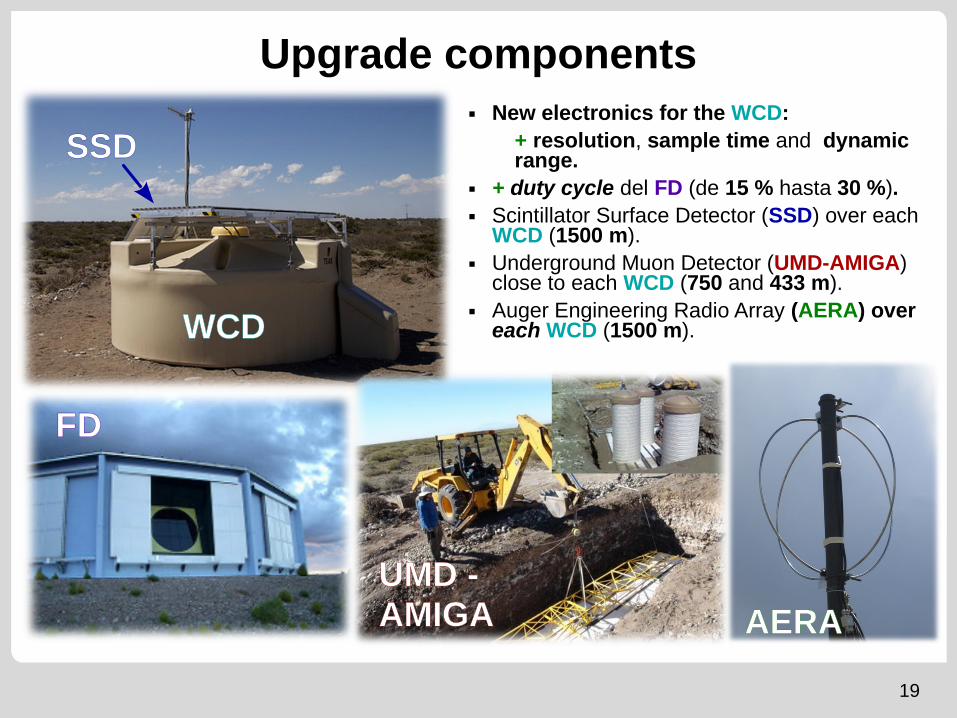
New electronics for the WCD:
+ resolution, sample time and dynamic range.
+ duty cycle del FD (de 15 % hasta 30 %). Scintillator Surface Detector (SSD) over each
WCD (1500 m). Underground Muon Detector (UMD-AMIGA)
close to each WCD (750 and 433 m). Auger Engineering Radio Array (AERA) over
each WCD (1500 m).
FDFD
SSD
WCD
AERA
UMD -AMIGA

20
Scintillator Surface Detector (SSD) 3.8 m² scintillator 48 scintillator strips + WLS optical fiber PMT Aluminium casing
PMTScintillatorstrips
SSD
Fibers
* JINST 6 (2011) P06006
*
Scintillator Surface Detector (SSD)
21
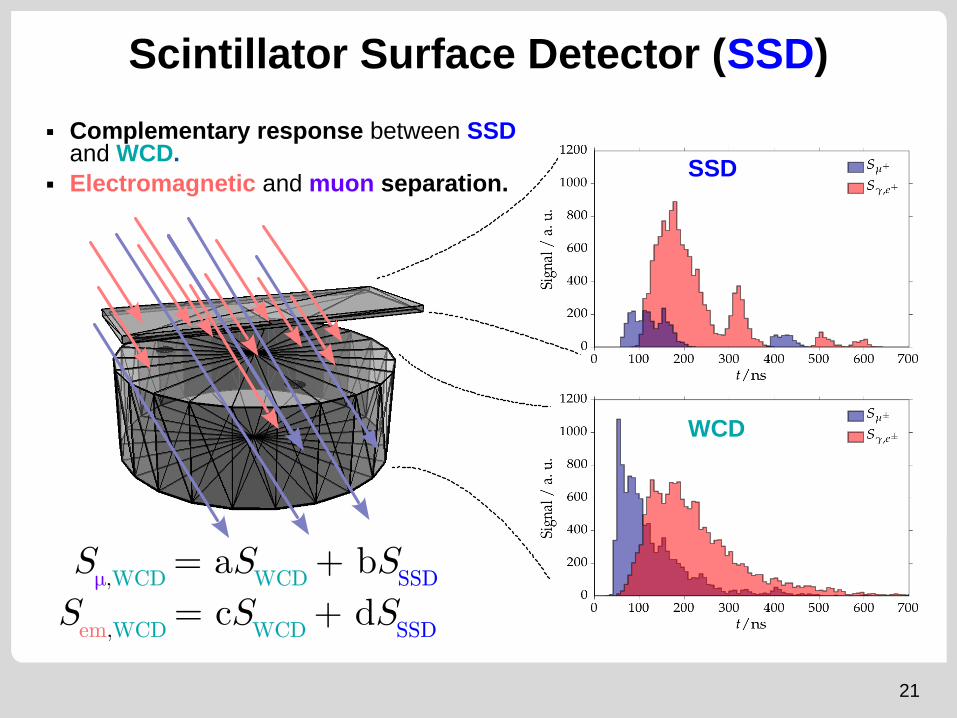
Complementary response between SSD and WCD.
Electromagnetic and muon separation.
Sµ,WCD
= aSWCD + bS
SSD
Sem,WCD
= cSWCD + dS
SSD
WCD
SSD

First engineering array data (SSD)
12 SSDs in engineering array.
Adquisition since October 2016.
22
Reconstruction of Lateral Distribution Functions (LDFs) with SSDs y WCDs.

Auger Engiennering Radio Array (AERA)
23

Underground Muon detector (UMD-AMIGA)
24
Infill 61 WCD SD 750 m
SD 433 m
WCD
1-bit electronics +
integratorPlastic Scintillators
+ WLS optical fibers
2.25 m (540
g/cm²)
30 m² Scintillator with
soil shielding →
Only muon detection

8x8 array of silicon
photomultipliers (SiPM).
Underground Muon Detector (UMD-AMIGA)
WLS optical fiber
25
64 scintillator
strips
* Picture from Hamamatsu MPPC array S13361-3050NE-08
*

AMIGA Engineering array
26PoS(icrc2019)202

UMD-AMIGA Electronics
27
Low muon densities
High muon densities
Discriminator
PoS(icrc2019)202

SiPM Calibration
28
Goal: obtain breakdown voltage, V
br, (minimum
voltage to operate in Geiger mode).
SiPM gain ~ HV - Vbr

SiPM Temperature dependance
29
Breakdown voltage depends on Temperature.
HV compensation.
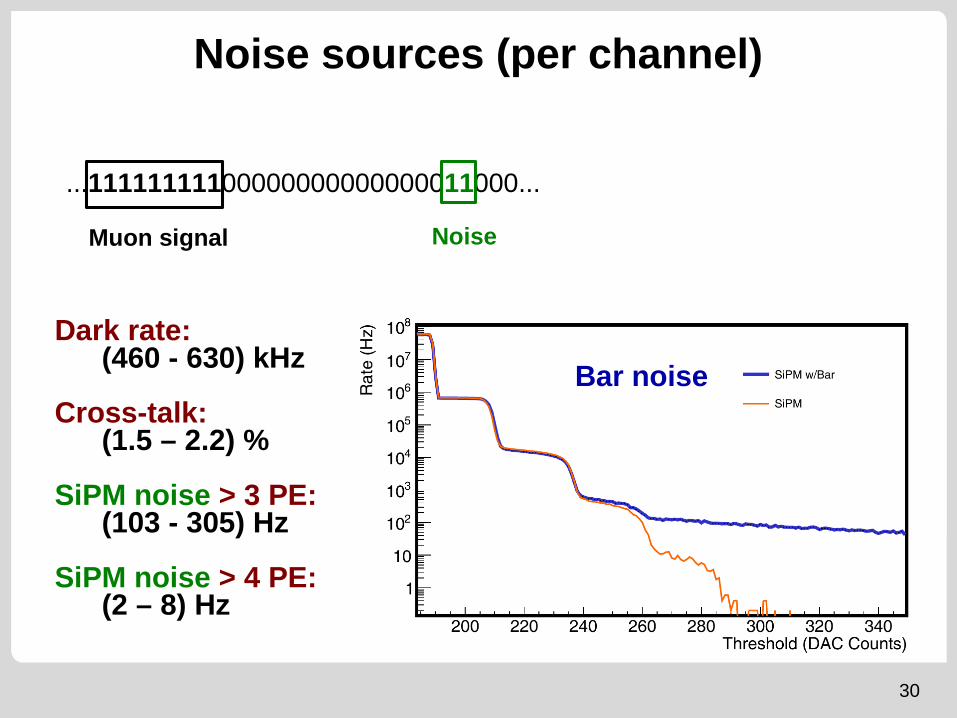
Noise sources (per channel)
30
Bar noise
...11111111100000000000000011000...
Muon signal Noise
Dark rate: (460 - 630) kHz
Cross-talk: (1.5 – 2.2) %
SiPM noise > 3 PE: (103 - 305) Hz
SiPM noise > 4 PE: (2 – 8) Hz

Noise in the field
31
Monitoring data:● Threshold @ 2.5 PE● Pattern 1x● 6.4 μs trace1 month
02/2018
~14 months04/2017 – 07/2018
(10-20) % probability of over-counting 1 muon in 1 event per module (In the lab: 14.6%). It can be reduced to 5.5 % with 1111x pattern.

Binary traces in lab setup
32

Muon counting and noise rejection
33PoS(icrc2019)202

Binary/ADC traces
34
BinaryADC LG ADC HG1 m
1 m
4.5 m
4.5 m
1 µ
Binary
ADC LG
ADC HG
1 µ
BinaryADC LG ADC HG
4 µ
BinaryADC LG ADC HG
1 m 1 m
4.5 m
4.5 m
4 µ
ete

Efficency and attenuation
35
ε ~ 98.5%
Speed of light in fiber:
PoS(icrc2019)202

1 µ charge
36
MIP separated from baseline.
In LAB, events triggered with background muons.
1 µ width
Baseline
Muon ADC signal in LAB*
99% of muons ~200 ns
Mean charge ~1000 ADC
*GAP2019_016
37
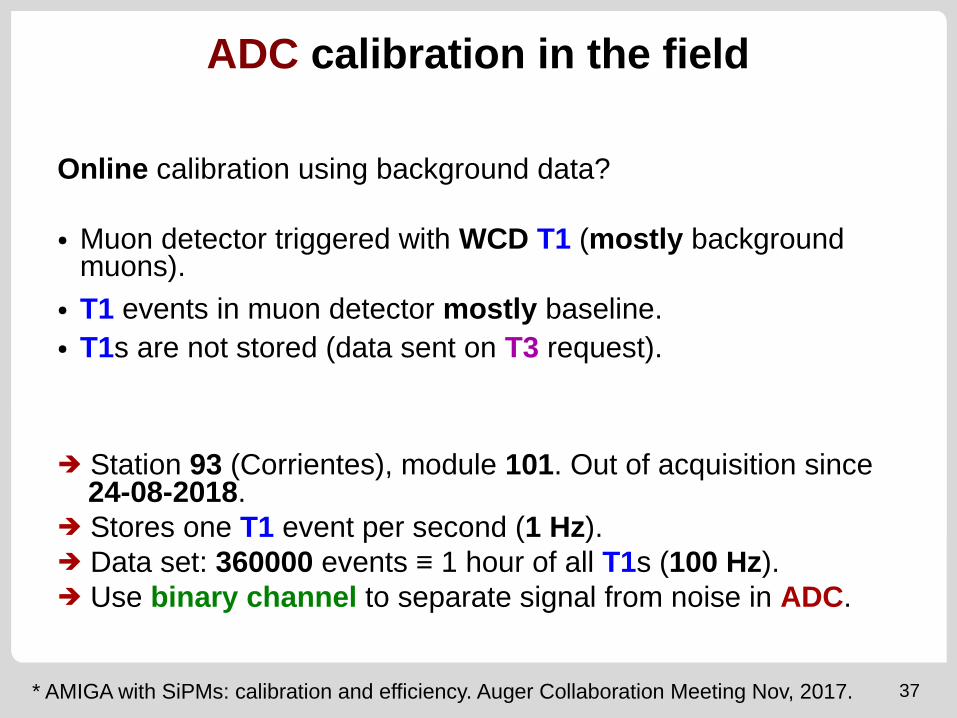
ADC calibration in the field
Online calibration using background data?
● Muon detector triggered with WCD T1 (mostly background muons).
● T1 events in muon detector mostly baseline.● T1s are not stored (data sent on T3 request).
* AMIGA with SiPMs: calibration and efficiency. Auger Collaboration Meeting Nov, 2017.
➔ Station 93 (Corrientes), module 101. Out of acquisition since 24-08-2018.
➔ Stores one T1 event per second (1 Hz).➔ Data set: 360000 events ≡ 1 hour of all T1s (100 Hz).➔ Use binary channel to separate signal from noise in ADC.

T1 Binary/ADC traces
38
“max” bin
Binary channels
360000 T1 events
ADC channel
360000 T1 events“latch” bin
/
*NoiseNoise
Undershoot (more than one muon)Note time shift
between binary and ADC signal.
*GAP2018_049

39
T1 Binary/ADC time shift
LG HG
Signal cuts (1 muon→lab data) :
➔ 1111x pattern.➔ < 12 positive samples.➔ 1 channel on.
LG HG
:μ (183.8 ± 0.1) ns: (σ 6.8 ± 0.1) ns
Binary channels star time (1st one in trace):
ADC channelmaximum signal bin:
360000 T1 events
360000 T1 events
Time shift:

T1 Binary/ADC traces
40
“signal + noise” window
“noise” window
/
Optimize window size around binary latch.

41
T1 number of events
Signal + NoiseNoise
(Signal + Noise) - Noise
~40 bin window contains all signal events

42
T1 calibration histograms
20-bin window
Calibration histogram built from T1 data.
Lognormal fit.
Mean: (358 ± 7) ADC Counts

Conclusion
43
New detectors improve mass discrimination
SSD (µ, em) UMD-AMIGA (µ) AERA (em)
Increse FD duty cycle + Xmax
statistics
New electronics WCD + sampling speed, resolution and dynamic range.
Coms. inalámbrica
GPS
Protección animales
Panel solar
Electrónica

44
Conclusions
➢ Fully characterized binary and ADC traces.
➢ SiPM caibration achieved.
➢ Temperature compensation working.
➢ Muon counting strategy to reduce background.
➢ ADC calibration with T1 possible (already implemented in electronics!).
➢ Online calibration every hour could be achieved.
➢ Compatible with offline calibration with T3.
➢ Consistent for different matching patterns.
➢ Stable in current range (24-08-2018 to 02-03-2019).

BKP
8
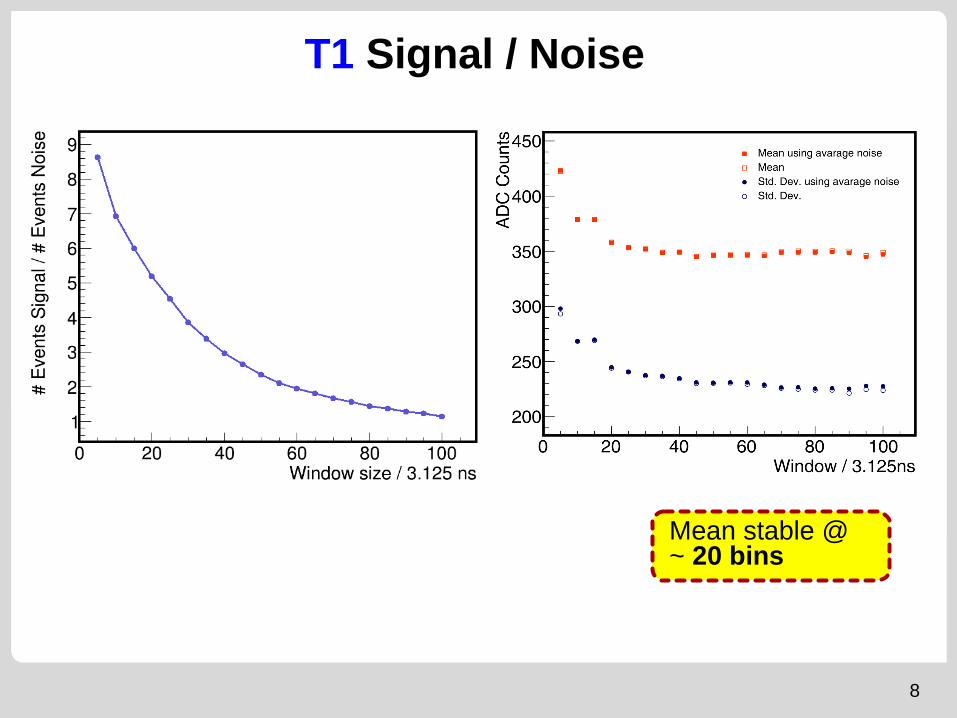
T1 Signal / Noise
Mean stable @ ~ 20 bins

T1 vs T3 calibration
9
Nµ (counter)
103
16
12
8
4
0C
ha
rge
(A
DC
Co
un
ts)
Offline calibration with T3 events
20-bin window
T1 muon mean: (358 ± 7) ADC Counts
T1/T3 calibrations consistent
T3 muon mean: (343 ± 4) ADC Counts

11
Long term monitoring and stability
Mean: 373RMS: 14 < 4% fluctuation
in this range.


D. Schmidt, Ph.D. Thesis

7
1111x @ 2.5 PE
Counting strategy: patterns (1x, 111x, 1111x)
Channel
Channel
1x @ 2.5 PE
1x @ 3.5 PE
Channel
111x @ 3.5 PE
