the panchromatic hubble andromeda treasury. i. bright uv stars in the bulge of m31
TRANSCRIPT

The Astrophysical Journal, 755:131 (13pp), 2012 August 20 doi:10.1088/0004-637X/755/2/131C© 2012. The American Astronomical Society. All rights reserved. Printed in the U.S.A.
THE PANCHROMATIC HUBBLE ANDROMEDA TREASURY. I. BRIGHT UV STARS IN THE BULGE OF M31∗
Philip Rosenfield1, L. Clifton Johnson1, Leo Girardi2, Julianne J. Dalcanton1, Alessandro Bressan3, Dustin Lang4,Benjamin F. Williams1, Puragra Guhathakurta5, Kirsten M. Howley6, Tod R. Lauer7, Eric F. Bell8, Luciana Bianchi9,
Nelson Caldwell10, Andrew Dolphin11, Claire E. Dorman5, Karoline M. Gilbert1,17, Jason Kalirai12,Søren S. Larsen13, Knut A. G. Olsen7, Hans-Walter Rix14, Anil C. Seth15, Evan D. Skillman16, and Daniel R. Weisz1
1 Department of Astronomy, University of Washington, Box 351580, Seattle, WA 98195, USA2 Osservatorio Astronomico di Padova-INAF, Vicolo dell’Osservatorio 5, I-35122 Padova, Italy
3 SISSA, Via Bonomea 265, 34136 Trieste, Italy4 Department of Astrophysical Sciences, Princeton University, Princeton, NJ 08544, USA
5 UCO/Lick Observatory and Department of Astronomy and Astrophysics, University of California, Santa Cruz, CA 95064, USA6 Lawrence Livermore National Laboratory, 7000 East Avenue, Livermore, CA 94550, USA
7 National Optical Astronomy Observatory, 950 North Cherry Avenue, Tucson, AZ 85719, USA8 Department of Astronomy, University of Michigan, 500 Church St., Ann Arbor, MI 48109, USA9 Department of Physics and Astronomy, Johns Hopkins University, Baltimore, MD 21218, USA10 Harvard-Smithsonian Center for Astrophysics, 60 Garden Street Cambridge, MA 02138, USA
11 Raytheon Company, 1151 East Hermans Road, Tucson, AZ 85756, USA12 Space Telescope Science Institute, 3700 San Martin Drive, Baltimore, MD 21218, USA
13 Astronomical Institute, University of Utrecht, Princetonplein 5, 3584 CC Utrecht, The Netherlands14 Max Planck Institute for Astronomy, Koenigstuhl 17, D-69117 Heidelberg, Germany
15 Department of Physics & Astronomy, University of Utah, Salt Lake City, UT 84112, USA16 Minnesota Institute for Astrophysics, University of Minnesota, 116 Church Street SE, Minneapolis, MN 55455, USA
Received 2011 September 20; accepted 2012 June 15; published 2012 August 2
ABSTRACT
As part of the Panchromatic Hubble Andromeda Treasury multi-cycle program, we observed a 12′ × 6.′5 area ofthe bulge of M31 with the WFC3/UVIS filters F275W and F336W . From these data we have assembled a sampleof ∼4000 UV-bright, old stars, vastly larger than previously available. We use updated Padova stellar evolutionarytracks to classify these hot stars into three classes: Post-AGB stars (P-AGB), Post-Early AGB (PE-AGB) stars, andAGB-manque stars. P-AGB stars are the end result of the asymptotic giant branch (AGB) phase and are expectedin a wide range of stellar populations, whereas PE-AGB and AGB-manque (together referred to as the hot post-horizontal branch; HP-HB) stars are the result of insufficient envelope masses to allow a full AGB phase, and areexpected to be particularly prominent at high helium or α abundances when the mass loss on the red giant branch ishigh. Our data support previous claims that most UV-bright sources in the bulge are likely hot (extreme) horizontalbranch (EHB) stars and their progeny. We construct the first radial profiles of these stellar populations and showthat they are highly centrally concentrated, even more so than the integrated UV or optical light. However, we findthat this UV-bright population does not dominate the total UV luminosity at any radius, as we are detecting onlythe progeny of the EHB stars that are the likely source of the UV excess. We calculate that only a few percent ofmain-sequence stars in the central bulge can have gone through the HP-HB phase and that this percentage decreasesstrongly with distance from the center. We also find that the surface density of hot UV-bright stars has the sameradial variation as that of low-mass X-ray binaries. We discuss age, metallicity, and abundance variations as possibleexplanations for the observed radial variation in the UV-bright population.
Key words: galaxies: evolution – galaxies: individual (M31) – galaxies: stellar content – stars: evolution – stars:horizontal-branch
Online-only material: color figures
1. INTRODUCTION
Many elliptical and large spiral bulges show enhanced ultra-violet (UV) flux toward their centers. This excess from ∼2000 Åto the Lyman limit is referred to as either the UV upturn, UV-rising branch, or UV excess (UVX). First discovered by Code(1969), explanations of the UVX converged on stellar phenom-ena as higher resolution telescopes came online (Bertola et al.1995; King et al. 1992, 1995; Brown et al. 1998, 2000) and
∗ Based on observations made with the NASA/ESA Hubble Space Telescope,obtained from the Data Archive at the Space Telescope Science Institute,which is operated by the Association of Universities for Research inAstronomy, Inc., under NASA contract NAS 5-26555.17 Hubble Fellow.
far-UV spectra from HUT and FUSE became available (Brownet al. 1997).
The UVX is generally believed to be due to core heliumburning stars (commonly known as horizontal branch stars;HB) and their descendants. These stars have evolved off thezero-age horizontal branch (ZAHB) and are following somecombination of three evolutionary channels to becoming whitedwarfs, depending on the fraction of their stellar envelope lostwhile they were red giants. Stars with a modest amount ofmass loss on the red giant branch (RGB) will leave the redside of the HB, lose a large convective envelope as canonicalasymptotic giant branch (AGB) stars, and become Post-AGB(P-AGB) stars. Intermediate amounts of mass loss will leavestars with smaller convective envelopes (which will be subse-quently lost) and hotter effective temperatures than canonical
1

The Astrophysical Journal, 755:131 (13pp), 2012 August 20 Rosenfield et al.
3.54.04.55.0
log Teff (K)
1.0
1.5
2.0
2.5
3.0
3.5
4.0
log
L(L
)
−1.0 −0.5 0.0 0.5 1.0 1.5 2.0 2.5 3.0
F275W − F336W
19
20
21
22
23
24
25
26
27
F33
6W
Figure 1. Sample stellar evolutionary tracks (Bressan et al. 2012) showing hot HB stars and their progenies’ placement on H-R diagram (left) and CMD in UVISfilters (right) as seen at the distance of M31 (see Section 3.1). Each evolutionary channel is illustrated and labeled. A canonical AGB track (black) is not shown onright panel as it is fainter than F336W = 28. The P-AGB track is taken from Vassiliadis & Wood (1994) H-burning tracks for a mass of 0.597 M� and Z = 0.016.The dashed box shows approximate range of other CMDs in this work.
(A color version of this figure is available in the online journal.)
AGBs. These stars will leave the AGB track early, becomingpost-early AGB (PE-AGB) stars.18 Stars that lose nearly alltheir envelopes on the RGB become extreme (blue) horizontalbranch (EHB) stars. These stars will have envelopes that are toosmall and temperatures that are too high to reach the canonicalAGB line, and instead will become AGB-manque or post-EHBstars (for a full review, see Greggio & Renzini 1999; O’Connell1999).
Examples of these stars’ evolutionary tracks and the hotside of the ZAHB are illustrated in Figure 1 for both aHertzsprung–Russell diagram and UV color–magnitude dia-gram (CMD). AGB-manque and PE-AGB stars collectively arelong-lived, hot post-HB stars (hereafter referred to as HP-HB).These HP-HB are 2–4 mag brighter in F336W than EHB starswith similar F275W–F336W color. HP-HB stars have bolomet-ric luminosities around 102–103 L� and have typical effectivetemperatures of 15,000–20,000 K, compared to L ∼ 30 L� andTeff = 104 K for HB stars (Bressan et al. 2012). The initialmasses of stars that become HP-HB is never more than 2 M�,corresponding to main-sequence (MS) lifetimes �0.6 Gyr.
Brown et al. (1998) (hereafter B98) obtained Hubble SpaceTelescope (HST) Faint Object Camera (FOC) data in the M31bulge, providing one of the most detailed discussions of thesedifferent types of UV-bright stars. However, these data only cov-ered a small area (14′′×14′′; see magenta box in Figure 2). Sinceradial gradients in age and metallicity are common in ellipticalsand the bulges of large spiral galaxies (e.g., Carollo et al. 1993;Davies et al. 1993; Trager et al. 2000; Peletier et al. 1990; Gorgaset al. 1990; Thomsen & Baum 1987; Wirth 1981), we should ex-pect radial gradients in the UV source population as well. Thesegradients can be used to constrain how age and metallicity affectthe stellar evolution leading to UV HP-HB stars.
M31 is an excellent target for the study of radial trends ingalaxy bulges. It hosts the most massive and metal-rich bulge(e.g., Ferguson & Davidsen 1993) that can be resolved intoindividual UV sources (as demonstrated by Bertola et al. 1995and B98), has a measured UVX (Burstein et al. 1988), and
18 This same effect can also arise in certain scenarios where stars burn theirenvelopes from the bottom up on the ZAHB, also leading to PE-AGBs.
estimated age–metallicity gradients derived from integrated lineindices (Saglia et al. 2010).
In this paper, we present observations and analysis of theUV component of the bulge of M31, the first data imaged in theUV by the Panchromatic Hubble Andromeda Treasury (PHAT)survey (Dalcanton et al. 2012). Section 2 presents our obser-vations and their comparison to those of B98. We investigatethe radial properties of the UV sources and present a first broadcomparison to new stellar models in Section 3. In Section 4, wediscuss our findings in light of the possible causes of the UVX.Closing remarks are presented in Section 5. All magnitudesquoted throughout this paper are in the VEGAMAG system.
2. THE DATA
2.1. PHAT Observations, Resolved StarPhotometry, Astrometry
As part of the PHAT program (GO-12058), we obtained UVimaging over a 12′×6.′5 region (2.6×1.4 kpc) around the centerof M31 with HST/WFC3-UVIS. The UVIS channel has a pixelsize 15 μm and plate scale of 0.04 arcsec pixel−1. Images weretaken in the F275W and F336W filters. Although the filterswere chosen primarily for the study of massive stars in the star-forming disk, they also allow an excellent sampling of the UV-bright sources across the bulge. The area covered for this studyis illustrated in Figure 2 and consists of a 3×6 grid of pointingswith a 180◦ orientation flip between the two 3 × 3 subgrids.The UVIS fields overlap by ∼45′′. Two exposures were taken ateach position in each filter, with a 1.′′9 dither between exposuresto cover the UVIS chip gap. Total exposure times are 1010 sand 1350 s in F275W and F336W , respectively. For completedetails of the PHAT observing strategy, see Dalcanton et al.(2012).
We performed point-spread function photometry on all UVISpipeline processed data (.flt files) in the region of interestusing the software package DOLPHOT.19 DOLPHOT is amodified version of HSTPhot (Dolphin 2000) that has beenupdated to include a specialized WFC3 module. Cosmic rays
19 http://americano.dolphinsim.com/dolphot
2

The Astrophysical Journal, 755:131 (13pp), 2012 August 20 Rosenfield et al.
Figure 2. Left: HST F336W (blue), F475W (green), and F814W (red) composite mosaic of M31 bulge. Elliptical contours show locations of isophotes used asanalysis region boundaries. The color scheme is used in other figures in this work and the median radius of each isophote bin is superimposed. Data within theinnermost (black dotted) region are excluded from the analysis (see Section 2.3). The magenta box shows the footprint of the B98 FOC imaging. Right: GALEXFUV (blue) and NUV (green) composite mosaic of M31 (Barmby et al. 2006). The red ellipse denotes the outermost (black) contour displayed in the left panel. Thefootprint of the M31 disk field plotted in Figure 5 is shown as a red rectangle in right panel.
(A color version of this figure is available in the online journal.)
were rejected from the raw images using the IDL packagelacosmic, which masks cosmic rays based on their very sharpedges. Furthermore, our sharpness cuts (see below) removedmost other cosmic rays from the photometry catalog.
We have merged the independent photometric catalog foreach of the 18 pointings into a single catalog for the entire bulge.We have removed duplicate sources in overlapping regions asfollows. First, given DOLPHOT’s source positions and initialastrometric solution, we searched the overlapping regions forpairs of stars that are close in celestial coordinates. We used asearch radius of 2 arcsec which is large enough to compensate forHST pointing errors. We then produced a histogram of (ΔR.A.,Δdecl.) vectors, which yielded a large but nearly uniformbackground of false matches plus a bump of correct matches atthe R.A., decl. offset between the two pointings. We measuredthese offsets for all pairs of pointings, then performed a least-squares fit to find the offsets and affine corrections (scales,rotations, and shears) between the pointings. By applying thesecorrections, we could put the sources detected in the separatepointings on a common local astrometric system. We thensearched for sources that are measured in multiple pointingsand merged their photometric measurements so that each starwas represented by a single catalog entry. The local astrometricsystem was then tied to a global astrometric system by firstaligning the WFC3/UVIS sources with our ACS/WFC sources,which are in turn aligned to a local reference catalog producedfrom Canada–France–Hawaii Telescope imaging, which is inturn tied to Two Micron All Sky Survey (2MASS; Skrutskieet al. 2006).
The photometry output was then filtered to only al-low objects classified as stars with DOLPHOT parameters
signal-to-noise > 4, sharp < 0.075, crowd < 0.5, andround < 1.5 in both filters (see Dolphin 2000 for a detaileddescription of each parameter).
To measure the completeness function, we performed 100,000artificial star tests (ASTs) for each observed field, and appliedthe above photometric cuts to the results. We find the data to be atleast 90% complete in each radial bin down to F275W = 24.3and F336W = 23.9. We limit our analysis to this innermost90% completeness limit to ensure that completeness is atleast 90% at all radii. Completeness magnitudes are listedin Table 1 for each radial bin. We made one further cut tolimit the contamination of hot Milky Way (MW) foregroundstars by removing bright red stars with F336W < 19 andF275W − F336W > 0.8 (see Section 2.3).
2.2. Comparison with FOC Data
As a consistency check, we compared our photometry to thatof B98, which carried out a comparable UV stellar populationanalysis, but over a much smaller area than presented here.B98’s imaging was taken by the FOC in its F175W andF275W filters, which are suited for the detection of stars witheffective temperatures up to Teff ∼ 40,000 K. To comparethese data sets, we began by correcting the FOC photometryto be 0.5 mag brighter, as recommended by Section 4.4.1 inBrown et al. (2000) to account for calibration revisions. Wemade no conversion between the FOC and WFC3 filter systems,beyond transforming the B98 data from its tabulated STMAGvalues into the VEGAMAG system. We then transformed theB98 catalog positions onto our astrometric system using linearshifts determined by matching bright sources (F275W < 22)
3

The Astrophysical Journal, 755:131 (13pp), 2012 August 20 Rosenfield et al.
Figure 3. Comparison of PHAT UV and FOC spatial overlap. Left: UV CMD for the B98 data set. The FOC sources with PHAT counterparts are shown in red (filledcircles), and FOC sources without PHAT counterparts are open circles. The PHAT data appear incomplete for the bluest sources with F175WFOC−F275WFOC < −0.75.Right: UV CMD for the PHAT data set extracted from the smaller FOC footprint of B98. Stars that have matched counterparts in the B98 catalog are plotted in red(filled circles), and unmatched PHAT sources are open circles. The completeness limit of the PHAT data is roughly 0.3 mag brighter in F275W than the B98 FOCobservations. The dashed lines correspond to B98 detection limit.
(A color version of this figure is available in the online journal.)
Table 1Photometry Measurements
Region Region Region Region Median Median Nstars 90% 90% Frac FracArea amin amax a a Comp. Comp. Cont. Cont.
(arcsec2) (arcsec) (arcsec) (arcsec) (pc) F275W F336W F275W F336W
0 76 0.0 4.3 2.1 8.2 . . . . . . . . . . . . . . .
1 600 4.3 13.6 8.9 34.0 280 24.3 23.9 0.27 0.222 3197 13.6 33.0 23.3 88.5 607 24.4 24.0 0.12 0.143 9816 33.0 63.0 48.0 182.3 856 24.5 24.4 0.04 0.094 34422 63.0 123.0 93.0 353.2 1187 24.5 24.7 0.02 0.035 85143 123.0 214.0 168.5 640.0 1404 24.6 25.1 0.01 0.01
Notes. Region area is of each logarithmically spaced isophote; a is the semimajor axis (see Section 2.3), given in minimum, maximum, and median. The median radiusis calculated directly from the isophotal boundary, assuming distance modulus (m − M)0 = 24.47 (McConnachie et al. 2005). Nstars are the numbers of UV-sources ineach annulus (detected in both filters and brighter than the 90% completeness magnitude of the innermost bin); 90% Comp., percent completeness magnitude in eachannulus. Frac Cont., fractional contamination at the 90% completeness magnitude of each annulus (see Section 3.4).
in the similar F275W passbands. Once aligned, we constructedcomparison catalogs with identical spatial coverage defined bythe 14′′ × 14′′ FOC field of view (see Figure 2) and excludeda circular 2.′′5 radius in the center to exclude the most crowdedregions. Finally, we performed cross-catalog matching using a∼2 pixel (∼0.07 arcsec) search radius, and accepted matcheswith F275W magnitude differences <0.7 mag. If multiplesources fulfilled the match criteria, we chose the match withthe smallest magnitude difference.
The results are presented in Figure 3. We were able to match65% of the B98 catalog to WFC3 sources in our catalog.A majority of the unmatched B98 sources fall in the fainter(F275WFOC > 24.5), bluer (F175WFOC − F275WFOC <−0.5) portion of the FOC CMD, showing the B98 data set’sslightly shorter wavelength sensitivity. Overall, however, thiscomparison showed that these two data sets probe comparablestellar populations, with the PHAT data set providing superiorspatial coverage, and the FOC sample providing a better probeof the very hottest stars.
2.3. Radial Binning of UV Sources and Possible Contaminants
We divided the data into bins to analyze the propertiesof the UV sources as a function of radius. These bins were
defined using logarithmically spaced isophotes, as measuredon a 3.6 μm image from Spitzer (Barmby et al. 2006). Theinnermost contour (semimajor axis distance of ∼4′′) was set toexclude the nuclear region, due to the relatively lower qualityof our photometry, while the outermost contour (214′′) was setto avoid major dust lanes and regions of recent star formationthat lie along the inner arms/ring in the disk. Table 1 lists theproperties of the bins, which are illustrated in Figure 2. TheirCMDs are shown in Figure 4.
Because metal-poor MS stars can occupy the same region ofCMD space as UV-bright stars, we needed to assess potentialeffects of contamination on our study. We examined the con-tamination from the star-forming disk of M31 by comparing theradial gradients of stars in two regions of the CMD. The firstCMD region was chosen to occupy the same color–magnitudespace as an MS-dominated disk field (galactocentric radius ∼6.5kpc), shown as a red rectangle in the right-hand image in Figure 2(22 < F336W < 23,−0.13 < F275W − F336W < 0.28).The second CMD region was selected to be too blue to havecontamination from MS stars (22 < F336W < 23,−0.35 <F275W − F336W < −0.50). The stellar gradients of theseregions showed a nearly constant ratio within uncertainties, in-dicating that MS contamination from the M31 bulge is small
4

The Astrophysical Journal, 755:131 (13pp), 2012 August 20 Rosenfield et al.
−0.5 0.0 0.5 1.0 1.5 2.0
F275W − F336W
19
20
21
22
23
24
25
26
F33
6W34 pc
−0.5 0.0 0.5 1.0 1.5 2.0
F275W − F336W
89 pc
−0.5 0.0 0.5 1.0 1.5 2.0
F275W − F336W
182 pc
−0.5 0.0 0.5 1.0 1.5 2.0
F275W − F336W
353 pc
−0.5 0.0 0.5 1.0 1.5 2.0
F275W − F336W
640 pc
Figure 4. UV color–magnitude diagrams of each analysis region. Dashed lines mark the 90% completeness limits and solid lines mark the 50% completeness limits(see Section 2). We limit out analysis to sources brighter than the 90% completeness limits in the innermost (green) region. The median projected radius of eachdistance-corrected logarithmically spaced isophote is labeled in the upper left. The color scheme follows Figure 2.
(A color version of this figure is available in the online journal.)
Table 2Radial Gradients
Region B/D F3.6 μm Integrated Flux Resolved Flux HP-HB Resolved Flux Surface Density
F275W F336W F275W F336W F275W F336W HP-HB P-AGB(Jy) (arcsec−2) (arcsec−2)
0 40.7 0.27 . . . . . . . . . . . . . . . . . . . . . . . .
1 40.7 1.16 25.26 98.33 0.96 0.75 0.46 0.39 0.383 0.0822 33.5 3.74 89.77 351.08 2.23 1.85 1.01 0.84 0.150 0.0403 20.7 6.77 181.40 681.08 4.01 3.45 1.51 1.23 0.062 0.0254 12.0 12.99 373.58 1315.45 5.70 5.12 2.14 1.74 0.024 0.0105 7.0 16.71 608.05 1802.78 6.96 6.73 2.52 2.03 0.011 0.005
Notes. First two columns are the same as in Table 1, followed by B/D, the bulge-to-disk ratio of luminosity within each annulus (K. M. Howley et al., in preparation);F3.6 μm, region integrated flux within each annulus obtained from Spitzer/IRAC 3.6 μm imaging (Barmby et al. 2006). Next are the integrated and resolved fluxmeasurements in each UVIS filter, followed by the resolved flux of HP-HB stars. All UVIS fluxes are in units of 10−15 erg cm−2 s−1 Å−1. Finally, the surface densitiesof the resolved UV-bright populations are tabulated (cf. Figure 9).
across the analysis region. Furthermore, bulge–disk decompo-sition suggest that while the fraction of disk light increasesfive-fold between the inner and outer annuli, the disk never con-tributes more than 12.5%, even in the outer most analysis region(K. M. Howley et al., in preparation).
There is also a possibility that some of the redder stars(F275W−F336W � 0.8; see Figure 4) are hot MW foregroundstars. To estimate the MW contamination we have made TRILE-GAL (Girardi et al. 2005) simulations of the MW for the field ofview contained in the entire analysis region. Most of the simu-lated foreground stars are redder than F275W −F336W = 0.8and brighter than F336W = 19. We excluded 69 sourcesbrighter and redder than these limits from our analysis. Bluerand fainter than these limits, our simulations suggest a negligiblecontribution (∼40 stars) of foreground stars with F336W > 19.
2.4. Integrated Light and Ancillary Imaging
As a way of assessing bulk properties of the defined analysisregions, we calculated total integrated fluxes for each analysisregion from the F275W and F336W imaging, as well asfrom the Spitzer/IRAC 3.6 μm image. For the HST imaging,we first assembled an aligned mosaic of the UV imaging bymeans of the Multidrizzle task within PyRAF (Koekemoer et al.2002) using the astrometry solution obtained from the stellarcatalogs and with sky-subtraction disabled. Once we obtainedthis combined mosaic, we performed aperture photometry of theregions on the combined image. To estimate the sky level for
the F275W and F336W mosaics, we performed photometry onouter disk images (galactocentric radius of ∼15 kpc) obtainedwith identical observing parameters as part of the PHAT surveyand confirmed that the true sky background level is ∼0 at thesevery blue wavelengths. As such, there was no need for skysubtraction as part of our aperture photometry. For the Spitzerimage, we used available mosaics (see Barmby et al. 2006 fordetails) and similarly performed aperture photometry for theanalysis regions.
Table 2 includes the surface density of HP-HB and P-AGBstars (see Section 3.3 for a discussion on how the populationsare separated), their resolved UV flux, the total resolved UVflux, and total integrated UV flux in each filter, in each annulus.Also tabulated is the total integrated flux within each annulusobtained from Spitzer/IRAC 3.6 μm imaging (F3.6 μm; Barmbyet al. 2006) and the bulge-to-disk ratio (B/D) integrated withinthe radial bin using a two-dimensional, two-component modelof an exponential disk and Sersic bulge (K. M. Howley et al., inpreparation).
3. ANALYSIS
3.1. Radial Color–Magnitude Diagrams
Figure 5 shows a UV CMD of the inner two radial bins(15–120 pc; left panels) and a disk field (right panels, redrectangle in Figure 2) composed of the entire Brick 9 (galac-tocentric radius ∼6.5 kpc) from the larger PHAT data set.We superimposed stellar evolutionary tracks converted to
5
The Astrophysical Journal, 755:131 (13pp), 2012 August 20 Rosenfield et al.
−0.4 0.0 0.4 0.8 1.2
F275W − F336W
18
19
20
21
22
23
24
25
F33
6W
−0.4 0.0 0.4 0.8 1.2
F275W − F336W
18
19
20
21
22
23
24
25
F33
6WBulge Field (< 120 pc) Disk Field (∼ 6.5 kpc)
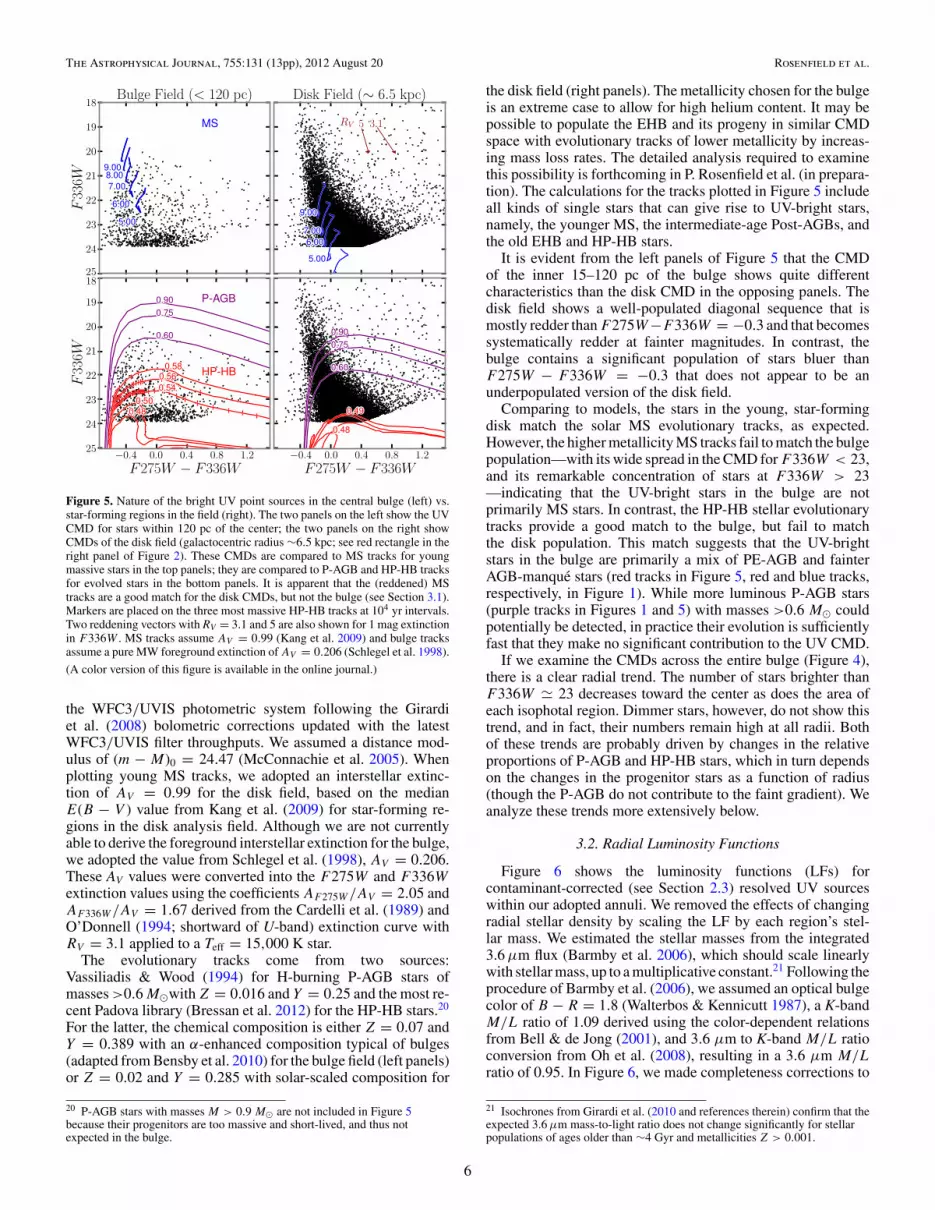
Figure 5. Nature of the bright UV point sources in the central bulge (left) vs.star-forming regions in the field (right). The two panels on the left show the UVCMD for stars within 120 pc of the center; the two panels on the right showCMDs of the disk field (galactocentric radius ∼6.5 kpc; see red rectangle in theright panel of Figure 2). These CMDs are compared to MS tracks for youngmassive stars in the top panels; they are compared to P-AGB and HP-HB tracksfor evolved stars in the bottom panels. It is apparent that the (reddened) MStracks are a good match for the disk CMDs, but not the bulge (see Section 3.1).Markers are placed on the three most massive HP-HB tracks at 104 yr intervals.Two reddening vectors with RV = 3.1 and 5 are also shown for 1 mag extinctionin F336W . MS tracks assume AV = 0.99 (Kang et al. 2009) and bulge tracksassume a pure MW foreground extinction of AV = 0.206 (Schlegel et al. 1998).
(A color version of this figure is available in the online journal.)
the WFC3/UVIS photometric system following the Girardiet al. (2008) bolometric corrections updated with the latestWFC3/UVIS filter throughputs. We assumed a distance mod-ulus of (m − M)0 = 24.47 (McConnachie et al. 2005). Whenplotting young MS tracks, we adopted an interstellar extinc-tion of AV = 0.99 for the disk field, based on the medianE(B − V ) value from Kang et al. (2009) for star-forming re-gions in the disk analysis field. Although we are not currentlyable to derive the foreground interstellar extinction for the bulge,we adopted the value from Schlegel et al. (1998), AV = 0.206.These AV values were converted into the F275W and F336Wextinction values using the coefficients AF275W/AV = 2.05 andAF336W/AV = 1.67 derived from the Cardelli et al. (1989) andO’Donnell (1994; shortward of U-band) extinction curve withRV = 3.1 applied to a Teff = 15,000 K star.
The evolutionary tracks come from two sources:Vassiliadis & Wood (1994) for H-burning P-AGB stars ofmasses >0.6 M�with Z = 0.016 and Y = 0.25 and the most re-cent Padova library (Bressan et al. 2012) for the HP-HB stars.20
For the latter, the chemical composition is either Z = 0.07 andY = 0.389 with an α-enhanced composition typical of bulges(adapted from Bensby et al. 2010) for the bulge field (left panels)or Z = 0.02 and Y = 0.285 with solar-scaled composition for
20 P-AGB stars with masses M > 0.9 M� are not included in Figure 5because their progenitors are too massive and short-lived, and thus notexpected in the bulge.
the disk field (right panels). The metallicity chosen for the bulgeis an extreme case to allow for high helium content. It may bepossible to populate the EHB and its progeny in similar CMDspace with evolutionary tracks of lower metallicity by increas-ing mass loss rates. The detailed analysis required to examinethis possibility is forthcoming in P. Rosenfield et al. (in prepara-tion). The calculations for the tracks plotted in Figure 5 includeall kinds of single stars that can give rise to UV-bright stars,namely, the younger MS, the intermediate-age Post-AGBs, andthe old EHB and HP-HB stars.
It is evident from the left panels of Figure 5 that the CMDof the inner 15–120 pc of the bulge shows quite differentcharacteristics than the disk CMD in the opposing panels. Thedisk field shows a well-populated diagonal sequence that ismostly redder than F275W−F336W = −0.3 and that becomessystematically redder at fainter magnitudes. In contrast, thebulge contains a significant population of stars bluer thanF275W − F336W = −0.3 that does not appear to be anunderpopulated version of the disk field.
Comparing to models, the stars in the young, star-formingdisk match the solar MS evolutionary tracks, as expected.However, the higher metallicity MS tracks fail to match the bulgepopulation—with its wide spread in the CMD for F336W < 23,and its remarkable concentration of stars at F336W > 23—indicating that the UV-bright stars in the bulge are notprimarily MS stars. In contrast, the HP-HB stellar evolutionarytracks provide a good match to the bulge, but fail to matchthe disk population. This match suggests that the UV-brightstars in the bulge are primarily a mix of PE-AGB and fainterAGB-manque stars (red tracks in Figure 5, red and blue tracks,respectively, in Figure 1). While more luminous P-AGB stars(purple tracks in Figures 1 and 5) with masses >0.6 M� couldpotentially be detected, in practice their evolution is sufficientlyfast that they make no significant contribution to the UV CMD.
If we examine the CMDs across the entire bulge (Figure 4),there is a clear radial trend. The number of stars brighter thanF336W � 23 decreases toward the center as does the area ofeach isophotal region. Dimmer stars, however, do not show thistrend, and in fact, their numbers remain high at all radii. Bothof these trends are probably driven by changes in the relativeproportions of P-AGB and HP-HB stars, which in turn dependson the changes in the progenitor stars as a function of radius(though the P-AGB do not contribute to the faint gradient). Weanalyze these trends more extensively below.
3.2. Radial Luminosity Functions
Figure 6 shows the luminosity functions (LFs) forcontaminant-corrected (see Section 2.3) resolved UV sourceswithin our adopted annuli. We removed the effects of changingradial stellar density by scaling the LF by each region’s stel-lar mass. We estimated the stellar masses from the integrated3.6 μm flux (Barmby et al. 2006), which should scale linearlywith stellar mass, up to a multiplicative constant.21 Following theprocedure of Barmby et al. (2006), we assumed an optical bulgecolor of B − R = 1.8 (Walterbos & Kennicutt 1987), a K-bandM/L ratio of 1.09 derived using the color-dependent relationsfrom Bell & de Jong (2001), and 3.6 μm to K-band M/L ratioconversion from Oh et al. (2008), resulting in a 3.6 μm M/Lratio of 0.95. In Figure 6, we made completeness corrections to
21 Isochrones from Girardi et al. (2010 and references therein) confirm that theexpected 3.6 μm mass-to-light ratio does not change significantly for stellarpopulations of ages older than ∼4 Gyr and metallicities Z > 0.001.
6

The Astrophysical Journal, 755:131 (13pp), 2012 August 20 Rosenfield et al.
1920212223242526
F275W
0
1
2
3
4
5
6
Num
ber
/107
M
1920212223242526
F336W
0
1
2
3
4
5
6
Figure 6. Number of resolved HP-HB stars (left panel: F275W ; right panel: F336W ) as a function of magnitude, scaled by each region’s stellar mass found by the3.6 μm M/L ratio (see Section 3.2), in bins of 0.2 mag. The observed LFs are corrected for completeness and shown with thin lines fainter than the 90% completenessmagnitude in the respective annulus (i.e., a correction by more than a factor of 1.1). The color scheme is the same as Figure 2, with green indicating the innermost bin.Long-lived HP-HB stars are shown in model LF (dotted) evolved from the ZAHB with a flat distribution of mass below 1.0 M�, and the Z = 0.07 Y = 0.389 tracks(cf. Figure 5). The model is normalized to the innermost region’s peak LF in F275W . The overabundance of stars with F275W > 23 in the innermost regions ofM31 are associated with HP-HBs. The bright LF tails are due to a seemingly flat distribution of P-AGB stars (see Section 3.5). The increase in the model LF at faintmagnitudes (�24.5) is due to numerous HB stars, of which the hottest likely dominate the UVX.
(A color version of this figure is available in the online journal.)
see if each LF peak was not simply a manifestation of incom-pleteness of the data. To do so, we removed our magnitude limitcriteria (see Section 2) and divided the sources of good qualitydetected in both filters by the completeness fraction found fromthe ASTs in 0.2 mag bins.
The LFs look similar at bright magnitudes for all radii, butshow significant radial variations at fainter magnitudes. First,we see a dramatic trend at faint magnitudes where faint HP-HBstars (F275W, F336W > 23) become increasingly abundantin the inner bulge, relative to the overall stellar mass. Second, wesee a weaker trend for stars with magnitudes between 21 and 23,which also show increasing contributions toward the inner bulge.These are likely P-AGB stars of a continuous distribution ofmasses less than ∼0.6 M�, suggesting that the outer regions areunderabundant in P-AGB stars.
To help interpret these results, we overlay a synthetic LF(dotted in Figure 6) made of low-mass Z = 0.07, Y =0.389 tracks from the Padova stellar evolution library (Bressanet al. 2012) evolved from the ZAHB, assuming that the massdistribution of stars along the ZAHB is flat for all ZAHB massesbelow 1.0 M�. This approximation is reasonable since the rangeof ZAHB masses that actually contributes to the LF is verynarrow (∼0.45–0.58 M�).
The simulated helium-burning LF reproduces the shape andcolor of the bump in the LF fainter than 22.5 mag, especially forthe inner M31 radial bin. This bump can therefore be interpretedas being made by the HP-HBs. Deeper observations would likelyreveal a much larger bump in the LF due to the EHB.
In addition, the flux density from the detected stars does notvary with magnitude except for the inner region. Essentially allstars between 20 and 24 in both F275W,F336W contributeequally to the flux density with the exception perhaps ofregion 1, where the contribution tends to increase toward faintermagnitudes.
3.3. Luminosity Contribution of HP-HB and P-AGB
Although P-AGB and HP-HB stars are individually bright inour UV bandpasses, together they only make up a small fraction
of the integrated UV light (<2% in F275W ). A vast majorityof the UV light must be emitted by fainter populations, such asEHB stars that remain undetected in our resolved photometry.Theoretical calculations (P. Rosenfield et al., in preparation) thatmatch the resolved star populations predict a flux contributionfrom faint unresolved stars that is comparable to measured fluxin unresolved stars.
Since the P-AGB and HP-HB stars we detect are a very smallfraction of the UV light (see Table 2), the total-integrated UVflux must be coming from some other population of fainter, butmore numerous, stars. Our model LF suggests a large populationof EHB stars fainter than mag ∼25. These stars are likely themain source of the UVX (cf. B98). These stars could be detectedwith deeper UVIS observations and with bluer filters, providedthat the crowding limit was sufficiently faint to detect thesenumerous stars.
To further quantify the radial gradients of stellar populations,we divided UV-bright stars into HP-HB and P-AGB stars.We separated the HP-HB stars from P-AGB stars using thehighest mass evolutionary track that produces an HP-HB starat Z = 0.07 and Y = 0.389 (M = 0.58 M�; see the brightestred track in the bottom left panel of Figure 5) for the Padovastellar evolution library. More massive evolutionary tracks thanthis critical mass produce stars with enough envelope mass tobecome canonical AGB stars; this behavior has little metallicitydependence and does not appear to change with He-abundancefrom 0.26 < Y < 0.46 (Bressan et al. 2012). We have classifiedstars brighter than this track as P-AGB. As a faint limit of UV-bright stars, we use our innermost region 90% completenessmagnitude (see Section 2).
The left panel of Figure 7 shows the surface brightness profilesof the HP-HB, P-AGB, and integrated UV light. In both filters,the surface brightness increases toward the center for bothHP-HB and P-AGB. The right panel of Figure 7 shows the ratioof resolved UV stars and indicates that the flux from HP-HBstars increases with respect to the P-AGB.
A best-fit Sersic profile from Courteau et al. (2011) is over-plotted on the left panel of Figure 7, with arbitrary normalizationin surface brightness. Courteau et al. (2011) fit UVBRI, 2MASS,
7

The Astrophysical Journal, 755:131 (13pp), 2012 August 20 Rosenfield et al.
Figure 7. Radial distribution of UV sources. Left panel: surface brightness as a function of radius of F275W (solid, black), F336W (solid, red), HP-HB (dotted),and P-AGB(dashed). The best-fit Sersic profile from Courteau et al. (2011) is overplotted with μe shifted to F336W = 23 (gray). Right panel: resolved flux ratio ofHP-HB to P-AGB stars in each filter for each annulus. Shaded regions show Poisson uncertainty in number counts. In both panels, red denotes the F336W filter andblack denotes the F275W filter. The characteristic metallicity as a function of radius reported by Saglia et al. (2010) is indicated on the top axes. Both the HP-HBand P-AGB populations increase toward the nucleus of M31, but the HP-HB stars show a dramatic increase in flux with respect to the P-AGB stars in the innermostregions.
(A color version of this figure is available in the online journal.)
20222426mag
102
103
104
105
#
20222426mag
20222426mag
20222426mag
20222426mag
F275WF336WF275WF336W
Figure 8. Input (black) and recovered (blue: F275W ; green: F336W ) luminosity functions in each of the radial bins. Close to the detection limit, blending causes anartificial upturn in the luminosity function. The effect only becomes appreciable below our adopted magnitude cuts (dashed lines) and is never above 27% (see Table 1for exact values in each radial bin).
(A color version of this figure is available in the online journal.)
and Spitzer IRAC surface brightness profiles of M31 to find theSersic bulge index of n = 2.2 ± 0.3 and effective radius ofRe = 1.0 ± 0.2 kpc. We did a simplistic least-squares fit toa Sersic profile using the surface brightness of our total inte-grated light in F336W imagery to find μeF336W
= 21.7 mag/′′2,nF336W = 2.4, and ReF336W
= 2.1 kpc. These numbers are con-sistent with the steeper scaled gradient in UV sources.
3.4. Possible Contributions from Stellar Blends
The bulge of M31 has a strong surface brightness gradientin the UV, which must be due to a dramatic increase in thenumber density of stars toward the center of the galaxy. As weshow in Table 2, the majority of these stars are unresolved inour observations, but they could possibly lead to the detectionof spurious sources, if sufficient numbers of the fainter starswere blended together to rise above our detection threshold.These spurious sources would dominate at fainter magnitudesand would be expected to show a strong radial gradient due tothe increased crowding in the center, and thus could potentiallymimic our observed gradient. While we have minimized the
likelihood of this contamination by excluding the most crowdedregions of the bulge and by choosing a relatively bright limitingmagnitude for our analysis (F336W = 23.9, F275W = 24.3),it is still worthwhile to confirm that this issue is not affectingour conclusions.
We have ruled out this possibility by considering two differentcases. For the first, we assume that the LF observed at brightmagnitudes continues as a power-law to faint magnitudes. Thisassumption puts large numbers of stars just below the detectionthreshold, where the chances are maximized that a star willblend with an undetected source and rise above the detectionthreshold. We then simulate the observed LF as follows. In aseries of magnitude bins, we randomly select stars from the samecatalog of artificial stars used to calculate our completenesslimits. The number of stars drawn in each magnitude bin isdetermined by our assumed power-law LF. We then use therecovered properties of the artificial stars (i.e., the magnitudesthe stars were recovered with, and if they were detected at all)to generate the LF that would be observed. Figure 8 showsthe input and recovered LF in each of the radial bins, plottedas black and colored lines, respectively. As expected, blending
8

The Astrophysical Journal, 755:131 (13pp), 2012 August 20 Rosenfield et al.
leads there to be an artificial upturn in the luminosity function asone approaches the detection limit, with the effect being moredramatic in the most crowded inner annulus. However, theseeffects only become appreciable below our adopted magnitudecuts (vertical dashed lines). At our adopted analysis limit ofF336W = 23.9 and F275W = 24.3, the observed LF never hasmore than 27% contamination from blends (see Table 1 for exactcontamination levels in each bin). Given that the LF is observedto vary by a factor of 100, it is unlikely that the observedradial trend is produced by radially dependent blending from apower-law LF.
We have also considered a second, somewhat less likelysource of blends. It is believed that the majority of the unresolvedflux in our images comes not from sources just below ourdetection threshold, but from a large population of long-livedEHB stars (e.g., B98) that are more than a magnitude fainterthan our detection threshold. If so, these sources must havea very high surface density, which could sometimes lead tomultiple EHB stars blending together within a single resolutionelement. Assuming a typical EHB magnitude of F336W = 26.5(Bressan et al. 2012), and a surface brightness of ∼18 magarcsec−2, we can calculate the mean number of EHB stars persquare arcsecond. Adopting this mean, we can then calculate thePoisson probability that there will be a sufficiently large upwardfluctuation in the local density (within the HST resolutionelement) to produce a spurious source at F336W = 24. We thenmultiply by the number of independent resolution elements tocalculate the contamination in the inner most annulus. When wedo so, we find that we expect no more than 0.1 spurious starsbrightward of F336W = 24, in contrast to the 164 stars foundbetween 23.5 and 24 mag in region 1. We therefore rule outblends from EHB stars as a significant source of contaminantsto the observed LF.
These two tests indicate that it is highly unlikely that falseblended sources are significant contaminants brighter than themagnitude limit we adopted for our analysis.
3.5. Comparison to Other Evolving Populations
Figure 7 establishes that the resolved flux of HP-HB increaseswith respect to the P-AGB sources toward the nucleus. We nowlook in depth at the radial variations of these populations andexpand the discussion to include other stellar populations.
The HP-HB sources discussed here are not the first populationof astrophysical sources to show enhancement toward the innerregions of M31’s bulge. In their study of Chandra X-ray pointsources, Voss & Gilfanov (2007b) show an increase in the low-mass X-ray binary (LMXB) population at small radii within thebulge of M31. These authors conclude that this enhancementcan be accounted for by a population of dynamically producedLMXBs, which explains why the distribution’s profile followsthe square of the stellar density (ρ2
∗).For comparison, we binned the X-ray sources from the Voss
& Gilfanov (2007a) catalog according to our analysis regions,excluding those sources that are either identified as non-LMXBsor that are associated with globular clusters (as their origin isdifferent than that of unclustered LMXBs). The resulting num-ber density distributions for the LMXBs are shown in Figure 9.We find the intriguing result that the excess in UV-bright sourcesis consistent with the power-law index of the LMXBs.
We have also evaluated the radial trends in the density ofplanetary nebulae (PNe), as these stars are likely descendantsfrom the P-AGB populations and might be expected to showa similar radial trend. We use the Merrett et al. (2006) catalog
Figure 9. Surface density of UV-bright sources (blue: HP-HB; red: P-AGB),LMXBs (green; Voss & Gilfanov 2007b), binned according to analysis regionwith Poisson uncertainties. The 3.6 μm luminosity (black dashed) is plottedin different units and follows the right axis. The characteristic metallicity as afunction of radius reported by Saglia et al. (2010) is indicated on the top axis.The least-squares fit power-law index of each stellar component is noted aboveits profile with its uncertainty in the fitting. HP-HB (blue) and P-AGB (red) starsfollow a different surface density profile than that of the 3.6 μm light. However,the HP-HB stars seem to follow a profile consistent with the LMXBs.
(A color version of this figure is available in the online journal.)
of 2615 PNe in M31 detected by 5007 Å emission and findthat the distribution of PNe across the bulge is roughly constantwith radius, and does not follow the trends of HP-HB, P-AGB,or LMXBs. However, the Merrett catalog is not expected to becomplete in the innermost regions. If the true radial distributionof PNe does follow the gradient in the P-AGB population, thenthe inner regions must be incomplete by a factor of ∼5.5. Wediscuss the implications of these results in Section 4 below.
3.6. Stellar Population Lifetimes Inferred from Observations
Now that we have detected gradients in HP-HB stars, it isuseful to make a rough estimate of what fraction of stars are ex-pected to become UV bright through this channel as a functionof radius. Renzini & Buzzoni (1986) provided a powerful toolto relate the number of evolved stars in a population to their life-times, with only a few conservative assumptions. Using the factthat most fuel is consumed by stars fusing hydrogen or helium,and that the initial mass function (IMF) is not too steep, they re-late the number of stars, Nj; in any evolved state, j, to the averageamount of time (in years) the star spends in that state 〈tj 〉:
Nj = LT B(t)〈tj 〉, (1)
where LT is the total bolometric luminosity of the stellar popu-lation in L� and B(t) is the rate of stars leaving the MS in unitsof L�−1 yr−1.
Equation (1) is strictly valid only for a stellar populationof single age and metallicity that happens to contain HP-HBstars. Any subregion of the M31 bulge, instead, is likely tocontain a range of populations, with some spread in their ages
9

The Astrophysical Journal, 755:131 (13pp), 2012 August 20 Rosenfield et al.
and metallicities. Since just a fraction f of these populationswill likely produce HP-HB stars (e.g., the oldest, most metal-rich, and/or of highest helium content), Equation (1) can beconveniently re-written as
f = NHP−HB
LT B(t)〈tHP−HB〉 , (2)
where f ≡ NHP−HB,obs/NHP−HB,pred. This equation can besolved for f, allowing us to solve for the fraction of evolvingstars that pass through the HP-HB channel.
We have previously measured NHP−HB,obs, as listed in Table 2.We also adopt a value of B(t) = 2.2×10⁻¹¹L�−1 yr−1, derivedfrom solar metallicity evolutionary models. This number shouldbe accurate to 10% for populations 10 Gyr and older (Renzini& Buzzoni 1986). For the average time in the observed state,tHP−HB, we calculated the mean CMD crossing time of therelevant Padova stellar evolution tracks shown in Figure 5 tofind 〈tHP−HB〉 ∼ 2 × 10⁶ yr for the HP-HB.
To calculate LT , we convert the 3.6 μm flux (corrected toexclude any disk contamination using B/D; see Table 2)to bolometric luminosity. As mentioned above, 3.6 μm fluxtraces the stellar population of the bulge, modulo a bolometriccorrection:
LT = L3.6 μm × Lbol
L3.6μm. (3)
We calculated the bolometric correction by simulating theintegrated light of simple stellar populations over a range ofages and metallicities using isochrones from Girardi et al. (2010and references therein). As mentioned in passing in Section 3.2,isochrones from Girardi et al. (2010) confirm that the expected3.6 μm flux of star light does not change significantly forstellar populations of ages older than ∼4 Gyr and metallicitiesZ > 0.001.
With the bolometric correction, BC = 2.60 and adoptingM�,bol = 4.77 and M�,3.6 μm = 3.24 (Oh et al. 2008), weconverted L3.6 μm to LT ,
Lbol
L3.6 μm= 10−0.4(M�,bol−M�,3.6 μm−BC) = 2.7. (4)
Combining Equations (2) and (3), and substituting the valuesabove for B(t) and 〈tHP−HB〉, we solve for f,
f = 1.7 × 10³ NHP−HB,obs
L3.6 μm. (5)
Substituting in numbers from Table 2, we plot f as a functionof radius (Figure 10). We find that the fraction of stars thatgo through the HP-HB channel is small, but that the fractionincreases systematically toward the center of M31. Figure 10shows that nearly 3% of the MS turnoff (MSTO) stars in theinnermost regions of M31 become HP-HB stars. This impliesthat 97% of the MSTO stars become canonical P-AGB stars. Incontrast, in the outermost regions of the bulge, fewer than 1%of MSTO stars become HP-HB stars. Note that these ∼3% ofHP-HB stars appearing as bright resolved UV sources belong tothe same population of the fainter EHB stars that, according toevolutionary models, do make a large fraction of the unresolvedUV light (see Section 3.3).
The fraction of stars that go though the HP-HB channel in theinnermost regions is consistent with what is found in M32 byBrown et al. (2008). Our findings are also consistent with Brown
Figure 10. Population variations in the central ∼0.5 kpc of M31. Shown (solid,blue) is the inferred fraction of evolving MS stars that must go through the HP-HB channel to explain the HP-HB number count profile, given the integratedlight properties. This fraction rises by about a factor of three toward the center.Shaded regions denote Poisson uncertainty. The Lick-Index-based metallicityand its dispersion derived by Saglia et al. (2010) is shown on the right axis(dotted, black).
(A color version of this figure is available in the online journal.)
et al. (1997), who demonstrated that galaxies with moderateUVX have about 2% of the MS population passing throughthe EHB.
This test has shown that, even in the center of M31, veryfew stars from the bulge population are necessary to becomeHP-HB and explain the UV-bright stars we detect. What causesan RGB or EHB star to eventually become an HP-HB star onlyaffects a small percentage of the underlying stellar population,but that small likelihood varies strongly with radius, for reasonswe discuss below.
4. DISCUSSION
Our LFs and CMDs allow us to confirm B98’s claim thatHP-HB stars are the likely evolutionary channel for the pro-duction of most of the UV-bright stars in the M31 bulge. How-ever, ∼20% of brighter UV stars in the inner two radial bins(15–120 pc) are compatible with P-AGB tracks (see Figure 9),expected for stars with negligible mass loss on the RGB.
We detect clear gradients in the number and types ofUV sources. We see a steep gradient at faint magnitudes(F275W, F336W � 23) that likely arises from an increasein the HP-HB population toward the center of the bulge. Thesefaint stars contribute about 60% of the resolved flux of the innertwo radial bins in both F275W and F336W (see Table 2) androughly 2% of evolving MS stars pass though this long-livedHP-HB channel before becoming white dwarfs (see Figure 10),the remainder pass though the short-lived P-AGB. However, thedetected stars only make up ∼2% of the total flux in the F275Wfilter indicating that we have not yet detected the stars directlyresponsible for the UVX. These missing stars are likely to befaint EHB stars, as suggested by e.g., B98.
We now outline possible causes of the detected radial gradi-ents of HP-HB stars.
4.1. Gradients in Stellar Ages
The UVX is expected to increase with time for an aging stellarpopulation. As a population ages, the mass of the MSTO will
10

The Astrophysical Journal, 755:131 (13pp), 2012 August 20 Rosenfield et al.
decrease, so for a fixed RGB mass loss rate, the older (i.e., lessmassive) stars will have smaller post-RGB envelope masses andthus will be hotter HBs. As a result, the UVX has been proposedas a possible age indicator for the centers of elliptical galaxies(Greggio & Renzini 1999; Bressan et al. 1994; Yi et al. 1999).Bressan et al. (1994) found that the EHB and AGB-manquestars power the UV flux of a high-mass galaxy at ages olderthan ∼7.6 × 10⁹ yr. A negative age gradient across the M31bulge could therefore potentially explain the gradient in HP-HBstars we measure.
There is, however, no obvious evidence for an age gradientin the bulge of M31. Saglia et al. (2010) constrained thestellar populations in the inner bulge of M31 using spline-interpolated Lick index models with α-element overabundances(Thomas et al. 2003), assuming simple stellar population models(Maraston 1998, 2005) and a Kroupa (2001) IMF. They foundthe age of the bulge (over the regions we analyze) to be consistentwith the age of the universe, with no significant radial gradient.If anything, the mean ages from Saglia et al. (2010) suggest apositive age gradient with radius (i.e., older stars at larger radii),which is in the opposite sense of what is needed to produce theobserved HP-HB gradient.
Another age effect is expected if the UVX is not fromEHB stars and their progeny at all, but is instead from binarystars. This is an attractive explanation for why the surfacedensity profile of LMXBs matches that of the HP-HB starsin Figure 9. Studies by Han and others (Han et al. 2002, 2003,2007 and references therein) present detailed synthetic spectralenergy distributions that include three binary star evolutionarychannels: common envelope, Roche lobe overflow, and mergingHe white dwarfs. Over time, stars in these models will powerthe UVX. However, if this is the case, all old populationsshould have a UVX, which they do not (e.g., O’Connell 1999).Alternatively, the lack of a central peak of PNe may suggestan alternate channel of P-AGB evolution in the central regions,such as AGB-manque or PE-AGB, which in turn produces acentral peak in the HP-HB stars. These conclusions should beconsidered tentative in light of the likely incompleteness of theMerrett et al. (2006) PN catalogs in this region of M31.
4.2. Galactic Metallicity Gradient
Negative radial metallicity gradients are common featuresof ellipticals and large spiral bulges (e.g., Roediger et al.2011; Jablonka et al. 2007; Papovich et al. 2001; Kobayashi& Arimoto 1999; Davies et al. 1993) with typical values ofΔ[Fe/H]/Δ log(r) ∼ −0.3 for ellipticals. Metal-rich stars arelinked to more mass loss on the RGB (Greggio & Renzini 1990)which result in smaller HB envelopes and thus hotter stars andmore UV flux. Thus, metallicity gradients may influence thefraction of stars that enter the EHB phase at each radius.
Support for the importance of RGB mass loss in producingthe UVX population comes from Kalirai et al. (2007), whofound that the white dwarfs of the metal-rich old open clusterNGC 6791 ([Fe/H] ∼ +0.4, t = 8 Gyr) are undermassive due tothe enhanced mass loss of their progenitors. The same clusterhosts a significant population of very hot helium burning stars,which, although only 30% of all HB stars, would be sufficient toproduce a UVX. Dorman et al. (1995) and Buzzoni & Gonzalez-Lopezlira (2008) found with synthetic population models thatonly ∼20% of HB stars need to be hot to explain the UV upturn,in agreement with the NGC 6791 observations.
The small fraction of evolving MS stars that go though theHP-HB channel could be explained by a galactic metallicity
Figure 11. Strong anti-correlation as a function of radius between GALEX color(blue; Thilker et al. 2005) and the Lick-Index-based metallicity and dispersionderived by Saglia et al. (2010; right axis, black). There is a sharp increase inmetallicity where the FUV−NUV color becomes extremely blue. This anti-correlation may be evidence of the galactic metallicity gradient driving theradial variation in the numbers of UV-bright stars detected. The extreme bluecolor further shows that the UV-bright populations are strongly confined to theinner ∼300 pc (∼75′′) of the M31 bulge.
(A color version of this figure is available in the online journal.)
gradient if the HP-HB are indeed the result of extreme massloss, and the mass loss depends on metallicity. Saglia et al.(2010) found that the metallicity in the bulge of M31 decreasesby 0.2 dex every decade in radius, from [Z/H] ∼0.4 in thecenter to solar at ∼100′′ (see Figure 10). In the inner regionsof M31, it is reasonable to assume that the bulk of the starswill have metallicities that sample the metallicities reported bySaglia et al. (2010), but that there will also be a tail to highmetallicities. If metallicity variations drive the gradient in HP-HB stars, then the HP-HB population must result from this highmetallicity tail, to avoid more than ∼3% of stars passing throughthe HP-HB channel (i.e., Figure 10).
Ancillary support for metallicity gradient being the driver ofUV-bright star production can be found in Figure 11, where weplot Galaxy Evolution Explorer (GALEX) FUV−NUV versusradius, along with the metallicities derived by Saglia et al.(2010). The FUV−NUV color should track the relative strengthof the EHB (see GALEX globular cluster CMDs in Schiavonet al. 2012). It is clear that there is a sharp upturn in [Z/H] exactlywhere the FUV−NUV colors become extremely blue. This anti-correlation suggests that the radial variation in the numbers ofUV-bright stars follows the galactic metallicity gradient.
An alternative metallicity dependent explanation for the UVXis through production of low metallicity (Z < 0.008) MSTOstars of intermediate age, which emit a large amount of theirflux in the NUV. If these stars were responsible for the UVflux we detect, we would expect the UV flux to fall towardthe center, due to the increased metallicity. In fact, we see theopposite gradient, the UV flux increases toward the center (seeB98 for a similar discussion). This mechanism does not help toexplain the changing fraction of HP-HB stars.
4.3. Elemental Abundance Gradients
Carter et al. (2011) found that the UVX depends more stronglyon [α/Fe] than [Fe/H]. An abundance gradient in [α/Fe] couldbe expected if high amounts of star formation and supernovae
11

The Astrophysical Journal, 755:131 (13pp), 2012 August 20 Rosenfield et al.
increase the α-element enrichment of stars in the bulges ofgalaxies (Greggio & Renzini 1999; Bressan et al. 1994; Catelan2009). However, Saglia et al. (2010) found no obvious gradientin [α/Fe] over the regions we analyze in M31. Within the bulgeof M31, the negative radial metallicity gradient exhibits a muchstronger correlation to the stellar populations responsible for theUVX.
Higher metallicity also implies higher helium content(ΔY/ΔZ ∼ 2–3, Greggio & Renzini 1990; 2.5–5, Bressan et al.1994; at least 2.5, Pagel et al. 1992). The MSTO mass decreasesstrongly with increasing helium abundance for a given age (seeO’Connell 1999 and references therein). For a fixed amount ofRGB mass loss, increased helium content will lead to hotterHB stars, that is, more EHB stars. Higher initial abundances ofhelium will also cause the star to burn more of its hydrogen en-velope during the HB phase, also favoring the production of HP-HB stars (O’Connell 1999; Horch et al. 1992). The increasedhelium abundances necessary to produce EHB stars could befrom contamination by the winds of older generations of AGBstars (Norris 2004), the winds of massive stars (Decressin et al.2007). Alternatively, these stars may have formed from the ac-cretion of material from winds of central stars (Seth 2010). Highhelium content is a necessary ingredient to reproduce our results,and stellar winds causing the higher helium could explain theradial gradients we detect. Detailed stellar evolution modelingthat varies the possible range of helium abundances from windcontamination is necessary to conclusively explain the radialgradient in MS stars that become HP-HB stars.
4.4. Radial Dust Gradients
Differential dust reddening could lead to gradients in thenumber of UV-bright stars detected as a function of radius.It is evident from Figure 2 that there is some structured dustobscuration in the bulge. The question then becomes, is theresystematically less dust in the center of the bulge and if so, coulddust alone account for the observed increase in faint UV sourcestoward the center of the galaxy?
Based on three lines of evidence, we find it unlikely thatthe UV population gradients are caused by dust. First, M31’sbulge is a three-dimensional object, and its dust is likely to beconfined primarily to the midplane. It is therefore reasonableto assume that ∼50% of the bugle stars are in front of the dustlayer. Second, we have inspected far-IR images of the bulge andsee no systematic gradient in the FIR surface brightness overthe central kiloparsec. We also see no obvious dust hole in thecentral regions. Finally, an AB extinction map (Melchior et al.2000; Ciardullo et al. 1988) shows no evidence of a significantradial dust gradient in the inner regions of M31. Therefore,while it is likely that dust has reduced the total number of UVstars we have detected (such that the percentages in Figure 10are likely to be lower limits), it is unlikely that radial variationsin extinction can be responsible for the rapid decline in HP-HBstars with radius.
5. CLOSING REMARKS
We have shown that the UV-bright population in the bulge ofM31 is due largely to the progeny of hot HB stars. Our findingsare consistent with the conclusion of B98 that these stars arejust the tip of the iceberg of the hot HB stars responsible forthe UVX. We report radial gradients in the resolved UV stellarpopulation of M31’s bulge that may be imperceptible in otherdata (e.g., in optical/NIR observations) because they regard
less than ∼3% of the evolving stellar populations in the bulge(∼2% for M31’s inner arcseconds and �5% for M32 cf. B98;Brown et al. 2000). We have demonstrated the great utility ofPHAT wide-area data, though bluer, deeper data are necessaryfor directly measuring the UVX.
The gradients in the likely HP-HB stars can only resultfrom gradients in the properties of their progenitors acrossthe bulge. The most likely changes in progenitor propertiesacross the bulge are due to gradients in metallicity, possiblycoupled to gradients in helium abundance. Detailed analysis ofthe most probable combinations of these parameters is givenin a forthcoming paper (P. Rosenfield et al., in preparation)where we use stellar models and population synthesis to repro-duce the ratio of P-AGB to AGB-manque stars. This will givemore precise estimates on which stellar evolution parametersare the most important in making AGB-manque and PE-AGBstars.
This work was supported by the Space Telescope ScienceInstitute through GO-12055. P.R. wishes to express his grati-tude to L.G., A.B., and Paola Marigo for invaluable guidanceand for graciously hosting him in Padova. We thank BrentGroves and the M31 Herschel imaging collaboration for al-lowing us to examine early Herschel observations of the bulge.We are grateful to Pauline Barmby for providing us the SpitzerIRAC images. We thank Roberto Saglia for providing us withmetallicity values of the M31 bulge. This research has madeuse of the NASA/IPAC Extragalactic Database (NED), whichis operated by JPL/Caltech, under contract with NASA. TheFOC data have been obtained from the Multimission Archive atthe Space Telescope Science Institute (MAST). STScI is oper-ated by the Association of Universities for Research in Astron-omy, Inc., under NASA contract NAS5-26555. L.G. and A.B.acknowledge support from contract ASI-INAF I/009/10/0.
Facilities: HST (UVIS)
REFERENCES
Barmby, P., Ashby, M. L. N., Bianchi, L., et al. 2006, ApJ, 650, L45Bell, E. F., & de Jong, R. S. 2001, ApJ, 550, 212Bensby, T., Feltzing, S., Johnson, J. A., et al. 2010, A&A, 512, A41Bertola, F., Bressan, A., Burstein, D., et al. 1995, ApJ, 438, 680Bressan, A., Chiosi, C., & Fagotto, F. 1994, ApJS, 94, 63Bressan, A., Marigo, P., Girardi, L., et al. 2012, MNRAS, submittedBrown, T. M., Bowers, C. W., Kimble, R. A., Sweigart, A. V., & Ferguson,
H. C. 2000, ApJ, 532, 308Brown, T. M., Ferguson, H. C., Davidsen, A. F., & Dorman, B. 1997, ApJ, 482,
685Brown, T. M., Ferguson, H. C., Stanford, S. A., & Deharveng, J.-M. B.
1998, ApJ, 504, 113Brown, T. M., Smith, E., Ferguson, H. C., et al. 2008, ApJ, 682, 319Burstein, D., Bertola, F., Buson, L. M., Faber, S. M., & Lauer, T. R. 1988, ApJ,
328, 440Buzzoni, A., & Gonzalez-Lopezlira, R. A. 2008, ApJ, 686, 1007Cardelli, J. A., Clayton, G. C., & Mathis, J. S. 1989, ApJ, 345, 245Carollo, C. M., Danziger, I. J., & Buson, L. 1993, MNRAS, 265, 553Carter, D., Pass, S., Kennedy, J., Karick, A. M., & Smith, R. J. 2011, MNRAS,
414, 3410Catelan, M. 2009, Horizontal Branch Stars and the Ultraviolet Universe,
Astrophysics and Space Science Proceedings (New York: Springer), 1Ciardullo, R., Rubin, V. C., Ford, W. K., Jr., Jacoby, G. H., & Ford, H. C.
1988, AJ, 95, 438Code, A. D. 1969, PASP, 81, 475Courteau, S., Widrow, L. M., McDonald, M., et al. 2011, ApJ, 739, 20Dalcanton, J. J., Williams, B. F., Lang, D., et al. 2012, ApJS, 200, 18Davies, R. L., Sadler, E. M., & Peletier, R. F. 1993, MNRAS, 262, 650Decressin, T., Meynet, G., Charbonnel, C., Prantzos, N., & Ekstrom, S.
2007, A&A, 1044, 1029
12

The Astrophysical Journal, 755:131 (13pp), 2012 August 20 Rosenfield et al.
Dolphin, A. E. 2000, PASP, 112, 1383Dorman, B., O’Connell, R. W., & Rood, R. T. 1995, ApJ, 442, 105Ferguson, H. C., & Davidsen, A. F. 1993, ApJ, 408, 92Girardi, L., Dalcanton, J., Williams, B., et al. 2008, PASP, 120, 583Girardi, L., Groenewegen, M. A. T., Hatziminaoglou, E., & da Costa, L.
2005, A&A, 436, 895Girardi, L., Williams, B. F., Gilbert, K. M., et al. 2010, ApJ, 724, 1030Gorgas, J., Efstathiou, G., & Aragon Salamanca, A. 1990, MNRAS, 245, 217Greggio, L., & Renzini, A. 1990, ApJ, 364, 35Greggio, L., & Renzini, A. 1999, Mem. Soc. Astron. Ital., 70, 691Han, Z., Podsiadlowski, P., & Lynas-Gray, A. E. 2007, MNRAS, 380, 1098Han, Z., Podsiadlowski, P., Maxted, P. F. L., & Marsh, T. R. 2003, MNRAS,
341, 669Han, Z., Podsiadlowski, P., Maxted, P. F. L., Marsh, T. R., & Ivanova, N.
2002, MNRAS, 336, 449Horch, E., Demarque, P., & Pinsonneault, M. 1992, ApJ, 388, L53Jablonka, P., Gorgas, J., & Goudfrooij, P. 2007, A&A, 474, 763Kalirai, J. S., Bergeron, P., Hansen, B. M. S., et al. 2007, ApJ, 671, 748Kang, Y., Bianchi, L., & Rey, S.-C. 2009, ApJ, 703, 614King, I. R., Deharveng, J. M., Albrecht, R., et al. 1992, ApJ, 397, L35King, I. R., Stanford, S. A., & Crane, P. 1995, AJ, 109, 164Kobayashi, C., & Arimoto, N. 1999, ApJ, 527, 573Koekemoer, A. M., Fruchter, A. S., Hook, R. N., & Hack, W. 2002, in The 2002
HST Calibration Workshop: Hubble after the Installation of the ACS and theNICMOS Cooling System, ed. S. Arribas, A. Koekemoer, & B. Whitmore(Baltimore, M.D.: Space Telescope Science Institute), 337
Kroupa, P. 2001, MNRAS, 322, 231Maraston, C. 1998, MNRAS, 300, 872Maraston, C. 2005, MNRAS, 362, 799McConnachie, A. W., Irwin, M. J., Ferguson, A. M. N., et al. 2005, MNRAS,
356, 979Melchior, A.-L., Viallefond, F., Guelin, M., & Neininger, N. 2000, MNRAS,
312, L29
Merrett, H. R., Merrifield, M. R., Douglas, N. G., et al. 2006, MNRAS, 142,120
Norris, J. E. 2004, ApJ, 612, L25O’Connell, R. W. 1999, ARA&A, 37, 603O’Donnell, J. E. 1994, ApJ, 422, 158Oh, S.-H., de Blok, W. J. G., Walter, F., Brinks, E., & Kennicutt, R. C., Jr.
2008, AJ, 136, 2761Pagel, B. E. J., Simonson, E. A., Terlevich, R. J., & Edmunds, M. G. 1992,
MNRAS, 255, 325Papovich, C., Dickinson, M., & Ferguson, H. C. 2001, ApJ, 559, 620Peletier, R. F., Davies, R. L., Illingworth, G. D., Davis, L. E., & Cawson, M.
1990, AJ, 100, 1091Renzini, A., & Buzzoni, A. 1986, in Spectral Evolution of Galaxies, ed. C.
Chiosi & A. Renzini (Astrophysics and Space Science Library, Vol. 122;Dordrecht: Reidel), 195
Roediger, J. C., Courteau, S., MacArthur, L. A., & McDonald, M. 2011,MNRAS, 416, 1996
Saglia, R. P., Fabricius, M., Bender, R., et al. 2010, A&A, 509, A61Schiavon, R. P., Dalessandro, E., Sohn, S. T., et al. 2012, AJ, 143, 121Schlegel, D. J., Finkbeiner, D. P., & Davis, M. 1998, ApJ, 500, 525Seth, A. C. 2010, ApJ, 725, 670Skrutskie, M. F., Cutri, R. M., Stiening, R., et al. 2006, AJ, 131, 1163Thilker, D. A., Hoopes, C. G., Bianchi, L., et al. 2005, ApJ, 619, L67Thomas, D., Maraston, C., & Bender, R. 2003, MNRAS, 339, 897Thomsen, B., & Baum, W. A. 1987, ApJ, 315, 460Trager, S. C., Faber, S. M., Worthey, G., & Gonzalez, J. J. 2000, AJ, 119,
1645Vassiliadis, E., & Wood, P. R. 1994, ApJS, 92, 125Voss, R., & Gilfanov, M. 2007a, A&A, 468, 49Voss, R., & Gilfanov, M. 2007b, MNRAS, 380, 1685Walterbos, R. A. M., & Kennicutt, R. C., Jr. 1987, A&AS, 69, 311Wirth, A. 1981, AJ, 86, 981Yi, S., Lee, Y.-W., Woo, J.-H., Park, J.-H., & Oemler, A. 1999, ApJ, 1, 128
13