the oxygen reduction reaction mechanism on pt(111) from density functional theory calculations
TRANSCRIPT

Tt
Va
b
a
ARRAA
KOPDR
1
ccumaeea
isfsiuibtwcmt
0d
Electrochimica Acta 55 (2010) 7975–7981
Contents lists available at ScienceDirect
Electrochimica Acta
journa l homepage: www.e lsev ier .com/ locate /e lec tac ta
he oxygen reduction reaction mechanism on Pt(1 1 1) from density functionalheory calculations
ladimir Tripkovic a, Egill Skúlasona, Samira Siahrostamia,b, Jens K. Nørskova, Jan Rossmeisl a,∗
Center for Atomic-scale Materials Design (CAMD), Department of Physics, Technical University of Denmark, Kgs. Lyngby 2800, DenmarkDepartment of Chemistry, College of Sciences, Shiraz University, Shiraz 71454, Iran
r t i c l e i n f o
rticle history:eceived 7 December 2009eceived in revised form 15 February 2010
a b s t r a c t
We study the oxygen reduction reaction (ORR) mechanism on a Pt(1 1 1) surface using density functionaltheory calculations. We find that at low overpotentials the surface is covered with a half dissociated waterlayer. We estimate the barrier for proton transfer to this surface and the barrier for proton transport
ccepted 18 February 2010vailable online 25 February 2010
eywords:xygen reduction reactiont
parallel to the surface within the half dissociated water network. We find both barriers to be small. Theonly potentially dependent step is the proton transfer from water to the half dissociated water layer. Wefind that ORR proceeds via four direct e− reductions without significant peroxide formation. We show thatthe oxygen–oxygen bond breaking is dependent on the local surface environment. The minimum energypathway is constructed and we confirm that OH removal from the surface determines the overpotential.
FTeaction mechanism
. Introduction
The largest challenge in the proton-exchange membrane fuelell (PEMFC) catalysis is to reduce the amount of Pt needed at theathode. The cathode contains 80–90% of the total amount of Ptsed in PEMFC. Sluggish kinetics at the cathode accounts for theajor part of voltage drop in PEMFCs. This limits state-of-the-
rt systems to operate at voltages of only ∼0.7 V, far from thequilibrium potential of ∼1.2 V [1]. To make fuel cell productionconomically viable, one has to increase the mass activity of Pt byt least factor of four [1].
Deducing a reaction mechanism from the measured kineticss a tremendously difficult problem [2,3]. In that perspective DFTtudies have provided huge molecular level understanding of sur-ace phenomena that are taking place during the ORR. The DFTimulations enabled us to relate the binding energies of all thentermediates in the ORR to the binding energy of oxygen [4] andse that knowledge to construct an activity volcano [5] depend-
ng just on that single descriptor. The activity volcano is limitedy two rate determining steps; OH removal and OOH formation onhe surface [3,6]. Therefore ideally it would be desirable to have
eaker OH and stronger OOH binding to the surface. Since oneannot change independently binding energies of OH and OOH,aterial with the tradeoff of these two limiting regimes will be
he best catalyst for this reaction. Pt with an intermediate O bind-
∗ Corresponding author.E-mail address: [email protected] (J. Rossmeisl).
013-4686/$ – see front matter © 2010 Elsevier Ltd. All rights reserved.oi:10.1016/j.electacta.2010.02.056
© 2010 Elsevier Ltd. All rights reserved.
ing energy is found to be close to the top of the volcano explainingwhy it stands out as the best single element catalyst. Higher activi-ties can be reached by slightly tuning the oxygen binding energy byalloying Pt with some other metal [7,8]. However, these previoustheoretical studies relied on the binding energies of the most sta-ble intermediates, and it was implicitly assumed that any additionalreaction barriers are rather small or essentially potential and metalindependent.
The barriers for O2, OOH and HOOH bond breaking on the purePt(1 1 1) surface have been calculated by Nilekar and Mavrikakisin the absence of water and an applied bias [9]. The first chargetransfer reaction of the ORR has also been modeled previously byJanik et al. in a water environment at a constant surface charge [10].This study showed that the barrier for this reaction is very small.The reaction was modeled having water at the surface; however,at the potentials where the ORR takes place, the electrode surfacewill start to oxidize. Therefore the OH coverage will be substantialand this could significantly affect the results [11].
In the present we study the ORR mechanism at relevant poten-tial, at a realistic surface coverage of OH and in the presence ofwater. First we calculate the binding energy of hydroxyl as a func-tion of the OH coverage; from this we determine the coverage ofOH at potentials of interest to be 1/3 ML. Subsequently we modelall ORR intermediates in this H2O/OH hydrogen bonded network.
2. Method
All the electronic structure calculations have been carried outusing density functional theory, using the RPBE functional for
7 imica Acta 55 (2010) 7975–7981
eobu∼(aurciaItellowtoocs
3
htatr
Fchateav0r
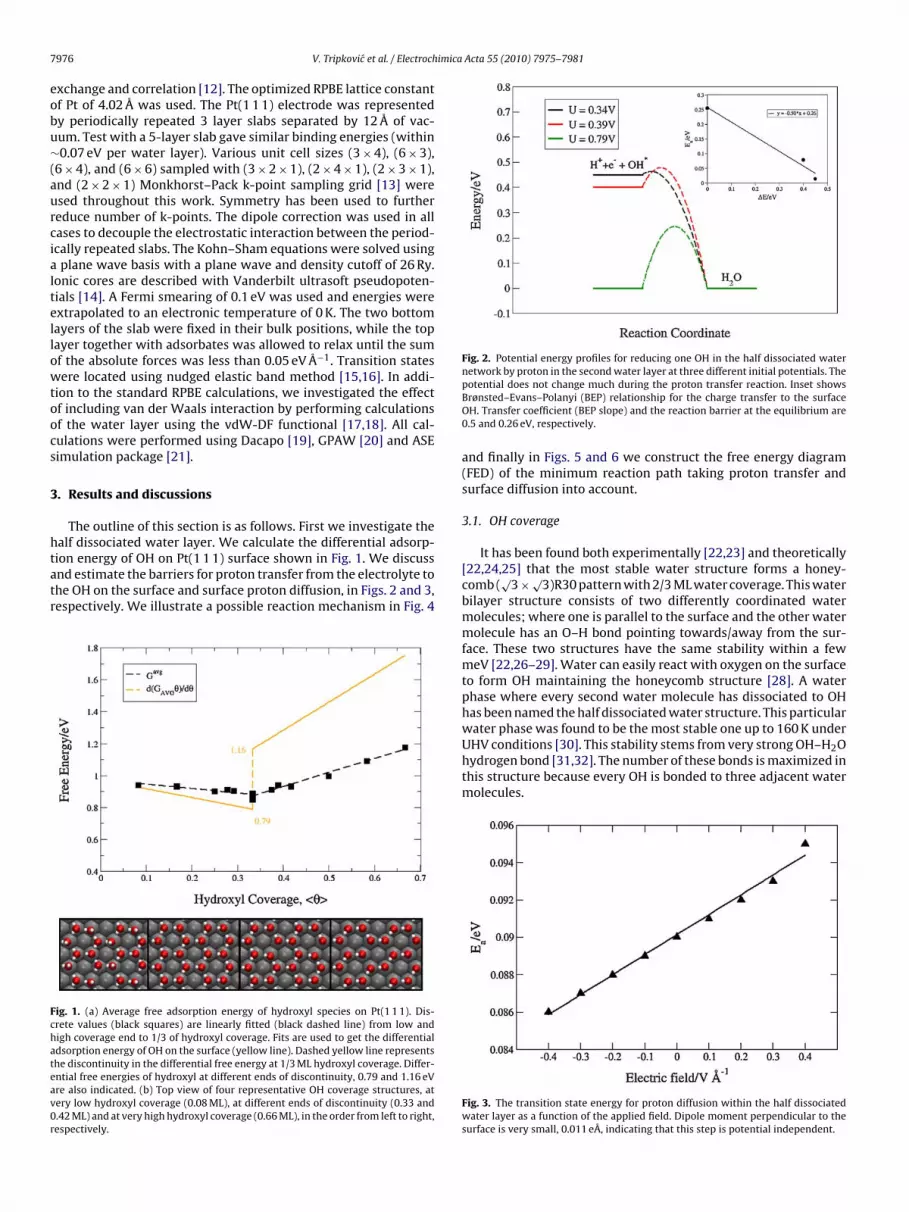
Fig. 2. Potential energy profiles for reducing one OH in the half dissociated waternetwork by proton in the second water layer at three different initial potentials. The
976 V. Tripkovic et al. / Electroch
xchange and correlation [12]. The optimized RPBE lattice constantf Pt of 4.02 Å was used. The Pt(1 1 1) electrode was representedy periodically repeated 3 layer slabs separated by 12 Å of vac-um. Test with a 5-layer slab gave similar binding energies (within0.07 eV per water layer). Various unit cell sizes (3 × 4), (6 × 3),
6 × 4), and (6 × 6) sampled with (3 × 2 × 1), (2 × 4 × 1), (2 × 3 × 1),nd (2 × 2 × 1) Monkhorst–Pack k-point sampling grid [13] weresed throughout this work. Symmetry has been used to furthereduce number of k-points. The dipole correction was used in allases to decouple the electrostatic interaction between the period-cally repeated slabs. The Kohn–Sham equations were solved usingplane wave basis with a plane wave and density cutoff of 26 Ry.
onic cores are described with Vanderbilt ultrasoft pseudopoten-ials [14]. A Fermi smearing of 0.1 eV was used and energies werextrapolated to an electronic temperature of 0 K. The two bottomayers of the slab were fixed in their bulk positions, while the topayer together with adsorbates was allowed to relax until the sumf the absolute forces was less than 0.05 eV Å−1. Transition statesere located using nudged elastic band method [15,16]. In addi-
ion to the standard RPBE calculations, we investigated the effectf including van der Waals interaction by performing calculationsf the water layer using the vdW-DF functional [17,18]. All cal-ulations were performed using Dacapo [19], GPAW [20] and ASEimulation package [21].
. Results and discussions
The outline of this section is as follows. First we investigate thealf dissociated water layer. We calculate the differential adsorp-
ion energy of OH on Pt(1 1 1) surface shown in Fig. 1. We discussnd estimate the barriers for proton transfer from the electrolyte tohe OH on the surface and surface proton diffusion, in Figs. 2 and 3,espectively. We illustrate a possible reaction mechanism in Fig. 4ig. 1. (a) Average free adsorption energy of hydroxyl species on Pt(1 1 1). Dis-rete values (black squares) are linearly fitted (black dashed line) from low andigh coverage end to 1/3 of hydroxyl coverage. Fits are used to get the differentialdsorption energy of OH on the surface (yellow line). Dashed yellow line representshe discontinuity in the differential free energy at 1/3 ML hydroxyl coverage. Differ-ntial free energies of hydroxyl at different ends of discontinuity, 0.79 and 1.16 eVre also indicated. (b) Top view of four representative OH coverage structures, atery low hydroxyl coverage (0.08 ML), at different ends of discontinuity (0.33 and.42 ML) and at very high hydroxyl coverage (0.66 ML), in the order from left to right,espectively.
potential does not change much during the proton transfer reaction. Inset showsBrønsted–Evans–Polanyi (BEP) relationship for the charge transfer to the surfaceOH. Transfer coefficient (BEP slope) and the reaction barrier at the equilibrium are0.5 and 0.26 eV, respectively.
and finally in Figs. 5 and 6 we construct the free energy diagram(FED) of the minimum reaction path taking proton transfer andsurface diffusion into account.
3.1. OH coverage
It has been found both experimentally [22,23] and theoretically[22,24,25] that the most stable water structure forms a honey-comb (
√3 × √
3)R30 pattern with 2/3 ML water coverage. This waterbilayer structure consists of two differently coordinated watermolecules; where one is parallel to the surface and the other watermolecule has an O–H bond pointing towards/away from the sur-face. These two structures have the same stability within a fewmeV [22,26–29]. Water can easily react with oxygen on the surfaceto form OH maintaining the honeycomb structure [28]. A waterphase where every second water molecule has dissociated to OHhas been named the half dissociated water structure. This particular
water phase was found to be the most stable one up to 160 K underUHV conditions [30]. This stability stems from very strong OH–H2Ohydrogen bond [31,32]. The number of these bonds is maximized inthis structure because every OH is bonded to three adjacent watermolecules.Fig. 3. The transition state energy for proton diffusion within the half dissociatedwater layer as a function of the applied field. Dipole moment perpendicular to thesurface is very small, 0.011 eÅ, indicating that this step is potential independent.

V. Tripkovic et al. / Electrochimica
Fig. 4. Schematic illustration of the reaction mechanism. Surface is covered withhalf dissociated water network (transparent background). Four additional hydrogenatoms indicated (left and right panels). These atoms can easily diffuse to the reactioncie
Pgdtwessva
fddttfropefertri
arebmohn
EintOH = E �OH + 2
3− � H2O − Eslab + 1
2�E(H2) − 2
3E(H2O∗)
(3)
Table 1Dissociation barriers and bond lengths for the most stable oxygen species on Pt(1 1 1)slab coordinated to different number of water molecules. Bond length for O2 invacuum from RPBE-DFT calculation is also included for comparison.
Ediss/eV Bond length/nm
O2 (g) 0.124
O2 0.73 0.135
O2 + H2O 0.67 0.140
O2 + 2H2O 0.48 0.142
OOHa + 2H2O 0.37 0.144
enter (middle panel) where they reduce ORR intermediates. The dashed yellow boxn the middle panel represents the simulated unit cell. All the structures are shownmbodied in the half dissociated water network.
Under electrochemical conditions, cyclic voltammograms fort(1 1 1) show an oxidation peak around 0.8 V vs. reversible hydro-en electrode (RHE) (from simulation point of view there is noifference between the reversible and the standard hydrogen elec-rode [33]). This peak is believed to be related to the splitting ofater into adsorbed OH* and H+ + e− [34,3]. It is difficult to get the
xact surface structure via in situ experiments. However, infraredpectroscopy suggests that the water on Pt(1 1 1) is in an ice-liketructure [35]. From DFT simulations of the oxidation peak in cyclicoltammograms, charge seems to be well reproduced by assumingn isotherm with the half dissociated water layer [2,29].
In the next section we will be looking at the three differentree energies schemes for OH adsorption; average, integral andifferential free energy scheme. The average free energy of OH isefined as the average adsorption energy per number of OHs, n, inhe simulated cell. This energy shows the strength of the interac-ion between the adsorbed OH species. On the other hand, integralree energy is the total OH adsorption energy normalized with theespect to the size of the simulated cell or equivalently numberf the surface atoms, N, in the simulation. It is obtained by multi-lying the average free energy with the OH coverage. Besides thisnergy equals the energy stored in a capacitor set up between sur-ace adsorbed water layer and the slab. Differential free adsorptionnergy is obtained by differentiating the free integral energy withespect to the OH coverage. Differential adsorption energy showshe most stable surface structure at corresponding potential. Theelationship between the three different energy schemes is givenn Eq. (1).
dG
N d�= d(Gavg�)
d�= d(Gint)
d�, � = n
N(1)
The average free energy of OH species as a function of cover-ge is presented in Fig. 1 (black squares). We start by stepwiseemoving H atoms from the water bilayer. When 1/3 ML of OH cov-rage is reached, further increase of the OH concentration can only
e achieved by taking one of the hydrogen atoms from the waterolecules in plane with the surface. This equals to removing onef the hydrogen bonds. 2/3 of OH coverage is reached when oneydrogen atom has been abstracted from all water molecules. Weote here that this high OH coverage is unrealistic under electro-
Acta 55 (2010) 7975–7981 7977
chemical conditions and that oxide layer will instead build up onthe surface at higher potentials [11,36].
Free average energy adsorption profile (dashed black line) isobtained by linearly fitting discrete points from both, low and highcoverage end to the coverage of 1/3 ML of hydroxyl. It can be seenfrom Fig. 1 that OH–OH interaction has a kink in the middle, mean-ing that the interaction is attractive below 1/3 ML and repulsiveabove 1/3 ML.
There are two ways in which we can calculate the adsorptionenergy of OH. We will illustrate this on the example of the integralenergy. The first way is to compare the adsorption energies of OH onthe surface to the liquid water and hydrogen molecules in the gasphase, whereas water in the bilayer is used as a reference for watermolecules. Zero point energy and entropy correction are added toget the free adsorption energy at 300 K (G = E + ZPE − TS).
EintOH = E
(�OH +
(23
− �)
H2O)
− Eslab − 23
E(H2O) + 12
�E(H2)
−(
23
− �)
(E(H2O∗) − Eslab − E(H2O)) (2)
Here E(H2O*) is the average energy of a water molecule in the waterbilayer on the surface.
Another more direct way of calculating the adsorption energyis: ( ( ) )
a In this case OOH is the most stable oxygen species on the surface.
7978 V. Tripkovic et al. / Electrochimica Acta 55 (2010) 7975–7981
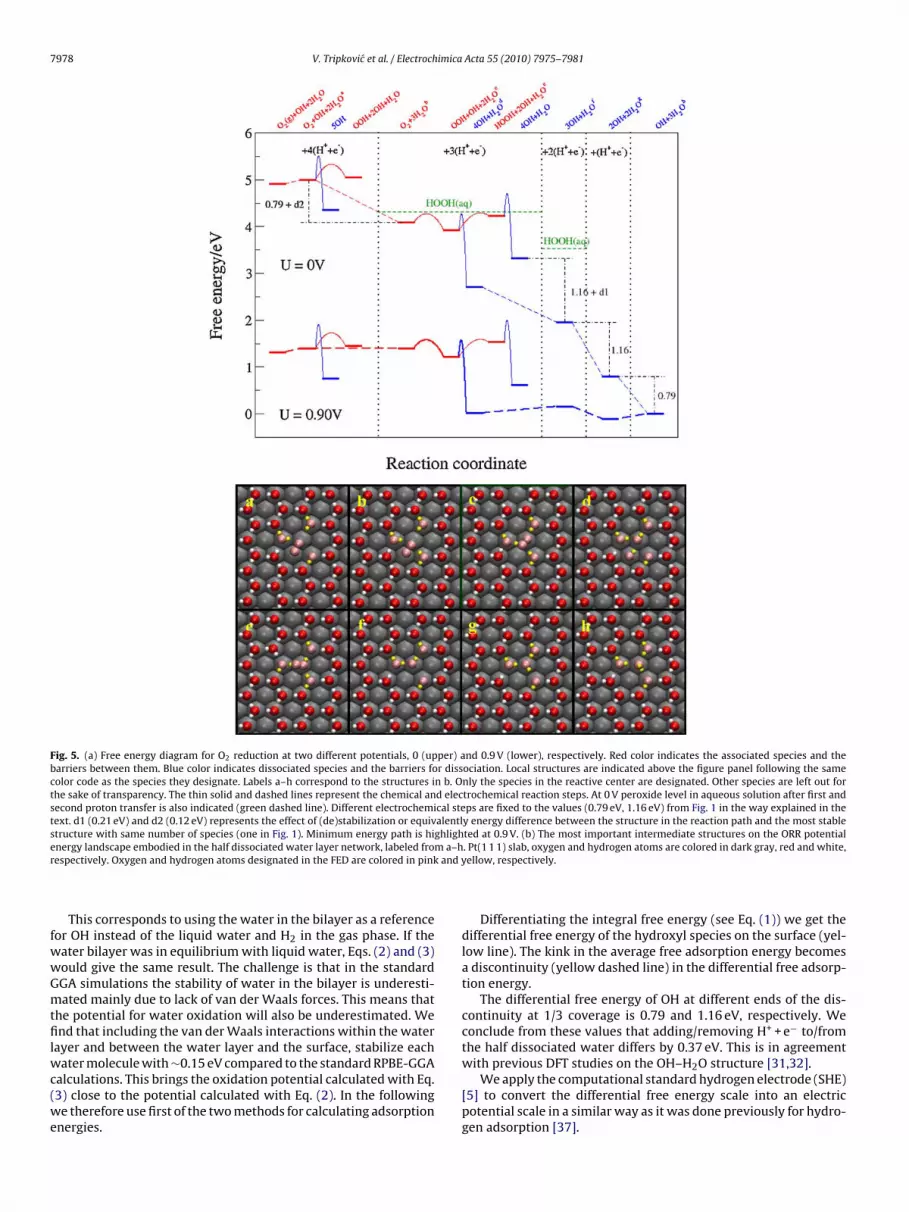
Fig. 5. (a) Free energy diagram for O2 reduction at two different potentials, 0 (upper) and 0.9 V (lower), respectively. Red color indicates the associated species and thebarriers between them. Blue color indicates dissociated species and the barriers for dissociation. Local structures are indicated above the figure panel following the samecolor code as the species they designate. Labels a–h correspond to the structures in b. Only the species in the reactive center are designated. Other species are left out forthe sake of transparency. The thin solid and dashed lines represent the chemical and electrochemical reaction steps. At 0 V peroxide level in aqueous solution after first andsecond proton transfer is also indicated (green dashed line). Different electrochemical steps are fixed to the values (0.79 eV, 1.16 eV) from Fig. 1 in the way explained in thetext. d1 (0.21 eV) and d2 (0.12 eV) represents the effect of (de)stabilization or equivalently energy difference between the structure in the reaction path and the most stablestructure with same number of species (one in Fig. 1). Minimum energy path is highlighted at 0.9 V. (b) The most important intermediate structures on the ORR potentiale m a–hr and y
fwwGmtfilwc(we
nergy landscape embodied in the half dissociated water layer network, labeled froespectively. Oxygen and hydrogen atoms designated in the FED are colored in pink
This corresponds to using the water in the bilayer as a referenceor OH instead of the liquid water and H2 in the gas phase. If theater bilayer was in equilibrium with liquid water, Eqs. (2) and (3)ould give the same result. The challenge is that in the standardGA simulations the stability of water in the bilayer is underesti-ated mainly due to lack of van der Waals forces. This means that
he potential for water oxidation will also be underestimated. Wend that including the van der Waals interactions within the water
ayer and between the water layer and the surface, stabilize each
ater molecule with ∼0.15 eV compared to the standard RPBE-GGAalculations. This brings the oxidation potential calculated with Eq.3) close to the potential calculated with Eq. (2). In the followinge therefore use first of the two methods for calculating adsorption
nergies.
. Pt(1 1 1) slab, oxygen and hydrogen atoms are colored in dark gray, red and white,ellow, respectively.
Differentiating the integral free energy (see Eq. (1)) we get thedifferential free energy of the hydroxyl species on the surface (yel-low line). The kink in the average free adsorption energy becomesa discontinuity (yellow dashed line) in the differential free adsorp-tion energy.
The differential free energy of OH at different ends of the dis-continuity at 1/3 coverage is 0.79 and 1.16 eV, respectively. Weconclude from these values that adding/removing H+ + e− to/fromthe half dissociated water differs by 0.37 eV. This is in agreement
with previous DFT studies on the OH–H2O structure [31,32].We apply the computational standard hydrogen electrode (SHE)[5] to convert the differential free energy scale into an electricpotential scale in a similar way as it was done previously for hydro-gen adsorption [37].
V. Tripkovic et al. / Electrochimica
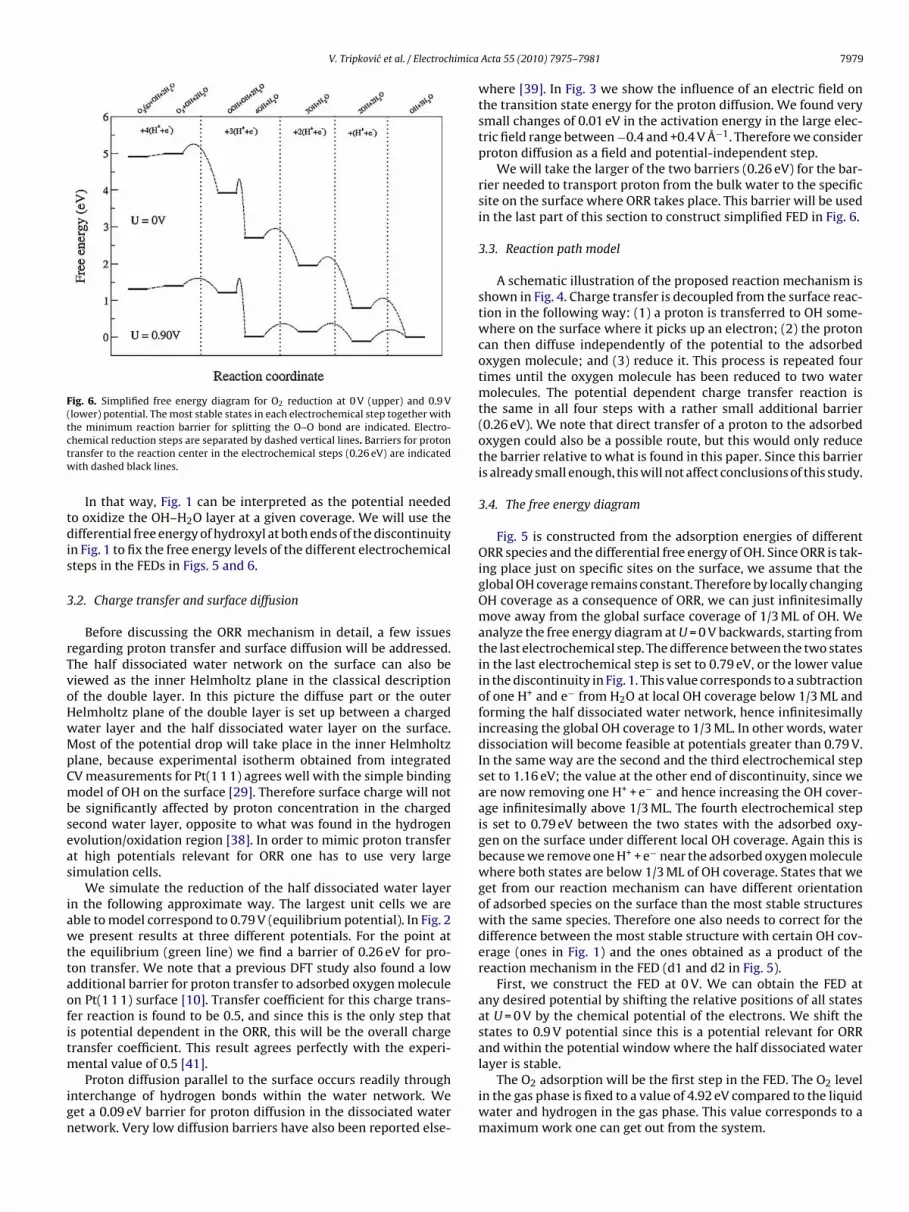
Fig. 6. Simplified free energy diagram for O2 reduction at 0 V (upper) and 0.9 V(lower) potential. The most stable states in each electrochemical step together withtctw
tdis
3
rTvoHwMpCmbseas
iawttaofitm
ign
he minimum reaction barrier for splitting the O–O bond are indicated. Electro-hemical reduction steps are separated by dashed vertical lines. Barriers for protonransfer to the reaction center in the electrochemical steps (0.26 eV) are indicatedith dashed black lines.
In that way, Fig. 1 can be interpreted as the potential neededo oxidize the OH–H2O layer at a given coverage. We will use theifferential free energy of hydroxyl at both ends of the discontinuity
n Fig. 1 to fix the free energy levels of the different electrochemicalteps in the FEDs in Figs. 5 and 6.
.2. Charge transfer and surface diffusion
Before discussing the ORR mechanism in detail, a few issuesegarding proton transfer and surface diffusion will be addressed.he half dissociated water network on the surface can also beiewed as the inner Helmholtz plane in the classical descriptionf the double layer. In this picture the diffuse part or the outerelmholtz plane of the double layer is set up between a chargedater layer and the half dissociated water layer on the surface.ost of the potential drop will take place in the inner Helmholtz
lane, because experimental isotherm obtained from integratedV measurements for Pt(1 1 1) agrees well with the simple bindingodel of OH on the surface [29]. Therefore surface charge will not
e significantly affected by proton concentration in the chargedecond water layer, opposite to what was found in the hydrogenvolution/oxidation region [38]. In order to mimic proton transfert high potentials relevant for ORR one has to use very largeimulation cells.
We simulate the reduction of the half dissociated water layern the following approximate way. The largest unit cells we areble to model correspond to 0.79 V (equilibrium potential). In Fig. 2e present results at three different potentials. For the point at
he equilibrium (green line) we find a barrier of 0.26 eV for pro-on transfer. We note that a previous DFT study also found a lowdditional barrier for proton transfer to adsorbed oxygen moleculen Pt(1 1 1) surface [10]. Transfer coefficient for this charge trans-er reaction is found to be 0.5, and since this is the only step thats potential dependent in the ORR, this will be the overall chargeransfer coefficient. This result agrees perfectly with the experi-
ental value of 0.5 [41].Proton diffusion parallel to the surface occurs readily through
nterchange of hydrogen bonds within the water network. Weet a 0.09 eV barrier for proton diffusion in the dissociated wateretwork. Very low diffusion barriers have also been reported else-
Acta 55 (2010) 7975–7981 7979
where [39]. In Fig. 3 we show the influence of an electric field onthe transition state energy for the proton diffusion. We found verysmall changes of 0.01 eV in the activation energy in the large elec-tric field range between −0.4 and +0.4 V Å−1. Therefore we considerproton diffusion as a field and potential-independent step.
We will take the larger of the two barriers (0.26 eV) for the bar-rier needed to transport proton from the bulk water to the specificsite on the surface where ORR takes place. This barrier will be usedin the last part of this section to construct simplified FED in Fig. 6.
3.3. Reaction path model
A schematic illustration of the proposed reaction mechanism isshown in Fig. 4. Charge transfer is decoupled from the surface reac-tion in the following way: (1) a proton is transferred to OH some-where on the surface where it picks up an electron; (2) the protoncan then diffuse independently of the potential to the adsorbedoxygen molecule; and (3) reduce it. This process is repeated fourtimes until the oxygen molecule has been reduced to two watermolecules. The potential dependent charge transfer reaction isthe same in all four steps with a rather small additional barrier(0.26 eV). We note that direct transfer of a proton to the adsorbedoxygen could also be a possible route, but this would only reducethe barrier relative to what is found in this paper. Since this barrieris already small enough, this will not affect conclusions of this study.
3.4. The free energy diagram
Fig. 5 is constructed from the adsorption energies of differentORR species and the differential free energy of OH. Since ORR is tak-ing place just on specific sites on the surface, we assume that theglobal OH coverage remains constant. Therefore by locally changingOH coverage as a consequence of ORR, we can just infinitesimallymove away from the global surface coverage of 1/3 ML of OH. Weanalyze the free energy diagram at U = 0 V backwards, starting fromthe last electrochemical step. The difference between the two statesin the last electrochemical step is set to 0.79 eV, or the lower valuein the discontinuity in Fig. 1. This value corresponds to a subtractionof one H+ and e− from H2O at local OH coverage below 1/3 ML andforming the half dissociated water network, hence infinitesimallyincreasing the global OH coverage to 1/3 ML. In other words, waterdissociation will become feasible at potentials greater than 0.79 V.In the same way are the second and the third electrochemical stepset to 1.16 eV; the value at the other end of discontinuity, since weare now removing one H+ + e− and hence increasing the OH cover-age infinitesimally above 1/3 ML. The fourth electrochemical stepis set to 0.79 eV between the two states with the adsorbed oxy-gen on the surface under different local OH coverage. Again this isbecause we remove one H+ + e− near the adsorbed oxygen moleculewhere both states are below 1/3 ML of OH coverage. States that weget from our reaction mechanism can have different orientationof adsorbed species on the surface than the most stable structureswith the same species. Therefore one also needs to correct for thedifference between the most stable structure with certain OH cov-erage (ones in Fig. 1) and the ones obtained as a product of thereaction mechanism in the FED (d1 and d2 in Fig. 5).
First, we construct the FED at 0 V. We can obtain the FED atany desired potential by shifting the relative positions of all statesat U = 0 V by the chemical potential of the electrons. We shift thestates to 0.9 V potential since this is a potential relevant for ORRand within the potential window where the half dissociated water
layer is stable.The O2 adsorption will be the first step in the FED. The O2 levelin the gas phase is fixed to a value of 4.92 eV compared to the liquidwater and hydrogen in the gas phase. This value corresponds to amaximum work one can get out from the system.

7 imica
tstAbabnOg0tf
fithialc
cfiggeaotb
pwomc
iasptvpt
sbeUsulttd
4
fd
[[[[[[
[[
980 V. Tripkovic et al. / Electroch
There are two possible reaction paths after initial O2 adsorp-ion. O2 can either react with one proton and electron from theurrounding water molecules to form OOH, or dissociate. The rela-ive stability of the O2 and OOH depends on the local OH coverage.fter proton transfer to the OH in the vicinity of O2, dissociationecomes more facile. This is related to water at the surface beingstronger proton donor than OH [31,32]. Dissociation barriers andond lengths depending on the number of hydrogen bonds coordi-ated to the most stable oxygen species are tabulated in Table 1. For–O bond scission compared to the most stable intermediate, weet the lowest barrier to be 0.37 eV which is considerably less than.73 eV we find on the bare Pt(1 1 1) surface. If we include the elec-ric field correction for transition state for O2 dissociation at 0.9 Vrom Ref. [40], barrier will shift upwards by additional 0.06 eV.
OOH species can further react with nearby water molecules toorm HOOH. This reaction step is energetically unfavorable whichs in agreement with rotating ring disc experiments where onlyraces of peroxide are present at ORR relevant potentials [41]. Theydrogen peroxide energy level in aqueous solution [42] is also
ndicated for comparison with the green dashed line in the secondnd the third panel in Fig. 5. Difference between the two peroxideevels in aqueous solution is 0.79 eV due to the way the FED wasonstructed.
This analysis confirms our previous established thermodynami-ally picture that OOH is the most stable reaction intermediate afterrst reduction step. As a product of O–O bond scission we can eitheret O or 2OH since the nearest water molecules can donate a hydro-en atom to oxygen to form 2OH. We find very similar reactionnergies and activation barriers for these two mechanisms. This isresult of simple scaling relationships that exist between differentxygen species based on the number of bonds each species has tohe surface [4,43]. Consequently the difference in the free energyetween O and 2OH is independent on material.
The following three consecutive electrochemical steps are sim-le proton transfer steps. In the final structure there is one moreater molecule due to an extra hydrogen atom sitting on top of
ne OH in the half dissociated water layer. This additional waterolecule can be readily replaced by O2 [44], thus completing the
atalytic cycle.The barrier for breaking the oxygen–oxygen bond is potential
ndependent, which means that it will not show up in comparingctivities at different potentials. This is the reason why the analy-is based on the intermediates binding gives qualitatively correctolarizations curves [2]. However, the barrier might change whenhe catalyst is changed, this could affect the previously establishedolcano curves. We speculate that less reactive catalysts might beredicted too active compared to Pt without explicitly includinghe kinetics.
The most stable intermediate in each electrochemical step ishown in Fig. 6, a simplified version of Fig. 5. The minimum energyarrier for OOH dissociation is also indicated as well as the barri-rs for charge transfer between different electrochemical steps. At= 0.9 V from Fig. 6 OOH formation and OH removal step have very
imilar barriers. We speculate that inclusion of more water (largernit cells) could slightly stabilize OOH and OH at surface. Any stabi-
ization would reduce the barrier for OOH dissociation and increasehe barrier for H2O formation. This is in agreement with previousheoretical results on Pt(1 1 1) [5], where the rate of OH removaletermined the overall ORR activity.
. Conclusions
In summary we have calculated the reaction path and barriersor ORR on Pt(1 1 1). We would like to highlight that this approachiffers from others in that we take explicitly into account the
[[
[
Acta 55 (2010) 7975–7981
half dissociated water layer on the surface. All ORR intermediatesare modeled within this water network, where water is not justaccounted for stabilization effect it exerts on surface intermediates,but also it is directly involved in the reaction mechanism. We haveconstructed differential adsorption energy diagram and we havedetermined the most stable surface structure at potentials of inter-est for ORR reduction. We find that there is a discontinuity in thechemical potential at 1/3 ML of OH coverage which corresponds toenergy needed for removing one extra hydrogen atom from the halfdissociated water layer network. From this we have constructedthe FED for O2 reduction on Pt(1 1 1) at 0.9 V. The results are inagreement with the previously established picture that on Pt(1 1 1),OH reduction is the potential determining step. We find that themost stable species after first proton transfer is OOH with mod-erately potential-independent dissociation barrier of 0.37 eV. Wehave also shown that O2 reduction proceeds via a so-called directpathway, with negligible amount of peroxide produced in agree-ment with experimental observation [41]. We showed that thereare only small reaction barriers for proton transfer and subsequentsurface diffusion. This allowed us to deconvolute the overall reac-tion into potential dependent charge transfer to the surface andpotential-independent proton transfer parallel to the surface. Sincethe barriers are small we can treat the potential dependent step tobe the same for all four electron transfer reactions. We consider sur-face proton transfer to the ORR intermediates via half dissociatedwater network. Direct transfer of proton to one of the ORR inter-mediates could yield smaller barrier, however, since the barriersfor the transfer via surface are already small, this will not affect theconclusions of this study.
Acknowledgements
CAMD is funded by the Lundbeck foundation. The Catalysis forSustainable Energy initiative is funded by the Danish Ministry ofScience, Technology and Innovation. This work was supported bythe Danish Center for Scientific Computing. Support from the Dan-ish Council for Technology and Innovation’s FTP program and theStrategic Electrochemistry Research Center is acknowledged.
References
[1] H.A. Gasteiger, S.S. Kocha, B. Sompalli, F.T. Wagner, Appl. Catal. B: Environ. 56(2005) 9.
[2] J. Rossmeisl, G.S. Karlberg, T. Jaramillo, J.K. Nørskov, Faraday Discuss. 140 (2008)337.
[3] J.X. Wang, N.M. Markovic, R.R. Adzic, J. Phys. Chem. B 108 (2004) 4127.[4] J. Rossmeisl, Á. Logadóttir, J.K. Nørskov, Chem. Phys. 319 (2005) 178.[5] J.K. Nørskov, J. Rossmeisl, A. Logadottir, L. Lindqvist, J.R. Kitchin, T. Bligaard, H.
Jónsson, J. Phys. Chem. B 108 (2004) 17886.[6] J. Rossmeisl, Z.-W. Qu, H. Zhu, G.-J. Kroes, J.K. Nørskov, J. Electroanal. Chem. 607
(2007) 83.[7] V.R. Stamenkovic, B.S. Moon, K.J.J. Mayrhofer, P.N. Ross, N.M. Markovic, J. Ross-
meisl, J. Greeley, J.K. Nørskov, Angew. Chem. Int. Ed. 45 (2006) 2897.[8] J. Greeley, I.E.L. Stephens, A.S. Bondarenko, T.P. Johansson, H.A. Hansen, T.F.
Jaramillo, J. Rossmeisl, I. Chorkendorff, J.K. Nørskov, Nat. Chem. 1 (2009) 552.[9] U. Nilekar, M. Mavrikakis, Surf. Sci. 602 (2008) 89.10] M.J. Janik, C.D. Taylor, M. Neurock, J. Electrochem. Soc. 156 (2009) 126.11] H.A. Hansen, J. Rossmeisl, J.K. Nørskov, Phys. Chem. Chem. Phys. 10 (2008) 3722.12] B. Hammer, L.B. Hansen, J.K. Nørskov, Phys. Rev. B 59 (1999) 7413.13] H.J. Monkhorst, J.D. Pack, Phys. Rev. B 13 (1976) 5188.14] D. Vanderbilt, Phys. Rev. B 41 (1990) 7892.15] H. Jónsson, G. Mills, K.W. Jacobsen, in: B.J. Berne, G. Ciccotti, D.F. Coker (Eds.),
Classical and Quantum Dynamics in Condensed Phase Simulations, World Sci-entific, Singapore, 1998.
16] G. Henkelman, H. Jónsson, J. Chem. Phys. 113 (2000) 9978.17] M. Dion, H. Rydberg, E. Schröder, D.C. Langreth, B.I. Lundqvist, Phys. Rev. Lett.
92 (2004) 246401.18] Y. Zhang, W. Yang, Phys. Rev. Lett. 80 (1998) 890.19] Dacapo pseudopotential code, URL: https://wiki.fysik.dtu.dk/dacapo, Center
for Atomic Scale Materiale Design (CAMD), Technical University of Denmark,Lyngby.
20] J.J. Mortensen, L.B. Hansen, K.W. Jacobsen, Phys. Rev. B 71 (2005) 035109.

imica
[
[
[
[[[[[[
[[[[
[
[[
[
[
[[
[
V. Tripkovic et al. / Electroch
21] Atomic Simulation Environment (ASE), URL: https://wiki.fysik.dtu.dk/ase,Center for Atomic Scale Materiale Design (CAMD), Technical University of Den-mark, Lyngby.
22] H. Ogasawara, B. Brena, D. Nordlund, M. Nyberg, A. Pelmenschikov, L.G.M. Pet-terson, A. Nilsson, Phys. Rev. Lett. 89 (2002) 276102.
23] T. Schiros, L.-Å. Näslund, K. Andersson, J. Gyllenpalm, G.S. Karlberg, M. Odelius,H. Ogasawara, L.G.M. Pettersson, A. Nilsson, J. Phys. Chem. C 111 (2007) 15003.
24] A. Michaelides, P. Hu, J. Chem. Phys. 114 (2001) 1.25] P.J. Feibelman, Science 295 (2002) 99.26] A. Roudgar, A. Groß, Chem. Phys. Lett. 409 (2005) 157.27] S. Schnur, A. Groß, New J. Phys. 11 (2009) 125003.28] A. Michaelides, A. Alavi, D.A. King, Phys. Rev. B 64 (2004) 113404.29] J. Rossmeisl, J.K. Nørskov, C.D. Taylor, M.J. Janik, M. Neurock, J. Phys. Chem. B
110 (2006) 21833.30] C. Clay, S. Haq, A. Hodgson, Phys. Rev. Lett. 92 (2004) 46102.31] G.S. Karlberg, G. Wahnström, Phys. Rev. Lett. 92 (2004) 136103.32] G.S. Karlberg, G. Wahnström, J. Chem. Phys. 122 (2005) 194705.33] G.S. Karlberg, T.F. Jaramillo, E. Skúlason, J. Rossmeisl, T. Bligaard, J.K. Nørskov,
Phys. Rev. Lett. 99 (2007) 126101.
[[
[
Acta 55 (2010) 7975–7981 7981
34] N.M. Markovic, H.A. Gasteiger, P.N. Ross, J. Phys. Chem. 99 (1995)3411.
35] H. Noguchi, T. Okada, K. Uosaki, Faraday Discuss. 140 (2009) 125.36] M. Wakisaka, H. Suzuki, S. Mitsui, H. Uchida, M. Watanabe, J. Phys. Chem. C 112
(2008) 2750.37] E. Skúlason, G.S. Karlberg, J. Rossmeisl, T. Bligaard, J. Greeley, H. Jónsson, J.K.
Nørskov, Phys. Chem. Chem. Phys. 9 (2007) 3241.38] J. Rossmeisl, E. Skúlason, M.E. Björketun, V. Tripkovic, J.K. Nørskov, Chem. Phys.
Lett. 466 (2008) 68.39] A. Michaelides, P. Hu, J. Am. Chem. Soc. 123 (2001) 4235.40] G.S. Karlberg, J. Rossmeisl, J.K. Nørskov, Phys. Chem. Chem. Phys. 9 (2007)
5158.41] B.N. Grgur, N.M. Markovic, P.N. Ross, Can. J. Chem. 75 (1997) 1465.
42] F. Tian, R. Jinnouchi, A.B. Anderson, J. Chem. Phys. 113 (2009) 17484.43] F. Abild-Pedersen, J. Greeley, F. Studt, J. Rossmeisl, T.R. Munter, P.G.Moses, E. Skulason, T. Bligaard, J.K. Nørskov, Phys. Rev. Lett. 99 (2007)016105.
44] K.Y. Yeh, S.A. Wasileski, M.J. Janik, Phys. Chem. Chem. Phys. 11 (2009)10108.