the osiris weight of evidence approach: its for skin sensitisation
TRANSCRIPT
Regulatory Toxicology and Pharmacology xxx (2013) xxx–xxx
Contents lists available at SciVerse ScienceDirect
Regulatory Toxicology and Pharmacology
journal homepage: www.elsevier .com/locate /yr tph
The OSIRIS Weight of Evidence approach: ITS for skin sensitisation
0273-2300/$ - see front matter � 2013 Elsevier Inc. All rights reserved.http://dx.doi.org/10.1016/j.yrtph.2013.06.003
⇑ Corresponding author. Address: RIVM, P.O. Box 1, 3720 BA Bilthoven, TheNetherlands. Fax: +31 302744401.
E-mail address: [email protected] (E. Rorije).
Please cite this article in press as: Rorije, E., et al. The OSIRIS Weight of Evidence approach: ITS for skin sensitisation. Regul. Toxicol. Pharmacol.http://dx.doi.org/10.1016/j.yrtph.2013.06.003
Emiel Rorije a,⇑, Tom Aldenberg a, Harrie Buist b, Dinant Kroese b, Gerrit Schüürmann c,d
a National Institute for Public Health and the Environment (RIVM), Antonie van Leeuwenhoeklaan 9, 3721 MA Bilthoven, The Netherlandsb TNO Innovation for Life, Research Group Quality & Safety, Utrechtseweg 48, 3704 HE Zeist, The Netherlandsc UFZ Department of Ecological Chemistry, Helmholtz Centre for Environmental Research, Permoserstr. 15, 04318 Leipzig, Germanyd Institute for Organic Chemistry, Technical University Bergakademie Freiberg, Leipziger Str. 29, 09596 Freiberg, Germany
a r t i c l e i n f o
Article history:Available online xxxx
Keywords:Integrated Testing StrategyITSREACHWeight-of-EvidenceWoEBayesian inference
a b s t r a c t
Within the EU FP6 project OSIRIS approaches to Integrated Testing Strategies (ITSs) were developed, withthe aim to facilitate the use of non-test and non-animal testing information in regulatory risk assessmentof chemicals. This paper describes an analytical Weight-of-Evidence (WoE) approach to an ITS for theendpoint of skin sensitisation. It specifically addresses the European chemicals legislation REACH, butthe concept is readily applicable to ITS and WoE procedures in other regulatory frameworks, and for othertoxicological endpoints. Bayesian statistics are applied to estimate the reliability of a conclusion on thesensitisation potential of a chemical, combining evidence from different information sources such asQSAR model predictions, in vitro and in vivo test results. The methodology allows for adaptation of theweight of individual information sources to account for the different levels of reliability of the individualITS components. The calculated reliability of the WoE conclusion gives an objective, transparent andreproducible measure to decide if the information requirements for data evaluation are satisfied. Further-more, in case the WoE is not sufficient, it gives the possibility to evaluate a priori if and how it will bepossible to fulfil the information requirements with additional tests and/or model predictions.
� 2013 Elsevier Inc. All rights reserved.
1. Introduction
Within the EU FP6 project OSIRIS (2011), different approachesto Integrated Testing Strategies (ITSs) were developed with theaim to facilitate the use of non-animal testing information in theregulatory hazard and risk assessment of chemicals. Four toxico-logically relevant endpoints for humans were considered: repeateddose toxicity, mutagenicity & carcinogenicity and skin sensitisation(see Vermeire et al., 2013).
Through the implementation of the European Directive REACHin 2007 (EC, 2006), alternatives for animal testing have gained in-creased importance for the toxicological assessment of chemicalsubstances. The 3R principles of reducing, refining and replacinganimal testing (Russell and Burch, 1959) have led to a paradigmshift in REACH. The original idea was to replace a given animaltest by a single in vitro alternative (1:1 replacement), but theIntegrated Testing Strategy (ITS) approach aims at exploiting thecombined information generated from several (n) non-animalmethods in order to – partly or fully – replace the respective
animal experiment (1:n replacement). OSIRIS addressed humanand environmental endpoints, combining in silico (QSAR, structuralalerts, read-across), in vitro and in vivo information to enable andsupport a predictive hazard assessment of chemical substances.
This article describes the specifics of the development of an ITSfor the toxicological endpoint skin sensitisation. The generalframework for human toxicity ITSs is described by Vermeireet al. (2013). A categorical endpoint ITS (mutagenicity), and a com-bined categorical and continuous endpoint (carcinogenicity) ITSare given by Buist et al. (2013). A generalized approach for contin-uous endpoints is applied to repeated dose toxicity testing byTluczkiewicz et al. (2013). In a further OSIRIS publication, majorin silico ITS components that may serve to identify substancesof concern regarding both human and environmental end-points have been characterized in terms of their scope, scientificrationale, application domain and known limitations (Nendzaet al., 2013).
The main goal of any ITS and also of these examples is to estab-lish a procedure by which one can reach a conclusion on the reli-ability, adequacy and validity of a battery of available data for aspecific toxicological end point. It should indicate if additional dataare required for classification and risk assessment, and possiblyalso indicate which information would be sufficient to fill a possi-ble data gap.
(2013),
2 E. Rorije et al. / Regulatory Toxicology and Pharmacology xxx (2013) xxx–xxx
1.1. REACH information requirements for the endpoint skinsensitisation
Under REACH, skin sensitisation is an endpoint that must beconsidered for substances that are imported or produced in vol-umes equal to or greater than 1 ton per annum (EC, 2006). Theinformation requirements are outlined in Annex VII of the legaltext. The information requirement for skin sensitisation is the re-sult of a murine Local Lymph Node Assay (LLNA) (OECD, 2010),or equivalent. Information from the Guinea Pig Maximization Test(GPMT) (OECD, 1992) is also explicitly mentioned as acceptable, ifit is pre-existing information. However, the LLNA is the test ofchoice if new experimental data has to be generated. This is dueto animal welfare concerns, and is not driven by differences in reli-ability of the two tests. Additionally, LLNA may give insight intothe sensitising potency. A generalized description of the alterna-tives that might be used in place of animal testing are given in An-nex XI of the regulation. An ITS framework for skin sensitisationand a number of specific alternatives for animal tests on skin sen-sitisation are described in Chapter R7.3 of the REACH guidance oninformation requirements (REACH, 2012). The first step in this ITSis to consider which information is already available from humandata, historical (animal) testing, (Q)SARs, chemical category andread-across approaches and/or in vitro testing. If the existing infor-mation is sufficient for classification and labelling and risk assess-ment, then the process stops. If the information is insufficient,additional testing needs to be considered. Surrogate assays andvarious QSAR approaches are highlighted in the technical guidanceas a potential sources of information in this ITS, and the usershould apply a ‘‘Weight of Evidence’’ (WoE) procedure. However,no practical guidance is currently provided on how to weigh thedifferent information sources in such a procedure.
The presently introduced OSIRIS ITS for skin sensitisation pro-vides a procedure for weighting different sources of information(mentioned in the technical guidance). It specifically answers thefollowing question: When is the body of evidence sufficient to fulfilthe REACH information requirement, which in this case meansinformation equivalent to a result from an in vivo LLNA.
1.2. ITSs for skin sensitisation
Recently a number of ITS approaches or Weight of Evidence pro-cedures for skin sensitization have been published. Ball et al.(2011) present a WoE procedure for skin sensitisation of eight sur-factants, combining both in vitro and in vivo tests. Their WoE pro-cedure is qualitative and the results of in vitro tests aidinterpretation of in vivo results, they do not replace in vivo testing.Scheel and Keller (2012) perform a qualitative WoE procedure toconclude on the skin sensitisation potential of five prodrugs, com-bining in silico predictions, read-across and in vivo LLNA results.
Ellison et al. (2010) present a WoE procedure using a battery ofin silico tools for predicting skin sensitisation potential. Expert as-signed, semi-quantitative weighting of the different QSAR modelsis used. The authors do not use statistical concepts to weigh thevarious models. Instead, equal weight is given to predictions fromdifferent models. The paper concludes that assigning weights tothe different models is one of the largest problems encounteredwhen using a WoE approach. The possibility to do this based onpredictive statistics from the various QSAR models is discussed,indicating that this implicitly means using statistics from a trainingdata set and subsequently applying these statistics to unknowncompounds.
Bauch et al. (2012) combine three in vitro tests in a battery,deriving the predictive performance of the battery directly fromthe complete test data matrix. For predicting the skin sensitisation
Please cite this article in press as: Rorije, E., et al. The OSIRIS Weight of Evidenhttp://dx.doi.org/10.1016/j.yrtph.2013.06.003
potential of a new compound, all three tests therefore need to beperformed.
Nukada et al. (2013) introduce a test battery of one in silico, onein chemico and one in vitro test to predict the outcome of the LLNA.They apply simple scores of 0, 1 or 2 to the in vitro and in chemicotest result, and 0 or 1 to the in silico prediction. Adding these scoresgives a score of 0–5, which is related to five LLNA potency classifi-cations: extreme (5), strong (4), moderate (3), weak (2) or not clas-sified (0 or 1).
A more general discussion of the concept of using Bayesianinference in ITS is given by Vermeire et al. (2007), Jaworska et al.(2010) and Aldenberg and Jaworska (2010), also as part of the OSI-RIS project efforts. The approach in the last two papers is illus-trated by data from in vitro mutagenicity tests, and does notaddress skin sensitisation. In another paper by Jaworska et al.(2011), Bayesian networks are applied for the prediction of skinsensitisation. Data from different in silico, in chemico, in vitro andin vivo tests are combined to a prediction model with a well-de-fined predictive performance (relative to the LLNA). It gives highlyvaluable information on the contribution of different informationsources to the overall reliability of the prediction. For example,the model indicates that the contribution from information on skinpenetration to a reliable prediction of the LLNA result is minimal oreven zero. However, the prediction model by Jaworska et al. (2011)and all other examples of WoE or ITS mentioned here, lack discus-sion of regulatory acceptance of the conclusions. No decision point(‘‘threshold’’) is defined at which the model is supposed to havefulfilled the information requirements of a regulatory frameworkin any of the ITS examples.
This paper builds on the concept of using Bayesian statistics tocalculate the probability that the WoE conclusion is correct. In-stead of a prediction model or an evaluation for specific sub-stances, a concept of a quantitative, reproducible WoE analysis ispresented. The predictive performance of each individual test ormodel serves to determine its weight in the WoE procedure. Theseweights then allow a conclusion on the compliance with testrequirements under REACH. If the conclusion on compliance isnegative, the individual weights can be used to generate the mostoptimal Testing Strategy (using the least number of animals, cost-ing the least, and/or requiring the least time investment) to fill thedata gap identified in the WoE procedure. The approach presentedshows the incremental value (in terms of an increased probabilityof being correct) of adding tests. It results in the qualification‘equivocal’ (probability of the WoE conclusion is too low) in thecase of seriously conflicting data, too little data, and/or when thecombined predictive performance of the available test results isnot sufficient.
The predictive performances presented for the different models,tests and assays discussed in this article are indicative, since theydepend on the choices made with regard to the interpretation ofthe model predictions or assay results and the specific dataset forwhich the predictive performance is calculated. Therefore, the pre-sented predictive performances should be seen as illustrations tothe concept of using Bayesian inference for performing a Weightof Evidence analysis, and are not meant as validation or valuationof the individual model performance.
2. Methodology
2.1. REACH skin sensitisation ITS
The ITS as elaborated in Chapter R7.3 of the REACH technicalguidance, given in the form of a flow scheme, is reproduced inFig. 1. For the evaluation of the endpoint of skin sensitisation inthe OSIRIS ITS, this general flow scheme was followed. However,
ce approach: ITS for skin sensitisation. Regul. Toxicol. Pharmacol. (2013),
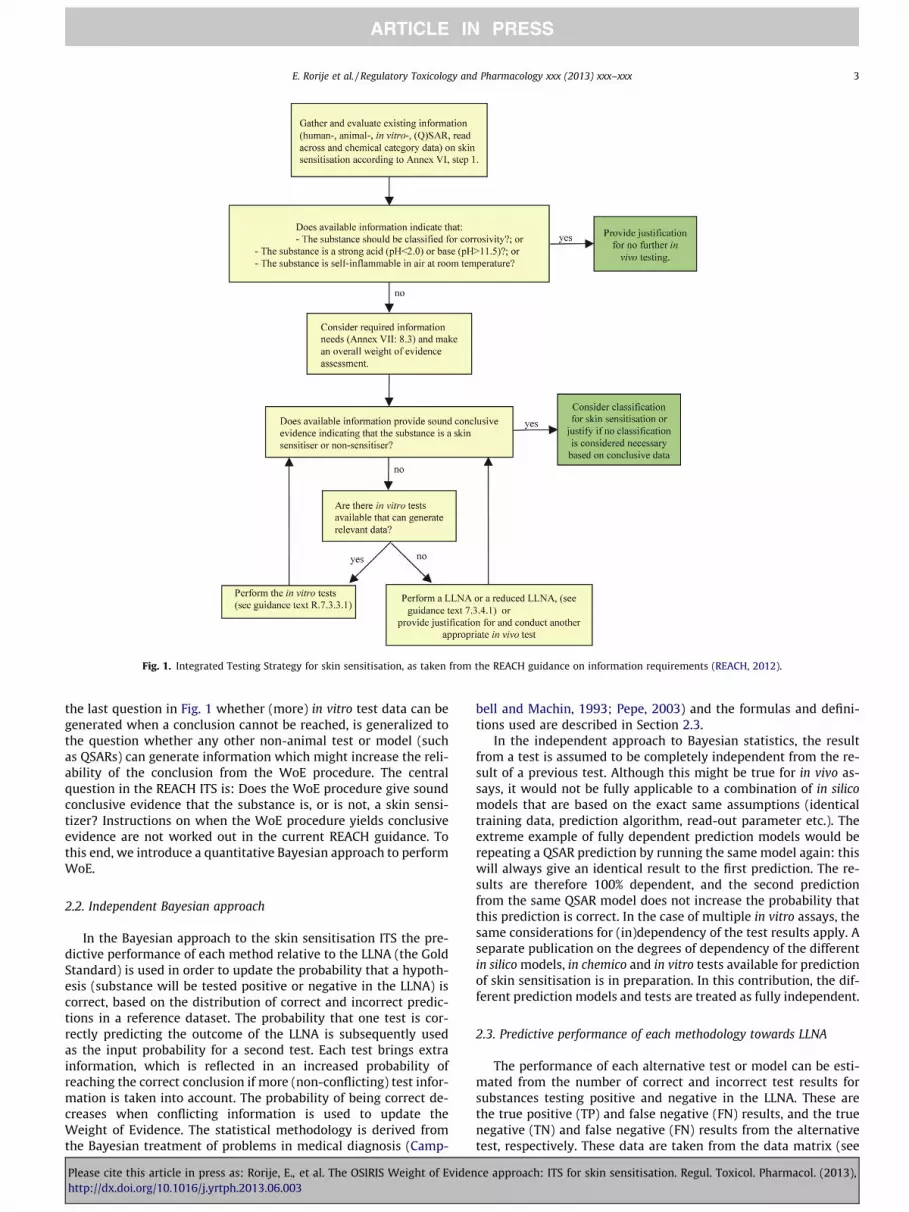
Fig. 1. Integrated Testing Strategy for skin sensitisation, as taken from the REACH guidance on information requirements (REACH, 2012).
E. Rorije et al. / Regulatory Toxicology and Pharmacology xxx (2013) xxx–xxx 3
the last question in Fig. 1 whether (more) in vitro test data can begenerated when a conclusion cannot be reached, is generalized tothe question whether any other non-animal test or model (suchas QSARs) can generate information which might increase the reli-ability of the conclusion from the WoE procedure. The centralquestion in the REACH ITS is: Does the WoE procedure give soundconclusive evidence that the substance is, or is not, a skin sensi-tizer? Instructions on when the WoE procedure yields conclusiveevidence are not worked out in the current REACH guidance. Tothis end, we introduce a quantitative Bayesian approach to performWoE.
2.2. Independent Bayesian approach
In the Bayesian approach to the skin sensitisation ITS the pre-dictive performance of each method relative to the LLNA (the GoldStandard) is used in order to update the probability that a hypoth-esis (substance will be tested positive or negative in the LLNA) iscorrect, based on the distribution of correct and incorrect predic-tions in a reference dataset. The probability that one test is cor-rectly predicting the outcome of the LLNA is subsequently usedas the input probability for a second test. Each test brings extrainformation, which is reflected in an increased probability ofreaching the correct conclusion if more (non-conflicting) test infor-mation is taken into account. The probability of being correct de-creases when conflicting information is used to update theWeight of Evidence. The statistical methodology is derived fromthe Bayesian treatment of problems in medical diagnosis (Camp-
Please cite this article in press as: Rorije, E., et al. The OSIRIS Weight of Evidenhttp://dx.doi.org/10.1016/j.yrtph.2013.06.003
bell and Machin, 1993; Pepe, 2003) and the formulas and defini-tions used are described in Section 2.3.
In the independent approach to Bayesian statistics, the resultfrom a test is assumed to be completely independent from the re-sult of a previous test. Although this might be true for in vivo as-says, it would not be fully applicable to a combination of in silicomodels that are based on the exact same assumptions (identicaltraining data, prediction algorithm, read-out parameter etc.). Theextreme example of fully dependent prediction models would berepeating a QSAR prediction by running the same model again: thiswill always give an identical result to the first prediction. The re-sults are therefore 100% dependent, and the second predictionfrom the same QSAR model does not increase the probability thatthis prediction is correct. In the case of multiple in vitro assays, thesame considerations for (in)dependency of the test results apply. Aseparate publication on the degrees of dependency of the differentin silico models, in chemico and in vitro tests available for predictionof skin sensitisation is in preparation. In this contribution, the dif-ferent prediction models and tests are treated as fully independent.
2.3. Predictive performance of each methodology towards LLNA
The performance of each alternative test or model can be esti-mated from the number of correct and incorrect test results forsubstances testing positive and negative in the LLNA. These arethe true positive (TP) and false negative (FN) results, and the truenegative (TN) and false negative (FN) results from the alternativetest, respectively. These data are taken from the data matrix (see
ce approach: ITS for skin sensitisation. Regul. Toxicol. Pharmacol. (2013),
Table 1Probabilities that a prediction will be correct and their corresponding analytical WoE+and WoE� values (applying Eqs. (5) and (6) respectively).
Probability (%) WoE+ WoE�
50 0.00 0.0060 1.76 �1.7670 3.68 �3.6880 6.02 �6.0290 9.54 �9.5495 12.79 �12.79100 1 �1
4 E. Rorije et al. / Regulatory Toxicology and Pharmacology xxx (2013) xxx–xxx
Section 2.4). The so-called Cooper statistics Sensitivity (Se, or TruePositive Fraction, TPF) and Specificity (Sp, or True Negative Frac-tion, TNF) of the alternative test or model towards the LLNA arecalculated from these observations:
Se ¼ TPF ¼ TPðTPþ FNÞ ð1Þ
Sp ¼ TNF ¼ TNðFPþ TNÞ ð2Þ
The probability that a substance will test positive in the LLNA(LLNA+) given a positive result from a test (T+) is denoted asPr(LLNA+| T+), also named Positive Predictive Value (PPV). It is de-fined as:
PrðLLNAþ j TþÞ ¼ PPV ¼ Se� pSe� pþ ð1� SpÞ � ð1� pÞ ð3Þ
with p being the prior (pre-test) probability that a substancewould test positive in the LLNA. This is the so-called posteriorprobability of a positive endpoint, given a positive test result,which follows from Bayes’ Theorem. Technical details are givenin the short tutorial on Bayesian analysis, in the electronic Supple-mental Material. If no previous information is available, the uni-form discrete (uninformed) prior of p = 0.5 is used. For thenegative hypothesis (negative in the LLNA, given a negative test re-sult; the Negative Predictive Value or NPV) the posterior probabil-ity becomes:
PrðLLNA� j T�Þ ¼ NPV ¼ Sp� ð1� pÞð1� SeÞ � pþ Sp� ð1� pÞ ð4Þ
Assuming that results from different alternative tests or modelsare independent, the posterior probability from one test can thenbe used as the prior probability for a subsequent test. This waythe probabilities from different sources of information are com-bined to give an overall probability that the hypothesis (substancewill test positive or negative in the LLNA) is correct, given a num-ber of alternative test predictions.
Assuming a non-informative prior, the diagnostic likelihoodratios (c.f. Pepe, 2003) are equal to the ratios of posteriorprobabilities. These are expressed in odds. When the odds arelog-transformed, the method becomes a simple additive quantita-tive Weight-of-Evidence procedure. This analytical WoE value isdefined in Jaworska et al. (2010), Aldenberg and Jaworska (2010)and Nendza et al. (2010), and also used in Buist et al. (2013). Theanalytical WoE for the positive endpoint, given a positive alterna-tive test, becomes:
WoEþ ¼ 10� log10Se
ð1� SpÞ ¼ 10� log10PPV
ð1� PPVÞ ð5Þ
The WoE towards a positive endpoint, for a negative alternativetest result is:
Woe� ¼ 10� log10ð1� SeÞ
Sp¼ 10� log10
ð1� NPVÞNPV
ð6Þ
Please cite this article in press as: Rorije, E., et al. The OSIRIS Weight of Evidenhttp://dx.doi.org/10.1016/j.yrtph.2013.06.003
The WoE� is defined in such a way that, for a well-behaved test,a negative alternative test result has a negative WoE on thehypothesis that the endpoint is positive. Assuming independencebetween tests, this allows addition of conflicting test results (posi-tive and negative predictions) in the WoE procedure. Thus, theseanalytical WoE’s behave like true weights in a WoE procedure tosum to a combined WoE value. A combined analytical WoE can al-ways be calculated back to a probability that the substance willtest positive in the LLNA, using:
PrðLLNAþ j TestsÞ ¼ 100:1�WoE
1þ100:1�WoE PrðLLNAþ j TestsÞ ¼ 100:1�WoE
1þ100:1�WoE
ð7Þ
The probability that a substance will test negative in the LLNA isthen given by
PrðLLNA� j TestsÞ ¼ 1� PrðLLNAþ j TestsÞ ð8Þ
The necessity to use this formal statistical approach, and the useof WoE is illustrated by the following example. Intuitively a readerwill understand that a PPV of 80% for an individual model will givea probability of 80% (4 out of 5) that its prediction will be correct. Itis however not intuitive what the probability of a correct predic-tion is when two different models, with each an individual PPVof 80%, are combined. Bayesian statistics allows to calculate thatprobability. The transformation to analytical WoE serves to makethe non-linear addition of individual probabilities more intuitive,as the log transformation allows direct addition of individualWoE. A model with a PPV of 80% has (Eq. (5)) a WoE+ of 6.02. Whentwo models with each a PPV of 80% are both predicting positive,their individual WoE+ can be added, i.e. the WoE of the combinedevidence is 12.04. This translates back (Eq. (7)) to a probability ofbeing correct of 94.11% (16 out of 17). So the PPV of these twomodels both predicting positive is 94%. To help interpretation ofthe analytical WoE values Table 1 gives the corresponding WoEvalues for a number of probabilities. A complete and more formaldescription of the statistics used in the Bayesian approach toWeight of Evidence is given in the Supplemental Material, Annex1, Tutorial Introduction to Bayesian Analysis of Multiple TestResults.
2.4. Information sources for the ITS skin sensitisation
In order to calculate the analytical weights of different predic-tion models in the Bayesian approach, all information sources needto be characterised in terms of their predictive performance to-wards a Gold Standard. In the REACH skin sensitisation ITS theLLNA is considered the Gold Standard, as this is the test which isdefined in REACH as completely fulfilling the information require-ment. The different (alternative) information sources are charac-terized by constructing a data matrix in which the results of eachtest for each single substance are compared to other tests, andmore specifically to the LLNA results. New tests, methods, or evi-dence that should be part of the WoE procedure can be added,by updating the data matrix with the respective data. The charac-terization of the tests by calculating predictive statistics does notinvolve any fitting of the data. Additionally, if better predictive sta-tistics (sensitivity, specificity) are available for a specific model,test or assay – for example from an external validation describedin literature – these statistics can be used instead of the perfor-mance statistics calculated from the data matrix. Especially whenthese statistics are thought to better reflect the true predictivityof a model, test or assay in a given case, this is recommended.
A number of data sources for the endpoint skin sensitisation issummarised by Vandebriel et al. in a recent review article onthe state of the art in non-animal testing for skin sensitisation
ce approach: ITS for skin sensitisation. Regul. Toxicol. Pharmacol. (2013),
Table 2Skin sensitization models and assays, the number of substances for which a result ispresent in the data matrix (n), and references.
Model/assay na Reference
In vivoLLNA 393a NICEATM-ICCVAM (1999)LLNA 220 Gerberick et al. (2005)Reduced LLNA 446 NICEATM-ICCVAM (1999)GPMT 298 Cronin and Basketter (1994)GPMT 44 OECD (2012)
In silicoTOPKAT 1045 Accelrys (2011)DEREK 1045 Lhasa (2012)TIMES-SS 1045 Dimitrov et al. (2005b)SMARTs rules 1045 Enoch et al. (2008)MultiCASE 1045 Danish EPA QSAR database, 2012CAESAR 1045 Chaudhry et al. (2010)Log Kow + MW 1045 Potts and Guy (1992)
In chemicoPeptide reactivity 82 Gerberick et al. (2007)Peptide reactivity (Corl
assay)68 Natsch and Gfeller (2008) and Emter et al.
(2010)
In vitroU937 CD86 16 Python et al. (2007)THP-1 CD54/CD86 29 Sakaguchi et al. (2009)CD34 + DC gene profiling 21 Hooyberghs et al. (2008)CD86 45 Ayehunie et al. (2009)h-CLAT CD86/CD54/
CV75106 Nukada et al. (2012)
KeratinoSens (ARE) 68 Emter et al. (2010)Peptide reactivity, ARE 116 Natsch et al. (2009)
HumanPatch testing 100 de Groot (2008)OECD SIDS summaries 24 OECD (2012)Epidemiological
allergens161 Schlede et al. (2003)
aModels/assays given in italics are evaluated in the presented OSIRIS ITS skin sen-sitisation (see Table 3).
E. Rorije et al. / Regulatory Toxicology and Pharmacology xxx (2013) xxx–xxx 5
(Vandebriel and van Loveren, 2010). The REACH guidance (REACH,2012) also mentions a number of models and tests. Within the OSI-RIS project, a large set of experimental and model prediction datahas been compiled using public test data for most of these skinsensitisation information sources. These sources and the numberof substances for which data could be located are summarized inTable 2.
2.5. Interpreting data sources for the categorical endpoint skinsensitisation
In order to construct a data matrix which has only one evalu-ated result (or no result) for each single chemical, different individ-ual test results need to be interpreted to give an outcome of either‘‘sensitizer’’ or ‘‘non-sensitizer’’. Subsequently, in the case of multi-ple results from a single type of test or model, these need to becombined into one single outcome from the test. The rules appliedto interpret the data sources are given in Table 3. It should be notedthat the choices on how to translate model predictions or test re-sults into the categories ‘‘sensitizer’’ and ‘‘non-sensitizer’’ stronglyinfluence the subsequently derived statistical performance of themethods. The rules given in Table 3 should therefore be seen asan example and not as guidance on the ‘‘correct’’ or best way tointerpret model and test results. The tests given in Table 3 arebriefly introduced here, more information can be found in therespective references given with each test in Table 2. The LocalLymph Node Assay (LLNA) and Guinea Pig Maximization Test(GPMT) are widely accepted in vivo tests for skin sensitization(OECD, 1992; OECD, 2010). In the GPMT test guinea pigs are ex-posed dermally in an induction phase, after which the actual sen-
Please cite this article in press as: Rorije, E., et al. The OSIRIS Weight of Evidenhttp://dx.doi.org/10.1016/j.yrtph.2013.06.003
sitization response (inflammation) is measured in a separatechallenge phase. In the LLNA 3H-thymidine uptake by lymph nodecells is measured as the endpoint after topical application of testchemical to mice (Gerberick et al., 2007), so the actual sensitizationresponse is not measured in this test. In the Human Patch Test(HPT) the sensitization response is measured in humans, also usingan induction and challenge phase. This type of test is not very stan-dardized and no strict conventions are available for interpretationof the results. In the human Cell Line Activation Test (h-CLAT), hu-man dendritic cells are exposed in vitro and phenotypic markers ofactivation (e.g. CD86 and CD54) are examined (Sakaguchi et al.,2009). The MultiCASE software model uses activating and deacti-vating structural fragments (biophores and biophobes) to predictactivity. Within subgroups sharing a biophore differences in activ-ity are modelled using a.o. physico-chemical, electronic as well asstructure related descriptors. The model is computer derived by fit-ting to (experimental) data. The DEREK model is actually an expertsystem which identifies substructures (alerts) that are related tothe empirical observations of skin sensitization. The SMARTs rulesas implemented in the OECD Toolbox are structural fragments de-rived from specific types of reactivity thought to be required for asensitization response, and are therefore built upon (organic) syn-thetic chemistry knowledge. No fitting, or use of training datasetsis involved in these two ‘‘models’’. The TopKAT model is a multi-variate statistical model using a large number of electronic proper-ties, atomic fragments and topological indices (among others) asdescriptors. Finally the TIMES-SS model is a combination of (skin)metabolism simulation and identification of structural fragmentsrelated to skin sensitization.
This procedure finally yields a data matrix of 1045 individualchemicals for which at least one test result (in vivo, in vitro, inchemico and/or in silico) is available. From this data matrix, theindividual correlations between the (evaluated) results from thedifferent tests can be determined in terms of sensitivity and spec-ificity (for a definition of sensitivity and specificity see Section 2.3).The skin sensitisation data matrix was generated as part of a largerinventory of mammalian toxicological testing data within the OSI-RIS project. The database is available interactively through the OSI-RIS Webtool (OSIRIS, 2011), which (among others) containssoftware implementations of the different OSIRIS ITSs. This web-tool also allows to retrieve all testing and non-testing data as pre-sented in this publication, and subsequently to use thisinformation in the WoE procedures developed.
2.6. Adjusting WoE using quality factors
When dealing with an actual test result as opposed to a hypo-thetical (ideal) test result, imperfections in the performed testshould be taken into account in the WoE procedure. For example,if a guideline study was not performed under GLP and was not welldocumented the weight of that particular study should not be sim-ilar to a well-documented GLP study. Similarly, if a QSAR modelwas applied for a substance that was outside of its optimal appli-cability domain (Dimitrov et al., 2005a; Kühne et al., 2009), thiswould have to be reflected by a reduced predictive performanceof the test outcome, and therefore a reduced weight in the WoEprocedure. A direct way of adjusting the weight assigned to amethodology in the Bayesian approach to ITS is modifying (lower-ing) the specificity and sensitivity which are used to calculate theassociated WoE+ and WoE�. The formula used for transformingthe model sensitivity and specificity to a quality-adjusted sensitiv-ity and specificity is
SeðadjustedÞ ¼ 0:5þ QF� ðSe� 0:5Þ ð9Þ
SpðadjustedÞ ¼ 0:5þ QF� ðSp� 0:5Þ ð10Þ
ce approach: ITS for skin sensitisation. Regul. Toxicol. Pharmacol. (2013),
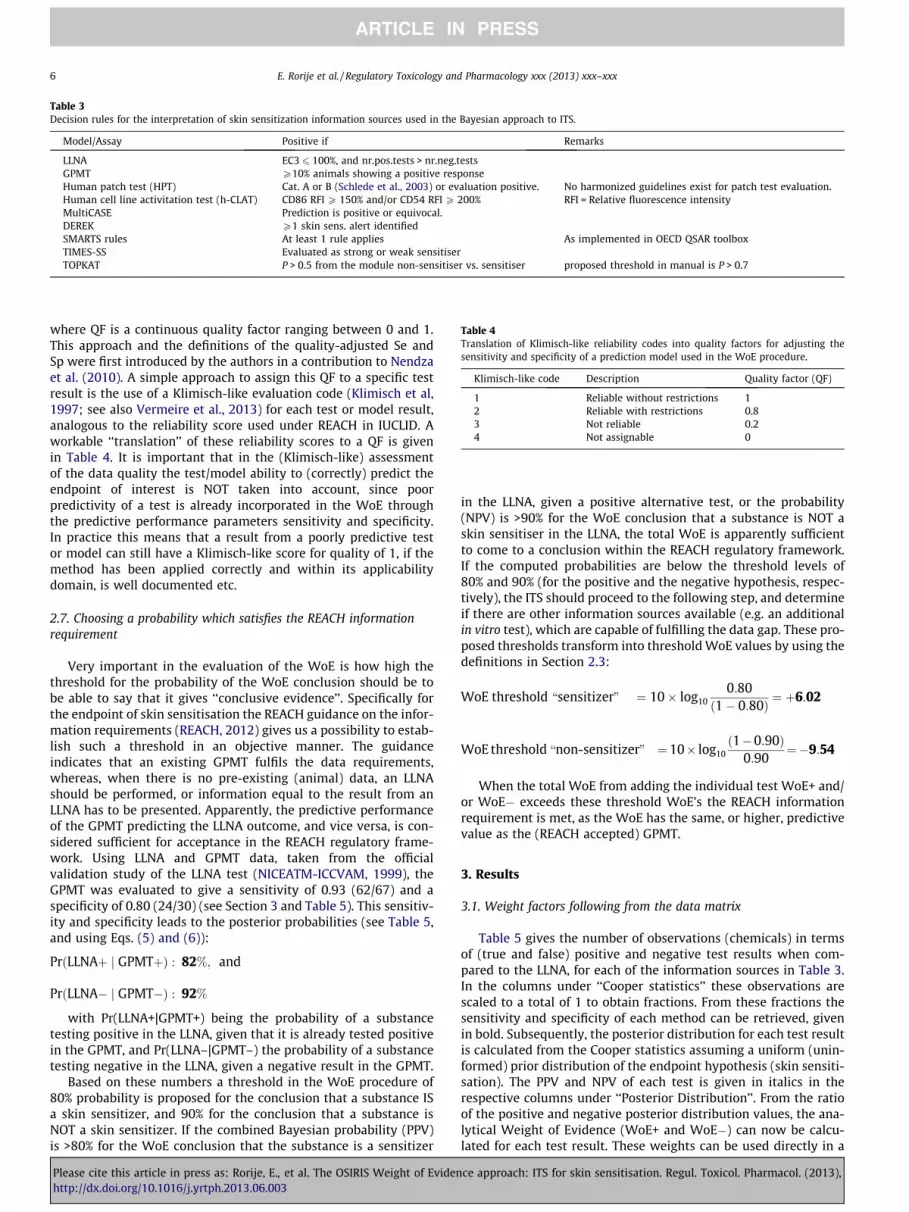
Table 3Decision rules for the interpretation of skin sensitization information sources used in the Bayesian approach to ITS.
Model/Assay Positive if Remarks
LLNA EC3 6 100%, and nr.pos.tests > nr.neg.testsGPMT P10% animals showing a positive responseHuman patch test (HPT) Cat. A or B (Schlede et al., 2003) or evaluation positive. No harmonized guidelines exist for patch test evaluation.Human cell line activitation test (h-CLAT) CD86 RFI P 150% and/or CD54 RFI P 200% RFI = Relative fluorescence intensityMultiCASE Prediction is positive or equivocal.DEREK P1 skin sens. alert identifiedSMARTS rules At least 1 rule applies As implemented in OECD QSAR toolboxTIMES-SS Evaluated as strong or weak sensitiserTOPKAT P > 0.5 from the module non-sensitiser vs. sensitiser proposed threshold in manual is P > 0.7
Table 4Translation of Klimisch-like reliability codes into quality factors for adjusting thesensitivity and specificity of a prediction model used in the WoE procedure.
Klimisch-like code Description Quality factor (QF)
1 Reliable without restrictions 12 Reliable with restrictions 0.83 Not reliable 0.24 Not assignable 0
6 E. Rorije et al. / Regulatory Toxicology and Pharmacology xxx (2013) xxx–xxx
where QF is a continuous quality factor ranging between 0 and 1.This approach and the definitions of the quality-adjusted Se andSp were first introduced by the authors in a contribution to Nendzaet al. (2010). A simple approach to assign this QF to a specific testresult is the use of a Klimisch-like evaluation code (Klimisch et al,1997; see also Vermeire et al., 2013) for each test or model result,analogous to the reliability score used under REACH in IUCLID. Aworkable ‘‘translation’’ of these reliability scores to a QF is givenin Table 4. It is important that in the (Klimisch-like) assessmentof the data quality the test/model ability to (correctly) predict theendpoint of interest is NOT taken into account, since poorpredictivity of a test is already incorporated in the WoE throughthe predictive performance parameters sensitivity and specificity.In practice this means that a result from a poorly predictive testor model can still have a Klimisch-like score for quality of 1, if themethod has been applied correctly and within its applicabilitydomain, is well documented etc.
2.7. Choosing a probability which satisfies the REACH informationrequirement
Very important in the evaluation of the WoE is how high thethreshold for the probability of the WoE conclusion should be tobe able to say that it gives ‘‘conclusive evidence’’. Specifically forthe endpoint of skin sensitisation the REACH guidance on the infor-mation requirements (REACH, 2012) gives us a possibility to estab-lish such a threshold in an objective manner. The guidanceindicates that an existing GPMT fulfils the data requirements,whereas, when there is no pre-existing (animal) data, an LLNAshould be performed, or information equal to the result from anLLNA has to be presented. Apparently, the predictive performanceof the GPMT predicting the LLNA outcome, and vice versa, is con-sidered sufficient for acceptance in the REACH regulatory frame-work. Using LLNA and GPMT data, taken from the officialvalidation study of the LLNA test (NICEATM-ICCVAM, 1999), theGPMT was evaluated to give a sensitivity of 0.93 (62/67) and aspecificity of 0.80 (24/30) (see Section 3 and Table 5). This sensitiv-ity and specificity leads to the posterior probabilities (see Table 5,and using Eqs. (5) and (6)):
PrðLLNAþ j GPMTþÞ : 82%; and
PrðLLNA� j GPMT�Þ : 92%
with Pr(LLNA+|GPMT+) being the probability of a substancetesting positive in the LLNA, given that it is already tested positivein the GPMT, and Pr(LLNA–|GPMT–) the probability of a substancetesting negative in the LLNA, given a negative result in the GPMT.
Based on these numbers a threshold in the WoE procedure of80% probability is proposed for the conclusion that a substance ISa skin sensitizer, and 90% for the conclusion that a substance isNOT a skin sensitizer. If the combined Bayesian probability (PPV)is >80% for the WoE conclusion that the substance is a sensitizer
Please cite this article in press as: Rorije, E., et al. The OSIRIS Weight of Evidenhttp://dx.doi.org/10.1016/j.yrtph.2013.06.003
in the LLNA, given a positive alternative test, or the probability(NPV) is >90% for the WoE conclusion that a substance is NOT askin sensitiser in the LLNA, the total WoE is apparently sufficientto come to a conclusion within the REACH regulatory framework.If the computed probabilities are below the threshold levels of80% and 90% (for the positive and the negative hypothesis, respec-tively), the ITS should proceed to the following step, and determineif there are other information sources available (e.g. an additionalin vitro test), which are capable of fulfilling the data gap. These pro-posed thresholds transform into threshold WoE values by using thedefinitions in Section 2.3:
WoE threshold \sensitizer" ¼ 10� log100:80
ð1� 0:80Þ ¼ þ6:02
WoE threshold \non-sensitizer" ¼ 10� log10ð1�0:90Þ
0:90¼�9:54
When the total WoE from adding the individual test WoE+ and/or WoE� exceeds these threshold WoE’s the REACH informationrequirement is met, as the WoE has the same, or higher, predictivevalue as the (REACH accepted) GPMT.
3. Results
3.1. Weight factors following from the data matrix
Table 5 gives the number of observations (chemicals) in termsof (true and false) positive and negative test results when com-pared to the LLNA, for each of the information sources in Table 3.In the columns under ‘‘Cooper statistics’’ these observations arescaled to a total of 1 to obtain fractions. From these fractions thesensitivity and specificity of each method can be retrieved, givenin bold. Subsequently, the posterior distribution for each test resultis calculated from the Cooper statistics assuming a uniform (unin-formed) prior distribution of the endpoint hypothesis (skin sensiti-sation). The PPV and NPV of each test is given in italics in therespective columns under ‘‘Posterior Distribution’’. From the ratioof the positive and negative posterior distribution values, the ana-lytical Weight of Evidence (WoE+ and WoE�) can now be calcu-lated for each test result. These weights can be used directly in a
ce approach: ITS for skin sensitisation. Regul. Toxicol. Pharmacol. (2013),
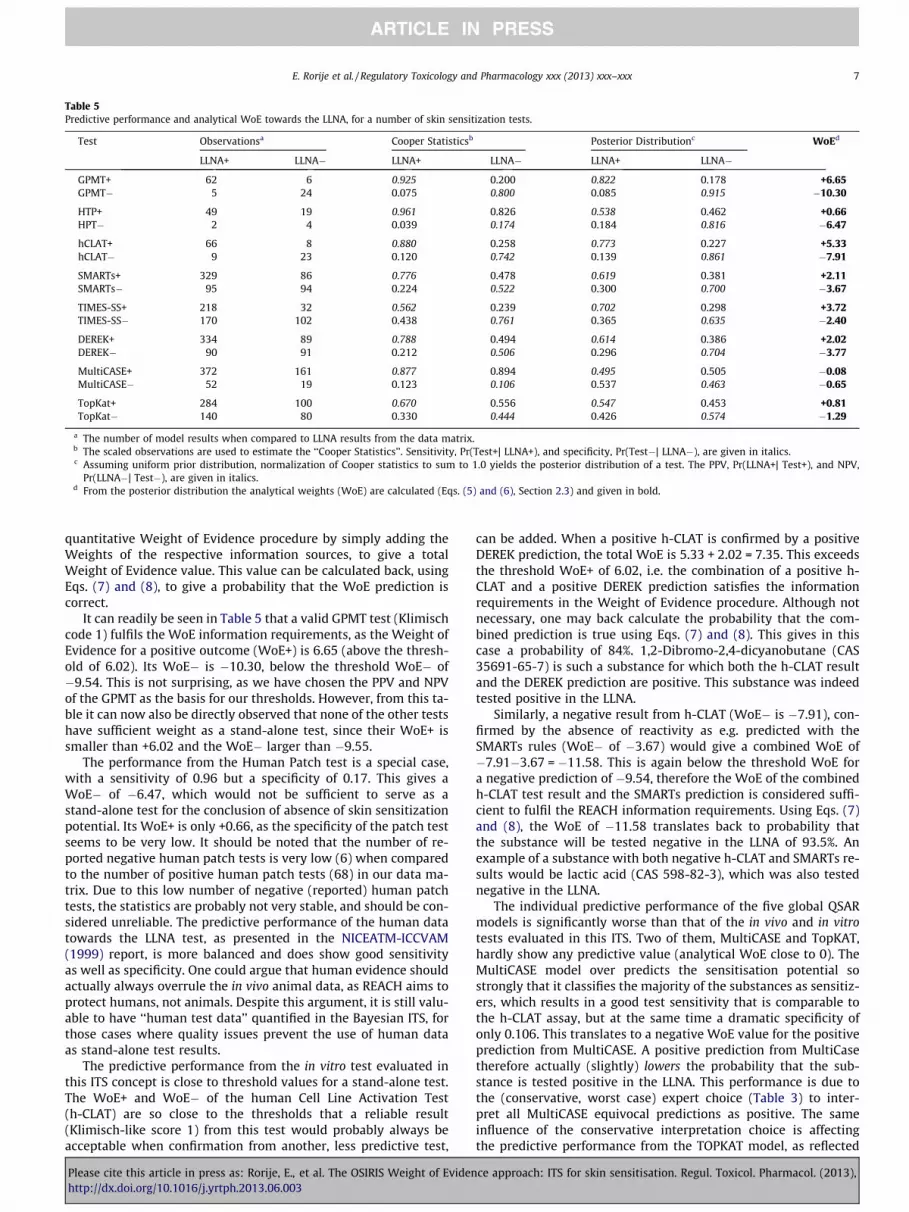
Table 5Predictive performance and analytical WoE towards the LLNA, for a number of skin sensitization tests.
Test Observationsa Cooper Statisticsb Posterior Distributionc WoEd
LLNA+ LLNA� LLNA+ LLNA� LLNA+ LLNA�
GPMT+ 62 6 0.925 0.200 0.822 0.178 +6.65GPMT� 5 24 0.075 0.800 0.085 0.915 �10.30
HTP+ 49 19 0.961 0.826 0.538 0.462 +0.66HPT� 2 4 0.039 0.174 0.184 0.816 �6.47
hCLAT+ 66 8 0.880 0.258 0.773 0.227 +5.33hCLAT� 9 23 0.120 0.742 0.139 0.861 �7.91
SMARTs+ 329 86 0.776 0.478 0.619 0.381 +2.11SMARTs� 95 94 0.224 0.522 0.300 0.700 �3.67
TIMES-SS+ 218 32 0.562 0.239 0.702 0.298 +3.72TIMES-SS� 170 102 0.438 0.761 0.365 0.635 �2.40
DEREK+ 334 89 0.788 0.494 0.614 0.386 +2.02DEREK� 90 91 0.212 0.506 0.296 0.704 �3.77
MultiCASE+ 372 161 0.877 0.894 0.495 0.505 �0.08MultiCASE� 52 19 0.123 0.106 0.537 0.463 �0.65
TopKat+ 284 100 0.670 0.556 0.547 0.453 +0.81TopKat� 140 80 0.330 0.444 0.426 0.574 �1.29
a The number of model results when compared to LLNA results from the data matrix.b The scaled observations are used to estimate the ‘‘Cooper Statistics’’. Sensitivity, Pr(Test+| LLNA+), and specificity, Pr(Test�| LLNA�), are given in italics.c Assuming uniform prior distribution, normalization of Cooper statistics to sum to 1.0 yields the posterior distribution of a test. The PPV, Pr(LLNA+| Test+), and NPV,
Pr(LLNA�| Test�), are given in italics.d From the posterior distribution the analytical weights (WoE) are calculated (Eqs. (5) and (6), Section 2.3) and given in bold.
E. Rorije et al. / Regulatory Toxicology and Pharmacology xxx (2013) xxx–xxx 7
quantitative Weight of Evidence procedure by simply adding theWeights of the respective information sources, to give a totalWeight of Evidence value. This value can be calculated back, usingEqs. (7) and (8), to give a probability that the WoE prediction iscorrect.
It can readily be seen in Table 5 that a valid GPMT test (Klimischcode 1) fulfils the WoE information requirements, as the Weight ofEvidence for a positive outcome (WoE+) is 6.65 (above the thresh-old of 6.02). Its WoE� is �10.30, below the threshold WoE� of�9.54. This is not surprising, as we have chosen the PPV and NPVof the GPMT as the basis for our thresholds. However, from this ta-ble it can now also be directly observed that none of the other testshave sufficient weight as a stand-alone test, since their WoE+ issmaller than +6.02 and the WoE� larger than �9.55.
The performance from the Human Patch test is a special case,with a sensitivity of 0.96 but a specificity of 0.17. This gives aWoE� of �6.47, which would not be sufficient to serve as astand-alone test for the conclusion of absence of skin sensitizationpotential. Its WoE+ is only +0.66, as the specificity of the patch testseems to be very low. It should be noted that the number of re-ported negative human patch tests is very low (6) when comparedto the number of positive human patch tests (68) in our data ma-trix. Due to this low number of negative (reported) human patchtests, the statistics are probably not very stable, and should be con-sidered unreliable. The predictive performance of the human datatowards the LLNA test, as presented in the NICEATM-ICCVAM(1999) report, is more balanced and does show good sensitivityas well as specificity. One could argue that human evidence shouldactually always overrule the in vivo animal data, as REACH aims toprotect humans, not animals. Despite this argument, it is still valu-able to have ‘‘human test data’’ quantified in the Bayesian ITS, forthose cases where quality issues prevent the use of human dataas stand-alone test results.
The predictive performance from the in vitro test evaluated inthis ITS concept is close to threshold values for a stand-alone test.The WoE+ and WoE� of the human Cell Line Activation Test(h-CLAT) are so close to the thresholds that a reliable result(Klimisch-like score 1) from this test would probably always beacceptable when confirmation from another, less predictive test,
Please cite this article in press as: Rorije, E., et al. The OSIRIS Weight of Evidenhttp://dx.doi.org/10.1016/j.yrtph.2013.06.003
can be added. When a positive h-CLAT is confirmed by a positiveDEREK prediction, the total WoE is 5.33 + 2.02 = 7.35. This exceedsthe threshold WoE+ of 6.02, i.e. the combination of a positive h-CLAT and a positive DEREK prediction satisfies the informationrequirements in the Weight of Evidence procedure. Although notnecessary, one may back calculate the probability that the com-bined prediction is true using Eqs. (7) and (8). This gives in thiscase a probability of 84%. 1,2-Dibromo-2,4-dicyanobutane (CAS35691-65-7) is such a substance for which both the h-CLAT resultand the DEREK prediction are positive. This substance was indeedtested positive in the LLNA.
Similarly, a negative result from h-CLAT (WoE� is �7.91), con-firmed by the absence of reactivity as e.g. predicted with theSMARTs rules (WoE� of �3.67) would give a combined WoE of�7.91�3.67 = �11.58. This is again below the threshold WoE fora negative prediction of �9.54, therefore the WoE of the combinedh-CLAT test result and the SMARTs prediction is considered suffi-cient to fulfil the REACH information requirements. Using Eqs. (7)and (8), the WoE of �11.58 translates back to probability thatthe substance will be tested negative in the LLNA of 93.5%. Anexample of a substance with both negative h-CLAT and SMARTs re-sults would be lactic acid (CAS 598-82-3), which was also testednegative in the LLNA.
The individual predictive performance of the five global QSARmodels is significantly worse than that of the in vivo and in vitrotests evaluated in this ITS. Two of them, MultiCASE and TopKAT,hardly show any predictive value (analytical WoE close to 0). TheMultiCASE model over predicts the sensitisation potential sostrongly that it classifies the majority of the substances as sensitiz-ers, which results in a good test sensitivity that is comparable tothe h-CLAT assay, but at the same time a dramatic specificity ofonly 0.106. This translates to a negative WoE value for the positiveprediction from MultiCASE. A positive prediction from MultiCasetherefore actually (slightly) lowers the probability that the sub-stance is tested positive in the LLNA. This performance is due tothe (conservative, worst case) expert choice (Table 3) to inter-pret all MultiCASE equivocal predictions as positive. The sameinfluence of the conservative interpretation choice is affectingthe predictive performance from the TOPKAT model, as reflected
ce approach: ITS for skin sensitisation. Regul. Toxicol. Pharmacol. (2013),
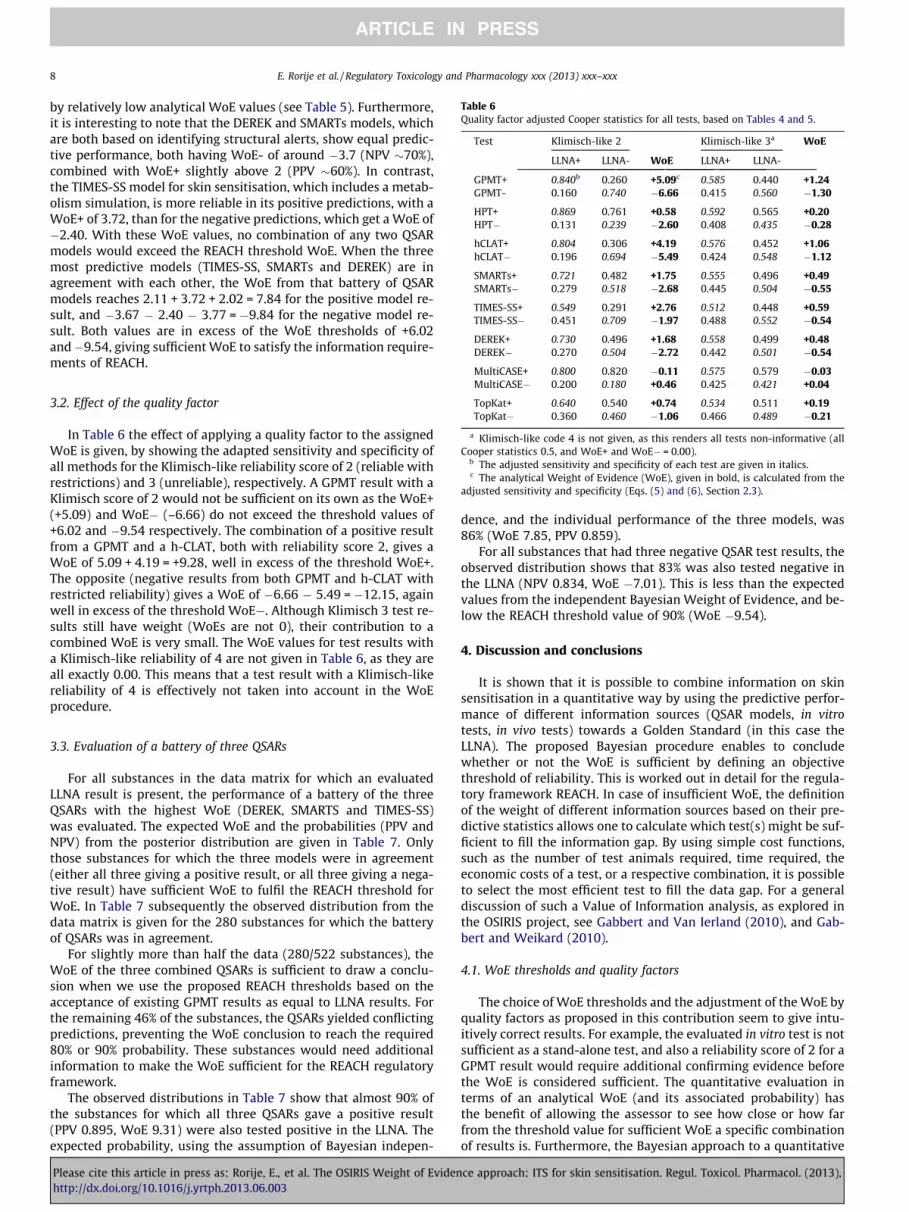
Table 6Quality factor adjusted Cooper statistics for all tests, based on Tables 4 and 5.
Test Klimisch-like 2 Klimisch-like 3a WoE
LLNA+ LLNA- WoE LLNA+ LLNA-
GPMT+ 0.840b 0.260 +5.09c 0.585 0.440 +1.24GPMT- 0.160 0.740 �6.66 0.415 0.560 �1.30
HPT+ 0.869 0.761 +0.58 0.592 0.565 +0.20HPT� 0.131 0.239 �2.60 0.408 0.435 �0.28
hCLAT+ 0.804 0.306 +4.19 0.576 0.452 +1.06hCLAT� 0.196 0.694 �5.49 0.424 0.548 �1.12
SMARTs+ 0.721 0.482 +1.75 0.555 0.496 +0.49SMARTs� 0.279 0.518 �2.68 0.445 0.504 �0.55
TIMES-SS+ 0.549 0.291 +2.76 0.512 0.448 +0.59TIMES-SS� 0.451 0.709 �1.97 0.488 0.552 �0.54
DEREK+ 0.730 0.496 +1.68 0.558 0.499 +0.48DEREK� 0.270 0.504 �2.72 0.442 0.501 �0.54
MultiCASE+ 0.800 0.820 �0.11 0.575 0.579 �0.03
8 E. Rorije et al. / Regulatory Toxicology and Pharmacology xxx (2013) xxx–xxx
by relatively low analytical WoE values (see Table 5). Furthermore,it is interesting to note that the DEREK and SMARTs models, whichare both based on identifying structural alerts, show equal predic-tive performance, both having WoE- of around �3.7 (NPV �70%),combined with WoE+ slightly above 2 (PPV �60%). In contrast,the TIMES-SS model for skin sensitisation, which includes a metab-olism simulation, is more reliable in its positive predictions, with aWoE+ of 3.72, than for the negative predictions, which get a WoE of�2.40. With these WoE values, no combination of any two QSARmodels would exceed the REACH threshold WoE. When the threemost predictive models (TIMES-SS, SMARTs and DEREK) are inagreement with each other, the WoE from that battery of QSARmodels reaches 2.11 + 3.72 + 2.02 = 7.84 for the positive model re-sult, and �3.67 � 2.40 � 3.77 = �9.84 for the negative model re-sult. Both values are in excess of the WoE thresholds of +6.02and�9.54, giving sufficient WoE to satisfy the information require-ments of REACH.
MultiCASE� 0.200 0.180 +0.46 0.425 0.421 +0.04
TopKat+ 0.640 0.540 +0.74 0.534 0.511 +0.19TopKat� 0.360 0.460 �1.06 0.466 0.489 �0.21
a Klimisch-like code 4 is not given, as this renders all tests non-informative (allCooper statistics 0.5, and WoE+ and WoE� = 0.00).
b The adjusted sensitivity and specificity of each test are given in italics.c The analytical Weight of Evidence (WoE), given in bold, is calculated from the
adjusted sensitivity and specificity (Eqs. (5) and (6), Section 2.3).
3.2. Effect of the quality factor
In Table 6 the effect of applying a quality factor to the assignedWoE is given, by showing the adapted sensitivity and specificity ofall methods for the Klimisch-like reliability score of 2 (reliable withrestrictions) and 3 (unreliable), respectively. A GPMT result with aKlimisch score of 2 would not be sufficient on its own as the WoE+(+5.09) and WoE� (–6.66) do not exceed the threshold values of+6.02 and �9.54 respectively. The combination of a positive resultfrom a GPMT and a h-CLAT, both with reliability score 2, gives aWoE of 5.09 + 4.19 = +9.28, well in excess of the threshold WoE+.The opposite (negative results from both GPMT and h-CLAT withrestricted reliability) gives a WoE of �6.66 � 5.49 = �12.15, againwell in excess of the threshold WoE�. Although Klimisch 3 test re-sults still have weight (WoEs are not 0), their contribution to acombined WoE is very small. The WoE values for test results witha Klimisch-like reliability of 4 are not given in Table 6, as they areall exactly 0.00. This means that a test result with a Klimisch-likereliability of 4 is effectively not taken into account in the WoEprocedure.
3.3. Evaluation of a battery of three QSARs
For all substances in the data matrix for which an evaluatedLLNA result is present, the performance of a battery of the threeQSARs with the highest WoE (DEREK, SMARTS and TIMES-SS)was evaluated. The expected WoE and the probabilities (PPV andNPV) from the posterior distribution are given in Table 7. Onlythose substances for which the three models were in agreement(either all three giving a positive result, or all three giving a nega-tive result) have sufficient WoE to fulfil the REACH threshold forWoE. In Table 7 subsequently the observed distribution from thedata matrix is given for the 280 substances for which the batteryof QSARs was in agreement.
For slightly more than half the data (280/522 substances), theWoE of the three combined QSARs is sufficient to draw a conclu-sion when we use the proposed REACH thresholds based on theacceptance of existing GPMT results as equal to LLNA results. Forthe remaining 46% of the substances, the QSARs yielded conflictingpredictions, preventing the WoE conclusion to reach the required80% or 90% probability. These substances would need additionalinformation to make the WoE sufficient for the REACH regulatoryframework.
The observed distributions in Table 7 show that almost 90% ofthe substances for which all three QSARs gave a positive result(PPV 0.895, WoE 9.31) were also tested positive in the LLNA. Theexpected probability, using the assumption of Bayesian indepen-
Please cite this article in press as: Rorije, E., et al. The OSIRIS Weight of Evidenhttp://dx.doi.org/10.1016/j.yrtph.2013.06.003
dence, and the individual performance of the three models, was86% (WoE 7.85, PPV 0.859).
For all substances that had three negative QSAR test results, theobserved distribution shows that 83% was also tested negative inthe LLNA (NPV 0.834, WoE �7.01). This is less than the expectedvalues from the independent Bayesian Weight of Evidence, and be-low the REACH threshold value of 90% (WoE �9.54).
4. Discussion and conclusions
It is shown that it is possible to combine information on skinsensitisation in a quantitative way by using the predictive perfor-mance of different information sources (QSAR models, in vitrotests, in vivo tests) towards a Golden Standard (in this case theLLNA). The proposed Bayesian procedure enables to concludewhether or not the WoE is sufficient by defining an objectivethreshold of reliability. This is worked out in detail for the regula-tory framework REACH. In case of insufficient WoE, the definitionof the weight of different information sources based on their pre-dictive statistics allows one to calculate which test(s) might be suf-ficient to fill the information gap. By using simple cost functions,such as the number of test animals required, time required, theeconomic costs of a test, or a respective combination, it is possibleto select the most efficient test to fill the data gap. For a generaldiscussion of such a Value of Information analysis, as explored inthe OSIRIS project, see Gabbert and Van Ierland (2010), and Gab-bert and Weikard (2010).
4.1. WoE thresholds and quality factors
The choice of WoE thresholds and the adjustment of the WoE byquality factors as proposed in this contribution seem to give intu-itively correct results. For example, the evaluated in vitro test is notsufficient as a stand-alone test, and also a reliability score of 2 for aGPMT result would require additional confirming evidence beforethe WoE is considered sufficient. The quantitative evaluation interms of an analytical WoE (and its associated probability) hasthe benefit of allowing the assessor to see how close or how farfrom the threshold value for sufficient WoE a specific combinationof results is. Furthermore, the Bayesian approach to a quantitative
ce approach: ITS for skin sensitisation. Regul. Toxicol. Pharmacol. (2013),
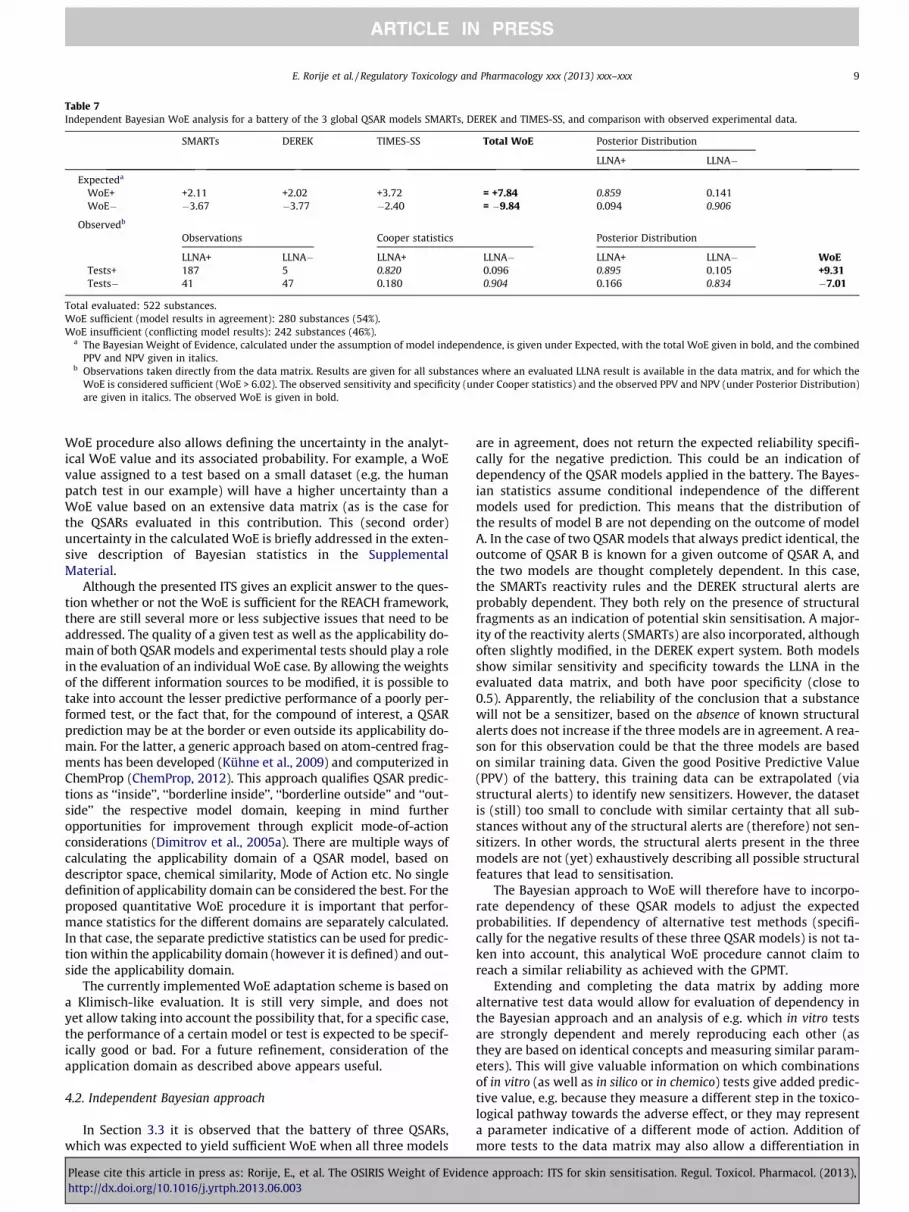
Table 7Independent Bayesian WoE analysis for a battery of the 3 global QSAR models SMARTs, DEREK and TIMES-SS, and comparison with observed experimental data.
SMARTs DEREK TIMES-SS Total WoE Posterior Distribution
LLNA+ LLNA�
Expecteda
WoE+ +2.11 +2.02 +3.72 = +7.84 0.859 0.141WoE� �3.67 �3.77 �2.40 = �9.84 0.094 0.906
Observedb
Observations Cooper statistics Posterior Distribution
LLNA+ LLNA� LLNA+ LLNA� LLNA+ LLNA� WoETests+ 187 5 0.820 0.096 0.895 0.105 +9.31Tests� 41 47 0.180 0.904 0.166 0.834 �7.01
Total evaluated: 522 substances.WoE sufficient (model results in agreement): 280 substances (54%).WoE insufficient (conflicting model results): 242 substances (46%).
a The Bayesian Weight of Evidence, calculated under the assumption of model independence, is given under Expected, with the total WoE given in bold, and the combinedPPV and NPV given in italics.
b Observations taken directly from the data matrix. Results are given for all substances where an evaluated LLNA result is available in the data matrix, and for which theWoE is considered sufficient (WoE > 6.02). The observed sensitivity and specificity (under Cooper statistics) and the observed PPV and NPV (under Posterior Distribution)are given in italics. The observed WoE is given in bold.
E. Rorije et al. / Regulatory Toxicology and Pharmacology xxx (2013) xxx–xxx 9
WoE procedure also allows defining the uncertainty in the analyt-ical WoE value and its associated probability. For example, a WoEvalue assigned to a test based on a small dataset (e.g. the humanpatch test in our example) will have a higher uncertainty than aWoE value based on an extensive data matrix (as is the case forthe QSARs evaluated in this contribution. This (second order)uncertainty in the calculated WoE is briefly addressed in the exten-sive description of Bayesian statistics in the SupplementalMaterial.
Although the presented ITS gives an explicit answer to the ques-tion whether or not the WoE is sufficient for the REACH framework,there are still several more or less subjective issues that need to beaddressed. The quality of a given test as well as the applicability do-main of both QSAR models and experimental tests should play a rolein the evaluation of an individual WoE case. By allowing the weightsof the different information sources to be modified, it is possible totake into account the lesser predictive performance of a poorly per-formed test, or the fact that, for the compound of interest, a QSARprediction may be at the border or even outside its applicability do-main. For the latter, a generic approach based on atom-centred frag-ments has been developed (Kühne et al., 2009) and computerized inChemProp (ChemProp, 2012). This approach qualifies QSAR predic-tions as ‘‘inside’’, ‘‘borderline inside’’, ‘‘borderline outside’’ and ‘‘out-side’’ the respective model domain, keeping in mind furtheropportunities for improvement through explicit mode-of-actionconsiderations (Dimitrov et al., 2005a). There are multiple ways ofcalculating the applicability domain of a QSAR model, based ondescriptor space, chemical similarity, Mode of Action etc. No singledefinition of applicability domain can be considered the best. For theproposed quantitative WoE procedure it is important that perfor-mance statistics for the different domains are separately calculated.In that case, the separate predictive statistics can be used for predic-tion within the applicability domain (however it is defined) and out-side the applicability domain.
The currently implemented WoE adaptation scheme is based ona Klimisch-like evaluation. It is still very simple, and does notyet allow taking into account the possibility that, for a specific case,the performance of a certain model or test is expected to be specif-ically good or bad. For a future refinement, consideration of theapplication domain as described above appears useful.
4.2. Independent Bayesian approach
In Section 3.3 it is observed that the battery of three QSARs,which was expected to yield sufficient WoE when all three models
Please cite this article in press as: Rorije, E., et al. The OSIRIS Weight of Evidenhttp://dx.doi.org/10.1016/j.yrtph.2013.06.003
are in agreement, does not return the expected reliability specifi-cally for the negative prediction. This could be an indication ofdependency of the QSAR models applied in the battery. The Bayes-ian statistics assume conditional independence of the differentmodels used for prediction. This means that the distribution ofthe results of model B are not depending on the outcome of modelA. In the case of two QSAR models that always predict identical, theoutcome of QSAR B is known for a given outcome of QSAR A, andthe two models are thought completely dependent. In this case,the SMARTs reactivity rules and the DEREK structural alerts areprobably dependent. They both rely on the presence of structuralfragments as an indication of potential skin sensitisation. A major-ity of the reactivity alerts (SMARTs) are also incorporated, althoughoften slightly modified, in the DEREK expert system. Both modelsshow similar sensitivity and specificity towards the LLNA in theevaluated data matrix, and both have poor specificity (close to0.5). Apparently, the reliability of the conclusion that a substancewill not be a sensitizer, based on the absence of known structuralalerts does not increase if the three models are in agreement. A rea-son for this observation could be that the three models are basedon similar training data. Given the good Positive Predictive Value(PPV) of the battery, this training data can be extrapolated (viastructural alerts) to identify new sensitizers. However, the datasetis (still) too small to conclude with similar certainty that all sub-stances without any of the structural alerts are (therefore) not sen-sitizers. In other words, the structural alerts present in the threemodels are not (yet) exhaustively describing all possible structuralfeatures that lead to sensitisation.
The Bayesian approach to WoE will therefore have to incorpo-rate dependency of these QSAR models to adjust the expectedprobabilities. If dependency of alternative test methods (specifi-cally for the negative results of these three QSAR models) is not ta-ken into account, this analytical WoE procedure cannot claim toreach a similar reliability as achieved with the GPMT.
Extending and completing the data matrix by adding morealternative test data would allow for evaluation of dependency inthe Bayesian approach and an analysis of e.g. which in vitro testsare strongly dependent and merely reproducing each other (asthey are based on identical concepts and measuring similar param-eters). This will give valuable information on which combinationsof in vitro (as well as in silico or in chemico) tests give added predic-tive value, e.g. because they measure a different step in the toxico-logical pathway towards the adverse effect, or they may representa parameter indicative of a different mode of action. Addition ofmore tests to the data matrix may also allow a differentiation in
ce approach: ITS for skin sensitisation. Regul. Toxicol. Pharmacol. (2013),
10 E. Rorije et al. / Regulatory Toxicology and Pharmacology xxx (2013) xxx–xxx
the performance of different test due to different domains ofapplicability.
As additional information sources in the WoE procedure, vari-ous possibilities exist. Different molecular initiating events leadingto skin sensitisation and mutagenicity have a considerable range ofreaction mechanisms in common, emphasizing the potential of or-ganic electrophiles and pro-electrophiles to act as both DNA-reac-tive and protein-reactive agents (Albert, 1997, or more recentlyMekenyan et al., 2010). Accordingly, knowledge about mutagenicor genotoxic effects of a compound may provide pertinent infor-mation regarding its likelihood to act as skin sensitizer. This ap-proach provides an example of extrapolating across humanendpoints, which may be analysed in more detail for its potentialinclusion in future extensions of the currently introduced ITS forskin sensitisation. Mode-of-Action based extrapolation across end-points might provide a promising opportunity for additional evi-dence in a Weight of Evidence procedure, and thereby toreduction of animal testing in regulatory frameworks (Carmichaelet al., 2011). Chemo-assays may also serve as non-animal ITS com-ponent for determining toxicity-relevant protein reactivity (Böhmeet al., 2009; Gerberick et al., 2007; Natsch and Gfeller, 2008) andDNA reactivity (Thaens et al., 2012), and thus the chemistry under-lying the molecular initiating event leading to skin sensitisation.This holds true correspondingly for computational chemistryschemes that quantify electrophilic reactivity from molecularstructure (Mulliner et al., 2011; Wondrousch et al., 2010).
A further opportunity for extending the currently introducedITS framework is to consider also mechanistic information throughextrapolation from aquatic toxicity as an ‘‘alternative test’’. Here, aprominent example is given by Michael acceptors that are knownto act as skin sensitizers (Karlberg et al., 2008) because of theirelectrophilic reactivity, and for the same reason exert excess toxic-ity in in vitro bioassays (Blaschke et al., 2012; Böhme et al., 2010). Itfollows that already available information about the excess toxicityof a given electrophile may trigger the suspicion of skin sensitisat-ion potential under circumstances that still need to be worked outthrough a respective systematic concordance analysis.
When multiple sources of similar evidence are actually used ina (quantitative) Weight of Evidence analysis, the analysis of modeldependency becomes more important. The independent Bayesianaddition of probilities will then lead to overestimation of the reli-ability of the WoE conclusion. Such overestimation of the reliabil-ity is observed in our example for the negative WoE conclusionbased on three in silico models. It should be noted that overestima-tion of reliability due to assumed model independence will also oc-cur in qualitative or semi-quantitative Weight of Evidenceapproaches such as proposed by Ellison et al. (2010) or Nukadaet al. (2013).
4.3. Objectivity, transparency and reproducibility
Quantifying and subsequently combining the (general) predic-tive performance of (alternative) methods using a pre-set algorithm(Bayesian inference) gives an objective, transparent, and reproduc-ible way to perform a WoE procedure. The definition of a clearthreshold of reliability, as indicated by the acceptance of differenttest results within the regulatory framework REACH, gives anobjective measure of the reliability considered sufficient forWeight of Evidence. Transparency of the proposed WoE procedureis increased by the use of this objective threshold value. Any devi-ations from the procedure will require documentation of thesedeviations, giving both motivation and quantification. Finally, theuse of the proposed procedures and algorithms to calculate a quan-titative measure for WoE makes this procedure fully reproducible.This can not be said from qualitative procedures, where judgementof sufficiency of the Weight of Evidence is often made using subjec-
Please cite this article in press as: Rorije, E., et al. The OSIRIS Weight of Evidenhttp://dx.doi.org/10.1016/j.yrtph.2013.06.003
tive, case-by-case arguments. The lack of a quantifiable thresholdwill also hamper reproducibility, as it is up to the user to decidewhen WoE is considered sufficient. The proposed quantitativeWoE procedure will therefore facilitate a harmonized evaluationof the WoE, and allow discussion on the choices made for specificcases. As such, it is preferable to a qualitative approach, which isoften termed ‘‘expert judgement’’, and which might sometimeslead to (selectively) ignoring pieces of information that do not fitthe desired WoE puzzle.
Conflict of interest statement
The authors declare that there are no conflicts of interest.
Acknowledgments
Support is gratefully acknowledged from the Sixth EU ResearchFramework Programme for funding Project no. GOCE-CT-2007-037017 OSIRIS; the Dutch Ministry of Infrastructure and the Envi-ronment within the scope of Project M/601353 Development ofMethodology for REACH; and Directorate General RIVM withinthe scope of the Strategic Research Project S/601001. We thankRob Vandebriel for his contributions to the manuscript, and wethank Ralph Kühne and Eduard Pauné for their feedback on themethodology and their efforts for the implementation of the ITSin the OSIRIS webtool.
Appendix A. Supplementary data
Supplementary data associated with this article can be found, inthe online version, at http://dx.doi.org/10.1016/j.yrtph.2013.06.003.
References
Albert, R.E., 1997. Allergic contact sensitizing chemicals as environmentalcarcinogens. Environ. Health Perspect. 105, 940–948.
Aldenberg, T., Jaworska, J., 2010. Multiple test in silico Weight-of-Evidence fortoxicological endpoints. In: Cronin, M.D., Madden, J.C. (Eds.), In SilicoToxicology. Principles and Applications. RSC Publishing, pp. 558–583.
Ayehunie, S., Snell, M., Child, M., Klausner, M., 2009. A plasmacytoid dendritic cell(CD123+/CD11c-) based assay system to predict contact allergenicity ofchemicals. Toxicology 264, 1–9.
Accelrys, 2011. http://accelrys.com/products/datasheets/topkat.pdf.Ball, N., Cagen, S., Carrillo, J.C., Certa, H., Eigler, D., Emter, R., Faulhammer, F., Garcia,
C., Graham, C., Haux, C., Kolle, S.N., Kreiling, R., Natsch, A., Mehling, A., 2011.Evaluating the sensitisation potential of surfactants: integrating data from thelocal lymph node assay, guinea pig maximization test, and in vitro methods in aweight-of-evidence approach. Regul. Toxicol. Pharmacol. 60, 389–400.
Bauch, C., Kolle, S.N., Ramirez, T., Eltze, T., Fabian, E., Mehling, A., Teubner, W., vanRavenzwaay, B., Landsiedel, R., 2012. Putting the parts together: combiningin vitro methods to test for skin sensitising potentials. Regul. Toxicol.Pharmacol. 63, 489–504.
Blaschke, U., Eismann, K., Böhme, A., Paschke, A., Schüürmann, G., 2012. Structuralalerts for the excess toxicity of acrylates, methacrylates and propiolates derivedfrom their short-term and long-term bacterial toxicity. Chem. Res. Toxicol. 25,170–180.
Böhme, A., Thaens, D., Paschke, A., Schüürmann, G., 2009. Kinetic glutathionechemoassay to quantify thiol reactivity of organic electrophiles – application toa,b-unsaturated ketones, acrylates, and propiolates. Chem. Res. Toxicol. 22,742–750.
Böhme, A., Thaens, D., Schramm, F., Paschke, A., Schüürmann, G., 2010. Thiolreactivity and its impact on the ciliate toxicity of a,b-un saturated aldehydes,ketones and esters. Chem. Res. Toxicol. 23, 1905–1912.
Buist, H.E., Aldenberg, T., Batke, M., Escher, S., Kühne, R., Marquart, H., Pauné, E.,Rorije, E., Schüürmann, G., Kroese, D., 2013. The OSIRIS Weight of Evidenceapproach: ITS mutagenicity and ITS carcinogenicity. Regul. Toxicol. Pharmacol,http://dx.doi.org/10.1016/j.yrtph.2013.01.002.
Campbell, M.J., Machin, D., 1993. Medical Statistics. A Commonsense Approach.John Wiley & Sons, Chichester.
Carmichael, N., Bausen, M., Boobis, A.R., Cohen, S.M., Embry, M., Fruijtier-Pölloth, C.,Greim, H., Lewis, R., 2011. Bette Meek M.E., Mellor H., Vickers C., Doe J., Usingmode of action information to improve regulatory decision-making: anECETOC/ILSI RF/HESI workshop overview. Crit. Rev. Toxicol. 41, 175–186.
ce approach: ITS for skin sensitisation. Regul. Toxicol. Pharmacol. (2013),
E. Rorije et al. / Regulatory Toxicology and Pharmacology xxx (2013) xxx–xxx 11
Chaudhry, Q., Piclin, N., Cotterill, J., Pintore, M., Price, N.R., Chrétien, J.R., Roncaglioni,A., 2010. Global QSAR models of skin sensitizers for regulatory purposes.Chemistry Central Journal 4 (Suppl 1), S5. http://dx.doi.org/10.1186/1752-153X-4-S1-S5. Available from http://journal.chemistrycentral.com/content/4/S1/S5.
ChemProp 2012. Chemical Properties Estimation Software System (ChemProp)5.2.7, 2012. UFZ Department of Ecological Chemistry, Leipzig, Germany. http://www.ufz.de/index.php?en=6738.
Cronin, M.T., Basketter, D.A., 1994. Multivariate QSAR analysis of a skin sensitisationdatabase. SAR QSAR Environ. Res. 2, 159–179.
Danish EPA QSAR database, 2012. http://130.226.165.14/index.html.De Groot, A.C., 2008. Patch Testing, . Test Concentrations and Vehicles for 4350
Chemicals, 3rd ed. Acdegroot publishing, Wapserveen, The Netherlands, ISBN978-90-813233-1-4, 456 pp., http://www.patchtesting.info.
Dimitrov, S., Dimitrova, G., Pavlov, T., Dimitrova, N., Patlewicz, G., Niemela, J.,Mekenyan, O., 2005a. A Stepwise approach for defining the applicability domainof SAR and QSAR models. J. Chem. Inf. Model. 45, 839–849.
Dimitrov, S.D., Low, L.K., Patlewicz, G.Y., Kern, P.S., Dimitrova, G.D., Comber, M.H.I.,Philips, R.D., Niemela, J., Bailey, P.T., Mekenyan, O.G., 2005b. Skin sensitisation:modeling based on skin metabolism simulation and formation of proteinconjugates. Int. J. Toxicol. 24, 189–204.
EC, 2006. Regulation No 1907/2006 of the European parliament and the council of18 December 2006 concerning the Registration, Evaluation, Authorisation andRestriction of Chemicals (REACH), establishing a European Chemicals Agency,amending Directive 1999/45/EC and repealing Council Regulation (EEC) No 793/93 and Commission Regulation (EC) No 1488/94 as well as Council Directive 76/769/EEC and Commission Directives 91/155/EEC, 93/67/EEC, 93/105/EC and2000/21/EC. Available at http://eurlex.europa.eu/LexUriServ/LexUriServ.do?uri=OJ:L:2006:396:0001:0849:EN:PDF.
Ellison, C.M., Madden, J.C., Judson, P., Cronin, M.T., 2010. Using in silico tools in aWeight of Evidence approach to aid toxicological assessment. Mol. Inform. 29,97–110.
Emter, R., Ellis, G., Natsch, A., 2010. Performance of a novel keratinocyte-basedreporter cell line to screen skin sensitizers in vitro. Toxicol. Appl. Pharmacol.245, 281–290.
Enoch, S.J., Madden, J.C., Cronin, M.T.D., 2008. Identification of mechanisms of toxicaction for skin sensitisation using a SMARTS pattern based approach. SAR QSAREnviron. Res. 19, 555–578.
Gabbert, S., Van Ierland, E.C., 2010. Cost-effectiveness analysis of chemical testingfor decision-support: how to include animal welfare? Hum. Ecol. Risk. Assess.16, 603–620.
Gabbert, S., Weikard, H.-P., 2010. A theory of chemicals regulation and testing. Nat.Res. Forum 34, 155–164.
Gerberick, G.F., Ryan, C.A., Kern, P.S., Schlatter, H., Dearman, R.J., Kimber, I.,Patlewicz, G.Y., Basketter, D.A., 2005. Compilation of historical lymph node datafor evaluation of skin sensitisation alternative methods. Dermatitis 16, 157–202.
Gerberick, G.F., Vassallo, J.D., Foertsch, L.M., Price, B.B., Chaney, J.G., Lepoittevin, J.P.,2007. Quantification of chemical peptide reactivity for screening contactallergens: a classification tree model approach. Toxicol. Sci. 97, 417–427.
Hooyberghs, J., Schoeters, E., Lambrechts, N., Nelissen, I., Witters, H., Schoeters, G.,Van Den Heuvel, R., 2008. A cell-based in vitro alternative to identify skinsensitizers by gene expression. Toxicol. Appl. Pharmacol. 231, 103–111.
Jaworska, J., Gabbert, S., Aldenberg, T., 2010. Towards optimization of chemicaltesting under REACH: a Bayesian network approach to Integrated TestingStrategies. Regul. Toxicol. Pharmacol. 57, 157–167.
Jaworska, J., Harol, A., Kern, P.S., Gerberick, G.F., 2011. Integrating non-animal testinformation into an adaptive testing strategy - skin sensitisation proof ofconcept case. ALTEX 28, 211–225.
Karlberg, A.-T., Berström, M.A., Börje, A., Luthman, K., Nilsson, J.L.G., 2008. Allergiccontact dermatitis – formation, structural requirements, and reactivity of skinsensitizers. Chem. Res. Toxicol. 21, 53–69.
Klimisch, H.-J., Andreae, M., Tillmann, U., 1997. A systematic approach forevaluating the quality of experimental toxicological and ecotoxicological data.Regul. Toxicol. Pharmacol. 25, 1–5.
Kühne, R., Ebert, R.-U., Schüürmann, G., 2009. Chemical domain of QSAR modelsfrom atom-centered fragments. J. Chem. Inf. Model. 49, 2660–2669.
Lhasa, 2013. https://www.lhasalimited.org/derek_nexus/.Mekenyan, O., Patlewicz, G., Stoeva, S., Todorov, M., Dimitrova, G., Kotov, S., Kuseva,
C., Donner, E.M., 2010. Use of genotoxicity information in the development ofintegrated testing strategies (ITS) for skin sensitization. Chem. Res. Toxicol. 23,1519–1540.
Mulliner, D., Wondrousch, D., Schüürmann, G., 2011. Predicting Michael-acceptorreactivity and toxicity through quantum chemical transition-state calculations.Org. Biomol. Chem. 9, 8400–8412.
Natsch, A., Gfeller, H., 2008. LC–MS – based characterization of the peptidereactivity of chemicals to improve the in vitro prediction of the skinsensitisation potential. Toxicol. Sci. 106, 464–478.
Natsch, A., Emter, R., Ellis, G., 2009. Filling the concept with data: integrating datafrom different in vitro and in silico assays on skin sensitizers to explore thebattery approach for animal-free skin sensitisation testing. Toxicol. Sci. 107,106–121.
Nendza, M., Aldenberg, T., Benfenati, E., Benigni, R., Cronin, M.T.D., Escher, S.,Fernandez, A., Gabbert, S., Giralt, F., Hewitt, M., Hrovat, M., Jeram, S., Kroese, D.,Madden, J.C., Mangelsdorf, I., Rallo, R., Roncaglioni, A., Rorije, E., Segner, H.,
Please cite this article in press as: Rorije, E., et al. The OSIRIS Weight of Evidenhttp://dx.doi.org/10.1016/j.yrtph.2013.06.003
Simon-Hettichi, Vermeire, T., 2010. Chapter 4: Data Quality Assessment for InSilico Methods: A Survey of Approaches and Needs. In: Cronin, M.T.D., Madden,J.C. (Eds.), Silico Toxicology. Principles and Applications. Issues in ToxicologyNo.7. The Royal Society of Chemistry Publishing, pp. 100–108, section 4.6.
Nendza, M., Gabbert, S., Kühne, R., Lombardo, A., Roncaglioni, A., Benfenati, E.,Benigni, R., Bossa, C., Strempel, S., Scheringer, M., Fernández, A., Rallo, R., Giralt,F., Dimitrov, S., Mekenyan, O., Bringezu, F., Schüürmann, G., 2013. A com parative survey of chemistry-driven in silico methods to identify hazardous substan ces under REACH. Regulat. Toxicol. Pharmacol. 66, 301–314.
NICEATM-ICCVAM, 1999. The Murine Local Lymph Node Assay: A Test Method forAssessing the Allergic Contact Dermatitis Potential of Chemicals/Compounds.The Results of an Independent Peer Review Evaluation Coordinated by theInteragency Coordinating Committee on the Validation of Alternative Methods(ICCVAM) and the National Toxicology Program Center for the Evaluation ofAlternative Toxicological Methods (NICEATM), NIH Publication No. 99-4494.Available from http://iccvam.niehs.nih.gov/docs/immunotox_docs/llna/llnarep.pdf.
Nukada, Y., Ashikaga, T., Miyazawa, M., Hirota, M., Sakaguchi, H., Sasa, H.,Nishiyama, N., 2012. Prediction of skin sensitisation potency of chemicals byhuman cell line activation test (h-CLAT) and an attempt at classifying skinsensitisation potency. Toxicol. in Vitro 26, 1150–1160.
Nukada, Y., Miyazawa, M., Kazutoshi, S., Sakaguchi, H., Nishiyama, N., 2013. Dataintegration of non-animal tests for the development of a test battery to predict theskin sensitizing potential an potency of chemicals. Toxicol. in Vitro 27, 609–618.
OECD, 1992. Test Guideline No. 406: Skin Sensitization, adopted 17 July 1992.Organisation of Economic Cooperation and Development, Paris, France. DOI:10.1787/9789264070660-en.
OECD, 2010. Test Guideline No. 429: Skin Sensitization: Local Lymph Node Assay,adopted 23 July 2010. Organisation of Economic Cooperation and Development,Paris, France. DOI: 10.1787/9789264071100-en.
OECD, 2012. OECD Existing Chemicals Database. http://webnet.oecd.org/hpv/ui/Default.aspx.
OSIRIS, 2011. Optimized Strategies for Risk Assessment of Industrial Chemicalsthrough Integration of Non-Test and Test Information. EU Project, contract no.GOCE-CT-2007-037017, 2007-2011. OSIRIS project website: http://www.osiris-reach.eu/. OSIRIS webtool implementing a.o. the different ITS approaches developedwithin the project OSIRIS: http://osiris.simpple.com/OSIRIS-ITS/welcome.do.
Pepe, M.S., 2003. The Statistical Evaluation of Medical Tests for Classification andPrediction. Oxford University Press, Oxford.
Potts, R.O., Guy, R.H., 1992. Predicting skin permeability. Pharm. Res. 9, 663–669.Python, F., Goebel, C., Aeby, P., 2007. Assessment of the U937 cell line for the
detection of contact allergens. Toxicol. Appl. Pharmacol. 220, 113–124.REACH, 2012. Guidance on information requirements and chemical safety
assessment R.7a Endpoint specific guidance. Version 2.0, November 2012.Chapter R.7.3 Skin and Respiratory Sensitisation, pp.219-248. Available from:http://echa.europa.eu/documents/10162/13632/information_requirements_r7a_en.pdf.
Russell, W.M.S., and Burch, R.L., 1959. The Principles of Humane ExperimentalTechnique. Methuen, London. Reprinted by UFAW, 1992: 8 Hamilton Close,South Mimms, Potters Bar, Herts EN6 3QD England. ISBN 0 900767 78 2. Anonline version of this reprint is available through: http://altweb.jhsph.edu/pubs/books/humane_exp/het-toc.
Sakaguchi, H., Ashikaga, T., Miyazawa, M., Kosaka, N., Ito, Y., Yoneyama, K., Sono, S.,Itagaki, H., Toyoda, H., Suzuki, H., 2009. The relationship between CD86/CD54expression and THP-1 cell viability in an in vitro skin sensitisation test – humancell line activation test (h-CLAT). Cell Biol. Toxicol. 25, 109–126.
Scheel, J., Keller, D., 2012. Investigation of the skin sensitising properties of 5osmolytic prodrugs in a weight-of-evidence assessment, employing in silico,in vivo, and read across analyses. Int. J. Toxicol. 31, 358–363.
Schlede, E., Aberer, W., Fuchs, T., Gerner, I., Lessmann, H., Maurer, T., Rossbacher, R.,Stropp, G., Wagner, E., Kayser, D., 2003. Chemical substances and contact allergy– 244 substances ranked according to allergenic potency. Toxicology 193, 219–259.
Thaens, D., Heinzelmann, D., Böhme, A., Paschke, A., Schüürmann, G., 2012.Chemoassay screening of DNA-reactive mutagenicity with 4-(4-nitrobenzyl)pyridine – application to epoxides, oxetanes and sulfur heterocycles.Chem. Res. Toxicol. 25, 2092–2102.
Tluczkiewicz, I., Batke, M., Kroese, D., Buist, H., Aldenberg, T., Pauné, E., Grimm, H.,Kühne, R., Schüürmann, G., Mangelsdorf, I., Escher, S., 2013. The OSIRIS Weightof Evidence approach: ITS for the endpoint repeated-dose toxicity (RepDoseITS). Regul. Toxicol. Pharmacol, http://dx.doi.org/10.1016/j.yrtph.2013.02.004.
Vandebriel, R.J., van Loveren, H., 2010. Non-animal sensitization testing: state-of-the-art. Crit. Rev. Toxicol. 40, 389–404.
Vermeire, T., Aldenberg, T., Dang, Z.C., Janer, G., de Knecht, J.A., van Loveren, H.,Peijnenburg, W.J.G.M., Piersma, A.H., Traas, T.P., Verschoor, A.J., van Zijverden,M., Hakkert, B., 2007. Selected Integrated Testing Strategies (ITS) for the riskassessment of chemicals. RIVM Report 601050001, Bilthoven, the Nehterlands.Available from http://www.rivm.nl/dsresource?objectid=rivmp:15521&type=org&disposition=inline.
Vermeire, T., Aldenberg, T., Buist, H., Escher, S., Mangelsdorf, I., Pauné, E., Rorije, E.,Kroese, D., 2013. OSIRIS, a quest for proof of principle for integrated testingstrategies of chemicals for four human health endpoints. Regul. Toxicol.Pharmacol, http://dx.doi.org/10.1016/j.yrtph.2013.01.007.
Wondrousch, D., Böhme, A., Thaens, D., Ost, N., Schüürmann, G., 2010. Localelectrophilicity predicts the toxicity-relevant reactivity of michael acceptors. J.Phys. Chem. Lett. 1, 1605–1610.
ce approach: ITS for skin sensitisation. Regul. Toxicol. Pharmacol. (2013),

The OSIRIS Weight of Evidence approach: ITS for Skin Sensitisation.
https://www.researchgate.net/publication/241692552_The_OSIRIS_Weight_of_Evidence_approach_ITS_for_Skin_Sensitisation[7/18/2013 2:13:54 PM]
0 0 · 0 BOOKMARKS · 5 VIEWS
CITATIONS (0) CITED IN (0)
Where has your publication been cited? Add citing publication
ArticleThe OSIRIS Weight of Evidence approach: ITS for SkinSensitisation.
National Institute for Public Health and the Environment (RIVM), Antonie van Leeuwenhoeklaan9, 3721 MA Bilthoven, The Netherlands. Electronic address: .Regulatory Toxicology and Pharmacology (impact factor: 2.43). 06/2013;DOI:10.1016/j.yrtph.2013.06.003Source: PubMed
Data provided are for informational purposes only. Although carefully collected, accuracy cannot beguaranteed. The impact factor represents a rough estimation of the journal's impact factor and does notreflect the actual current impact factor. Publisher conditions are provided by RoMEO. Differing provisionsfrom the publisher's actual policy or licence agreement may be applicable.
Show self-archiving restrictions
Emiel Rorije, Tom Aldenberg, Harrie Buist, Dinant Kroese, Gerrit Schüürmann
ABSTRACT Within the EU FP6 project OSIRIS approaches to Integrated TestingStrategies (ITSs) were developed, with the aim to facilitate the use of non-test and non-animal testing information in regulatory risk assessment of chemicals. This paper describes
[more]
Tag your publication with topics
Discuss Share Edit
Publish full-text
Publish supplementary resources
AUTHOR CONTRIBUTIONS
Invite
Invite
Invite
Invite
Add the skills you used in this publication:
Tom Aldenberg
Harrie Buist
Dinant Kroese
Gerrit Schüürmann
Emiel Rorije 24.72 · 59.17RIVM
Add skills
DISCUSSIONS (0)
Emiel Rorije 24.72
RIVM
Edit
W
×
ResearchGate
Topics Publications Projects more 0 SearchSearch
The OSIRIS Weight of Evidence approach: ITS for Skin Sensitisation.
https://www.researchgate.net/publication/241692552_The_OSIRIS_Weight_of_Evidence_approach_ITS_for_Skin_Sensitisation[7/18/2013 2:13:54 PM]
© 2013 researchgate.net. All rights reserved. About us · Contact us · Developers · News · Privacy · Terms
SIMILAR PUBLICATIONS
A comparative survey of chemistry-driven in silicomethods to identify hazardous substances under REACH.Monika Nendza, Silke Gabbert, Ralph Kühne, Anna Lombardo,Alessandra Roncaglioni, Emilio Benfenati, Romualdo Benigni,Cecilia Bossa, Sebastian Strempel, Martin Scheringer, AlbertoFernández, Robert Rallo, Francesc Giralt, Sabcho Dimitrov, OvanesMekenyan, Frank Bringezu, Gerrit Schüürmann
OSIRIS, a quest for proof of principle for integrated testingstrategies of chemicals for four human health endpoints.Theo Vermeire, Tom Aldenberg, Harrie Buist, Sylvia Escher, IngeMangelsdorf, Eduard Pauné, Emiel Rorije, Dinant Kroese
A step change towards risk assessment in the 21st centuryGrace Yvonne Patlewicz, Deborah Rosemary Lander
Ask a question to discuss thispublication with otherspecialists.
Discuss this publication