the open transportation journal
TRANSCRIPT
1874-4478/20 Send Orders for Reprints to [email protected]
154
DOI: 10.2174/1874447802014010154, 2020, 14, 154-163
The Open Transportation JournalContent list available at: https://opentransportationjournal.com
RESEARCH ARTICLE
Comparisons Between Braking Experiments and Longitudinal Train DynamicsUsing Friction Coefficient and Braking Pressure Modeling in a Freight Train
Don Bum Choi1,*, Rag-Gyo Jeong2, Yongkook Kim3 and Jangbom Chai4
1Urban Transit Research Team, Korea Railroad Research Institute, Uiwang 16105, Korea2Autonomous Train Research Team, Korea Railroad Research Institute, Uiwang 16105, Korea3Railroad Type Approval Team, Korea Railroad Research Institute, Uiwang 16105, Korea4Mechanical Engineering, 206 Wordlcup-ro, Yeongtong-gu, Suwon16499, Korea
Abstract:
Background:
This paper describes the predictions and validation of the pneumatic emergency braking performance of a freight train consisting of a locomotiveand 20 wagons, generally operated in Korea. It suggests the possibility of replacing the expensive and time-consuming train running tests withlongitudinal train dynamic simulations.
Methods:
The simulation of longitudinal train dynamics of a freight train uses the time integration method of EN 14531. For reasonable simulation results,the characteristics of the train and brake equipment must be considered. For the train characteristics, specifications provided by the vehiclemanufacturer are used. The braking characteristics are analyzed by friction coefficient tests and a braking pressure model. The friction coefficientsof a locomotive and wagons are tested with a dynamo test bench and statistically expanded to account for variability. Freight trains should take intoaccount the braking delay time. To reflect this in the simulation, the brake cylinder pressure pattern model uses pressures and exponential empiricalequations measured at selective positions in a train of 50 vehicles. The simulation results are validated in comparison with those of the brakingtests of a freight train consisting of 1 locomotive and 20 wagons.
Results:
The results of the longitudinal dynamics simulation show very similar results to the running test results based on the speed profile and brakingdistance.
Conclusion:
In particular, the statistical expansion method of the friction coefficient enables robust prediction of the distribution of the braking distance. Thesimulation can reduce or make up for costly and time-consuming repeated braking tests and reduce the risks that may arise during testing.
Keywords: Freight trains, Composite shoes, Friction coefficient, Brake cylinder pressure, Longitudinal train dynamics, Wagon.
Article History Received: April 04, 2020 Revised: May 21, 2020 Accepted: June 03, 2020
1. INTRODUCTION
Since the 1990s, as Korea's industrial structure changedfrom mass production to multi-variety small-scale production,road freight transport has rapidly increased while freighttransport by railroad has been decreased [1].
Recently, according to the government policy forimproving the economic efficiency of freight trains and linking
* Address correspondence to this author at the Urban Transit Research Team,Korea Railroad Research Institute, Uiwang 16105, Korea, Tel:+82314605563;E-mail: [email protected]
with continental railroad routes such as TSR (Trans-SiberianRailway) and TCR (Trans China Railway), the demand forfreight transport by rail has been increased [2, 3]. According tothe operating company's freight vehicle plan, orders for newfreight trains are expected to increase rapidly within the nexttwo years [4].
Newly introduced freight trains are required to prove theirperformance in accordance with the Railroad Safety Act [5]. Ifthe performance cannot be proved by the design data, it isnecessary to carry out repeated running tests.
Comparisons Between Braking Experiments and Longitudinal Trains Dynamic The Open Transportation Journal, 2020, Volume 14 155
In particular, the braking performance of a freight train isone of the most important performance because it is closelyrelated to safety, but it has only been proven by running tests.The running tests are time consuming and expensive, such asthe cost of rail use, installation of measuring devices, anddisruption in commercial train operation during the tests.
This study suggests that Longitudinal Train Dynamics(LTD) simulation can be a method to prove the brakingperformance of a freight train. One of the classic applicationsof LTD simulation is to predict the in-train force depending onthe brake system characteristics such as the delay time andbrake pressure rising pattern [6 - 8]. LTD simulation can alsobe used to predict the force acting on the connector when thetrain is traveling on a curve or slope [9 - 13]. LTD simulation isalso known as a suitable method for predicting brakingperformance [6, 7, 14, 15]. The key to LTD simulation dependson properly modeling the braking properties such as frictioncoefficients and braking pressures [6, 14, 16].
In previous LTD studies, the coefficient of friction wasapplied to assume a constant value [7 - 10, 12, 17]. However,the coefficient of friction presents conspicuous variations dueto material hardness, surface roughness, pressure, frictionspeed, presence and type of lubricant, temperature andcontamination [18, 19]. In this study, the results of the frictioncoefficient test are analyzed and the variation of the frictioncoefficient is considered in the LTD simulation for predictingbraking performance.
The brake pressure rise pattern is affected by the pipelength, diameter, fittings and valves installed in a vehicle [16].Therefore, it could vary depending on vehicle design. In thisstudy, braking pressures are measured at selected vehiclepositions on a train and modeled using an exponentialempirical model. The results of the LTD simulation arecompared and verified with the results of the repeated runningbrake tests.
2. FREIGHT TRAIN SPECIFICATIONS AND BRAKINGSYSTEM
A freight train consists of a locomotive and a number ofwagons. The locomotive generates compressed air necessaryfor braking and can be classified into a diesel locomotive or anelectric locomotive according to the traction power. Depending
on the type of cargo, wagons can be classified into the bulkwagon, a flatbed wagon carrying containers, etc.
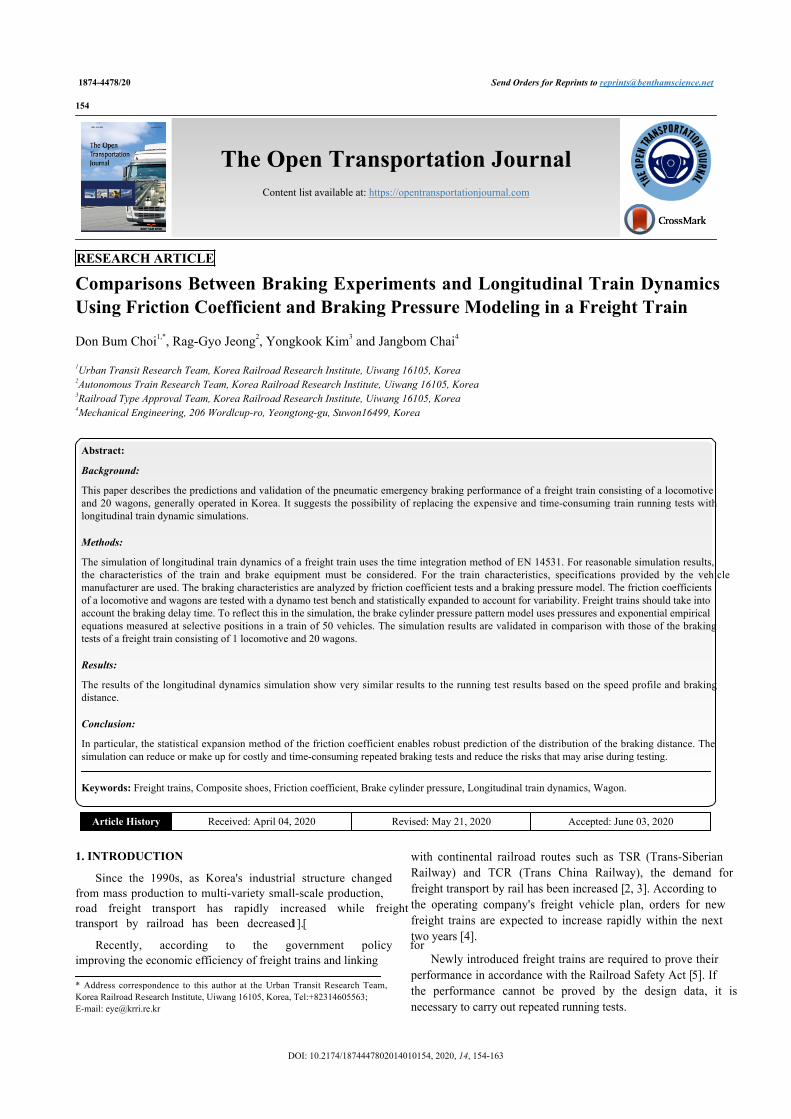
In this study, a freight train consisting of one 7600 serieselectric locomotive, which was introduced since 2014, and 20flatbed wagons was studied. The braking system for the freighttrain uses pneumatics, as shown in Fig. (1). The compressed airfrom the locomotive's compressor is stored in the locomotive'sreservoir. It is supplied to the auxiliary reservoir of each wagonthrough the brake pipe connected to the end of the train (Fig.2a).
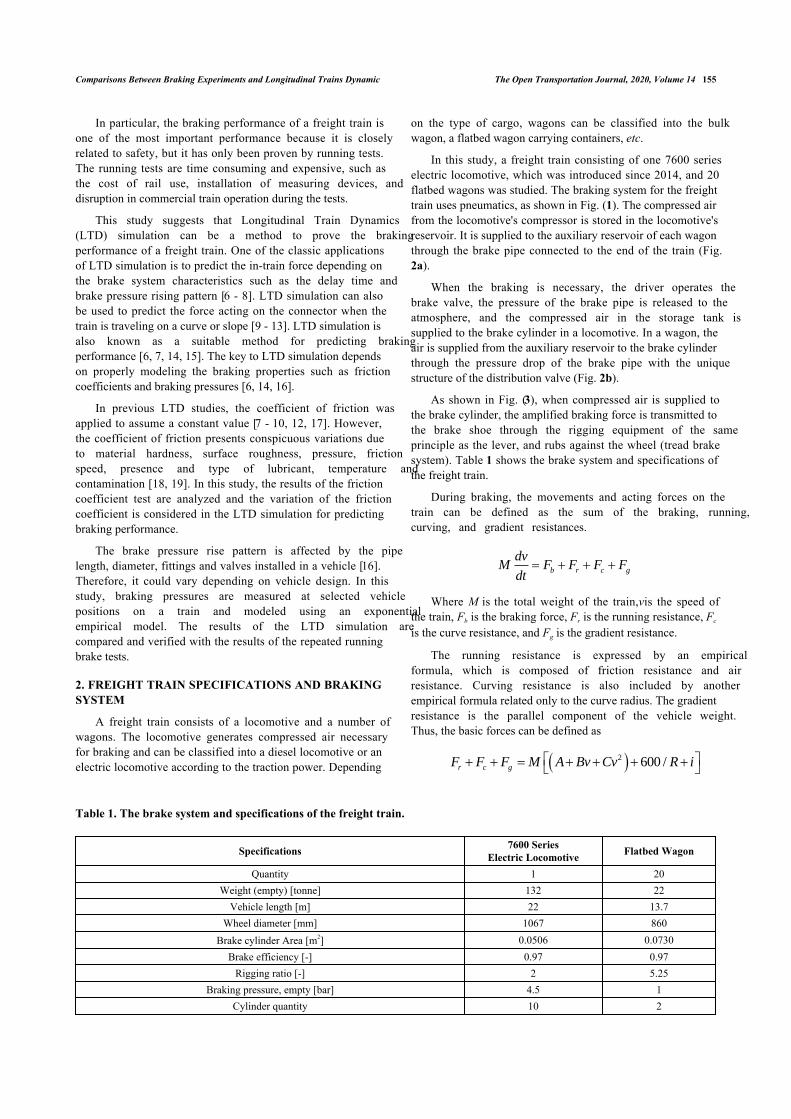
When the braking is necessary, the driver operates thebrake valve, the pressure of the brake pipe is released to theatmosphere, and the compressed air in the storage tank issupplied to the brake cylinder in a locomotive. In a wagon, theair is supplied from the auxiliary reservoir to the brake cylinderthrough the pressure drop of the brake pipe with the uniquestructure of the distribution valve (Fig. 2b).
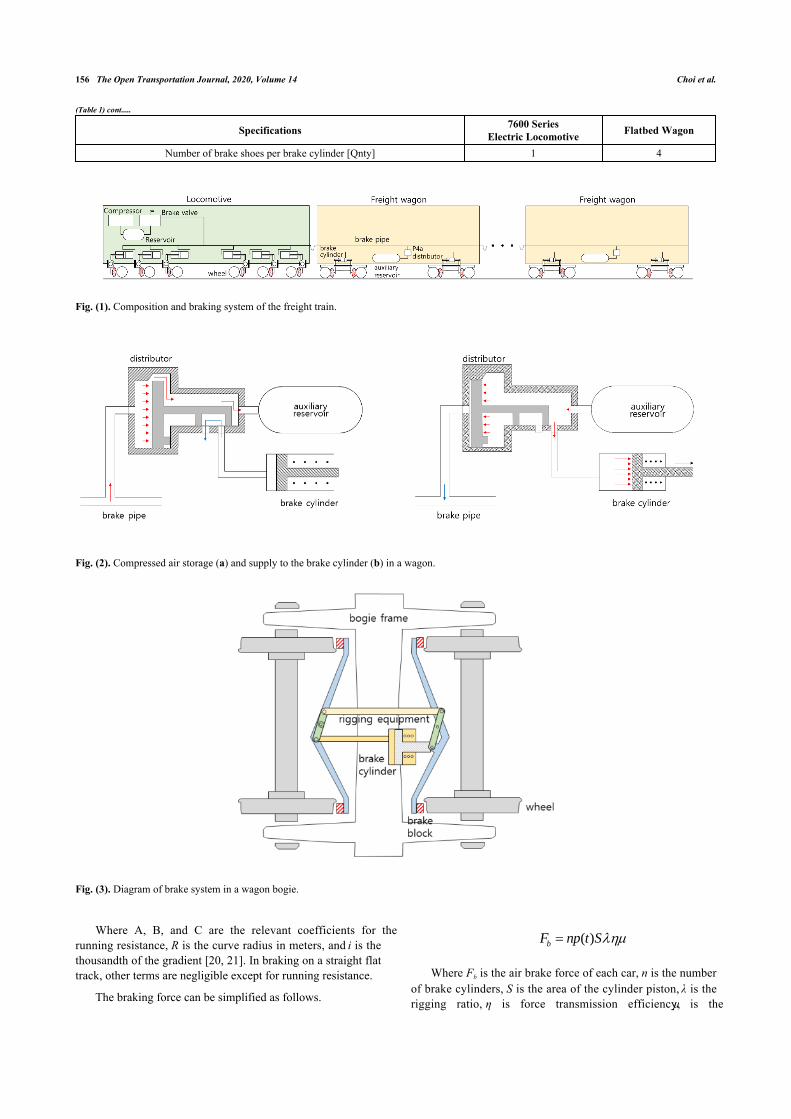
As shown in Fig. (3), when compressed air is supplied tothe brake cylinder, the amplified braking force is transmitted tothe brake shoe through the rigging equipment of the sameprinciple as the lever, and rubs against the wheel (tread brakesystem). Table 1 shows the brake system and specifications ofthe freight train.
During braking, the movements and acting forces on thetrain can be defined as the sum of the braking, running,curving, and gradient resistances.
Where M is the total weight of the train,v is the speed ofthe train, Fb is the braking force, Fr is the running resistance, Fc
is the curve resistance, and Fg is the gradient resistance.
The running resistance is expressed by an empiricalformula, which is composed of friction resistance and airresistance. Curving resistance is also included by anotherempirical formula related only to the curve radius. The gradientresistance is the parallel component of the vehicle weight.Thus, the basic forces can be defined as
Table 1. The brake system and specifications of the freight train.
Specifications 7600 SeriesElectric Locomotive Flatbed Wagon
Quantity 1 20Weight (empty) [tonne] 132 22
Vehicle length [m] 22 13.7Wheel diameter [mm] 1067 860
Brake cylinder Area [m2] 0.0506 0.0730Brake efficiency [-] 0.97 0.97
Rigging ratio [-] 2 5.25Braking pressure, empty [bar] 4.5 1
Cylinder quantity 10 2
b r c g
dvM F F F F
dt
2 600 /r c gF F F M A Bv Cv R i
156 The Open Transportation Journal, 2020, Volume 14 Choi et al.
Specifications 7600 SeriesElectric Locomotive Flatbed Wagon
Number of brake shoes per brake cylinder [Qnty] 1 4
Fig. (1). Composition and braking system of the freight train.
Fig. (2). Compressed air storage (a) and supply to the brake cylinder (b) in a wagon.
Fig. (3). Diagram of brake system in a wagon bogie.
Where A, B, and C are the relevant coefficients for therunning resistance, R is the curve radius in meters, and i is thethousandth of the gradient [20, 21]. In braking on a straight flattrack, other terms are negligible except for running resistance.
The braking force can be simplified as follows.
Where Fb is the air brake force of each car, n is the numberof brake cylinders, S is the area of the cylinder piston, λ is therigging ratio, η is force transmission efficiency, µ is the
( )bF np t S
(Table 1) cont.....

Comparisons Between Braking Experiments and Longitudinal Trains Dynamic The Open Transportation Journal, 2020, Volume 14 157
equivalent friction coefficient of a brake shoe, and p(t) is thebrake pressure. In the braking force, it is determined by themechanical specification except for the friction coefficient andbraking pressure.
3. EXPERIMENTS AND MODELING METHODS
3.1. Friction CoefficientsThe friction coefficient, in general, varies depending on
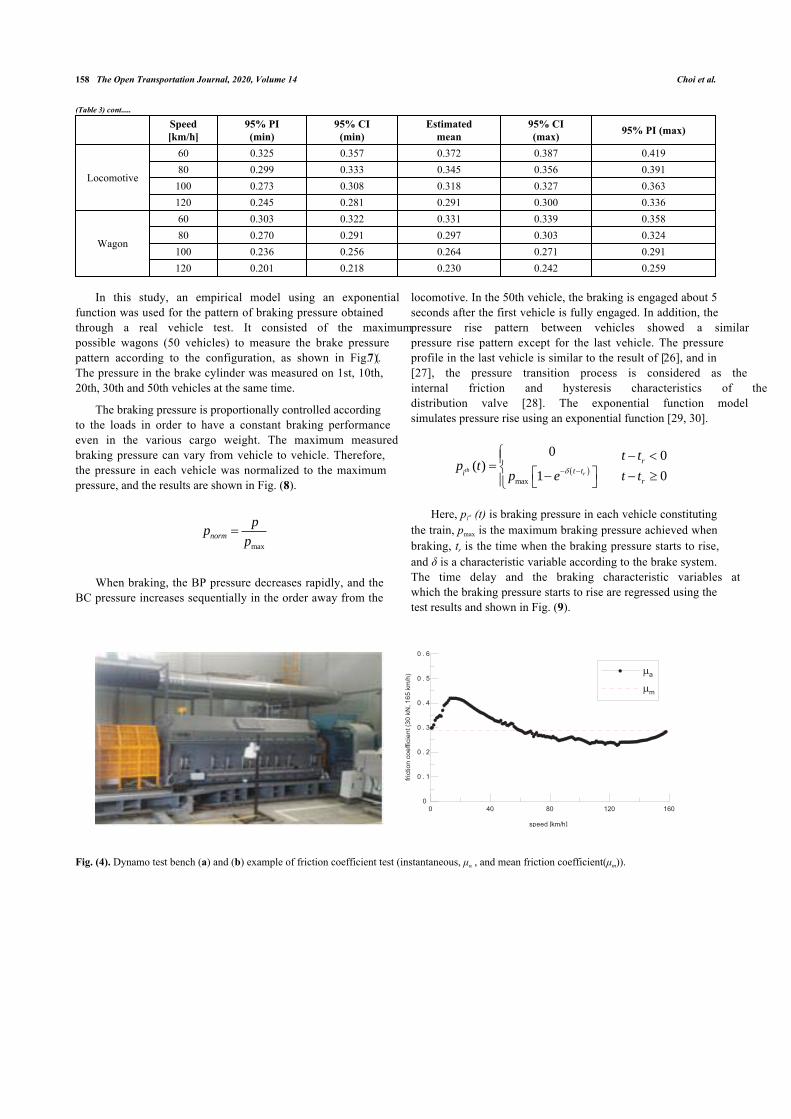
material properties and thus is not constant. In this study, withreference to UIC 541-4 [18], which stipulated the testconditions for the composite brake shoe for railway vehicles, ashort program was constructed as shown in Table 2 [22, 23],and friction material testing was performed using a brakebench (Fig. 4). The locomotive and wagon had different wheeldiameters and different brake shoe suppliers, so frictioncoefficient tests were performed in each case. The program inTable 2 was repeated four times. Since a locomotive can towpassenger cars with a higher speed than freight wagon, thecoefficient of friction has been tested even at speeds higherthan wagons.
According to UIC 541-4, the average coefficient of frictionis influenced by speed and braking force and may have adistribution rather than constant at the same speed. The meanfriction coefficient shows that it can be modeled in a linearrelationship above a certain speed (60 km/h) [18, 24]. In orderto predict the distribution of the mean friction coefficient foruse as the input of the LTD simulation, the test results werelinearly interpolated and statistically estimated usingConfidence Interval (CI) and Prediction Interval (PI) [25].
is the estimated mean friction coefficient, t is the t-statistic for the input confidence level and the number of pointsin the regression data. sµm
|v is standard error, n is the number ofpoints in the regression data. v is the speed. is the averagetest speed.
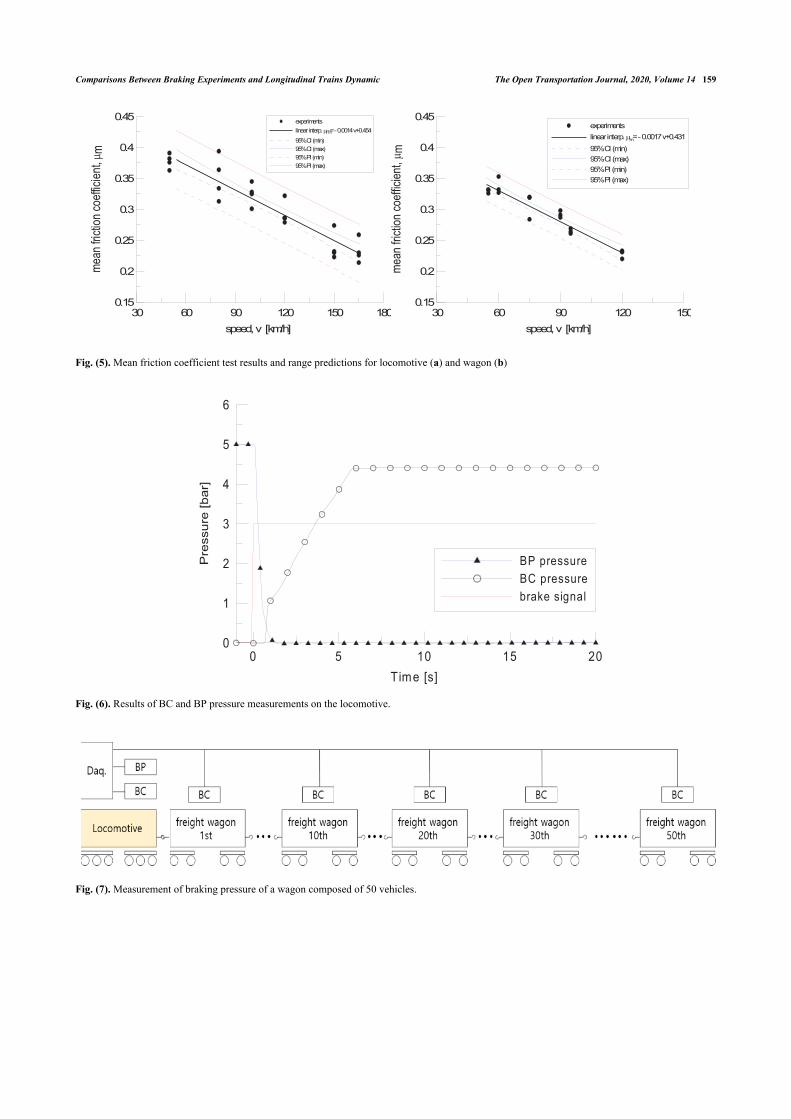
The results of the predicted range of the 95% confidencelevel of the friction coefficient of the locomotive and wagonare shown in Fig. (5). Table 3 shows the range of the estimatedmean friction coefficient of the locomotive and the wagon atthe selected speeds. As the confidence level increases, theprediction interval of the friction coefficient increases [25].
3.2. Braking PressuresSince the brake cylinder pressure patterns of locomotive
and wagon are different, modeling is required for each vehiclefor LTD simulation. The pressure of the brake cylinder (BC) ofthe locomotive was measured while the braking operation wasin a stationary state. The measured results are shown in Fig.(6). In the locomotive, the brake pipe (BP) pressure rapidlydecreases with the braking, and the BC pressure starts to rise.The BC pressure rises rapidly to 1 bar and then linearly to 4.5bar.
The braking pressure characteristics of the wagon areaffected by the pipe and valves used. It also depends on thenumber of vehicles that make up a train. Models for estimatingthe braking pressure of the wagons are hydrodynamic andempirical methods. Hydrodynamic and empirical models areused to estimate the braking pressure of the wagon. Ahydrodynamic model is a method of physically modeling avehicle's brake system, such as pipes and valves andperforming a fluid dynamic analysis. This method is useful forunknown brake systems, but it is difficult to model and verifyall components of the brake system. The empirical method useslimited measurement results. The model has the limitation thatit can be applied only to known brake systems, but it has theadvantage of providing highly reliable information and a shortcalculation time [14].
Table 2. Friction coefficient test program.
Locomotive WagonInitial Speed [km/h] Braking Force [kN] Initial Speed [km/h] Braking Force [kN]
5080100120150165
40
5560759095120
20
Table 3. Estimated mean friction coefficient ( ) ranges for locomotive and wagon at selected speeds.
Speed[km/h]
95% PI(min)
95% CI(min)
Estimatedmean
95% CI(max) 95% PI (max)
2
/2, 2 | 2
1
1ˆCI
mm n v n
ii
v vt s
n v v
2
/2, 2 | 2
1
1ˆPI 1
mm n v n
ii
v vt s
n v v
m
)
v
m
)
158 The Open Transportation Journal, 2020, Volume 14 Choi et al.
Speed[km/h]
95% PI(min)
95% CI(min)
Estimatedmean
95% CI(max) 95% PI (max)
Locomotive
60 0.325 0.357 0.372 0.387 0.41980 0.299 0.333 0.345 0.356 0.391100 0.273 0.308 0.318 0.327 0.363120 0.245 0.281 0.291 0.300 0.336
Wagon
60 0.303 0.322 0.331 0.339 0.35880 0.270 0.291 0.297 0.303 0.324100 0.236 0.256 0.264 0.271 0.291120 0.201 0.218 0.230 0.242 0.259
In this study, an empirical model using an exponentialfunction was used for the pattern of braking pressure obtainedthrough a real vehicle test. It consisted of the maximumpossible wagons (50 vehicles) to measure the brake pressurepattern according to the configuration, as shown in Fig. (7).The pressure in the brake cylinder was measured on 1st, 10th,20th, 30th and 50th vehicles at the same time.
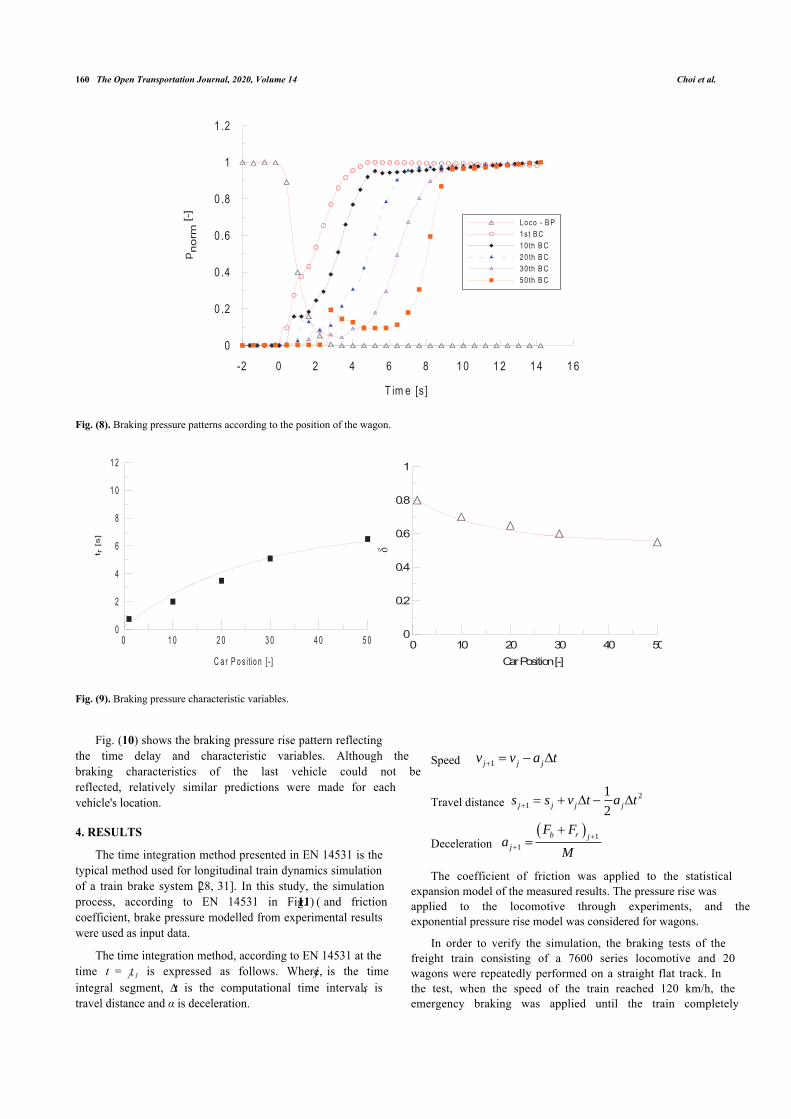
The braking pressure is proportionally controlled accordingto the loads in order to have a constant braking performanceeven in the various cargo weight. The maximum measuredbraking pressure can vary from vehicle to vehicle. Therefore,the pressure in each vehicle was normalized to the maximumpressure, and the results are shown in Fig. (8).
When braking, the BP pressure decreases rapidly, and theBC pressure increases sequentially in the order away from the
locomotive. In the 50th vehicle, the braking is engaged about 5seconds after the first vehicle is fully engaged. In addition, thepressure rise pattern between vehicles showed a similarpressure rise pattern except for the last vehicle. The pressureprofile in the last vehicle is similar to the result of [26], and in[27], the pressure transition process is considered as theinternal friction and hysteresis characteristics of thedistribution valve [28]. The exponential function modelsimulates pressure rise using an exponential function [29, 30].
Here, pith (t) is braking pressure in each vehicle constitutingthe train, pmax is the maximum braking pressure achieved whenbraking, tr is the time when the braking pressure starts to rise,and δ is a characteristic variable according to the brake system.The time delay and the braking characteristic variables atwhich the braking pressure starts to rise are regressed using thetest results and shown in Fig. (9).
Fig. (4). Dynamo test bench (a) and (b) example of friction coefficient test (instantaneous, μα , and mean friction coefficient(μm)).
max
norm
pp
p
max
0 0( )
1 0th
r
r
t tir
t tp t
p e t t
0 40 80 120 160
speed [km/h]
0
0 . 1
0 . 2
0 . 3
0 . 4
0 . 5
0 . 6
frict
ion
coef
ficie
nt (3
0 kN
, 165
km
/h) �
�
(Table 3) cont.....
Comparisons Between Braking Experiments and Longitudinal Trains Dynamic The Open Transportation Journal, 2020, Volume 14 159
Fig. (5). Mean friction coefficient test results and range predictions for locomotive (a) and wagon (b)
Fig. (6). Results of BC and BP pressure measurements on the locomotive.
Fig. (7). Measurement of braking pressure of a wagon composed of 50 vehicles.
30 60 90 120 150 180speed, v [km/h]
0.15
0.2
0.25
0.3
0.35
0.4
0.45
mean
fricti
on co
effici
ent, �
experimentslinear interp. � = - 0.0014 v+0.45495% CI (min)95% CI (max)95% PI (min)95% PI (max)
30 60 90 120 150speed, v [km/h]
0.15
0.2
0.25
0.3
0.35
0.4
0.45
mea
n fri
ction
coef
ficien
t, �
experimentslinear interp. � = - 0.0017 v+0.43195% CI (min)95% CI (max)95% PI (min)95% PI (max)
0 5 10 15 20Time [s]
0
1
2
3
4
5
6
Pre
ssur
e [b
ar]
BP pressureBC pressurebrake signal
160 The Open Transportation Journal, 2020, Volume 14 Choi et al.
Fig. (8). Braking pressure patterns according to the position of the wagon.
Fig. (9). Braking pressure characteristic variables.
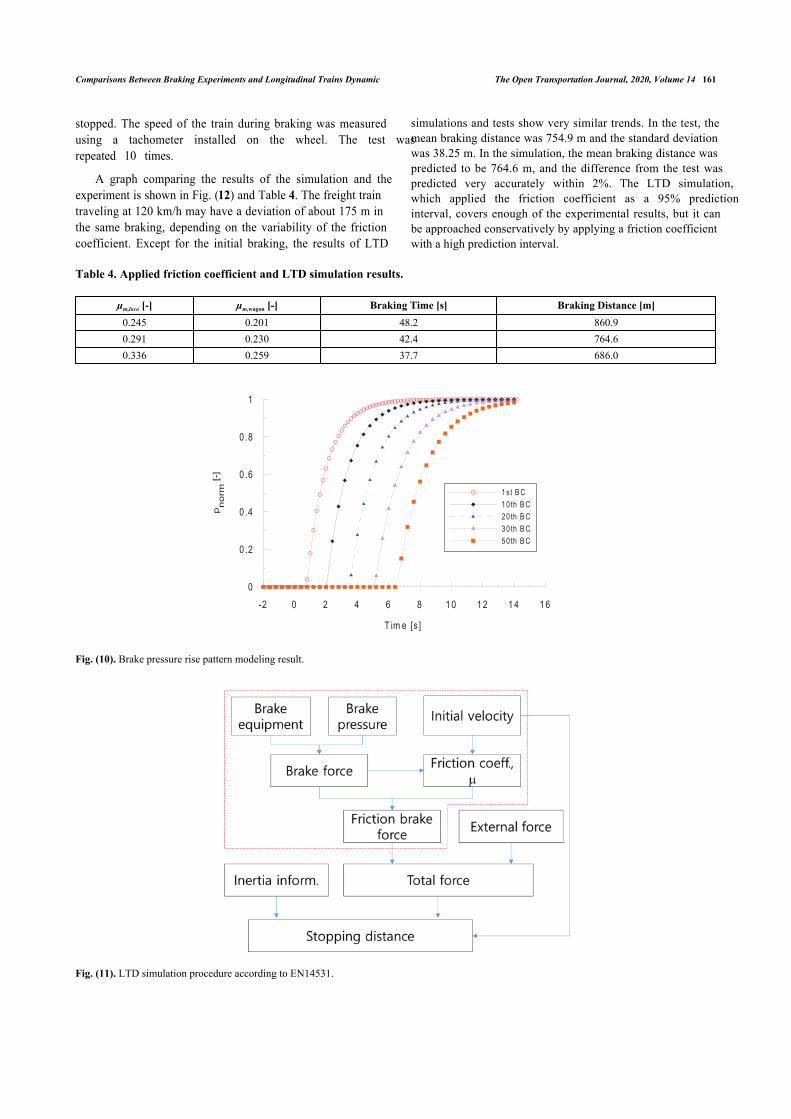
Fig. (10) shows the braking pressure rise pattern reflectingthe time delay and characteristic variables. Although thebraking characteristics of the last vehicle could not bereflected, relatively similar predictions were made for eachvehicle's location.
4. RESULTS
The time integration method presented in EN 14531 is thetypical method used for longitudinal train dynamics simulationof a train brake system [28, 31]. In this study, the simulationprocess, according to EN 14531 in Fig. (11) and frictioncoefficient, brake pressure modelled from experimental resultswere used as input data.
The time integration method, according to EN 14531 at thetime t = tj+1 is expressed as follows. Where, j is the timeintegral segment, ∆t is the computational time interval, s istravel distance and α is deceleration.
Speed
Travel distance
Deceleration
The coefficient of friction was applied to the statisticalexpansion model of the measured results. The pressure rise wasapplied to the locomotive through experiments, and theexponential pressure rise model was considered for wagons.
In order to verify the simulation, the braking tests of thefreight train consisting of a 7600 series locomotive and 20wagons were repeatedly performed on a straight flat track. Inthe test, when the speed of the train reached 120 km/h, theemergency braking was applied until the train completely
-2 0 2 4 6 8 1 0 1 2 1 4 1 6
T im e [s ]
0
0 .2
0 .4
0 .6
0 .8
1
1 .2
pnorm
[-]
L o co - B P1s t B C10 th B C20 th B C30 th B C50 th B C
0 1 0 2 0 3 0 4 0 5 0
C a r P o s it io n [- ]
0
2
4
6
8
1 0
1 2
t r [
s]
0 10 20 30 40 50
Car Position [-]
0
0.2
0.4
0.6
0.8
1
�
1j j jv v a t
2
1
1
2j j j js s v t a t
1
1
b r j
j
F Fa
M
Comparisons Between Braking Experiments and Longitudinal Trains Dynamic The Open Transportation Journal, 2020, Volume 14 161
stopped. The speed of the train during braking was measuredusing a tachometer installed on the wheel. The test wasrepeated 10 times.
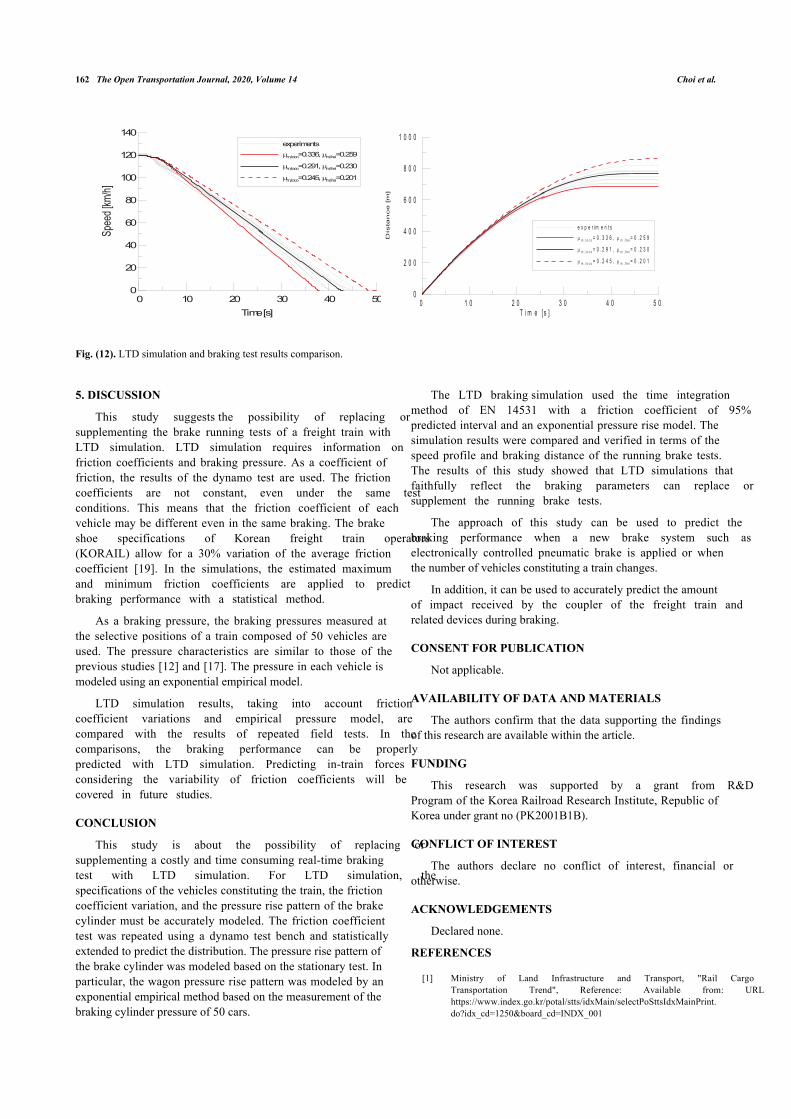
A graph comparing the results of the simulation and theexperiment is shown in Fig. (12) and Table 4. The freight traintraveling at 120 km/h may have a deviation of about 175 m inthe same braking, depending on the variability of the frictioncoefficient. Except for the initial braking, the results of LTD
simulations and tests show very similar trends. In the test, themean braking distance was 754.9 m and the standard deviationwas 38.25 m. In the simulation, the mean braking distance waspredicted to be 764.6 m, and the difference from the test waspredicted very accurately within 2%. The LTD simulation,which applied the friction coefficient as a 95% predictioninterval, covers enough of the experimental results, but it canbe approached conservatively by applying a friction coefficientwith a high prediction interval.
Table 4. Applied friction coefficient and LTD simulation results.
µm,loco [-] µm,wagon [-] Braking Time [s] Braking Distance [m]0.245 0.201 48.2 860.90.291 0.230 42.4 764.60.336 0.259 37.7 686.0
Fig. (10). Brake pressure rise pattern modeling result.
Fig. (11). LTD simulation procedure according to EN14531.
-2 0 2 4 6 8 1 0 1 2 1 4 1 6
T im e [s ]
0
0 .2
0 .4
0 .6
0 .8
1
pnorm
[-]
1 s t B C1 0 th B C2 0 th B C3 0 th B C5 0 th B C
162 The Open Transportation Journal, 2020, Volume 14 Choi et al.
Fig. (12). LTD simulation and braking test results comparison.
5. DISCUSSION
This study suggests the possibility of replacing orsupplementing the brake running tests of a freight train withLTD simulation. LTD simulation requires information onfriction coefficients and braking pressure. As a coefficient offriction, the results of the dynamo test are used. The frictioncoefficients are not constant, even under the same testconditions. This means that the friction coefficient of eachvehicle may be different even in the same braking. The brakeshoe specifications of Korean freight train operators(KORAIL) allow for a 30% variation of the average frictioncoefficient [19]. In the simulations, the estimated maximumand minimum friction coefficients are applied to predictbraking performance with a statistical method.
As a braking pressure, the braking pressures measured atthe selective positions of a train composed of 50 vehicles areused. The pressure characteristics are similar to those of theprevious studies [12] and [17]. The pressure in each vehicle ismodeled using an exponential empirical model.
LTD simulation results, taking into account frictioncoefficient variations and empirical pressure model, arecompared with the results of repeated field tests. In thecomparisons, the braking performance can be properlypredicted with LTD simulation. Predicting in-train forcesconsidering the variability of friction coefficients will becovered in future studies.
CONCLUSION
This study is about the possibility of replacing orsupplementing a costly and time consuming real-time brakingtest with LTD simulation. For LTD simulation, thespecifications of the vehicles constituting the train, the frictioncoefficient variation, and the pressure rise pattern of the brakecylinder must be accurately modeled. The friction coefficienttest was repeated using a dynamo test bench and statisticallyextended to predict the distribution. The pressure rise pattern ofthe brake cylinder was modeled based on the stationary test. Inparticular, the wagon pressure rise pattern was modeled by anexponential empirical method based on the measurement of thebraking cylinder pressure of 50 cars.
The LTD braking simulation used the time integrationmethod of EN 14531 with a friction coefficient of 95%predicted interval and an exponential pressure rise model. Thesimulation results were compared and verified in terms of thespeed profile and braking distance of the running brake tests.The results of this study showed that LTD simulations thatfaithfully reflect the braking parameters can replace orsupplement the running brake tests.
The approach of this study can be used to predict thebraking performance when a new brake system such aselectronically controlled pneumatic brake is applied or whenthe number of vehicles constituting a train changes.
In addition, it can be used to accurately predict the amountof impact received by the coupler of the freight train andrelated devices during braking.
CONSENT FOR PUBLICATION
Not applicable.
AVAILABILITY OF DATA AND MATERIALS
The authors confirm that the data supporting the findingsof this research are available within the article.
FUNDING
This research was supported by a grant from R&DProgram of the Korea Railroad Research Institute, Republic ofKorea under grant no (PK2001B1B).
CONFLICT OF INTEREST
The authors declare no conflict of interest, financial orotherwise.
ACKNOWLEDGEMENTS
Declared none.
REFERENCES
Ministry of Land Infrastructure and Transport, "Rail Cargo[1]Transportation Trend", Reference: Available from: URLhttps://www.index.go.kr/potal/stts/idxMain/selectPoSttsIdxMainPrint.do?idx_cd=1250&board_cd=INDX_001
0 10 20 30 40 50Time [s]
0
20
40
60
80
100
120
140
Spee
d [km
/h]
experiments� 0.336, � 0.259
� 0.291, � 0.230
� 0.245, � 0.201
0 1 0 2 0 3 0 4 0 5 0T i m e [ s ]
0
2 0 0
4 0 0
6 0 0
8 0 0
1 0 0 0
Dis
tan
ce
[m
]
e x p e r i m e n t s� 0 . 3 3 6 , � 0 . 2 5 9
� 0 . 2 9 1 , � 0 . 2 3 0
� 0 . 2 4 5 , � 0 . 2 0 1
Comparisons Between Braking Experiments and Longitudinal Trains Dynamic The Open Transportation Journal, 2020, Volume 14 163
Jeong Hyun Kim, Gang Seog Kim, Yong Jin Kim, and Jeong Whon[2]Yu, "Trans-Korea rail logistics strategy for the normalization of southand north Korea economic cooperation", Journal of the Korean Societyof Civil Engineers,, vol. 36, no. 3, p. 511-520, 2016. (Korean)H.S. Na, Kim. Man O, and Ho Jang. Seung, A Study on integration[3]method for effective connection of tile two Korea’s railway systems,Korea Institute of Construction & Transportation TechnologyEvaluation and Planning., Korean, 2004.Seung Tak Kim, "Mid- to long-term purchasing plan for railway[4]vehicles and major parts", Railroad Vehicles,, vol. 14, 2018. Korearolling stock industries association, (Korean),Ministry of Land Infrastructure and Transport, RAILROAD SAFETY[5]ACT,, 2016.Jan. 19, Act No. 13807,R. Serajian, S. Mohammadi, and A. Nasr, "Influence of train length on[6]in-train longitudinal forces during brake application", Veh. Syst. Dyn.,vol. 57, pp. 192-206, 2019.[http://dx.doi.org/10.1080/00423114.2018.1456667]A. Nasr, and S. Mohammadi, "The effects of train brake delay time on[7]in-train forces", Proc. Inst. Mech. Eng., F J. Rail Rapid Transit, vol.224, pp. 523-534, 2010.[http://dx.doi.org/10.1243/09544097JRRT306]S. Mohammadi, and R. Serajian, Effects of the change in auto coupler[8]parameters on in-train longitudinal forces during brake application.,vol. Vol. 16. Mechanics & Industry, 2015.C. Cole, M. Spiryagin, Q. Wu, and Q.S. Yan, "Modelling, simulation[9]and applications of longitudinal train dynamics", Veh. Syst. Dyn., vol.55, pp. 1498-1571, 2017.[http://dx.doi.org/10.1080/00423114.2017.1330484]J. Wang, and H.A. Rakha, Longitudinal train dynamics model for a rail[10]transit simulation system Transportation Research Part C,, vol. 86.2018.[http://dx.doi.org/10.1016/j.trc.2017.10.011]Z. Qi, Z. Huang, and X. Kong, "Simulation of longitudinal dynamics[11]of long freight trains in positioning operations", Veh. Syst. Dyn., vol.50, pp. 1409-1433, 2012.[http://dx.doi.org/10.1080/00423114.2012.661063]Q. Wu, S. Luo, and C. Cole, "Longitudinal dynamics and energy[12]analysis for heavy haul trains", J Mod Trans, vol. 22, pp. 127-136,2014.[http://dx.doi.org/10.1007/s40534-014-0055-x]C. Chang, G. Guo, J. Wang, and Y. Ma, "Study on longitudinal force[13]simulation of heavy-haul train", Veh. Syst. Dyn., vol. 55, pp. 571-582,2017.[http://dx.doi.org/10.1080/00423114.2016.1269183]Q. Wu, M. Spiryagin, and C. Cole, "Longitudinal train dynamics: an[14]overview", Veh. Syst. Dyn., vol. 54, pp. 1688-1714, 2016.[http://dx.doi.org/10.1080/00423114.2016.1228988]M. Volpi, "Numerical analysis of the effect of electronically controlled[15]pneumatic braking on the longitudinal dynamics of freight train", MSc
Thesis, Mechanical Engineering Department, University ofPolytechnic University of Milan,, 2014.W. Wei, Y. Hu, Q. Wu, X. Zhao, J. Zhang, and Y. Zhang, "An air[16]brake model for longitudinal train dynamics studies", Veh. Syst. Dyn.,vol. 55, pp. 517-533, 2017.[http://dx.doi.org/10.1080/00423114.2016.1254261]J. Zhang, W. Wei, and Y. Zhang, "Mechanism Research of Train[17]Longitudinal Impulsion Based on the Brake Emulation of High-speedFreight Train", Inf Tech J, vol. 12, pp. 5356-5361, 2013.[http://dx.doi.org/10.3923/itj.2013.5356.5361]UIC, UIC 541-4 Brakes-Brakes with composite brake blocks- General[18]conditions for certification of composite brake blocks,, 2010.KORAIL, KRCS B006 05 Specifications of railway vehicle parts,[19]Brake shoe, KORAIL., Korean, 2018.L. Yang, Y. Kang, and S. Luo, "Assessment of the curving[20]performance of heavy haul trains under braking conditions", J. Mod.Transport, vol. 23, pp. 169-175, 2015.[http://dx.doi.org/10.1007/s40534-015-0075-1]S. Iwnicki, M. Spiryagin, C. Cole, and T. McSweeney, Handbook of[21]railway vehicle dynamics., CRC Press, 2019.[http://dx.doi.org/10.1201/9780429469398]KORAIL, Diesel electric locomotive brake shoe specifications[22](REDE200667)., Korean, 2012.KORAIL, Freight wagon brake shoe test procedure (T12-0079-[23]FCBA06)., Korean, 2012.V. Jörgl, R. Rathammer, H. Lehmann, and G. Vohla, Brake systems[24]for freight cars., Knorr-Bremse GmbH, 2005.C. Cobb, Uncertainty approaches and analyses for regression models[25]and ECAM., SBW Consulting Inc., 2017.I. Kiss, and V.G. Cioată, "1, S A Ratiu1, M Rackov and M Penčić,[26]“Statistical experiments using the multiple regression research forprediction of proper hardness in areas of phosphorus cast–iron brakeshoes manufacturing", IOP Conf. Series Mater. Sci. Eng., p. 294,2018.Comite Europeen de Normalisation, EN 14531-1 Railway[27]applications- methods for calculation of stopping and slowingdistances and immobilization braking part 1: general algorithmsutilizing mean value calculation for train sets or single vehicles,, 2015.Comite Europeen de Normalisation, EN 14067-4 Railway[28]applications- aerodynamics Part 4: Requirements and test proceduresfor aerodynamics on open track,, 2013.E.I. Kuzmina, "Choice of an optimal diagram for filling air brakes of a[29]locomotive", Vestnik VNIIZHT, vol. 4, pp. 40-44, 1962.M.A. Murtaza, "Railway air brake simulation: an empirical approach",[30]Journal of Rail Rapid Transit, vol. 207, pp. 51-56, 1993.[http://dx.doi.org/10.1243/PIME_PROC_1993_207_226_02]Bu-Byoung Kang, and Yong Hyeon Cho, Methods for calculation of[31]stopping and slowing distances and braking performance parameters,vol. 17, pp. 990-997, 2015.J Korean Soc Mech Tech,, vol. 17, pp.990-997, 2015. (Korean)
© 2020 Choi et al.
This is an open access article distributed under the terms of the Creative Commons Attribution 4.0 International Public License (CC-BY 4.0), a copy of which isavailable at: (https://creativecommons.org/licenses/by/4.0/legalcode). This license permits unrestricted use, distribution, and reproduction in any medium, providedthe original author and source are credited.