the nasa-uc-uh eta-earth program: iv. a low-mass planet orbiting an m dwarf 3.6 pc from earth
TRANSCRIPT

arX
iv:1
408.
5645
v1 [
astr
o-ph
.EP]
25
Aug
201
4Astrophysical Journal (accepted)Preprint typeset using LATEX style emulateapj v. 5/2/11
THE NASA-UC-UH ETA-EARTH PROGRAM:IV. A LOW-MASS PLANET ORBITING AN M DWARF 3.6 PC FROM EARTH1
Andrew W. Howard2, Geoffrey W. Marcy3, Debra A. Fischer4, Howard Isaacson3, Philip S. Muirhead5,6,Gregory W. Henry7, Tabetha S. Boyajian4, Kaspar von Braun8,9, Juliette C. Becker5, Jason T. Wright10,11,
John Asher Johnson12,13
Astrophysical Journal (accepted)
ABSTRACT
We report the discovery of a low-mass planet orbiting Gl 15A based on radial velocities from theEta-Earth Survey using HIRES at Keck Observatory. Gl 15Ab is a planet with minimum massM sin i = 5.35± 0.75M⊕, orbital period P = 11.4433± 0.0016d, and an orbit that is consistent withcircular. We characterize the host star using a variety of techniques. Photometric observations atFairborn Observatory show no evidence for rotational modulation of spots at the orbital period to alimit of ∼0.1 mmag, thus supporting the existence of the planet. We detect a second RV signal with aperiod of 44 days that we attribute to rotational modulation of stellar surface features, as confirmedby optical photometry and the Ca II H & K activity indicator. Using infrared spectroscopy fromPalomar-TripleSpec, we measure an M2V spectral type and a sub-solar metallicity ([M/H] = −0.22,[Fe/H] = −0.32). We measure a stellar radius of 0.3863 ± 0.0021R⊙ based on interferometry fromCHARA.Subject headings: planetary systems — stars: individual (Gliese 15 A) — techniques: radial velocity
1. INTRODUCTION
The nearest and brightest stars are among the beststudied and hold a special place in the popular imag-ination. The discovery of planets orbiting these starstells us that the solar neighborhood is potentially richwith solar systems. Within 7 pc, we know of gasgiant planets orbiting ǫ Eridani (Hatzes et al. 2000),Gl 876 (Marcy et al. 1998; Delfosse et al. 1998), andGl 832 (Bailey et al. 2009), intermediate mass planetscommonly called Neptunes and super-Earths orbitingGl 674 (Bonfils et al. 2007a), Gl 876 (Rivera et al. 2010),HD 20794 (Pepe et al. 2011), and Gl 581 (Mayor et al.
1 Based on observations obtained at the W.M.Keck Observa-tory, which is operated jointly by the University of California andthe California Institute of Technology. Keck time was grantedfor this project by the University of Hawaii, the University ofCalifornia, and NASA.
2 Institute for Astronomy, University of Hawaii, 2680 Wood-lawn Drive, Honolulu, HI 96822, USA
3 Department of Astronomy, University of California, Berke-ley, CA 94720-3411, USA
4 Department of Astronomy, Yale University, New Haven, CT06511, USA
5 Department of Astrophysics, California Institute of Technol-ogy, MC 249-17, Pasadena, CA 91125, USA
6 Current address: Department of Astronomy, Boston Univer-sity, 725 Commonwealth Ave, Boston, MA 02215, USA
7 Center of Excellence in Information Systems, TennesseeState University, 3500 John A. Merritt Blvd., Box 9501,Nashville, TN 37209, USA
8 NASA Exoplanet Science Institute, California Institute ofTechnology, Pasadena, CA 91125, USA
9 Max-Planck-Institute for Astronomy, Konigstuhl 17, 69117Heidelberg, Germany
10 Department of Astronomy and Astrophysics, The Pennsyl-vania State University, University Park, PA 16802, USA
11 Center for Exoplanets and Habitable Worlds, The Pennsyl-vania State University, University Park, PA 16802, USA
12 Center for Planetary Astronomy, California Institute ofTechnology, 1200 E. California Blvd, Pasadena, CA 91125, USA
13 Current address: Harvard-Smithsonian Center for Astro-physics, 60 Garden St., Cambridge, MA 02138, USA
2009), and an approximately Earth-mass (M⊕) planet or-biting α Centauri B (Dumusque et al. 2012). To this listwe add a 5M⊕ planet orbiting the star Gl 15A, whichat 3.6 pc is a member of the sixteenth closest stellarsystem cataloged by RECONS14 (e.g. Jao et al. 2005;Henry et al. 2006).This new planet was discovered as part of the Eta-
Earth Survey, a census of planets orbiting the neareststars. Our target list is composed of 232 G, K, and Mstars suitable for high-precision Doppler observations atthe Keck Observatory. These stars are nearby (within25 pc), bright (V < 11), and have low chromosphericactivity (logR′
HK < −4.7). Each star is searched forplanets — particularly close-in, low-mass planets — us-ing a minimum of twenty radial velocity (RV) measure-ments of ∼1m s−1 precision from the HIRES spectrom-eter. This survey has detected several low-mass plan-ets (Howard et al. 2009, 2011a,b) and showed that forG and K dwarfs the planet mass function rises steeplywith decreasing planet mass: small planets are common(Howard et al. 2010b). The 66 M dwarfs in the Eta-Earth Survey sample were excluded from that statisticalstudy of planet occurrence because many stars lackedsufficient measurements to confidently detect or excludethe presence of low-mass planets.In this paper, we characterize the planet host star
Gl 15A using a variety of observational techniques (Sec.2), describe Doppler measurements of the star (Sec.3), announce the existence of the close-in, super-EarthGl 15Ab (Sec. 4), and discuss this new planet in the con-text of the properties of known small planets (Sec. 5).
2. STELLAR CHARACTERIZATION
Gl 15A (also known as HD1326A, HIP 1475, GX An-dromedae, and Groombridge 34) is a nearby, cool dwarfof type M1 (Reid et al. 1995) or M2 (this work). The
14 http://www.chara.gsu.edu/RECONS/

2 Howard et al.
other member of this binary star system, Gl 15B, isfainter and has a spectral type of M3.5 dwarf (Reid et al.1995). Lippincott (1972) measured a small astrometricsegment of their orbit, giving an AB separation of 146 AUand an orbital period of 2600 years. Assuming an edge-onviewing geometry of AB and a circular orbit, the max-imum RV acceleration of A due to B is ∼2 m s−1 yr−1.Based on an imaging search for companions at 10 µmwith MIRLIN at Palomar, van Buren et al. (1998) ruledout additional companions to A having projected separa-tions of 9–36 AU with Teff > 1800 K (M⋆ > 0.084 M⊙).Gautier et al. (2007) found no infrared excess for Gl 15Aat 24, 70 or 160 µm.Since Gl 15A is a bright, nearby star, we undertook a
significant campaign to characterize it using a combina-tion of high-resolution optical spectroscopy, near infrared(IR) spectroscopy, long-baseline optical/infrared interfer-ometry, and high-cadence, broad-band optical photom-etry. In the subsections that follow we describe thesemeasurements, which are summarized in Table 1.
2.1. HIRES Optical Spectroscopy
We observed Gl 15A with the HIRES echelle spectrom-eter (Vogt et al. 1994) on the 10-m Keck I telescope us-ing standard procedures. The observations reported herespan fifteen years (1997 January through 2011 Decem-ber) and were made with an iodine cell mounted directlyin front of the spectrometer entrance slit to measure pre-cise, relative radial velocities (RVs). The dense set ofmolecular absorption lines imprinted on the stellar spec-tra provide a robust wavelength fiducial against whichDoppler shifts are measured, as well as strong constraintson the shape of the spectrometer instrumental profileat the time of each observation (Marcy & Butler 1992;Valenti et al. 1995).With the iodine cell removed, we also measured a
“template” spectrum of Gl 15A that was used in theDoppler analysis (Sec. 3). For stars with Teff & 4800K, we typically measure stellar parameters using theSpectroscopy Made Easy (SME; Valenti & Piskunov1996; Valenti & Fischer 2005) LTE spectral synthesistool. However, below this temperature SME is unreli-able. For Gl 15A, we measured stellar parameters usingthe techniques below.Measurements of the cores of the Ca II H & K lines of
each HIRES spectrum (outside the ∼5000-6200 A regionaffected by iodine lines) show modest levels of chromo-spheric activity, as quantified by the SHK and logR′
HKindices (Isaacson & Fischer 2010). The SHK values (Ta-ble 3) are computed to a precision of 0.001 and carrysingle measurement uncertainties of ∼0.002. Values inTable 3 that are reported to a precision less than 0.001are the result of binning multiple measurements in a 2hour timespan. These measurements are variable on bothshort and long timescales. Over our 15 year baseline, wedetect a 9±2.5 year cycle with a semi-amplitude of ∼0.05(in the dimensionless units of SHK), which is a ∼10%fractional change. This variation may be a magnetic ac-tivity cycle analogous to the solar cycle. We are unableto check for a similar variation in the optical photometryfrom Fairborn Observatory below (Sec. 2.4), which spanonly four years.To measure variability on shorter timescales, we ex-
amined 59 SHK measurements from the 2011 observing
1 10 100Period (d)
0
5
10
15
20
25
Pe
rio
do
gra
m P
ow
er
(S−
valu
es)
P = 44.8 d
Fig. 1.— Lomb-Scargle periodogram of SHK values from 59 mea-surements during the 2011 observing season (BJD > 2,455,500).We interpret the prominent peak near 44 days as due to modu-lation of stellar surface features (spots and plagues) at the stellarrotation period. The peaks near 1 day are aliases of our observingcadence and longer period signals.
season (BJD > 2,455,500). A Lomb-Scargle periodogramof these data (Figure 1) shows a clear periodicity near 44days that we interpret as the rotation period. As shownbelow, we also detect ∼44 day modulations in opticalphotometry and the RV time series, which is consistentwith the rotational modulation of stellar surface features.
2.2. Palomar-TripleSpec Infrared Spectrscopy
We observed Gl 15A with the TripleSpec Spectrographon the Palomar Observatory 200-inch Hale Telescope onUT 12 February 2012. TripleSpec is a near-infrared,long-slit spectrograph covering 1.0–2.5 µm simultane-ously with a resolving power of 2700 (Wilson et al. 2004;Herter et al. 2008). The TripleSpec detector does nothave a shutter, and instead records differences betweenmultiple non-destructive readouts for individual expo-sures (Fowler & Gatley 1990). The readout time sets theminimum exposure time of the detector to 3.8 seconds.To prevent saturation of this bright target, we guidedwith only a wing of the seeing-limited image of Gl 15Aon the slit. Two positions along the slit (A and B) wereused. Exposures were taken in an ABBA pattern withthe minimum exposure time.We reduced the data using the SpexTool program,
modified for Palomar TripleSpec (Cushing et al. 2004,M. Cushing, private communication). The spectra werecleansed of telluric absorption lines by comparison withspectra of a nearby A0V star (BD+43 61) and wereflux calibrated using the xtellcor package (Vacca et al.2003). The brightness of Gl 15A resulted in a discontinu-ity in the reduced spectrum at the location of a quadrantboundary in the detector. We manually adjusted the nor-malization of the spectrum to remove the discontinuity.Figure 2 shows the reduced K-band spectrum of Gl 15A,with comparison spectra of bracketing spectral types.Moderate resolution K-band spectra of M dwarfs
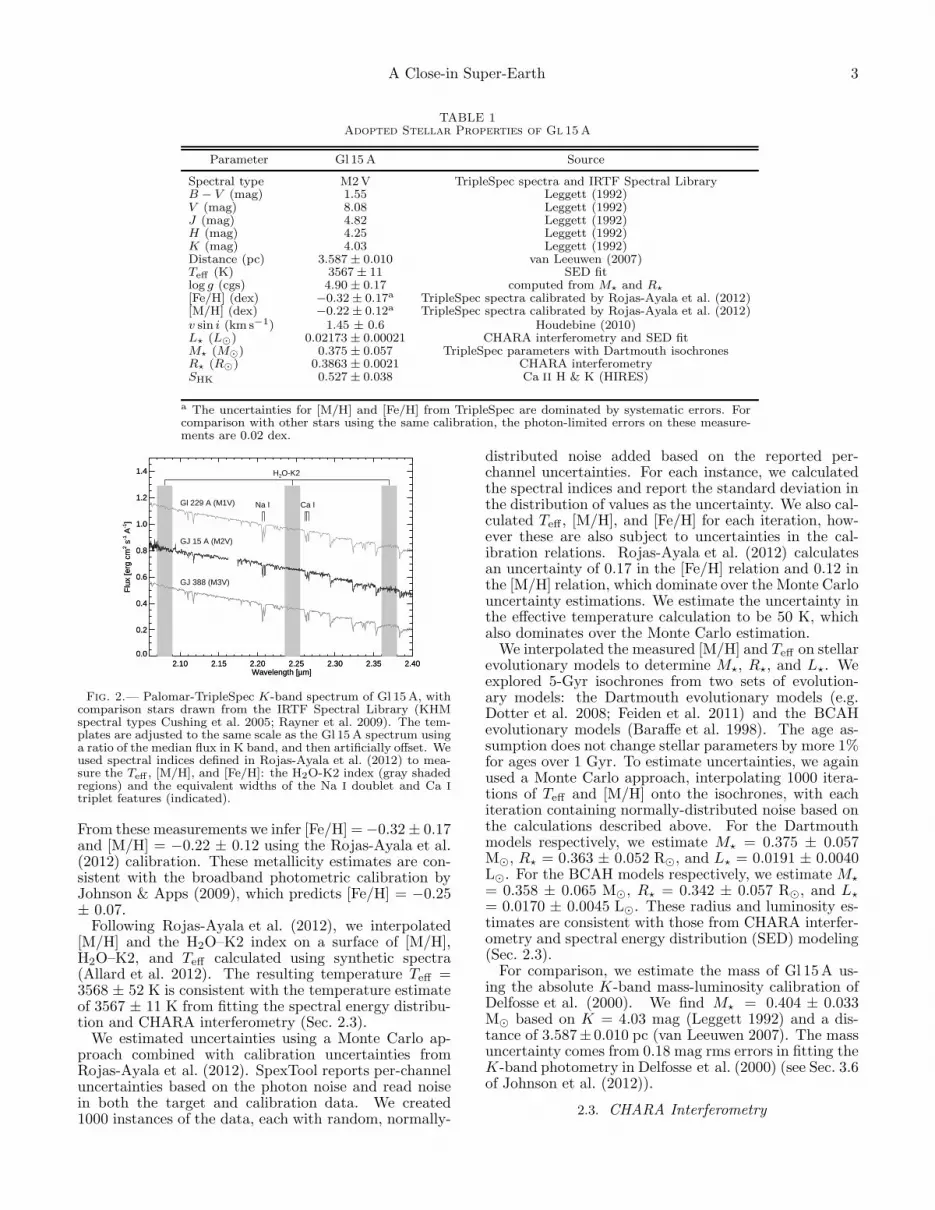
are sensitive to stellar temperature (Covey et al. 2010)and metallicity (Rojas-Ayala et al. 2010, 2012). ForGl 15A, we measured spectral indices and used theRojas-Ayala et al. (2012) calibrations to estimate Teff ,[M/H], and [Fe/H]. We measured the equivalent widthsof 3.430 ± 0.098 A and 3.148 ± 0.103 A for the K-bandNa I and Ca I absorption features, respectively. For theH2O–K2 index, we measured a value of 0.95434± 0.0030.
A Close-in Super-Earth 3
TABLE 1Adopted Stellar Properties of Gl 15A
Parameter Gl 15A Source
Spectral type M2V TripleSpec spectra and IRTF Spectral LibraryB − V (mag) 1.55 Leggett (1992)V (mag) 8.08 Leggett (1992)J (mag) 4.82 Leggett (1992)H (mag) 4.25 Leggett (1992)K (mag) 4.03 Leggett (1992)Distance (pc) 3.587± 0.010 van Leeuwen (2007)Teff (K) 3567± 11 SED fitlog g (cgs) 4.90± 0.17 computed from M⋆ and R⋆
[Fe/H] (dex) −0.32± 0.17a TripleSpec spectra calibrated by Rojas-Ayala et al. (2012)[M/H] (dex) −0.22± 0.12a TripleSpec spectra calibrated by Rojas-Ayala et al. (2012)v sin i (km s−1) 1.45 ± 0.6 Houdebine (2010)L⋆ (L⊙) 0.02173 ± 0.00021 CHARA interferometry and SED fitM⋆ (M⊙) 0.375± 0.057 TripleSpec parameters with Dartmouth isochronesR⋆ (R⊙) 0.3863 ± 0.0021 CHARA interferometrySHK 0.527± 0.038 Ca II H & K (HIRES)
a The uncertainties for [M/H] and [Fe/H] from TripleSpec are dominated by systematic errors. Forcomparison with other stars using the same calibration, the photon-limited errors on these measure-ments are 0.02 dex.
2.10 2.15 2.20 2.25 2.30 2.35 2.40Wavelength [µm]
0.0
0.2
0.4
0.6
0.8
1.0
1.2
1.4
Flu
x [e
rg c
m2 s
-1 A
-1]
2.10 2.15 2.20 2.25 2.30 2.35 2.40Wavelength [µm]
0.0
0.2
0.4
0.6
0.8
1.0
1.2
1.4
Flu
x [e
rg c
m2 s
-1 A
-1]
H2O-K2
GJ 388 (M3V)
GJ 15 A (M2V)
Gl 229 A (M1V) Ca ΙNa Ι
Fig. 2.— Palomar-TripleSpec K-band spectrum of Gl 15A, withcomparison stars drawn from the IRTF Spectral Library (KHMspectral types Cushing et al. 2005; Rayner et al. 2009). The tem-plates are adjusted to the same scale as the Gl 15A spectrum usinga ratio of the median flux in K band, and then artificially offset. Weused spectral indices defined in Rojas-Ayala et al. (2012) to mea-sure the Teff , [M/H], and [Fe/H]: the H2O-K2 index (gray shadedregions) and the equivalent widths of the Na I doublet and Ca Itriplet features (indicated).
From these measurements we infer [Fe/H] =−0.32± 0.17and [M/H] = −0.22 ± 0.12 using the Rojas-Ayala et al.(2012) calibration. These metallicity estimates are con-sistent with the broadband photometric calibration byJohnson & Apps (2009), which predicts [Fe/H] = −0.25± 0.07.Following Rojas-Ayala et al. (2012), we interpolated
[M/H] and the H2O–K2 index on a surface of [M/H],H2O–K2, and Teff calculated using synthetic spectra(Allard et al. 2012). The resulting temperature Teff =3568 ± 52 K is consistent with the temperature estimateof 3567 ± 11 K from fitting the spectral energy distribu-tion and CHARA interferometry (Sec. 2.3).We estimated uncertainties using a Monte Carlo ap-
proach combined with calibration uncertainties fromRojas-Ayala et al. (2012). SpexTool reports per-channeluncertainties based on the photon noise and read noisein both the target and calibration data. We created1000 instances of the data, each with random, normally-
distributed noise added based on the reported per-channel uncertainties. For each instance, we calculatedthe spectral indices and report the standard deviation inthe distribution of values as the uncertainty. We also cal-culated Teff , [M/H], and [Fe/H] for each iteration, how-ever these are also subject to uncertainties in the cal-ibration relations. Rojas-Ayala et al. (2012) calculatesan uncertainty of 0.17 in the [Fe/H] relation and 0.12 inthe [M/H] relation, which dominate over the Monte Carlouncertainty estimations. We estimate the uncertainty inthe effective temperature calculation to be 50 K, whichalso dominates over the Monte Carlo estimation.We interpolated the measured [M/H] and Teff on stellar
evolutionary models to determine M⋆, R⋆, and L⋆. Weexplored 5-Gyr isochrones from two sets of evolution-ary models: the Dartmouth evolutionary models (e.g.Dotter et al. 2008; Feiden et al. 2011) and the BCAHevolutionary models (Baraffe et al. 1998). The age as-sumption does not change stellar parameters by more 1%for ages over 1 Gyr. To estimate uncertainties, we againused a Monte Carlo approach, interpolating 1000 itera-tions of Teff and [M/H] onto the isochrones, with eachiteration containing normally-distributed noise based onthe calculations described above. For the Dartmouthmodels respectively, we estimate M⋆ = 0.375 ± 0.057M⊙, R⋆ = 0.363 ± 0.052 R⊙, and L⋆ = 0.0191 ± 0.0040L⊙. For the BCAH models respectively, we estimate M⋆
= 0.358 ± 0.065 M⊙, R⋆ = 0.342 ± 0.057 R⊙, and L⋆
= 0.0170 ± 0.0045 L⊙. These radius and luminosity es-timates are consistent with those from CHARA interfer-ometry and spectral energy distribution (SED) modeling(Sec. 2.3).For comparison, we estimate the mass of Gl 15A us-
ing the absolute K-band mass-luminosity calibration ofDelfosse et al. (2000). We find M⋆ = 0.404 ± 0.033M⊙ based on K = 4.03 mag (Leggett 1992) and a dis-tance of 3.587± 0.010 pc (van Leeuwen 2007). The massuncertainty comes from 0.18 mag rms errors in fitting theK-band photometry in Delfosse et al. (2000) (see Sec. 3.6of Johnson et al. (2012)).
2.3. CHARA Interferometry

4 Howard et al.
Fig. 3.— SED fit for Gl 15A with a M2V spectral template(blue) from Pickles (1998) and photometry (red) from the litera-ture. Filter bandpasses are indicated by the horizontal lengths ofthe red photometric measurements. The black “X” symbols showthe template flux integrated over the filter bandpasses. Residu-als between these integrated model and measured fluxes are in thelower panel. For details, see §2.3.2
2.3.1. Interferometry and Stellar Diameter
We measured the angular diameter of Gl 15A us-ing visibility interferometry. We observed Gl 15Aover seven nights between 2008 Sept and 2011 Au-gust using the Georgia State University Center forHigh Angular Resolution Astronomy (CHARA) Array(ten Brummelaar et al. 2005) as part of a survey of Kand M dwarfs (Boyajian et al. 2012). We obtained fortyinterferometric observations in H and K bands in singlebaseline mode, using six of CHARA’s longest availablebaselines (217 < Bmax < 331 m). Our observationalstrategy is described in von Braun et al. (2011a,b), in-cluding the use of calibrator stars to remove the influenceof atmospheric and instrumental systematics. Our cali-brator stars were chosen to be near-point-like sources ofsimilar brightness as Gl 15A and are separated by smallangular distances. These stars are HD 6920, HD 905,and HD 3765.We measured a limb-darkening-corrected (Claret 2000)
angular diameter of 1.005 ± 0.005 milliarcseconds (mas).Using the van Leeuwen (2007) distance, we convert theangular diameter to a physical diameter of R⋆ = 0.3846±0.0023 R⊙, in agreement with previous CHARA mea-surements of 0.379 ± 0.006 R⋆ (Berger et al. 2006) and0.393± 0.023 R⋆ (van Belle & von Braun 2009).With this well-measured stellar radius and rotation
period, we can make a comparison with the spectro-scopic broadening kernel, v sin i. For an equatorialviewing geometry (sin i = 1), we the expect v sin i ≈Vrot ≈ 2πR⋆/Prot. For Gl 15A, we find 2πR⋆/Prot= 0.44km s−1, which is inconsistent at the 1.7-σ level with themeasured v sin i = 1.45 ± 0.6 km s−1 (Houdebine 2010).
2.3.2. Spectral Energy Distribution
Similar to the procedure outlined in von Braun et al.(2012), we fitted the SED (Figure 3) based onthe spectroscopic templates of Pickles (1998) toliterature photometry published in Cowley et al.(1967); Johnson & Morgan (1953); Upgren (1974);Niconov et al. (1957); Argue (1966); Johnson (1965);Erro (1971); Mermilliod (1986); Hauck & Mermilliod
(1998); Twarog (1980); Olsen (1993); Olson (1974);Cutri et al. (2003) and cataloged in Gezari et al. (1999).We did not include interstellar extinction from the SEDfit due to the proximity of Gl 15A.The SED fit produces a bolometric flux of Fbol =
(5.42 ± 0.04) × 10−8 erg cm−2 s−1. The ∼1% fractionalerror accounts only for photometric and fitting uncer-tainties and does not include systematic uncertainties(e.g., see Sec. 2.2 of von Braun et al. (2014)). Combin-ing Fbol with the distance, we derive a luminosity of L =0.02173 ± 0.00021 L⊙. We derive an effective tempera-ture of 3563± 11 K using the modified Stefan-BoltzmannLaw Teff(K) = 2341(Fbol/θ
2LD)
14 from von Braun et al.
(2012).Using the approach in von Braun et al. (2011a) and
based on the equations of Jones & Sleep (2010) we cal-culate the inner and outer boundaries of the habitablezone around Gl 15A to be 0.14 and 0.29 AU, respectively.With a semi-major axis of 0.074 AU (see Sec. 4), Gl 15Aborbits interior to the habitable zone.
2.4. Photometry from Fairborn Observatory
We measured the brightness of Gl 15A over four ob-serving seasons with the T12 0.80 m automatic photo-metric telescope (APT), one of several automatic tele-scopes operated by Tennessee State University at Fair-born Observatory (Eaton et al. 2003). The APTs candetect short-term, low-amplitude brightness changes insolar-type stars resulting from rotational modulation inthe visibility of active regions, such as starspots andplages (e.g., Henry et al. 1995b) and can also detectlonger-term variations produced by the growth and decayof individual active regions and the occurrence of stel-lar magnetic cycles (e.g., Henry et al. 1995a; Hall et al.2009). The TSU APTs can disprove the hypothe-sis that RV variations are caused by stellar activity,rather than planetary reflex motion (e.g., Henry et al.2000a). Several cases of apparent periodic RV vari-ations in solar-type stars induced by the presence ofphotospheric starspots have been discussed in the lit-erature (e.g., Queloz et al. 2001; Paulson et al. 2004;Bonfils et al. 2007b; Forveille et al. 2009). Photome-try of planetary candidate host stars is also useful tosearch for transits of the planetary companions (e.g.,Henry et al. 2000b; Sato et al. 2005; Gillon et al. 2007;Barbieri et al. 2007).The T12 0.80 m APT is equipped with a two-channel
photometer that uses two EMI 9124QB bi-alkali pho-tomultiplier tubes (PMTs) to make simultaneous mea-surements of one star in the Stromgren b and y pass-bands. We report differential measurements of the tar-get star with respect to three comparison stars: HD571(V = 5.01, B − V = 0.41), HD 818 (V = 6.63, B − V =0.40), and HD1952 (V = 6.66, B − V = 0.41). The T12APT is functionally identical to the T8 APT described inHenry (1999). All photometric measurements were madethrough a 45′′ focal-plane diaphragm, thus excluding thelight from the two 11th magnitude visual companionsGl 15 B and C. The observing sequence and conditionsfor rejecting photometry in non-photometric conditionsare described in Henry (1999).During four consecutive observing seasons starting in
2008, the APT acquired 578 differential brightness mea-

A Close-in Super-Earth 5
Fig. 4.— Top panel: Stromgren (b+y)/2 differential magnitudesof Gl 15A plotted against heliocentric Julian Date for four observ-ing seasons (2008-2011). The standard deviation of these normal-ized observations from their mean (dotted line) is 3.1mmag. Thevertical lines in the top panel set off the best covered and most co-herent segment of the light curve that shows rotational modulationof spots. The two lower panels focus on this high cadence subsetof the photometry. Middle panel: Frequency spectrum of the highcadence photometry showing a peak corresponding to a period of∼ 44 days, which we interpret as the stellar rotation period. Bot-tom panel: Photometry from the high cadence interval phased toa 44 day period. Two cycles are shown (with data repeated) alongwith a least-squared sine function fit having a peak-to-peak ampli-tude of 6 mmag.
surements of Gl 15A. We combined the b and y differ-ential magnitudes into (b + y)/2 measurements, achiev-ing typical single measurement precision of 1.5–2.0mmag(Henry 1999). These measurements are plotted in thetop panel of Figure 4 and have a standard deviation of3.1mmag, which is somewhat larger than measurementuncertainties.In the 2011 observing season, we increased the cadence
to several observations per night. A periodogram of thesemeasurements (Figure 4, middle panel) shows Fourierpower at a period of 43.82 ± 0.56 days. The phased pho-tometry from this season is shown in the bottom panelof Figure 4. The APT photometry show no evidence forrotational modulation of spots at the orbital period to alimit of ∼0.1 mmag, thus supporting the interpretationthat the 11.44d RV signal is due to an orbiting planet(Sec. 4.1).
3. KECK-HIRES DOPPLER MEASUREMENTS
We measured the Doppler shift of each star-times-iodine HIRES spectrum (Sec. 2.1) using a modeling pro-cedure descended from Butler et al. (1996) and describedin Howard et al. (2011a). The velocity and correspond-ing uncertainty for each observation is based on separatemeasurements for ∼700 spectral chunks each 2 A wide.Once the planet announced here emerged as a candidate
1 10 100 1000Period (d)
0
5
10
15
20
25
30
35
Pe
rio
do
gra
m P
ow
er
(RV
s) P = 11.44 d
Fig. 5.— Lomb-Scargle periodogram of RV measurements ofGl 15A. The tall peak near P = 11.44 d suggests a planet withthat orbital period.
in October 2010, we increased the nightly cadence tothree consecutive observations per night to reduce thePoisson noise from photon statistics. We calculated meanvelocities for multiple observations in 2 hr intervals. TheRMS of these measurements is 3.21 m s−1. The relativeRVs and simultaneous SHK values are listed in Table 3.The absolute RV of Gl 15A relative to the solar systembarycenter is 11.82 ± 0.11 km s−1 (Chubak et al. 2012).The RVs in Table 3 are corrected for motion of KeckObservatory through the Solar System (barycentric cor-rections) and secular acceleration, but not for any mea-sured or assumed motion of Gl 15A from interactionswith Gl 15B or C.Measurements made after the HIRES CCD upgrade
in 2004 August suffer from smaller systematic errors. Asdescribed in the Sec. 4, when modeling the measurementswe allowed for a zero-point offset between the 20 “pre-upgrade” and 97 “post-upgrade” RVs, as well as differingamounts of jitter.
4. PLANET DETECTION AND ORBITAL MODEL
We modeled the RV time series as a single planet inKeplerian orbit around the star Gl 15A. We searchedfor periodic signals by computing a Lomb-Scargle pe-riodogram (Lomb 1976; Scargle 1982) of the RVs (Fig-ure 5) and found a dominant peak at 11.44 days. Weseeded single-planet Keplerian models with that periodand a variety of other periods using the orbit fitting tech-niques described in Howard et al. (2010a) and the par-tially linearized, least-squares fitting procedure describedin Wright & Howard (2009). Our adopted model (Table2) has an orbital period near 11.44 days. We also in-clude a linear trend of −0.26± 0.09 m s−1 yr−1, which isconsistent with the mass and separation of the Gl 15ABsystem (see Sec. 2). The best-fit circular, single-planetmodel is plotted in Figure 6.We estimated orbital parameter uncertainties using
a Markov Chain Monte Carlo (MCMC) method (Ford2005, 2006) with the Metropolis-Hastings algorithm(Metropolis et al. 1953; Hastings 1970) and a Gibbs sam-pler (Geman & Geman 1984). We report the median,84.1%, and 15.9% levels of the marginalized posteriorparameter distributions in Table 2. Instead of minimiz-ing χ2, we (equivalently) maximized the logarithm of the

6 Howard et al.
TABLE 2Orbital Solutions for Gl 15Ab
Parameter Value
Circular Orbit Model (adopted)
P (days) 11.4433 ± 0.0016Tc
a (BJD – 2,440,000) 15874.95 ± 0.21K (m s−1) 2.94± 0.28γ (m s−1) 2.47± 0.88dv/dt (m s−1 yr−1) −0.26± 0.09M sin i (M⊕) 5.35± 0.75a (AU) 0.0717 ± 0.0034RMS to best-fit model, pre-upgrade RVs (m s−1) 2.69RMS to best-fit model, post-upgrade RVs (m s−1) 1.93σjit,pre (m s−1) 2.56+0.61
−0.48
σjit,post (m s−1) 1.88± 0.16
Eccentric Orbit Model
P (days) 11.4433 ± 0.0017Tc
a (BJD – 2,440,000) 15875.09 ± 0.45Tp
b (BJD – 2,440,000) 15876.6+2.4−4.7
e cosω −0.04± 0.11e sinω −0.01± 0.09e 0.12+0.08
−0.06
ω (deg) 186+92−110
K (m s−1) 2.93± 0.29γ (m s−1) of relative RVs 2.43± 0.90dv/dt (m s−1 yr−1) −0.27± 0.09M sin i (M⊕) 5.28± 0.75a (AU) 0.0717 ± 0.0036RMS to best-fit model, pre-upgrade RVs (m s−1) 2.70RMS to best-fit model, post-upgrade RVs (m s−1) 1.93σjit,pre (m s−1) 2.54+0.62
−0.48
σjit,post (m s−1) 1.91± 0.16
a Time of inferior conjunction or time of transit if viewed edge-on.b Time of periastron passage.
0.0 0.5 1.0 Orbital Phase
−5
0
5
10
Velo
city
(m
s−1)
P = 11.44 d K = 2.94 m s−1
e = 0.0
Mass = 5.35 ME /sin i
Fig. 6.— Single-planet model for the Keck-HIRES RVs ofGl 15Ab. Filled black circles represent phased measurements whilethe open black circles represent the same velocities wrapped oneorbital phase. The error bars show the quadrature sum of mea-surement uncertainties and jitter. Red squares show RVs binnedin 0.1 phase increments and have an RMS to the model of 0.62ms−1. The best-fit circular orbital solution is shown as a dashedred line.
likelihood,
lnL=−Npre∑
i=1
(vi − vm(ti))2
2(σ2i + σ2
jit,pre)− ln
√
2π(σ2i + σ2
jit,pre)
−Npost∑
i=1
(vi − vm(ti))2
2(σ2i + σ2
jit,post)− ln
√
2π(σ2i + σ2
jit,post),
(1)
where vi and σi are the ith velocity measurement and itsassociated measurement error from among the Npre andNpost measurements acquired before and after the 2004upgrade of HIRES; vm(ti) is the Keplerian model veloc-ity at time ti; σjit,pre and σjit,post are the jitter estimatesof the pre- and post-upgrade data sets. The first term ineach sum represents the usual normalized sum of squaredresiduals (χ2). Following Johnson et al. (2011), we al-lowed jitter to float in the MCMC analysis, as controlledby the second terms in each sum in eq. 1. Our model usesseparate jitter parameters for the pre- and post-upgradeRV data sets. The jitter estimates for these datasets(see Table 2) show the improvement in HIRES measure-ment precision after the 2004 upgrade. We adopted aGregory eccentricity prior (Gregory & Fischer 2010) andnon-informative priors on other parameters. The jumpparameters of the MCMC model were orbital period P ,a time of transit (or inferior conjunction) Tc, Dopplersemi-amplitude K, Lagrangian parameters e cosω ande sinω, RV zero-point γ, RV offset between pre- and post-upgrade data sets, linear RV trend dv/dt, and pre- andpost-upgrade RV jitter terms σjit,pre and σjit,post. Fromthese jump parameters we derived the remaining param-eters listed in Table 2.We justify the inclusion of a linear RV trend, dv/dt,
as follows. For the circular planet model with a trendas a free parameter (Table 2, top), only 0.3% of the

A Close-in Super-Earth 7
MCMC trials have dv/dt > 0. Thus, a negative RVtrend is preferred with approximately 3-σ significance.The trend is also physically well motivated by the dis-tant orbit of the star Gl 15B, and is consistent with the∼1 m s−1 yr−1 expected amplitude (order of magnitude).We considered circular and eccentric single-planet
models. We adopted the circular orbit (Table 2, top) fortwo reasons. First, the posterior distributions for e cosωand e sinω are consistent with zero to within 1-σ in thefloating eccentricity model. Second, the χ2 value (not re-duced) of the best-fit eccentric model is only smaller thanthe value for the best-fit circular model by 0.3, which failsto justify the addition of two model parameters. The ec-centric model rules out e > 0.26 with 95% confidence.
4.1. Photometric confirmation and transit search
We searched for periodic variability of the APT pho-tometry (Sec. 2.4) at the orbital period of 11.44d, butfound none. This non-detection strengthens the plane-tary interpretation for the 11.44d RV signal. A least-squares sine fit to the photometry at the best-fit orbitalperiod gives a semi-amplitude of 0.09 ± 0.14mmag. Asshown in the top panel of Figure 7, this tight limit sup-ports the hypothesis that the RV signal is due to stellarreflex motion from a planet in motion, rather than spots.Gl 15Ab has a 2% a priori probability of having an or-
bital inclination i that gives rise to eclipses as seen fromEarth. While this geometry is unlikely, it is instructiveto consider the photometric detectability of transits. Forplausible planets with radii 1.5–4.0 R⊕, corresponding todensities of 8–0.4 g cm−3, the transit depths are 1.4–10mmag. If the planet has an Earth-like density, then Rp =1.8 R⊕, which gives a transit depth of 2.0 mmag. Equa-torial transits will last 2.1 hr, as shown by the width ofthe box-shaped transit model in the bottom panel Figure7. Our sparse APT photometry casts doubt on the pres-ence of a very low density transiting planet. However,we refrain from making quantitative statements aboutthe sizes of planets that can be excluded based on thecurrent data. To date, only ∼4 points are contained inthe expected best-fit transit window. A dedicated pho-tometric campaign from space or the ground could likelydetect or exclude all of the planet sizes described above.
4.2. Null hypothesis considered
We considered the null hypothesis—that the observedRVs are the chance arrangement of random veloci-ties masquerading as a coherent signal—by calculat-ing false alarm probabilities (FAPs) and Bayesian In-formation Criteria (BIC). Using the method describedin Howard et al. (2010a), we computed the improvementin ∆χ2 from a constant velocity model to a Keplerianmodel for 103 scrambled data sets. We allowed for eccen-tric single-planet orbital solutions in the scrambled datasets. We found that no scrambled data set had a larger∆χ2 value than the measured velocities did, implying anFAP of < 0.001.As an additional check, we assessed statistical signifi-
cance by computing the BIC (Schwarz 1978; Liddle 2004)for the single planet circular model (Table 2, top) and thenull hypothesis, a model with an RV trend varying lin-early with time. The BIC is defined as χ2
min + k lnNobs,where χ2
min is the unreduced χ2 value of the best-fitting
Fig. 7.— APT Photometry from four observing seasons (2008-2011) phased to the best-fit orbital period (Table 2). The pho-tometric means in the final three observing seasons were adjustedto remove yearly offsets. The top panel shows the entire orbitalphase, while the bottom panel focusses on photometry near thephase of predicted transits. Photometry in the top panel showsno apparent modulation at the orbital period, which is consistentwith our planetary interpretation of the RV modulation. Transitdepths of 1 and 10 mmag are shown for a toy model with a transitduration of 2.1 hours for an equatorial transit. The sparse pho-tometry rules out transits if the planet’s atmosphere is extremelybloated, but are insensitive to transits if the planet’s atmospherecontributes minimally to its radius (see text for details). The ver-tical bar shows the typical photometric error of 1.8 mmag. Thetransit time uncertainty for the circular orbit model is indicatedby the horizontal line segment centered at phase 0.0.
1 10 100Period (d)
0
5
10
15
20
25
Pe
rio
do
gra
m P
ow
er
(RV
re
sid
ua
ls)
P = 44.8 d
Fig. 8.— Lomb-Scargle periodogram of the RV residuals to thesingle-planet, circular orbit model for Gl 15Ab. We interpret thepeaks near 44 days as artifacts of stellar rotation because modula-tion at this period is also detected in Ca II H & K lines and opticalphotometry.
model having k degrees of freedom. Nobs = 117 is thenumber of RV measurements. Differences of 2–6, 6–10,>10 between BIC values for the two models indicatesthat there is positive, strong, and very strong evidencefor the more complex model (Kass & Raftery 1995). Thesingle planet model (Table 2) is strongly supported overthe null hypothesis with ∆BIC = 24.
4.3. A second RV signal
In addition to the single-planet model presented above,we also considered two-planet Keplerian models. The

8 Howard et al.
small residuals to the one-planet fit constrain the familyof possible additional planets to those with small Doppleramplitudes – low mass and/or distant. We computed aperiodogram of the RV residuals (Figure 8) to the single-planet fit and found several periods with considerablepower in the range∼30–120d, with the two largest peaksnear 44 d. These peaks correspond to Doppler signalswith ∼1–2m s−1 semiamplitudes and represent possiblesecond planets with masses in the range ∼2–10 M⊕.We considered two-planet orbital solutions with Pb
seeded with the best-fit value from the single-planetmodel and Pc seeded with peaks in the residual peri-odogram. Fits with Pc seeded with periods correspond-ing to either of two tallest peaks in Figure 8 yield themost statistically significant two-planet fits. If real, thissignal would represent a 5 M⊕ planet in a 0.18AU orbitwithin the classically defined habitable zone. The signal(at either of the two periods near 44 d) has an amplitudeof 1.8 m s−1.However, we do not interpret the 44 d RV signal as a
planet. The broad periodogram power in the ∼30–120drange, with two closely spaced peaks near 44d, suggeststhat it is due to rotationally-modulated spots. Such spotsappear and disappear on timescales of weeks and monthson a range of differentially rotating stellar latitudes, in-jecting a quasi-coherent noise in the RV time series. Incontrast, an orbiting planet creates a coherent RV signa-ture. The spot interpretation is strengthened with thedetection of periodic signals in the photometry (Sec. 2.4)and Ca II H & K line strengths (Sec. 2.1), also with∼44d periods. We measured the correlation between theRV residuals to the one-planet fit and the simultaneousSHK values. The Pearson correlation coefficient of r =+0.41 demonstrates a modest correlation between thesequantities. In comparison, the RVs in Table 3 (beforesubtracting the single-planet fit) are less correlated withthe SHK values, with r = +0.24. We conclude that the∼44 d RV signal is mostly likely not due to an orbitingplanet.As an additional check, we computed “running peri-
odograms” (Howard et al. 2011a) of the 11.4 d and ∼44dsignals. This diagnostic tests for coherent signals inthe RV time series by computing the increase in Lomb-Scargle periodogram power near a trial period as addi-tional measurements are taken. The 11.4 d signal risesnearly monotonically in the time series, suggesting a dy-namical origin and supporting the planetary interpre-tation. In contrast, the ∼44d signal waxes and wanesas additional measurements are added to the time se-ries, suggesting an incoherent source such as rotationally-modulated spots.
5. SUMMARY AND DISCUSSION
We announce the existence of a low-mass planet or-biting the star Gl 15A, an M2 dwarf 3.6 pc from Earth.Gl 15Ab has a minimum mass 5.28 ± 0.75M⊕ and or-bits with a period of 11.4433 ± 0.0017d. The orbitaleccentricity is consistent with zero and the planet has anequilibrium temperature of 390 K for a Bond albedo A= 0.75 and 550 K for A = 0.In addition, we detected a second RV signal with a
period of 44 d and an amplitude of 1.8 m s−1. Becausewe also detected photometric and chromospheric modu-lation with the same period, we interpret this signal as
rotational modulation of spots. We will continue to mon-itor Gl 15A to verify that the second signal is truly inco-herent, as spots should be, and to hunt for additional low-mass planets. Our analysis of this second signal showshow challenging the RV detection of Earth-mass planetsin the habitable zones of early M dwarfs will be. Suchplanets will have periods of ∼1–2 months and Doppleramplitudes of ∼0.3–0.4 m s−1, i.e. with similar periodsto the spot signal above, but five times smaller in am-plitude. Detecting such signals will be quite challenging,but may be feasible for high-precision Doppler spectrom-eters with nearly nightly observational coverage. Thehigh cadence not only improves the (naıve) sensitivity as√Nobs, it allows the observer to trace out the anomalous
RV signature of stellar spots and potentially model andsubtract it (e.g. Dumusque et al. 2012). Contemporane-ous photometry will also aid in the false positive vettingfor such future searches.Statistical studies of the Kepler planet catalog
suggest that small planets like Gl 15Ab are abun-dant (Howard et al. 2012; Howard 2013) and thatmulti planet systems are common (Lissauer et al. 2011;Fang & Margot 2012). We plan continued RV monitor-ing to search for such additional planets in this system.Given the distance of only 3.6 pc, we urge high-contrastimaging and astrometry by next generation surveys.
We thank the many observers who contributed tothe measurements reported here. We gratefully ac-knowledge the efforts and dedication of the Keck Ob-servatory staff, especially Scott Dahm, Greg Doppman,Hien Tran, and Grant Hill for support of HIRES andGreg Wirth for support of remote observing. We thankKevin Apps, Andrew Mann, Evan Sinukoff, and CallaHoward for helpful discussions. We are grateful tothe time assignment committees of the University ofHawaii, the University of California, and NASA fortheir generous allocations of observing time. With-out their long-term commitment to RV monitoring, thisplanet would likely remain unknown. We acknowledgeR. Paul Butler and S. S. Vogt for many years of con-tributing to the data presented here. A.W.H. acknowl-edges NASA grant NNX12AJ23G. G.W.H. acknowl-edges support from NASA, NSF, Tennessee State Uni-versity, and the State of Tennessee through its Centersof Excellence program. J.A. J. gratefully acknowledgessupport from generous grants from the David & LucilePackard and Alfred P. Sloan Foundations. This workmade use of the SIMBAD database (operated at CDS,Strasbourg, France), NASA’s Astrophysics Data SystemBibliographic Services, and the NASA Star and Exo-planet Database (NStED). Finally, the authors wish toextend special thanks to those of Hawai‘ian ancestry onwhose sacred mountain of Mauna Kea we are privilegedto be guests. Without their generous hospitality, theKeck observations presented herein would not have beenpossible.

A Close-in Super-Earth 9
TABLE 3Relative Radial Velocities for Gl 15 A
Radial Velocity UncertaintyBJD – 2,440,000 (m s−1) (m s−1) SHK
10461.77113 -2.79 1.09 0.600010716.03838 -3.68 1.09 0.627011044.04091 3.60 0.81 0.665011071.01567 -5.12 1.07 0.598011368.04395 -4.06 1.04 0.570011412.00051 2.25 1.15 0.569011438.83506 1.73 1.23 0.762011552.75997 -6.53 1.21 0.504011704.12495 1.26 1.06 0.564011882.73441 2.56 1.18 0.634012063.12014 3.31 1.40 0.600012097.04192 -2.04 1.35 0.568012099.08799 1.79 1.25 0.566012129.01691 1.65 1.32 0.563012133.09619 2.10 1.14 0.550012487.96446 1.27 1.20 0.585012535.95822 -1.55 1.38 0.576012574.86983 2.00 1.32 0.531012829.10405 -1.15 1.35 0.536012924.89439 -2.33 1.28 · · ·13238.98277 3.49 0.84 0.584013302.80391 -1.46 0.93 0.488013338.81208 -2.33 1.03 0.546013547.11252 3.52 0.57 0.540013548.11449 3.22 0.92 0.530013549.12933 4.55 0.53 0.528013550.12107 3.65 0.61 0.533013551.10142 3.16 0.58 0.557513552.06885 1.68 0.62 0.523013571.07965 2.24 0.54 0.526013723.72563 -1.74 0.71 0.538513928.02017 2.56 0.55 0.572013981.94154 1.71 0.62 0.548014085.85430 0.06 0.80 0.525514339.08172 2.78 0.88 0.643014340.04292 3.31 0.95 0.639014398.90264 -1.05 1.09 0.599014429.88240 3.59 1.02 0.616014667.99675 -1.91 0.96 0.560014672.02334 -0.82 0.74 0.525514673.00572 -2.46 0.61 0.517514674.11984 0.12 0.89 0.542014676.09669 -4.85 0.68 0.522014689.13119 -0.39 0.98 0.619014690.09869 1.04 0.95 0.537014721.03229 -0.81 1.05 0.555014778.86564 -3.02 1.09 0.486014807.88673 3.02 1.05 0.541015134.90869 -4.21 1.02 0.529015412.09294 2.11 0.96 0.472015434.05192 -1.27 0.90 0.520015435.03590 -2.48 0.82 0.494015436.05321 0.29 0.97 0.486015437.07327 0.31 0.99 0.526015470.07431 2.11 1.03 0.521015490.02622 -3.35 1.11 0.442015528.86024 2.60 1.23 0.485015542.83596 2.25 1.02 0.507015545.79628 -2.97 1.08 0.488015584.73104 1.83 1.13 0.518015613.71949 -1.79 1.12 0.484015704.11022 -1.82 1.15 0.509015705.11833 -5.05 1.02 0.521015706.11861 -4.46 0.97 0.511015723.10704 4.86 0.57 0.486315726.12358 6.12 0.57 0.499015727.10118 3.55 0.58 0.521015729.07256 1.41 0.79 0.537515731.08821 3.07 0.53 0.533715732.11181 2.33 0.95 0.542015734.10300 3.56 0.55 0.554015735.10478 3.93 0.54 0.535315736.09232 3.27 0.56 0.531715752.12244 -6.05 0.59 0.473715753.02718 -5.65 0.64 0.4593
TABLE 3 — Continued
Radial Velocity UncertaintyBJD – 2,440,000 (m s−1) (m s−1) SHK
15760.12146 -3.03 0.61 0.445015761.11957 -3.86 0.54 0.446315762.12115 -2.80 0.50 0.437015770.11306 3.10 0.60 0.496715770.94986 2.66 0.52 0.521315782.09409 1.67 0.54 0.544015783.10066 1.74 0.59 0.548015786.12265 -0.05 0.55 0.534315787.99817 0.10 0.58 0.521715789.09994 1.76 0.52 0.520315790.09912 2.32 0.53 0.537015791.11511 4.01 0.55 0.515015792.08892 3.76 0.51 0.507015793.09169 2.52 0.52 0.488715794.13095 2.12 0.53 0.493315795.11032 -1.26 0.58 0.487015796.09957 -2.35 0.56 0.485715797.11759 -4.85 0.57 0.488015798.10397 -4.62 0.57 0.519315799.08373 -2.81 0.56 0.494715806.83968 -1.14 0.64 0.449715808.06252 -0.07 0.66 0.437015809.03505 0.67 0.63 0.449715810.08551 0.87 0.57 0.443315811.04909 -0.61 0.57 0.467015812.06251 0.20 0.53 0.462015815.14191 5.98 0.59 0.494015841.84563 -4.05 0.62 0.493015842.84489 -2.81 0.65 0.473015843.93703 -2.74 0.61 0.472715850.94268 0.30 0.62 0.470715851.83105 -0.44 0.58 0.437315853.76621 -1.94 0.58 0.436715870.93426 1.28 0.74 0.560715877.89696 -4.58 0.65 0.520715878.86899 -3.80 0.61 0.521715879.94263 -3.82 0.59 0.503715880.85881 -1.00 0.57 0.525015901.91394 -0.77 0.57 0.471315902.79143 -0.71 1.48 0.494015903.76626 0.92 0.56 0.470315904.81574 2.57 0.63 0.4743

10 Howard et al.
REFERENCES
Allard, F., Homeier, D., & Freytag, B. 2012, Royal Society ofLondon Philosophical Transactions Series A, 370, 2765
Argue, A. N. 1966, MNRAS, 133, 475Bailey, J., Butler, R. P., Tinney, C. G., et al. 2009, ApJ, 690, 743Baraffe, I., Chabrier, G., Allard, F., & Hauschildt, P. H. 1998,
A&A, 337, 403Barbieri, M., Alonso, R., Laughlin, G., et al. 2007, A&A, 476, L13Berger, D. H., Gies, D. R., McAlister, H. A., et al. 2006, ApJ,
644, 475Bonfils, X., Mayor, M., Delfosse, X., et al. 2007a, A&A, 474, 293—. 2007b, A&A, 474, 293Boyajian, T. S., von Braun, K., van Belle, G., et al. 2012, ApJ,
757, 112Butler, R. P., Marcy, G. W., Williams, E., et al. 1996, PASP,
108, 500Chubak, C., Marcy, G., Fischer, D. A., et al. 2012, ArXiv
e-prints, arXiv:1207.6212Claret, A. 2000, A&A, 363, 1081Covey, K. R., Lada, C. J., Roman-Zuniga, C., et al. 2010, ApJ,
722, 971Cowley, A. P., Hiltner, W. A., & Witt, A. N. 1967, AJ, 72, 1334Cushing, M. C., Rayner, J. T., & Vacca, W. D. 2005, ApJ, 623,
1115Cushing, M. C., Vacca, W. D., & Rayner, J. T. 2004, PASP, 116,
362Cutri, R. M., Skrutskie, M. F., van Dyk, S., et al. 2003, VizieR
Online Data Catalog, 2246, 0Delfosse, X., Forveille, T., Mayor, M., et al. 1998, A&A, 338, L67Delfosse, X., Forveille, T., Segransan, D., et al. 2000, A&A, 364,
217Dotter, A., Chaboyer, B., Jevremovic, D., et al. 2008, ApJS, 178,
89Dumusque, X., Pepe, F., Lovis, C., et al. 2012, Nature, 491, 207Eaton, J. A., Henry, G. W., & Fekel, F. C. 2003, in The Future of
Small Telescopes in the New Millennium, Vol. II, TheTelescopes We Use, ed. T. D. Oswalt, Vol. 288, 189
Erro, B. I. 1971, Boletin del Instituto de Tonantzintla, 6, 143Fang, J., & Margot, J.-L. 2012, ApJ, 761, 92Feiden, G. A., Chaboyer, B., & Dotter, A. 2011, ApJ, 740, L25Ford, E. B. 2005, AJ, 129, 1706—. 2006, ApJ, 642, 505Forveille, T., Bonfils, X., Delfosse, X., et al. 2009, A&A, 493, 645Fowler, A. M., & Gatley, I. 1990, ApJ, 353, L33Gautier, III, T. N., Rieke, G. H., Stansberry, J., et al. 2007, ApJ,
667, 527Geman, S., & Geman, D. 1984, IEEE Trans. Pattern Anal. Mach.
Intell., 6, 721Gezari, D. Y., Pitts, P. S., & Schmitz, M. 1999, VizieR Online
Data Catalog, 2225, 0Gillon, M., Pont, F., Demory, B., et al. 2007, A&A, 472, L13Gregory, P. C., & Fischer, D. A. 2010, MNRAS, 403, 731Hall, J. C., Henry, G. W., Lockwood, G. W., Skiff, B. A., & Saar,
S. H. 2009, AJ, 138, 312Hastings, W. K. 1970, Biometrika, 57, 97Hatzes, A. P., Cochran, W. D., McArthur, B., et al. 2000, ApJ,
544, L145Hauck, B., & Mermilliod, M. 1998, A&AS, 129, 431Henry, G. W. 1999, PASP, 111, 845Henry, G. W., Baliunas, S. L., Donahue, R. A., Fekel, F. C., &
Soon, W. 2000a, ApJ, 531, 415Henry, G. W., Eaton, J. A., Hamer, J., & Hall, D. S. 1995a,
ApJS, 97, 513Henry, G. W., Fekel, F. C., & Hall, D. S. 1995b, AJ, 110, 2926Henry, G. W., Marcy, G. W., Butler, R. P., & Vogt, S. S. 2000b,
ApJ, 529, L41Henry, T. J., Jao, W.-C., Subasavage, J. P., et al. 2006, AJ, 132,
2360Herter, T. L., Henderson, C. P., Wilson, J. C., et al. 2008, in
Society of Photo-Optical Instrumentation Engineers (SPIE)Conference Series, Vol. 7014, Society of Photo-OpticalInstrumentation Engineers (SPIE) Conference Series
Houdebine, E. R. 2010, MNRAS, 407, 1657Howard, A. W. 2013, Science, 340, 572Howard, A. W., Johnson, J. A., Marcy, G. W., et al. 2009, ApJ,
696, 75
—. 2010a, ApJ, 721, 1467—. 2010b, Science, 330, 653—. 2011a, ApJ, 726, 73—. 2011b, ApJ, 730, 10Howard, A. W., Marcy, G. W., Bryson, S. T., et al. 2012, ApJS,
201, 15Isaacson, H., & Fischer, D. 2010, ApJ, 725, 875Jao, W.-C., Henry, T. J., Subasavage, J. P., et al. 2005, AJ, 129,
1954Johnson, H. L. 1965, ApJ, 141, 170Johnson, H. L., & Morgan, W. W. 1953, ApJ, 117, 313Johnson, J. A., & Apps, K. 2009, ApJ, 699, 933Johnson, J. A., Clanton, C., Howard, A. W., et al. 2011, ApJS,
197, 26Johnson, J. A., Gazak, J. Z., Apps, K., et al. 2012, AJ, 143, 111Jones, B. W., & Sleep, P. N. 2010, MNRAS, 407, 1259Kass, R., & Raftery, A. 1995, Journal of the American Statistical
Association, 90, 773Leggett, S. K. 1992, ApJS, 82, 351Liddle, A. R. 2004, MNRAS, 351, L49Lippincott, S. L. 1972, AJ, 77, 165Lissauer, J. J., Ragozzine, D., Fabrycky, D. C., et al. 2011, ApJS,
197, 8Lomb, N. R. 1976, Ap&SS, 39, 447Marcy, G. W., & Butler, R. P. 1992, PASP, 104, 270Marcy, G. W., Butler, R. P., Vogt, S. S., Fischer, D., & Lissauer,
J. J. 1998, ApJ, 505, L147Mayor, M., Bonfils, X., Forveille, T., et al. 2009, A&A, 507, 487Mermilliod, J.-C. 1986, Catalogue of Eggen’s UBV data., 0
(1986), 0Metropolis, N., Rosenbluth, A. W., Rosenbluth, M. N., Teller,
A. H., & Teller, E. 1953, J. Chem. Phys., 21, 1087Niconov, V. B., Nekrasova, S. V., Polosuina, N. S., Rachkouvsky,
N. D., & Chuvajev, W. K. 1957, Izvestiya Ordena TrudovogoKrasnogo Znameni Krymskoj Astrofizicheskoj Observatorii, 17,42
Olsen, E. H. 1993, A&AS, 102, 89Olson, E. C. 1974, AJ, 79, 1424Paulson, D. B., Saar, S. H., Cochran, W. D., & Henry, G. W.
2004, AJ, 127, 1644Pepe, F., Lovis, C., Segransan, D., et al. 2011, A&A, 534, A58Pickles, A. J. 1998, PASP, 110, 863Queloz, D., Henry, G. W., Sivan, J. P., et al. 2001, A&A, 379, 279Rayner, J. T., Cushing, M. C., & Vacca, W. D. 2009, ApJS, 185,
289Reid, I. N., Hawley, S. L., & Gizis, J. E. 1995, AJ, 110, 1838Rivera, E. J., Laughlin, G., Butler, R. P., et al. 2010, ApJ, 719,
890Rojas-Ayala, B., Covey, K. R., Muirhead, P. S., & Lloyd, J. P.
2010, ApJ, 720, L113—. 2012, ApJ, 748, 93Sato, B., Fischer, D. A., Henry, G. W., et al. 2005, ApJ, 633, 465Scargle, J. D. 1982, ApJ, 263, 835Schwarz, G. 1978, Annals of Statistics, 6, 461ten Brummelaar, T. A., McAlister, H. A., Ridgway, S. T., et al.
2005, ApJ, 628, 453Twarog, B. A. 1980, ApJS, 44, 1Upgren, A. R. 1974, PASP, 86, 294Vacca, W. D., Cushing, M. C., & Rayner, J. T. 2003, PASP, 115,
389Valenti, J. A., Butler, R. P., & Marcy, G. W. 1995, PASP, 107,
966Valenti, J. A., & Fischer, D. A. 2005, ApJS, 159, 141Valenti, J. A., & Piskunov, N. 1996, A&AS, 118, 595van Belle, G. T., & von Braun, K. 2009, ApJ, 694, 1085van Buren, D., Brundage, M., Ressler, M., & Terebey, S. 1998,
AJ, 116, 1992van Leeuwen, F. 2007, A&A, 474, 653Vogt, S. S., Allen, S. L., Bigelow, B. C., et al. 1994, in Proc. SPIE
Instrumentation in Astronomy VIII, David L. Crawford; EricR. Craine; Eds., Vol. 2198, p. 362
von Braun, K., Boyajian, T. S., ten Brummelaar, T. A., et al.2011a, ApJ, 740, 49
von Braun, K., Boyajian, T. S., Kane, S. R., et al. 2011b, ApJ,729, L26

A Close-in Super-Earth 11
—. 2012, ApJ, 753, 171von Braun, K., Boyajian, T. S., van Belle, G. T., et al. 2014,
MNRAS, 438, 2413
Wilson, J. C., Henderson, C. P., Herter, T. L., et al. 2004, inSociety of Photo-Optical Instrumentation Engineers (SPIE)Conference Series, Vol. 5492, Society of Photo-OpticalInstrumentation Engineers (SPIE) Conference Series, ed.A. F. M. Moorwood & M. Iye, 1295–1305
Wright, J. T., & Howard, A. W. 2009, ApJS, 182, 205