the kinetics and reproducibility of 18f-sodium fluoride for oncology using current pet camera...
TRANSCRIPT

The Kinetics and Reproducibility of 18F-Sodium Fluoride forOncology Using Current PET Camera Technology
Karen A. Kurdziel1, Joanna H. Shih2, Andrea B. Apolo3, Liza Lindenberg1, Esther Mena1,Yolanda McKinney1, Stephen S. Adler1, Baris Turkbey1, William Dahut3, James L. Gulley3,Ravi A. Madan3, Ola Landgren3, and Peter L. Choyke1
1Molecular Imaging Program, Center for Cancer Research, National Cancer Institute, NationalInstitutes of Health, Bethesda, Maryland 2Biometric Research Branch, Division of CancerTreatment and Diagnosis, National Cancer Institute, National Institutes of Health, Bethesda,Maryland 3Medical Oncology Branch, Center for Cancer Research, National Cancer Institute,National Institutes of Health, Bethesda, Maryland
AbstractWe evaluated the kinetics of 18F-sodium fluoride (NaF) and reassessed the recommended dose,optimal uptake period, and reproducibility using a current-generation PET/CT scanner.
Methods—In this prospective study, 73 patients (31 patients with multiple myeloma or myelomaprecursor disease and 42 with prostate cancer) were injected with a mean administered dose of 141MBq of 18F-NaF. Sixty patients underwent 3 sequential sessions of 3-dimensional PET/CT of thetorso beginning ~15 min after 18F-NaF injection, followed by a whole-body 3-dimensional PET/CT at 2 h. The remaining 13 prostate cancer patients were imaged only at 2 and 3 h after injection.Twenty-one prostate cancer patients underwent repeat baseline studies (mean interval, 5.9 d) toevaluate reproducibility.
Results—The measured effective dose was 0.017 mSv/MBq, with the urinary bladder,osteogenic cells, and red marrow receiving the highest doses at 0.080, 0.077, and 0.028 mGy/MBq, respectively. Visual analysis showed that uptake in both normal and abnormal boneincreased with time; however, the rate of increase decreased with time. A semiautomatedworkflow provided objective uptake parameters, including the mean standardized uptake value ofall pixels within bone with SUVs greater than 10 and the average of the mean SUV of allmalignant lesions identified by the algorithm. The values of these parameters for the imagesbeginning at ~15 min and ~35 min were significantly different (0.3% change/minute). Differencesbetween the later imaging time points were not significant (P < 0.01). Repeat baseline studiesshowed high intraclass correlations (>0.9) and relatively low critical percent change (the valueabove which a change can be considered real) for these parameters. The tumor-to-normal boneratio, based on the SUVmax of identified malignant lesions, decreased with time; however, thisdifference was small, estimated at ~0.16%/min in the first hour.
Conclusion—18F-NaF PET/CT images obtained with modest radiation exposures can result inhighly reproducible imaging parameters. Although the tumor-to-normal bone ratio decreasesslightly with time, the high temporal dependence during uptake periods < 30 min may limit
For correspondence or reprints contact: Karen A. Kurdziel, Molecular Imaging Program, National Cancer Institute, 10 Center Dr.,Room B3B403, Bethesda, MD 20892. [email protected].
DISCLOSURE STATEMENT The costs of publication of this article were defrayed in part by the payment of page charges.Therefore, and solely to indicate this fact, this article is hereby marked “advertisement” in accordance with 18 USC section 1734.
No other potential conflict of interest relevant to this article was reported.
NIH Public AccessAuthor ManuscriptJ Nucl Med. Author manuscript; available in PMC 2013 July 01.
Published in final edited form as:J Nucl Med. 2012 August ; 53(8): 1175–1184. doi:10.2967/jnumed.111.100883.
NIH
-PA Author Manuscript
NIH
-PA Author Manuscript
NIH
-PA Author Manuscript

accurate quantitation. An uptake period of 60 ± 30 min has limited temporal dependence whilemaintaining high tumor-to-normal bone ratio.
Keywordsbone scanning; oncology; pet/ct; prostate cancer; multiple myeloma
IntroductionThere is renewed clinical interest in the use of sodium fluoride (18F-NaF) as a bone scanningagent. Reasons for this resurgence include recent periodic worldwide shortages of 99mTc(needed for conventional bone scanning agents) and the improved sensitivity andquantitative potential of 18F-NaF PET/CT, compared with 99mTc-based conventional bonescans. The current dosing regimens, uptake periods, and reproducibility measurements arefounded on decades-old data, based on older PET equipment. There is a critical need toreassess these recommendations in light of current advances in technology and the addeddrive to develop quantitative imaging to monitor patient response to therapy. Initial uptakeof NaF is dependent on blood flow and exposed bone surface area (1). The diffusion of NaFinto the bone leads to a slow exchange of fluoride ions with hydroxide ions of thehydroxyapatite crystals, eventually forming fluoroapatite, a process that begins rapidly buttakes many days to wks to complete. Given the relatively short half life of 18F-NaF, only theearly stages of this process, namely blood flow and the entrance of fluoride ions into thebound water shell initiating integration into the bone, are imaged. With its rapid bone uptakeand blood clearance, the axial skeleton can be visualized less than an hour after injection.However, understanding the kinetics of this uptake is important for image quantitation andreproducibility. If scanning is performed during a period of rapid bone uptake, it will have ahigher temporal dependence than if it is performed during slow or stable uptake. The uptakeplateau has been previously studied, using less sensitive and lower-resolution scanners, withinconsistent results, ranging from 1 to 5 h after injection (1,2), and thus, there is a need toreconsider dose, uptake kinetics, and reproducibility in light of modern technology.
We evaluated the kinetics of 18F-NaF using a current-generation PET/CT scanner to reassessthe recommended dose of 18F-NaF, characterize the uptake period, and maximize itspotential for quantitation.
MATERIALS AND METHODSPatient Population and Study Design
This protocol was approved by the National Cancer Institute Institutional Review Board andthe Radiation Safety Committee of the National Institutes of Health, and all patients gavewritten informed consent to participate. In this prospective study, 73 patients, including 31with multiple myeloma or myeloma precursor disease and 42 with prostate cancer (with orwithout known bone involvement), were injected with 111–203 MBq (mean, 141 MBq)of 18F-NaF. Approximately 15 min after injection, all 31 of the myeloma patients and 29 ofthe prostate cancer patients underwent 3 sequential 3-dimensional PET/CT images of thetorso (mid ear to upper thigh) over 60 min, followed by a whole-body (vertex to toes) 3-dimensional PET/CT at 2 h after intravenous injection. The remaining 13 prostate cancerpatients were imaged only at 2 and 3 h after injection. A subset of 21 prostate cancerpatients underwent duplicate baseline scanning within a 2-wk period (mean, 5.9 d; range 2–9d) to evaluate reproducibility. Imaging was performed on a Gemini TF system (PhilipsHealth Care). The average patient age was 65 y (age range, 45–80 y). For simplicity, we willrefer to the imaging time points as 1, 2, 3, 4, and 5, corresponding to the mean postinjectiontimes (in minutes, including all patients) of 12.4 ± 2.9, 34.9 ± 3.7, 57.6 ± 4.8, 123.5 ± 11.2,
Kurdziel et al. Page 2
J Nucl Med. Author manuscript; available in PMC 2013 July 01.
NIH
-PA Author Manuscript
NIH
-PA Author Manuscript
NIH
-PA Author Manuscript
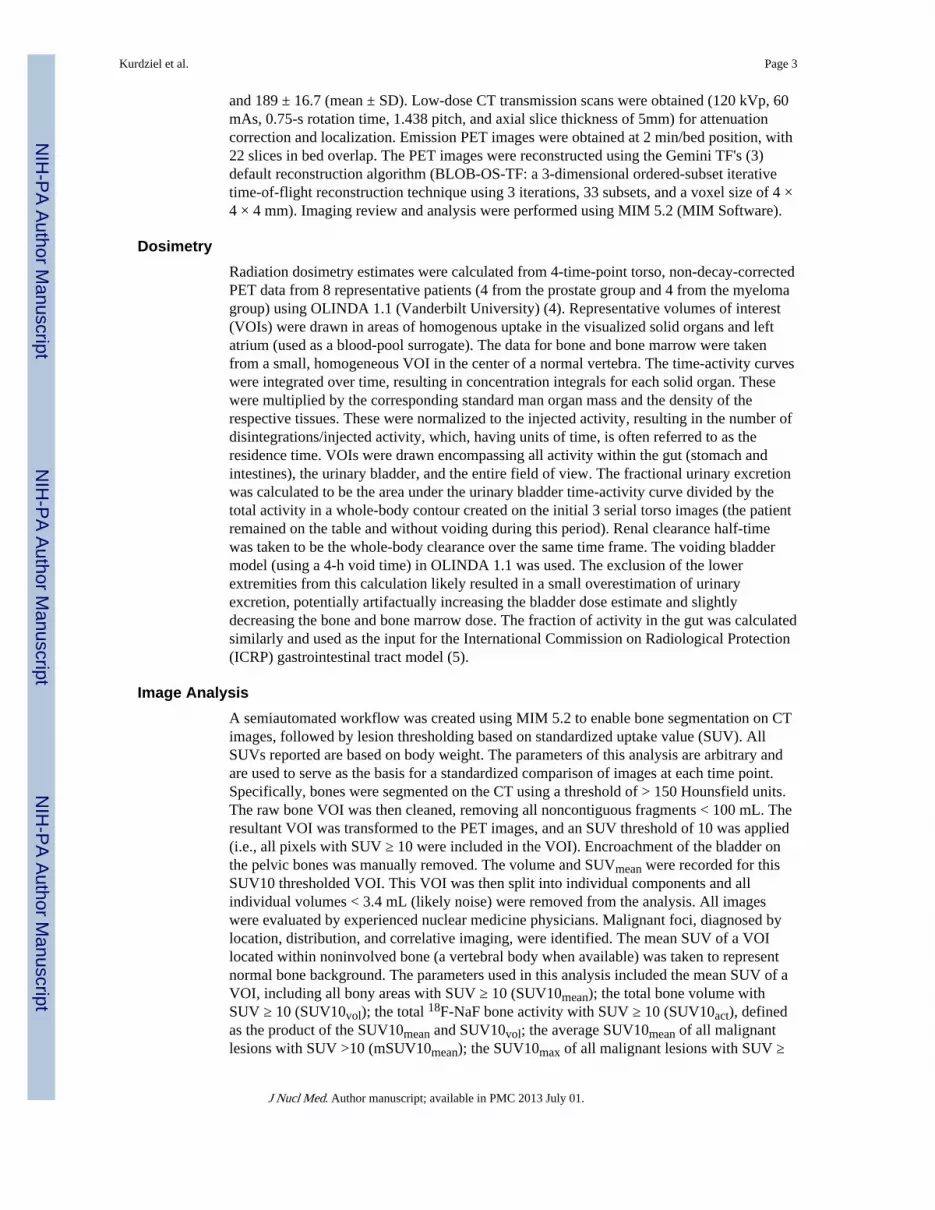
and 189 ± 16.7 (mean ± SD). Low-dose CT transmission scans were obtained (120 kVp, 60mAs, 0.75-s rotation time, 1.438 pitch, and axial slice thickness of 5mm) for attenuationcorrection and localization. Emission PET images were obtained at 2 min/bed position, with22 slices in bed overlap. The PET images were reconstructed using the Gemini TF's (3)default reconstruction algorithm (BLOB-OS-TF: a 3-dimensional ordered-subset iterativetime-of-flight reconstruction technique using 3 iterations, 33 subsets, and a voxel size of 4 ×4 × 4 mm). Imaging review and analysis were performed using MIM 5.2 (MIM Software).
DosimetryRadiation dosimetry estimates were calculated from 4-time-point torso, non-decay-correctedPET data from 8 representative patients (4 from the prostate group and 4 from the myelomagroup) using OLINDA 1.1 (Vanderbilt University) (4). Representative volumes of interest(VOIs) were drawn in areas of homogenous uptake in the visualized solid organs and leftatrium (used as a blood-pool surrogate). The data for bone and bone marrow were takenfrom a small, homogeneous VOI in the center of a normal vertebra. The time-activity curveswere integrated over time, resulting in concentration integrals for each solid organ. Thesewere multiplied by the corresponding standard man organ mass and the density of therespective tissues. These were normalized to the injected activity, resulting in the number ofdisintegrations/injected activity, which, having units of time, is often referred to as theresidence time. VOIs were drawn encompassing all activity within the gut (stomach andintestines), the urinary bladder, and the entire field of view. The fractional urinary excretionwas calculated to be the area under the urinary bladder time-activity curve divided by thetotal activity in a whole-body contour created on the initial 3 serial torso images (the patientremained on the table and without voiding during this period). Renal clearance half-timewas taken to be the whole-body clearance over the same time frame. The voiding bladdermodel (using a 4-h void time) in OLINDA 1.1 was used. The exclusion of the lowerextremities from this calculation likely resulted in a small overestimation of urinaryexcretion, potentially artifactually increasing the bladder dose estimate and slightlydecreasing the bone and bone marrow dose. The fraction of activity in the gut was calculatedsimilarly and used as the input for the International Commission on Radiological Protection(ICRP) gastrointestinal tract model (5).
Image AnalysisA semiautomated workflow was created using MIM 5.2 to enable bone segmentation on CTimages, followed by lesion thresholding based on standardized uptake value (SUV). AllSUVs reported are based on body weight. The parameters of this analysis are arbitrary andare used to serve as the basis for a standardized comparison of images at each time point.Specifically, bones were segmented on the CT using a threshold of > 150 Hounsfield units.The raw bone VOI was then cleaned, removing all noncontiguous fragments < 100 mL. Theresultant VOI was transformed to the PET images, and an SUV threshold of 10 was applied(i.e., all pixels with SUV ≥ 10 were included in the VOI). Encroachment of the bladder onthe pelvic bones was manually removed. The volume and SUVmean were recorded for thisSUV10 thresholded VOI. This VOI was then split into individual components and allindividual volumes < 3.4 mL (likely noise) were removed from the analysis. All imageswere evaluated by experienced nuclear medicine physicians. Malignant foci, diagnosed bylocation, distribution, and correlative imaging, were identified. The mean SUV of a VOIlocated within noninvolved bone (a vertebral body when available) was taken to representnormal bone background. The parameters used in this analysis included the mean SUV of aVOI, including all bony areas with SUV ≥ 10 (SUV10mean); the total bone volume withSUV ≥ 10 (SUV10vol); the total 18F-NaF bone activity with SUV ≥ 10 (SUV10act), definedas the product of the SUV10mean and SUV10vol; the average SUV10mean of all malignantlesions with SUV >10 (mSUV10mean); the SUV10max of all malignant lesions with SUV ≥
Kurdziel et al. Page 3
J Nucl Med. Author manuscript; available in PMC 2013 July 01.
NIH
-PA Author Manuscript
NIH
-PA Author Manuscript
NIH
-PA Author Manuscript

10 (mSUV10max); the total 18F-NaF activity (mSUV10act) in all of the malignant lesionswith SUV ≥ 10 (an estimate of total metastatic burden), defined as the sum of the 18F-NaFactivity in all of the bone lesions classified as malignant; and the normalization of themSUV10max and mSUV10act to normal bone background (mSUV10max:bkg andmSUV10act:bkg). Time-activity curves for each parameter were created. A listing of theparameter abbreviations used is included in Table 1.
Statistical AnalysisBecause of the skewed distribution of each imaging parameter response, all the statisticalanalyses were performed on natural log-transformed data. Imaging data from a singlebaseline study in 42 patients with prostate cancer were used to assess the uptake kineticsof 18F-NaF. The paired t test was used to test the mean difference of SUV (log scale) at thesame location on 2 consecutive images. The percent rate of change per minute wascalculated at each time point. Because of an insufficient number of malignant lesionsidentified at time point 5, comparison between imaging time points 4 and 5 for malignantuptake parameters was not performed. A similar analysis was performed for the myelomagroup (n = 31).
A subset of prostate cancer patients (n = 21) underwent 2 baseline imaging sessions. Eachimaging parameter was measured at each imaging time and was fitted to a variancecomponent model (6), which decomposed the total source variation into 2 components: 1attributable to individual sample (patient-to-patient variation) and the other attributable torepeated imaging in each patient. The 2 variance components, 2 (variation due to repeatedimaging [intrapatient reproducibility]), were used to assess the reproducibility of eachimaging parameter at each imaging time point. Intraclass 2 tau2 ÷ tau2 + sigma2, the ratio ofvariance due to patient heterogeneity to the total variance, measures the degree ofreproducibility. The ICC lies between 0 and 1; the higher the ICC value, the higher thereproducibility.
For the prostate cancer patients who underwent repeated baseline studies, the criticalpercentage difference (CPD) was calculated for each parameter at each imaging time. CPDis the maximal acceptable difference of SUV of 2 repeats measured at the same imagingtime. Differences in SUV larger than the CPD are considered significant, i.e., not due tonoise. CPD is defined as [exp(Z0.975 × sqrt2 × sigma) – 1] × 100, where Z0.975 is the 97.5th
percentile of standard normal distribution, and sigma is the SD for variation due to therepeated imaging.
RESULTSBiodistribution and Dosimetry
The small amount of administered 18F-NaF dose, 111–185 MBq, and modest increase inscan time/bed position (to 2 min), was sufficient to provide diagnostic PET images (Fig. 1).For illustration, the background (muscle) SUVmean plus 2 SDs and normal bone SUVmeanminus 2 SDs for a myeloma patient injected with 192 MBq and a prostate cancer patientinjected with 114 MBq are presented in Table 2. The resultant normal bone-to-backgroundratios were high: 17.6 and 11.7 for the myeloma and prostate patients, respectively.
Most of the injected dose localized within the bones (Figs.1 and 2). On average, 15.3% ±4.9% of the whole-body activity was excreted into the urinary bladder. The mean ± SDbiologic urinary extraction half-life was 1.37 ± 0.01 h. The number of disintegrations/injected activity (residence time) for select organs are included in Table 3. The estimatedeffective dose (ED) was 0.017 mSv/MBq, with the following organs receiving the highest
Kurdziel et al. Page 4
J Nucl Med. Author manuscript; available in PMC 2013 July 01.
NIH
-PA Author Manuscript
NIH
-PA Author Manuscript
NIH
-PA Author Manuscript

doses: urinary bladder (0.080 mGy/MBq) the osteogenic cells (0.077 mGy/MBq), and thered bone marrow (0.028 mGy/MBq) (Table 4).
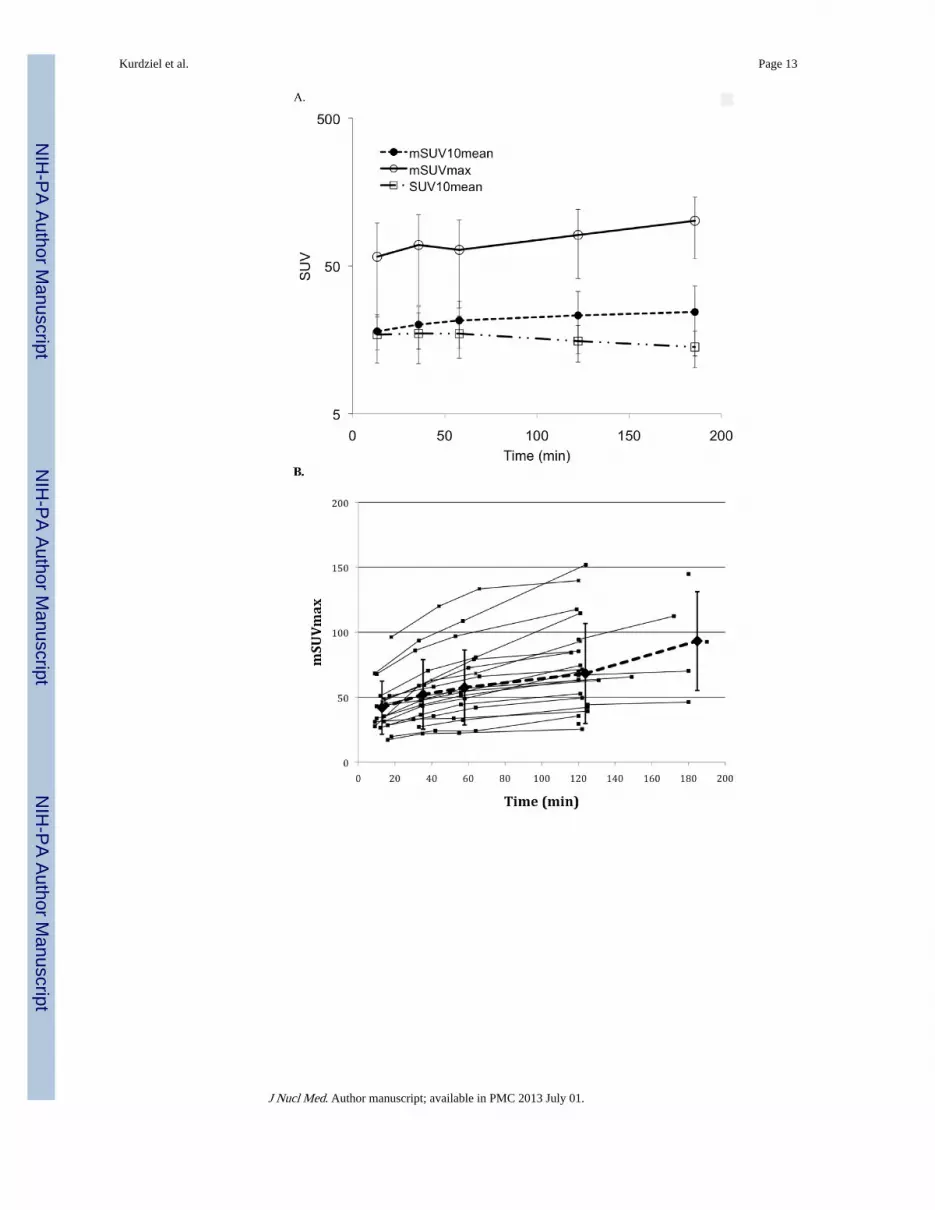
18F-NaF Reproducibility and Temporal DependenceVisually, the uptake of 18F-NaF increased with time in both normal and abnormal bone (Fig.2). The overall 18F-NaF uptake in abnormal bone, as measured by SUV10mean andSUV10act, initially increased with time, followed by a plateau. In prostate cancer patients,considering only the malignant lesions, the maximum SUV (mSUV10max), and mean SUV(mSUV10mean) (Fig. 3A) and total activity (mSUV10act) also increased with time. Figure3B shows 18F-NaF uptake in individual patients with malignant lesions. Although theaverage has a relatively large SD, the consistent shape of each individual patient's curveindicates that this variability is due to differential uptake in the individual patients' tumors,not large changes of tumor uptake over time. Figure 3C shows the decrease in tumor tobackground over time, with the highest ratio present on the initial images.
A comparison of the change in various parameters between sequential images is presented inlog-transformed scale in Table 5. For all parameters there was a significant difference inuptake between the first and second time points (as denoted by the P values), and all butSUV10mean and mSUV10mean and mSUV10max:bkg maintained this significance over time.
Reproducibility data, calculated from the 21 prostate cancer patients who underwentrepeated baseline imaging, are presented in Table 6 and Figure 4. The variability of eachimaging parameter was dominated by patient heterogeneity. ICCs show high reproducibility,greater than 0.9 for most imaging parameters at all image time points. The only exceptionwas mSUV10max:bkg, for which the ICC was below 0.85. The CPD values, representing thepercentage difference in each parameter required to be considered a real change, areprovided in Table 6.
A comparison of multiple uptake parameters at multiple imaging time points was alsoperformed in patients with multiple myeloma or myeloma precursor states (n = 31). Giventhe small number of malignant lesions in this cohort, only the SUV10mean and SUV10actparameters were evaluated. In these patients, the SUV10mean did not change significantlywith time; however, the SUV10act values did increase with time (Table 7).
DISCUSSION18F-NaF was introduced as an imaging agent for bone lesions by Blau et al. (9) in 1962.Data from multiple small studies have shown that 18F-NaF PET produces bone scans withhigher sensitivity and specificity than 99mTc-based bone scans (10–15). In one study ofprostate cancer patients, using CT and clinical follow-up as a gold standard, the sensitivityand specificity for detection of bone lesions was higher for 18F-NaF PET/CT (100% and100%, respectively) than for planar (70% and 57%, respectively) or SPECT bone scans(92% and 82%, respectively) (16).
These promising results, along with the recent shortages of 99mTc, have renewed interestin 18F-NaF clinical bone scanning. The Center for Medicare and Medicaid Services hasestablished reimbursement for 18F-NaF PET/CT performed under clinical protocolsdesigned to assess efficacy (17). The National Cancer Institute (NCI) Cancer ImagingProgram obtained approval of a new drug application (NDA) from the Food and DrugAdministration for the use of 18F-NaF (intravenous injection [296–444 MBq], with anuptake period >1 h) for the evaluation of bone turnover. Specific details regarding the 18F-NaF NDA can be found on the NCI website (18).
Kurdziel et al. Page 5
J Nucl Med. Author manuscript; available in PMC 2013 July 01.
NIH
-PA Author Manuscript
NIH
-PA Author Manuscript
NIH
-PA Author Manuscript

Dosimetry and BiodistributionThe procedure guidelines of the Society of Nuclear Medicine recommend the administrationof 185–370 MBq of 18F-NaF (19); however, we obtained high-quality images byadministering only 111–185 MBq of 18F-NaF. The biodistribution and kinetics (Fig. 2)of 18F-NaF were similar to those previously published, showing rapid accumulation in boneand rapid renal clearance. The first-pass extraction is high but not 100%, as evidenced by thecontinued uptake in bone over time. The rate of uptake decreases with time, presumablybecause of irreversible binding and continued renal clearance. Previous publications (20)based on ICRP Report 53 (21) estimated an ED equivalent (EDE) of 0.027 mSv/MBq, withthe urinary bladder receiving the highest dose at 0.22 mGy/MBq, followed by the bonesurfaces and red marrow, each at 0.04 mGy/MBq. Our results (Table 4) using measuredurinary excretion fraction and biological half-life, and assuming a conservative 4-h voidinginterval, showed the ED to be 0.02 mSv/MBq; however, doses to the urinary bladder weresubstantially lower (0.08 mGy/MBq). The basis for these differences is likely our currentability to obtain and analyze large, high-quality volumetric data over time, resulting inimproved estimates of organ distributions and urinary clearance. The ICRP report assumesthe urinary fraction to be 50%, whereas we measured it to be significantly lower at 15.3% ±0.05%. In addition, the ICRP report measure of the residence time for the bladder was 25.1min, whereas ours was 11 ± 5.4 min. Although the recommended dose of 296–444 MBq, asindicated in the NCI NDA, results in an acceptable ED of 4.9–7.4 mSv, we obtained high-quality images with only 111–185 MBq, with an ED of 1.8–3.1 mSv. High tumor-to-background (T:B) ratios permitted the injection of a reduced dose, with a concurrentincrease in the default scan time/bed position from 1.5 to 2 min. Even at ~111 MBq, thenormal bone-to-background measurements are sufficient (11.7) to determine a statisticallyaccurate measurement (Fig. 1; Table 2).
Temporal Characterization of 18F-NaF Uptake in BoneNaF uptake in bone is dependent on blood flow and the available bone surface area.Eventually, NaF is incorporated into bone by replacement of hydroxyl or bicarbonate ions atthe surface of hydroxyapatite crystals (2); however, this process takes hours to days (1).Given the short half-life of 18F (~110 min), during PET the 18F-NaF likely is notincorporated into bone, but rather is bound within the bone's extracellular fluid (22).Although the kinetics of 18F-NaF uptake in bone have been reported (22), the optimal 18F-NaF uptake period has not been defined. Given the high extraction fraction, rapid uptake,and fast renal clearance, high-contrast bone imaging can be performed much earlierwith 18F-NaF than with 99mTc-methylene-dephosphonate, which typically requires a delayof 2 h or greater. On the basis of available clinical studies, a report of the Society of NuclearMedicine recommends that imaging begin 30–45 min after injection (19). In addition, thereport notes that imaging of the extremities may necessitate a delay of 90–120 min. The NCINDA recommends a delay of 1 h or more delay after injection.
Visual analysisVisually, 18F-NaF uptake increases with time both in normal bone and in malignant andbenign bony processes (Fig. 2). Quantitatively, the T:B ratio decreased with time (Fig. 3C).However, at all time points this ratio was high, and with adjustment of the display windowand level, this difference was not visibly apparent, suggesting that an uptake period as shortas ~15 min may be adequate for nonquantitative clinical interpretation.
Quantitative AnalysisFor quantitative applications, the selection of a robust imaging parameter with highreproducibility is critical to assessing therapeutic response. Although the T:B ratio decreases
Kurdziel et al. Page 6
J Nucl Med. Author manuscript; available in PMC 2013 July 01.
NIH
-PA Author Manuscript
NIH
-PA Author Manuscript
NIH
-PA Author Manuscript

with time, the temporal dependence of the absolute uptake on early images may hinderaccurate serial monitoring (a small difference in uptake period can result in a significantchange in SUV).
To identify the most robust parameter representing bone uptake, we compared severalparameters. We chose to exclude activity with SUV of 10 or less, which was statistically lesslikely to represent abnormal bone, because the contribution of normal bone is dependent onthe amount of bone in the imaging field of view, a parameter that can vary between studiesand between patients. Potentially comprising a large volume, such variability could dilutesmall amounts of disease-based changes. This analysis method is not recommended as anautomated diagnostic parameter, but rather was used as a method of standardizing analysisfor this study.
Initially, global parameters, which are independent of the cause of uptake (i.e., benign ormalignant) such as SUV10act and SUV10mean, were evaluated. By not distinguishingbetween benign and malignant uptake, these parameters would be expected to be lesssensitive to small changes in malignant disease burden. For this reason, metrics morespecific for malignancy were also compared: mSUV10max, mSUV10mean, and mSUV10act.Because the T:B ratio drives lesion conspicuity, normalization to normal bone backgroundfor 2 of the malignant-specific parameters were also evaluated: mSUV10max:bkg andmSUV10act:bkg.
Paired imaging time-point comparisons showed a significant difference between all timepoints, with the exception of SUV10mean (significantly different only between scans 1 and2) and mSUV10max:bkg (showing significant differences between scans 1 and 2, and scans 2and 3). Considering only temporal stability, imaging between ~30 and 90 min resulted in thesmallest rate of change/min (≤ 0.2%) for the SUV10mean, mSUV10max:bkg, andmSUV10mean. This change would translate to a 6% increase in mSUV10mean measurementsbetween ~30 and 60 min, as compared with a 23% difference in mSUV10mean (0.7%change/min) if measured between ~10 and ~40 min.
The precision of 18F-NaF uptake measures in 21 patients, who underwent 2 baseline studieswithin 2 wk was evaluated. The differences within each patient were much smaller than thedifferences between patients. The ICCs were greater than 0.9 for most imaging parameters atall image time points. The only exception was the mSUV10max:bkg, for which ICC wasbelow 0.8. In view of the high reproducibility of unadjusted mSUV10max, the decline ofreproducibility of mSUV10max:bkg was due to the high variability of background SUV.
Considering again the most temporally stable of the highly reproducible parameters—SUV10mean and mSUV10mean—evaluating the critical percentage difference (the minimumpercentage change needed to designate a change as significant), the former is slightly lowerthan the latter (9.4%–20.9% vs. 18.4%–33.2%). The advantage of the SUV10mean is that iteliminates the need to distinguish between benign and malignant abnormal bone uptake,reducing subjectivity; however, the SUV10mean parameter is anticipated to be insensitive tosmall changes in malignant bone disease burden, and mSUV10mean may be more indicativeof total malignant disease burden. Further study is needed to determine the most clinicallyrelevant and robust parameter.
Overall, although the T:B ratio decreases with time (estimated at 0.16%/min in the first h),the rate of change of the most reproducible imaging parameters increases during that time(estimated, 0.3%–0.7%/min). Thus, it is reasonable to image between 30 and 90 min, whentemporal variance is minimized. Fortunately, this paradigm fits readily into the existingworkflow in most PET departments.
Kurdziel et al. Page 7
J Nucl Med. Author manuscript; available in PMC 2013 July 01.
NIH
-PA Author Manuscript
NIH
-PA Author Manuscript
NIH
-PA Author Manuscript
CONCLUSION18F-NaF PET/CT bone imaging with modest radiation exposures results in highlyreproducible imaging parameters. While the T:B ratio decreases with time, the hightemporal dependence of uptake periods < 30 min may limit accurate quantitation. An uptakeperiod of 60 ± 30 min has limited temporal dependence and maintains a high T:B ratio.
AcknowledgmentsWe thank our imaging technologists Gideon Kwarteng and Phil Eclarinal, without whom no data would have beenobtained. We also thank the reviewers of this manuscript, whose advice and recommendations improved the qualityof this article. This work was funded by the Center for Cancer Research/National Cancer Institute/NationalInstitutes of Health.
REFERENCES1. Blau M, Ganatra R, Bender MA. 18 F-fluoride for bone imaging. Semin Nucl Med. 1972; 2:31–37.
[PubMed: 5059349]
2. French RJ, McCready VR. The use of 18-F for bone scanning. Br J Radiol. 1967; 40:655–661.[PubMed: 6033154]
3. Surti S, Kuhn A, Werner ME, Perkins AE, Kolthammer J, Karp JS. Performance of Philips GeminiTF PET/CT scanner with special consideration for its time-of-flight imaging capabilities. J NuclMed. 2007; 48:471–480. [PubMed: 17332626]
4. Stabin MG, Sparks RB, Crowe E. OLINDA/EXM: the second-generation personal computersoftware for internal dose assessment in nuclear medicine. J Nucl Med. 2005; 46:1023–1027.[PubMed: 15937315]
5. International Commission on Radiological Protection (ICRP). Human alimentary tract model forradiological protection. ICRP publication 100. A report of The International Commission ofRadiological Protection. Ann ICRP. 2006; 36:25–327. iii. [PubMed: 17188183]
6. Searle, S. Variance Components. Wiley Press; New York, NY: 1992.
7. Levy P. The design and analysis of clinical experiments. Brit J Math Stat Psychol. 1987; 40:98–99.
8. Fleiss, J. The design and analysis of clinical experiments. John Wiley & Sons; New York, NY:1986.
9. Blau M, Nagler W, Bender M. Fluorine-18: a new isotope for bone scanning. J Nucl Med. 1962;3:332–334. [PubMed: 13869926]
10. Langsteger W, Heinisch M, Fogelman I. The role of fluorodeoxyglucose, F-18-dihydroxyphenylalanine, F-18-choline, and F-18-fluoride in bone imaging with emphasis onprostate and breast. Semin Nucl Med. 2006; 36:73–92. [PubMed: 16356797]
11. Arslandemir C, Schirrmeister H, Dziuk K, et al. Comparison of planar bone scanning with SPECTand F-18-fluoride-PET in staging lung cancer patients [abstract]. J Nucl Med. 2001; 42:305P.
12. Schirrmeister H, Guhlmann A, Kotzerke J, et al. Early detection and accurate description of extentof metastatic bone disease in breast cancer with fluoride ion and positron emission tomography. JClin Oncol. 1999; 17:2381–2389. [PubMed: 10561300]
13. Hetzel M, Arslandemir C, Konig HH, et al. F-18NaFPET for detection of bone metastases in lungcancer: accuracy, cost-effectiveness, and impact on patient management. J Bone Miner Res. 2003;18:2206–2214. [PubMed: 14672356]
14. Schirrmeister H, Glatting G, Hetzel J, et al. Prospective evaluation of the clinical value of planarbone scans, SPECT, and F-18-labeled NaFPET in newly diagnosed lung cancer. J Nucl Med.2001; 42:1800–1804. [PubMed: 11752076]
15. Hoh CK, Hawkins RA, Dahlbom M, et al. Whole-body skeletal imaging with [F-18] fluoride-ionand PET. J Comp Assist Tomogr. 1993; 17:34–41.
16. Even-Sapir E, Metser U, Mishani E, Lievshitz G, Lerman H, Leibovitch I. The detection of bonemetastases in patients with high-risk prostate cancer: 99mTc-MDP planar bone scintigraphy,
Kurdziel et al. Page 8
J Nucl Med. Author manuscript; available in PMC 2013 July 01.
NIH
-PA Author Manuscript
NIH
-PA Author Manuscript
NIH
-PA Author Manuscript

single- and multi-field-of-view SPECT, 18F-fluoride PET, and 18 F-fluoride PET/CT. J NuclMed. 2006; 47:287–297. [PubMed: 16455635]
17. Positron Emission Tomography CMS. [Accessed June 8, 2012] (PET) (NaF-18) to identify bonemetastasis of cancer. MLN Matters. Available at: https://www.cms.gov/MLNMattersArticles/downloads/MM6861.pdf.
18. Cancer tracer synthesis resources. [Accessed June 8, 2012] National Cancer Institute Web site.Available at: http://imaging.cancer.gov/programsandresources/cancer-tracer-synthesis-resources.
19. Segall G, Delbeke D, Stabin MG, et al. SNM practice guideline for sodium 18F-fluoride PET/CTbone scans 1.0. J Nucl Med. 2010; 51:1813–1820. [PubMed: 21051652]
20. Grant FD, Fahey FH, Packard AB, Davis RT, Alavi A, Treves ST. Skeletal PET with 18F-fluoride:applying new technology to an old tracer. J Nucl Med. 2008; 49:68–78. [PubMed: 18077529]
21. International Commission on Radiological Protection (ICRP). Radiation dose to patients fromradiopharmaceuticals. A report of a Task Group of Committee 2 of the International Commissionon Radiological Protection. Ann ICRP. 1987; 18:1–377. [PubMed: 3505163]
22. Blake GM, Park-Holohan SJ, Cook GJR, Fogelman I. Quantitative studies of bone with the use ofF-18-fluoride and Tc-99m-methylene diphosphonate. Semin Nucl Med. 2001; 31:28–49.[PubMed: 11200203]
Kurdziel et al. Page 9
J Nucl Med. Author manuscript; available in PMC 2013 July 01.
NIH
-PA Author Manuscript
NIH
-PA Author Manuscript
NIH
-PA Author Manuscript
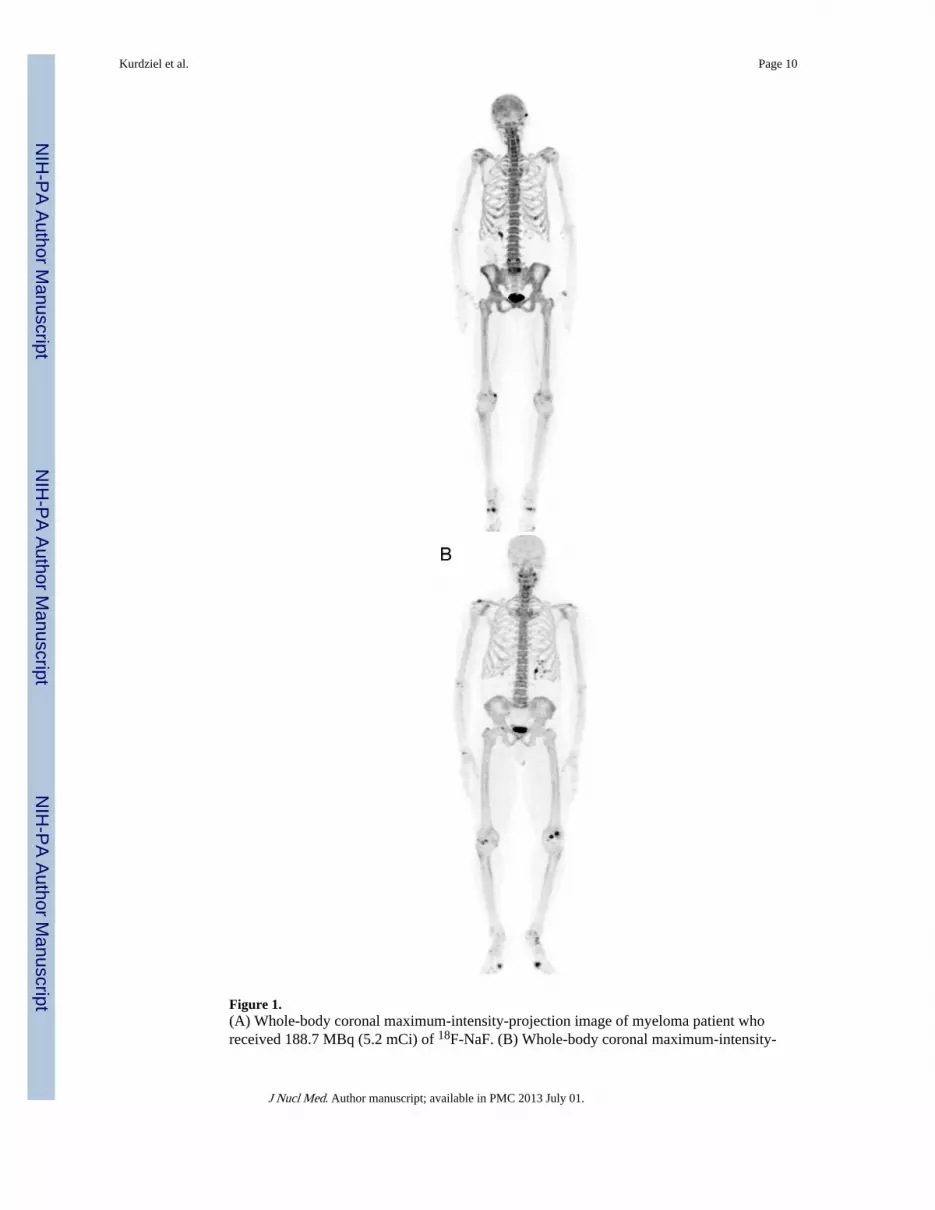
Figure 1.(A) Whole-body coronal maximum-intensity-projection image of myeloma patient whoreceived 188.7 MBq (5.2 mCi) of 18F-NaF. (B) Whole-body coronal maximum-intensity-
Kurdziel et al. Page 10
J Nucl Med. Author manuscript; available in PMC 2013 July 01.
NIH
-PA Author Manuscript
NIH
-PA Author Manuscript
NIH
-PA Author Manuscript

projection image of a prostate cancer patient who received 118.4 MBq (3.1 mCi) of 18F-NaF. Both patients weighed 73 kg and were imaged 2 h after injection. Images are scaledequally. Although overall uptake is higher in the myeloma patient, abnormal foci of uptakeare readily seen on images of both patients.
Kurdziel et al. Page 11
J Nucl Med. Author manuscript; available in PMC 2013 July 01.
NIH
-PA Author Manuscript
NIH
-PA Author Manuscript
NIH
-PA Author Manuscript
Figure 2.Although blood-pool clearance is rapid, uptake in normal and abnormal bone increases withtime. (A) 18F- NaF PET images of 63-y-old man with adenocarcinoma of prostate. Imageswere acquired at 12, 30, 57, and 119 min after injection of 121 MBq (3.26 mCi) of 18F-NaF.Images are normalized such that all activity with SUV > 10 appears in STEP-10 color scale(in which each color change represents a 10% change in SUV). Visibility of lesionsincreases with time. (B) Average time-activity curves for blood pool and normal bone inpatients with prostate cancer.
Kurdziel et al. Page 12
J Nucl Med. Author manuscript; available in PMC 2013 July 01.
NIH
-PA Author Manuscript
NIH
-PA Author Manuscript
NIH
-PA Author Manuscript
Kurdziel et al. Page 13
J Nucl Med. Author manuscript; available in PMC 2013 July 01.
NIH
-PA Author Manuscript
NIH
-PA Author Manuscript
NIH
-PA Author Manuscript

Figure 3.(A) Log plot of average time-activity curves of maximum SUV in mSUV10max,mSUV10mean, and SUV10mean, malignant or benign, in prostate cancer patients (n = 42).Slight upward trend in mSUV10max and mSUV10mean is seen SUV10mean decreasedslightly after 60 min. (B) Plot of the mSUVmax for each patient with metastatic lesions.Dashed line is average value, with error bars representing SD. Large error bars are due toindividual tumors having variable uptake, not to intrapatient time-dependent variability. (C)Plot of mSUVmax-to-normal bone ratio. T:B ratio decreases with time.
Kurdziel et al. Page 14
J Nucl Med. Author manuscript; available in PMC 2013 July 01.
NIH
-PA Author Manuscript
NIH
-PA Author Manuscript
NIH
-PA Author Manuscript

Figure 4.Plot of absolute value of the percentage change of SUV10mean (A) and mSUV10mean (B) inprostate cancer patients who underwent repeated baseline imaging within 2 wk of each other(no intervention; mean interval, 5.9 ± 2 d). M = patients who were imaged for 4 time pointsover 2 h; I = the patients who were imaged only at 2 and 3 h after injection. Dotted line anderror bars are mean and SD, respectively, at each time point.
Kurdziel et al. Page 15
J Nucl Med. Author manuscript; available in PMC 2013 July 01.
NIH
-PA Author Manuscript
NIH
-PA Author Manuscript
NIH
-PA Author Manuscript

NIH
-PA Author Manuscript
NIH
-PA Author Manuscript
NIH
-PA Author Manuscript
Kurdziel et al. Page 16
TABLE 1
Definition of PET Parameters
GLOBAL Used in all patients
SUV10mean Mean SUV of a VOI including all bony areas with SUV ≥ 10
SUV10act Total activity of 18F-NaF in all bone uptake with SUV ≥ 10
bkg Mean SUV of noninvolved bone (a vertebral body when available); normal bone background
MALIGNANT Used only in prostate patients with malignant lesions
mSUV10max Maximum SUV of all malignant lesions with SUV ≥ 10
mSUV10mean Average SUV10mean of all malignant lesions with SUV ≥ 10
mSUV10act Total 18F-NaF activity in all malignant lesions with SUV ≥ 10 (an estimate of total metastatic burden)
NORMALIZED Used only in prostate patients with malignant lesions
mSUV10max:bkg Maximum SUV of all malignant lesions divided by mean SUV of normal bone
mSUV10act:bkg Total activity in all malignant lesions divided by the mean SUV of normal bone
J Nucl Med. Author manuscript; available in PMC 2013 July 01.

NIH
-PA Author Manuscript
NIH
-PA Author Manuscript
NIH
-PA Author Manuscript
Kurdziel et al. Page 17
TAB
LE 2
Com
pari
son
of B
one-
to-B
ackg
roun
d U
ptak
e w
ith R
espe
ct to
Inj
ecte
d D
ose
Inje
cted
dos
e (M
Bq)
Upt
ake
peri
od (
h)P
atie
nt w
eigh
t (k
g)SU
Vbk
g +
(2 x
SD
)SU
Vbo
ne −
(2
x SD
)B
one
to b
ackg
roun
d
188.
72
730.
6912
.12
17.5
9*
118.
42
730.
9210
.77
11.7
5*
* Bot
h in
ject
ed d
oses
yie
ld a
ccep
tabl
e bo
ne:b
ackg
roun
d ra
tio
J Nucl Med. Author manuscript; available in PMC 2013 July 01.

NIH
-PA Author Manuscript
NIH
-PA Author Manuscript
NIH
-PA Author Manuscript
Kurdziel et al. Page 18
TABLE 3
Listing of Mean Cumulative Activity per Injected Dose (Residence Times) for Selected Organs
Organ Mean (h) SD
Lung 0.029 0.014
Liver 0.017 0.002
Kidney 0.010 0.002
Spleen 0.002 0.000
Heart 0.004 0.001
Muscle 0.223 0.046
Red marrow 0.130 0.050
Cortical bone 0.901 0.282
Trabecular bone 0.207 0.079
Heart chamber 0.010 0.002
Urinary bladder wall 0.190 0.089
Stomach 0.025 0.005
Small intestine 0.044 0.010
Upper large intestine 0.010 0.010
Lower large intestine 0.018 0.011
Final dose calculations made in article represent average of each subject's individual organ dose (i.e., residence times for each subject were enteredinto OLINDA separately, resulting in a unique organ dose for each subject).
J Nucl Med. Author manuscript; available in PMC 2013 July 01.

NIH
-PA Author Manuscript
NIH
-PA Author Manuscript
NIH
-PA Author Manuscript
Kurdziel et al. Page 19
TABLE 4
Human Radiation Dosimetry Estimates for Select Organs
OrganAverage Average
rad/mCi mGy/MBq rem/mCi mSv/MBq
Adrenals 0.037 [0.002] 0.010 [0.001]
Brain 0.034 [0.004] 0.009 [0.001]
Breasts 0.022 [0.005] 0.006 [0.001]
Gallbladder 0.032 [0.007] 0.009 [0.002]
Lower large intestine 0.052 [0.008] 0.014 [0.002]
Small intestine 0.069 [0.019] 0.018 [0.005]
Stomach 0.051 [0.022] 0.013 [0.006]
Upper large intestine 0.070 [0.021] 0.019 [0.006]
Myocardium 0.035 [0.005] 0.009 [0.001]
Kidneys 0.040 [0.009] 0.011 [0.002]
Liver 0.024 [0.002] 0.007 [0.000]
Lungs 0.039 [0.009] 0.010 [0.002]
Muscle 0.028 [0.001] 0.007 [0.000]
Ovaries 0.044 [0.007] 0.012 [0.002]
Pancreas 0.035 [0.006] 0.009 [0.002]
Red marrow* 0.104 [0.025] 0.028 [0.007]
Osteogenic cells* 0.288 [0.086] 0.077 [0.023]
Skin 0.022 [0.004] 0.006 [0.001]
Spleen 0.029 [0.003] 0.008 [0.001]
Testes 0.029 [0.006] 0.008 [0.002]
Thymus 0.026 [0.005] 0.007 [0.001]
Thyroid 0.029 [0.005] 0.008 [0.001]
Urinary bladder* 0.300 [0.049] 0.080 [0.013]
Uterus 0.051 [0.008] 0.014 [0.002]
Total body 0.043 [0.001] 0.012 [0.000]
Effective dose equivalent 0.074 [0.004] 0.020 [0.001]
Effective dose 0.062 [0.004] 0.017 [0.001]
n = 8; calculated using OLINDA. Data in brackets are SDs.
*Organs receiving highest dose.
J Nucl Med. Author manuscript; available in PMC 2013 July 01.

NIH
-PA Author Manuscript
NIH
-PA Author Manuscript
NIH
-PA Author Manuscript
Kurdziel et al. Page 20
TAB
LE 5
Com
pari
son
of M
ultip
le U
ptak
e Pa
ram
eter
s at
Mul
tiple
Im
agin
g T
ime
Poin
ts in
Pat
ient
s w
ith P
rost
ate
Can
cer
Par
amet
erIm
agin
g T
ime
Poi
nt
Tim
e po
int
12
34
5
Tim
e (m
in)
12.9
±2.
835
.3±
3.7
57.9
±4.
712
3.6±
7.2
184.
8±9.
8
Inte
rval
(m
in)
22.4
022
.60
65.7
061
.20
GL
OB
AL
SUV
10m
ean
(log
-sca
le)
2.73
2.77
2.75
2.69
2.6
Mea
n di
ffer
ence
(lo
g-sc
ale)
0.04
<0.
01−
0.03
−0.
02
% c
hang
e/m
in*
0.3
<0.
1−
0.1
<0.
01
p-va
lue
0.00
160.
7708
0.11
540.
1832
SUV
10ac
t5.
86.
596.
67.
357.
64
Mea
n di
ffer
ence
(lo
g-sc
ale)
0.79
0.41
0.85
0.51
% c
hang
e/m
in*
5.3
1.4
1.4
0.9
P va
lue
<0.
0001
<0.
0001
<0.
0001
<0.
0001
MA
LIG
NA
NT
mSU
V10
max
3.63
3.84
3.93
4.1
Mea
n di
ffer
ence
(lo
g-sc
ale)
0.24
0.09
0.24
% c
hang
e/m
in (
log-
scal
e)1.
60.
30.
4
P va
lue
<0.
0001
<0.
0001
<0.
0001
mSU
V10
mea
n2.
852.
943
3.02
Mea
n di
ffer
ence
(lo
g-sc
ale)
0.11
0.06
0.05
% c
hang
e/m
in+
0.7
0.2
0.1
p-va
lue
<0.
0001
<0.
0001
0.03
65
mSU
V10
act
6.94
7.2
7.41
7.34
Mea
n di
ffer
ence
(lo
g-sc
ale)
0.44
0.2
0.43
% c
hang
e/m
in*
30.
70.
7
P va
lue
<0.
0001
<0.
0001
<0.
0001
NO
RM
AL
IZE
D
mSU
V10
max
:bkg
J Nucl Med. Author manuscript; available in PMC 2013 July 01.

NIH
-PA Author Manuscript
NIH
-PA Author Manuscript
NIH
-PA Author Manuscript
Kurdziel et al. Page 21
Par
amet
erIm
agin
g T
ime
Poi
nt
Mea
n di
ffer
ence
(lo
g-sc
ale)
0.08
0.01
0.04
% c
hang
e/m
in*
0.5
<0.
10.
1
P va
lue
0.03
860.
8362
0.40
01
mSU
V10
act:b
kg
Mea
n di
ffer
ence
(lo
g-sc
ale)
0.28
0.11
0.22
% c
hang
e/m
in*
1.9
0.4
0.4
P va
lue
00.
0004
0.00
32
Tim
e in
terv
al b
etw
een
time
poin
ts 3
and
4 a
nd 4
and
5 is
~3
times
that
of
1–2
and
2–3.
SUV
10m
ean
and
SUV
10ac
t rep
rese
nt m
ean
SUV
and
tota
l 18 F
-NaF
act
ivity
of
a V
OI
cont
aini
ng a
ll bo
ne w
ith S
UV
≥ 1
0, r
espe
ctiv
ely.
* % c
hang
e/m
in v
alue
s id
entic
al f
or b
oth
log
and
orig
inal
sca
les
J Nucl Med. Author manuscript; available in PMC 2013 July 01.

NIH
-PA Author Manuscript
NIH
-PA Author Manuscript
NIH
-PA Author Manuscript
Kurdziel et al. Page 22
TAB
LE 6
Rep
eat B
asel
ine
Imag
ing
Ana
lysi
s in
Pat
ient
s w
ith P
rost
ate
Can
cer.
Par
amet
er
Imag
e T
ime
poin
t1
23
45
Tim
e (m
in)
12.4
± 2
.934
.9 ±
3.7
57.6
± 4
.812
3.5
± 1
1.2
189
± 1
6.7
GL
OB
AL
SUV
10m
ean
ICC
0.97
0.97
0.93
0.87
0.92
CPD
16.2
14.9
20.9
239.
4
SUV
10ac
t
ICC
0.78
0.93
0.9
0.93
0.96
CPD
575.
115
9.6
203.
516
5.6
105.
9
MA
LIG
NA
NT
mSU
V10
max
ICC
0.91
0.9
0.93
0.94
CPD
52.2
6652
.754
.1
mSU
V10
mea
n
ICC
0.89
0.94
0.91
0.98
CPD
27.4
2433
.218
.4
mSU
V10
act
ICC
0.96
0.91
0.95
0.97
CPD
111.
619
6.9
135.
312
4.4
NO
RM
AL
IZE
D
mSU
V10
max
:bkg IC
C0.
780.
650.
720.
84
CPD
220.
930
2.3
231.
414
2.1
mSU
V10
act:b
kg ICC
0.96
0.95
0.95
0.97
CPD
202.
524
9.9
218
162.
2
Ele
ven
patie
nts
unde
rwen
t 2 im
agin
g se
ssio
ns a
t 4 im
agin
g tim
e po
ints
; 10
patie
nts
unde
rwen
t 2 im
agin
g se
ssio
ns a
t 2 im
agin
g tim
e po
ints
. Bec
ause
of
limite
d nu
mbe
r of
tum
ors
in la
tter
grou
p, c
ompa
riso
nof
3 m
alig
nant
lesi
on-b
ased
par
amet
ers
was
not
mad
e fo
r im
agin
g tim
es 4
and
5.
J Nucl Med. Author manuscript; available in PMC 2013 July 01.

NIH
-PA Author Manuscript
NIH
-PA Author Manuscript
NIH
-PA Author Manuscript
Kurdziel et al. Page 23
TABLE 7
Comparison of Multiple Uptake Parameters at Multiple Imaging Time Points in Patients with MultipleMyeloma and Precursor States
Time point 1 2 3 4
Time (min) 14.8 ± 4.6 37.2 ± 5.9 59.8 ± 7.9 121.5 ± 10.4
Interval (min) 22.40 22.60 61.70
SUV10mean 2.50 2.51 2.51 2.50
Mean difference (log-scale) 0.01 0 −0.01
Rate of change per min (%)* 0.1 <0.1 <0.1
P value 0.2969 0.759 0.5897
SUV10act 3.94 5.09 5.92 7.32
Mean difference (log-scale) 1.37 0.87 1.37
Rate of change per min(%)* 9.2 2.9 2.3
P value <0.0001 <0.0001 <0.0001
Time interval between time points 3 and 4 and 4 and 5 is ~3 times that of 1–2 and 2–3.
Because of the small number of positive malignant lesions, only mean and activity of abnormal foci with SUV > 10 (SUV10mean and SUV10act)
are presented. In these patients, the SUV10mean does not change significantly with time; however, SUV10act values do.
Repeated baseline studies were not performed in group.
*Percentage change per min values are identical for both log and original scales.
J Nucl Med. Author manuscript; available in PMC 2013 July 01.