the ionizing radiation environment on the international space station: performance vs. expectations...
TRANSCRIPT

Source of Acquisition NASA Johnson Space Center
The Ionizing Radiation Environment on the International Space Station: nce vs. E x p e c ~ t i o ~ for Avionics a
Steven L. Koontz"), Paul A. Boeder"), Courtney Pankop'", Brandon Reddell'"
Abstract
The role of structural shielding mass in the design, verification, and in-flight performance of International Space Station (ISS), in both the natural and induced orbital ionizing radiation (IR) environments, is reported.
1) Structural Engineering Division Mail Code ES4, NASA Johnson Space Center, Houston, Texas 77058 2) The Boeing Company, 13100 Space Center Blvd. HB3-20, Houston, Texas 77059-3599
Introduction
Orbital inclination (5 1.6') and altitude (nominally between 350 km and 400 km) determine the natural ionizing radiation environment of the International Space Station (ISS). The high inclination orbital environment exposes ISS to higher fluences of trapped energetic electrons, trapped protons, solar and galactic cosmic rays (1-3) than would be the case in a lower inclination orbit with the same altitude range, largely as a result of the overall shape and magnitude of the geomagnetic field (1-3). In addition, an induced radiation environment is produced by inelastic collisions of primary galactic and solar cosmic ray nuclei, as well as trapped protons, with ISS structural materials (4-6). ISS structure provides a shielding depth ( 10g/cm2 to 100 g/cm2) substantially greater than that typical of unmanned spacecraft (e 1 g/cm2) (6). ISS shielding depths are comparable to the inelastic collision lengths of energetic galactic cosmic rays (GCRs) (7) that pass through the geomagnetic field with minimal deflection (E > 10 GeV). Hadronic showers (secondary particle cascades consisting of energetic protons, neutrons, mesons and nuclear fragments) (8) initiated in ISS structure and shielding by inelastic collisions of minimally-deflected, high- energy GCRs are expected to make a larger contribution to the single event effect (SEE) and total ionizing dose environments than would be the case in less massive spacecraft (4-6). Similarly, the hadronic showers initiated by GCR collisions with air nuclei in Earth's atmosphere produce secondary particle cascades (7, 8) leading to the well know Pfotzer radiation maximum, a concern for aircraft avionics, at altitudes near 20 km (9, 10). The atmospheric shielding depth at 20 km altitude is about 50 g/cm2 air.
ISS must meet all performance requirements during continuous exposure to the nominal total ionizing dose (TID) and single event effect (SEE) environments for not less than 15 years. Periodically, ISS is also exposed to the extreme SEE environment produced by solar energetic particle events and must remain safe and functional during the events and recover to meet all performance requirements after the events. The performance of ISS hardware in the TID and SEE Environments must be verified by test and analysis prior to acceptance of hardware for flight.
The ISS ionizing radiation environment for design and verification is defined in SSP-305 12-Rev. C, (1) while electronic parts testing method and analysis procedures are defined in SSP-30513 Rev. B (2). Not all avionic equipment on ISS is subjected to the test and verification processes defined in SSP-305 12 and SSP- 305 13. Some lower criticality equipment is accepted on the basis of an assembled article high-energy proton screening test (1 1).
Structural ShieldinP Mass
The ISS ionizing radiation requirements documents (1,2) contains no specific guidelines or recommendations on how to account for the effects of structural shielding mass on the SEE or TID environments, though look-up tables describing the effects of simple Al shielding mass geometries are included. For purposes of design and verification, small shielding depth environments have been assumed for the purpose of estimating worst-case TID and SEE effects. TID and SEE susceptible equipment outside the pressurized elements is generally assumed to be at the center of an aluminum sphere, 0.13cm to 0.5 lcm thick (shielding depth of 0.35g/cm2 to 1.5 g/cm2 Al). The corresponding values used for sensitive equipment inside the pressurized elements are 1.3cm to 5.lcm (shielding depth of 3.5 g/cm2 to 14 g/cm2 All.

The shielding depths usually assumed for ISS design and verification are substantially smaller than the actual shielding depths. For a typical point internal to the ISS pressurized elements, detailed Sector Shielding (12), and CAD based (13-15) analysis of the as-built ISS structure reveals a cumulative shielding depth distribution function with a median (50%) value of between 50 and 60 g/cm2 and ranging from 10 to 100 g/cm2 at the 10% and 90% points respectively. Similarly, the cumulative shielding depth distribution of ISS avionics enclosures external to the pressurized elements typically ranges from 4 g/cm2 to 20 g/cm2 with a median value of 10 g/cm2 (15). It should be noted that no secondary particle design environment is specified SSP-305 12 Rev. C, though some analysis of secondary neutron and proton effects was completed for ISS optoelectronic devices labile to displacement damage produced by structural secondary and Earth- albedo neutrons (16). In the analysis presented below, the shielding mass distribution of avionics boxes mounted external to the pressurized elements are used with no additional contributions from the truss or pressurized element structure which either have relatively low mass and/or subtend only a small solid angle as viewed from the avionics box location. For avionics boxes mounted inside the pressurized elements, the avionics box mass distribution is simply added to the pressurized element mass distribution with no consideration of local geometry.
The Radiation Design Environment - Total IonizinP Dose
The ISS TID radiation environment is specified for 500 km at solar maximum and includes trapped protons defined per AP8MAX and trapped electrons defined per AEi8MAX. The contributions of solar and galactic cosmic rays and secondary particles are not included. Shielding mass effects are included in the form of look-up tables for Al shielding mass in two simple geometries, as determined with the well known Shieldose model combined with the SSP-305 12 natural environment (1). Dose estimates at specific points in more complex ISS configurations can be made by combining the CAD or Sector (12-15) based shielding mass distributions with the Al shielding look-up tables in SSP-3 15 12. Other minor contributions to TID, such as galactic or solar cosmic rays and x-rays, uncertainties in the trapped radiation models, contributions from SEP and other space weather events, and degradation rates of exposed labile materials, are addressed through the application of a recommended design margin of 2X applied to the 500 km design environment. The ISS radiation design environment represents a conservative, low cost solution for ISS hardware design and verification. The selection of 500 km as a design point altitude is, in itself, a worst-case assumption because ISS operates between 350 km and 460 km. TID rates increase by a factor of about 3X between 300 and 500 km, largely as a result of the altitude structure of the SAA.
On-Orbit Observations - Total Ionizing Dose
ISS is performing well within expectations with respect to TID to EEE parts and materials interior to structural shielding. With few short term exceptions, ISS has been flying at altitudes between 350 and 400 km during the past 6 years, well below the 500 km specified for the worst-case radiation design environment in SSP 305 12. TID accumulated to date is well below the performance degradation threshold (1 had) for even for the most sensitive ISS EEE parts and will remain so for the life of ISS. Ionizing radiation dose measurements, conducted within the habitable volume using therm0 luminescent dosimeters and crew personal dosimeters, range from 5 to 12 pGy (tissue) (0.5 to 1.2 mrads (tissue)) per hour, depending on location in the habitable volume, corresponding to an annual dose range of 44 to 105 mGy (tissue) (4.4 to 10.5 rads (tissue)) (17-19). For most of the subject dosimetry measurement times, ISS has been flying at altitudes below 400 km during the declining phase of the last solar maximum. The variation in TID with location in the habitable volume is expected as a result of variations in the average line-of-sight shielding depth with location in ISS (12-15). Pre-flight worst-case estimates of TID internal to the ISS pressurized elements were less than 20 rads (Si)/year in all cases (12), about twice the maximum observed dose rates.
The Radiation Design Environment - Single Event Effects
Two different natural single event environments, for design and verification, are specified in SSP-305 12 Rev. C (1). The nominal SEE environment is based on AP-8 solar minimum model for trapped protons and the CREME86, space weather index, M A , solar minimum model for galactic cosmic rays. The nominal SEE environment is specified for a 500 km altitude at solar minimum so as to define a global worst-case environment for both trapped protons and GCR (1). The extreme SEE environment is also specified for 500 km. The extreme SEE environment for ISS design and verification is based on the October 1989 SEP

event; a 9gfi percentile worst-case extreme SEE environment with respect to both energetic proton and energetic heavy ion fluxes (20-23).
Methods for testing and analysis of EEE parts in support of ISS avionics performance verification in the nominal and extreme SEE environments are described in detail in SSP-30513 Rev. B (2). The Scott Effective Flux Approach (SCFA) (24), using a charged particle incident angle cut-off of 80' (normal incidence is 0') and an LET cut-off of 110 MeVcm2/mg, is used to calculate worst case estimates of on- orbit upset rates for ISS design and verification purposes. Petersen (25) has shown that the ISS SCFA methods can overestimate or underestimate predicted on-orbit SEU rates compared to the Integral Rectangular Parallelepiped (lRRP) method for some classes of device geometry and relative radiation hardness. For the ISS 1Mx4 DRAM considered in detail below, an overestimation of about one order of magnitude is expected. In subsequent work, Peterson has demonstrated that a generalized Figure of Merit (FOM) approximation can produce useful SEU rate predictions (often comparable to much more complex detailed IRPP with shielding particle transport calculations) for a wide range of EEE part types, shielding mass environments and orbits (26). Barak, Reed and LaBel have analyzed this surprising result and established a sound theoretical basis for FOM (27). Below, SCFA and FOM SEU rate calculations are compared with observed on-orbit SEU rates for an ISS lx4M DRAM.
Estimation of on-orbit SEU rates using either the SCFA or FOM requires heavy ion and proton test data in combination with the shielding mass distribution function. The DRAM die for the specific 1Mx4 DRAM (Texas Instruments 44400,O.g micron design rules, 13.7mm x 6 mm die size) used in the ISS multiplexer demultiplexer MDMs was selected on the basis of results of TID and SEE testing conducted by the European Space Agency @SA) (28) on the essentially identical 4Mx1 device. The normal-incidence heavy ion test data can be fit to the well known Weibull function, as shown below, allowing calculation of SEU cross section, cs, as a function of ion effective linear energy transfer, L.
(T (L) = (T (s)( 1 - exp{ -[(L - Lo)/W]s}) where,
(T (s) = the saturated SEE cross-section at large values of L; (T (s) = 3.00 x 10⁻⁷cm2/bit (r (L) = the SEU cross-section for any value of L, L = the Linear Energy Transfer (LET) of the ion species in the beam, and Lo, W, and S are em irical parameters, adjusted for a best fit to the observed data with Lo = 0.99 (MeV-cm )/mg, W = 7.7 (MeV-cm2)/mg, and s = 1.3 t?
Proton testing yielded a threshold proton energy, Ep, equal to 3OMeV, and a saturation cross section, op, equal to 2.00 x 10-'3cm2/bit (28).
The shielding mass distribution functions as determined by the CAD method (12-15) for the ISS MDM DRAM reported on here is shown in Figure 1, and the physical locations of the external ISS MDMs are shown in Figure 2 and are calculated as described above, in the shielding mass section of this paper.
The SEU FOM for the lx4M is calculated using the Weibull parameters derived from heavy ion test data as described in reference 26.
FOM = (r (~)/&.25)~ , where
0 (s) = (T (s) = 3.00 x 10⁻⁷cm2/bit; the limiting SEU cross-section at large values of L, and b . 2 5 = Lo + W(0.288)"' = the LET value at (T (L) = 0.250 (s).
The upset rate for a particular orbit, and an assumed 100 mils (0.71g/cm2) of AI shielding, is then calculated using an orbit specific rate coefficient, Cob, that has the units upsets per bit-day (26) or,
Rate (upsets/(bit day)) = FOM x Cmb.
The effect of shielding mass can be accounted for using the following very approximate equation (26),
Corb/sMd = 2COrb - 0.5Corblog(t), where t is a shielding thickness in mils.

MDM Model Shkldlng Distrlbutlon
I
1 .o
0.8
+ 0.7
!! 0.6
0.5
i: 0.2
0.1
0.0 0.1 1 10
T, Equinknt Aunimrm Thklmua (&m!2)
Figure 1: MDM 1Mx4 DRAM Structural Shielding Distributions.
100
$0-1 MDM-IO I - . -7"-r ---
m.
Figure 2: External MDM locations on ISS
On-Orbit Observations - Single Event Effects
The current configuration of the US segment of ISS (FlightIStage 11) contains over 600 SEE susceptible avionics boxes and 3000 devices susceptible to SEE induced functional interrupt. During 4 years of flight, a total of 11 in-flight anomalies have been observed that may be SEE related. No destructive SEE events have been observed. None of the SEE related anomalies show the strong correlations with SEP events, flight through the SAA, or flight at high latitudes as predicted using the design environment in combination with the assumption of low shielding mass.
On-Orbit ISS MDM SEE Performance
The performance of the ISS command and data handling system MDM units is of special interest in light of the critical nature of MDM function. During the first 4 years of flight, the 16 MDMs in the US Lab module have displayed only 3 performance anomalies that may be attributable to SEE processes (see Figure 3). The three possible SEE performance anomalies showed no correlation with SEP events or flight through the South Atlantic Anomaly, though two of the three occurred at latitudes near +5 1 degrees. MDM performance anomalies are driven by functional lockup of 80386SX microprocessor and the 82370 controller. An average US Lab MDM anomaly rate of 4.4E-3 per day (6 per 4 years) was predicted using

-180 -160 -120 -90 60 -30 0 30 60 90 120 150 180
‘100MaVSPE In pmq.rMmd M n u C LOngltUdO ooEoFltm~-1plu
Figure 3: SEE anomaly candidates - 2001 to 2005 MDM = multiplexer demultiplexer; AFS =Automatic Payload Switch; ASBSP = Assembly and Contingency System Baseband Signal Pmcessm, AUAI = ACWCS Audio Iuterface Unit
an assumed shielding mass of 14 g/cm2 and an assumed critical bit fraction of 20 percent of the total bit count in the critical devices. During the frrst 4 years of flight the observed anomaly rate for the 14 US Lab MDMs is 1.5 x lo4 per day (3 per 4 years), a factor of 2 lower than the pre-flight verification estimate. No MDM anomalies were observed during any of the 23 > lOOMeV solar energetic particle events (extreme SEE environments) that occurred between April 200 1 and June 2005.
ISS MDMs are equipped with error detection and correction (EDAC) capability. The EDAC detects and corrects single-bit-perdata-word errors but only detects errors involving more than one bit per data word. No true, single word, double bit errors have been detected to date, though 13% of the DRAM SEU events observed to date involve 2 or more bits per 1 second telemetry reporting cycle. DRAM refreshes are initiated every 8 pec and take 8.2 seconds to complete so that at any time there are 125,000 refreshes in progress. The multiple upsets are most likely the result of a single charged particle event affecting physically adjacent DRAM cells that are not part of the same data word because the probability of two independent events in 1 sec is equal to the square of the single event rate and is therefore minute.
DRAM SEUs for 6 of the external MDMs are plotted as a function of SEU latitude and longitude in Figure 4. SEU data was collected for 155 calendar days, however, after accounting for occasional loss of telemetry signal COS) periods the actual SEU data collection time turns out to be 135 days. LOS is most likely between longitudes of +55 and +80 east as is apparent in Figure 4. This LOS region corresponds to a region where TDRSS-3 coverage cannot always be guaranteed due to scheduling issues.
The expected increase in SEU counts in the South Atlantic Anomaly (SAA) and the high latitude or “horn” regions of the map are obvious. Table 1 shows the relative number of upsets in the SAA region, the high latitude horn regions, and the remainder of the orbital ground track, i.e. the mid latitude, non-SAA region. All 6 external MDMs are displaying nearly the same upset rate and very nearly the same distribution of upsets in the three major geographic regions, except for MDM SO-1, which shows a lower SEU rate in the SAA region and MDM Pl-1, which shows a significantly higher rate overall. With the exceptions of MDM P1-1 and MDM SO-1, the overall variation between MDMs is within that expected from Poisson process counting statistics. The SAA region makes a relatively small contribution to the total number of soft upsets, most of which occur in the horn and mid latitude regions.
; 2005 MDM DRAM SEU Events; 01 :A-
Average on-orbit SEU Count per MDM 10 g/cm2 median shielding
(SEW135 days) 268 f 17
, ................ ;................, 60 ................. j .................. j .................. : ..._....._._..__ j --
SEFA SEU Count FOM SEU Count 10g/cm2 Shielding 10g/cm2 Shielding (SEU/135 days) (SEW135 days)
3574 949
I , -
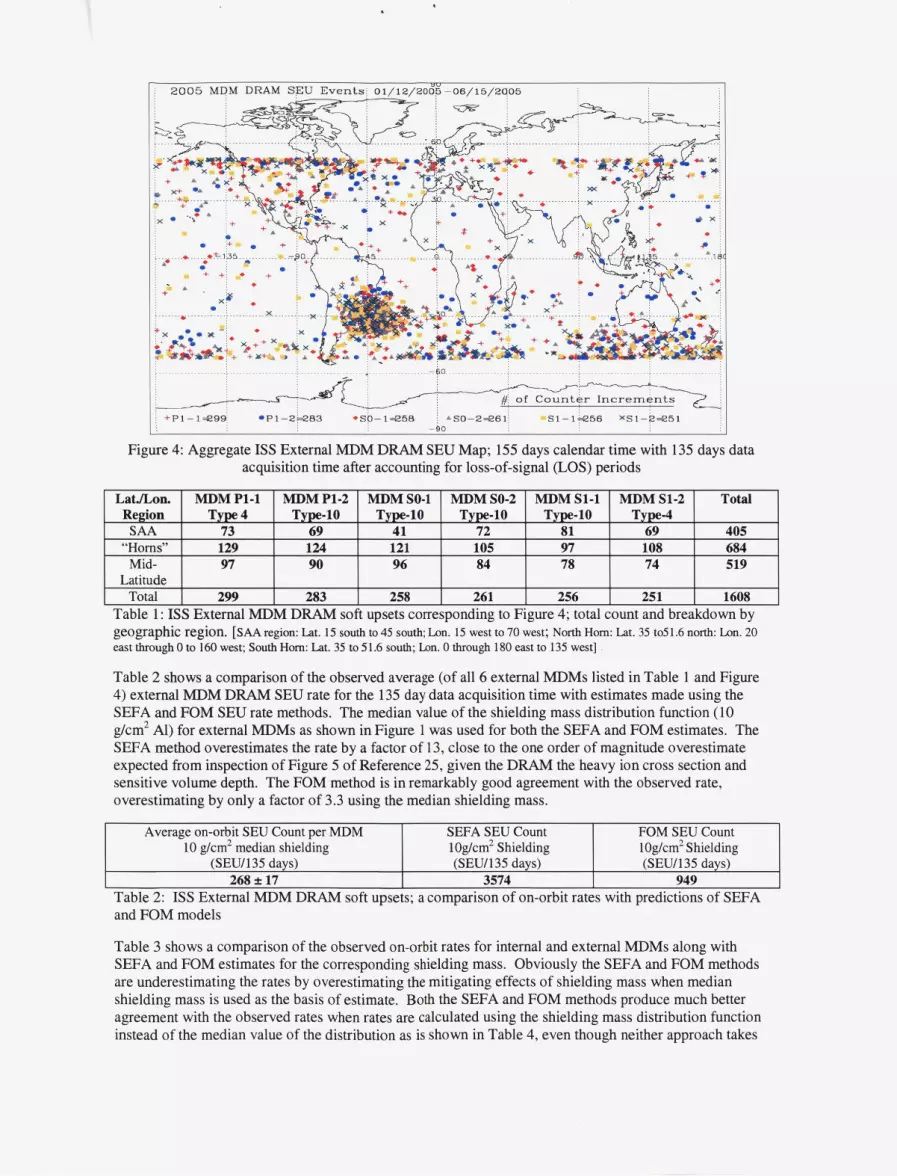
Figure 4: Aggregate ISS External MDM DRAM SEU Map; 155 days calendar time with 135 days data acquisition time after accounting for loss-of-signal (LOS) periods
Table 1 : ISS External MDM DRAM soft upsets corresponding to Figure 4; total count and breakdown by geographic region. [SAA repioa: Lat. 15 south to 45 south; Lon. 15 west to 70 west; North Horn: Lat. 35 to51.6 north: Lon. 20 east through 0 to 160 west; South Horn: Lat. 35 to 51.6 south, Lon. 0 through 180 east to 135 west] I
Table 2 shows a comparison of the observed average (of all 6 external MDMs listed in Table 1 and Figure 4) external MDM DRAM SEU rate for the 135 day data acquisition time with estimates made using the SEFA and FOM SEU rate methods. The median value of the shielding mass distribution function (10 gkm2 Al) for external MDMs as shown in Figure 1 was used for both the SEFA and FOM estimates. The SEFA method overestimates the rate by a factor of 13, close to the one order of magnitude overestimate expected from inspection of Figure 5 of Reference 25, given the DRAM the heavy ion cross section and sensitive volume depth. The FOM method is in remarkably good agreement with the observed rate, overestimating by only a factor of 3.3 using the median shielding mass.
Table 3 shows a comparison of the observed on-orbit rates for internal and external MDMs along with SEFA and FOM estimates for the corresponding shielding mass. Obviously the SEFA and FOM methods are underestimating the rates by overestimating the mitigating effects of shielding mass when median shielding mass is used as the basis of estimate. Both the SEFA and FOM methods produce much better agreement with the observed rates when rates are calculated using the shielding mass distribution function instead of the median value of the distribution as is shown in Table 4, even though neither approach takes

secondary particle production in shielding into account. The improved agreement is largely a result of consistent overestimation of SEU rates for the lower mass end of the shielding mass distribution function.
for multiple bit errors) and comparison of on-orbit rates with predictions of SEFA and FOM models using median shielding values for estimate
Table 4: Effects of integrating over the shielding mass: ISS Internal External MDM DRAM soft upset rates (corrected for multiple bit errors) and comparison of on-orbit rates with predictions of SEFA and FOM models
Summaw and Conclusions
Detailed consideration of the effects of both the natural and induced ionizing radiation environment during ISS design, development, and flight operations has produced a safe, efficient manned space platform that is largely immune to deleterious effects of the LEO ionizing radiation environment. The assumption of a small shielding mass for purposes of design and verification has been shown to be a valid worst-case approximation approach to design for reliability, though predicted dependences of SEE effects on latitude, longitude, SEP events, and spacecraft structural shielding mass are not observed. The FOM method over predicts the rate for median shielding masses of about 10g/cm2 by only a factor of 3, while the SEFA method overestimated by about one order of magnitude as expected. The IRPP, SEFA, and FOM methods for estimating on-orbit SEU rates all utilize some version of the CREME-96 treatment of energetic particle interaction with structural shielding, which has been shown to underestimate the production of secondary particles in heavily shielded manned spacecraft (4-6 and 29-3 1). The need for more work directed to development of a practical understanding of secondary particle production in massive structural shielding for SEE design and verification is indicated. In contrast, total dose estimates using CAD based shielding mass distributions functions and the Shieldose Code provided a reasonable accurate estimate of accumulated dose in Grays internal to the ISS pressurized elements, albeit as a result of using worst-on- worst case assumptions (500 km altitude x 2) that compensate for ignoring both GCR and secondary particle production in massive structural shielding.
References 1) (a) Boeder, P., Watts, J.; “Implementation of Ionizing Radiation Requirements for Space Station,” AIAA 93-0612,31” Aerospace Sciences Meeting and Exhibit, Jan. 11-14,1993, Reno Nevada, (b) Boeder, P.; SDace Station Ionizing Radiation Desim Environment; SSP-30512 Revision C., National Aeronautics and Space Administration, Space Station Program Office, Johnson Space Flight Center, Houston, Texas 77058 June 3, 1994, (c) Adams, J.; “Cosmic Ray Effects on Micro-Electronics, Part IV,” NRL Memorandum Report 5901, Naval Research Laboratory, December 3 1,1986, (d) Shieldose, www.sDenvis.oma.be/helD/background/shieldose 2) Boeder, P.; Space Station Ionizing Radiation Environment Effects Test and Anal sis Techni ues; SSP-30513 Revision B, National Aeronautics and Space Administration, Space Station Program Office, Johnson Space Flight Center, Houston, Texas 77058 June 3, 1994. 3) (a) Anderson, J. B., Smith, R. E., Natural Orbital Environment Guidelines for Use in AerosDace Vehicle DeveloDment, NASA Technical Memorandum 4527, National aeronautics and space Administration, Marshall Space Flight Center, Huntsville, Alabama 35821, (b) Handbook of Geouhvsics and the SDace Environment; Jursa, Adolph S. , Editor, Air Force Geophysics Laboratory, Air Force Systems Command, United States Air Force, 1985 4) Dyer, C. S . , Truscott, P. R., Evans, H., Sims, A. J.; “Secondary Radiation Environments in Heavy Space Vehicles and Instrumentation,” Adv. Space Res. Vol. 17, No. 2, pp (2) 53 - (2) 58,1996. 5 ) (a) Dementyev, A. V., Nymmik, R. A., Sobolevsky, N. M.; Nucleon Spectra Behind 1-100 g/cm2 Aluminum Shielding under Galactic and Solar Cosmic Rays Irradiation, Preprint n 95-28/392. SINP MSU 1995, (b) Getselev, I., Rumin, S., Sobolevsky, N., Ufimtsev, M., Podzolko, M.; “Absorbed dose of secondary neutrons from galactic cosmic rays inside the international space station,” Advances in Space Research, 34 (2004) pp. 1429-1432 6) (a) Holmes-Siedel, A., Adams, L.; Handbook of Radiation Effects, Oxford University press, Oxford, New York, 1993, pp 399-405, (b) Hastings, D., Garrett, H.; Spacecraft-Environment Interactions, Cambridge University Press, Cambridge, New York, 1996, pp.

21 1-223, (c) Smith, E. C.; “Effects of Realistic Satellite Shielding on SEE Rates,” IEEE Transactions on Nuclear Science, Vol. 41, No. 6, December 1994. 7) (a)Groom, D. E., The European Physical Journal, C15 (2000) 1, Chapters 6 & 23. (b) Higawara, K., et al., Physical Review D66, 010001-1 (2002), Chapters 6 and 24 8) Masarik, J., Beer, J.; “Simulation of Particle Fluxes and Cosmogenic Nuclide Production in the Earth’s Atmosphere,” J. Geophys.
9) Gangnes, A. V., Jenkins, Jr., J. F., and Van Allen, J. A. “The Cosmic Ray Intensity above the Atmosphere,” PhysiculReview 75
10) Norman, E.; “Single Event Effects in Avionics,” Boeing Defense and Space Group, Seattle, WA,
Res., D1-4(10), 120999-13-12,1999
(Jan. 1949): 57-69
ojects, Lyndon B. Johnson Space Center, Houston Texas, Sept. 30,1999 12) Pendleton, G. N.; “Radiation Dose Sector Shielding Track Analysis Tool Results for the International Space Station,” Colsa Corporation Report Colsa-RTD-ISS-DR-03-008-DOC-B, Colsa Corporation, Huntsville Alabama, USA, March 2003 (Marshal Space Flight Center cooperative agreement NCC8-200, J. W. Watts Jr. Project Technical Representative) 13) Hugger, C. P., Nealy, J. E., Clowdsley, M. S., Wilson, J. W., Qua&, G. D., Atwell, W., Cucinotta, F. A., Golightly, M. J., Semones, E., Shavers, M. R.; “Preliminary Validation of an ISS Radiation shielding Model,” AIAA Conference Paper AIAA 2003- 6220. 14) Colbom, B. L., Potter, D. W., Armstrong, T. W.; “A Space Station Freedom CAD Mass Model for Ionizing Radiation Analyses,” Science Applications International Corporation Report SAIC-TN-9301, Jan. 1993 (NASA Marshall space Flight Center Space Science Laboratory Contract No. NAS8-38770 15) Ringler, S. J., Colbom, B. L., and Armstrong, T. W.; “CADrays 3-D Shielding Model of Space Station Multiplexer/Demultiplexer Electronic Components for Single Event Upset Prediction,” Science Applications International Corporation Report SAIC-TN-9535, Aug. 1995 (NASA Marshall space Flight Center Space Science Laboratory Contract No. NAS8-39698) 16) (a) Clowdsley, M. S., Wilson, J. W., Shinn, J. L., Badavi, F. F., Heinbockel, J. H., Atwell, W.; “Neutron Environment Calculations for Low Earth Orbit,” Society of Automotive Engineers, Paper Number OlICES-2327,2001 @)Armstrong, T. W., Colbom, B. L.; “Predictions of secondary Neutron and Proton Fluxes Induced in the International Space Station by the Space Radiation Environment,” Science Applications International Corporation Report 98O42R, Prospect TN, August 1998 17) (a)Beaugean, R., Burmeister, S., Petersen, F., Reitz, G.; “Dosimetxic Measurements on ISS during Quiet and Disturbed Periods,” 6th Workshop on Radiation Monitoring of the International Space Station, 12-14 September, 2001, Jesus College, Oxford England, @) Berger, T., Hajek, M., Summerer, L., Vana, N., Akatov, Y., Shurshakov, V., Arkhangelsky, V.; “Austrian dose measurements onboard space station MIR and the International Space Station,” Advances in Space Research 34, (2004), pp. 1414-1419. 18) Semones, E., Johnson, S., Weyland, M., Golightly, M.; “Recent Results of Passive Monitoring on International Space Station,” 6th Workshop on Radiation Monitoring of the International Space Station, 12-14 September, 2001, Jesus College, Oxford England 19) httu://srag-nt.isc.nasa.gov/RadDocs/WRMISS02--ISSRadMeasurean~at~chive.Ddf 20) httu://lheawww.gsfc.nasa.gov/-reames/~sfc3.html 21) Reames, D. V.; “Solar Energetic Particle Variations,” Cospar D2.3-E3.3-0032-02, &tu:/leuact2.gsfc.nasa.gov/don/Vmiations.odf 22) Sauer, H.; “GOES Observations of Energetic Protons E>685 MeV: Ground Level Events form 10/83 to 7/92, 23d, ICRC, Alberta Canada, 1993. 23) Majewski, P. P., Normand, E., Oberg, D. L.; “A New Solar Flare Heavy Ion Model and Its Implementation Through MACREE, An Improved Modeling Tool to Calculate Single Event Effect Rates in Space,” IEEE Transactions on Nuclear Science, Vol. 42, No. 6, December 1995, pp. 2043-2050. 24) Scott, T. M.; “A Single Event Rate Calculation Technique,” IBM Report 89-PN6-004, Feb. 1989 25) Petersen, E. L.; “SEE Rate Calculations Using the Effective Flux Approach and a Generalized figure of Merit Approximation,” IEEE Transactions on Nuclear Science, 42 (6) Dec. 1995, pp 1995-2003 26) Petersen, S. L., ‘The SEU Figure of Merit and Proton Upset Rate Calculations,” IEEE Transactions on Nuclear Science, 45 (6) December 1998, pp 2550-2562 27)Barak, J., Reed, R. A., LaBel, K. A.; “On the Figure of Merit Model for SEU Rate Calculations,” IEEE Transactions on Nuclear Science46, (6) December 1999 pp.1504-1510 28) Harboe-Sorensen, R., Muller, R., Daly, E., Nickson, B., Schmitt, J., Rombeck, F. J.; “ Radiation pre-screening of 4 M bit dynamic random access memories for space application,” in RADECS 91, Proceedings of the First Eurooean conference on Radiation and its Effects on Devices and Svstems, 09/09/91 to 09/12/91. La Grande-Motte, France, IEEE Catalog Number 91THO400-2 29) O’Neill, P. M., Badhwar, G. D.; “Single Event Upsets for Space shuttle flights of New General Purpose Computer Memeoy Devices,” IEEE Transactions on Nuclear Science, 41, (5) October 1994 30) Shinn, J. L., Cucinotta, F. A., Wilson, J. W., Badhwar, G. D., ONeill, P. M., Badavi, F. F.; “Effects of Target Fragmentation on Evaluation of LET Spectra from Space Radiation in Low-Earth Orbit (LEO) Environment: Impact on SEU Predictions,” Proceedings of the 32nd Annual International Space Radiation Effects Conference, Madiion Wisconsin, July 17-21,1995. 31) OSullivan, D. O., Zhou, D., Semones, E., Heinrich, W., Flmd, E.; “Dose Equivalent, Absorbed Dose, and Charge Spectrum Investigation in low-Earth Orbit,” Advances in Space Research, 34 (2004) pp. 1420-1423