the integration of fuzzy-ism, fuzzy-ahp, and - doi
TRANSCRIPT
The Integration of Fuzzy-ISM, Fuzzy-AHP, and
Fuzzy-MICMAC Approach under Trapezoid Fuzzy
Linguistic to Analyze Enablers of The Logistics
Outsourcing Relationship: Mekong Delta, Vietnam
Rice Supply Chain Context.
Nguyen Thang Loi1, H.T.T Hoa2, P.D.T.Anh1, N.D.Khoi1, N.T.K.My1, N.T.Luan1
1FPT University, School of Business.
2Ho Chi Minh City University of Transport
Received: March 11, 2021. Revised: August 14, 2021. Accepted: August 29, 2021. Published: August 31, 2021.
Abstract: The purpose of this paper is to analyze the effects
of the factors and determine the importance of these
factors to the LO relationship with the desire to improve
the efficiency in logistics activities of the supply chain. An
integrated approach including Fuzzy Interpretation
Structure Model (FISM), Fuzzy Cross-Impact Matrix
Multiplication Applied to Classification (FMICMAC)
analysis, Fuzzy Analytic Hierarchy Process (FAHP) is
structured in reaching this purpose. Specifically, the
impact of factors on the LO relationship will be
determined through the FISM-FMICMAC method, then
FAHP will use the results from this FISM-FMICMAC
analysis step to perform the determination of the level of
importance of contributing factors to the LO relationship.
The fuzzy number formats of this paper are all in
trapezoidal format. To evaluate the proposed framework,
a typical example of logistics activity in the Mekong Delta
Rice Supply Chain (SuC) was selected. The results have
shown the impact level of 14 factors on the LO relationship
under 4 clusters (Dependent, Linkage, Independent
Autonomous). Finally, only the 10 most outstanding of the
14 factors were used to conduct FAHP analysis to find the
global weightages which contribute to the LO relationship
by each factor.
Keywords: Fuzzy-AHP, Fuzzy-ISM-MICMAC, Relationships,
Rice Supply Chain, Third-party logistics service providers,
Trapezoidal linguistic.
I. INTRODUCTION
Although it is one of the countries with the top trade-to-GDP
ratio in the world, specifically over 170%, Vietnam's logistics
have been also incurred costs more than 20% of GDP, which
is belonging to the highest line in the world. [1-2]
Recognizing the great importance and efficiency of logistics
services, Vietnam has focused on building a legal, policy
framework, and in particular, outsourced logistics services
have been expanded through the applicable preparatory
regulations. use in the coming time. Therefore, the enterprises
prefer outsourcing LSP for their logistics issues, which have
supported them in reaching the superiority about the cost and
arouse the overall operational efficiency of their systems,
especially logistics operations Evangelista et al. (2012). [3]
According to shipper’s perspective, the Fail Relationship
(FR) is formed by a dependency relationship with LSP that
caused a large risk, thus the suitable LO relationship
management has been stressed about its important roles (Tsai
et al., 2012) for enriching the performance of LO control (Chu
et al., 2016). In addition, the escape of responsibility,
perception of opportunism, business conflicts of interest, lack
of expertise and reveal each other's business secrets which
cause to the shorter three to five years existence of LO
relationships (Sangam , 2015). [4-6].
Therefore, the tightness of the LO relationship should be
regularly rated to minimize the risk which can influence to the
performance of logistics operations. Kumar and Singh (2012)
and Liu et al. (2011) have revealed that two most significant
criteria that have rated the service level of LSP, are logistics
the cost related to logistics operation and the cost for on-time
delivery. In which, the second criteria, Liu et al. (2011) has
illustrated the significant results in increasing the cohesion
degree when shippers are committed by LSP for the on-time
delivery [7-8].
Research on maintaining LO relationships, Jayaram and
Tan (2010) have provided various citations and guidelines
within the linkage of onshoring and offshoring operations to
enhanced performance. However, the authors have not offered
any recommendations to solve the performance problems, but
only called for more research into LO relationships. The
application on SuC management, Lam et al. (2015) and König
and Spinler (2016) have concurred that LSP have played key
roles in reducing the overall risks in the SuC operation. [9-11]
In this study, the objective to concentrate the LO
relationship for orienting the future logistics operation deal
with Rice SuC in Mekong Delta, Vietnam, within an LO
context which the enterprises in this area are forced the
pressures by Vietnam Government for changing to using LO
service. The LO relationship framework will be derived from
the integrations of an extensive literature review, the Experts'
ideas and the real information which is arranged a logical
INTERNATIONAL JOURNAL OF CIRCUITS, SYSTEMS AND SIGNAL PROCESSING DOI: 10.46300/9106.2021.15.137 Volume 15, 2021
E-ISSN: 1998-4464 1260
order to make sure that only the main factors influencing LO
relationships will not be missed.
The remaining parts are constructed as follows. The various
enablers of LO relationships are discussed in the literature
review. Next, the methodology which is built by the
integration of FISM-FMICMAC-FAHP will be mentioned in
next part. The next part is the illustration of the FISM-
FMICMAC-FAHP methodology applied to Mekong Delta
(Vietnam) Rice SuC context. Finally, it is shown the
conclusions and recommendations for future studies.
II. LITERATURE REVIEW
A. Top Management Championship (TM)
TM involvement is a prerequisite and necessary to enable SuC
cooperation (Ireland et al., 2020). On the other hand,
compared to the term "Top Leadership Support", the
championship embodies a more active role of top
management and emphasizes their ability to take the initiative
to take the lead in LO (Chatterjee et al., 2002). In addition, the
lack of senior management involvement is a multiple barrier
to the development of appropriate logistics strategies
(Gunasekaran et al., 2003). Often, TM is not aware of the true
value of our SuC operations and our probable contributions to
long-term competitive advantage (Hammer and Michael,
2004). Besides that, supporting TM as a key element of
internal cooperation (Ellinger et al., 2006) and the logistics
department may have more powers to cooperate with the 3PL
and, if necessary, cooperation can be taken to a more
specialized level (Sandberg and Birgitta, 2007). [12]
Moreover, LO relationship variables can be also modeled to
improve both the performance and the competitiveness of the
store owners in the SuC of logistics (Qureshi et al., 2008).
Along with that one needs to be concerned about companies
process reengineering as it has become a useful arm for any
business model looking to increase its existing organizational
productivity and intend to get a cost-leading strategy in its
industry, and its operating environment (Magutu et al., 2010).
[13-14]
To be more complete, we need to incorporate the concept of
work and waste at every step in any process and the goal is to
eliminate trash y elements and try to enrich the elements work
factor (Ragab, 2009). The support of TM is another important
factor which arouses the capability of top managers to offer
the orientations, resources, and requirements to be needed
during, and after the acquisition of blockchain technologies in
LO companies (Queiroz and Wanba, 2019). Yuan et al. (2020)
emphasized the critical role of top management in mediating
transaction attributes to practice their effectiveness on LO's
success. [15-17].
B. Personal Relationship/Guanxi (PR)
PR represents a company and an important human resource in
the business community and problems need to be deployed to
enhance a company's competitive advantage (Peng et al.,
2000). Although there are similar concepts in other countries
as "Pratik" in Haiti, or "chaebol" in South Korea, the PR term
is unique to Chinese culture in many ways (Grewal et al.,
2002). For foreign companies operating in China or having
Chinese firms as partners in their SuC, it is significant to know
the implications of developing PR in China (Handfield et al.,
2005, Shou et al. 2017). [18]
Furthermore, people in the PR network are committed to the
others based on a reciprocity expectation regarding equity and
incentives exchange (Leung et al., 2005). In addition, as a
network, PR is also seen as an important form of social capital
for companies (Szeto et al., 2006; Shou et al. 2017). [18].
Besides, PR has helped the global LSPs to warrant their own
market share in the China Market by signing the strategic
contracts with domestic LSPs (Liu et al., 2018). Although PR
has received considerable attention from researchers in other
business areas, empirical research is still lacking in logistics
and supply chain management. Guanxi mentions informal
individual relationships that make easier the exchange of
grace between people. In essence, Quan Tay is a type of PR
characterized by friendship, belief, and interdependency (Gu
et al., 2008). On the other hand, the recent research has proved
that the interpersonal PR is valued as the social capital to help
solving the LSPs' problems and improve LO relationships in
China (Chen et al., 2015) and it can also be applied at the
constitutive level (Cai et al., 2010). [19-23]
C. Commitment Trust (CT)
In an inter-organizational scene, the Trust can be defined as
"the belief that one's partner will act in a predictable manner,
will keep its word, and will behave in a manner that does not
negatively affect to the other" Spekman et al. (2002). Trust is
also defined as a partnership-based decision with the prospect
that the partner will act following to mutual agreement. Inter-
organizational trust establishes a situation, where enterprises
are driven to overcome the minimum claims of a LO
relationship to stimulate the win-win relationship. Moreover,
it has been proved that Trust is often low at the onset of a 3PL
partnership and is a necessary in the business development
strategy (Knemeyer et al., 2003; Klein, 2007). In turn, Trust
allows for transparent and effectual communication because
the partners will tend to the open mind in sharing their
intellectuality and the value information. when they keep in
trust to the other ones Ghosh and Fedorowicz (2008). [24-25]
Others suggest that contracts are the basis for trust Hofenk et
al. (2011), and Gao et al. (2017) found that the similarity of
partners and the ability to manage the alliance contribute to
the stability of the alliance and the effectiveness of the
relationship. Several key research that appeared the sector is a
relatively “new” area for management in SuC; lack of
agreement on the name of the term. The studies of trust's types
which included institutional and rational trust, and decision-
making over the trust, are often negligible attention Tejpal et
al. (2013). [26-28]
Yuan et al. (2018) argued that Commitment (Co) has had the
positively affects performance in the SuC and Yuan et al.
(2018) also proved that Co has become the mediated stage in
the relationship between the coordination performance and
Trust. Individuals who believed each other are ready to reveal
their own opinions, to give exchanging information, setting,
and clarifying goals, solving problems and being able to work
together to improve cooperation effectiveness (Huo et al.,
2015) [29-30].
INTERNATIONAL JOURNAL OF CIRCUITS, SYSTEMS AND SIGNAL PROCESSING DOI: 10.46300/9106.2021.15.137 Volume 15, 2021
E-ISSN: 1998-4464 1261
D. Cultural aspects influence the logistics operation
(CUL)
Cultural incompatibility, which is revealed, have often leaded
to the failure of a 3PL partnership Wilding and Juriado (2004).
Others state that the cultural diversity can significantly
influence the way that the managers make final decisions
because they are bared great impacts by the CUL where they
live Panayides (2007). Some authors emphasized the
important role of having the partner's organization CUL. The
authors also identified that the consistent interaction which
combines to an open exchange of latent disputes, is needed for
the partners to understand the CUL each other. The conflicts
in CUL can cause to the opposites in controlling the business
at some nations. The Saudis, for example, favor individual
relationships over assignments, while the Swedes put that in
revers Hofstede et al. (2010). To exploit the advantages of
positioning abroad effectively, companies must also choose
the most suitable management method based on the need to
control overseas services, the level of commitment desired
depends on effort and investment they are willing to make
(both tangible assets and human capital), and the degree of
risk associated with an overseas deployment Hutzschenreuter
et al. (2011). [31-32]
Furthermore, the cultural gap is defined as a multiple obstacle
in out-sourcing relationships that they represent in political
systems, religions, business practices, or languages
differently. They also claim that cultural diversities may be
advantages for such relationships Gooris and Peeters (2014).
In addition, the organizational culture that includes the
behavioral patterns and practices of everyone in the freight
logistics company is an important in choosing to use or not to
use the technologies to improve performance Schuetz and
Venkatesh (2019). Dai et al. (2018) and Dubey et al. (2019)
have mentioned the advantages of Constitutive CUL to the
way how the enterprises can react to external pressures, and
how to make strategic decisions [33-36].
E. The 3PL Customer Service Expertise (PLC)
Nowadays, logistics out-sourcing operations usually include
complex supply chain procedure and advanced IT customized
for critical consumers or key accounts. Therefore, 3PL
employees 'understanding of the main client's performance
issues and requirements and their relationships with peers'
employees are key differentiating resources Ellinger et al.
(2008). Besides, Service level (SL) management is related to
the necessary to create strong LO relationships between its
consumers and LSP. SL control should create a tight link
between the customer and LSP (Hsiao et al., 2010). There are
two main approaches to measuring service quality. One of
these approaches is subjective or internal where companies
build specifications to evaluate their services (Thai, 2013;
Arvis et al., 2018) [37-40].
F. Logistic Performance (LP)
Often, the LSP's innovation obligations cannot be
appropriately predetermined, as it is not clear what innovation
could benefit future customers and what technological
advancements. will be available to LSP Bhatnagar and
Viswanathan (2000). Some authors prove that the various
types of cooperation between partners will produce the perfect
interactions, which leads to the improvement of the innovation
abilities of channel echelons Stahl et al. (2003) and Roy et al.
(2004). Others emphasizes that business can be a market
leader only when its logistics operations are accompanied the
efficiency in “service lead and cost” Christopher (2005).
Besides, innovation mentions to any change in radical or
incremental characters, which manifests itself in products and
processes and consists of a change in services or governance
activities Sher et al. (2005). Innovations can also target
multiple customers, including full group or subgroup of
customers. These innovations promote LSP's competitive
advantages for services provided in upcoming or existing LO
relationships in the form of adaptive agreements Williamson
(2018) [41]. Fortune 500 companies can be completely known
their LP by the comparing results with their competitors
Daugherty et al. (2009) [42]. In these studies, the main items
on the LP of 3PLs are usually promised delivery times, on-
time delivery, logistics costs, flexibility, etc. Marcus et al.
(2010) [43]. Additionally, performed a comparative analysis
from the two-side point of view by collecting data from both
3PLs and customers (large manufacturing companies), the
authors also use the variables of financial performance and
efficiency Liu and Lyons (2011), Mothilal et al. (2012) [8,
44], and those directly related to logistics services for
improving the benefits such as better service, a higher rate of
on-time delivery and accuracy, quick response, more
satisfaction with the level of service, more additional services,
lower logistics costs Karia and Wong (2013) [45].
Furthermore, Zailani et al. (2017) [46] build the relationship
levels between LP and customer satisfaction by the 3PL
vendor selection criteria to measure operational performance.
In addition, some authors found that reducing logistics costs
is the most important factor to improve Vietnam's logistics
system, followed by logistics services. They note the
importance of the LSP but also argue that Vietnamese
logistics companies lack international competitiveness.
G. System compliance (SC)
The development of LSPs' role has also aroused the need for
measuring the LSPs' effectiveness that directly impacts the
performance of the entire SuC Van-Hoek (2000). Some
authors believe that the IT integration (ITI) projects will be
matched the technical requirements more exactly when the
regular and advanced communication was conducted on the
right way and controlled tightly Nah et al. (2003), they also
suggest that companies' IT capabilities can improve
organizational learning, contributing to corporate
performance Tippins and Sohi (2003). In addition, within the
SuC network, LSP work as the bridges to link processes in the
upper and lower SuCs Chan and Chung (2005), and they foster
an IT system in a way that assists shippers in evaluating the
cost 3PLs’ efficiency Halldórsson and Skjøtt-Larsen (2004).
Overall, IT has been widely recognized as an important factor
in the SuC, which helps to increase the effectiveness of not
only the firms but also the entire SuC. However, Sanders et al.
(2007) found the presence of the inconsistent results when the
research that analyzed the direct influence of IT on specific
performance measures, were conducted [47]. They argue that
the higher the ITI between all SuC's sides which can leading
to increased transparency in operations, thus fostering trust
INTERNATIONAL JOURNAL OF CIRCUITS, SYSTEMS AND SIGNAL PROCESSING DOI: 10.46300/9106.2021.15.137 Volume 15, 2021
E-ISSN: 1998-4464 1262
(Sinkovics et al., 2011) [48], and emphasizing the progressive
link between data collection technology with efficiency and
performance [3]. On the other hand, digitization is a new
relational model across the entire SuC network (Yuan et al.,
2020) [22]. Digitization helps the business to be supported
better than ever before when the manual performances will be
substituted by the electronic communication and
communications technology systems (Chang et al., 2019)
[49].
H. Standardization (ST)
They state that the standardization of Logistics Procedures
(LoPr) leads to improved competitiveness in operations. They
also emphasize that implementing process standardization
comes with geographic and cultural challenges that need to be
considered when doing business across borders Manrodt and
Vitasek (2004). Others state that LoPr need to be standardized
in accordance with general international standards and
practices, for example, including logistics facility-specific or
normal measures equipment. Besides, they also clarify that the
standardization of logistics is conducted completely only
when the packaging, the barcode logistics, and consolidation
of containers for handling, transport, and storage are
implemented synchronously. In addition, this standardization
is becoming an effective way which helps to minimize the
logistics costs and improve overall operational efficiency
(Zhao and Tang, 2009) [50]. Some authors agree that 3PLs
adopt shipper standards to ensure improved productivity
(Large et al., 2011) [51]. Specifically, it is explained that
efficiency-focused 3PLs has tended to provide standardized
solutions which achieved a yield rate as high as to how to
exploit economies of scope and scale and achieved a deeper
"customer adaptation", requiring the higher capacity from
each shipper (Marchet et al., 2016) [52].
I. Contract length (CL)
The long-term agreement must be in accordance with
changing market conditions, public technology, and customer
needs (Webb and Laborde, 2005). Our evidence links the
performance of on-time delivery with the degree of
contractual clarity; without a clear service definition in the
contract, it will take longer to clarify the scope of each
delivery which caused to delayed or missed deliveries. Indeed,
contracts must be based on transparency and clarity
Halldórsson and Skjøtt-Larsen, 2004). Such a conception
could support another author's argument (Rajesh et al., 2011)
[53], by proposing to carefully consider the 3PL's amplitude
of freedom when establishing agreements. Furthermore, smart
contracts can control digital operations effectively, thereby
increasing outsource costs, simplifying the management
process and risk mitigation (Helo and Hao, 2019) [54].
Therefore, this has ensured that the information and currency
flows can be fast smooth without using the intermediaries,
namely as custom clearing companies and banks Chang et al.
(2019) [49].
J. Coordination/ Buyer-3PL Collaboration (COL)
In the present studies, the cooperation between LSP and
Supplier is considered as a kind of capacity to support
Supplier in developing decision ownership and responsibility
with its main LSP. Specifically, Collaboration involves good
relationships that emphasize information sharing and
coordinate processes to jointly explore market opportunities
and generate new ideas. The 3PL provides resources and
assets that the acquirer may not have (Robert and Kendrick,
2003). Compared to companies that view outsourcing
logistics as a commodity, companies that have a close
working with their 3PLs are more likely to respond to
changing market needs and needs. and customers.
Consequently, the 3PL-buyer partnership demonstrates the
unique ability that an owned (Rudolf and Anthony, 2004).
Working with a large 3PL vendor encourages a company to
integrate an integrated purchase of the organization's
processes and activities, thereby enhancing corporate
alignment and use of company resources. Furthermore, the
company's capability to connect with key 3PL vendors also
facilitates the growth of other key abilities such as
responsiveness, flexibility, and learning abilities Esper et al.
(2007) [55]. Finally, they also consider about collaboration a
documentary concept of Cooperation (Coop.) refers to it as an
organization of activities under the existence of Coop. Coop
is then understood as the result of the connection between the
two exchange parties. In addition, the activities in same
environment are not necessarily reflect cooperation, as they
can simply be imposed on partners through the exercise of
power (Obadia, 2008). The state of the buyer-supplier
relationship may also influence on performance metrics (Hald
and Mouritsen, 2018) [56] and the relationship degree. DUC
et al. (2018) [57] have mentioned the important role of
logistics and the LO relationships in building a mathematical
model revolving around partners in the SuC to maximize SuC
operations.
K. Productivity enhancement and competitive advantage
(PE)
Well, the top level of excellence is required for a variety of
clients, to respond to their strategic target in the properties of
the product. The logistics needs to hire out the underlying
basis of the people who need to send their product, in most the
cases, they've created specialists to serve better relatives, the
software needs to provide access to a group of people with
lower costs (Langley, 2000). It improves the focus in a dark
direction that maximizes value to increase productive, energy
and increased value. It also provides the edge of competition
by providing more quickly and allows you to approach and
evaluate the technology, new market (Sloper, 2004). Besides,
the benefits of upcoming hosts allow the hosts to gain more
parts, the idea that the relationship will be the source of the
future, and the commitment or the trust is necessary for this
relationship (Yilmaz et al., 2005) [58]. They also found out
about flexibility, which is the most important ability to resist
the uncertainty of the environment Eric et al. (2006) [59].
Competitive pressure is a significant factor which caused the
constant urge between logistics companies in proving their
competency with partners or investors (Angelis, 2019)) [60].
Competition pressure and globalization have motivated LSP
to find ways how to develop and enhance their own
competitive advantages (Nguyen, 2013) [61]. In addition, it is
difficult that the new technologies can be applied the logistics
industry unless there are the government assistance and enact
rules and regulation, for example, the blockchain technology
INTERNATIONAL JOURNAL OF CIRCUITS, SYSTEMS AND SIGNAL PROCESSING DOI: 10.46300/9106.2021.15.137 Volume 15, 2021
E-ISSN: 1998-4464 1263
(Montecchi et al., 2019) [62].
L. Evaluation of supplier performance (ESP)
It is realized that collaboration is actively impaired whether
the high-end trading environment or low, all this reasoning
shows that cooperation can protect international exchange and
create an environment where there's a trade level of
communication and sharing knowledge higher (Cannon et al.,
2000). They also emphasize the high value of the provider's
achievement to promote their good relationship to the highest
bidder for the upgraded in the entire organization, committed
to an inability, so provide more improvements or allow the
partners to continue to exist in many more crisis (Bullington,
2005). There is a clear agreement that the administrator based
on standard has a positive effect on the company (Kim et al.,
2006) [63]. According to the RBV, the autonomy agencies, as
the belief is the main motivation of the business competition,
especially in the national exchange, where the separation
between the partners made the traditional contract deal
become attractive. Some of the research provides evidence
that the standard of the role-playing system as a productive
administrator helps the advantage of the company and limit
the opportunity of the business on the international business
market (Wu et al., 2007 [64]. The importance of measuring
the loss of the supply chain is growing along with the
importance of the suppliers to the success of the companies.
However, the administrator of the suppliers and the supply
chain are a challenge to the complex companies of social ties
and connections (Maestrini et al., 2007). The strategic
relationship between the buyer and the supplier is drawing
attention increasingly increasing in the documents (Agarwal
et al., 2010; Krishnan et al., 2016) [65, 66]. This kind of
relationship is getting more important in management of
transactions. Using information about efficiency and results
can be different between strategic suppliers and strategic
factories and no strategic strategies Hald and Mouritsen,
2018) [67].
M. Added distinctive value through (total quality
management) TQM and (just in time) JIT practice
(ADV)
Dell's computer has used the advantage of hiring out and
contract contracts with third suppliers to rent out most of his
client services while the company is focusing on the right
warehouse patterns and distribution system with the online
distribution system. The last thing is to maintain the
competition's profits and notice that the competition is
difficult to replicate the procedure like that or even replace a
new change like that (Ranjith and Bijuna, 2013) [68]. Tasie
(2016) [69] recommends that the unique features of TQM are
to use the science approach in making decisions and solving
problems, attachment and privileges to the staff, improve the
endurance of the process, focus of the client and outside.
According to Flynn (1995) [70], the concurrence between JIT
and TQM can improve efficiency. Furthermore, Green et al.
(2019) [71] suggests that the “three-zero production model”,
which requires production managers to simultaneously
achieve defect-free, waste-free and zero-emissions to the
environment and no inventory suggesting that it can is done
through JIT, TQM and GSCP.
N. Dedicated Resources (DR)
According to Rutner and Langley (2000), logistics efficiency
is required to meet their objective of product delivery
optimization. LO helps to solve the shippers' limitations in
investing on the logistics infrastructure requirement while
these shippers can take care their customers as well as
possible. LO can completely generate DR to serve their
shippers in a better way. LSP access to dedicated
RESOURCES of the experts at lower costs, whose skills can
promote the existing technologies, especially Information
Technology (IT). IT has caused a logistics revolution, which
helps to increase the efficiency and the ability to meet demand
Gunasekaran et al., 2017) [72]. The companies which have
properly invested IT/ICT resource, will create the positively
influence to quality, production efficiency and the added value
in the logistics and SuC management (Brinch et al.,2018) [73].
In addition, Belvedere et al. (2017) [74] proved that the
effectiveness from IT in the current digital transformation
revolution can motivate all logistics activities. These activities
often consist of transportations, storages, and warehouse
control. The popularity of E-commerce has forced the LSP
concentrating more on the key factors of the LO relationship
(Evangelista et al., 2012) [3].
This study attempts to provide the logistics managers a
detailed outline for potential supporters and impediments
impacting their LO relationship, and consequently enhance
the LP outcome.
The main contributions are included the contents as follows:
The relationship in Logistics Outsourcing (LO) activities
currently has not received much attention from businesses in
Vietnam. Logistics studies in Vietnam have so far not focused
on studying the factors affecting the relationship of
outsourced logistics. In this paper, we delve deeper into this
problem of outsourced logistics relationships. In addition, the
factors that we studied were gathered and considered in the
same context from many research studies that have been
carried out up to the present time and the contributions of
leading logistics experts in Vietnam. In Vietnam, the problem
has not appeared in articles written on logistics, and especially
articles written on logistics activities in Vietnam, for the rice
supply chain in the Mekong Delta.
In addition, the mutual impact of supporting factors in the
LO relationship between shippers and LSPs has been modeled
under a new approach, which has not been found in LO
studies, especially than studies related to LO in Vietnam's rice
supply chain. The approach considered is the integration
between FISM, FMICMAC and FAHP under Trapezoidal
fuzzy numbers. The FISM-FMICMAC-FAHP integration
method was not found in the studies on the LO relationship of
the Vietnamese rice supply chain while the trapezoidal fuzzy
language was integrated into the research method
development process as well. This is the main contribution of
this paper. The factors supporting the LO relationship were
modeled based on their driving power and dependence. Since,
the research objectives are addressed:
1. To develop FISM–FMICMAC analysis in clustering
14 enablers which are drawn by the literature and the
discussion with practitioners and academicians.
2. To integrate FAHP to formulate FISM–FMICMAC-
FAHP methodology to determine the global weights
INTERNATIONAL JOURNAL OF CIRCUITS, SYSTEMS AND SIGNAL PROCESSING DOI: 10.46300/9106.2021.15.137 Volume 15, 2021
E-ISSN: 1998-4464 1264
in the relationship between the clusters and enablers
in the clusters identified from the FISM - FMICMAC
classification.
3. To identify the best driving enablers which
significantly influenced LO relationship.
Finally, the factors affecting the LO relationship have never
appeared in studies on rice supply chains in the Mekong Delta,
Vietnam. Therefore, the conclusion of the thesis will be an
important input to help business managers, especially
enterprises related to the rice supply chain, understand the
crux of the LO relationship. From there, they can make more
appropriate decisions to improve LO performance and help
businesses survive and develop. This is also a contribution of
this article to business management.
III. METHODOLOGY
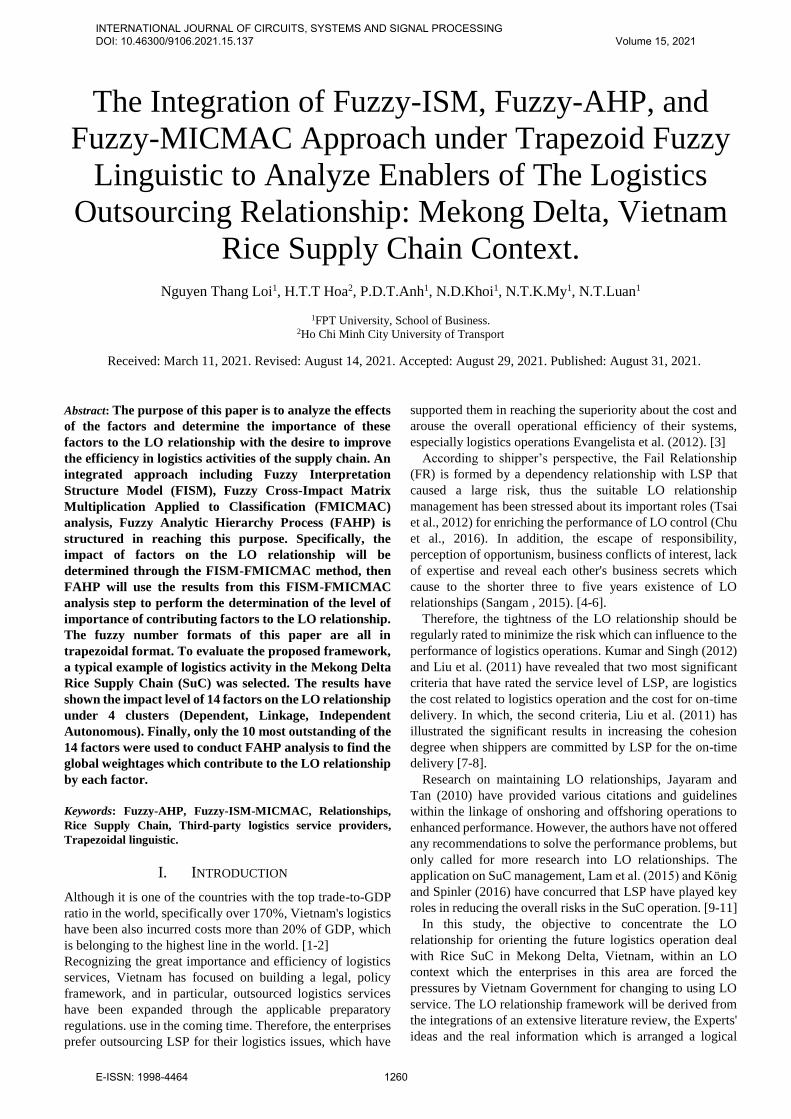
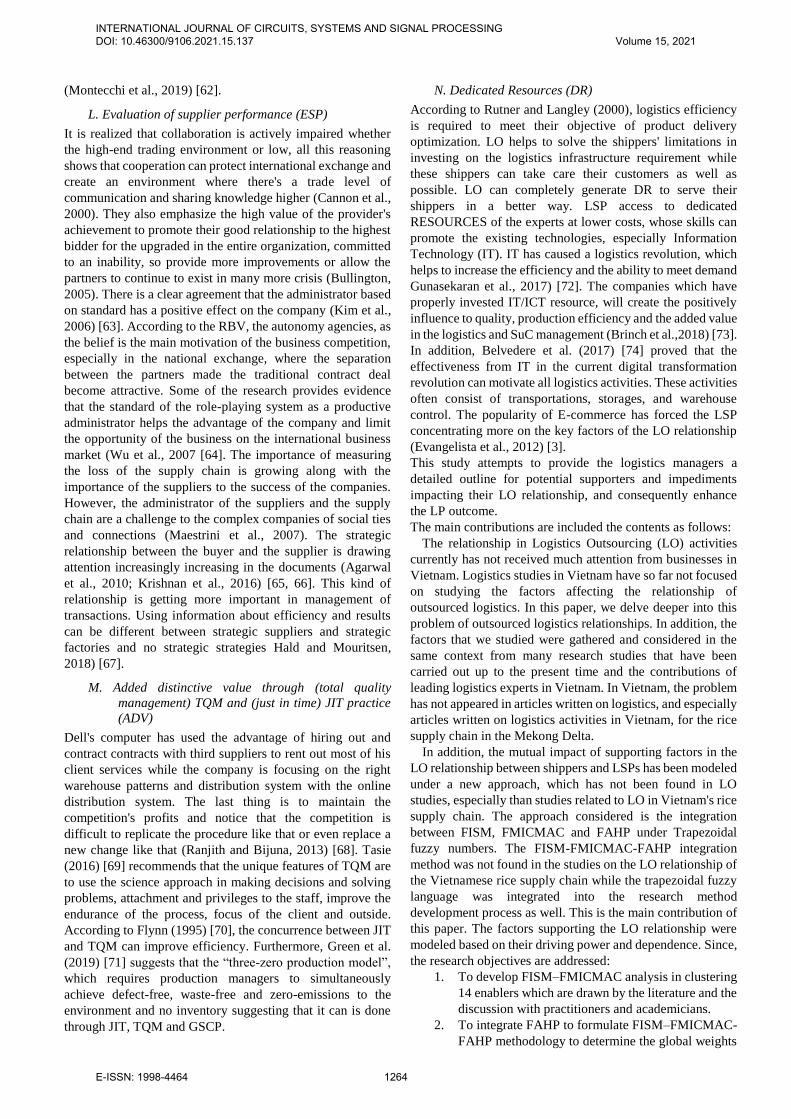
This paper develops a new approach which consists of both
the integration and analysis to model and rank the enablers of
loyalty in LO relationship in out using a integrated FISM-
FMIMAC-FAHP approach. In this approach, the literature,
real Logistics operation and experts’ ideas are combined to
derive 14 independent variables which are represented by 14
the impact factors to the LO relationships. These variables
will be analyzed to determine the specific importance and
relationship through the ISM method considered under fuzzy
values. The results by FISM will be categorized into four
clusters under FMIMAC method. In this stage, the variables
belonging Independent and linkage clusters are considered for
the AHP method. Then, AHP is used to determine the Final
ranking of the relative weights under fuzzy value. All the
fuzzy value sets which are calculated in this paper, are the
Trapezoidal Fuzzy (TF) Savitha and George (2017) [75]. The
research’s framework has been shown in Figure 1.
Figure 1. The Study framework
According to Figure 1, data collection will be developed
from both primary and secondary sources. Secondary sources
are information provided from leaders of Shippers and LSP
and Experts, Published reports, articles and internet.
Meanwhile, primary resources are made available to
employees of relevant units through questionnaire surveys,
telephone interviews and personal visits.
Characteristics of LO were implemented after review of the
document and discussion with Experts. In this study, the
literature from 2000 to 2020 was reviewed. Furthermore, there
are very few published results which are closed related to the
concept of LO Relationships. A rigorous search was
performed using groups of keywords that were characteristic
and fully reflective of the LO Relationships-related aspect to
collect research papers for review. This rigorous search 's
results then have been discussed by a council of 10
experts/researchers under the Delphi technique to find out the
14 main drivers from sustainably LO Relationships in the
Mekong Delta, Vietnam. Key components of the Delphi
technique include the communication process, an essential
group of experts and feedback Yousuf (2007), Dube and
Gawande (2016a)[76].
These 14 factors will be incorporated into the survey to
prepare for the primary data collection process under the
requirements of ISM Method. The data survey subjects are
concentrated of 10 experts/researchers and 130 enterprises (13
provinces/city in Mekong Delta, respectively), who have
managed/operated logistics' solutions, who have been
approached the LO services for over two years.
FISM method in this research is an extended fuzzy format
of ISM Savitha and George (2017), Yadav and Sharma
(2017), Lamba and Singh (2018), Rana et al. (2019), Mishra
INTERNATIONAL JOURNAL OF CIRCUITS, SYSTEMS AND SIGNAL PROCESSING DOI: 10.46300/9106.2021.15.137 Volume 15, 2021
E-ISSN: 1998-4464 1265
et al. (2019), Rajput and Singh (2019) [75, 77, 78, 79, 80, 81].
In this article, the FISM is used in the integration with
FMICMAC to form a consolidation method or FISM-
FMICMAC method. The steps of the proposed methodology
is described as follows Yadav and Singh (2020) [82]:
- FISM application
+ Aggregated Structure Self- Interaction Matrix
(ASSIM)
+ Initial Fuzzy-Reachability Matrix (IFRM) under
Linguistic Variables (LVs)
+ Develop the Binary Relationship Matrix (BRM)
+ Show transitive links in Final Defuzzified
Reachability Matrix (FDRM).
+ FISM Hierarchy model
- FMICMAC
+ IFRM under Fuzzy number.
+ Final Average Crisp Values (CV) of dependence and
driving power.
+ Classify Characteristics into four zone
+ Finding of Common Driver Characteristics
As mentioned before, the FAHP methods will be
concentrated on the factors beloging the independent and
linkage clusters which have been resulted by FISM-
FMICMAC approach. FAHP method is an expanded form
AHP, which is a popular method to solve complex Multi
Criteria Decision Making (MCDM) problems quickly.
MCDM problems have been involved many types of
conditions in which qualitative and quantitative issues are the
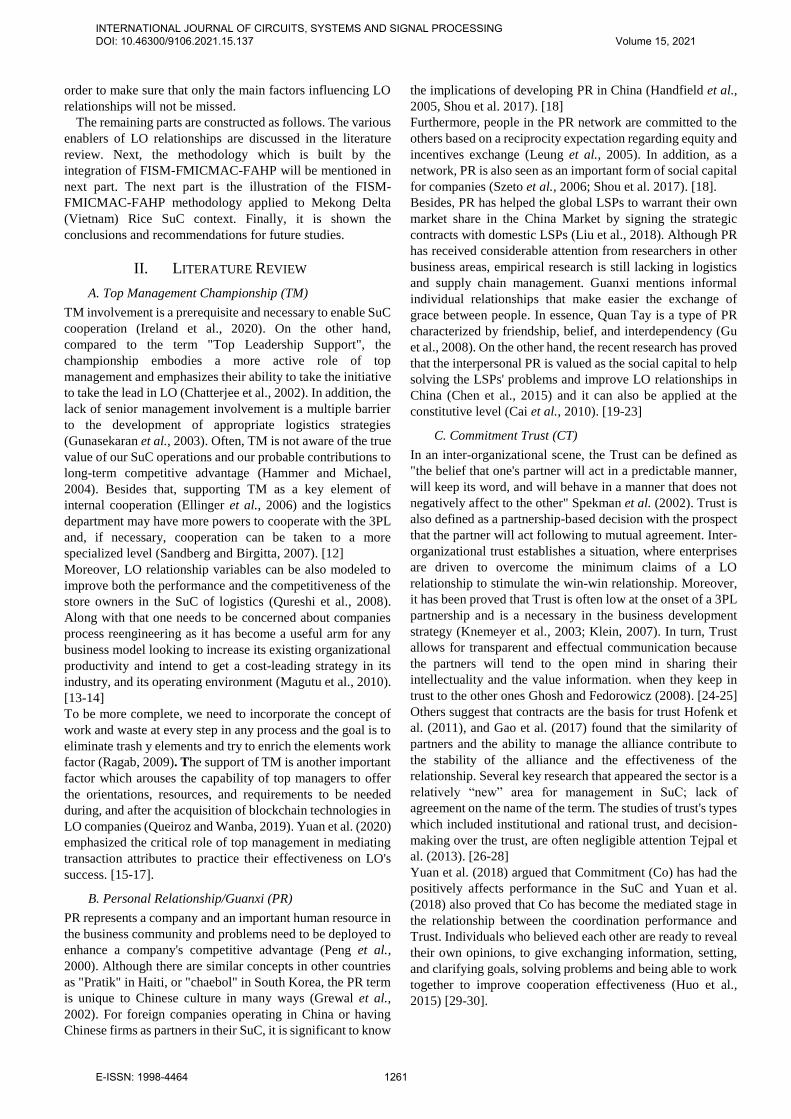
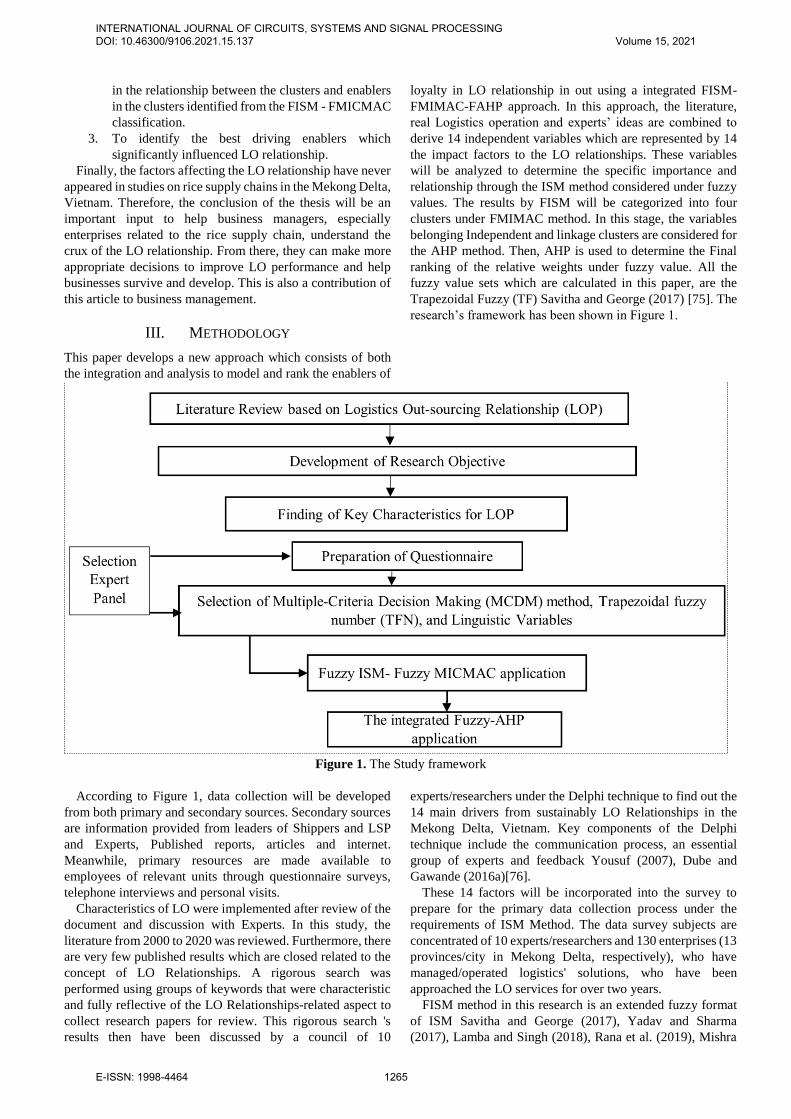
most popular Saaty (1980), Saaty and Thomas (2000) [83]. In
FAHP method, a complex MCDM problem will be broken
down into a hierarchy of decision elements (see Figure 2).
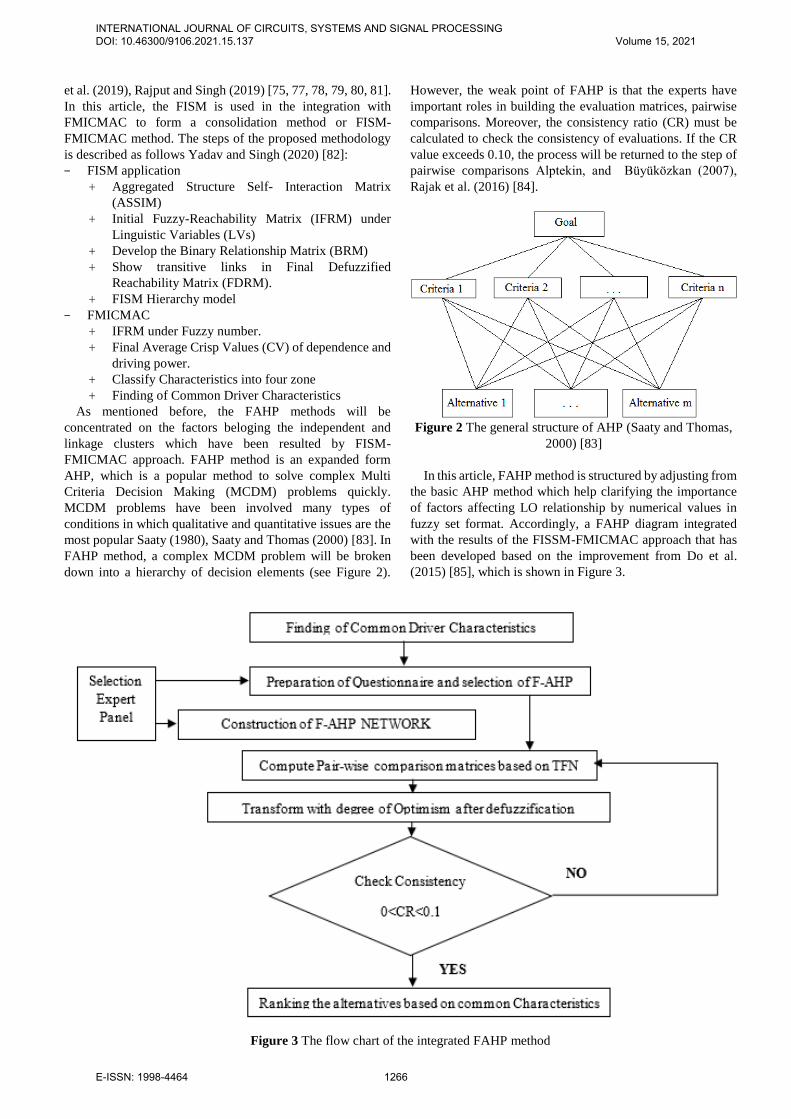
However, the weak point of FAHP is that the experts have
important roles in building the evaluation matrices, pairwise
comparisons. Moreover, the consistency ratio (CR) must be
calculated to check the consistency of evaluations. If the CR
value exceeds 0.10, the process will be returned to the step of
pairwise comparisons Alptekin, and Büyüközkan (2007),
Rajak et al. (2016) [84].
Figure 2 The general structure of AHP (Saaty and Thomas,
2000) [83]
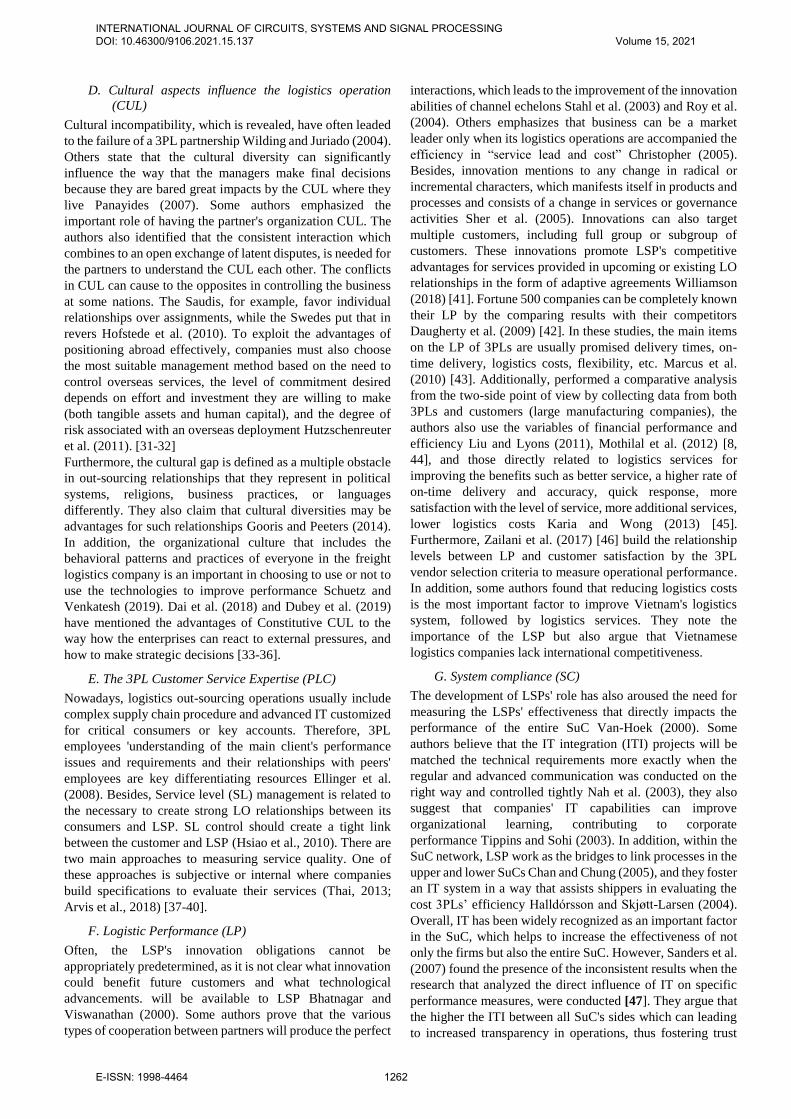
In this article, FAHP method is structured by adjusting from
the basic AHP method which help clarifying the importance
of factors affecting LO relationship by numerical values in
fuzzy set format. Accordingly, a FAHP diagram integrated
with the results of the FISSM-FMICMAC approach that has
been developed based on the improvement from Do et al.
(2015) [85], which is shown in Figure 3.
Figure 3 The flow chart of the integrated FAHP method
INTERNATIONAL JOURNAL OF CIRCUITS, SYSTEMS AND SIGNAL PROCESSING DOI: 10.46300/9106.2021.15.137 Volume 15, 2021
E-ISSN: 1998-4464 1266
However, the fuzzy set in FAHP is not same with Fuzzy set
in FISM-FMICMAC even though the trapezoidal rule is still
used, respectively. The theory of first fuzzy set was has
created by Zadeh (1965) to solve the uncertainly problems
which are caused by imprecision or vagueness. A fuzzy set 𝐴
in a universe of discourse 𝑋 is defined as the set of pairs, 𝐴 = {(𝑥, 𝜇𝐴 (𝑥)): 𝑥 ∈ 𝑋}, where 𝜇𝐴 (𝑥): 𝑋 → [0,1] is called the
membership value of 𝑥 ∈ 𝑋 in the fuzzy set 𝐴 [86].
According to Sanhita and Tapan (2012) [86], A Trapezoidal
fuzzy number (TFN) denoted by 𝐴 is defined as (𝑙, 𝑚, 𝑛, 𝑢)
where the membership function is given by function (1).
𝜇𝐴(𝑥) =
{
0, 𝑥 ≤ 𝑙 𝑥−𝑙
𝑚−𝑙, 𝑙 ≤ 𝑥 ≤ 𝑚
1, 𝑚 ≤ 𝑥 ≤ 𝑛𝑢−𝑥
𝑢−𝑛, 𝑛 ≤ 𝑥 ≤ 𝑢
0, 𝑥 ≥ 𝑢
. (1)
A Fuzzy Number (AFN) 𝐴 is a fuzzy subset of the real line;
𝐴: 𝑅 → [0,1] satisfying the following properties Ban and
Coroianu (2015) [87]:
(i) 𝐴 is normal (i.e. there exists 𝑥0 ∈ 𝑅 such that
𝐴 (𝑥0) = 1);
(ii) 𝐴 is fuzzy convex;
(iii) 𝐴 is upper semi continuous on 𝑅. 𝑖𝑒; ∀휀 > 0, ∃𝛿 > 0
such that 𝐴(𝑥) − 𝐴(𝑥0) < 휀 whenever |𝑥 − 𝑥0| < 𝛿;
(iv) The closure, 𝑐𝑙 (𝑠𝑢𝑝𝑝 (𝐴)) is compact.
The 𝛼-cut, 𝛼 ∈ (0, 1] of AFN 𝐴 is a crisp set defined as
𝐴 (𝛼) = {𝑥𝜖𝑅: 𝐴 (𝑥) ≥ 𝛼}. Every 𝐴𝛼 is a closed interval of
the form [𝐴𝐿 (𝛼), 𝐴𝑈 (𝛼)].
The AFN’s value 𝐴 is denoted by function (2).
𝑣𝑎𝑙(𝐴) = ∫ 𝛼(𝐴𝑢(𝛼) +1
0𝐴𝐿(𝛼)) 𝑑𝛼 (2)
According to [112], it is assumed that TFNs: 𝐴1 = (𝑎1, 𝑎2,
𝑎3, 𝑎4), 𝐴2 = (𝑏1, 𝑏2, 𝑏3, 𝑏4), …, A𝑛 = (𝑛1, 𝑛2, 𝑛3, 𝑛4).
𝐴𝑣 =A1+ A2+⋯+𝐴𝑛
𝑛=
( 𝑎1+𝑏1…+𝑛1
𝑛,𝑎2+𝑏2…+𝑛2
𝑛,𝑎3+𝑏3…+𝑛3
𝑛,𝑎4+𝑏4…+𝑛4
𝑛). (3)
Then the membership function of the arithmetic mean 𝐴𝑣 is
given by (4):
𝜇𝐴𝑉(𝑋) =
{
𝑋−𝑀𝐴
𝑀𝐵−𝑀𝐴 𝑖𝑓 𝑀𝐴 ≤ 𝑋 ≤ 𝑀𝐵
1 𝑖𝑓 𝑀𝐵 ≤ 𝑋 ≤ 𝑀𝐶𝑀𝐷−𝑋
𝑀𝐷−𝑀𝐶 𝑖𝑓𝑀𝐶 ≤ 𝑋 ≤ 𝑀𝐷
0 𝑜𝑡ℎ𝑒𝑟𝑤𝑖𝑠𝑒
. (4)
where:
𝑀𝐴 =𝑎1+𝑏1…+𝑛1
𝑛.
𝑀𝐵 =𝑎2+𝑏2…+𝑛2
𝑛.
𝑀𝐶 =𝑎3+𝑏3…+𝑛3
𝑛,
𝑀𝐷 =𝑎4+𝑏4…+𝑛4
𝑛.
There are various types and procedure of FAHP Bozbura et
al.(2007), Elif et al. (2016) [88]. In this study, we try to
enlarge the FAHP approach of Savitha and George (2017)
[75] to implicate improving the LO Relationships.
IV. DISCUSSIONS AND RESULTS
A. Using FISM-FMICMAC to cluster Enablers
To establish a SSIM, data from a council of 10
experts/researchers and 130 enterprises (13 provinces/city in
Mekong Delta, respectively), who have managed/operated
logistics' solutions, are collected. These have been approached
the LO services for over two years. The LO relationships are
belonging to the nature of their partnership which determined
the loyalty factors between the respective partners. The SSIM
in this study is combined with the Fuzzy Linguistic Scale
(FLS) to create the ASSIM.
In this study, 14 enablers which are mentioned, consisting
of Top Management Support (TM); Guanxi/Personal
Relationships (PR); Commitment or trust (CT); Culture
(CUL); 3PL Customer Service Expertise (PLC); Logistics
Performance (LP); System Compliance (SC); Standardization
(ST); Contract Length (CL); Buyer-3PL Collaboration
(COL); Productivity Enhancement and Competitive
Advantage (PE); Evaluation of supplier performance (ESP);
TQM and JIT supplier added (ADV) and Dedicated Resources
(DR). Béides, the two trapezoidal fuzzy sets will be used for
all fuzzy approaches in our methodology. The First set is
applied to FISM-FMICMAC stage while the rest one
represents in FAHP. Defuzzification and implementation
method is adopted by Savitha and George (2017); Lamba and
Singh (2018) [75, 78] from the fuzzy numbers in Table 1.
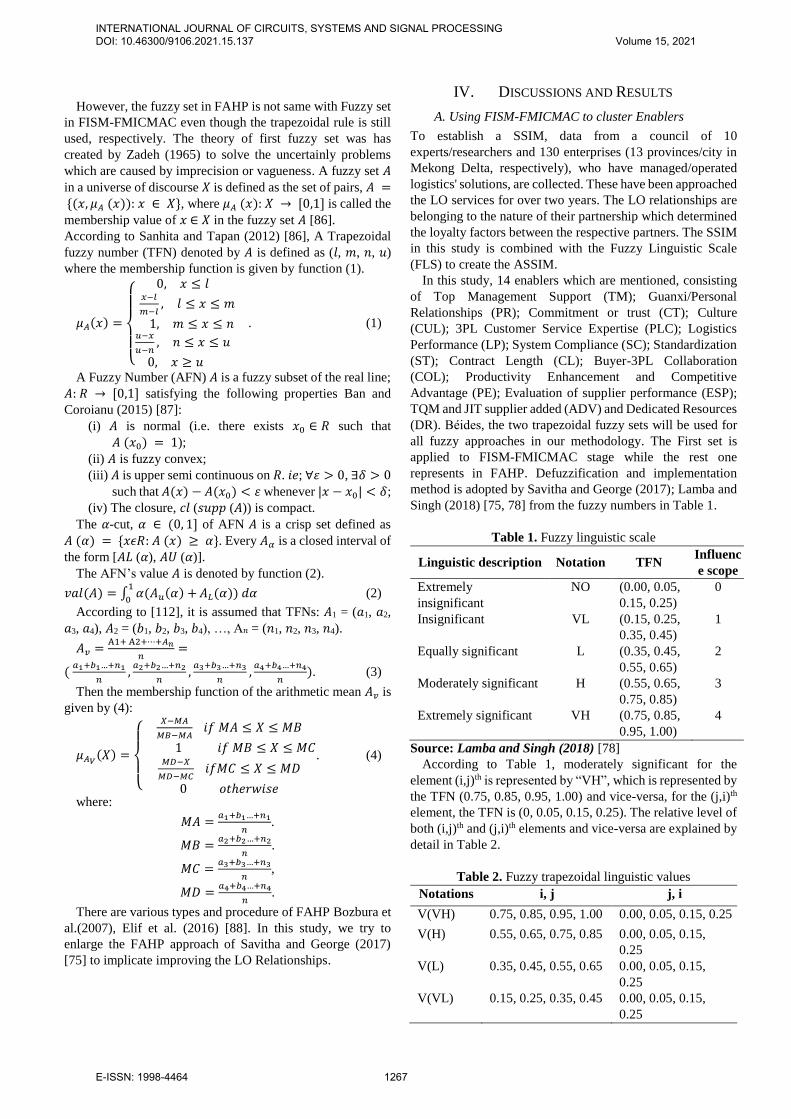
Table 1. Fuzzy linguistic scale
Linguistic description Notation TFN Influenc
e scope
Extremely
insignificant
NO (0.00, 0.05,
0.15, 0.25)
0
Insignificant VL (0.15, 0.25,
0.35, 0.45)
1
Equally significant L (0.35, 0.45,
0.55, 0.65)
2
Moderately significant H (0.55, 0.65,
0.75, 0.85)
3
Extremely significant VH (0.75, 0.85,
0.95, 1.00)
4
Source: Lamba and Singh (2018) [78]
According to Table 1, moderately significant for the
element (i,j)th is represented by “VH”, which is represented by
the TFN (0.75, 0.85, 0.95, 1.00) and vice-versa, for the (j,i)th
element, the TFN is (0, 0.05, 0.15, 0.25). The relative level of
both (i,j)th and (j,i)th elements and vice-versa are explained by
detail in Table 2.
Table 2. Fuzzy trapezoidal linguistic values
Notations i, j j, i
V(VH) 0.75, 0.85, 0.95, 1.00 0.00, 0.05, 0.15, 0.25
V(H) 0.55, 0.65, 0.75, 0.85 0.00, 0.05, 0.15,
0.25
V(L) 0.35, 0.45, 0.55, 0.65 0.00, 0.05, 0.15,
0.25
V(VL) 0.15, 0.25, 0.35, 0.45 0.00, 0.05, 0.15,
0.25
INTERNATIONAL JOURNAL OF CIRCUITS, SYSTEMS AND SIGNAL PROCESSING DOI: 10.46300/9106.2021.15.137 Volume 15, 2021
E-ISSN: 1998-4464 1267
A(VH) 0.00, 0.05, 0.15,
0.25)
0.75, 0.85, 0.95,
1.00
A(H) 0.00, 0.05, 0.15,
0.25)
0.55, 0.65, 0.75,
0.85
A(L) 0.00, 0.05, 0.15,
0.25)
0.35, 0.45, 0.55,
0.65
A(VL) 0.00, 0.05, 0.15,
0.25)
0.15, 0.25, 0.35,
0.45
X(VH) 0.75, 0.85, 0.95, 1.00 0.75, 0.85, 0.95,
1.00
X(H) 0.55, 0.65, 0.75, 0.85 0.55, 0.65, 0.75,
0.85
X(L) 0.35, 0.45, 0.55, 0.65 0.35, 0.45, 0.55,
0.65
X(VL) 0.15, 0.25, 0.35, 0.45 0.15, 0.25, 0.35,
0.45
X(VH,H) 0.75, 0.85, 0.95, 1.00 0.55, 0.65, 0.75,
0.85
X(VH,L) 0.75, 0.85, 0.95, 1.00 0.35, 0.45, 0.55,
0.65
X(VH,VL) 0.75, 0.85, 0.95, 1.00 0.15, 0.25, 0.35,
0.45
X(H,VH) 0.55, 0.65, 0.75, 0.85 0.75, 0.85, 0.95,
1.00
X(H,L) 0.55, 0.65, 0.75, 0.85 0.35, 0.45, 0.55,
0.65
X(H,VL) 0.55, 0.65, 0.75, 0.85 0.15, 0.25, 0.35,
0.45
X(L,VH) 0.35, 0.45, 0.55, 0.65 0.75, 0.85, 0.95,
1.00
X(L,H) 0.35, 0.45, 0.55, 0.65 0.55, 0.65, 0.75,
0.85
X(L,VL) 0.35, 0.45, 0.55, 0.65 0.15, 0.25, 0.35,
0.45
X(VL,VH) 0.15, 0.25, 0.35, 0.45 0.75, 0.85, 0.95,
1.00
X(VL,H) 0.15, 0.25, 0.35, 0.45 0.55, 0.65, 0.75,
0.85
X(VL,L) 0.15, 0.25, 0.35, 0.45 0.35, 0.45, 0.55,
0.65
O(No) 0.00, 0.05, 0.15, 0.25 0.00, 0.05, 0.15,
0.25
Source: Savitha and George (2017) [75]
Following FISM process, The ASSIM is established in this
study will help to clarify the degrees of pair-wise comparison
by FLS. The specific descriptions will be contented in Table
3. From ASSIM’s results, the IFRM is made shorter after the
comparison the results in Table 1 to Table 3. For example,
notation H in Table 1 is considered as V(H), X(H); X(H,VH);
X(H,L); and X(H,VL) in Table 2 for the (j,i)th element. After
replacing all notations in Table 3, the new table results have
been formed with all notations which are matched with Table
1, ordered by Table 4. Table 4 is also named by The IFRM
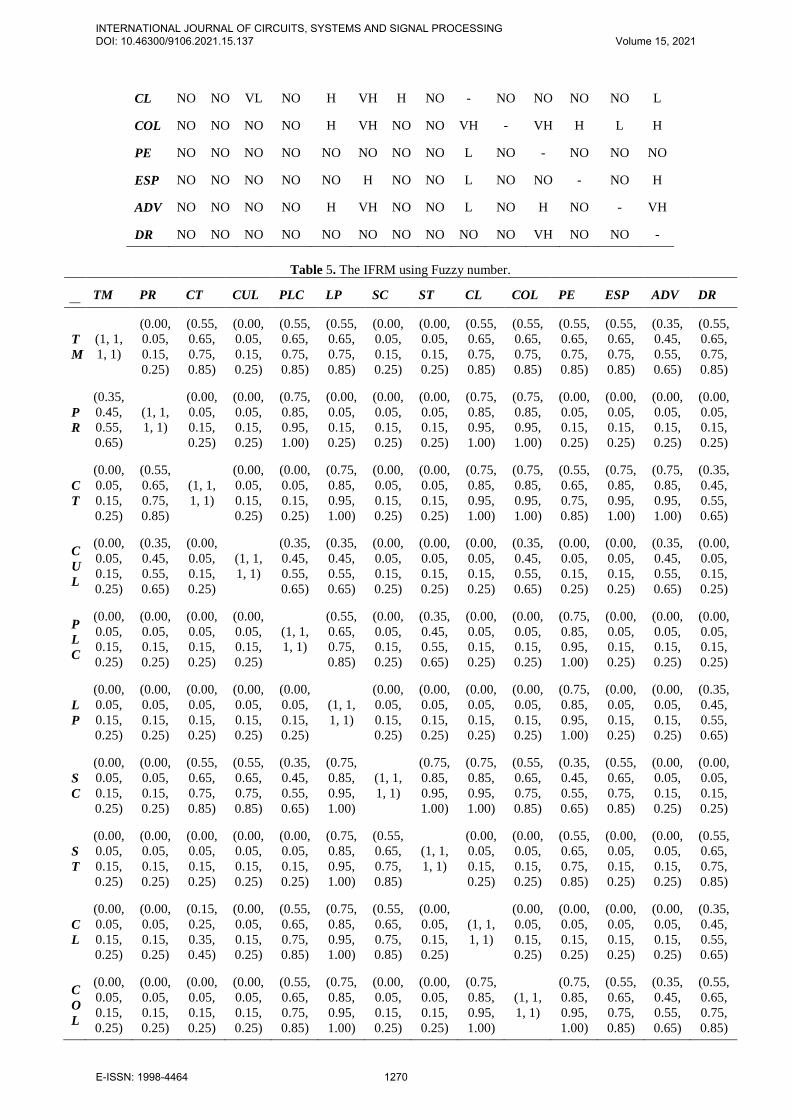
using LVs. Then, these LVs have been converted according to
specific rules which are depicted by Table 1 to produce the
Initial Fuzzy–Aggregated Reachability Matrix (IFARM)
which is depicted in Table 5.
On the other hand, the LVs of Table 4’s results L, H and
VH are represented by 1 while the value of 0 will be all
remaining notations, namely A, VL, and NO (Luo et al.,
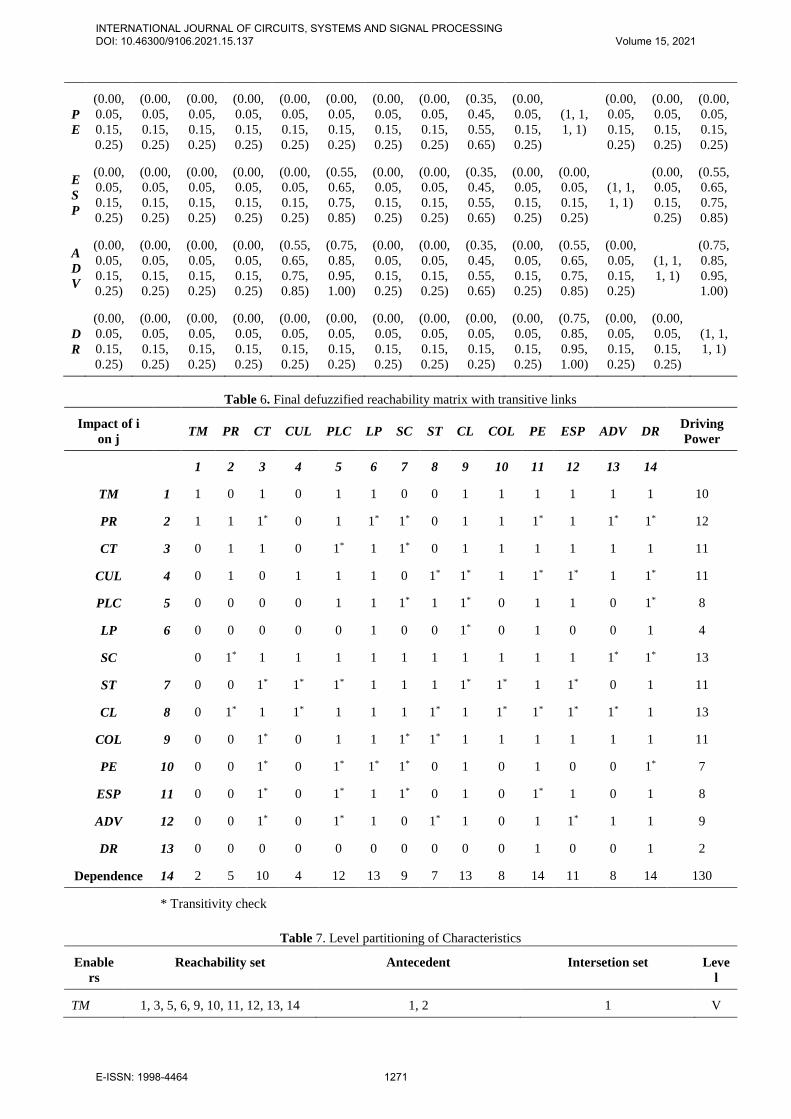
2018). According to Luo et al. (2018), the transitivity
relationships are parallelly checked from Table 4 to build the
FDRM (see Table 6) that is used for calculating the level
partitions (LPs). Then, the hierarchy model digraph of FISM
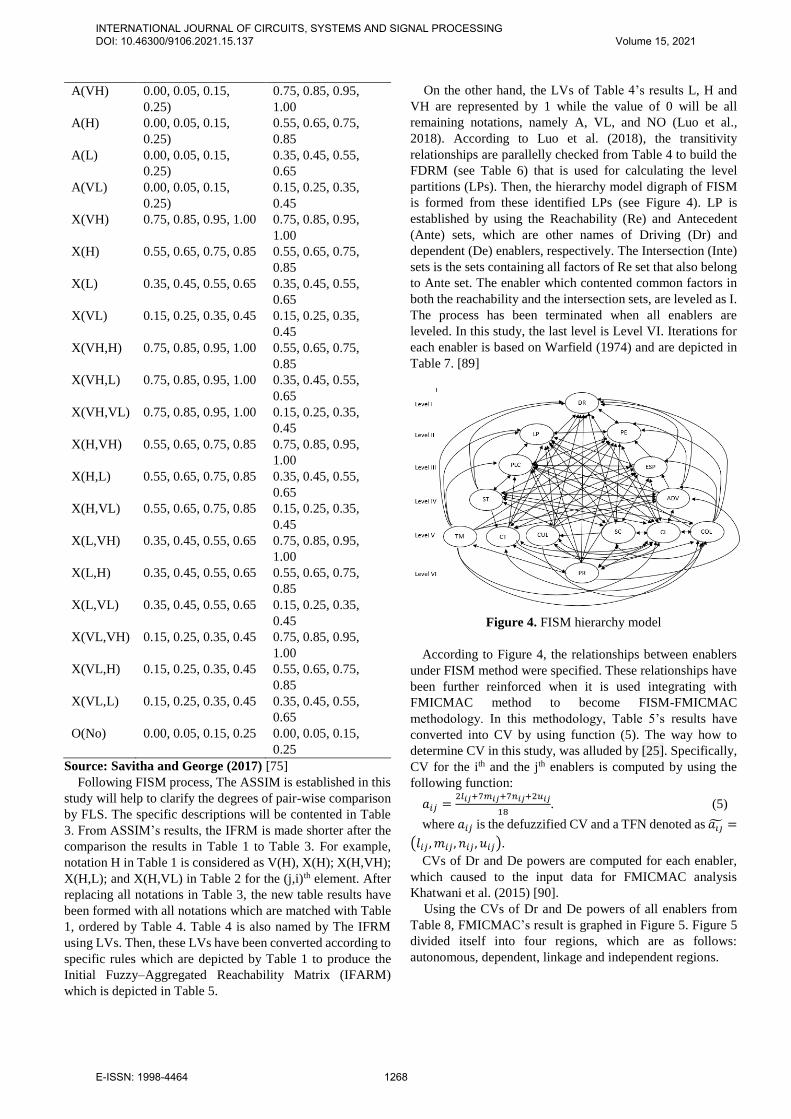
is formed from these identified LPs (see Figure 4). LP is
established by using the Reachability (Re) and Antecedent
(Ante) sets, which are other names of Driving (Dr) and
dependent (De) enablers, respectively. The Intersection (Inte)
sets is the sets containing all factors of Re set that also belong
to Ante set. The enabler which contented common factors in
both the reachability and the intersection sets, are leveled as I.
The process has been terminated when all enablers are
leveled. In this study, the last level is Level VI. Iterations for
each enabler is based on Warfield (1974) and are depicted in
Table 7. [89]
Figure 4. FISM hierarchy model
According to Figure 4, the relationships between enablers
under FISM method were specified. These relationships have
been further reinforced when it is used integrating with
FMICMAC method to become FISM-FMICMAC
methodology. In this methodology, Table 5’s results have
converted into CV by using function (5). The way how to
determine CV in this study, was alluded by [25]. Specifically,
CV for the ith and the jth enablers is computed by using the
following function:
𝑎𝑖𝑗 =2𝑙𝑖𝑗+7𝑚𝑖𝑗+7𝑛𝑖𝑗+2𝑢𝑖𝑗
18. (5)
where 𝑎𝑖𝑗 is the defuzzified CV and a TFN denoted as 𝑎𝑖�̃� =
(𝑙𝑖𝑗 , 𝑚𝑖𝑗 , 𝑛𝑖𝑗 , 𝑢𝑖𝑗).
CVs of Dr and De powers are computed for each enabler,
which caused to the input data for FMICMAC analysis
Khatwani et al. (2015) [90].
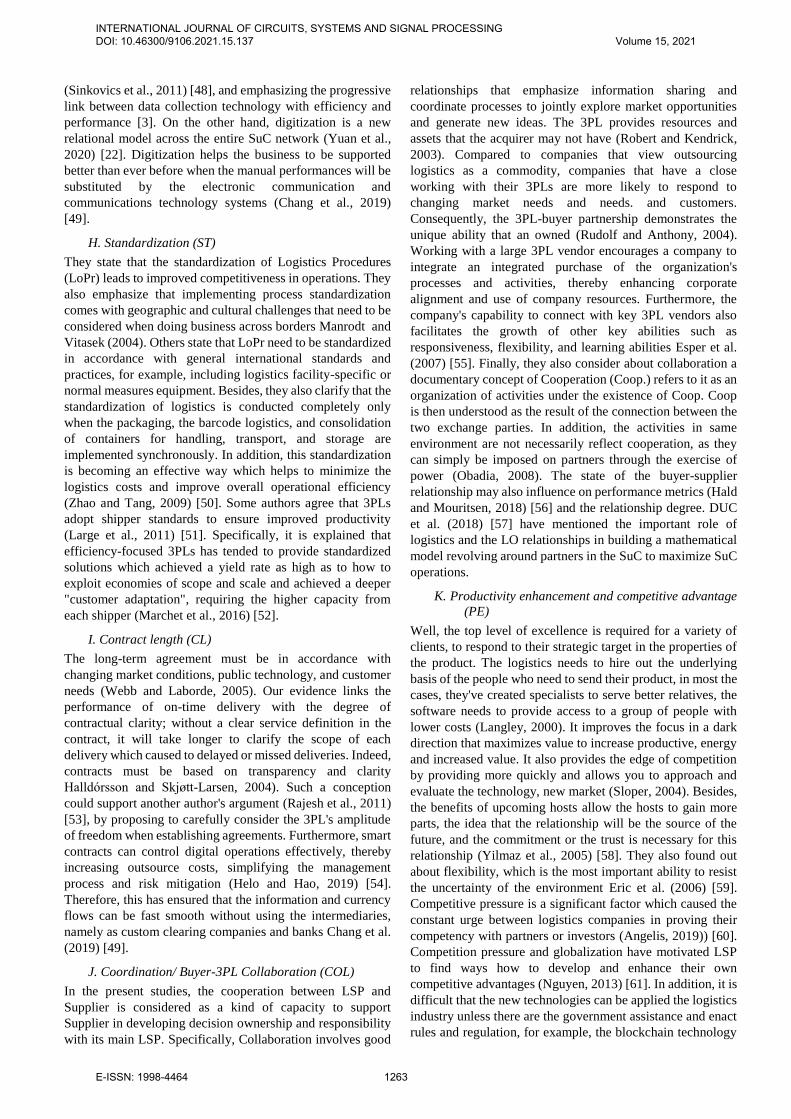
Using the CVs of Dr and De powers of all enablers from
Table 8, FMICMAC’s result is graphed in Figure 5. Figure 5
divided itself into four regions, which are as follows:
autonomous, dependent, linkage and independent regions.
INTERNATIONAL JOURNAL OF CIRCUITS, SYSTEMS AND SIGNAL PROCESSING DOI: 10.46300/9106.2021.15.137 Volume 15, 2021
E-ISSN: 1998-4464 1268
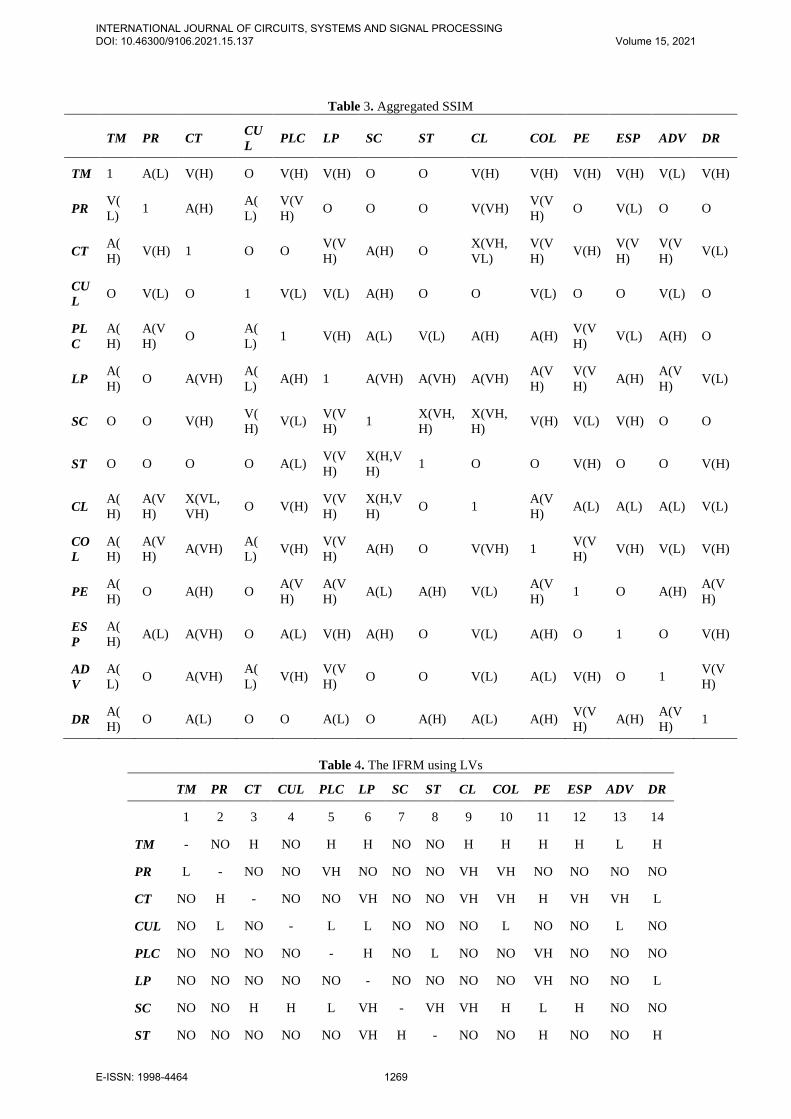
Table 3. Aggregated SSIM
TM PR CT CU
L PLC LP SC ST CL COL PE ESP ADV DR
TM 1 A(L) V(H) O V(H) V(H) O O V(H) V(H) V(H) V(H) V(L) V(H)
PR V(
L) 1 A(H)
A(
L)
V(V
H) O O O V(VH)
V(V
H) O V(L) O O
CT A(
H) V(H) 1 O O
V(V
H) A(H) O
X(VH,
VL)
V(V
H) V(H)
V(V
H)
V(V
H) V(L)
CU
L O V(L) O 1 V(L) V(L) A(H) O O V(L) O O V(L) O
PL
C
A(
H)
A(V
H) O
A(
L) 1 V(H) A(L) V(L) A(H) A(H)
V(V
H) V(L) A(H) O
LP A(
H) O A(VH)
A(
L) A(H) 1 A(VH) A(VH) A(VH)
A(V
H)
V(V
H) A(H)
A(V
H) V(L)
SC O O V(H) V(
H) V(L)
V(V
H) 1
X(VH,
H)
X(VH,
H) V(H) V(L) V(H) O O
ST O O O O A(L) V(V
H)
X(H,V
H) 1 O O V(H) O O V(H)
CL A(
H)
A(V
H)
X(VL,
VH) O V(H)
V(V
H)
X(H,V
H) O 1
A(V
H) A(L) A(L) A(L) V(L)
CO
L
A(
H)
A(V
H) A(VH)
A(
L) V(H)
V(V
H) A(H) O V(VH) 1
V(V
H) V(H) V(L) V(H)
PE A(
H) O A(H) O
A(V
H)
A(V
H) A(L) A(H) V(L)
A(V
H) 1 O A(H)
A(V
H)
ES
P
A(
H) A(L) A(VH) O A(L) V(H) A(H) O V(L) A(H) O 1 O V(H)
AD
V
A(
L) O A(VH)
A(
L) V(H)
V(V
H) O O V(L) A(L) V(H) O 1
V(V
H)
DR A(
H) O A(L) O O A(L) O A(H) A(L) A(H)
V(V
H) A(H)
A(V
H) 1
Table 4. The IFRM using LVs
TM PR CT CUL PLC LP SC ST CL COL PE ESP ADV DR
1 2 3 4 5 6 7 8 9 10 11 12 13 14
TM - NO H NO H H NO NO H H H H L H
PR L - NO NO VH NO NO NO VH VH NO NO NO NO
CT NO H - NO NO VH NO NO VH VH H VH VH L
CUL NO L NO - L L NO NO NO L NO NO L NO
PLC NO NO NO NO - H NO L NO NO VH NO NO NO
LP NO NO NO NO NO - NO NO NO NO VH NO NO L
SC NO NO H H L VH - VH VH H L H NO NO
ST NO NO NO NO NO VH H - NO NO H NO NO H
INTERNATIONAL JOURNAL OF CIRCUITS, SYSTEMS AND SIGNAL PROCESSING DOI: 10.46300/9106.2021.15.137 Volume 15, 2021
E-ISSN: 1998-4464 1269
CL NO NO VL NO H VH H NO - NO NO NO NO L
COL NO NO NO NO H VH NO NO VH - VH H L H
PE NO NO NO NO NO NO NO NO L NO - NO NO NO
ESP NO NO NO NO NO H NO NO L NO NO - NO H
ADV NO NO NO NO H VH NO NO L NO H NO - VH
DR NO NO NO NO NO NO NO NO NO NO VH NO NO -
Table 5. The IFRM using Fuzzy number.
TM PR CT CUL PLC LP SC ST CL COL PE ESP ADV DR
T
M
(1, 1,
1, 1)
(0.00,
0.05,
0.15,
0.25)
(0.55,
0.65,
0.75,
0.85)
(0.00,
0.05,
0.15,
0.25)
(0.55,
0.65,
0.75,
0.85)
(0.55,
0.65,
0.75,
0.85)
(0.00,
0.05,
0.15,
0.25)
(0.00,
0.05,
0.15,
0.25)
(0.55,
0.65,
0.75,
0.85)
(0.55,
0.65,
0.75,
0.85)
(0.55,
0.65,
0.75,
0.85)
(0.55,
0.65,
0.75,
0.85)
(0.35,
0.45,
0.55,
0.65)
(0.55,
0.65,
0.75,
0.85)
P
R
(0.35,
0.45,
0.55,
0.65)
(1, 1,
1, 1)
(0.00,
0.05,
0.15,
0.25)
(0.00,
0.05,
0.15,
0.25)
(0.75,
0.85,
0.95,
1.00)
(0.00,
0.05,
0.15,
0.25)
(0.00,
0.05,
0.15,
0.25)
(0.00,
0.05,
0.15,
0.25)
(0.75,
0.85,
0.95,
1.00)
(0.75,
0.85,
0.95,
1.00)
(0.00,
0.05,
0.15,
0.25)
(0.00,
0.05,
0.15,
0.25)
(0.00,
0.05,
0.15,
0.25)
(0.00,
0.05,
0.15,
0.25)
C
T
(0.00,
0.05,
0.15,
0.25)
(0.55,
0.65,
0.75,
0.85)
(1, 1,
1, 1)
(0.00,
0.05,
0.15,
0.25)
(0.00,
0.05,
0.15,
0.25)
(0.75,
0.85,
0.95,
1.00)
(0.00,
0.05,
0.15,
0.25)
(0.00,
0.05,
0.15,
0.25)
(0.75,
0.85,
0.95,
1.00)
(0.75,
0.85,
0.95,
1.00)
(0.55,
0.65,
0.75,
0.85)
(0.75,
0.85,
0.95,
1.00)
(0.75,
0.85,
0.95,
1.00)
(0.35,
0.45,
0.55,
0.65)
C
U
L
(0.00,
0.05,
0.15,
0.25)
(0.35,
0.45,
0.55,
0.65)
(0.00,
0.05,
0.15,
0.25)
(1, 1,
1, 1)
(0.35,
0.45,
0.55,
0.65)
(0.35,
0.45,
0.55,
0.65)
(0.00,
0.05,
0.15,
0.25)
(0.00,
0.05,
0.15,
0.25)
(0.00,
0.05,
0.15,
0.25)
(0.35,
0.45,
0.55,
0.65)
(0.00,
0.05,
0.15,
0.25)
(0.00,
0.05,
0.15,
0.25)
(0.35,
0.45,
0.55,
0.65)
(0.00,
0.05,
0.15,
0.25)
P
L
C
(0.00,
0.05,
0.15,
0.25)
(0.00,
0.05,
0.15,
0.25)
(0.00,
0.05,
0.15,
0.25)
(0.00,
0.05,
0.15,
0.25)
(1, 1,
1, 1)
(0.55,
0.65,
0.75,
0.85)
(0.00,
0.05,
0.15,
0.25)
(0.35,
0.45,
0.55,
0.65)
(0.00,
0.05,
0.15,
0.25)
(0.00,
0.05,
0.15,
0.25)
(0.75,
0.85,
0.95,
1.00)
(0.00,
0.05,
0.15,
0.25)
(0.00,
0.05,
0.15,
0.25)
(0.00,
0.05,
0.15,
0.25)
L
P
(0.00,
0.05,
0.15,
0.25)
(0.00,
0.05,
0.15,
0.25)
(0.00,
0.05,
0.15,
0.25)
(0.00,
0.05,
0.15,
0.25)
(0.00,
0.05,
0.15,
0.25)
(1, 1,
1, 1)
(0.00,
0.05,
0.15,
0.25)
(0.00,
0.05,
0.15,
0.25)
(0.00,
0.05,
0.15,
0.25)
(0.00,
0.05,
0.15,
0.25)
(0.75,
0.85,
0.95,
1.00)
(0.00,
0.05,
0.15,
0.25)
(0.00,
0.05,
0.15,
0.25)
(0.35,
0.45,
0.55,
0.65)
S
C
(0.00,
0.05,
0.15,
0.25)
(0.00,
0.05,
0.15,
0.25)
(0.55,
0.65,
0.75,
0.85)
(0.55,
0.65,
0.75,
0.85)
(0.35,
0.45,
0.55,
0.65)
(0.75,
0.85,
0.95,
1.00)
(1, 1,
1, 1)
(0.75,
0.85,
0.95,
1.00)
(0.75,
0.85,
0.95,
1.00)
(0.55,
0.65,
0.75,
0.85)
(0.35,
0.45,
0.55,
0.65)
(0.55,
0.65,
0.75,
0.85)
(0.00,
0.05,
0.15,
0.25)
(0.00,
0.05,
0.15,
0.25)
S
T
(0.00,
0.05,
0.15,
0.25)
(0.00,
0.05,
0.15,
0.25)
(0.00,
0.05,
0.15,
0.25)
(0.00,
0.05,
0.15,
0.25)
(0.00,
0.05,
0.15,
0.25)
(0.75,
0.85,
0.95,
1.00)
(0.55,
0.65,
0.75,
0.85)
(1, 1,
1, 1)
(0.00,
0.05,
0.15,
0.25)
(0.00,
0.05,
0.15,
0.25)
(0.55,
0.65,
0.75,
0.85)
(0.00,
0.05,
0.15,
0.25)
(0.00,
0.05,
0.15,
0.25)
(0.55,
0.65,
0.75,
0.85)
C
L
(0.00,
0.05,
0.15,
0.25)
(0.00,
0.05,
0.15,
0.25)
(0.15,
0.25,
0.35,
0.45)
(0.00,
0.05,
0.15,
0.25)
(0.55,
0.65,
0.75,
0.85)
(0.75,
0.85,
0.95,
1.00)
(0.55,
0.65,
0.75,
0.85)
(0.00,
0.05,
0.15,
0.25)
(1, 1,
1, 1)
(0.00,
0.05,
0.15,
0.25)
(0.00,
0.05,
0.15,
0.25)
(0.00,
0.05,
0.15,
0.25)
(0.00,
0.05,
0.15,
0.25)
(0.35,
0.45,
0.55,
0.65)
C
O
L
(0.00,
0.05,
0.15,
0.25)
(0.00,
0.05,
0.15,
0.25)
(0.00,
0.05,
0.15,
0.25)
(0.00,
0.05,
0.15,
0.25)
(0.55,
0.65,
0.75,
0.85)
(0.75,
0.85,
0.95,
1.00)
(0.00,
0.05,
0.15,
0.25)
(0.00,
0.05,
0.15,
0.25)
(0.75,
0.85,
0.95,
1.00)
(1, 1,
1, 1)
(0.75,
0.85,
0.95,
1.00)
(0.55,
0.65,
0.75,
0.85)
(0.35,
0.45,
0.55,
0.65)
(0.55,
0.65,
0.75,
0.85)
INTERNATIONAL JOURNAL OF CIRCUITS, SYSTEMS AND SIGNAL PROCESSING DOI: 10.46300/9106.2021.15.137 Volume 15, 2021
E-ISSN: 1998-4464 1270
P
E
(0.00,
0.05,
0.15,
0.25)
(0.00,
0.05,
0.15,
0.25)
(0.00,
0.05,
0.15,
0.25)
(0.00,
0.05,
0.15,
0.25)
(0.00,
0.05,
0.15,
0.25)
(0.00,
0.05,
0.15,
0.25)
(0.00,
0.05,
0.15,
0.25)
(0.00,
0.05,
0.15,
0.25)
(0.35,
0.45,
0.55,
0.65)
(0.00,
0.05,
0.15,
0.25)
(1, 1,
1, 1)
(0.00,
0.05,
0.15,
0.25)
(0.00,
0.05,
0.15,
0.25)
(0.00,
0.05,
0.15,
0.25)
E
S
P
(0.00,
0.05,
0.15,
0.25)
(0.00,
0.05,
0.15,
0.25)
(0.00,
0.05,
0.15,
0.25)
(0.00,
0.05,
0.15,
0.25)
(0.00,
0.05,
0.15,
0.25)
(0.55,
0.65,
0.75,
0.85)
(0.00,
0.05,
0.15,
0.25)
(0.00,
0.05,
0.15,
0.25)
(0.35,
0.45,
0.55,
0.65)
(0.00,
0.05,
0.15,
0.25)
(0.00,
0.05,
0.15,
0.25)
(1, 1,
1, 1)
(0.00,
0.05,
0.15,
0.25)
(0.55,
0.65,
0.75,
0.85)
A
D
V
(0.00,
0.05,
0.15,
0.25)
(0.00,
0.05,
0.15,
0.25)
(0.00,
0.05,
0.15,
0.25)
(0.00,
0.05,
0.15,
0.25)
(0.55,
0.65,
0.75,
0.85)
(0.75,
0.85,
0.95,
1.00)
(0.00,
0.05,
0.15,
0.25)
(0.00,
0.05,
0.15,
0.25)
(0.35,
0.45,
0.55,
0.65)
(0.00,
0.05,
0.15,
0.25)
(0.55,
0.65,
0.75,
0.85)
(0.00,
0.05,
0.15,
0.25)
(1, 1,
1, 1)
(0.75,
0.85,
0.95,
1.00)
D
R
(0.00,
0.05,
0.15,
0.25)
(0.00,
0.05,
0.15,
0.25)
(0.00,
0.05,
0.15,
0.25)
(0.00,
0.05,
0.15,
0.25)
(0.00,
0.05,
0.15,
0.25)
(0.00,
0.05,
0.15,
0.25)
(0.00,
0.05,
0.15,
0.25)
(0.00,
0.05,
0.15,
0.25)
(0.00,
0.05,
0.15,
0.25)
(0.00,
0.05,
0.15,
0.25)
(0.75,
0.85,
0.95,
1.00)
(0.00,
0.05,
0.15,
0.25)
(0.00,
0.05,
0.15,
0.25)
(1, 1,
1, 1)
Table 6. Final defuzzified reachability matrix with transitive links
Impact of i
on j
TM PR CT CUL PLC LP SC ST CL COL PE ESP ADV DR
Driving
Power
1 2 3 4 5 6 7 8 9 10 11 12 13 14
TM 1 1 0 1 0 1 1 0 0 1 1 1 1 1 1 10
PR 2 1 1 1* 0 1 1* 1* 0 1 1 1* 1 1* 1* 12
CT 3 0 1 1 0 1* 1 1* 0 1 1 1 1 1 1 11
CUL 4 0 1 0 1 1 1 0 1* 1* 1 1* 1* 1 1* 11
PLC 5 0 0 0 0 1 1 1* 1 1* 0 1 1 0 1* 8
LP 6 0 0 0 0 0 1 0 0 1* 0 1 0 0 1 4
SC 0 1* 1 1 1 1 1 1 1 1 1 1 1* 1* 13
ST 7 0 0 1* 1* 1* 1 1 1 1* 1* 1 1* 0 1 11
CL 8 0 1* 1 1* 1 1 1 1* 1 1* 1* 1* 1* 1 13
COL 9 0 0 1* 0 1 1 1* 1* 1 1 1 1 1 1 11
PE 10 0 0 1* 0 1* 1* 1* 0 1 0 1 0 0 1* 7
ESP 11 0 0 1* 0 1* 1 1* 0 1 0 1* 1 0 1 8
ADV 12 0 0 1* 0 1* 1 0 1* 1 0 1 1* 1 1 9
DR 13 0 0 0 0 0 0 0 0 0 0 1 0 0 1 2
Dependence 14 2 5 10 4 12 13 9 7 13 8 14 11 8 14 130
* Transitivity check
Table 7. Level partitioning of Characteristics
Enable
rs
Reachability set Antecedent Intersetion set Leve
l
TM 1, 3, 5, 6, 9, 10, 11, 12, 13, 14 1, 2 1 V
INTERNATIONAL JOURNAL OF CIRCUITS, SYSTEMS AND SIGNAL PROCESSING DOI: 10.46300/9106.2021.15.137 Volume 15, 2021
E-ISSN: 1998-4464 1271
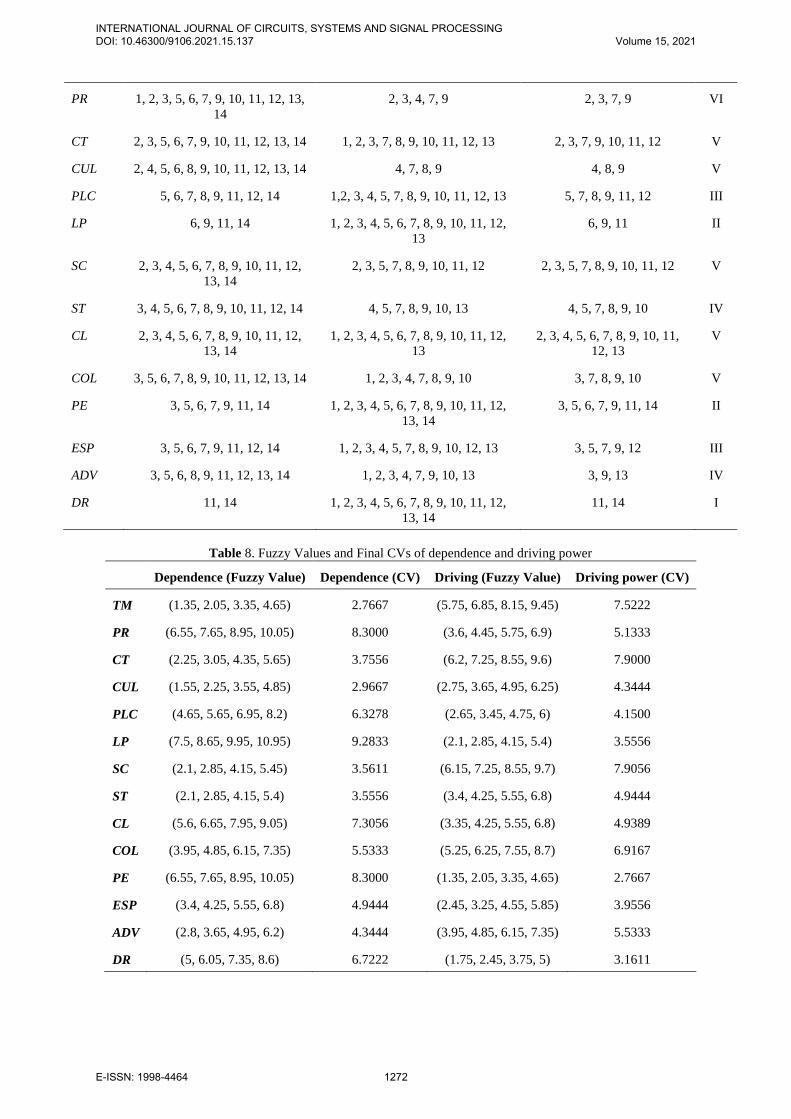
PR 1, 2, 3, 5, 6, 7, 9, 10, 11, 12, 13,
14
2, 3, 4, 7, 9 2, 3, 7, 9 VI
CT 2, 3, 5, 6, 7, 9, 10, 11, 12, 13, 14 1, 2, 3, 7, 8, 9, 10, 11, 12, 13 2, 3, 7, 9, 10, 11, 12 V
CUL 2, 4, 5, 6, 8, 9, 10, 11, 12, 13, 14 4, 7, 8, 9 4, 8, 9 V
PLC 5, 6, 7, 8, 9, 11, 12, 14 1,2, 3, 4, 5, 7, 8, 9, 10, 11, 12, 13 5, 7, 8, 9, 11, 12 III
LP 6, 9, 11, 14 1, 2, 3, 4, 5, 6, 7, 8, 9, 10, 11, 12,
13
6, 9, 11 II
SC 2, 3, 4, 5, 6, 7, 8, 9, 10, 11, 12,
13, 14
2, 3, 5, 7, 8, 9, 10, 11, 12 2, 3, 5, 7, 8, 9, 10, 11, 12 V
ST 3, 4, 5, 6, 7, 8, 9, 10, 11, 12, 14 4, 5, 7, 8, 9, 10, 13 4, 5, 7, 8, 9, 10 IV
CL 2, 3, 4, 5, 6, 7, 8, 9, 10, 11, 12,
13, 14
1, 2, 3, 4, 5, 6, 7, 8, 9, 10, 11, 12,
13
2, 3, 4, 5, 6, 7, 8, 9, 10, 11,
12, 13
V
COL 3, 5, 6, 7, 8, 9, 10, 11, 12, 13, 14 1, 2, 3, 4, 7, 8, 9, 10 3, 7, 8, 9, 10 V
PE 3, 5, 6, 7, 9, 11, 14 1, 2, 3, 4, 5, 6, 7, 8, 9, 10, 11, 12,
13, 14
3, 5, 6, 7, 9, 11, 14 II
ESP 3, 5, 6, 7, 9, 11, 12, 14 1, 2, 3, 4, 5, 7, 8, 9, 10, 12, 13 3, 5, 7, 9, 12 III
ADV 3, 5, 6, 8, 9, 11, 12, 13, 14 1, 2, 3, 4, 7, 9, 10, 13 3, 9, 13 IV
DR 11, 14 1, 2, 3, 4, 5, 6, 7, 8, 9, 10, 11, 12,
13, 14
11, 14 I
Table 8. Fuzzy Values and Final CVs of dependence and driving power
Dependence (Fuzzy Value) Dependence (CV) Driving (Fuzzy Value) Driving power (CV)
TM (1.35, 2.05, 3.35, 4.65) 2.7667 (5.75, 6.85, 8.15, 9.45) 7.5222
PR (6.55, 7.65, 8.95, 10.05) 8.3000 (3.6, 4.45, 5.75, 6.9) 5.1333
CT (2.25, 3.05, 4.35, 5.65) 3.7556 (6.2, 7.25, 8.55, 9.6) 7.9000
CUL (1.55, 2.25, 3.55, 4.85) 2.9667 (2.75, 3.65, 4.95, 6.25) 4.3444
PLC (4.65, 5.65, 6.95, 8.2) 6.3278 (2.65, 3.45, 4.75, 6) 4.1500
LP (7.5, 8.65, 9.95, 10.95) 9.2833 (2.1, 2.85, 4.15, 5.4) 3.5556
SC (2.1, 2.85, 4.15, 5.45) 3.5611 (6.15, 7.25, 8.55, 9.7) 7.9056
ST (2.1, 2.85, 4.15, 5.4) 3.5556 (3.4, 4.25, 5.55, 6.8) 4.9444
CL (5.6, 6.65, 7.95, 9.05) 7.3056 (3.35, 4.25, 5.55, 6.8) 4.9389
COL (3.95, 4.85, 6.15, 7.35) 5.5333 (5.25, 6.25, 7.55, 8.7) 6.9167
PE (6.55, 7.65, 8.95, 10.05) 8.3000 (1.35, 2.05, 3.35, 4.65) 2.7667
ESP (3.4, 4.25, 5.55, 6.8) 4.9444 (2.45, 3.25, 4.55, 5.85) 3.9556
ADV (2.8, 3.65, 4.95, 6.2) 4.3444 (3.95, 4.85, 6.15, 7.35) 5.5333
DR (5, 6.05, 7.35, 8.6) 6.7222 (1.75, 2.45, 3.75, 5) 3.1611
INTERNATIONAL JOURNAL OF CIRCUITS, SYSTEMS AND SIGNAL PROCESSING DOI: 10.46300/9106.2021.15.137 Volume 15, 2021
E-ISSN: 1998-4464 1272
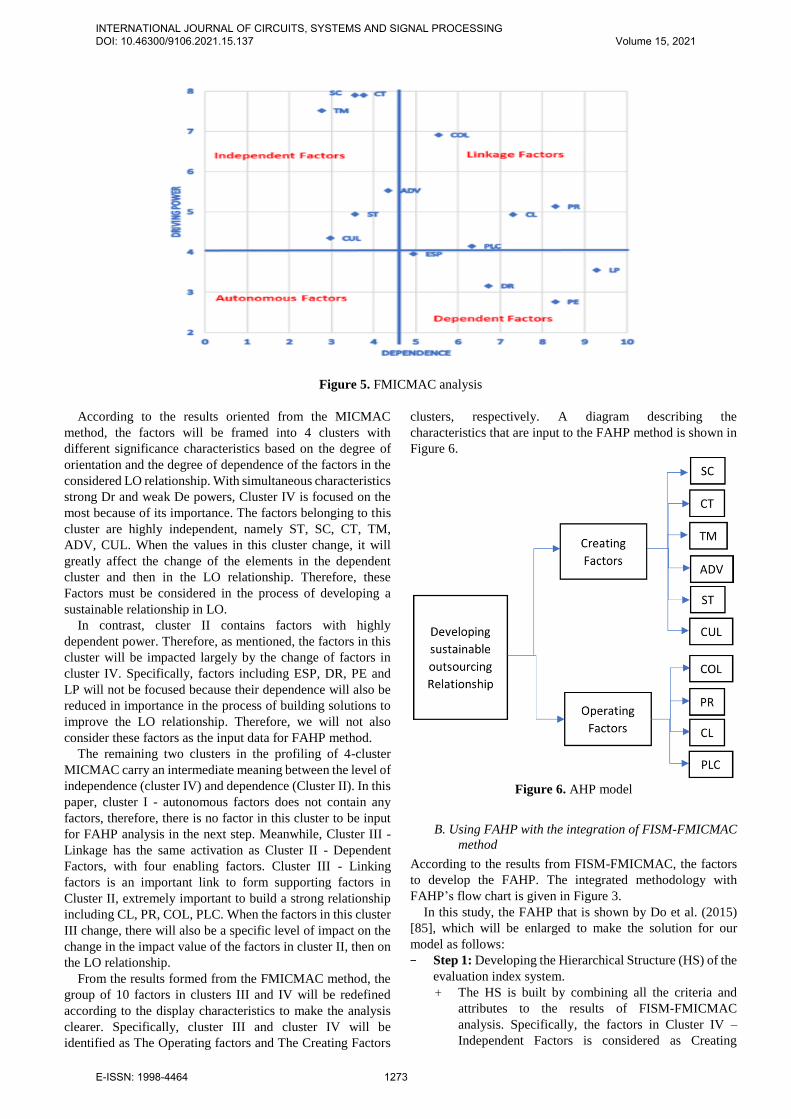
Figure 5. FMICMAC analysis
According to the results oriented from the MICMAC
method, the factors will be framed into 4 clusters with
different significance characteristics based on the degree of
orientation and the degree of dependence of the factors in the
considered LO relationship. With simultaneous characteristics
strong Dr and weak De powers, Cluster IV is focused on the
most because of its importance. The factors belonging to this
cluster are highly independent, namely ST, SC, CT, TM,
ADV, CUL. When the values in this cluster change, it will
greatly affect the change of the elements in the dependent
cluster and then in the LO relationship. Therefore, these
Factors must be considered in the process of developing a
sustainable relationship in LO.
In contrast, cluster II contains factors with highly
dependent power. Therefore, as mentioned, the factors in this
cluster will be impacted largely by the change of factors in
cluster IV. Specifically, factors including ESP, DR, PE and
LP will not be focused because their dependence will also be
reduced in importance in the process of building solutions to
improve the LO relationship. Therefore, we will not also
consider these factors as the input data for FAHP method.
The remaining two clusters in the profiling of 4-cluster
MICMAC carry an intermediate meaning between the level of
independence (cluster IV) and dependence (Cluster II). In this
paper, cluster I - autonomous factors does not contain any
factors, therefore, there is no factor in this cluster to be input
for FAHP analysis in the next step. Meanwhile, Cluster III -
Linkage has the same activation as Cluster II - Dependent
Factors, with four enabling factors. Cluster III - Linking
factors is an important link to form supporting factors in
Cluster II, extremely important to build a strong relationship
including CL, PR, COL, PLC. When the factors in this cluster
III change, there will also be a specific level of impact on the
change in the impact value of the factors in cluster II, then on
the LO relationship.
From the results formed from the FMICMAC method, the
group of 10 factors in clusters III and IV will be redefined
according to the display characteristics to make the analysis
clearer. Specifically, cluster III and cluster IV will be
identified as The Operating factors and The Creating Factors
clusters, respectively. A diagram describing the
characteristics that are input to the FAHP method is shown in
Figure 6.
Figure 6. AHP model
B. Using FAHP with the integration of FISM-FMICMAC
method
According to the results from FISM-FMICMAC, the factors
to develop the FAHP. The integrated methodology with
FAHP’s flow chart is given in Figure 3.
In this study, the FAHP that is shown by Do et al. (2015)
[85], which will be enlarged to make the solution for our
model as follows:
- Step 1: Developing the Hierarchical Structure (HS) of the
evaluation index system.
+ The HS is built by combining all the criteria and
attributes to the results of FISM-FMICMAC
analysis. Specifically, the factors in Cluster IV –
Independent Factors is considered as Creating
INTERNATIONAL JOURNAL OF CIRCUITS, SYSTEMS AND SIGNAL PROCESSING DOI: 10.46300/9106.2021.15.137 Volume 15, 2021
E-ISSN: 1998-4464 1273
Factors because this cluster have a strong driving
power more than others. The remaining clusters are
also named as Operating and Internal Clusters for
Cluster III and Cluster II, respectively. The attributes
which belong to factors according to their common
enablers, are still dissected though these enablers are
in one Cluster. The specific HS in this step is
depicted in Figure 6.
- Step 2: Determining the LVs and fuzzy conversion scale.
+ Although fuzzy linguistics numbers are existed in the
above FISM-FMICMAC methodology, the other
fuzzy scales must be used because of the FAHP
requirements. However, the Table 4’s results will be
still used instead of the other surveys must perform
one more time which presented in the reviewed
articles. In this study, the fuzzy are given in Table 9
Saaty (1990), Natasa and Zivojin (2017) [91]
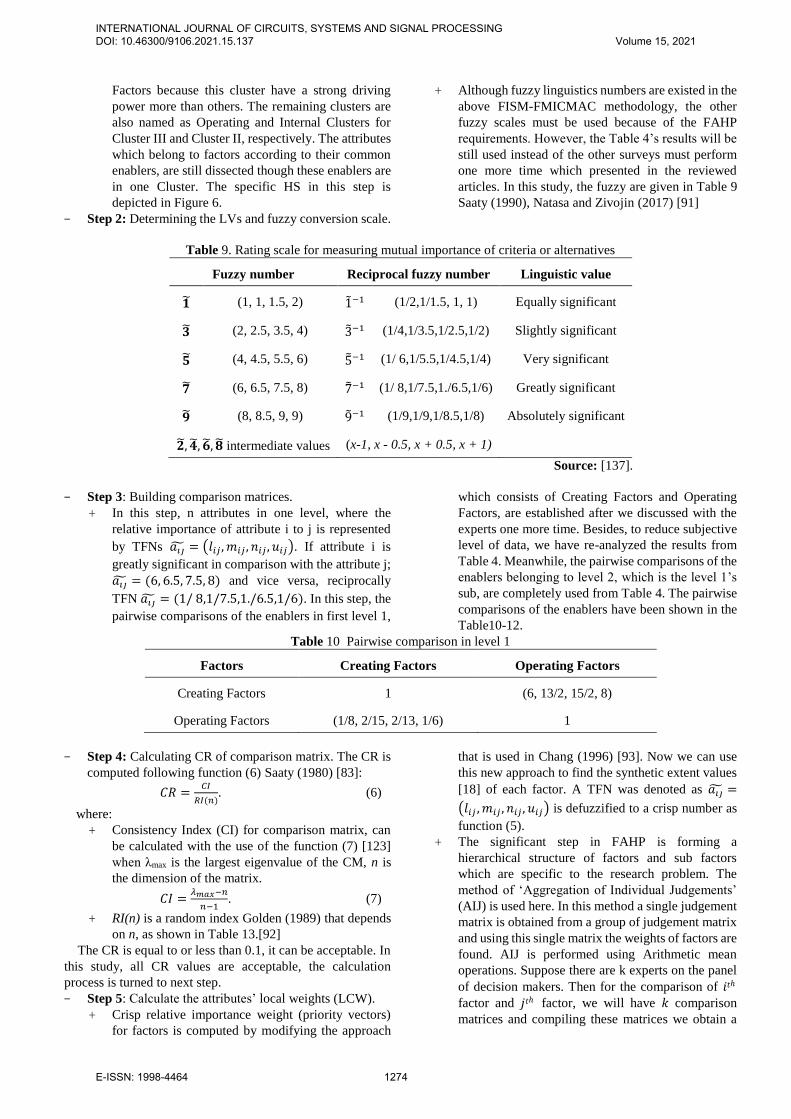
Table 9. Rating scale for measuring mutual importance of criteria or alternatives
Fuzzy number Reciprocal fuzzy number Linguistic value
�̃� (1, 1, 1.5, 2) 1̃−1 (1/2,1/1.5, 1, 1) Equally significant
�̃� (2, 2.5, 3.5, 4) 3̃−1 (1/4,1/3.5,1/2.5,1/2) Slightly significant
�̃� (4, 4.5, 5.5, 6) 5̃−1 (1/ 6,1/5.5,1/4.5,1/4) Very significant
�̃� (6, 6.5, 7.5, 8) 7̃−1 (1/ 8,1/7.5,1./6.5,1/6) Greatly significant
�̃� (8, 8.5, 9, 9) 9̃−1 (1/9,1/9,1/8.5,1/8) Absolutely significant
�̃�, �̃�, �̃�, �̃� intermediate values (x-1, x - 0.5, x + 0.5, x + 1)
Source: [137].
- Step 3: Building comparison matrices.
+ In this step, n attributes in one level, where the
relative importance of attribute i to j is represented
by TFNs 𝑎𝑖�̃� = (𝑙𝑖𝑗 , 𝑚𝑖𝑗 , 𝑛𝑖𝑗 , 𝑢𝑖𝑗). If attribute i is
greatly significant in comparison with the attribute j;
𝑎𝑖�̃� = (6, 6.5, 7.5, 8) and vice versa, reciprocally
TFN 𝑎𝑖�̃� = (1/ 8,1/7.5,1./6.5,1/6). In this step, the
pairwise comparisons of the enablers in first level 1,
which consists of Creating Factors and Operating
Factors, are established after we discussed with the
experts one more time. Besides, to reduce subjective
level of data, we have re-analyzed the results from
Table 4. Meanwhile, the pairwise comparisons of the
enablers belonging to level 2, which is the level 1’s
sub, are completely used from Table 4. The pairwise
comparisons of the enablers have been shown in the
Table10-12.
Table 10 Pairwise comparison in level 1
Factors Creating Factors Operating Factors
Creating Factors 1 (6, 13/2, 15/2, 8)
Operating Factors (1/8, 2/15, 2/13, 1/6) 1
- Step 4: Calculating CR of comparison matrix. The CR is
computed following function (6) Saaty (1980) [83]:
𝐶𝑅 =𝐶𝐼
𝑅𝐼(𝑛). (6)
where:
+ Consistency Index (CI) for comparison matrix, can
be calculated with the use of the function (7) [123]
when λmax is the largest eigenvalue of the CM, n is
the dimension of the matrix.
𝐶𝐼 =𝜆𝑚𝑎𝑥−𝑛
𝑛−1. (7)
+ RI(n) is a random index Golden (1989) that depends
on n, as shown in Table 13.[92]
The CR is equal to or less than 0.1, it can be acceptable. In
this study, all CR values are acceptable, the calculation
process is turned to next step.
- Step 5: Calculate the attributes’ local weights (LCW).
+ Crisp relative importance weight (priority vectors)
for factors is computed by modifying the approach
that is used in Chang (1996) [93]. Now we can use
this new approach to find the synthetic extent values
[18] of each factor. A TFN was denoted as 𝑎𝑖�̃� =
(𝑙𝑖𝑗 , 𝑚𝑖𝑗 , 𝑛𝑖𝑗 , 𝑢𝑖𝑗) is defuzzified to a crisp number as
function (5).
+ The significant step in FAHP is forming a
hierarchical structure of factors and sub factors
which are specific to the research problem. The
method of ‘Aggregation of Individual Judgements’
(AIJ) is used here. In this method a single judgement
matrix is obtained from a group of judgement matrix
and using this single matrix the weights of factors are
found. AIJ is performed using Arithmetic mean
operations. Suppose there are k experts on the panel
of decision makers. Then for the comparison of 𝑖𝑡ℎ
factor and 𝑗𝑡ℎ factor, we will have 𝑘 comparison
matrices and compiling these matrices we obtain a
INTERNATIONAL JOURNAL OF CIRCUITS, SYSTEMS AND SIGNAL PROCESSING DOI: 10.46300/9106.2021.15.137 Volume 15, 2021
E-ISSN: 1998-4464 1274
single judgement matrix Synthetic extent value of 𝑖𝑡ℎ
factor 𝑆𝑖 is defined as follow:
𝐴 = [
𝑙𝑖𝑗1 𝑚𝑖𝑗1
𝑙𝑖𝑗2 𝑙𝑖𝑗2
𝑛𝑖𝑗1 𝑢𝑖𝑗1… 𝑢𝑖𝑗2
… …
𝑙𝑖𝑗𝑘 𝑚𝑖𝑗𝑘
… ……𝑛𝑖𝑗𝑘 𝑢𝑖𝑗𝑘
].
where 1 ≤ 𝑗 ≤ 𝑛, 1 ≤ 𝑖 ≤ 𝑛 and 𝑘 is number of experts.
+ Arithmetic mean operation is used for aggregation.
(𝑙𝑖𝑗 , 𝑚𝑖𝑗 , 𝑛𝑖𝑗 , 𝑢𝑖𝑗) =
(𝑙𝑖𝑗1+⋯+𝑙𝑖𝑗𝑘
𝑘,𝑚𝑖𝑗1+⋯+𝑚𝑖𝑗𝑘
𝑘,𝑛𝑖𝑗1+⋯+𝑛𝑖𝑗𝑘
𝑘,𝑢𝑖𝑗1+⋯+𝑢𝑖𝑗𝑘
𝑘) (8)
+ Now we can use extent analysis method to find the
synthetic extent values Zarandi et al. (2012) [94] of
each factor, 𝑆𝑖 from functions (9) to (12).
𝑆𝑖 = ∑ 𝑀𝑖𝑗 ∗ (∑ ∑ 𝑀𝑖𝑗 𝑛𝑗=1
𝑛𝑖=1 )
−1𝑛𝑗=1 . (9)
where:
∑ 𝑀𝑖𝑗𝑛𝑗=1 =
(𝑙𝑖1+. . . +𝑙𝑖𝑛 , 𝑚𝑖1+. . . +𝑚𝑖𝑛 , 𝑛𝑖1+. . . +𝑛𝑖𝑛, 𝑢𝑖1+. . . +𝑢𝑖𝑛) =(𝑙𝑖 , 𝑚𝑖 , 𝑛𝑖, 𝑢𝑖), ∀𝑖 = 1,2, … , 𝑛. (10)
∑ ∑ 𝑀𝑖𝑗 𝑛𝑗=1
𝑛𝑖=1 =
(𝑙1+. . . +𝑙𝑛, 𝑚1+. . . +𝑚𝑛, 𝑛1+. . . +𝑛𝑛, 𝑢1+. . . +𝑢𝑛) =(𝑙,𝑚, 𝑛, 𝑢). (11)
Thus,
(∑ ∑ 𝑀𝑖𝑗 𝑛𝑗=1
𝑛𝑖=1 )
−1= (
1
𝑢,1
𝑛,1
𝑚,1
𝑙). (12)
+ Comparison between factors is done by finding the
degree of possibility, from function (4) will cause to
function (13)
𝑉(𝑆𝑖 ≥ 𝑆𝑗) =
{
1 𝑓 ≥ 𝑏 0 𝑏 − 𝑔 > ℎ + 𝑎 𝑔−𝑏+ℎ+𝑎
ℎ+𝑎 0 < 𝑏 − 𝑔 < ℎ + 𝑎
𝑏−𝑔+ℎ+𝑎
ℎ+𝑎𝑏 − 𝑔 < ℎ + 𝑎,𝑤ℎ𝑒𝑟𝑒 𝑏 < 𝑔
.
(13)
where 𝑆𝑖 = (𝑒, 𝑓, 𝑔, ℎ) và 𝑆𝑗 = (𝑎, 𝑏, 𝑐, 𝑑)
+ Final weightage of each of the factors can be
calculated by calculating the average of 𝑉 (𝑆𝑖 ≥ 𝑆𝑗) and then normalizing the obtained values.
Therefore, substituting pairwise comparison of the enabler
in Tables 11–12 into the functions (8)-(13) will help determine
the weights of the attributes in the specific respective order as
follows:
+ From table 10, we calculate ∑ 𝑀𝑖𝑗 𝑛𝑗=1 as follows:
𝐴 1 = (7; 7.5; 8.5; 9), 𝐴 2 = (1.125; 1.1333; 1.1538; 1.1667),
Then ∑ ∑ 𝑀𝑖𝑗𝑛𝑗=1
𝑛𝑖=1 =
(8.125; 8.6333; 9.6538; 10.1667).
(∑ ∑ 𝑀𝑖𝑗𝑛𝑗=1
𝑛𝑖=1 )
−1=
(0.1231; 0.1158; 0.1036; 0.0984). Then we calculate the synthetic extent values of each
of the factors as follows:
𝑆1 = (0.8615; 0.9231; 1.0462; 1.1077), 𝑆2 = (0.1385; 0.1395; 0.142; 0.1436),
Then 𝑉 (𝑆𝑖 ≥ 𝑆𝑗) is computed and obtained the
following result:
𝑉 (𝑆1 ≥ 𝑆𝑗) = 1 for every 𝑗 ≠ 1.
𝑉 (𝑆2 ≥ 𝑆𝑗) = 0,2229 for every 𝑗 ≠ 2.
On normalizing we get the weightage of each factor.
Weight (𝐴 1) = 0.81772,
Weight (𝐴 2) = 0.18228.
So, we prioritize the factors in the first stage
consisting of Creating and Operating Factors which
affect the LO relationship directly. These factors are
determined by two clusters in FMICMAC.
+ According to Cluster IV – Independent Factors which
consists of Creating Factors (System compliance (1);
Commitment or trust (2); Top management support (3);
TQM and JIT supplier added (4); Standardization (5);
and Culture (6)), we have determined the calculation
process as similar as follows:
𝐴 1 = (23; 24.7; 28; 30), 𝐴 2 = (12.125; 12.6333; 14.6515; 16.1667), 𝐴 3 = (6; 6.8333; 9.5; 11), 𝐴 4 = (3.8611; 4.0635; 5.5176; 6.625), 𝐴 5 = (3.6111; 4.1111; 5.6176; 6.125), 𝐴 6 = (3.125; 3.8; 5.1515; 5.1667).
Then, the synthetic extent values of each of the
factors will be as follows:
𝑆1 = (0.4447; 0.4776; 0.5414; 0.58), 𝑆2 = (0.1184; 0.1282; 0.1769; 0.2159), 𝑆3 = (0.116; 0.1321; 0.1837; 0.2127), 𝑆4 = (0.0747; 0.0786; 0.1067; 0.1281), 𝑆5 = (0.0698; 0.0795; 0.1086; 0.1184), 𝑆6 = (0.0604; 0.0735; 0.0996; 0.0999).
Then the values of 𝑉 (𝑆𝑖 ≥ 𝑆𝑗) are resulted as
follows:
𝑉 (𝑆1 ≥ 𝑆𝑗) = 1 for every 𝑗 ≠ 1,
𝑉 (𝑆2 ≥ 𝑆𝑗) = 0.5449 for every 𝑗 ≠ 2,
𝑉 (𝑆3 ≥ 𝑆𝑗) = 0.5529 for every 𝑗 ≠ 3,
𝑉 (𝑆4 ≥ 𝑆𝑗) = 0.3525 for every 𝑗 ≠ 4,
𝑉 (𝑆5 ≥ 𝑆𝑗) = 0,3448 for every 𝑗 ≠ 5,
𝑉 (𝑆6 ≥ 𝑆𝑗) = 0,306 for every 𝑗 ≠ 6.
On normalizing we get the weightage of each factor.
Weight (𝐴 1) = 0.3225,
Weight (𝐴 2) = 0.1757, Weight (𝐴 3) = 0.1783, Weight (𝐴 4) = 0.1137, Weight (𝐴 5) = 0.11122, Weight (𝐴 6) = 0.0987.
+ In the same way, the weightage of each factor in
Cluster III – Linkage Factors that consists of Creating
Factors (Buyer-3PL Collaboration (1); Guanxi
(Personal Relationships) (2); Contract length (3); 3PL
Customer Service Expertise (4)) have been also
determined as follows:
Weight (𝐴 1) = 0.6098, Weight (𝐴 2) = 0.1567, Weight (𝐴 3) = 0.1307, Weight (𝐴 4) = 0.1028.
- Step 6: Calculating the Global Weights (GW) for the
attributes.
+ GW are calculated after the relationships between
LCW are determined. In FAHP, GW is equal to the
result when the LCW of the attribute is multiplied with
the LCW of the criterion to which it belongs.
+ In this step, global weights derived from FAHP have
significantly influenced to the description about the
INTERNATIONAL JOURNAL OF CIRCUITS, SYSTEMS AND SIGNAL PROCESSING DOI: 10.46300/9106.2021.15.137 Volume 15, 2021
E-ISSN: 1998-4464 1275
significance of the enablers for increasing the
sustainable degree in LO relationships. These weights
will be displayed the most complete next to the
normalizing weights in Table 14. According to Table
14, System compliance (0.2637-1) came at rank one
out of ten enables, whose global weight was 70% more
than rank two enabler, Top management support
(0.1458-2). Commitment or trust (0.1437-3) and
Buyer-3PL Collaboration (0.1112-4) were at rank three
and four. The remaining enablers have been ranked
from five to ten which consisted of TQM and JIT
supplier added (added distinctive value) (0.0929-5);
Standardization (0.0909-6); Culture (0.0807-7);
Guanxi (Personal Relationships) (0.0286-8); Contract
length (0.0238-9); and 3PL Customer Service
Expertise (0.0187-10), respectively.
This study was inherited from many variables which work
as enablers in the orientation of sustainability in LO
relationships. By linking the above proposed model with the
LO relationship management process, the strategy makers will
have a robust base on considering the importance of the
enablers in the process of decision-making in each of the
specific segment, which help to achieve high efficiency in
logistics operations.
The case study of Mekong Delta, Vietnam, describes the
reality of using the integrated FISM-FMICMAC-FAHP
methodology for modelling and ranking of the significant
degree of enablers in LO relationships in this Area. This
integrated approach, which combined FISM-FMICMAC
diagraph and FAHP ranking, would help managers to control
the efforts and risks of the enablers better than ever before. It
is sure that the operation cost will be minimized while the
effectiveness in Logistics performance can be improved as
high as possible.
V. CONCLUSION
For looking for the main factors influencing LO relationship
between Shippers and LSP, fourteen factors are considered by
collecting experts’ opinion and constructed pair-wise
comparison matrices under fuzzy linguistic and Scaling of
these LVs is done by Trapezoidal fuzzy conversion. This
paper which is based on the understanding of the LO
relationship in practice, has concluded the significant degree
of the enablers in developing the LO relationship among the
partners in Mekong Delta Rice SuC. It is resulted that 10 out
of 14 enablers have significantly influenced upon the LO
relationship with specific global weights on each enabler.
FISM-FMICMAC provide an insight overview of enablers of
sustainable LO relationships by developing and categorizing.
FAHP has been integrated to know the importance of each
enabler. The development of the integrated FISM-
FMICMAC-FAHP method under the trapezoidal fuzzy
number in assessing the importance and finding the specific
impact weights of the factors on the LO relationship for the
Rice SuC also contributes to enrich the literature on the fact-
based approach in understanding logistics activities for the
rice supply chain.
The results of this paper create a highly practical scientific
basis for managers of rice companies in the Mekong Delta to
understand the possibility of developing a sustainable LO
relationship from which can form more effective solutions for
logistics activities. In addition, understanding the key
character of the LO relationship will be an extremely
important input in decision-making regarding the adjustment
of the structure of this activity to business managers, which
helps their businesses minimize costs incurred, thus
minimizing risks in logistics-related activities.
Finally, by the method that we have framed, this paper can be
extended to the other fields besides the logistics of the other
supply chains. With other supply chains, to build and maintain
LO relationships, managers can use parts of our research
results when their company's products have similar
characteristics. Meanwhile, the most significant difference
when applied to other fields is the specific expertise of the
experts and the understanding of the members to the specific
nature of research field. Since then, the results of this paper
bring more value in practice besides the scientific content that
the paper brings.
Limitations and scope for future work
In this paper, only fourteen-variables are limited for
modeling the LO relationship. More number of enablers
influencing LO relationship should be added to develop
FISM for enriching the dynamic suitability to other fields
instead of LO relationships, which help to enhance the
enterprises’ effectiveness. Therefore, developing a more
rigorous model with the combination various types of FISM
has been proposed for future research.
Although the enablers are identified from reputed journal
and industry experts of logistics industry and the actual
practitioners and FISM-FMICMAC-FAHP methodology is
established, the nature of this study is partly subjective
judgements. The subjectivity is mentioned which is the in-
depth interview process with experts to identify 14 groups
of factors affecting the LO relationship before we conduct
a survey on the required samples for the next stages this
paper. The future study should be expanded to identifying
most significant enablers in different industries of sectors in
Vietnam by various methodologies and approaches.
Moreover, further MCDM techniques liked ANP have also
been used for complementing the statistical validation of the
hypothetical model in the future study.
Finally, the fuzzy type II approach [13] should be
considered for counting the second-stage ambiguity to
narrow the uncertainty in the LO relationships analysis.
ACKNOWLEDGEMENT
This work is partly supported by the research project No.
ĐHFPT/2020/02 granted by FPT University.
Graduate student Nguyen Thang Loi was funded by Vingroup
Joint Stock Company and supported by the Domestic Master/
PhD Scholarship Programme of Vingroup Innovation
Foundation (VINIF), Vingroup Big Data Institute
(VINBIGDATA), code VINIF.2020.TS.26
INTERNATIONAL JOURNAL OF CIRCUITS, SYSTEMS AND SIGNAL PROCESSING DOI: 10.46300/9106.2021.15.137 Volume 15, 2021
E-ISSN: 1998-4464 1276
REFERENCES
[1] Ges-kualalumpur 2013, The process and advantages of the
signed trade agreements of vietnam, retrieved from
https://www.geskualalumpur2013.org/ngoai-giao/cac-
hiep-dinh-thuong-mai-viet-nam-da-ky-ket-qua-trinh-
va-loi-the/ (accessed on september 12, 2018), 2018.
[2] Ministry of Industry and Trade of Vietnam, Vietnam
Logistics report 2017, Logistics: from planning to
action, industry and trade publisher, Vietnam: Hanoi,
2017.
[3] Evangelista, p., r. Mogre, a. Perego, a. Raspagliesi, and e.
Sweeney, “A survey-based analysis of it adoption and
3PLs” performance.”, Supply chain management: an
international journal, 17 (2), pp. 172–186, 2012.
[4] Tsai, m. C., k. H. Lai, a. E. Lloyd, and h. J. Lin, “The dark
side of logistics outsourcing – unraveling the Potential
risks leading to failed relationships.”, Transportation
research part e: logistics and transportation, Review 48
(1), pp. 178–189, 2012.
[5] Chu, Z., Wang, Q. and Lado, A.A., "Customer orientation,
relationship quality, and performance: The third-party
logistics provider’s perspective", The International
Journal of Logistics Management, Vol. 27 No. 3, pp.
738-754. 2016.
[6] Sangam, v. K., “Global logistics outsourcing trends:
challenges in managing 3pl relationship.” Research
Paper. Palmerston north: Massey University, 2015.
[7] Kumar, p., and r. K. Singh, “A fuzzy ahp and topsis
methodology to evaluate 3pl in a supply chain.”, Journal
of modelling in management, 7 (3), pp. 287–303, 2012.
[8] Liu, Chiung-Lin & Lyons, Andrew, “An analysis of third-
party logistics performance and service provision”,
Transportation Research Part E: Logistics and
Transportation Review. 47. 547-570, 2011.
[9] Jayaram, j., and k. C. Tan, “Supply chain integration with
third-party logistics providers.” International Journal of
production economics, 125 (2), pp. 262–271, 2010.
[10] Lam, j. S. L., and j. Dai, “Developing supply chain
security design of logistics service providers: An
Analytical Network process-quality function
deployment approach.” International journal of
physical distribution & Logistics management, 45 (7),
pp. 674–690, 2015.
[11] König, a., and s. Spinler, “The effect of logistics
outsourcing on the supply chain vulnerability of
shippers: Development of a conceptual risk
management framework.” The international journal of
logistics management, 27 (1), pp. 122–141, 2016.
[12] Ireland, Ron and Robert Bruce, “CPFR: Only the
Beginning of Collaboration,”, Supply Chain
Management Review, Vol. 4, No. 4, pp. 80-88, 2020.
[13] M.N. Qureshi, Dinesh Kumar, Pradeep Kumar. An
integrated model to identify and classify the key criteria
and their role in the assessment of 3PL services
providers. Asia Pacific Journal of Marketing and
Logistics, 20:2, pp. 227-249, 2008.
[14] Magutu, P.O., Nyamwange, S.O. & Kaptonge G.K,
“Business process reengineering for competitive
advantage”, African journal of business and
management, vol.1, pp. 16, 2010.
[15] Ragab, A, “Impact of business process reengineering
(BPR) on organizational performance”, Harvard
Business School, 2009.
[16] Queiroz, M.M., Wanba, S.F. “Blockchain Adoption
Challenges in Supply Chain: An Empirical Investigation
of The Main Drivers in India and the USA”, Int. J. Inf.
Manage, 46, pp. 70-82, 2019.
[17] Yuan, Y., Chu, Z., Lai, F., & Wu, H. “The impact of
transaction attributes on logistics outsourcing success: a
moderated mediation model”, International journal of
production economics, 219, pp. 54-65. 2020.
[18] Shou, Y., J. Shao, and A. Chen, “Relational Resources
and Performance of Chinese Third-Party Logistics
Providers, The Mdediating Role of Innovation
Capability.” International Journal of Physitical
Distribtuion & Logistics Management, 47 (9), pp. 864–
883, 2017.
[19] Liu, X., K. Zhang, B. Chen, J. Zhou, and L. Miao.
“Analysis of Logitics Service Supply Chain for the One
Belt nd One Road Initiative of China.” Transportation
Research Part E: Logistics and Transportation Review,
117, pp. 23–39, 2018.
[20] Gu, Flora F., Kineta Hung, and David K. Tse, “When
Does Guanxi Matter? Issues of Capitalization and its
Dark Sides,” Journal of Marketing, Vol. 72, No. 3, pp.
12-28, 2008.
[21] Chen, H., E. James, J. Zemanek, E. S. Mai, and Y. Tien.
“Relationship Flexibility in a 3PL Context: Impacts of
Network Embeddedness, Guanxi, and Explicit
Contract.” Journal of Marketing Channels, 22 (4), pp.
253–264, 2015.
[22] Burt, Ronald S, “The Contingent Value of Social
Capital,” Administrative Science Quarterly, Vol. 42, No.
2, pp. 339-365, 1997.
[23] Cai, S., Jun, M. and Yang, Z., “Implementing supply
chain information integration in China: The role of
institutional forces and trust”, Journal of Operations
Management, Vol. 28 No.3, pp.257-268, 2010.
[24] Klein, R. “Customization and Real Time Information
Access in Integrated eBusiness Supply Chain
Relationships.” Journal of Operations Management, 25
(6): pp. 1366–1381, 2007.
[25] Ghosh, A., and J. Fedorowicz. “The Role of Trust in
Supply Chain Governance.” Business Process
Management Journal, 14 (4): 453–470, 2008.
[26] Hofenk, D., R. Schipper, J. Semeijn, and C. Gelderman,
“The Influence of Contractual and Relational Factors on
the Effectiveness of Third-Party Logistics
Relationships.” Journal of Purchasing & Supply
Management, 17 (3), pp. 167–175, 2011.
[27] Gao, H., J. Yang, H. Yin, and Z. Ma, “The Impact of
Partner Simiarity on Alliance Management Capabillity,
Stability and Performance, Empirical Evidence of
Horizontal Logistics Alliance in China.” International
Journal of Phystical Distribution & Logistics
Management, 47 (9), pp. 906–926, 2017.
[28] G. Tejpal, R. K. Garg and A. Sachdeva, "Factor analysis
of rational trust among supply chain partners in Indian
INTERNATIONAL JOURNAL OF CIRCUITS, SYSTEMS AND SIGNAL PROCESSING DOI: 10.46300/9106.2021.15.137 Volume 15, 2021
E-ISSN: 1998-4464 1277
industries," 2013 IEEE International Conference on
Industrial Engineering and Engineering Management,
Bangkok, Thailand, pp. 915-918. 2013
[29] Yuan, Yang, Feng, Bo; Lai, Fujun, Collins, Brian J., “The
role of trust, commitment, and learning orientation on
logistic service effectiveness”. Journal of Business
Research, 93(), 37–50. 2018.
[30] Huo, B., C. Liu, M. Kang, and X. Zhao, “The Impact of
Dependence and Relationship Commitement on
Logistics Outsourcing, Empirical Evidence from
Greater China.” International Journal of Physica
Distribution & Logistics Management, 45 (9/10), pp.
887–912, 2015.
[31] Hofstede, G., G. J. Hofstede, and M. Minkov, Cultures
and Organisations. Software of the Mind: Intercultural
Cooperation and Its Importance for Survival. 3rd ed.
New York: McGraw-Hill, 2010.
[32] Hutzschenreuter, Thomas & Voll, Johannes & Verbeke,
Alain, “The Impact of Added Cultural Distance and
Cultural Diversity on International Expansion Patterns:
A Penrosean Perspective”. Journal of Management
Studies. 48. 305-329, 2011.
[33] Gooris, J., and C. Peeters, “Home–Host Country Distance
in Offshore Governance Choices.” Journal of
International Management, 20 (1), pp. 73–86, 2014.
[34] Schuetz, S., Venkatesh., V., Blockchain, adoption, and
financial inclusion in India: Research opportunities. Int.
J. Inf. Manage, 2019.
[35] Dai, J., Chan, H.K., Yee, R.W.Y., Examining moderating
effect of organizational culture on the relationship
between market pressure and corporate environment
strategy. Ind. Mark. Manage, 74, pp. 227-236, 2018.
[36] Dubey, R., Gunasekaran, A., Chide, S.J., Roubaud, Dd.,
Wamba, S.F., Giannakis, M, Foropon, C., Big data
analytics and organizational culture as complements to
swift trust and collaborative performance in the
humanitarian supply chain. Int. J. Prod. Econ, 210, pp.
120-136, 2019.
[37] Ellinger, Alexander E., David J. Ketchen, G. Tomas L.
Hult, Aye Banu Elmada, and R. Glenn Richey, Jr.,
“Market-Orientation, Employee Development Practices
and Performance,” Industrial Marketing Management,
Vol. 37, No. 4, pp. 353-366, 2008.
[38] Hsiao, H. I., Kemp, R. G., Van der Vorst, J. G., & Omta,
S. O. A classification of logistic outsourcing levels and
their impact on service performance: Evidence from the
food processing industry. International journal of
production economics, 124(1), pp. 75-86, 2010.
[39] Thai, V. V., Logistics service quality: Conceptual model
and empirical evidence. International Journal of
Logistics: Research and Applications, 16(2), pp. 144-
131, 2013.
[40] Arvis, J.-F., Ojala, L., Wiederer, C., shepgerd, B., Rai,
A., Dairabayeva, K., et al. Connecting to compete 2018:
Trade logistics in the global economy: The logistics
performance index and its indicators. New York: World
Bank, 2018.
[[41] Williamson, O.E. ‘‘Outsourcing: Transaction Cost
Economics and Supply Chain Management,’’ Journal of
Supply Chain Management, (44:2), pp. 5-16, 2018.
[42] Daugherty, M. P., Domenico Bosco, and R. P. P.
Almeida, "Temperature mediates vector transmission
efficiency: inoculum supply and plant infection
dynamics." Annals of applied biology, 155.3: 361-369,
2009.
[43] Marcus Wallenburg, C., Cahill, D.L., Goldsby, T.J. and
Knemeyer, A.M.,"Logistics outsourcing performance
and loyalty behavior: Comparisons between Germany
and the United States", International Journal of
Physical Distribution & Logistics Management, Vol. 40
No. 7, pp. 579-602, 2010.
[44] Mothilal, S., Gunasekaran, A., Nachiappan, S. P., &
Jayaram, J., “Key success factors and their performance
implications in the Indian third-party logistics (3PL)
industry”, International Journal of Production
Research, 50(9), 2407-2422. 2012.
[45] Karia, N., & Wong, C. Y., “The impact of logistics
resources on the performance of Malaysian logistics
service providers”, Production Planning & Control,
24(7), 589-606, 2013.
[46] Zailani, Suhaiza & Iranmanesh, Mohammad & Aziz,
Azmin & Kanapathy, Kanagi, “Halal logistics
opportunities and challenges”. Journal of Islamic
Marketing, 8, 2017.
[47] Sanders, N. R., Locke, A., Moore, C. B., & Autry, C. W.,
“A multidimensional framework for understanding
outsourcing arrangements”, Journal of Supply Chain
Management, 43(4), 3-15, 2007.
[48] Sinkovics, R. R., R. J. B. Jean, A. S. Roath, and S. T.
Cavusgil, “Does IT Integration Really Enhance Supplier
Responsiveness in Global Supply Chains?”
Management International Review, 51 (2), pp. 193–212,
2011.
[49] Chang, S.E., Chen, Y.-C, Lu, M.-F., Supply chain re-
engineering using blockchain technology: A case of
smart contract-based tracking. Technol. Forecast.
Soc.Chang, 144, pp. 1-11, 2019.
[50] Zhao, X., and Q. Tang, “Analysis and Strategy of the
Chinese Logistics Cost Reduction.” International
Journal of Business & Management, 4 (4), pp. 188–191,
2009.
[51] Large, R. O., N. Kramer, and R. K. Hartmann,
“Customer-specific Adaptation by Providers and Their
Perception of 3PL-relationship Success.” International
Journal of Physical Distribution & Logistics
Management, 41 (9), pp. 822–838, 2011.
[52] Marchet, G., M. Melacini, C. Sassi, and E. Tappia,
“Assessing Efficiency and Innovation in the 3PL
Industry: An Empirical Analysis.” International Journal
of Logistics Research and Applications, pp. 1–20, 2016.
[53] Rajesh, R., S. Pugazhendhi, K. Ganesh, D. Yves, S. C.
Lenny Koh, and C. Muralidharan, “Perceptions of
Service Providers and Customers of Key Success
Factors of Third-party Logistics Relationships – An
Empirical Study.” International Journal of Logistics
Research and Applications, 14 (4), pp. 221–250, 2011.
[54] Helo, P., Hao, Y., Blockchains in operations and supply
chains: A model and reference implementation. Comut.
Ind. Eng, 136, pp. 242-251, 2019.
INTERNATIONAL JOURNAL OF CIRCUITS, SYSTEMS AND SIGNAL PROCESSING DOI: 10.46300/9106.2021.15.137 Volume 15, 2021
E-ISSN: 1998-4464 1278
[55] Esper, Terry L., Brian S. Fugate, and Beth Davis-Sramek,
“Logistics Learning Capability: Sustaining the
Competitive Advantage Gained through Logistics
Leverage,” Journal of Business Logistics, Vol. 28, No.
2, pp. 57-81, 2007.
[56] Hald, K. S., & Mouritsen, J., “The evolution of
performance measurement systems in a supply chain: A
longitudinal case study on the role of interorganisational
factors”, International Journal of Production
Economics, Vol. 205, pp. 256-271, 2018.
[57] DUC, T. T. H.; LOI, N. T.; BUDDHAKULSOMSIRI, J.
Buyback contract in a risk-averse supply chain with a
return policy and price dependent demand. International
Journal of Logistics Systems and Management, 30.3, pp.
298-329, 2018.
[58] Yilmaz, C., Sezen, B. and Ozdemir, O., “Joint interactive
effects of trust and (inter) dependence on relational
behaviors in long-term channel dyads”, Industrial
Marketing Management, Vol. 34 No. 3, pp. 235-48,
2005.
[59] Eric T.G. Wang, Jeffrey C.F. Tai & Hsiao-Lan Wei, A
Virtual Integration Theory of Improved Supply-Chain
Performance, Journal of Management Information
Systems, 23:2, pp. 41-64, 2006.
[60] Angelis, J. da Silva, R., Blockchain adoption: A value
diver perspective. Bus. Horiz, 62 (3), pp. 307-314, 2019.
[61] Nguyen, H.-O., Critical factors in e-business adoption:
Evidence from Australian transport and logistics
companies. Int. J. Prod. Econ, 146 (1), pp. 300-312,
2013.
[62] Montecchi, M., Plangger, K., Etter, M., It’s real, trust me!
Establishing supply chain provenance using blockchain.
Bus. Horizons, 62, pp. 283–293, 2019.
[63] Kim, D., Cavusgil, S. T., & Calantone, R. J., Information
system innovations and supply chain management:
Channel relationships and firm performance. Journal of
the Academy of Marketing Science, 34(1), pp. 40–54,
2006.
[64] Wu, F., Sinkovics, R. R., Cavusgil, S. T., & Roath, A. S.,
Overcoming export manufacturer’s dilemma in
international expansion. Journal of International
Business Studies, 38(2), pp. 283–302, 2007.
[65] Agarwal, R., Croson, R., & Mahoney, J. T, “The role of
incentives and communication in strategic alliances: An
experimental investigation”, Strategic Management
Journal, Vol. 31, No. 4, pp. 413-437, 2010.
[66] Krishnan, R., Geyskens, I., & Steenkamp, J. B. E, “The
effectiveness of contractual and trust-based governance
in strategic alliances under behavioral and
environmental uncertainty”, Strategic Management
Journal, Vol. 37, No. 12, pp. 2521-2542, 2016.
[67] Hald, K. S., & Mouritsen, J., “The evolution of
performance measurement systems in a supply chain: A
longitudinal case study on the role of interorganisational
factors”, International Journal of Production
Economics, Vol. 205, pp. 256-271, 2018.
[68] Ranjith, V. K., & Bijuna, C., Outsourcing and
Competitive Advantage. International Journal of
Research in Commerce and Management, 4, 5, 2013.
[69] Tasie, G., “An exploratory review of total quality
managment and organizational performance”,
International Journal of Business and Law Research,
Vol. 4 No. 1, pp. 39-45, 2016.
[70] Flynn, P.J., “U.S. patent application no. 29/025,780”
Green, K.W., Inman, R.A., Sower, V.E. and Zelbst, P.J.
(2019a), “Impact of JIT, TQM and green supply chain
practices on environmental sustainability”, Journal of
Manufacturing Technology Management, Vol. 30 No. 1,
pp. 26-47, 1995.
[71] Green, K.W., Inman, R.A., Sower, V.E. and Zelbst, P.J.,
“Impact of JIT, TQM and green supply chain practices
on environmental sustainability”, Journal of
Manufacturing Technology Management, Vol. 30 No. 1,
pp. 26-47 2019.
[72] Gunasekaran, A., Subramanian, N., & Papadopoulos, T.,
“Information technology for competitive advantage
within logistics and supply chains: A review”,
Transportation Research Part E: Logistics and
Transportation Review, 99, 14-33, 2017.
[73] Brinch, M., Stentoft, J., Jensen, J.K. and Rajkumar, C.,
"Practitioners understanding of big data and its
applications in supply chain management", The
International Journal of Logistics Management, Vol. 29
No. 2, pp. 555-574, 2018.
[74] Belvedere, Valeria, and Alberto Grando, Sustainable
operations and supply chain management, John Wiley
& Sons, 2017.
[75] Savitha M T and Dr. Mary George, New Methods for
Ranking of TFNs. Advances in Fuzzy Mathematics.
Volume 12, Number 5, pp. 1159-1170, 2017.
[76] Dube A, Gawande R, ISM-fuzzy MICMAC approach for
analysis of GSCM enablers. Int J Logist Syst Manag,
24(4), pp. 426–451, 2016a.
[77] Yadav, S. and Sharma, A., “Modelling of enablers for
maintenance management by ISM method”, Industrial
Engineering & Management, Vol. 6 No. 203, pp. 2169-
0316, 2017.
[78] Lamba, K. and Singh, S.P., “Modeling big data enablers
for operations and supply chain management”,
International Journal of Logistics Management, Vol. 29
No. 2, pp. 629-658, 2018.
[79] Rana, N.P., Barnard, D.J., Baabdullah, A.M., Rees, D.
and Roderick, S., “Exploring barriers of m-commerce
adoption in SMEs in the UK: developing a framework
using ISM”, International Journal of Information
Management, Vol. 44, pp. 141-153, 2019.
[80] Mishra, S., Singh, S.P., Johansen, J., Cheng, Y. and
Farooq, S., “Evaluating indicators for international
manufacturing network under circular economy”,
Management Decision, Vol. 57 No. 4, pp. 811-839,
2019.
[81] Rajput, S. and Singh, S.P., “Identifying industry 4.0 IoT
enablers by integrated PCA-ISM-DEMATEL
approach”, Management Decision, Vol. 57 No. 8, pp.
1784-1817, 2019.
[82] Yadav, S. and Singh, S.P., “Blockchain critical success
factors for sustainable supply chain”, Resources,
Conservation and Recycling, Vol. 152, 104505, 2020.
INTERNATIONAL JOURNAL OF CIRCUITS, SYSTEMS AND SIGNAL PROCESSING DOI: 10.46300/9106.2021.15.137 Volume 15, 2021
E-ISSN: 1998-4464 1279
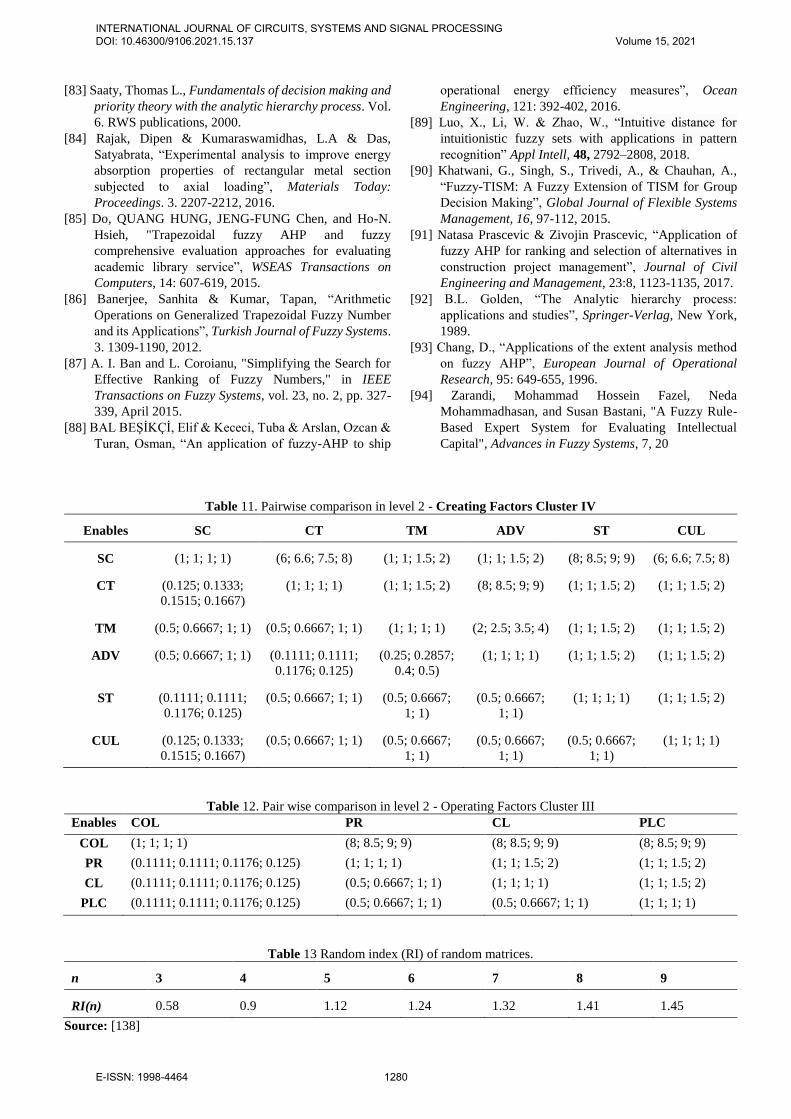
[83] Saaty, Thomas L., Fundamentals of decision making and
priority theory with the analytic hierarchy process. Vol.
6. RWS publications, 2000.
[84] Rajak, Dipen & Kumaraswamidhas, L.A & Das,
Satyabrata, “Experimental analysis to improve energy
absorption properties of rectangular metal section
subjected to axial loading”, Materials Today:
Proceedings. 3. 2207-2212, 2016.
[85] Do, QUANG HUNG, JENG-FUNG Chen, and Ho-N.
Hsieh, "Trapezoidal fuzzy AHP and fuzzy
comprehensive evaluation approaches for evaluating
academic library service”, WSEAS Transactions on
Computers, 14: 607-619, 2015.
[86] Banerjee, Sanhita & Kumar, Tapan, “Arithmetic
Operations on Generalized Trapezoidal Fuzzy Number
and its Applications”, Turkish Journal of Fuzzy Systems.
3. 1309-1190, 2012.
[87] A. I. Ban and L. Coroianu, "Simplifying the Search for
Effective Ranking of Fuzzy Numbers," in IEEE
Transactions on Fuzzy Systems, vol. 23, no. 2, pp. 327-
339, April 2015.
[88] BAL BEŞİKÇİ, Elif & Kececi, Tuba & Arslan, Ozcan &
Turan, Osman, “An application of fuzzy-AHP to ship
operational energy efficiency measures”, Ocean
Engineering, 121: 392-402, 2016.
[89] Luo, X., Li, W. & Zhao, W., “Intuitive distance for
intuitionistic fuzzy sets with applications in pattern
recognition” Appl Intell, 48, 2792–2808, 2018.
[90] Khatwani, G., Singh, S., Trivedi, A., & Chauhan, A.,
“Fuzzy-TISM: A Fuzzy Extension of TISM for Group
Decision Making”, Global Journal of Flexible Systems
Management, 16, 97-112, 2015.
[91] Natasa Prascevic & Zivojin Prascevic, “Application of
fuzzy AHP for ranking and selection of alternatives in
construction project management”, Journal of Civil
Engineering and Management, 23:8, 1123-1135, 2017.
[92] B.L. Golden, “The Analytic hierarchy process:
applications and studies”, Springer-Verlag, New York,
1989.
[93] Chang, D., “Applications of the extent analysis method
on fuzzy AHP”, European Journal of Operational
Research, 95: 649-655, 1996.
[94] Zarandi, Mohammad Hossein Fazel, Neda
Mohammadhasan, and Susan Bastani, "A Fuzzy Rule-
Based Expert System for Evaluating Intellectual
Capital", Advances in Fuzzy Systems, 7, 20
Table 11. Pairwise comparison in level 2 - Creating Factors Cluster IV
Enables SC CT TM ADV ST CUL
SC (1; 1; 1; 1) (6; 6.6; 7.5; 8) (1; 1; 1.5; 2) (1; 1; 1.5; 2) (8; 8.5; 9; 9) (6; 6.6; 7.5; 8)
CT (0.125; 0.1333;
0.1515; 0.1667)
(1; 1; 1; 1) (1; 1; 1.5; 2) (8; 8.5; 9; 9) (1; 1; 1.5; 2) (1; 1; 1.5; 2)
TM (0.5; 0.6667; 1; 1) (0.5; 0.6667; 1; 1) (1; 1; 1; 1) (2; 2.5; 3.5; 4) (1; 1; 1.5; 2) (1; 1; 1.5; 2)
ADV (0.5; 0.6667; 1; 1) (0.1111; 0.1111;
0.1176; 0.125)
(0.25; 0.2857;
0.4; 0.5)
(1; 1; 1; 1) (1; 1; 1.5; 2) (1; 1; 1.5; 2)
ST (0.1111; 0.1111;
0.1176; 0.125)
(0.5; 0.6667; 1; 1) (0.5; 0.6667;
1; 1)
(0.5; 0.6667;
1; 1)
(1; 1; 1; 1) (1; 1; 1.5; 2)
CUL (0.125; 0.1333;
0.1515; 0.1667)
(0.5; 0.6667; 1; 1) (0.5; 0.6667;
1; 1)
(0.5; 0.6667;
1; 1)
(0.5; 0.6667;
1; 1)
(1; 1; 1; 1)
Table 12. Pair wise comparison in level 2 - Operating Factors Cluster III
Enables COL PR CL PLC
COL (1; 1; 1; 1) (8; 8.5; 9; 9) (8; 8.5; 9; 9) (8; 8.5; 9; 9)
PR (0.1111; 0.1111; 0.1176; 0.125) (1; 1; 1; 1) (1; 1; 1.5; 2) (1; 1; 1.5; 2)
CL (0.1111; 0.1111; 0.1176; 0.125) (0.5; 0.6667; 1; 1) (1; 1; 1; 1) (1; 1; 1.5; 2)
PLC (0.1111; 0.1111; 0.1176; 0.125) (0.5; 0.6667; 1; 1) (0.5; 0.6667; 1; 1) (1; 1; 1; 1)
Table 13 Random index (RI) of random matrices.
n 3 4 5 6 7 8 9
RI(n) 0.58 0.9 1.12 1.24 1.32 1.41 1.45
Source: [138]
INTERNATIONAL JOURNAL OF CIRCUITS, SYSTEMS AND SIGNAL PROCESSING DOI: 10.46300/9106.2021.15.137 Volume 15, 2021
E-ISSN: 1998-4464 1280
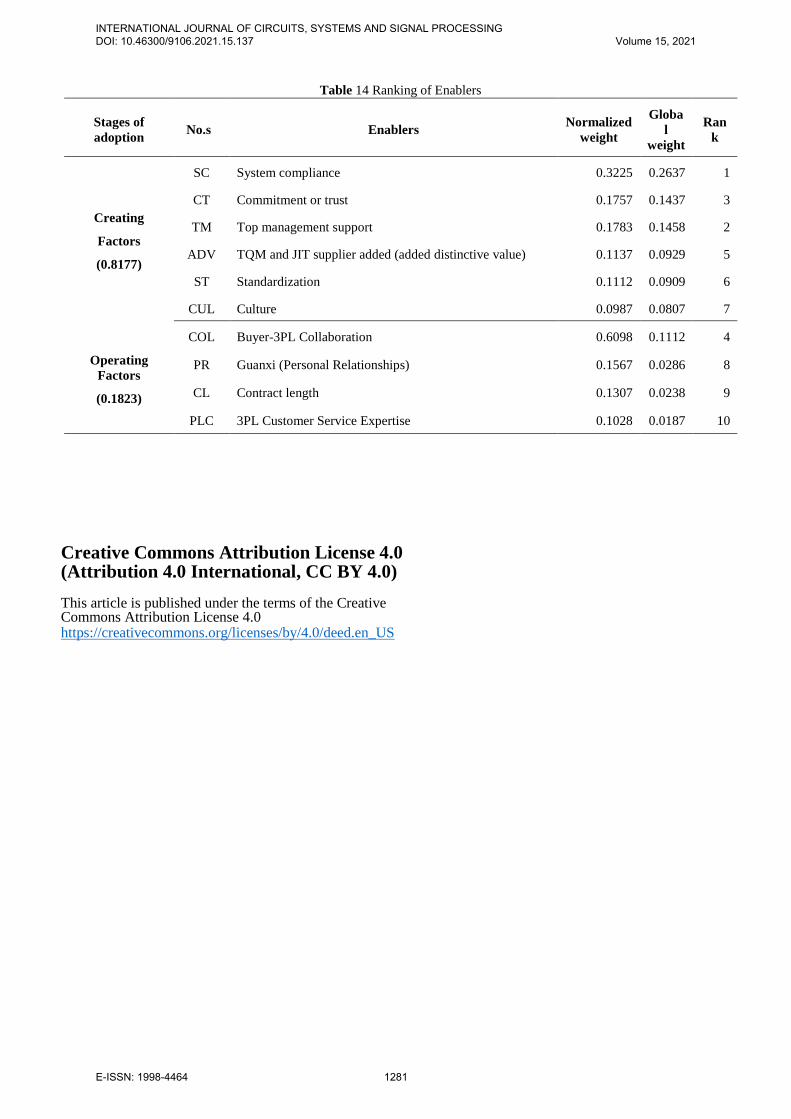
Table 14 Ranking of Enablers
Stages of
adoption No.s Enablers
Normalized
weight
Globa
l
weight
Ran
k
Creating
Factors
(0.8177)
SC System compliance 0.3225 0.2637 1
CT Commitment or trust 0.1757 0.1437 3
TM Top management support 0.1783 0.1458 2
ADV TQM and JIT supplier added (added distinctive value) 0.1137 0.0929 5
ST Standardization 0.1112 0.0909 6
CUL Culture 0.0987 0.0807 7
Operating
Factors
(0.1823)
COL Buyer-3PL Collaboration 0.6098 0.1112 4
PR Guanxi (Personal Relationships) 0.1567 0.0286 8
CL Contract length 0.1307 0.0238 9
PLC 3PL Customer Service Expertise 0.1028 0.0187 10
Creative Commons Attribution License 4.0 (Attribution 4.0 International, CC BY 4.0)
This article is published under the terms of the Creative Commons Attribution License 4.0 https://creativecommons.org/licenses/by/4.0/deed.en_US
INTERNATIONAL JOURNAL OF CIRCUITS, SYSTEMS AND SIGNAL PROCESSING DOI: 10.46300/9106.2021.15.137 Volume 15, 2021
E-ISSN: 1998-4464 1281