the influence of soft spectral components on the structure and stability of warm absorbers in active...
TRANSCRIPT

arX
iv:1
201.
5435
v1 [
astr
o-ph
.HE
] 26
Jan
201
2Mon. Not. R. Astron. Soc.000, 000–000 (0000) Printed 27 January 2012 (MN LATEX style file v2.2)
The influence of soft spectral components on the structure andstability of warm absorbers in AGN
Susmita Chakravorty1,2,3 ⋆, Ranjeev Misra1∗, Martin Elvis3∗, Ajit K. Kembhavi1∗,Gary Ferland4∗1IUCAA, Post Bag 4, Ganeshkhind, Pune 411 007, India;2Astronomy Department, Harvard University, Cambridge, MA 02138, USA;3Harvard-Smithsonian Center for Astrophysics, Cambridge, MA 02138, USA;4Department of Physics and Astronomy, University of Kentucky, Lexington, KY 40506, USA.
27 January 2012
ABSTRACT
The radiation from the central regions of active galactic nuclei, including that from theaccretion disk surrounding the black hole, is likely to peakin the extreme ultraviolet∼ 13 −
100 eV. However, due to Galactic absorption, we are limited to constraining the physicalproperties - black hole mass and accretion rate - from what observations we have below∼10 eV or above∼ 100 eV. In this paper we predict the thermal and ionization states of warmabsorbers as a function of the shape of the unobservable continuum. In particular we modelan accretion disk atkTin ∼ 10 eV and asoft excess at kTse ∼ 150 eV. The warm absorber,which is the highly ionized gas along the line of sight to the continuum, shows signaturesin the ∼ 0.3 − 2 keV energy range consisting of numerous absorption lines and edges ofvarious ions, some of the prominent ones being H- and He-likeoxygen, neon, magnesium andsilicon. We find that the properties of the warm absorber are significantly influenced by thechanges in the temperature of the accretion disk, as well as by the strength of thesoft excess, asthey affect the optical depth particularly for iron and oxygen. These trends may help developa method of characterising the shape of the unobservable continuum and the occurrence ofwarm absorbers.
Key words:
1 INTRODUCTION
Accretion of matter onto a supermassive black hole and theconversion of the gravitational energy into radiation, viaanaccretion disk, is the main source of energy output in ac-tive galactic nuclei (AGN). The radiation from AGN is likelyto peak in the extreme ultraviolet (EUV)∼ 10 − 100 eV(Lynden-Bell 1969; Pringle, Rees & Pacholczyk 1973; Shields1978; Shakura & Sunyaev 1973; Netzer 1985). However, Galacticabsorption of EUV light results in a ‘blind spot’ in the energy range13− 100 eV (∼ 912− 50A, marked as “unobserved” in Figure 1)introducing an uncertainty in the shape of the spectral energy distri-bution (SED) of AGN, just where it is expected to peak. Attemptshave been made to reconstruct the SED from observations avail-able below∼ 10 eV and above∼ 100 eV (Siemiginowska et al.1995; Sobolewska et al. 2004a,b, and references therein). This un-observed part of the SED is most effective at ionizing gas (which is
⋆ E-mail: [email protected] (SC);[email protected] (RM); [email protected] (AK);[email protected] (MA); [email protected] (GF)
the very reason it also gets absorbed by the Galaxy). Hence the con-tinuum will influence the intervening line of sight gas, local to theAGN, and the resultant absorption and emission line strengths ofthe various ions seen in far ultraviolet (FUV) and the Balmercon-tinuum can be used to constrain the SED, as discussed by Netzer(1987).
At the high energy end of the ‘blind spot’, i.e. in the soft X-ray(0.1 - 10 keV), observations of most AGN reveal that, for a major-ity, the SED from 2 - 10 keV is well approximated by a power-lawf(ν) ∼ ν−α with spectral indices∼ 0.8. The join between theEUV (2500A) and the soft X-ray (2 keV), αOX , is steeper, withtypical values of∼ 1.2 for Seyfert 1 galaxies (Netzer 1993). Henceextending the X-ray power-law to the ultraviolet (UV) cannot ex-plain the observed flux (but see Laor (1997)). An ionizing contin-uum with two power-law components, a steep one for the join be-tween EUV and soft X-ray, and a flatter one for the soft X-ray SED,can represent the overall shape of the AGN spectra in the energyrange3 eV− 2 keV.
However, such an SED is not a physical model and doesnot resemble certain specific features expected in this energyrange. In particular, the proposed accretion disk, whose in-
c© 0000 RAS

2 Chakravorty et al.
nermost stable orbit should have a temperature of∼ 13 eV,for a black hole of mass108M⊙ and an accretion rate ofm/mEdd = 0.1 (Shakura & Sunyaev 1973; Frank, King & Raine2002), is not included. Another spectral component whichwould remain unaccounted for by a simple two power-lawcontinuum is thesoft excess which is seen in most AGN below2 keV. The soft excess could be a Comptonised disk compo-nent (Czerny & Elvis 1987), an additional quasi-blackbody(Crummy et al. 2006; Korista, Ferland & Baldwin 1997;Ross & Fabian 1993, 2005) or due to relativistic broadenedabsorption features (Gierlinski & Done 2004). Such spectralcomponents are likely to have important effects on the nature ofthe absorbing gas along the line of sight towards the centralengineof the AGN.
In the 0.3 - 1.5 keV soft X-ray spectra of about half ofall Seyfert 1 galaxies (Nandra & Pounds 1994; Reynolds 1997;George et al. 1998) and quasars (Piconcelli et al. 2005) one canfind signatures of photoionized gas called “warm absorbers”(here-after WAs, Halpern (1984)). These signatures are, often, ab-sorption lines and edges from highly ionized species, such asOVII, OVIII, FeXVII, NeX, CV and CVI (Collinge et al. 2001;Kaastra et al. 2002; Kinkhabwala et al. 2002; Blustin et al. 2003;Krongold et al. 2003; Netzer et al. 2003; Turner et al. 2004).The typical column density observed for the gas isNH ∼1022±1 cm−2. The ionization parameterξ of the WA spans a range∼ 10 − 1000 erg cm s−1 corresponding to gas temperatures of104 − 106.5 K. Some authors claim that the WA is made upof discrete thermodynamic phases in near pressure equilibrium(Andrade-Velazquez et al. 2010, and references therein), whileothers (Ogle et al. 2004; Steenbrugge et al. 2005; Behar 2009) be-lieve that the gas has a continuous distribution of temperature andpressure.
In this temperature range heating and cooling processes arerespectively dominated by photoionization and recombination ofhigher ionization states of heavier elements. These processes re-sult in local regions of thermal stability in this otherwiseunstabletemperature range (Krolik et al. 1981; Gehrels & Williams 1993;Hess et al. 1997). Chakravorty et al. (2009) showed that the na-ture of the WA is strongly influenced by the chemical compositionof the absorbing gas. It was shown that the abundance of iron andoxygen, which have important atomic transitions in the sub-keVenergy range are particularly important.
To obtain the equilibrium conditions for a gas with an assumedset physical conditions, we have used the publicly available pho-toionization codeCLOUDY1version C07.02 (hereafter C07), seeFerland (1998). CLOUDY calculates the ionization equilibriumconditions by solving the energy and charge conservation equa-tions under the assumption that all the atomic processes have hadtime to reach a steady state. Any stable photoionised gas will lieon the thermal equilibrium curve (hereafter referred to as the sta-bility curve) where heating balances cooling. The stability curveof temperature (T ) against pressure (ξ/T ), whereξ is the ioniza-tion parameter (see below for definition), is often used to studythe nature of the WA. Gas lying off the stability curve will heator cool until reaching the curve. If the curve has kinks that pro-duce multiple stable values at fixedξ/T , then the WA can havemultiple temperature phases in pressure equilibrium. The shapeof the stability curve depends on the SED of the ionizing contin-uum and the chemical abundance of the gas (Reynolds & Fabian
1 URL: http://www.nublado.org/
1995; Krolik & Kriss 2001; Komossa & Meerschweinchen 2000;Komossa & Mathur 2001; Chakravorty et al. 2008, 2009).
In this paper we investigate the behaviour of the stability curveas a function of thedisk blackbody andsoft excess both to under-stand the role of these spectral components on the nature of the WA,and to examine whether the observable parameters of the WA candiagnose the shape of the AGN continuum in the EUV ‘blind spot’.In Section 2 we describe the different models of the AGN contin-uum that we are interested in and use these SEDs to study theireffect on the stability curves in Section 3. We investigate the causesof the variations in the stability curves in Section 4 by studying theheating and ionization fractions of the elements and ions which areresponsible for determining the nature of the WA. Section 5 exam-ines the relevance of a few other physical parameters, like the X-rayslope of the ionizing continuum and the abundance of the absorb-ing gas, (also discussed in Chakravorty et al. 2009) in the contextof the present study. The multi-phase nature of the WA is discussedin Section 6 and we conclude our results in Section 7.
2 THE AGN CONTINUUM
The 2 - 10 keV X-ray spectra of most of the observed active galac-tic nuclei (AGN) can be modeled satisfactorily using a power-lawf(ν) ∼ ν−α where the spectral indexα for most AGN lie inthe range0.7 < α < 0.9 (Wilkes & Elvis 1987; Grupe et al.2006; Lopez et al. 2006). The optical depthτ = 1 for photonsat 0.2 keV with a typical Galactic hydrogen column density ofNH = 3 × 1020 cm−2. Extinction is a steeply rising function ofcolumn density, e. g.τ = 2 at 0.2 keV for NH = 5 × 1020 cm−2.Thus, we lack observational constraints on the evolution ofthe X-ray power-law at lower energies. However, for most AGN, the UVflux is found to be much higher than what a simple extrapolation ofthe X-ray power-law to lower energies would predict (Elvis et al.1994; Zheng et al. 1997; Shang et al. 2005), but see Laor (1997)for exceptions. The slopeαOX , defined as
αOX = −0.384 log
[
f(2keV )
f(4.7 eV = 2500A)
]
(1)
by Tananbaum et al. (1979), is conventionally used to parametrizethe nominal power-law between the UV and soft X-ray bands. Theobserved range is1 . αOX . 2 (Stalin et al. 2009; Green et al.2009, and references therein).
The overall shape of the AGN continuum in the energy rangeof ∼ 4.7 eV(2500A) − 10 keV can, thus, be represented as a sumof two power-law components
f(ν) ∼[
ν−α + A1ν−αs
]
e− ν
νmax , for E(= hν) ≥ 4.7 eV, (2)
whereαs(> 0) is the spectral index of a steep soft component andA1 is the relative normalization factor to realize the desiredvaluesof αOX (dotted-and-dashed curve in Figure 1.). Chakravorty et al.(2009) had used such an SED withEmax = hνmax = 200 keV,and this value is maintained throughout this paper, as well.Resultsfrom the Swift/BAT (Burst Alert Telescope) hard X-ray sky survey(Tueller et al. 2008) show that, of the brightest few dozen AGN,for whichEmax can be determined, the cut-off spans the range 50to 450keV. In Chakravorty et al. (2009) we have shown that in therange50 keV < Emax < 400 keV, the variation inEmax does nothave any significant effect on the nature of the warm absorber. Forenergies lower than4.7 eV Chakravorty et al. (2009) followed thecut-off scheme
f(ν) ∼ ν−0.5 for 2.8 ≤ E(= hν) < 4.7 eV
c© 0000 RAS, MNRAS000, 000–000

Soft spectral components & warm absorber 3
Figure 1. Comparison between various ionizing continua : the brokenpower-law (Equation 2, dotted-and-dashed line) and more realistic SEDshavingdisk blackbody andsoft excess components (Equations 4 and 5). Forall the curvesα = 0.8 andαOX = 1.2. Using Equation 4 we draw thesolid curve withη = 0.0 and the dashed curve withη = 1.0, while thedotted curve is drawn using Equation 5 withη′ = 1.0. The temperature ofthe innermost ring of the accretion disk isTin = 10 eV and temperaturecorresponding to thesoft excess isTse = Tc = 150 eV. See text for furtherdetails.
∼ ν−1.0 for 0.12 ≤ E(= hν) < 2.8 eV
∼ ν2.5 for E(= hν) < 0.12 eV (3)
This scheme is similar to that described by Mathews & Ferland(1987). However, a SED described by Equations 2 and 3 may some-times be an inadequate description for the AGN ionizing continuumbecause it fails to represent the signature of the accretiondisk at∼ 10 eV or thesoft excess component.
2.1 Disk blackbody
Multiwavelength observations suggest that the AGN continua peakin the EUV energy band and emission here usually dominatesthe quasar luminosity (Neugebauer et al. 1979; Shields 1978;Malkan & Sargent 1982; Elvis et al. 1986; Czerny & Elvis 1987;Mathews & Ferland 1987; Laor et al. 1990; Siemiginowska et al.1995; Zheng et al. 1997; Sobolewska et al. 2004a,b). This spec-tral component, often referred to as the “Big Blue Bump”, is con-sidered to be the signature of the presence of an accretion diskas discussed by Lynden-Bell (1969); Pringle, Rees & Pacholczyk(1973); Shields (1978); Shakura & Sunyaev (1973).
According to the standard theory of accretion disks byShakura & Sunyaev (1973), the emission from the disk can be mod-eled as a sum of local blackbody radiations emitted from annuli ofthe disk at different radii. The temperature of all the subsequentrings can be estimated from the theory if the temperatureTin ofthe innermost ring of the accretion disk is known, which in turn isrelated to the one-fourth power of the mass of the central blackhole and to the fourth power of its accretion rate. Thus for thesame accretion rate,Tin changes by only a factor of 3 while theblack hole mass spans a range of about two order of magnitude.As
such, the resultant shape of the “Big Blue Bump” peaks between∼ 10 − 100 eV for the range of black hole masses and accretionrates typical of Seyfert galaxies.
Studies of high redshift quasars show that their UV-EUVSEDs are consistent with the standard theory of accretion disks(Bechtold et al. 1994; Page et al. 2004a,b; Shang et al. 2005).However, typically, the quasars have higher mass (108 . MBH .
5 × 10¹⁰M⊙ Shang et al. 2005; Bechtold et al. 1994) and higheraccretion rates (Bechtold et al. 1994). Thus, for the same accretionrates, we can expect the “Big Blue Bump” in quasars to be peakingat lower energies than that in Seyferts which would typically resultin steeperαOX ∼ 1.8 (Bechtold et al. 1994) for the quasars, ascompared to 1.2 (Netzer 1993) for the Seyferts.
A standard model for the spectral component from the ac-cretion disk is available asdisk blackbody (Mitsuda et al. 1984;Makishima et al. 1987) in XSPEC2 (Arnaud 1996). We have usedversion 11.3 of XSPEC to generate thedisk blackbody spectralcomponentfdbb(ν) to be used in the construction of the realisticAGN continuum (the third term in Equations 4 and 5). The solidblack line in Figure 1 shows a SED which includes a “Big BlueBump” with Tin = 10 eV. In this paper we explore “Big BlueBumps” in the range10 ≤ Tin ≤ 30 eV corresponding to108.47 ≤MBH ≤ 106.56M⊙ for an accretion rate ofm/mEdd = 0.1. Thisrange of accretion disks parameters pertain to Seyfert galaxies orlow mass and low accretion rate quasars. We do not explore thepa-rameter range for higher mass quasars because for themTin wouldmove to lower energies and suchdisk blackbodies are less likely toinfluence the nature of the WA.
2.2 Soft excess
X-ray observations of AGN with ROSAT and XMM-Newtonoften show that if the 1 - 10 keV power-law is extended tolower energies to fit the observed spectra of type 1 AGN,some unaccounted for excess intensity is usually seen atE < 1 keV (Elvis, Wilkes & Tananbaum 1985; Brinkmann 1992;Buehler et al. 1995; Pounds & Reeves 2002). This excess hascome to be known as thesoft excess component. A blackbody withtemperatureTse ∼ 100−200 eV (i.e. peaking at∼ 282−564 eV)is often a good fit to thesoft excess (Matsumoto et al. 2004;Piconcelli et al. 2005; Porquet et al. 2004; Vignali et al. 2004,and references therein). The same authors show that the ratio ofthe soft excess luminosity to power-law luminosity, usually be-tween 0.1 - 10 keV varies from object to object from 0.04 in Mkn304 (Piconcelli et al. 2005) to& 1.0 in Ark 564 (Vignali et al.2004). The simple ‘sum of blackbodies’ model for the accretionsdisk is a satisfactory qualitative representation of the UVSED witha range of parameter values to cover the observed AGN proper-ties. However, all AGN disks, having supermassive black-holes attheir centres, are too cold to reach soft X-rays at∼ 0.5 keV. Moresophisticated modifications of this model (Czerny & Elvis 1987;Korista, Ferland & Baldwin 1997) or an additional spectral com-ponent is required to explain thesoft excess.
2.2.1 Blackbody soft excess
A theoretical representation of thesoft excess as a blackbody isa simplified version of the Ross & Fabian (1993, 2005) model forthe soft excess component which owes its origin to the reflection
2 http://heasarc.gsfc.nasa.gov/docs/xanadu/xspec/
c© 0000 RAS, MNRAS000, 000–000

4 Chakravorty et al.
of the power-law component of the AGN spectrum from the ac-cretion disk. Thus, in this model the X-ray power-law photons arereprocessed, instead of the ones from the accretion disc.
The general SED for the ionizing continuum including ablackbodysoft excess component can be given as
f(ν) ∼[
{ ν−α + η2π h
c2ν3
exp(h ν/kB Tse) − 1}
+ A2fdbb(ν, Tin)]
e− ν
νmax . (4)
The first term in the above equation represents the X-ray power-lawwith spectral indexα. The second term is thesoft excess compo-nent, as a blackbody distribution of photons whereTse = 150 eVis the temperature of the blackbody andη determines the ratio ofluminosity in thesoft excess component to that in the power-lawbetween 0.1 - 10 keV. The third term in Equation 4 is thediskblackbody component which is parametrised byTin, the temper-ature of the innermost ring of the accretion disk.A2 is the nor-malisation factor to attain the desired value ofαOX . Unless oth-erwise mentioned, throughout this paper, we have usedα = 0.8andαOX = 1.2, Emax = hνmax = 200 keV. For numerical con-venience we put a cut-off forf(ν) at E = hν = 0.12 eV belowwhich the flux drops off asν2.5.
In Figure 1 both, the black solid SED and the blue dashedSED are drawn using Equation 4. For both SEDs,Tin = 10 eV sothat the peak of the diskblackbody lies at∼ 30 eV. The solid linerepresents a SED which does not have anysoft excess component,i. e. , η = 0. On the other hand, the blue dashed SED withη =1.0 has a moderately strongsoft excess. See further discussions inSection 3.3.1
2.2.2 Comptonisation by ∼ 150 eV plasma
Korista, Ferland & Baldwin (1997) discuss the puzzle that manyquasars which show soft ionizing continuum, would have an in-sufficient number of photons at the 54.4 eV He II edge to gen-erate the observed strength of He II emission seen in the sameobjects. To explain the strength of the He II line in Mrk 335,Korista, Ferland & Baldwin (1997) invoked a “double peaked”UV-EUV continuum where the second “bump” peaks at∼ 54 eV andcontains energy comparable to the classical UV bump at loweren-ergies (∼ 10 eV). The
A model, where the photons from the accretion disk are up-scattered by inverse Comptonization due to energetic electrons,does a better job of qualitatively satisfying the required strength ofthe UV-EUV SED for objects like Mrk 335. Czerny & Elvis (1987)have shown that the models which account for the electron scatter-ing of the accretion disk photons are better than the simple ‘sum ofblackbodies’ model. Similar thermal Comptonization models havebeen worked out by Lightman & Zdziarski (1987); Coppi (1992);Haardt (1993); Coppi (1999) and Beloborodov (1999) among oth-ers.
The thermal Comptonization model of Lightman & Zdziarski(1987) has been used by Zdziarski et al. (1996) and extended byZycki (1999) and their model is included in XSPEC 12.5 (Arnaud1996) asnthcomp. We have usednthcomp, where we have assumedthat the seed photons coming from the accretion disk (modeled asdisk blackbody) are reprocessed by the thermal plasma to generatesufficient photons at sub-keV to mimic thesoft excess, usually ob-served in AGN. The high energy cut-off for the resultingsoft excessfeature is parametrised by the electron temperatureTc, whereas thelow energy rollover is dependent on the effective temperature of
the seed photons from the accretion disk, which in this case isparametrised byTin. Between the low and high energy rolloversthe shape of the spectrum is not necessarily a power law, but can beparametrised by an asymptotic power law indexΓc which wouldphysically be determined by the combination of electron scatter-ing optical depth and electron temperature, i.e. by the Comptony-parameter (Rybicki & Lightman 1986). Beloborodov (1999)hadshown that there is a simple relationΓc ≈ 9
4y−2/9 between the
power-law index and the Compton y-parameter. Thus, in our model,Γc, used as an input, gives a measure of the extent of Compton re-processing; i.e. larger the value ofΓc, lesser is the number of pho-tons reprocessed from thedisk blackbody component to the highenergy photons at∼ Tc.
The SED with this alternative model for thesoft excess fc(ν),generated bynthcomp, can be written as
f(ν) ∼[
{ ν−α + η′fc(ν, Tin, Tc,Γc) }
+ A2fdbb(ν, Tin)]
e− ν
νmax , (5)
whereη′ is the ratio of luminosity of thesoft excess componentfor E(= hν) ≥ 0.3 keV to the luminosity of the power-lawcomponent in the energy range0.1 − 10 keV. The orange dottedcurve in Figure 1 is drawn using Equation 5 withTin = 10 eV,Tc = 150 eV η′ = 1.0 and Γc = 1.7. Note that atE =54.4 eV (i.e. log ν = 16.12) the orange dotted SED has 1.4 timeshigher flux than the blue dashed SED due to a blackbodysoft ex-cess and this factor grows to 13.1 atE = 100 eV. Thus SEDs likethe orange dotted line are better suited to explain observations ofobjects like Mrk 335 or Mrk 478. See further discussions on thisissue in Section 3.3.2.
Chakravorty et al. (2009) showed that the WA temperaturerange,104.5 < T < 106.5 K, is strongly influenced by the chemi-cal composition of the absorbing gas, particularly by the abundanceof iron and oxygen which have important atomic transitions in thesub-keV energy range where thesoft excess component is likelyto have maximum effect. In the following sections we shall exten-sively investigate the effect of a SEDs, given by Equations 4and 5,on the nature of the WA, as a function of the shape of the accretiondisk component parametrised by the value ofTin, and the strengthof thesoft excess feature parametrised byη or Γc andη′.
3 STABILITY CURVES ANALYSIS
Studies of WA variability in response to continuum changesshow that it is reasonable to assume the WA to be in ion-ization and thermal equilibrium as observed for NGC 985(Krongold et al. 2005a), NGC 3783 (Krongold et al. 2005b),NGC 5548 (Andrade-Velazquez et al. 2010). The thermal and ion-ization equilibrium is governed by heating due to photoionizationand cooling due to line emission and collisional recombination (ra-diative and dielectronic).
We model the WA as an optically thin, plane parallel slabof Solar metallicity gas (as given by Allende Prieto et al. (2001,2002) for C and O, by Holweger (2001) for N, Ne, Mg, Si and byGrevesse & Sauval (1998) for the remainder of the first thirtyele-ments) with column densityNH = 1022 cm−2. The absorbing gasis assumed to be illuminated by an ionizing continuum given byEquation 4 or Equation 5 and the ionization state of the gas can bedescribed by specifying the ratio of the ionizing photon fluxto thegas density through anionization parameter (see Equation 6).
c© 0000 RAS, MNRAS000, 000–000

Soft spectral components & warm absorber 5
Figure 2. Stability curves demonstrating the advantage of usingξP as compared toξ. The dotted-and-dashed stability curves in both the panelsare drawnusing the broken power-law continuum (Equation 2), whereasthe solid ones are generated for a SED given by Equation 4 withη = 0.0 andTin = 10 eV.Curves drawn withξ (left panel) are separated in the phase space even if the WA inboth the cases have similar nature. On the other hand, the curves drawnusing the alternative definition,ξP , of the ionization parameter (right panel), are almost identical showing the true nature of the WAs. See text in Section 3.1for further details.
3.1 Normalising the ionisation parameter
The photoionization state of the WA can be parametrised by theionization parameter which is the ratio of the ionizing photon fluxto the gas density (Tarter, Tucker & Salpeter, 1969):
ξ = Lion/nH R2 =
13.6 keV∫
hν0=13.6 eV
Lν
nHR2dν [erg cm s−1], (6)
whereLion is the luminosity between13.6 eV− 13.6 keV (i.e 1−103 Rydberg). Henceξ/T ∼ L/pR2, p being the gas pressure inthe WA.
This definition has a certain drawback which is demonstratedby the stability curves on the left panel of Figure 2. The dotted-and-dashed curve is for a gas illuminated with the broken power-law ionizing continuum (Equation 2) and the solid curve is gen-erated with a more realistic SED given by Equation 4 having anaccretion disk component withTin = 10 eV, but no soft excess(η = 0.0). From Figure 1 we can see that the SED including theaccretion disk component (the solid black line) has∼ 50 timesmore photons at13.6 eV (1 Rydberg) than the dotted-and-dashedspectra (Equation 2), although they have similar flux at 100 eV.This would result in very different values ofξ in the two casesbut very similar WAs, since the WA properties are determinedbythe photon distribution in soft X-ray (E & 100 eV) and not byphotons with energyE << 100 eV. The kinks in any stabilitycurve are a result of the interplay between the various heating andcooling agents responsible for maintaining the gas at a state ofthermal equilibrium (Chakravorty et al. 2008, 2009). The stabilitycurves on the left panel of Figure 2 have almost identical shape for4.4 < log T < 6.5, indicating that they have WAs with identicalthermal properties and state of ionization. However, they are sepa-
rated from each other, by a mere horizontal shift inlog(ξ/T ) be-cause of the differentξ values predicted by the two different SEDs.Thus, ξ is a relatively poor parametrization of the nature of theWA. Such a problem with the standard definition of the ionizationparameter has been acknowledged by other authors as well. For ex-ample, Chelouche & Netzer (2005, and references therein) use anionization parameterUx which considers the ionizing flux only be-tween540 eV to 10 keV.
To circumvent this problem we use a normalisation scheme,appropriate for this paper, as described in the following. All theSEDs considered in this paper (except for ones in Section 5.1) havea common power-law in addition to the diskblackbody and/or thesoft excess component. Hence we define
ξP =LP
nH R2=
1
nH R2
4πR2
200keV∫
hν0=13.6 eV
ν−α dν
(7)
whereLP is a constant luminosity due to the soft X-ray power-law componentf(ν) ∼ ν−α (with α = 0.8) in the energy rangeE = hν = 13.6 eV − 200 keV. Thus, ξP is the ratio of theionizing flux, due only to the power-law component in the energyrange13.6 eV to 200 keV, to the gas density. For any SED givenby Equations 2, 4 or 5 there would be a unique factorξ/ξP forthe samenH R2. The stability curves corresponding to the ionizingcontinua given by Equations 2, 4 or 5 are calculated byCLOUDYtaking the entire SEDs into account, following which their x-axis(log(ξ/T )) is divided by the unique (to each SED) factorξ/ξP gen-erating a normalised stability curve in thelog T - log(ξP /T ) plane.The advantage of such a normalisation is shown in the right panel ofFigure 2, where the stability curves overlap closely, demonstratingthe true physical scenario of two very similar WAs. Note thatthese
c© 0000 RAS, MNRAS000, 000–000

6 Chakravorty et al.
are the same stability curves which are seperated by the horizon-tal shift in the left panel, as discussed above. This normalisationscheme is used for all subsequent figures in the paper except forFigure 9. In addition to the SEDs which determine the physicsofthe respective stability curves, the top panels of Figures 3,4 and 5also include the constant power-law component (magenta, long-and-short-dashed curve) which is used to normalise the stabilitycurves so that they can be plotted in terms oflog(ξP /T ).
It is to be noted that while calculating the thermal and ioniza-tion properties of the WA,CLOUDY uses the entire SEDs, includingall three spectral components (namely thedisk blackbody, thesoftexcess and the X-ray power-law), described by Equations 4 and 5.The introduction ofξP and normalisation of the stability curves isonly for the convenience of demonstration of the stability curvesand their associated properties. Use ofξP merely introduces anoverall horizontal shift in these distributions. Further,note that anygiven range inlog(ξ/T ) would correspond to an exactly equalrange inlog(ξP/T ) and vice versa.
3.2 Disk-blackbody
The top panel of Figure 3 shows the ionizing continua which in-clude thedisk blackbody and the power-law components (η = 0,Equation 4). AsTin is increased from10 eV to 30 eV, the peakof the flux distribution moves from∼ 30 − 90 eV. Photons atE . 90 eV affect only the lower ionization species of the absorb-ing gas. The resulting WA should show differences only in thena-ture of the lower ionization phases, and should have very similarhigher ionization states. We shall discuss this issue further in Sec-tion 4.
Corresponding stability curves are shown in the bottom panelof Figure 3. A hotterdisk blackbody lowers the Compton temper-ature branch and increases the temperature of the bottom branch.However, in the5 < log T < 6.5K temperature range the WAs,the stability curves are independent of the value ofTin, i. e. , unaf-fected by the spectral component due to the accretion disk. How-ever, the lower temperature (log T < 5) part of the stability curvesundergo remarkable changes with the increase inTin; for the samevalue ofξP , the gas attains a higher temperature, the stability curvebecomes more stable and any possibility of multi-phase existencewith higher ionization states is lost. See Section 6 for further dis-cussion on this issue.
3.3 Soft excess
3.3.1 Blackbody soft excess
The top panel of Figure 4 shows the ionizing continua given byEquation 4 with values ofη = 0.0, 1.0, 3.0, representing increas-ing strengths of thesoft excess component for a fixed value of theblackbody temperatureTse = 150 eV. The corresponding stabil-ity curves in the bottom panel show a remarkable enhancementofthe stablelog(ξP /T ) range from∼ 0.20 through 0.41 to 0.63dex for the105 K absorber, as the strength of thesoft excess isincreased fromη = 0.0 through 1.0 to 3.0. The106 K phase re-mains unchanged through the variation ofη. In theη = 3.0 casehowever, the transition from the∼ 105 to 106 K phase is smoothi.e. with no distinct unstable region separating the two temperatureregimes. Such a result implies that stronger thesoft excess compo-nent in the spectra, greater is the probability of finding a∼ 105 Kabsorber, since the stable region then becomes less susceptible toluminosity variations in the AGN. However, the possibilityof the
Figure 3. The SEDs in the top panel are constituted by two spectral com-ponents, a X-ray power-law and a EUVdisk blackbody. The curves are fordifferent values of the temperatureTin of the innermost ring of the accre-tion disk.α = 0.8 andαOX = 1.2 for all the SEDs. We have includedthe constant power-law (magenta, long-and-short-dashed curve) which isused to normalise the stability curves so that they can be plotted in termsof log(ξP /T ). Important energy values including the upper energy cut-off(Emax = 200 keV) and the range of definition forαOX (2500A and 2keV) have been marked and labeled. The bottom panel shows thestabilitycurves corresponding to the ionizing continua shown in the top panels.
105 K gas being in pressure equilibrium with the other WA phasesis significantly reduced. We shall return to these points in Section 6.
To find a typical value ofη implied by X-ray observations ofAGN we refer to two examples, namely a typical Seyfert 1 galaxyNGC 5548 and a narrow line Seyfert 1 galaxy IRAS13349+2438.Andrade-Velazquez et al. (2010) analysed the 800 ks Chandragrating spectra of NGC 5548 and their best fit parameters for thesoft X-ray continuum is a power-law withα = 0.6 and a blackbodywith Tse = 110 eV. The relative normalisation of the two com-
c© 0000 RAS, MNRAS000, 000–000

Soft spectral components & warm absorber 7
Figure 4. Top panel : SEDs which have asoft excess component de-scribed by a blackbody distribution (see Equation 4) with temperatureTse = 150 eV. The different SEDs are for different values ofη, i. e. , fordifferent strengths of thesoft excess component.α = 0.8 andαOX = 1.2for all the SEDs. The magenta, long-and-short-dashed curveis the same asin the top panel of Figure 3. We have included the energy values 1300Aand120 eV to guide the eye in the context of observations of Mrk 478 (seetext in Section 3.3.2)Bottom panel : The stability curves corresponding tothe ionizing continua shown in the top panels. With the growing strength ofthe soft excess component, there is significant increase in the range ofξPover which thermally stable warm gas at∼ 105 K can exist.
ponents results inη ∼ 1.2. Similarly, Holczer et al. (2007) haveanalysed the 300 ksChandra data for IRAS13349+2438 and havereported the spectral parameters for the best-fit ionizing continuumcomprising of a X-ray power-law withα = 0.9 and a blackbodywith Tse = 105 eV. From their results we calculateη to be∼ 2.58.In both cases the values ofη is well within the range consideredhere (0 - 3).
TheTse, observed for a large number of type I AGN, lies in
the small range100− 200 eV. We have checked whether the influ-ence of thesoft excess component is modified when the blackbodytemperature is varied across this range. Results showed that the sta-bility curves remain unaffected by such variations, e.g. the range inlog(ξP /T ) for the stable105 K gas changes by merely 0.06 dex asTse varies from 100 eV to 200 eV.
3.3.2 Comptonised soft excess
The blackbodysoft excess sometimes turns out to be inadequatein explaining the observations. For example, the SED for Mrk478 may be 1-3 times brighter inνLν at E ∼ 120 eV than itis at 1300A (∼ 10 eV) (Gondhalekar et al. 1994; Marshall et al.1996). We find that a blackbodysoft excess cannot satisfy such acondition even with a relatively high normalisation ofη = 3.0(top panel, Figure 4). We want to investigate if the alternative de-scription of thesoft excess component, namely thesoft excess dueto thermal Comptonisation, can account for a SED similar to thatseen in Mrk 478, and to see what are its effect on the WA.
Spectra generated by Equation 5 with fixed values ofTc =150 eV, Tin = 10 eV and η′ = 1.0 are drawn in the toppanel of Figure 5 for different values ofΓc. For comparison,we have also drawn the continuum with nosoft excess (Figure 5solid curves). The continuum withΓc = 2.0 satisfies the con-ditions required by observations of Mrk 478 as mentioned byKorista, Ferland & Baldwin (1997).
The influence of a thermal Comptonisationsoft excess com-ponent on the stability curves is shown in the bottom panel ofFig-ure 5. We see again, that the range oflog(ξP/T ) for the stable105 K branch is increased in width from∼ 0.2 dex to 0.48 dexasη′ goes from 0 to 1.0, independent of the value ofΓ, facilitat-ing the presence of a stable WA at these temperatures and thatthedifferent phases of the WA lose the possibility of existing in pres-sure equilibrium as the strength of the soft excess component isincreased.
The thermal Comptonised and the blackbody models of thesoft excess result in similar WAs. For example,η = 1.0 curve(dashed; lower panel of Figure 4) have stable ranges oflog(ξP /T )at 105 and 106 K similar to that of theη′ = 1.0 curves (the dot-ted and the long-dashed forΓ = 1.7 and 2.0 respectively; lowerpanel of Figure 5). The stability curves withη′ = 1.0 do have aslightly smoother rise from the∼ 104.2 to 105 K with no distinctintermediate unstable phase, because they have more flux in theE = 10− 100 eV range for the samesoft excess strength.
4 CAUSE OF EXTENDED STABLE REGION : HEATINGAGENTS AND ION FRACTIONS
We have seen that the disk blackbody and thesoft excess radia-tion at . 0.5 keV significantly influence the stability curve, im-plying that these components are important for shaping the ionicand thermal state of the WA (Section 3). Changes in thedisk black-body affect the low temperaturearm (log T ∼ 4.5) of the stabil-ity curve, whereas thesoft excess influences the absorbing gas atlog T ∼ 5.0K. In this section we examine the important heatingagents and the distribution of ion fractions of the signature ions inthe WA along the stability curve. All the ionizing continua con-sidered in this section are given by Equation 4. The effect ofthethermal Comptonisedsoft excess gives the same qualitative resultsas the blackbodysoft excess modeled by a blackbody (Equation 4,see ).
c© 0000 RAS, MNRAS000, 000–000

8 Chakravorty et al.
Figure 5. Top panel : Ionizing continua withsoft excess component due tothermal Comptonisation given by Equation 5 with fixed valuesof Tc =150 eV, Tin = 10 eV andη′ = 1.0. The different curves are for differentvalues ofΓc, namely 1.7 and 2.0. For comparison, we have also drawn thecontinuum with nosoft excess (solid curve). Withα = 0.8 andαOX =1.2, the accretion disk component and the X-ray power-law component aresame for all the SEDs. The magenta, long-and-short-dashed curve is thesame as in the top panels of Figures 3 and 4. We have included the energyvalues1300A and120 eV to guide the eye in the context of observationsof Mrk 478 (see text in Section 3.3.2)Bottom panel : The stability curvescorresponding to the ionizing continua shown in the top panels.
4.1 Heating
CLOUDY works by dividing a gas into a set of thin concentric shells,referred to as ‘zones’ which have thicknesses that are smallenoughfor the physical conditions across them to be nearly constant, main-tained by continuously adjusting the physical thicknessesof theseshells. For this sub-section, only, we have constrained thecode toperform a single zone calculation for numerical convenience as we
are not concerned with quantitative rigor, but want to understandthe qualitative trends.
Figure 6 shows the influence of these two components on theheating fraction∆H of H+0, He+1, Fe and O as a function ofξP/T . All other ions and/or elements contribute less than 10% to∆H .
On the left the solid and the dotted-and-dashed curves re-spectively correspond to a WA ionized by an SED withTin =10 and 30 eV (see Eqn 4). In both casesη = 0 so that there isno soft excess component in these SEDs, so any changes in theheating fractions are entirely due to the variation in the accretiondisk spectrum.
On the right panels the solid and the dotted-and-dashed curvescorrespond toη = 0 and 3 respectively, whileTin = 10 eV.Hence changes in the heating fractions in the right panels are dueonly to the varying strength of thesoft excess component.
The top panels (labeled A) of Figure 6 show the region of thestability curves where the variation of these spectral componentshas maximum effect.
4.1.1 Hydrogen and Helium
Panels B and C of Figure 6 show the distribution of∆H respec-tively for neutral Hydrogen H+0 and singly ionised Helium He+1.In the left panels we see that there is no significant difference inthe distributions asTin increases from10 to 30 eV. For both H+0
and He+1, ∆H is considerably less forη = 3.0 than forη = 0 asseen in the right panels. Thus in either case (of the disk blackbodyor thesoft excess) H+0 and He+1 can be ruled out as the cause ofextra heating causing the increase in the temperature of thestabilitycurves in the range oflog(ξP/T ).
4.1.2 Iron
We find that in the disk blackbody and thesoft excess cases the sig-nificant heating agents are the various species of iron. It isto benoted that the range of∆H for Fe (panels D1, D2 & D3) is doublethat for O (panels E1, E2 & E3). The∆H behaviour of the ironions are affected, both, when we increaseTin from 10 to 30 eV,and when we increaseη from 0 to 1.Fe+7,Fe+8, Fe+9, Fe+10
and the Unresolved Transition Array (UTA, see below) are themostsignificant heating agents; and their contributions have been addedto give the heating fraction due to iron (labeled ‘Iron’) in panels D1through D3. On the left panels D2 and D3 the heating fractionsofthe individual ions of iron and the UTA are shown, respectively, forTin = 10 and 30 eV. Similarly, the right panels D2 and D3 show∆H for the individual iron ions and the UTA, respectively, forη = 0 and 3.0. A WA which is overabundant in iron (Fields et al.2005, 2007) and/or illuminated by a SED having photons facilitat-ing absorption by iron will be warmer at relatively lower values ofξP . These two physical scenarios influence different ions of iron,which may help to distinguish between the otherwise degenerateeffects.
For −4.0 < log(ξP /T ) < −3.4, where∆H for iron ismost affected byTin, Fe+8 and Fe+9 are the dominant ions (panelD2 and D3 on the left of Figure 6). The ionization potentials forFe+7,Fe+8, Fe+9, and Fe+10 are 151.1, 235, 262.1 and 290.4eV respectively. As the accretion disk becomes hotter, withTin in-creasing from 10 to 30 eV, the number of photons withE > 100 eVincreases by a factor of 27. It is this enhancement in the numberof photons that influences these ions of iron differently in the twocases and hence changes the shape of the stability curves.
c© 0000 RAS, MNRAS000, 000–000

Soft spectral components & warm absorber 9
Figure 6. The principal heating agents which are being influenced by the soft spectral componentsdisk blackbody (panels on the left) andsoft excess(panels on the right) present in the SEDs of typical AGN.Top panels (A) : The stable part of the thermal equilibrium curves for an optically thin Solarmetallicity gas illuminated by ionizing continua given by Equation 4. On the left panel the solid and the dotted-and-dashed lines correspond to SEDs havingTin = 10 and 30 eV respectively withη = 0 in both cases. The solid line in the right panel represents a SED with η = 0 and the dotted-and-dashed curveis for η = 1.0, whereTin = 10 eV for both the curves. We have zoomed in on the regions of the stability curves where they differ most from one to theother. The line schemes described for the left and right panels are maintained same for the lower panels in the figure.Lower panels : Fraction (∆H) of thetotal heating caused by the various significant elements andions. We have demonstrated the effects of all those elementswhich contribute& 10% to the totalheating in the samelog(ξP /T ) range as shown in the top panels. Panels B, C, D1 and E1 show theresults for H+0, He+1, iron and oxygen respectively.The ‘break-up’ in heating fraction of iron are shown in panels D2 and D3 and the same for oxygen are shown in panels E2 and E3.Note that the y-range forthe panels E1 through E3 for Oxygen are different from all other panels showing∆H distributions because Oxygen never contributes more than 20% to theheating unlike other agents, some of which are responsible for even up to 50% of the heating for some values oflog(ξP /T ). Note that the discontinuity in the∆H distribution of oxygen in theη = 3.0, Tin = 10 eV case (dotted-and-dashed curve in panels E1 and E3) is because the contribution drops below 5% for−4.2 < log(ξP /T ) < 4.0.
c© 0000 RAS, MNRAS000, 000–000

10 Chakravorty et al.
The UTA is a blend of the numerous absorption lines aris-ing from the iron M-shell ions, Fe+0 - Fe+15, due to their n = 2-3(mainly 2p-3d, n being the principal quantum number of the activeelectron) transitions which are found to occur between 16 and 17A (730 - 776eV) (Sako et al. 2001; Netzer 2004; Krongold et al.2005a,b; Holczer et al. 2007, and reference therein). The energyranges important for the UTA are likely to be influenced by thesoftexcess component of the SED. This effect is clearly seen by com-paring the∆H distributions of UTA in the right panels D2 and D3of Figure 6;∆H for iron is far more dominated by the UTA∆Hcontribution forη = 3.0 case in the range−4.4 < log(ξP/T ) <3.6.
Note that in panels D2 (both left and right), the solid curvefor iron is multivalued at−3.43 < log(ξP/T ) < −3.42, justwhere the stability curve is multivalued (see panels A), giving mul-tiple phases in pressure equilibrium. On the other hand, fortheTin = 30 eV and theη = 3 curves (the dotted-and-dashed sta-bility curves in panels A and the corresponding∆H distribution ofiron in panels D3, both left and right) there is no multivalued be-haviour forlog(ξP /T ) ∼ −3.4. Thus the behaviour of the stabilitycurve seems to be driven by the heating due to the different ions ofiron.
4.1.3 Oxygen
Panels E1 through E3 show the results for the heating fractionscontributed by Oxygen. Note the factor 2 smaller, y-range for thepanels E1 through E3 because Oxygen never contributes more than20% to the heating of the gas.
The left panels show that∆H due to Oxygen is lower forTin = 30 eV than that forTin = 10 eV in the rangelog(ξ/T ) .−3.6. In the same range 0flog(ξ/T ), the stability curve forTin =30 eV has higher temperature than theTin = 10 eV curve (panel Aon the left). Thus here Oxygen is not acting as one of the requiredheating agents resulting in a warmer absorber.
However, in theη = 3.0 case (right panels) Oxygen becomesa significant excess heating agent forlog(ξP/T ) > −3.6 wherethe contributing ions are O+6 (OVII) and O+7 (OVIII).
As for iron, the∆H distribution due to oxygen for theTin =10 eV, η = 0 case, are also multivalued at the same values, namelythe narrow range−3.43 < log(ξP/T ) < 3.42 (panels E2, bothleft and right), although not as strongly as that for iron (panels D2,both left and right). Moreover, atlog(ξP/T ) ∼ −3.4, it is iron andnot oxygen which is the dominant heating agent. However, oxygenis the dominant heating agent at higher valueslog(ξP /T ) ∼ −3.2,and has multivalued∆H distribution which drives the multi-phasenature of the solid stability curves at those values oflog(ξP /T ).
The∆H distribution of oxygen for theTin = 30 eV, η = 0 isshown in the left E3 panel (dotted-and-dashed curve). For−3.8 <log(ξP /T ) . −3.3 the oxygen∆H is about 2 to 4 times lowerthan the iron∆H (left panel D3). The oxygen∆H dominates onlybeyondlog(ξP /T ) > −3.3 where it is multivalued and is respon-sible for the multivalued nature of the stability curve (left panel A)at the same values oflog(ξP/T ).
For theη = 3.0, Tin = 30 eV case (right panel E3) as well,the oxygen∆H contribution is lower than the iron∆H (right panelD3) until log(ξP/T ) & −3.6 beyond which the oxygen∆H dis-tribution determines the behaviour of the stability curve.Note thatthe stability curve (dotted-and-dashed in right panel A) isnot mul-tivalued atlog(ξP /T ) & −3.6 because the∆H for oxygen is notmultivalued.
Thus, at the higher ionization (log(ξP/T ) ∼ −3.2) phase of
the WA, the nature of the stability curve seems to be driven bytheheating due to the oxygen ions, predominantly O+7 (OVIII).
4.1.4 Zero oxygen and iron abundance
We have further illustrated the importance of iron and oxygen as thekey players in determining the thermal properties of the WA usingFigure 7. The distinction between the left and the right panels are asthat in Figure 6; the upper panels being the same stability curves asin Figure 6 panels A, but for slightly different ranges oflog(ξP /T )and wider ranges oflog T .
Comparing the stability curves for Solar metallicity gas (toppanels), which have pronounced kinks in the temperature range4.2 < log T < 6.5, with the relatively featureless ones for gaswith zero O and Fe (bottom panels), we see that the detailed shapeof the curves in the temperature range∼ 4.2 < log T < 6.5 aregoverned by the atomic interactions due to oxygen and iron (alsosee Chakravorty et al. 2009). As a result, the SED induced differ-ences between the solid and the dotted-and-dashed stability curvesin the top panels are significantly smoothed out in the bottompan-els.
For −3.7 < log(ξP /T ) < −3.3 the rise in temperature ofthe Solar metallicity stability curves in the top left panelshowsa temperature difference of 0.4 dex from one curve to the other.This difference is reduced to 0.2 dex when iron and oxygen arenotpresent in the gas (lower left panel) suggesting that a hotter accre-tion disk (Tin = 30 eV) mainly affects ions of iron and oxygenwhich results in a hotter WA.
The temperatures of the Solar metallicity stability curvesinthe top right panels are remarkably different, by∼ 1 dex, for−4.2 < log(ξP/T ) < −3.3. These differences are significantlyreduced to 0.3 - 0.5 dex when iron and oxygen are removed fromthe gas (lower right panel). This indicates that atomic interactionsdue to these elements are affected by the strength of thesoft ex-cess component. Unlike the accretion disk case, however, the sta-bility curves in the lower right panel retain some of their differencesin WA temperatures suggesting that other elements have a role asheating agents in thesoft excess case. The detailed investigation ofthis effect is beyond the scope of this paper, but will be attemptedsoon in our future publications.
4.2 Ion fraction
Absorption lines and edges of OVII, with ionisation potential (IP)of 0.74 keV, and OVIII, with IP of 0.87 keV, are often prominentsignatures of the WA in soft X-ray spectra. Hence the column den-sities of these two ions are often considered as important observ-able parameters for WA states (see introduction for references). Athigher values ofξP , absorption by various ions of silicon becomeimportant, e.g. Netzer et al. (2003) show that SiXIV (IP of 2.67keV) has a significant column density corresponding to the hightemperature component of the WA. We choose these three ions tostudy the variation of their ion fraction as a function ofξP as thespectral components change in the ionizing continuum.
The ion fractionI(X+i) of theX+i ion is the fraction of thetotal number of atoms of the elementX which are in theith stateof ionization. Thus,
I(X+i) =N(X+i)
f(X)NH
,
whereN(X+i) is the column density of theX+i ion andf(X) =
c© 0000 RAS, MNRAS000, 000–000

Soft spectral components & warm absorber 11
Figure 7. Top Panels : The comparison between the stability curves for Solar metallicity gas, when ionized by SEDs having accretion disks withdifferenttemperaturesTin = 10 and 30 eV (left) and when the ionizing continua have different strengths of thesoft excess componentη = 0 and 3.0 (right). Bottompanels : The same ionizing continua are used to illuminate a gas for which iron and oxygen have been removed. The relative differences in the stability curvesare almost entirely removed in the lower left panel, and are significantly reduced in the lower right panel, indicating that these spectral components stronglyinfluence the ions of iron and oxygen.
n(X)/nH is the ratio of the number density of the elementX tothat of hydrogen.
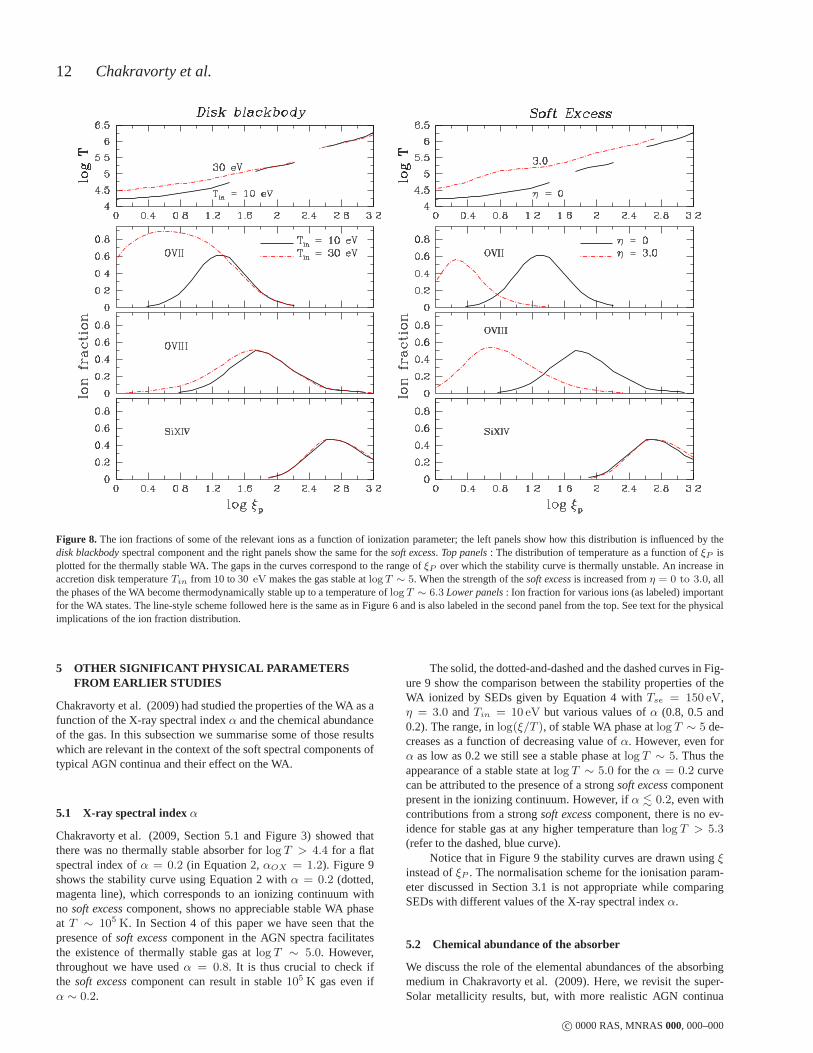
The top panels of Figure 8 show the distribution oflog T withrespect tolog ξP for the stable WA phases. The gaps in the linescorrespond to the range of ionization parameter over which the gasis thermally unstable. The lower panels show I(OVII), I(OVIII) andI(SiXIV).
As before, left panels in Figure 8 correspond to the changesin the diskblackbody. ForTin = 10 eV we can see three distinctregions ofξP separated by intermediate ranges of thermally unsta-ble solutions. These regions are respectively dominated byOVII,OVIII and SiXIV. However, whenTin is raised to30 eV, the sta-bility curve becomes stable all the way up tolog T = 5.3 and theOVII dominated phase gradually merges in to the OVIII dominatedgas, as demonstrated by the uninterrupted dotted-and dashed line inthe top left panel. Thus there seems to be a continuous distributionof possible thermal solutions resulting from the greater productionof OVII (second panel from top) which, in its turn, is a resultof theenhanced number ofE & 100 eV photons coming from a hotter
accretion disk withTin = 30 eV. The change in the shape of thedisk blackbody does not change the ion fraction distribution of thehigh ionization species like OVIII or SiXIV (the two lowest pan-els) or the stability curve forlog T > 5 and log ξP > 1.7. Thusthe higher temperature (log T & 5) phase of the ionized absorberremains unaffected.
The effect of thesoft excess component is demonstrated in theright panels of Figure 8. In this case the increase in the strengthof the soft excess component fromη = 0 to η = 3.0 makes theabsorber thermally stable all the way up to temperatures oflog T ∼6. The third panel from the top shows that increase in the strengthof the soft excess component mainly influence the occurrence ofOVIII. The fraction of OVII is reduced forη = 3.0 because of thefacilitated production of OVIII at lower values oflog ξP . This iscaused by increase in the number of∼ 100 eV−2 keV photons bya factor of∼ 7.5. The ion fraction distribution of SiXIV however,remains unaffected (bottom panel).
c© 0000 RAS, MNRAS000
12 Chakravorty et al.
Figure 8. The ion fractions of some of the relevant ions as a function ofionization parameter; the left panels show how this distribution is influenced by thedisk blackbody spectral component and the right panels show the same for thesoft excess. Top panels : The distribution of temperature as a function ofξP isplotted for the thermally stable WA. The gaps in the curves correspond to the range ofξP over which the stability curve is thermally unstable. An increase inaccretion disk temperatureTin from 10 to 30eV makes the gas stable atlog T ∼ 5. When the strength of thesoft excess is increased fromη = 0 to 3.0, allthe phases of the WA become thermodynamically stable up to a temperature oflog T ∼ 6.3 Lower panels : Ion fraction for various ions (as labeled) importantfor the WA states. The line-style scheme followed here is thesame as in Figure 6 and is also labeled in the second panel fromthe top. See text for the physicalimplications of the ion fraction distribution.
5 OTHER SIGNIFICANT PHYSICAL PARAMETERSFROM EARLIER STUDIES
Chakravorty et al. (2009) had studied the properties of the WA as afunction of the X-ray spectral indexα and the chemical abundanceof the gas. In this subsection we summarise some of those resultswhich are relevant in the context of the soft spectral components oftypical AGN continua and their effect on the WA.
5.1 X-ray spectral indexα
Chakravorty et al. (2009, Section 5.1 and Figure 3) showed thatthere was no thermally stable absorber forlog T > 4.4 for a flatspectral index ofα = 0.2 (in Equation 2,αOX = 1.2). Figure 9shows the stability curve using Equation 2 withα = 0.2 (dotted,magenta line), which corresponds to an ionizing continuum withno soft excess component, shows no appreciable stable WA phaseat T ∼ 105 K. In Section 4 of this paper we have seen that thepresence ofsoft excess component in the AGN spectra facilitatesthe existence of thermally stable gas atlog T ∼ 5.0. However,throughout we have usedα = 0.8. It is thus crucial to check ifthe soft excess component can result in stable105 K gas even ifα ∼ 0.2.
The solid, the dotted-and-dashed and the dashed curves in Fig-ure 9 show the comparison between the stability properties of theWA ionized by SEDs given by Equation 4 withTse = 150 eV,η = 3.0 andTin = 10 eV but various values ofα (0.8, 0.5 and0.2). The range, inlog(ξ/T ), of stable WA phase atlog T ∼ 5 de-creases as a function of decreasing value ofα. However, even forα as low as 0.2 we still see a stable phase atlog T ∼ 5. Thus theappearance of a stable state atlog T ∼ 5.0 for theα = 0.2 curvecan be attributed to the presence of a strongsoft excess componentpresent in the ionizing continuum. However, ifα . 0.2, even withcontributions from a strongsoft excess component, there is no ev-idence for stable gas at any higher temperature thanlog T > 5.3(refer to the dashed, blue curve).
Notice that in Figure 9 the stability curves are drawn usingξinstead ofξP . The normalisation scheme for the ionisation param-eter discussed in Section 3.1 is not appropriate while comparingSEDs with different values of the X-ray spectral indexα.
5.2 Chemical abundance of the absorber
We discuss the role of the elemental abundances of the absorbingmedium in Chakravorty et al. (2009). Here, we revisit the super-Solar metallicity results, but, with more realistic AGN continua
c© 0000 RAS, MNRAS000, 000–000

Soft spectral components & warm absorber 13
Figure 9. Thermal equilibrium curves generated using SEDs given byEquation 4 with a strongsoft excess (Tse = 150 eV, η = 3.0 andTin = 10 eV) for a range of X-ray slopeα = 0.8 0.5 and 0.2 (respec-tively drawn with the solid, the dotted-and-dashed and the dashed lines).The stable phase atlogT ∼ 5.0 the range oflog(ξ/T ) progressively de-creases asα decreases from 0.8, to 0.5 and then to 0.2. For comparison wehave used Equation 2 withα = 0.2, which corresponds to an ionizing con-tinuum which has nosoft excess component, and drawn the dotted stabilitycurve which is consistent with no stable WA phase atlog T ∼ 5.0.
given by Equation 4 (α = 0.8, η = 3.0 andTin = 10 eV). The sta-bility curves are shown in Figure 10 for WA abundances from Solar(Z⊙) to 9 Z⊙ in steps of 2. The qualitative results are the same asin Chakravorty et al. (2009).
On the low temperature (log T . 4.5, corresponding to OVIIlike ions) arm of the stability curves, super-Solar metallicity resultsin a cooler absorber for the sameξP (or ξ) values, with an increasein the range ofξP over which we get stable WA. Thus super-Solarmetallicity opposes the role of increasedTin (see Figure 3 in Sec-tion 3.2).
For the intermediate temperature arm of the stability curve(log T ∼ 5.0, corresponding to OVIII like ions) super-Solar abun-dance decreases the range of stable WA, thus opposing the influ-ence of the increase inη in the ionizing continuum (see Figure 4 inSection 4).
On the highest temperature arm of the WA (log T ∼ 6.0, cor-responding to SiXIV like ions) super-Solar gas tends to be hot-ter, and is thermodynamically stable for a larger range of values oflog(ξP /T ). Thus the fine tuning ofξP values to detect such speciesof ions is relaxed if the absorber has super-Solar abundance, and theprobability of detecting these high ionization species is increased.In this regime, the influence of high metallicity is degenerate withthe influence of increasingα in the ionizing continuum, but only ifα & 0.8 (see Figure 9 in Section 5.1).
6 MULTI-PHASES WARM ABSORBER
The stability curves we have derived in the previous sections of-ten contain segments that allow phases at different temperatures to
Figure 10. Stability curves for absorbers with Solar and super-Solar abun-dance from Z⊙ to 9 Z⊙ in steps of 2. The ionizing continuum has a strongsoft excess (Equation 4 with :α = 0.8, η = 3.0 andTin = 10 eV).
occur at similar pressureξP/T indicating the possibility of twoor more distinct WA phases within the same medium to exist atnear pressure equilibrium. However, variations in some of the phys-ical parameters can also result in the possibility of multi-phase ab-sorbers being lost.
Observationally, distinct phases in pressure equilibriumhavebeen derived in a number of cases of WAs (Krongold et al. 2003;Netzer et al. 2003; Chelouche & Netzer 2005; Krongold et al.2007; Andrade-Velazquez et al. 2010), while in other cases it hasbeen claimed that there is a continuous range of ionization pa-rameter (Ogle et al. 2004; Steenbrugge et al. 2005). Since a widerange of physical parameters have been studied in this paperandChakravorty et al. (2009) for their effects on the WA, we can nowform a clearer picture of which physical conditions favour themulti-phase absorbers.
Thedisk blackbody component from the accretion disk affectsthe lower temperature part of the stability curve (Sections3 and 4).Figure 3 shows that the stability curve (solid line) withTin =10 eV has a slim range−3.34 ≤ log(ξP /T ) ≤ −3.31 over whichgas at low temperatureslog T . 4.3 can be in pressure equilibriumwith the absorber at intermediate temperatureslog T . 5.0. How-ever, asTin is increased, all possibilities of such multi-phase struc-ture is lost, instead the curve becomes stable in the intermediatetemperature range supporting a continuous distribution ofallowedpressure and temperature in this phase space. Thus cooler accretiondisks support a multi-phase WA, although for a narrow range ofpressure.
An ionizing continuum having nosoft excess (solid line in Fig-ures 4 and 5) allows for a multi-phase betweenlog T ∼ 5 and 6.However, with the increase in the strength of thesoft excess com-ponent the range oflog(ξP /T ) over which the possibility of multi-phase exists reduces from 0.09 dex forη = 0 to 0.006 dex forη = 1.0 and to 0 forη = 3.0.
Chakravorty et al. (2009) had emphasised that super-Solarabundances increase the range oflog(ξ/T ) with the possibility
c© 0000 RAS, MNRAS000, 000–000

14 Chakravorty et al.
of multi-phase WA (also see Komossa & Mathur 2001). For ex-ample, as the metallicity of the gas was increased from 1.0 to3.0to 5.0,∆45[log(ξ/T )] increased from 0.012 to 0.08 to 0.1, where∆45[log(ξ/T )] gives the range of common values oflog(ξ/T )over which the WA has stable phases at both∼ 105 and∼ 104 K.Beyond a metallicity of 5Z⊙, ∆45[log(ξ/T )] was found to dropbecause the range oflog(ξ/T ) for the∼ 105 WA was found todecrease with the increase in metallicity and became zero for a gaswith metallicity 9Z⊙.
Similar trends are retained for the continua in this paper. Asthe metallicity of the gas is increased, keeping the ionizing con-tinuum the same, the stable phases increasingly align alongthesame values oflog(ξP /T ) (Figure 10), strongly suggesting thepresence of multi-phase WA.∆45[log(ξP /T )] increases from 0 to0.02 to 0.04 to 0.045 as metallicity is increased from Solar to 3, 5and 7 times Solar. Beyond this high metallicity,∆45[log(ξP/T )]becomes constant. There is a even more significant increase in∆56[log(ξP /T )] from 0 to 0.03 to 0.08 to 0.11 to 0.13 with theincrease in metallicity from Solar to 3, 5,7 and 9 times Solar.
For NGC 3783, Netzer et al. (2003) found three distinctphases of the WA in near pressure equilibrium. In Figure 10we see that only for Z = 9Z⊙ there is a very narrow rangeof 0.03 dex in which all three phases of the WA, at tempera-tures∼ 104, 105 and 106 K, are stable in the range−3.69 ≤log(ξP /T ) ≤ −3.66. Interestingly, the stability curve for a muchlower metallicity, Z = 5Z⊙, gas but ionized by a continuum withweakersoft excess (η = 1.0, not shown in Figure 10) shows thethree phases in pressure equilibrium for a larger range of 0.08 dexfor −3.48 ≤ log(ξP /T ) ≤ −3.4. Thus, it is easier (relativelylower super-Solar metallicity) to have 3 phases in pressureequi-librium if the strength of thesoft excess is lower. In all the physi-cal conditions of the WA, that were studied by Chakravorty etal.(2009), three phases of the WA were found to coexist in pres-sure equilibrium for still lower metallicity& 3Z⊙ which bringsit down to observed values (e.g. see Fields et al. 2005, 2007,forMRK 279). It is to be noted, however, that the continua used byChakravorty et al. (2009) had nosoft excess component in them.
7 CONCLUSION
We have examined the effect of spectral energy distributions in-cluding hot disks andsoft excess spectral components in the energy‘blind spot’ between 13 - 100 eV (Equations 4 and 5) on warm ab-sorber. We investigated whether the spectral shapes can, inturn, beconstrained from the observed properties of the warm absorber.
We summarise our results as follows :
• The maximum temperature of the accretion disk component(see Equation 4, Section 2.2) strongly affects on the low tempera-ture (log T . 4.5) arm of the stability curve, the thermal proper-ties of which are largely decided by ions Fe+7 to Fe+10 and O+6
(OVII). This phase of the WA becomes hotter and thermodynami-cally stable over a larger range ofξ when the ionising continuum ishotter (Tin = 30 eV) compared toTin = 10 eV. Thus hotter accre-tion disks are more likely to produce WA phases characterised byions having similar ionisation potentials to OVII. However, the pos-sibility of this phase of the WA being in pressure equilibrium withthe higher temperature phases is eliminated in the hot disk casesas∆45[log(ξ/T )] decreases from 0.03 forTin = 10 eV to 0 forTin = 20 and 30 eV. Changes in the accretion disk temperaturehowever, do not affect the higher temperature arms of the stabilitycurve.
• The thermal properties of the intermediate temperature(log T ∼ 5.0) branch of the stability curve are essentially deter-mined by atomic interactions due to the different ions of iron andOVIII (IP = 0.87 keV). We find that with the increase in the relativestrengthη of thesoft excess component this105 K stable phase ofthe WA spans a much larger range oflog(ξ/T ) (by 0.4 dex fromη = 0 to η = 3.0) thus increasing the probability of finding WAphases characterised by ‘OVIII like’ ions.• For a gas whose chemical composition is devoid of iron and
oxygen, changes in the accretion disk spectral component bringabout no change in the properties of the WA, and changes due tothe variation in the strength of thesoft excess component are sig-nificantly reduced.• The highest temperature arm (log T ∼ 6.0) of the stability
curve which is characterised by the ions having similar IP tothatof SiXIV (IP = 2.67 keV), is left almost unaffected by any changeseither in the accretion disk component or in thesoft excess compo-nent.• An AGN continuum with a flat X-ray slope will not produce
high IP ions like SiXIV, and may show signatures of lower IP ionslike OVIII (IP = 0.87 keV) only if a sufficiently strongsoft excesscomponent is present in the SED.• The metallicity of the gas plays an important role in determin-
ing the multi-phase nature of the warm absorber. The possibilityof the104 and the 105 K phases of the warm absorber occurringat similar values oflog(ξ/T ) is increased if the absorber is super-Solar in abundance. Similarly, the chances of having pressure equi-librium between the105 and the 106 K phases are also increasedby the super-Solar metallicity of the gas. However, all three phases,together, are found to be in pressure equilibrium only if Z> 3Z⊙,and the required abundance to achieve this is increased if the ioniz-ing continuum has strongersoft excess.
ACKNOWLEDGEMENTS
SC sincerely thanks Profs. Andy Fabian and Hagai Netzer for pro-viding valuable suggestions in the early stage of preparingthis pa-per.
REFERENCES
Allende Prieto, C., Lambert, D.L., & Asplund, M., 2001, ApJ,556, L63
Allende Prieto, C., Lambert, D.L., & Asplund, M., 2002, ApJ,573, L137
Andrade-Velazquez, M.; Krongold, Y.; Elvis, M.; Nicastro,F.;Brickhouse, N.; Binette, L.; Mathur, S.; Jimenez-Bailon, E.2010, ApJ, 711, 888
Arnaud, K. A. 1996, ASPC, 101, 17Bechtold, J. et al. 1994, AJ, 108, 759Behar, E. 2009, ApJ, 703, 1346Beloborodov, A.M. 1999, ASPC, 161, 295.Blustin, A. J. et al. 2003, A&A, 403, 481Brinkmann, W. 1992, A&A, 254, 460Buehler, P.; Courvoisier, T. J.-L.; Staubert, R.; Brunner,H.;Lamer, G. 1995, A&A, 295, 309
Chakravorty, S., Kembhavi, A.K., Elvis, M., Ferland, G. & Bad-nell, N.R., 2008, MNRAS, 384L, 24
Chakravorty, S., Kembhavi, A.K., Elvis, M. & Ferland, G., 2009,MNRAS, 393, 83
c© 0000 RAS, MNRAS000, 000–000

Soft spectral components & warm absorber 15
Chelouche, D., Netzer, H. 2005, ApJ, 625, 95Collinge, M. J. et al. 2001, ApJ, 557,2Coppi, P.S. 1992, MNRAS, 258, 657Coppi, P.S. 1999, ASPC, 161, 375Crummy, J.; Fabian, A.C.; Gallo, L.; Ross, R. 2006, MNRAS,365, 1067
Czerny, B.; Elvis, M., 1987, ApJ, 321, 305.Elvis, M.; Wilkes, B. J.; Tananbaum, H., 1985, ApJ, 292, 357Elvis, M.; Green, R. F.; Bechtold, J.; Schmidt, M; Neugebauer,G.; Soifer, B. T.; Matthews, K.; Fabbiano, G., 1986, ApJ, 310,291.
Elvis, M. et al. 1994, ApJS, 95, 1Fields, D. L.; Mathur, S.; Pogge, R.; Nicastro, F.; Komossa,S.;Krongold, Y. 2005, ApJ, 634, 928
Fields, D. L.; Mathur, S.; Krongold, Y.; Williams, R.; Nicastro, F.2007, ApJ, 666, 828
Frank, J., King, A., & Raine, D. 2002, Accretion Power in Astro-physics (3rd ed.; Cambridge: Cambridge Univ. Press)
Gehrels, N and Williams, E.D. 1993, ApJ, 418L, 25George, I. M.; Turner, T. J.; Netzer, Hagai; Nandra, K.;Mushotzky, R. F. & Yaqoob, T., 1998, ApJS, 114, 73
Gierlinski M.; Done C. 2004, MNRAS, 349L, 7Gondhalekar, P. M.; Kellett, B. J.; Pounds, K. A.; Matthews,L.;Quenby, J. J., 1994, MNRAS, 268, 973
Green, P.J. et al. 2009, ApJ, 690, 644Grevesse, N., & Sauval, A.J., 1998, Space Science Review, 85,161
Grupe, D.; Mathur, S.; Wilkes, B. & Osmer, P., 2006, AJ, 131, 55Haardt, F.; Maraschi, L. 1993, ApJ, 413, 507Halpern, J.P., 1984, ApJ, 281,90Hess, C.J.; Kahn, S.M.; Paerels, F.B.S., 1997, ApJ, 478, 94Holczer, T.; Behar, E.; Kaspi, S. 2007, ApJ, 663, 799Holweger, H., 2001, Joint SOHO/ACE workshop “Solarand Galactic Composition”. Edited by Robert F. Wimmer-Schweingruber. Publisher: American Institute of Physics Con-ference proceedings, 598, 23
Kaastra, J. S.; Steenbrugge, K. C.; Raassen, A. J. J.; van derMeer,R. L. J.; Brinkman, A. C.; Liedahl, D. A.; Behar, E. & de Rosa,A., 2002, A&A, 386, 427
Kinkhabwala, A. et al. 2002, ApJ, 575, 732Komossa, S. & Meerschweinchen, J. 2000, A&A, 354, 411Komossa, S. & Mathur 2001, A&A, 374, 914Korista, K.; Ferland, G.; Baldwin, J., 1997, ApJ, 487, 555.Krolik, J. H., McKee, C. F., & Tarter, C. B. 1981, ApJ, 249, 422Krolik, J., & Kriss, G. A., 2001, ApJ 561, 684Krongold, Y.; Nicastro, F.; Brickhouse, N. S.; Elvis, M.; Liedahl,D. A. & Mathur, S., 2003, ApJ 597, 832
Krongold, Y.; Nicastro, F.; Elvis, M.; Brickhouse, N. S.; Mathur,S. & Zezas, A., 2005a, ApJ 620, 165
Krongold, Y.; Nicastro, F.; Brickhouse, N. S.; Elvis, M. & Mathur,S., 2005b, ApJ 622, 842
Krongold, Y.; Nicastro, F.; Elvis, M.; Brickhouse, N.; Binette, L.;Mathur, S.; Jimenez-Bailon, E., 2007, ApJ, 659, 1022
Laor, A., 1990, MNRAS, 246, 369.Laor, A.; Fiore, F.; Elvis, M.; Wilkes, B.J.; McDowell, J.C., 1997.ApJ, 477, 93
Lightman, A. P., & Zdziarski, A. A. 1987, ApJ, 319, 643.Lynden-Bell, D., 1969, Natur. 223, 690Lopez, L. A.; Brandt, W. N.; Vignali, C.; Schneider, D. P.; Chartas,G.; Garmire, G. P. 2006, AJ, 131, 1914
Makishima, K.; Maejima, Y.; Mitsuda, K.; Bradt, H. V.; Remil-
lard, R. A.; Tuohy, I. R.; Hoshi, R.; Nakagawa, M. 1986, ApJ,308, 635.
Malkan, M. A.; Sargent, W. L. W., 1982, ApJ, 254, 22.Marshall, H. L.; Carone, T. E.; Shull, J. Michael; Malkan, M.A.;Elvis, M., 1996, ApJ, 457, 169
Mathews, W.G.; Ferland, G.J., 1987, ApJ, 323, 456Matsumoto, C; Leighly, K. M.; Marshall, H. L., 2004, ApJ, 603,456
Mitsuda, K. et al. 1984, PASJ, 36, 741Nandra, K. & Pounds, K. A. 1994, MNRAS, 268, 405Netzer, H. 1985, MNRAS 216, 63Netzer, H. 1987, MNRAS, 225, 55Netzer, H. 1993, ApJ, 411, 594Netzer et al. , 2003, ApJ 599, 933Netzer, H. 2004, ApJ, 604, 551Neugebauer, G.; Oke, J. B.; Becklin, E. E.; Matthews, K. 1979,ApJ, 230, 79.
Ogle, P. M., Mason, K. O., Page, M. J., Salvi, N. J., Cordova, F.A., McHardy, I. M. & Priedhorsky, W. C. 2004, ApJ, 606, 151
Page, K. L.; Reeves, J. N.; O’Brien, P. T.; Turner, M. J. L.; Worrall,D. M. 2004, MNRAS, 353, 133
Page, K. L.; Schartel, N.; Turner, M. J. L.; O’Brien, P. T. 2004,MNRAS, 352, 523
Piconcelli, E.; Jimenez-Bailon, E.; Guainazzi, M.; Schartel, N.;Rodriguez-Pascual, P. M.; Santos-Lleo, M. 2005, A&A, 432,835.
Porquet, D.; Reeves, J. N.; O’Brien, P.; Brinkmann, W. 2004,A&A, 422, 85
Pounds, K; Reeves, J. 2002, astro-ph/0201436Pringle, J. E.; Rees, M. J.; Pacholczyk, A. G., 1973, A&A, 29,179Reynolds, C.S. & Fabian, A.C., 1995, MNRAS, 273, 1167Reynolds, C. S. 1997, MNRAS, 286, 513Ross, R. R.; Fabian, A. C. 1993, MNRAS, 261, 74Ross, R. R.; Fabian, A. C. 2005, MNRAS, 358, 211Rybicki G. B., Lightman A. P., 1986, Radiative Processes in As-trophysics (New York : John Wiley & Sons Inc.)
Sako, M. et al. 2001, A&A, 365L, 168Shakura, N. I.; Sunyaev, R. A. 1973, A&A, 24, 337Shang, Z. et al. 2005, ApJ, 619,41Shields, G. A. 1978 Nature, 272, 706.Siemiginowska, A.; Kuhn, O.; Elvis, M.; Fiore, F.; McDowell, J.;Wilkes, B. J. 1995, ApJ, 454, 77.
Sobolewska, M. A.; Siemiginowska, A.; Zycki, P. T., 2004a, ApJ,608, 80.
Sobolewska, M. A.; Siemiginowska, A.; Zycki, P. T., 2004b, ApJ,617, 102.
Stalin, C. S.; Petitjean, Patrick; Srianand, R.; Fox, A. J.;Cop-polani, F.; Schwope, A. 2010, MNRAS, 401, 294
Steenbrugge, K.C. et al. 2005, A&A 434, 569Tananbaum, H. et al. 1979, ApJ, 234L, 9Tueller, J.; Mushotzky, R. F.; Barthelmy, S.; Cannizzo, J. K.;Gehrels, N.; Markwardt, C. B.; Skinner, G. K. & Winter, L. M.,2008, ApJ, 681, 113
Turner, A. K., Fabian, A. C., Lee, J. C., & Vaughan, S. 2004, MN-RAS, 353, 319
Vignali, C; Brandt, W. N.; Boller, T.; Fabian, A. C.; Vaughan, S,2004, MNRAS, 347, 854
Wilkes, B.J. & Elvis, M., 1987, ApJ, 323, 243Zdziarski, A. A.; Johnson, W. N.; Magdziarz, P. 1996, MNRAS,283, 193
Zheng, W.; Kriss, G.A.; Telfer, RC.; Grimes, J.P. & Davidsen,A.F., 1997, ApJ, 475, 469
c© 0000 RAS, MNRAS000, 000–000

16 Chakravorty et al.
Zycki, P. T.; Done, C.; Smith, D. A. 1999, MNRAS 309, 561
c© 0000 RAS, MNRAS000, 000–000