the influence of emotion clarity on emotional prosody identification in paranoid schizophrenia
TRANSCRIPT
The influence of emotion clarity on emotionalprosody identification in paranoid schizophrenia
D. R. Bach1*, K. Buxtorf1, D. Grandjean2 and W. K. Strik1
1 University Hospital of Psychiatry, University of Bern, Bolligenstrasse 111, 3000 Bern 60, Switzerland2 Swiss Centre for Affective Sciences, University of Geneva, 7 rue des Battoirs, 1205 Geneva, Switzerland
Background. Identification of emotional facial expression and emotional prosody (i.e. speech melody) is often
impaired in schizophrenia. For facial emotion identification, a recent study suggested that the relative deficit in
schizophrenia is enhanced when the presented emotion is easier to recognize. It is unclear whether this effect is
specific to face processing or part of a more general emotion recognition deficit.
Method. We used clarity-graded emotional prosodic stimuli without semantic content, and tested 25 in-patients with
paranoid schizophrenia, 25 healthy control participants and 25 depressive in-patients on emotional prosody
identification. Facial expression identification was used as a control task.
Results. Patients with paranoid schizophrenia performed worse than both control groups in identifying emotional
prosody, with no specific deficit in any individual emotion category. This deficit was present in high-clarity but not
in low-clarity stimuli. Performance in facial control tasks was also impaired, with identification of emotional facial
expression being a better predictor of emotional prosody identification than illness-related factors. Of those, negative
symptoms emerged as the best predictor for emotional prosody identification.
Conclusions. This study suggests a general deficit in identifying high-clarity emotional cues. This finding is in line
with the hypothesis that schizophrenia is characterized by high noise in internal representations and by increased
fluctuations in cerebral networks.
Received 14 November 2007 ; Revised 18 September 2008 ; Accepted 18 September 2008 ; First published online 12 November 2008
Key words : Affective prosody, emotional cues, emotional facial expression, emotional prosody, facial affect,
negative symptoms.
Introduction
The capability to accurately identify the emotions ex-
pressed by others is a precondition for understanding
one another and for making satisfactory mutual ad-
justments. This capability is often impaired in schizo-
phrenia. A large body of literature has accumulated
on this issue, and most studies have focused on the
recognition of emotional facial expression (Edwards
et al. 2002 ; Kohler & Martin, 2006). There is a general
consensus that patients with schizophrenia show defi-
cits in recognizing facial expression of emotions in
most tasks. Although many studies have not reported
performance for individual emotion categories, it
has been suggested that happiness, surprise, fear
and sadness are recognized more poorly than other
emotion categories ; however, reports are contradic-
tory (Edwards et al. 2002). There is evidence that
deficits in recognizing emotion in facial expressions
are greater during acute psychosis than after re-
mission (Gessler et al. 1989 ; Gaebel & Wolwer, 1992).
One study showed an increased impairment in ad-
vanced as compared to first-episode schizophrenia
(Kucharska-Pietura et al. 2005), and the deficit seems
to be correlated with general cognitive deficits in
schizophrenia (Bozikas et al. 2004 ; Sachs et al. 2004).
Reports on differences concerning paranoid and non-
paranoid schizophrenia are contradictory (Edwards
et al. 2002). Most studies, however, have neither dif-
ferentiated between schizophrenia subtypes nor re-
ported the ratio of subtypes in their samples.
Beyond facial expression, emotional prosody (i.e.
speech melody) is another important source for non-
verbal emotional communication. Several studies have
addressed deficits in schizophrenia in order to id-
entify emotional prosody using different kinds of
stimuli (Edwards et al. 2001, 2002 ; Kucharska-Pietura
et al. 2005 ; Leitman et al. 2005 ; Bozikas et al. 2006 ;
Matsumoto et al. 2006). These studies found evi-
dence for impaired recognition in acute and chronic
* Address for correspondence : Dr D. R. Bach, Wellcome Trust
Centre for Neuroimaging, 12 Queen Square, London WC1N 3BG, UK.
(Email : [email protected])
Psychological Medicine (2009), 39, 927–938. f Cambridge University Press 2008doi:10.1017/S0033291708004704 Printed in the United Kingdom
ORIGINAL ARTICLE
schizophrenia. Deficits in emotional prosody identifi-
cation have been linked to impaired performance in
basic auditory perception (Leitman et al. 2005, 2007 ;
Matsumoto et al. 2006), negative symptoms (Bozikas
et al. 2004), illness duration (Kucharska-Pietura et al.
2005) andmale gender (Bozikas et al. 2006). Differences
between paranoid and non-paranoid schizophrenia
have been reported equivocally (Edwards et al. 2002),
although, as in research on facial expression, most
studies did not report schizophrenia subtypes. Spe-
cificity of deficits with regard to emotion categories
has been reported ambiguously. Some studies did
not analyse performance in individual emotion cate-
gories (Leitman et al. 2005 ; Matsumoto et al. 2006 ;
also see Edwards et al. 2002 for an overview), whereas
others have suggested deficits in recognizing sadness
(Murphy & Cutting, 1990), sadness and fear (Edwards
et al. 2001), sadness, anger and surprise (Bozikas et al.
2006), and negative emotions in general (Kucharska-
Pietura et al. 2005).
To summarize, although there is good evidence that
emotional prosody identification is often impaired in
schizophrenia, reports on specificity are contradictory
between studies. In the present study, we focused on
two possible explanations for this ambiguity.
As prosodic stimuli, almost all studies used sen-
tences with neutral content spoken with emotional
intonation. This means that vocal and verbal infor-
mation can be inconsistent. Inconsistency between
verbal and vocal information can, for example, induce
specific neural responses (Mitchell et al. 2003). The
importance of such inconsistencies in everyday lan-
guage is easily illustrated with examples such as
‘Great job! ’, which might be understood as sar-
casm when tone of voice contradicts verbal meaning
(Schirmer & Kotz, 2006). Low performance in identi-
fying the vocal meaning of such a stimulus could
therefore reflect a deficit in emotion recognition and
also a deficit in dealing with inconsistent information.
Such inconsistency might be present only in specific
emotion categories that would eventually be more
difficult to identify. There are two possibilities to pre-
vent such inconsistencies : the filtering of vocal stimuli
to render the semantic content incomprehensible (Kotz
et al. 2003), or the use of nonsense syllables spokenwith
affective intonation (Grandjean et al. 2005 ; Sander et al.
2005 ; Bach et al. 2008). To our knowledge, such stimuli
have only been used in one early study on emotional
prosody identification in schizophrenia that, however,
did not report performance in individual emotion cate-
gories (Turner, 1964).
Another possible explanation for contradictory re-
ports on deficit specificity refers to the clarity of stim-
uli, which often differs between emotion categories.
Contrary to an intuitive assumption, there is evidence
that deficits in the recognition of emotions in facial
expression are more pronounced when the expressed
emotion is easier to recognize for healthy participants
(Kohler et al. 2003). In this study, both patients with
schizophrenia and healthy control participants per-
formed better on high-intensity than on low-intensity
stimuli, but the relative performance deficit of patients
with schizophrenia increased when cues were easier
to identify. There are, however, no studies so far ex-
amining whether this effect is limited to the processing
of emotional facial expression or part of a more gen-
eral pattern of emotional processing in schizophrenia.
The purpose of the present study was therefore (a)
to examine emotional prosody identification using
nonsense syllables in order to avoid inconsistencies
between vocal and verbal meaning. Furthermore, this
study was aimed at (b) testing the hypothesis that,
similar to identification of emotional facial expression,
patients with schizophrenia do not profit from greater
clarity of stimuli to the extent that healthy indivi-
duals do.
To achieve these goals, a set of prosodic stimuli was
used that had been validated previously in healthy
participants (Banse & Scherer, 1996). This carefully
selected set comprises both high- and low-clarity stim-
uli for the emotions of fear, sadness, anger and hap-
piness. To control for deficits in the visual modality,
we used a simple facial expression identification task,
the Facial Affect Computer Task (FACT), that had
been used in previous studies on schizophrenia
(Feinberg et al. 1986 ; Edwards et al. 2001). As schizo-
phrenia is a relatively broad diagnosis comprising
subtypes with specific symptoms and deficits, differ-
ences in sample composition might further add to
equivocal results between studies. We therefore aimed
at limiting our findings to the most frequent subgroup,
paranoid schizophrenia. To exclude the possibility
that our findings would be due to patient status rather
than to the specific illness, a clinical control group with
unipolar depression was also included.
Method
Study design
The emotional prosody identification task followed a
three-way ANOVA design with the within-subjects
factors emotion category and emotion clarity, and the
between-subjects factor group. Planned contrasts were
performed to compare patients with schizophrenia
with both other groups. As the set of prosodic stimuli
that was used here comprised emotion categories with
and without graded clarity, a first analysis was per-
formed on all six emotion categories while not ac-
counting for clarity, and a second analysis on the four
clarity-graded emotion categories.
928 D. R. Bach et al.
The facial expression identification task used a two-
way ANOVA design with the within-subjects factor
emotion category, and the between-subjects factor
group. The other three facial control tasks followed a
one-way ANOVA design with the between-subjects
factor group.
Participants
Twenty-five patients with paranoid schizophrenia and
25 healthy control participants were studied, and 25
patients with unipolar depression served as a clinical
control group. Exclusion criteria for all participants
were psychiatric co-morbidity, known organic brain
damage, mental retardation, epilepsy, current drug
or alcohol abuse, and non-fluent command of the
German language. This was checked by interview for
all participants, and additionally by screening pa-
tients’ clinical documentation.
Patients were recruited as in-patients in the Uni-
versity Hospital for Psychiatry, Bern, Switzerland.
Diagnoses were made by the treating clinician and
confirmed by a clinically trained member of the study
group (D.R.B.). Patients with paranoid schizophrenia
were required to have a clinically confirmed diagnosis
according to the ICD-10 (WHO, 2004), as indicated by
a predominance of delusions and/or auditory hal-
lucinations. To ensure a stable diagnosis, it was also
required that the retrospectively assessed onset of first
symptoms was more than a year ago. Symptoms were
assessed with the Positive and Negative Symptom
Scale (PANSS; Kay et al. 1987). Patients with de-
pression fulfilled the ICD-10 criteria for unipolar de-
pression. Symptoms were additionally assessed with
the Beck Depression Inventory (BDI ; Hautzinger et al.
1994) and the 21-item version of the Hamilton De-
pression Rating Scale (HAMD; Hamilton, 1960). All
patients were approached as soon as the treating clin-
ician judged them to be able to give informed consent
and to maintain attention for the required amount of
time (about 2r15 min). Healthy control participants
were recruited from the general population by adver-
tisement and were given no reward for their partici-
pation.
The three groups were matched for gender and age
with a maximum difference of 5 years within each
triple. As it has been speculated that education might
influence emotional cue identification, all but two tri-
ples were also matched for secondary education. This
was achieved by drawing from a larger participant
pool the best-matching healthy and depressive par-
ticipant for each patient with schizophrenia. Socio-
demographic and illness-related characteristics of the
sample, including chlorpromazine equivalent (CPZ)
doses, are listed in Table 1. All participants gave
written informed consent, and the study was ap-
proved by the local ethics committee (Kantonale
Ethikkomission Bern).
Emotional prosody tasks
For the emotional prosody identification task, stimuli
from a validated set of Banse & Scherer (1996) were
used. The original work was concerned with acoustic
profiles in vocal emotion expression that addressed
the emotions fear, sadness, anger, disgust, neutral af-
fect, and happiness. In the original set, 12 professional
actors performed the emotions. There were two sen-
tences for each emotion and clarity level, and each
sentence was performed twice in two different elici-
ting scenarios. From the whole set, items were selected
on the basis of expert ratings by an independent group
of 12 actors. Those items were then included in a rec-
ognition study with naı̈ve participants. Into that rec-
ognition study, stimuli were included also from actors
who did not perform well on all emotions but only on
some. To minimize variance caused by low-level
acoustic features, we used only stimuli from the two
actors (one male, one female) who performed the
whole set of emotions. Therefore, the stimulus set used
in the present study comprised only a part of the
original set. Nine additional stimuli performed by a
different actor were used as practice items for the
present study.
Hence, there were eight items for each clarity level
of the clarity-graded emotions, for two actors, two
sentences, and two scenarios. For neutral and disgust,
there were two different items from each actor/sen-
tence/scenario combination, adding up to 16 items, to
keep the total number of items per emotion category
constant. The sentences were ‘Hat sundig pron you
venzy’ and ‘Fee gott laish jonkill gosterr ’. These
meaningless sentences comprise phonemes from sev-
eral Indo-European languages and resemble normal
speech. According to the validation study, ‘ listeners
generally have the impression of listening to an un-
known foreign language’ (Banse & Scherer, 1996).
Thus, the emotional prosody task used 96 stimuli
expressing fear, sadness, anger, disgust, neutral affect,
and happiness. Only stimuli for fear, sadness, anger,
and happiness were graded in two clarity categories.
It should be noted here that, in the original study,
high-intensity sadness (despair) was recognized
more poorly than lower-intensity sadness. Therefore,
it seemed appropriate to classify the stimuli according
to their clarity rather than to their intensity.
Each stimulus was about 2 s in length. Stimuli were
presented in randomized order. Participants re-
sponded by selecting the appropriate emotion cate-
gory. They had as much time to respond as they
Emotional prosody identification in schizophrenia 929
needed, but the presentation could not be repeated.
Most participants required about 15 min for the whole
task.
Facial Affect Computer Task (FACT)
Identification of emotional expression in faces was
used as a control paradigm. A computerized task was
adapted from a study by Feinberg et al. (1986) on
schizophrenia and affective disorders ; this task had
also been used in a well-controlled experiment on
emotional prosody and facial expression recognition
in first-episode schizophrenia by another study group
(Edwards et al. 2001). As the original Feinberg task
comprised seven emotion categories, including sur-
prise, we also used seven emotions for comparability
across studies. This, however, rendered the facial ex-
pression tasks slightly more difficult than the prosody
task, for which only six emotion categories were
available.
In addition to identification of emotional expression
in faces, the FACT includes facial expression dis-
crimination, face discrimination and reversed face
discrimination. Those tasks were also used in the
present study.
Twenty-one slides from the Pictures of Facial Affect
(Ekman&Friesen, 1975)were selected, showing photo-
graphs of three actors (MF1, NR1, C1) with standar-
dized poses of fear, sadness, anger, disgust, neutral
affect, surprise, and happiness. All faces were pre-
sented with a vertical visual angle of about 7x on a
white background. Stimulus order was randomized
for each participant. As in the prosody identification
task, participants had as much time to respond as they
needed, but the presentation could not be repeated.
FACTs 1 and 2. These tasks were designed to examine
facial identity discrimination regardless of emotional
content. On each trial, two faces were shown sequen-
tially with an interstimulus interval (ISI). Both tasks
used faces of two female actors (MF1 and NR1) with a
close resemblance to each other regarding hair, facial
size and complexion. Every emotion was paired with
every other emotion. There were 10 pairs of the same
actor, and 11 pairs of different actors. Participants had
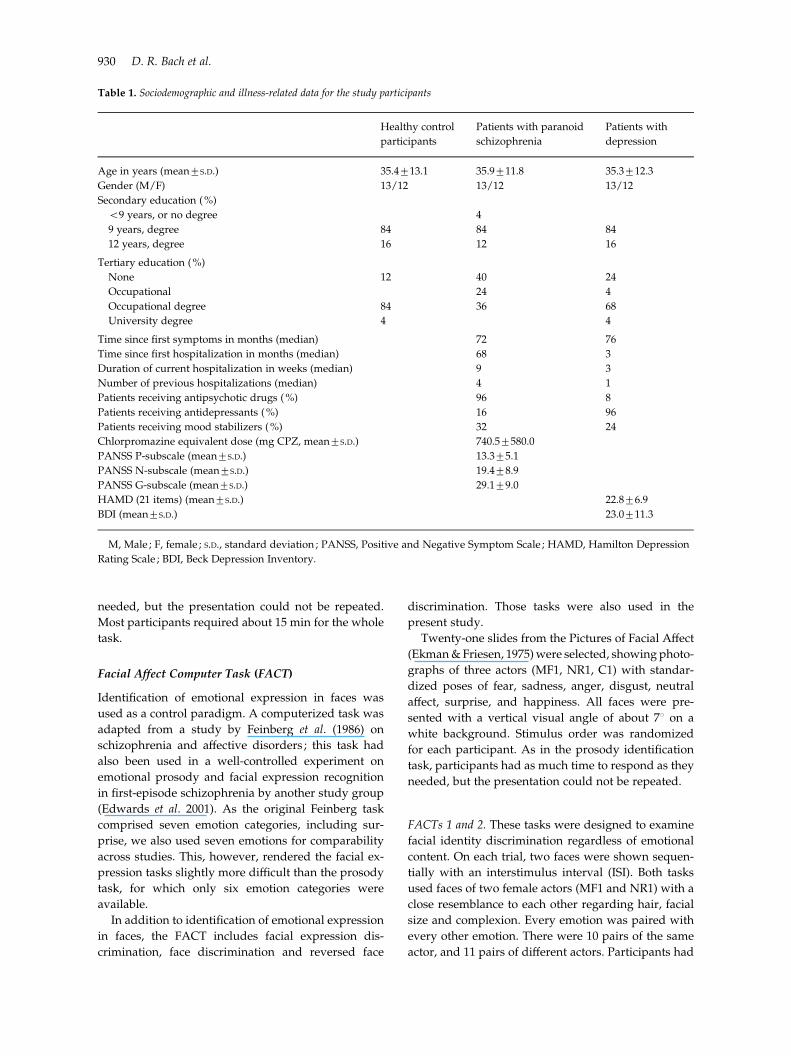
Table 1. Sociodemographic and illness-related data for the study participants
Healthy control
participants
Patients with paranoid
schizophrenia
Patients with
depression
Age in years (mean¡S.D.) 35.4¡13.1 35.9¡11.8 35.3¡12.3
Gender (M/F) 13/12 13/12 13/12
Secondary education (%)
<9 years, or no degree 4
9 years, degree 84 84 84
12 years, degree 16 12 16
Tertiary education (%)
None 12 40 24
Occupational 24 4
Occupational degree 84 36 68
University degree 4 4
Time since first symptoms in months (median) 72 76
Time since first hospitalization in months (median) 68 3
Duration of current hospitalization in weeks (median) 9 3
Number of previous hospitalizations (median) 4 1
Patients receiving antipsychotic drugs (%) 96 8
Patients receiving antidepressants (%) 16 96
Patients receiving mood stabilizers (%) 32 24
Chlorpromazine equivalent dose (mg CPZ, mean¡S.D.) 740.5¡580.0
PANSS P-subscale (mean¡S.D.) 13.3¡5.1
PANSS N-subscale (mean¡S.D.) 19.4¡8.9
PANSS G-subscale (mean¡S.D.) 29.1¡9.0
HAMD (21 items) (mean¡S.D.) 22.8¡6.9
BDI (mean¡S.D.) 23.0¡11.3
M, Male ; F, female ; S.D., standard deviation ; PANSS, Positive and Negative Symptom Scale ; HAMD, Hamilton Depression
Rating Scale ; BDI, Beck Depression Inventory.
930 D. R. Bach et al.
to select whether they saw the same person or not. In
FACT 1, they saw the faces upside-down. Because
FACT 1 is more difficult than the other tasks, each face
was presented for 2000 ms in FACT 1 and for 500 ms
in FACT 2 with an 1000 ms ISI. This is in accordance
with previous studies using FACT.
FACT 3. This was a facial expression discrimination
task. On each trial, two faces were shown sequentially
for 500 ms with an ISI of 1000 ms. Participants saw
42 combinations of three actors, of which 21 pairs had
the same emotion (each emotion was repeated three
times in different pairs of actors) and 21 had different
emotions (each emotion was paired once with each of
the other emotions). Participants selected if they had
seen the same emotion in both faces or not.
FACT 4. In the proper facial expression identification
task, participants were shown all 21 slides for 500 ms
and had to select the appropriate emotion category
from a set of seven categories.
Procedure
As we were mainly interested in emotional prosody
identification and used the FACT as the control task,
the order of the tests was constant for all participants.
After completing the emotional prosody identification
task, FACTs 1–4 were conducted.
Apparatus
All experiments were programmed in e-prime ver-
sion 1.1.4.4 (Psychology Software Tools, Pittsburgh
PA, USA) and run on a laptop usingWindows XPwith
a 14-inch LCD screen. Auditory stimuli were pre-
sented through headphones (SBC HP800, Philips,
Amsterdam, The Netherlands). In all tasks, partici-
pants selected the correct response with a computer
mouse. Data extraction was conducted using R
(www.r-project.org).
Statistical analysis
To test the hypothesis that patients with paranoid
schizophrenia perform worse than both healthy con-
trol participants and the clinical control group, the
following a priori contrasts were defined for the
group factor in all analyses and were tested simul-
taneously : (1) healthy control participants versus
patients with paranoid schizophrenia, and (2) patients
with depression versus patients with paranoid schizo-
phrenia.
Emotional prosody identification was analysed
using a 3 (group) r 6 (emotion) repeated-measures
ANOVA in the GLM procedure of SPSS version 12.0
(SPSS Inc., Chicago, IL, USA). For emotions with high-
and low-clarity stimuli, both clarity levels were col-
lapsed for this analysis. Performance differences in
single emotion categories were tested as a priori con-
trasts for deviation from the group mean.
Influence of emotion clarity on emotional prosody
identification was analysed using a 3 (group) r 4
(emotion) r 2 (emotion clarity) repeated-measures
ANOVA, using only emotions with high- and low-
clarity stimuli (i.e. excluding disgust and neutral af-
fect). Performance differences in both levels of clarity
were tested separately as a priori contrasts.
Facial expression identification was analysed using
a 3 (group)r7 (emotion) repeated-measures ANOVA.
Performance differences in single emotion categories
were tested as a priori contrasts for deviation from the
group mean.
The results for facial expression discrimination, face
discrimination and reverse face discrimination were
calculated as overall task performance and analysed
using a one-way ANOVA with three levels for the
group factor.
To assess the association of emotional prosody
identification with identification of emotional facial
expression, gender, and disorder-related variables
(PANSS subscales, CPZ equivalents, time since ill-
ness onset, time since first hospitalization, number of
hospitalizations, duration of current hospitalization),
those were entered into a multiple regression model in
SPSS. Forward, backward and stepwise methods were
compared and led to the same results.
As one previous study found an effect of gender on
emotional prosody identification in schizophrenia
(Bozikas et al. 2004), gender was introduced into all
ANOVAs as an independent parameter in an ex-
ploratory analysis. As there were no main or interac-
tion effects of gender, the results from these analyses
are omitted here.
Results
Emotional prosody identification
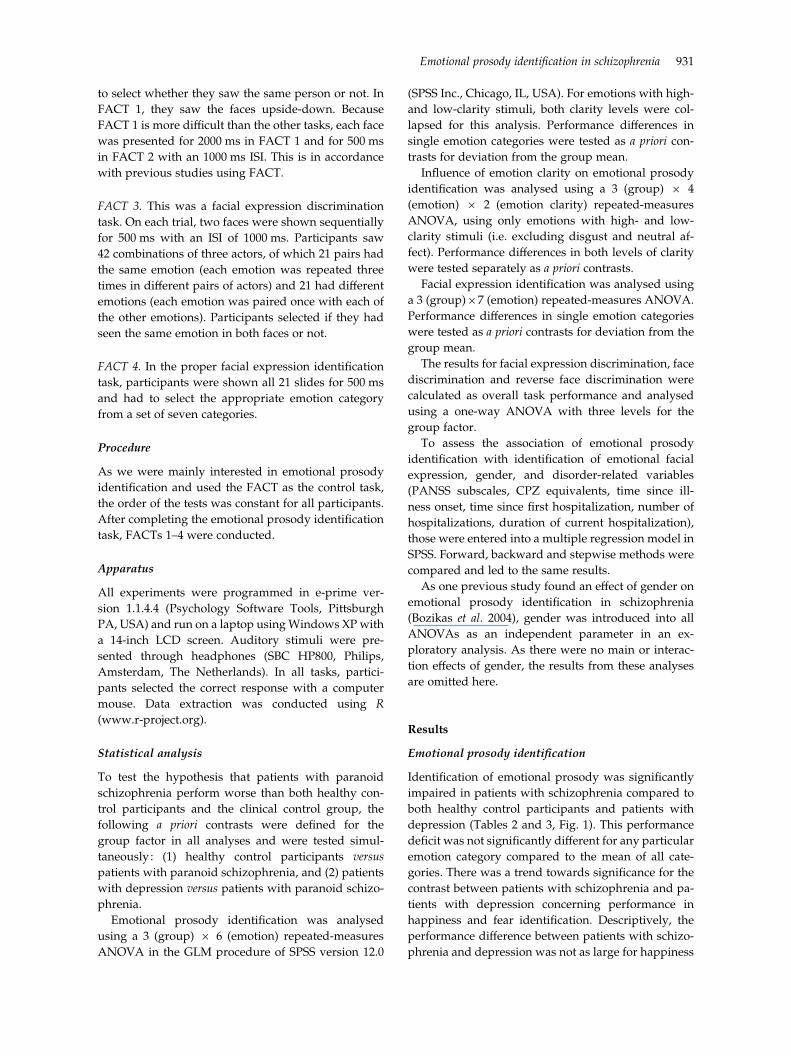
Identification of emotional prosody was significantly
impaired in patients with schizophrenia compared to
both healthy control participants and patients with
depression (Tables 2 and 3, Fig. 1). This performance
deficit was not significantly different for any particular
emotion category compared to the mean of all cate-
gories. There was a trend towards significance for the
contrast between patients with schizophrenia and pa-
tients with depression concerning performance in
happiness and fear identification. Descriptively, the
performance difference between patients with schizo-
phrenia and depression was not as large for happiness
Emotional prosody identification in schizophrenia 931
as for the other emotion categories, and it was greater
for fear than for the other emotions. In other words,
although patients with depression generally per-
formed better than patients with schizophrenia, they
performed much better in the recognition of fear,
whereas the performances of the two groups were
more similar in the identification of happiness.
In a three-way ANOVA model including group,
emotion category and emotion clarity, there was a
strong grouprclarity interaction. That is, the influ-
ence of emotion clarity on emotional prosody identi-
fication was less pronounced in patients with
schizophrenia than in healthy control participants
(Tables 2 and 3, Fig. 2). Although the performance
of these groups did not differ for low-clarity stimuli,
patients with schizophrenia performed worse than
healthy control participants on high-clarity stimuli. In
other words, the performance deficit of patients with
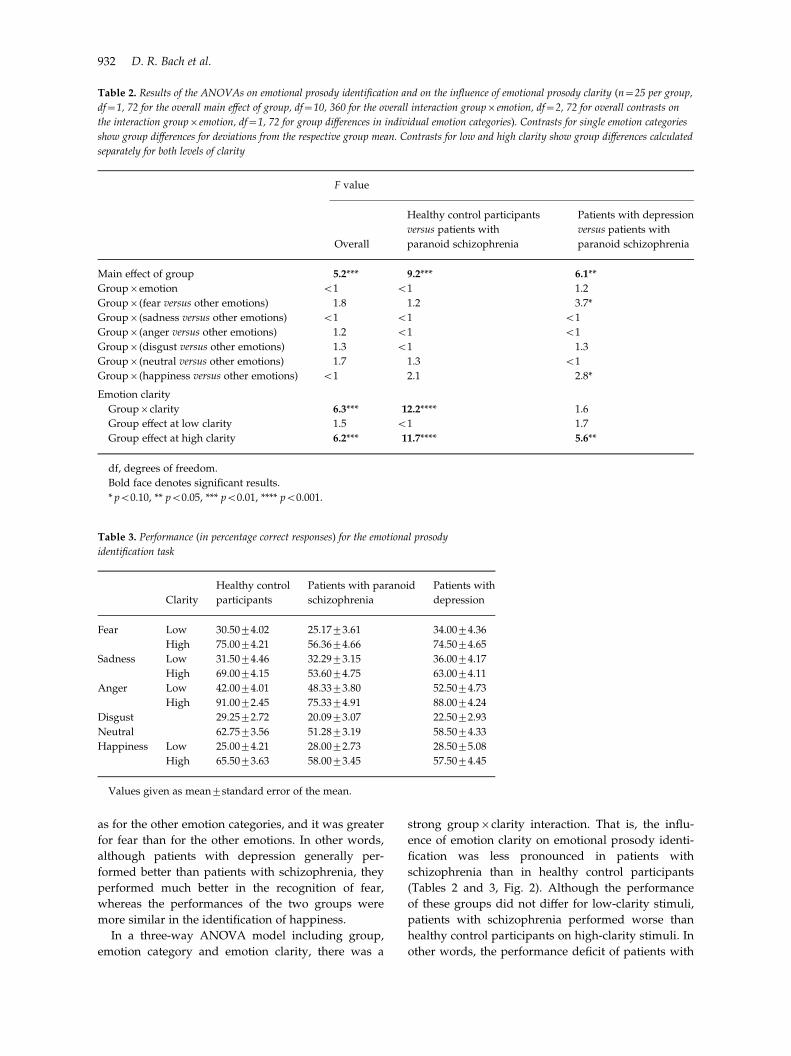
Table 3. Performance (in percentage correct responses) for the emotional prosody
identification task
Clarity
Healthy control
participants
Patients with paranoid
schizophrenia
Patients with
depression
Fear Low 30.50¡4.02 25.17¡3.61 34.00¡4.36
High 75.00¡4.21 56.36¡4.66 74.50¡4.65
Sadness Low 31.50¡4.46 32.29¡3.15 36.00¡4.17
High 69.00¡4.15 53.60¡4.75 63.00¡4.11
Anger Low 42.00¡4.01 48.33¡3.80 52.50¡4.73
High 91.00¡2.45 75.33¡4.91 88.00¡4.24
Disgust 29.25¡2.72 20.09¡3.07 22.50¡2.93
Neutral 62.75¡3.56 51.28¡3.19 58.50¡4.33
Happiness Low 25.00¡4.21 28.00¡2.73 28.50¡5.08
High 65.50¡3.63 58.00¡3.45 57.50¡4.45
Values given as mean¡standard error of the mean.
Table 2. Results of the ANOVAs on emotional prosody identification and on the influence of emotional prosody clarity (n=25 per group,
df=1, 72 for the overall main effect of group, df=10, 360 for the overall interaction groupremotion, df=2, 72 for overall contrasts on
the interaction groupremotion, df=1, 72 for group differences in individual emotion categories). Contrasts for single emotion categories
show group differences for deviations from the respective group mean. Contrasts for low and high clarity show group differences calculated
separately for both levels of clarity
F value
Overall
Healthy control participants
versus patients with
paranoid schizophrenia
Patients with depression
versus patients with
paranoid schizophrenia
Main effect of group 5.2*** 9.2*** 6.1**
Groupremotion <1 <1 1.2
Groupr(fear versus other emotions) 1.8 1.2 3.7*
Groupr(sadness versus other emotions) <1 <1 <1
Groupr(anger versus other emotions) 1.2 <1 <1
Groupr(disgust versus other emotions) 1.3 <1 1.3
Groupr(neutral versus other emotions) 1.7 1.3 <1
Groupr(happiness versus other emotions) <1 2.1 2.8*
Emotion clarity
Grouprclarity 6.3*** 12.2**** 1.6
Group effect at low clarity 1.5 <1 1.7
Group effect at high clarity 6.2*** 11.7**** 5.6**
df, degrees of freedom.
Bold face denotes significant results.
* p<0.10, ** p<0.05, *** p<0.01, **** p<0.001.
932 D. R. Bach et al.
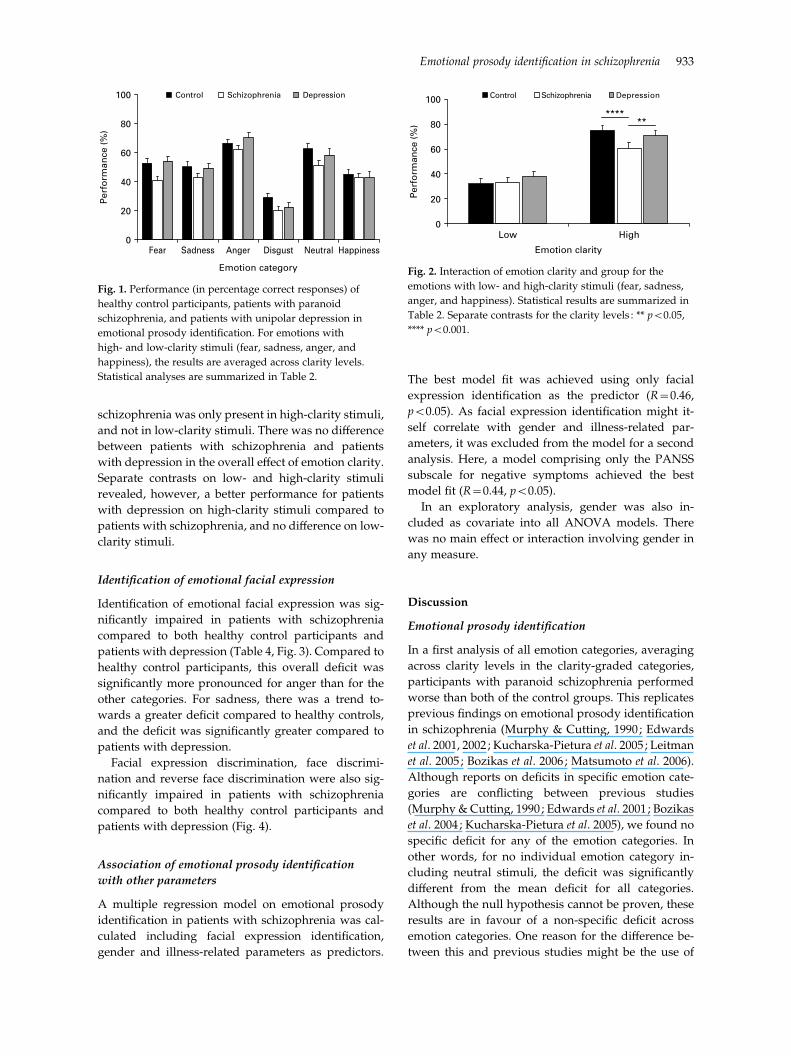
schizophrenia was only present in high-clarity stimuli,
and not in low-clarity stimuli. There was no difference
between patients with schizophrenia and patients
with depression in the overall effect of emotion clarity.
Separate contrasts on low- and high-clarity stimuli
revealed, however, a better performance for patients
with depression on high-clarity stimuli compared to
patients with schizophrenia, and no difference on low-
clarity stimuli.
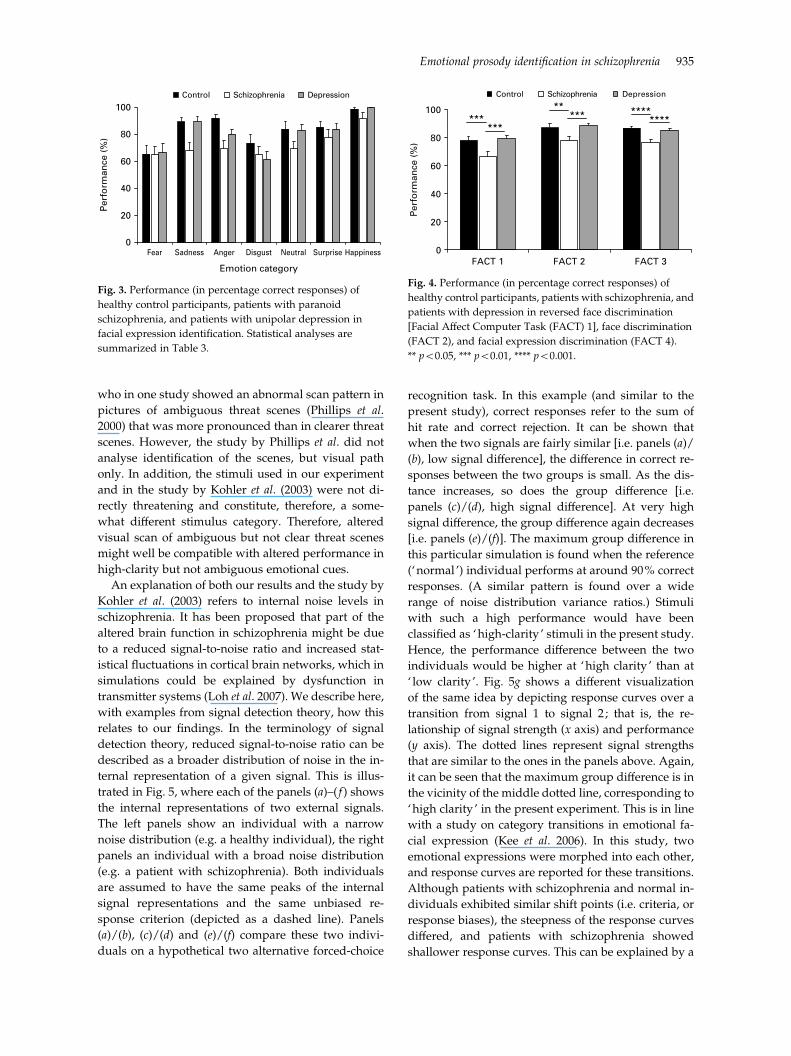
Identification of emotional facial expression
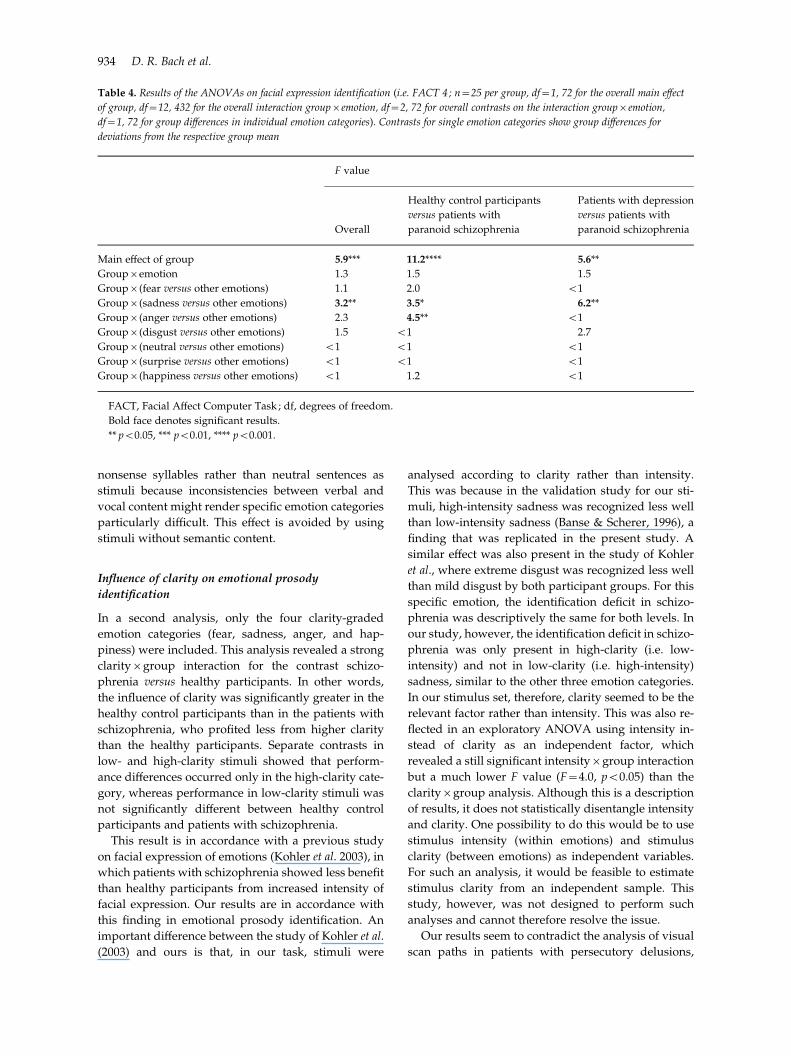
Identification of emotional facial expression was sig-
nificantly impaired in patients with schizophrenia
compared to both healthy control participants and
patients with depression (Table 4, Fig. 3). Compared to
healthy control participants, this overall deficit was
significantly more pronounced for anger than for the
other categories. For sadness, there was a trend to-
wards a greater deficit compared to healthy controls,
and the deficit was significantly greater compared to
patients with depression.
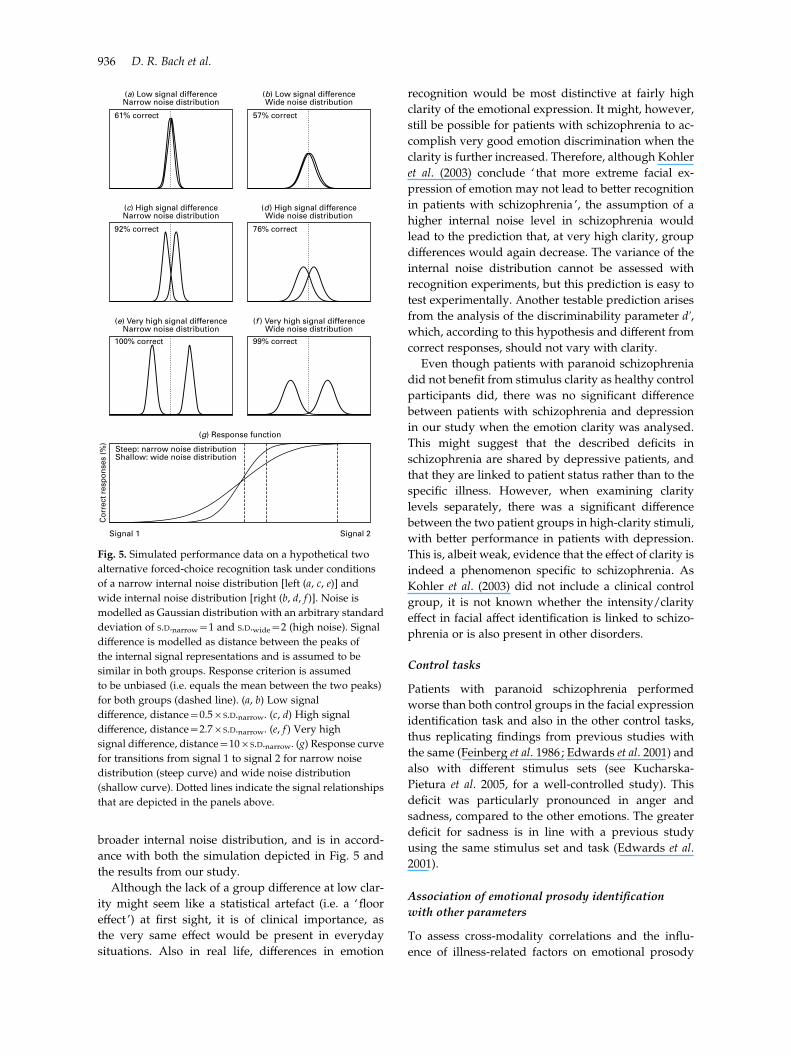
Facial expression discrimination, face discrimi-
nation and reverse face discrimination were also sig-
nificantly impaired in patients with schizophrenia
compared to both healthy control participants and
patients with depression (Fig. 4).
Association of emotional prosody identification
with other parameters
A multiple regression model on emotional prosody
identification in patients with schizophrenia was cal-
culated including facial expression identification,
gender and illness-related parameters as predictors.
The best model fit was achieved using only facial
expression identification as the predictor (R=0.46,
p<0.05). As facial expression identification might it-
self correlate with gender and illness-related par-
ameters, it was excluded from the model for a second
analysis. Here, a model comprising only the PANSS
subscale for negative symptoms achieved the best
model fit (R=0.44, p<0.05).
In an exploratory analysis, gender was also in-
cluded as covariate into all ANOVA models. There
was no main effect or interaction involving gender in
any measure.
Discussion
Emotional prosody identification
In a first analysis of all emotion categories, averaging
across clarity levels in the clarity-graded categories,
participants with paranoid schizophrenia performed
worse than both of the control groups. This replicates
previous findings on emotional prosody identification
in schizophrenia (Murphy & Cutting, 1990; Edwards
et al. 2001, 2002 ; Kucharska-Pietura et al. 2005 ; Leitman
et al. 2005 ; Bozikas et al. 2006 ; Matsumoto et al. 2006).
Although reports on deficits in specific emotion cate-
gories are conflicting between previous studies
(Murphy & Cutting, 1990 ; Edwards et al. 2001; Bozikas
et al. 2004 ; Kucharska-Pietura et al. 2005), we found no
specific deficit for any of the emotion categories. In
other words, for no individual emotion category in-
cluding neutral stimuli, the deficit was significantly
different from the mean deficit for all categories.
Although the null hypothesis cannot be proven, these
results are in favour of a non-specific deficit across
emotion categories. One reason for the difference be-
tween this and previous studies might be the use of
0
20
40
60
80
100
Fear Sadness Anger Disgust Neutral Happiness
Emotion category
Per
form
ance
(%
)Control Schizophrenia Depression
Fig. 1. Performance (in percentage correct responses) of
healthy control participants, patients with paranoid
schizophrenia, and patients with unipolar depression in
emotional prosody identification. For emotions with
high- and low-clarity stimuli (fear, sadness, anger, and
happiness), the results are averaged across clarity levels.
Statistical analyses are summarized in Table 2.
0
20
40
60
80
100
Low High
Emotion clarity
Per
form
ance
(%
)
Control Schizophrenia Depression
******
Fig. 2. Interaction of emotion clarity and group for the
emotions with low- and high-clarity stimuli (fear, sadness,
anger, and happiness). Statistical results are summarized in
Table 2. Separate contrasts for the clarity levels : ** p<0.05,
**** p<0.001.
Emotional prosody identification in schizophrenia 933
nonsense syllables rather than neutral sentences as
stimuli because inconsistencies between verbal and
vocal content might render specific emotion categories
particularly difficult. This effect is avoided by using
stimuli without semantic content.
Influence of clarity on emotional prosody
identification
In a second analysis, only the four clarity-graded
emotion categories (fear, sadness, anger, and hap-
piness) were included. This analysis revealed a strong
clarityrgroup interaction for the contrast schizo-
phrenia versus healthy participants. In other words,
the influence of clarity was significantly greater in the
healthy control participants than in the patients with
schizophrenia, who profited less from higher clarity
than the healthy participants. Separate contrasts in
low- and high-clarity stimuli showed that perform-
ance differences occurred only in the high-clarity cate-
gory, whereas performance in low-clarity stimuli was
not significantly different between healthy control
participants and patients with schizophrenia.
This result is in accordance with a previous study
on facial expression of emotions (Kohler et al. 2003), in
which patients with schizophrenia showed less benefit
than healthy participants from increased intensity of
facial expression. Our results are in accordance with
this finding in emotional prosody identification. An
important difference between the study of Kohler et al.
(2003) and ours is that, in our task, stimuli were
analysed according to clarity rather than intensity.
This was because in the validation study for our sti-
muli, high-intensity sadness was recognized less well
than low-intensity sadness (Banse & Scherer, 1996), a
finding that was replicated in the present study. A
similar effect was also present in the study of Kohler
et al., where extreme disgust was recognized less well
than mild disgust by both participant groups. For this
specific emotion, the identification deficit in schizo-
phrenia was descriptively the same for both levels. In
our study, however, the identification deficit in schizo-
phrenia was only present in high-clarity (i.e. low-
intensity) and not in low-clarity (i.e. high-intensity)
sadness, similar to the other three emotion categories.
In our stimulus set, therefore, clarity seemed to be the
relevant factor rather than intensity. This was also re-
flected in an exploratory ANOVA using intensity in-
stead of clarity as an independent factor, which
revealed a still significant intensityrgroup interaction
but a much lower F value (F=4.0, p<0.05) than the
clarityrgroup analysis. Although this is a description
of results, it does not statistically disentangle intensity
and clarity. One possibility to do this would be to use
stimulus intensity (within emotions) and stimulus
clarity (between emotions) as independent variables.
For such an analysis, it would be feasible to estimate
stimulus clarity from an independent sample. This
study, however, was not designed to perform such
analyses and cannot therefore resolve the issue.
Our results seem to contradict the analysis of visual
scan paths in patients with persecutory delusions,
Table 4. Results of the ANOVAs on facial expression identification (i.e. FACT 4 ; n=25 per group, df=1, 72 for the overall main effect
of group, df=12, 432 for the overall interaction groupremotion, df=2, 72 for overall contrasts on the interaction groupremotion,
df=1, 72 for group differences in individual emotion categories). Contrasts for single emotion categories show group differences for
deviations from the respective group mean
F value
Overall
Healthy control participants
versus patients with
paranoid schizophrenia
Patients with depression
versus patients with
paranoid schizophrenia
Main effect of group 5.9*** 11.2**** 5.6**
Groupremotion 1.3 1.5 1.5
Groupr(fear versus other emotions) 1.1 2.0 <1
Groupr(sadness versus other emotions) 3.2** 3.5* 6.2**
Groupr(anger versus other emotions) 2.3 4.5** <1
Groupr(disgust versus other emotions) 1.5 <1 2.7
Groupr(neutral versus other emotions) <1 <1 <1
Groupr(surprise versus other emotions) <1 <1 <1
Groupr(happiness versus other emotions) <1 1.2 <1
FACT, Facial Affect Computer Task ; df, degrees of freedom.
Bold face denotes significant results.
** p<0.05, *** p<0.01, **** p<0.001.
934 D. R. Bach et al.
who in one study showed an abnormal scan pattern in
pictures of ambiguous threat scenes (Phillips et al.
2000) that was more pronounced than in clearer threat
scenes. However, the study by Phillips et al. did not
analyse identification of the scenes, but visual path
only. In addition, the stimuli used in our experiment
and in the study by Kohler et al. (2003) were not di-
rectly threatening and constitute, therefore, a some-
what different stimulus category. Therefore, altered
visual scan of ambiguous but not clear threat scenes
might well be compatible with altered performance in
high-clarity but not ambiguous emotional cues.
An explanation of both our results and the study by
Kohler et al. (2003) refers to internal noise levels in
schizophrenia. It has been proposed that part of the
altered brain function in schizophrenia might be due
to a reduced signal-to-noise ratio and increased stat-
istical fluctuations in cortical brain networks, which in
simulations could be explained by dysfunction in
transmitter systems (Loh et al. 2007). We describe here,
with examples from signal detection theory, how this
relates to our findings. In the terminology of signal
detection theory, reduced signal-to-noise ratio can be
described as a broader distribution of noise in the in-
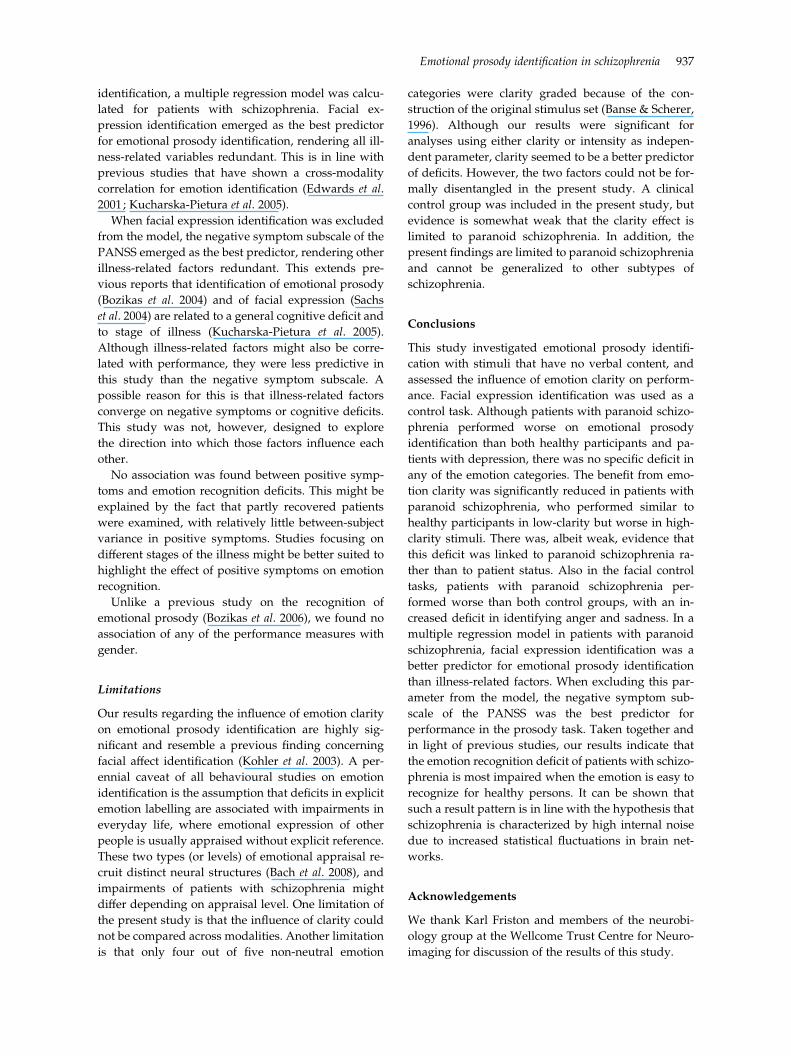
ternal representation of a given signal. This is illus-
trated in Fig. 5, where each of the panels (a)–( f ) shows
the internal representations of two external signals.
The left panels show an individual with a narrow
noise distribution (e.g. a healthy individual), the right
panels an individual with a broad noise distribution
(e.g. a patient with schizophrenia). Both individuals
are assumed to have the same peaks of the internal
signal representations and the same unbiased re-
sponse criterion (depicted as a dashed line). Panels
(a)/(b), (c)/(d) and (e)/(f) compare these two indivi-
duals on a hypothetical two alternative forced-choice
recognition task. In this example (and similar to the
present study), correct responses refer to the sum of
hit rate and correct rejection. It can be shown that
when the two signals are fairly similar [i.e. panels (a)/
(b), low signal difference], the difference in correct re-
sponses between the two groups is small. As the dis-
tance increases, so does the group difference [i.e.
panels (c)/(d), high signal difference]. At very high
signal difference, the group difference again decreases
[i.e. panels (e)/(f)]. The maximum group difference in
this particular simulation is found when the reference
(‘normal ’) individual performs at around 90% correct
responses. (A similar pattern is found over a wide
range of noise distribution variance ratios.) Stimuli
with such a high performance would have been
classified as ‘high-clarity ’ stimuli in the present study.
Hence, the performance difference between the two
individuals would be higher at ‘high clarity ’ than at
‘ low clarity ’. Fig. 5g shows a different visualization
of the same idea by depicting response curves over a
transition from signal 1 to signal 2 ; that is, the re-
lationship of signal strength (x axis) and performance
(y axis). The dotted lines represent signal strengths
that are similar to the ones in the panels above. Again,
it can be seen that the maximum group difference is in
the vicinity of the middle dotted line, corresponding to
‘high clarity ’ in the present experiment. This is in line
with a study on category transitions in emotional fa-
cial expression (Kee et al. 2006). In this study, two
emotional expressions were morphed into each other,
and response curves are reported for these transitions.
Although patients with schizophrenia and normal in-
dividuals exhibited similar shift points (i.e. criteria, or
response biases), the steepness of the response curves
differed, and patients with schizophrenia showed
shallower response curves. This can be explained by a
0
20
40
60
80
100
Fear Sadness Anger Disgust Neutral Surprise Happiness
Emotion category
Per
form
ance
(%
)Control Schizophrenia Depression
Fig. 3. Performance (in percentage correct responses) of
healthy control participants, patients with paranoid
schizophrenia, and patients with unipolar depression in
facial expression identification. Statistical analyses are
summarized in Table 3.
0
20
40
60
80
100
FACT 1 FACT 2 FACT 3
Per
form
ance
(%
)
Control Schizophrenia Depression
******
***** ****
****
Fig. 4. Performance (in percentage correct responses) of
healthy control participants, patients with schizophrenia, and
patients with depression in reversed face discrimination
[Facial Affect Computer Task (FACT) 1], face discrimination
(FACT 2), and facial expression discrimination (FACT 4).
** p<0.05, *** p<0.01, **** p<0.001.
Emotional prosody identification in schizophrenia 935
broader internal noise distribution, and is in accord-
ance with both the simulation depicted in Fig. 5 and
the results from our study.
Although the lack of a group difference at low clar-
ity might seem like a statistical artefact (i.e. a ‘floor
effect ’) at first sight, it is of clinical importance, as
the very same effect would be present in everyday
situations. Also in real life, differences in emotion
recognition would be most distinctive at fairly high
clarity of the emotional expression. It might, however,
still be possible for patients with schizophrenia to ac-
complish very good emotion discrimination when the
clarity is further increased. Therefore, although Kohler
et al. (2003) conclude ‘ that more extreme facial ex-
pression of emotion may not lead to better recognition
in patients with schizophrenia ’, the assumption of a
higher internal noise level in schizophrenia would
lead to the prediction that, at very high clarity, group
differences would again decrease. The variance of the
internal noise distribution cannot be assessed with
recognition experiments, but this prediction is easy to
test experimentally. Another testable prediction arises
from the analysis of the discriminability parameter dk,which, according to this hypothesis and different from
correct responses, should not vary with clarity.
Even though patients with paranoid schizophrenia
did not benefit from stimulus clarity as healthy control
participants did, there was no significant difference
between patients with schizophrenia and depression
in our study when the emotion clarity was analysed.
This might suggest that the described deficits in
schizophrenia are shared by depressive patients, and
that they are linked to patient status rather than to the
specific illness. However, when examining clarity
levels separately, there was a significant difference
between the two patient groups in high-clarity stimuli,
with better performance in patients with depression.
This is, albeit weak, evidence that the effect of clarity is
indeed a phenomenon specific to schizophrenia. As
Kohler et al. (2003) did not include a clinical control
group, it is not known whether the intensity/clarity
effect in facial affect identification is linked to schizo-
phrenia or is also present in other disorders.
Control tasks
Patients with paranoid schizophrenia performed
worse than both control groups in the facial expression
identification task and also in the other control tasks,
thus replicating findings from previous studies with
the same (Feinberg et al. 1986 ; Edwards et al. 2001) and
also with different stimulus sets (see Kucharska-
Pietura et al. 2005, for a well-controlled study). This
deficit was particularly pronounced in anger and
sadness, compared to the other emotions. The greater
deficit for sadness is in line with a previous study
using the same stimulus set and task (Edwards et al.
2001).
Association of emotional prosody identification
with other parameters
To assess cross-modality correlations and the influ-
ence of illness-related factors on emotional prosody
(a) Low signal differenceNarrow noise distribution
(b) Low signal differenceWide noise distribution
(c) High signal differenceNarrow noise distribution
(d) High signal differenceWide noise distribution
(e) Very high signal differenceNarrow noise distribution
(g) Response function
Steep: narrow noise distributionShallow: wide noise distribution
Signal 1
Cor
rect
res
pons
es (%
)
Signal 2
(f ) Very high signal differenceWide noise distribution
61% correct 57% correct
92% correct 76% correct
100% correct 99% correct
Fig. 5. Simulated performance data on a hypothetical two
alternative forced-choice recognition task under conditions
of a narrow internal noise distribution [left (a, c, e)] and
wide internal noise distribution [right (b, d, f )]. Noise is
modelled as Gaussian distribution with an arbitrary standard
deviation of S.D.narrow=1 and S.D.wide=2 (high noise). Signal
difference is modelled as distance between the peaks of
the internal signal representations and is assumed to be
similar in both groups. Response criterion is assumed
to be unbiased (i.e. equals the mean between the two peaks)
for both groups (dashed line). (a, b) Low signal
difference, distance=0.5rS.D.narrow. (c, d) High signal
difference, distance=2.7rS.D.narrow. (e, f ) Very high
signal difference, distance=10rS.D.narrow. (g) Response curve
for transitions from signal 1 to signal 2 for narrow noise
distribution (steep curve) and wide noise distribution
(shallow curve). Dotted lines indicate the signal relationships
that are depicted in the panels above.
936 D. R. Bach et al.
identification, a multiple regression model was calcu-
lated for patients with schizophrenia. Facial ex-
pression identification emerged as the best predictor
for emotional prosody identification, rendering all ill-
ness-related variables redundant. This is in line with
previous studies that have shown a cross-modality
correlation for emotion identification (Edwards et al.
2001 ; Kucharska-Pietura et al. 2005).
When facial expression identification was excluded
from the model, the negative symptom subscale of the
PANSS emerged as the best predictor, rendering other
illness-related factors redundant. This extends pre-
vious reports that identification of emotional prosody
(Bozikas et al. 2004) and of facial expression (Sachs
et al. 2004) are related to a general cognitive deficit and
to stage of illness (Kucharska-Pietura et al. 2005).
Although illness-related factors might also be corre-
lated with performance, they were less predictive in
this study than the negative symptom subscale. A
possible reason for this is that illness-related factors
converge on negative symptoms or cognitive deficits.
This study was not, however, designed to explore
the direction into which those factors influence each
other.
No association was found between positive symp-
toms and emotion recognition deficits. This might be
explained by the fact that partly recovered patients
were examined, with relatively little between-subject
variance in positive symptoms. Studies focusing on
different stages of the illness might be better suited to
highlight the effect of positive symptoms on emotion
recognition.
Unlike a previous study on the recognition of
emotional prosody (Bozikas et al. 2006), we found no
association of any of the performance measures with
gender.
Limitations
Our results regarding the influence of emotion clarity
on emotional prosody identification are highly sig-
nificant and resemble a previous finding concerning
facial affect identification (Kohler et al. 2003). A per-
ennial caveat of all behavioural studies on emotion
identification is the assumption that deficits in explicit
emotion labelling are associated with impairments in
everyday life, where emotional expression of other
people is usually appraised without explicit reference.
These two types (or levels) of emotional appraisal re-
cruit distinct neural structures (Bach et al. 2008), and
impairments of patients with schizophrenia might
differ depending on appraisal level. One limitation of
the present study is that the influence of clarity could
not be compared across modalities. Another limitation
is that only four out of five non-neutral emotion
categories were clarity graded because of the con-
struction of the original stimulus set (Banse & Scherer,
1996). Although our results were significant for
analyses using either clarity or intensity as indepen-
dent parameter, clarity seemed to be a better predictor
of deficits. However, the two factors could not be for-
mally disentangled in the present study. A clinical
control group was included in the present study, but
evidence is somewhat weak that the clarity effect is
limited to paranoid schizophrenia. In addition, the
present findings are limited to paranoid schizophrenia
and cannot be generalized to other subtypes of
schizophrenia.
Conclusions
This study investigated emotional prosody identifi-
cation with stimuli that have no verbal content, and
assessed the influence of emotion clarity on perform-
ance. Facial expression identification was used as a
control task. Although patients with paranoid schizo-
phrenia performed worse on emotional prosody
identification than both healthy participants and pa-
tients with depression, there was no specific deficit in
any of the emotion categories. The benefit from emo-
tion clarity was significantly reduced in patients with
paranoid schizophrenia, who performed similar to
healthy participants in low-clarity but worse in high-
clarity stimuli. There was, albeit weak, evidence that
this deficit was linked to paranoid schizophrenia ra-
ther than to patient status. Also in the facial control
tasks, patients with paranoid schizophrenia per-
formed worse than both control groups, with an in-
creased deficit in identifying anger and sadness. In a
multiple regression model in patients with paranoid
schizophrenia, facial expression identification was a
better predictor for emotional prosody identification
than illness-related factors. When excluding this par-
ameter from the model, the negative symptom sub-
scale of the PANSS was the best predictor for
performance in the prosody task. Taken together and
in light of previous studies, our results indicate that
the emotion recognition deficit of patients with schizo-
phrenia is most impaired when the emotion is easy to
recognize for healthy persons. It can be shown that
such a result pattern is in line with the hypothesis that
schizophrenia is characterized by high internal noise
due to increased statistical fluctuations in brain net-
works.
Acknowledgements
We thank Karl Friston and members of the neurobi-
ology group at the Wellcome Trust Centre for Neuro-
imaging for discussion of the results of this study.
Emotional prosody identification in schizophrenia 937
Declaration of Interest
None.
References
Bach DR, Grandjean D, Sander D, Herdener M, Strik WK,
Seifritz E (2008). The effect of appraisal level on processing
of emotional prosody in meaningless speech. Neuroimage
42, 919–927.
Banse R, Scherer KR (1996). Acoustic profiles in vocal
emotion expression. Journal of Personality and Social
Psychology 70, 614–636.
Bozikas VP, Kosmidis MH, Anezoulaki D, Giannakou M,
Andreou C, Karavatos A (2006). Impaired perception of
affective prosody in schizophrenia. Journal of
Neuropsychiatry and Clinical Neurosciences 18, 81–85.
Bozikas VP, Kosmidis MH, Anezoulaki D, Giannakou M,
Karavatos A (2004). Relationship of affect recognition with
psychopathology and cognitive performance in
schizophrenia. Journal of the International Neuropsychological
Society 10, 549–558.
Edwards J, Jackson HJ, Pattison PE (2002). Emotion
recognition via facial expression and affective prosody in
schizophrenia : a methodological review. Clinical
Psychology Review 22, 789–832.
Edwards J, Pattison PE, Jackson HJ, Wales RJ (2001). Facial
affect and affective prosody recognition in first-episode
schizophrenia. Schizophrenia Research 48, 235–253.
Ekman P, Friesen W (1975). Pictures of Facial Affect.
Consulting Psychologists Press : Palo Alto, CA.
Feinberg TE, Rifkin A, Schaffer C, Walker E (1986). Facial
discrimination and emotional recognition in schizophrenia
and affective disorders. Archives of General Psychiatry 43,
276–279.
Gaebel W, Wolwer W (1992). Facial expression and
emotional face recognition in schizophrenia and
depression. European Archives of Psychiatry and Clinical
Neuroscience 242, 46–52.
Gessler S, Cutting J, Frith CD, Weinman J (1989).
Schizophrenic inability to judge facial emotion : a
controlled study. British Journal of Clinical Psychology 28,
19–29.
Grandjean D, Sander D, Pourtois G, Schwartz S, Seghier
ML, Scherer KR, Vuilleumier P (2005). The voices of
wrath : brain responses to angry prosody in meaningless
speech. Nature Neuroscience 8, 145–146.
Hamilton M (1960). A rating scale for depression. Journal of
Neurology, Neurosurgery and Psychiatry 23, 56–62.
Hautzinger M, Bailer M, Worall H, Keller F (1994). The Beck
Depression Inventory [in German]. Hans Huber : Bern.
Kay SR, Fiszbein A, Opler LA (1987). The positive and
negative syndrome scale (PANSS) for schizophrenia.
Schizophrenia Bulletin 13, 261–276.
Kee KS, HoranWP, Wynn JK, Mintz J, Green MF (2006). An
analysis of categorical perception of facial emotion in
schizophrenia. Schizophrenia Research 87, 228–237.
Kohler CG, Martin EA (2006). Emotional processing in
schizophrenia. Cognitive Neuropsychiatry 11, 250–271.
Kohler CG, Turner TH, Bilker WB, Brensinger CM,
Siegel SJ, Kanes SJ, Gur RE, Gur RC (2003). Facial
emotion recognition in schizophrenia : intensity effects
and error pattern. American Journal of Psychiatry 160,
1768–1774.
Kotz SA, Meyer M, Alter K, Besson M, von Cramon DY,
Friederici AD (2003). On the lateralization of emotional
prosody : an event-related functional MR investigation.
Brain and Language 86, 366–376.
Kucharska-Pietura K, David AS, Masiak M, Phillips ML
(2005). Perception of facial and vocal affect by people with
schizophrenia in early and late stages of illness. British
Journal of Psychiatry 187, 523–528.
Leitman DI, Foxe JJ, Butler PD, Saperstein A, Revheim N,
Javitt DC (2005). Sensory contributions to impaired
prosodic processing in schizophrenia. Biological Psychiatry
58, 56–61.
Leitman DI, Hoptman MJ, Foxe JJ, Saccente E, Wylie GR,
Nierenberg J, Jalbrzikowski M, Lim KO, Javitt DC (2007).
The neural substrates of impaired prosodic detection in
schizophrenia and its sensorial antecedents. American
Journal of Psychiatry 164, 474–482.
Loh M, Rolls ET, Deco G (2007). A dynamical systems
hypothesis of schizophrenia. PLoS Computational Biology 3,
228.
Matsumoto K, Samson GT, O’Daly OD, Tracy DK,
Patel AD, Shergill SS (2006). Prosodic discrimination in
patients with schizophrenia. British Journal of Psychiatry
189, 180–181.
Mitchell RL, Elliott R, Barry M, Cruttenden A, Woodruff
PW (2003). The neural response to emotional prosody,
as revealed by functional magnetic resonance imaging.
Neuropsychologia 41, 1410–1421.
Murphy D, Cutting J (1990). Prosodic comprehension and
expression in schizophrenia. Journal of Neurology,
Neurosurgery and Psychiatry 53, 727–730.
Phillips ML, Senior C, David AS (2000). Perception of threat
in schizophrenics with persecutory delusions : an
investigation using visual scan paths. Psychological
Medicine 30, 157–167.
Sachs G, Steger-Wuchse D, Kryspin-Exner I, Gur RC,
Katschnig H (2004). Facial recognition deficits and
cognition in schizophrenia. Schizophrenia Research 68,
27–35.
Sander D, Grandjean D, Pourtois G, Schwartz S, Seghier
ML, Scherer KR, Vuilleumier P (2005). Emotion and
attention interactions in social cognition : brain regions
involved in processing anger prosody. Neuroimage 28,
848–858.
Schirmer A, Kotz SA (2006). Beyond the right hemisphere :
brain mechanisms mediating vocal emotional processing.
Trends in Cognitive Sciences 10, 24–30.
Turner JLB (1964). Schizophrenics as judges of vocal
expressions of emotional meaning. In The Communication
of Emotional Meaning (ed. J. R. Davitz), pp. 129–142.
McGraw-Hill : New York.
WHO (2004). International Statistical Classification of Diseases
and Related Health Problems, Tenth Revision (ICD-10).
World Health Organization : Geneva.
938 D. R. Bach et al.