the importance of experimental time when assessing the effect of temperature on toxicity in...
TRANSCRIPT

Online Proofing System
1. Corrections should be marked with the Adobe Annotation & Comment Tools below:
2. To save your proof corrections, click the ‘Publish Comments’ button. Publishing your comments saves the marked up version of your proof to a centralized location in Wiley’s Online Proofing System. Corrections don’t have to be marked in one sitting – you can publish corrections and log back in at a later time to add more.
3. When your proof review is complete we recommend you download a copy of your annotated proof for reference in any future correspondence concerning the article before publication. You can do this by clicking on the icon to the right of the ‘Publish Comments’ button and selecting ‘Save as Archive Copy…’.
4. When your proof review is complete and you are ready to send corrections to the publisher click the ‘Complete Proof Review’ button that appears above the proof in your web browser window. Note: Once you click ‘Complete Proof Review’ you will not be able to mark any further comments or corrections.
Firefox, Chrome, Safari Users If your PDF article proof opens in any PDF viewer other than Adobe Reader or Adobe Acrobat, you will not be able to mark corrections and query responses, nor save them. To mark and save corrections, please follow these instructions to disable the built-in browser PDF viewers in Firefox, Chrome, and Safari so the PDF article proof opens in Adobe within a Firefox or Chrome browser window.

UNCORRECTED PROOFS
Terrestrial Toxicology
THE IMPORTANCE OF EXPERIMENTAL TIME WHEN ASSESSING THE EFFECTOF TEMPERATURE ON TOXICITY IN POIKILOTHERMS
NILS J. NØRHAVE,yz DAVID SPURGEON,z CLAUS SVENDSEN,z and NINA CEDERGREEN*yyDepartment of Plant and Environmental Science, University of Copenhagen, Frederiksberg, Denmark
zCentre for Ecology and Hydrology, Wallingford, Oxon, United Kingdom
(Submitted 2 January 2014; Returned for Revision 8 February 2014; Accepted 27 February 2014)
Abstract: Temperature is an important factor affecting toxicity, determining chemical toxicokinetics and toxicodynamics inpoikilothermic organisms. Because metabolic rates also are affected by temperature, interactions between the emergence of toxiceffects and time are very likely. The aim of the present study was to investigate how temperature affects the toxicity of copper toward thenematode Caenorhabditis elegans when measured during short, fixed time frames compared with full life cycles. Copper toxicity wastested in 2 experiments at 4 or 6 temperatures in the range of 11 8C to 24 8C, with Cu concentrations spanning from 1mg Cu/L agar to40mg Cu/L agar, respectively. Reproduction and mortality were determined across the entire life cycle, and the time to production of firstegg and the population growth rate were calculated. The results showed that the 50% effect concentrations (EC50s) of Cu increased 1.5-fold to 2.5-fold with increasing temperature within the tested range, depending on endpoint. When calculating EC50 on reproduction after24 h or 96 h, the typical setup for temperature-chemical interaction studies, results ranged from no temperature effect to effects much largerthan those for the full life cycle. Studies of temperature effects on toxicity must therefore be carefully designed in relation to the researchquestion being investigated. Environ Toxicol Chem 2014;9999:1–9. # 2014 SETAC
Keywords: Temperature Copper Acute toxicity Chronic toxicity Caenorhabditis elegans
INTRODUCTION
Temperature is an important factor affecting toxicity becaiseit determines fate processes such as microbial degradation ratesof organic compounds and processes related to biologicaleffects, such as those influencing chemical toxicokinetics andtoxicodynamics in poikilothermic organisms. As a result of thesedependent effects, the toxicity of chemicals can changedepending on the growth temperature [1–4].
Heugens et al. [5] and Cairns et al. [6] have reviewed theeffect of changing temperature on the toxicity of a number ofcompounds to aquatic organisms and found that the toxicity ofmetals and pesticides generally increase with increasingtemperature, particularly when the temperature approaches theupper tolerance limit of an organism. Previous studies on theeffects of temperature on toxicity have often been based onfixed-time-point observations in acute toxicity experiments,such as the 48-h Daphnia immobilization test [5,7]. This meansthat toxicity is actually assessed after different metabolic andphysiological times for each of the different temperatures,because the rate of metabolic processes decreases withdecreasing temperatures in poikilothermic organisms [3,8,9].This difference in the physiological time experienced inexposures at different temperatures has the potential to lead tothe erroneous conclusion that a chemical is more toxic at highertemperatures simply because toxicity is measured at a time whenmore metabolism has taken place and toxic symptoms, therefore,are more advanced. The true toxicity, defined as the effect of thechemical on the life history of the organism, could be just assevere for the organism exposed at lower temperatures if theexperiment was performed on a time scale allowing forsymptoms of toxicity to develop and manifest themselves.
When investigating the effect of temperature on chemicaltoxicity in poikilothermic organisms, it would be preferable ifobservations could be based on full life cycles rather than onfixed, short-time experiments, because these more comprehen-sive tests are not vulnerable to bias related to the influence ofvariable physiological time during exposure. Heugens et al. [9]was one of the few studies to report a temperature-metalinteraction taking physiological time into account, and the studyshowed enhanced effects of cadmium at elevated temperature.This studyQ1, however, only included 3 temperatures, the lowest(10 8C) of which is likely to have been near the lower tolerancelimit of the test organism, Daphnia magna. This makes itdifficult to extrapolate a general trend in temperature effects ontoxicity to the entire temperature range relevant for the organism.The aim of the present study, therefore, was to investigate theeffect of a larger range of growth temperatures on the toxicity ofcopper toCaenorhabditis elegans throughout its whole life cycleand to compare these results with a standard fixed-time setup.According to Klass [10], the egg production of C. elegans issignificantly reduced below 10 8C and above 25.5 8C, indicatingdirect temperature induced stress on reproductive outputs. Wetherefore used 4 to 6 temperatures within this range to investigatethe effect of the full relevant ambient temperature spectrum onCu toxicity. Copper effects on life cycle traits were tracked forindividual worms from egg to death, thus providing acomprehensive view of chronic exposures to Cu for the fullrange of nematode life stages and yielding results normallyderived from time-bound standard acute studies for comparison.
Copper was selected as the chemical for our studies forseveral reasons. Copper is an essential metal present in allecosystems. It has a general toxic mode of action, catalyzing theformation of reactive oxygen species [11], which is a generaltype of damage from many different stressors. Because of thedual role of Cu as an essential and toxic element [12,13],organisms have evolved systems for the regulation of internal Cuconcentrations [12–14]. This active regulation of Cu uptake and
* Address correspondence to [email protected] online in Wiley Online Library
(wileyonlinelibrary.com).DOI: 10.1002/etc.2563
Environmental Toxicology and Chemistry, Vol. 9999, No. 9999, pp. 1–9, 2014# 2014 SETAC
Printed in the USA
1
ETC-14-00004(2563)

UNCORRECTED PROOFS
excretion, together with an organism’s ability to repair reactiveoxygen species damage is likely to depend on temperature-dependent metabolic activity. It is therefore possible that,contrary to the results of the acute studies showing increasedtoxicity with increasing temperature [1,4], the toxicity of Cu toC. elegans measured over a full life cycle will be constant attemperatures within the species tolerance limits. Temperatures atthe upper and lower tolerance limits of C. elegans are, however,expected to increase the toxicity of Cu, as the combination ofextreme environmental stress and chemical stress have beenshown to enhance the effect of each other [15,16]. Caeno-rhabditis elegans was chosen as a test species because of its fastlife cycle and the possibility to monitor survival and reproduc-tion over time.
We hypothesized that Cu toxicity measured over an entire lifespan will not be dependent on temperature. We furtherhypothesized that short-term studies of temperature effects ontoxicity overestimate the toxicity at warm temperaturescompared with the toxicity evaluated when based on populationgrowth rates.
METHODS
Culture conditions for test organism
Caenorhabditis elegans of the N2 Bristol strain (obtainedfrom the Caenorhabditis Genetics Center, University ofMinnesota, MN, USA) were cultivated in darkness at 18 8Cor 20 8C on plates of a modified bacteriological agar (nematodegrowth medium [NGM] [17]) and fed Escherichia coli of theuracil-deficient strain OP50. At least 2 wk before the start of theexperiments, new cultures were initiated at the selected testtemperatures to acclimatize the worms through severalgenerations. The cultures were maintained by transferring achunk of agar and associated eggs, juvenile, and adult wormsfrom an existing culture to freshly prepared NGM agar platesweekly.
Toxicity tests
To cover the full temperature range at which the cumulativereproduction of C. elegans is relatively unaffected of (10–25.58C) [10], experiment 1 tested the temperatures 11 8C, 13 8C, 158C, 18 8C, 21 8C, and 25 8C. Copper concentrations used were0mg Cu/L agar, 1mg Cu/L agar, 2mg Cu/L agar, 4mg Cu/Lagar, 8mg Cu/L agar, and 16mg Cu/L agar in all cases. Theselected test concentrations were based on 2 literature 50% effectconcentration (EC50) values for brood size of C. elegans. Thefirst states a range 2.66mg Cu/L to 3.37mg Cu/L measured inthe water fraction from NGM agar at 15 8C [18], and the secondstates a value of 2.04� 0.19mg Cu/L in liquid media at anunspecified temperature [19]. These concentrations equate tolevels 2 to 3 orders of magnitude greater than those found insurface waters and soil porewaters from uncontaminated sitesbut are comparable to soil porewater concentrations in heavilypolluted soils [11,20].
A stock solution of CuCl2 in demineralized water (2 g Cu/L)was used throughout the experiment. This Cu stock solution wasadded to the NGM agar while liquid and mixed by swirling.Batches of NGM were produced once every week during thecourse of the experiment to minimize immobilization of Cu inthe agar, as shown by Álvarez et al. [21] for cadmium. Toprovide validation of the nominal concentrations used, samplesof NGM from each batch were collected and stored for analysisof Cu content.
All tests were conducted with synchronized cohorts ofnematodes produced from adults selected from the main stockcultures acclimatized at each temperature. To generate thesecohorts, adult hermaphrodite worms were selected from theacclimatized cultures and placed on Petri dishes with Cu-dosedNGM and E. coli and left at the test temperatures for 4 h (6 h for11 8C to ensure that sufficient eggs were laid). After this time, theadults were removed, and the eggs laid in the 4-h or 6-h periodwere left to hatch. The offspring (the test organisms), oncehatched and grown to the L4 larval stage on the Cu-dosed plates,were transferred to 12-well plates with Cu-dosed NGM and E.coli, with 1 individual per well. There were 12 replicate wormsfor each treatment, and the full set of life-cycle parameters wasrecorded for each individual. The test organisms were moved tonew wells in fresh plates every day, and the time to their first egglaying and subsequent daily egg production was determined.The daily transfer and counting were repeated through both thereproductive and senescence stages until the test organisms died(determined by the lack of response to being probed). Fertileeggs and hatched juveniles were counted as offspring, andvisibly infertile eggs were excluded.
To provide further resolution of toxicity, a second experiment(experiment 2) was conducted that included higher concen-trations within the design. Experiment 2 was conducted at 12 8C,16 8C, 20 8C, and 24 8C, and the range of Cu concentrationsincluded being 0mgCu/L agar, 1mgCu/L agar, 3mgCu/L agar,8mg Cu/L agar, 20mg Cu/L agar, and 40mg Cu/L agar.Experiment 2 followed the same procedures as experiment 1, theonly exception being that the exposure at 24 8C had 36 controlindividuals instead of the 12 used in the rest of the setup.
Copper analysis
Nematode growth medium samples were stored from eachproduced batch for experiment 1. The samples were digested by70% HNO3 (Ultrapure) at 200 8C for 15min within sealedmicrowave digestion vessels and analyzed for Cu content byinductively coupled plasma–mass spectrometry (Perkin ElmerDRCII). Measured concentrations correlated well with nominalconcentrations (slope¼ 0.996, R2¼ 0.95), assuming that NGMhas a density of 1 g/mL, with measured concentrations deviatingless than 20% from nominal concentrations. Concentrations areconsequently given as nominal concentrations throughout thepresent study. To check for the concentration of available Cu inNGM from experiment 2, the Cu content in the water fraction ofthe agar was determined 1 d and 5 d after production. This wasdone to distinguish between dissolved Cu and Cu that was boundto the agar and therefore not bioavailable. Samples of NGM fromeach produced batch were saved in centrifuge tubes and, after 1 dor 5 d, centrifuged at 10 000 g for 5min to separate water andagar. A sample of the water fraction was removed, acidified, andstored for later analysis. The analyses were performed with agraphite furnace (Perkin Elmer Zeeman 5100).
Statistics
Brood size and life span were tested for normality (Shapiro–Wilk test) and homogeneity of variance (Levene median test)and were analyzed by a two-way analysis of variance (ANOVA;temperature and Cu treatments), with Holm–Sidak post hocanalysis (chosen for its ability to compare cells of unequal size,in this case the number of individuals per treatment). SigmaPlot11.0, which includes SigmaStat, was used. The residuals of theANOVA were tested for normal distribution (Shapiro–Wilk andvisual assessment).
2 Environ Toxicol Chem 9999, 2014 N.J. Nørhave et al.
UNCORRECTED PROOFS
The average cumulative egg production as a function of timefor each treatment was described by a 3-parameter log–logisticsigmoid model (Equation 1) using a Box–Cox transformation tominimize variance heterogeneity. The analyses were performedin the statistical software R, Ver 2.12.0 (http://www.r-project.org/), with the drc package [22].
Y ¼ d=ð1þ ðx=eÞbÞ ð1ÞIn themodel, d is themaximum number of eggs produced, e is
the time when half the maximum number of eggs is produced, bis proportional to the slope of the sigmoid curve at e, Y is theaccumulated number of eggs produced, and x is the time. Fromthis model, the estimated time to the production of the first egg(time to first egg) was calculated by solving x for Y equal to 1.The drc package returns a standard error with the estimate.
A stage-based matrix population model was constructed foreach treatment based on the daily reproduction values and lifespan. The modeling was performed with R 2.12.0 (http://www.r-project.org/), using the popbio package [23], which is based onthe work of Caswell [24], among others. The models wereconstructed so that each day in the life of the nematodescorresponded to a life stage in the model, thus making full use ofthe daily reproduction data in the model. A projection of thepopulation over 500 iterations (days) was made, and afterchecking that the population growth had stabilized, thepopulation growth rates were determined. The 95%, 99%, and99.9% confidence intervals (CIs) were determined bybootstrapping.
To determine EC50 values for brood size, life span, andpopulation growth rate, these responses were described with alog–logistic three-parameter concentration-response model(Equation 1). To compare the full–life-cycle data withreproductive data from typical fixed-time setups 2 acuteexposure scenarios were chosen from the literature: 1)individuals monitored for reproduction for the first 96 h of theadult life stage [25] and 2) individuals monitored forreproduction for 24 h at the approximate peak of reproductiveoutput [26] (Figure 2)Q2. Short-term subsets of reproduction datawere made from the full–life-cycle data using these scenarios,and from these we determined EC50 values for comparison withfull–life-cycle EC50 values.
RESULTS
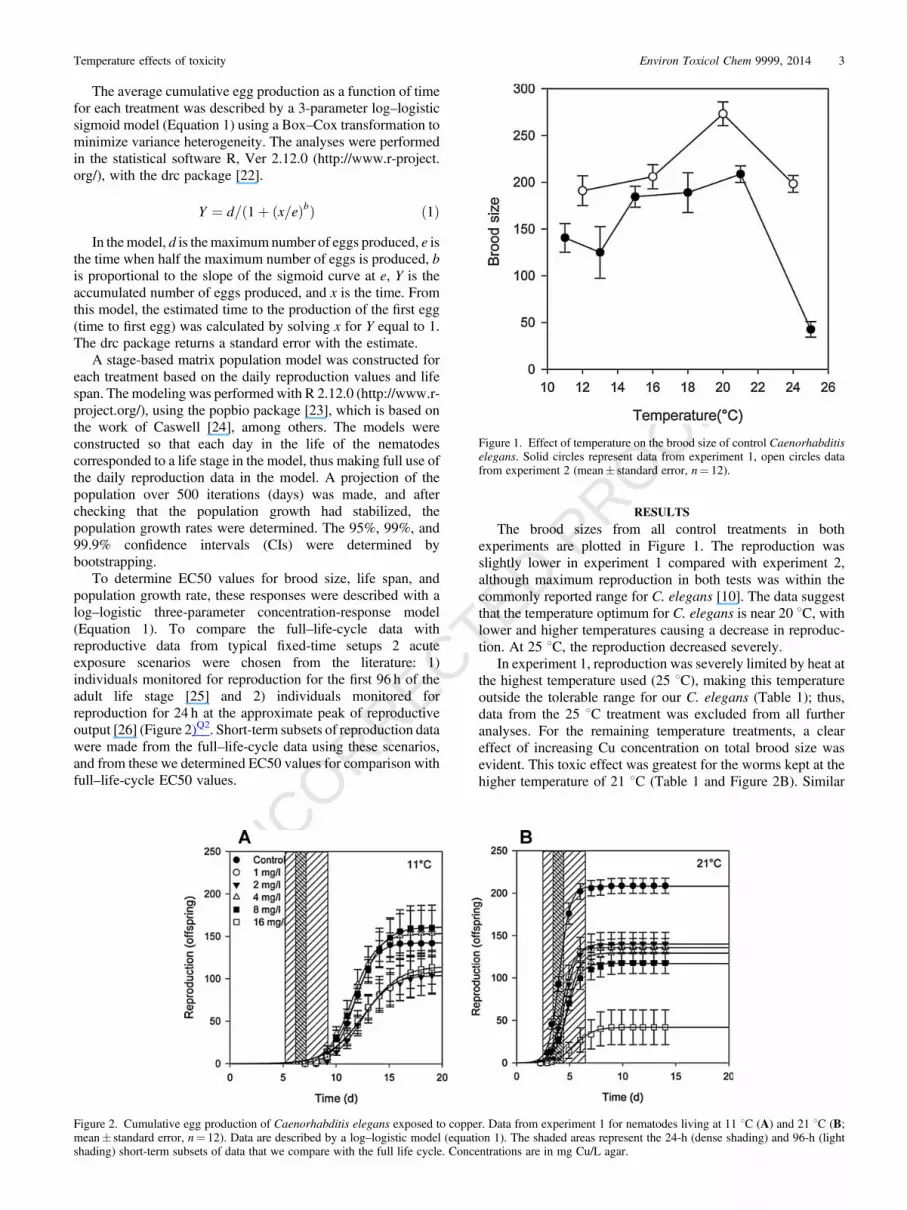
The brood sizes from all control treatments in bothexperiments are plotted in Figure 1. The reproduction wasslightly lower in experiment 1 compared with experiment 2,although maximum reproduction in both tests was within thecommonly reported range for C. elegans [10]. The data suggestthat the temperature optimum for C. elegans is near 20 8C, withlower and higher temperatures causing a decrease in reproduc-tion. At 25 8C, the reproduction decreased severely.
In experiment 1, reproduction was severely limited by heat atthe highest temperature used (25 8C), making this temperatureoutside the tolerable range for our C. elegans (Table 1); thus,data from the 25 8C treatment was excluded from all furtheranalyses. For the remaining temperature treatments, a cleareffect of increasing Cu concentration on total brood size wasevident. This toxic effect was greatest for the worms kept at thehigher temperature of 21 8C (Table 1 and Figure 2B). Similar
Figure 1. Effect of temperature on the brood size of control Caenorhabditiselegans. Solid circles represent data from experiment 1, open circles datafrom experiment 2 (mean� standard error, n¼ 12).
Figure 2. Cumulative egg production of Caenorhabditis elegans exposed to copper. Data from experiment 1 for nematodes living at 11 8C (A) and 21 8C (B;mean� standard error, n¼ 12). Data are described by a log–logistic model (equation 1). The shaded areas represent the 24-h (dense shading) and 96-h (lightshading) short-term subsets of data that we compare with the full life cycle. Concentrations are in mg Cu/L agar.
Temperature effects of toxicity Environ Toxicol Chem 9999, 2014 3

UNCORRECTED PROOFS
effects of Cu on other measured parameters—including lifespan, time to first egg, and population growth rate—wereevident, effects again being more severe at higher temperatures(Table 1). At low temperatures, however, the toxic effects of Cuwere less pronounced and were not significant for brood size at11 8C or 13 8C (Figure 2A and Table 1).
A two-way ANOVA for the brood size results fromexperiment 1 showed significant effects of both temperatureand Cu treatment (both p< 0.001) and significant interactionsbetween the 2 factors (p< 0.001). This significant interactioncomponent implies that Cu toxicity is dependent on exposuretemperature. Brood size data failed the normality test, but theresiduals from the two-way ANOVA were normally distributed(p¼ 0.074). The data also failed the test for homogeneity ofvariance. Because differences between treatments were highlysignificant, however, we do not believe that these failures tomeetthe assumptions of the tests seriously affect themain conclusionsof the present study. Describing total brood size with a log–logistic dose-response model (equation 1) produced an EC50value of 6.0� 1.9mg Cu/L agar for the 21 8C treatment. At 158C and 18 8C, the EC50s were 16.8� 2.2 and 16.1� 0.7mg Cu/L agar and hence higher than at 21 8C, reflecting the reduced
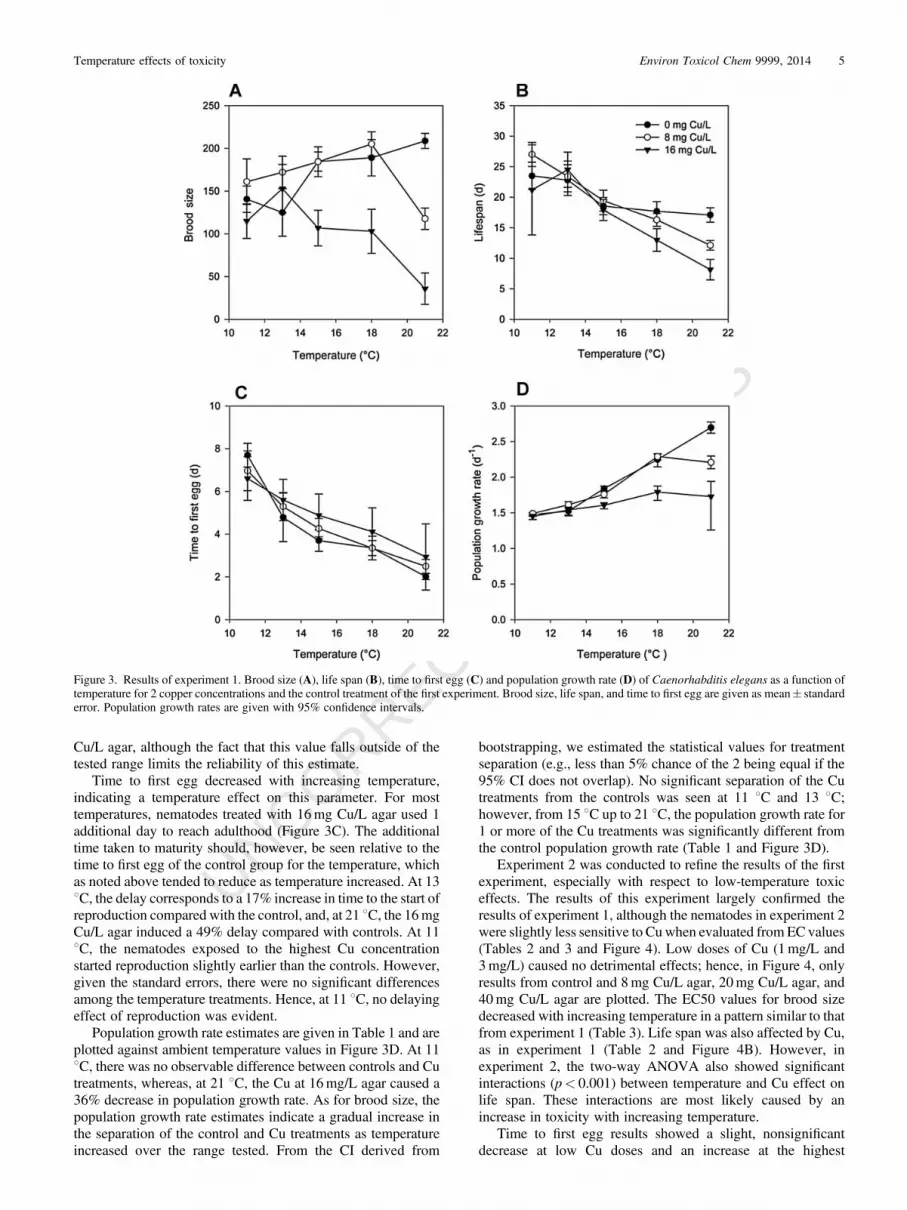
toxicity of Cu at these test temperatures. At the 2 lowest testtemperatures (13 8C and 11 8C), the absence of a significantconcentration-response relationship did not allow calculation ofEC50 values. Figure 3A shows brood size for control treatmentsand the 2 highest Cu concentrations used (8mg/L and 16mg/L)versus the temperature treatments, clearly illustrating thecomplex nature of the relationship between temperature andeffect of Cu on brood size and showing that, although 16mg Cu/L caused little change from control brood size values at 11 8Cand 13 8C, it caused a greater than 80% reduction at 21 8C.
Life span raw data passed the normality test (p¼ 0.133), asdid the residuals of the ANOVA (p¼ 0.133). A two-wayANOVA for data on nematode life span indicated a significanteffects of both temperature and Cu concentration (p< 0.001 andp¼ 0.002, respectively), but no significant interaction(p¼ 0.256). The pattern of temperature-dependent effects ofCu, however, followed that seen for brood size. Only the highesttemperature (21 8C) yielded a significant effect of Cu on life spancompared with controls and only at the highest Cu treatment(16mg Cu/L), thus hampering statistical identification of theinteraction (Table 1 and Figure 3B). From the 21 8C test, it waspossible to estimate an EC50 value for life span of 16.9� 3.8mg
Table 1. Brood size, life span, time to first egg (TFE), and population growth rate (PGR) of Caenorhabditis elegans exposed to copper (experiment 1)a
Temp. Concentration (mg Cu/L agar) Brood size (No. of offspring) Life span (d) TFE (d) PGR (d�1)
11 8C0 142.0� 15.4 A 23.5� 2.2 A 7.7� 0.6 1.48 (1.45–1.50) A1 109.3� 24.5 A 25.0� 2.7 A 6.4� 1.3 1.44 (1.38–1.46) A2 105.1� 25.1 A 21.2� 2.5 A 7.5� 1.2 1.42 (1.37–1.46) A4 153.5� 29.7 A 25.6� 1.6 A 6.9� 1.1 1.50 (1.48–1.53) A8 161.0� 26.7 A 27.0� 2.0 A 7.0� 0.9 1.49 (1.46–1.51) A16 115.0� 20.3 A 21.2� 2.3 A 6.6� 1.0 1.45 (1.42–1.48) A
13 8C0 125.0� 27.6 A 22.8� 2.5 A 4.8� 1.1 1.52 (1.47–1.57) A1 130.8� 11.7 A 25.1� 2.1 A 4.4� 0.5 1.56 (1.52–1.60) A2 125.8� 20.0 A 24.9� 2.3 A 4.7� 0.9 1.58 (1.53–1.60) A4 170.1� 14.2 A 25.5� 1.6 A 4.6� 0.5 1.64 (1.61–1.67) B8 172.1� 18.8 A 23.4� 2.5 A 5.3� 0.7 1.61 (1.57–1.66) AB16 152.9� 28.3 A 24.5� 2.9 A 5.6� 1.0 1.54 (1.49–1.58) A
15 8C0 184.6� 11.2 A 18.6� 1.4 A 3.7� 0.5 1.84 (1.81–1.88) A1 188.7� 18.8 A 20.3� 2.4 A 3.8� 0.5 1.90 (1.86–1.93) A2 184.4� 12.7 A 23.9� 1.8 A 4.4� 0.4 1.76 (1.71–1.80) B4 177.5� 26.8 AB 19.1� 2.3 A 4.4� 0.7 1.75 (1.70–1.80) B8 184.3� 17.4 A 19.4� 1.7 A 4.3� 0.5 1.76 (1.71–1.81) AB16 106.9� 20.8 B 17.9� 1.7 A 4.9� 1.0 1.61 (1.55–1.64) C
18 8C0 189.0� 21.3 A 17.7� 1.6 A 3.4� 0.6 2.25 (2.18–2.32) A1 220.1� 9.6 A 17.9� 1.5 A 3.1� 0.2 2.46 (2.40–2.51) B2 175.8� 20.7 A 17.8� 1.1 A 3.2� 0.6 2.30 (2.22–2.38) A4 218.3� 16.6 A 14.6� 1.2 A 3.3� 0.4 2.43 (2.38–2.50) B8 205.1� 14.2 A 16.3� 1.1 A 3.3� 0.3 2.29 (2.24–2.32) A16 103.0� 25.8 B 13.0� 1.9 A 4.1� 1.1 1.79 (1.62–1.86) C
21 8C0 208.7� 8.9 A 17.1� 1.2 A 2.0� 0.1 2.70 (2.64–2.79) A1 136.0� 11.8 B 15.4� 1.3 A 2.3� 0.4 2.38 (2.29–2.46) B2 141.1� 6.3 B 14.7� 0.8 A B 2.3� 0.1 2.34 (2.29–2.40) B4 130.2� 10.2 B 15.0� 0.6 A B 2.5� 0.3 2.24 (2.21–2.30) B8 117.8� 12.5 B 12.1� 0.8 A B 2.5� 0.3 2.21 (2.12–2.30) B16 35.9� 18.4 C 8.1� 1.7 B 3.0� 1.6 1.73 (0.65–1.94) C
25 8C0 42.7� 28.8 A 13.2� 0.5 A Na 2.38 (2.25–2.48) A1 36.3� 23.7 A 12.3� 0.9 A Na 2.34 (2.12–2.51) A2 55.9� 28.9 A 11.6� 0.9 A Na 2.64 (2.34–2.80) A4 35.5� 35.4 A 14.6� 0.8 A Na 2.29 (1.93–2.53) A8 34.3� 27.2 A 11.8� 1.0 A 2.3� 0.7 2.16 (1.97–2.34) A16 36.3� 31.5 A 8.6� 1.0 A 2.5� 1.0 2.08 (1.85–2.26) A
aAll parameters are given as mean� standard error, except for PGR, which is given� 95% confidence interval (CI). Parameters of the same temperature treatmentsharing the same uppercase letter are not significantly different from each other (p> 0.05), as determined by analysis of variance for brood size and life span or asno overlap of the 95% CIs for PGR.
4 Environ Toxicol Chem 9999, 2014 N.J. Nørhave et al.
UNCORRECTED PROOFS
Cu/L agar, although the fact that this value falls outside of thetested range limits the reliability of this estimate.
Time to first egg decreased with increasing temperature,indicating a temperature effect on this parameter. For mosttemperatures, nematodes treated with 16mg Cu/L agar used 1additional day to reach adulthood (Figure 3C). The additionaltime taken to maturity should, however, be seen relative to thetime to first egg of the control group for the temperature, whichas noted above tended to reduce as temperature increased. At 138C, the delay corresponds to a 17% increase in time to the start ofreproduction compared with the control, and, at 21 8C, the 16mgCu/L agar induced a 49% delay compared with controls. At 118C, the nematodes exposed to the highest Cu concentrationstarted reproduction slightly earlier than the controls. However,given the standard errors, there were no significant differencesamong the temperature treatments. Hence, at 11 8C, no delayingeffect of reproduction was evident.
Population growth rate estimates are given in Table 1 and areplotted against ambient temperature values in Figure 3D. At 118C, there was no observable difference between controls and Cutreatments, whereas, at 21 8C, the Cu at 16mg/L agar caused a36% decrease in population growth rate. As for brood size, thepopulation growth rate estimates indicate a gradual increase inthe separation of the control and Cu treatments as temperatureincreased over the range tested. From the CI derived from
bootstrapping, we estimated the statistical values for treatmentseparation (e.g., less than 5% chance of the 2 being equal if the95% CI does not overlap). No significant separation of the Cutreatments from the controls was seen at 11 8C and 13 8C;however, from 15 8C up to 21 8C, the population growth rate for1 or more of the Cu treatments was significantly different fromthe control population growth rate (Table 1 and Figure 3D).
Experiment 2 was conducted to refine the results of the firstexperiment, especially with respect to low-temperature toxiceffects. The results of this experiment largely confirmed theresults of experiment 1, although the nematodes in experiment 2were slightly less sensitive to Cuwhen evaluated from EC values(Tables 2 and 3 and Figure 4). Low doses of Cu (1mg/L and3mg/L) caused no detrimental effects; hence, in Figure 4, onlyresults from control and 8mg Cu/L agar, 20mg Cu/L agar, and40mg Cu/L agar are plotted. The EC50 values for brood sizedecreased with increasing temperature in a pattern similar to thatfrom experiment 1 (Table 3). Life span was also affected by Cu,as in experiment 1 (Table 2 and Figure 4B). However, inexperiment 2, the two-way ANOVA also showed significantinteractions (p< 0.001) between temperature and Cu effect onlife span. These interactions are most likely caused by anincrease in toxicity with increasing temperature.
Time to first egg results showed a slight, nonsignificantdecrease at low Cu doses and an increase at the highest
Figure 3. Results of experiment 1. Brood size (A), life span (B), time to first egg (C) and population growth rate (D) of Caenorhabditis elegans as a function oftemperature for 2 copper concentrations and the control treatment of the first experiment. Brood size, life span, and time to first egg are given as mean� standarderror. Population growth rates are given with 95% confidence intervals.
Temperature effects of toxicity Environ Toxicol Chem 9999, 2014 5

UNCORRECTED PROOFS
concentration used (Figure 4C and Table 2). Among thepopulation growth rate values, only 24 8C permitted theestimation of an EC50 value of 36.1� 1.8mg/L, but EC10values decreased steadily from 30.9� 4.0mg/L to13.0� 1.8mg/L when increasing the temperature from 12 8Cto 24 8C (Table 2 and Figure 4D). Several of the treatmentsshowed signs of stimulating effects at low Cu doses on thevarious endpoints, the so-called hormesis effects, also forpopulation growth rate (Table 2). Although this stimulation wasrarely significant, it was consistent across the temperatures inboth experiments.
The EC50 values for reproduction over the full life cycle andover 24 h and 96 h, reflecting traditional fixed-time set-ups [25,26], from both experiments are listed in Table 3. TheEC50s from the 24-h short-term exposure scenario wereconsistently lower than EC50s for the full life cycle for all
temperatures, and the clear pattern of increased toxicity withincreasing temperature is less evident. The 96-h data showedlower EC50 values at low temperatures compared with the full–life-cycle data; as temperature rose and the 96-h short-termscenario included more of the total reproductive output,however, the EC50 values approached those obtained withfull–life-cycle data. The consequence was that the consistenttemperature effect on toxicity observed for the full–life-cyclestudy disappeared in the 96-h study, in which no significantdifferences between EC50 values were obtained among the 4temperatures tested in the second study. Hence, althoughincreasing temperature consistently increases Cu toxicitytoward reproduction in both experiments when monitoredover the full life cycle, this true temperature effect on toxicitycould not be detected if reproduction was monitored for only 24or 96 h.
Table 2. Brood size, life span, time to first egg (TFE) and population growth rate (PGR) of Caenorhabditiselegans exposed to copper (experiment 2)a
Temp. Concentration (mg Cu/L agar) Brood size (No. of offspring) Life span (d) TFE (d) PGR (d�1)
12 8C0 190.9� 15.9 A 36.0� 2.7 A 5.9� 0.5 1.64 (1.63–1.65) A1 236.9� 6.5 A 33.9� 2.0 A 5.3� 0.2 1.69 (1.68–1.70) B3 216.6� 7.2 A 35.6� 1.4 A 5.2� 0.2 1.69 (1.68–1.70) B8 215.9� 12.5 A 31.9� 0.9 A 5.2� 0.6 1.65 (1.63–1.66) A20 179.6� 8.8 A 22.8� 0.6 B 5.0� 0.3 1.57 (1.56–1.58) C40 76.1� 8.8 B 17.1� 0.5 C 6.8� 0.6 1.44 (1.43–1.47) D
16 8C0 206.0� 12.9 A 24.0� 1.9 A 3.6� 0.5 2.04 (2.02–2.07) A1 254.0� 9.0 A 25.9� 1.7 A 3.3� 0.2 2.12 (2.09–2.14) B3 247.4� 9.9 A 24.2� 0.5 A 3.3� 0.2 1.13 (2.11–2.15) B8 232.5� 7.9 A 22.6� 0.9 A 3.7� 0.2 2.01 (1.98–2.04) A20 135.8� 19.5 B 12.9� 0.9 B 3.8� 0.7 1.83 (1.78–1.87) C40 71.5� 18.3 C 12.� 0.9 B 4.4� 1.1 1.57 (1.53–1.69) D
20 8C0 273.2� 12.8 A 14.9� 1.6 A 2.5� 0.2 2.73 (2.68–2.78) A1 287.3� 8.6 A 18.4� 1.7 AB 2.2� 0.1 2.76 (2.72–2.78) A3 285.1� 8.9 A 16.8� 1.9 AB 2.5� 0.1 2.77 (2.75–2.80) A8 253.5� 9.4 A 14.1� 0.4 A 2.6� 0.1 2.65 (2.61–2.68) A20 156.8� 4.6 B 10.0� 0.3 A 2.8� 0.1 2.29 (2.24–2.34) B40 91.7� 14.6 C 10.2� 0.8 A 2.9� 0.6 1.97 (1.86–2.05) C
24 8C0 198.4� 9.0 A 14.7� 0.7 A 2.0� 0.2 3.11 (3.05–3.17) A1 222.5� 13.5 A 16.5� 1.9 A 1.7� 0.4 3.33 (3.26–3.41) B3 181.0� 14.8 A 16.2� 1.2 A 1.8� 0.3 3.16 (3.04–3.27) A8 195.1� 8.9 A 13.8� 1.2 A 1.8� 0.3 3.11 (3.00–3.21) A20 93.6� 19.6 B 8.0� 0.6 B 1.9� 0.7 2.50 (2.31–2.65) C40 12.6� 10.8 C 4.7� 0.6 B Na 1.43 (0.58–1.66) D
aAll parameters are given as mean� standard error, except for PGR, which is given� 95% confidence interval (CI). Parameters of the same temperature treatmentsharing the same uppercase letter are not significantly different from each other (p> 0.05), as determined by analysis of variance for brood size and life span or asno overlap of the 95% CIs for PGR.
Table 3. 50% effect concentration values (mg/L) for reproduction based on data from the full life cycle and subsets of 24 h and 96 h
Temp. Full life cycle 24 h 96 h
Experiment 111 8C >16 NA NA13 8C >16 NA NA15 8C 16.8� 2.2 4.0� 1.6 10.0� 3.218 8C 16.1� 0.7 10.7� 1.6 14.6� 2.221 8C 6.0� 1.9 1.7� 0.5 4.1� 1.1
Experiment 212 8C 33.1� 2.1 20.6� 3.1 19.4� 1.716 8C 25.1� 2.5 7.9� 0.4 19.6� 1.720 8C 24.2� 1.7 12.1� 0.8 22.7� 1.424 8C 19.4� 1.6 14.7� 2.4 19.2� 1.5
6 Environ Toxicol Chem 9999, 2014 N.J. Nørhave et al.

UNCORRECTED PROOFS
DISCUSSION
The results of both experiments showed that the toxicity ofCu toward the measured whole–life-cycle endpoints tended toincrease with increasing temperature. This is contrary to ourinitial hypothesis that there is no interaction between tempera-ture and Cu toxicity within a temperature range near theoptimum for C. elegans. For reproduction, the observedtemperature-dependent increase in toxicity was approximately2.5-fold in experiment 1 between 15 8C and 21 8C andapproximately 2-fold in experiment 2 between 12 8C and 24 8C(Table 3). The results showing increased toxicity with increasingtemperature match those found by Rathore and Khangarot [27],who showed that the toxicity of 8 metals, including Cu, to thesludge worm Tubifex tubifex increased with temperature, in therange of 15 8C to 30 8C. Jacobson et al. [28] also showed a lineardecrease of 50% lethal concentration (LC50) values for Cu withtemperatures increasing from 10 8C to 25 8C for the freshwatermussel Actinonaias pectorosa. Similarly, in a review of 6 studiesof the interactions between Cu and temperature by Heugenset al. [5], increasing toxicity with increasing temperature wasfound in all cases except for 1 (see Table 4 for summary).Contrary to these results, the toxicity of Cu and Cd to thepotworm Enchytraeus crypticus measured with regard to
reproduction decreased approximately twofold between 11 8Cand 25 8C (although 50% lethal dose values were rather constantover the same temperature range) [29]. All of these conclusions,except that for E. crypticus, were based on time-limited studieson mortality (Table 4). Hence, these studies may be biased bytheir failure to include the element of increased physiologicaltime at higher temperatures as a component of the assessment.Had we reported mortality after a fixed time interval of 10 d to 15d (Figure 4B), we would find concentration-dependent mortalityat 24 8C, but no mortality at 12 8C, even though this temperatureeventually gives a clear dose–response relationship on mortalityat a later time. Hence, had mortality been the chosen endpoint, asit was in all but 1 of the studies mentioned in Table 4, theperceived temperature effect on toxicity would have been evengreater than what was found using population growth rates.
Similarly, our detailed observations of reproductive outputover time show that the simulated time-limited observations onnematodes would not clearly identify the true increase in toxicityof Cu with increasing temperature demonstrated in the full–life-cycle reproductive output (Table 3). When Cu toxicity wasestimated based on the values for reproduction derived duringthe first 96 h of adult life (the 4 d immediately followingmaturation) in the second study, the effect concentrations acrossthe experiment from 12 8C to 24 8C were similar. The 24-h
Figure 4. Results of experiment 2. Brood size (A), life span (B), time to first egg (C) and population growth rate (D) of Caenorhabditis elegans as a function oftemperature for 3 copper concentrations and the control treatment of the second experiment. Brood size, life span, and time to first egg are given asmean� standarderror. Population growth rates are given with 95% confidence intervals.
Temperature effects of toxicity Environ Toxicol Chem 9999, 2014 7

UNCORRECTED PROOFS
assessments showed no specific trends (Table 3). Had we chosento fix not only the time frame of reproductive measurement afterwormmaturation but also the starting point in terms of time afteregg laying, we most likely would have seen very strongtemperature effects, because cool-treated nematodes would notyet have matured at the fixed starting time [25,30]. This type ofsetup might be one of the main reasons for the much highertemperature effects found in other studies (Table 4), in which, forexample, EC50 values for T. tubifex, Pyganodon grandis, andDiaptomus clavipes increased 7.5-fold to 11-fold within atemperature span of 10 8C to 20 8C. Experimental designtherefore substantially affects the derived conclusions oftemperature effects on toxicity.
One plausible explanation for the increase in Cu toxicity withrising temperature is that it results from a change in Cutoxicokinetics or toxicodynamics. That is, either the uptake/exclusion processes of Cu homeostasis are changing leading toan increase in the internal concentrations of Cu, or the intrinsictoxicity of the Cu taken up by the organism is increasing atincreasing temperature. In a study on D. magna and Cd, bothuptake and sensitivity to the internal concentrations increasedwith increasing temperature [7]. In a study with E. crypticus, inwhich Cu toxicity was shown to decrease with increasingtemperature [29], the decrease in Cu toxicity with increasingtemperature was due to an increase in Cu elimination efficiency,making the worm better able to maintain low internalconcentrations at high temperatures than at low temper-atures [29]. With the nematode’s small size, measurements ofinternal metal concentrations in individuals are challenging, sowe have not evaluated their importance for the increased toxicityat higher temperature. However, higher uptake rates at hightemperatures could potentially explain the increased toxicitywith temperature. The main mode of toxic action of Cu is thecatalyzation of reactive oxygen species, the occurrence of whichincreases with increasing temperature [31], so toxicodynamicprocesses might also play an important role for the increasedtoxicity at high temperatures. The increase of time to first egginduced at both low temperatures and high Cu concentrationsindicate that both parameters slowed nematode growth anddevelopment. Toxicant-induced decreased growth rates havebeen observed for nematodes exposed to Cd [32], but this wasnot measured in the present study.
In all 10 dose–response experiments except for 1, Cu doses ashigh as 8mg Cu/L resulted not only in increased reproductionbut also in increased population growth rates (Tables 1 and 2).Such biphasic trends are often called “hermetic” responses [33]without regarding the physiological cause of the response, whichmight be different depending on stressor and type of organism.From an evolutionary perspective, population growth rate
should not increase in response to a stressor [34,35]. Anincreased fitness of treated populations compared with controlscan, however, occur if the controls are deficient in some elementpresent in the treatment [34]. Copper is an essential element, andthis could possibly explain the consistent trend observed.We do,however, find that this is unlikely, because the populationgrowth stimulation occurs at rather high Cu concentrationscompared with naturally occurring concentrations [11]. Anotherpossible explanation for biphasic responses is that the stressor, inthis case Cu, is more toxic to a competitor or pathogen than to theorganism in which fitness is measured [34] or that it in some wayenhances the food quality [35]. We do not know of potentialmicrobial pathogens in our nematode test system, nor are we ableto measure food quality. Hence, changes in 1 of these 2parameters in response to the Cu treatments could possiblyexplain the consistent increase in population growth rate withtreatment, but this would have to be investigated further.
The comparison of reproduction EC50 values from full–life-cycle and short-term reproduction indicates a tendency either tooverestimate the temperature effect on toxicity when usingshort-term, time-fixed exposures or to overlook it entirely (96-hdata), all depending on experimental design. These errors are duemainly to the delay in toxic response caused by the slowermetabolic rates at low temperatures, giving the impression thattoxic response does not occur to the same extent under lowtemperatures as under high temperatures. Thus our resultsconfirm the hypothesis that short-term, time-fixed studies oftemperature effects on toxicity underestimate toxicity at lowtemperatures or overestimate toxicity at high temperatures. Veryfew studies to date have investigated the influence of time on theoutcome of temperature effects on toxicity, so it is still prematureto discuss the possible implications for environmental riskassessment of chemicals. We do, however, encourage studies oftemperature effects on toxicity to be very carefully designed interms of the time courses used and the endpoints measured inrelation to the research question investigated.
Acknowledgment—This study was supported by the Research School ofEnvironmental Chemistry, Microbiology and Toxicology (RECETO) inDenmark and a mobility grant donated by the Department of Basic Sciencesand Environment, Faculty of Life Sciences, University of Copenhagen. Theauthors thank H. Hooper for kind advice.
REFERENCES
1. Kim J, Park J, Kim PG, Lee C, Choi K, Choi K. 2010. Implication ofglobal environmental changes on chemical toxicity—Effect of watertemperature, pH, and ultraviolet B irradiation on acute toxicity of severalpharmaceuticals in Daphnia magna. Ecotoxicology 19:662–669.
Table 4. Examples of short-term copper experiments at different temperatures extracted from the literaturea
Species Temperature (8C) EndpointTime scale ofexperiment (h)
Fold changein toxicity Reference
Tubifex tubifex 15, 20, 25, 30 Mortality 96 11 Rathore and Khangarot [27]Actinonaias Pectorosa 10, 15, 20, 25 Mortality 24 3.1 Jacobsen et al. [28]Pyganodon grandis 10, 20 Mortality 24 7.5 Jacobsen et al. [28]Daphnia pulex 10, 20, 30 Mortality 48 1.3 Boeckman and Bidwell [2]Diaptomus clavipes 10, 20, 30 Mortality 48 9.6 Boeckman and Bidwell [2]Enchytraeus crypticus 11, 13, 15, 18, 21, 25 Reproduction Variableb –2.5 Cedergreen et al. [29]
aExperimental steady state temperatures used, endpoint measured, time scale of the experiment and the fold increase in toxicity from the lowest to the highesttemperature measured as the change in.bAt each temperature, the experimental time was the time taken for the controls to produce an approximate average of 40 offspring.c TheQ3 study showed a decrease in toxicity with rising temperature by a factor 2.
8 Environ Toxicol Chem 9999, 2014 N.J. Nørhave et al.

UNCORRECTED PROOFS
2. Boeckman CJ, Bidwell JR. 2006. The effects of temperature, suspendedsolids, and organic carbon on copper toxicity to two aquaticinvertebrates. Water Air Soil Pollut 171:185–202.
3. Donker MH, Abdel-Lateif HM, Khalil MA, Bayoumi BM, van StraalenNM. 1998. Temperature, physiological time, and zinc toxicity in theisopod Porcellio scaber. Environ Toxicol Chem 17:1558–1563.
4. Noyes PD,McElweeMK,Miller HD, Clark BW,VanTiemLA,WalcottKC, Erwin KN, Levin ED. 2009. The toxicology of climate change:Environmental contaminants in a warming world. Environ Int 35:971–986.
5. Heugens EHW, Hendriks AJ, Dekker T, van Straalen NM, Admiraal W.2001. A review of the effects of multiple stressors on aquatic organismsand analysis of uncertainty factors for use in risk assessment. Crit RevToxicol 31:247–284.
6. Cairns J, Heath AG, Parker BC. 1975. Effects of temperature upontoxicity of chemicals to aquatic organisms. Hydrobiologia 47:135–171.
7. Heugens EHW, Jager T, Creyghton R, Kraak MHS, Hendriks AJ, vanStraalen NM, Admiraal W. 2003. Temperature-dependent effects ofcadmium onDaphnia magna: Accumulation versus sensitivity. EnvironSci Technol 37:2145–2151.
8. Axelsen JA. 1997. A physiological driven mathematical simulationmodel as a tool for extention of results from laboratory tests to ecosystemeffects. In van Straalen NM, Loekke H, eds, Ecological Risk Assessmentof Contaminents in Soil. Chapman & Hall, Padstow, UK, pp 233–250.
9. Heugens EHW, Tokkie LTB, Kraak MHS, Hendriks AJ, van StraalenNM, Admiraal W. 2006. Population growth of Daphnia magna undermultiple stress conditions: Joint effects of temperature, food, andcadmium. Environ Toxicol Chem 25:1399–1407.
10. Klass MR. 1977. Aging in nematode Caenorhabditis elegans—Majorbiological and environmental factors influencing life-span.Mech AgeingDev 6:413–429.
11. Bremner I. 1998. Manifestations of copper excess. Am J Clin Nutr67:1069S–1073S.
12. Flemming CA, Trevors JT. 1989. Copper toxicity and chemistry in theenvironment—A review. Water Air Soil Pollut 44:143–158.
13. Burkhead JL, Reynolds KAG, Abdel-Ghany SE, Cohu CM, Pilon M.2009. Copper homeostasis. New Phytol 182:799–816.
14. Puig S, Lee J, LauM, Thiele DJ. 2002. Biochemical and genetic analysisof yeast and human high affinity copper transporters suggest a conservedmechanism for copper uptake. J Biol Chem 277:26021–26030.
15. Holmstrup M, Petersen BF, Larsen MM. 1998. Combined effects ofcopper, desiccation, and frost on the viability of earthworm cocoons.Environ Toxicol Chem 17:897–901.
16. HolmstrupM, Bindesbol AM, Oostingh GJ, Duschl A, Scheil V, KohlerHR, Loureiro S, Soares AMVM, Ferreira ALG, Kienle C, Gerhardt A,Laskowski R, Kramarz PE, Bayley M, Svendsen C, Spurgeon DJ. 2010.Interactions between effects of environmental chemicals and naturalstressors: A review. Sci Tot Environ 408:3746–3762.
17. Brenner S. 1974. Genetics of Caenorhabditis elegans. Genetics 77:71–94.18. Jonker MJ, Piskiewicz AM, Ivorra N, Kammenga JE. 2004. Toxicity of
binary mixtures of cadmium–copper and carbendazim–copper to the
nematode Caenorhabditis elegans. Environ Toxicol Chem 23:1529–1537.
19. Boyd WA, Williams PL. 2003. Comparison of the sensitivity of threenematode species to copper and their utility in aquatic and soil toxicitytests. Environ Toxicol Chem 22:2768–2774.
20. Vulkan R, Zhao FJ, Barbosa-Jefferson V, Preston S, Paton GI, TippingE, McGrath SP. 2000. Copper speciation and impacts on bacterialbiosensors in the pore water of copper-contaminated soils. Environ SciTechnol 34:5115–5121.
21. Alvarez OA, Jager T, Kooijman SALM, Kammenga JE. 2005.Responses to stress of Caenorhabditis elegans populations withdifferent reproductive strategies. Funct Ecol 19:656–664.
22. Ritz C, Streibig JC. 2005. Bioassay analysis using R. J Statist Software12:1–22.
23. Stubben C, Milligan B. 2007. Estimating and analyzing demographicmodels using the popbio package in R. J Statist Software 22:1–23.
24. Caswell H. 2001. Matrix Population Models: Construction, Analysis,and Interpretation. Sinauer Associates, Sunderland, MA, USA.
25. Williams PL, Dusenbery DB. 1990. Aquatic toxicity testing using thenematode Caenorhabditis elegans. Environ Toxicol Chem 9:1285–1290.
26. Gomez-Eyles JL, Svendsen C, Lister L, Martin H, Hodson ME,Spurgeon DJ. 2009. Measuring and modelling mixture toxicity ofimidacloprid and thiacloprid on Caenorhabditis elegans and Eiseniafetida. Ecotoxicol Environ Saf 72:71–79.
27. Rathore RS, Khangarot BS. 2002. Effects of temperature on thesensitivity of sludge worm Tubifex tubifex Muller to selected heavymetals. Ecotoxicol Environ Saf 53:27–36.
28. Jacobson PJ, Neves RJ, Cherry DS, Farris JL. 1997. Sensitivity ofglochidial stages of freshwater mussels (Bivalvia: Unionidae) to copper.Environ Toxicol Chem 16:2384–2392.
29. Cedergreen N, Nørhave NJ, Nielsen K, Johansson HK, Marcussen H,Svendsen C, SpurgeonDJ. 2013. Low temperatures enhance the toxicityof Cu and Cd to Enchytraeus crypticus through different mechanisms.Environ Toxicol Chem 32:2274–2283.
30. American Society for Testing and Materials. 2001. Standard guide forconducting laboratory soil toxicity tests with the nematode Caeno-rhabditis elegans. E2172-01(2008) In. Annual Book of ASTM Stand-ards, Vol 11.06, Philadelphia, PA, pp xxQ4–xx.
31. Speakman JR. 2005. Body size, energy metabolism and life span. J ExpBiol 208:1717–1730.
32. Nørhave N, Spurgeon D, Svendsen C, Cedergreen N. 2012. How doesgrowth temperature affect cadmium toxicity measured on different lifehistory traits in the soil nematode Caenorhabditis elegans? EnvironToxicol Chem 31:787–793.
33. Calabrese EJ, Baldwin LA. 2001. Hormesis: U-shaped dose responsesand their centrality in toxicology. Trends Pharmacol Sci 22:285–291.
34. Forbes VE. 2000. Is hormesis an evolutionary expectation? Funct Ecol14:12–24.
35. Jager T, Barsi A, Ducrot V. 2013. Hormesis on life-history traits: Is theresuch thing as a free lunch? Ecotoxicology 22:263–270.
Temperature effects of toxicity Environ Toxicol Chem 9999, 2014 9

UNCORRECTED PROOFS
AUTHOR QUERY FORM
JOURNAL: ENVIRONMENTAL TOXICOLOGY AND CHEMISTRY
Article: etc2563
Dear Author,
During the copyediting of your paper, the following queries arose. Please respond to these by annotating your proofswith the necessary changes/additions using the E-annotation guidelines attached after the last page of this article.
We recommend that you provide additional clarification of answers to queries by entering your answers on the querysheet, in addition to the text mark-up.
Query No. Query Remark
Q1 Please clarify: Does “This study” refer to Heugens etl al.? If so, please insert “[9]”after “This study”
Q2 Figures must be mentioned in numerical order. Please mention Figure 1 before this,switch the order of Figures 1 and 2 (and update text accordingly), or remove thisreference to Figure 2.
Q3 Table 4: It was not clear which study this note referred to. Please insert a superscriptc in the appropriate place in the table.
Q4 Ref 30: Please insert page range.

Environmental Toxicology and Chemistry
Please indicate if you would like your figures to be printed in color or black and white. Color images will be reproduced online in Wiley Online Library at no charge, whether or not you opt for color printing.
Failure to return this form will result in the publication of your figures in black and white. JOURNAL
VOLUME
ISSUE
TITLE OF MANUSCRIPT
MS. NO.
NO. OF COLOR PAGES
AUTHOR(S)
No. Color Pages Color Charges No. Color Pages Color Charges No. Color Pages Color Charges 1 550 5 2750 9 4950 2 1100 6 3300 10 5500 3 1650 7 3850 11 6050 4 2200 8 4400 12 6600
Please print the following figures in B&W: ________________
Please print the following figures in color: ________________
TOTAL color charges: ________________
BILL TO: Purchase Order No. (if applicable): Name
Institution Phone Address
Fax E-mail
***Payment details may be provided upon receipt of invoice. Invoices are issued upon print publication.***
PLEASE SUBMIT THIS FORM WITH YOUR PAGE PROOFS
John Wiley & Sons, Inc., 111 River Street, 8th
floor, Hoboken, NJ 07030. ATTENTION: Nesty Diaz ([email protected])

Environmental Toxicology and Chemistry Page Charge Form
PLEASE RETURN WITH YOUR PAGE PROOFS TO: John Wiley & Sons, 111 River Street, Hoboken, NJ 07030 ATTENTION: Nesty Diaz ([email protected]).
Article Number: Authors:
Please calculate page charges on the basis of the article type and length, and on your SETAC membership status:
Page Charges Check one Author Category Pages 1–6 Pages 7–12 Pages 13 and beyond Critical Review or Focus
Article Provided free by
the publisher $50 per page $150 per page
SETAC member-in-good-standing*
Provided free as a SETAC member
benefit
$50 per page $150 per page
Not a SETAC member or not a member-in-good-standing**
$50 per page $150 per page $150 per page
* SETAC member-in-good-standing: Your SETAC membership must be current at the time you submit the paper and must have been continuous for the 2 years prior to submission.
** A SETAC member is not in good standing if his or her membership is not current at the time the paper is submitted and has not been continuous for the 2 years prior to submission.
Total article length ____________ pages
Cost for pages 1–6 $___________
Additional cost for pages 7–12 $___________
Additional cost for pages 13 and beyond $___________
TOTAL page charges $___________
***Payment details may be provided upon receipt of invoice. Invoices are issued upon print publication.***
BILL TO:
Name: _____________________________ Institution: ________________________________
Address: ______________________________________________________________________
______________________________________________________________________
Phone: _____________________________ Fax: ______________________________________
E-mail: _______________________________________________________________________
• Purchase Order No. (If applicable): _____________________ Note: Color charges will be billed separately. If you are interested in Open Access options for your article, please visit:
https://authorservices.wiley.com/bauthor/onlineopen_order.asp