the greenhouse gas regional inventory process (grip): paris (france)
TRANSCRIPT
brUSSelS FrankFUrT glaSgOW hambUrg helSinki maDriD naPleS OSlO PariS POrTO rOTTerDam STOCkhOlm STUTTgarT TUrin
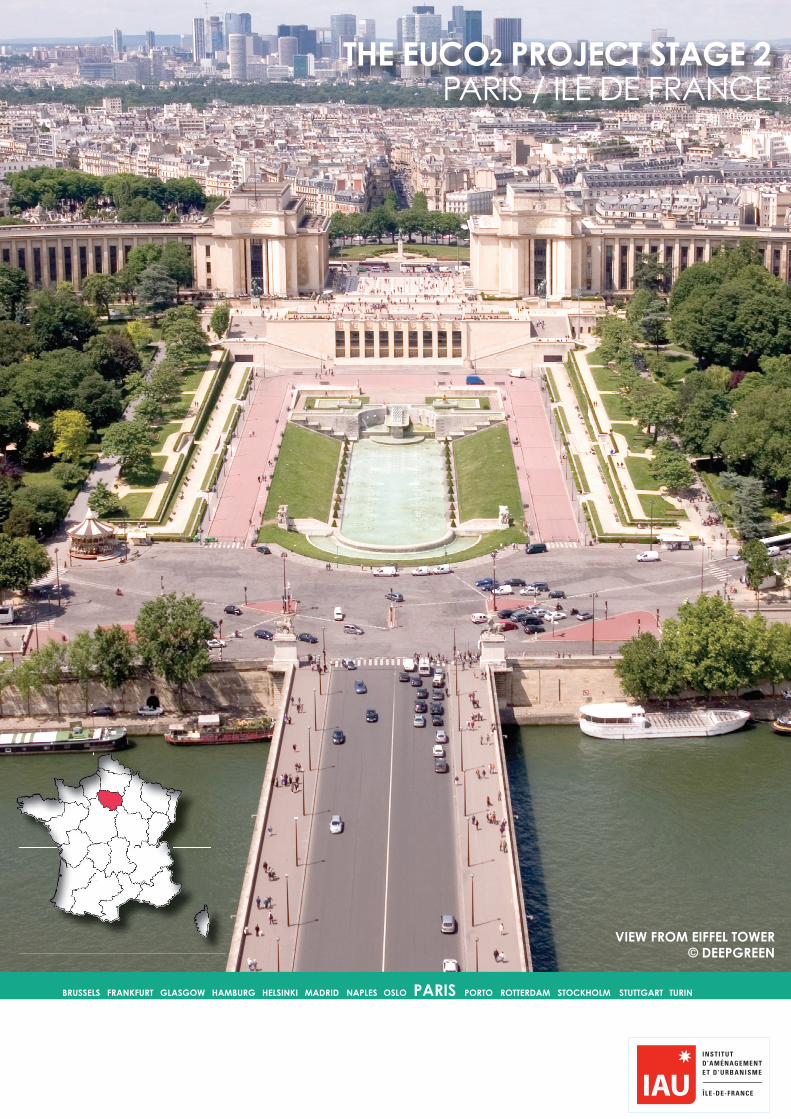
vieW FrOm eiFFel TOWer© DeePgreen
The eUCO2 PrOjeCT STage 2paris / ile de france

The eUCO2 PrOjeCT STage 2
160
The eUCO2 80/50 PrOjeCT STage 2
introduction to Paris
Industry, including construction, accounted for 12% of gross value added (GVA) in 2005, agriculture less than 1%, the commercial sector 71% of GVA, and public administration 16% of GVA. In 2010, 83% of the region’s employees worked in public administration or the service sector.
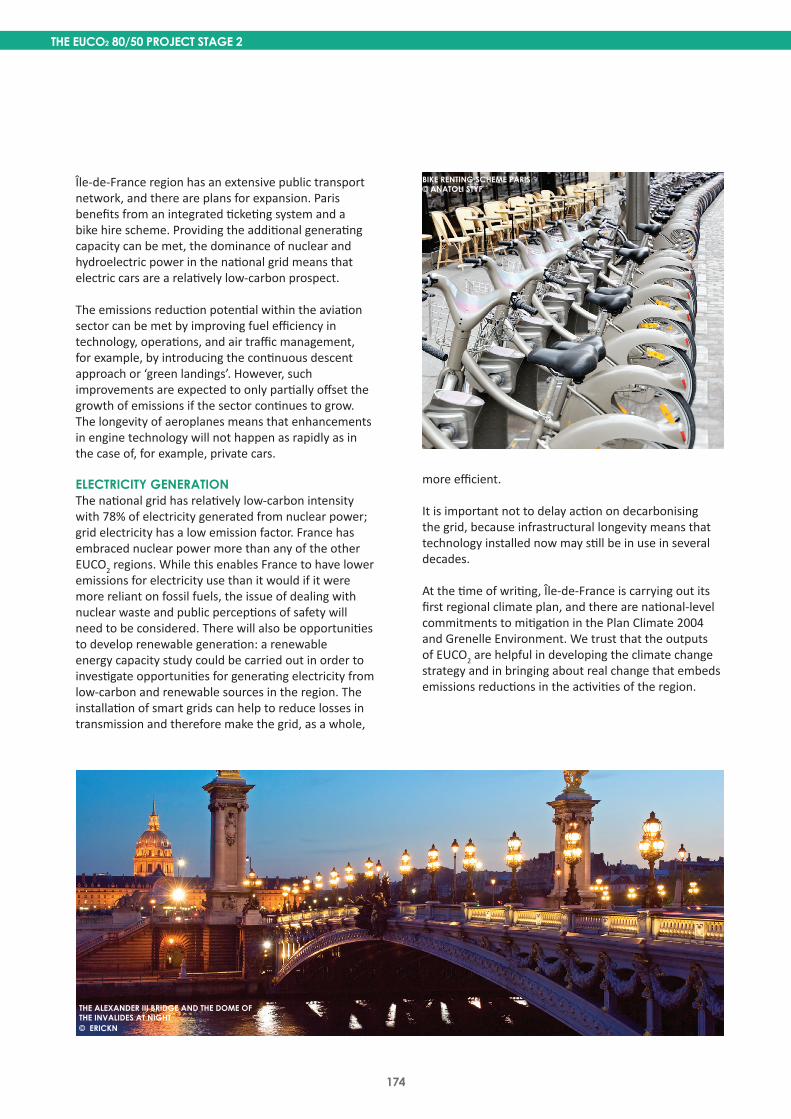
The region has an established transport network includ-ing 16 Metro Lines covering 211 kilometres of track, five RER lines, two tram ways and 1400 bus routes. There is one private vehicle registered for every 2.1 people in the region. The region has connections to the French TGV network and high-speed links to Brussels and London. The three main airports in the region, Charles de Gaulle, Paris-Orly and Paris Le-Bourget, handled 83 million passengers in 20093.
The ‘Grenelle 1’ or ‘Grenelle Environment’ identifies national-level policies for the environment, including climate change. Headline targets include a 20% reduc-tion of GhG emissions by 2020 on a 2009 baseline, a 20% improvement in energy efficiency by 2020, and the percentage of energy consumption from renewable energy to be 23% by 2020.
The national ‘Plan Climate 2004’, which was updated in 2006, sets the target to reduce GhG emissions by 75% by 2050. The Ile-de-France region has set a higher target of reducing GhG emissions by a factor of 4 by 2030. The Ile-de-France Regional Council is currently forming its first Regional Climate Plan. Furthermore, the national and regional administrations are working together to develop a Regional Plan for Energy, Air and Climate, in accordance with the Grenelle National Law.
The Ile-de-France region’s population was 11.5 mil-lion in 2005 and covers approximately 12,000km2. This makes the region the most densely inhabited region in France. The region includes 1,281 towns and cities including the city of Paris - which accommodates nearly one fifth of the region’s population.
The region is comprised of a highly urbanised central zone, including the densely populated three-depart-ment area known as the ‘inner ring’ and a less densely populated four-department ‘outer ring’. The region is situated at the heart of the Paris basin, which borders the mountain ranges of the Ardennes, the Vosges and the Morvan. Agricultural and green space make up 79% of the land. This includes four natural parks. In the outer ring, 24% of the land area is comprised of leisure parks and rich and varied natural habitats and forests. In 2005, 30.5% of the region’s population was aged be-tween 20 and 39 years old making it one of the young-est populations in France. In 2010, 56.8% of the region was less than 40 years old. Although people are tending to leave the region when they retire, population growth comes less from inward migration from the rest of France and more from births within the region. In 2010, more than one in five births in France was in the Ile-de-France region. The region has been the most ethnically diverse area of France since the 1930s.
Ile de France has the largest regional share of the national economy, accounting for 29% of GDP in 2009. The region has Europe’s largest share of the world’s 500 biggest companies located within it, second globally to Tokyo1. A quality of life survey by Monocle Magazine found it to be the seventh best city in the world to live and work in2.
PariS CaFe© anaTOli STyF
meTrOPOliTan line PariS© TrOmbax
1 www.iledefrance.fr/english/decouvrir-lile-de-france/an-overview/a-land-of-contrast/2 www.monocle.com/specials/35_cities/3 2009, Airports de Paris Sustainable Growth
THE EUCO2 PROJECT STAGE 2
161
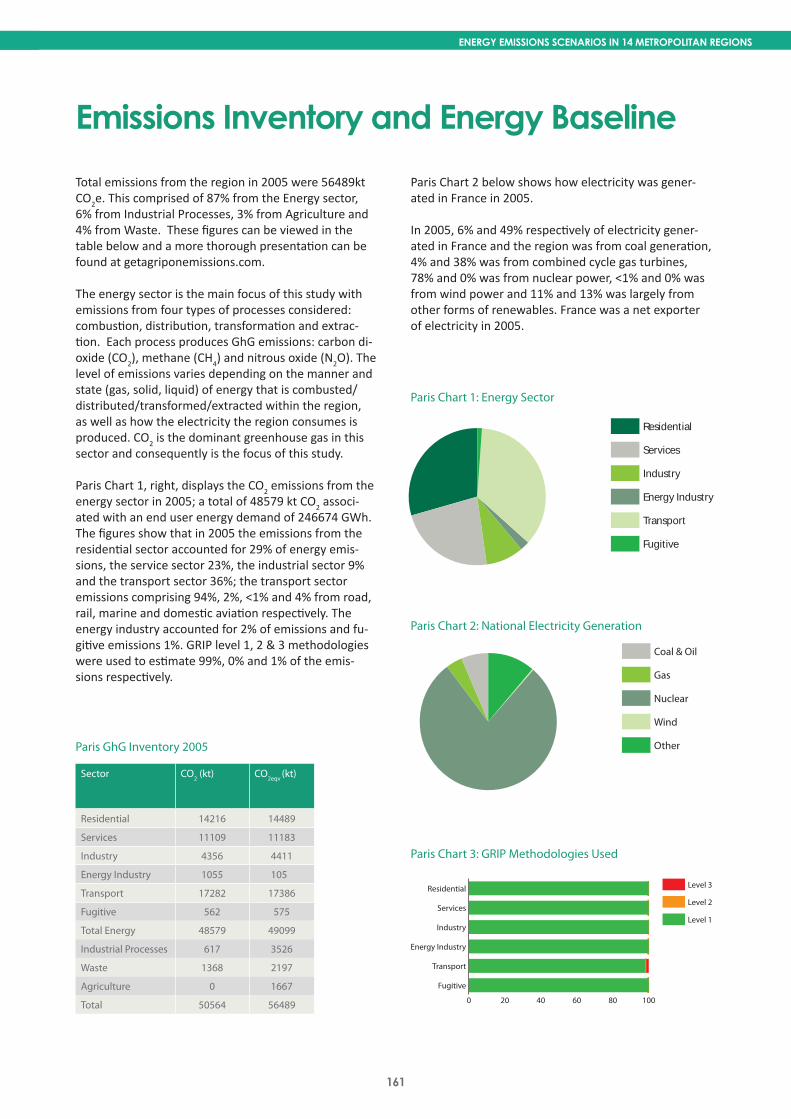
Emissions Inventory and Energy Baseline
ENERGY EMISSIONS SCENARIOS IN 14 METROPOLITAN REGIONS
Paris GhG Inventory 2005
Sector CO2 (kt) CO2eqv (kt)
Residential 14216 14489
Services 11109 11183
Industry 4356 4411
Energy Industry 1055 105
Transport 17282 17386
Fugitive 562 575
Total Energy 48579 49099
Industrial Processes 617 3526
Waste 1368 2197
Agriculture 0 1667
Total 50564 56489
CO2
-‐-‐
2 2
2
2
2 associ-‐
-‐
-‐
-‐
-‐
-‐
0 20 40 60 80 100
Level 3
Level 2
Level 1
Fugitive
Transport
Energy Industry
Industry
Services
Residential
Paris Chart 1: Energy Sector
Residential
Services
Industry
Energy Industry
Transport
Fugitive
Coal & Oil
Gas
Nuclear
Wind
Other
Residential
Services
Industry
Energy Industry
Transport
Fugitive
Coal & Oil
Gas
Nuclear
Wind
Other
Paris Chart 2: National Electricity Generation
Paris Chart 3: GRIP Methodologies Used
The eUCO2 PrOjeCT STage 2
162
The eUCO2 80/50 PrOjeCT STage 2
Scenario OverviewTranSPOrT Emission reductions of 97%, 82% and 82% have been achieved by Road Transport in Scenarios 1, 2 and 3 respectively. There is no increase in road transport kilometres in any of the scenarios, this is driven by planning and market interventions to discourage private car use. Improvements in vehicle engines lead to efficiency improvements of between 45% and 61% in each scenario. In Scenarios 1 and 2, electricity accounts for half of the ‘fuel’ mix. In Scenario 3, slower development of battery technologies limits the adoption of electric vehicles and hydrogen becomes the dominant fuel.
Further electrification to the rail network takes place in each scenario and the number of vehicle kilometres increase. In Scenarios 1 and 3 there is no increase in aeroplane vehicle kilometres. In Scenario 2, there is an 80% increase in vehicle kilometres with a lower 40% increase in energy demand due to efficiency improvements.
eleCTriCiTy generaTiOn In each scenario there is a national grid, rather than an European grid. In Scenario 1, France pursues a strategy of independence and self-sufficiency with no fossil fuels in the generation mix. None of the scenarios contain CCS. In all three scenarios nuclear power continues to play an important role in generation, although in none of the scenarios is there unanimous support for it. In Scenario 1, electricity generation inside the region is carbon free and is based on wind, solar, hydroelectric and biomass, whereas in the other two scenarios there has been some development of renewables but natural gas continues to play an important role.
inTrODUCTiOnThere were four scenario sessions conducted in the Île-de-France Region, three scenarios focused on reducing CO2 emissions by 80% by 2050. The remaining session looked at what level of CO2 reduction could be achieved by 2025 and what actions could be pursued in the short-term.
To ensure that the scenarios were developed independently the participants in the sessions were not informed how previous groups, either in the region, or outside had acted. This section provides a comparison between the first three scenarios.
The emissions decrease by 97%, 80% and 76% ; and energy demand decreases by 47%, 32% and 49% in Scenarios 1, 2 & 3 respectively.
eCOnOmy anD POPUlaTiOn In Scenario 1, the population grows to 13 million in this scenario due to the region’s strong economy. In Scenario 3, there is a lower increase in population, with some of this immigration coming from the global south due to climatic change. In each scenario there is a decrease in household size with construction struggling to keep up with demand.
Average annual economic growth is 0.7%, 1% and 2% in Scenarios 1, 2 & 3 respectively. In Scenario 1 the agricultural sector increases to 10% of the economy and the industry sector almost doubles driven by an increasing importance placed on local production and low-impact products. Despite economic growth the relative share of the economy is largely unchanged in Scenarios 2 & 3.
reSiDenTial, ServiCeS anD inDUSTrial SeCTOrS. In Scenario 1, the emissions from the residential, services and industry sectors have reduced to zero, due to the zero carbon nature of the heat mix the national grid. Combined heat and power (CHP) is also carbon free. In each scenario each sectors energy demand reduces. The reduction of heat demand and electricity is partly reflective of compliance with regulations existing in 2005.
In Scenarios 2 and 3 emissions reduce by at least 70% in each sector. The utilisation of CHP increases across the sectors in each scenario. Only in Scenario 1 is there a fully carbon neutral, biofuel-fired CHP system. In the other two scenarios there remains a natural gas component, albeit a smaller one than in 2005. In each scenario, solid fossil fuel has been removed from the CHP and from direct heating, cooling and process heat. On-site technologies for heat are a key energy source across the sectors.
The eUCO2 PrOjeCT STage 2
163
energy emiSSiOnS SCenariOS in 14 meTrOPOliTan regiOnS
164
The eUCO2 80/50 PrOjeCT STage 2
Scenario Characteristics
in ThiS meDiUm grOWTh SCenariO CO2 emiSSiOnS reDUCe by 97% anD Per CaPiTa emiSSiOnS COnTraCT TO 0.1T. enD USer energy COnSUmPTiOn DeCreaSeS by nearly halF. The POPUlaTiOn inCreaSeS DUe TO immigraTiOn. POliCieS regarDing bUilDing COnSTrUCTiOn PUT in PlaCe early in The CenTUry have Driven The COnSUmPTiOn OF energy in The reSiDenTial SeCTOr DOWn. The ServiCe SeCTOr mOveD FaSTer TO reDUCe iTS emiSSiOnS DUe TO iTS abiliTy TO Deliver POliCy. a SWiTCh TO zerO CarbOn energy reDUCeS emiSSiOnS in The inDUSTrial SeCTOr. The energy in-DUSTry beCOmeS renWable-FOCUSeD. eleCTriCally PrOPelleD PrivaTe vehiCle USe inCreaSeS bUT rOaD vehiCle kilOmeTerS DeCreaSe aS DOeS PUbliC TranSPOrT. The regiOn reCeiveS iTS eleCTriC-iTy FrOm a FrenCh griD ThaT iS almOST enTirely SelF-SUFFiCienT.
eCOnOmy anD POPUlaTiOnAll countries have successfully reduced their CO2 emissions and the worst impacts of climate change have been avoided. The population of Île-de-France has grown steadily over the past 45 years to 13 million. People, particularly from southern and eastern European countries, have moved to the region because of its strong economy. The rest of France’s population has grown at the same rate as the region. Regional household size has declined as new homes have been constructed.
The regional economy, like the rest of France, has grown at 0.7% each year. Industry’s share of the regional economy has doubled, and agriculture has increased its share to 10%, due to the development of hemp and wood production. Industry has grown partly due to lifestyle changes which have created a demand for local production and ‘green’ products. The public administration sector has the same share of the regional economy, and the commercial sector has decreased its share to 45%.
reSiDenTial SeCTOr
“There will be no more waste in 2050, especially household waste, so no waste heating?”
Emissions have reduced to near zero. Both new and old buildings comply with regulations put in place in the first decade of the century. This has resulted in a reduction of 75% in residential heat demand and 50% in electricity demand. Public subsidies have helped to enable these changes which would not have otherwise been possible. Heat demand is met by an energy mix split equally between bioenergy, CHP and on-site heat renewable technologies. Onsite renewable electricity generation meets 10% of demand.
“Road transport and railway transport are both crazy, so as a hypothesis, we need to keep jobs close to housing, otherwise we’re
making the problem even worse.”
ServiCeS SeCTOrEmissions have reduced to near zero emissions. The service sector reduced its emissions quicker than the
residential sector as it was better placed to apply the Grenelle targets. Electricity demand has reduced by 50% and there has been a reduction in heat demand of 85%. It has not been possible to eradicate the use of air conditioning, but the technology is now more efficient. As in the residential sector, heat demand is met by an energy mix split equally between bioenergy, CHP and on-site heat technologies. CHP contributes less than 1% of electricity, and is powered by bioenergy. On-site photovoltaic (PV) panels meet 10% of electricity demand.
inDUSTrial SeCTOrIndustry has reached near zero emissions, despite more than doubling electricity and heat demand. Heat demand is met by an energy mix that includes bioenergy, hydrogen and electricity. CHP supplies 10% of heating and cooling energy and 4% of electricity. CHP is fuelled entirely by bioenergy. There have been significant improvements in energy efficiency, achieved in part through recycling and by process integration. Increasingly, processes have been adapted to enable electrification. As the electricity mix is low-carbon, this has resulted in further emissions reductions.
energy inDUSTryEnergy industry has reduced its emissions to near zero. The petroleum refinery in the region has become a bioenergy refinery that requires no other external energy.
TranSPOrT
“In 2050 there will be no more petrol.”
Emissions from the road transport sector have decreased by 97%. Urban planning policies advocated locating activities near public transport nodes and encouraging home working, which has led to a 30% decline in road vehicle kilometres. Road vehicles have become more than twice as efficient as they were in 2005, through improvements to engine design and being lighter. Electricity has become the dominant road transport ‘fuel’ along with development of bioenergy and hydrogen ‘fuels’. Petroleum’s share of the road
Scenario 1: Paris

165
energy emiSSiOnS SCenariOS in 14 meTrOPOliTan regiOnS
0 1000020000300004000050000600007000080000
Baseline 2005
Scenario - 2050
Transport
Energy Industry
Industry
Services
Residential
0 5000 10000 15000 20000
Baseline 2005
Scenario - 2050
Transport
Energy Industry
Industry
Services
Residential
0 20 40 60 80 100
Coal CCS
Gas CCS
Coal
Gas
Nuclear
Wind On-Shore
Wind off-Shore
Tidal
Hydro
Solar
Biomass
Outside Region
Region
0 20000 40000 60000 80000 100000
CHP
Onsite
Grid
Baseline 2005
Scenario - 2050
CO2 emissions Change by Sector (kt)
electricity generation Percentage Share
electricity Source
energy Change by Sector (gWh)
transport energy mix has reduced substantially to 10%.
There have been improvements to the rail in the form of infrastructure which have helped double rail vehicle kilometres. Rail is 80% electrified with the remaining rolling stock running on bioenergy and hydrogen. These changes have enabled the rail network to become largely carbon free. Traffic on the waterways network, including the Seine Nord Canal, has expanded. Boats still run on petroleum, but the sector’s emissions are 30% lower than in 2005 because of efficiency improvements.
eleCTriCiTy generaTiOn
“Biofuels, for example, will be unsustainable, and we’ll not be able to use pesticides in agriculture. What we have to reflect are major
changes in consumption.”
France has pursued a strategy of independence and self-sufficiency and there is little requirement for electricity from neighbouring electricity networks. There is no coal or natural gas generation, making electricity carbon free. The majority of electricity produced nationally is generated in nuclear power stations. Solar power and bioenergy have been developed, supplying 2% and 7% of grid electricity respectively. Regional electricity production has increased its share of the national supply from 6% to 10% and is mainly generated from bioenergy with some wind and solar power.
Emissions Change -97%
Energy Change -47%
Emissions per Capita 0.1t
166
The eUCO2 80/50 PrOjeCT STage 2
Scenario Characteristics
in ThiS lOW grOWTh SCenariO CO2 emiSSiOnS reDUCe by 80% anD Per CaPiTa emiSSiOnS COn-TraCT TO 0.7T. enD USer energy COnSUmPTiOn DeCreaSeS by nearly a ThirD. The POPUlaTiOn inCreaSeS DUe TO an aging POPUlaTiOn. POliCieS regarDing bUilDing eFFiCienCy have Driv-en The COnSUmPTiOn OF energy in The reSiDenTial anD ServiCe SeCTOrS DOWn. a SWiTCh TO knOWleDge inTenSive inDUSTrieS reDUCe energy COnSUmPTiOn anD emiSSiOnS in The inDUSTrial SeCTOr. PrivaTe vehiCle USe DeCreaSeS anD PUbliC TranSPOrT inCreaSeS. The regiOn reCeiveS iTS eleCTriCiTy FrOm a FrenCh griD, WiThin The regiOn PrODUCTiOn iS largely FrOm naTUral gaS.
“We’re trying to make a new future, not repeat the mistakes of the past.”
eCOnOmy anD POPUlaTiOnThe national population has grown at the same rate as the regional population. The number of households has increased to 6.6 million, an increase of 37% since 2005. There is a trend for people to live in smaller household units (an average of 2 people per household), in part due to the aging population. By 2050, growth across the region has been distributed evenly, rather than centred in the urban core. This reflects a desire to restrict urban sprawl, but also, policy encouraged locating workplaces near to residences and the regionalisation of national governance.
“If we differentiate economic and demographic growth, that would be good.”
The economy has grown at an average annual rate of 1%. Higher value industries, such as research and development, have tended to occur more in the region than elsewhere in France; this has been aided by the presence of Charles de Gaulle airport.
“There’s ‘Nimby’ [not in my back yard] behaviour and we’re not likely to want to change our habits, but our kids will have to deal with it.”
reSiDenTial SeCTOr
“And because most houses are rented the occupants have little control over the quality of the building and optimisation may happen
very slowly as a result.”
Emissions have reduced by 83%. Half of the housing stock from the turn of the century has been retrofitted to meet high energy efficiency standards, overcom-ing obstacles associated with historical buildings and rented properties. Heat demand per household has halved with 10% of it met by fossil fuels. CHP networks have expanded to provide 40% of heat and 3% of electricity. There have been no significant behavioural changes, though smart grids and associated smart technologies have helped to reduce costs to consumers, and smart meters have helped residents to use devices more efficiently. Overall there has been a 3% increase in electricity demand.
“[There are] a number of historical buildings in Paris which are part of the heritage and we can’t change them because of that.”
ServiCe SeCTOrEmissions have reduced by 81%. Electricity demand is unchanged and heat demand has reduced by 40% since the beginning of the century. Energy efficiency has im-proved largely through regulations. Heat demand is met by a similar mix as the residential sector, but with less bioenergy and more on-site renewable heat technolo-gies. CHP meets 50% of demand.
inDUSTrial SeCTOrEmissions have reduced by 71%. Overall electricity demand has not changed. Heat demand has halved due to a shift towards knowledge-based industries. Natural gas’s share of the energy mix has reduced while the use of CHP and on-site heat technologies has increased. CHP provides 50% of heat and 11% of electricity. The predominate on-site renewable heat technology used is ground-source heat pumps. The residential, services and industry sectors are connected to CHP networks fired by a mixture of natural gas, biomass, waste and geothermal, which has been widely adopted.
TranSPOrT
“Need to think about market drivers to de-incentivise road travel. Make it slower or make it more expensive.”
Emissions have reduced by 82%. The increase in popu-lation has led to an increase in travel in the region, but there has been a shift away from private car use towards rail, causing vehicle kilometres to rise by 50%. This change was driven by a combination of market drivers including road capacity reaching saturation point. Despite lobbying, political will for road pricing has not been found. Road transport has become more efficient and consumes 50% less energy per kilometre than in 2005. Road transport’s energy mix is comprised of 50% electricity and 20% bioenergy. Vehicle manu-facturers have invested in the development of electric vehicle technology, particularly batteries. Safety fears have meant hydrogen technologies have not been developed. Electricity remains the dominant fuel in rail
Scenario 2: Paris

167
energy emiSSiOnS SCenariOS in 14 meTrOPOliTan regiOnS
CO2 emissions Change by Sector (kt)
electricity generation Percentage Share
electricity Source
energy Change by Sector (gWh)
0 20000 40000 60000 80000
Baseline 2005
Scenario - 2050
Transport
Energy Industry
Industry
Services
Residential
0 5000 10000 15000 20000
Baseline 2005
Scenario - 2050
Transport
Energy Industry
Industry
Services
Residential
0 20 40 60 80 100
Coal CCS
Gas CCS
Coal
Gas
Nuclear
Wind On-Shore
Wind off-Shore
Tidal
Hydro
Solar
Biomass
Outside Region
Region
0 1000020000300004000050000600007000080000
CHP
Onsite
Grid
Baseline 2005
Scenario - 2050
and the low-carbon intensity of electricity means that rail transport emissions have reduced by 69%.
“Hydrogen can be dismissed because it’s just way too dangerous.”
Boats on inland waterways are now electric and charged overnight in docks. The number of boats run-ning on electricity forms half the fleet, leading to emis-sions reductions of 44%. In comparison, the aviation sector has increased its emissions by 5%, despite an increase in energy use of 40% and an 80% increase in passenger kilometres for long-distance aviation. This has been achieved through the introduction of bioen-ergy into the energy mix. This change was motivated by the increasing cost of aviation fuel, but develop-ment was limited by the availability of bioenergy as opposed to technological advances.
eleCTriCiTy generaTiOnThe region is connected to a national electric grid comprising 5% fossil fuels. Nuclear power has de-creased its share of the mix. Despite its long term lack of popularity, wind energy (mostly off-shore) contrib-utes 30%. Hydroelectric power, tidal power and solar power form the rest of the national grid supply. There are no coal-fired power stations, but a national law decreed that, if one were planned, it would need to have CCS technology. Relative to national generation, the region continues to provide the same amount of electricity as in 2005. Natural gas generates the major-ity of regional electricity supply.
CO2 emissions Change by Sector (kt)
electricity generation Percentage Share
electricity Source
energy Change by Sector (gWh)
Emissions Change -80%
Energy Change -32%
Emissions per Capita 0.7t
168
The eUCO2 80/50 PrOjeCT STage 2
Scenario Characteristics
in ThiS meDiUm grOWTh SCenariO CO2 emiSSiOnS reDUCe by 76% anD Per CaPiTa emiSSiOnS COn-TraCT TO 1T. enD USer energy COnSUmPTiOn iS CUT by nearly a halF. The POPUlaTiOn inCreaSeS DUe TO immigraTiOn CaUSeD in ParT by ClimaTe reFUgeeS. behaviOUral Change, ClimaTe Change anD aPPlianCe eFFiCienCy helP reDUCe reSiDenTial energy DemanD. POliCy regarDing ServiCe SeCTOr’S bUilDingS Drive DOWn The SeCTOr’S energy COnSUmPTiOn. a SWiTCh in FUelS reDUCeS emiSSiOnS in The inDUSTrial SeCTOr. PrivaTe vehiCle USe DeCreaSeS by a QUarTer, WiTh ThiS energy DemanD being meT mOSTly by lOW-CarbOn energy. The regiOn reCeiveS iTS eleC-TriCiTy FrOm a FrenCh griD.
eCOnOmy anD POPUlaTiOnThe population has increased to 12 million, growing at the same rate as the rest of the country. The impact of climate change in Sub-Saharan Africa has led to im-migration to France with immigrants tending to move first to the Île-de-France region. There are 5.5 million households, with social trends meaning that people prefer to live in smaller households. Development has been more concentrated in the city than the suburbs to help maintain lifestyles of earlier in the century.
“There are also climate refugees because there are increasing risks for people in the southern hemisphere.”
The region’s economy has grown at 2% per year, which is slightly slower than the national average. There has been little change in the sectorial share of the economy, with a slight increase in the commercial sector compen-sated for by a decrease in public administration. Indus-try has remained important to the region’s economy, with many factories being renewed and renovated over the past 45 years.
reSiDenTial SeCTOrEmissions have reduced by 77%. Electricity and heat demand have decreased by 25% and 70% respectively. These changes in demand have been driven by ef-ficient new technologies, behavioural changes and global warming. New policies across different levels of government, Île-de-France, Paris and the EU have been introduced. Guidelines at the European level and financial support at the regional level have supported the installation of solar technologies.
CHP meets 20% of heat demand. Although the share of natural gas and petroleum has decreased, fossil fuels still form half of the energy mix for heating. However, because heat consumption has reduced by 70%, this is half of a much smaller heat demand. There has been some deployment of on-site renewable heat technolo-gies; ground-source heat pumps have been installed on communal buildings as they were seen as too expensive for individual houses. On-site technologies, mainly solar PV, meet 25% of electricity demand.
ServiCeS SeCTOrEmissions have reduced by 78%. Electricity demand has increased and heat demand has decreased. It has been easier to achieve energy efficiency improvements in the service sector than in the residential sector, because policy requires that buildings are systemically renovat-ed. CHP, powered by natural gas and bioenergy, meets a larger share of heat demand than in the residential sector. On-site heat renewable technologies, mainly solar thermal panels, meet 20% of heat demand. Onsite technologies, mainly solar PV panels, generate 15% of electricity.
inDUSTrial SeCTOrEmissions from industry have nearly halved. Industry has grown in line with the wider regional economy, with both heat and electricity demand remaining static, partly as a result of process optimisation. Natural gas provides 26% and low-carbon electricity 0% of heat de-mand. CHP plants, providing 29% of heat demand, are fired by a mixture of natural gas and bioenergy. On-site technologies, mainly solar PV panels, generate 5% of electricity demand.
“Industry has already made amazing strides to optimise processes, so to make any more gains would be very surprising.”
TranSPOrTEmissions from road transport have reduced by 82%. A master plan has been implemented that has reduced car use and increased walking and cycling. This has helped to reduce road vehicle kilometres by 25%. The use of electric cars has increased, and now accounts for 23% of the road transport energy mix while petroleum now fuels 25% of vehicles, hydrogen 40%, bioenergy 10%, and natural gas 2%. Further deployment of electric vehicles has been constrained by challenges in the development of battery technology, particularly for longer distances.
“Larger population, but they’re poorer because they’re from Sub-Saharan Africa, so they won’t travel as much.”
Scenario 3: Paris
169
energy emiSSiOnS SCenariOS in 14 meTrOPOliTan regiOnS
CO2 emissions Change by Sector (kt)
electricity Source
energy Change by Sector (gWh)
0 20000 40000 60000 80000
Baseline 2005
Scenario - 2050
Transport
Energy Industry
Industry
Services
Residential
0 5000 10000 15000 20000
Baseline 2005
Scenario - 2050
Transport
Energy Industry
Industry
Services
Residential
0 20 40 60 80 100
Coal CCS
Gas CCS
Coal
Gas
Nuclear
Wind On-Shore
Wind off-Shore
Tidal
Hydro
Solar
Biomass
Outside Region
Region
0 25000 50000 75000 100000
CHP
Onsite
Grid
Baseline 2005
Scenario - 2050
electricity generation Percentage Share
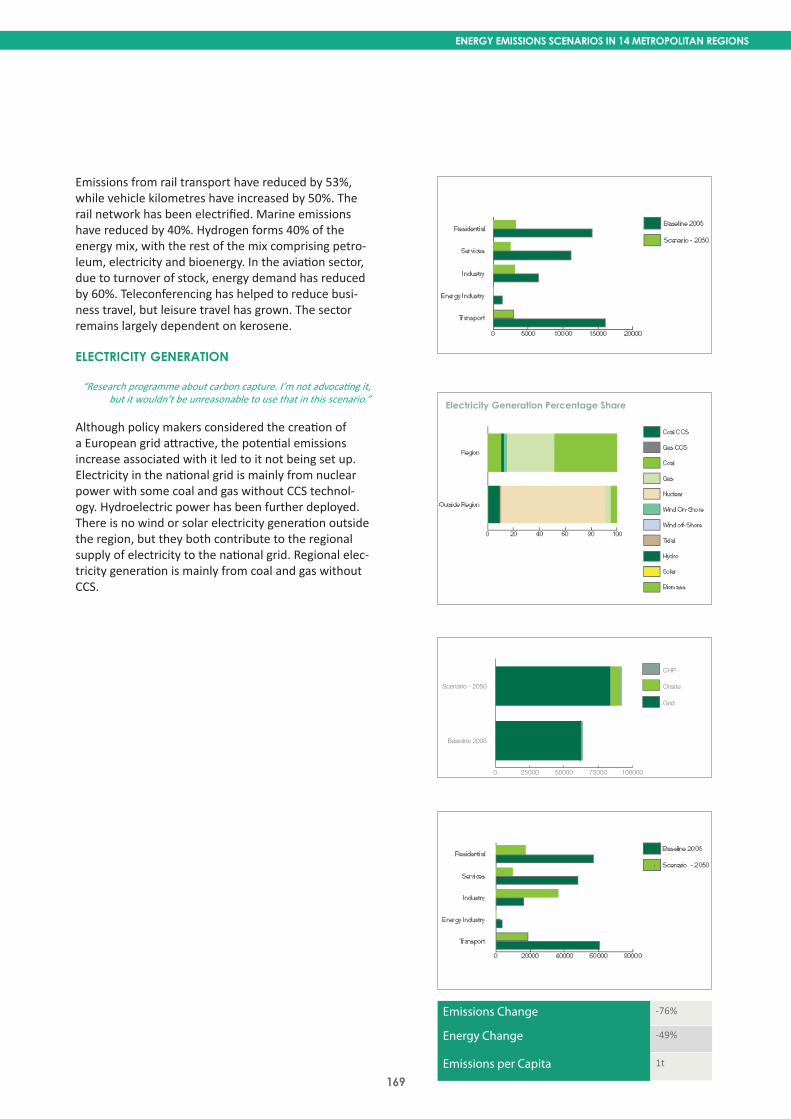
Emissions from rail transport have reduced by 53%, while vehicle kilometres have increased by 50%. The rail network has been electrified. Marine emissions have reduced by 40%. Hydrogen forms 40% of the energy mix, with the rest of the mix comprising petro-leum, electricity and bioenergy. In the aviation sector, due to turnover of stock, energy demand has reduced by 60%. Teleconferencing has helped to reduce busi-ness travel, but leisure travel has grown. The sector remains largely dependent on kerosene.
eleCTriCiTy generaTiOn
“Research programme about carbon capture. I’m not advocating it, but it wouldn’t be unreasonable to use that in this scenario.”
Although policy makers considered the creation of a European grid attractive, the potential emissions increase associated with it led to it not being set up. Electricity in the national grid is mainly from nuclear power with some coal and gas without CCS technol-ogy. Hydroelectric power has been further deployed. There is no wind or solar electricity generation outside the region, but they both contribute to the regional supply of electricity to the national grid. Regional elec-tricity generation is mainly from coal and gas without CCS.
Emissions Change -76%
Energy Change -49%
Emissions per Capita 1t
The eUCO2 PrOjeCT STage 2
170
The eUCO2 80/50 PrOjeCT STage 2
inTrODUCTiOnThe purpose of the final scenario session was to iden-tify, based on the outcomes of the 2050 scenario ses-sions, what emissions reductions might be achieved in the region by 2025. The final scenario session in Île-de-France involved representatives from each of the three 2050 scenarios. Emissions have reduced by 53%.
eCOnOmy anD POPUlaTiOnThe population has increased to 12 million, represent-ing 18% of the population of France. Average house-hold size has reduced. The economy has grown by 0.7% on average each year, with industry and agriculture increasing their share of the economy and the commer-cial sector contracting slightly.
reSiDenTial SeCTOrEmissions have reduced by 64%. Electricity consump-tion has increased by 30%, and heat demand has reduced by 50%. Natural gas comprises 60% of the heat energy mix, petroleum 5%, biofuel 15%, and on-site heat technologies 5%. Onsite renewable electricity gen-eration meets 5% of electricity consumption.
ServiCe SeCTOrEmissions have reduced by 74%. Electricity consump-tion has not changed, but heat demand has reduced by 55%. Natural gas meets 30% of heat demand, petro-leum 5%, and biofuel 9%. CHP provides 42% of heat demand and a small amount of electricity demand, less than 1%. On-site renewable heat technologies meet a further 10% of demand. There has been no deployment of on-site electricity generation.
inDUSTrial SeCTOrEmissions have reduced by 28%. Electricity and heat demand have reduced by 10%. Natural gas meets 66% of heat demand, on-site renewable heat technologies 4% and electric heating 5%. On-site renewable electric-ity generation meets 3% of electricity demand. The energy industry in the region has closed down.
2025 Synthesis Scenario: Paris
TranSPOrTRoad transport emissions have reduced by 35% and road vehicle kilometres have reduced by 25%. Petro-leum is the dominant fuel, but there has been some development of bioenergy, which forms 5% of the fuel mix, and electric vehicles (10%). The number of vehicle kilometres travelled on rail has increased by 86%, re-flecting some modal shift away from car use. There has been a decrease of 6% in the marine sector’s emissions, reflecting the introduction of 5% bioenergy and 1% electricity to the fuel mix.
eleCTriCiTy generaTiOnThere has been little change in the mix of technologies used for the generation of electricity across France, with nuclear power remaining the dominant source. Nationally, coal has been entirely phased out, replaced by wind and biomass. Coal generation has also been phased out in the region, with further electricity gen-eration met by 10% onshore wind, 2% hydroelectric and 53% bioenergy.

The eUCO2 PrOjeCT STage 2
171
energy emiSSiOnS SCenariOS in 14 meTrOPOliTan regiOnSenergy emiSSiOnS SCenariOS in 14 meTrOPOliTan regiOnS
arC De TriOmPhe aT nighT.© FSTOCkFOTO

THE EUCO2 PROJECT STAGE 2
172
THE EUCO2 80/50 PROJECT STAGE 2
RESIDENTIAL SECTOR
2
INTRODUCTION
2
the EUCO2
The EUCO2
2
tonnes CO2
Next Steps: Paris
Step Action
2
3
THE EUCO2 PROJECT STAGE 2
173
ENERGY EMISSIONS SCENARIOS IN 14 METROPOLITAN REGIONS
INDUSTRIAL SECTOR
TRANSPORT
2 emissions and
SERVICE SECTOR
THE EUCO2 PROJECT STAGE 2
174
THE EUCO2 80/50 PROJECT STAGE 2
in engine technology will not happen as rapidly as in
ELECTRICITY GENERATION
EUCO2
2
BIKE RENTING SCHEME PARIS© ANATOLI STYF
THE ALEXANDER III BRIDGE AND THE DOME OF THE INVALIDES AT NIGHT© ERICKN