the future of the guangdong-hong kong-macao greater bay
TRANSCRIPT
GBA Background Document
© Copyright 2022 Foundation, 2019. 1
The Future of the Guangdong-Hong Kong-Macao
Greater Bay Area
Background Document
2022 Foundation
January 2019
GBA Background Document
© Copyright 2022 Foundation, 2019. 2
Contents
0. This Document ................................................................................................................................ 6
1. Introduction .................................................................................................................................... 7
An Economic Region ........................................................................................................................... 8
2. The Region .................................................................................................................................... 11
Historical Background ....................................................................................................................... 11
Regional Economic Profile ................................................................................................................ 12
Linkages and Interactions in the Region ........................................................................................... 15
Trade in Goods .............................................................................................................................. 15
Cargo Flows ................................................................................................................................... 18
Trade in Services ........................................................................................................................... 22
“Foreign Investment” .................................................................................................................... 31
Financial Flows in the GBA ............................................................................................................ 36
Visitor Flows in the GBA ................................................................................................................ 38
Education Links in the GBA ........................................................................................................... 42
Cultural and Creative Exchange .................................................................................................... 45
3. The GBA’s Transportation Connectivity ........................................................................................ 46
Air Transportation ............................................................................................................................. 47
Water Transportation ....................................................................................................................... 49
High-speed Rail ................................................................................................................................. 53
Inter-city Rail ..................................................................................................................................... 56
Metro Systems .................................................................................................................................. 60
Road Transport ................................................................................................................................. 60
Transport Connectivity in the GBA ................................................................................................... 66
4. Boundary Crossing ........................................................................................................................ 69
Cross Boundary Trips ........................................................................................................................ 69
Control Points ................................................................................................................................... 71
Boundary Crossings by Control Points .............................................................................................. 77
Border Crossing Points in the GBA .................................................................................................... 80
5. Human Mobility in the Greater Bay Area ..................................................................................... 82
Guangdong Province ......................................................................................................................... 82
Work Permits, Residence, and Social Security: People from the Chinese Mainland .................... 82
Work Permits, Residence, and Social Security: Hong Kong and Macao Residents ....................... 84
Short-Term Business and Tourist Visas ......................................................................................... 87
Ability to Buy Property .................................................................................................................. 88
Hong Kong and Macao ...................................................................................................................... 91
GBA Background Document
© Copyright 2022 Foundation, 2019. 3
Work Permits, Residence, and Social Security .............................................................................. 91
Short Term Business and Tourist Visas into Hong Kong and Macao ............................................ 94
Ability to Purchase Property in Hong Kong and Macao ................................................................ 96
Human Mobility in the GBA .............................................................................................................. 97
6. Initiatives, Programs, Plans, and Policies Related to GBA Cooperation and Development.......... 99
Plans Specific to the GBA .................................................................................................................. 99
The GBA Initiative ......................................................................................................................... 99
Prior GBA Plans ............................................................................................................................... 100
Plans Related to the GBA ................................................................................................................ 102
CEPA ............................................................................................................................................ 102
China (Guangdong) Pilot Free Trade Zone .................................................................................. 105
Framework Agreement on Guangdong’s Cooperation with Hong Kong and Macao ................. 111
The Thirteenth Five Year Program for the National Economy and Social Development of Guangdong .................................................................................................................................. 112
Demonstration Areas for Service Liberalization ......................................................................... 113
The Implementation Plan for the Construction of the PRD National Demonstration Zone for Independent Innovation and the China (Guangdong) Pilot Free Trade Zone ............................ 115
The Plan for Guangzhou-Shenzhen Scientific Technology and Innovation Corridor .................. 117
Hong Kong Programs for Cooperation in the GBA .......................................................................... 117
Macao Programs for Cooperation in the GBA ................................................................................ 119
Appendix 6.1. Specific Areas for GBA Cooperation under the GFTZ .............................................. 120
Nansha Area ................................................................................................................................ 120
Qianhai and Shekou Area ............................................................................................................ 121
Hengqin Area .............................................................................................................................. 122
Appendix 6.2. Ten Major Core Innovation Platforms and 37 Nodes of Guangzhou-Shenzhen Scientific and Technological Innovation Corridor ........................................................................... 124
Appendix 6.3. Examples of Inter-Governmental Interaction in the GBA ........................................ 125
7. Economic Circles in the PRD........................................................................................................ 127
Guangzhou-Foshan-Zhaoqing Integration ...................................................................................... 127
Transport Integration .................................................................................................................. 127
Land Planning Integration ........................................................................................................... 129
Economic Planning Integration ................................................................................................... 129
Integration of Public Services...................................................................................................... 129
Further plans for integration ...................................................................................................... 132
Appendix 7.1. Agreements and Policies on Guangzhou-Foshan-Zhaoqing Integration ................ 133
Appendix 7.2. Agreements and Policies on Shenzhen-Dongguan-Huizhou Integration ................. 142
Appendix 7.3. Agreements and Policies on Zhuhai, Zhongshan, and Jiangmen Integration .......... 143
8. The Jurisdictions of the GBA ....................................................................................................... 145
GBA Background Document
© Copyright 2022 Foundation, 2019. 4
Guangzhou ...................................................................................................................................... 145
Development Plans ..................................................................................................................... 145
Plan for Cooperation with Hong Kong and Macao ..................................................................... 146
Positioning................................................................................................................................... 146
Shenzhen ......................................................................................................................................... 150
Development Plans ..................................................................................................................... 150
Plan for Cooperation with Hong Kong and Macao ..................................................................... 151
Positioning................................................................................................................................... 151
Dongguan ........................................................................................................................................ 155
Development Plans ..................................................................................................................... 155
Plan for Cooperation with Hong Kong and Macao ..................................................................... 156
Positioning................................................................................................................................... 156
Foshan ............................................................................................................................................. 160
Development Plans ..................................................................................................................... 160
Plan for Cooperation with Hong Kong and Macao ..................................................................... 161
Positioning................................................................................................................................... 161
Zhuhai ............................................................................................................................................. 165
Development Plans ..................................................................................................................... 165
Plan for Cooperation with Hong Kong and Macao ..................................................................... 165
Positioning................................................................................................................................... 166
Zhongshan ....................................................................................................................................... 170
Development Plans ..................................................................................................................... 170
Plan for Cooperation with Hong Kong and Macao ..................................................................... 170
Positioning................................................................................................................................... 170
Huizhou ........................................................................................................................................... 174
Development Plans ..................................................................................................................... 174
Plan for Cooperation with Hong Kong and Macao ..................................................................... 174
Positioning................................................................................................................................... 174
Jiangmen ......................................................................................................................................... 178
Development Plans ..................................................................................................................... 178
Plan for Cooperation with Hong Kong and Macao ..................................................................... 178
Positioning................................................................................................................................... 179
Zhaoqing ......................................................................................................................................... 182
Development Plans ..................................................................................................................... 182
Plan for Cooperation with Hong Kong and Macao ..................................................................... 182
Positioning................................................................................................................................... 183
Hong Kong ....................................................................................................................................... 186
Development Plans ..................................................................................................................... 187
GBA Background Document
© Copyright 2022 Foundation, 2019. 5
Positioning................................................................................................................................... 187
Macao ............................................................................................................................................. 192
Development Plans ..................................................................................................................... 192
Positioning................................................................................................................................... 193
9. 9. A Selection of Reports and Surveys on the GBA ..................................................................... 197
10. Background on the European Union ........................................................................................... 202
The EU Integration Process: Milestones ......................................................................................... 202
Free Movement of Goods ........................................................................................................... 202
Free Movement of Services ........................................................................................................ 203
Free Movement of the Workforce .............................................................................................. 204
Free Movement of Capital .......................................................................................................... 204
Common Competition Law (including prohibition to subsidize at the member-state level) ..... 205
The Legislative Process in the EU .................................................................................................... 205
EU Competences and Relations with Member States .................................................................... 206
The Source and Distribution of Competences in the European Union ....................................... 206
Exclusive Competence ................................................................................................................ 207
Shared Competence .................................................................................................................... 207
Supporting Competence ............................................................................................................. 208
Decision-making in the EU .......................................................................................................... 209
Competence by Topic: the EU “Competence Matrix” ................................................................ 210
EU Organization .............................................................................................................................. 217
GBA Background Document
© Copyright 2022 Foundation, 2019. 6
0. This Document
This document is the Background Document for “The Future of the Guangdong-Hong Kong-Macao
Greater Bay Area” Project. It compiles information on the Greater Bay Area (GBA), its jurisdictions,
and programs and policies that may affect the future of the GBA. Given the complex nature of the
region (9 cities or prefectures in Guangdong Province and two Special Administrative Regions in
three customs zones); the multiple governments involved (Central Government of the People’s
Republic of China, Provincial Government of Guangdong, Hong Kong SAR Government, Macao SAR
Government, and the governments of the 9 cities of the Guangdong portion of the GBA); and the
multiple laws, regulations, agreements, programs, policies, and initiatives that influence the GBA,
establishing the fact base is an important undertaking.
This Document is one of the outputs from a six-month investigation into the Greater Bay Area of
Southern China undertaken under the auspices of the 2022 Foundation.
This Document has been prepared by a team at Hong Kong-based consultancy Enright, Scott &
Associates (ESA) under the direction of Professor Michael J. Enright, with substantial input from
Professor Feng Xiaoyun (of Guangzhou's Jinan University), Professor Patrick Low (of the Asia Global
Institute and University of Hong Kong), Professor Petros Mavroidis (of Columbia University and
University of Neuchâtel); and a team at the Fung Business Intelligence Centre including Chang Ka-
Mun, Denise Cheung WY, and Chan Kaiyip.
The goal has been to pull together information on the region to be used by researchers, analysts,
and others, as well as to provide background for the Main Report and Executive Summary for the
Project. These documents provide analysis, implications, and suggestions to enhance the economic
development of the GBA region.
GBA Background Document
© Copyright 2022 Foundation, 2019. 7
1. Introduction
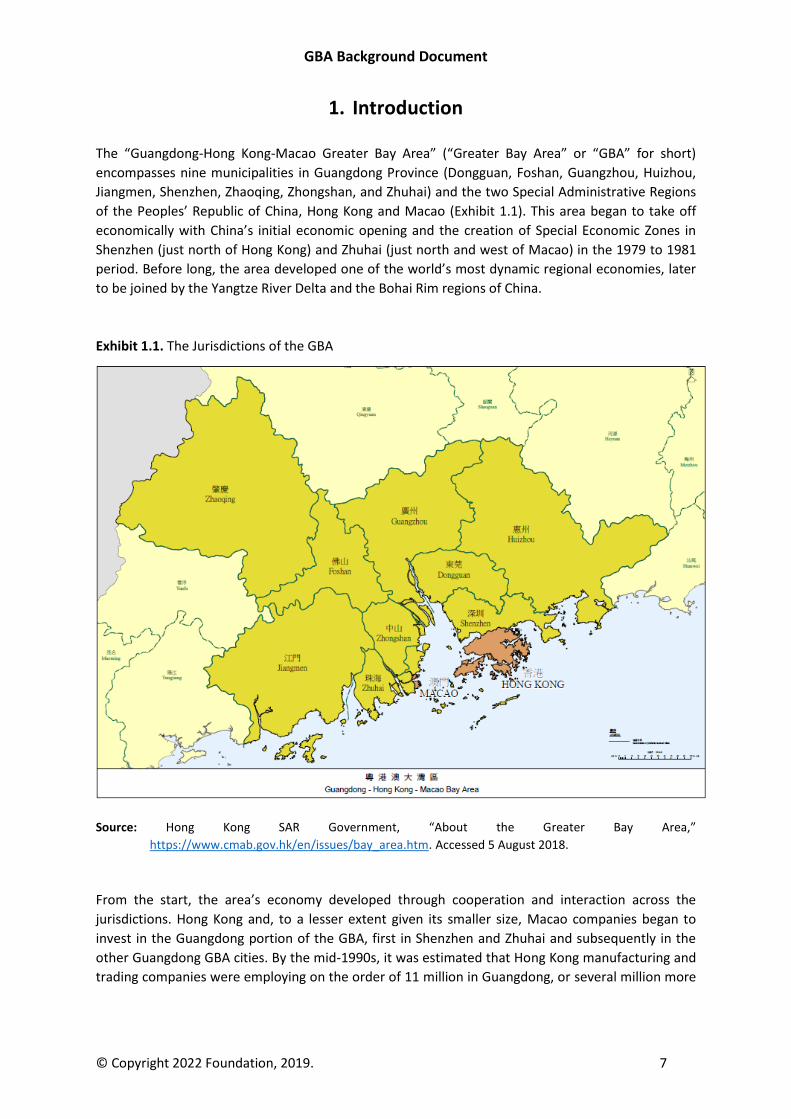
The “Guangdong-Hong Kong-Macao Greater Bay Area” (“Greater Bay Area” or “GBA” for short)
encompasses nine municipalities in Guangdong Province (Dongguan, Foshan, Guangzhou, Huizhou,
Jiangmen, Shenzhen, Zhaoqing, Zhongshan, and Zhuhai) and the two Special Administrative Regions
of the Peoples’ Republic of China, Hong Kong and Macao (Exhibit 1.1). This area began to take off
economically with China’s initial economic opening and the creation of Special Economic Zones in
Shenzhen (just north of Hong Kong) and Zhuhai (just north and west of Macao) in the 1979 to 1981
period. Before long, the area developed one of the world’s most dynamic regional economies, later
to be joined by the Yangtze River Delta and the Bohai Rim regions of China.
Exhibit 1.1. The Jurisdictions of the GBA
Source: Hong Kong SAR Government, “About the Greater Bay Area,”
https://www.cmab.gov.hk/en/issues/bay_area.htm. Accessed 5 August 2018.
From the start, the area’s economy developed through cooperation and interaction across the
jurisdictions. Hong Kong and, to a lesser extent given its smaller size, Macao companies began to
invest in the Guangdong portion of the GBA, first in Shenzhen and Zhuhai and subsequently in the
other Guangdong GBA cities. By the mid-1990s, it was estimated that Hong Kong manufacturing and
trading companies were employing on the order of 11 million in Guangdong, or several million more
GBA Background Document
© Copyright 2022 Foundation, 2019. 8
than the total population of Hong Kong.1 Hong Kong companies were also leaders in investing in and
managing the toll roads, ports, and power plants that helped provide the hard industrial
infrastructure for parts of the GBA as well as the hotels, office buildings, and facilities that helped
provide the soft industrial infrastructure.2
Guangdong became a leader in China’s reform process and an attractive location for talented
individuals from all over China. In the process, the province’s population increased from 52.3 million
in 1980 to 70.5 million in 1997 to 111.7 million in 2017. The “Pearl River Delta Economic Zone”
jurisdictions of Dongguan, Foshan, Guangzhou, Huizhou, Jiangmen, Shenzhen, Zhaoqing, Zhongshan,
and Zhuhai (but particularly Shenzhen, Dongguan, Guangzhou, and Foshan in the eastern and central
Pearl River Delta) saw wave upon wave of economic development, which included simple assembly
and basic infrastructure, followed by multi-stage processing, component production, and logistics;
followed by more advanced industries, support services, research and development, and complex
infrastructure; followed by advanced manufacturing, indigenous innovation, high-tech development,
and medium to high-end services.
Hong Kong’s economy benefitted enormously from China’s opening; its GDP grew at a real rate of
6.3 percent per year from 1980 to 1997. Despite the Asian Financial Crisis, the Global Financial Crisis,
and other international economic downturns, Hong Kong’s GDP grew at a real rate of 3.4 percent per
year from 1997 to 2017. The Hong Kong economy, which had already shifted from a manufacturing
economy to a services economy by 1997 (services 85.2 percent3 of GDP) continued the trend and by
2016 services accounted for 92.2 percent4 of Hong Kong’s GDP, with financial services, professional
services, trade-related services, and tourism accounting for 56.6 percent of GDP. 5
The Macao economy, which had been dominated by tourism related to the gaming industry along
with light manufacturing, took off with the ending of the gaming monopoly and the opening of
facilities of new competitors in 2004. Macao’s economy grew at a rate of 8.9 percent per year from
1999 to 2004, 13.2 percent per year from 2004 to 2010, and 6.6 percent per year from 2010 to 2017.
By 2016, the tourism and gaming sector accounted for 61.1 percent6 of GDP.
An Economic Region
The idea of the Greater Bay Area as an integrated economic region with greater cooperation from a
planning standpoint started to take root after the return of Hong Kong and Macao to Chinese
1 Michael J. Enright, Edith E. Scott, and David Dodwell, The Hong Kong Advantage (Hong Kong: Oxford University Press, 1997). 2 Michael J. Enright, Chang Ka-Mun, Edith E. Scott, and Zhu Wenhui, Hong Kong and the Pearl River Delta: The Economic Interaction (Hong Kong: The 2022 Foundation, 2003). 3 Hong Kong Census and Statistics Department, “GDP by economic activity (b) Percentage contribution to GDP at current prices, 1980-1998,” Gross Domestic Product 1961 to 1999, March 2000. 4 Hong Kong Census and Statistics Department, “Gross Domestic Product (GDP) by Major Economic Activity - Percentage Contribution to GDP at Basic Current Prices,” Accessed August 2018. 5 Hong Kong Census and Statistics Department, “Value added of the Four Key Industries, Feature Article: The Four Key Industries and Other Selected Industries in the Hong Kong Economy,” Hong Kong Monthly Digest of Statistics, May 2018. 6 Statistics and Census Service of the Government of Macao Special Administrative Region, Macao’s Tourism Satellite Account, 2018.
GBA Background Document
© Copyright 2022 Foundation, 2019. 9
administration in 1997 and 1999 respectively. For example, when the 2022 Foundation released its
report, Hong Kong and the Pearl River Delta: The Economic Interaction7 in February 2003, the search
term “The Greater Pearl River Delta,” the name that was being promoted for the area as an
integrated economic region at the time, registered 175 “hits” in a Google search. By the end of 2005,
when a book from the project, Regional Powerhouse: The Greater Pearl River Delta and the Rise of
China,8 was published, the number of hits was 15,600 and by May 2010, when the 6th edition of
Invest Hong Kong’s The Greater Pearl River Delta9 by some of the same authors was published, the
number was 1,450,000.
In the meanwhile, Hong Kong and Macao both have CEPAs, or Closer Economic Partnership
Arrangements, with the Chinese Mainland that were signed in June and October of 2003
respectively. By 2018, there had been 10 supplements to each of the CEPA arrangements as well as
agreements on trade in services. Hong Kong and Macao, which have been two of the world’s most
open economies, signed their own CEPA in October 2017. The dominant business interaction and
integration that the various rounds of CEPA negotiations have facilitated have taken place within the
GBA.
There have been clear benefits to the economic interaction and integration that has taken place
between Guangdong, Hong Kong, and Macao. Hong Kong was a critical source of investment and
access to the rest of the world for Guangdong-based manufacturing facilities in the early days of
China’s economic opening, and still plays an important role as investor and connector to this day.
Guangdong provided the manufacturing base that allowed Hong Kong to become a leading trading
economy and Guangdong still provides a vast production base and market for Hong Kong firms, as it
has progressed on its own as well. The vast majority of the tourists that drive Macao’s economy
once came from Hong Kong and now come from Guangdong. The economic interaction within the
GBA transformed the region from an economic backwater to one of the world’s most dynamic and
important economic regions.
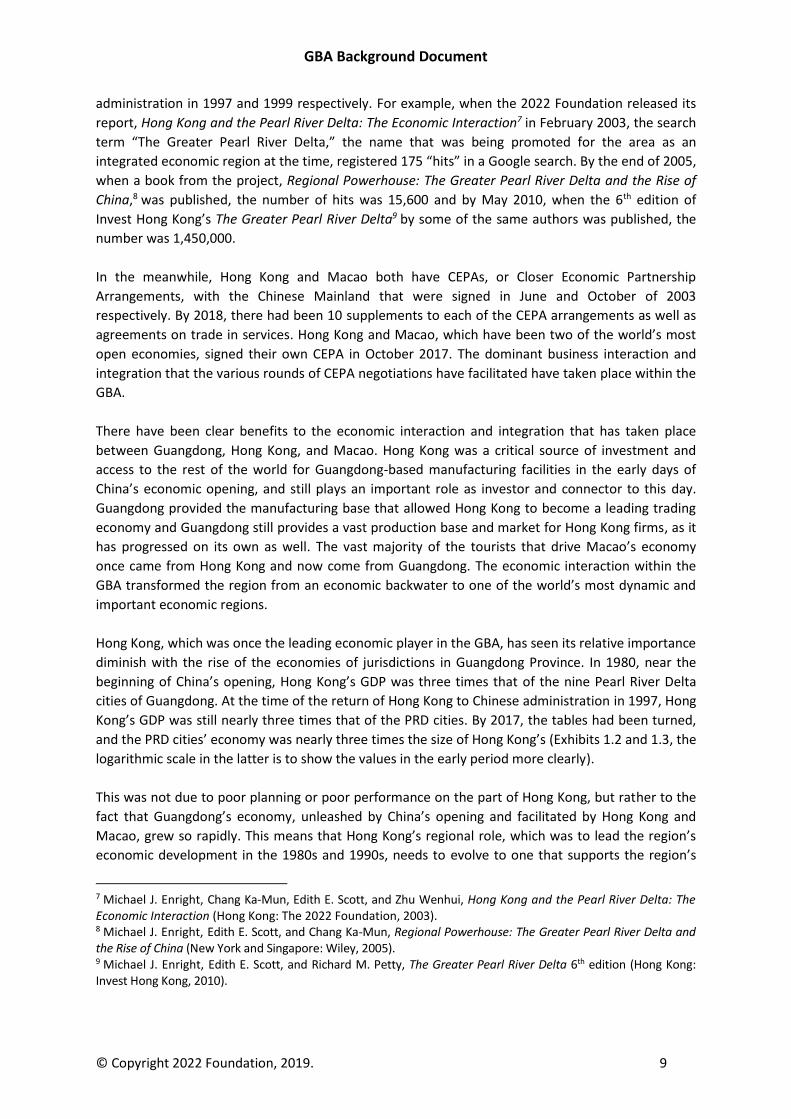
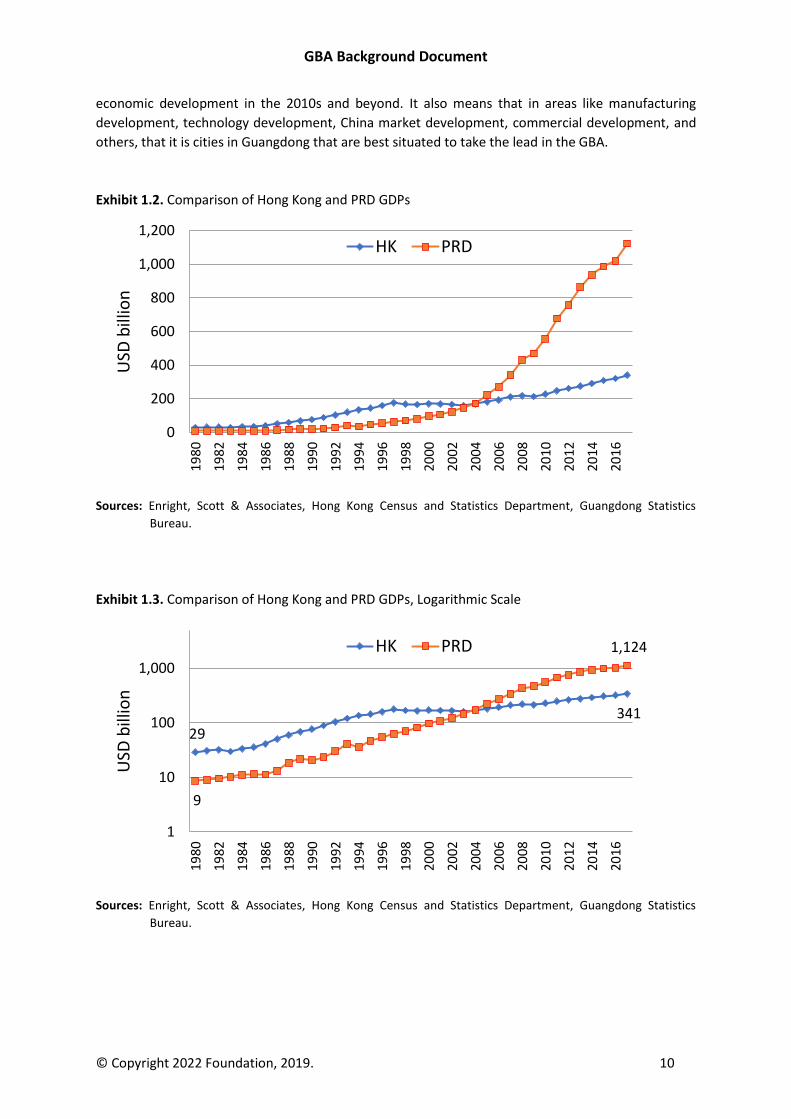
Hong Kong, which was once the leading economic player in the GBA, has seen its relative importance
diminish with the rise of the economies of jurisdictions in Guangdong Province. In 1980, near the
beginning of China’s opening, Hong Kong’s GDP was three times that of the nine Pearl River Delta
cities of Guangdong. At the time of the return of Hong Kong to Chinese administration in 1997, Hong
Kong’s GDP was still nearly three times that of the PRD cities. By 2017, the tables had been turned,
and the PRD cities’ economy was nearly three times the size of Hong Kong’s (Exhibits 1.2 and 1.3, the
logarithmic scale in the latter is to show the values in the early period more clearly).
This was not due to poor planning or poor performance on the part of Hong Kong, but rather to the
fact that Guangdong’s economy, unleashed by China’s opening and facilitated by Hong Kong and
Macao, grew so rapidly. This means that Hong Kong’s regional role, which was to lead the region’s
economic development in the 1980s and 1990s, needs to evolve to one that supports the region’s
7 Michael J. Enright, Chang Ka-Mun, Edith E. Scott, and Zhu Wenhui, Hong Kong and the Pearl River Delta: The Economic Interaction (Hong Kong: The 2022 Foundation, 2003). 8 Michael J. Enright, Edith E. Scott, and Chang Ka-Mun, Regional Powerhouse: The Greater Pearl River Delta and the Rise of China (New York and Singapore: Wiley, 2005). 9 Michael J. Enright, Edith E. Scott, and Richard M. Petty, The Greater Pearl River Delta 6th edition (Hong Kong: Invest Hong Kong, 2010).
GBA Background Document
© Copyright 2022 Foundation, 2019. 10
economic development in the 2010s and beyond. It also means that in areas like manufacturing
development, technology development, China market development, commercial development, and
others, that it is cities in Guangdong that are best situated to take the lead in the GBA.
Exhibit 1.2. Comparison of Hong Kong and PRD GDPs
Sources: Enright, Scott & Associates, Hong Kong Census and Statistics, Guangdong Statistical Bureau
Sources: Enright, Scott & Associates, Hong Kong Census and Statistics Department, Guangdong Statistics
Bureau.
Exhibit 1.3. Comparison of Hong Kong and PRD GDPs, Logarithmic Scale
Sources: Enright, Scott & Associates, Hong Kong Census and Statistics, Guangdong Statistical Bureau
Sources: Enright, Scott & Associates, Hong Kong Census and Statistics Department, Guangdong Statistics
Bureau.
29
341
9
1,124
1
10
100
1,000
1980
1982
1984
1986
1988
1990
1992
1994
1996
1998
2000
2002
200
4
200
6
2008
2010
2012
2014
2016
USD
bill
ion
HK PRD
0
200
400
600
800
1,000
1,200
19
80
19
82
19
84
19
86
19
88
19
90
19
92
19
94
19
96
19
98
20
00
20
02
200
4
200
6
20
08
20
10
20
12
20
14
20
16
USD
bill
ion
HK PRD
GBA Background Document
© Copyright 2022 Foundation, 2019. 11
2. The Region
The Greater Bay Area consists of nine cities of Guangdong Province, which account for around 30
percent of the land mass of Guangdong Province, plus the Special Administrative Regions of Hong
Kong and Macao. It is located in the Pearl River Delta along the South China coast.
Historical Background
Guangdong was first incorporated into the Chinese empire in 222 BCE, when the first emperor of the
Qin dynasty, conquered the area. In 111 BCE Chinese domination was extended to the whole of
what is now Guangdong. Over the next centuries Guangdong became more integrated into China
and by the 1100s Guangzhou had become a major transit point for international trade and a city
with a population of hundreds of thousands. By the 17th century Guangdong became a source of
emigration, first to other parts of China and then to other parts of the world. When China closed
itself off from the rest of the world, Guangzhou became the leading conduit for foreign trade. After
the founding of the People’s Republic of China, Guangdong retained its leading role in trade, but
otherwise was economically behind the Eastern and Northeastern coasts of China. With the advent
of China’s economic reform and opening program in 1979-1981, Guangdong took a leadership role in
reform and opening, a role it retains to today, and emerged as one of the most economically
dynamic provinces of China.
The British took control over Hong Kong Island and the Kowloon Peninsula in the 1840s as a result of
the Opium Wars. Subsequently a lease was signed that gave the British control over the more
extensive New Territories adjacent to Kowloon. China never acknowledged the legitimacy of foreign
administration over Hong Kong and Macao and when the 99-year lease on the New Territories (over
80 percent of the Hong Kong land mass) came up for expiry, China indicated its desire to reassume
administration. This was achieved based on the Joint Declaration of the Government of the United
Kingdom of Great Britain and Northern Ireland and the Government of the People's Republic of China
on the Question of Hong Kong, signed in December 1984, and The Basic Law of the Hong Kong
Special Administrative Region, which was adopted on 4 April 1990 by the National People's Congress
of the PRC and came into effect on 1 July 1997.
Macao’s colonial history was much longer than that of Hong Kong. Macao is reported to have been
established by one Jorge Alvarez, a Portuguese explorer in the mid-1550s as one of the first trading
ports in the Far East. After initial success, increased competition from other foreign powers in the
region, the opening up of further Chinese ports to foreign trade, and trade restrictions applied by
Chinese leaders, the colony saw a decline in its wealth and influence. The granting of a gaming
monopoly in 1962 brought investment that helped build a tourism industry to supplement Macao’s
trading and light manufacturing. In the 1970s, the Portuguese Government decided to dis-invest
itself of all its colonial possessions. This coincided with China’s desire to reassert administration over
its territory. Discussions between the Portugal and Chinese leaders resulted in the signing of the
Joint Declaration of the Government of the People's Republic of China and the Government of the
Portuguese Republic on the Question of Macao, in March 1987 and The Basic Law of the Macao
Special Administrative Region of the People's Republic of China, which was adopted by the National
People's Congress of the PRC on 31 March 1993 and came into effect on 20 December 1999.
GBA Background Document
© Copyright 2022 Foundation, 2019. 12
Regional Economic Profile
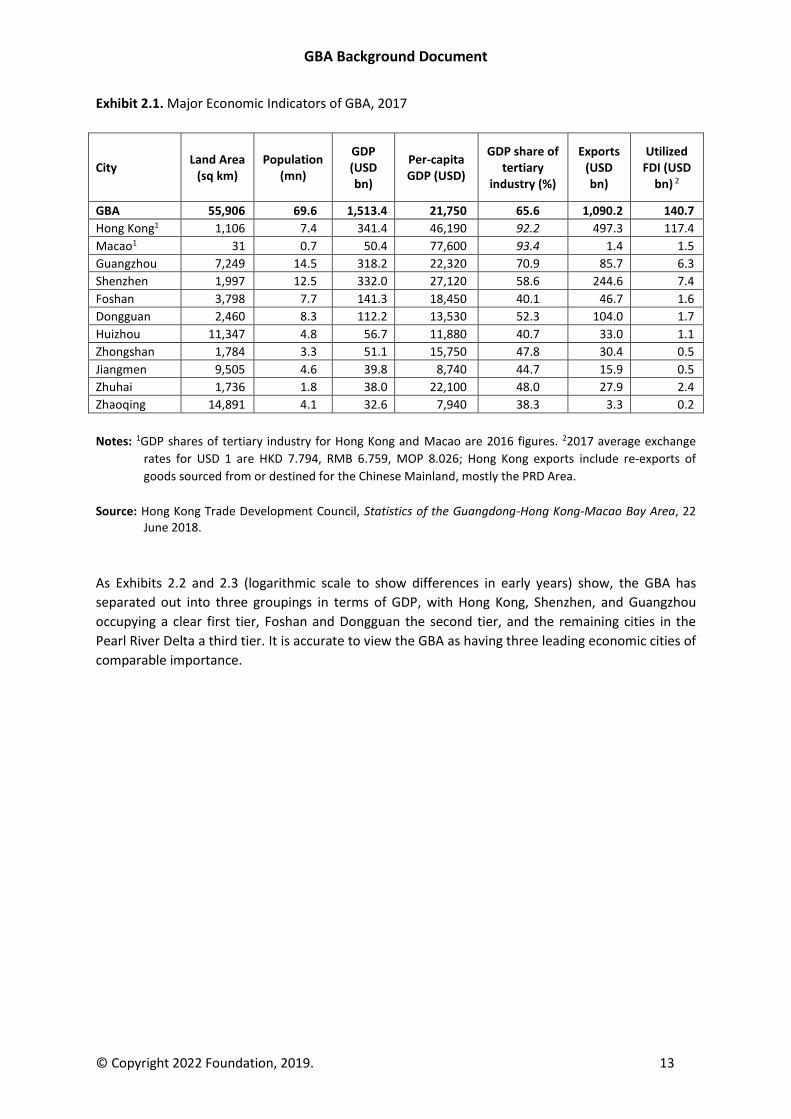
The land area of the GBA is 55,905 square kilometers (see Exhibit 2.1). The largest jurisdiction in the
region is Huizhou in the eastern part of the GBA at 11,347 square kilometers and the smallest is
Macao at only 31 square kilometers. The official permanent population of the region was 69.6
million in 2017, though unofficial estimates placed the region’s population significantly higher.
Guangzhou had the largest reported permanent population at 14.5 million, while Macao had the
smallest at 0.7 million. Hong Kong’s GDP of USD 341 billion led the region, but Shenzhen and
Guangzhou were not far behind. The economies of Hong Kong and Macao are dominated by the
service sector, while those of Zhaoqing, Foshan, and Huizhou are still dominated by manufacturing.
Per capita GDP in the region shows significant disparity, with Macao’s USD 77,600 figure skewed by
the small population and the high profitability of the SAR’s gaming establishments the world’s third
highest according to the IMF, while Hong Kong’s per capita GDP of USD 46,190 was ahead of both
Canada (USD 45,077) and Germany (USD 44,550). Shenzhen’s GDP per capita of USD 27,120 was
below that of South Korea USD 29,891, but above that of Taiwan USD 24,577.10 Most of the GBA
jurisdictions now qualify as high-income economies (the World Bank cut off is per capita Gross
National Income of USD 12,05511).
Hong Kong was the dominant recipient of foreign direct investment in the GBA, accounting for USD
117.4 billion out of a total of USD 140.7 billion in 2017. Hong Kong’s USD 497.3 billion in exports is
misleading, since USD 491.7 of those exports were re-exports.12 Shenzhen and to a lesser extent
Dongguan are the region’s real export powerhouses.
10 IMF, World Economic Outlook, April 2018. 11 World Bank, New country classifications by income level: 2018-2019, 1 July 2018. 12 Enright, Scott & Associates analysis based on Hong Kong Census and Statistics Department data.
GBA Background Document
© Copyright 2022 Foundation, 2019. 13
Exhibit 2.1. Major Economic Indicators of GBA, 2017
City Land Area
(sq km) Population
(mn)
GDP
(USD bn)
Per-capita GDP (USD)
GDP share of tertiary
industry (%)
Exports (USD bn)
Utilized FDI (USD
bn) 2
GBA 55,906 69.6 1,513.4 21,750 65.6 1,090.2 140.7
Hong Kong1 1,106 7.4 341.4 46,190 92.2 497.3 117.4
Macao1 31 0.7 50.4 77,600 93.4 1.4 1.5
Guangzhou 7,249 14.5 318.2 22,320 70.9 85.7 6.3
Shenzhen 1,997 12.5 332.0 27,120 58.6 244.6 7.4
Foshan 3,798 7.7 141.3 18,450 40.1 46.7 1.6
Dongguan 2,460 8.3 112.2 13,530 52.3 104.0 1.7
Huizhou 11,347 4.8 56.7 11,880 40.7 33.0 1.1
Zhongshan 1,784 3.3 51.1 15,750 47.8 30.4 0.5
Jiangmen 9,505 4.6 39.8 8,740 44.7 15.9 0.5
Zhuhai 1,736 1.8 38.0 22,100 48.0 27.9 2.4
Zhaoqing 14,891 4.1 32.6 7,940 38.3 3.3 0.2
Notes: 1GDP shares of tertiary industry for Hong Kong and Macao are 2016 figures. 22017 average exchange
rates for USD 1 are HKD 7.794, RMB 6.759, MOP 8.026; Hong Kong exports include re-exports of
goods sourced from or destined for the Chinese Mainland, mostly the PRD Area.
Source: Hong Kong Trade Development Council, Statistics of the Guangdong-Hong Kong-Macao Bay Area, 22 June 2018.
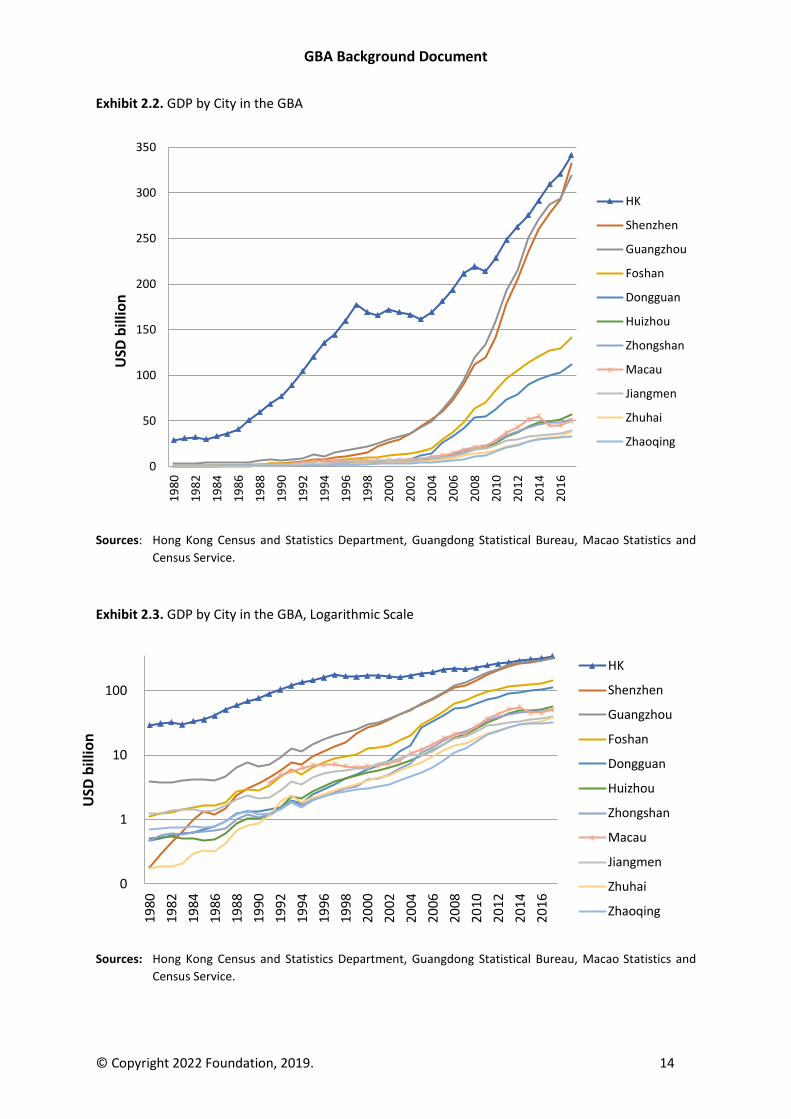
As Exhibits 2.2 and 2.3 (logarithmic scale to show differences in early years) show, the GBA has
separated out into three groupings in terms of GDP, with Hong Kong, Shenzhen, and Guangzhou
occupying a clear first tier, Foshan and Dongguan the second tier, and the remaining cities in the
Pearl River Delta a third tier. It is accurate to view the GBA as having three leading economic cities of
comparable importance.
GBA Background Document
© Copyright 2022 Foundation, 2019. 14
Exhibit 2.2. GDP by City in the GBA
Sources: Hong Kong Census and Statistics Department, Guangdong Statistical Bureau, Macao Statistics and
Census Service.
Exhibit 2.3. GDP by City in the GBA, Logarithmic Scale
Sources: Hong Kong Census and Statistics Department, Guangdong Statistical Bureau, Macao Statistics and
Census Service.
0
50
100
150
200
250
300
350
19
80
19
82
19
84
19
86
19
88
19
90
19
92
19
94
19
96
19
98
20
00
20
02
20
04
20
06
20
08
20
10
20
12
20
14
20
16
USD
bill
ion
HK
Shenzhen
Guangzhou
Foshan
Dongguan
Huizhou
Zhongshan
Macau
Jiangmen
Zhuhai
Zhaoqing
0
1
10
100
1980
1982
1984
1986
1988
1990
1992
1994
1996
1998
2000
2002
2004
2006
2008
2010
2012
2014
2016
USD
bill
ion
HK
Shenzhen
Guangzhou
Foshan
Dongguan
Huizhou
Zhongshan
Macau
Jiangmen
Zhuhai
Zhaoqing
GBA Background Document
© Copyright 2022 Foundation, 2019. 15
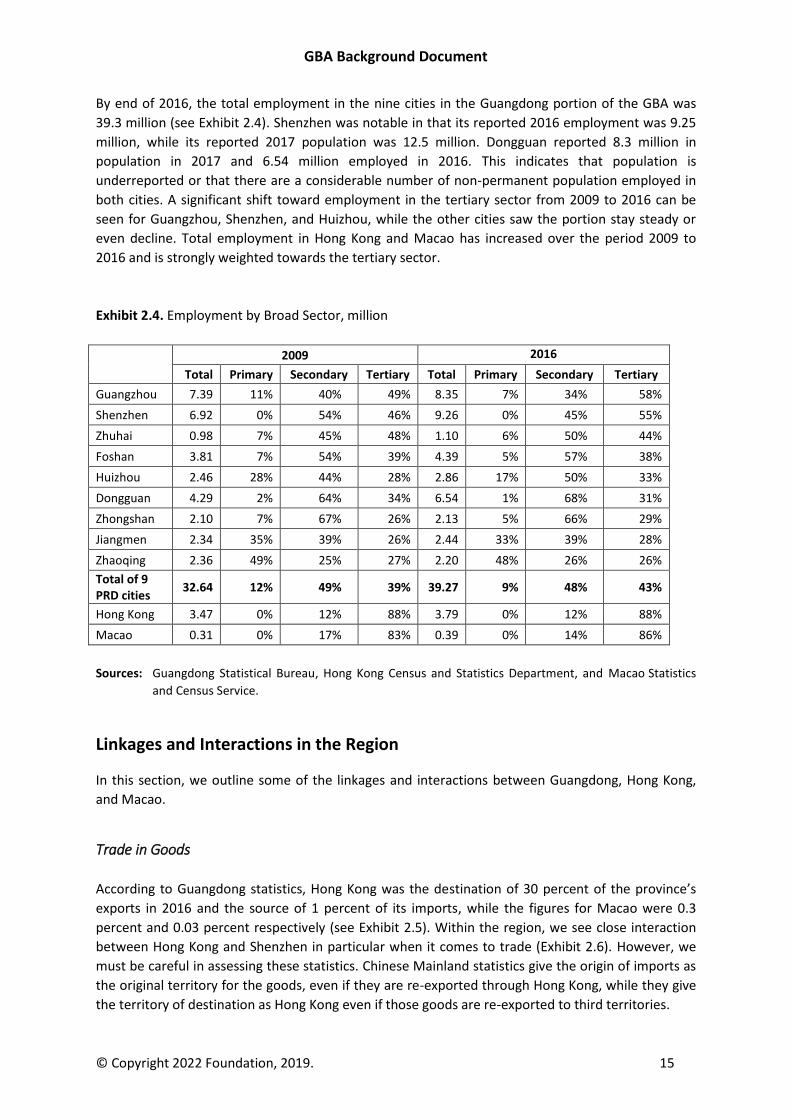
By end of 2016, the total employment in the nine cities in the Guangdong portion of the GBA was
39.3 million (see Exhibit 2.4). Shenzhen was notable in that its reported 2016 employment was 9.25
million, while its reported 2017 population was 12.5 million. Dongguan reported 8.3 million in
population in 2017 and 6.54 million employed in 2016. This indicates that population is
underreported or that there are a considerable number of non-permanent population employed in
both cities. A significant shift toward employment in the tertiary sector from 2009 to 2016 can be
seen for Guangzhou, Shenzhen, and Huizhou, while the other cities saw the portion stay steady or
even decline. Total employment in Hong Kong and Macao has increased over the period 2009 to
2016 and is strongly weighted towards the tertiary sector.
Exhibit 2.4. Employment by Broad Sector, million
2009 2016
Total Primary Secondary Tertiary Total Primary Secondary Tertiary
Guangzhou 7.39 11% 40% 49% 8.35 7% 34% 58%
Shenzhen 6.92 0% 54% 46% 9.26 0% 45% 55%
Zhuhai 0.98 7% 45% 48% 1.10 6% 50% 44%
Foshan 3.81 7% 54% 39% 4.39 5% 57% 38%
Huizhou 2.46 28% 44% 28% 2.86 17% 50% 33%
Dongguan 4.29 2% 64% 34% 6.54 1% 68% 31%
Zhongshan 2.10 7% 67% 26% 2.13 5% 66% 29%
Jiangmen 2.34 35% 39% 26% 2.44 33% 39% 28%
Zhaoqing 2.36 49% 25% 27% 2.20 48% 26% 26%
Total of 9 PRD cities
32.64 12% 49% 39% 39.27 9% 48% 43%
Hong Kong 3.47 0% 12% 88% 3.79 0% 12% 88%
Macao 0.31 0% 17% 83% 0.39 0% 14% 86%
Sources: Guangdong Statistical Bureau, Hong Kong Census and Statistics Department, and Macao Statistics
and Census Service.
Linkages and Interactions in the Region
In this section, we outline some of the linkages and interactions between Guangdong, Hong Kong,
and Macao.
Trade in Goods
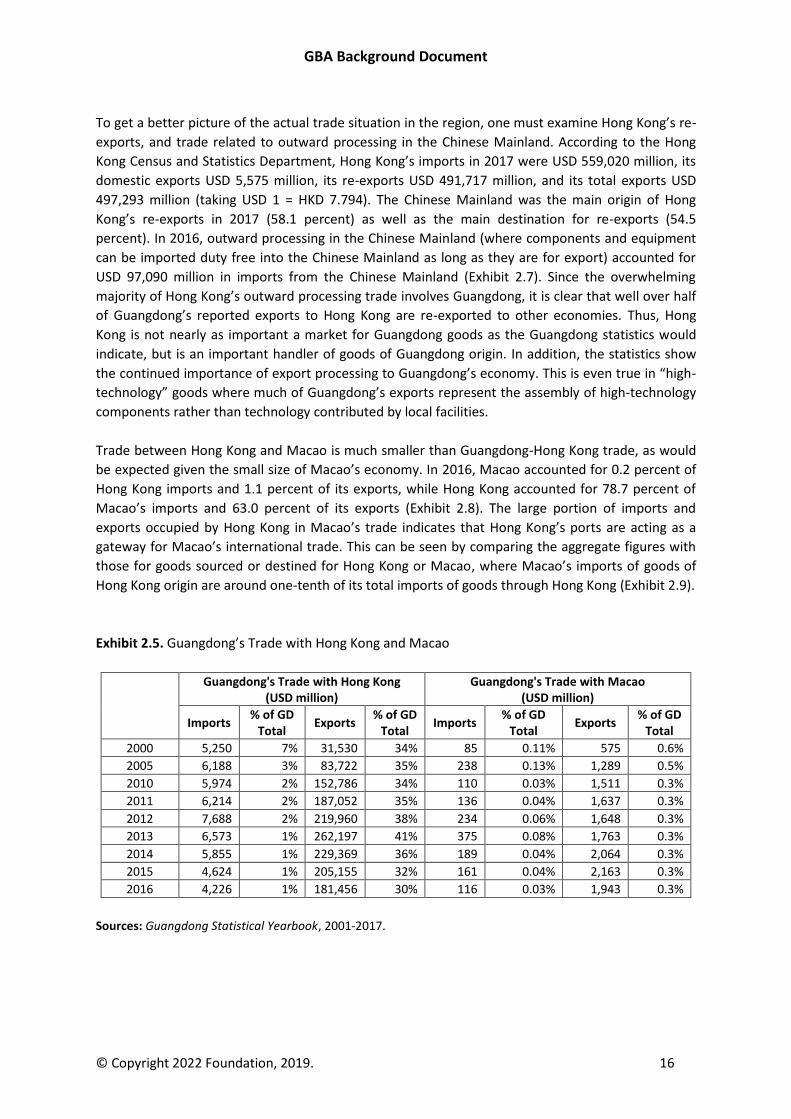
According to Guangdong statistics, Hong Kong was the destination of 30 percent of the province’s
exports in 2016 and the source of 1 percent of its imports, while the figures for Macao were 0.3
percent and 0.03 percent respectively (see Exhibit 2.5). Within the region, we see close interaction
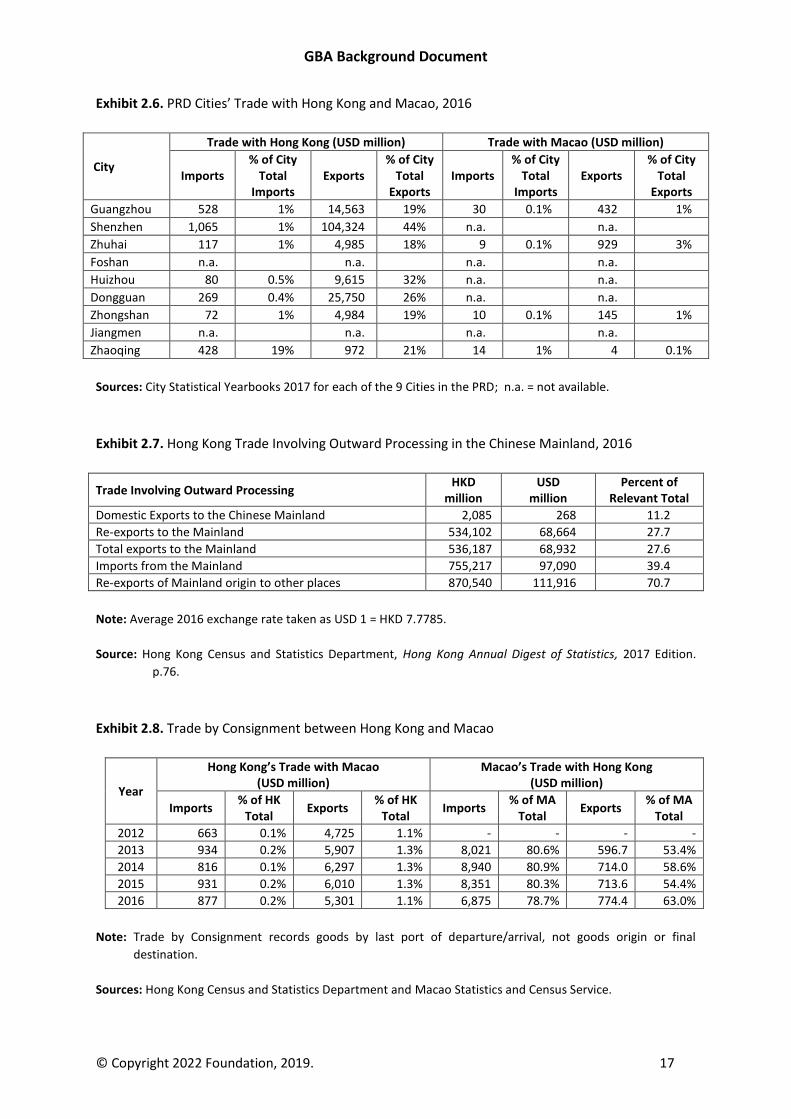
between Hong Kong and Shenzhen in particular when it comes to trade (Exhibit 2.6). However, we
must be careful in assessing these statistics. Chinese Mainland statistics give the origin of imports as
the original territory for the goods, even if they are re-exported through Hong Kong, while they give
the territory of destination as Hong Kong even if those goods are re-exported to third territories.
GBA Background Document
© Copyright 2022 Foundation, 2019. 16
To get a better picture of the actual trade situation in the region, one must examine Hong Kong’s re-
exports, and trade related to outward processing in the Chinese Mainland. According to the Hong
Kong Census and Statistics Department, Hong Kong’s imports in 2017 were USD 559,020 million, its
domestic exports USD 5,575 million, its re-exports USD 491,717 million, and its total exports USD
497,293 million (taking USD 1 = HKD 7.794). The Chinese Mainland was the main origin of Hong
Kong’s re-exports in 2017 (58.1 percent) as well as the main destination for re-exports (54.5
percent). In 2016, outward processing in the Chinese Mainland (where components and equipment
can be imported duty free into the Chinese Mainland as long as they are for export) accounted for
USD 97,090 million in imports from the Chinese Mainland (Exhibit 2.7). Since the overwhelming
majority of Hong Kong’s outward processing trade involves Guangdong, it is clear that well over half
of Guangdong’s reported exports to Hong Kong are re-exported to other economies. Thus, Hong
Kong is not nearly as important a market for Guangdong goods as the Guangdong statistics would
indicate, but is an important handler of goods of Guangdong origin. In addition, the statistics show
the continued importance of export processing to Guangdong’s economy. This is even true in “high-
technology” goods where much of Guangdong’s exports represent the assembly of high-technology
components rather than technology contributed by local facilities.
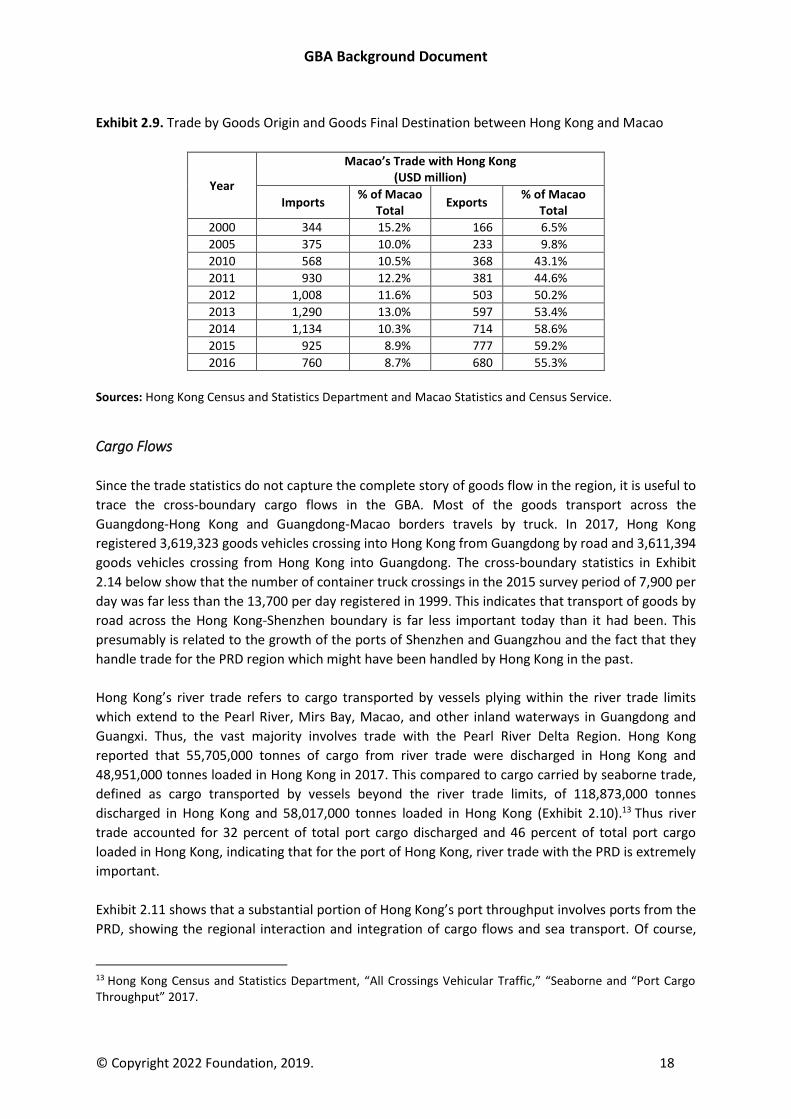
Trade between Hong Kong and Macao is much smaller than Guangdong-Hong Kong trade, as would
be expected given the small size of Macao’s economy. In 2016, Macao accounted for 0.2 percent of
Hong Kong imports and 1.1 percent of its exports, while Hong Kong accounted for 78.7 percent of
Macao’s imports and 63.0 percent of its exports (Exhibit 2.8). The large portion of imports and
exports occupied by Hong Kong in Macao’s trade indicates that Hong Kong’s ports are acting as a
gateway for Macao’s international trade. This can be seen by comparing the aggregate figures with
those for goods sourced or destined for Hong Kong or Macao, where Macao’s imports of goods of
Hong Kong origin are around one-tenth of its total imports of goods through Hong Kong (Exhibit 2.9).
Exhibit 2.5. Guangdong’s Trade with Hong Kong and Macao
Guangdong's Trade with Hong Kong (USD million)
Guangdong's Trade with Macao (USD million)
Imports % of GD
Total Exports
% of GD Total
Imports % of GD
Total Exports
% of GD Total
2000 5,250 7% 31,530 34% 85 0.11% 575 0.6%
2005 6,188 3% 83,722 35% 238 0.13% 1,289 0.5%
2010 5,974 2% 152,786 34% 110 0.03% 1,511 0.3%
2011 6,214 2% 187,052 35% 136 0.04% 1,637 0.3%
2012 7,688 2% 219,960 38% 234 0.06% 1,648 0.3%
2013 6,573 1% 262,197 41% 375 0.08% 1,763 0.3%
2014 5,855 1% 229,369 36% 189 0.04% 2,064 0.3%
2015 4,624 1% 205,155 32% 161 0.04% 2,163 0.3%
2016 4,226 1% 181,456 30% 116 0.03% 1,943 0.3%
Sources: Guangdong Statistical Yearbook, 2001-2017.
GBA Background Document
© Copyright 2022 Foundation, 2019. 17
Exhibit 2.6. PRD Cities’ Trade with Hong Kong and Macao, 2016
City
Trade with Hong Kong (USD million) Trade with Macao (USD million)
Imports % of City
Total Imports
Exports % of City
Total Exports
Imports % of City
Total Imports
Exports % of City
Total Exports
Guangzhou 528 1% 14,563 19% 30 0.1% 432 1%
Shenzhen 1,065 1% 104,324 44% n.a. n.a.
Zhuhai 117 1% 4,985 18% 9 0.1% 929 3%
Foshan n.a. n.a. n.a. n.a.
Huizhou 80 0.5% 9,615 32% n.a. n.a.
Dongguan 269 0.4% 25,750 26% n.a. n.a.
Zhongshan 72 1% 4,984 19% 10 0.1% 145 1%
Jiangmen n.a. n.a. n.a. n.a.
Zhaoqing 428 19% 972 21% 14 1% 4 0.1%
Sources: City Statistical Yearbooks 2017 for each of the 9 Cities in the PRD; n.a. = not available.
Exhibit 2.7. Hong Kong Trade Involving Outward Processing in the Chinese Mainland, 2016
Trade Involving Outward Processing HKD
million USD
million Percent of
Relevant Total
Domestic Exports to the Chinese Mainland 2,085 268 11.2
Re-exports to the Mainland 534,102 68,664 27.7
Total exports to the Mainland 536,187 68,932 27.6
Imports from the Mainland 755,217 97,090 39.4
Re-exports of Mainland origin to other places 870,540 111,916 70.7
Note: Average 2016 exchange rate taken as USD 1 = HKD 7.7785.
Source: Hong Kong Census and Statistics Department, Hong Kong Annual Digest of Statistics, 2017 Edition.
p.76.
Exhibit 2.8. Trade by Consignment between Hong Kong and Macao
Year
Hong Kong’s Trade with Macao (USD million)
Macao’s Trade with Hong Kong (USD million)
Imports % of HK
Total Exports
% of HK Total
Imports % of MA
Total Exports
% of MA Total
2012 663 0.1% 4,725 1.1% - - - -
2013 934 0.2% 5,907 1.3% 8,021 80.6% 596.7 53.4%
2014 816 0.1% 6,297 1.3% 8,940 80.9% 714.0 58.6%
2015 931 0.2% 6,010 1.3% 8,351 80.3% 713.6 54.4%
2016 877 0.2% 5,301 1.1% 6,875 78.7% 774.4 63.0%
Note: Trade by Consignment records goods by last port of departure/arrival, not goods origin or final
destination.
Sources: Hong Kong Census and Statistics Department and Macao Statistics and Census Service.
GBA Background Document
© Copyright 2022 Foundation, 2019. 18
Exhibit 2.9. Trade by Goods Origin and Goods Final Destination between Hong Kong and Macao
Year
Macao’s Trade with Hong Kong (USD million)
Imports % of Macao
Total Exports
% of Macao Total
2000 344 15.2% 166 6.5%
2005 375 10.0% 233 9.8%
2010 568 10.5% 368 43.1%
2011 930 12.2% 381 44.6%
2012 1,008 11.6% 503 50.2%
2013 1,290 13.0% 597 53.4%
2014 1,134 10.3% 714 58.6%
2015 925 8.9% 777 59.2%
2016 760 8.7% 680 55.3%
Sources: Hong Kong Census and Statistics Department and Macao Statistics and Census Service.
Cargo Flows
Since the trade statistics do not capture the complete story of goods flow in the region, it is useful to
trace the cross-boundary cargo flows in the GBA. Most of the goods transport across the
Guangdong-Hong Kong and Guangdong-Macao borders travels by truck. In 2017, Hong Kong
registered 3,619,323 goods vehicles crossing into Hong Kong from Guangdong by road and 3,611,394
goods vehicles crossing from Hong Kong into Guangdong. The cross-boundary statistics in Exhibit
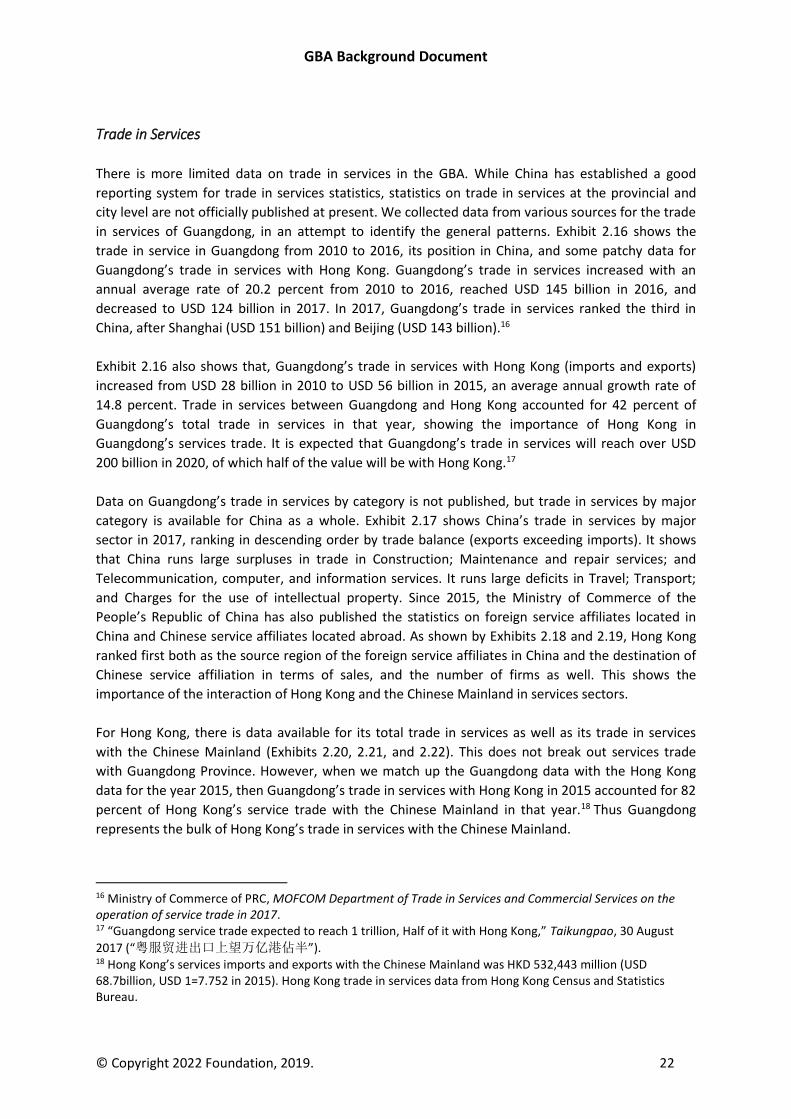
2.14 below show that the number of container truck crossings in the 2015 survey period of 7,900 per
day was far less than the 13,700 per day registered in 1999. This indicates that transport of goods by
road across the Hong Kong-Shenzhen boundary is far less important today than it had been. This
presumably is related to the growth of the ports of Shenzhen and Guangzhou and the fact that they
handle trade for the PRD region which might have been handled by Hong Kong in the past.
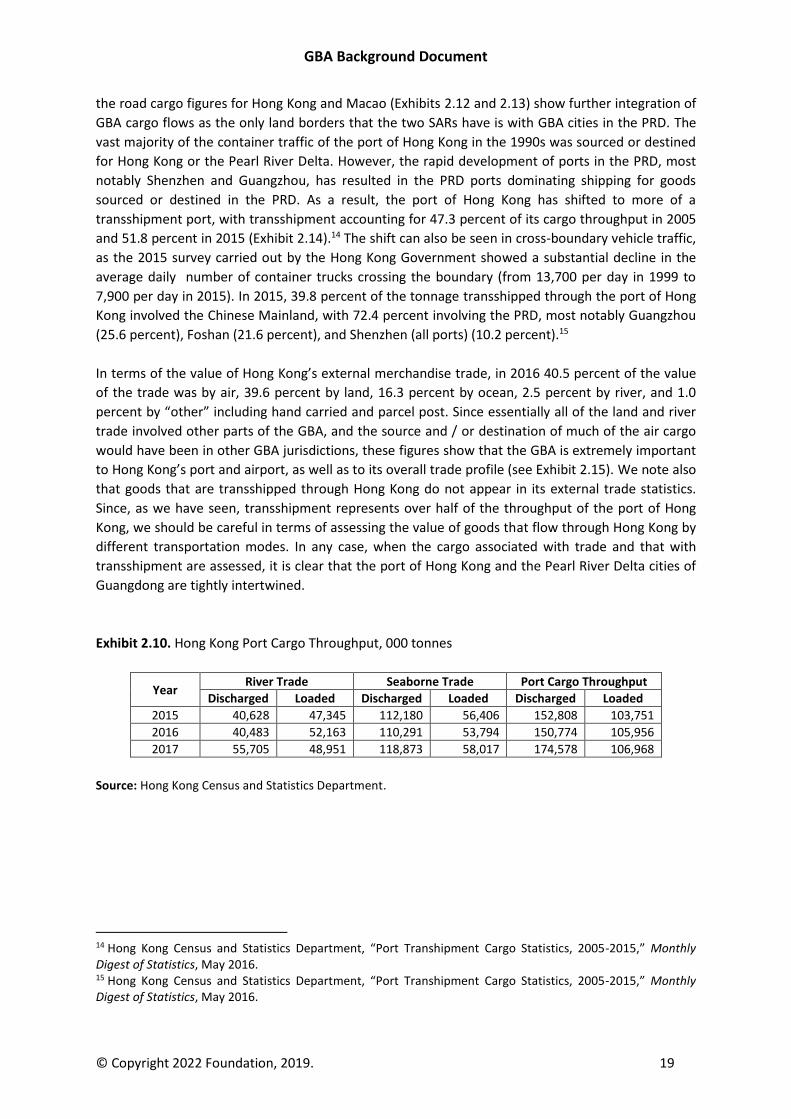
Hong Kong’s river trade refers to cargo transported by vessels plying within the river trade limits
which extend to the Pearl River, Mirs Bay, Macao, and other inland waterways in Guangdong and
Guangxi. Thus, the vast majority involves trade with the Pearl River Delta Region. Hong Kong
reported that 55,705,000 tonnes of cargo from river trade were discharged in Hong Kong and
48,951,000 tonnes loaded in Hong Kong in 2017. This compared to cargo carried by seaborne trade,
defined as cargo transported by vessels beyond the river trade limits, of 118,873,000 tonnes
discharged in Hong Kong and 58,017,000 tonnes loaded in Hong Kong (Exhibit 2.10).13 Thus river
trade accounted for 32 percent of total port cargo discharged and 46 percent of total port cargo
loaded in Hong Kong, indicating that for the port of Hong Kong, river trade with the PRD is extremely
important.
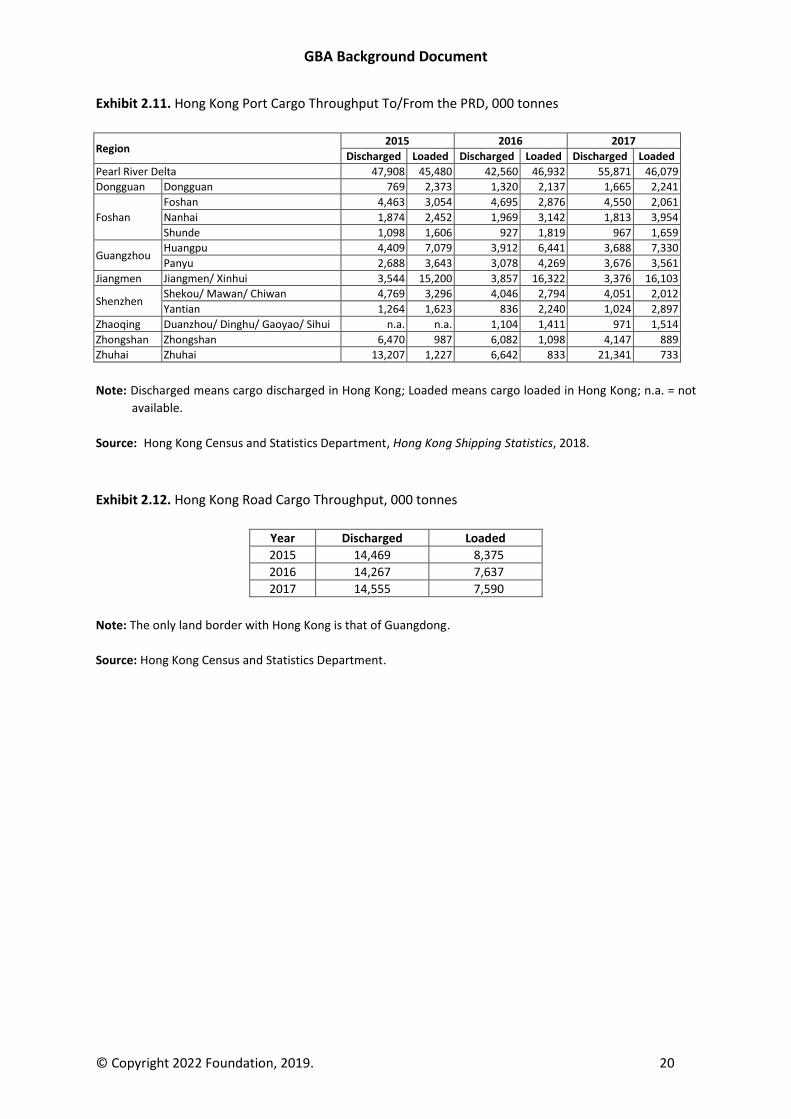
Exhibit 2.11 shows that a substantial portion of Hong Kong’s port throughput involves ports from the
PRD, showing the regional interaction and integration of cargo flows and sea transport. Of course,
13 Hong Kong Census and Statistics Department, “All Crossings Vehicular Traffic,” “Seaborne and “Port Cargo Throughput” 2017.
GBA Background Document
© Copyright 2022 Foundation, 2019. 19
the road cargo figures for Hong Kong and Macao (Exhibits 2.12 and 2.13) show further integration of
GBA cargo flows as the only land borders that the two SARs have is with GBA cities in the PRD. The
vast majority of the container traffic of the port of Hong Kong in the 1990s was sourced or destined
for Hong Kong or the Pearl River Delta. However, the rapid development of ports in the PRD, most
notably Shenzhen and Guangzhou, has resulted in the PRD ports dominating shipping for goods
sourced or destined in the PRD. As a result, the port of Hong Kong has shifted to more of a
transshipment port, with transshipment accounting for 47.3 percent of its cargo throughput in 2005
and 51.8 percent in 2015 (Exhibit 2.14).14 The shift can also be seen in cross-boundary vehicle traffic,
as the 2015 survey carried out by the Hong Kong Government showed a substantial decline in the
average daily number of container trucks crossing the boundary (from 13,700 per day in 1999 to
7,900 per day in 2015). In 2015, 39.8 percent of the tonnage transshipped through the port of Hong
Kong involved the Chinese Mainland, with 72.4 percent involving the PRD, most notably Guangzhou
(25.6 percent), Foshan (21.6 percent), and Shenzhen (all ports) (10.2 percent).15
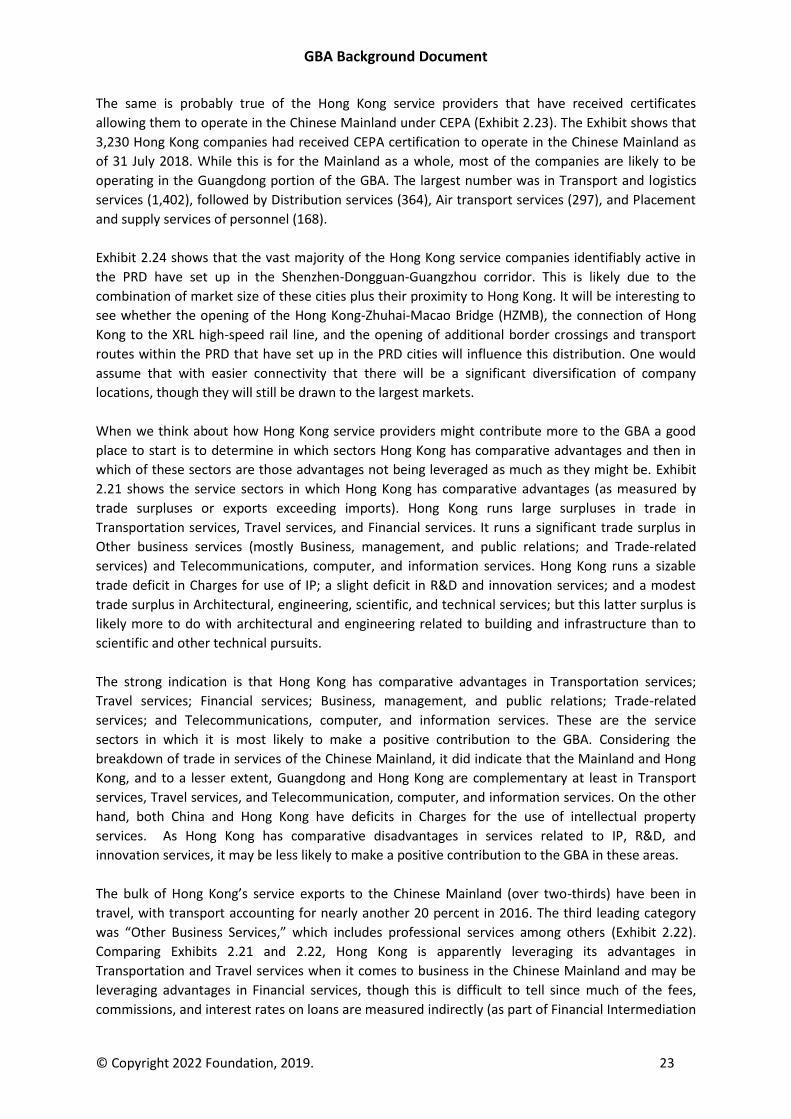
In terms of the value of Hong Kong’s external merchandise trade, in 2016 40.5 percent of the value
of the trade was by air, 39.6 percent by land, 16.3 percent by ocean, 2.5 percent by river, and 1.0
percent by “other” including hand carried and parcel post. Since essentially all of the land and river
trade involved other parts of the GBA, and the source and / or destination of much of the air cargo
would have been in other GBA jurisdictions, these figures show that the GBA is extremely important
to Hong Kong’s port and airport, as well as to its overall trade profile (see Exhibit 2.15). We note also
that goods that are transshipped through Hong Kong do not appear in its external trade statistics.
Since, as we have seen, transshipment represents over half of the throughput of the port of Hong
Kong, we should be careful in terms of assessing the value of goods that flow through Hong Kong by
different transportation modes. In any case, when the cargo associated with trade and that with
transshipment are assessed, it is clear that the port of Hong Kong and the Pearl River Delta cities of
Guangdong are tightly intertwined.
Exhibit 2.10. Hong Kong Port Cargo Throughput, 000 tonnes
Year River Trade Seaborne Trade Port Cargo Throughput
Discharged Loaded Discharged Loaded Discharged Loaded
2015 40,628 47,345 112,180 56,406 152,808 103,751
2016 40,483 52,163 110,291 53,794 150,774 105,956
2017 55,705 48,951 118,873 58,017 174,578 106,968
Source: Hong Kong Census and Statistics Department.
14 Hong Kong Census and Statistics Department, “Port Transhipment Cargo Statistics, 2005-2015,” Monthly Digest of Statistics, May 2016. 15 Hong Kong Census and Statistics Department, “Port Transhipment Cargo Statistics, 2005-2015,” Monthly Digest of Statistics, May 2016.
GBA Background Document
© Copyright 2022 Foundation, 2019. 20
Exhibit 2.11. Hong Kong Port Cargo Throughput To/From the PRD, 000 tonnes
Region 2015 2016 2017
Discharged Loaded Discharged Loaded Discharged Loaded
Pearl River Delta 47,908 45,480 42,560 46,932 55,871 46,079
Dongguan Dongguan 769 2,373 1,320 2,137 1,665 2,241
Foshan
Foshan 4,463 3,054 4,695 2,876 4,550 2,061
Nanhai 1,874 2,452 1,969 3,142 1,813 3,954
Shunde 1,098 1,606 927 1,819 967 1,659
Guangzhou Huangpu 4,409 7,079 3,912 6,441 3,688 7,330
Panyu 2,688 3,643 3,078 4,269 3,676 3,561
Jiangmen Jiangmen/ Xinhui 3,544 15,200 3,857 16,322 3,376 16,103
Shenzhen Shekou/ Mawan/ Chiwan 4,769 3,296 4,046 2,794 4,051 2,012
Yantian 1,264 1,623 836 2,240 1,024 2,897
Zhaoqing Duanzhou/ Dinghu/ Gaoyao/ Sihui n.a. n.a. 1,104 1,411 971 1,514
Zhongshan Zhongshan 6,470 987 6,082 1,098 4,147 889
Zhuhai Zhuhai 13,207 1,227 6,642 833 21,341 733
Note: Discharged means cargo discharged in Hong Kong; Loaded means cargo loaded in Hong Kong; n.a. = not
available.
Source: Hong Kong Census and Statistics Department, Hong Kong Shipping Statistics, 2018.
Exhibit 2.12. Hong Kong Road Cargo Throughput, 000 tonnes
Year Discharged Loaded
2015 14,469 8,375
2016 14,267 7,637
2017 14,555 7,590
Note: The only land border with Hong Kong is that of Guangdong.
Source: Hong Kong Census and Statistics Department.
GBA Background Document
© Copyright 2022 Foundation, 2019. 21
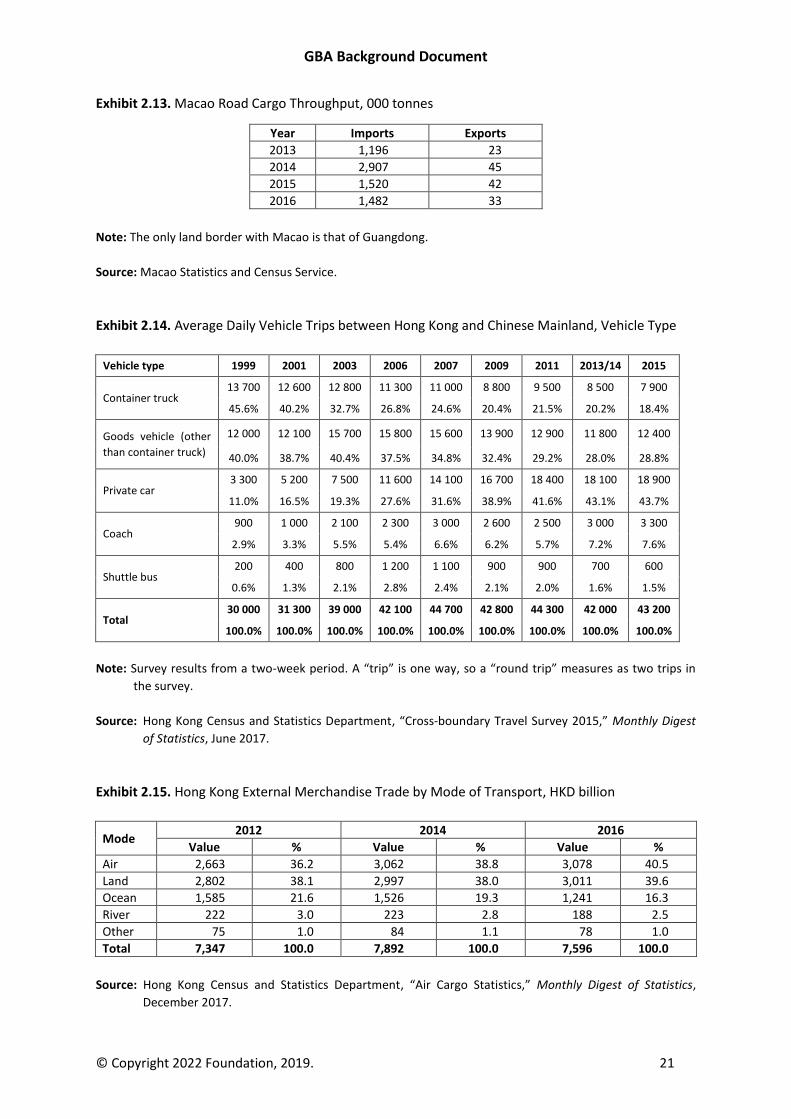
Exhibit 2.13. Macao Road Cargo Throughput, 000 tonnes
Year Imports Exports
2013 1,196 23
2014 2,907 45
2015 1,520 42
2016 1,482 33
Note: The only land border with Macao is that of Guangdong.
Source: Macao Statistics and Census Service.
Exhibit 2.14. Average Daily Vehicle Trips between Hong Kong and Chinese Mainland, Vehicle Type
Vehicle type 1999 2001 2003 2006 2007 2009 2011 2013/14 2015
Container truck 13 700 12 600 12 800 11 300 11 000 8 800 9 500 8 500 7 900
45.6% 40.2% 32.7% 26.8% 24.6% 20.4% 21.5% 20.2% 18.4%
Goods vehicle (other
than container truck)
12 000 12 100 15 700 15 800 15 600 13 900 12 900 11 800 12 400
40.0% 38.7% 40.4% 37.5% 34.8% 32.4% 29.2% 28.0% 28.8%
Private car 3 300 5 200 7 500 11 600 14 100 16 700 18 400 18 100 18 900
11.0% 16.5% 19.3% 27.6% 31.6% 38.9% 41.6% 43.1% 43.7%
Coach 900 1 000 2 100 2 300 3 000 2 600 2 500 3 000 3 300
2.9% 3.3% 5.5% 5.4% 6.6% 6.2% 5.7% 7.2% 7.6%
Shuttle bus 200 400 800 1 200 1 100 900 900 700 600
0.6% 1.3% 2.1% 2.8% 2.4% 2.1% 2.0% 1.6% 1.5%
Total 30 000 31 300 39 000 42 100 44 700 42 800 44 300 42 000 43 200
100.0% 100.0% 100.0% 100.0% 100.0% 100.0% 100.0% 100.0% 100.0%
Note: Survey results from a two-week period. A “trip” is one way, so a “round trip” measures as two trips in
the survey.
Source: Hong Kong Census and Statistics Department, “Cross-boundary Travel Survey 2015,” Monthly Digest
of Statistics, June 2017.
Exhibit 2.15. Hong Kong External Merchandise Trade by Mode of Transport, HKD billion
Mode 2012 2014 2016
Value % Value % Value %
Air 2,663 36.2 3,062 38.8 3,078 40.5
Land 2,802 38.1 2,997 38.0 3,011 39.6
Ocean 1,585 21.6 1,526 19.3 1,241 16.3
River 222 3.0 223 2.8 188 2.5
Other 75 1.0 84 1.1 78 1.0
Total 7,347 100.0 7,892 100.0 7,596 100.0
Source: Hong Kong Census and Statistics Department, “Air Cargo Statistics,” Monthly Digest of Statistics,
December 2017.
GBA Background Document
© Copyright 2022 Foundation, 2019. 22
Trade in Services
There is more limited data on trade in services in the GBA. While China has established a good
reporting system for trade in services statistics, statistics on trade in services at the provincial and
city level are not officially published at present. We collected data from various sources for the trade
in services of Guangdong, in an attempt to identify the general patterns. Exhibit 2.16 shows the
trade in service in Guangdong from 2010 to 2016, its position in China, and some patchy data for
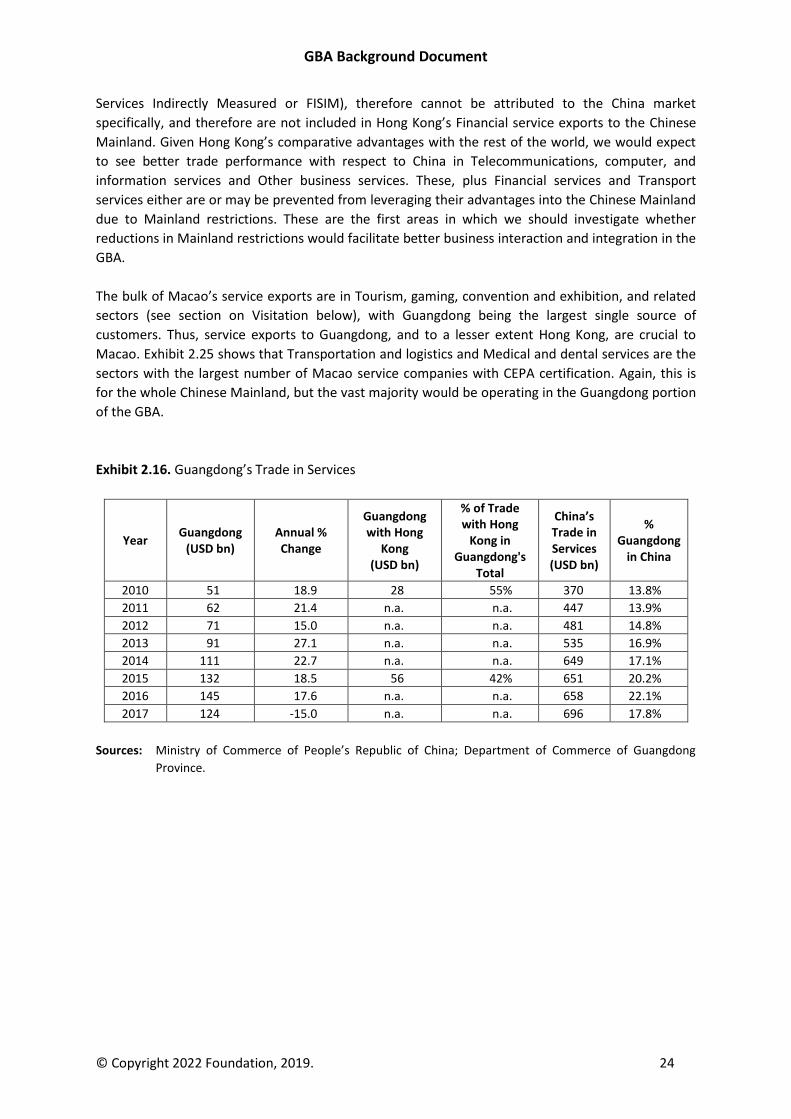
Guangdong’s trade in services with Hong Kong. Guangdong’s trade in services increased with an
annual average rate of 20.2 percent from 2010 to 2016, reached USD 145 billion in 2016, and
decreased to USD 124 billion in 2017. In 2017, Guangdong’s trade in services ranked the third in
China, after Shanghai (USD 151 billion) and Beijing (USD 143 billion).16
Exhibit 2.16 also shows that, Guangdong’s trade in services with Hong Kong (imports and exports)
increased from USD 28 billion in 2010 to USD 56 billion in 2015, an average annual growth rate of
14.8 percent. Trade in services between Guangdong and Hong Kong accounted for 42 percent of
Guangdong’s total trade in services in that year, showing the importance of Hong Kong in
Guangdong’s services trade. It is expected that Guangdong’s trade in services will reach over USD
200 billion in 2020, of which half of the value will be with Hong Kong.17
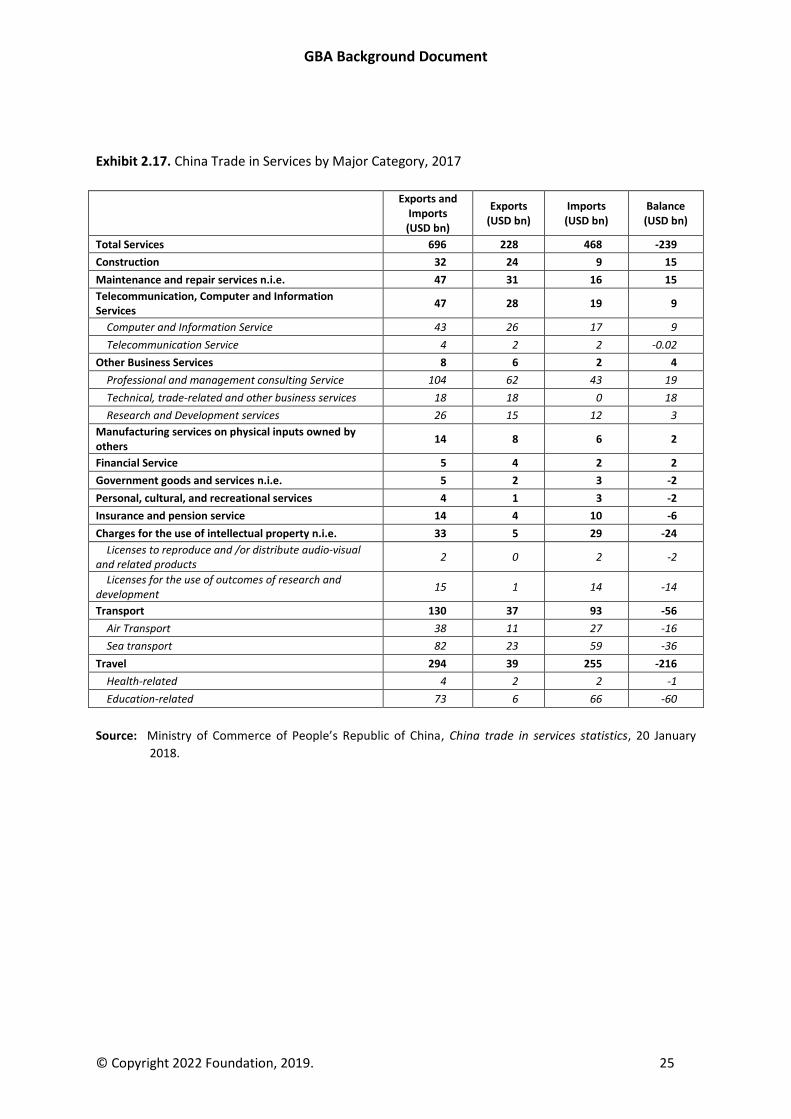
Data on Guangdong’s trade in services by category is not published, but trade in services by major
category is available for China as a whole. Exhibit 2.17 shows China’s trade in services by major
sector in 2017, ranking in descending order by trade balance (exports exceeding imports). It shows
that China runs large surpluses in trade in Construction; Maintenance and repair services; and
Telecommunication, computer, and information services. It runs large deficits in Travel; Transport;
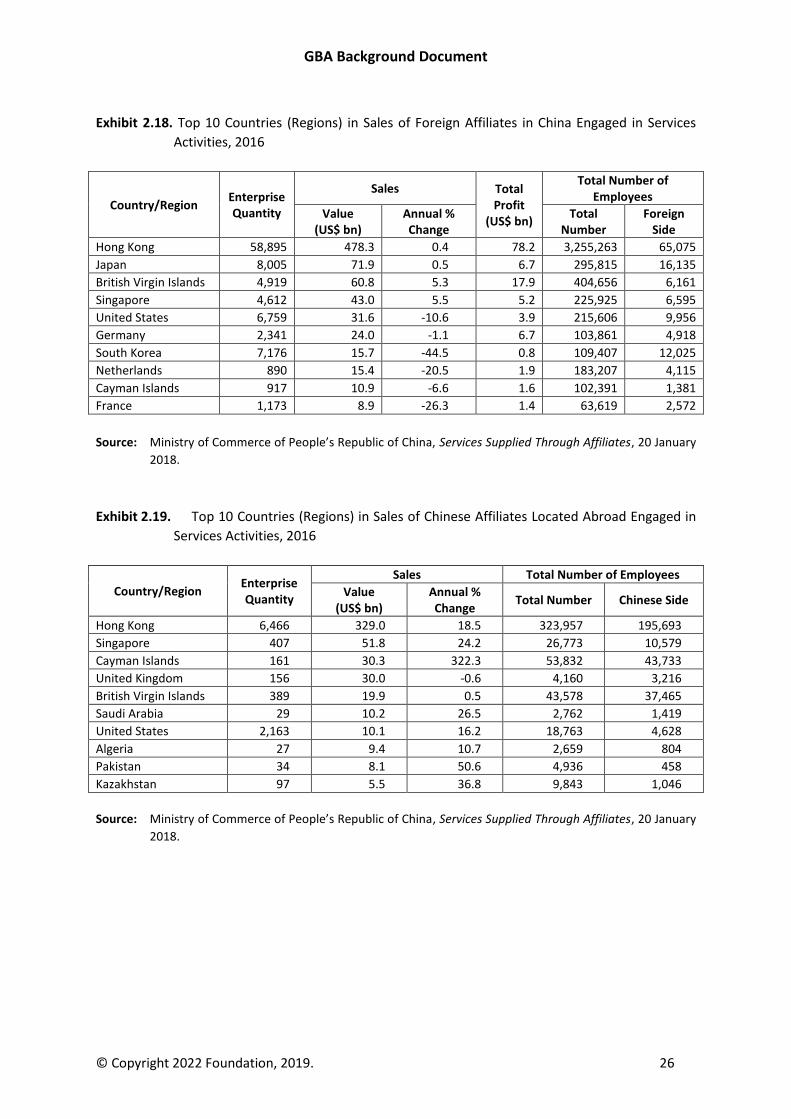
and Charges for the use of intellectual property. Since 2015, the Ministry of Commerce of the
People’s Republic of China has also published the statistics on foreign service affiliates located in
China and Chinese service affiliates located abroad. As shown by Exhibits 2.18 and 2.19, Hong Kong
ranked first both as the source region of the foreign service affiliates in China and the destination of
Chinese service affiliation in terms of sales, and the number of firms as well. This shows the
importance of the interaction of Hong Kong and the Chinese Mainland in services sectors.
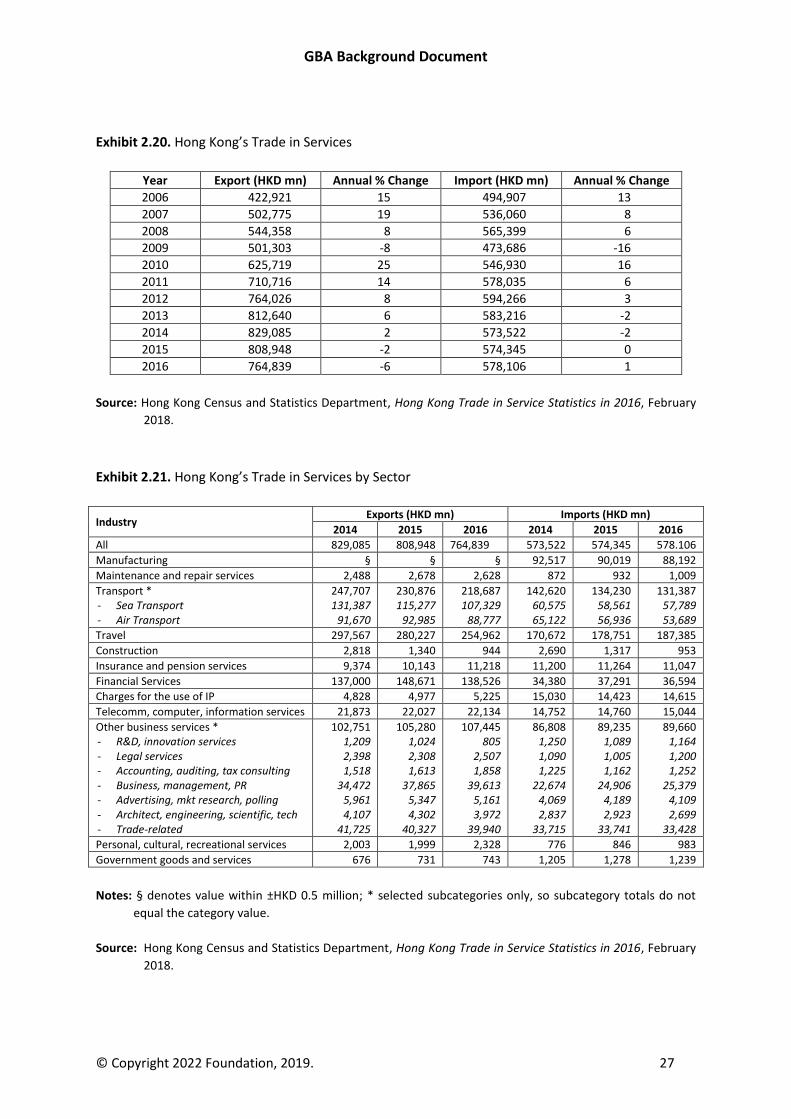
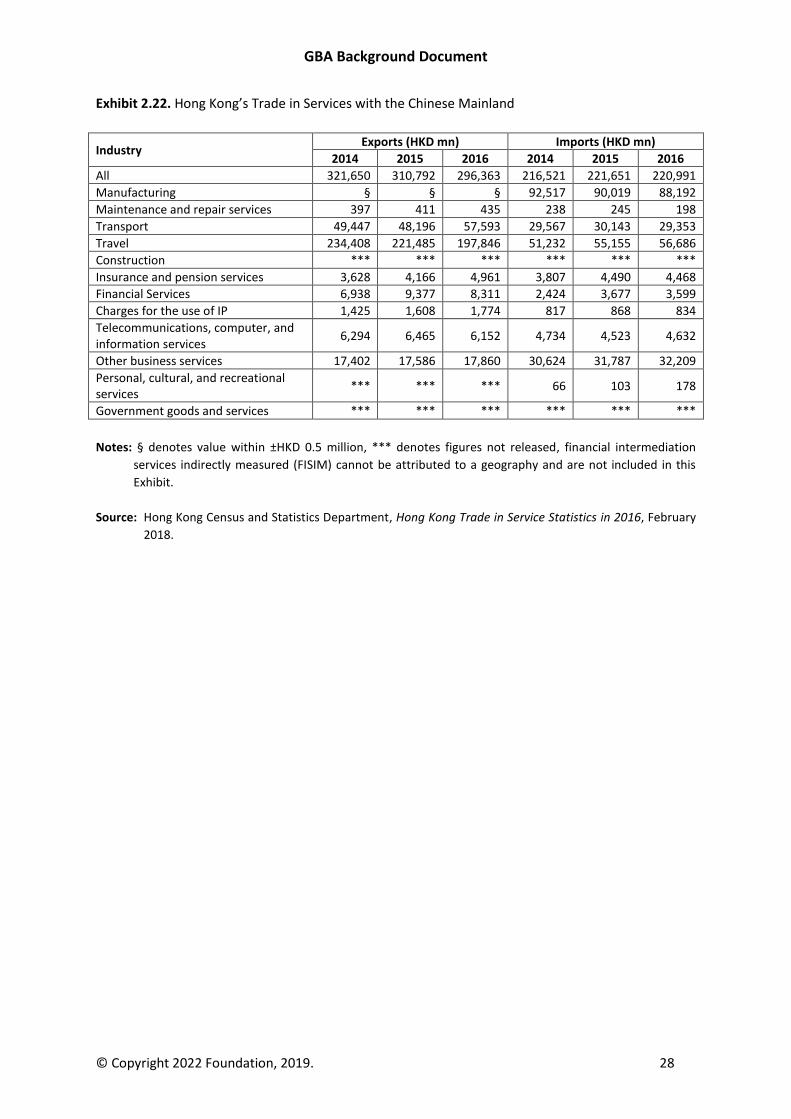
For Hong Kong, there is data available for its total trade in services as well as its trade in services
with the Chinese Mainland (Exhibits 2.20, 2.21, and 2.22). This does not break out services trade
with Guangdong Province. However, when we match up the Guangdong data with the Hong Kong
data for the year 2015, then Guangdong’s trade in services with Hong Kong in 2015 accounted for 82
percent of Hong Kong’s service trade with the Chinese Mainland in that year.18 Thus Guangdong
represents the bulk of Hong Kong’s trade in services with the Chinese Mainland.
16 Ministry of Commerce of PRC, MOFCOM Department of Trade in Services and Commercial Services on the operation of service trade in 2017. 17 “Guangdong service trade expected to reach 1 trillion, Half of it with Hong Kong,” Taikungpao, 30 August
2017 (“粤服贸进出口上望万亿港佔半”). 18 Hong Kong’s services imports and exports with the Chinese Mainland was HKD 532,443 million (USD 68.7billion, USD 1=7.752 in 2015). Hong Kong trade in services data from Hong Kong Census and Statistics Bureau.
GBA Background Document
© Copyright 2022 Foundation, 2019. 23
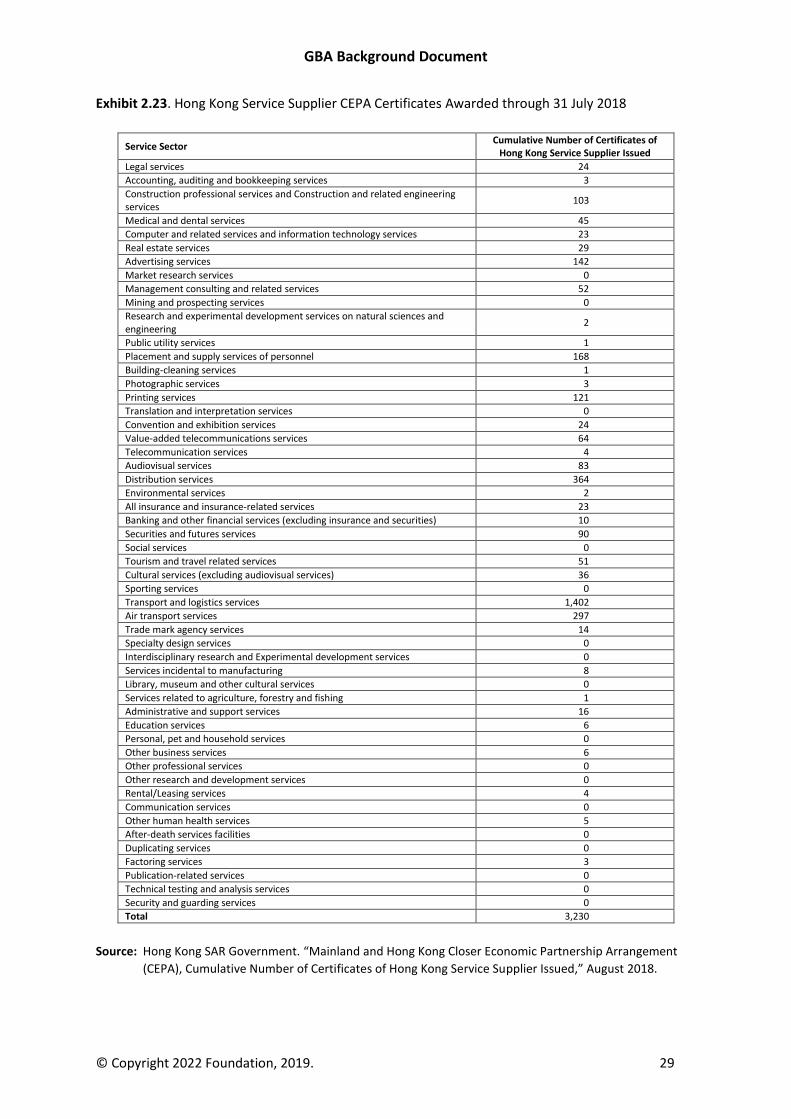
The same is probably true of the Hong Kong service providers that have received certificates
allowing them to operate in the Chinese Mainland under CEPA (Exhibit 2.23). The Exhibit shows that
3,230 Hong Kong companies had received CEPA certification to operate in the Chinese Mainland as
of 31 July 2018. While this is for the Mainland as a whole, most of the companies are likely to be
operating in the Guangdong portion of the GBA. The largest number was in Transport and logistics
services (1,402), followed by Distribution services (364), Air transport services (297), and Placement
and supply services of personnel (168).
Exhibit 2.24 shows that the vast majority of the Hong Kong service companies identifiably active in
the PRD have set up in the Shenzhen-Dongguan-Guangzhou corridor. This is likely due to the
combination of market size of these cities plus their proximity to Hong Kong. It will be interesting to
see whether the opening of the Hong Kong-Zhuhai-Macao Bridge (HZMB), the connection of Hong
Kong to the XRL high-speed rail line, and the opening of additional border crossings and transport
routes within the PRD that have set up in the PRD cities will influence this distribution. One would
assume that with easier connectivity that there will be a significant diversification of company
locations, though they will still be drawn to the largest markets.
When we think about how Hong Kong service providers might contribute more to the GBA a good
place to start is to determine in which sectors Hong Kong has comparative advantages and then in
which of these sectors are those advantages not being leveraged as much as they might be. Exhibit
2.21 shows the service sectors in which Hong Kong has comparative advantages (as measured by
trade surpluses or exports exceeding imports). Hong Kong runs large surpluses in trade in
Transportation services, Travel services, and Financial services. It runs a significant trade surplus in
Other business services (mostly Business, management, and public relations; and Trade-related
services) and Telecommunications, computer, and information services. Hong Kong runs a sizable
trade deficit in Charges for use of IP; a slight deficit in R&D and innovation services; and a modest
trade surplus in Architectural, engineering, scientific, and technical services; but this latter surplus is
likely more to do with architectural and engineering related to building and infrastructure than to
scientific and other technical pursuits.
The strong indication is that Hong Kong has comparative advantages in Transportation services;
Travel services; Financial services; Business, management, and public relations; Trade-related
services; and Telecommunications, computer, and information services. These are the service
sectors in which it is most likely to make a positive contribution to the GBA. Considering the
breakdown of trade in services of the Chinese Mainland, it did indicate that the Mainland and Hong
Kong, and to a lesser extent, Guangdong and Hong Kong are complementary at least in Transport
services, Travel services, and Telecommunication, computer, and information services. On the other
hand, both China and Hong Kong have deficits in Charges for the use of intellectual property
services. As Hong Kong has comparative disadvantages in services related to IP, R&D, and
innovation services, it may be less likely to make a positive contribution to the GBA in these areas.
The bulk of Hong Kong’s service exports to the Chinese Mainland (over two-thirds) have been in
travel, with transport accounting for nearly another 20 percent in 2016. The third leading category
was “Other Business Services,” which includes professional services among others (Exhibit 2.22).
Comparing Exhibits 2.21 and 2.22, Hong Kong is apparently leveraging its advantages in
Transportation and Travel services when it comes to business in the Chinese Mainland and may be
leveraging advantages in Financial services, though this is difficult to tell since much of the fees,
commissions, and interest rates on loans are measured indirectly (as part of Financial Intermediation
GBA Background Document
© Copyright 2022 Foundation, 2019. 24
Services Indirectly Measured or FISIM), therefore cannot be attributed to the China market
specifically, and therefore are not included in Hong Kong’s Financial service exports to the Chinese
Mainland. Given Hong Kong’s comparative advantages with the rest of the world, we would expect
to see better trade performance with respect to China in Telecommunications, computer, and
information services and Other business services. These, plus Financial services and Transport
services either are or may be prevented from leveraging their advantages into the Chinese Mainland
due to Mainland restrictions. These are the first areas in which we should investigate whether
reductions in Mainland restrictions would facilitate better business interaction and integration in the
GBA.
The bulk of Macao’s service exports are in Tourism, gaming, convention and exhibition, and related
sectors (see section on Visitation below), with Guangdong being the largest single source of
customers. Thus, service exports to Guangdong, and to a lesser extent Hong Kong, are crucial to
Macao. Exhibit 2.25 shows that Transportation and logistics and Medical and dental services are the
sectors with the largest number of Macao service companies with CEPA certification. Again, this is
for the whole Chinese Mainland, but the vast majority would be operating in the Guangdong portion
of the GBA.
Exhibit 2.16. Guangdong’s Trade in Services
Year Guangdong
(USD bn) Annual % Change
Guangdong with Hong
Kong (USD bn)
% of Trade with Hong
Kong in Guangdong's
Total
China’s Trade in Services (USD bn)
% Guangdong
in China
2010 51 18.9 28 55% 370 13.8%
2011 62 21.4 n.a. n.a. 447 13.9%
2012 71 15.0 n.a. n.a. 481 14.8%
2013 91 27.1 n.a. n.a. 535 16.9%
2014 111 22.7 n.a. n.a. 649 17.1%
2015 132 18.5 56 42% 651 20.2%
2016 145 17.6 n.a. n.a. 658 22.1%
2017 124 -15.0 n.a. n.a. 696 17.8%
Sources: Ministry of Commerce of People’s Republic of China; Department of Commerce of Guangdong
Province.
GBA Background Document
© Copyright 2022 Foundation, 2019. 25
Exhibit 2.17. China Trade in Services by Major Category, 2017
Exports and
Imports (USD bn)
Exports (USD bn)
Imports (USD bn)
Balance (USD bn)
Total Services 696 228 468 -239
Construction 32 24 9 15
Maintenance and repair services n.i.e. 47 31 16 15
Telecommunication, Computer and Information Services
47 28 19 9
Computer and Information Service 43 26 17 9
Telecommunication Service 4 2 2 -0.02
Other Business Services 8 6 2 4
Professional and management consulting Service 104 62 43 19
Technical, trade-related and other business services 18 18 0 18
Research and Development services 26 15 12 3
Manufacturing services on physical inputs owned by others
14 8 6 2
Financial Service 5 4 2 2
Government goods and services n.i.e. 5 2 3 -2
Personal, cultural, and recreational services 4 1 3 -2
Insurance and pension service 14 4 10 -6
Charges for the use of intellectual property n.i.e. 33 5 29 -24
Licenses to reproduce and /or distribute audio-visual and related products
2 0 2 -2
Licenses for the use of outcomes of research and development
15 1 14 -14
Transport 130 37 93 -56
Air Transport 38 11 27 -16
Sea transport 82 23 59 -36
Travel 294 39 255 -216
Health-related 4 2 2 -1
Education-related 73 6 66 -60
Source: Ministry of Commerce of People’s Republic of China, China trade in services statistics, 20 January
2018.
GBA Background Document
© Copyright 2022 Foundation, 2019. 26
Exhibit 2.18. Top 10 Countries (Regions) in Sales of Foreign Affiliates in China Engaged in Services
Activities, 2016
Country/Region Enterprise Quantity
Sales Total Profit
(US$ bn)
Total Number of Employees
Value (US$ bn)
Annual % Change
Total Number
Foreign Side
Hong Kong 58,895 478.3 0.4 78.2 3,255,263 65,075
Japan 8,005 71.9 0.5 6.7 295,815 16,135
British Virgin Islands 4,919 60.8 5.3 17.9 404,656 6,161
Singapore 4,612 43.0 5.5 5.2 225,925 6,595
United States 6,759 31.6 -10.6 3.9 215,606 9,956
Germany 2,341 24.0 -1.1 6.7 103,861 4,918
South Korea 7,176 15.7 -44.5 0.8 109,407 12,025
Netherlands 890 15.4 -20.5 1.9 183,207 4,115
Cayman Islands 917 10.9 -6.6 1.6 102,391 1,381
France 1,173 8.9 -26.3 1.4 63,619 2,572
Source: Ministry of Commerce of People’s Republic of China, Services Supplied Through Affiliates, 20 January
2018.
Exhibit 2.19. Top 10 Countries (Regions) in Sales of Chinese Affiliates Located Abroad Engaged in
Services Activities, 2016
Country/Region Enterprise Quantity
Sales Total Number of Employees
Value (US$ bn)
Annual % Change
Total Number Chinese Side
Hong Kong 6,466 329.0 18.5 323,957 195,693
Singapore 407 51.8 24.2 26,773 10,579
Cayman Islands 161 30.3 322.3 53,832 43,733
United Kingdom 156 30.0 -0.6 4,160 3,216
British Virgin Islands 389 19.9 0.5 43,578 37,465
Saudi Arabia 29 10.2 26.5 2,762 1,419
United States 2,163 10.1 16.2 18,763 4,628
Algeria 27 9.4 10.7 2,659 804
Pakistan 34 8.1 50.6 4,936 458
Kazakhstan 97 5.5 36.8 9,843 1,046
Source: Ministry of Commerce of People’s Republic of China, Services Supplied Through Affiliates, 20 January
2018.
GBA Background Document
© Copyright 2022 Foundation, 2019. 27
Exhibit 2.20. Hong Kong’s Trade in Services
Year Export (HKD mn) Annual % Change Import (HKD mn) Annual % Change
2006 422,921 15 494,907 13
2007 502,775 19 536,060 8
2008 544,358 8 565,399 6
2009 501,303 -8 473,686 -16
2010 625,719 25 546,930 16
2011 710,716 14 578,035 6
2012 764,026 8 594,266 3
2013 812,640 6 583,216 -2
2014 829,085 2 573,522 -2
2015 808,948 -2 574,345 0
2016 764,839 -6 578,106 1
Source: Hong Kong Census and Statistics Department, Hong Kong Trade in Service Statistics in 2016, February
2018.
Exhibit 2.21. Hong Kong’s Trade in Services by Sector
Industry Exports (HKD mn) Imports (HKD mn)
2014 2015 2016 2014 2015 2016
All 829,085 808,948 764,839 573,522 574,345 578.106
Manufacturing § § § 92,517 90,019 88,192
Maintenance and repair services 2,488 2,678 2,628 872 932 1,009
Transport * - Sea Transport - Air Transport
247,707 131,387
91,670
230,876 115,277
92,985
218,687 107,329
88,777
142,620 60,575 65,122
134,230 58,561 56,936
131,387 57,789 53,689
Travel 297,567 280,227 254,962 170,672 178,751 187,385
Construction 2,818 1,340 944 2,690 1,317 953
Insurance and pension services 9,374 10,143 11,218 11,200 11,264 11,047
Financial Services 137,000 148,671 138,526 34,380 37,291 36,594
Charges for the use of IP 4,828 4,977 5,225 15,030 14,423 14,615
Telecomm, computer, information services 21,873 22,027 22,134 14,752 14,760 15,044
Other business services * - R&D, innovation services - Legal services - Accounting, auditing, tax consulting - Business, management, PR - Advertising, mkt research, polling - Architect, engineering, scientific, tech - Trade-related
102,751 1,209 2,398 1,518
34,472 5,961 4,107
41,725
105,280 1,024 2,308 1,613
37,865 5,347 4,302
40,327
107,445 805
2,507 1,858
39,613 5,161 3,972
39,940
86,808 1,250 1,090 1,225
22,674 4,069 2,837
33,715
89,235 1,089 1,005 1,162
24,906 4,189 2,923
33,741
89,660 1,164 1,200 1,252
25,379 4,109 2,699
33,428
Personal, cultural, recreational services 2,003 1,999 2,328 776 846 983
Government goods and services 676 731 743 1,205 1,278 1,239
Notes: § denotes value within ±HKD 0.5 million; * selected subcategories only, so subcategory totals do not
equal the category value.
Source: Hong Kong Census and Statistics Department, Hong Kong Trade in Service Statistics in 2016, February
2018.
GBA Background Document
© Copyright 2022 Foundation, 2019. 28
Exhibit 2.22. Hong Kong’s Trade in Services with the Chinese Mainland
Industry Exports (HKD mn) Imports (HKD mn)
2014 2015 2016 2014 2015 2016
All 321,650 310,792 296,363 216,521 221,651 220,991
Manufacturing § § § 92,517 90,019 88,192
Maintenance and repair services 397 411 435 238 245 198
Transport 49,447 48,196 57,593 29,567 30,143 29,353
Travel 234,408 221,485 197,846 51,232 55,155 56,686
Construction *** *** *** *** *** ***
Insurance and pension services 3,628 4,166 4,961 3,807 4,490 4,468
Financial Services 6,938 9,377 8,311 2,424 3,677 3,599
Charges for the use of IP 1,425 1,608 1,774 817 868 834
Telecommunications, computer, and information services
6,294 6,465 6,152 4,734 4,523 4,632
Other business services 17,402 17,586 17,860 30,624 31,787 32,209
Personal, cultural, and recreational services
*** *** *** 66 103 178
Government goods and services *** *** *** *** *** ***
Notes: § denotes value within ±HKD 0.5 million, *** denotes figures not released, financial intermediation
services indirectly measured (FISIM) cannot be attributed to a geography and are not included in this
Exhibit.
Source: Hong Kong Census and Statistics Department, Hong Kong Trade in Service Statistics in 2016, February
2018.
GBA Background Document
© Copyright 2022 Foundation, 2019. 29
Exhibit 2.23. Hong Kong Service Supplier CEPA Certificates Awarded through 31 July 2018
Service Sector Cumulative Number of Certificates of
Hong Kong Service Supplier Issued
Legal services 24
Accounting, auditing and bookkeeping services 3
Construction professional services and Construction and related engineering services
103
Medical and dental services 45
Computer and related services and information technology services 23
Real estate services 29
Advertising services 142
Market research services 0
Management consulting and related services 52
Mining and prospecting services 0
Research and experimental development services on natural sciences and engineering
2
Public utility services 1
Placement and supply services of personnel 168
Building-cleaning services 1
Photographic services 3
Printing services 121
Translation and interpretation services 0
Convention and exhibition services 24
Value-added telecommunications services 64
Telecommunication services 4
Audiovisual services 83
Distribution services 364
Environmental services 2
All insurance and insurance-related services 23
Banking and other financial services (excluding insurance and securities) 10
Securities and futures services 90
Social services 0
Tourism and travel related services 51
Cultural services (excluding audiovisual services) 36
Sporting services 0
Transport and logistics services 1,402
Air transport services 297
Trade mark agency services 14
Specialty design services 0
Interdisciplinary research and Experimental development services 0
Services incidental to manufacturing 8
Library, museum and other cultural services 0
Services related to agriculture, forestry and fishing 1
Administrative and support services 16
Education services 6
Personal, pet and household services 0
Other business services 6
Other professional services 0
Other research and development services 0
Rental/Leasing services 4
Communication services 0
Other human health services 5
After-death services facilities 0
Duplicating services 0
Factoring services 3
Publication-related services 0
Technical testing and analysis services 0
Security and guarding services 0
Total 3,230
Source: Hong Kong SAR Government. “Mainland and Hong Kong Closer Economic Partnership Arrangement
(CEPA), Cumulative Number of Certificates of Hong Kong Service Supplier Issued,” August 2018.
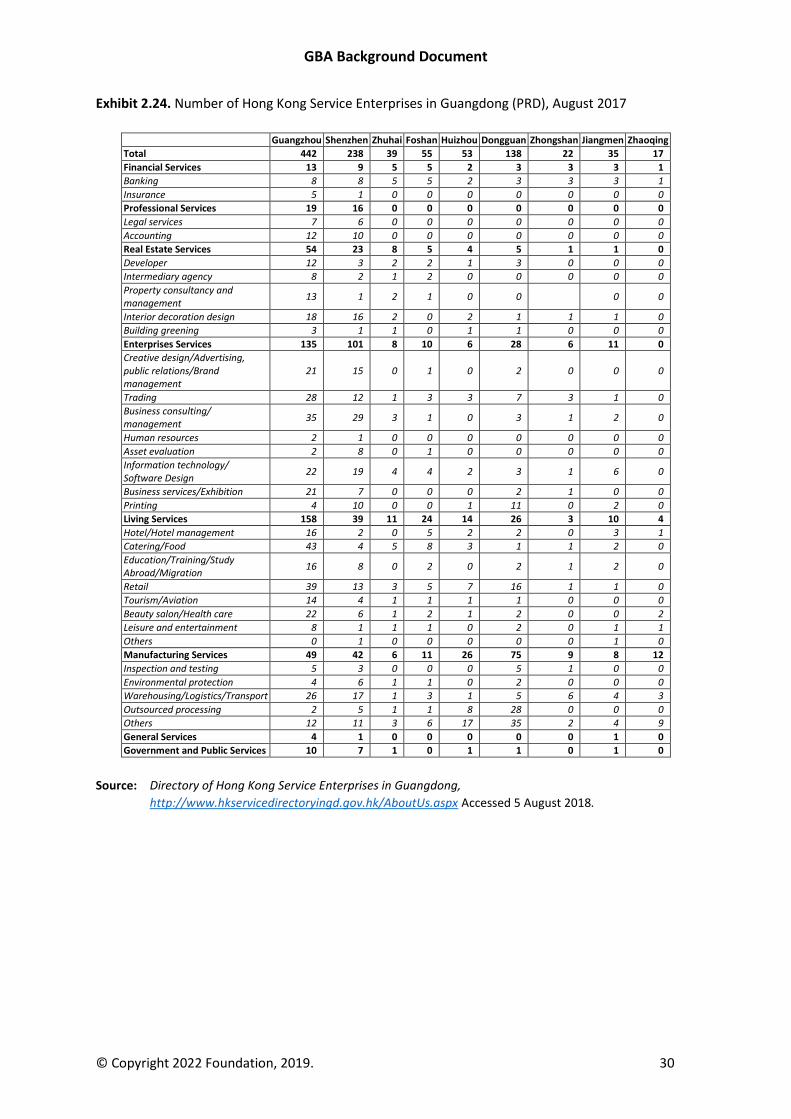
GBA Background Document
© Copyright 2022 Foundation, 2019. 30
Exhibit 2.24. Number of Hong Kong Service Enterprises in Guangdong (PRD), August 2017
Guangzhou Shenzhen Zhuhai Foshan Huizhou Dongguan Zhongshan Jiangmen Zhaoqing
Total 442 238 39 55 53 138 22 35 17
Financial Services 13 9 5 5 2 3 3 3 1
Banking 8 8 5 5 2 3 3 3 1
Insurance 5 1 0 0 0 0 0 0 0
Professional Services 19 16 0 0 0 0 0 0 0
Legal services 7 6 0 0 0 0 0 0 0
Accounting 12 10 0 0 0 0 0 0 0
Real Estate Services 54 23 8 5 4 5 1 1 0
Developer 12 3 2 2 1 3 0 0 0
Intermediary agency 8 2 1 2 0 0 0 0 0
Property consultancy and management
13 1 2 1 0 0 0 0
Interior decoration design 18 16 2 0 2 1 1 1 0
Building greening 3 1 1 0 1 1 0 0 0
Enterprises Services 135 101 8 10 6 28 6 11 0
Creative design/Advertising, public relations/Brand management
21 15 0 1 0 2 0 0 0
Trading 28 12 1 3 3 7 3 1 0
Business consulting/ management
35 29 3 1 0 3 1 2 0
Human resources 2 1 0 0 0 0 0 0 0
Asset evaluation 2 8 0 1 0 0 0 0 0
Information technology/ Software Design
22 19 4 4 2 3 1 6 0
Business services/Exhibition 21 7 0 0 0 2 1 0 0
Printing 4 10 0 0 1 11 0 2 0
Living Services 158 39 11 24 14 26 3 10 4
Hotel/Hotel management 16 2 0 5 2 2 0 3 1
Catering/Food 43 4 5 8 3 1 1 2 0
Education/Training/Study Abroad/Migration
16 8 0 2 0 2 1 2 0
Retail 39 13 3 5 7 16 1 1 0
Tourism/Aviation 14 4 1 1 1 1 0 0 0
Beauty salon/Health care 22 6 1 2 1 2 0 0 2
Leisure and entertainment 8 1 1 1 0 2 0 1 1
Others 0 1 0 0 0 0 0 1 0
Manufacturing Services 49 42 6 11 26 75 9 8 12
Inspection and testing 5 3 0 0 0 5 1 0 0
Environmental protection 4 6 1 1 0 2 0 0 0
Warehousing/Logistics/Transport 26 17 1 3 1 5 6 4 3
Outsourced processing 2 5 1 1 8 28 0 0 0
Others 12 11 3 6 17 35 2 4 9
General Services 4 1 0 0 0 0 0 1 0
Government and Public Services 10 7 1 0 1 1 0 1 0
Source: Directory of Hong Kong Service Enterprises in Guangdong,
http://www.hkservicedirectoryingd.gov.hk/AboutUs.aspx Accessed 5 August 2018.
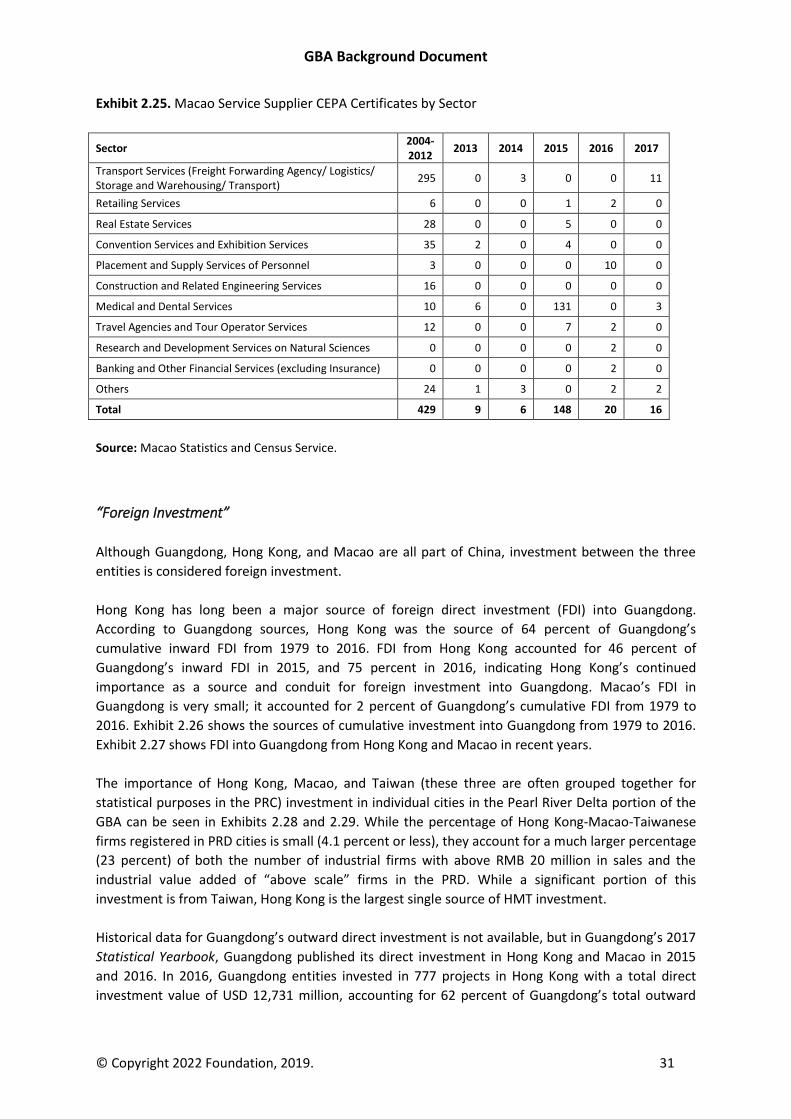
GBA Background Document
© Copyright 2022 Foundation, 2019. 31
Exhibit 2.25. Macao Service Supplier CEPA Certificates by Sector
Sector 2004-2012
2013 2014 2015 2016 2017
Transport Services (Freight Forwarding Agency/ Logistics/ Storage and Warehousing/ Transport)
295 0 3 0 0 11
Retailing Services 6 0 0 1 2 0
Real Estate Services 28 0 0 5 0 0
Convention Services and Exhibition Services 35 2 0 4 0 0
Placement and Supply Services of Personnel 3 0 0 0 10 0
Construction and Related Engineering Services 16 0 0 0 0 0
Medical and Dental Services 10 6 0 131 0 3
Travel Agencies and Tour Operator Services 12 0 0 7 2 0
Research and Development Services on Natural Sciences 0 0 0 0 2 0
Banking and Other Financial Services (excluding Insurance) 0 0 0 0 2 0
Others 24 1 3 0 2 2
Total 429 9 6 148 20 16
Source: Macao Statistics and Census Service.
“Foreign Investment”
Although Guangdong, Hong Kong, and Macao are all part of China, investment between the three
entities is considered foreign investment.
Hong Kong has long been a major source of foreign direct investment (FDI) into Guangdong.
According to Guangdong sources, Hong Kong was the source of 64 percent of Guangdong’s
cumulative inward FDI from 1979 to 2016. FDI from Hong Kong accounted for 46 percent of
Guangdong’s inward FDI in 2015, and 75 percent in 2016, indicating Hong Kong’s continued
importance as a source and conduit for foreign investment into Guangdong. Macao’s FDI in
Guangdong is very small; it accounted for 2 percent of Guangdong’s cumulative FDI from 1979 to
2016. Exhibit 2.26 shows the sources of cumulative investment into Guangdong from 1979 to 2016.
Exhibit 2.27 shows FDI into Guangdong from Hong Kong and Macao in recent years.
The importance of Hong Kong, Macao, and Taiwan (these three are often grouped together for
statistical purposes in the PRC) investment in individual cities in the Pearl River Delta portion of the
GBA can be seen in Exhibits 2.28 and 2.29. While the percentage of Hong Kong-Macao-Taiwanese
firms registered in PRD cities is small (4.1 percent or less), they account for a much larger percentage
(23 percent) of both the number of industrial firms with above RMB 20 million in sales and the
industrial value added of “above scale” firms in the PRD. While a significant portion of this
investment is from Taiwan, Hong Kong is the largest single source of HMT investment.
Historical data for Guangdong’s outward direct investment is not available, but in Guangdong’s 2017
Statistical Yearbook, Guangdong published its direct investment in Hong Kong and Macao in 2015
and 2016. In 2016, Guangdong entities invested in 777 projects in Hong Kong with a total direct
investment value of USD 12,731 million, accounting for 62 percent of Guangdong’s total outward
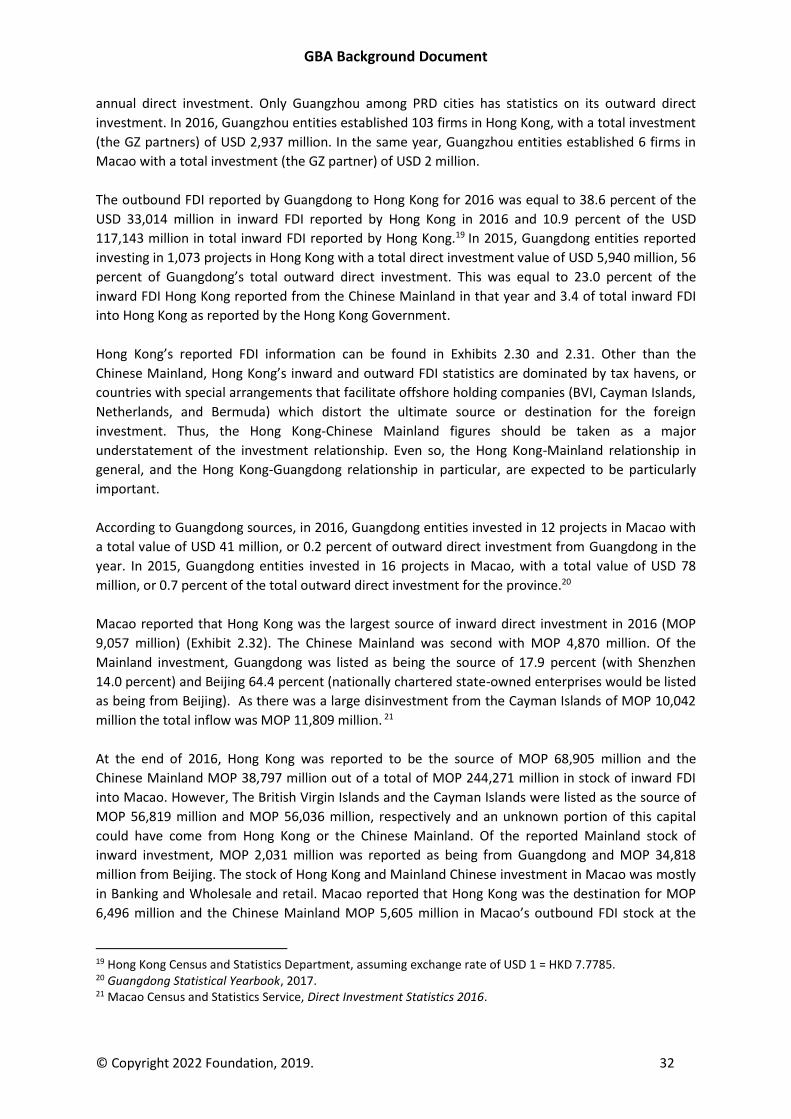
GBA Background Document
© Copyright 2022 Foundation, 2019. 32
annual direct investment. Only Guangzhou among PRD cities has statistics on its outward direct
investment. In 2016, Guangzhou entities established 103 firms in Hong Kong, with a total investment
(the GZ partners) of USD 2,937 million. In the same year, Guangzhou entities established 6 firms in
Macao with a total investment (the GZ partner) of USD 2 million.
The outbound FDI reported by Guangdong to Hong Kong for 2016 was equal to 38.6 percent of the
USD 33,014 million in inward FDI reported by Hong Kong in 2016 and 10.9 percent of the USD
117,143 million in total inward FDI reported by Hong Kong.19 In 2015, Guangdong entities reported
investing in 1,073 projects in Hong Kong with a total direct investment value of USD 5,940 million, 56
percent of Guangdong’s total outward direct investment. This was equal to 23.0 percent of the
inward FDI Hong Kong reported from the Chinese Mainland in that year and 3.4 of total inward FDI
into Hong Kong as reported by the Hong Kong Government.
Hong Kong’s reported FDI information can be found in Exhibits 2.30 and 2.31. Other than the
Chinese Mainland, Hong Kong’s inward and outward FDI statistics are dominated by tax havens, or
countries with special arrangements that facilitate offshore holding companies (BVI, Cayman Islands,
Netherlands, and Bermuda) which distort the ultimate source or destination for the foreign
investment. Thus, the Hong Kong-Chinese Mainland figures should be taken as a major
understatement of the investment relationship. Even so, the Hong Kong-Mainland relationship in
general, and the Hong Kong-Guangdong relationship in particular, are expected to be particularly
important.
According to Guangdong sources, in 2016, Guangdong entities invested in 12 projects in Macao with
a total value of USD 41 million, or 0.2 percent of outward direct investment from Guangdong in the
year. In 2015, Guangdong entities invested in 16 projects in Macao, with a total value of USD 78
million, or 0.7 percent of the total outward direct investment for the province.20
Macao reported that Hong Kong was the largest source of inward direct investment in 2016 (MOP
9,057 million) (Exhibit 2.32). The Chinese Mainland was second with MOP 4,870 million. Of the
Mainland investment, Guangdong was listed as being the source of 17.9 percent (with Shenzhen
14.0 percent) and Beijing 64.4 percent (nationally chartered state-owned enterprises would be listed
as being from Beijing). As there was a large disinvestment from the Cayman Islands of MOP 10,042
million the total inflow was MOP 11,809 million. 21
At the end of 2016, Hong Kong was reported to be the source of MOP 68,905 million and the
Chinese Mainland MOP 38,797 million out of a total of MOP 244,271 million in stock of inward FDI
into Macao. However, The British Virgin Islands and the Cayman Islands were listed as the source of
MOP 56,819 million and MOP 56,036 million, respectively and an unknown portion of this capital
could have come from Hong Kong or the Chinese Mainland. Of the reported Mainland stock of
inward investment, MOP 2,031 million was reported as being from Guangdong and MOP 34,818
million from Beijing. The stock of Hong Kong and Mainland Chinese investment in Macao was mostly
in Banking and Wholesale and retail. Macao reported that Hong Kong was the destination for MOP
6,496 million and the Chinese Mainland MOP 5,605 million in Macao’s outbound FDI stock at the
19 Hong Kong Census and Statistics Department, assuming exchange rate of USD 1 = HKD 7.7785. 20 Guangdong Statistical Yearbook, 2017. 21 Macao Census and Statistics Service, Direct Investment Statistics 2016.
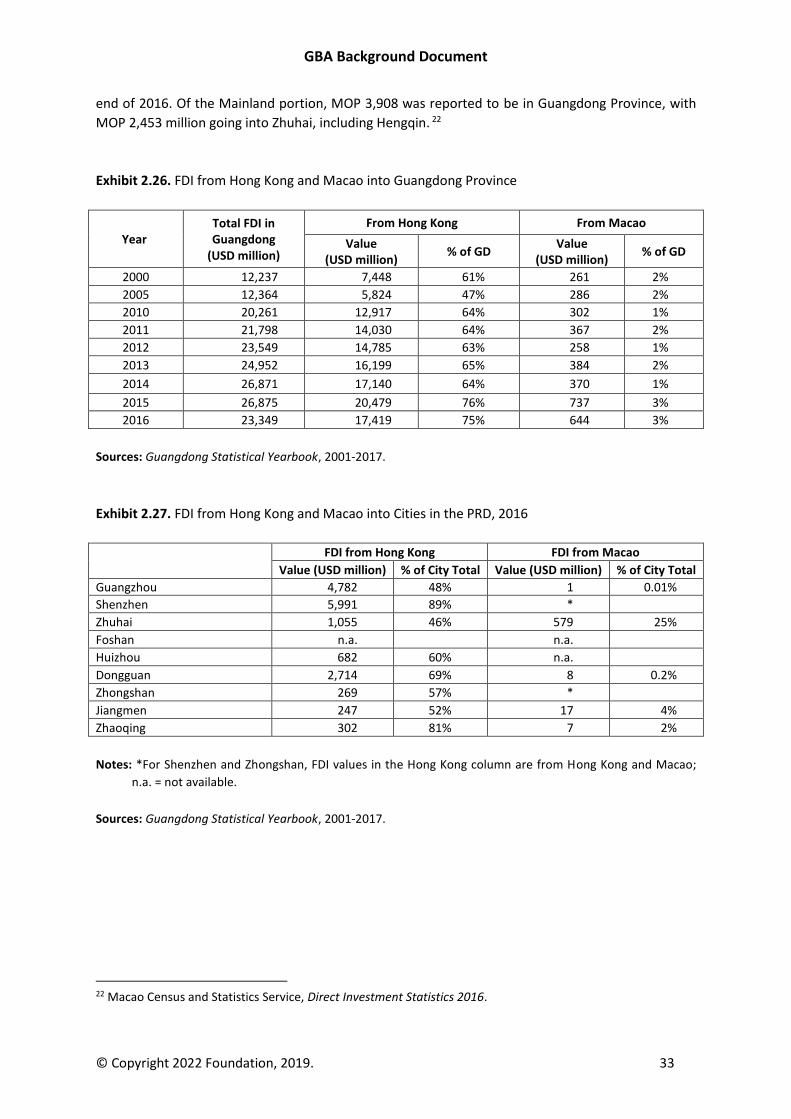
GBA Background Document
© Copyright 2022 Foundation, 2019. 33
end of 2016. Of the Mainland portion, MOP 3,908 was reported to be in Guangdong Province, with
MOP 2,453 million going into Zhuhai, including Hengqin. 22
Exhibit 2.26. FDI from Hong Kong and Macao into Guangdong Province
Year Total FDI in Guangdong
(USD million)
From Hong Kong From Macao
Value (USD million)
% of GD Value
(USD million) % of GD
2000 12,237 7,448 61% 261 2%
2005 12,364 5,824 47% 286 2%
2010 20,261 12,917 64% 302 1%
2011 21,798 14,030 64% 367 2%
2012 23,549 14,785 63% 258 1%
2013 24,952 16,199 65% 384 2%
2014 26,871 17,140 64% 370 1%
2015 26,875 20,479 76% 737 3%
2016 23,349 17,419 75% 644 3%
Sources: Guangdong Statistical Yearbook, 2001-2017.
Exhibit 2.27. FDI from Hong Kong and Macao into Cities in the PRD, 2016
FDI from Hong Kong FDI from Macao
Value (USD million) % of City Total Value (USD million) % of City Total
Guangzhou 4,782 48% 1 0.01%
Shenzhen 5,991 89% *
Zhuhai 1,055 46% 579 25%
Foshan n.a. n.a.
Huizhou 682 60% n.a.
Dongguan 2,714 69% 8 0.2%
Zhongshan 269 57% *
Jiangmen 247 52% 17 4%
Zhaoqing 302 81% 7 2%
Notes: *For Shenzhen and Zhongshan, FDI values in the Hong Kong column are from Hong Kong and Macao;
n.a. = not available.
Sources: Guangdong Statistical Yearbook, 2001-2017.
22 Macao Census and Statistics Service, Direct Investment Statistics 2016.
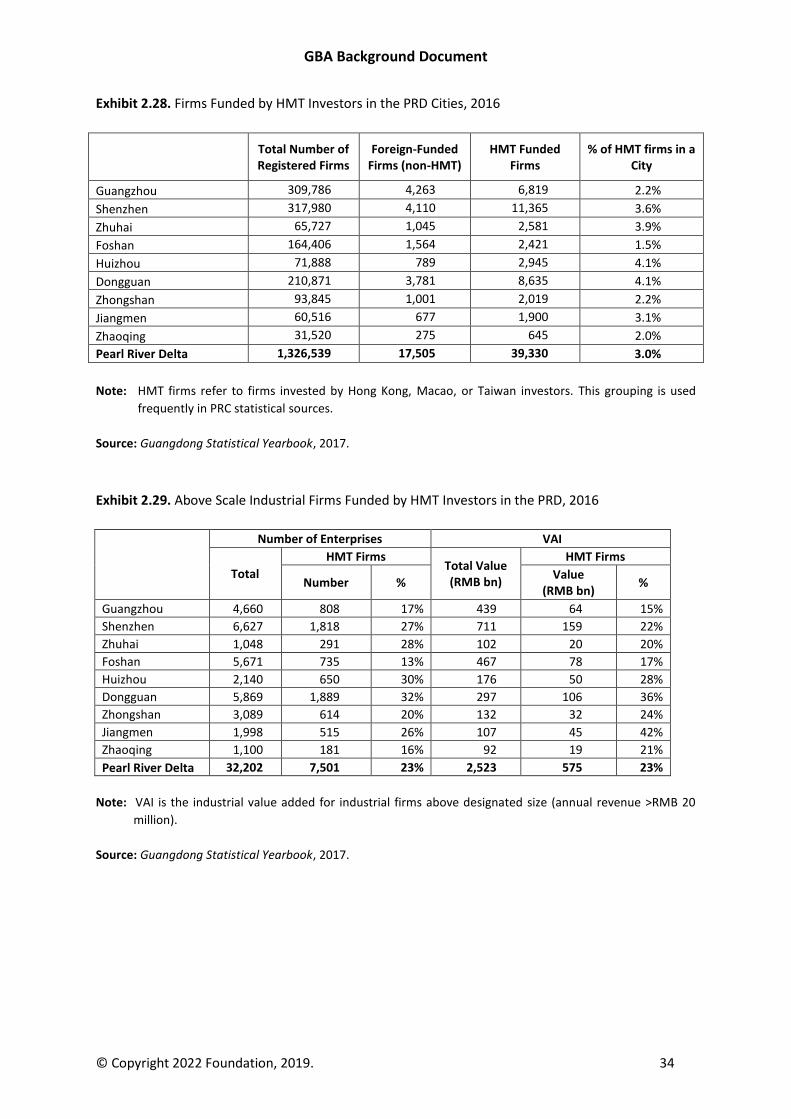
GBA Background Document
© Copyright 2022 Foundation, 2019. 34
Exhibit 2.28. Firms Funded by HMT Investors in the PRD Cities, 2016
Total Number of Registered Firms
Foreign-Funded Firms (non-HMT)
HMT Funded Firms
% of HMT firms in a City
Guangzhou 309,786 4,263 6,819 2.2%
Shenzhen 317,980 4,110 11,365 3.6%
Zhuhai 65,727 1,045 2,581 3.9%
Foshan 164,406 1,564 2,421 1.5%
Huizhou 71,888 789 2,945 4.1%
Dongguan 210,871 3,781 8,635 4.1%
Zhongshan 93,845 1,001 2,019 2.2%
Jiangmen 60,516 677 1,900 3.1%
Zhaoqing 31,520 275 645 2.0%
Pearl River Delta 1,326,539 17,505 39,330 3.0%
Note: HMT firms refer to firms invested by Hong Kong, Macao, or Taiwan investors. This grouping is used
frequently in PRC statistical sources.
Source: Guangdong Statistical Yearbook, 2017.
Exhibit 2.29. Above Scale Industrial Firms Funded by HMT Investors in the PRD, 2016
Number of Enterprises VAI
Total
HMT Firms Total Value (RMB bn)
HMT Firms
Number % Value
(RMB bn) %
Guangzhou 4,660 808 17% 439 64 15%
Shenzhen 6,627 1,818 27% 711 159 22%
Zhuhai 1,048 291 28% 102 20 20%
Foshan 5,671 735 13% 467 78 17%
Huizhou 2,140 650 30% 176 50 28%
Dongguan 5,869 1,889 32% 297 106 36%
Zhongshan 3,089 614 20% 132 32 24%
Jiangmen 1,998 515 26% 107 45 42%
Zhaoqing 1,100 181 16% 92 19 21%
Pearl River Delta 32,202 7,501 23% 2,523 575 23%
Note: VAI is the industrial value added for industrial firms above designated size (annual revenue >RMB 20
million).
Source: Guangdong Statistical Yearbook, 2017.
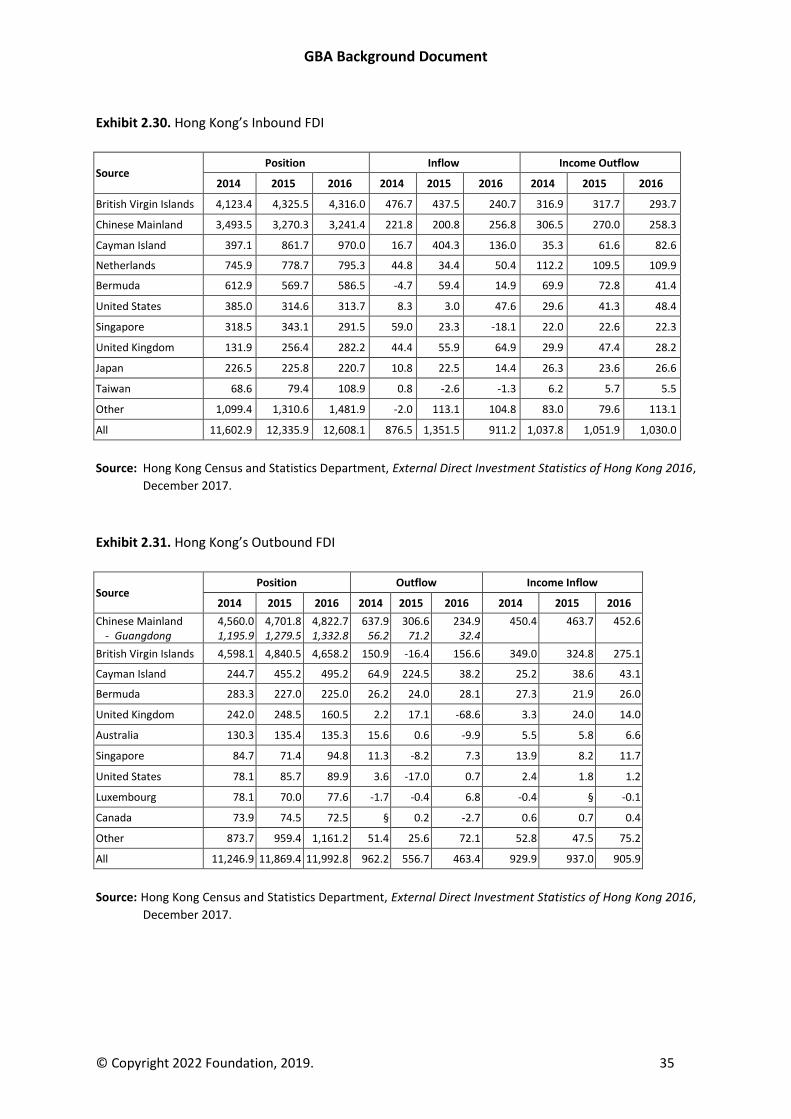
GBA Background Document
© Copyright 2022 Foundation, 2019. 35
Exhibit 2.30. Hong Kong’s Inbound FDI
Source Position Inflow Income Outflow
2014 2015 2016 2014 2015 2016 2014 2015 2016
British Virgin Islands 4,123.4 4,325.5 4,316.0 476.7 437.5 240.7 316.9 317.7 293.7
Chinese Mainland 3,493.5 3,270.3 3,241.4 221.8 200.8 256.8 306.5 270.0 258.3
Cayman Island 397.1 861.7 970.0 16.7 404.3 136.0 35.3 61.6 82.6
Netherlands 745.9 778.7 795.3 44.8 34.4 50.4 112.2 109.5 109.9
Bermuda 612.9 569.7 586.5 -4.7 59.4 14.9 69.9 72.8 41.4
United States 385.0 314.6 313.7 8.3 3.0 47.6 29.6 41.3 48.4
Singapore 318.5 343.1 291.5 59.0 23.3 -18.1 22.0 22.6 22.3
United Kingdom 131.9 256.4 282.2 44.4 55.9 64.9 29.9 47.4 28.2
Japan 226.5 225.8 220.7 10.8 22.5 14.4 26.3 23.6 26.6
Taiwan 68.6 79.4 108.9 0.8 -2.6 -1.3 6.2 5.7 5.5
Other 1,099.4 1,310.6 1,481.9 -2.0 113.1 104.8 83.0 79.6 113.1
All 11,602.9 12,335.9 12,608.1 876.5 1,351.5 911.2 1,037.8 1,051.9 1,030.0
Source: Hong Kong Census and Statistics Department, External Direct Investment Statistics of Hong Kong 2016,
December 2017.
Exhibit 2.31. Hong Kong’s Outbound FDI
Source Position Outflow Income Inflow
2014 2015 2016 2014 2015 2016 2014 2015 2016
Chinese Mainland - Guangdong
4,560.0 1,195.9
4,701.8 1,279.5
4,822.7 1,332.8
637.9 56.2
306.6 71.2
234.9 32.4
450.4 463.7 452.6
British Virgin Islands 4,598.1 4,840.5 4,658.2 150.9 -16.4 156.6 349.0 324.8 275.1
Cayman Island 244.7 455.2 495.2 64.9 224.5 38.2 25.2 38.6 43.1
Bermuda 283.3 227.0 225.0 26.2 24.0 28.1 27.3 21.9 26.0
United Kingdom 242.0 248.5 160.5 2.2 17.1 -68.6 3.3 24.0 14.0
Australia 130.3 135.4 135.3 15.6 0.6 -9.9 5.5 5.8 6.6
Singapore 84.7 71.4 94.8 11.3 -8.2 7.3 13.9 8.2 11.7
United States 78.1 85.7 89.9 3.6 -17.0 0.7 2.4 1.8 1.2
Luxembourg 78.1 70.0 77.6 -1.7 -0.4 6.8 -0.4 § -0.1
Canada 73.9 74.5 72.5 § 0.2 -2.7 0.6 0.7 0.4
Other 873.7 959.4 1,161.2 51.4 25.6 72.1 52.8 47.5 75.2
All 11,246.9 11,869.4 11,992.8 962.2 556.7 463.4 929.9 937.0 905.9
Source: Hong Kong Census and Statistics Department, External Direct Investment Statistics of Hong Kong 2016,
December 2017.
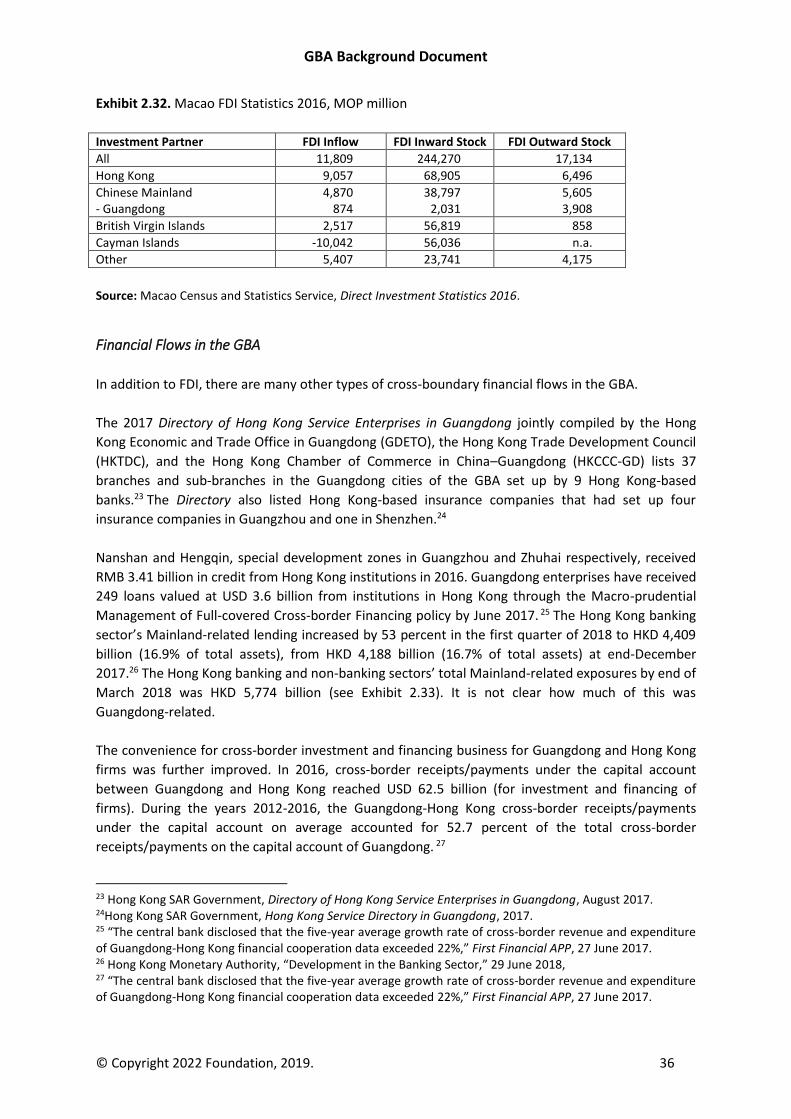
GBA Background Document
© Copyright 2022 Foundation, 2019. 36
Exhibit 2.32. Macao FDI Statistics 2016, MOP million
Investment Partner FDI Inflow FDI Inward Stock FDI Outward Stock
All 11,809 244,270 17,134
Hong Kong 9,057 68,905 6,496
Chinese Mainland - Guangdong
4,870 874
38,797 2,031
5,605 3,908
British Virgin Islands 2,517 56,819 858
Cayman Islands -10,042 56,036 n.a.
Other 5,407 23,741 4,175
Source: Macao Census and Statistics Service, Direct Investment Statistics 2016.
Financial Flows in the GBA
In addition to FDI, there are many other types of cross-boundary financial flows in the GBA.
The 2017 Directory of Hong Kong Service Enterprises in Guangdong jointly compiled by the Hong
Kong Economic and Trade Office in Guangdong (GDETO), the Hong Kong Trade Development Council
(HKTDC), and the Hong Kong Chamber of Commerce in China–Guangdong (HKCCC-GD) lists 37
branches and sub-branches in the Guangdong cities of the GBA set up by 9 Hong Kong-based
banks.23 The Directory also listed Hong Kong-based insurance companies that had set up four
insurance companies in Guangzhou and one in Shenzhen.24
Nanshan and Hengqin, special development zones in Guangzhou and Zhuhai respectively, received
RMB 3.41 billion in credit from Hong Kong institutions in 2016. Guangdong enterprises have received
249 loans valued at USD 3.6 billion from institutions in Hong Kong through the Macro-prudential
Management of Full-covered Cross-border Financing policy by June 2017. 25 The Hong Kong banking
sector’s Mainland-related lending increased by 53 percent in the first quarter of 2018 to HKD 4,409
billion (16.9% of total assets), from HKD 4,188 billion (16.7% of total assets) at end-December
2017.26 The Hong Kong banking and non-banking sectors’ total Mainland-related exposures by end of
March 2018 was HKD 5,774 billion (see Exhibit 2.33). It is not clear how much of this was
Guangdong-related.
The convenience for cross-border investment and financing business for Guangdong and Hong Kong
firms was further improved. In 2016, cross-border receipts/payments under the capital account
between Guangdong and Hong Kong reached USD 62.5 billion (for investment and financing of
firms). During the years 2012-2016, the Guangdong-Hong Kong cross-border receipts/payments
under the capital account on average accounted for 52.7 percent of the total cross-border
receipts/payments on the capital account of Guangdong. 27
23 Hong Kong SAR Government, Directory of Hong Kong Service Enterprises in Guangdong, August 2017. 24Hong Kong SAR Government, Hong Kong Service Directory in Guangdong, 2017. 25 “The central bank disclosed that the five-year average growth rate of cross-border revenue and expenditure of Guangdong-Hong Kong financial cooperation data exceeded 22%,” First Financial APP, 27 June 2017. 26 Hong Kong Monetary Authority, “Development in the Banking Sector,” 29 June 2018, 27 “The central bank disclosed that the five-year average growth rate of cross-border revenue and expenditure of Guangdong-Hong Kong financial cooperation data exceeded 22%,” First Financial APP, 27 June 2017.
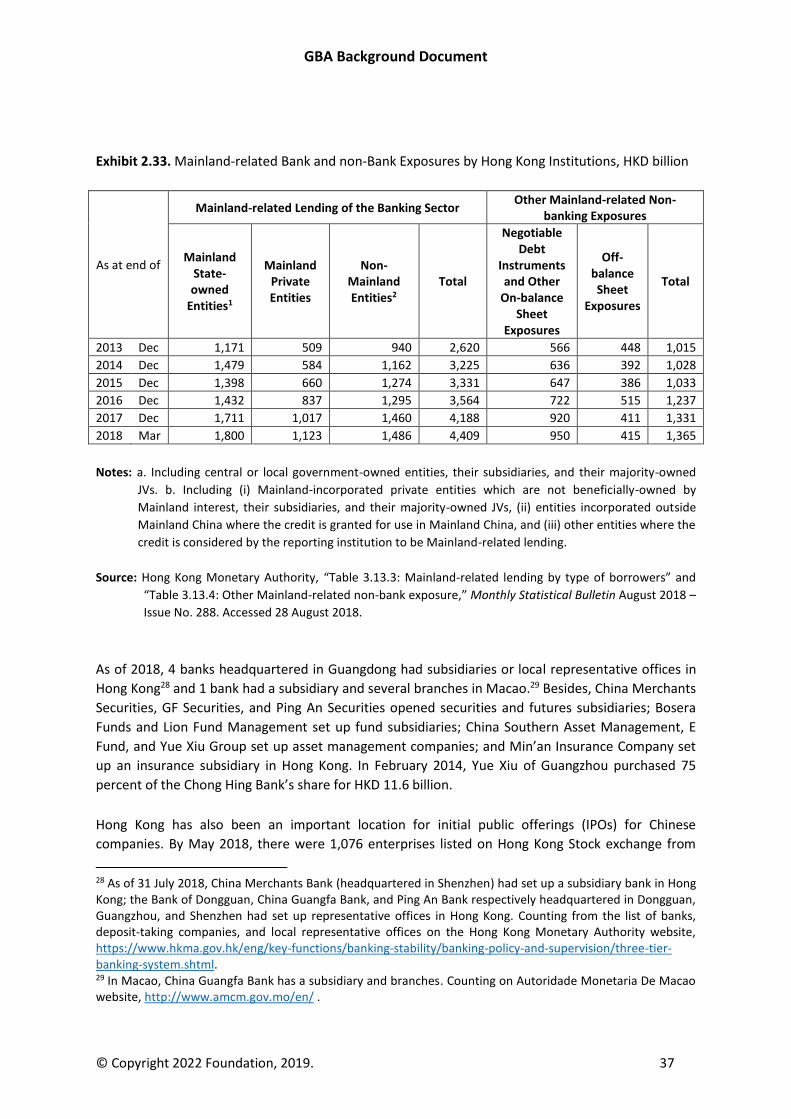
GBA Background Document
© Copyright 2022 Foundation, 2019. 37
Exhibit 2.33. Mainland-related Bank and non-Bank Exposures by Hong Kong Institutions, HKD billion
As at end of
Mainland-related Lending of the Banking Sector Other Mainland-related Non-
banking Exposures
Mainland State-owned
Entities1
Mainland Private Entities
Non-Mainland Entities2
Total
Negotiable Debt
Instruments and Other
On-balance Sheet
Exposures
Off-balance Sheet
Exposures
Total
2013 Dec 1,171 509 940 2,620 566 448 1,015
2014 Dec 1,479 584 1,162 3,225 636 392 1,028
2015 Dec 1,398 660 1,274 3,331 647 386 1,033
2016 Dec 1,432 837 1,295 3,564 722 515 1,237
2017 Dec 1,711 1,017 1,460 4,188 920 411 1,331
2018 Mar 1,800 1,123 1,486 4,409 950 415 1,365
Notes: a. Including central or local government-owned entities, their subsidiaries, and their majority-owned
JVs. b. Including (i) Mainland-incorporated private entities which are not beneficially-owned by
Mainland interest, their subsidiaries, and their majority-owned JVs, (ii) entities incorporated outside
Mainland China where the credit is granted for use in Mainland China, and (iii) other entities where the
credit is considered by the reporting institution to be Mainland-related lending.
Source: Hong Kong Monetary Authority, “Table 3.13.3: Mainland-related lending by type of borrowers” and
“Table 3.13.4: Other Mainland-related non-bank exposure,” Monthly Statistical Bulletin August 2018 –
Issue No. 288. Accessed 28 August 2018.
As of 2018, 4 banks headquartered in Guangdong had subsidiaries or local representative offices in
Hong Kong28 and 1 bank had a subsidiary and several branches in Macao.29 Besides, China Merchants
Securities, GF Securities, and Ping An Securities opened securities and futures subsidiaries; Bosera
Funds and Lion Fund Management set up fund subsidiaries; China Southern Asset Management, E
Fund, and Yue Xiu Group set up asset management companies; and Min’an Insurance Company set
up an insurance subsidiary in Hong Kong. In February 2014, Yue Xiu of Guangzhou purchased 75
percent of the Chong Hing Bank’s share for HKD 11.6 billion.
Hong Kong has also been an important location for initial public offerings (IPOs) for Chinese
companies. By May 2018, there were 1,076 enterprises listed on Hong Kong Stock exchange from
28 As of 31 July 2018, China Merchants Bank (headquartered in Shenzhen) had set up a subsidiary bank in Hong Kong; the Bank of Dongguan, China Guangfa Bank, and Ping An Bank respectively headquartered in Dongguan, Guangzhou, and Shenzhen had set up representative offices in Hong Kong. Counting from the list of banks, deposit-taking companies, and local representative offices on the Hong Kong Monetary Authority website, https://www.hkma.gov.hk/eng/key-functions/banking-stability/banking-policy-and-supervision/three-tier-banking-system.shtml. 29 In Macao, China Guangfa Bank has a subsidiary and branches. Counting on Autoridade Monetaria De Macao website, http://www.amcm.gov.mo/en/ .
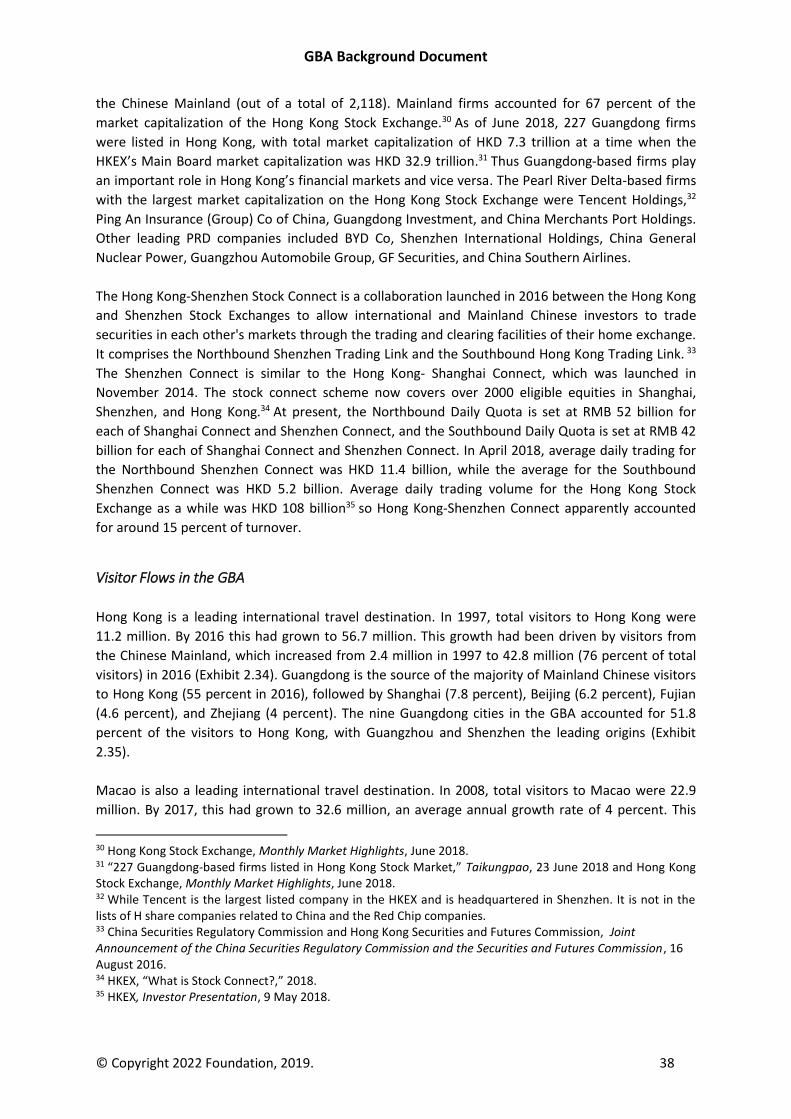
GBA Background Document
© Copyright 2022 Foundation, 2019. 38
the Chinese Mainland (out of a total of 2,118). Mainland firms accounted for 67 percent of the
market capitalization of the Hong Kong Stock Exchange.30 As of June 2018, 227 Guangdong firms
were listed in Hong Kong, with total market capitalization of HKD 7.3 trillion at a time when the
HKEX’s Main Board market capitalization was HKD 32.9 trillion.31 Thus Guangdong-based firms play
an important role in Hong Kong’s financial markets and vice versa. The Pearl River Delta-based firms
with the largest market capitalization on the Hong Kong Stock Exchange were Tencent Holdings,32
Ping An Insurance (Group) Co of China, Guangdong Investment, and China Merchants Port Holdings.
Other leading PRD companies included BYD Co, Shenzhen International Holdings, China General
Nuclear Power, Guangzhou Automobile Group, GF Securities, and China Southern Airlines.
The Hong Kong-Shenzhen Stock Connect is a collaboration launched in 2016 between the Hong Kong
and Shenzhen Stock Exchanges to allow international and Mainland Chinese investors to trade
securities in each other's markets through the trading and clearing facilities of their home exchange.
It comprises the Northbound Shenzhen Trading Link and the Southbound Hong Kong Trading Link. 33
The Shenzhen Connect is similar to the Hong Kong- Shanghai Connect, which was launched in
November 2014. The stock connect scheme now covers over 2000 eligible equities in Shanghai,
Shenzhen, and Hong Kong.34 At present, the Northbound Daily Quota is set at RMB 52 billion for
each of Shanghai Connect and Shenzhen Connect, and the Southbound Daily Quota is set at RMB 42
billion for each of Shanghai Connect and Shenzhen Connect. In April 2018, average daily trading for
the Northbound Shenzhen Connect was HKD 11.4 billion, while the average for the Southbound
Shenzhen Connect was HKD 5.2 billion. Average daily trading volume for the Hong Kong Stock
Exchange as a while was HKD 108 billion35 so Hong Kong-Shenzhen Connect apparently accounted
for around 15 percent of turnover.
Visitor Flows in the GBA
Hong Kong is a leading international travel destination. In 1997, total visitors to Hong Kong were
11.2 million. By 2016 this had grown to 56.7 million. This growth had been driven by visitors from
the Chinese Mainland, which increased from 2.4 million in 1997 to 42.8 million (76 percent of total
visitors) in 2016 (Exhibit 2.34). Guangdong is the source of the majority of Mainland Chinese visitors
to Hong Kong (55 percent in 2016), followed by Shanghai (7.8 percent), Beijing (6.2 percent), Fujian
(4.6 percent), and Zhejiang (4 percent). The nine Guangdong cities in the GBA accounted for 51.8
percent of the visitors to Hong Kong, with Guangzhou and Shenzhen the leading origins (Exhibit
2.35).
Macao is also a leading international travel destination. In 2008, total visitors to Macao were 22.9
million. By 2017, this had grown to 32.6 million, an average annual growth rate of 4 percent. This
30 Hong Kong Stock Exchange, Monthly Market Highlights, June 2018. 31 “227 Guangdong-based firms listed in Hong Kong Stock Market,” Taikungpao, 23 June 2018 and Hong Kong Stock Exchange, Monthly Market Highlights, June 2018. 32 While Tencent is the largest listed company in the HKEX and is headquartered in Shenzhen. It is not in the lists of H share companies related to China and the Red Chip companies. 33 China Securities Regulatory Commission and Hong Kong Securities and Futures Commission, Joint Announcement of the China Securities Regulatory Commission and the Securities and Futures Commission, 16 August 2016. 34 HKEX, “What is Stock Connect?,” 2018. 35 HKEX, Investor Presentation, 9 May 2018.
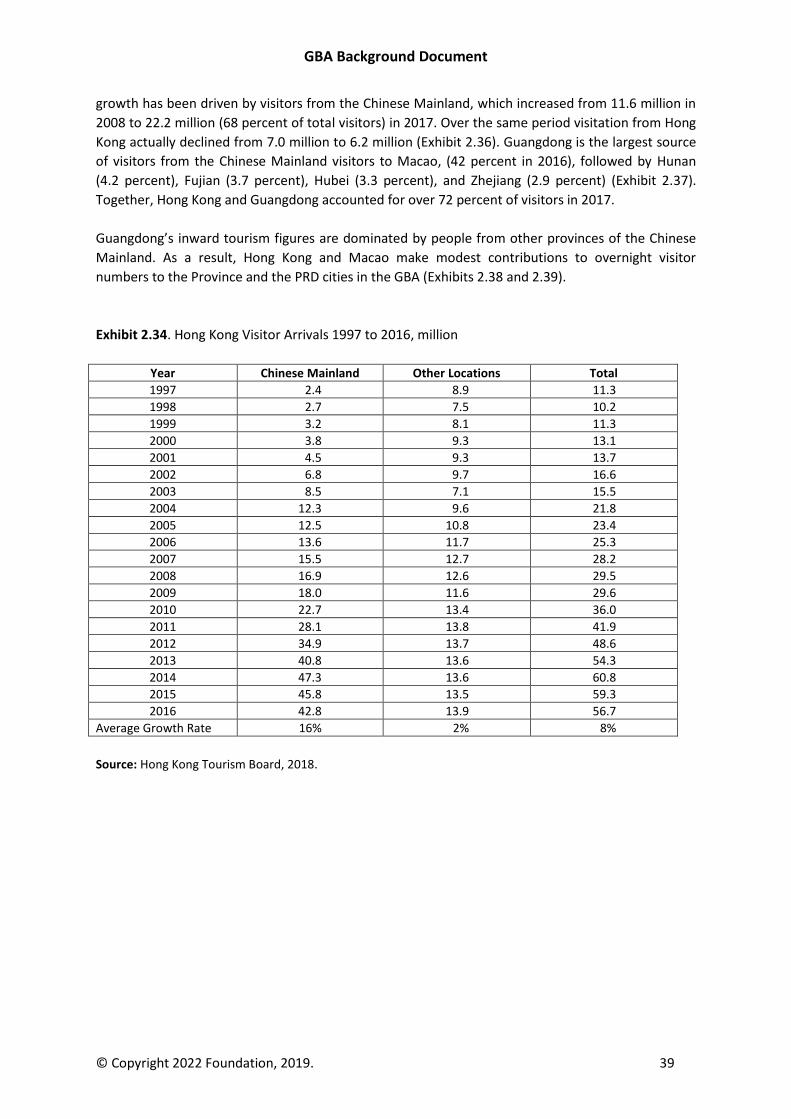
GBA Background Document
© Copyright 2022 Foundation, 2019. 39
growth has been driven by visitors from the Chinese Mainland, which increased from 11.6 million in
2008 to 22.2 million (68 percent of total visitors) in 2017. Over the same period visitation from Hong
Kong actually declined from 7.0 million to 6.2 million (Exhibit 2.36). Guangdong is the largest source
of visitors from the Chinese Mainland visitors to Macao, (42 percent in 2016), followed by Hunan
(4.2 percent), Fujian (3.7 percent), Hubei (3.3 percent), and Zhejiang (2.9 percent) (Exhibit 2.37).
Together, Hong Kong and Guangdong accounted for over 72 percent of visitors in 2017.
Guangdong’s inward tourism figures are dominated by people from other provinces of the Chinese
Mainland. As a result, Hong Kong and Macao make modest contributions to overnight visitor
numbers to the Province and the PRD cities in the GBA (Exhibits 2.38 and 2.39).
Exhibit 2.34. Hong Kong Visitor Arrivals 1997 to 2016, million
Year Chinese Mainland Other Locations Total
1997 2.4 8.9 11.3
1998 2.7 7.5 10.2
1999 3.2 8.1 11.3
2000 3.8 9.3 13.1
2001 4.5 9.3 13.7
2002 6.8 9.7 16.6
2003 8.5 7.1 15.5
2004 12.3 9.6 21.8
2005 12.5 10.8 23.4
2006 13.6 11.7 25.3
2007 15.5 12.7 28.2
2008 16.9 12.6 29.5
2009 18.0 11.6 29.6
2010 22.7 13.4 36.0
2011 28.1 13.8 41.9
2012 34.9 13.7 48.6
2013 40.8 13.6 54.3
2014 47.3 13.6 60.8
2015 45.8 13.5 59.3
2016 42.8 13.9 56.7
Average Growth Rate 16% 2% 8%
Source: Hong Kong Tourism Board, 2018.
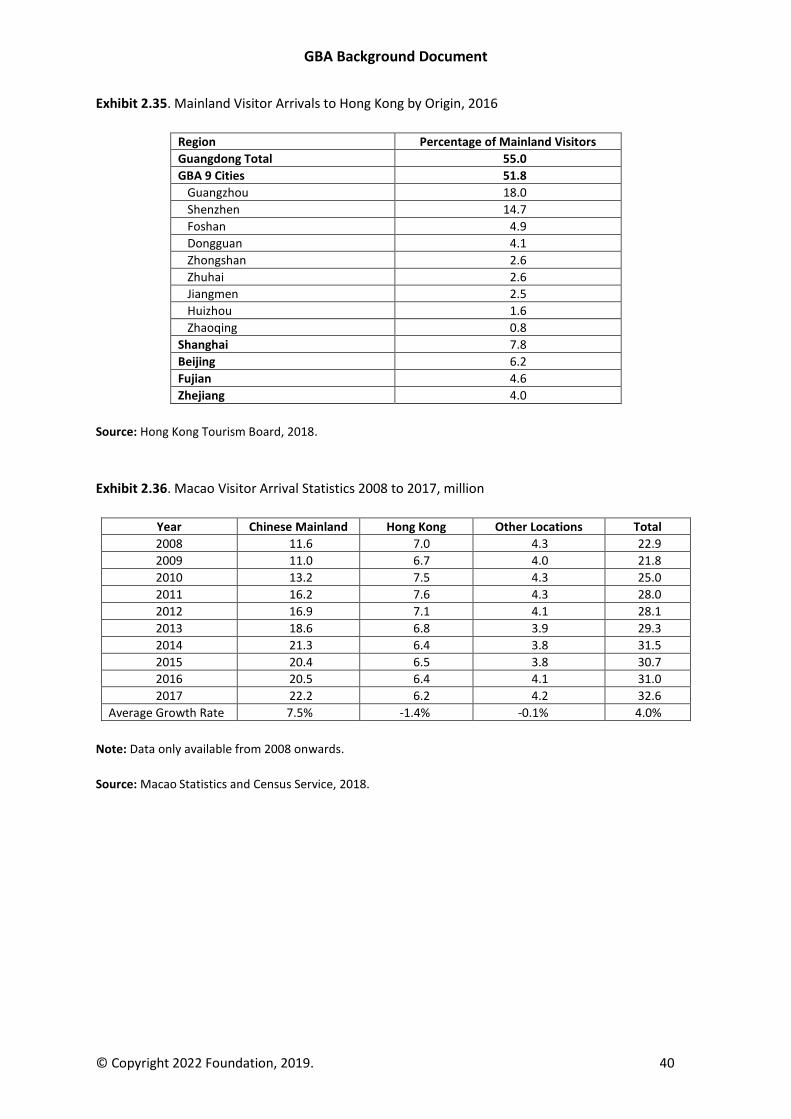
GBA Background Document
© Copyright 2022 Foundation, 2019. 40
Exhibit 2.35. Mainland Visitor Arrivals to Hong Kong by Origin, 2016
Region Percentage of Mainland Visitors
Guangdong Total 55.0
GBA 9 Cities 51.8
Guangzhou 18.0
Shenzhen 14.7
Foshan 4.9
Dongguan 4.1
Zhongshan 2.6
Zhuhai 2.6
Jiangmen 2.5
Huizhou 1.6
Zhaoqing 0.8
Shanghai 7.8
Beijing 6.2
Fujian 4.6
Zhejiang 4.0
Source: Hong Kong Tourism Board, 2018.
Exhibit 2.36. Macao Visitor Arrival Statistics 2008 to 2017, million
Year Chinese Mainland Hong Kong Other Locations Total
2008 11.6 7.0 4.3 22.9
2009 11.0 6.7 4.0 21.8
2010 13.2 7.5 4.3 25.0
2011 16.2 7.6 4.3 28.0
2012 16.9 7.1 4.1 28.1
2013 18.6 6.8 3.9 29.3
2014 21.3 6.4 3.8 31.5
2015 20.4 6.5 3.8 30.7
2016 20.5 6.4 4.1 31.0
2017 22.2 6.2 4.2 32.6
Average Growth Rate 7.5% -1.4% -0.1% 4.0%
Note: Data only available from 2008 onwards.
Source: Macao Statistics and Census Service, 2018.
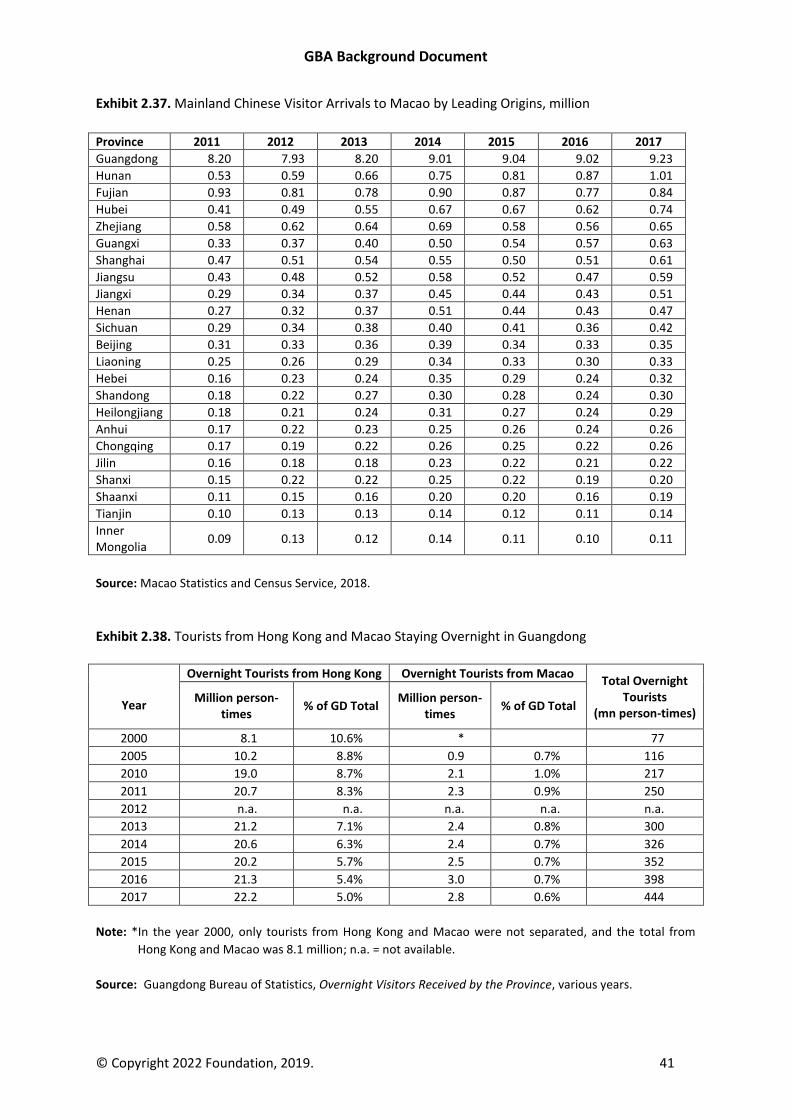
GBA Background Document
© Copyright 2022 Foundation, 2019. 41
Exhibit 2.37. Mainland Chinese Visitor Arrivals to Macao by Leading Origins, million
Province 2011 2012 2013 2014 2015 2016 2017
Guangdong 8.20 7.93 8.20 9.01 9.04 9.02 9.23
Hunan 0.53 0.59 0.66 0.75 0.81 0.87 1.01
Fujian 0.93 0.81 0.78 0.90 0.87 0.77 0.84
Hubei 0.41 0.49 0.55 0.67 0.67 0.62 0.74
Zhejiang 0.58 0.62 0.64 0.69 0.58 0.56 0.65
Guangxi 0.33 0.37 0.40 0.50 0.54 0.57 0.63
Shanghai 0.47 0.51 0.54 0.55 0.50 0.51 0.61
Jiangsu 0.43 0.48 0.52 0.58 0.52 0.47 0.59
Jiangxi 0.29 0.34 0.37 0.45 0.44 0.43 0.51
Henan 0.27 0.32 0.37 0.51 0.44 0.43 0.47
Sichuan 0.29 0.34 0.38 0.40 0.41 0.36 0.42
Beijing 0.31 0.33 0.36 0.39 0.34 0.33 0.35
Liaoning 0.25 0.26 0.29 0.34 0.33 0.30 0.33
Hebei 0.16 0.23 0.24 0.35 0.29 0.24 0.32
Shandong 0.18 0.22 0.27 0.30 0.28 0.24 0.30
Heilongjiang 0.18 0.21 0.24 0.31 0.27 0.24 0.29
Anhui 0.17 0.22 0.23 0.25 0.26 0.24 0.26
Chongqing 0.17 0.19 0.22 0.26 0.25 0.22 0.26
Jilin 0.16 0.18 0.18 0.23 0.22 0.21 0.22
Shanxi 0.15 0.22 0.22 0.25 0.22 0.19 0.20
Shaanxi 0.11 0.15 0.16 0.20 0.20 0.16 0.19
Tianjin 0.10 0.13 0.13 0.14 0.12 0.11 0.14
Inner Mongolia
0.09 0.13 0.12 0.14 0.11 0.10 0.11
Source: Macao Statistics and Census Service, 2018.
Exhibit 2.38. Tourists from Hong Kong and Macao Staying Overnight in Guangdong
Year
Overnight Tourists from Hong Kong Overnight Tourists from Macao Total Overnight
Tourists (mn person-times)
Million person-times
% of GD Total Million person-
times % of GD Total
2000 8.1 10.6% * 77
2005 10.2 8.8% 0.9 0.7% 116
2010 19.0 8.7% 2.1 1.0% 217
2011 20.7 8.3% 2.3 0.9% 250
2012 n.a. n.a. n.a. n.a. n.a.
2013 21.2 7.1% 2.4 0.8% 300
2014 20.6 6.3% 2.4 0.7% 326
2015 20.2 5.7% 2.5 0.7% 352
2016 21.3 5.4% 3.0 0.7% 398
2017 22.2 5.0% 2.8 0.6% 444
Note: *In the year 2000, only tourists from Hong Kong and Macao were not separated, and the total from
Hong Kong and Macao was 8.1 million; n.a. = not available.
Source: Guangdong Bureau of Statistics, Overnight Visitors Received by the Province, various years.
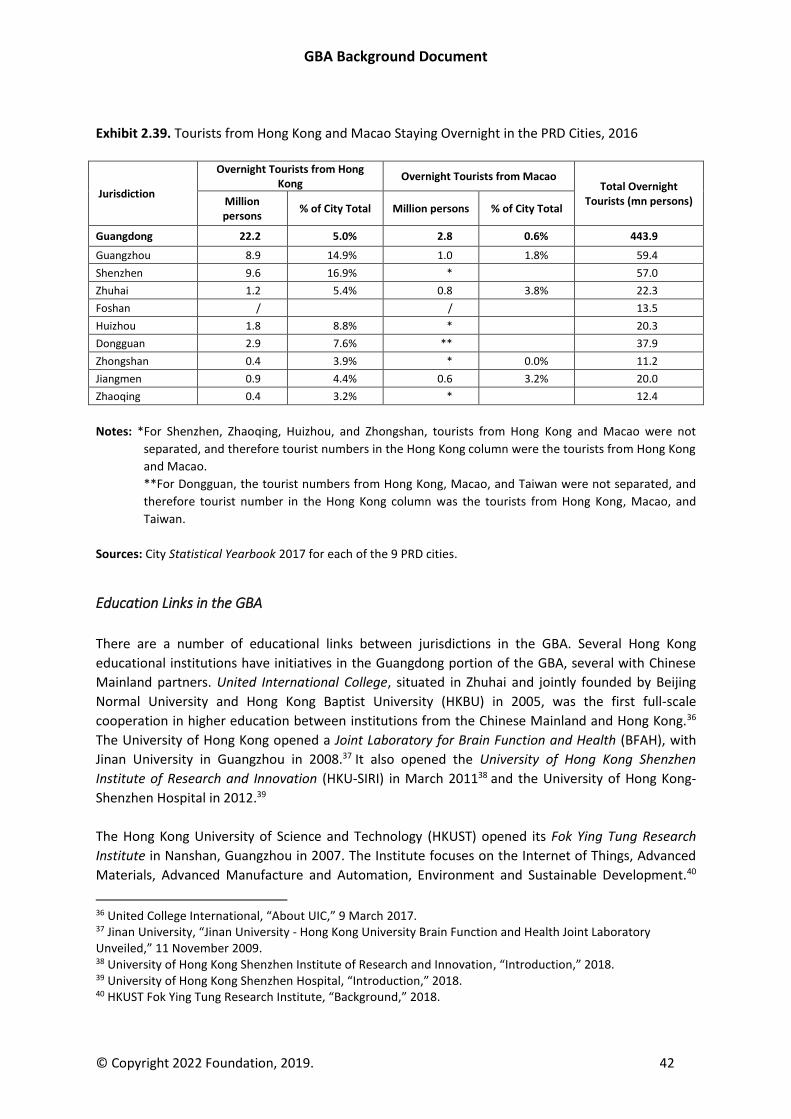
GBA Background Document
© Copyright 2022 Foundation, 2019. 42
Exhibit 2.39. Tourists from Hong Kong and Macao Staying Overnight in the PRD Cities, 2016
Jurisdiction
Overnight Tourists from Hong Kong
Overnight Tourists from Macao Total Overnight
Tourists (mn persons) Million persons
% of City Total Million persons % of City Total
Guangdong 22.2 5.0% 2.8 0.6% 443.9
Guangzhou 8.9 14.9% 1.0 1.8% 59.4
Shenzhen 9.6 16.9% * 57.0
Zhuhai 1.2 5.4% 0.8 3.8% 22.3
Foshan / / 13.5
Huizhou 1.8 8.8% * 20.3
Dongguan 2.9 7.6% ** 37.9
Zhongshan 0.4 3.9% * 0.0% 11.2
Jiangmen 0.9 4.4% 0.6 3.2% 20.0
Zhaoqing 0.4 3.2% * 12.4
Notes: *For Shenzhen, Zhaoqing, Huizhou, and Zhongshan, tourists from Hong Kong and Macao were not
separated, and therefore tourist numbers in the Hong Kong column were the tourists from Hong Kong
and Macao.
**For Dongguan, the tourist numbers from Hong Kong, Macao, and Taiwan were not separated, and
therefore tourist number in the Hong Kong column was the tourists from Hong Kong, Macao, and
Taiwan.
Sources: City Statistical Yearbook 2017 for each of the 9 PRD cities.
Education Links in the GBA
There are a number of educational links between jurisdictions in the GBA. Several Hong Kong
educational institutions have initiatives in the Guangdong portion of the GBA, several with Chinese
Mainland partners. United International College, situated in Zhuhai and jointly founded by Beijing
Normal University and Hong Kong Baptist University (HKBU) in 2005, was the first full-scale
cooperation in higher education between institutions from the Chinese Mainland and Hong Kong.36
The University of Hong Kong opened a Joint Laboratory for Brain Function and Health (BFAH), with
Jinan University in Guangzhou in 2008.37 It also opened the University of Hong Kong Shenzhen
Institute of Research and Innovation (HKU-SIRI) in March 201138 and the University of Hong Kong-
Shenzhen Hospital in 2012.39
The Hong Kong University of Science and Technology (HKUST) opened its Fok Ying Tung Research
Institute in Nanshan, Guangzhou in 2007. The Institute focuses on the Internet of Things, Advanced
Materials, Advanced Manufacture and Automation, Environment and Sustainable Development.40
36 United College International, “About UIC,” 9 March 2017. 37 Jinan University, “Jinan University - Hong Kong University Brain Function and Health Joint Laboratory Unveiled,” 11 November 2009. 38 University of Hong Kong Shenzhen Institute of Research and Innovation, “Introduction,” 2018. 39 University of Hong Kong Shenzhen Hospital, “Introduction,” 2018. 40 HKUST Fok Ying Tung Research Institute, “Background,” 2018.
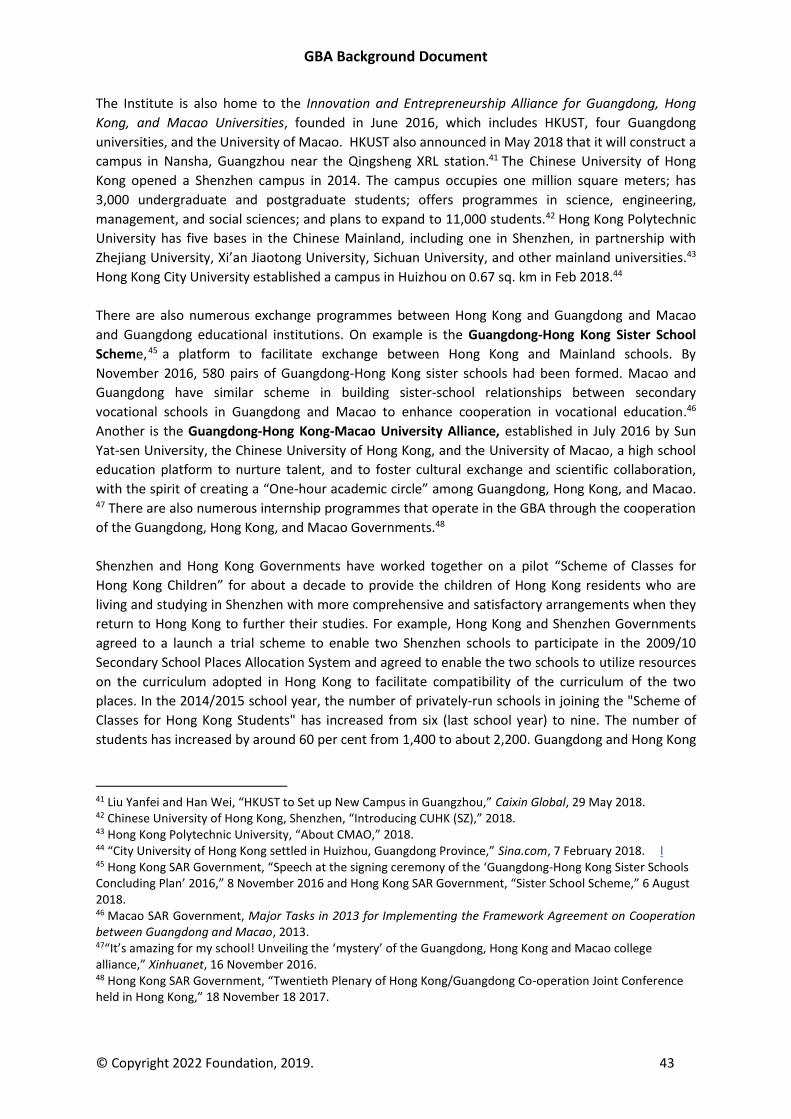
GBA Background Document
© Copyright 2022 Foundation, 2019. 43
The Institute is also home to the Innovation and Entrepreneurship Alliance for Guangdong, Hong
Kong, and Macao Universities, founded in June 2016, which includes HKUST, four Guangdong
universities, and the University of Macao. HKUST also announced in May 2018 that it will construct a
campus in Nansha, Guangzhou near the Qingsheng XRL station.41 The Chinese University of Hong
Kong opened a Shenzhen campus in 2014. The campus occupies one million square meters; has
3,000 undergraduate and postgraduate students; offers programmes in science, engineering,
management, and social sciences; and plans to expand to 11,000 students.42 Hong Kong Polytechnic
University has five bases in the Chinese Mainland, including one in Shenzhen, in partnership with
Zhejiang University, Xi’an Jiaotong University, Sichuan University, and other mainland universities.43
Hong Kong City University established a campus in Huizhou on 0.67 sq. km in Feb 2018.44
There are also numerous exchange programmes between Hong Kong and Guangdong and Macao
and Guangdong educational institutions. On example is the Guangdong-Hong Kong Sister School
Scheme,45 a platform to facilitate exchange between Hong Kong and Mainland schools. By
November 2016, 580 pairs of Guangdong-Hong Kong sister schools had been formed. Macao and
Guangdong have similar scheme in building sister-school relationships between secondary
vocational schools in Guangdong and Macao to enhance cooperation in vocational education.46
Another is the Guangdong-Hong Kong-Macao University Alliance, established in July 2016 by Sun
Yat-sen University, the Chinese University of Hong Kong, and the University of Macao, a high school
education platform to nurture talent, and to foster cultural exchange and scientific collaboration,
with the spirit of creating a “One-hour academic circle” among Guangdong, Hong Kong, and Macao.
47 There are also numerous internship programmes that operate in the GBA through the cooperation
of the Guangdong, Hong Kong, and Macao Governments.48
Shenzhen and Hong Kong Governments have worked together on a pilot “Scheme of Classes for
Hong Kong Children” for about a decade to provide the children of Hong Kong residents who are
living and studying in Shenzhen with more comprehensive and satisfactory arrangements when they
return to Hong Kong to further their studies. For example, Hong Kong and Shenzhen Governments
agreed to a launch a trial scheme to enable two Shenzhen schools to participate in the 2009/10
Secondary School Places Allocation System and agreed to enable the two schools to utilize resources
on the curriculum adopted in Hong Kong to facilitate compatibility of the curriculum of the two
places. In the 2014/2015 school year, the number of privately-run schools in joining the "Scheme of
Classes for Hong Kong Students" has increased from six (last school year) to nine. The number of
students has increased by around 60 per cent from 1,400 to about 2,200. Guangdong and Hong Kong
41 Liu Yanfei and Han Wei, “HKUST to Set up New Campus in Guangzhou,” Caixin Global, 29 May 2018. 42 Chinese University of Hong Kong, Shenzhen, “Introducing CUHK (SZ),” 2018. 43 Hong Kong Polytechnic University, “About CMAO,” 2018. 44 “City University of Hong Kong settled in Huizhou, Guangdong Province,” Sina.com, 7 February 2018. l 45 Hong Kong SAR Government, “Speech at the signing ceremony of the ‘Guangdong-Hong Kong Sister Schools Concluding Plan’ 2016,” 8 November 2016 and Hong Kong SAR Government, “Sister School Scheme,” 6 August 2018. 46 Macao SAR Government, Major Tasks in 2013 for Implementing the Framework Agreement on Cooperation between Guangdong and Macao, 2013. 47“It’s amazing for my school! Unveiling the ‘mystery’ of the Guangdong, Hong Kong and Macao college alliance,” Xinhuanet, 16 November 2016. 48 Hong Kong SAR Government, “Twentieth Plenary of Hong Kong/Guangdong Co-operation Joint Conference held in Hong Kong,” 18 November 18 2017.
GBA Background Document
© Copyright 2022 Foundation, 2019. 44
Governments also kept working on facilitating the transportation arrangements for cross-boundary
students (CBS), including increasing the special quota for cross-boundary school coaches (CBSC).49
Shenzhen is also the first city that allows Hong Kong children to apply, through a points system, for
free education in public schools. These children are treated equally as local students. According to
the information provided by the Hong Kong and Macao Affairs Office of the People's Government of
Guangdong Province, Hong Kong children in Guangzhou, Zhuhai, Dongguan and Zhongshan, etc. may
also apply for admission to public schools through a points system, in that their parents' length of
residence, taxation, employer, and so forth are considered.50
Macao and Guangdong Government have commenced the pilot scheme for subsidizing Macao
citizens paying school fees for kindergarten, primary and secondary education in Guangdong.51
Guangdong Province allowed certain qualified vocational and technical institutions of Guangdong to
enroll Hong Kong students through assessment and admission arrangements operated by the
institutions independently. 52
Both Hong Kong and Macao Governments have arranged internship programmes with Guangdong.
Hong Kong and Guangdong organized the Guangdong-Hong Kong Internship Programme in June
2015 whereby internship places in areas covering information technology, marketing, personnel
management, engineering, accounting and law were offered by enterprises and departments in
Guangdong Province to youths in Hong Kong. Over 530 young people have taken up internships in
Guangdong under this Programme. Continuous efforts will be made by the two places to improve
arrangements for next year's Programme to provide a wider diversity of internship places to the
youths in Hong Kong. On voluntary services, over 350 tertiary students from Hong Kong and
Guangdong took part in a seven-day voluntary service program on a matching basis in four
Guangdong municipalities in July 2015 to provide services in areas including teaching assistance,
cultural promotion, agricultural science and technology, environmental science and medical care. 53
In 2017-2018, the Home Affairs Bureau of Hong Kong SAR Government has provided funding of
around $91 million through the Funding Scheme for Youth Internship in the Mainland to support
some 120 youth internship projects in the Mainland. It is expected that about 3,500 Hong Kong
young people can benefit from the scheme, including some 1,100 undertaking internships in
Guangdong Province, which accounts for the biggest share among all provinces/cities of the country.
The Hong Kong SAR Government has set up the Youth Development Fund to support young people
to start their own businesses and they may do so in Guangdong Province or other provinces/cities in
the Mainland.54
49 Hong Kong SAR Government, Press releases for the Plenaries of Hong Kong/Guangdong Co-operation Joint Conference in various years. 50 Hong Kong SAR Government, “Greater Bay Area Opportunities, Education,” 2018. 51 Macao SAR Government, Major Tasks for 2013 within the implementation of the Framework Agreement on Cooperation Between Guangdong and Macao, 2013. 52 Hong Kong SAR Government, “Fifteenth Plenary of Hong Kong/Guangdong Co-operation Joint Conference held in Guangzhou,” 14 September 2012. 53 Hong Kong SAR Government, “Eighteenth Plenary of Hong Kong/Guangdong Co-operation Joint Conference held in Hong Kong,” 9 September 2015. 54 Hong Kong SAR Government, “Twentieth Plenary of Hong Kong/Guangdong Co-operation Joint Conference held in Hong Kong,” 18 November 2017.
GBA Background Document
© Copyright 2022 Foundation, 2019. 45
Cultural and Creative Exchange
There are many examples of cultural and creative exchanges in the GBA. The bureau/department
responsible for culture of Hong Kong and Guangdong signed the Guangdong-Hong Kong Cultural
Exchange and Co-operation Development Plan 2014-2018 in 2014. The Plan covers co-operation in
areas including the nurturing and exchanges of artists, collaboration in artistic branding and the
development of Internet culture, etc., in the next five years.55 Since 2009, the Department of Culture
of Guangdong Province, the Tertiary Education Services Office of the Macao Special Administrative
Region, and the Home Affairs Bureau of the Hong Kong Special Administrative Region jointly
organized the Guangdong-Hong Kong-Macao Youth Cultural Exchange Programme. Over a thousand
of young people have participated in the Programme.56 A Co-operation Agreement between
Guangdong and Hong Kong on Promoting and Deepening the Development of Film Industries was
signed in September 2013 to encourage the film industries of Guangdong and Hong Kong to deepen
cooperation, establish a communication mechanism and information exchange channel, and
organize activities to facilitate investment, cooperation, and exchange among the respective film
industries, including film exhibition weeks, film exchange visits, film production investment, and film
trade fairs. An Agreement between the HKSAR Government and the Shenzhen Municipal People’s
Government on Promoting Co-operation in Creative Industries was signed in February 2016 to
strengthen exchange in design, architecture, and other creative sectors through a variety of
promotional activities. The Zetta Bridge Qianhai Hong Kong-Shenzhen Design Innovation Hub project
is expected to open in the first quarter of 2019. It will become an exchange platform to boost further
collaborations between Shenzhen and Hong Kong in design. 57 From July 2012 to December 2016, the
Hong Kong Arts Development Fund provided funding (a total grant of over HKD 6 million) to support
60 cultural exchange projects on the Mainland. The Hong Kong Arts Development Council has also
provided funding (a total grant of over HKD 12 million) to 74 projects. Both were largely focused on
Guangdong.58
Key achievements of cultural co-operation among Guangdong, Hong Kong, and Macao also include
jointly promoting the development of Cantonese opera, the development of a Regional Museum
Pass to encourage pass holders to visit the museums in the three places; and the development of a
mobile application that maps cultural information in the Greater Pearl River Delta, to enable users to
browse cultural information of Guangdong, Hong Kong and Macao with ease. The 7th Guangdong-
Hong Kong-Macao Youth Cultural Exchange was held in July 2015 and attracted a total of 123 youths
from the three places.59
55 Hong Kong SAR Government, “Seventeenth Plenary of Hong Kong/Guangdong Co-operation Joint Conference held in Guangzhou,” 6 November 2014. 56 Hong Kong Youth Development Commission, “Guangdong-Hong Kong-Macao Youth Cultural Exchange Programme,” 2018. 57 Hong Kong SAR Government, “Greater Bay Area Opportunities, Education,” 2018. 58 Government of the Hong Kong SAR, Progress Made by the Current-term Government on Mainland Co-operation, 2017. 59 Hong Kong SAR Government, “Eighteenth Plenary of Hong Kong/Guangdong Co-operation Joint Conference held in Hong Kong,” 9 September 2015.
GBA Background Document
© Copyright 2022 Foundation, 2019. 46
3. The GBA’s Transportation Connectivity
Transportation connectivity between the GBA and the rest of the world and within the GBA are
critical to the region’s economic future. Here we can distinguish between the region’s international
links through its air and sea networks; its links to the rest of China through its air, rail, sea, and road
networks; the links between Guangdong, Hong Kong, and Macao; and the links within Guangdong
Province.
The GBA’s transportation links have been shaped by the region’s unique history. Before the 1980s,
the main links between the region and the rest of the world were through Hong Kong and Macao, as
the economy and society of the Chinese Mainland were largely closed to the rest of the world.
Transportation links between Guangdong and both Hong Kong and Macao were limited for the same
reason. In addition, the international transportation system of Guangdong Province, including the
Guangdong portions of the GBA, were relatively underdeveloped given the relatively backward
status of Guangdong compared to other parts of the Chinese Mainland.
The economic reform policies initiated by Deng Xiaoping in 1979 and further expanded by
subsequent Chinese leaders set in motion the economic transition of the Chinese mainland from
highly regulated socialist command economy to a mixed model of socialist and private ownership.
The reform policies also created changes in the transportation links between Guangdong, Hong
Kong, and Macao, and within Guangdong. In 1979, train services between Hong Kong and
Guangzhou resumed, with crossing at the Lo Wu Border Control Point, while the Man Kam To
Control Point serviced vehicle and foot traffic. Originally Macao was separated from the mainland by
narrow shallow straits but through a process of gradual reclamation the northern shore of the main
island of Macao joined with the mainland to form what is now known as the Macao Peninsula. This
was the only land route connecting Macao with the mainland. Similar to Hong Kong, this border was
virtually closed to the start of the reform policies, and then was gradually opened. The current land
border is served by the Portas do Cerco Control Point.
As the economic interaction between Guangdong, Hong Kong, and Macao grew, so did the demand
for transportation infrastructure, especially related to export trade. Highways were built to connect
new industrial estates with ports and major cities. Rail lines were built to serve increased passenger
and cargo flows. The ports of Hong Kong and Guangzhou were expanded and new ports were
developed in Shenzhen, Zhuhai, and other cities in the GBA. New airports were constructed in Hong
Kong, Guangzhou, Shenzhen, and other cities to handle increased domestic and international traffic.
As the cities of the region continued to develop, metro systems and urban road systems were built
to serve much larger populations. These, in turn, were linked with denser systems of railways and
highways.
Current developments in the region are creating unprecedented connectivity to the rest of the
world; to the rest of China; between Guangdong, Hong Kong, and Macao; and between the cities of
Guangdong. The result will be a much more closely integrated region from a transportation
standpoint that is also much more integrated with the rest of China and the rest of the world.
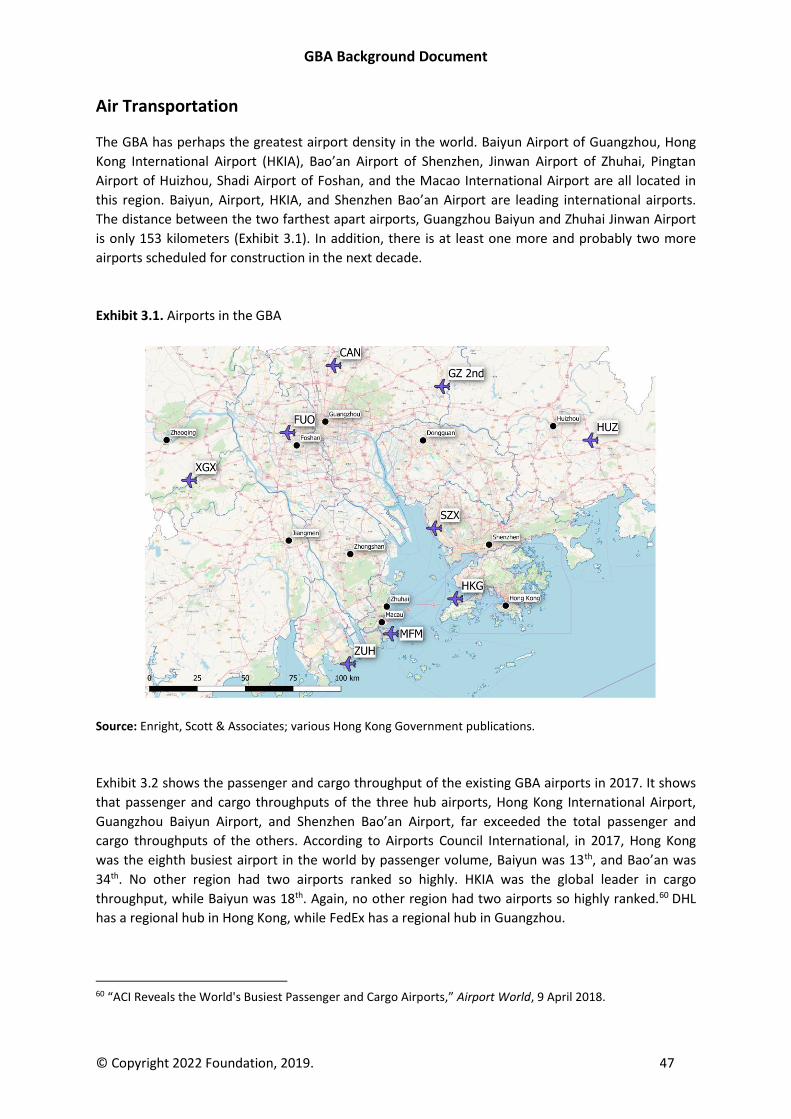
GBA Background Document
© Copyright 2022 Foundation, 2019. 47
Air Transportation
The GBA has perhaps the greatest airport density in the world. Baiyun Airport of Guangzhou, Hong
Kong International Airport (HKIA), Bao’an Airport of Shenzhen, Jinwan Airport of Zhuhai, Pingtan
Airport of Huizhou, Shadi Airport of Foshan, and the Macao International Airport are all located in
this region. Baiyun, Airport, HKIA, and Shenzhen Bao’an Airport are leading international airports.
The distance between the two farthest apart airports, Guangzhou Baiyun and Zhuhai Jinwan Airport
is only 153 kilometers (Exhibit 3.1). In addition, there is at least one more and probably two more
airports scheduled for construction in the next decade.
Exhibit 3.1. Airports in the GBA
Source: Enright, Scott & Associates; various Hong Kong Government publications.
Exhibit 3.2 shows the passenger and cargo throughput of the existing GBA airports in 2017. It shows
that passenger and cargo throughputs of the three hub airports, Hong Kong International Airport,
Guangzhou Baiyun Airport, and Shenzhen Bao’an Airport, far exceeded the total passenger and
cargo throughputs of the others. According to Airports Council International, in 2017, Hong Kong
was the eighth busiest airport in the world by passenger volume, Baiyun was 13th, and Bao’an was
34th. No other region had two airports ranked so highly. HKIA was the global leader in cargo
throughput, while Baiyun was 18th. Again, no other region had two airports so highly ranked.60 DHL
has a regional hub in Hong Kong, while FedEx has a regional hub in Guangzhou.
60 “ACI Reveals the World's Busiest Passenger and Cargo Airports,” Airport World, 9 April 2018.
GBA Background Document
© Copyright 2022 Foundation, 2019. 48
The region’s airports give the GBA excellent connectivity to the rest of the world. As of 2018, HKIA
served 120 airlines serving 220 destinations, including 50 in China. Baiyun served 80 airlines serving
160 destinations, including 90 in China. Bao’an Airport served 152 destinations, including 114 in
China. HKIA is building a third runway. Baiyun recently opened a new terminal and plans a third
terminal along with a fourth and fifth runway. Both airports expect to see capacity reach 100 million
passengers over the next several years, while Shenzhen’s airport will expand to capacity of well over
50 million per year. Meanwhile, a new airport is planned for Foshan that will have an estimated
capacity of 30 million passengers and Guangzhou has announced plans for a second airport in that
city to supplement Baiyun.
Guangdong Province plans to build a world-class airport cluster in the PRD Area by designating the
positions of the key airports in the area:
Guangzhou Baiyun International Airport is positioned as an international aviation hub. It will
construct the international aviation passenger and freight transportation network that covers the
whole world, with the focus on international transport corridors connecting such regions as Europe,
the U.S., Australia, Africa, and South America.
Shenzhen Bao’an International Airport will strengthen its functions of regional aviation hub airport.
The construction of international aviation hub will also be accelerated. Annual passenger throughput
of the Airport will reach 45 million person-times by 2020.
Pearl River Delta Xinganxian Airport is a new airport planned in Foshan. It will be developed into an
international aviation hub, juxtaposed with Guangzhou Baiyun International Airport, to mainly serve
the central and west areas of the Pearl River Delta and the surrounding regions. It will develop both
the domestic and international aviation passenger and freight transport.
Zhuhai Jinwan Airport is positioned as a compound international main line airport, serving the west
bank of the Pearl River and the surrounding regions. It will primarily develop passenger transport
and freight transport airline networks within China and to the Southeast Asia.
Huizhou Airport is a trunk airport mainly serve Huizhou, Shanwei, Heyuan, and the east regions of
Shenzhen.
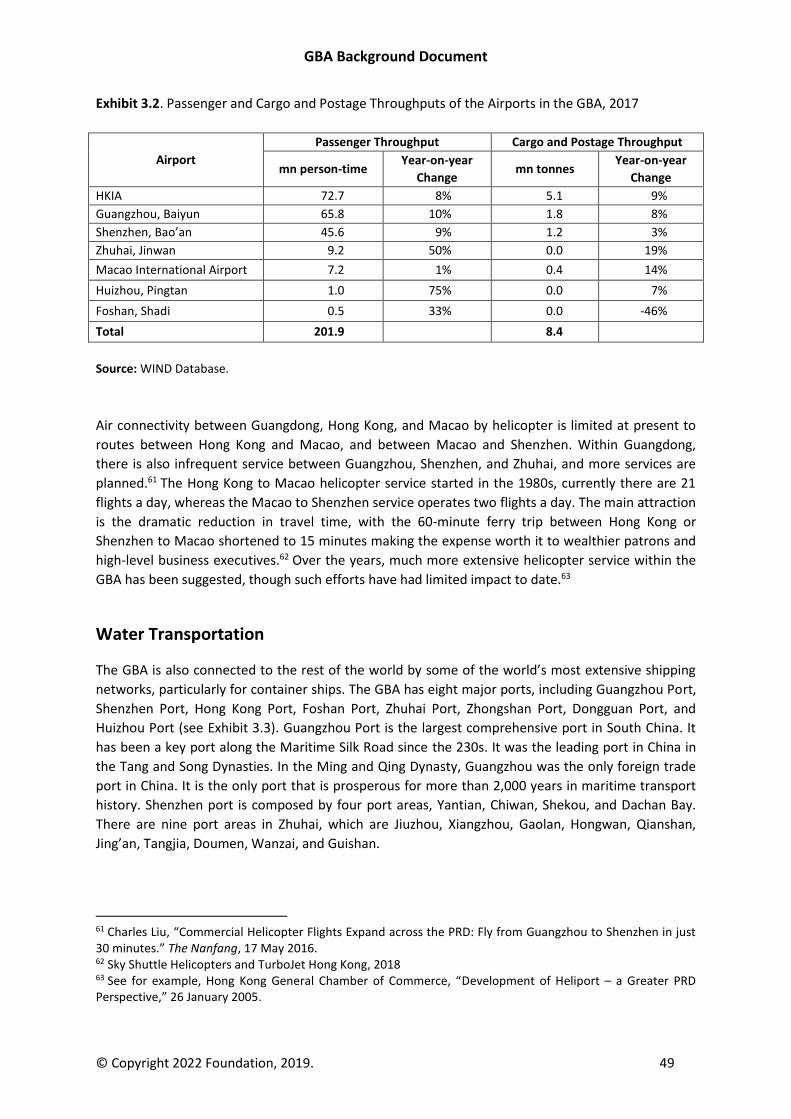
GBA Background Document
© Copyright 2022 Foundation, 2019. 49
Exhibit 3.2. Passenger and Cargo and Postage Throughputs of the Airports in the GBA, 2017
Airport
Passenger Throughput Cargo and Postage Throughput
mn person-time Year-on-year
Change mn tonnes
Year-on-year
Change
HKIA 72.7 8% 5.1 9%
Guangzhou, Baiyun 65.8 10% 1.8 8%
Shenzhen, Bao’an 45.6 9% 1.2 3%
Zhuhai, Jinwan 9.2 50% 0.0 19%
Macao International Airport 7.2 1% 0.4 14%
Huizhou, Pingtan 1.0 75% 0.0 7%
Foshan, Shadi 0.5 33% 0.0 -46%
Total 201.9 8.4
Source: WIND Database.
Air connectivity between Guangdong, Hong Kong, and Macao by helicopter is limited at present to
routes between Hong Kong and Macao, and between Macao and Shenzhen. Within Guangdong,
there is also infrequent service between Guangzhou, Shenzhen, and Zhuhai, and more services are
planned.61 The Hong Kong to Macao helicopter service started in the 1980s, currently there are 21
flights a day, whereas the Macao to Shenzhen service operates two flights a day. The main attraction
is the dramatic reduction in travel time, with the 60-minute ferry trip between Hong Kong or
Shenzhen to Macao shortened to 15 minutes making the expense worth it to wealthier patrons and
high-level business executives.62 Over the years, much more extensive helicopter service within the
GBA has been suggested, though such efforts have had limited impact to date.63
Water Transportation
The GBA is also connected to the rest of the world by some of the world’s most extensive shipping
networks, particularly for container ships. The GBA has eight major ports, including Guangzhou Port,
Shenzhen Port, Hong Kong Port, Foshan Port, Zhuhai Port, Zhongshan Port, Dongguan Port, and
Huizhou Port (see Exhibit 3.3). Guangzhou Port is the largest comprehensive port in South China. It
has been a key port along the Maritime Silk Road since the 230s. It was the leading port in China in
the Tang and Song Dynasties. In the Ming and Qing Dynasty, Guangzhou was the only foreign trade
port in China. It is the only port that is prosperous for more than 2,000 years in maritime transport
history. Shenzhen port is composed by four port areas, Yantian, Chiwan, Shekou, and Dachan Bay.
There are nine port areas in Zhuhai, which are Jiuzhou, Xiangzhou, Gaolan, Hongwan, Qianshan,
Jing’an, Tangjia, Doumen, Wanzai, and Guishan.
61 Charles Liu, “Commercial Helicopter Flights Expand across the PRD: Fly from Guangzhou to Shenzhen in just 30 minutes.” The Nanfang, 17 May 2016. 62 Sky Shuttle Helicopters and TurboJet Hong Kong, 2018 63 See for example, Hong Kong General Chamber of Commerce, “Development of Heliport – a Greater PRD Perspective,” 26 January 2005.
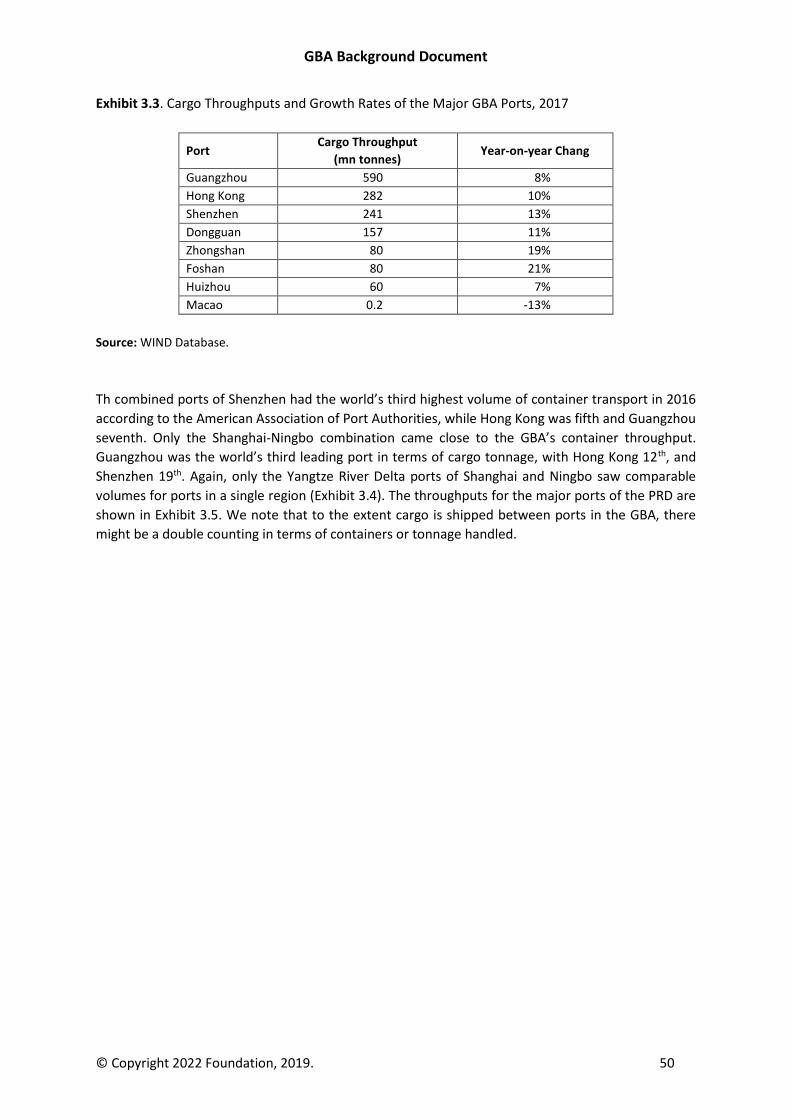
GBA Background Document
© Copyright 2022 Foundation, 2019. 50
Exhibit 3.3. Cargo Throughputs and Growth Rates of the Major GBA Ports, 2017
Port Cargo Throughput
(mn tonnes) Year-on-year Chang
Guangzhou 590 8%
Hong Kong 282 10%
Shenzhen 241 13%
Dongguan 157 11%
Zhongshan 80 19%
Foshan 80 21%
Huizhou 60 7%
Macao 0.2 -13%
Source: WIND Database.
Th combined ports of Shenzhen had the world’s third highest volume of container transport in 2016
according to the American Association of Port Authorities, while Hong Kong was fifth and Guangzhou
seventh. Only the Shanghai-Ningbo combination came close to the GBA’s container throughput.
Guangzhou was the world’s third leading port in terms of cargo tonnage, with Hong Kong 12th, and
Shenzhen 19th. Again, only the Yangtze River Delta ports of Shanghai and Ningbo saw comparable
volumes for ports in a single region (Exhibit 3.4). The throughputs for the major ports of the PRD are
shown in Exhibit 3.5. We note that to the extent cargo is shipped between ports in the GBA, there
might be a double counting in terms of containers or tonnage handled.
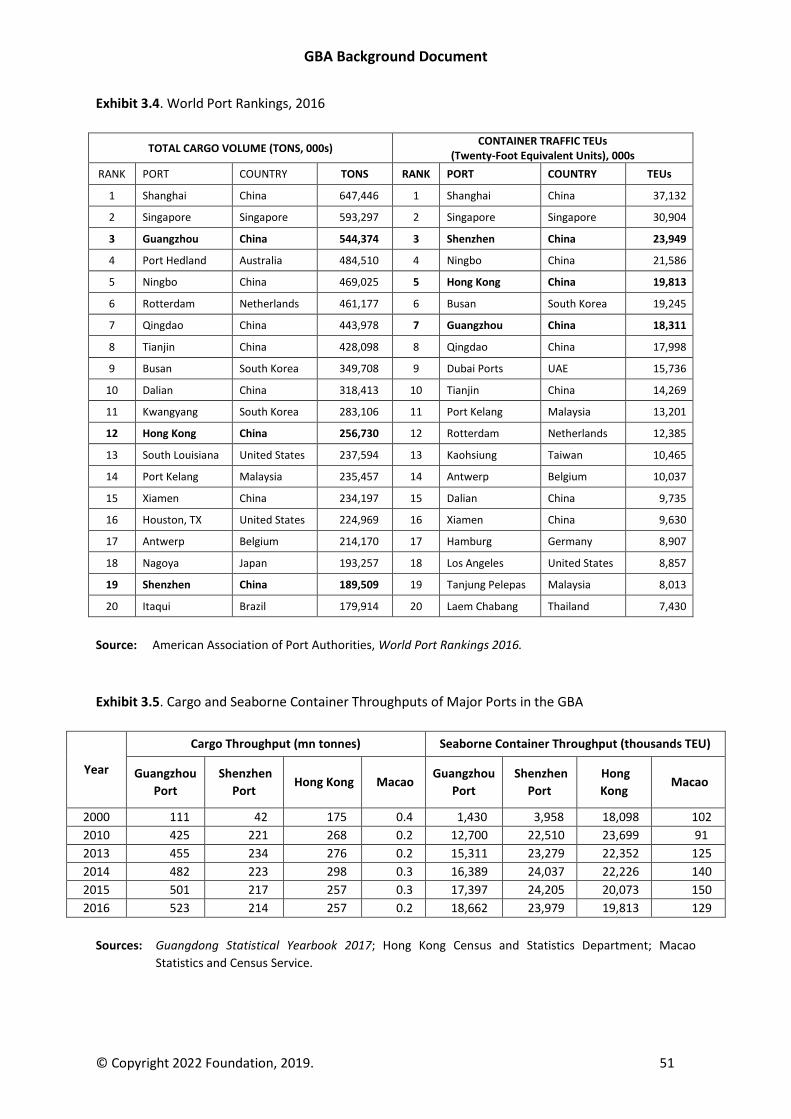
GBA Background Document
© Copyright 2022 Foundation, 2019. 51
Exhibit 3.4. World Port Rankings, 2016
TOTAL CARGO VOLUME (TONS, 000s) CONTAINER TRAFFIC TEUs
(Twenty-Foot Equivalent Units), 000s
RANK PORT COUNTRY TONS RANK PORT COUNTRY TEUs
1 Shanghai China 647,446 1 Shanghai China 37,132
2 Singapore Singapore 593,297 2 Singapore Singapore 30,904
3 Guangzhou China 544,374 3 Shenzhen China 23,949
4 Port Hedland Australia 484,510 4 Ningbo China 21,586
5 Ningbo China 469,025 5 Hong Kong China 19,813
6 Rotterdam Netherlands 461,177 6 Busan South Korea 19,245
7 Qingdao China 443,978 7 Guangzhou China 18,311
8 Tianjin China 428,098 8 Qingdao China 17,998
9 Busan South Korea 349,708 9 Dubai Ports UAE 15,736
10 Dalian China 318,413 10 Tianjin China 14,269
11 Kwangyang South Korea 283,106 11 Port Kelang Malaysia 13,201
12 Hong Kong China 256,730 12 Rotterdam Netherlands 12,385
13 South Louisiana United States 237,594 13 Kaohsiung Taiwan 10,465
14 Port Kelang Malaysia 235,457 14 Antwerp Belgium 10,037
15 Xiamen China 234,197 15 Dalian China 9,735
16 Houston, TX United States 224,969 16 Xiamen China 9,630
17 Antwerp Belgium 214,170 17 Hamburg Germany 8,907
18 Nagoya Japan 193,257 18 Los Angeles United States 8,857
19 Shenzhen China 189,509 19 Tanjung Pelepas Malaysia 8,013
20 Itaqui Brazil 179,914 20 Laem Chabang Thailand 7,430
Source: American Association of Port Authorities, World Port Rankings 2016.
Exhibit 3.5. Cargo and Seaborne Container Throughputs of Major Ports in the GBA
Year
Cargo Throughput (mn tonnes) Seaborne Container Throughput (thousands TEU)
Guangzhou
Port
Shenzhen
Port Hong Kong Macao
Guangzhou
Port
Shenzhen
Port
Hong
Kong Macao
2000 111 42 175 0.4 1,430 3,958 18,098 102
2010 425 221 268 0.2 12,700 22,510 23,699 91
2013 455 234 276 0.2 15,311 23,279 22,352 125
2014 482 223 298 0.3 16,389 24,037 22,226 140
2015 501 217 257 0.3 17,397 24,205 20,073 150
2016 523 214 257 0.2 18,662 23,979 19,813 129
Sources: Guangdong Statistical Yearbook 2017; Hong Kong Census and Statistics Department; Macao
Statistics and Census Service.
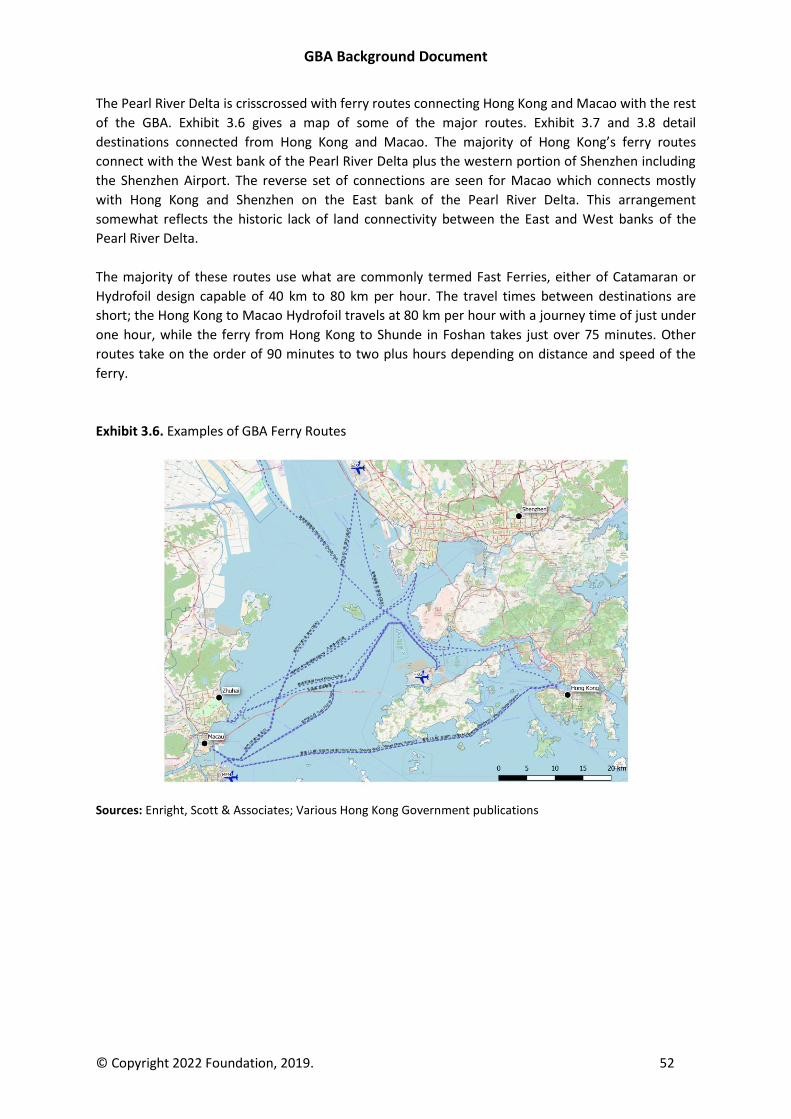
GBA Background Document
© Copyright 2022 Foundation, 2019. 52
The Pearl River Delta is crisscrossed with ferry routes connecting Hong Kong and Macao with the rest
of the GBA. Exhibit 3.6 gives a map of some of the major routes. Exhibit 3.7 and 3.8 detail
destinations connected from Hong Kong and Macao. The majority of Hong Kong’s ferry routes
connect with the West bank of the Pearl River Delta plus the western portion of Shenzhen including
the Shenzhen Airport. The reverse set of connections are seen for Macao which connects mostly
with Hong Kong and Shenzhen on the East bank of the Pearl River Delta. This arrangement
somewhat reflects the historic lack of land connectivity between the East and West banks of the
Pearl River Delta.
The majority of these routes use what are commonly termed Fast Ferries, either of Catamaran or
Hydrofoil design capable of 40 km to 80 km per hour. The travel times between destinations are
short; the Hong Kong to Macao Hydrofoil travels at 80 km per hour with a journey time of just under
one hour, while the ferry from Hong Kong to Shunde in Foshan takes just over 75 minutes. Other
routes take on the order of 90 minutes to two plus hours depending on distance and speed of the
ferry.
Exhibit 3.6. Examples of GBA Ferry Routes
Sources: Enright, Scott & Associates; Various Hong Kong Government publications
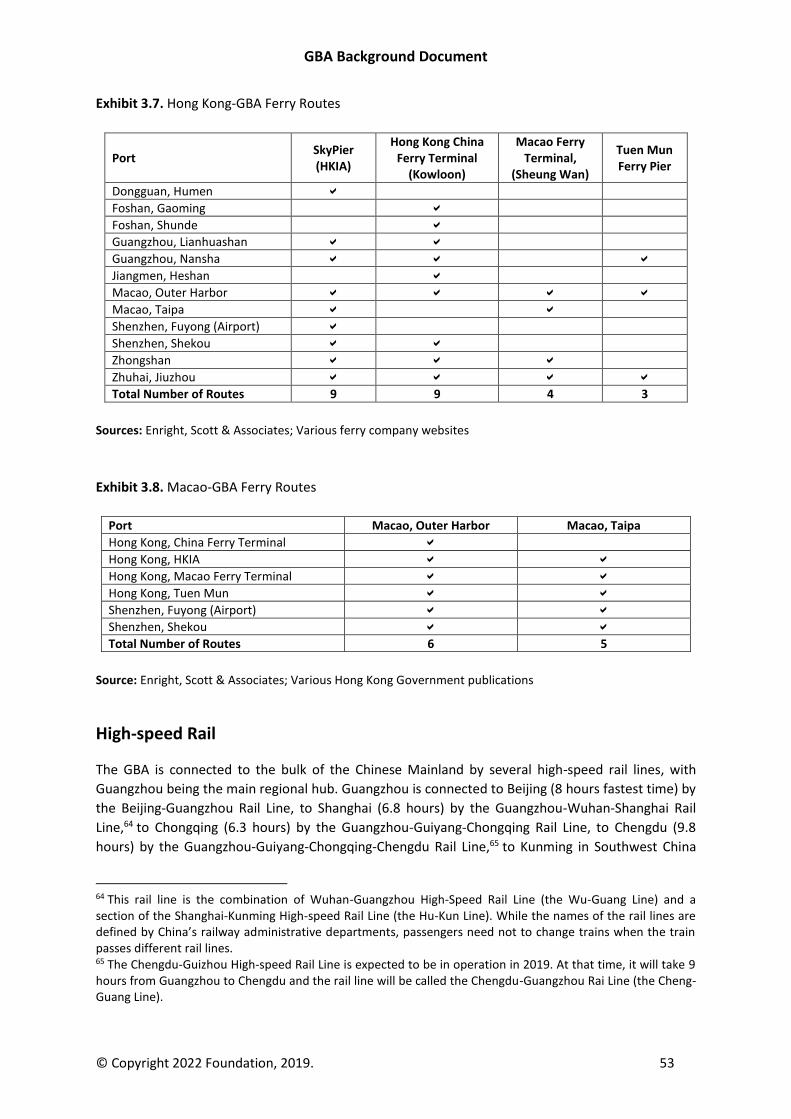
GBA Background Document
© Copyright 2022 Foundation, 2019. 53
Exhibit 3.7. Hong Kong-GBA Ferry Routes
Port SkyPier (HKIA)
Hong Kong China Ferry Terminal
(Kowloon)
Macao Ferry Terminal,
(Sheung Wan)
Tuen Mun Ferry Pier
Dongguan, Humen
Foshan, Gaoming
Foshan, Shunde
Guangzhou, Lianhuashan
Guangzhou, Nansha Jiangmen, Heshan
Macao, Outer Harbor Macao, Taipa
Shenzhen, Fuyong (Airport)
Shenzhen, Shekou
Zhongshan
Zhuhai, Jiuzhou Total Number of Routes 9 9 4 3
Sources: Enright, Scott & Associates; Various ferry company websites
Exhibit 3.8. Macao-GBA Ferry Routes
Port Macao, Outer Harbor Macao, Taipa
Hong Kong, China Ferry Terminal
Hong Kong, HKIA Hong Kong, Macao Ferry Terminal Hong Kong, Tuen Mun Shenzhen, Fuyong (Airport) Shenzhen, Shekou Total Number of Routes 6 5
Source: Enright, Scott & Associates; Various Hong Kong Government publications
High-speed Rail
The GBA is connected to the bulk of the Chinese Mainland by several high-speed rail lines, with
Guangzhou being the main regional hub. Guangzhou is connected to Beijing (8 hours fastest time) by
the Beijing-Guangzhou Rail Line, to Shanghai (6.8 hours) by the Guangzhou-Wuhan-Shanghai Rail
Line,64 to Chongqing (6.3 hours) by the Guangzhou-Guiyang-Chongqing Rail Line, to Chengdu (9.8
hours) by the Guangzhou-Guiyang-Chongqing-Chengdu Rail Line,65 to Kunming in Southwest China
64 This rail line is the combination of Wuhan-Guangzhou High-Speed Rail Line (the Wu-Guang Line) and a section of the Shanghai-Kunming High-speed Rail Line (the Hu-Kun Line). While the names of the rail lines are defined by China’s railway administrative departments, passengers need not to change trains when the train passes different rail lines. 65 The Chengdu-Guizhou High-speed Rail Line is expected to be in operation in 2019. At that time, it will take 9 hours from Guangzhou to Chengdu and the rail line will be called the Chengdu-Guangzhou Rai Line (the Cheng-Guang Line).
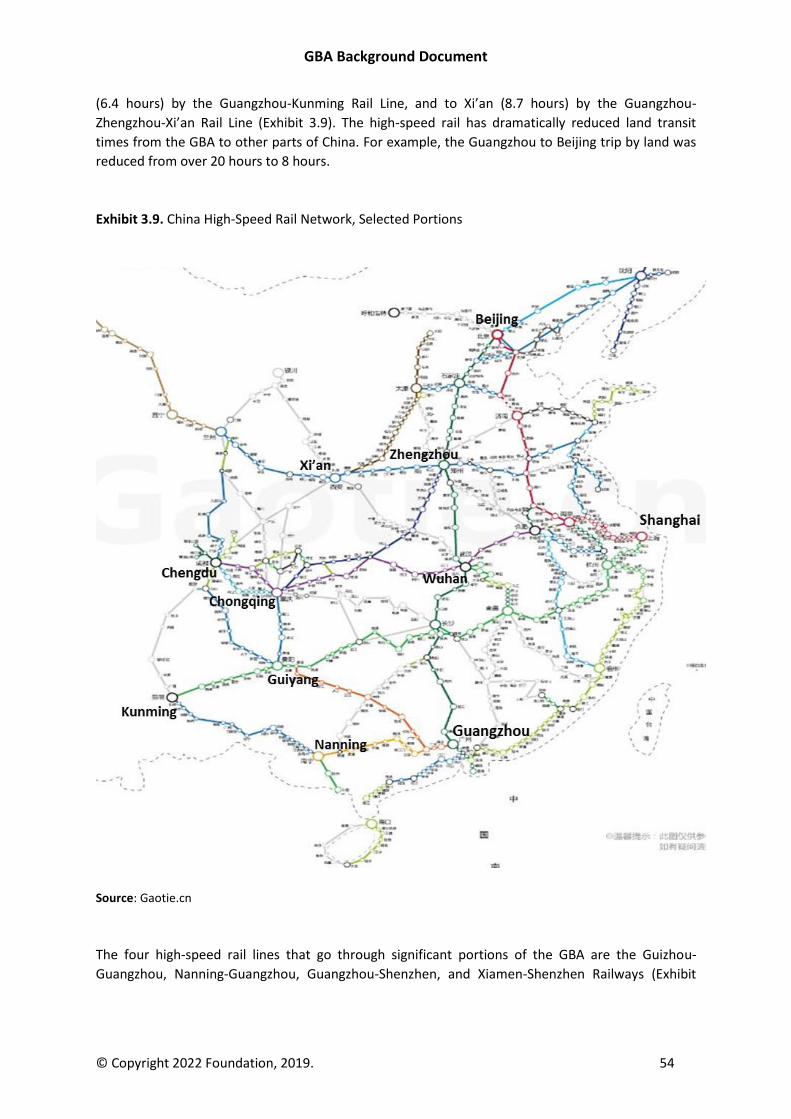
GBA Background Document
© Copyright 2022 Foundation, 2019. 54
(6.4 hours) by the Guangzhou-Kunming Rail Line, and to Xi’an (8.7 hours) by the Guangzhou-
Zhengzhou-Xi’an Rail Line (Exhibit 3.9). The high-speed rail has dramatically reduced land transit
times from the GBA to other parts of China. For example, the Guangzhou to Beijing trip by land was
reduced from over 20 hours to 8 hours.
Exhibit 3.9. China High-Speed Rail Network, Selected Portions
Source: Gaotie.cn
The four high-speed rail lines that go through significant portions of the GBA are the Guizhou-
Guangzhou, Nanning-Guangzhou, Guangzhou-Shenzhen, and Xiamen-Shenzhen Railways (Exhibit
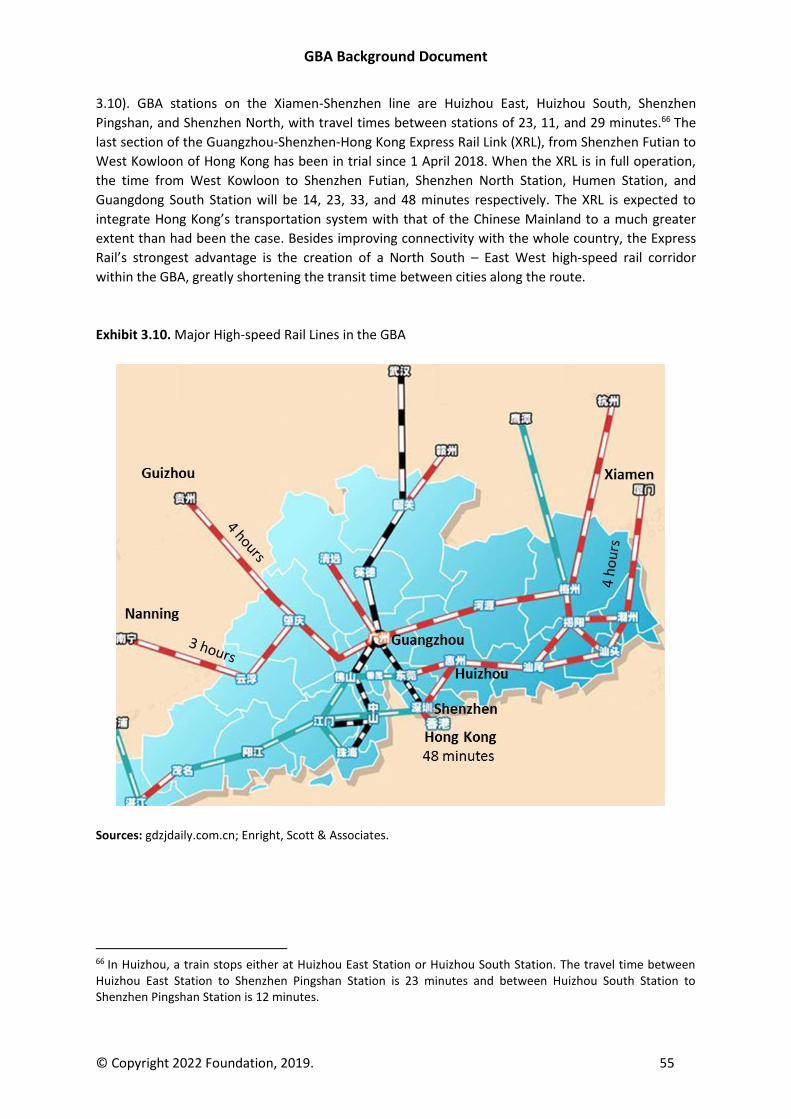
GBA Background Document
© Copyright 2022 Foundation, 2019. 55
3.10). GBA stations on the Xiamen-Shenzhen line are Huizhou East, Huizhou South, Shenzhen
Pingshan, and Shenzhen North, with travel times between stations of 23, 11, and 29 minutes.66 The
last section of the Guangzhou-Shenzhen-Hong Kong Express Rail Link (XRL), from Shenzhen Futian to
West Kowloon of Hong Kong has been in trial since 1 April 2018. When the XRL is in full operation,
the time from West Kowloon to Shenzhen Futian, Shenzhen North Station, Humen Station, and
Guangdong South Station will be 14, 23, 33, and 48 minutes respectively. The XRL is expected to
integrate Hong Kong’s transportation system with that of the Chinese Mainland to a much greater
extent than had been the case. Besides improving connectivity with the whole country, the Express
Rail’s strongest advantage is the creation of a North South – East West high-speed rail corridor
within the GBA, greatly shortening the transit time between cities along the route.
Exhibit 3.10. Major High-speed Rail Lines in the GBA
Sources: gdzjdaily.com.cn; Enright, Scott & Associates.
66 In Huizhou, a train stops either at Huizhou East Station or Huizhou South Station. The travel time between Huizhou East Station to Shenzhen Pingshan Station is 23 minutes and between Huizhou South Station to Shenzhen Pingshan Station is 12 minutes.
GBA Background Document
© Copyright 2022 Foundation, 2019. 56
Inter-city Rail
Inter-city rail lines operate at slower speeds, but greater frequency and with more stops than high-
speed lines. There are four inter-city rail lines currently in operation in the Guangdong portion of the
GBA, the Guangzhou-Zhongshan-Zhuhai, Guangzhou-Zhongshan-Jiangmen, Guangzhou-Foshan-
Zhaoqing, and Dongguan-Huizhou lines (Exhibit 3.11). Guangdong Province is now building an inter-
city rail network centered on Guangzhou, including a ring rail line from Guangzhou to Foshan (127
km of track), a south-north ring rail line from Qingyuan to Shenzhen centered on Guangzhou (382
km), an east-west ring rail line from Zhaoqing to Huizhou (219 km), and branch lines (226 km) to
increase the network’s density and connectivity. The idea is to turn part of China that traditionally
was underserved with inter-city rail to be one of the best-connected parts of the country.
Specifically, the Guangzhou-Foshan ring rail line, which is expected to be fully opened in 2022, will
connect four transportation hubs, i.e., Foshan West Station, Guangzhou South Station, Guangzhou
North Station, and Guangzhou Baiyun International Airport, and will realize rail-air combined
transportation between Guangzhou and Foshan. The Guangzhou-Dongguan-Shenzhen inter-city rail
connects Guangzhou Xintang, Dongguan, and Shenzhen Bao’an International Airport, and passes
through Dongguan (with a reserved extension line to Futian Central District of Shenzhen). The whole
length is 87 km and a total investment of RMB 19.698 billion. After completion, the project will
become an express passage connecting Guangzhou, Dongguan, and Shenzhen. Stations between
Dongguan and Shenzhen include Shatian Station, Houjie Station, Humen Station, Chang’an Station,
and Shenzhen Bao’an International Airport Station, with the whole journey of about 1 hour. Stations
between Guangzhou and Dongguan include Xintang Station, Zhongtang Station, Wangniudun
Station, and Hongmei Station. It is expected to be completed and open to traffic in 2018.
One measure of the development of passenger and cargo flow by rail in the GBA comes from the
annual reports of the Guangshen Railway Co. Ltd. (GSRC). GSRC operates the Guangzhou-Shenzhen
Inter-city Rail, long-haul trains, and the Canton-Kowloon Through Train. 67 The Guangzhou-Shenzhen
railway is strategically located and links with major railway networks in China, including the Beijing-
Guangzhou, Beijing-Kowloon, Sanshui-Maoming, Pinghu-Nantou, and Pinghu-Yantian lines, as well as
to the Kowloon-Canton Railway in Hong Kong. It is an important component of the transportation
network of the southern China, as well as the only railway channel linking Hong Kong with inland
China at present. The Company’s domestically manufactured electric trains with a speed of 200km
per hour named “Concord” (“CRH”) transport most passengers between Guangzhou and Shenzhen.
One pair of CRHs between Guangzhou and Shenzhen are dispatched every 10 minutes on average
during peak hours. Exhibit 3.12 shows that flows of passengers along the Guangzhou-Shenzhen line
and the Canton-Kowloon Through Train grew at rates of 1.2 percent and 3.1 percent per year
respectively from 2009 to 2017, but the freight handled by the company was down 2.1 percent per
year from 2009 to 2017.
67 Guangshen Railway Company Limited is mainly engaged in passenger and freight transportation businesses on the Shenzhen-Guangzhou-Pingshi Railway and certain long-distance passenger transportation services. The Company also cooperates with MTR Corporation Limited (‘MTR’) in operating the Hong Kong Through Train services. Passenger transportation is the principal business of the Company, including Guangzhou-Shenzhen intercity express trains, Hong Kong through trains and long-distance trains. See Guangshen Railway Co. Ltd., Company Profile, 2018.
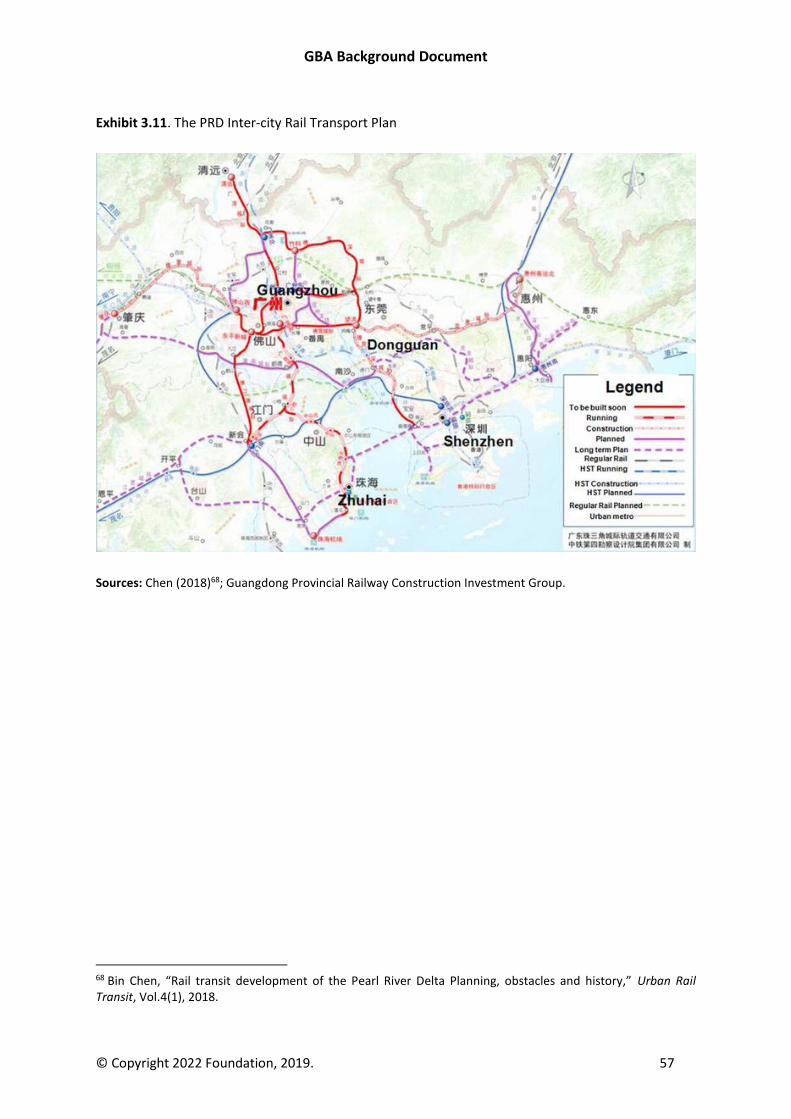
GBA Background Document
© Copyright 2022 Foundation, 2019. 57
Exhibit 3.11. The PRD Inter-city Rail Transport Plan
Sources: Chen (2018)68; Guangdong Provincial Railway Construction Investment Group.
68 Bin Chen, “Rail transit development of the Pearl River Delta Planning, obstacles and history,” Urban Rail Transit, Vol.4(1), 2018.
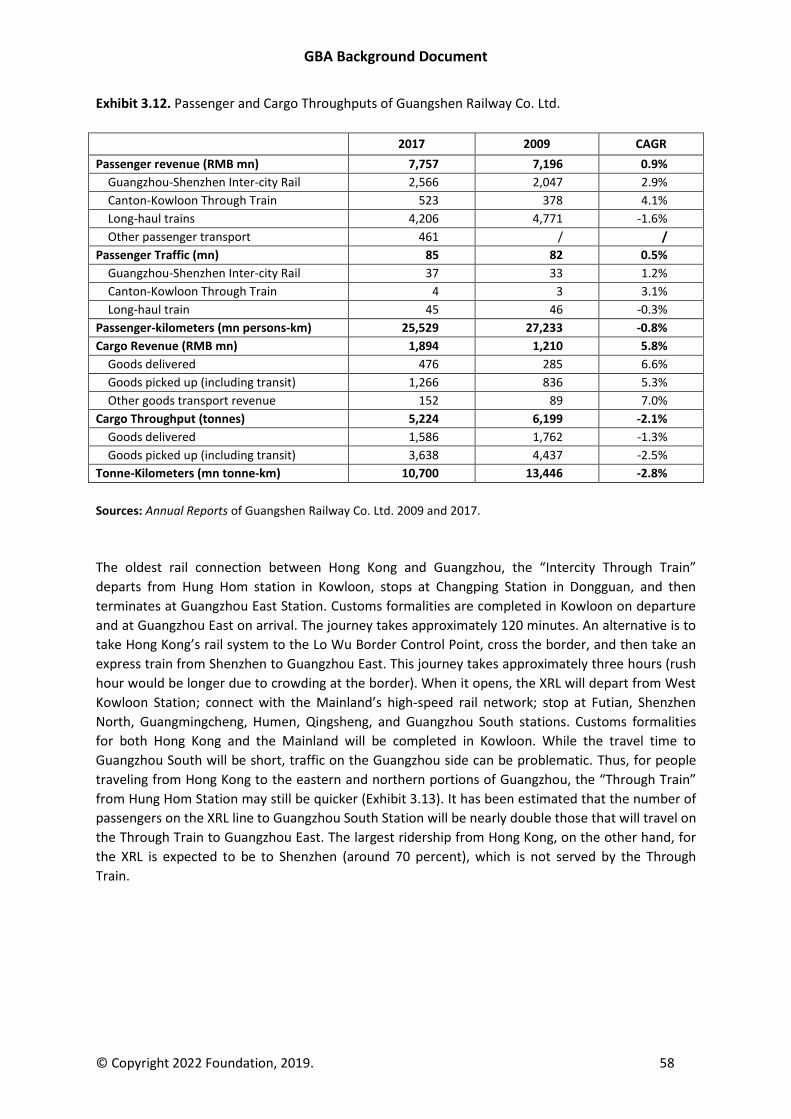
GBA Background Document
© Copyright 2022 Foundation, 2019. 58
Exhibit 3.12. Passenger and Cargo Throughputs of Guangshen Railway Co. Ltd.
2017 2009 CAGR
Passenger revenue (RMB mn) 7,757 7,196 0.9%
Guangzhou-Shenzhen Inter-city Rail 2,566 2,047 2.9%
Canton-Kowloon Through Train 523 378 4.1%
Long-haul trains 4,206 4,771 -1.6%
Other passenger transport 461 / /
Passenger Traffic (mn) 85 82 0.5%
Guangzhou-Shenzhen Inter-city Rail 37 33 1.2%
Canton-Kowloon Through Train 4 3 3.1%
Long-haul train 45 46 -0.3%
Passenger-kilometers (mn persons-km) 25,529 27,233 -0.8%
Cargo Revenue (RMB mn) 1,894 1,210 5.8%
Goods delivered 476 285 6.6%
Goods picked up (including transit) 1,266 836 5.3%
Other goods transport revenue 152 89 7.0%
Cargo Throughput (tonnes) 5,224 6,199 -2.1%
Goods delivered 1,586 1,762 -1.3%
Goods picked up (including transit) 3,638 4,437 -2.5%
Tonne-Kilometers (mn tonne-km) 10,700 13,446 -2.8%
Sources: Annual Reports of Guangshen Railway Co. Ltd. 2009 and 2017.
The oldest rail connection between Hong Kong and Guangzhou, the “Intercity Through Train”
departs from Hung Hom station in Kowloon, stops at Changping Station in Dongguan, and then
terminates at Guangzhou East Station. Customs formalities are completed in Kowloon on departure
and at Guangzhou East on arrival. The journey takes approximately 120 minutes. An alternative is to
take Hong Kong’s rail system to the Lo Wu Border Control Point, cross the border, and then take an
express train from Shenzhen to Guangzhou East. This journey takes approximately three hours (rush
hour would be longer due to crowding at the border). When it opens, the XRL will depart from West
Kowloon Station; connect with the Mainland’s high-speed rail network; stop at Futian, Shenzhen
North, Guangmingcheng, Humen, Qingsheng, and Guangzhou South stations. Customs formalities
for both Hong Kong and the Mainland will be completed in Kowloon. While the travel time to
Guangzhou South will be short, traffic on the Guangzhou side can be problematic. Thus, for people
traveling from Hong Kong to the eastern and northern portions of Guangzhou, the “Through Train”
from Hung Hom Station may still be quicker (Exhibit 3.13). It has been estimated that the number of
passengers on the XRL line to Guangzhou South Station will be nearly double those that will travel on
the Through Train to Guangzhou East. The largest ridership from Hong Kong, on the other hand, for
the XRL is expected to be to Shenzhen (around 70 percent), which is not served by the Through
Train.
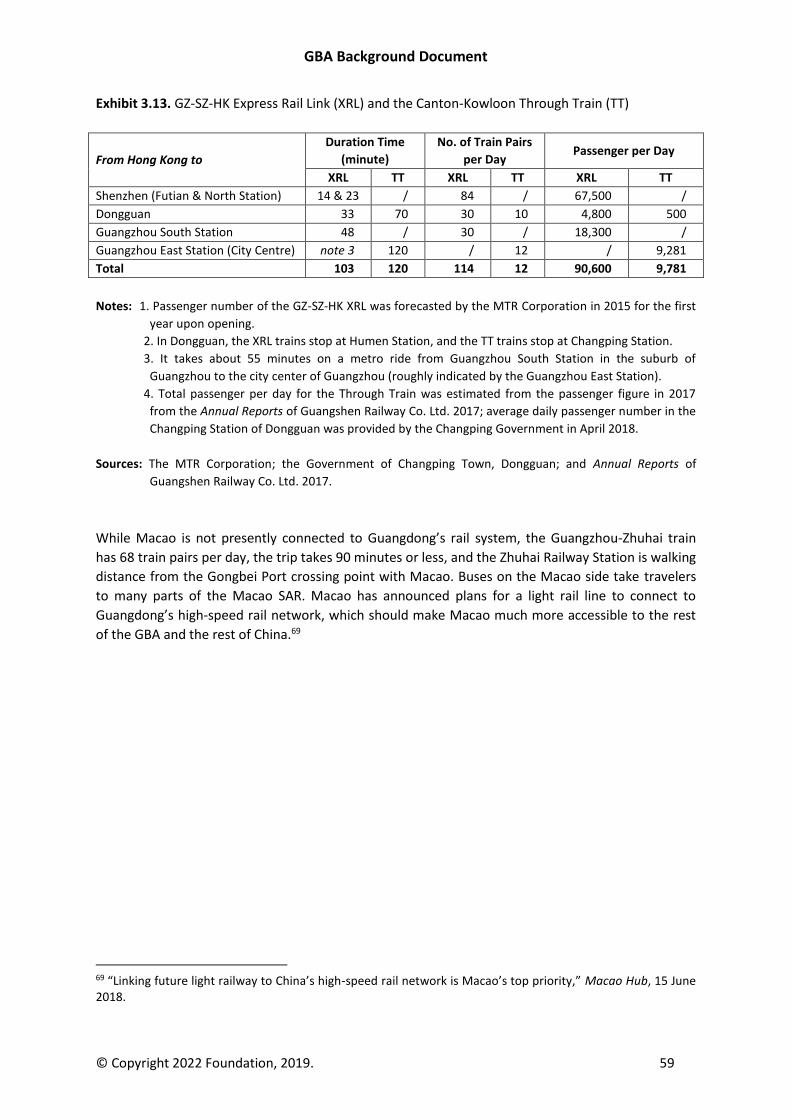
GBA Background Document
© Copyright 2022 Foundation, 2019. 59
Exhibit 3.13. GZ-SZ-HK Express Rail Link (XRL) and the Canton-Kowloon Through Train (TT)
From Hong Kong to
Duration Time
(minute)
No. of Train Pairs
per Day Passenger per Day
XRL TT XRL TT XRL TT
Shenzhen (Futian & North Station) 14 & 23 / 84 / 67,500 /
Dongguan 33 70 30 10 4,800 500
Guangzhou South Station 48 / 30 / 18,300 /
Guangzhou East Station (City Centre) note 3 120 / 12 / 9,281
Total 103 120 114 12 90,600 9,781
Notes: 1. Passenger number of the GZ-SZ-HK XRL was forecasted by the MTR Corporation in 2015 for the first
year upon opening.
2. In Dongguan, the XRL trains stop at Humen Station, and the TT trains stop at Changping Station.
3. It takes about 55 minutes on a metro ride from Guangzhou South Station in the suburb of
Guangzhou to the city center of Guangzhou (roughly indicated by the Guangzhou East Station).
4. Total passenger per day for the Through Train was estimated from the passenger figure in 2017
from the Annual Reports of Guangshen Railway Co. Ltd. 2017; average daily passenger number in the
Changping Station of Dongguan was provided by the Changping Government in April 2018.
Sources: The MTR Corporation; the Government of Changping Town, Dongguan; and Annual Reports of
Guangshen Railway Co. Ltd. 2017.
While Macao is not presently connected to Guangdong’s rail system, the Guangzhou-Zhuhai train
has 68 train pairs per day, the trip takes 90 minutes or less, and the Zhuhai Railway Station is walking
distance from the Gongbei Port crossing point with Macao. Buses on the Macao side take travelers
to many parts of the Macao SAR. Macao has announced plans for a light rail line to connect to
Guangdong’s high-speed rail network, which should make Macao much more accessible to the rest
of the GBA and the rest of China.69
69 “Linking future light railway to China’s high-speed rail network is Macao’s top priority,” Macao Hub, 15 June 2018.
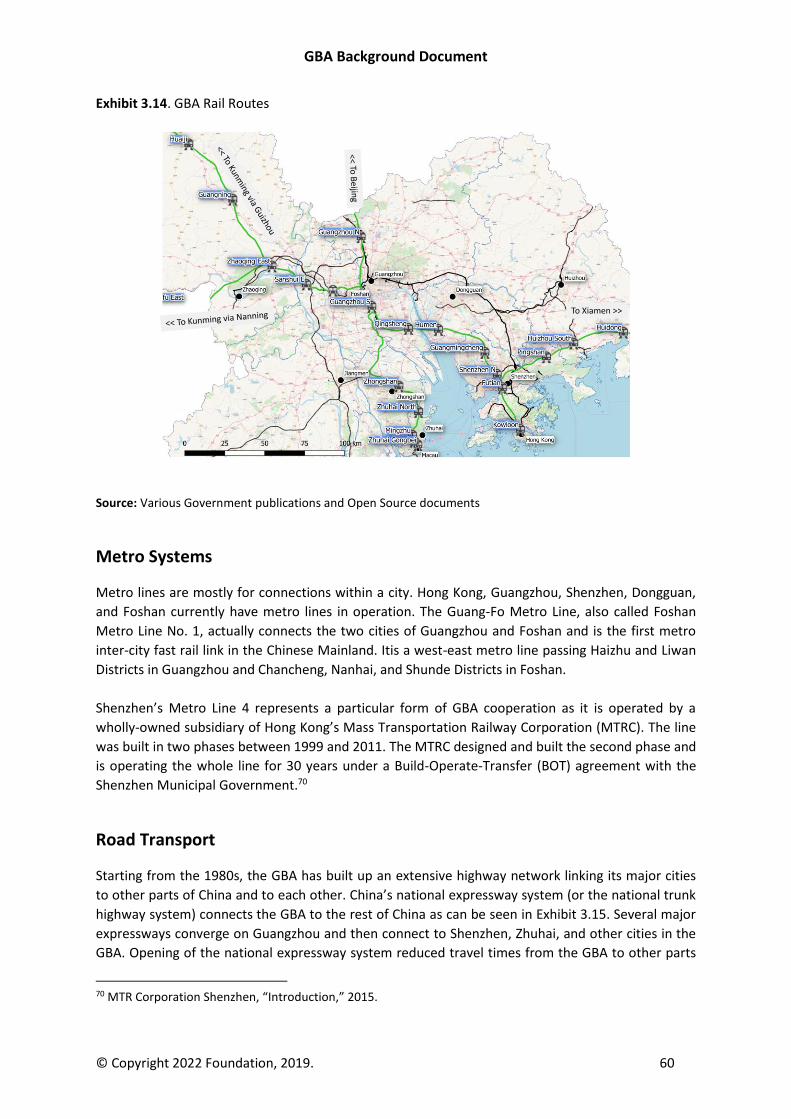
GBA Background Document
© Copyright 2022 Foundation, 2019. 60
Exhibit 3.14. GBA Rail Routes
Source: Various Government publications and Open Source documents
Metro Systems
Metro lines are mostly for connections within a city. Hong Kong, Guangzhou, Shenzhen, Dongguan,
and Foshan currently have metro lines in operation. The Guang-Fo Metro Line, also called Foshan
Metro Line No. 1, actually connects the two cities of Guangzhou and Foshan and is the first metro
inter-city fast rail link in the Chinese Mainland. Itis a west-east metro line passing Haizhu and Liwan
Districts in Guangzhou and Chancheng, Nanhai, and Shunde Districts in Foshan.
Shenzhen’s Metro Line 4 represents a particular form of GBA cooperation as it is operated by a
wholly-owned subsidiary of Hong Kong’s Mass Transportation Railway Corporation (MTRC). The line
was built in two phases between 1999 and 2011. The MTRC designed and built the second phase and
is operating the whole line for 30 years under a Build-Operate-Transfer (BOT) agreement with the
Shenzhen Municipal Government.70
Road Transport
Starting from the 1980s, the GBA has built up an extensive highway network linking its major cities
to other parts of China and to each other. China’s national expressway system (or the national trunk
highway system) connects the GBA to the rest of China as can be seen in Exhibit 3.15. Several major
expressways converge on Guangzhou and then connect to Shenzhen, Zhuhai, and other cities in the
GBA. Opening of the national expressway system reduced travel times from the GBA to other parts
70 MTR Corporation Shenzhen, “Introduction,” 2015.
To Xiamen >>
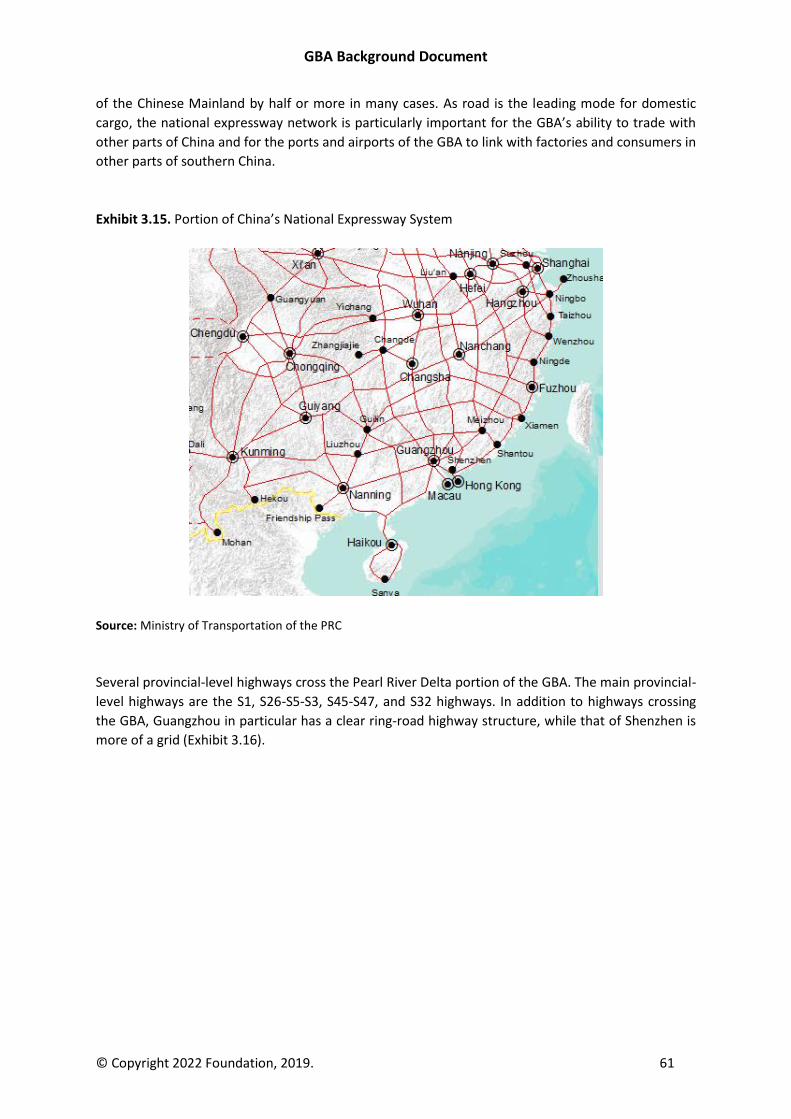
GBA Background Document
© Copyright 2022 Foundation, 2019. 61
of the Chinese Mainland by half or more in many cases. As road is the leading mode for domestic
cargo, the national expressway network is particularly important for the GBA’s ability to trade with
other parts of China and for the ports and airports of the GBA to link with factories and consumers in
other parts of southern China.
Exhibit 3.15. Portion of China’s National Expressway System
Source: Ministry of Transportation of the PRC
Several provincial-level highways cross the Pearl River Delta portion of the GBA. The main provincial-
level highways are the S1, S26-S5-S3, S45-S47, and S32 highways. In addition to highways crossing
the GBA, Guangzhou in particular has a clear ring-road highway structure, while that of Shenzhen is
more of a grid (Exhibit 3.16).
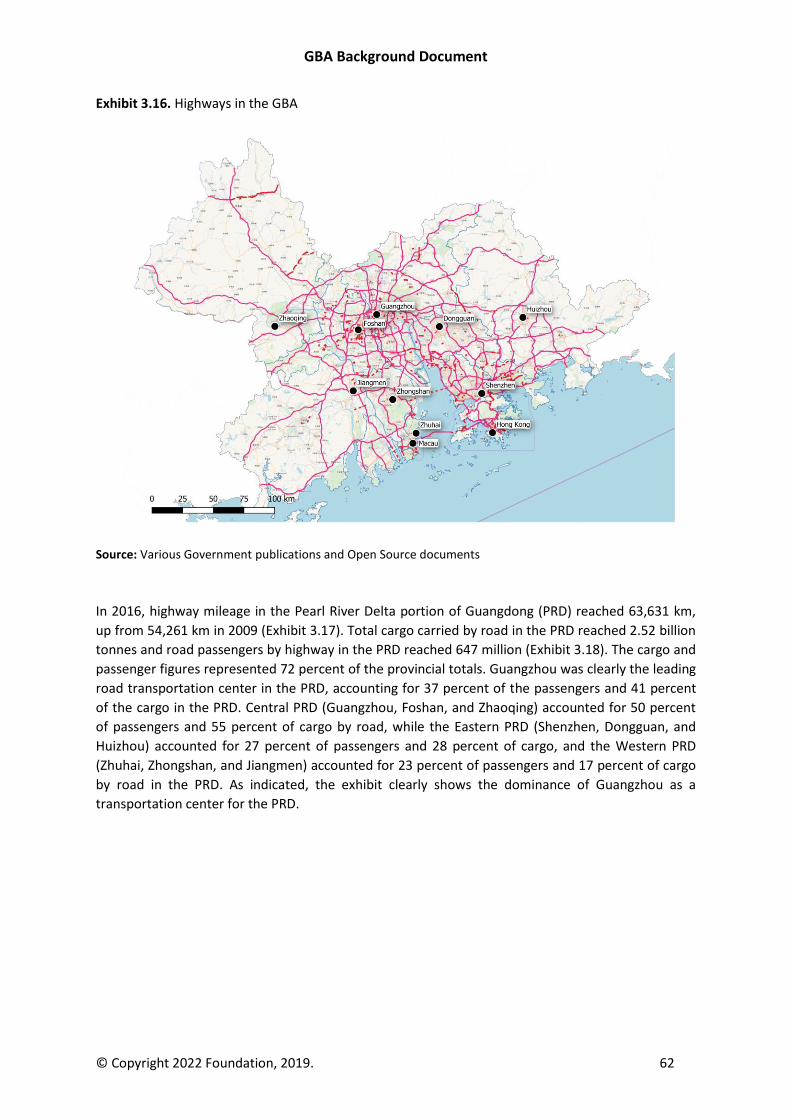
GBA Background Document
© Copyright 2022 Foundation, 2019. 62
Exhibit 3.16. Highways in the GBA
Source: Various Government publications and Open Source documents
In 2016, highway mileage in the Pearl River Delta portion of Guangdong (PRD) reached 63,631 km,
up from 54,261 km in 2009 (Exhibit 3.17). Total cargo carried by road in the PRD reached 2.52 billion
tonnes and road passengers by highway in the PRD reached 647 million (Exhibit 3.18). The cargo and
passenger figures represented 72 percent of the provincial totals. Guangzhou was clearly the leading
road transportation center in the PRD, accounting for 37 percent of the passengers and 41 percent
of the cargo in the PRD. Central PRD (Guangzhou, Foshan, and Zhaoqing) accounted for 50 percent
of passengers and 55 percent of cargo by road, while the Eastern PRD (Shenzhen, Dongguan, and
Huizhou) accounted for 27 percent of passengers and 28 percent of cargo, and the Western PRD
(Zhuhai, Zhongshan, and Jiangmen) accounted for 23 percent of passengers and 17 percent of cargo
by road in the PRD. As indicated, the exhibit clearly shows the dominance of Guangzhou as a
transportation center for the PRD.
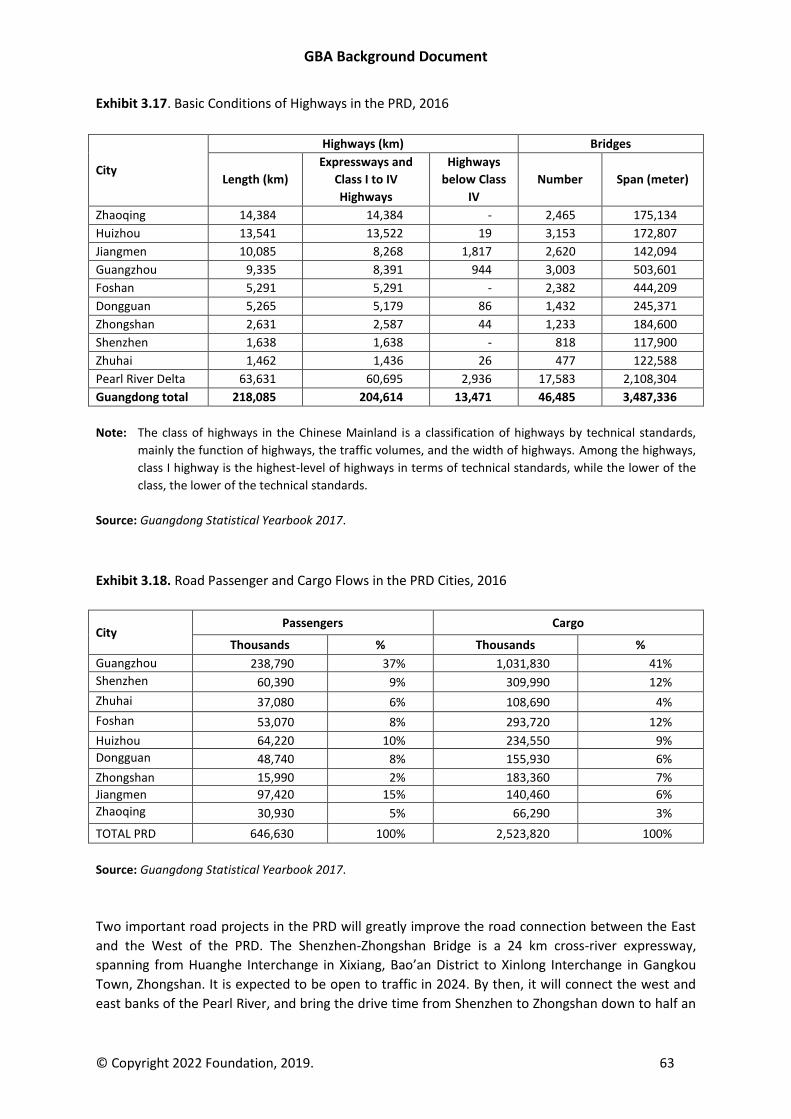
GBA Background Document
© Copyright 2022 Foundation, 2019. 63
Exhibit 3.17. Basic Conditions of Highways in the PRD, 2016
City
Highways (km) Bridges
Length (km)
Expressways and
Class I to IV
Highways
Highways
below Class
IV
Number Span (meter)
Zhaoqing 14,384 14,384 - 2,465 175,134
Huizhou 13,541 13,522 19 3,153 172,807
Jiangmen 10,085 8,268 1,817 2,620 142,094
Guangzhou 9,335 8,391 944 3,003 503,601
Foshan 5,291 5,291 - 2,382 444,209
Dongguan 5,265 5,179 86 1,432 245,371
Zhongshan 2,631 2,587 44 1,233 184,600
Shenzhen 1,638 1,638 - 818 117,900
Zhuhai 1,462 1,436 26 477 122,588
Pearl River Delta 63,631 60,695 2,936 17,583 2,108,304
Guangdong total 218,085 204,614 13,471 46,485 3,487,336
Note: The class of highways in the Chinese Mainland is a classification of highways by technical standards,
mainly the function of highways, the traffic volumes, and the width of highways. Among the highways,
class I highway is the highest-level of highways in terms of technical standards, while the lower of the
class, the lower of the technical standards.
Source: Guangdong Statistical Yearbook 2017.
Exhibit 3.18. Road Passenger and Cargo Flows in the PRD Cities, 2016
City Passengers Cargo
Thousands % Thousands %
Guangzhou 238,790 37% 1,031,830 41%
Shenzhen 60,390 9% 309,990 12%
Zhuhai 37,080 6% 108,690 4%
Foshan 53,070 8% 293,720 12%
Huizhou 64,220 10% 234,550 9%
Dongguan 48,740 8% 155,930 6%
Zhongshan 15,990 2% 183,360 7%
Jiangmen 97,420 15% 140,460 6%
Zhaoqing 30,930 5% 66,290 3%
TOTAL PRD 646,630 100% 2,523,820 100%
Source: Guangdong Statistical Yearbook 2017.
Two important road projects in the PRD will greatly improve the road connection between the East
and the West of the PRD. The Shenzhen-Zhongshan Bridge is a 24 km cross-river expressway,
spanning from Huanghe Interchange in Xixiang, Bao’an District to Xinlong Interchange in Gangkou
Town, Zhongshan. It is expected to be open to traffic in 2024. By then, it will connect the west and
east banks of the Pearl River, and bring the drive time from Shenzhen to Zhongshan down to half an
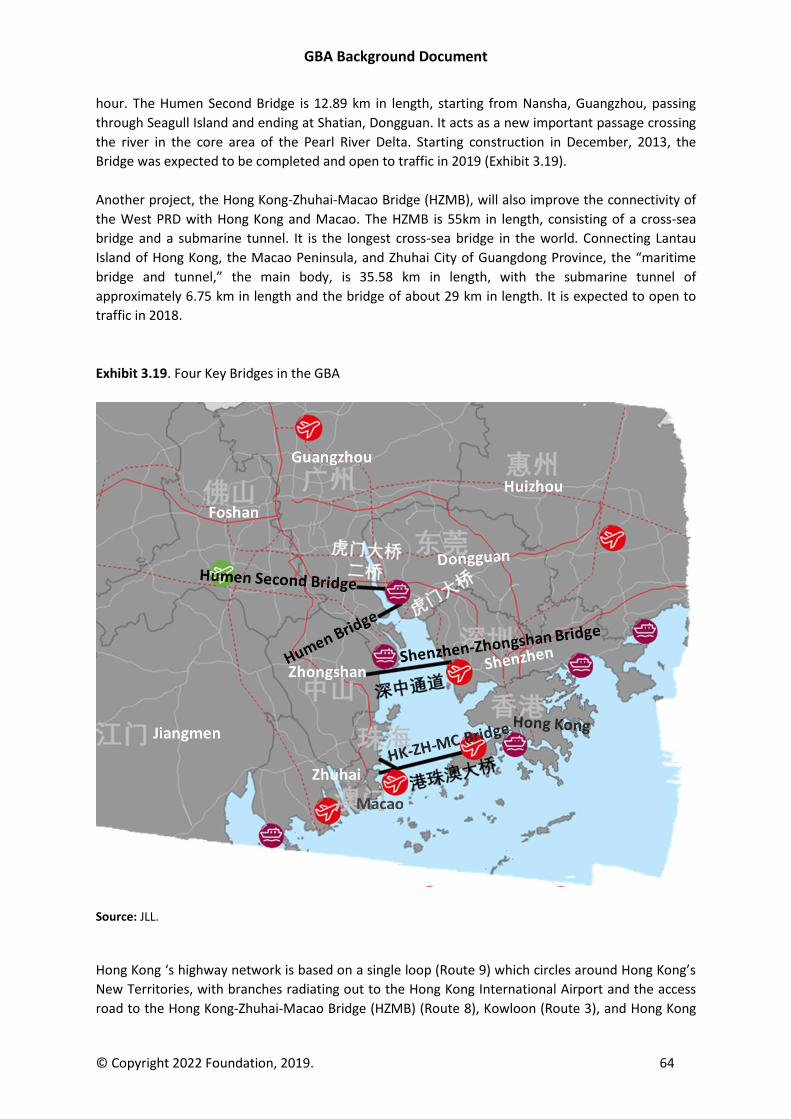
GBA Background Document
© Copyright 2022 Foundation, 2019. 64
hour. The Humen Second Bridge is 12.89 km in length, starting from Nansha, Guangzhou, passing
through Seagull Island and ending at Shatian, Dongguan. It acts as a new important passage crossing
the river in the core area of the Pearl River Delta. Starting construction in December, 2013, the
Bridge was expected to be completed and open to traffic in 2019 (Exhibit 3.19).
Another project, the Hong Kong-Zhuhai-Macao Bridge (HZMB), will also improve the connectivity of
the West PRD with Hong Kong and Macao. The HZMB is 55km in length, consisting of a cross-sea
bridge and a submarine tunnel. It is the longest cross-sea bridge in the world. Connecting Lantau
Island of Hong Kong, the Macao Peninsula, and Zhuhai City of Guangdong Province, the “maritime
bridge and tunnel,” the main body, is 35.58 km in length, with the submarine tunnel of
approximately 6.75 km in length and the bridge of about 29 km in length. It is expected to open to
traffic in 2018.
Exhibit 3.19. Four Key Bridges in the GBA
Source: JLL.
Hong Kong ‘s highway network is based on a single loop (Route 9) which circles around Hong Kong’s
New Territories, with branches radiating out to the Hong Kong International Airport and the access
road to the Hong Kong-Zhuhai-Macao Bridge (HZMB) (Route 8), Kowloon (Route 3), and Hong Kong
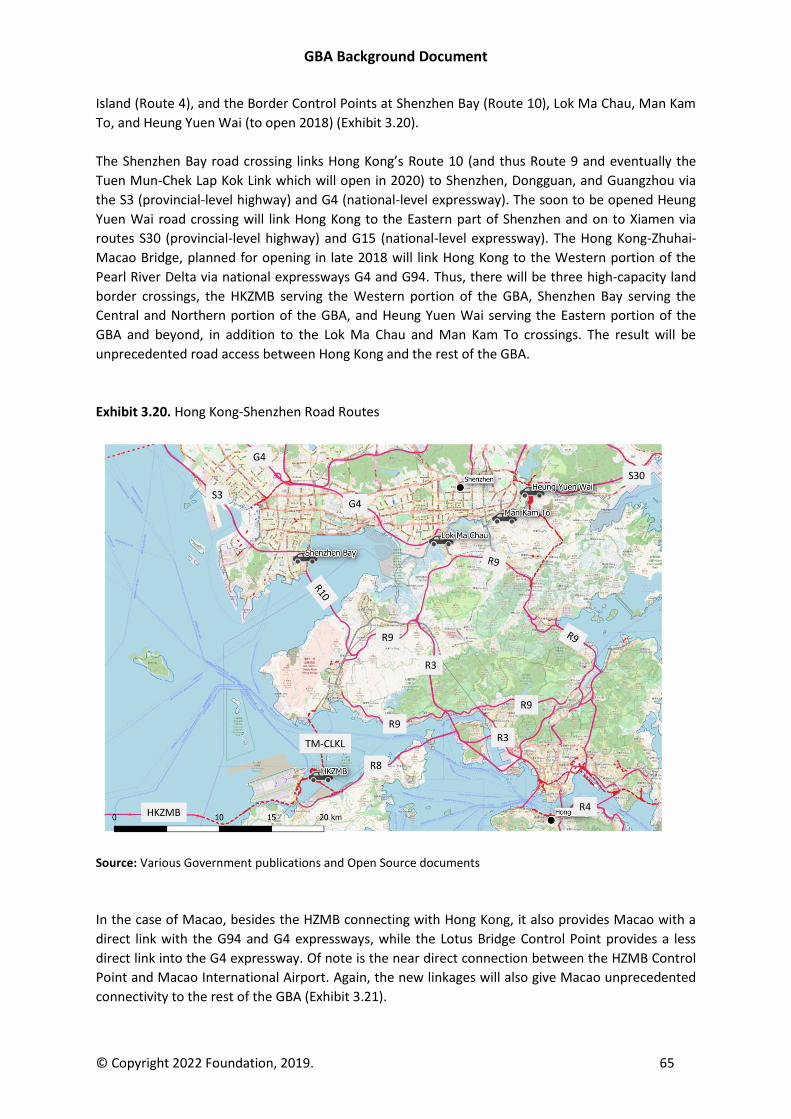
GBA Background Document
© Copyright 2022 Foundation, 2019. 65
Island (Route 4), and the Border Control Points at Shenzhen Bay (Route 10), Lok Ma Chau, Man Kam
To, and Heung Yuen Wai (to open 2018) (Exhibit 3.20).
The Shenzhen Bay road crossing links Hong Kong’s Route 10 (and thus Route 9 and eventually the
Tuen Mun-Chek Lap Kok Link which will open in 2020) to Shenzhen, Dongguan, and Guangzhou via
the S3 (provincial-level highway) and G4 (national-level expressway). The soon to be opened Heung
Yuen Wai road crossing will link Hong Kong to the Eastern part of Shenzhen and on to Xiamen via
routes S30 (provincial-level highway) and G15 (national-level expressway). The Hong Kong-Zhuhai-
Macao Bridge, planned for opening in late 2018 will link Hong Kong to the Western portion of the
Pearl River Delta via national expressways G4 and G94. Thus, there will be three high-capacity land
border crossings, the HKZMB serving the Western portion of the GBA, Shenzhen Bay serving the
Central and Northern portion of the GBA, and Heung Yuen Wai serving the Eastern portion of the
GBA and beyond, in addition to the Lok Ma Chau and Man Kam To crossings. The result will be
unprecedented road access between Hong Kong and the rest of the GBA.
Exhibit 3.20. Hong Kong-Shenzhen Road Routes
Source: Various Government publications and Open Source documents
In the case of Macao, besides the HZMB connecting with Hong Kong, it also provides Macao with a
direct link with the G94 and G4 expressways, while the Lotus Bridge Control Point provides a less
direct link into the G4 expressway. Of note is the near direct connection between the HZMB Control
Point and Macao International Airport. Again, the new linkages will also give Macao unprecedented
connectivity to the rest of the GBA (Exhibit 3.21).
R9
R9
R9
R3
S3G4
G4
S30
HKZMB
TM-CLKL
R8
R3
R4
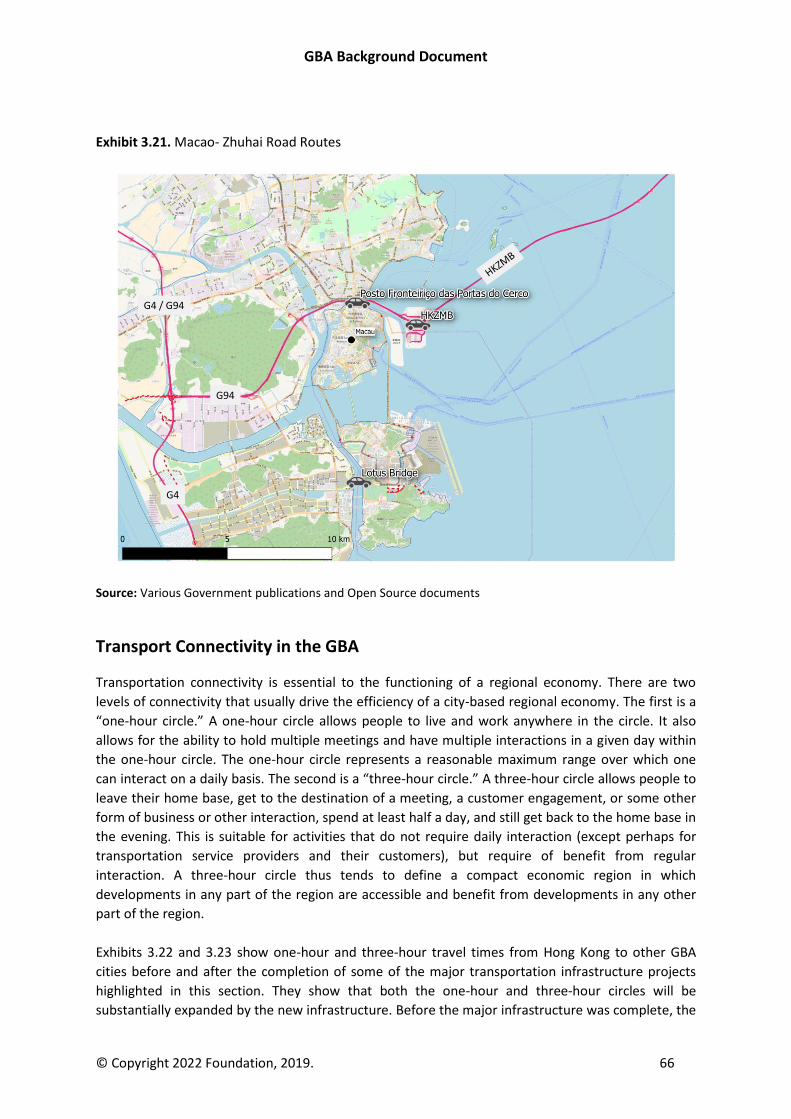
GBA Background Document
© Copyright 2022 Foundation, 2019. 66
Exhibit 3.21. Macao- Zhuhai Road Routes
Source: Various Government publications and Open Source documents
Transport Connectivity in the GBA
Transportation connectivity is essential to the functioning of a regional economy. There are two
levels of connectivity that usually drive the efficiency of a city-based regional economy. The first is a
“one-hour circle.” A one-hour circle allows people to live and work anywhere in the circle. It also
allows for the ability to hold multiple meetings and have multiple interactions in a given day within
the one-hour circle. The one-hour circle represents a reasonable maximum range over which one
can interact on a daily basis. The second is a “three-hour circle.” A three-hour circle allows people to
leave their home base, get to the destination of a meeting, a customer engagement, or some other
form of business or other interaction, spend at least half a day, and still get back to the home base in
the evening. This is suitable for activities that do not require daily interaction (except perhaps for
transportation service providers and their customers), but require of benefit from regular
interaction. A three-hour circle thus tends to define a compact economic region in which
developments in any part of the region are accessible and benefit from developments in any other
part of the region.
Exhibits 3.22 and 3.23 show one-hour and three-hour travel times from Hong Kong to other GBA
cities before and after the completion of some of the major transportation infrastructure projects
highlighted in this section. They show that both the one-hour and three-hour circles will be
substantially expanded by the new infrastructure. Before the major infrastructure was complete, the
G94
G4 / G94
G4
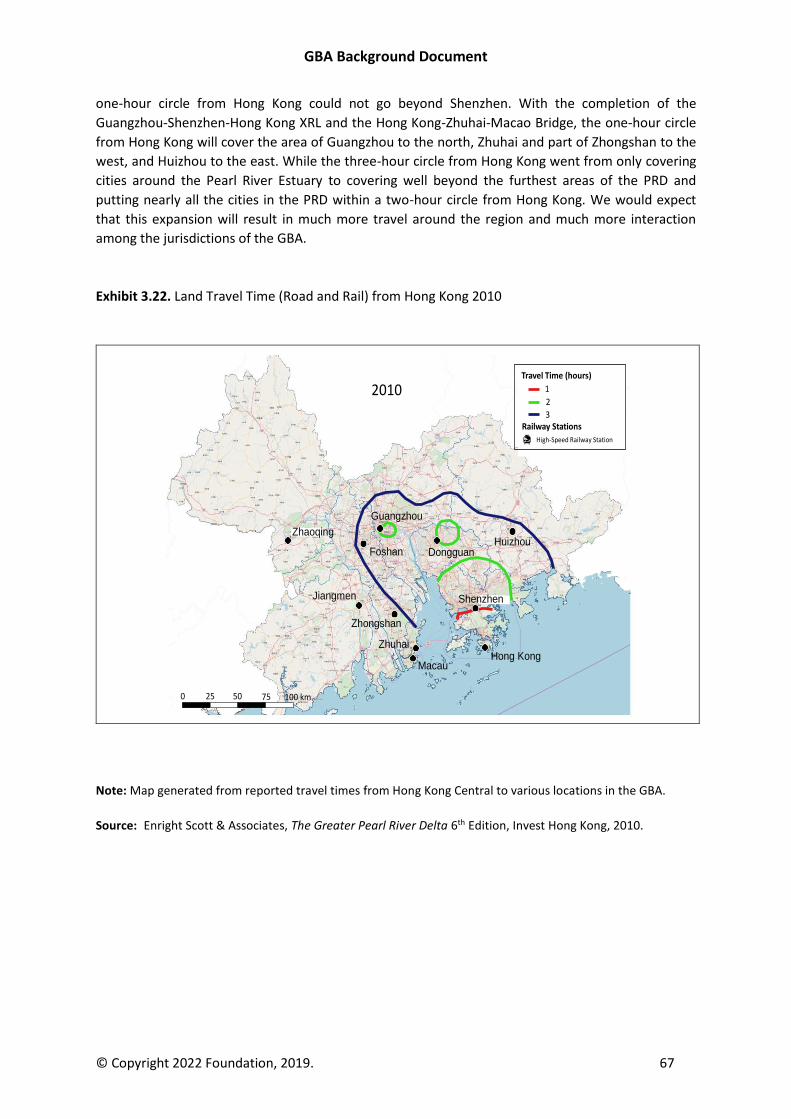
GBA Background Document
© Copyright 2022 Foundation, 2019. 67
one-hour circle from Hong Kong could not go beyond Shenzhen. With the completion of the
Guangzhou-Shenzhen-Hong Kong XRL and the Hong Kong-Zhuhai-Macao Bridge, the one-hour circle
from Hong Kong will cover the area of Guangzhou to the north, Zhuhai and part of Zhongshan to the
west, and Huizhou to the east. While the three-hour circle from Hong Kong went from only covering
cities around the Pearl River Estuary to covering well beyond the furthest areas of the PRD and
putting nearly all the cities in the PRD within a two-hour circle from Hong Kong. We would expect
that this expansion will result in much more travel around the region and much more interaction
among the jurisdictions of the GBA.
Exhibit 3.22. Land Travel Time (Road and Rail) from Hong Kong 2010
Zhaoqing
Foshan
Guangzhou
Dongguan
Shenzhen
Hong KongMacau
Zhuhai
Zhongshan
Jiangmen
Huizhou
Travel Time (hours)
1
Railway Stations
High-Speed Railway Station
2
3
0 25 50 75 100 km
2010
Note: Map generated from reported travel times from Hong Kong Central to various locations in the GBA.
Source: Enright Scott & Associates, The Greater Pearl River Delta 6th Edition, Invest Hong Kong, 2010.
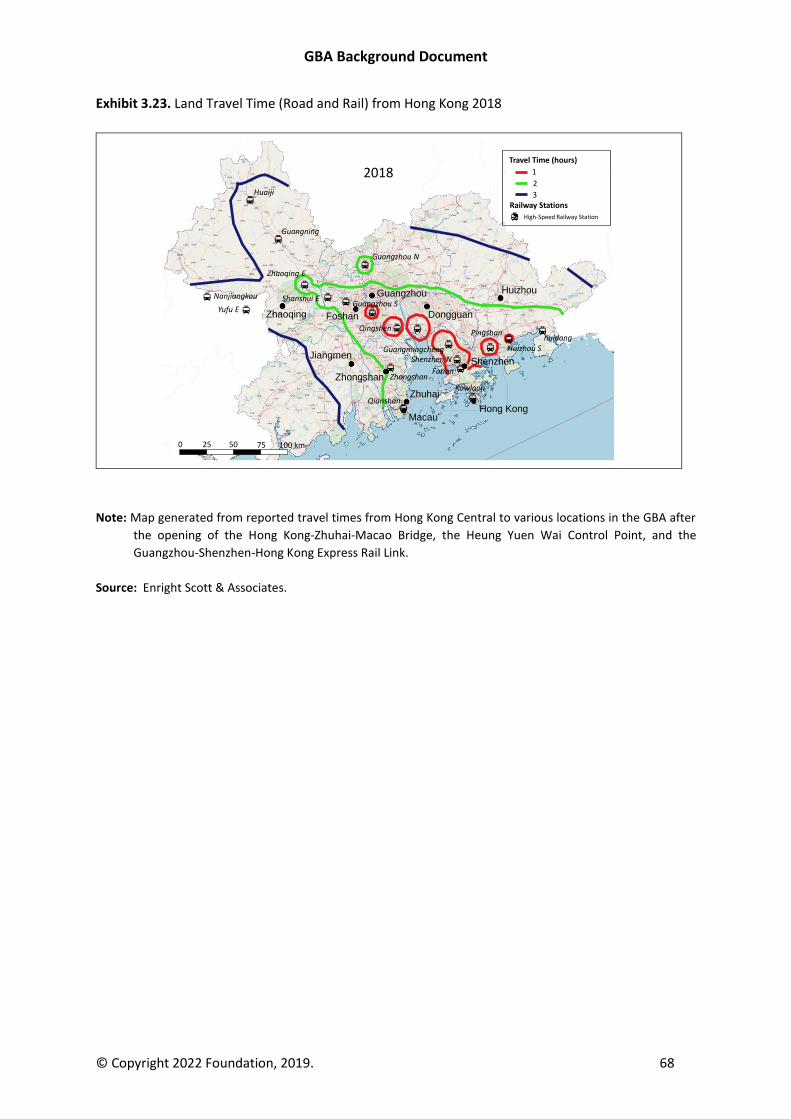
GBA Background Document
© Copyright 2022 Foundation, 2019. 68
Exhibit 3.23. Land Travel Time (Road and Rail) from Hong Kong 2018
Zhaoqing
Guangzhou
Hong KongMacau
Zhuhai
Zhongshan
Jiangmen
Huizhou
Travel Time (hours)
1
Railway Stations
High-Speed Railway Station
2
3
0 25 50 75 100 km
Foshan Dongguan
Shenzhen
Huaiji
Guangning
Yufu E
Nanjiangkou
Guangzhou N
Shanshui E
Zhaoqing E
Pingshan
Huizhou Shuidong
Qianshan
Kowloon
Zhongshan
Qingshen
Futian
Shenzhen NGuangmingcheng
Guangzhou S
2018
Note: Map generated from reported travel times from Hong Kong Central to various locations in the GBA after
the opening of the Hong Kong-Zhuhai-Macao Bridge, the Heung Yuen Wai Control Point, and the
Guangzhou-Shenzhen-Hong Kong Express Rail Link.
Source: Enright Scott & Associates.
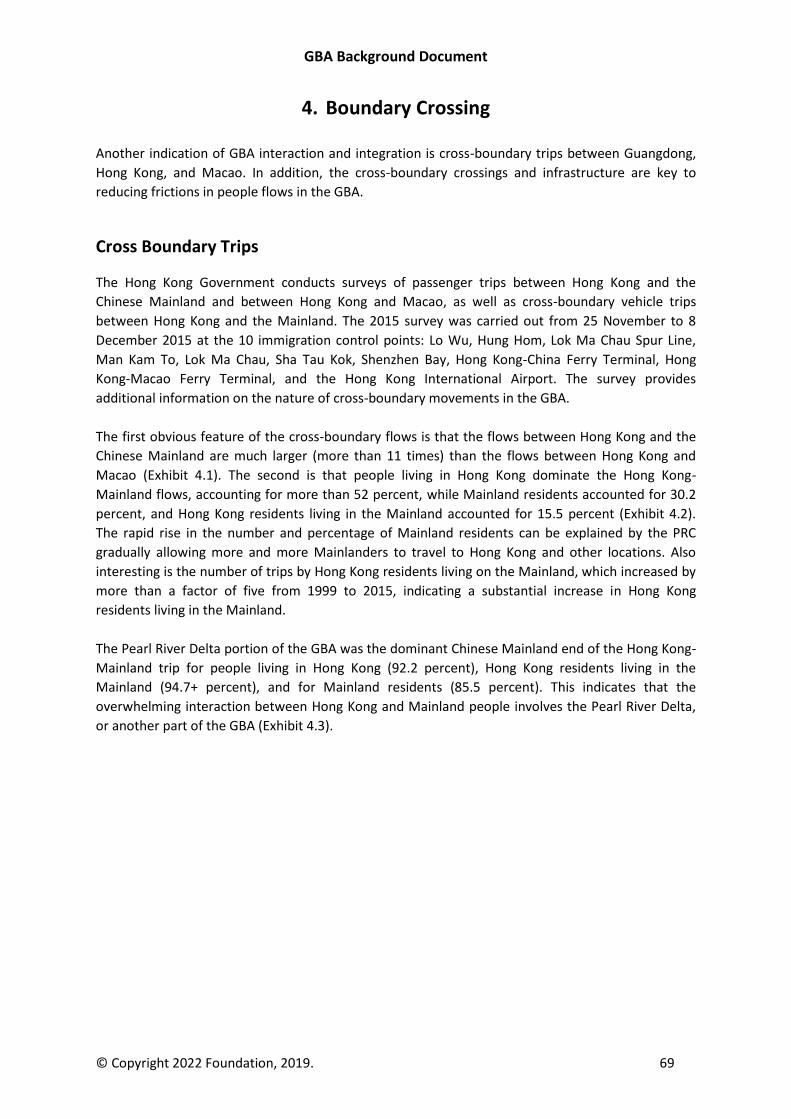
GBA Background Document
© Copyright 2022 Foundation, 2019. 69
4. Boundary Crossing
Another indication of GBA interaction and integration is cross-boundary trips between Guangdong,
Hong Kong, and Macao. In addition, the cross-boundary crossings and infrastructure are key to
reducing frictions in people flows in the GBA.
Cross Boundary Trips
The Hong Kong Government conducts surveys of passenger trips between Hong Kong and the
Chinese Mainland and between Hong Kong and Macao, as well as cross-boundary vehicle trips
between Hong Kong and the Mainland. The 2015 survey was carried out from 25 November to 8
December 2015 at the 10 immigration control points: Lo Wu, Hung Hom, Lok Ma Chau Spur Line,
Man Kam To, Lok Ma Chau, Sha Tau Kok, Shenzhen Bay, Hong Kong-China Ferry Terminal, Hong
Kong-Macao Ferry Terminal, and the Hong Kong International Airport. The survey provides
additional information on the nature of cross-boundary movements in the GBA.
The first obvious feature of the cross-boundary flows is that the flows between Hong Kong and the
Chinese Mainland are much larger (more than 11 times) than the flows between Hong Kong and
Macao (Exhibit 4.1). The second is that people living in Hong Kong dominate the Hong Kong-
Mainland flows, accounting for more than 52 percent, while Mainland residents accounted for 30.2
percent, and Hong Kong residents living in the Mainland accounted for 15.5 percent (Exhibit 4.2).
The rapid rise in the number and percentage of Mainland residents can be explained by the PRC
gradually allowing more and more Mainlanders to travel to Hong Kong and other locations. Also
interesting is the number of trips by Hong Kong residents living on the Mainland, which increased by
more than a factor of five from 1999 to 2015, indicating a substantial increase in Hong Kong
residents living in the Mainland.
The Pearl River Delta portion of the GBA was the dominant Chinese Mainland end of the Hong Kong-
Mainland trip for people living in Hong Kong (92.2 percent), Hong Kong residents living in the
Mainland (94.7+ percent), and for Mainland residents (85.5 percent). This indicates that the
overwhelming interaction between Hong Kong and Mainland people involves the Pearl River Delta,
or another part of the GBA (Exhibit 4.3).
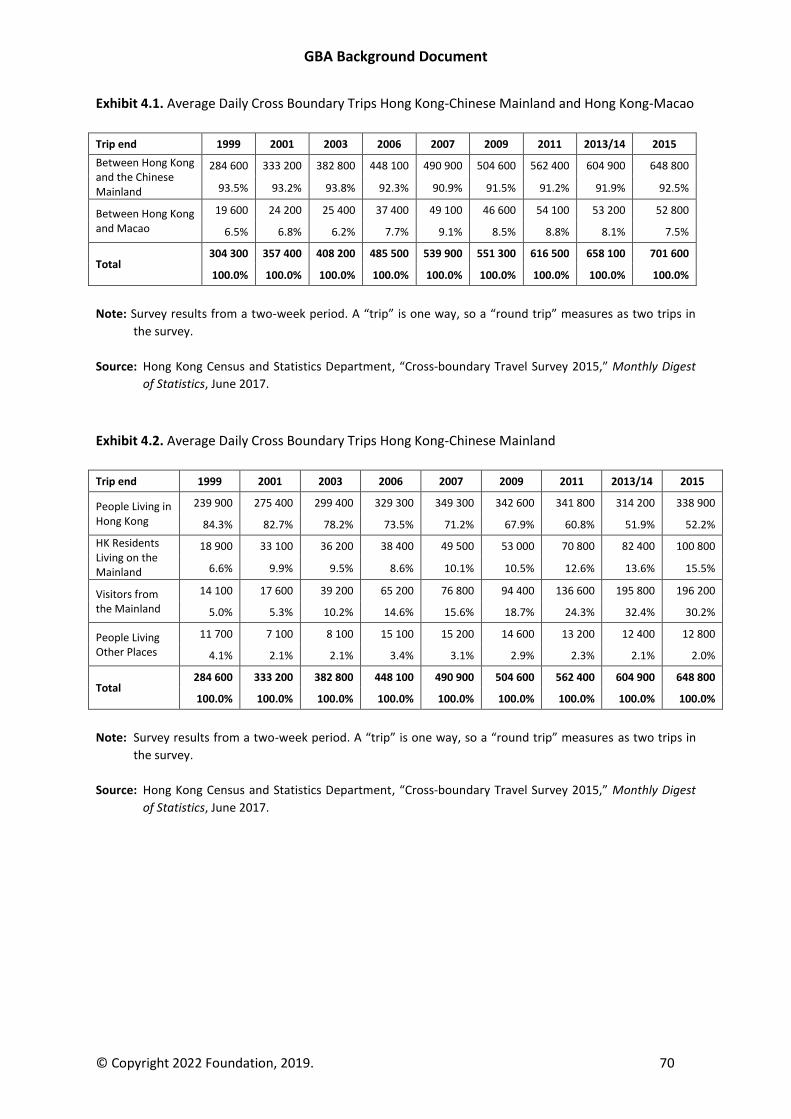
GBA Background Document
© Copyright 2022 Foundation, 2019. 70
Exhibit 4.1. Average Daily Cross Boundary Trips Hong Kong-Chinese Mainland and Hong Kong-Macao
Trip end 1999 2001 2003 2006 2007 2009 2011 2013/14 2015
Between Hong Kong and the Chinese Mainland
284 600 333 200 382 800 448 100 490 900 504 600 562 400 604 900 648 800
93.5% 93.2% 93.8% 92.3% 90.9% 91.5% 91.2% 91.9% 92.5%
Between Hong Kong and Macao
19 600 24 200 25 400 37 400 49 100 46 600 54 100 53 200 52 800
6.5% 6.8% 6.2% 7.7% 9.1% 8.5% 8.8% 8.1% 7.5%
Total 304 300 357 400 408 200 485 500 539 900 551 300 616 500 658 100 701 600
100.0% 100.0% 100.0% 100.0% 100.0% 100.0% 100.0% 100.0% 100.0%
Note: Survey results from a two-week period. A “trip” is one way, so a “round trip” measures as two trips in
the survey.
Source: Hong Kong Census and Statistics Department, “Cross-boundary Travel Survey 2015,” Monthly Digest
of Statistics, June 2017.
Exhibit 4.2. Average Daily Cross Boundary Trips Hong Kong-Chinese Mainland
Trip end 1999 2001 2003 2006 2007 2009 2011 2013/14 2015
People Living in Hong Kong
239 900 275 400 299 400 329 300 349 300 342 600 341 800 314 200 338 900
84.3% 82.7% 78.2% 73.5% 71.2% 67.9% 60.8% 51.9% 52.2%
HK Residents Living on the Mainland
18 900 33 100 36 200 38 400 49 500 53 000 70 800 82 400 100 800
6.6% 9.9% 9.5% 8.6% 10.1% 10.5% 12.6% 13.6% 15.5%
Visitors from the Mainland
14 100 17 600 39 200 65 200 76 800 94 400 136 600 195 800 196 200
5.0% 5.3% 10.2% 14.6% 15.6% 18.7% 24.3% 32.4% 30.2%
People Living Other Places
11 700 7 100 8 100 15 100 15 200 14 600 13 200 12 400 12 800
4.1% 2.1% 2.1% 3.4% 3.1% 2.9% 2.3% 2.1% 2.0%
Total 284 600 333 200 382 800 448 100 490 900 504 600 562 400 604 900 648 800
100.0% 100.0% 100.0% 100.0% 100.0% 100.0% 100.0% 100.0% 100.0%
Note: Survey results from a two-week period. A “trip” is one way, so a “round trip” measures as two trips in
the survey.
Source: Hong Kong Census and Statistics Department, “Cross-boundary Travel Survey 2015,” Monthly Digest
of Statistics, June 2017.
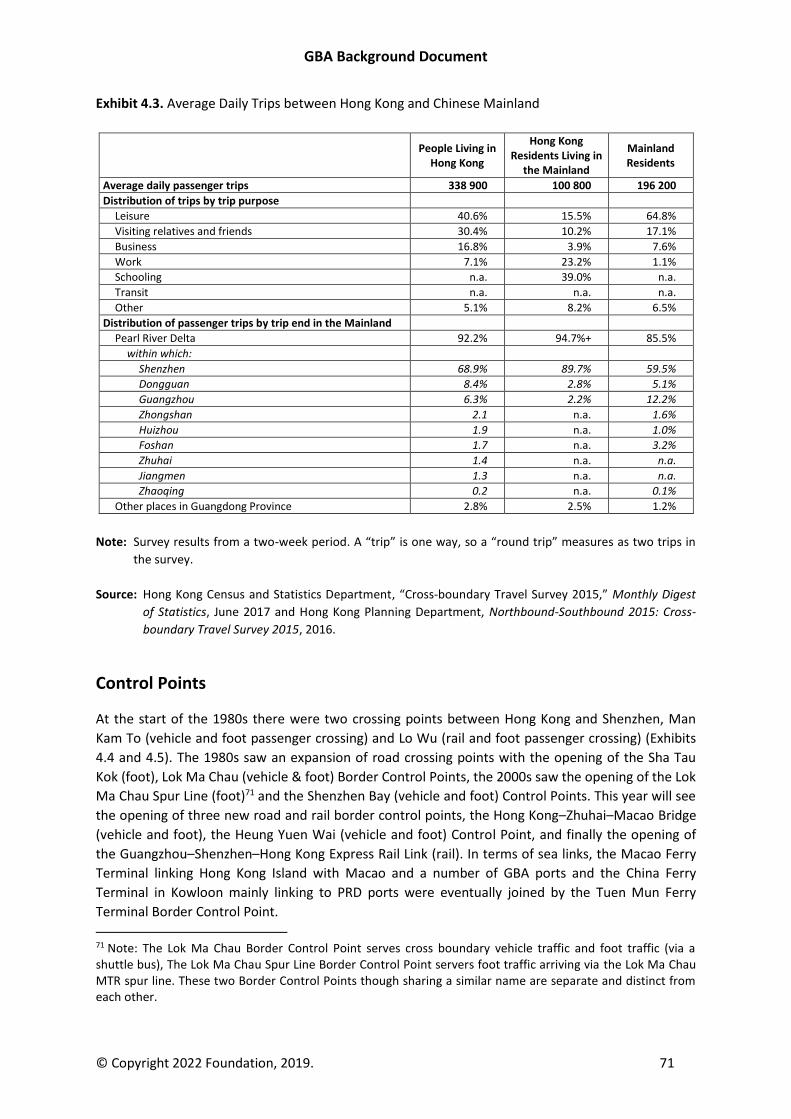
GBA Background Document
© Copyright 2022 Foundation, 2019. 71
Exhibit 4.3. Average Daily Trips between Hong Kong and Chinese Mainland
People Living in
Hong Kong
Hong Kong Residents Living in
the Mainland
Mainland Residents
Average daily passenger trips 338 900 100 800 196 200
Distribution of trips by trip purpose
Leisure 40.6% 15.5% 64.8%
Visiting relatives and friends 30.4% 10.2% 17.1%
Business 16.8% 3.9% 7.6%
Work 7.1% 23.2% 1.1%
Schooling n.a. 39.0% n.a.
Transit n.a. n.a. n.a.
Other 5.1% 8.2% 6.5%
Distribution of passenger trips by trip end in the Mainland
Pearl River Delta 92.2% 94.7%+ 85.5%
within which:
Shenzhen 68.9% 89.7% 59.5%
Dongguan 8.4% 2.8% 5.1%
Guangzhou 6.3% 2.2% 12.2%
Zhongshan 2.1 n.a. 1.6%
Huizhou 1.9 n.a. 1.0%
Foshan 1.7 n.a. 3.2%
Zhuhai 1.4 n.a. n.a.
Jiangmen 1.3 n.a. n.a.
Zhaoqing 0.2 n.a. 0.1%
Other places in Guangdong Province 2.8% 2.5% 1.2%
Note: Survey results from a two-week period. A “trip” is one way, so a “round trip” measures as two trips in
the survey.
Source: Hong Kong Census and Statistics Department, “Cross-boundary Travel Survey 2015,” Monthly Digest
of Statistics, June 2017 and Hong Kong Planning Department, Northbound-Southbound 2015: Cross-
boundary Travel Survey 2015, 2016.
Control Points
At the start of the 1980s there were two crossing points between Hong Kong and Shenzhen, Man
Kam To (vehicle and foot passenger crossing) and Lo Wu (rail and foot passenger crossing) (Exhibits
4.4 and 4.5). The 1980s saw an expansion of road crossing points with the opening of the Sha Tau
Kok (foot), Lok Ma Chau (vehicle & foot) Border Control Points, the 2000s saw the opening of the Lok
Ma Chau Spur Line (foot)71 and the Shenzhen Bay (vehicle and foot) Control Points. This year will see
the opening of three new road and rail border control points, the Hong Kong–Zhuhai–Macao Bridge
(vehicle and foot), the Heung Yuen Wai (vehicle and foot) Control Point, and finally the opening of
the Guangzhou–Shenzhen–Hong Kong Express Rail Link (rail). In terms of sea links, the Macao Ferry
Terminal linking Hong Kong Island with Macao and a number of GBA ports and the China Ferry
Terminal in Kowloon mainly linking to PRD ports were eventually joined by the Tuen Mun Ferry
Terminal Border Control Point.
71 Note: The Lok Ma Chau Border Control Point serves cross boundary vehicle traffic and foot traffic (via a shuttle bus), The Lok Ma Chau Spur Line Border Control Point servers foot traffic arriving via the Lok Ma Chau MTR spur line. These two Border Control Points though sharing a similar name are separate and distinct from each other.
GBA Background Document
© Copyright 2022 Foundation, 2019. 72
Exhibit 4.6 shows the capacity of Hong Kong’s control points. Total capacity is on the order of 1.7
million crossings per day. While this seems substantial in a city with a population of 7.4 million
people, it is not so high when compared to the estimated 1.6 million people that commute into
Manhattan every work day.72
Macao has fewer border crossing points than Hong Kong. For sea arrivals, the Macao Ferry Terminal
has been serving Macao passengers since the 1980s. A new additional terminal on Taipa opened in
2017. The oldest land border crossing is that of the Portas Do Cerco which had been in place since at
least the mid-1850s, this was upgraded to a more substantial crossing point, the Posto Fronteiriço
das Portas do Cerco in 2004. The Lotus Bridge Land Crossing was opened in 1999 (Exhibits 4.7 and
4.8).
The Macao Government is also planning a number of measures what will expand passenger
throughput and increase the speed at which they will traverse the border. These include the
Guangdong-Macao New Channel (expected to open in 2019), the expansion of the Cotai Checkpoint
(assumed to be in place by 2025) and the Light Rapid Transit System (LRT) (assumed Taipa Line
opening in 2019 and future extension to Macao Peninsula). It is hoped that these capacity
expansions will result in shorter wait times and more efficient crossings, especially at peak hours.
72 United States Bureau of the Census, “Census Bureau Reports 1.6 Million Workers Commute into Manhattan Each Day,” 5 March 2013..
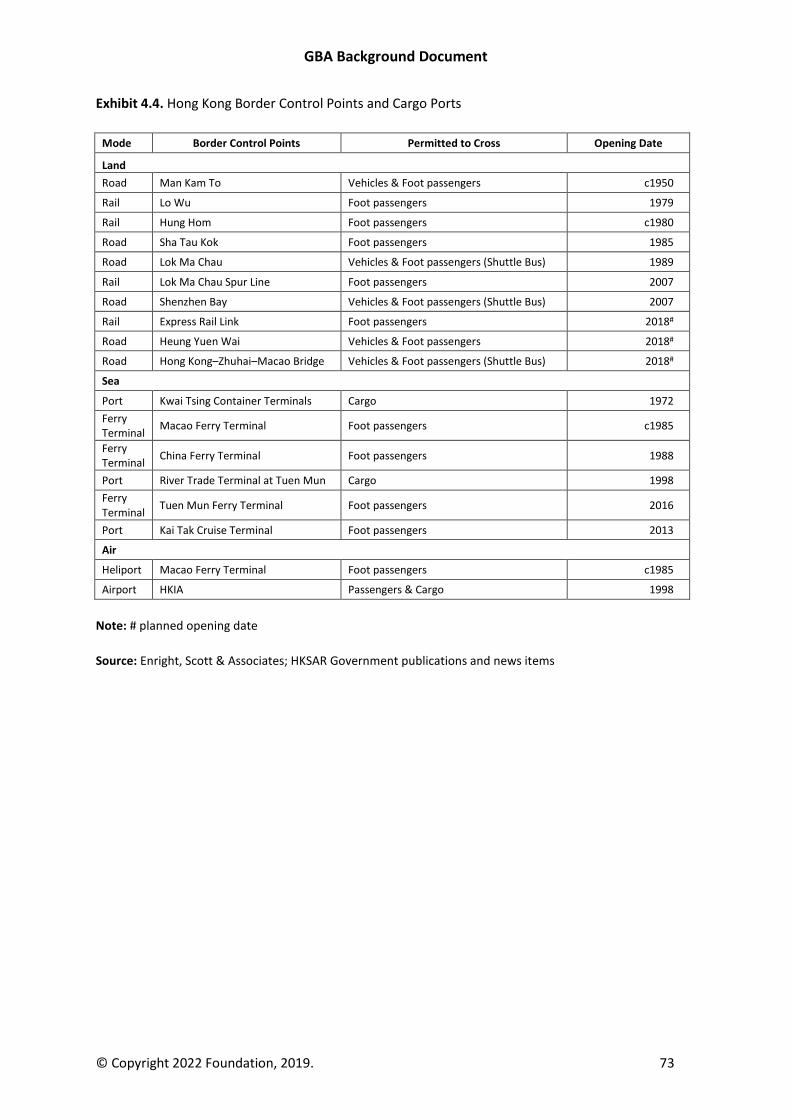
GBA Background Document
© Copyright 2022 Foundation, 2019. 73
Exhibit 4.4. Hong Kong Border Control Points and Cargo Ports
Mode Border Control Points Permitted to Cross Opening Date
Land
Road Man Kam To Vehicles & Foot passengers c1950
Rail Lo Wu Foot passengers 1979
Rail Hung Hom Foot passengers c1980
Road Sha Tau Kok Foot passengers 1985
Road Lok Ma Chau Vehicles & Foot passengers (Shuttle Bus) 1989
Rail Lok Ma Chau Spur Line Foot passengers 2007
Road Shenzhen Bay Vehicles & Foot passengers (Shuttle Bus) 2007
Rail Express Rail Link Foot passengers 2018#
Road Heung Yuen Wai Vehicles & Foot passengers 2018#
Road Hong Kong–Zhuhai–Macao Bridge Vehicles & Foot passengers (Shuttle Bus) 2018#
Sea
Port Kwai Tsing Container Terminals Cargo 1972
Ferry Terminal
Macao Ferry Terminal Foot passengers c1985
Ferry Terminal
China Ferry Terminal Foot passengers 1988
Port River Trade Terminal at Tuen Mun Cargo 1998
Ferry Terminal
Tuen Mun Ferry Terminal Foot passengers 2016
Port Kai Tak Cruise Terminal Foot passengers 2013
Air
Heliport Macao Ferry Terminal Foot passengers c1985
Airport HKIA Passengers & Cargo 1998
Note: # planned opening date
Source: Enright, Scott & Associates; HKSAR Government publications and news items
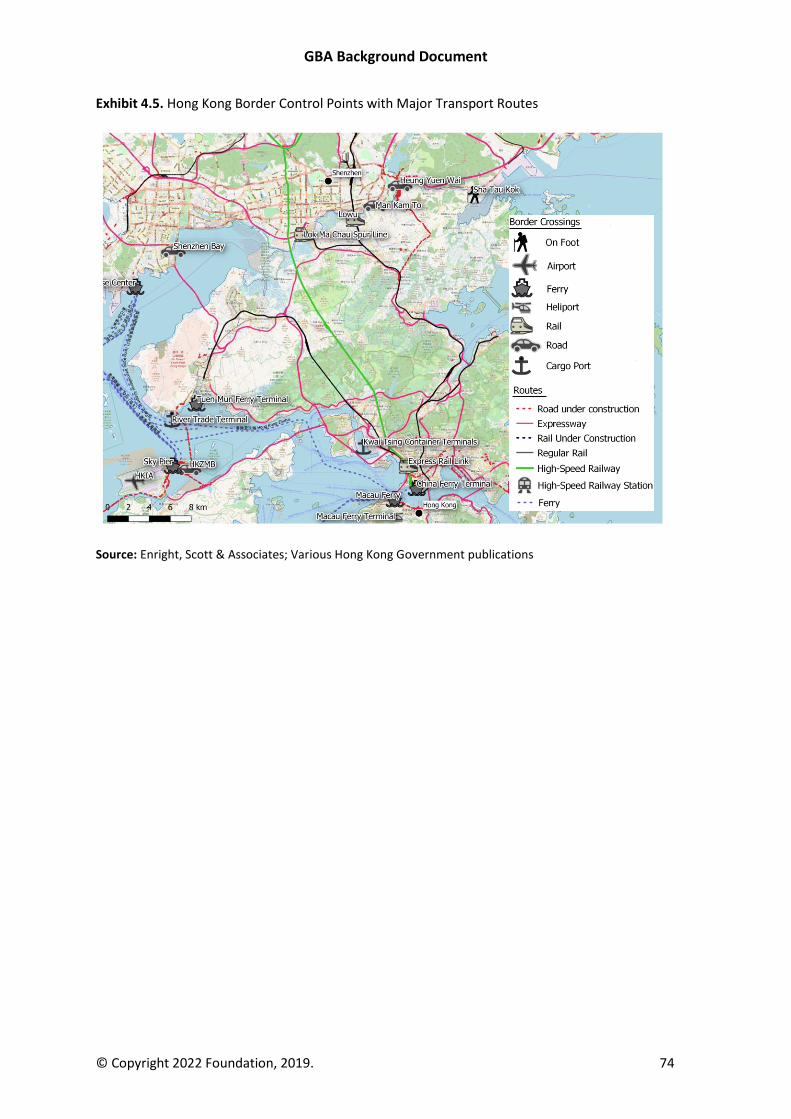
GBA Background Document
© Copyright 2022 Foundation, 2019. 74
Exhibit 4.5. Hong Kong Border Control Points with Major Transport Routes
Source: Enright, Scott & Associates; Various Hong Kong Government publications
Ferry Routes
Rail
Road
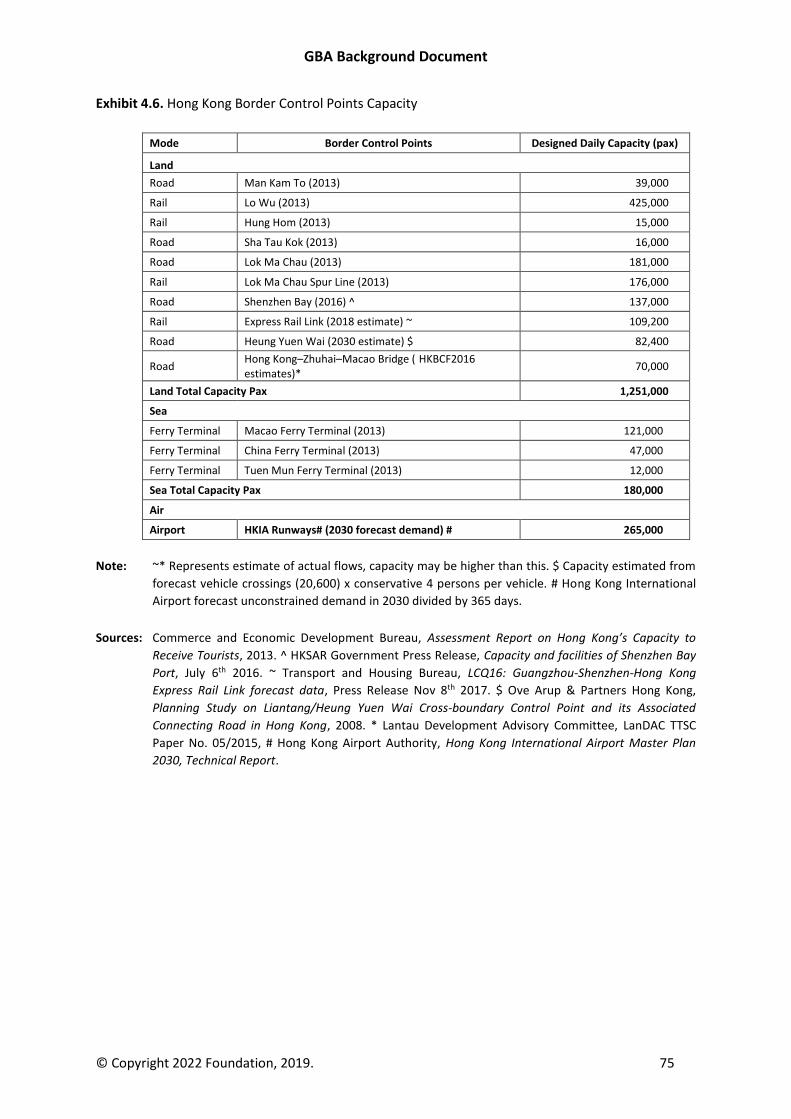
GBA Background Document
© Copyright 2022 Foundation, 2019. 75
Exhibit 4.6. Hong Kong Border Control Points Capacity
Mode Border Control Points Designed Daily Capacity (pax)
Land
Road Man Kam To (2013) 39,000
Rail Lo Wu (2013) 425,000
Rail Hung Hom (2013) 15,000
Road Sha Tau Kok (2013) 16,000
Road Lok Ma Chau (2013) 181,000
Rail Lok Ma Chau Spur Line (2013) 176,000
Road Shenzhen Bay (2016) ^ 137,000
Rail Express Rail Link (2018 estimate) ~ 109,200
Road Heung Yuen Wai (2030 estimate) $ 82,400
Road Hong Kong–Zhuhai–Macao Bridge ( HKBCF2016 estimates)*
70,000
Land Total Capacity Pax 1,251,000
Sea
Ferry Terminal Macao Ferry Terminal (2013) 121,000
Ferry Terminal China Ferry Terminal (2013) 47,000
Ferry Terminal Tuen Mun Ferry Terminal (2013) 12,000
Sea Total Capacity Pax 180,000
Air
Airport HKIA Runways# (2030 forecast demand) # 265,000
Note: ~* Represents estimate of actual flows, capacity may be higher than this. $ Capacity estimated from
forecast vehicle crossings (20,600) x conservative 4 persons per vehicle. # Hong Kong International
Airport forecast unconstrained demand in 2030 divided by 365 days.
Sources: Commerce and Economic Development Bureau, Assessment Report on Hong Kong’s Capacity to
Receive Tourists, 2013. ^ HKSAR Government Press Release, Capacity and facilities of Shenzhen Bay
Port, July 6th 2016. ~ Transport and Housing Bureau, LCQ16: Guangzhou-Shenzhen-Hong Kong
Express Rail Link forecast data, Press Release Nov 8th 2017. $ Ove Arup & Partners Hong Kong,
Planning Study on Liantang/Heung Yuen Wai Cross-boundary Control Point and its Associated
Connecting Road in Hong Kong, 2008. * Lantau Development Advisory Committee, LanDAC TTSC
Paper No. 05/2015, # Hong Kong Airport Authority, Hong Kong International Airport Master Plan
2030, Technical Report.
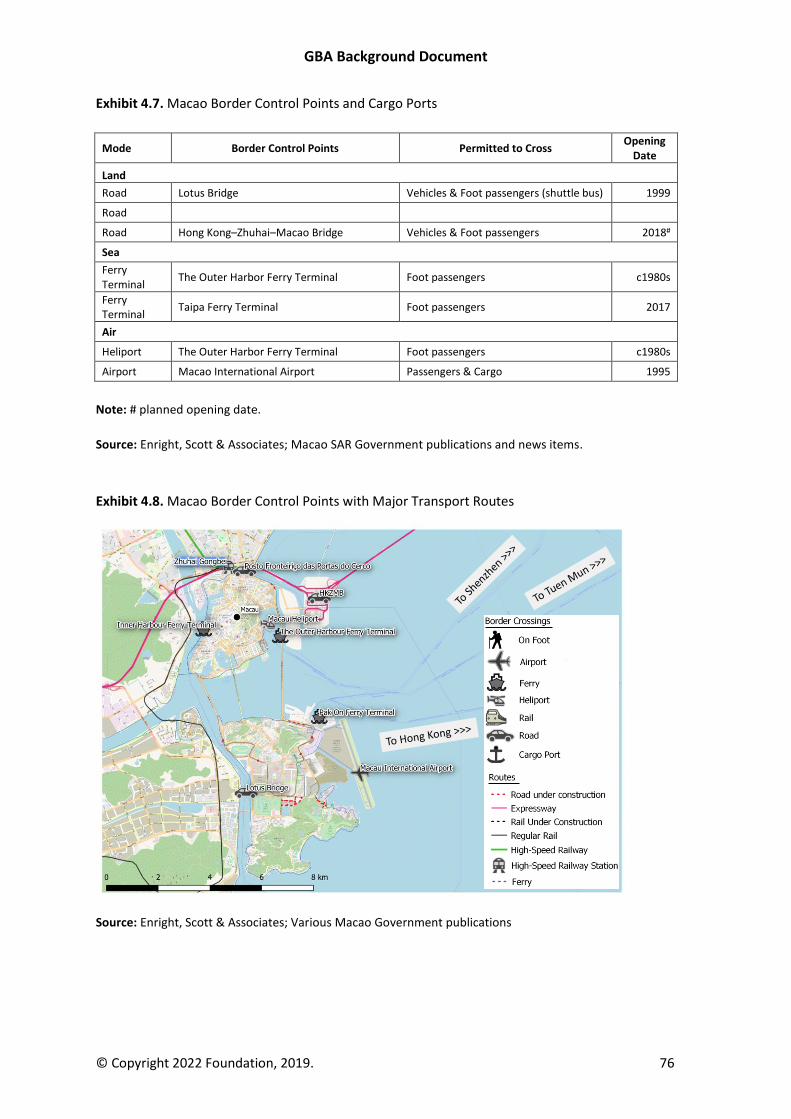
GBA Background Document
© Copyright 2022 Foundation, 2019. 76
Exhibit 4.7. Macao Border Control Points and Cargo Ports
Mode Border Control Points Permitted to Cross Opening
Date
Land
Road Lotus Bridge Vehicles & Foot passengers (shuttle bus) 1999
Road
Road Hong Kong–Zhuhai–Macao Bridge Vehicles & Foot passengers 2018#
Sea
Ferry Terminal
The Outer Harbor Ferry Terminal Foot passengers c1980s
Ferry Terminal
Taipa Ferry Terminal Foot passengers 2017
Air
Heliport The Outer Harbor Ferry Terminal Foot passengers c1980s
Airport Macao International Airport Passengers & Cargo 1995
Note: # planned opening date.
Source: Enright, Scott & Associates; Macao SAR Government publications and news items.
Exhibit 4.8. Macao Border Control Points with Major Transport Routes
Source: Enright, Scott & Associates; Various Macao Government publications
Ferry Routes
Rail
Road
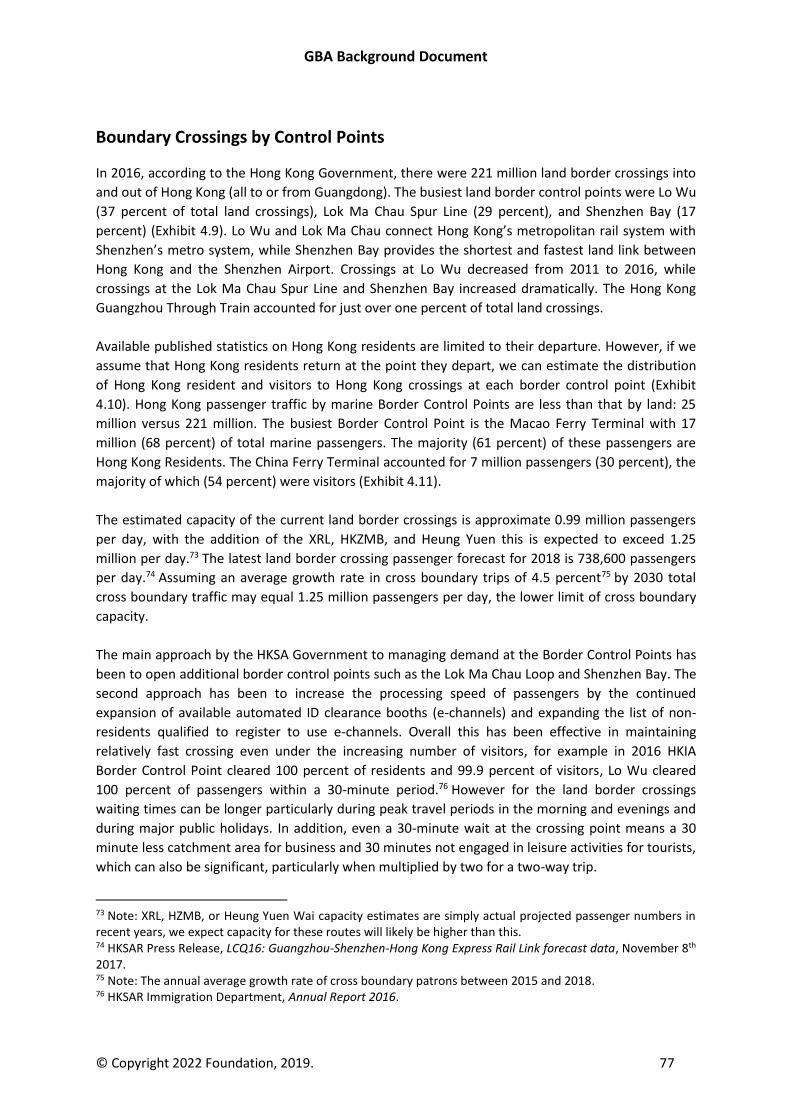
GBA Background Document
© Copyright 2022 Foundation, 2019. 77
Boundary Crossings by Control Points
In 2016, according to the Hong Kong Government, there were 221 million land border crossings into
and out of Hong Kong (all to or from Guangdong). The busiest land border control points were Lo Wu
(37 percent of total land crossings), Lok Ma Chau Spur Line (29 percent), and Shenzhen Bay (17
percent) (Exhibit 4.9). Lo Wu and Lok Ma Chau connect Hong Kong’s metropolitan rail system with
Shenzhen’s metro system, while Shenzhen Bay provides the shortest and fastest land link between
Hong Kong and the Shenzhen Airport. Crossings at Lo Wu decreased from 2011 to 2016, while
crossings at the Lok Ma Chau Spur Line and Shenzhen Bay increased dramatically. The Hong Kong
Guangzhou Through Train accounted for just over one percent of total land crossings.
Available published statistics on Hong Kong residents are limited to their departure. However, if we
assume that Hong Kong residents return at the point they depart, we can estimate the distribution
of Hong Kong resident and visitors to Hong Kong crossings at each border control point (Exhibit
4.10). Hong Kong passenger traffic by marine Border Control Points are less than that by land: 25
million versus 221 million. The busiest Border Control Point is the Macao Ferry Terminal with 17
million (68 percent) of total marine passengers. The majority (61 percent) of these passengers are
Hong Kong Residents. The China Ferry Terminal accounted for 7 million passengers (30 percent), the
majority of which (54 percent) were visitors (Exhibit 4.11).
The estimated capacity of the current land border crossings is approximate 0.99 million passengers
per day, with the addition of the XRL, HKZMB, and Heung Yuen this is expected to exceed 1.25
million per day.73 The latest land border crossing passenger forecast for 2018 is 738,600 passengers
per day.74 Assuming an average growth rate in cross boundary trips of 4.5 percent75 by 2030 total
cross boundary traffic may equal 1.25 million passengers per day, the lower limit of cross boundary
capacity.
The main approach by the HKSA Government to managing demand at the Border Control Points has
been to open additional border control points such as the Lok Ma Chau Loop and Shenzhen Bay. The
second approach has been to increase the processing speed of passengers by the continued
expansion of available automated ID clearance booths (e-channels) and expanding the list of non-
residents qualified to register to use e-channels. Overall this has been effective in maintaining
relatively fast crossing even under the increasing number of visitors, for example in 2016 HKIA
Border Control Point cleared 100 percent of residents and 99.9 percent of visitors, Lo Wu cleared
100 percent of passengers within a 30-minute period.76 However for the land border crossings
waiting times can be longer particularly during peak travel periods in the morning and evenings and
during major public holidays. In addition, even a 30-minute wait at the crossing point means a 30
minute less catchment area for business and 30 minutes not engaged in leisure activities for tourists,
which can also be significant, particularly when multiplied by two for a two-way trip.
73 Note: XRL, HZMB, or Heung Yuen Wai capacity estimates are simply actual projected passenger numbers in recent years, we expect capacity for these routes will likely be higher than this. 74 HKSAR Press Release, LCQ16: Guangzhou-Shenzhen-Hong Kong Express Rail Link forecast data, November 8th 2017. 75 Note: The annual average growth rate of cross boundary patrons between 2015 and 2018. 76 HKSAR Immigration Department, Annual Report 2016.
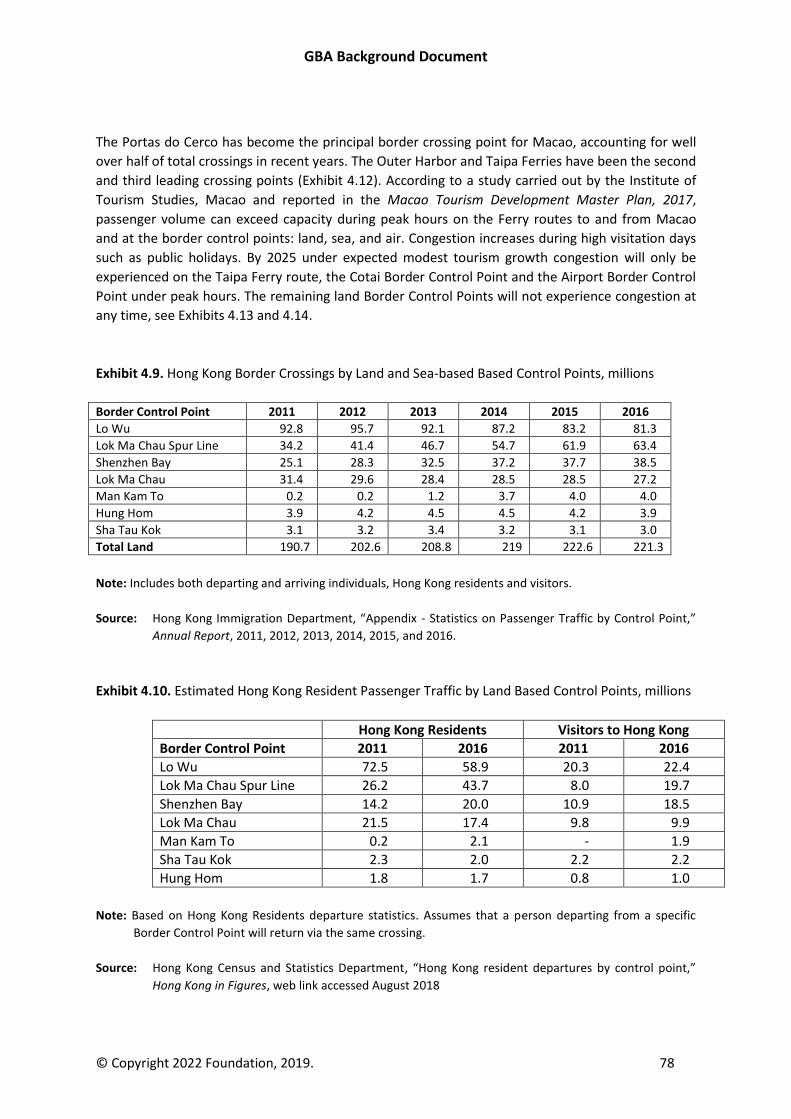
GBA Background Document
© Copyright 2022 Foundation, 2019. 78
The Portas do Cerco has become the principal border crossing point for Macao, accounting for well
over half of total crossings in recent years. The Outer Harbor and Taipa Ferries have been the second
and third leading crossing points (Exhibit 4.12). According to a study carried out by the Institute of
Tourism Studies, Macao and reported in the Macao Tourism Development Master Plan, 2017,
passenger volume can exceed capacity during peak hours on the Ferry routes to and from Macao
and at the border control points: land, sea, and air. Congestion increases during high visitation days
such as public holidays. By 2025 under expected modest tourism growth congestion will only be
experienced on the Taipa Ferry route, the Cotai Border Control Point and the Airport Border Control
Point under peak hours. The remaining land Border Control Points will not experience congestion at
any time, see Exhibits 4.13 and 4.14.
Exhibit 4.9. Hong Kong Border Crossings by Land and Sea-based Based Control Points, millions
Border Control Point 2011 2012 2013 2014 2015 2016
Lo Wu 92.8 95.7 92.1 87.2 83.2 81.3
Lok Ma Chau Spur Line 34.2 41.4 46.7 54.7 61.9 63.4
Shenzhen Bay 25.1 28.3 32.5 37.2 37.7 38.5
Lok Ma Chau 31.4 29.6 28.4 28.5 28.5 27.2
Man Kam To 0.2 0.2 1.2 3.7 4.0 4.0
Hung Hom 3.9 4.2 4.5 4.5 4.2 3.9
Sha Tau Kok 3.1 3.2 3.4 3.2 3.1 3.0
Total Land 190.7 202.6 208.8 219 222.6 221.3
Note: Includes both departing and arriving individuals, Hong Kong residents and visitors.
Source: Hong Kong Immigration Department, “Appendix - Statistics on Passenger Traffic by Control Point,”
Annual Report, 2011, 2012, 2013, 2014, 2015, and 2016.
Exhibit 4.10. Estimated Hong Kong Resident Passenger Traffic by Land Based Control Points, millions
Hong Kong Residents Visitors to Hong Kong
Border Control Point 2011 2016 2011 2016
Lo Wu 72.5 58.9 20.3 22.4
Lok Ma Chau Spur Line 26.2 43.7 8.0 19.7
Shenzhen Bay 14.2 20.0 10.9 18.5
Lok Ma Chau 21.5 17.4 9.8 9.9
Man Kam To 0.2 2.1 - 1.9
Sha Tau Kok 2.3 2.0 2.2 2.2
Hung Hom 1.8 1.7 0.8 1.0
Note: Based on Hong Kong Residents departure statistics. Assumes that a person departing from a specific
Border Control Point will return via the same crossing.
Source: Hong Kong Census and Statistics Department, “Hong Kong resident departures by control point,”
Hong Kong in Figures, web link accessed August 2018
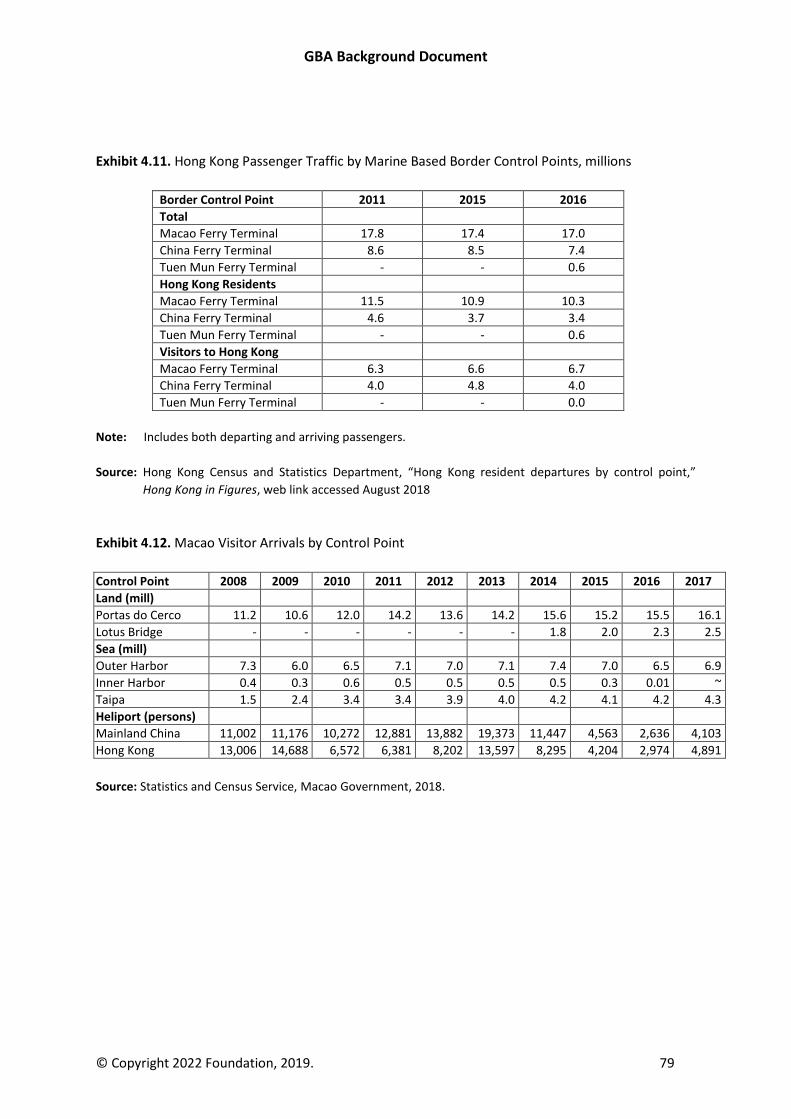
GBA Background Document
© Copyright 2022 Foundation, 2019. 79
Exhibit 4.11. Hong Kong Passenger Traffic by Marine Based Border Control Points, millions
Border Control Point 2011 2015 2016
Total
Macao Ferry Terminal 17.8 17.4 17.0
China Ferry Terminal 8.6 8.5 7.4
Tuen Mun Ferry Terminal - - 0.6
Hong Kong Residents
Macao Ferry Terminal 11.5 10.9 10.3
China Ferry Terminal 4.6 3.7 3.4
Tuen Mun Ferry Terminal - - 0.6
Visitors to Hong Kong
Macao Ferry Terminal 6.3 6.6 6.7
China Ferry Terminal 4.0 4.8 4.0
Tuen Mun Ferry Terminal - - 0.0
Note: Includes both departing and arriving passengers.
Source: Hong Kong Census and Statistics Department, “Hong Kong resident departures by control point,”
Hong Kong in Figures, web link accessed August 2018
Exhibit 4.12. Macao Visitor Arrivals by Control Point
Control Point 2008 2009 2010 2011 2012 2013 2014 2015 2016 2017
Land (mill)
Portas do Cerco 11.2 10.6 12.0 14.2 13.6 14.2 15.6 15.2 15.5 16.1
Lotus Bridge - - - - - - 1.8 2.0 2.3 2.5
Sea (mill)
Outer Harbor 7.3 6.0 6.5 7.1 7.0 7.1 7.4 7.0 6.5 6.9
Inner Harbor 0.4 0.3 0.6 0.5 0.5 0.5 0.5 0.3 0.01 ~
Taipa 1.5 2.4 3.4 3.4 3.9 4.0 4.2 4.1 4.2 4.3
Heliport (persons)
Mainland China 11,002 11,176 10,272 12,881 13,882 19,373 11,447 4,563 2,636 4,103
Hong Kong 13,006 14,688 6,572 6,381 8,202 13,597 8,295 4,204 2,974 4,891
Source: Statistics and Census Service, Macao Government, 2018.
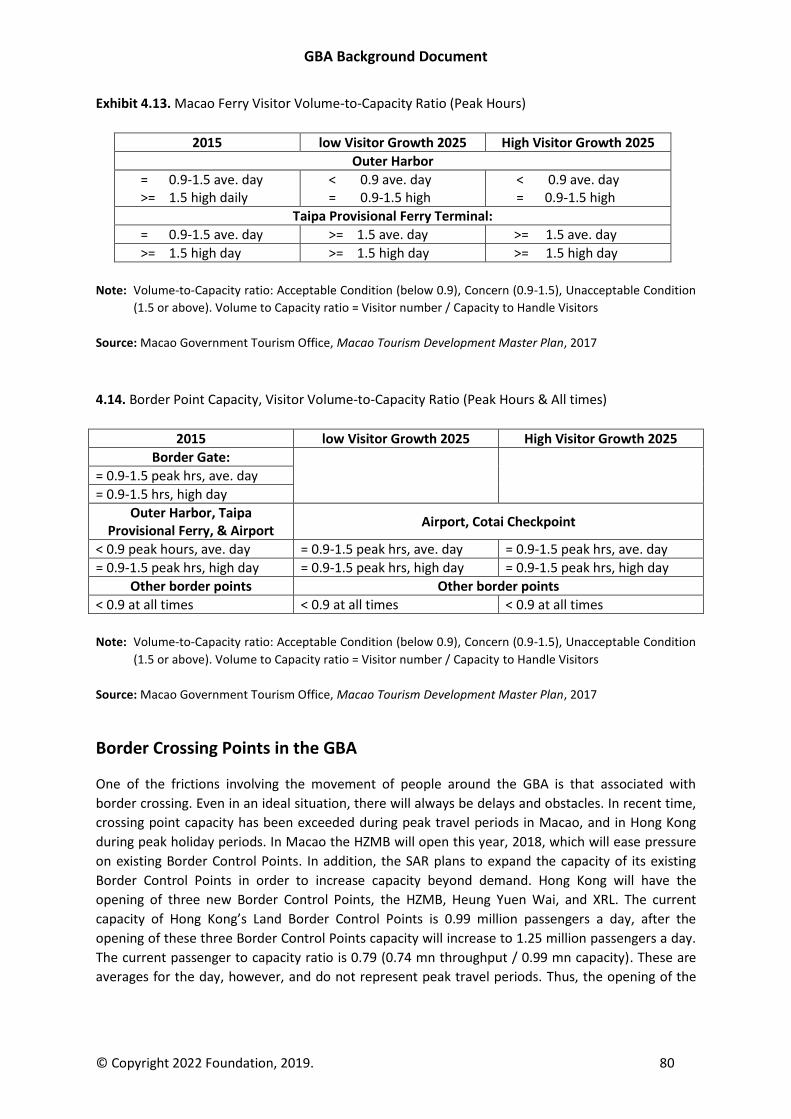
GBA Background Document
© Copyright 2022 Foundation, 2019. 80
Exhibit 4.13. Macao Ferry Visitor Volume-to-Capacity Ratio (Peak Hours)
2015 low Visitor Growth 2025 High Visitor Growth 2025
Outer Harbor
= 0.9-1.5 ave. day >= 1.5 high daily
< 0.9 ave. day = 0.9-1.5 high
< 0.9 ave. day = 0.9-1.5 high
Taipa Provisional Ferry Terminal:
= 0.9-1.5 ave. day >= 1.5 ave. day >= 1.5 ave. day
>= 1.5 high day >= 1.5 high day >= 1.5 high day
Note: Volume-to-Capacity ratio: Acceptable Condition (below 0.9), Concern (0.9-1.5), Unacceptable Condition
(1.5 or above). Volume to Capacity ratio = Visitor number / Capacity to Handle Visitors
Source: Macao Government Tourism Office, Macao Tourism Development Master Plan, 2017
4.14. Border Point Capacity, Visitor Volume-to-Capacity Ratio (Peak Hours & All times)
2015 low Visitor Growth 2025 High Visitor Growth 2025
Border Gate:
= 0.9-1.5 peak hrs, ave. day
= 0.9-1.5 hrs, high day
Outer Harbor, Taipa Provisional Ferry, & Airport
Airport, Cotai Checkpoint
< 0.9 peak hours, ave. day = 0.9-1.5 peak hrs, ave. day = 0.9-1.5 peak hrs, ave. day
= 0.9-1.5 peak hrs, high day = 0.9-1.5 peak hrs, high day = 0.9-1.5 peak hrs, high day
Other border points Other border points
< 0.9 at all times < 0.9 at all times < 0.9 at all times
Note: Volume-to-Capacity ratio: Acceptable Condition (below 0.9), Concern (0.9-1.5), Unacceptable Condition
(1.5 or above). Volume to Capacity ratio = Visitor number / Capacity to Handle Visitors
Source: Macao Government Tourism Office, Macao Tourism Development Master Plan, 2017
Border Crossing Points in the GBA
One of the frictions involving the movement of people around the GBA is that associated with
border crossing. Even in an ideal situation, there will always be delays and obstacles. In recent time,
crossing point capacity has been exceeded during peak travel periods in Macao, and in Hong Kong
during peak holiday periods. In Macao the HZMB will open this year, 2018, which will ease pressure
on existing Border Control Points. In addition, the SAR plans to expand the capacity of its existing
Border Control Points in order to increase capacity beyond demand. Hong Kong will have the
opening of three new Border Control Points, the HZMB, Heung Yuen Wai, and XRL. The current
capacity of Hong Kong’s Land Border Control Points is 0.99 million passengers a day, after the
opening of these three Border Control Points capacity will increase to 1.25 million passengers a day.
The current passenger to capacity ratio is 0.79 (0.74 mn throughput / 0.99 mn capacity). These are
averages for the day, however, and do not represent peak travel periods. Thus, the opening of the
GBA Background Document
© Copyright 2022 Foundation, 2019. 81
additional three border crossings should allow for better accommodation of present as well as
future demand.
We note that passenger to capacity ratios tell us nothing about queue or wait time to go through
border controls. The Hong Kong Immigration Department’s posted performance metrics quote that
95 percent and higher of visitors should wait 15 minutes or less at the airport and 30 minutes or less
at the land Border Control Points. If there are significant wait times on the Mainland side, or for
travel on heavy days, the total wait time could be on the order of an hour or substantially more. To
put this in perspective, an hour is the journey time between Lo Wu and Hung Hom Station, or less
than the time it will take to get to Guangzhou South Station from Hong Kong.
Such wait times make friction-free business travel across the boundary problematic, both because of
the time and the uncertainty. Ideally, for business travel the whole process (Hong Kong and
Mainland) should be predictably under 15 minutes. Leisure travel, which is usually less time
sensitive, can deal with longer wait times. E-channels are already increasing throughput. It might
take additional channels, special business channels, a special business card, or some other
mechanism to enhance the flows. The XRL experience in placing both Hong Kong and Mainland
checkpoints together should also be monitored to see if this model could be used for other crossing
points in the future.77 Channels that accept both Hong Kong home return permits and Mainland
identity cards might be installed. Since the Mainland is already collecting biometric data on
foreigners, foreign passports could potentially be added in the future. Even small savings in time per
person could make a large difference in the overall accessibility across GBA jurisdictions.
77 There is nothing unique about this arrangement. The immigration and customs points for the Eurostar are on the British side for France-bound traffic and the French side for British-bound traffic.
GBA Background Document
© Copyright 2022 Foundation, 2019. 82
5. Human Mobility in the Greater Bay Area
One of the most important flows in the Greater Bay Area is the flow of people from one jurisdiction
to another. Here we summarize the situation with respect to mobility within Guangdong Province as
well as mobility between Guangdong, Hong Kong, and Macao. In addition to reviewing the policy
situation, we also review features that affect mobility, such as access to social services and ability to
buy property in the various jurisdictions.
Guangdong Province
Work Permits, Residence, and Social Security: People from the Chinese Mainland
There are no specific limitations preventing people from Guangdong living or working in the
Guangdong cities in the Greater Bay Area. However, China’s Household Registration system does
place certain practical limits on freedom of mobility within the Chinese Mainland, including
Guangdong. The place of the permanent residence registered, or the location of Hukou, no longer
restricts people’s movement across regions in the Chinese Mainland. However, it still ties people’s
access to social services to their residential status, thereby influencing in practical terms where
people choose to live and work. In general, larger cities have better educational and medical
resources, and better social welfare. People without a local Hukou may be unable to access these
resources and services, they may be restricted in buying and selling property, and they may forgo
pension entitlements and other entitlements that they have in the location where they have
residential status.
In Guangdong’s latest regulation on Hukou, Implementation Opinions of Guangdong People’s
Government on Promoting the Further Reform of Household Registration System (2015), various
tests and requirements are laid out for getting Hukou in different locations, including the length of
time that a person has legally lived in a place, a person’s employment and tax history, their level of
education, skill and capability, and whether they have paid social insurance. Often a points-based
system is used to determine whether a person is awarded local Hukou, and most places allow a
person’s spouse, minor children, and any parents living with them to register for local Hukou.
Guangzhou and Shenzhen are required to strictly control their populations and to attract talent
urgently need for economic development to become local citizens. Guangzhou has implemented a
resident permit management system and a points-based Hukou. Points are accumulated according
to a residence permit holder’s conditions on years of residence, legal stable employment, education,
social insurance payment, tax payment, and skill and capability. Residence permit holders whose
points meet the criteria and additional requirements can apply for a local Hukou. However, people
with talents that the city needs are exempt from the point system and can get the Hukou directly. In
addition, talented individuals can apply for a “Talent Green Card” of five-year validity. During the
validity period, Green Card holders will enjoy basic public services equivalent to a local Hukou holder.
Shenzhen’s Hukou policy divides people into four categories: people with talents that meet certain
criteria, people whose tax payments reach required amounts, and people whose presence supports
certain policies can apply for Hukou without other limitation. Other people are subject to a points-
based Hukou system. Points are accumulated mainly based on legal and stable employment and
GBA Background Document
© Copyright 2022 Foundation, 2019. 83
residence and social insurance payment and Hukou will be given according the points and a yearly
quota.
Zhuhai, Foshan, Dongguan, and Zhongshan allow individuals to apply for local Hukou who have
worked and payed social insurance in the city for 5 years and have legal and stable residence
(including housing rentals). People who meet these criteria can apply for local Hukou for themselves,
spouses, underage children, and parents living with them.
Heyuan, Shaoguan, Meizhou, Shanwei, Yangjiang, Zhaoqing, Qingyuan, Chaozhou, and Yunfu allow
people who have worked and payed social insurance in the city for 3 years and have legal and stable
residence (including housing rentals), their spouses, underage children, and parents living with them
to apply for local Hukou.
Other small towns and small cities in Guangdong allow people who have legal and stable residence
(including housing rentals), their spouses, underage children, and parents living with them to apply
for local Hukou.
In general, people with advanced educations and skills have a great deal more mobility in
Guangdong than others. All nine cities in the PRD have favorable policies on Hukou to attract
talented people. These policies may include immediately granting Hukou, providing home
settlement compensation, providing housing subsidies, and providing immediate access to social
services benefits. The Hukou policy has, in many locations, been used as “an aggressive means of
competition for talent and investment which are regarded as crucial development resources.”78
The types of high-end talent the PRD cities try to attract can be found in Exhibit 5.1. In particular, we
note that the cities try to identify individuals who qualify for the “Thousand Talents Plan” and the
“Ten-thousand Talents Plan.” The “Thousand Talents Plan” was instituted nation-wide in 2008 to
attract high-level talented people, primarily Chinese who have studied and worked abroad, from
overseas who could aid in China’s development. Most of the recipients of this program are in science
and technology fields.79 The “Ten-thousand Talents Scheme,” instituted in 2012, aims to identify and
develop 10,000 top scientists in China into potential Nobel Prize winners in the sciences.80
In addition, special policies have been granted for the Guangdong Free Trade Zone to attract people
from Hong Kong and Macao. In Nansha, Hong Kong and Macao talent can get receive an award on
par with the value difference between the tax burden in the Mainland and in Hong Kong or Macao.
In Qianhai, the employment permit system for Hong Kong and Macao residents was eliminated
(before it became nation-wide policy) to allow professionals with Hong Kong and Macao practicing
qualifications to work freely and personal income tax for all talent including those from Hong Kong
and Macao is at a favorable 15 percent. Hengqin has similar favorable income tax policies for Hong
Kong and Macao residents, as well as other foreign high-end talent.
78 Li Zhang, Citizenship in Urban China: the Case of Points System, working paper, Fudan-UCSD Working Paper, 25 March 2013. 79 Heping Jia, “China’s plan to recruit talented researchers,” Nature, 17 January 2018. 80 “Ten-thousand Talents Program,” China Daily, 12 December 2013.
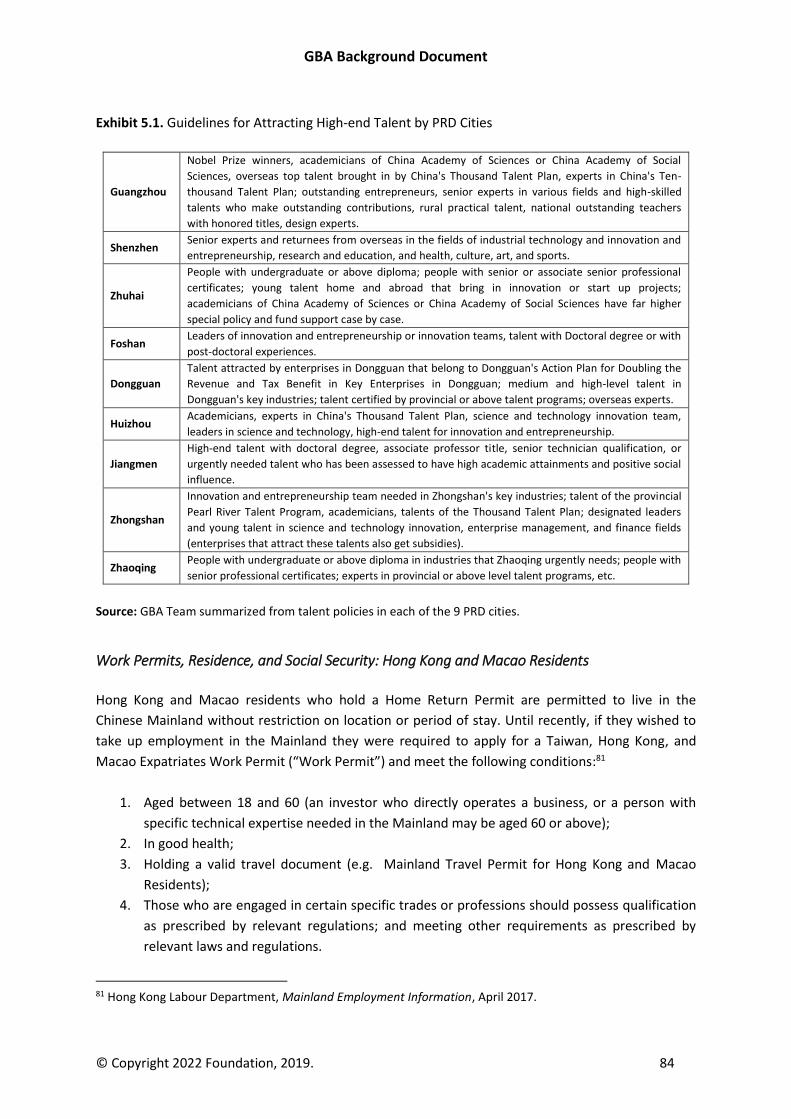
GBA Background Document
© Copyright 2022 Foundation, 2019. 84
Exhibit 5.1. Guidelines for Attracting High-end Talent by PRD Cities
Guangzhou
Nobel Prize winners, academicians of China Academy of Sciences or China Academy of Social
Sciences, overseas top talent brought in by China's Thousand Talent Plan, experts in China's Ten-
thousand Talent Plan; outstanding entrepreneurs, senior experts in various fields and high-skilled
talents who make outstanding contributions, rural practical talent, national outstanding teachers
with honored titles, design experts.
Shenzhen Senior experts and returnees from overseas in the fields of industrial technology and innovation and
entrepreneurship, research and education, and health, culture, art, and sports.
Zhuhai
People with undergraduate or above diploma; people with senior or associate senior professional
certificates; young talent home and abroad that bring in innovation or start up projects;
academicians of China Academy of Sciences or China Academy of Social Sciences have far higher
special policy and fund support case by case.
Foshan Leaders of innovation and entrepreneurship or innovation teams, talent with Doctoral degree or with
post-doctoral experiences.
Dongguan
Talent attracted by enterprises in Dongguan that belong to Dongguan's Action Plan for Doubling the
Revenue and Tax Benefit in Key Enterprises in Dongguan; medium and high-level talent in
Dongguan's key industries; talent certified by provincial or above talent programs; overseas experts.
Huizhou Academicians, experts in China's Thousand Talent Plan, science and technology innovation team,
leaders in science and technology, high-end talent for innovation and entrepreneurship.
Jiangmen
High-end talent with doctoral degree, associate professor title, senior technician qualification, or
urgently needed talent who has been assessed to have high academic attainments and positive social
influence.
Zhongshan
Innovation and entrepreneurship team needed in Zhongshan's key industries; talent of the provincial
Pearl River Talent Program, academicians, talents of the Thousand Talent Plan; designated leaders
and young talent in science and technology innovation, enterprise management, and finance fields
(enterprises that attract these talents also get subsidies).
Zhaoqing People with undergraduate or above diploma in industries that Zhaoqing urgently needs; people with
senior professional certificates; experts in provincial or above level talent programs, etc.
Source: GBA Team summarized from talent policies in each of the 9 PRD cities.
Work Permits, Residence, and Social Security: Hong Kong and Macao Residents
Hong Kong and Macao residents who hold a Home Return Permit are permitted to live in the
Chinese Mainland without restriction on location or period of stay. Until recently, if they wished to
take up employment in the Mainland they were required to apply for a Taiwan, Hong Kong, and
Macao Expatriates Work Permit (“Work Permit”) and meet the following conditions:81
1. Aged between 18 and 60 (an investor who directly operates a business, or a person with
specific technical expertise needed in the Mainland may be aged 60 or above);
2. In good health;
3. Holding a valid travel document (e.g. Mainland Travel Permit for Hong Kong and Macao
Residents);
4. Those who are engaged in certain specific trades or professions should possess qualification
as prescribed by relevant regulations; and meeting other requirements as prescribed by
relevant laws and regulations.
81 Hong Kong Labour Department, Mainland Employment Information, April 2017.
GBA Background Document
© Copyright 2022 Foundation, 2019. 85
To obtain a Work Permit several documents had to be submitted including the would-be employer's
business license, the employee's health certificate, and their valid travel document. The Work Permit
had to be renewed every two years and a change of employers meant reapplication for the permit.
However, on 28 July 2018 China’s State Council published a circular that abolished the requirement
that Taiwan residents, and Hong Kong and Macao Home Return Permit holders (HMT individuals)
have a work permit in order to work in the Mainland.82 The change would dramatically reduce the
paperwork required for Mainland entities to hire people from Hong Kong, Macao, and Taiwan;
(formerly up to ten separate documents were required), and would allow the people affected to
change jobs or locations much more freely. In addition, the requirement that companies only hire
HMT individuals if no local Mainland person was available to do the job and for three-week local
advertisement of positions before hiring an HMT individual would be abolished. The HMT individuals
will still be treated differently when it comes to healthcare, pension, and social security benefits,
however.83
As indicated above, the Guangdong jurisdictions in the GBA have a variety of programs and policies
to attract talented individuals. Depending on the policies, they can be used to attract people from
elsewhere in the Chinese Mainland, from Hong Kong and Macao, or from elsewhere.
Social security
The PRC Social Security Law which took effect in July 2011 has established a basic social security
system, including basic pension, basic medical insurance, work-related injury insurance,
unemployment insurance, and maternity insurance, etc. For any expatriate employees being
employed in the Mainland, employers should be responsible for contributing to social security on
their behalf. The employers' social security contribution, together with the employees' personal
contribution, makes up the employees' social security benefits. For Hong Kong and Macao residents,
employers should, in theory, make contribution to the social security scheme for them. However,
since there is no implementation detail with regard to social security payment for Hong Kong
residents at the moment, employers could exercise their discretion on whether to enroll their Hong
Kong employees in the social security scheme. According to Administrative Regulations on the
Housing Provident Fund promulgated by the State Council, employers and employees are required
to contribute to employees' personal Housing Fund account.
Taxation
Hong Kong tax residents may qualify for tax relief in Mainland China under the Arrangement
between the Mainland of China and the Hong Kong Special Administrative Region for the Avoidance
of Double Taxation and the Prevention of Fiscal Evasion with Respect to Taxes on Income (“the
Arrangement”). Under the Arrangement, double taxation is on Mainland China sourced income is
82 PWC, “China: Taiwan, Hong Kong, and Macao residents no longer need work permits,” 16 August 2018. 83 Dorcas Wong, “China Work Permits No Longer Needed for Taiwan, Hong Kong, and Macao Residents,” China Briefing, 9 August 2018.
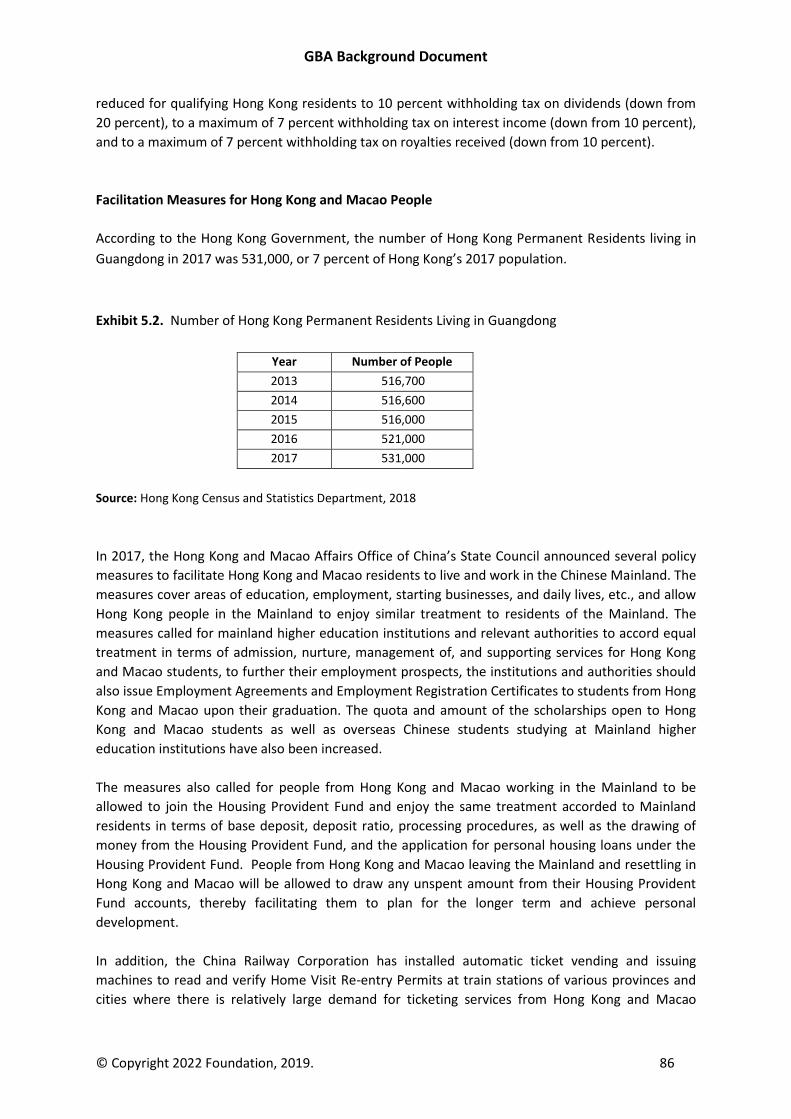
GBA Background Document
© Copyright 2022 Foundation, 2019. 86
reduced for qualifying Hong Kong residents to 10 percent withholding tax on dividends (down from
20 percent), to a maximum of 7 percent withholding tax on interest income (down from 10 percent),
and to a maximum of 7 percent withholding tax on royalties received (down from 10 percent).
Facilitation Measures for Hong Kong and Macao People
According to the Hong Kong Government, the number of Hong Kong Permanent Residents living in
Guangdong in 2017 was 531,000, or 7 percent of Hong Kong’s 2017 population.
Exhibit 5.2. Number of Hong Kong Permanent Residents Living in Guangdong
Year Number of People
2013 516,700
2014 516,600
2015 516,000
2016 521,000
2017 531,000
Source: Hong Kong Census and Statistics Department, 2018
In 2017, the Hong Kong and Macao Affairs Office of China’s State Council announced several policy
measures to facilitate Hong Kong and Macao residents to live and work in the Chinese Mainland. The
measures cover areas of education, employment, starting businesses, and daily lives, etc., and allow
Hong Kong people in the Mainland to enjoy similar treatment to residents of the Mainland. The
measures called for mainland higher education institutions and relevant authorities to accord equal
treatment in terms of admission, nurture, management of, and supporting services for Hong Kong
and Macao students, to further their employment prospects, the institutions and authorities should
also issue Employment Agreements and Employment Registration Certificates to students from Hong
Kong and Macao upon their graduation. The quota and amount of the scholarships open to Hong
Kong and Macao students as well as overseas Chinese students studying at Mainland higher
education institutions have also been increased.
The measures also called for people from Hong Kong and Macao working in the Mainland to be
allowed to join the Housing Provident Fund and enjoy the same treatment accorded to Mainland
residents in terms of base deposit, deposit ratio, processing procedures, as well as the drawing of
money from the Housing Provident Fund, and the application for personal housing loans under the
Housing Provident Fund. People from Hong Kong and Macao leaving the Mainland and resettling in
Hong Kong and Macao will be allowed to draw any unspent amount from their Housing Provident
Fund accounts, thereby facilitating them to plan for the longer term and achieve personal
development.
In addition, the China Railway Corporation has installed automatic ticket vending and issuing
machines to read and verify Home Visit Re-entry Permits at train stations of various provinces and
cities where there is relatively large demand for ticketing services from Hong Kong and Macao
GBA Background Document
© Copyright 2022 Foundation, 2019. 87
people. These ticketing machines can reduce the amount of time otherwise spent on queuing and
processing for tickets at the counter.84
There are also a number of measures that the Hong Kong and Macao Governments have taken that
increase the ability of Hong Kong and Macao residents to live in the GBA. These include portability of
social benefits, including pensions, the ability to attend Hong Kong schools, and others.
Short-Term Business and Tourist Visas
Hong Kong and Macao residents who are Chinese nationals who wish to enter into the Chinese
Mainland need to apply for a Mainland Travel Permit for Hong Kong and Macao Residents, or a
Home Return Permit. The Ministry of Public Security of the People’s Republic of China has
commissioned the sub-branches of the China Travel Service in Hong Kong and Macao to accept Hong
Kong and Macao residents’ applications and authorized the Guangdong Provincial Public Security
Bureau to examine and approve the issuance of Home Return Permits for Hong Kong and Macao
residents.
The Home Return Permit will be issued to the following Hong Kong and Macao residents with
Chinese nationality:85
• Permanent residents of Hong Kong or Macao born in Hong Kong or Macao and possessing
Chinese nationality by birth;
• Mainland residents who have been approved by mainland authorities to immigrate to Hong
Kong or Macao and have already established residency in one of these regions;
• Permanent residents of Hong Kong or Macao with Chinese nationalities who were born in
other Chinese regions;
• Permanent residents of Hong Kong and Macao born in a country or region other than Hong
Kong or Macao and possess Chinese nationality by birth, descent, or naturalization.
Other residents in Hong Kong and Macao need to apply for a China visa to enter the Chinese
Mainland, also through the sub-branches of the China Travel Service (CTS) in Hong Kong and Macao.
According to information posted by the China Travel Service Hong Kong, visitors with valid passports
or travel documents are all welcomed to apply for China Visa via CTS for various purposes including
traveling, visiting relatives, or business. The short-term visa categories include the L visa for tourism
in China: the Q2 and S2 visas for visiting relatives in China: the M visa for business: and the F visa for
cultural exchanges, visits, and study tours in China (there are also the Z visa for employment in China
and the X visa for studying in China).86
84 Hong Kong SAR Government, “Measures facilitating Hong Kong people and enterprises in the development of careers and businesses on the Mainland,” 10 January 2018. 85 The Central Government of the People’s Republic of China, “Guidance for Procedures for Hong Kong and Macao residents to enter into the Mainland,” June 2005. 86 China Travel Service (Hong Kong), China Visa, 2013..
GBA Background Document
© Copyright 2022 Foundation, 2019. 88
Hong Kong and Macao residents or permanent residents who are not Chinese nationals must go
through the same process as all other foreigners to obtain visas for entry into China (China has
granted citizens of only a few countries visa-free access to the PRC).
Once they reach the Mainland immigration control points, the Hong Kong and Macao residents with
Chinese nationality can use their Home Return permits in channels similar to those used by Mainland
residents. Hong Kong and Macao residents with Chinese nationality that do not have a Home Return
permit need to use the manned lanes where their visas are examined. Hong Kong and Macao
permanent residents who are not Chinese nationals must use the “foreigners” lanes at Mainland
immigration control points.
Ability to Buy Property
One interesting area that can affect mobility in the Chinese Mainland is the ability of newcomers to
buy a property. Zhaoqing is the only one of the 9 cities in the PRD that has no restriction on buying
property by people from the Chinese Mainland. The remaining 8 cities restrict the ability to purchase
property either by limiting the number of houses that a person or firm can purchase, or by placing
restrictions on borrowing, or by imposing restrictions on selling property. A person is able to buy no
more than two houses in Guangzhou, Foshan, Dongguan, Shenzhen, and Huizhou, and three houses
in Zhongshan, Zhuhai, and Jiangmen. In Guangzhou, restrictions on selling a house apply to
individuals and to legal entities. Foshan, Shenzhen, Zhongshan, and Jiangmen do not have
restrictions on selling a home. For cities with restrictions on home selling, generally newly purchased
homes cannot be sold within 2-3 years upon the issue of Property Ownership Certificate.
Details of the policies of individual cities are shown in Exhibit 5.3.
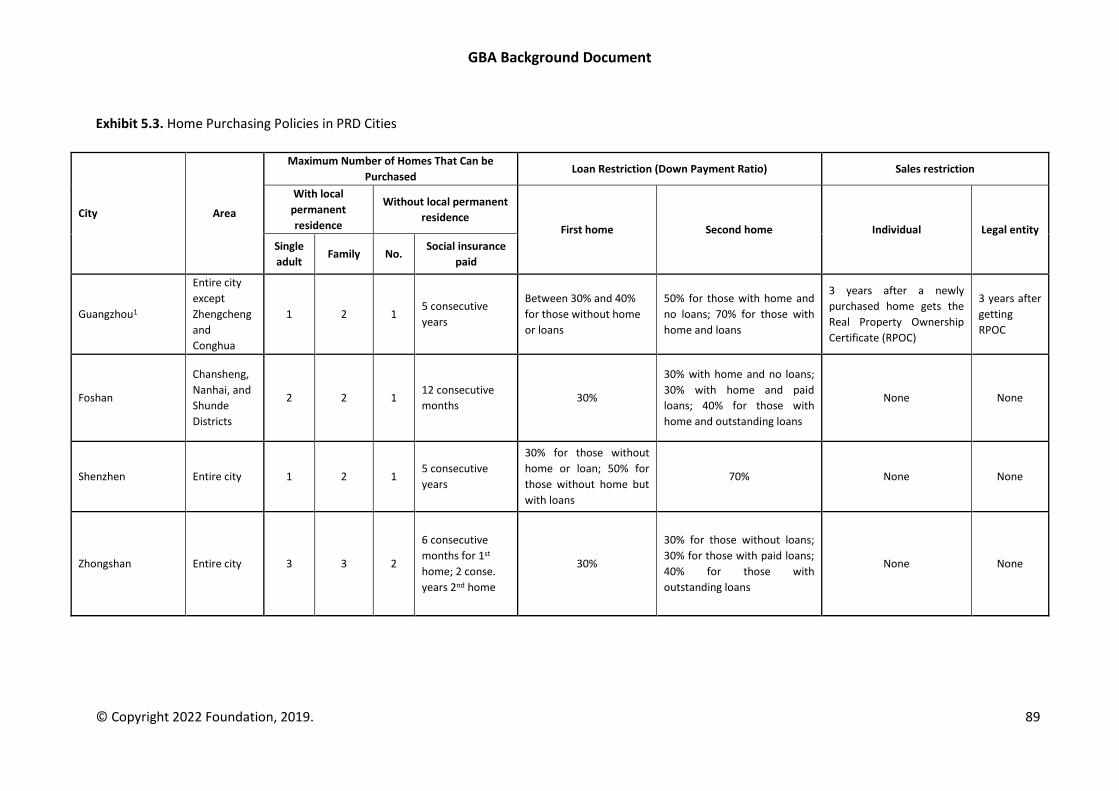
GBA Background Document
© Copyright 2022 Foundation, 2019. 89
Exhibit 5.3. Home Purchasing Policies in PRD Cities
City Area
Maximum Number of Homes That Can be
Purchased Loan Restriction (Down Payment Ratio) Sales restriction
With local
permanent
residence
Without local permanent
residence First home Second home Individual Legal entity
Single
adult Family No.
Social insurance
paid
Guangzhou1
Entire city
except
Zhengcheng
and
Conghua
1 2 1 5 consecutive
years
Between 30% and 40%
for those without home
or loans
50% for those with home and
no loans; 70% for those with
home and loans
3 years after a newly
purchased home gets the
Real Property Ownership
Certificate (RPOC)
3 years after
getting
RPOC
Foshan
Chansheng,
Nanhai, and
Shunde
Districts
2 2 1 12 consecutive
months 30%
30% with home and no loans;
30% with home and paid
loans; 40% for those with
home and outstanding loans
None None
Shenzhen Entire city 1 2 1 5 consecutive
years
30% for those without
home or loan; 50% for
those without home but
with loans
70% None None
Zhongshan Entire city 3 3 2
6 consecutive
months for 1st
home; 2 conse.
years 2nd home
30%
30% for those without loans;
30% for those with paid loans;
40% for those with
outstanding loans
None None
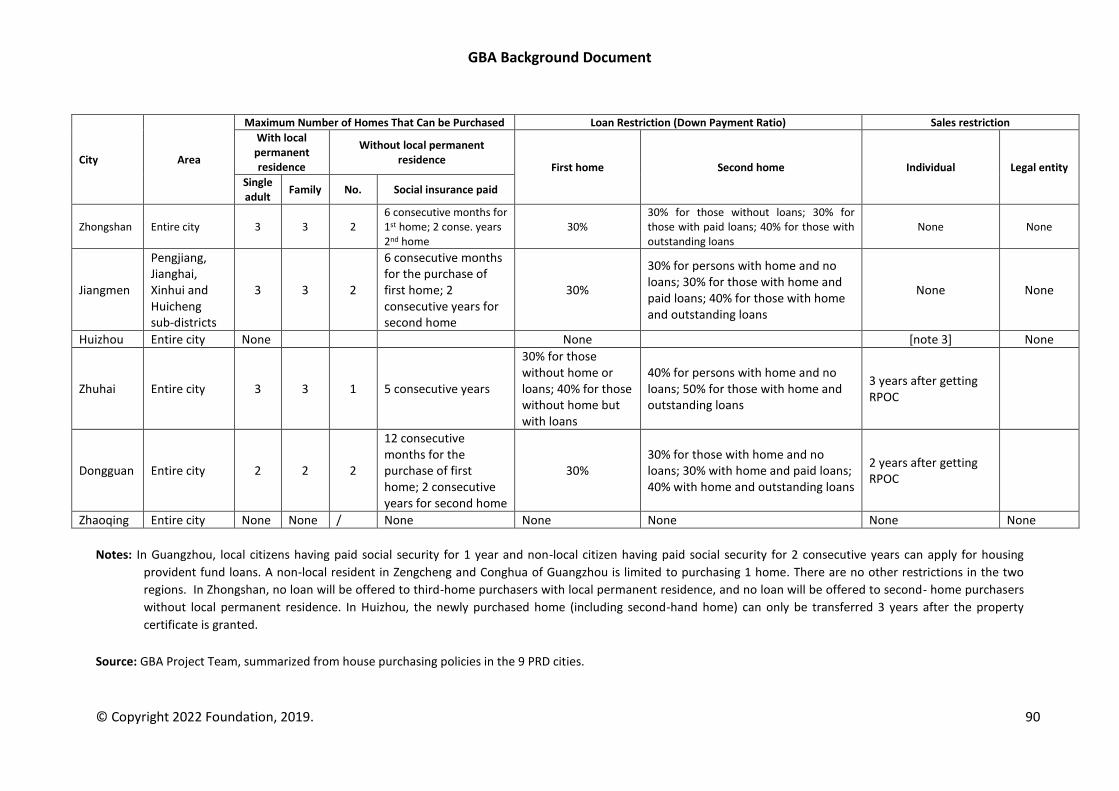
GBA Background Document
© Copyright 2022 Foundation, 2019. 90
City Area
Maximum Number of Homes That Can be Purchased Loan Restriction (Down Payment Ratio) Sales restriction
With local permanent residence
Without local permanent residence
First home Second home Individual Legal entity Single adult
Family No. Social insurance paid
Zhongshan Entire city 3 3 2 6 consecutive months for 1st home; 2 conse. years 2nd home
30% 30% for those without loans; 30% for those with paid loans; 40% for those with outstanding loans
None None
Jiangmen
Pengjiang, Jianghai, Xinhui and Huicheng sub-districts
3 3 2
6 consecutive months for the purchase of first home; 2 consecutive years for second home
30%
30% for persons with home and no loans; 30% for those with home and paid loans; 40% for those with home and outstanding loans
None None
Huizhou Entire city None None [note 3] None
Zhuhai Entire city 3 3 1 5 consecutive years
30% for those without home or loans; 40% for those without home but with loans
40% for persons with home and no loans; 50% for those with home and outstanding loans
3 years after getting RPOC
Dongguan Entire city 2 2 2
12 consecutive months for the purchase of first home; 2 consecutive years for second home
30% 30% for those with home and no loans; 30% with home and paid loans; 40% with home and outstanding loans
2 years after getting RPOC
Zhaoqing Entire city None None / None None None None None
Notes: In Guangzhou, local citizens having paid social security for 1 year and non-local citizen having paid social security for 2 consecutive years can apply for housing
provident fund loans. A non-local resident in Zengcheng and Conghua of Guangzhou is limited to purchasing 1 home. There are no other restrictions in the two
regions. In Zhongshan, no loan will be offered to third-home purchasers with local permanent residence, and no loan will be offered to second- home purchasers
without local permanent residence. In Huizhou, the newly purchased home (including second-hand home) can only be transferred 3 years after the property
certificate is granted.
Source: GBA Project Team, summarized from house purchasing policies in the 9 PRD cities.
GBA Background Document
© Copyright 2022 Foundation, 2019. 91
Hong Kong and Macao
Work Permits, Residence, and Social Security
Only Hong Kong Permanent Residents are permitted to take up employment in the SAR without first
gaining authorization from the Hong Kong Government’s Immigration Department (IMD). Hong Kong has
a range of visa options to the prospective immigrant. Broadly, all the work visa categories are aimed at
attracting degree educated/technical, skilled and experienced individuals. At present it is not possible
for a Mainland resident to live and work in Hong Kong SAR or Macao SAR without any restrictions. They
must first obtain the relevant work or dependent entry visa from the Hong Kong SAR or Macao SAR
Governments. There are two main work visa categories in Hong Kong, the General Employment Policy
(GEP) and the Admission Scheme for Mainland Talents and Professionals (ASMTP). The GEP is aimed at
all nationalities excluding residents of Mainland China, while the ASMTP is aimed exclusively at
Mainland residents. Visas and entry permits issued by Hong Kong SAR Immigration Department for the
period 2009-2016 are shown in Exhibit 5.4.
A similar situation exists in Macao where only Permanent Residents are permitted to take up
employment in the SAR without first gaining authorization from the Macao Government’s Human
Resource Office. Macao has two distinct aims: to fill short term gaps in the labor market (Non-resident
Worker) and to attract investment/talent to facilitate Macao’s long-term growth (Temporary Resident).
There are three basic categories of non-resident worker: 1) Specialized Worker with a tertiary degree or
high qualified technical skills or professional experience, 2) Domestic Worker, and 3) Non-specialized
Worker. The employment permit is vested with the employer and it is through them that the application
is made. The decision on whether a permit is issued or not is judged based on availability of current
resident workers who can occupy the same position, specific needs of the labor market in each sector,
the qualifications and experience of the applicant, employment conditions and the employer’s financial
ability to support the worker.87 Applications are based on merit and not national origin. Once an
employee’s contract ends, they are obliged to leave Macao as soon as possible. This employment route
does not lead to Permanent Residency.
For Temporary Resident there are two routes: Investment or Employment as management and/or
technical personnel. The application process is administered by Macao Trade and Investment Promotion
Institute. The criteria for the investment route include what industry invested in, the degree of
investment currently implemented, Macao employment generated/will be generated, and other
beneficial factors for Macao among others. Management / Technical criteria include: academic
qualifications, professional qualifications, work experience, job offer and position, and salary, among
87 Macao SAR Government, Law for the employment of non-resident workers, Law No.21/2009.
GBA Background Document
© Copyright 2022 Foundation, 2019. 92
others. It is possible for a qualified Non-Resident Worker to apply for this category once living and
working in Macao. 88 This route can lead to Permanent Residency.
In addition to visas and entry permits linked to employment, there is a One-Way Permit policy that
enables close family members (spouse, children, and parents) of a Hong Kong/Macao Permanent
Resident to emigrate from Mainland China to Hong Kong/Macao. Applicants are screened by Mainland
authorities using a points system, with points allocated based on relationship (spouse, child, or parent),
age of applicant, length of separation time, and whether the applicant requires care (children and
elderly applicants). There are no points based on the applicant’s education level or skill base and the
total is limited by a quota. Hong Kong and Macao do not participate in the vetting process and have no
say in who is allowed to enter.
The quota for Hong Kong is currently set at 150 persons per day. The number of daily arrivals from 1999
to 2017 ranged from 100 to 150 individuals with an average of 130 per day, with annual totals from
34,000 to 58,000 with an average of 48,000. The portion of entrants with a secondary education
increased from 64 percent in 1999 to 68 percent in 2017, while the portion with a tertiary education
increased from five percent in 1999 to 21 percent in 2017. The percentage of entrants with Primary and
below levels of education declined from 31 percent in 1999 to 11 percent in 2017. For 1999 to 2017 for
all years Guangdong was the major source by far of immigrants though this share has been declining. In
1999, 82 percent of immigrants were from Guangdong decreasing to 65 percent by 2017 (Exhibit 5.5).
There have been calls in Hong Kong to try to renegotiate this system, for example to change it to a
points system focused on highly-qualified individuals like in Guangzhou or Shenzhen, but as the
sovereign power, the Central Government retains complete control.
After seven years of ordinary residence in Hong Kong (or Macao) a resident may apply to become a
Permanent Resident which, once granted, allows them to live and work in Hong Kong (or Macao) as they
choose without having to seek permission from the Government to change jobs. Certain types of worker
are not permitted to apply for Permanent Residence, In Hong Kong domestic helpers and in Macao
persons issued with a non-resident worker permit are not permitted to apply for Permanent Residence.
88 Macao Trade and Investment Promotion Institute, “Investment Residency,” 2018.
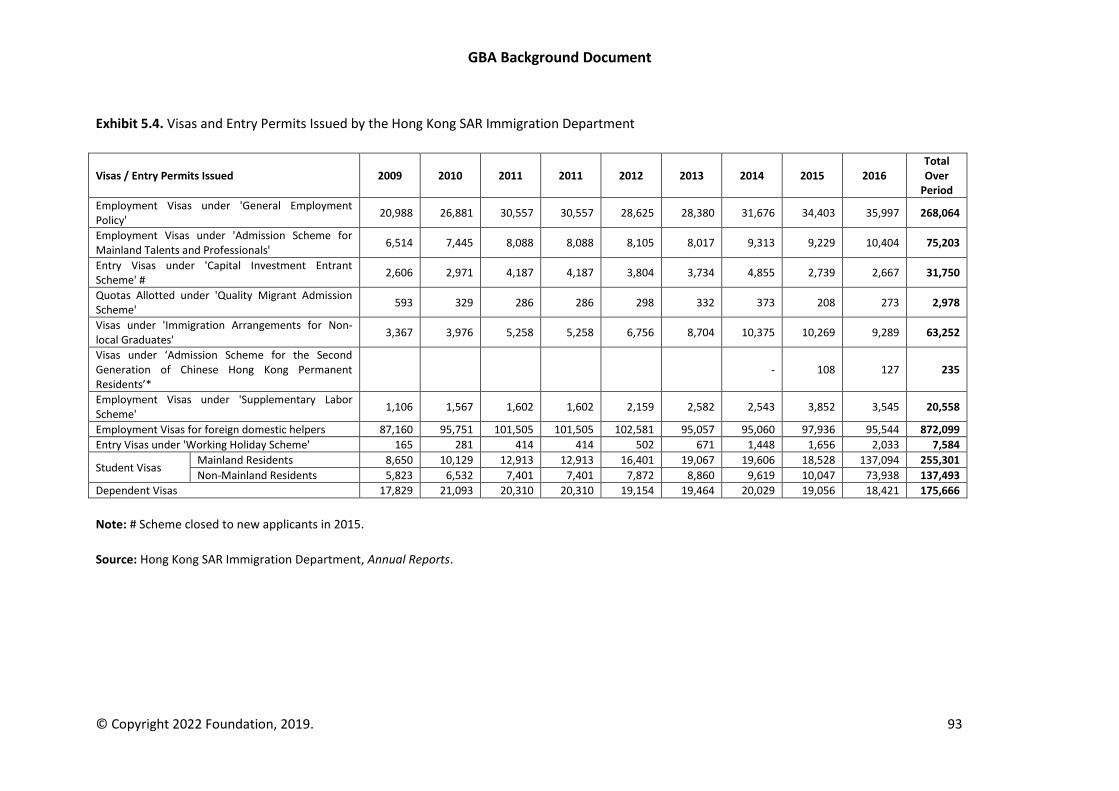
GBA Background Document
© Copyright 2022 Foundation, 2019. 93
Exhibit 5.4. Visas and Entry Permits Issued by the Hong Kong SAR Immigration Department
Visas / Entry Permits Issued 2009 2010 2011 2011 2012 2013 2014 2015 2016 Total Over
Period
Employment Visas under 'General Employment Policy'
20,988 26,881 30,557 30,557 28,625 28,380 31,676 34,403 35,997 268,064
Employment Visas under 'Admission Scheme for Mainland Talents and Professionals'
6,514 7,445 8,088 8,088 8,105 8,017 9,313 9,229 10,404 75,203
Entry Visas under 'Capital Investment Entrant Scheme' #
2,606 2,971 4,187 4,187 3,804 3,734 4,855 2,739 2,667 31,750
Quotas Allotted under 'Quality Migrant Admission Scheme'
593 329 286 286 298 332 373 208 273 2,978
Visas under 'Immigration Arrangements for Non-local Graduates'
3,367 3,976 5,258 5,258 6,756 8,704 10,375 10,269 9,289 63,252
Visas under ‘Admission Scheme for the Second Generation of Chinese Hong Kong Permanent Residents’*
- 108 127 235
Employment Visas under 'Supplementary Labor Scheme'
1,106 1,567 1,602 1,602 2,159 2,582 2,543 3,852 3,545 20,558
Employment Visas for foreign domestic helpers 87,160 95,751 101,505 101,505 102,581 95,057 95,060 97,936 95,544 872,099
Entry Visas under 'Working Holiday Scheme' 165 281 414 414 502 671 1,448 1,656 2,033 7,584
Student Visas Mainland Residents 8,650 10,129 12,913 12,913 16,401 19,067 19,606 18,528 137,094 255,301
Non-Mainland Residents 5,823 6,532 7,401 7,401 7,872 8,860 9,619 10,047 73,938 137,493
Dependent Visas 17,829 21,093 20,310 20,310 19,154 19,464 20,029 19,056 18,421 175,666
Note: # Scheme closed to new applicants in 2015.
Source: Hong Kong SAR Immigration Department, Annual Reports.
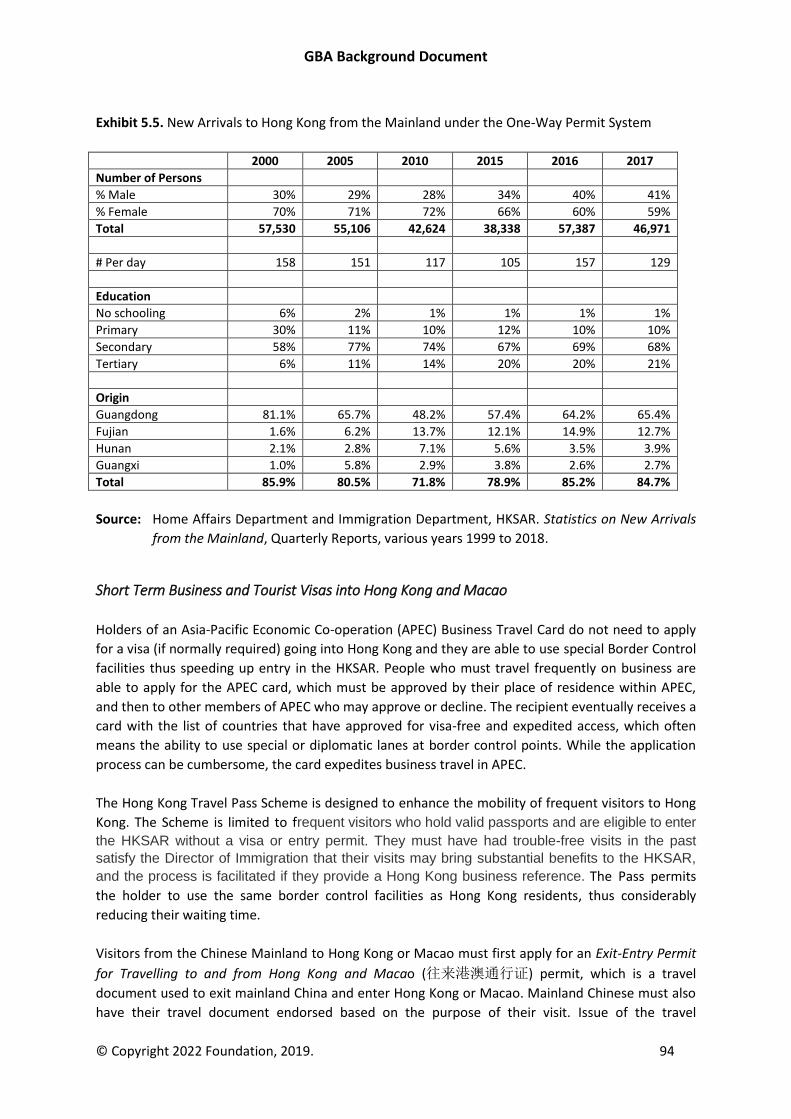
GBA Background Document
© Copyright 2022 Foundation, 2019. 94
Exhibit 5.5. New Arrivals to Hong Kong from the Mainland under the One-Way Permit System
2000 2005 2010 2015 2016 2017
Number of Persons
% Male 30% 29% 28% 34% 40% 41%
% Female 70% 71% 72% 66% 60% 59%
Total 57,530 55,106 42,624 38,338 57,387 46,971
# Per day 158 151 117 105 157 129
Education
No schooling 6% 2% 1% 1% 1% 1%
Primary 30% 11% 10% 12% 10% 10%
Secondary 58% 77% 74% 67% 69% 68%
Tertiary 6% 11% 14% 20% 20% 21%
Origin
Guangdong 81.1% 65.7% 48.2% 57.4% 64.2% 65.4%
Fujian 1.6% 6.2% 13.7% 12.1% 14.9% 12.7%
Hunan 2.1% 2.8% 7.1% 5.6% 3.5% 3.9%
Guangxi 1.0% 5.8% 2.9% 3.8% 2.6% 2.7%
Total 85.9% 80.5% 71.8% 78.9% 85.2% 84.7%
Source: Home Affairs Department and Immigration Department, HKSAR. Statistics on New Arrivals
from the Mainland, Quarterly Reports, various years 1999 to 2018.
Short Term Business and Tourist Visas into Hong Kong and Macao
Holders of an Asia-Pacific Economic Co-operation (APEC) Business Travel Card do not need to apply
for a visa (if normally required) going into Hong Kong and they are able to use special Border Control
facilities thus speeding up entry in the HKSAR. People who must travel frequently on business are
able to apply for the APEC card, which must be approved by their place of residence within APEC,
and then to other members of APEC who may approve or decline. The recipient eventually receives a
card with the list of countries that have approved for visa-free and expedited access, which often
means the ability to use special or diplomatic lanes at border control points. While the application
process can be cumbersome, the card expedites business travel in APEC.
The Hong Kong Travel Pass Scheme is designed to enhance the mobility of frequent visitors to Hong
Kong. The Scheme is limited to frequent visitors who hold valid passports and are eligible to enter
the HKSAR without a visa or entry permit. They must have had trouble-free visits in the past
satisfy the Director of Immigration that their visits may bring substantial benefits to the HKSAR,
and the process is facilitated if they provide a Hong Kong business reference. The Pass permits
the holder to use the same border control facilities as Hong Kong residents, thus considerably
reducing their waiting time.
Visitors from the Chinese Mainland to Hong Kong or Macao must first apply for an Exit-Entry Permit
for Travelling to and from Hong Kong and Macao (往来港澳通行证) permit, which is a travel
document used to exit mainland China and enter Hong Kong or Macao. Mainland Chinese must also
have their travel document endorsed based on the purpose of their visit. Issue of the travel
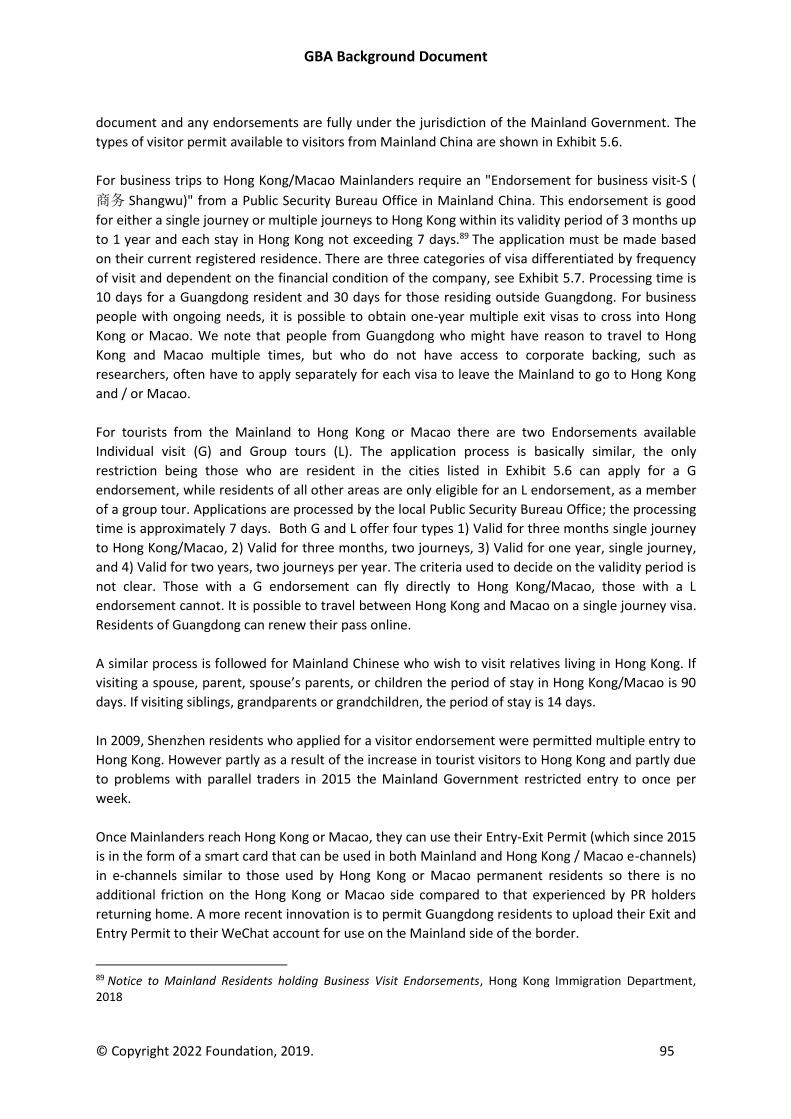
GBA Background Document
© Copyright 2022 Foundation, 2019. 95
document and any endorsements are fully under the jurisdiction of the Mainland Government. The
types of visitor permit available to visitors from Mainland China are shown in Exhibit 5.6.
For business trips to Hong Kong/Macao Mainlanders require an "Endorsement for business visit-S (
商务 Shangwu)" from a Public Security Bureau Office in Mainland China. This endorsement is good
for either a single journey or multiple journeys to Hong Kong within its validity period of 3 months up
to 1 year and each stay in Hong Kong not exceeding 7 days.89 The application must be made based
on their current registered residence. There are three categories of visa differentiated by frequency
of visit and dependent on the financial condition of the company, see Exhibit 5.7. Processing time is
10 days for a Guangdong resident and 30 days for those residing outside Guangdong. For business
people with ongoing needs, it is possible to obtain one-year multiple exit visas to cross into Hong
Kong or Macao. We note that people from Guangdong who might have reason to travel to Hong
Kong and Macao multiple times, but who do not have access to corporate backing, such as
researchers, often have to apply separately for each visa to leave the Mainland to go to Hong Kong
and / or Macao.
For tourists from the Mainland to Hong Kong or Macao there are two Endorsements available
Individual visit (G) and Group tours (L). The application process is basically similar, the only
restriction being those who are resident in the cities listed in Exhibit 5.6 can apply for a G
endorsement, while residents of all other areas are only eligible for an L endorsement, as a member
of a group tour. Applications are processed by the local Public Security Bureau Office; the processing
time is approximately 7 days. Both G and L offer four types 1) Valid for three months single journey
to Hong Kong/Macao, 2) Valid for three months, two journeys, 3) Valid for one year, single journey,
and 4) Valid for two years, two journeys per year. The criteria used to decide on the validity period is
not clear. Those with a G endorsement can fly directly to Hong Kong/Macao, those with a L
endorsement cannot. It is possible to travel between Hong Kong and Macao on a single journey visa.
Residents of Guangdong can renew their pass online.
A similar process is followed for Mainland Chinese who wish to visit relatives living in Hong Kong. If
visiting a spouse, parent, spouse’s parents, or children the period of stay in Hong Kong/Macao is 90
days. If visiting siblings, grandparents or grandchildren, the period of stay is 14 days.
In 2009, Shenzhen residents who applied for a visitor endorsement were permitted multiple entry to
Hong Kong. However partly as a result of the increase in tourist visitors to Hong Kong and partly due
to problems with parallel traders in 2015 the Mainland Government restricted entry to once per
week.
Once Mainlanders reach Hong Kong or Macao, they can use their Entry-Exit Permit (which since 2015
is in the form of a smart card that can be used in both Mainland and Hong Kong / Macao e-channels)
in e-channels similar to those used by Hong Kong or Macao permanent residents so there is no
additional friction on the Hong Kong or Macao side compared to that experienced by PR holders
returning home. A more recent innovation is to permit Guangdong residents to upload their Exit and
Entry Permit to their WeChat account for use on the Mainland side of the border.
89 Notice to Mainland Residents holding Business Visit Endorsements, Hong Kong Immigration Department, 2018
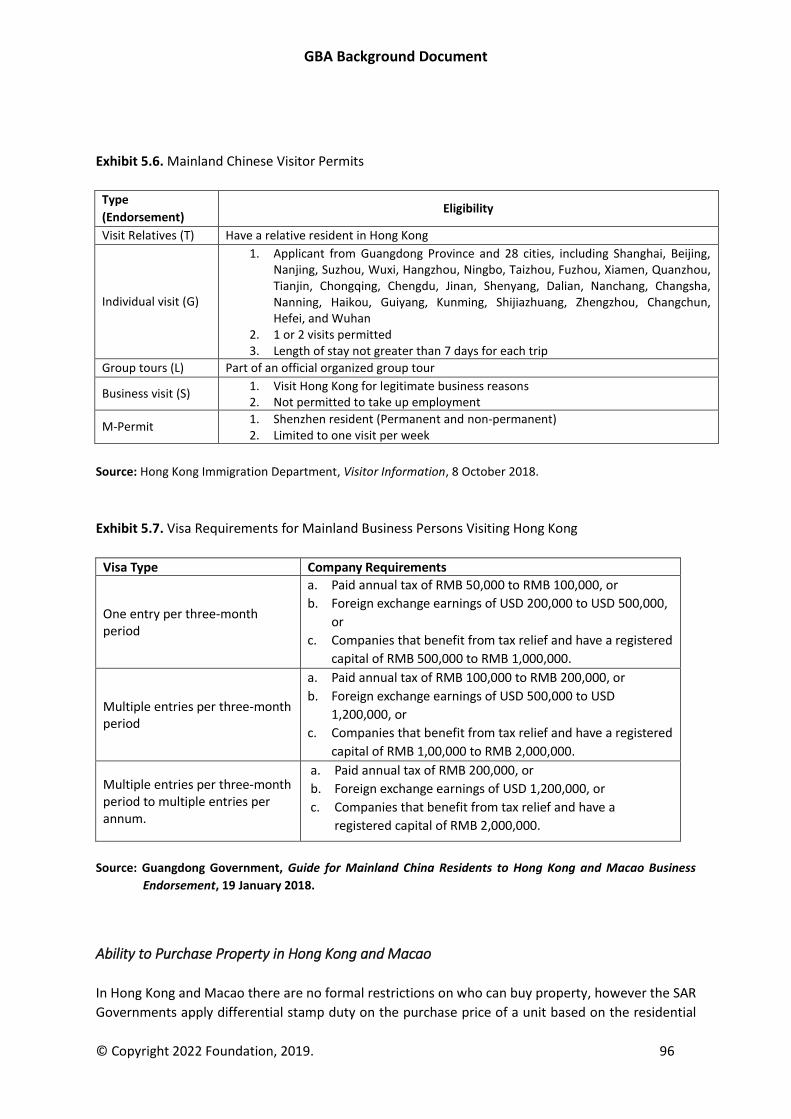
GBA Background Document
© Copyright 2022 Foundation, 2019. 96
Exhibit 5.6. Mainland Chinese Visitor Permits
Type
(Endorsement) Eligibility
Visit Relatives (T) Have a relative resident in Hong Kong
Individual visit (G)
1. Applicant from Guangdong Province and 28 cities, including Shanghai, Beijing, Nanjing, Suzhou, Wuxi, Hangzhou, Ningbo, Taizhou, Fuzhou, Xiamen, Quanzhou, Tianjin, Chongqing, Chengdu, Jinan, Shenyang, Dalian, Nanchang, Changsha, Nanning, Haikou, Guiyang, Kunming, Shijiazhuang, Zhengzhou, Changchun, Hefei, and Wuhan
2. 1 or 2 visits permitted 3. Length of stay not greater than 7 days for each trip
Group tours (L) Part of an official organized group tour
Business visit (S) 1. Visit Hong Kong for legitimate business reasons 2. Not permitted to take up employment
M-Permit 1. Shenzhen resident (Permanent and non-permanent) 2. Limited to one visit per week
Source: Hong Kong Immigration Department, Visitor Information, 8 October 2018.
Exhibit 5.7. Visa Requirements for Mainland Business Persons Visiting Hong Kong
Visa Type Company Requirements
One entry per three-month period
a. Paid annual tax of RMB 50,000 to RMB 100,000, or
b. Foreign exchange earnings of USD 200,000 to USD 500,000,
or
c. Companies that benefit from tax relief and have a registered
capital of RMB 500,000 to RMB 1,000,000.
Multiple entries per three-month period
a. Paid annual tax of RMB 100,000 to RMB 200,000, or
b. Foreign exchange earnings of USD 500,000 to USD
1,200,000, or
c. Companies that benefit from tax relief and have a registered
capital of RMB 1,00,000 to RMB 2,000,000.
Multiple entries per three-month period to multiple entries per annum.
a. Paid annual tax of RMB 200,000, or
b. Foreign exchange earnings of USD 1,200,000, or
c. Companies that benefit from tax relief and have a
registered capital of RMB 2,000,000.
Source: Guangdong Government, Guide for Mainland China Residents to Hong Kong and Macao Business
Endorsement, 19 January 2018.
Ability to Purchase Property in Hong Kong and Macao
In Hong Kong and Macao there are no formal restrictions on who can buy property, however the SAR
Governments apply differential stamp duty on the purchase price of a unit based on the residential
GBA Background Document
© Copyright 2022 Foundation, 2019. 97
status of the purchaser, whether the purchaser is a company or an individual, and whether the
purchaser already owns a property in the SAR. In Hong Kong, rates of stamp duty vary with a Hong
Kong permanent resident who is a first-time buyer paying no stamp duty, up to rates of 30 percent
and more for non-residents. In Macao, rates of stamp duty also vary depending on whether the
purchaser is resident in Macao (stamp duty of 0.5 percent), a non-resident of company (stamp duty
of 10 percent), and higher in some instances.
Human Mobility in the GBA
The rules and regulations concerning residence, work permits, immigration, business visas, and
tourist visas affect mobility in the GBA. Historically, it has been cumbersome for residents of Hong
Kong or Macao to work in Guangdong and for residents of Guangdong to work in Hong Kong and
Macao. In addition, in the past it was difficult for residents of one Guangdong city in the GBA to live
and work in other cities in the GBA.
Guangdong residents can now live and work in any city in the province without work permits or
formal permission. However, the fact that many social benefits, services, and local rights (such as the
ability buy a property) are linked to residence status makes this mobility less than complete.
Obtaining residence status for such people in a Guangdong city depends on the city, as well as on
the person themselves, their education, background, employment history, and whether they have
talents that lead cities to use residence Hukou as a recruitment tool. The PRC has recently
announced the abolishment of work permit requirements for Hong Kong, Macao, and Taiwan
residents with Chinese nationality in the Mainland. This combined with policies to facilitate HMT
individuals living and working in the PRC is making it much easier. The question is whether these
policy changes are enough to encourage more people to move across the boundaries. The fact that
around 7 percent of Hong Kongers have decided to live in Guangdong indicates that there is an
attraction for some. But not necessarily for many.
For Guangdong residents, Hong Kong and Macao require work permits in order to take up
employment. One question is whether Hong Kong and Macao will be able to obtain greater influence
over their immigration from the Chinese Mainland in order to implement an overall strategy in
addition to the talent schemes already in place. One view is that Hong Kong and Macao, just like
Guangzhou and Shenzhen should be viewed as places that have limited population carrying capacity
and should have a mandate to accept people who will contribute most to their economic
development and their ability to contribute to the GBA and to the country. The counter is that family
reunification is desirable from a social standpoint and that Guangzhou and Shenzhen have provisions
where family members can join residents who have been given Hukou much easier than is the case
in Hong Kong or Macao.
For short-term business and leisure visits, Hong Kong and Macao residents with Chinese nationality
already have very easy access to the Mainland, including the GBA as long as they have applied for
and received a Home Return permit. They can use channels similar to those of Mainland residents on
the Mainland side with no additional frictions. The same is true of Guangdong residents of Chinese
nationality when they reach the Hong Kong or Macao side. Thus, while border crossing time is
always an issue that can only be dealt with through streamlined processes and increased capacity at
the crossing points. The major frictions for Mainland visitors to Hong Kong and Macao, including GBA
GBA Background Document
© Copyright 2022 Foundation, 2019. 98
residents, involve applying for and receiving approvals and exit permits from Mainland authorities.
Another place there are frictions are for Hong Kong and Macao residents and permanent residents
who do not have Chinese nationality. While these people may apply for multi-entry visas of up to ten
years, they still may face waiting with foreign tourists at crossing points.
GBA Background Document
© Copyright 2022 Foundation, 2019. 99
6. Initiatives, Programs, Plans, and Policies Related to GBA Cooperation and Development
There are numerous governmental plans and initiatives related to the development of the GBA and
the development of GBA cooperation. These include plans specific to the GBA, plans related to the
GBA, and other plans that impact the various parts of the GBA either together or individually.
Together they define a complex and overlapping web of initiatives, programs, plans, and policies
that can be used as a basis for enhancing economic interaction and integration in the GBA as well as
the overall development of the region.
Plans Specific to the GBA
First, we will focus on plans that are specifically focused on GBA interaction and integration and then
plans that are related to GBA development, or development within the GBA.
The GBA Initiative Current interest in the GBA stems in significant part from the signing of The Framework Agreement on Deepening Guangdong-Hong Kong-Macao Cooperation in the Development of the Bay Area (The Agreement) on 1 July 2017. This document provides objectives and goals for cooperation key cooperation areas, and institutional arrangements to facilitate cooperation. The idea in part is to learn from other “Bay Areas,” including San Francisco, New York, Tokyo, and others to create an innovative, vibrant, integrated modern economy. The different parts of the Bay Area are each to have their own role. The Guangdong portion (or PRD) is to be a technology and industrial innovation center, an advanced manufacturing and modern service industries base, and a pilot zone for reform and opening for the Chinese Mainland. Hong Kong is to be an international financial, transportation, and trade center; a global offshore Renminbi business hub; and an international asset management center. Hong Kong is also to develop its professional services and innovation and technology industries and to be a center for international legal and dispute resolution services for the Asia-Pacific Region. Macao is to be a global tourism and leisure center, an economic and trade cooperation platform between China and Portuguese-speaking countries, and an exchange and cooperation base with Chinese culture as its mainstream and leveraging the co-existence of different cultures. The individual attributes of the different components of the Bay Area are to combine to make it a leader in China’s development. The key cooperation areas called for in the Agreement are to promote infrastructure connectivity, to enhance the level of market integration, to build a global technology and innovation hub, to build a modern system of industries through coordinated development, and to jointly build a quality living circle to provide an ideal place for living, working, and travelling. In order to enhance the level of market integration, the Agreement calls on the parties to implement the Closer Economic Partnership Arrangement (CEPA) between the Mainland and Hong Kong, the Mainland and Macao, and their Supplements; promote the convenient flow of factors of production; enhance the efficiency of immigration and customs clearance, and enhance of the flow of people and goods; encourage an increase in investment between Mainland and Hong Kong and Macao
GBA Background Document
© Copyright 2022 Foundation, 2019. 100
enterprises; encourage Hong Kong and Macao people to invest, set up businesses, and take up employment in Guangdong and provide Hong Kong and Macao residents with more development opportunities; and provide better conditions for Hong Kong and Macao residents to live on the Mainland. To support the Bay Area in taking the lead and setting an example for the nation’s participation in high-level international collaboration the parties are to deepen cooperation with countries along the “Belt and Road” in infrastructure connectivity, commerce and trade, financial services, ecological and environmental protection, and people-to-people exchanges; build an important support area for pursuing the “Belt and Road” Initiative; and jointly engage in international collaboration on production capacity and “going global” together.
To support the establishment of major cooperation platforms, the Agreement calls for promotion of Guangdong-Hong Kong-Macao cooperation platforms in Qianhai of Shenzhen, Nansha of Guangzhou, and Hengqin of Zhuhai, among others. It calls for the promotion of a business start-up and employment base for young people of Hong Kong and Macao to start up business and work in Guangdong. It calls for the establishment of cooperation platforms including the Hong Kong-Shenzhen Innovation and Technology Park, Daguang Bay Economic Zone in Jiangmen, and Guangdong-Macao Comprehensive Cooperation Demonstration Zone in Zhongshan. Finally, it also calls for the region to leverage the demonstrative effect of the cooperation platforms and expand the development potential for micro, small, and medium enterprises of Hong Kong and Macao in Guangdong.
Prior GBA Plans
While current interest in the GBA stems in significant part from the signing of The Framework Agreement, there have been a number of documents and programs that have directly or indirectly promoted close cooperation between Guangdong, Hong Kong, and Macao or have facilitated such cooperation. Documents directly related to the GBA include The Outline of the Plan for the Reform and Development of the Pearl River Delta (2008-2020), Regional Cooperation Plan on Building a Quality Living Area (2012), and Study on the Action Plan for a Livable Bay Area of the Pearl River Estuary (2014). The Outline of the Plan for the Reform and Development of the Pearl River Delta (2008-2020) (The Outline) compiled by China’s National Development and Reform Commission and approved by the State Council in 2009 was the first national level plan to address the development of the PRD as an integrated region. It is also the first major document to seriously incorporate close cooperation of Guangdong, Hong Kong, and Macao as a major focus on the plan. The document defined the positioning of the PRD Region and set the tasks, work focuses, and policies and measures on nine key aspects: 1) building a modern industrial system, 2) strengthening capabilities of independent innovation, 3) promoting infrastructure modernization, 4) coordinating urban and rural development, 5) promoting coordinated regional development, 6) enhancing resource conservation and environmental protection, 7) expediting social undertakings, 8) creating of new system and mechanism advantages, and 9) creating a new situation for opening-up and cooperation.90
90 National Development and Reform Commission of China, The Outline of the Plan for the Reform and Development of the Pearl River Delta (2008-2020), 2008.
GBA Background Document
© Copyright 2022 Foundation, 2019. 101
The PRD was referred to as an experimental region for scientific development (a program linked to then President Hu Jintao), a pilot region for further reforms, an important international gateway for expanding China’s opening, a world-class base for advanced manufacturing and modern service industries, and an important national economic center. The document proposed fostering regional economic integration by overriding the obstacles imposed by the administrative system. Guangzhou and Shenzhen were designated as centers for innovation and integration of Guangzhou and Foshan listed as an initial focus. The Outline also proposed that the PRD region push forward its cooperation, integration, and common development with Hong Kong and Macao to forge the most dynamic and internationally competitive city cluster of the Asia-Pacific region. It also proposed innovative mechanisms for international and regional cooperation through the convergence of major infrastructure, strengthening industrial cooperation, and jointly build a high-quality living community. The Regional Cooperation Plan on Building a Quality Living Area (2012), the first regional plan jointly compiled by Hong Kong, Guangdong, and Macao, was produced after a three-year study. The Plan put forth proposals to address the common problems through a regional approach improving environmental and ecological quality, promoting low-carbon development, taking forward cooperation in culture and livelihood issues, taking forward coordinated spatial development, and facilitating development of green transportation and convenient boundary crossing. The study also considered implementation issues such as resource allocation, soliciting support from the Central Government, and Coordinating the implementation of the Plan. The Plan also serves as a reference for government departments of the three parties. 91 The Study on the Action Plan for a Livable Bay Area of the Pearl River Estuary (2014), was the result of a four-year study commissioned by the Governments of Guangdong, Hong Kong, and Macao started in 2010 and carried out by the Guangdong Urban and Rural Planning and Design Institute and the Shenzhen Graduate School of Peking University. The goal was to provide a liaison and communication platform for the governments to facilitate the development of the "Bay Area of the Pearl River Estuary" into a core area of quality living and economic prosperity. Recommendations on principles and directions for this vision focused on a Green Network (concerning ecological conservation), Blue Network (strengthening coordination of the management of coastlines in the region), Regional Public Transport Network (building a seamless regional transportation system), Cultural Precincts (conserving and leveraging local culture through cultural preservation), Featured Public Spaces (planning public spaces to highlight local culture and attract talented people), Public Service Network (establishment of a comprehensive public service network and cooperation in education, social services, and medical services), Livable Communities (through housing supply, supporting facilities, and improving community management), Walkable Cities (establish pedestrian walkways that allow safe access to public spaces and transport nodes), Convenient and Efficient Boundary Crossing (alleviate inadequate connections and limited capacity of the boundary control facilities), and Cross-Boundary Cooperation on Environmental Protection. The study suggested that the cross-boundary cooperative areas of Nansha, Qianhai, Hengqin, Shenzhen-Dongguan Harbor Bay New City, Zhuhai-Zhongshan Seafront New City, Lok Ma Chau Loop Area, and the Zhuhai-Macao Cross Boundary Cooperation Zone be pilots for implementing the study recommendations.92
91 Guangdong Province Housing and Urban-Rural Development Department, Environment bureau of HKSAR, Secretariat for Transport and Public Works of MCSAR, Regional Cooperation Plan on Building a Quality Living Area, June 2012. 92 Hong Kong SAR Government, “Stage 2 Public Engagement launched for ‘Study on the Action Plan for Livable Bay Area of the Pearl River Estuary’,” 24 January 2014 and Housing and Urban-rural Development, Guangdong Province; Development Bureau/Planning Department, Hong Kong SAR; and Secretariat for Transport and
GBA Background Document
© Copyright 2022 Foundation, 2019. 102
Plans Related to the GBA
There are also several initiatives, programs, policies, and documents that might not be specific to the GBA per se, but have the effect or the potential to promote cooperation, economic interaction, and economic integration in the GBA.
CEPA CEPA (The Closer Economic Partnership Arrangement) is the first free trade agreement of the Chinese Mainland. It was first signed in 2003 by the Central Government of the PRC respectively with the two SARs, Hong Kong and Macao as independent customs regions. CEPA has adopted a gradual, sector-by-sector approach. By end of 2017, ten supplements and four agreements had been signed to broaden and enrich the content of CEPA, expand market liberalization, and facilitate additional trade and investment. While CEPA is not a specific GBA arrangement, as it covers the entire Chinese Mainland, given geographic proximity the bulk of the impact on the Mainland side in terms of further links with Hong Kong and Macao business has been in Guangdong Province. Since Hong Kong and Macao have zero tariffs on virtually all goods, CEPA itself did not change the openness of Hong Kong and Macao to imports of goods from the Chinese Mainland significantly. Under CEPA, however, the Chinese Mainland agreed to fully implement zero tariffs on imported goods of Hong Kong or Macao origin. This requires Hong Kong and Macao companies applying for zero tariff status and meeting agreed CEPA origin rules (ROOs). For purposes of CEPA, “imported goods” do not include goods prohibited by the Mainland's rules and regulations, as well as those prohibited as a result of the implementation of the PRC’s international treaties. Agreements on the CEPA ROOs have been reached for over 1,900 goods. For goods with no agreed ROOs, the ROOs are jointly worked out twice a year on applications by the trade from 2006. To claim zero tariffs, goods exported from Hong Kong to the Mainland, each consignment must be accompanied by a Certificate of Hong Kong Origin - CEPA ["CO(CEPA)"] issued by Hong Kong’s Trade and Industry Department or one a Government Approved Certification Organization (the Hong Kong General Chamber of Commerce, Federation of Hong Kong Industries, the Chinese Manufacturers' Association of Hong Kong, the Chinese General Chamber of Commerce, and the Indian Chamber of Commerce of Hong Kong). This requires a Factory Registration (FR) from the Trade and Industry Department to demonstrate that the exporter has sufficient capacity to produce the goods for export.93 The Agreement on Trade in Services signed in 2015 is a stand-alone, subsidiary agreement that consolidates and expands service liberalization commitments introduced under CEPA since 2003. It was based on The Agreement between the Mainland and Hong Kong on Achieving Basic Liberalization of Trade in Services in Guangdong (The Guangdong Agreement) signed in 2014 with implementing regulations released in 201594 and effectively makes that agreement national in scope. The Agreement on Trade in Services, along with State Council implementing regulations issued in
Public Works Macao SAR; Study on the Action Plan for Livable Bay Area of the Pear River Estuary: Summary of Recommendations, December 2014. 93 Hong Kong Trade and Industry Department, Mainland and Hong Kong Closer Economic Partnership Arrangement (CEPA), Trade in Goods, 2 October 2018. 94 Implementation Opinion on Further Promoting the Liberalization in Trade in Services Between Guangdong, Hong Kong and Macao, 2015
GBA Background Document
© Copyright 2022 Foundation, 2019. 103
2016, 95 broadens and deepens liberalization by extending the majority of Guangdong pilot liberalization measures to the whole Mainland; reducing restrictive measures on the negative list; and adding 28 liberalization measures in the positive lists for cross-border services as well as cultural and telecommunications services. It also provides Hong Kong and Macao investors with pre-establishment national treatment for service sectors. In this agreement, the Mainland opened 153 services sectors (out of 160 recognized by the WTO) to Hong Kong and Macao. Full national treatment is applied in 62 sectors. The negative list covers 134 sectors, reserving 120 restrictive measures as inconsistent with the obligation of national treatment. The positive list covers cross-border services as well as the sectors of telecommunications and cultural services. In terms of investment facilitation, for Hong Kong service suppliers in the majority of services trade sectors, filing administration is adopted in lieu of prior approval of contracts and articles of association for establishment and change of enterprises.96 Overall, the Agreement results in Hong Kong and Macao entities operating in the Chinese Mainland under rules more favorable than those of entities from other customs areas. Qualification requirements, share ratios limitation, and business scope in 7 sectors are also temporarily relaxed for Hong Kong and Macao investors, as compared with other foreign investors. These sectors are the Telecommunication sector, the Maritime sector, the Education sector, the Entertainment sector, the Exhibition sector, and the Aviation sector. The following are a few examples of favorable treatment of Hong Kong and Macao entities and individuals that have been implemented under CEPA. China’s Ministry of Finance published a Notice97 in 2016 to support Hong Kong and Macao permanent resident accounting professionals who have the Chinese CPA qualification and certain years of audit working experiences to take the position as partners in the Mainland partnership-based firms. Their audit work experience in Hong Kong and Macao is equivalent to the same period of audit work experience in the Mainland. China’s State Council approved the MIIT’s application in 2014 to increase the shareholding ratio of Hong Kong and Macao service providers in online data processing and transaction processing in Guangdong to 55 percent.98 China’s Ministry of Culture published Measures to Support the Key Project for Culture Exchange with Hong Kong and Macao in 2013, having defined the supporting areas, the requirements for the projects, the applying and approving procedures, and how funds are managed and used. China’s National Tourism Bureau published the detailed measures in 2012 to implement the CEPA agreement regarding the tourism sector.99 In 2012, the China’s Ministry of
95 State Council of China, Decision of State Council on Temporarily Adjusting the Administration Approval and
Access Requirement Management Measures for Hong Kong and Macao Service Providers, 31 May 2016 国务院
关于在内地对香港、澳门服务提供者暂时调整有关行政审批和准入特别管理措施的决定,国发〔2016〕
32 号. 96 Hong Kong SAR Government, “Mainland and Hong Kong Closer Economic Partnership Arrangement (CEPA) Further Liberalisation in 2015,” 2015. 97 Ministry of Finance of China, Notice on Supporting Accounting Professionals from Hong Kong and Macao as
Partners in Mainland Certified Accounting Firm, 16 May 2016.关于大力支持香港澳门特别行政区会计专业人
士担任内地会计师事务所合伙人有关问题的通知, 财会﹝2016)9 号. 98 State Council of China, Reply of the State Council on issues related to the provision of online data processing and transaction processing services by Hong Kong and Macao service providers in Guangdong Province, 2
October 2014.国务院关于香港和澳门服务提供者在广东省提供在线数据处理与交易处理业务有关问题的
批复, 国函〔2014〕134 号. 99 China Office of National Tourism, Notice of the National Tourism Administration Office on Implementing the Relevant Tourism Measures between the Mainland and Hong Kong and Macao on the Supplementary
Agreement on the Establishment of Closer Economic Partnership Arrangement, 19 December 2012, 国家旅游
局办公室关于落实内地与香港、澳门《关于建立更紧密经贸关系安排补充协议九》有关旅游措施的通知,
旅办发〔2012〕566 号.
GBA Background Document
© Copyright 2022 Foundation, 2019. 104
Commerce approved Hong Kong and Macao services providers to establish commercial factoring enterprises in Shenzhen and Guangzhou as a trial policy.100 The Investment Agreement and Agreement on Economic and Technical Cooperation, signed in 2017, also is part of the CEPA process. It covers investment in the forms of establishment of enterprises or acquisition of assets on one side by an investor from the other side on all non-services sectors, as the commitments for admission of investments in services have been covered under the Agreement on Trade in Services. The provisions on investment protection under the Investment Agreement apply to investments in both services and non-services sectors. Under the Investment Agreement, the Mainland commits to providing national treatment to investments and investors of Hong Kong and Macao in all non-services sectors, except for 26 measures listed in an Annex. The “Most-Favored Treatment” provision of the Agreement specifies Hong Kong and Macao investments and investors will be treated no worse than investments and investors from other countries or regions. The Agreement provides pre-establishment national treatment for non-service sectors, making the market access commitments given by the Mainland to Hong Kong and Macao under CEPA complete. Hong Kong and Macao have committed that they will not impose any new discriminatory measures on Mainland investments and investors in non-services sectors and will provide protection to all Mainland investments and investors in Hong Kong and Macao.101 The Agreement on Economic and Technical Cooperation has consolidated and updated the commitments on trade and investment facilitation under CEPA, adds new economic and trade cooperation areas in relation to the “Belt and Road” Initiative and Sub-regional Cooperation, and enriches and specifies the contents of cooperation. The Ecotech Agreement does not cover market access commitments or substantive liberalization measures, but lays the foundation and charts the course for higher level of cooperation of the Mainland with Hong Kong and Macao.102 With the new agreements, CEPA has broadened its scope to become a comprehensive free trade agreement (FTA) covering trade in goods and services, investment, and economic and technical cooperation.103 Exhibit 6.1 Summarizes some of the main features of the Hong Kong- Chinese Mainland CEPA.
100 Ministry of Commerce of China, Notice of the Ministry of Commerce on the establishment of commercial factoring enterprises in Hong Kong and Macao service providers in Shenzhen and Guangzhou, 7 December
2012, 商务部关于香港、澳门服务提供者在深圳市、广州市试点设立商业保理企业的通知, 商资函
[2012]1091 号. 101 Hong Kong SAR Government, Mainland and Hong Kong Closer Economic Partnership Arrangement (CEPA) Frequently Asked Questions – Investment, 2018. 102 Hong Kong SAR Government, Mainland and Hong Kong Closer Economic Partnership Arrangement (CEPA) Frequently Asked Questions – Economic and Technical Cooperation, 2018. 103 Hong Kong Trade Development Council, CEPA 2017: New Measures and New Opportunities for Hong Kong, 13 July 2017.
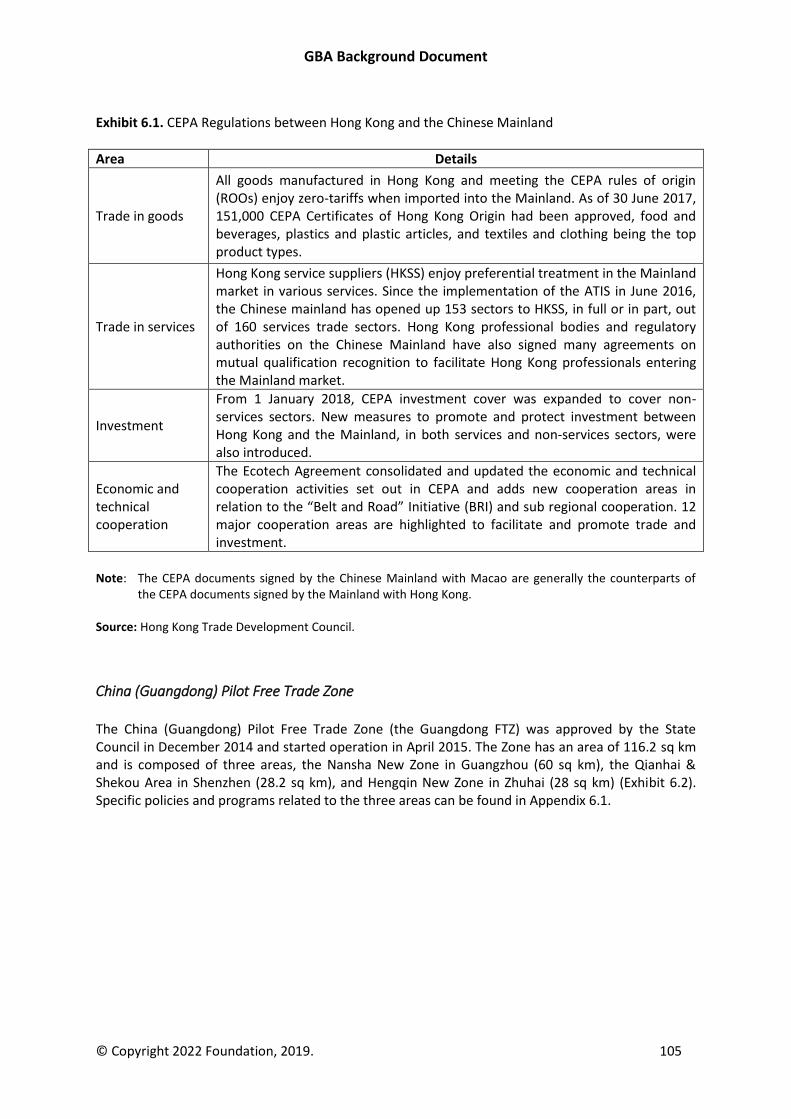
GBA Background Document
© Copyright 2022 Foundation, 2019. 105
Exhibit 6.1. CEPA Regulations between Hong Kong and the Chinese Mainland
Area Details
Trade in goods
All goods manufactured in Hong Kong and meeting the CEPA rules of origin (ROOs) enjoy zero-tariffs when imported into the Mainland. As of 30 June 2017, 151,000 CEPA Certificates of Hong Kong Origin had been approved, food and beverages, plastics and plastic articles, and textiles and clothing being the top product types.
Trade in services
Hong Kong service suppliers (HKSS) enjoy preferential treatment in the Mainland market in various services. Since the implementation of the ATIS in June 2016, the Chinese mainland has opened up 153 sectors to HKSS, in full or in part, out of 160 services trade sectors. Hong Kong professional bodies and regulatory authorities on the Chinese Mainland have also signed many agreements on mutual qualification recognition to facilitate Hong Kong professionals entering the Mainland market.
Investment
From 1 January 2018, CEPA investment cover was expanded to cover non-services sectors. New measures to promote and protect investment between Hong Kong and the Mainland, in both services and non-services sectors, were also introduced.
Economic and technical cooperation
The Ecotech Agreement consolidated and updated the economic and technical cooperation activities set out in CEPA and adds new cooperation areas in relation to the “Belt and Road” Initiative (BRI) and sub regional cooperation. 12 major cooperation areas are highlighted to facilitate and promote trade and investment.
Note: The CEPA documents signed by the Chinese Mainland with Macao are generally the counterparts of
the CEPA documents signed by the Mainland with Hong Kong. Source: Hong Kong Trade Development Council.
China (Guangdong) Pilot Free Trade Zone The China (Guangdong) Pilot Free Trade Zone (the Guangdong FTZ) was approved by the State Council in December 2014 and started operation in April 2015. The Zone has an area of 116.2 sq km and is composed of three areas, the Nansha New Zone in Guangzhou (60 sq km), the Qianhai & Shekou Area in Shenzhen (28.2 sq km), and Hengqin New Zone in Zhuhai (28 sq km) (Exhibit 6.2). Specific policies and programs related to the three areas can be found in Appendix 6.1.
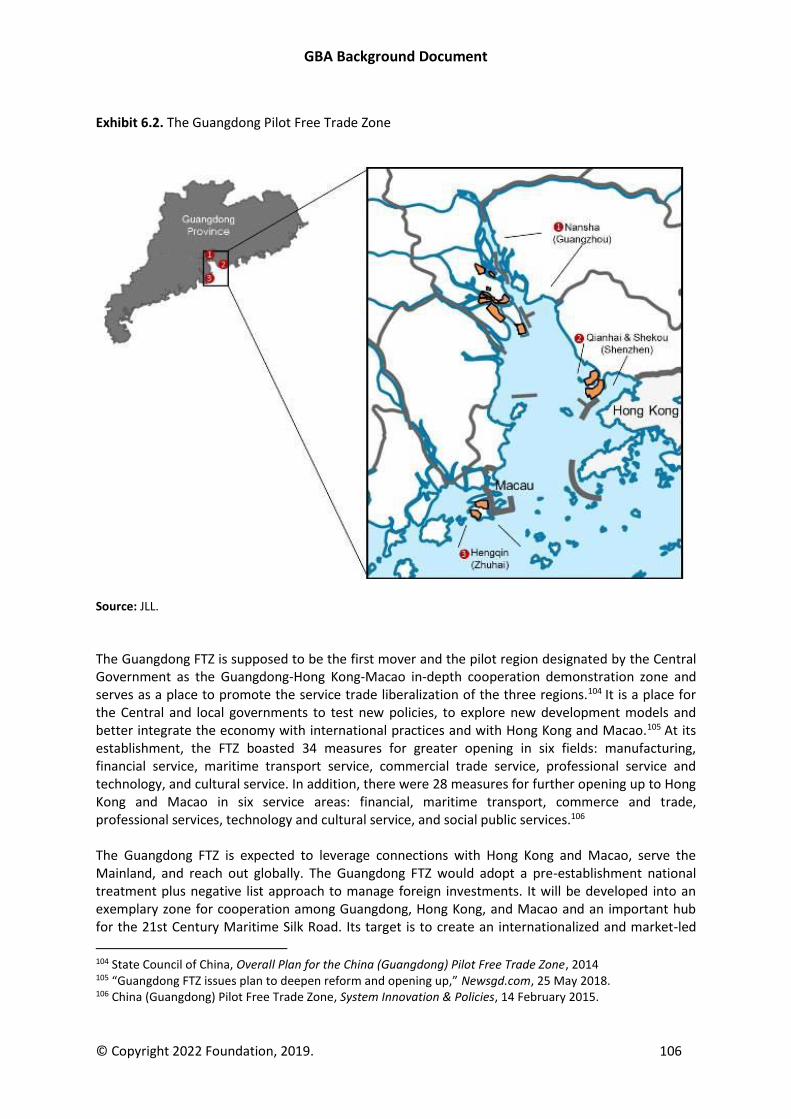
GBA Background Document
© Copyright 2022 Foundation, 2019. 106
Exhibit 6.2. The Guangdong Pilot Free Trade Zone
Source: JLL.
The Guangdong FTZ is supposed to be the first mover and the pilot region designated by the Central Government as the Guangdong-Hong Kong-Macao in-depth cooperation demonstration zone and serves as a place to promote the service trade liberalization of the three regions.104 It is a place for the Central and local governments to test new policies, to explore new development models and better integrate the economy with international practices and with Hong Kong and Macao.105 At its establishment, the FTZ boasted 34 measures for greater opening in six fields: manufacturing, financial service, maritime transport service, commercial trade service, professional service and technology, and cultural service. In addition, there were 28 measures for further opening up to Hong Kong and Macao in six service areas: financial, maritime transport, commerce and trade, professional services, technology and cultural service, and social public services.106 The Guangdong FTZ is expected to leverage connections with Hong Kong and Macao, serve the Mainland, and reach out globally. The Guangdong FTZ would adopt a pre-establishment national treatment plus negative list approach to manage foreign investments. It will be developed into an exemplary zone for cooperation among Guangdong, Hong Kong, and Macao and an important hub for the 21st Century Maritime Silk Road. Its target is to create an internationalized and market-led
104 State Council of China, Overall Plan for the China (Guangdong) Pilot Free Trade Zone, 2014 105 “Guangdong FTZ issues plan to deepen reform and opening up,” Newsgd.com, 25 May 2018. 106 China (Guangdong) Pilot Free Trade Zone, System Innovation & Policies, 14 February 2015.
GBA Background Document
© Copyright 2022 Foundation, 2019. 107
business environment with a sound legal framework, develop a more open economic system, and achieve in-depth cooperation with Hong Kong and Macao after three to five years of pilot reforms.107 In May 2018, the State Council published another document, the Plan for Further Deepening the Reform and Opening up of China (Guangdong) Pilot Free Trade Zone (2018 GDFTZ Plan), to continue the reform and opening-up of Guangdong FTZ, and to support Hong Kong and Macao to integrate into the overall national development agenda.108 The 2018 GDFTZ plan calls for a streamlining of administration, delegation of power to free trade zones, reform of the commercial system and business registration, strengthening of market supervision, easier market access, more transparent regulation, better IP protection, and greater openness of the service sector to foreign investment. A world-class “single-window” system for international trade will be set up and expanded to the service trade, including technology trade, outsourcing, and maintenance service. Equity and business cooperation between qualified domestic and foreign financial institutions will be encouraged. Highly talented foreigners are to be offered more preferential measures regarding their living arrangements, healthcare, children’s education, business, and research.109 By 2020, the 2018 GDFTZ plan indicates the Guangdong FTZ will have established a system compatible with an international shipping hub, international trade center, and a pilot for financial opening. This plan emphasizes cooperation in the Guangdong-Hong Kong-Macao Greater Bay Area and interaction of the FTZ with overall reform in Guangdong Province. Successful pilot reforms in the FTZ are encouraged to be replicated in the whole PRD area and eventually all of Guangdong Province. Both the 2015 and 2018 GFTZ plans have large sections on promoting the cooperation with Hong Kong and Macao, and further opening to Hong Kong and Macao investors. Key initiatives include: promotion of liberalization of trade in services among Guangdong, Hong Kong, and Macao; improve business and management standards in the region; and creating institutional mechanisms for cooperation within the region and between the region and the rest of the world. More details can be found in Exhibit 6.3.
107 Hong Kong SAR Government, “CE attends China (Guangdong) Pilot Free Trade Zone plaque-unveiling ceremony,” 21 April 2015. 108 State Council of China, Notice on the Plan for Further Deepening the Reform and Opening-up of China
(Guangdong) Pilot Free Trade Zone, 24 May 2018. 国务院关于印发进一步深化中国(广东)自由贸易试验
区改革开放方案的通知, 国发〔2018〕13. 109 State Council of China, “Reform in Guangdong FTZ to be intensified, 24 May 2018.
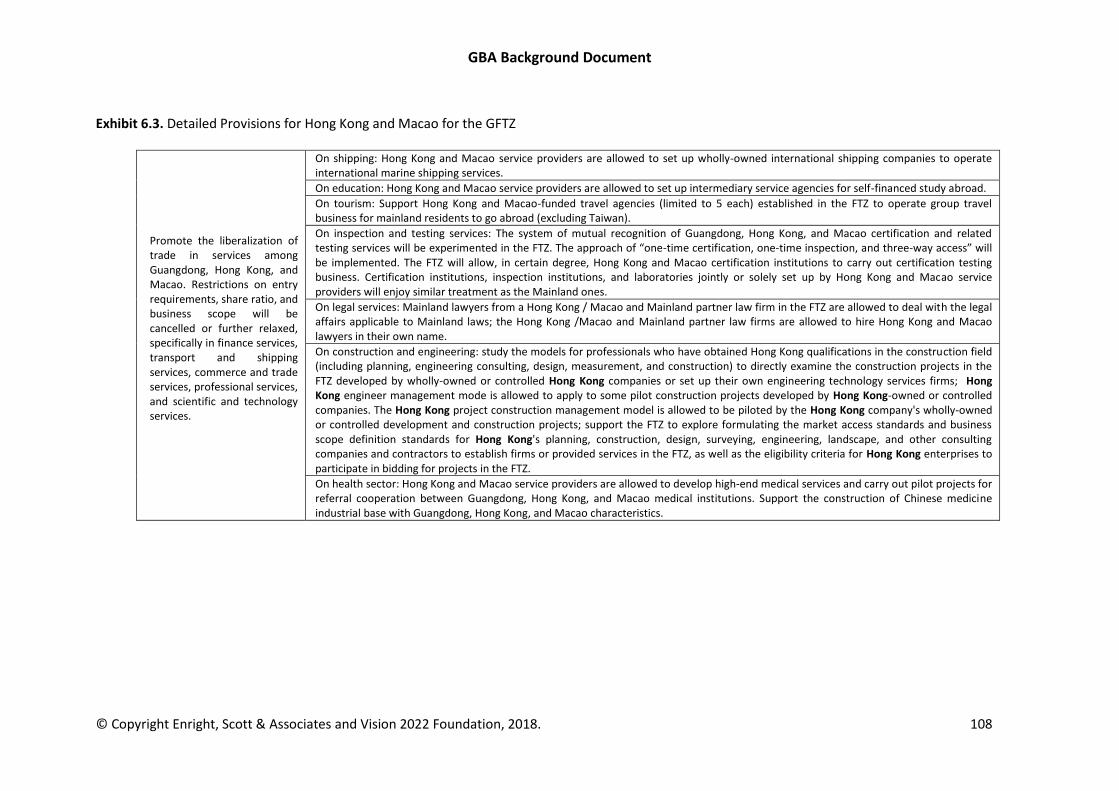
GBA Background Document
© Copyright Enright, Scott & Associates and Vision 2022 Foundation, 2018. 108
Exhibit 6.3. Detailed Provisions for Hong Kong and Macao for the GFTZ
Promote the liberalization of trade in services among Guangdong, Hong Kong, and Macao. Restrictions on entry requirements, share ratio, and business scope will be cancelled or further relaxed, specifically in finance services, transport and shipping services, commerce and trade services, professional services, and scientific and technology services.
On shipping: Hong Kong and Macao service providers are allowed to set up wholly-owned international shipping companies to operate international marine shipping services.
On education: Hong Kong and Macao service providers are allowed to set up intermediary service agencies for self-financed study abroad.
On tourism: Support Hong Kong and Macao-funded travel agencies (limited to 5 each) established in the FTZ to operate group travel business for mainland residents to go abroad (excluding Taiwan).
On inspection and testing services: The system of mutual recognition of Guangdong, Hong Kong, and Macao certification and related testing services will be experimented in the FTZ. The approach of “one-time certification, one-time inspection, and three-way access” will be implemented. The FTZ will allow, in certain degree, Hong Kong and Macao certification institutions to carry out certification testing business. Certification institutions, inspection institutions, and laboratories jointly or solely set up by Hong Kong and Macao service providers will enjoy similar treatment as the Mainland ones.
On legal services: Mainland lawyers from a Hong Kong / Macao and Mainland partner law firm in the FTZ are allowed to deal with the legal affairs applicable to Mainland laws; the Hong Kong /Macao and Mainland partner law firms are allowed to hire Hong Kong and Macao lawyers in their own name.
On construction and engineering: study the models for professionals who have obtained Hong Kong qualifications in the construction field (including planning, engineering consulting, design, measurement, and construction) to directly examine the construction projects in the FTZ developed by wholly-owned or controlled Hong Kong companies or set up their own engineering technology services firms; Hong Kong engineer management mode is allowed to apply to some pilot construction projects developed by Hong Kong-owned or controlled companies. The Hong Kong project construction management model is allowed to be piloted by the Hong Kong company's wholly-owned or controlled development and construction projects; support the FTZ to explore formulating the market access standards and business scope definition standards for Hong Kong's planning, construction, design, surveying, engineering, landscape, and other consulting companies and contractors to establish firms or provided services in the FTZ, as well as the eligibility criteria for Hong Kong enterprises to participate in bidding for projects in the FTZ.
On health sector: Hong Kong and Macao service providers are allowed to develop high-end medical services and carry out pilot projects for referral cooperation between Guangdong, Hong Kong, and Macao medical institutions. Support the construction of Chinese medicine industrial base with Guangdong, Hong Kong, and Macao characteristics.
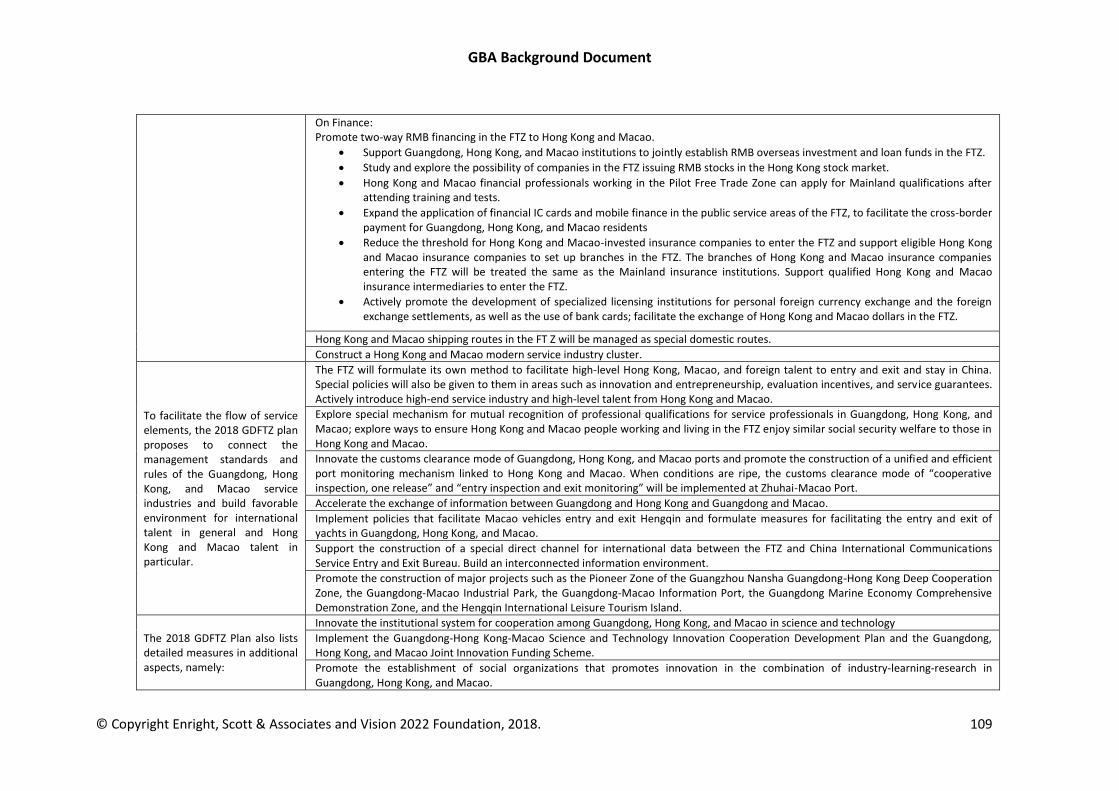
GBA Background Document
© Copyright Enright, Scott & Associates and Vision 2022 Foundation, 2018. 109
On Finance: Promote two-way RMB financing in the FTZ to Hong Kong and Macao.
• Support Guangdong, Hong Kong, and Macao institutions to jointly establish RMB overseas investment and loan funds in the FTZ.
• Study and explore the possibility of companies in the FTZ issuing RMB stocks in the Hong Kong stock market.
• Hong Kong and Macao financial professionals working in the Pilot Free Trade Zone can apply for Mainland qualifications after attending training and tests.
• Expand the application of financial IC cards and mobile finance in the public service areas of the FTZ, to facilitate the cross-border payment for Guangdong, Hong Kong, and Macao residents
• Reduce the threshold for Hong Kong and Macao-invested insurance companies to enter the FTZ and support eligible Hong Kong and Macao insurance companies to set up branches in the FTZ. The branches of Hong Kong and Macao insurance companies entering the FTZ will be treated the same as the Mainland insurance institutions. Support qualified Hong Kong and Macao insurance intermediaries to enter the FTZ.
• Actively promote the development of specialized licensing institutions for personal foreign currency exchange and the foreign exchange settlements, as well as the use of bank cards; facilitate the exchange of Hong Kong and Macao dollars in the FTZ.
Hong Kong and Macao shipping routes in the FT Z will be managed as special domestic routes.
Construct a Hong Kong and Macao modern service industry cluster.
To facilitate the flow of service elements, the 2018 GDFTZ plan proposes to connect the management standards and rules of the Guangdong, Hong Kong, and Macao service industries and build favorable environment for international talent in general and Hong Kong and Macao talent in particular.
The FTZ will formulate its own method to facilitate high-level Hong Kong, Macao, and foreign talent to entry and exit and stay in China. Special policies will also be given to them in areas such as innovation and entrepreneurship, evaluation incentives, and service guarantees. Actively introduce high-end service industry and high-level talent from Hong Kong and Macao.
Explore special mechanism for mutual recognition of professional qualifications for service professionals in Guangdong, Hong Kong, and Macao; explore ways to ensure Hong Kong and Macao people working and living in the FTZ enjoy similar social security welfare to those in Hong Kong and Macao.
Innovate the customs clearance mode of Guangdong, Hong Kong, and Macao ports and promote the construction of a unified and efficient port monitoring mechanism linked to Hong Kong and Macao. When conditions are ripe, the customs clearance mode of “cooperative inspection, one release” and “entry inspection and exit monitoring” will be implemented at Zhuhai-Macao Port.
Accelerate the exchange of information between Guangdong and Hong Kong and Guangdong and Macao.
Implement policies that facilitate Macao vehicles entry and exit Hengqin and formulate measures for facilitating the entry and exit of yachts in Guangdong, Hong Kong, and Macao.
Support the construction of a special direct channel for international data between the FTZ and China International Communications Service Entry and Exit Bureau. Build an interconnected information environment.
Promote the construction of major projects such as the Pioneer Zone of the Guangzhou Nansha Guangdong-Hong Kong Deep Cooperation Zone, the Guangdong-Macao Industrial Park, the Guangdong-Macao Information Port, the Guangdong Marine Economy Comprehensive Demonstration Zone, and the Hengqin International Leisure Tourism Island.
The 2018 GDFTZ Plan also lists detailed measures in additional aspects, namely:
Innovate the institutional system for cooperation among Guangdong, Hong Kong, and Macao in science and technology
Implement the Guangdong-Hong Kong-Macao Science and Technology Innovation Cooperation Development Plan and the Guangdong, Hong Kong, and Macao Joint Innovation Funding Scheme.
Promote the establishment of social organizations that promotes innovation in the combination of industry-learning-research in Guangdong, Hong Kong, and Macao.
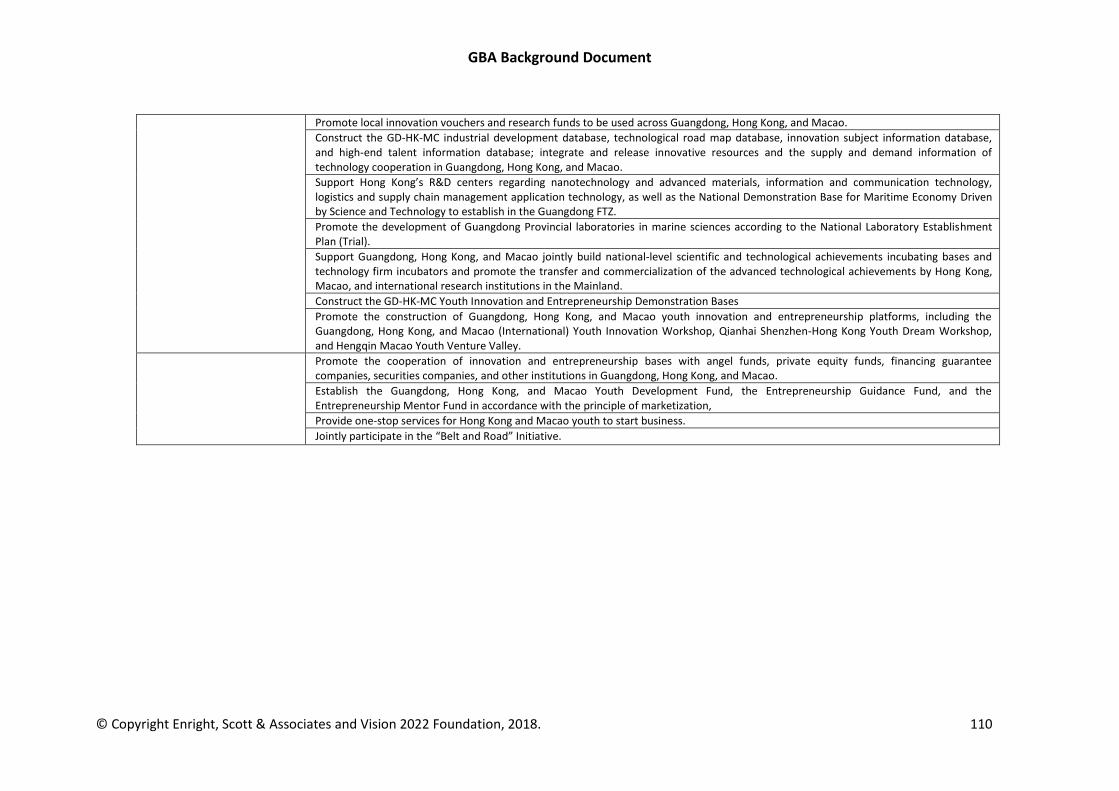
GBA Background Document
© Copyright Enright, Scott & Associates and Vision 2022 Foundation, 2018. 110
Promote local innovation vouchers and research funds to be used across Guangdong, Hong Kong, and Macao.
Construct the GD-HK-MC industrial development database, technological road map database, innovation subject information database, and high-end talent information database; integrate and release innovative resources and the supply and demand information of technology cooperation in Guangdong, Hong Kong, and Macao.
Support Hong Kong’s R&D centers regarding nanotechnology and advanced materials, information and communication technology, logistics and supply chain management application technology, as well as the National Demonstration Base for Maritime Economy Driven by Science and Technology to establish in the Guangdong FTZ.
Promote the development of Guangdong Provincial laboratories in marine sciences according to the National Laboratory Establishment Plan (Trial).
Support Guangdong, Hong Kong, and Macao jointly build national-level scientific and technological achievements incubating bases and technology firm incubators and promote the transfer and commercialization of the advanced technological achievements by Hong Kong, Macao, and international research institutions in the Mainland.
Construct the GD-HK-MC Youth Innovation and Entrepreneurship Demonstration Bases
Promote the construction of Guangdong, Hong Kong, and Macao youth innovation and entrepreneurship platforms, including the Guangdong, Hong Kong, and Macao (International) Youth Innovation Workshop, Qianhai Shenzhen-Hong Kong Youth Dream Workshop, and Hengqin Macao Youth Venture Valley.
Promote the cooperation of innovation and entrepreneurship bases with angel funds, private equity funds, financing guarantee companies, securities companies, and other institutions in Guangdong, Hong Kong, and Macao.
Establish the Guangdong, Hong Kong, and Macao Youth Development Fund, the Entrepreneurship Guidance Fund, and the Entrepreneurship Mentor Fund in accordance with the principle of marketization,
Provide one-stop services for Hong Kong and Macao youth to start business.
Jointly participate in the “Belt and Road” Initiative.
GBA Background Document
© Copyright 2022 Foundation, 2019. 111
Framework Agreement on Guangdong’s Cooperation with Hong Kong and Macao In 2010, the Guangdong and Hong Kong Governments signed the Framework Agreement on Guangdong-Hong Kong Cooperation. In 2011, the Guangdong and Macao Governments signed the Framework Agreement on Cooperation between Guangdong and Macao. The purpose of the two documents is to translate the macro policies in the Outline of the Plan for the Reform and Development of the Pearl River Delta into concrete measures that are conducive to the development of three places. The two documents comprise the first agendas on Guangdong-Hong Kong/Macao cooperation endorsed and approved for implementation by the State Council since the establishment of the Hong Kong-Guangdong Joint Conference in 1998.110 Under this Framework, the Governments concerned review progress of the implementation work and plan major initiatives for the coming year on an annual basis, which facilitates the two sides in seeking more “early and pilot implementation.” The Framework Agreement on Guangdong-Hong Kong Cooperation consists of two parts, the main text and the list of annual major initiatives. The main text of a Framework Agreement contains 11 chapters, and focuses on cross-boundary infrastructural facilities, modern service industries, manufacturing industries and innovation and technology, business environment, quality living area, education and talent, major cooperation areas, and regional cooperation plans, as well as mechanisms and arrangements. Cooperation areas in general cover Innovation and Technology, Youth Cooperation, Finance, Professional Services, Environmental Protection, and Cross-boundary Infrastructure. The list of annual major initiatives sets out specific measures for the two sides to implement during the year. To keep up the momentum, this document is updated annually. The policies, measures and items set out in the Framework Agreement or arising are be implemented jointly or respectively by Hong Kong and Guangdong depending on the circumstances.111 The Framework Agreement emphasizes particular aspects of Hong Kong/Guangdong cooperation: (a) promote joint socio-economic development in Hong Kong and Guangdong to create a new world-class economic zone; (b) enhance Hong Kong's position as an international financial center and expedite the development of financial services industries in Guangdong; (c) capitalize on the competitiveness of Hong Kong's service industries and Guangdong's manufacturing industries to build an advanced global manufacturing and modern services base; (d) facilitate the flow of key factors such as people, goods, information, and capital across the boundary, with a view to building an international aviation, shipping, and logistics hub and a world-class modern economic circulation sphere; (e) implement a regional ecology and environment protection regime operating at a leading level by the national standards to create a high quality living area; and (f) promote collaborative development among Hong Kong and the PRD (Pearl River Delta) cities to form a world-class metropolitan cluster.112 The Framework Agreement on Guangdong-Macao Cooperation has similar content, but is based on two additional documents: The Overall Development Plan for Hengqin and the Macao CEPA. The Agreement calls for the joint establishment of a world-famous travel and leisure destination, with Macao’s world-class travel and leisure center playing the leading role, Zhuhai’s international business and leisure travel hub as the nodal point, and Guangdong’s tourism resources as the bedrock. It calls for the creation of a new platform for upgrading industries in Guangdong and diversifying Macao’s economy and enhancing cooperation between the Greater Pearl River Delta
110 Hong Kong SAR Government, “Framework Agreement on Hong Kong/Guangdong Co-operation,” 2011. 111 Hong Kong Legislative Council, “Framework Agreement on Hong Kong/Guangdong Co-operation,” 2011. 112 Hong Kong SAR Government, “Signing ceremony of Framework Agreement on Hong Kong/Guangdong Co-operation held in Beijing,” 7 April 2010.
GBA Background Document
© Copyright 2022 Foundation, 2019. 112
Region and the EU, ASEAN, and Portuguese-speaking countries. In addition, the parties agreed to jointly develop Hengqin and cooperate in developing the tourism, convention and exhibition, Chinese medicine, cultural creativity, finance industries. The Guangdong Government has published Key Works on Implementing the Framework Agreement on Guangdong-Hong Kong Cooperation 2010 through to 2017 and on Guangdong-Macao cooperation 2010 through to 2018. The latest document for Hong Kong lists 77 key tasks for Guangdong and Hong Kong cooperation in cross-boundary infrastructure, modern services (liberalization in trade in services, finance, tourism, logistics, transport, convention and exhibition, cultural and creative, professional services, innovation and science and technology, internationalized business environment (trade facilitation, customs clearance and supervision, intellectual property rights protection), building quality living circle (ecological construction and environment protection, cultural exchange, health and medical care, food safety and inspection and guarantee, social security and service, security management), education, talent and youth development, and improving cooperation mechanisms.113 This latest document for Macao lists 65 key tasks of Guangdong and Macao in developing the GBA, participating the development of “Belt and Road,” improving infrastructure and facilitating convenient border crossing, fostering cooperation in modern services and industries (financial services, tourism, cultural and creative sector, convention and exhibition industry, trade investment, Chinese medicine industry, professional services), fostering cooperation in social and public services, and improving cooperation mechanisms. Specifically, the major areas for cooperation of 2018 include: developing Hengqin New Area, Zhuhai; developing Cuiheng (Tsuiheng) New District, Zhongshan; and construction of Jiangmen’s Daguangwan Bay.114
The Thirteenth Five Year Program for the National Economy and Social Development of
Guangdong Guangdong’s Thirteenth Five Year Program uses one chapter to explain its strategies on Guangdong, Hong Kong, and Macao cooperation. The chapter focused on building the GD-HK-MC Greater Bay Area; advancing liberalization of trade in services among Guangdong, Hong Kong, and Macao; and jointly building a high-quality living circle. To build the GBA, the Guangdong Government plans to build a world city cluster, to promote the connection of infrastructure across the three regions, to strengthen innovation and entrepreneurship cooperation, and to build an environment suitable for living and working. To build the world city cluster, the program plans to leverage the advantages of Guangzhou as the capital; to promote the combination of Shenzhen and Hong Kong as a global financial center, logistics center, trade center, innovation center, and international cultural and creative center; and to support Zhuhai and Macao to jointly build a world-class tourism and leisure center. Specific efforts are called for to upgrade cooperation between the West Bank of the Pearl River and Hong Kong and Macao based on the Hong Kong-Zhuhai-Macao Bridge, and to support the development of the Jiangmen Daguang Bay Area and Zhongshan Cuiheng New Area through stronger cooperation with Hong Kong and Macao. Further efforts are to be made to deepen tourism
113 Guangdong Government, “Notice of the Guangdong Provincial People's Government on Printing and Distributing the Key Work of the Guangdong-Hong Kong Cooperation Framework Agreement in 2017,” 30 March 2017. 114 Details may be found in Macao SAR Government, Major Tasks in 2018 for Implementing the Framework Agreement on Cooperation between Guangdong and Macao, 2018.
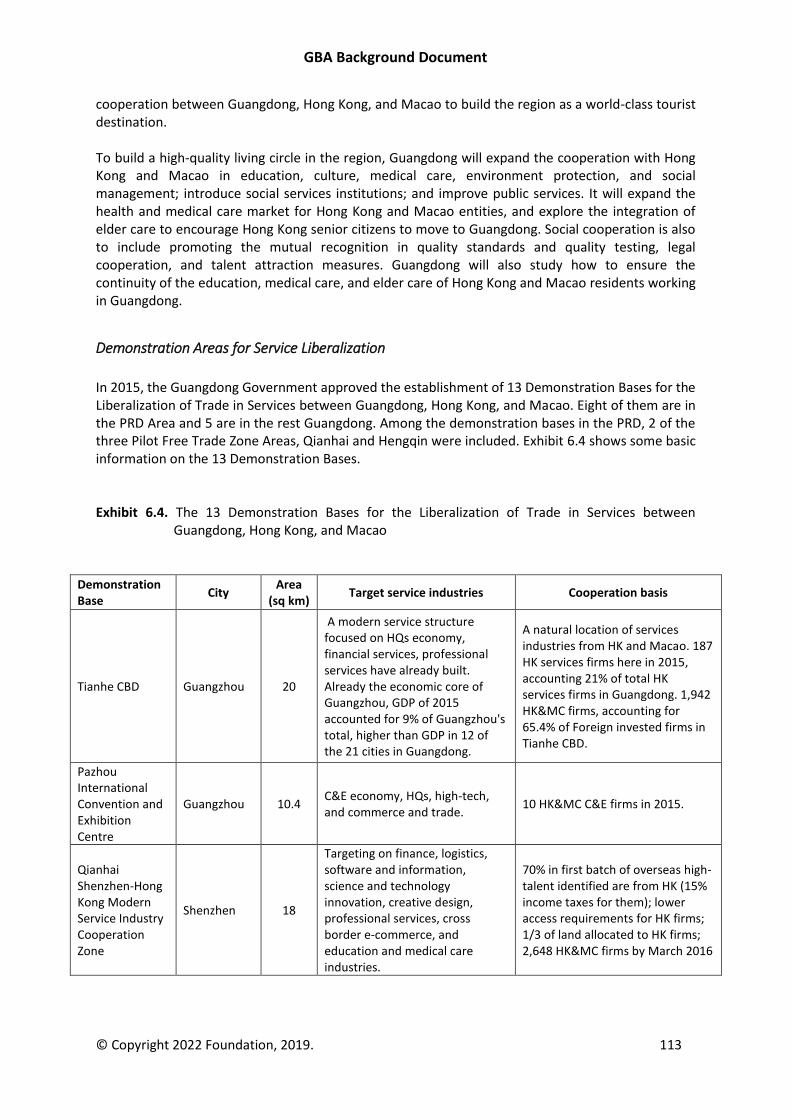
GBA Background Document
© Copyright 2022 Foundation, 2019. 113
cooperation between Guangdong, Hong Kong, and Macao to build the region as a world-class tourist destination. To build a high-quality living circle in the region, Guangdong will expand the cooperation with Hong Kong and Macao in education, culture, medical care, environment protection, and social management; introduce social services institutions; and improve public services. It will expand the health and medical care market for Hong Kong and Macao entities, and explore the integration of elder care to encourage Hong Kong senior citizens to move to Guangdong. Social cooperation is also to include promoting the mutual recognition in quality standards and quality testing, legal cooperation, and talent attraction measures. Guangdong will also study how to ensure the continuity of the education, medical care, and elder care of Hong Kong and Macao residents working in Guangdong.
Demonstration Areas for Service Liberalization
In 2015, the Guangdong Government approved the establishment of 13 Demonstration Bases for the Liberalization of Trade in Services between Guangdong, Hong Kong, and Macao. Eight of them are in the PRD Area and 5 are in the rest Guangdong. Among the demonstration bases in the PRD, 2 of the three Pilot Free Trade Zone Areas, Qianhai and Hengqin were included. Exhibit 6.4 shows some basic information on the 13 Demonstration Bases. Exhibit 6.4. The 13 Demonstration Bases for the Liberalization of Trade in Services between
Guangdong, Hong Kong, and Macao
Demonstration Base
City Area
(sq km) Target service industries Cooperation basis
Tianhe CBD Guangzhou 20
A modern service structure focused on HQs economy, financial services, professional services have already built. Already the economic core of Guangzhou, GDP of 2015 accounted for 9% of Guangzhou's total, higher than GDP in 12 of the 21 cities in Guangdong.
A natural location of services industries from HK and Macao. 187 HK services firms here in 2015, accounting 21% of total HK services firms in Guangdong. 1,942 HK&MC firms, accounting for 65.4% of Foreign invested firms in Tianhe CBD.
Pazhou International Convention and Exhibition Centre
Guangzhou 10.4 C&E economy, HQs, high-tech, and commerce and trade.
10 HK&MC C&E firms in 2015.
Qianhai Shenzhen-Hong Kong Modern Service Industry Cooperation Zone
Shenzhen 18
Targeting on finance, logistics, software and information, science and technology innovation, creative design, professional services, cross border e-commerce, and education and medical care industries.
70% in first batch of overseas high-talent identified are from HK (15% income taxes for them); lower access requirements for HK firms; 1/3 of land allocated to HK firms; 2,648 HK&MC firms by March 2016
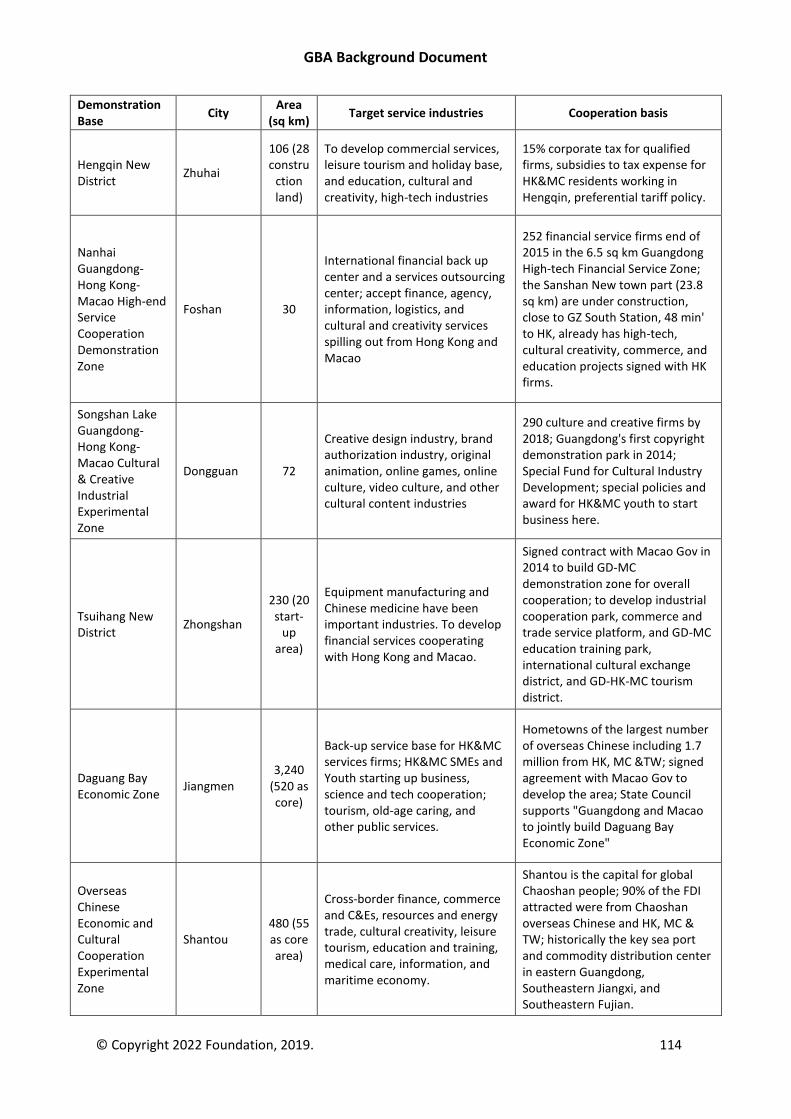
GBA Background Document
© Copyright 2022 Foundation, 2019. 114
Demonstration Base
City Area
(sq km) Target service industries Cooperation basis
Hengqin New District
Zhuhai
106 (28 constru
ction land)
To develop commercial services, leisure tourism and holiday base, and education, cultural and creativity, high-tech industries
15% corporate tax for qualified firms, subsidies to tax expense for HK&MC residents working in Hengqin, preferential tariff policy.
Nanhai Guangdong-Hong Kong-Macao High-end Service Cooperation Demonstration Zone
Foshan 30
International financial back up center and a services outsourcing center; accept finance, agency, information, logistics, and cultural and creativity services spilling out from Hong Kong and Macao
252 financial service firms end of 2015 in the 6.5 sq km Guangdong High-tech Financial Service Zone; the Sanshan New town part (23.8 sq km) are under construction, close to GZ South Station, 48 min' to HK, already has high-tech, cultural creativity, commerce, and education projects signed with HK firms.
Songshan Lake Guangdong-Hong Kong-Macao Cultural & Creative Industrial Experimental Zone
Dongguan 72
Creative design industry, brand authorization industry, original animation, online games, online culture, video culture, and other cultural content industries
290 culture and creative firms by 2018; Guangdong's first copyright demonstration park in 2014; Special Fund for Cultural Industry Development; special policies and award for HK&MC youth to start business here.
Tsuihang New District
Zhongshan
230 (20 start-
up area)
Equipment manufacturing and Chinese medicine have been important industries. To develop financial services cooperating with Hong Kong and Macao.
Signed contract with Macao Gov in 2014 to build GD-MC demonstration zone for overall cooperation; to develop industrial cooperation park, commerce and trade service platform, and GD-MC education training park, international cultural exchange district, and GD-HK-MC tourism district.
Daguang Bay Economic Zone
Jiangmen 3,240
(520 as core)
Back-up service base for HK&MC services firms; HK&MC SMEs and Youth starting up business, science and tech cooperation; tourism, old-age caring, and other public services.
Hometowns of the largest number of overseas Chinese including 1.7 million from HK, MC &TW; signed agreement with Macao Gov to develop the area; State Council supports "Guangdong and Macao to jointly build Daguang Bay Economic Zone"
Overseas Chinese Economic and Cultural Cooperation Experimental Zone
Shantou 480 (55 as core area)
Cross-border finance, commerce and C&Es, resources and energy trade, cultural creativity, leisure tourism, education and training, medical care, information, and maritime economy.
Shantou is the capital for global Chaoshan people; 90% of the FDI attracted were from Chaoshan overseas Chinese and HK, MC & TW; historically the key sea port and commodity distribution center in eastern Guangdong, Southeastern Jiangxi, and Southeastern Fujian.
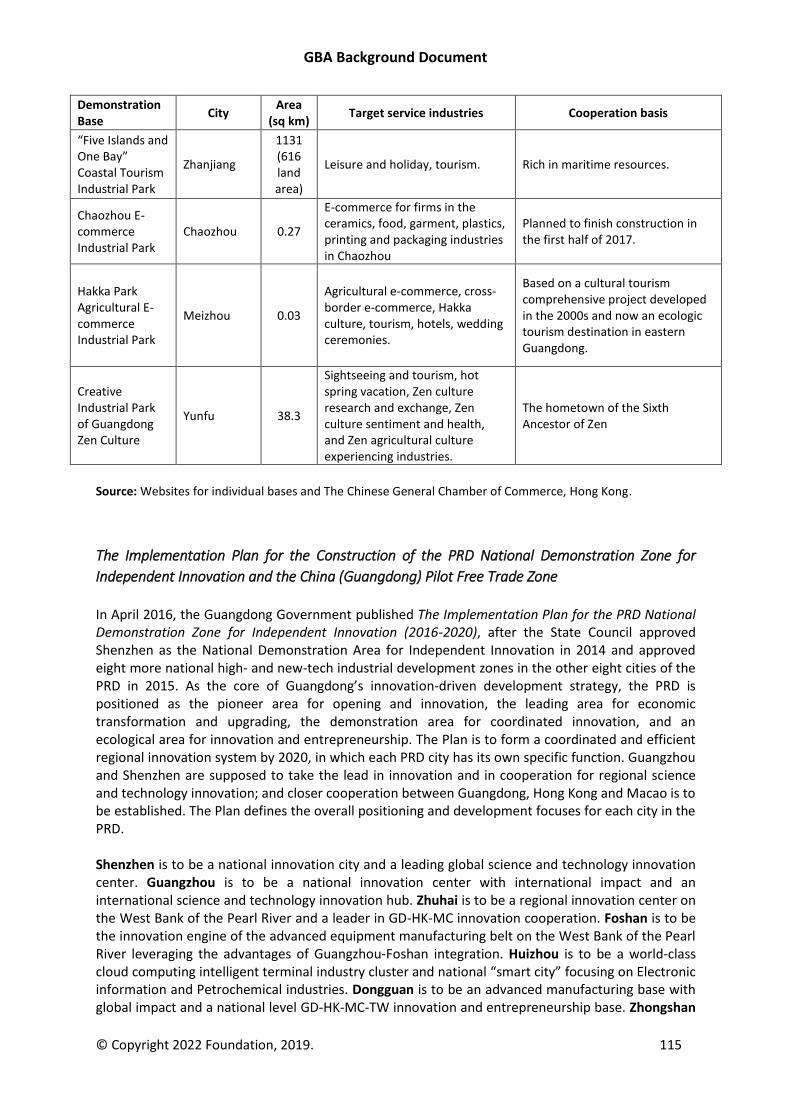
GBA Background Document
© Copyright 2022 Foundation, 2019. 115
Demonstration Base
City Area
(sq km) Target service industries Cooperation basis
“Five Islands and One Bay” Coastal Tourism Industrial Park
Zhanjiang
1131 (616 land area)
Leisure and holiday, tourism. Rich in maritime resources.
Chaozhou E-commerce Industrial Park
Chaozhou 0.27
E-commerce for firms in the ceramics, food, garment, plastics, printing and packaging industries in Chaozhou
Planned to finish construction in the first half of 2017.
Hakka Park Agricultural E-commerce Industrial Park
Meizhou 0.03
Agricultural e-commerce, cross-border e-commerce, Hakka culture, tourism, hotels, wedding ceremonies.
Based on a cultural tourism comprehensive project developed in the 2000s and now an ecologic tourism destination in eastern Guangdong.
Creative Industrial Park of Guangdong Zen Culture
Yunfu 38.3
Sightseeing and tourism, hot spring vacation, Zen culture research and exchange, Zen culture sentiment and health, and Zen agricultural culture experiencing industries.
The hometown of the Sixth Ancestor of Zen
Source: Websites for individual bases and The Chinese General Chamber of Commerce, Hong Kong.
The Implementation Plan for the Construction of the PRD National Demonstration Zone for
Independent Innovation and the China (Guangdong) Pilot Free Trade Zone In April 2016, the Guangdong Government published The Implementation Plan for the PRD National Demonstration Zone for Independent Innovation (2016-2020), after the State Council approved Shenzhen as the National Demonstration Area for Independent Innovation in 2014 and approved eight more national high- and new-tech industrial development zones in the other eight cities of the PRD in 2015. As the core of Guangdong’s innovation-driven development strategy, the PRD is positioned as the pioneer area for opening and innovation, the leading area for economic transformation and upgrading, the demonstration area for coordinated innovation, and an ecological area for innovation and entrepreneurship. The Plan is to form a coordinated and efficient regional innovation system by 2020, in which each PRD city has its own specific function. Guangzhou and Shenzhen are supposed to take the lead in innovation and in cooperation for regional science and technology innovation; and closer cooperation between Guangdong, Hong Kong and Macao is to be established. The Plan defines the overall positioning and development focuses for each city in the PRD. Shenzhen is to be a national innovation city and a leading global science and technology innovation center. Guangzhou is to be a national innovation center with international impact and an international science and technology innovation hub. Zhuhai is to be a regional innovation center on the West Bank of the Pearl River and a leader in GD-HK-MC innovation cooperation. Foshan is to be the innovation engine of the advanced equipment manufacturing belt on the West Bank of the Pearl River leveraging the advantages of Guangzhou-Foshan integration. Huizhou is to be a world-class cloud computing intelligent terminal industry cluster and national “smart city” focusing on Electronic information and Petrochemical industries. Dongguan is to be an advanced manufacturing base with global impact and a national level GD-HK-MC-TW innovation and entrepreneurship base. Zhongshan
GBA Background Document
© Copyright 2022 Foundation, 2019. 116
is to be an innovation and entrepreneurship center for the West Bank of the Pearl River and a new engine of the Intelligent Equipment Manufacturing Industrial Belt. Jiangmen is to be the capital of small and micro-innovation firms and an innovation and entrepreneurship agglomeration for overseas Chinese. Zhaoqing is to be the PRD’s expansion base for the commercialization of scientific and technological results and an industrial center connecting the Pearl River Delta with the Southwest China. The Plan also outlined in detail the innovation functions to be undertaken by each PRD city, the innovation areas a city focuses, the key high-tech zones a city will develop, the key manufacturing industries a city focuses, the key service industries a city focuses, the key strategic emerging industries a city focuses, the innovation industrial clusters a city will develop, the positioning of cities in international industrial cooperation, the R&D institutes a city will develop, and the key technology and innovation platforms in the PRD. These are described further in the individual city profiles below. In 2016, the Guangdong Government published the related plan the Implementation Plan on Promoting the Interaction and Joint Development of the PRD National Independent Innovation Demonstration Zone and the China (Guangdong) Pilot Free Trade Zone to explore integration of the two areas in institution innovation, innovation in opening up policies, finance innovation, and science technology innovation. It hopes that, by 2017, an institutional mechanism for the joint development of the Independent Innovation Zone and the Free Trade Zone will have been basically formed and the Zones can provide a series of experiences that can be replicated and promoted in Guangdong and China for its opening up and innovation; by 2020, the Zones will be an innovative resource allocation center with global influence, an innovative industrial agglomeration center, and a science and technology innovation center. The good practices, policies and innovations on administrative approval system, on facilitating cross-border R&D activities (preferential import taxes on R&D equipment and materials), on cross-border technology investment and financing, on attracting talented people globally (subsidies to high-level overseas innovative talent and awards and funds to the start-ups they established, as well as the relaxation of requirements on their visa, working permit, and resident permit), and on creating an intellectual property protection mechanism with international standards in the Free Trade Zones will be extended to and replicated in the Independent Innovation Zone. Reciprocally, the Free Trade Zone will also leverage the innovation strengthen and the science and technology resources of the Independent Innovation Zone to improve its innovation level and science and technology service level to support the further development of the Independent Innovation Zone. The plan proposes to realize the deep integration of technology, talent, and industry among Guangdong, Hong Kong, and Macao; to promote the construction of the Guangdong-Hong Kong Science and Technology Innovation Corridor, the Shenzhen-Hong Kong Innovation Circle, and the Guangdong-Macao Comprehensive Cooperation Demonstration Zone; support the Guangdong, Hong Kong, and Macao enterprises, universities, and research institutes to jointly establish innovation and entrepreneurship bases and joint works on technical breakthroughs, and collaborate in innovation and the transformation of scientific research achievements, thus to build the GBA as an important source of technological innovation. The construction of the Guangdong, Hong Kong, and Macao talent cooperation demonstration zones will be accelerated, especially the Nansha GD-HK-MC International High-end Talent Exchange Station, the Qianhai Shekou “International Talent Free Port,” and the Hengqin Haichuang Building, to attract
GBA Background Document
© Copyright 2022 Foundation, 2019. 117
international high-end innovation and entrepreneurship talent and teams from Hong Kong and Macao.
The Plan for Guangzhou-Shenzhen Scientific Technology and Innovation Corridor
This document was published by the Guangdong Government in December 2017,aiming to build a region approximately 180 kilometers long starting from the Guangzhou-Foshan border in the north, running through downtown Guangzhou, Songshan Lake in Dongguan, and downtown Shenzhen, to Dapeng New District in Shenzhen in the south into the core area of PRD’s National Independent Innovation Demonstration Zone, and thus to give all-around support to the construction of the Nation’s Science and Technology Industrial Innovation Centre and the Guangdong-Hong Kong-Macao Greater Bay Area, and to provide support for the Nation to implement its innovation-driven development strategy. The goal of this area is to become a world leading innovation center for technological industries, a main science center, and the innovation leader in the world by 2050. The ten nuclei are ten core innovation platforms and the multi-nodes include 37 areas (13 in Guangzhou, 15 in Shenzhen and 9 in Dongguan) with good innovation basis alongside the corridor. Details are listed in Appendix 6.2.
Hong Kong Programs for Cooperation in the GBA
The development of the Guangdong-Hong Kong-Macao Bay Area is a significant initiative and a focus
of Hong Kong SAR Government. It sees potential for Hong Kong to participate closely in one of the
world’s most dynamic economic regions and to foster greater connectivity supporting increased
trade, people-to-people interactions, throughout of cargo, and market integration. Hong Kong’s rule
of law, independent judiciary, English language, universities, status as an international trade and
financial center, absence of barriers to the flow of capital and information in Hong Kong, position as
the world’s freest and most competitive economy, and the “One Country, Two Systems” system that
it operates under all are seen as favorable to Hong Kong’s role in the development of the Greater
Bay Area, and in seizing opportunities that arise.
Hong Kong’s well-developed transportation links to the Greater Bay Area via road, train, and Hong
Kong International Airport, and by ferry services to cities including Shenzhen, Zhuhai, Zhongshan,
Guangzhou, Dongguan, and to Macao, will be further enhanced by the Hong Kong-Macao-Zhuhai
Bridge which is scheduled to open in late 2018.
The Chinese Mainland and Hong Kong Closer Economic Partnership Arrangement (CEPA), introduced
in 2003 and revised with several supplements since, is a free trade agreement between Mainland
China and Hong Kong. CEPA covers trade in goods, trade in services, investment, economic and
technical cooperation. Under CEPA, the Hong Kong SAR Government and China’s Ministry of
Commerce signed The Investment Agreement and Agreement on Economic and Technical
Cooperation between Hong Kong and the Pan-Pearl River Delta Region in June 2017. Chapter 5 of the
Agreement states that agencies on both sides will work to enhance cooperation in different regions.
Hong Kong professionals have been significant beneficiaries of CEPA with many accountants,
lawyers, doctors, architects, and structural engineers engaging in cross-border work in the Greater
Bay Area. For example, by June 2018 seven partnership associations had been established between
Hong Kong law firms and law firms in Shenzhen, with a further two such associations in place
between Hong Kong and each of Zhuhai and Guangzhou.
GBA Background Document
© Copyright 2022 Foundation, 2019. 118
Hong Kong and Macao signed their own CEPA in October 2017 providing for enhanced economic
cooperation and development, and giving service providers in the two SARs better market access
and greater legal certainty when operating in the other. The Hong Kong-Macao CEPA goes beyond
the commitments made by each of Hong Kong and Macao to the World Trade Organization, making
their bilateral economic commitment stronger than that required to other WTO members.
Hong Kong Science and Technology Park announced in January 2017 during a joint ceremony by the
governments of Hong Kong and Shenzhen that it is establishing a Hong Kong-Shenzhen Innovation
and Technology Park to support co-operation in scientific research between Hong Kong and
Shenzhen. Hong Kong’s Financial Secretary announced that HKD 20 billion in funding would be
allocated for the first phase development of the Hong Kong-Shenzhen Innovation and Technology
Park.
The Shenzhen-Hong Kong Stock Connect was launched in 2016, allowing investors in Hong Kong and
Mainland China to trade securities both in Hong Kong and in Shenzhen through the trading and
clearing facilities of their home exchange. The scheme is a step toward closer financial integration in
the Greater Bay Area and is intended to support the development of a cross-border capital market.
Intermodal code sharing services are increasingly being used by airlines in Hong Kong and Mainland
China for transportation within the Greater Bay Area. This allows an airline passenger to use one
ticket to connect with a high-speed ferry service or a bus service to get to their final destination. The
opening of the Hong Kong-Zhuhai-Macao Bridge is expected to further expand the use of intermodal
code sharing services. Hong Kong Government is also evaluating the possibility of helicopter services
between Hong Kong and other cities in the Pearl River Delta, noting that such services already exist
between Hong Kong and Macao.
The Hong Kong Section of the Guangzhou-Shenzhen-Hong Kong Express Rail Link is expected to open
in September 2018 and will connect Hong Kong to the national high-speed rail network and
dramatically reduce travel times between Hong Kong and Shenzhen, with an expected travel time of
23 minutes to Shenzhen North, and Guangzhou, with an expected travel time of 48 minutes to
Guangzhou South.
Cross-border medical services have been advanced by the opening of The University of Hong Kong-
Shenzhen Hospital in 2012 and the launch by the Hong Kong SAR Government of a pilot scheme at
the hospital in 2015 that enables elderly Hong Kong residents to use health care vouchers to pay for
certain services at the hospital.
Several Hong Kong universities have established campuses in the Greater Bay Area including The
Chinese University of Hong Kong, Shenzhen, and the Beijing Normal University-Hong Kong Baptist
University United International College. There is provision for Hong Kong students who have
graduated from universities in Mainland China to register for employment and then work in
Mainland China. At a primary and secondary education level, Shenzhen, Guangzhou, Zhuhai,
Dongguan and Zhongshan all allow Hong Kong children to apply under a points system for free
education in public schools.
In 2016 the Hong Kong SAR Government and the Shenzhen Municipal People’s Government signed
an Agreement on Promoting Cooperation in Creative Industries to foster an environment for closer
creative collaboration between Hong Kong and Shenzhen. Investment in film production between
GBA Background Document
© Copyright 2022 Foundation, 2019. 119
Guangdong, Hong Kong, and Macao is supported by the Guangdong-Hong Kong-Macao Film
Production Investment and Trade Fair that is organized by the Hong Kong Film Development Council
under the Framework Agreement on Hong Kong-Guangdong Cooperation.
Macao Programs for Cooperation in the GBA
In July 2017, the governments of Guangdong, Hong Kong, and Macao signed the Framework
Agreement on Deepening Guangdong–Hong Kong–Macao Cooperation in the Development of the
Greater Bay Area, joining forces to develop the Greater Bay Area into a more connected economic
zone. The three governments have agreed to promote infrastructure connectivity, enhance the level
of market integration, build a global technology and innovation hub, build a system of modern
industries through coordinated development, and build a quality environment for living, working
and travelling.
The Macao Government is consulting relevant stakeholders regarding Macao’s participation in the
development of the Guangdong-Hong Kong-Macao Greater Bay Area. The Macao Government plans
to establish a department focused on coordinating regional cooperation, and it will encourage big
enterprises to take the lead in participating in regional cooperation with smaller businesses.
The Macao Government will deepen Guangdong-Macao cooperation, actively participate in the
development of the Hengqin and Nansha sub-zones of the Guangdong Free Trade Zone, promote
liberalization of trade in services between Guangdong and Macao, and jointly create a competitive
business environment. The Government will continue deepening Pan Pearl River Delta regional
cooperation to explore the markets in Portuguese-speaking, European Union, and Southeast Asian
countries.
In terms of infrastructure, Macao is working to ensure that all aspects of the construction and
development of the Hong Kong-Zhuhai-Macao Bridge that are within its control are completed
satisfactorily. The Macao SAR Government is working closely with Guangdong and Hong Kong to
ensure that connectivity and regional integration are improved, and the Hong Kong-Zhuhai-Macao
Bridge is key to achieving this.
In the financial sector, three Macao financial institutions have participated in distribution of RMB
5 billion of the bond issued by Guangdong Government, the Land Reserve Special Bond for the
Guangdong, Hong Kong and Macao Greater Bay Area, in August 2018. It is the first time that
Macao financial institutions have participated in the distribution of Mainland municipal bonds.
These financial institutions will distribute the special bond in the form of wealth management
products to Macao residents who may then have a chance to participate in the investment
projects in the Greater Bay Area.
The Macao Government plans to encourage the education sector to seize the opportunities arising
from the development of the Greater Bay Area and develop innovative models for education.
Investments in technological research and development will also be increased to boost cooperation
between the industrial, academic and research and development sectors, especially through
implementing the framework agreement on the development of the Guangdong-Hong Kong-Macao
Greater Bay Area, to enhance cooperation and promote technological innovation.
GBA Background Document
© Copyright 2022 Foundation, 2019. 120
Finally, the Macao Government will enhance communications with the Central People’s
Government, Guangdong, and Hong Kong to foster cultural exchange and with an emphasis on
Chinese culture, and to support all sectors of Macao to participate in the development of the
Greater Bay Area.
Appendix 6.1. Specific Areas for GBA Cooperation under the GFTZ
Nansha Area Nansha, located in southernmost Guangzhou, is the city’s only gateway to the sea. It is 38 sea miles away from Hong Kong and 41 sea miles from Macao. Nansha plans to prioritize shipping logistics, special finance, international trade, and high-end manufacturing to become a new modern industrial base with manufacturing-related and comprehensive service industries as the focus. The Central and Provincial Governments have granted Nansha several favorable development policies.115 Major policies related to Hong Kong and Macao include:
• Nansha New District has been approved as the Guangdong, Hong Kong, and Macao Talent Cooperation Demonstration Zone and China's first talent management reform pilot zone.
• It is Guangdong’s pilot area for professional qualification mutual recognition.
• Eligible Hong Kong and Macao institutions are allowed to set up joint venture securities companies, joint venture securities investment consulting companies, and joint venture fund management companies in Nansha.
• Hong Kong and Macao insurance brokerage companies are encouraged to set up wholly-owned insurance agency companies in Nansha.
• Financial institutions in Nansha are allowed to provide cross-border settlement financial services to Hong Kong, Macao, and Taiwan residents (including institutions and individuals).
• Hong Kong and Macao law firms are allowed to set up partnership-based law firms with Mainland law firms in Nansha (also in Guangzhou, Shenzhen, Zhuhai).
• Supporting Hong Kong and Macao investors to set up wholly-owned non-degree secondary and higher vocational institutions.
• Allowing medical institutions and practitioners in Hong Kong and Macao to carry out corresponding business in Nansha after filing for permission.
• Relaxing the relevant policies on imported yachts in Nansha and supporting Nansha to take the lead in establishing a new model for the Macao yacht entry and exit management system.
• Further cancelling or relaxing access restrictions on Hong Kong and Macao service providers in qualification requirements, shareholding ratio, and business scope.
• Allowing non-bank financial institutions to conduct cross-border RMB business with Hong Kong and Macao.
• Supporting innovation in personal cross-border RMB business with Hong Kong and Macao.
• Further opening the payment service and credit information services to Hong Kong and Macao.
• Hong Kong and Macao talent can get awards on par with the difference between the tax burden in the Mainland and in Hong Kong or Macao.
115 Guangzhou Government, Special preferential policies granted by the state for Nansha, 8 March 2018.
GBA Background Document
© Copyright 2022 Foundation, 2019. 121
Qianhai and Shekou Area The Qianhai and Shekou Area is located at the western part of Shenzhen, east of the Pearl River and adjacent to Hong Kong. This area is near two international airports (i.e. Hong Kong Airport and Shenzhen Airport) within a distance of 30 km and two world-class container hub ports (i.e. Hong Kong Port and Shenzhen Port). Qianhai & Shekou Area of Shenzhen will prioritize finance, modern logistics, information services, science and technology services, and other strategic emerging service industries; will be established as an experimental window to the world for China’s financial industry; and become a significant base for global service trade and an international hub port. The Qianhai is the Shenzhen-Hong Kong Modern Service Cooperation Zone. Before Qianhai became part of the GDFTZ, the Qianhai Shenzhen-Hong Kong Modern Service Cooperation Zone was established in 2010. As China’s first service cooperation platform with Hong Kong, the State Council approved in 2012 to allow this demonstration zone to adopt more special policies than the Special Economic Zone to practice the early and pilot opening policies.116 Favorable policies in Qianhai include the followings:
• On finance services: (i) encouraging Hong Kong financial institutions to extend RMB lending to enterprises or projects in Qianhai; (ii) supporting enterprises and financial institutions in Qianhai to issue RMB bonds in Hong Kong for funding development projects in Qianhai; and (iii) lowering the entry requirements for Hong Kong financial institutions to enter the Mainland, so as to strengthen the cross-border development in the future
• On legal services: (i) allowing Hong Kong arbitration institutes to establish branch institutes in Qianhai; and (ii) improving the mode of associations of law firms of the Mainland and Hong Kong.
• On human resources: (i) allowing Hong Kong professionals to practice in Qianhai; and (ii) allowing Hong Kong professionals who are qualified Chinese Certified Public Accountants to become partners of Mainland accounting firms.
• On education and medical services: allowing Hong Kong service suppliers to set up wholly-owned international schools and hospitals in Qianhai.
• On telecommunications services: supporting telecommunications operators in Hong Kong and Macao to establish joint ventures in Qianhai with Mainland counterparts to operate telecommunications businesses.117
• In order to promote the development of modern service industries, tax concessions and land supporting policies are introduced in Qianhai. Relevant tax concessions include (a) exemption of business income tax for offshore services enterprises registered in Qianhai; (b) levy of concessionary business income tax rate, at 15 percent, on high-technology companies registered in Qianhai; and (c) exemption of business income tax on income
116 State Council of China, “Reply of the State Council on Supporting the Development and Opening-up Policies
of Shenzhen Qianhai Shenzhen-Hong Kong Modern Service Industry Cooperation Zone,” 2 July 2018. “国务院
关于支持深圳前海深港现代服务业合作区开发开放有关政策的批复, 国函〔2012〕58 号. 117 Hong Kong Legislative Council, Free economic and trade zones in the Mainland (Part 2), ISE04/15-16.
GBA Background Document
© Copyright 2022 Foundation, 2019. 122
derived from the provision of international maritime insurance services by insurance companies registered in Shenzhen. 118
• The employment permit system for Hong Kong and Macao residents is eliminated to allow professionals with Hong Kong practicing qualifications to work freely; personal income tax for all talent including those from HK will be at a favorable 15 percent.
Hengqin Area Hengqin is located in the southern corner of Zhuhai and is the largest among the 146 islands of Zhuhai. It is connected to Macao by a bridge, with the shortest distance of less than 200 meters to Macao. It is 34 sea miles to Hong Kong. Hengqin Area of Zhuhai will prioritize tourism, leisure and health, business financial services, culture, science, education, high tech, and other industries, to be established as an area of open and leading culture and education, and a leisure and recreation base for international commercial services, as well as create a new engine that promotes appropriate and diversified economic development in Macao. Preferential policies in Hengqin include:
• Eligible enterprises in Hengqin are taxed at a reduced rate of 15 percent.
• Administration of bonded or tax-exempt production-related goods entering Hengqin from abroad has been conducted.
• Production-related goods sold from areas of the Chinese Mainland to Hengqin are treated as exports and enjoy tax refunds.
• Transactions among enterprises located within the Hengqin FTZ are exempted from any value-added tax and/or consumption tax.
• Hong Kong/Macao residents working in Hengqin receive the appropriate China Individual Income Tax (IIT) deduction from the Guangdong Provincial Government so that their effective China IIT burden would be close to what they would pay if they instead had been working where they are domiciled.
• Clearance procedures for residents of Hong Kong and Macao entering and leaving Hengqin are simplified, with 24-hour passage at the Lotus Bridge Checkpoint.
• Administrative regulations for Macao vehicles with single license plates (to be operated exclusively within Hengqin) have been issued.
Preferential policies for Macao in Hengqin include:
• Eleven Measures of Hengqin New Area on Supporting Macao’s Moderate Diversified Economic Development have been issued in favor of Macao investment. These measures concern land acquisition, industrial construction and infrastructure, and Macao businesses and employees’ access to public resources such as talent apartments.
• Macao residents working in Hengqin New Area pay income tax according to Macao salaries tax rate of 12 percent and the differences will be fully subsidized by the Guangdong Government.
Provisions for financial cooperation with Hong Kong and Macao:
118 Hong Kong Legislative Council, Free economic and trade zones in the Mainland (Part 2), ISE04/15-16.
GBA Background Document
© Copyright 2022 Foundation, 2019. 123
• Multi-currency Union Pay IC card issued for the first time allows for the rapid settlement of cross-border payments.
• Settlement has been implemented of foreign exchange capital by foreign-funded enterprises in the Hengqin New Area.
• Insurance agencies in Hengqin, Guangdong, and Macao have associated to provide mutual cross-border motor vehicle insurance.
• Hengqin financial institutions have joined the Macao Pass contactless smartcard payment system, the first of its kind in the Chinese Mainland.
Projects operating in the Hengqin FTZ by March 2016:
• Chimelong International Ocean Tourist Resort
• Hengqin Campus of the University of Macao
• Shizimen Central Business District
• Guangdong-Macao Traditional Chinese Medicine Science & Technology Industrial Park
• Yacht Marina and Yacht Industry Demonstration Base
• Reserved 4.5 sq km of land for Guangdong-Macao Cooperation Industrial Park to develop traditional Chinese medicine, cultural and creative, education, training and other industries. Seven out of 33 projects recommended by the Macao SAR government have settled in the park.
Sources: Zhuhai Government website, http://www.cityofzhuhai.com/2016-03/17/c_50260.htm; Guangdong
Free Trade Zone Website, http://www.china-gdftz.gov.cn/.
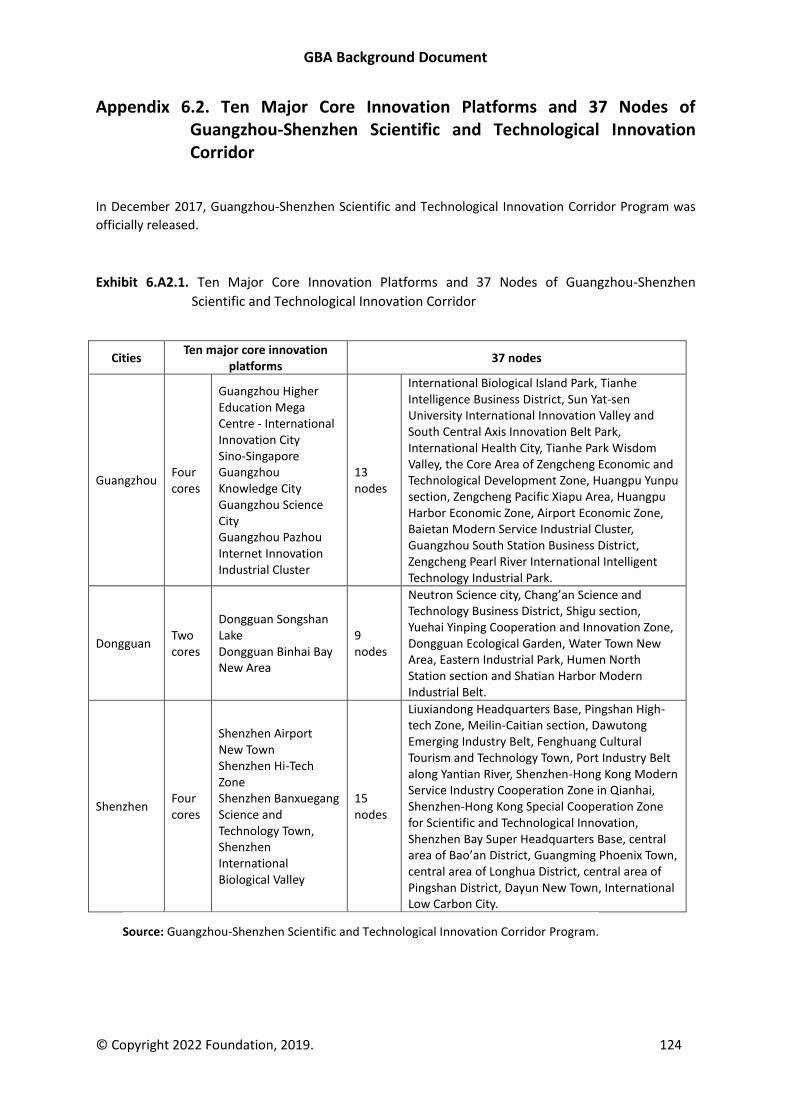
GBA Background Document
© Copyright 2022 Foundation, 2019. 124
Appendix 6.2. Ten Major Core Innovation Platforms and 37 Nodes of Guangzhou-Shenzhen Scientific and Technological Innovation Corridor
In December 2017, Guangzhou-Shenzhen Scientific and Technological Innovation Corridor Program was
officially released.
Exhibit 6.A2.1. Ten Major Core Innovation Platforms and 37 Nodes of Guangzhou-Shenzhen
Scientific and Technological Innovation Corridor
Cities Ten major core innovation
platforms 37 nodes
Guangzhou Four cores
Guangzhou Higher Education Mega Centre - International Innovation City Sino-Singapore Guangzhou Knowledge City Guangzhou Science City Guangzhou Pazhou Internet Innovation Industrial Cluster
13 nodes
International Biological Island Park, Tianhe Intelligence Business District, Sun Yat-sen University International Innovation Valley and South Central Axis Innovation Belt Park, International Health City, Tianhe Park Wisdom Valley, the Core Area of Zengcheng Economic and Technological Development Zone, Huangpu Yunpu section, Zengcheng Pacific Xiapu Area, Huangpu Harbor Economic Zone, Airport Economic Zone, Baietan Modern Service Industrial Cluster, Guangzhou South Station Business District, Zengcheng Pearl River International Intelligent Technology Industrial Park.
Dongguan Two cores
Dongguan Songshan Lake Dongguan Binhai Bay New Area
9 nodes
Neutron Science city, Chang’an Science and Technology Business District, Shigu section, Yuehai Yinping Cooperation and Innovation Zone, Dongguan Ecological Garden, Water Town New Area, Eastern Industrial Park, Humen North Station section and Shatian Harbor Modern Industrial Belt.
Shenzhen Four cores
Shenzhen Airport New Town Shenzhen Hi-Tech Zone Shenzhen Banxuegang Science and Technology Town, Shenzhen International Biological Valley
15 nodes
Liuxiandong Headquarters Base, Pingshan High-tech Zone, Meilin-Caitian section, Dawutong Emerging Industry Belt, Fenghuang Cultural Tourism and Technology Town, Port Industry Belt along Yantian River, Shenzhen-Hong Kong Modern Service Industry Cooperation Zone in Qianhai, Shenzhen-Hong Kong Special Cooperation Zone for Scientific and Technological Innovation, Shenzhen Bay Super Headquarters Base, central area of Bao’an District, Guangming Phoenix Town, central area of Longhua District, central area of Pingshan District, Dayun New Town, International Low Carbon City.
Source: Guangzhou-Shenzhen Scientific and Technological Innovation Corridor Program.
GBA Background Document
© Copyright 2022 Foundation, 2019. 125
Appendix 6.3. Examples of Inter-Governmental Interaction in the GBA
There has been a substantial amount of interaction among government officials across the GBA in
recent years. Intergovernmental interaction is reflected in cooperation on infrastructure projects
including the Hong Kong-Zhuhai-Macao Bridge and the XRL rail line that connects Hong Kong to
China’s high-speed rail network. Multiple rounds of CEPA, the creation of the Guangdong Free Trade
Zone, the creation of numerous cooperation zones, and cooperation on a wide range of issues from
the environment, to education, to public health, to technology development, and others are the
result of intergovernmental interaction, much of which goes on behind the scenes and may not be
obvious to the public.
The creation of the Central Government Leading Group on the GBA under the supervision of Vice
Premier and Chinese Communist Party Standing Committee member Han Zheng with members
including the Chief Executive of HKSAR, the Chief Executive of Macao, as well as representatives
from the Guangdong Province and the National Reform and Development Commission, and its
meetings should foster further interaction and cooperation between governments in the region.
Examples of interaction also include the establishment in 2003 of 15 expert groups under the Sixth
Plenary of the Hong Kong/Guangdong Co-operation Joint Conference. 119 These groups have
responsibility to undertake studies and follow up and implement cooperation projects in various
specific fields endorsed at the Joint Conference. Since 2003, 12 new expert groups have been
established as indicated in Exhibit 6.A3.1. There have been numerous visits by senior officials to
other jurisdictions in the GBA and the expert and working groups have regular meetings. There have
also been some joint efforts to promote the region in external markets. For example, officials from
the GBA have visited other countries in Southeast Asia to promote the GBA as a place for
investment. For instance, the director-general of Invest Hong Kong has visited Vietnam and Thailand
to discuss opportunities in the GBA.
Intergovernmental cooperation in the GBA within Guangdong is highlighted in the next section.
119 Hong Kong SAR Government, “Develop new frontiers in HK/Guangdong co-operation,” 5 August 2003.
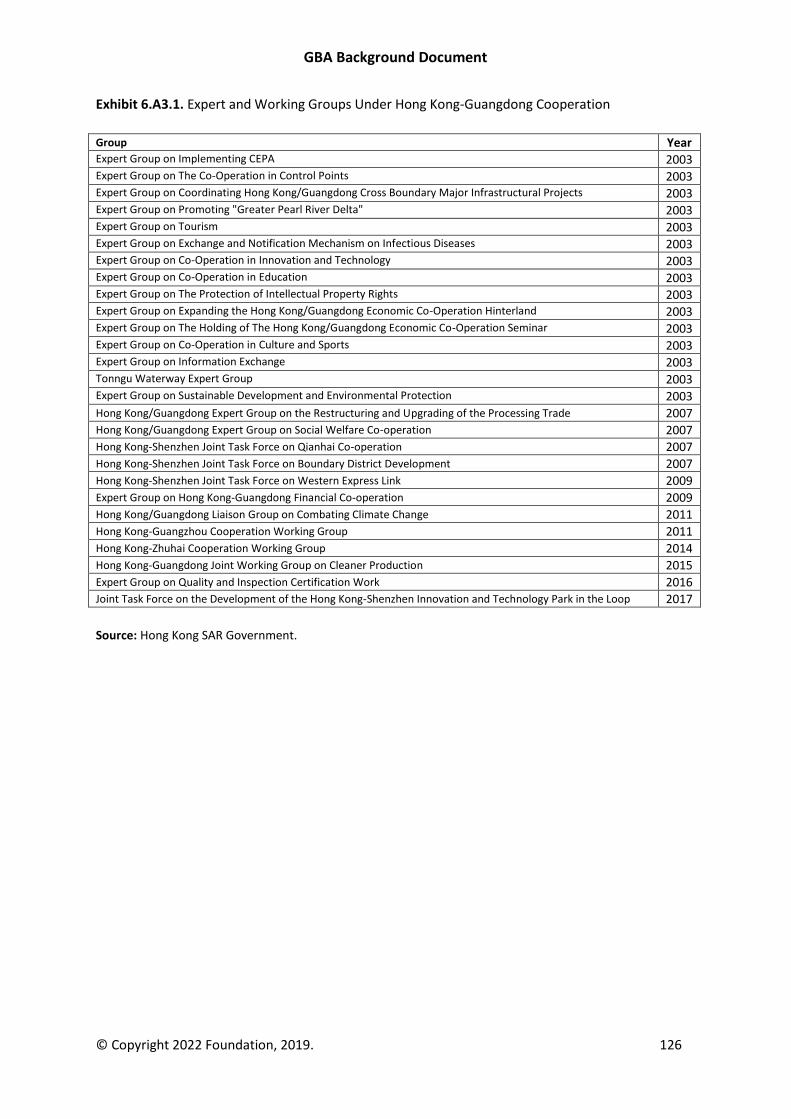
GBA Background Document
© Copyright 2022 Foundation, 2019. 126
Exhibit 6.A3.1. Expert and Working Groups Under Hong Kong-Guangdong Cooperation
Group Year Expert Group on Implementing CEPA 2003 Expert Group on The Co-Operation in Control Points 2003 Expert Group on Coordinating Hong Kong/Guangdong Cross Boundary Major Infrastructural Projects 2003 Expert Group on Promoting "Greater Pearl River Delta" 2003 Expert Group on Tourism 2003 Expert Group on Exchange and Notification Mechanism on Infectious Diseases 2003 Expert Group on Co-Operation in Innovation and Technology 2003 Expert Group on Co-Operation in Education 2003 Expert Group on The Protection of Intellectual Property Rights 2003 Expert Group on Expanding the Hong Kong/Guangdong Economic Co-Operation Hinterland 2003 Expert Group on The Holding of The Hong Kong/Guangdong Economic Co-Operation Seminar 2003 Expert Group on Co-Operation in Culture and Sports 2003 Expert Group on Information Exchange 2003 Tonngu Waterway Expert Group 2003 Expert Group on Sustainable Development and Environmental Protection 2003 Hong Kong/Guangdong Expert Group on the Restructuring and Upgrading of the Processing Trade 2007 Hong Kong/Guangdong Expert Group on Social Welfare Co-operation 2007 Hong Kong-Shenzhen Joint Task Force on Qianhai Co-operation 2007 Hong Kong-Shenzhen Joint Task Force on Boundary District Development 2007 Hong Kong-Shenzhen Joint Task Force on Western Express Link 2009 Expert Group on Hong Kong-Guangdong Financial Co-operation 2009 Hong Kong/Guangdong Liaison Group on Combating Climate Change 2011 Hong Kong-Guangzhou Cooperation Working Group 2011 Hong Kong-Zhuhai Cooperation Working Group 2014 Hong Kong-Guangdong Joint Working Group on Cleaner Production 2015 Expert Group on Quality and Inspection Certification Work 2016 Joint Task Force on the Development of the Hong Kong-Shenzhen Innovation and Technology Park in the Loop 2017
Source: Hong Kong SAR Government.
GBA Background Document
© Copyright 2022 Foundation, 2019. 127
7. Economic Circles in the PRD
In addition to plans focused on the entire GBA, or the entirety of the Guangdong-Hong Kong-Macao
region, there are specific plans to foster integration among city groups in the PRD portion of the
GBA. These include plans for the integration of Guangzhou, Foshan, and Zhaoqing (including more
far-reaching plans for Guangzhou-Foshan integration); Shenzhen, Dongguan, and Huizhou; and
Zhuhai, Zhongshan, and Jiangmen. The city groups show the sort of interaction and integration that
can be achieved within the GBA, or at least portions of the GBA. In this section, we will focus on
integration among Guangzhou, Foshan, and Zhaoqing. Some of the specific initiatives for all three
circles can be found in Appendices 7.1, 7.2, and 7.3.
Guangzhou-Foshan-Zhaoqing Integration
In 2009, following on from the publication of the NDRC PRD Outline Plan, the Guangdong
Government published the Decision on Implementing the Outline of the Plan for the Reform and
Development of the Pearl River Delta (2008-2020). This document proposed to promote the
economic and social integration of the cities through the construction of three economic circles, the
Guang-Fo-Zhao (Guangzhou, Foshan, and Zhaoqing), Shen-Guan-Hui (Shenzhen, Dongguan, and
Huizhou), and Zhu-Zhong-Jiang (Zhuhai, Zhongshan, and Jiangmen) Economic Circles.
The Guangzhou and Foshan governments took the lead to sign a Framework Agreement on
Guangzhou-Foshan Integration. Four cooperation agreements were signed covering city planning,
transport infrastructure construction, industrial coordination, and environmental protection. The
two governments also published a Development Plan for Guangzhou-Foshan Integration (2009-
2020), which described in detail the spatial layout for the integrated development; the key
integrated regions of the two cities; and the key integrated aspect in infrastructure, industry
coordination, technology and innovation, environment protection, social undertakings, public
services, regional cooperation, and institutional cooperation.
In June 2009, the Guangzhou, Foshan, and Zhaoqing Governments signed the Framework Agreement
on the Construction of the Guangzhou-Foshan-Zhaoqing Economic Circle, proposing that the three
cities undertake “double transfers” of industries and workers, as well as strategic cooperation on
transport, planning, industry, environment protection, tourism, innovation, and social services. This
was followed in 2011 by the Development Plan for the Guangzhou-Foshan-Zhaoqing Economic Circle
(2010-2020), which set goals of overall integration of Guangzhou-Foshan by 2015 and Guang-Fo-
Zhao Integration by 2020. Since then the three cities have made great achievements in this
integration process.
Transport Integration
One area in which integration has proceeded to a great extent is transportation, the Guang-Fo
Metro (38.84 km, started operation in 2010) is China’s first underground fast rail line to cross two
cities. It takes 54 minutes to travel from its western terminal at Foshan New Town Station to the
east terminal at Lijiao Station of Guangzhou. In 2017, there were nearly 110 million passengers on
this line (300,000 per day), 49 percent of which travelled across the city boundary. In 2016,
construction started to extend Guangzhou metro line no. 7 to Shunde in Foshan.
GBA Background Document
© Copyright 2022 Foundation, 2019. 128
With respect to road transport, 9 expressways and 16 highways now connect Guangzhou and
Foshan. There are also 15 Guang-Fo city bus lines, 13 Guang-Fo fast bus lines, and 47 Guang-Fo
intercity passenger transport lines. In December 2016, the Nanhai District of Foshan and the Panyu
District of Guangzhou cooperated to construct the Pan-Hai Bridge, the second bridge connecting the
two cities. In 2017, the Guangzhou and Foshan governments proposed to set up 9 connection points
to connect the city rail networks in the two cities, and planned 2 for the future, thus there will be 11
city rail lines that connect the two cities. The Foshan mayor said that by 2020, Foshan will finish
construction the Guang-Fo rail, the Foshan rail line no. 2, the west extension of Guangzhou rail line
no. 7, Guang-Fo Ring rail (Foshan West Station to Guangzhou South Station), and Foshan-Zhaoqing
inter-city rail, together with the existing Guangzhou-Zhuhai inter-city rail, to realize the “one-hour
metropolis circle” plan.120
Zhaoqing is connected with Guang-Fo by the Nanning-Guangzhou and Guiyang-Guangzhou High-
speed railways and the Guangzhou-Foshan-Zhaoqing inter-city rail. The Guangzhou-Zhanjiang and
Liuzhou-Guangzhou High-speed rail lines that will connect the three cities have been incorporated
into the national mid-and long-term rail network plan.121 There are 7 expressways, 1 waterway
connecting Zhaoqing with Guangzhou and Foshan. In addition, Zhaoqing also plans to build 11
highways (including 3 expressways) and 2 bridges to connect with Foshan. A feasibility study on
extending the Guangzhou-Foshan Metro Line to Zhaoqing is underway.
Two important projects for Guangzhou-Foshan-Zhaoqing integration are the Guangzhou-Foshan-
Zhaoqing Inter-city Rail and the Guangzhou-Foshan-Zhaoqing Expressway. The Guangzhou-Foshan-
Zhaoqing Inter-city Rail is 111 km long starting from Zhaoqing Station, passing through Foshan West
Station, and reaching Guangzhou Station on the eastside. In the process it connects with national
railway stations and high-speed rail stations. At present it takes 1 hour 18 minutes for the whole
journey, even though the design speed of 200 km/hour is not yet reached. The 30.5 pairs of trains
per day that operate is also far less than the eventual expected 77 pairs per day. It is hoped that
traffic will increase when the inter-city rail connects Shenzhen and Dongguan. The 177.3 km
Guangzhou-Foshan-Zhaoqing Expressway connects the three cities and extends to Wuzhou City in
Guangxi Province. The Zhaoqing section opened in December 2016; the Guangzhou and Foshan
sections are expected to be completed in 2019 and 2020 respectively. When completed, it will
connect Foshan and Zhaoqing in 30 minutes and Zhaoqing and Guangzhou in 40 minutes.
Construction has started on the north section of the Guangzhou-Foshan Orbital Inter-city Rail, which
will connect Guangzhou South Station, Foshan West Station, and Guangzhou Baiyun Airport with fast
rail links. In addition, the Nansha Port Phase 4 is planned to be invested, built, and operated by a
company owned by companies from Guangzhou, Foshan, and Zhongshan. The port will serve mostly
Foshan, Zhongshan, and Jiangmen.
120 As indicated earlier, a “one-hour circle” would be indicative of a tightly integrated local economy. 121 This Guangzhou-Zhanjiang rail was scheduled to start construction in August 2018.
GBA Background Document
© Copyright 2022 Foundation, 2019. 129
Land Planning Integration
Integration along the border of Guangzhou and Foshan is taking place as Guangzhou residents buy
properties and move to the Foshan side. Industrial projects have also been attracted to the border
areas of Foshan due to lower costs, good logistics, and adjacency to Guangzhou. The Lishui region in
Foshan adjacent to Guangzhou’s Jinsha Zhou area is such an area. In 2014, when Guangzhou urban
planning department re-planned the Jinsha Zhou Area, it incorporated the Lishui region of Foshan as
a Guangzhou-Foshan Gateway Point. In 2015, the Guangzhou and Foshan Governments started
carrying out integrated planning on five bordering areas, Fangcun-Guicheng, the Jinsha Zhou Area,
the area around Guangzhou South Station, the Baiyun Airport area, and the Wusha Area. The two
Governments also signed an agreement to build cooperation demonstration zones across three
adjacent district pairs: Liwan-Nanhai, Panyu-Shunde, and Huadu-Sanshui. Cooperation includes
district officials from one city working in the district departments in the other city.
Economic Planning Integration
The Framework Agreement on the Construction of the Guangzhou-Foshan-Zhaoqing Economic Circle
of 2009 proposed to coordinate the industrial development plans in the three cities to complement
with each other. Foshan first tried to attract the automobile production chain in Guangzhou to
extend to Foshan. Now Guangzhou focuses on the production of Japanese automobiles and Foshan
focuses on German automobiles. Foshan has attracted 7 Guangzhou branches of Hong Kong banks
including HSBC and Bank of East Asia to establish branches in Foshan since 2010. More than 20
banks in the two cities have accepted interbank deposit and withdrawal. However, overall industrial
cooperation between the two cities is still limited.
The industrial integration of Foshan and Zhaoqing has been based on the “double transfer” of
industries and labor. More than 142 projects in Foshan have transferred to Zhaoqing. Many ceramic
companies in Foshan have moved their production bases to Zhaoqing. Two Foshan stainless steel
firms moved their headquarters to the Zhaoqing High-tech Industrial Development Zone. The Fujian
Chamber of Commerce in Foshan built a High- and New Tech Park in the Guang-Fo-Zhao Economic
Cooperation Zone in Huaiji of Zhaoqing and moved their whole production chain there.
Zhaoqing’s proximity to Foshan and Guangzhou led to the establishment of the Dawang Zhaoqing
High-tech Industrial Development Zone, which was set up in part to accept industrial transfer from
the PRD and has developed into an engine parts manufacturing base starting from supplying parts to
Guangzhou and Foshan. This is just one of many examples of relocation across the cities that has
taken place in recent years.
Integration of Public Services
Education
Guangzhou is one of China’s major centers for higher education. It has 83 universities and colleges.
Foshan, on the other hand, was once ranked first by a national economic publication among “the
Chinese Cities that Lack Universities.” Zhaoqing is Guangdong’s vocational and technical education
training base, with 31 vocational schools and high quality of labor training. However, Zhaoqing, like
Foshan, lacks universities. Foshan and Zhaoqing have attempted to persuade universities and
GBA Background Document
© Copyright 2022 Foundation, 2019. 130
colleges in Guangzhou to open local campuses. So far three Guangzhou universities have established
campuses in Foshan, South China Normal University (Nanhai Campus), Southern Medical University
(Shunde Campus), and Guangdong University of Finance and Economics (Sanshui Campus). Zhaoqing
University has had cooperative programs with Guangdong University of Technology, Zhongkai
Universities of Agriculture and Engineering, Guangzhou University, and South China Normal
University. Zhaoqing Medical College has held undergraduate programs with Guangdong Medical
University, Guangzhou Medical University, and Guangzhou University of Traditional Chinese
Medicine. In 2018, Huashang College of Guangdong University of Finance and Economics and
Zhujiang College of South China Agricultural University started constructing campuses in Zhaoqing.
Guangzhou has absolute advantages in primary and secondary education among the three cities.
Guangzhou has 43 national model high schools (an important indicator), while Foshan has 27, and
Zhaoqing has 2. Foshan and Zhaoqing have invited schools from Guangzhou to establish affiliates in
Foshan so Foshan can absorb teaching and management experience. Examples include Zhaoqing
Guangwai Foreign Language School and Foshan Foreign Language School (Guangdong University of
Foreign Studies), Nanhai Zhixin High School (Guangzhou Zhixin High School), Nanhai Experimental
High School (South China Normal University Affiliated Middle School), and Guangdong Experimental
Nanhai School (Guangdong Experimental Middle School, Guangzhou). There were some suggestions
as early as 2009 that children in Guangzhou and Foshan be allowed to choose schools in the two
cities freely. However, this proposal has not been implemented, even in the border areas of Lishui
and Jinshazhou area which are supposed to be experimental areas for integration. As a result, for
example, children of Guangzhou citizens who work in Foshan cannot enjoy free education in Foshan
and have to pay high education fees.
The Thirteenth Five-year Program for Guangzhou-Foshan Integration (2016-2020) published in 2017
proposed to coordinate the layout of primary and secondary schools and kindergartens in the border
areas of Liwan, Baiyun, Huadu, and Panyu in Guangzhou and Nanhai, Sanshui, and Shunde in Foshan,
and support prestige schools to established sub-schools across regions. It is not clear how far this
has proceeded.
In 2009, the Guangzhou and Foshan education departments signed the Education Cooperation
Agreement for the Guangzhou-Foshan Integration. In 2010, the two cities signed a vocational
education agreement to leave 100 spots in 3 to 5 middle level vocational schools in each city for
students from the other city. The educational bureaus of Guangzhou, Foshan, and Zhaoqing
cooperate to hold academic conferences, forums, and seminars. Student exchanges, such as
knowledge competition matches are active in the three cities. According to the “Thousand Schools
Help Thousand Schools” Plan of the Guangdong Educational Department, Guangzhou and Foshan
schools have respectively provided support to 96 and 85 primary and middle schools, among which
33 are in Zhaoqing. In 2009, the education departments of Guangzhou and Foshan established the
“Guang-Fo Education Search Engine” for students in the two cities to browse and download
education materials from the intranet. In 2016, education bureaus in 7 PRD cities, i.e. Guangzhou,
Foshan, Zhaoqing, Meizhou, Qingyuan, Yunfu, and Shaoguan jointly launched the “Internet +”
Learning and Teaching Conference, to pool teaching materials to education apps that can be shared
to students.
GBA Background Document
© Copyright 2022 Foundation, 2019. 131
Social Insurance and Healthcare
Unemployment insurance benefits have been freely transferable among Guangzhou, Foshan, and
Zhaoqing since 2011. Pension and unemployment insurance have been transferrable between
Guangzhou, Foshan, Zhaoqing, and Qingyuan since 2015. In 2016, the Guangdong Government
published the Key Points for Deepening the Medical and Health System Reform Work, proposing
cross-city settlement of health care expenditures for healthcare insurers within Guangdong
Province. By June 2018, 151, 60, and 33 hospitals respectively in Guangzhou, Foshan, and Zhaoqing
had joined the National medical treatment and settlement system, indicating that medical insurers
in the three cities can settle their medical treatment expenditures in any of these hospitals.
The three cities are trying to providing better public health services starting with sharing health
information among cities, creating a unified residents' medical card, mutual recognition of medical
examination results, real-time joint consultation, and medical results sharing. In 2010, residents’
medical examination and test results in 19 designated municipal hospitals in Guangzhou and Foshan
were mutually recognized. From March 2018, medical examinations and imaging examination results
in 117 Grade III hospitals122 and 6 medical examination centers in Guangdong Province have been
mutually recognized. Among these medical institutions, 36 Grade III hospitals are in Guangzhou, 12
in Foshan, and 3 in Zhaoqing, while all the medical examination centers are from Guangzhou and
Foshan. In 2016, family planning information in Guangzhou, Foshan, and Zhaoqing has been linked
and the family planning service management has been consolidated. In 2016, 15 cities in Guangdong
Province, including Guangzhou, Foshan, and Zhaoqing, started a “medical card,” which integrates
the information of a resident in his health card, ID card, social security card, financial IC card, and
citizen service card. This card is expected to improve residents’ experience in medical registration,
medical treatment in different places, medical payment, and digitalization of medical records.
Despite the integration efforts in medical treatment and healthcare, the designated settlement
hospitals are still not enough to serve demand. People who work in another city mostly have to go
back to the cities in which they have taken out insurance for medical treatment, otherwise, they
have to pay the whole bill first and then get refunded later.
Livelihood, Leisure, and Entertainment Services
City transport cards were unified in Guangzhou and Foshan in 2006 and in Guangzhou, Foshan, and
Zhaoqing in 2009. In 2016, Guangzhou’s Guang-Fo Card used outside Guangzhou, mainly in Foshan,
reached 91.4 million person-times; and Foshan’s transport card used outside Foshan, mainly in
Guangzhou, reached 171.9 million person-times. In 2013, China launched the national transport card
project, encouraging cities across the country to upgrade their public transport terminals so that this
card can be used at these terminals. Guangdong and Foshan plan to finish restructuring their metro
ticket gate system by November 2018 and will try the national transport card first on the
Guangzhou-Foshan-Zhaoqing Inter-city Rail line, and then on all the buses in the three cities, and
thus replace local transport cards currently used. Long-distance fees and roaming fees were
122 Grade III hospitals refer to hospitals that provide medical and health services all over the nation across regions, provinces, cities. They are medical and disease prevention technical centres with comprehensive medical, teaching, and scientific research capabilities.
GBA Background Document
© Copyright 2022 Foundation, 2019. 132
removed for phone calls within the three cities in 2012. Adjacent districts in Guangzhou and Foshan
(Liwan and Nanhai) have integrated their administrative services since 2014.
Guangzhou, Foshan, and Zhaoqing jointly promote tourism through the Guang-Fo-Zhao Tourism
Card, which can be used for public transport in the three cities and discounts in scenic spots, hotels
and restaurants, and travel agents in the three cities. Three districts respectively in the three cities
have jointly promoted Cantonese culture.
Further plans for integration
In September 2017, the Thirteenth Five-year Program for Guangzhou-Foshan Integration (2016-
2020) was published. The plan identified several deep-routed problems that have hindered the
Guangzhou-Foshan Integration process: 1) the overall and institutional coordination system is weak;
2) industrial integration is not well established, platforms for industrial cooperation are insufficient,
and the “R&D in Guangzhou + Foshan Manufacturing” model is far from fully formed; 3) the
radiation and impact of Guangzhou’s airports, ports, and high-speed rail hubs on Foshan are still
weak; and 4) cooperation in people’s livelihood is weak and both cities are still in short supply of
public services.
According to the Program, Guangzhou-Foshan Integration has entered the deep integration and
transformation stage, in which the integrated transportation network is the basis; market
integration is the core; industrial dislocation development is a breakthrough; technological
innovation is the driving force; public policy integration is the guarantee; and the free flow of
economic factors, efficient allocation of resources, and the deep integration of the market are the
targets. The overall positioning of the Guangzhou-Foshan Area will be: 1) the core area of the PRD
city cluster; 2) the national model of city-integrated development; 3) the core hub of Guangdong-
Hong Kong-Macao cooperation, the leading area of independent innovation in the PRD, and 4) a
national service and advanced manufacturing center.
By 2020, the Guang-Fo area aims to have comprehensive economic strength and a complete
infrastructure network. New breakthroughs have been made in industrial division of labor;
innovation capabilities have been tremendously increased; ecological environment quality has
improved significantly; basic public service has been steadily improved; social employment has
become more adequate; a well-off society has been fully established.
To achieve these goals, the two cities jointly planned their infrastructure, industrial layout and key
focuses, innovation enhancing strategies, and environment protection procedures. They also agreed
to cooperate to promote education resources sharing, improve medical and health care, jointly
develop culture and sports, coordinate employment services and social securities, and coordinate
the administrative institutions. Together they will promote the development of a Guangzhou-
Foshan-Zhaoqing-Yunfu-Shaoguan economic circle, develop simultaneously with areas on both side
of the Pearl River, deeply involve into the construction of the Nashan Free Trade Zone, promote
closer cooperation with Hong Kong and Macao, and participate into national initiatives. They will
continue to develop the three city integration demonstration areas of Liwan-Nanhai, Huadu-Sanshui,
and Panyu-Shunde.
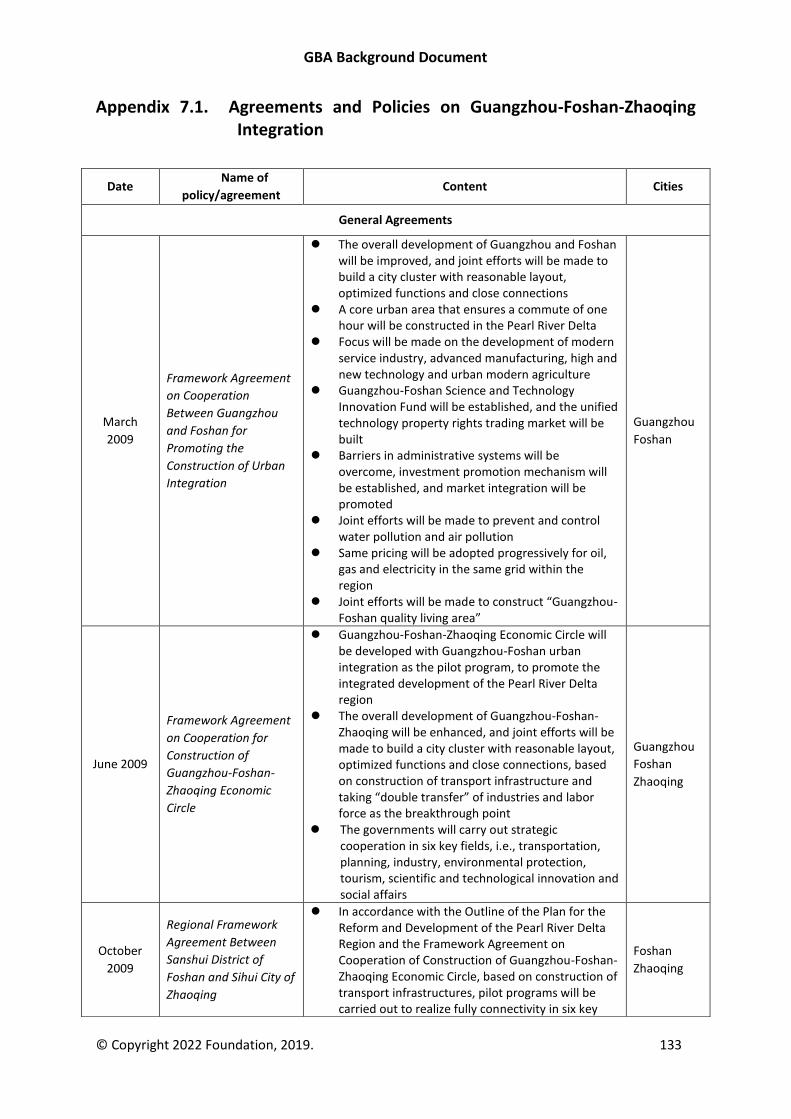
GBA Background Document
© Copyright 2022 Foundation, 2019. 133
Appendix 7.1. Agreements and Policies on Guangzhou-Foshan-Zhaoqing Integration
Date Name of
policy/agreement Content Cities
General Agreements
March
2009
Framework Agreement
on Cooperation
Between Guangzhou
and Foshan for
Promoting the
Construction of Urban
Integration
⚫ The overall development of Guangzhou and Foshan will be improved, and joint efforts will be made to build a city cluster with reasonable layout, optimized functions and close connections
⚫ A core urban area that ensures a commute of one hour will be constructed in the Pearl River Delta
⚫ Focus will be made on the development of modern service industry, advanced manufacturing, high and new technology and urban modern agriculture
⚫ Guangzhou-Foshan Science and Technology Innovation Fund will be established, and the unified technology property rights trading market will be built
⚫ Barriers in administrative systems will be overcome, investment promotion mechanism will be established, and market integration will be promoted
⚫ Joint efforts will be made to prevent and control water pollution and air pollution
⚫ Same pricing will be adopted progressively for oil, gas and electricity in the same grid within the region
⚫ Joint efforts will be made to construct “Guangzhou-Foshan quality living area”
Guangzhou
Foshan
June 2009
Framework Agreement
on Cooperation for
Construction of
Guangzhou-Foshan-
Zhaoqing Economic
Circle
⚫ Guangzhou-Foshan-Zhaoqing Economic Circle will be developed with Guangzhou-Foshan urban integration as the pilot program, to promote the integrated development of the Pearl River Delta region
⚫ The overall development of Guangzhou-Foshan-Zhaoqing will be enhanced, and joint efforts will be made to build a city cluster with reasonable layout, optimized functions and close connections, based on construction of transport infrastructure and taking “double transfer” of industries and labor force as the breakthrough point
⚫ The governments will carry out strategic cooperation in six key fields, i.e., transportation, planning, industry, environmental protection, tourism, scientific and technological innovation and social affairs
Guangzhou
Foshan
Zhaoqing
October
2009
Regional Framework
Agreement Between
Sanshui District of
Foshan and Sihui City of
Zhaoqing
⚫ In accordance with the Outline of the Plan for the Reform and Development of the Pearl River Delta Region and the Framework Agreement on Cooperation of Construction of Guangzhou-Foshan-Zhaoqing Economic Circle, based on construction of transport infrastructures, pilot programs will be carried out to realize fully connectivity in six key
Foshan
Zhaoqing
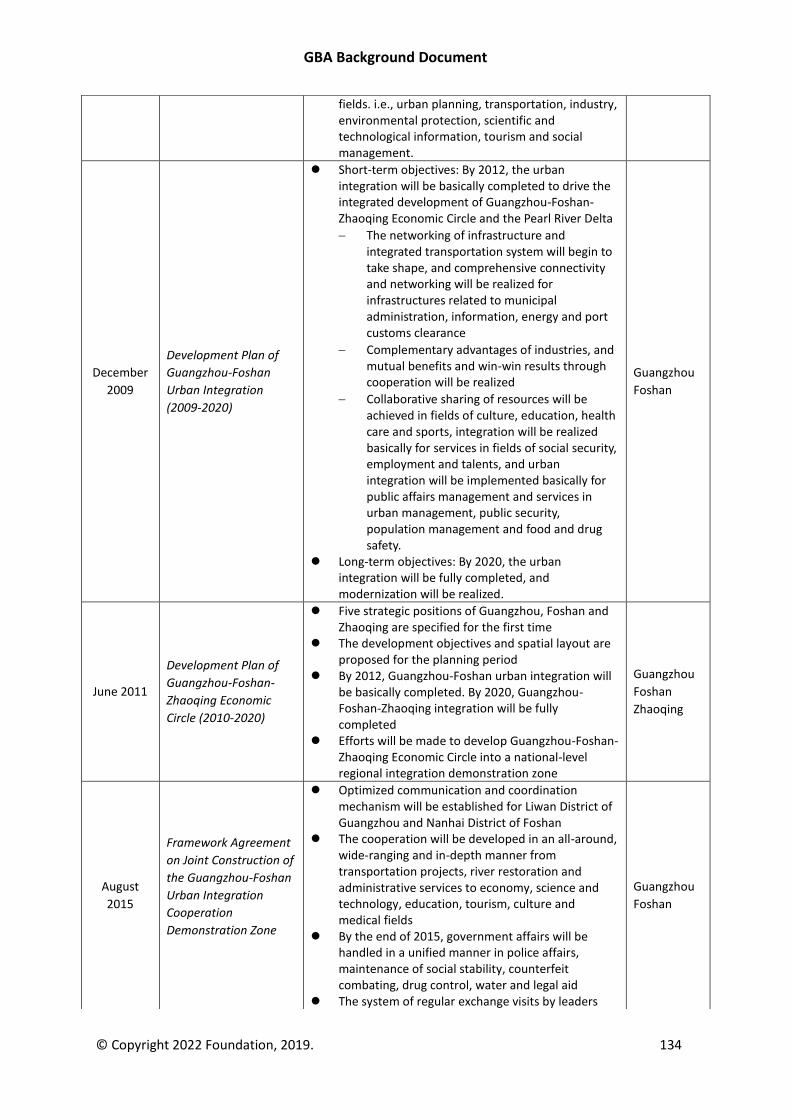
GBA Background Document
© Copyright 2022 Foundation, 2019. 134
fields. i.e., urban planning, transportation, industry, environmental protection, scientific and technological information, tourism and social management.
December
2009
Development Plan of
Guangzhou-Foshan
Urban Integration
(2009-2020)
⚫ Short-term objectives: By 2012, the urban integration will be basically completed to drive the integrated development of Guangzhou-Foshan-Zhaoqing Economic Circle and the Pearl River Delta
− The networking of infrastructure and integrated transportation system will begin to take shape, and comprehensive connectivity and networking will be realized for infrastructures related to municipal administration, information, energy and port customs clearance
− Complementary advantages of industries, and mutual benefits and win-win results through cooperation will be realized
− Collaborative sharing of resources will be achieved in fields of culture, education, health care and sports, integration will be realized basically for services in fields of social security, employment and talents, and urban integration will be implemented basically for public affairs management and services in urban management, public security, population management and food and drug safety.
⚫ Long-term objectives: By 2020, the urban integration will be fully completed, and modernization will be realized.
Guangzhou
Foshan
June 2011
Development Plan of
Guangzhou-Foshan-
Zhaoqing Economic
Circle (2010-2020)
⚫ Five strategic positions of Guangzhou, Foshan and Zhaoqing are specified for the first time
⚫ The development objectives and spatial layout are proposed for the planning period
⚫ By 2012, Guangzhou-Foshan urban integration will be basically completed. By 2020, Guangzhou-Foshan-Zhaoqing integration will be fully completed
⚫ Efforts will be made to develop Guangzhou-Foshan-Zhaoqing Economic Circle into a national-level regional integration demonstration zone
Guangzhou
Foshan
Zhaoqing
August
2015
Framework Agreement
on Joint Construction of
the Guangzhou-Foshan
Urban Integration
Cooperation
Demonstration Zone
⚫ Optimized communication and coordination mechanism will be established for Liwan District of Guangzhou and Nanhai District of Foshan
⚫ The cooperation will be developed in an all-around, wide-ranging and in-depth manner from transportation projects, river restoration and administrative services to economy, science and technology, education, tourism, culture and medical fields
⚫ By the end of 2015, government affairs will be handled in a unified manner in police affairs, maintenance of social stability, counterfeit combating, drug control, water and legal aid
⚫ The system of regular exchange visits by leaders
Guangzhou
Foshan
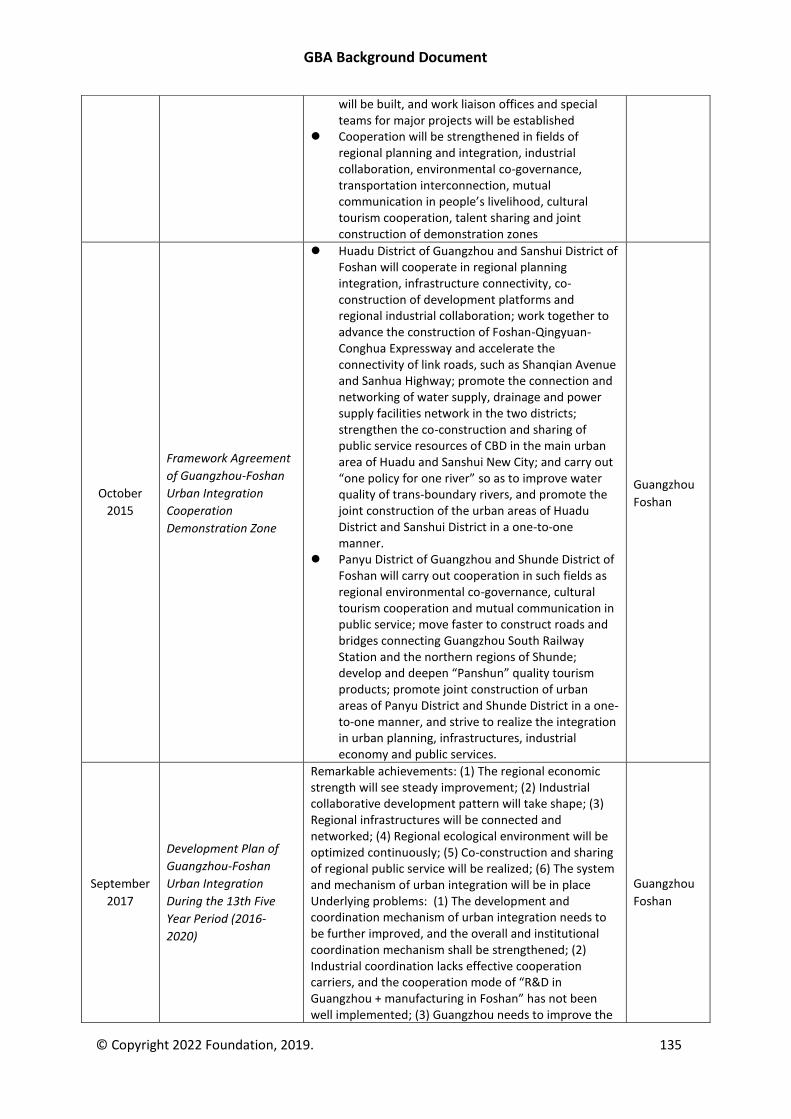
GBA Background Document
© Copyright 2022 Foundation, 2019. 135
will be built, and work liaison offices and special teams for major projects will be established
⚫ Cooperation will be strengthened in fields of regional planning and integration, industrial collaboration, environmental co-governance, transportation interconnection, mutual communication in people’s livelihood, cultural tourism cooperation, talent sharing and joint construction of demonstration zones
October
2015
Framework Agreement
of Guangzhou-Foshan
Urban Integration
Cooperation
Demonstration Zone
⚫ Huadu District of Guangzhou and Sanshui District of Foshan will cooperate in regional planning integration, infrastructure connectivity, co-construction of development platforms and regional industrial collaboration; work together to advance the construction of Foshan-Qingyuan-Conghua Expressway and accelerate the connectivity of link roads, such as Shanqian Avenue and Sanhua Highway; promote the connection and networking of water supply, drainage and power supply facilities network in the two districts; strengthen the co-construction and sharing of public service resources of CBD in the main urban area of Huadu and Sanshui New City; and carry out “one policy for one river” so as to improve water quality of trans-boundary rivers, and promote the joint construction of the urban areas of Huadu District and Sanshui District in a one-to-one manner.
⚫ Panyu District of Guangzhou and Shunde District of Foshan will carry out cooperation in such fields as regional environmental co-governance, cultural tourism cooperation and mutual communication in public service; move faster to construct roads and bridges connecting Guangzhou South Railway Station and the northern regions of Shunde; develop and deepen “Panshun” quality tourism products; promote joint construction of urban areas of Panyu District and Shunde District in a one-to-one manner, and strive to realize the integration in urban planning, infrastructures, industrial economy and public services.
Guangzhou
Foshan
September
2017
Development Plan of
Guangzhou-Foshan
Urban Integration
During the 13th Five
Year Period (2016-
2020)
Remarkable achievements: (1) The regional economic strength will see steady improvement; (2) Industrial collaborative development pattern will take shape; (3) Regional infrastructures will be connected and networked; (4) Regional ecological environment will be optimized continuously; (5) Co-construction and sharing of regional public service will be realized; (6) The system and mechanism of urban integration will be in place Underlying problems: (1) The development and coordination mechanism of urban integration needs to be further improved, and the overall and institutional coordination mechanism shall be strengthened; (2) Industrial coordination lacks effective cooperation carriers, and the cooperation mode of “R&D in Guangzhou + manufacturing in Foshan” has not been well implemented; (3) Guangzhou needs to improve the
Guangzhou
Foshan
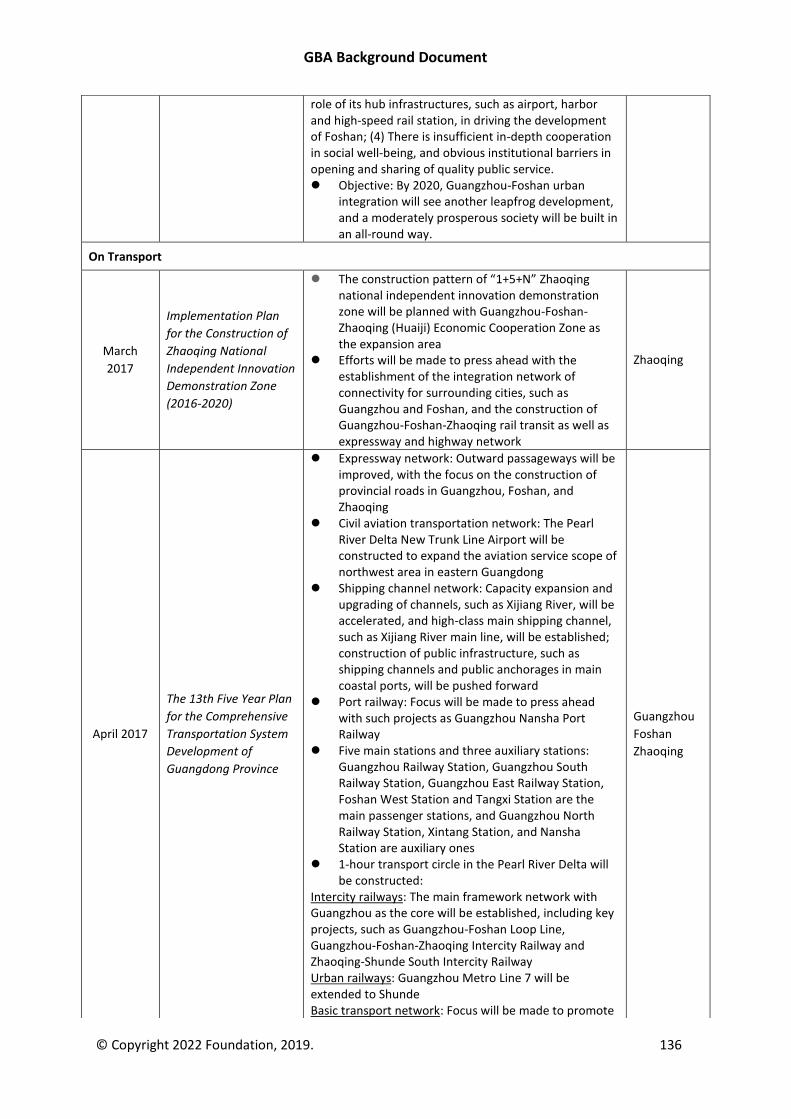
GBA Background Document
© Copyright 2022 Foundation, 2019. 136
role of its hub infrastructures, such as airport, harbor and high-speed rail station, in driving the development of Foshan; (4) There is insufficient in-depth cooperation in social well-being, and obvious institutional barriers in opening and sharing of quality public service. ⚫ Objective: By 2020, Guangzhou-Foshan urban
integration will see another leapfrog development, and a moderately prosperous society will be built in an all-round way.
On Transport
March
2017
Implementation Plan
for the Construction of
Zhaoqing National
Independent Innovation
Demonstration Zone
(2016-2020)
⚫ The construction pattern of “1+5+N” Zhaoqing national independent innovation demonstration zone will be planned with Guangzhou-Foshan-Zhaoqing (Huaiji) Economic Cooperation Zone as the expansion area
⚫ Efforts will be made to press ahead with the establishment of the integration network of connectivity for surrounding cities, such as Guangzhou and Foshan, and the construction of Guangzhou-Foshan-Zhaoqing rail transit as well as expressway and highway network
Zhaoqing
April 2017
The 13th Five Year Plan
for the Comprehensive
Transportation System
Development of
Guangdong Province
⚫ Expressway network: Outward passageways will be improved, with the focus on the construction of provincial roads in Guangzhou, Foshan, and Zhaoqing
⚫ Civil aviation transportation network: The Pearl River Delta New Trunk Line Airport will be constructed to expand the aviation service scope of northwest area in eastern Guangdong
⚫ Shipping channel network: Capacity expansion and upgrading of channels, such as Xijiang River, will be accelerated, and high-class main shipping channel, such as Xijiang River main line, will be established; construction of public infrastructure, such as shipping channels and public anchorages in main coastal ports, will be pushed forward
⚫ Port railway: Focus will be made to press ahead with such projects as Guangzhou Nansha Port Railway
⚫ Five main stations and three auxiliary stations: Guangzhou Railway Station, Guangzhou South Railway Station, Guangzhou East Railway Station, Foshan West Station and Tangxi Station are the main passenger stations, and Guangzhou North Railway Station, Xintang Station, and Nansha Station are auxiliary ones
⚫ 1-hour transport circle in the Pearl River Delta will be constructed:
Intercity railways: The main framework network with Guangzhou as the core will be established, including key projects, such as Guangzhou-Foshan Loop Line, Guangzhou-Foshan-Zhaoqing Intercity Railway and Zhaoqing-Shunde South Intercity Railway Urban railways: Guangzhou Metro Line 7 will be extended to Shunde Basic transport network: Focus will be made to promote
Guangzhou
Foshan
Zhaoqing
GBA Background Document
© Copyright 2022 Foundation, 2019. 137
the construction of common-speed rail lines, such as Liuzhou-Zhaoqing-Guangzhou Railway. Guangzhou International Comprehensive Transportation Hub will be constructed to improve the comprehensive service capability of Zhaoqing as a hub city ⚫ Guangdong-Hong Kong-Macao transportation
cooperation will be deepened ⚫ Guangdong-Hong Kong-Macao road transport
corridors will be optimized to ensure better connectivity between the section of Chinese mainland and Hong Kong of Guangzhou-Shenzhen-Hong Kong Express Rail Link, the Pearl River Delta Intercity Railway and Macao Light Rail
⚫ The comprehensive transport management mechanism will be optimized
April 2017
Overall Urban Plan of
Zhaoqing City (2015-
2030) (Exposure Draft)
⚫ The comprehensive transport network of Guangzhou-Foshan-Zhaoqing economic integration has not been established
⚫ Railway will serve as the pillar of the comprehensive transport service, ensuring that Zhaoqing will play a better role in facilitating the transportation of the southwest China
⚫ The construction of Zhanjiang-Zhaoqing-Guangzhou-Heyuan Passenger Railway, Shantou-Wuzhou Railway and Guangzhou-Maoming Railway will be pushed forward
Zhaoqing
On Land Planning
March
2013
June 2014
Implementation Plan
for Optimization of the
Public Supporting
Facilities of Jinshazhou
Area
2014-2016
Implementation Plan
for Optimization of the
Public Supporting
Facilities of Jinshazhou
Area
⚫ Press ahead with Guangzhou-Foshan urban integration
⚫ Ensure a better role of Guangzhou-Foshan in driving the development of surrounding areas, and work out a plan for the public parking area for Xunfeng Station of Metro Line 6 and the surrounding areas
⚫ Priority will be given to the construction of the internal transport network, municipal supporting facilities and external transport connections in Jinshazhou, and the overall renovation of Shabei Access of North Ring Expressway with Guangzhou-Foshan Expressway Co., Ltd. to realize smooth connection between North Ring Expressway and ground roads
Guangzhou
Foshan
July 2015
Overall Development
Plan of Zhaoqing New
Area in Guangdong
⚫ Modern logistics industry will be developed to form favorable interaction with Guangzhou Baiyun International Airport, and press ahead with the joint development of Guangzhou-Foshan-Zhaoqing logistics industry
⚫ The connectivity of comprehensive transport system with Guangzhou and Foshan and other cities in the Pearl River Delta will be reinforced
⚫ The integration of Guangzhou-Foshan-Zhaoqing Economic Circle will be accelerated: (1) Perfect connectivity of transport infrastructures; (2) Connection with Guangzhou-Foshan market system and service functions; (3) Integration of public services and community services; (4) Actively
Zhaoqing
GBA Background Document
© Copyright 2022 Foundation, 2019. 138
implementing Guangzhou-Foshan industries, and introducing funds and advanced technologies
January
2014
April 2015
Overall Development
Plan of Guangzhou-
Foshan-Zhaoqing
(Huaiji) Economic
Cooperation Zone
(2013-2030)
3-year Action Plan of
Guangzhou-Foshan-
Zhaoqing (Huaiji)
Economic Cooperation
Zone (2015-2017)
⚫ It’s upgraded to a provincial development strategy in January, 2014
⚫ As the principal participant of development and construction of the cooperation zone, Zhaoqing City shall strengthen the organization and leadership for implementation of overall planning of the cooperation zone
⚫ Guangzhou and Foshan shall clarify their respective responsibilities and obligations, and actively participate in development and construction of the cooperation zone
⚫ The related provincial departments shall strengthen the support and guidance for the cooperation zone by performing their functions, and develop a favorable policy environment
⚫ Important chances shall be seized to realize deep division of labor and cooperation, complementary strengths, mutual benefits and win-win results and coordinated development for industries in the Guangzhou-Foshan-Zhaoqing Economic Circle
⚫ Help Huaiji develop into the sub-center of Zhaoqing ⚫ Highlights of investment attraction: Advanced
equipment manufacturing, new materials and biotechnology
Zhaoqing
Guangzhou
Foshan
September
2015
May 2018
Overall Plan for Land
Utilization of
Guangdong Province
Dawang Overseas
Chinese Farm
Construction Land Scale
Replacement Program
(Supporting Projects of
Intercity Railway) of
Overall Plan for Land
Utilization of
Guangdong Province
Dawang Overseas
Chinese Farm (2010-
2020)
⚫ TOD comprehensive development project of Dawang Station of Foshan-Zhaoqing Intercity Railway
⚫ Additional scale for TOD comprehensive development project of Dawang Station of Foshan-Zhaoqing Intercity Railway
⚫ TOD comprehensive development project of Dawang Station is subject to the province-city cooperation mode
Foshan
Zhaoqing
June 2017
Implementation
Program of Overall
Development Plan of
Guangdong-Guangxi-
Guizhou High-speed
Railway Economic Belt
Cooperation Pilot Zone
(Guangdong Park)
(2015-2030)
⚫ The planning and construction of Guangdong Park will take Foshan West Station Hub New City as the core and Foshan National High-tech Industrial Development Zone as the carrier, aiming to promote collaboration of the three provinces of Guangdong, Guangxi and Guizhou
⚫ The feasibility study on the extension of Guangzhou-Foshan Metro to Zhaoqing New Area will be carried out
Guangzhou
Foshan
Zhaoqing
On Industry
May 2011
Industrial Collaboration
Plan of Guangzhou-
Foshan-Zhaoqing
⚫ The key targets include modern service industry, advanced manufacturing, strategic emerging industry and high-tech industry, traditional
Guangzhou
Foshan
Zhaoqing
GBA Background Document
© Copyright 2022 Foundation, 2019. 139
Economic Circle (2010-
2020)
competitive industry, urban modern agriculture, construction of collaboration zone and collaborative service system
⚫ Development objectives: Guangzhou-Foshan-Zhaoqing industry cooperation and development integration will be completed preliminarily by 2015; Guangzhou-Foshan-Zhaoqing industry integration will be fully achieved by 2020
The spatial layout of industrial collaboration development, i.e., “one center, two belts and five areas,” will be constructed
November
2016
Implementation Plan
for Construction of
Guangzhou
International
Automobile
Components Industry
Base
The areas under the influence of Zhaoqing will be gradually expanded. Based on Zhaoqing (Gaoyao) Automobile Components Industrial Park, the focus will be put on the development of the traditional automobile components so as to take on the projects related to supporting components for finished automobiles transferred from the Pearl River Delta.
Guangzhou
Zhaoqing
On Public Services
October
2009
Framework Agreement
on Guangzhou-Foshan-
Zhaoqing Cooperation
for Food and Drug
Safety Regulation
⚫ Perfect connection for food and drug safety regulation in the three cities will be achieved to get rid of uncovered areas of regulation, to ensure the food and drug safety and promote the coordinated and sustainable development of food and drug industries in the three cities
⚫ The three cities shall establish the food and drug safety monitoring collaboration and joint counterfeit combating mechanisms as well as the safety early warning system, build the joint work mechanism and mutual recognition of professionals of drugs, work together to build food and drug regulation data center, promote information sharing, storage and exchange, and strive to fully realize the integration of food and drug safety regulation in the three cities by 2020
Guangzhou
Foshan
Zhaoqing
August
2010
Cooperation Agreement
of Guangzhou-Foshan-
Zhaoqing Regional
Archive Catalogue
Centre
⚫ 30 million archive catalogue records are available to public in the archive centers of Guangzhou, Foshan and Zhaoqing
A large regional archive catalogue center that covers archive centers in nine cities of the Pearl River Delta region will be established by the end of 2011, to realize sharing of archive catalogue records in archive centers of the nine cities
Guangzhou
Foshan
Zhaoqing
2011
Cooperation Agreement
on Transfer of
Guangzhou-Foshan-
Zhaoqing
Unemployment
Insurance Relations
⚫ The three cities will realize smooth transfer of social security relations (endowment insurance and unemployment insurance) of the insured with mobile employment, that enables transfer applied directly with either the transferred-in city or the transferred-out city.
⚫ The three cities will establish a normalized social insurance risk prevention and control contact and communication platform to effectively prevent the occurrence of social insurance fraud and repeated claim for benefits
Guangzhou
Foshan
Zhaoqing
July 2014 Construction Plan of
Guangzhou-Foshan ⚫ Based on the detailed content of the Construction
Plan of Making Water Clearer in Guangzhou,
Guangzhou
Foshan
GBA Background Document
© Copyright 2022 Foundation, 2019. 140
Trans-boundary River
Restoration Projects
Guangzhou Water Resources Bureau works out the Plan to give priority to pressing ahead with the restoration of trans-boundary rivers in Guangzhou and Foshan
⚫ By implementing four-level “river chief accountability system,” Guangzhou and Foshan will work together to promote the restoration of 16 trans-boundary rivers, including Liuxi River, strive to basically eliminate rivers under Grade V in terms of pollution by 2016, and fully achieve the water quality standard set for water function areas by 2020.
August
2015
Action Plan for
Comprehensive
Restoration of Rivers in
Foshan City
⚫ Contact with Guangzhou will be further strengthened, and comprehensive restoration will be implemented for trans-boundary rivers in Guangzhou and Foshan
⚫ Joint law enforcement mechanism for trans-boundary environmental pollution between Foshan and Zhaoqing as well as Foshan and Qingyuan will be optimized
Foshan
June 2016
Opinions on
Implementing Xijiang
Talents Plan
⚫ The core task shall be attracting and cultivating highly educated, professionally competent, cutting-edge, and urgently needed talents
⚫ Four major talent programs will be implemented ⚫ A talent development platform will be constructed ⚫ Talent service guarantee will be strengthened
Zhaoqing
December
2016
Circular on Issues
Concerning Further
Promoting Reform of
Household Registration
System in Zhaoqing
⚫ Graduates of junior colleges and technical secondary schools (technical schools and vocational technical institutes) as well as technical personnel with preliminary or higher professional vocational certificates or professional titles above the preliminary level can directly apply for registration as local residents
⚫ Talents who meet the standards of Xijiang talents plan can apply for transitional household registration
Zhaoqing
September
2017
Cooperation
Framework Agreement
of Food and Drug Law
Enforcement, Case
Handling and
Emergency Disposal
Areas in Guangzhou,
Foshan, Dongguan and
Qingyuan
⚫ Investigation assistance and coordination will be strengthened in terms of law enforcement, case handling and emergency disposal of food (including health food), drugs, cosmetics and medical equipment in the four cities, and a city cluster will be built to ensure food and drug safety
⚫ In order to realize regional cooperation, investigation assistance, information sharing and joint crackdown, in-depth cooperation will be carried out in special rectification of drug and food, assistance in case investigation, joint dealing with major cases, response to emergencies and acceptance and sharing of complaints and reports
Guangzhou
Foshan
June 2018
Ten Action Plans for
Education-Driven
Development in
Zhaoqing
⚫ Proactively attract well-known colleges and universities to settle in Zhaoqing, such as affiliated schools of South China Normal University and Affiliated Middle School of Guangzhou University
⚫ Make great efforts to attract colleges and universities to run schools, ensuring that Huashang College of Guangdong University of Technology,
Guangzhou
Zhaoqing
GBA Background Document
© Copyright 2022 Foundation, 2019. 141
Zhujiang College of South China Agricultural University and Huali College Guangdong University of Technology will be put into operation in August, 2019
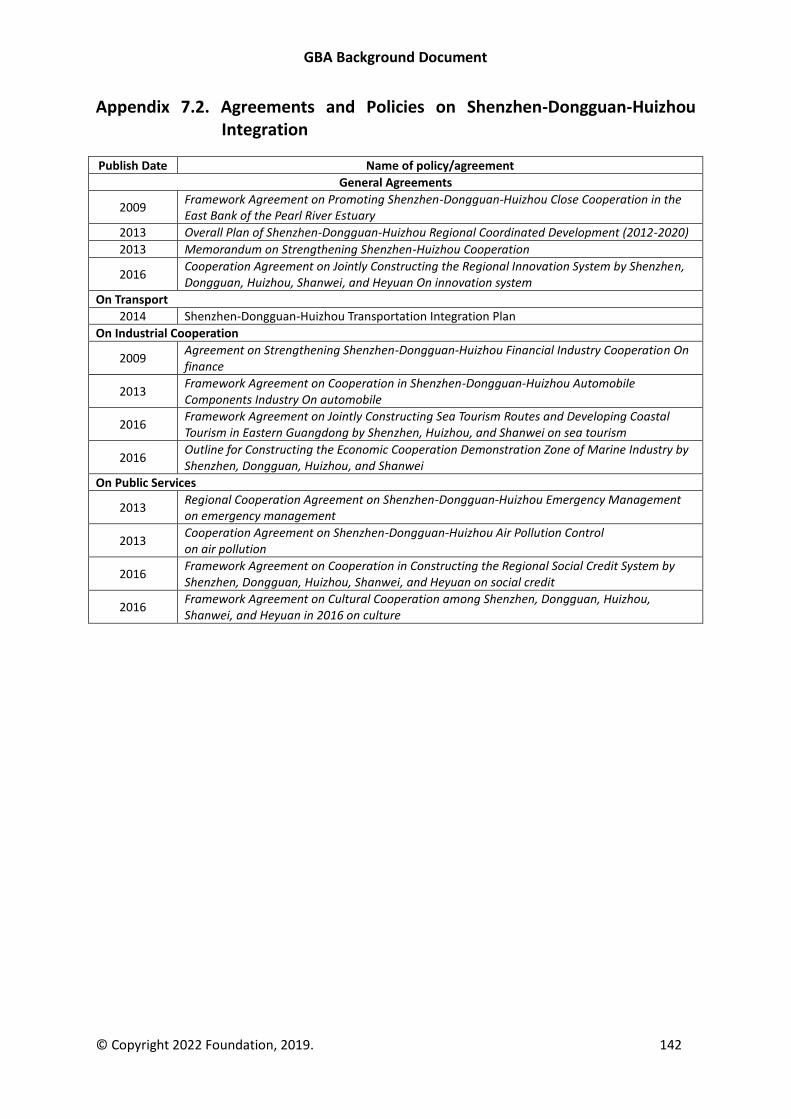
GBA Background Document
© Copyright 2022 Foundation, 2019. 142
Appendix 7.2. Agreements and Policies on Shenzhen-Dongguan-Huizhou Integration
Publish Date Name of policy/agreement
General Agreements
2009 Framework Agreement on Promoting Shenzhen-Dongguan-Huizhou Close Cooperation in the East Bank of the Pearl River Estuary
2013 Overall Plan of Shenzhen-Dongguan-Huizhou Regional Coordinated Development (2012-2020)
2013 Memorandum on Strengthening Shenzhen-Huizhou Cooperation
2016 Cooperation Agreement on Jointly Constructing the Regional Innovation System by Shenzhen, Dongguan, Huizhou, Shanwei, and Heyuan On innovation system
On Transport
2014 Shenzhen-Dongguan-Huizhou Transportation Integration Plan
On Industrial Cooperation
2009 Agreement on Strengthening Shenzhen-Dongguan-Huizhou Financial Industry Cooperation On finance
2013 Framework Agreement on Cooperation in Shenzhen-Dongguan-Huizhou Automobile Components Industry On automobile
2016 Framework Agreement on Jointly Constructing Sea Tourism Routes and Developing Coastal Tourism in Eastern Guangdong by Shenzhen, Huizhou, and Shanwei on sea tourism
2016 Outline for Constructing the Economic Cooperation Demonstration Zone of Marine Industry by Shenzhen, Dongguan, Huizhou, and Shanwei
On Public Services
2013 Regional Cooperation Agreement on Shenzhen-Dongguan-Huizhou Emergency Management on emergency management
2013 Cooperation Agreement on Shenzhen-Dongguan-Huizhou Air Pollution Control on air pollution
2016 Framework Agreement on Cooperation in Constructing the Regional Social Credit System by Shenzhen, Dongguan, Huizhou, Shanwei, and Heyuan on social credit
2016 Framework Agreement on Cultural Cooperation among Shenzhen, Dongguan, Huizhou, Shanwei, and Heyuan in 2016 on culture
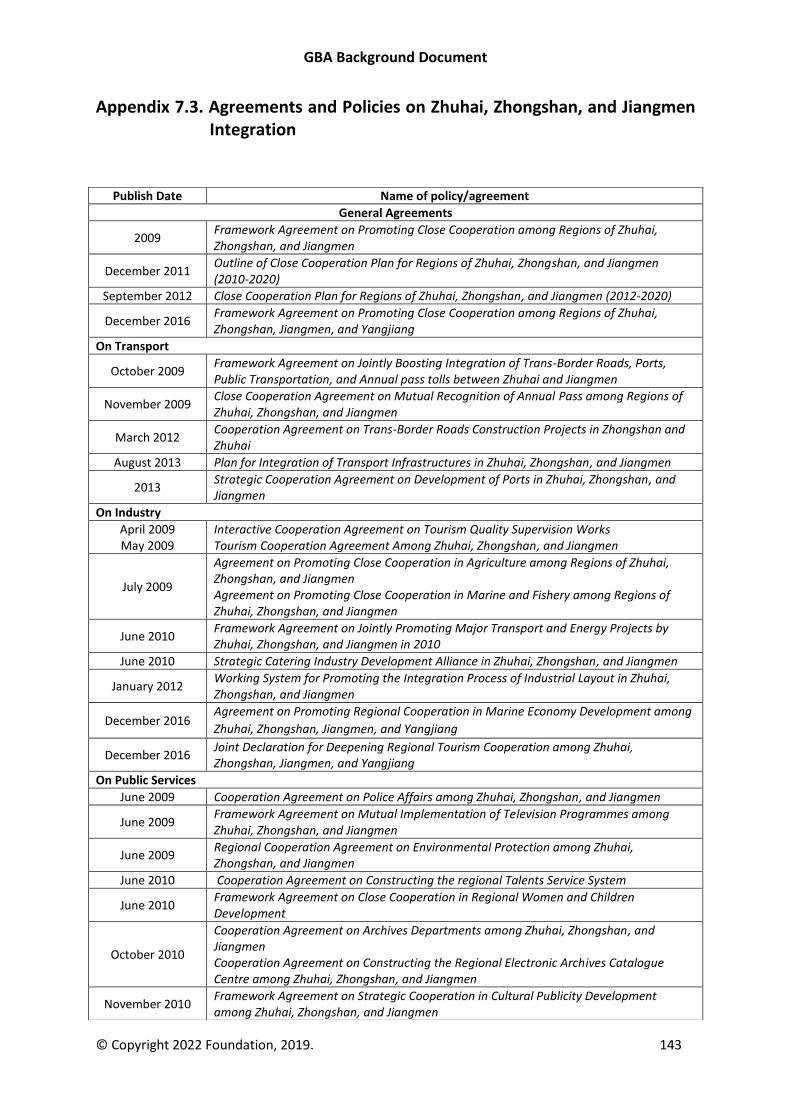
GBA Background Document
© Copyright 2022 Foundation, 2019. 143
Appendix 7.3. Agreements and Policies on Zhuhai, Zhongshan, and Jiangmen Integration
Publish Date Name of policy/agreement
General Agreements
2009 Framework Agreement on Promoting Close Cooperation among Regions of Zhuhai, Zhongshan, and Jiangmen
December 2011 Outline of Close Cooperation Plan for Regions of Zhuhai, Zhongshan, and Jiangmen (2010-2020)
September 2012 Close Cooperation Plan for Regions of Zhuhai, Zhongshan, and Jiangmen (2012-2020)
December 2016 Framework Agreement on Promoting Close Cooperation among Regions of Zhuhai, Zhongshan, Jiangmen, and Yangjiang
On Transport
October 2009 Framework Agreement on Jointly Boosting Integration of Trans-Border Roads, Ports, Public Transportation, and Annual pass tolls between Zhuhai and Jiangmen
November 2009 Close Cooperation Agreement on Mutual Recognition of Annual Pass among Regions of Zhuhai, Zhongshan, and Jiangmen
March 2012 Cooperation Agreement on Trans-Border Roads Construction Projects in Zhongshan and Zhuhai
August 2013 Plan for Integration of Transport Infrastructures in Zhuhai, Zhongshan, and Jiangmen
2013 Strategic Cooperation Agreement on Development of Ports in Zhuhai, Zhongshan, and Jiangmen
On Industry
April 2009 May 2009
Interactive Cooperation Agreement on Tourism Quality Supervision Works Tourism Cooperation Agreement Among Zhuhai, Zhongshan, and Jiangmen
July 2009
Agreement on Promoting Close Cooperation in Agriculture among Regions of Zhuhai, Zhongshan, and Jiangmen Agreement on Promoting Close Cooperation in Marine and Fishery among Regions of Zhuhai, Zhongshan, and Jiangmen
June 2010 Framework Agreement on Jointly Promoting Major Transport and Energy Projects by Zhuhai, Zhongshan, and Jiangmen in 2010
June 2010 Strategic Catering Industry Development Alliance in Zhuhai, Zhongshan, and Jiangmen
January 2012 Working System for Promoting the Integration Process of Industrial Layout in Zhuhai, Zhongshan, and Jiangmen
December 2016 Agreement on Promoting Regional Cooperation in Marine Economy Development among
Zhuhai, Zhongshan, Jiangmen, and Yangjiang
December 2016 Joint Declaration for Deepening Regional Tourism Cooperation among Zhuhai, Zhongshan, Jiangmen, and Yangjiang
On Public Services
June 2009 Cooperation Agreement on Police Affairs among Zhuhai, Zhongshan, and Jiangmen
June 2009 Framework Agreement on Mutual Implementation of Television Programmes among Zhuhai, Zhongshan, and Jiangmen
June 2009 Regional Cooperation Agreement on Environmental Protection among Zhuhai, Zhongshan, and Jiangmen
June 2010 Cooperation Agreement on Constructing the regional Talents Service System
June 2010 Framework Agreement on Close Cooperation in Regional Women and Children Development
October 2010
Cooperation Agreement on Archives Departments among Zhuhai, Zhongshan, and Jiangmen Cooperation Agreement on Constructing the Regional Electronic Archives Catalogue Centre among Zhuhai, Zhongshan, and Jiangmen
November 2010 Framework Agreement on Strategic Cooperation in Cultural Publicity Development among Zhuhai, Zhongshan, and Jiangmen
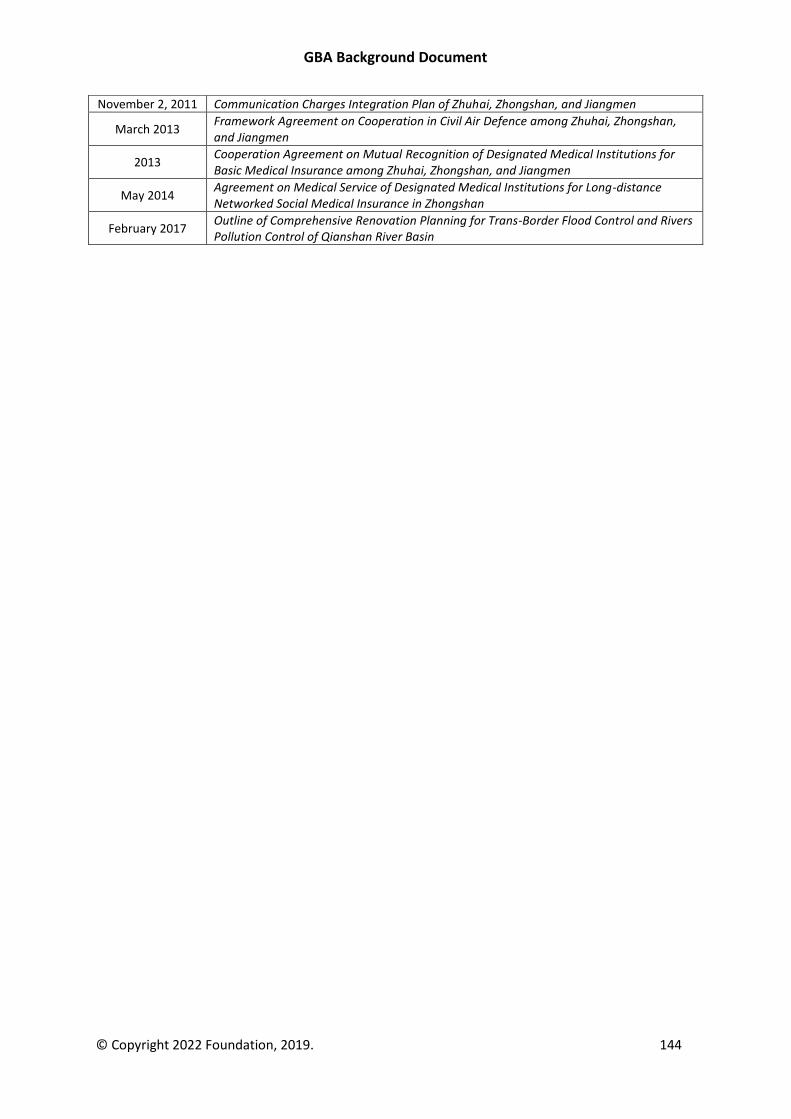
GBA Background Document
© Copyright 2022 Foundation, 2019. 144
November 2, 2011 Communication Charges Integration Plan of Zhuhai, Zhongshan, and Jiangmen
March 2013 Framework Agreement on Cooperation in Civil Air Defence among Zhuhai, Zhongshan, and Jiangmen
2013 Cooperation Agreement on Mutual Recognition of Designated Medical Institutions for Basic Medical Insurance among Zhuhai, Zhongshan, and Jiangmen
May 2014 Agreement on Medical Service of Designated Medical Institutions for Long-distance Networked Social Medical Insurance in Zhongshan
February 2017 Outline of Comprehensive Renovation Planning for Trans-Border Flood Control and Rivers Pollution Control of Qianshan River Basin
GBA Background Document
© Copyright 2022 Foundation, 2019. 145
8. The Jurisdictions of the GBA
The following are brief profiles of the individual jurisdictions of the Greater Bay Area.
Guangzhou
Guangzhou, the capital of Guangdong Province, is the province’s political, administrative, cultural,
and commercial center. Guangzhou had the third largest economy among cities in the Chinese
Mainland after Shanghai and Beijing, until overtaken by Shenzhen in 2017. In 2016, Guangzhou led
the cities of the GBA in population, and was second only to Hong Kong in terms of GDP, tertiary
sector GDP, and retail sales. Guangzhou is the leading transportation, logistics, distribution, and
service center in Guangdong Province. It is also emerging as a location for heavy industries such as
automobiles, steel, and petrochemicals.
Guangzhou’s leading industries by industrial value added of enterprises above designated size
(annual revenue over RMB 20 million) in 2016 were machinery and equipment, chemicals, and
electric and electronic equipment, respectively accounting respectively for 31 percent, 14.3 percent,
and 13.5 percent of the relevant total value added. In the machinery and equipment category,
transport equipment (mostly automotive) accounted for 77 percent of the value added.
Guangzhou is also a leading hub for services in the Pearl River Delta region. In terms of output,
Guangzhou’s foremost service sectors are wholesale and retail; financial and intermediation; real
estate; and transport, storage, and post. As the home of the world-renowned Canton Fair, it is also a
leading trade and distribution center in the Chinese Mainland. Guangzhou’s Pazhou International
Convention and Exhibition Centre, with more than 340,000 square meters of exhibition space, is the
second largest in China and Asia and the fifth in the world. Guangzhou’s strength in retail sales
exceeds that of any other Chinese Mainland city in South China by a wide margin and drives demand
for related services.
Development Plans
Guangzhou’s goal is to be international shipping and air transport center, an international logistics
center, an international trade center, and a modern financial service center by 2020. In its 13th Five-
Year Program Period, Guangzhou targeted an annual average GDP growth rate of over 7.5 percent.
In 2020, Guangzhou plans to have a GDP of RMB 2.8 trillion, a per capita GDP of RMB 180,000,
services account for 70 percent of GDP, high-tech industries account for 49 percent of the gross
industrial output (GIO) of industrial enterprises above designated size, R&D investment equal for 3
percent of GDP, and the financial sector account for 12 percent of GDP.
Guangzhou plans to build an economy driven by both modern services and advanced manufacturing.
It is focusing its development efforts on seven producer services industries (Finance, Logistics,
Information services, E-commerce, Science and technology services, Convention and Exhibition, and
Business services) and a series of consumer service industries (Cultural industries, Tourism, Sports,
Healthcare, Family services, Old-age care, Education, Real estate, and Food and beverage).
Guangzhou’s pillar industrial sectors are Automobile, Electronic and information, Petrochemical
industry, and advanced equipment. It will continue to cultivate strategic and emerging industries,
GBA Background Document
© Copyright 2022 Foundation, 2019. 146
focusing on New-generation information technology; Biochemical and health; New materials and
high-end equipment manufacturing; New-energy automobile, new energies, and energy saving and
environment protection; and Animation, gaming, and creative industries.
Plan for Cooperation with Hong Kong and Macao
In its 13th Five-year Program, Guangzhou sets the Nansha New District and Nansha Pilot Free Trade
Zone as key places to implement pilot programs in relation to CEPA. Areas of cooperation include
finance, professional services, trade fairs and exhibitions, and modern logistics services. Guangzhou
also plans to leverage the Tianhe Central Business District and Haizhu Pazhou Convention and
Exhibition Centre as the first provincial demonstration bases for service trade liberalization between
Guangdong, Hong Kong, and Macao and to promote the development of three municipal
demonstration bases, the Guangzhou Bonded Zone in Huangpu, the Baiyun Airport Comprehensive
Bonded Zone, and the Panyu Lianhuashan Service Trade Comprehensive Industrial Zone.
Guangzhou is also planning to cooperate with Hong Kong and Macao in urban planning and
management and in carrying out marine environment improvement projects in the Pearl River
Estuary. It will promote the construction of the Demonstration Zone for Talent Cooperation between
Guangdong, Hong Kong, and Macao; and improve the innovation services in the Guangdong, Hong
Kong, and Macao (International) Youth Innovation Workshop and the Guangzhou Nansha
(International) Entrepreneurial Base to attract people from Hong Kong and Macao to invest and live
in Guangzhou. It also plans to work with Macao to build a national economic park for Portuguese /
Spanish-speaking people; establish a comprehensive display and sales platform for commodities
from Portuguese / Spanish speaking countries; and jointly develop trade services, product display,
and import and export trade.
Positioning
Guangzhou is positioning itself as an international commerce and trade center, a world-famous
cultural city, a national innovation city, a comprehensive gateway city, and a regional education
center. It wants to be the “Best District” among the urban and rural areas of Guangdong and an
international metropolis that embraces the world and serves the whole country. Guangzhou is to
take a leading role in innovation policy exploration in the PRD, innovation resource sharing, and
talent training and attraction, relying on its abundance of talent resources in science, technology,
and education. Guangzhou seeks to build an open and free innovation ecosystem, enhance its ability
to serve the innovation-driven development of the whole province, and build an international
technological innovation hub and a national innovation center with international influence.
Guangzhou aims to be the core growth pole and the international transport, aviation, and scientific
technology innovation hub for the GBA. It plans to focus on constructing a high-end, high-quality,
and high-tech modern industrial system; to build new reform institutions; and to strengthen its hub
functions in international shipping, air transport, and technology innovation.
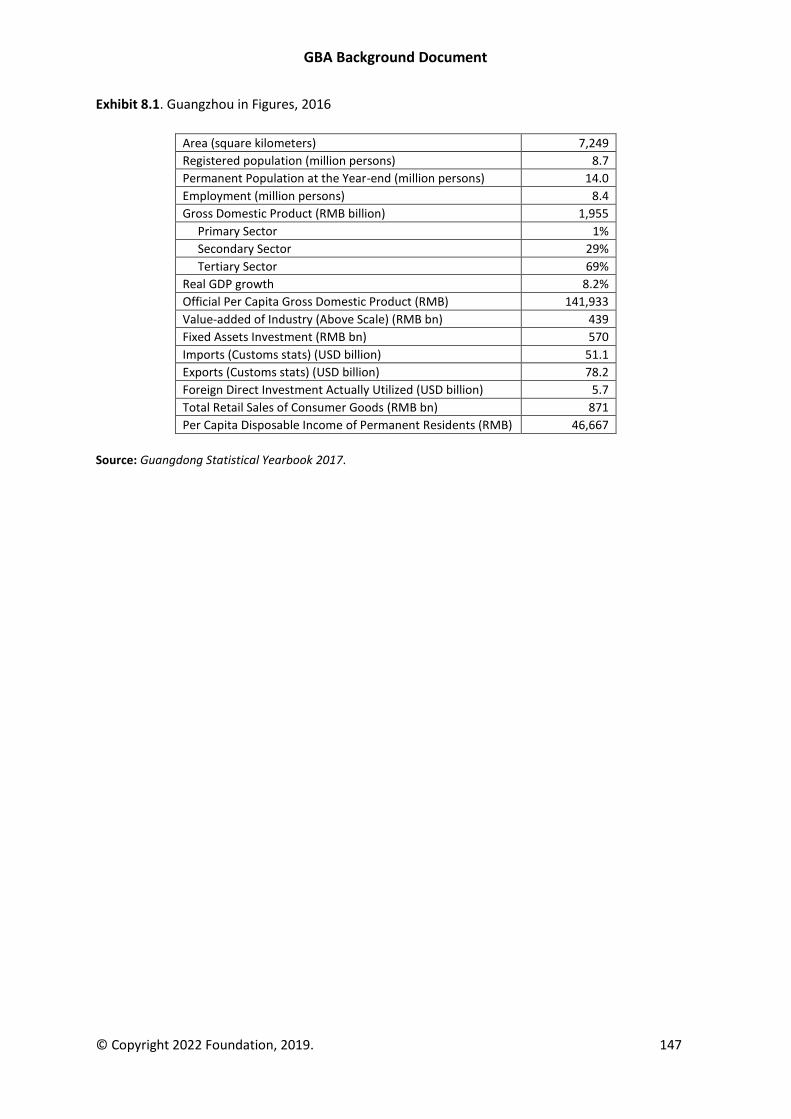
GBA Background Document
© Copyright 2022 Foundation, 2019. 147
Exhibit 8.1. Guangzhou in Figures, 2016
Area (square kilometers) 7,249
Registered population (million persons) 8.7
Permanent Population at the Year-end (million persons) 14.0
Employment (million persons) 8.4
Gross Domestic Product (RMB billion) 1,955
Primary Sector 1%
Secondary Sector 29%
Tertiary Sector 69%
Real GDP growth 8.2%
Official Per Capita Gross Domestic Product (RMB) 141,933
Value-added of Industry (Above Scale) (RMB bn) 439
Fixed Assets Investment (RMB bn) 570
Imports (Customs stats) (USD billion) 51.1
Exports (Customs stats) (USD billion) 78.2
Foreign Direct Investment Actually Utilized (USD billion) 5.7
Total Retail Sales of Consumer Goods (RMB bn) 871
Per Capita Disposable Income of Permanent Residents (RMB) 46,667
Source: Guangdong Statistical Yearbook 2017.
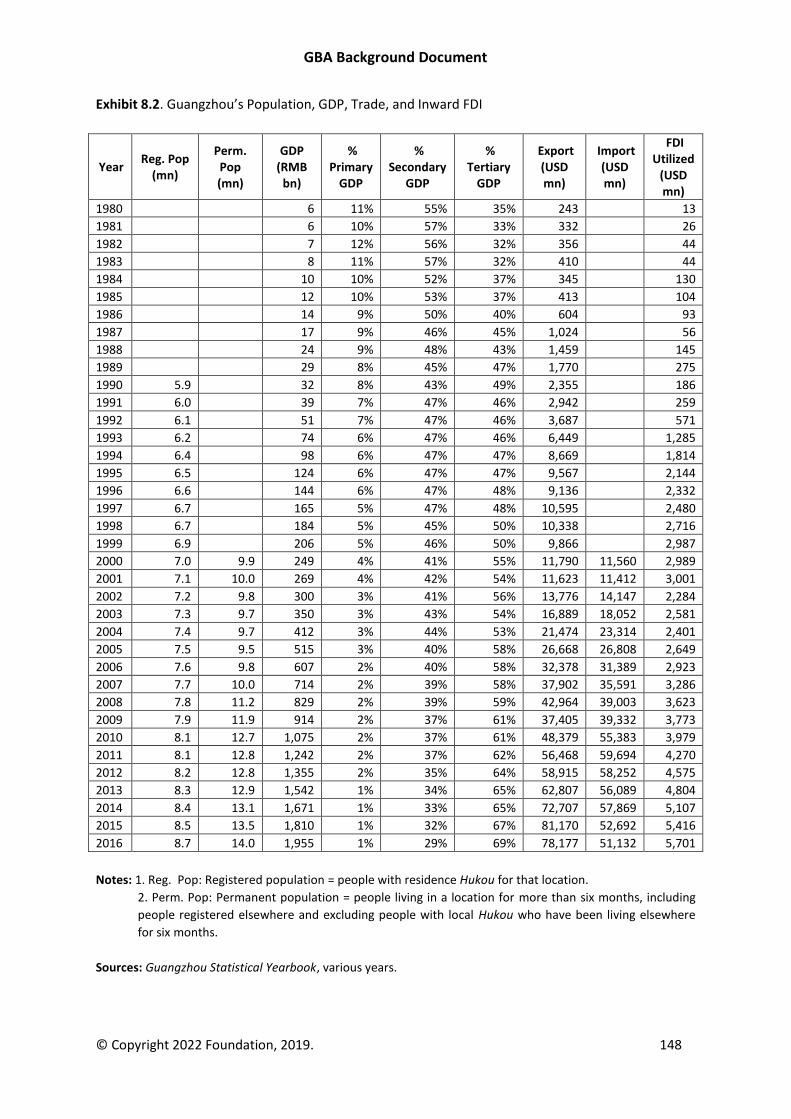
GBA Background Document
© Copyright 2022 Foundation, 2019. 148
Exhibit 8.2. Guangzhou’s Population, GDP, Trade, and Inward FDI
Year Reg. Pop
(mn)
Perm. Pop (mn)
GDP (RMB
bn)
% Primary
GDP
% Secondary
GDP
% Tertiary
GDP
Export (USD mn)
Import (USD mn)
FDI Utilized
(USD mn)
1980 6 11% 55% 35% 243 13
1981 6 10% 57% 33% 332 26
1982 7 12% 56% 32% 356 44
1983 8 11% 57% 32% 410 44
1984 10 10% 52% 37% 345 130
1985 12 10% 53% 37% 413 104
1986 14 9% 50% 40% 604 93
1987 17 9% 46% 45% 1,024 56
1988 24 9% 48% 43% 1,459 145
1989 29 8% 45% 47% 1,770 275
1990 5.9 32 8% 43% 49% 2,355 186
1991 6.0 39 7% 47% 46% 2,942 259
1992 6.1 51 7% 47% 46% 3,687 571
1993 6.2 74 6% 47% 46% 6,449 1,285
1994 6.4 98 6% 47% 47% 8,669 1,814
1995 6.5 124 6% 47% 47% 9,567 2,144
1996 6.6 144 6% 47% 48% 9,136 2,332
1997 6.7 165 5% 47% 48% 10,595 2,480
1998 6.7 184 5% 45% 50% 10,338 2,716
1999 6.9 206 5% 46% 50% 9,866 2,987
2000 7.0 9.9 249 4% 41% 55% 11,790 11,560 2,989
2001 7.1 10.0 269 4% 42% 54% 11,623 11,412 3,001
2002 7.2 9.8 300 3% 41% 56% 13,776 14,147 2,284
2003 7.3 9.7 350 3% 43% 54% 16,889 18,052 2,581
2004 7.4 9.7 412 3% 44% 53% 21,474 23,314 2,401
2005 7.5 9.5 515 3% 40% 58% 26,668 26,808 2,649
2006 7.6 9.8 607 2% 40% 58% 32,378 31,389 2,923
2007 7.7 10.0 714 2% 39% 58% 37,902 35,591 3,286
2008 7.8 11.2 829 2% 39% 59% 42,964 39,003 3,623
2009 7.9 11.9 914 2% 37% 61% 37,405 39,332 3,773
2010 8.1 12.7 1,075 2% 37% 61% 48,379 55,383 3,979
2011 8.1 12.8 1,242 2% 37% 62% 56,468 59,694 4,270
2012 8.2 12.8 1,355 2% 35% 64% 58,915 58,252 4,575
2013 8.3 12.9 1,542 1% 34% 65% 62,807 56,089 4,804
2014 8.4 13.1 1,671 1% 33% 65% 72,707 57,869 5,107
2015 8.5 13.5 1,810 1% 32% 67% 81,170 52,692 5,416
2016 8.7 14.0 1,955 1% 29% 69% 78,177 51,132 5,701
Notes: 1. Reg. Pop: Registered population = people with residence Hukou for that location.
2. Perm. Pop: Permanent population = people living in a location for more than six months, including
people registered elsewhere and excluding people with local Hukou who have been living elsewhere
for six months.
Sources: Guangzhou Statistical Yearbook, various years.
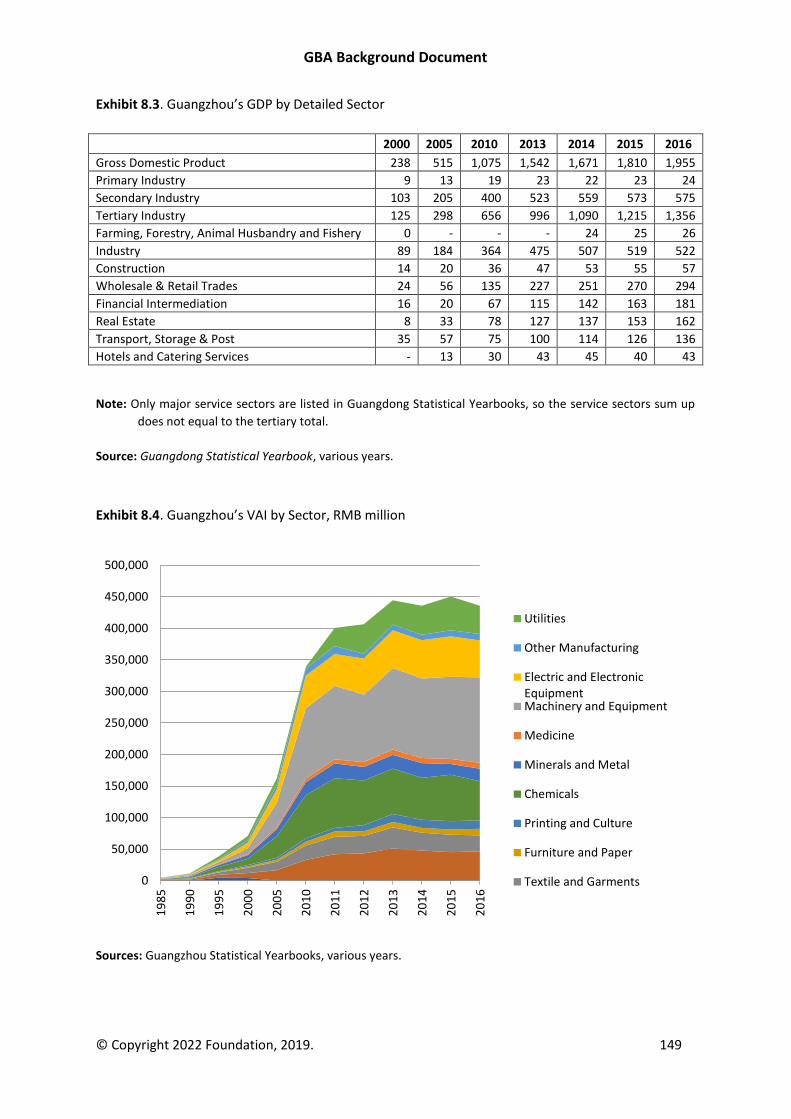
GBA Background Document
© Copyright 2022 Foundation, 2019. 149
Exhibit 8.3. Guangzhou’s GDP by Detailed Sector
2000 2005 2010 2013 2014 2015 2016
Gross Domestic Product 238 515 1,075 1,542 1,671 1,810 1,955
Primary Industry 9 13 19 23 22 23 24
Secondary Industry 103 205 400 523 559 573 575
Tertiary Industry 125 298 656 996 1,090 1,215 1,356
Farming, Forestry, Animal Husbandry and Fishery 0 - - - 24 25 26
Industry 89 184 364 475 507 519 522
Construction 14 20 36 47 53 55 57
Wholesale & Retail Trades 24 56 135 227 251 270 294
Financial Intermediation 16 20 67 115 142 163 181
Real Estate 8 33 78 127 137 153 162
Transport, Storage & Post 35 57 75 100 114 126 136
Hotels and Catering Services - 13 30 43 45 40 43
Note: Only major service sectors are listed in Guangdong Statistical Yearbooks, so the service sectors sum up
does not equal to the tertiary total.
Source: Guangdong Statistical Yearbook, various years.
Exhibit 8.4. Guangzhou’s VAI by Sector, RMB million
Sources: Guangzhou Statistical Yearbooks, various years.
0
50,000
100,000
150,000
200,000
250,000
300,000
350,000
400,000
450,000
500,000
19
85
19
90
19
95
20
00
20
05
20
10
20
11
20
12
20
13
20
14
20
15
20
16
Utilities
Other Manufacturing
Electric and ElectronicEquipmentMachinery and Equipment
Medicine
Minerals and Metal
Chemicals
Printing and Culture
Furniture and Paper
Textile and Garments
GBA Background Document
© Copyright 2022 Foundation, 2019. 150
Shenzhen
Shenzhen, situated just north of Hong Kong, ranks first in exports among all cities in the Chinese
Mainland and third in GDP as of 2017. In the GBA, Shenzhen ranks second in GDP and inward FDI (to
Hong Kong), third in tertiary sector GDP and retail sales (to Hong Kong and Guangzhou). Shenzhen
has the highest industrial value added and domestic exports among the cities of the GBA.
Shenzhen has used its status as one of the first Special Economic Zones to develop a dynamic and
vibrant economy that attracts workers, scientists, and engineers from throughout China. Its
residents have the highest average educational achievement in the Chinese Mainland, and are highly
concentrated in the wage-earning age bracket. Shenzhen’s long-term residents are among the most
affluent consumers in the Chinese Mainland.
Shenzhen is a leading city in the Chinese Mainland for high-tech industries and new business
ventures. It is also China’s leading innovation center, with the highest R&D to GDP ratio among cities
in the PRD (4.3 percent). The Electric and electronic equipment sector leads the local manufacturing
economy and accounted for 68 percent of the value added of Shenzhen’s industrial enterprises with
designated size in 2016. In the electric and electronic equipment industry, 87 percent of its value
added in 2016 were from communication equipment, computers, and other electronic equipment.
Huawei, Tencent, BYD, and DJI developed in Shenzhen are already world-famous firms.
Shenzhen’s leading service sectors are financial intermediation, wholesale and retail trade, and real
estate. Shenzhen is home to a number of international trade fairs and exhibitions covering a wide
range of industries from nuclear power to food. Shenzhen’s China High-tech Fair, the largest of its
kind in China, attracts participants from around the globe. Shenzhen is also home to the second-
largest stock exchange in the Chinese Mainland after Shanghai, and has been a leader in the opening
of China’s finance sectors. Shenzhen’s port and logistics industries are emerging as leaders within
China driven by the massive cargo flows generated by Shenzhen and neighboring cities. Shenzhen is
already the world’s third leading container port city and 19th in the world in sea cargo tonnage.
Development Plans
Shenzhen’s goals include for its GDP to reach RMB 2.6 trillion, per capita GDP RMB 176,000, service
sector value added to account for 61 percent of GDP, for emerging industry value added to account
for 42 percent of GDP, R&D investment to account for 4.25 percent of GDP, service trade to account
for 25 percent of import and export value, and to have 8 to 10 firms in the Global 500 by 2020. To
build a leading innovation city, Shenzhen has pledged to support innovation in firms, strictly protect
intellectual property rights, build an innovation support policy system beneficial to all, and build an
environment that is attractive to talent from all over the world. Shenzhen has set the target to have
over 10,000 national high- and new-tech firms in 2020 and have organized 1,000 national, provincial,
and municipal core projects that make scientific and technology breakthroughs.
To build a national economic central city, Shenzhen plans to expand its emerging and strategic
industries, in Integrated circuits, New displays, Genetic technologies, High-end medical imaging,
New energy vehicles, High-end materials, Digital contents, Energy saving and environmental
protection equipment, instrument, and technologies; increase the support for “Future” industries,
GBA Background Document
© Copyright 2022 Foundation, 2019. 151
including Life and health, Aerospace, Robotics, Wearable devices, and Smart equipment. The key
service industries Shenzhen focuses on include Science and technology services; Professional
services; Commerce, trade, convention, exhibition, and tourism services. It also plans to use
advanced manufacturing technology and information technology to upgrade its traditional industries.
Shenzhen also strives to be an international financial innovation center and an international logistic
hub. It plans for value added in financial services to account for 15 percent of GDP and logistics value
added for 10.5 percent of GDP in 2020.
Plan for Cooperation with Hong Kong and Macao
In its 13th Five-year Program, Shenzhen is planning to be a world-famous city of the GBA. It plans to
focus on developing high value services and high-tech research and development and accelerating
the development of a Bay Area economy that is well developed, highly functional, open and
interactive, and agglomerative. Shenzhen plans to promote the overall connectivity and the flow of
productive factors in the Greater Bay Area, foster development and innovation, promote growth and
the integration of the interests of GBA jurisdictions, and help form a world-class economic region
with the greatest potential for growth.
Shenzhen plans to use the Qianhai Shenzhen-Hong Kong Modern Service Industry Cooperation Zone
and the Qianhai and Shekou Free Trade Area to strengthen exchanges and cooperation with Hong
Kong in finance, professional services, science, technology, culture, health care, education,
environmental protection, and the rule of law. It will accelerate the development of the Shenzhen-
Hong Kong boundary area; deepen cooperation between Shenzhen and Hong Kong in boundary
crossing points, seaports, and airports; carry out preliminary research on the Hong Kong-Shenzhen
Western Express Line; and jointly advance the development of Lok Ma Chau Loop Area. It will
accelerate the integration of port resources, complete the overall transformation of Huanggang Port
and Shatoujiao Port, improve the supporting facilities of Shenzhen Bay Port, advance the restoration
of Meisha Port, and build Liantang / Xiangyuanwei Port and other infrastructure.
Shenzhen plans to deepen cooperation with Macao to expand connections with Portuguese-
speaking countries. It will promote the construction of the quality living area in Guangdong, Hong
Kong, and Macao and work to improve fast direct routes between Shenzhen and Zhongshan, Zhuhai,
Hong Kong, and Macao to realize one-hour access to the cities in GBA.
Positioning
Shenzhen is positioning itself to be a national economic center and a national innovation city. It will
continue as a leader for experimentation and new developments in special economic zones, national
comprehensive reform, promotion of development through innovation, new institutions and
systems, technology, industry, and social and cultural areas. It is a major national base for strategic
and emerging industries. It is cooperating with Hong Kong to build the Shenzhen-Hong Kong
innovation circle. Shenzhen aims to be an example and model within China as it becomes a modern
international city.
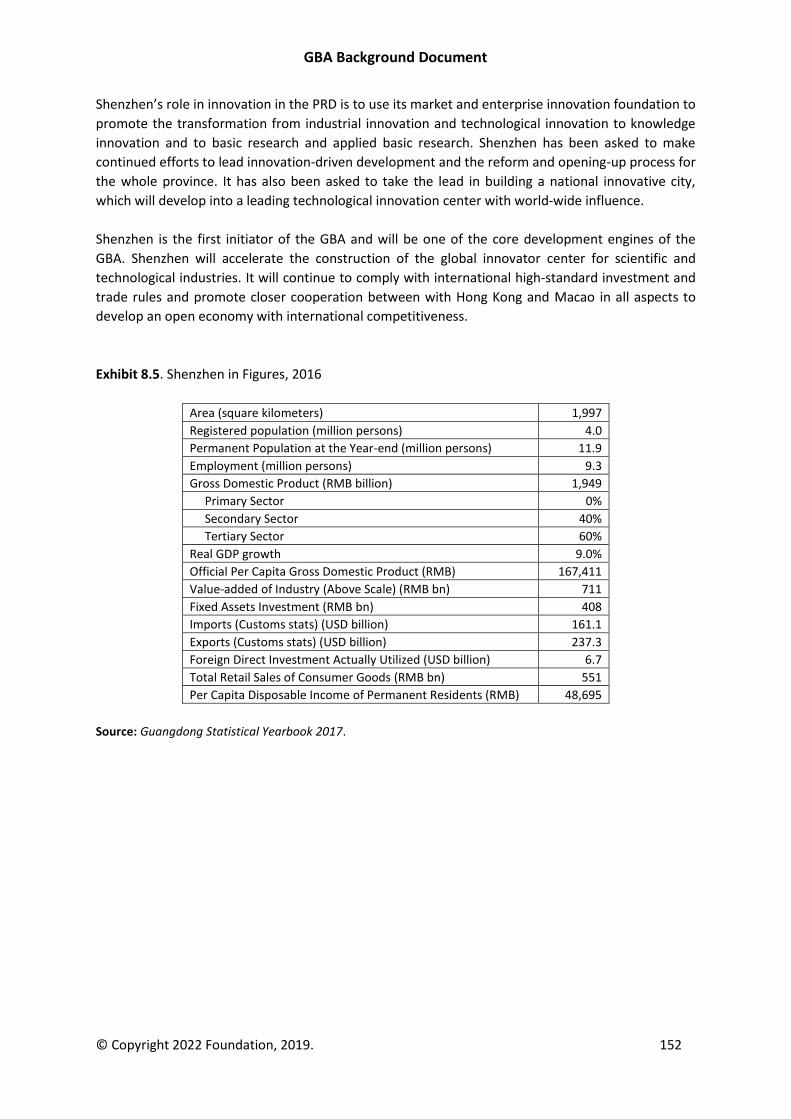
GBA Background Document
© Copyright 2022 Foundation, 2019. 152
Shenzhen’s role in innovation in the PRD is to use its market and enterprise innovation foundation to
promote the transformation from industrial innovation and technological innovation to knowledge
innovation and to basic research and applied basic research. Shenzhen has been asked to make
continued efforts to lead innovation-driven development and the reform and opening-up process for
the whole province. It has also been asked to take the lead in building a national innovative city,
which will develop into a leading technological innovation center with world-wide influence.
Shenzhen is the first initiator of the GBA and will be one of the core development engines of the
GBA. Shenzhen will accelerate the construction of the global innovator center for scientific and
technological industries. It will continue to comply with international high-standard investment and
trade rules and promote closer cooperation between with Hong Kong and Macao in all aspects to
develop an open economy with international competitiveness.
Exhibit 8.5. Shenzhen in Figures, 2016
Area (square kilometers) 1,997
Registered population (million persons) 4.0
Permanent Population at the Year-end (million persons) 11.9
Employment (million persons) 9.3
Gross Domestic Product (RMB billion) 1,949
Primary Sector 0%
Secondary Sector 40%
Tertiary Sector 60%
Real GDP growth 9.0%
Official Per Capita Gross Domestic Product (RMB) 167,411
Value-added of Industry (Above Scale) (RMB bn) 711
Fixed Assets Investment (RMB bn) 408
Imports (Customs stats) (USD billion) 161.1
Exports (Customs stats) (USD billion) 237.3
Foreign Direct Investment Actually Utilized (USD billion) 6.7
Total Retail Sales of Consumer Goods (RMB bn) 551
Per Capita Disposable Income of Permanent Residents (RMB) 48,695
Source: Guangdong Statistical Yearbook 2017.
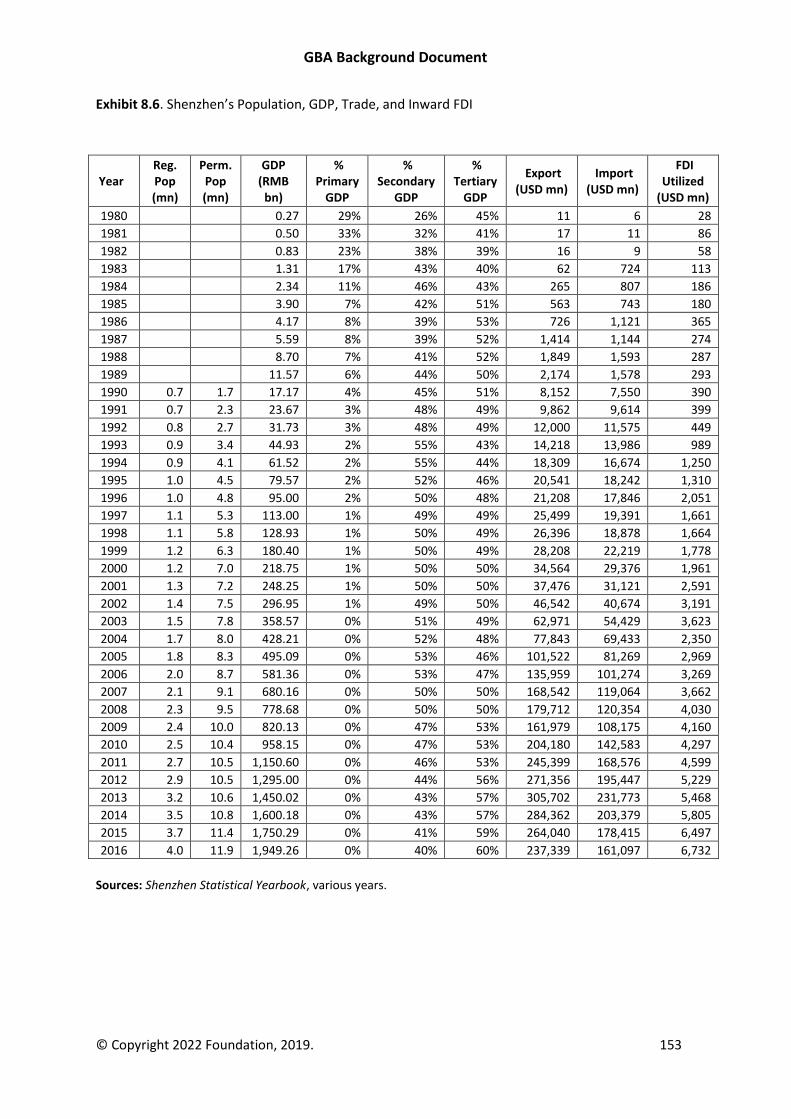
GBA Background Document
© Copyright 2022 Foundation, 2019. 153
Exhibit 8.6. Shenzhen’s Population, GDP, Trade, and Inward FDI
Year Reg. Pop (mn)
Perm. Pop (mn)
GDP (RMB
bn)
% Primary
GDP
% Secondary
GDP
% Tertiary
GDP
Export (USD mn)
Import (USD mn)
FDI Utilized
(USD mn)
1980 0.27 29% 26% 45% 11 6 28
1981 0.50 33% 32% 41% 17 11 86
1982 0.83 23% 38% 39% 16 9 58
1983 1.31 17% 43% 40% 62 724 113
1984 2.34 11% 46% 43% 265 807 186
1985 3.90 7% 42% 51% 563 743 180
1986 4.17 8% 39% 53% 726 1,121 365
1987 5.59 8% 39% 52% 1,414 1,144 274
1988 8.70 7% 41% 52% 1,849 1,593 287
1989 11.57 6% 44% 50% 2,174 1,578 293
1990 0.7 1.7 17.17 4% 45% 51% 8,152 7,550 390
1991 0.7 2.3 23.67 3% 48% 49% 9,862 9,614 399
1992 0.8 2.7 31.73 3% 48% 49% 12,000 11,575 449
1993 0.9 3.4 44.93 2% 55% 43% 14,218 13,986 989
1994 0.9 4.1 61.52 2% 55% 44% 18,309 16,674 1,250
1995 1.0 4.5 79.57 2% 52% 46% 20,541 18,242 1,310
1996 1.0 4.8 95.00 2% 50% 48% 21,208 17,846 2,051
1997 1.1 5.3 113.00 1% 49% 49% 25,499 19,391 1,661
1998 1.1 5.8 128.93 1% 50% 49% 26,396 18,878 1,664
1999 1.2 6.3 180.40 1% 50% 49% 28,208 22,219 1,778
2000 1.2 7.0 218.75 1% 50% 50% 34,564 29,376 1,961
2001 1.3 7.2 248.25 1% 50% 50% 37,476 31,121 2,591
2002 1.4 7.5 296.95 1% 49% 50% 46,542 40,674 3,191
2003 1.5 7.8 358.57 0% 51% 49% 62,971 54,429 3,623
2004 1.7 8.0 428.21 0% 52% 48% 77,843 69,433 2,350
2005 1.8 8.3 495.09 0% 53% 46% 101,522 81,269 2,969
2006 2.0 8.7 581.36 0% 53% 47% 135,959 101,274 3,269
2007 2.1 9.1 680.16 0% 50% 50% 168,542 119,064 3,662
2008 2.3 9.5 778.68 0% 50% 50% 179,712 120,354 4,030
2009 2.4 10.0 820.13 0% 47% 53% 161,979 108,175 4,160
2010 2.5 10.4 958.15 0% 47% 53% 204,180 142,583 4,297
2011 2.7 10.5 1,150.60 0% 46% 53% 245,399 168,576 4,599
2012 2.9 10.5 1,295.00 0% 44% 56% 271,356 195,447 5,229
2013 3.2 10.6 1,450.02 0% 43% 57% 305,702 231,773 5,468
2014 3.5 10.8 1,600.18 0% 43% 57% 284,362 203,379 5,805
2015 3.7 11.4 1,750.29 0% 41% 59% 264,040 178,415 6,497
2016 4.0 11.9 1,949.26 0% 40% 60% 237,339 161,097 6,732
Sources: Shenzhen Statistical Yearbook, various years.
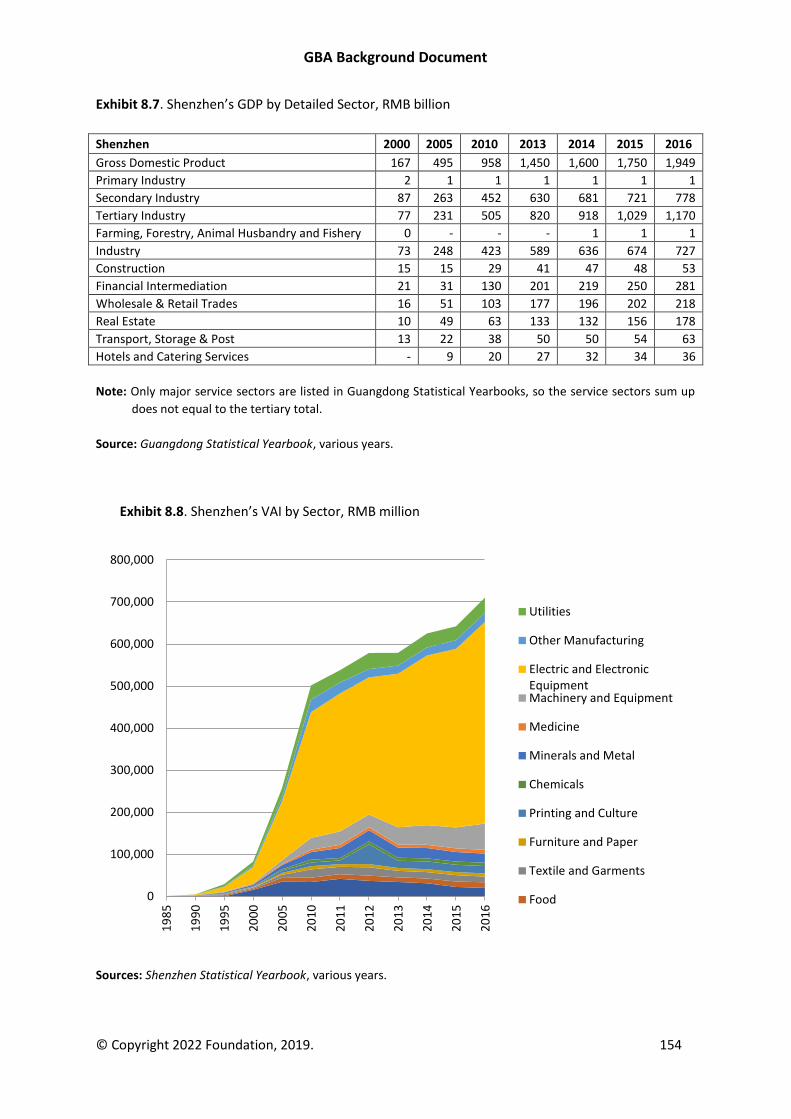
GBA Background Document
© Copyright 2022 Foundation, 2019. 154
Exhibit 8.7. Shenzhen’s GDP by Detailed Sector, RMB billion
Shenzhen 2000 2005 2010 2013 2014 2015 2016
Gross Domestic Product 167 495 958 1,450 1,600 1,750 1,949
Primary Industry 2 1 1 1 1 1 1
Secondary Industry 87 263 452 630 681 721 778
Tertiary Industry 77 231 505 820 918 1,029 1,170
Farming, Forestry, Animal Husbandry and Fishery 0 - - - 1 1 1
Industry 73 248 423 589 636 674 727
Construction 15 15 29 41 47 48 53
Financial Intermediation 21 31 130 201 219 250 281
Wholesale & Retail Trades 16 51 103 177 196 202 218
Real Estate 10 49 63 133 132 156 178
Transport, Storage & Post 13 22 38 50 50 54 63
Hotels and Catering Services - 9 20 27 32 34 36
Note: Only major service sectors are listed in Guangdong Statistical Yearbooks, so the service sectors sum up
does not equal to the tertiary total.
Source: Guangdong Statistical Yearbook, various years.
Exhibit 8.8. Shenzhen’s VAI by Sector, RMB million
Sources: Shenzhen Statistical Yearbook, various years.
0
100,000
200,000
300,000
400,000
500,000
600,000
700,000
800,000
19
85
19
90
19
95
20
00
20
05
20
10
20
11
20
12
20
13
20
14
20
15
20
16
Utilities
Other Manufacturing
Electric and ElectronicEquipmentMachinery and Equipment
Medicine
Minerals and Metal
Chemicals
Printing and Culture
Furniture and Paper
Textile and Garments
Food
GBA Background Document
© Copyright 2022 Foundation, 2019. 155
Dongguan
Dongguan, located on the East side of the PRD between Guangzhou and Shenzhen, is more trade
dependent (exports plus imports to GDP ratio) than any other city in the Chinese Mainland. After
China’s opening, Dongguan emerged as China’s leading center for export processing in which
imported components are processed and assembled for export. While the main focus initially was on
labor-intensive assembly of light manufactured goods, since the 2008 Financial Crisis there has been
a shift to more capital and knowledge-intensive products like electric and electronic products. By
2016, high-technology goods accounted for 40 percent of Dongguan’s exports, and export
processing had decreased from virtually 100 percent of exports in the 1990s to 58 percent in 2016.
The dominant manufacturing industry in Dongguan is electric and electronic equipment (mostly
communication equipment and computers), accounting for 43.2 percent of Dongguan’s value added
of industrial enterprises above designated size. Other important industries in Dongguan include
textile and garments (9 percent), machinery and equipment, minerals and metal, and furniture and
paper. Dongguan has attracted China’s top 3 mobile phone manufacturers (in terms of mobile phone
shipments), Huawei, OPPO, and Vivo, to establish manufacturing facilities in Dongguan. In 2016, the
sales of Huawei Devices exceeded RMB 100 billion, setting a sales record for firms in Dongguan.
While foreign-invested enterprises dominated Dongguan’s economy for decades, Chinese
investment, particularly from Shenzhen (the source of RMB 197.5 billion in contracted investment
from 2012 to 2017) has become more and more prominent. Wholesale and retail trades (24 percent
of tertiary GDP) was the largest service sector in Dongguan in 2016, followed by real estate (13
percent) and financial intermediation (12 percent). Dongguan is taking steps to strengthen its
distribution and exhibition services and holds regular trade fairs with a focus on processing trade.
Dongguan’s economy is driven by immigrant workers. It has a permanent population of 8.3 million
even though there are only 2 million people with local Hukou.
Development Plans
Dongguan has targeted annual average GDP growth of 8 percent and a per capita GDP growth of 7.5
percent during the 13th Five-Year Program Period. In 2020, Dongguan’s GDP is expected to reach
RMB 920 billion, per capita GDP RMB 110,000, service sector value added 55 percent of GDP,
advanced manufacturing 52 percent of the VAI of industrial enterprises above designated size, high-
tech manufacturing 38 percent of the VAI of industrial enterprises above designated size, and R&D
investment 2.8 percent of GDP.
The key industries Dongguan plans to develop are Electronics and information products
(communication equipment, intelligent terminals, consumer electronics, and electronic
components), Equipment manufacturing (robots and key components, smart sensors and
instrumentation, high speed and high precision manufacturing equipment, energy saving and
environmental protection equipment, auto parts, major intelligent equipment, and electronics),
Cultural industry and tourism, Finance, Logistics (Third and fourth party logistics, bonded logistics,
cold chain logistics, and express delivery logistics), and E-commerce.
GBA Background Document
© Copyright 2022 Foundation, 2019. 156
Plan for Cooperation with Hong Kong and Macao
Dongguan’s 13th Five-year Program calls for it to speed up the establishment of the Dongguan-Hong
Kong Youth Entrepreneurship Base, support the creation a professional platform for business start-
ups to attract Hong Kong youth and second generation of Hong Kong businessmen to Dongguan for
innovation and business start-up. It will further promote the construction of Guangdong-Hong Kong-
Macao Cultural Creativity Industry Experimental Park at Songshan Lake and introduce cultural and
creative institutions, enterprises, talent, and funds of Hong Kong and Macao to develop cultural and
creative industries. Dongguan plans to develop innovative cooperation mechanisms with Hong Kong
and to push service trade between the two places from "liberalization" to "integration," with a
specific focus on producer services. Dongguan will focus specifically on the cooperation with Hong
Kong and Macao in science and technology, finance, commerce, education, and public services; and
introduce support institutions in industrial design, productivity guidance, legal services, brand
promotion, financing and investment, and service outsourcing to meet the demand of the city for
high-end services. Efforts will also be enhanced in construction of cross-border infrastructure and
integration of resources to build a green and quality living area in the GBA.
Positioning
Dongguan is positioning itself as a world-famous manufacturing city; an ecological city suitable for
innovation, entrepreneurship, living, and working; and an emerging logistics center in the PRD.
Dongguan’s role in innovation in the PRD is to leverage its manufacturing strength, coordinate
innovation activities and resources in the Songshan Lake and the Ecological Park and surrounding
areas to speed up its industrial transformation and upgrading and to take an important position in
the innovation driven development of the East Bank of the Pearl River. Dongguan aims to develop
into an advanced manufacturing base with global influence; a national level Guangdong-Hong Kong-
Macao-Taiwan business start-up and innovation base; and a South China technology transfer center.
The development of the GBA provides opportunities for Dongguan to accelerate its development
into an advanced manufacturing center of the GBA and as a first-tier city through interaction with
other cities in the region.
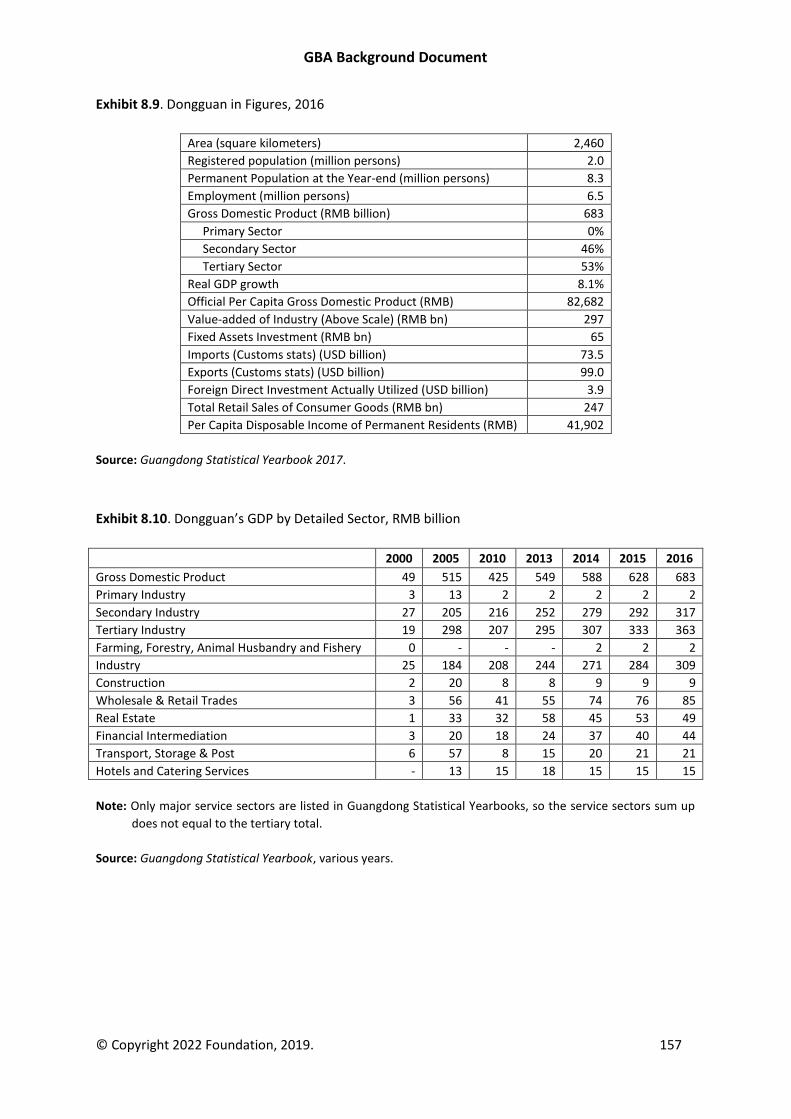
GBA Background Document
© Copyright 2022 Foundation, 2019. 157
Exhibit 8.9. Dongguan in Figures, 2016
Area (square kilometers) 2,460
Registered population (million persons) 2.0
Permanent Population at the Year-end (million persons) 8.3
Employment (million persons) 6.5
Gross Domestic Product (RMB billion) 683
Primary Sector 0%
Secondary Sector 46%
Tertiary Sector 53%
Real GDP growth 8.1%
Official Per Capita Gross Domestic Product (RMB) 82,682
Value-added of Industry (Above Scale) (RMB bn) 297
Fixed Assets Investment (RMB bn) 65
Imports (Customs stats) (USD billion) 73.5
Exports (Customs stats) (USD billion) 99.0
Foreign Direct Investment Actually Utilized (USD billion) 3.9
Total Retail Sales of Consumer Goods (RMB bn) 247
Per Capita Disposable Income of Permanent Residents (RMB) 41,902
Source: Guangdong Statistical Yearbook 2017.
Exhibit 8.10. Dongguan’s GDP by Detailed Sector, RMB billion
2000 2005 2010 2013 2014 2015 2016
Gross Domestic Product 49 515 425 549 588 628 683
Primary Industry 3 13 2 2 2 2 2
Secondary Industry 27 205 216 252 279 292 317
Tertiary Industry 19 298 207 295 307 333 363
Farming, Forestry, Animal Husbandry and Fishery 0 - - - 2 2 2
Industry 25 184 208 244 271 284 309
Construction 2 20 8 8 9 9 9
Wholesale & Retail Trades 3 56 41 55 74 76 85
Real Estate 1 33 32 58 45 53 49
Financial Intermediation 3 20 18 24 37 40 44
Transport, Storage & Post 6 57 8 15 20 21 21
Hotels and Catering Services - 13 15 18 15 15 15
Note: Only major service sectors are listed in Guangdong Statistical Yearbooks, so the service sectors sum up
does not equal to the tertiary total.
Source: Guangdong Statistical Yearbook, various years.
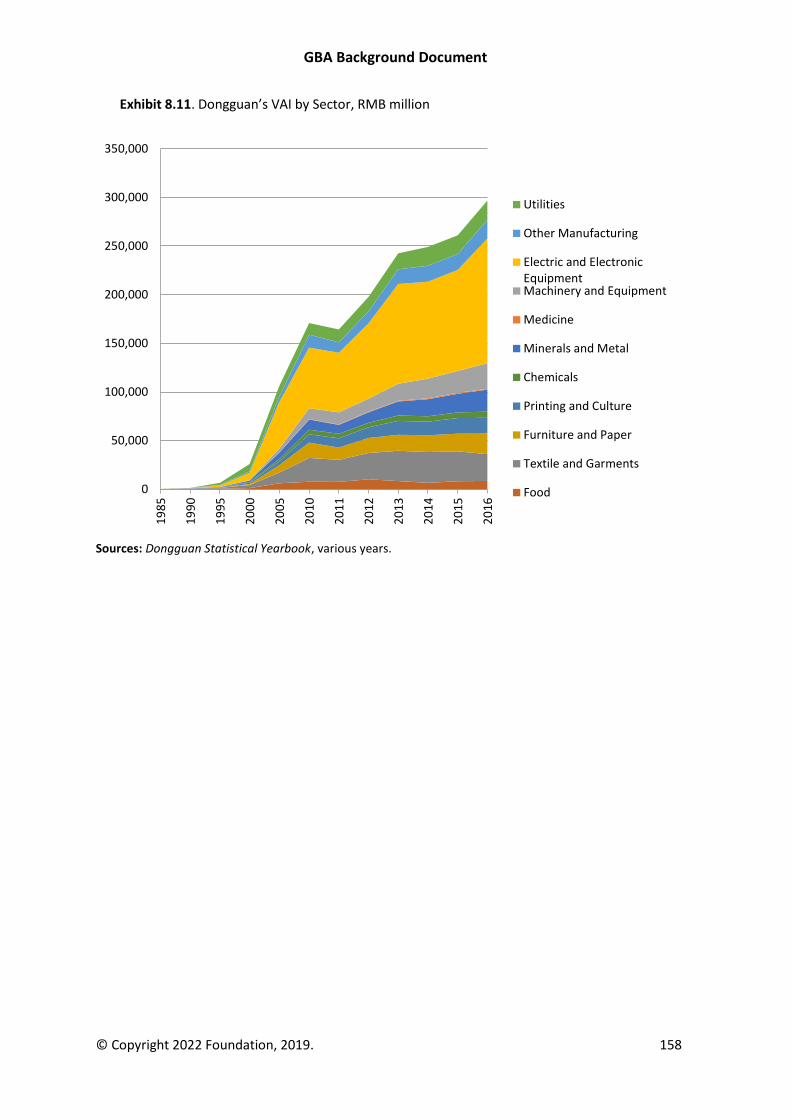
GBA Background Document
© Copyright 2022 Foundation, 2019. 158
Exhibit 8.11. Dongguan’s VAI by Sector, RMB million
Sources: Dongguan Statistical Yearbook, various years.
0
50,000
100,000
150,000
200,000
250,000
300,000
350,0001
98
5
19
90
19
95
20
00
20
05
20
10
20
11
20
12
20
13
20
14
20
15
20
16
Utilities
Other Manufacturing
Electric and ElectronicEquipmentMachinery and Equipment
Medicine
Minerals and Metal
Chemicals
Printing and Culture
Furniture and Paper
Textile and Garments
Food
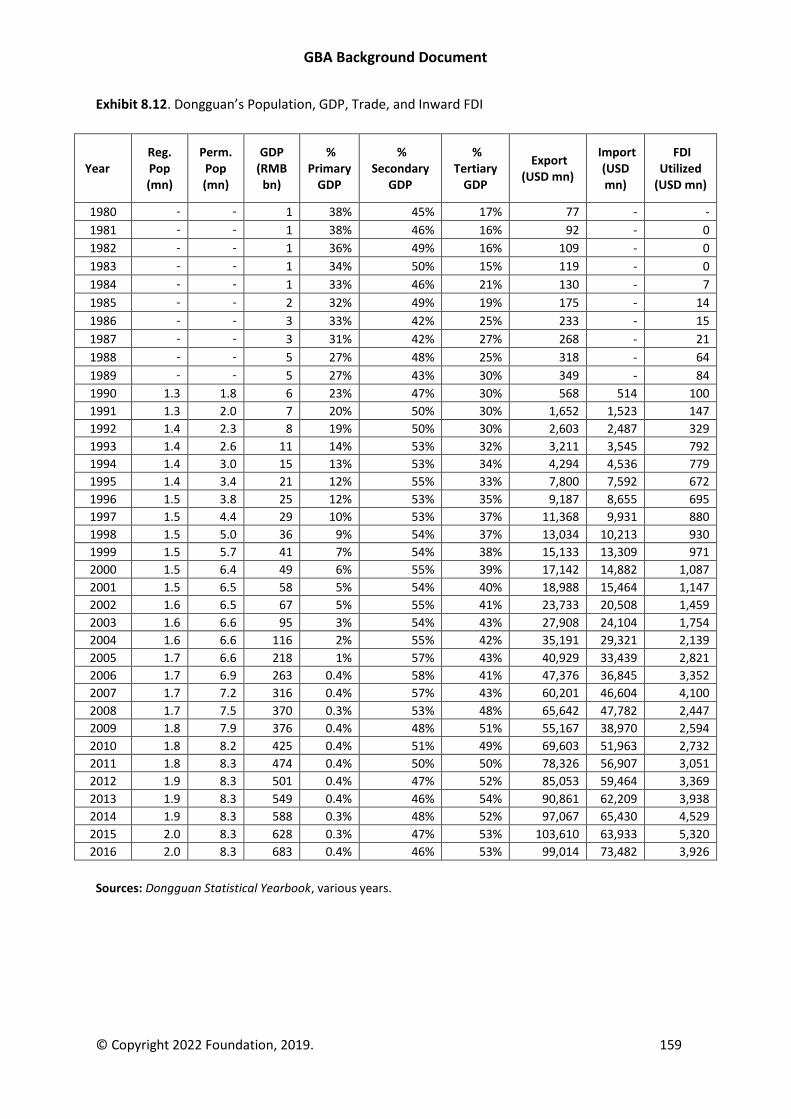
GBA Background Document
© Copyright 2022 Foundation, 2019. 159
Exhibit 8.12. Dongguan’s Population, GDP, Trade, and Inward FDI
Year Reg. Pop (mn)
Perm. Pop (mn)
GDP (RMB
bn)
% Primary
GDP
% Secondary
GDP
% Tertiary
GDP
Export (USD mn)
Import (USD mn)
FDI Utilized
(USD mn)
1980 - - 1 38% 45% 17% 77 - -
1981 - - 1 38% 46% 16% 92 - 0
1982 - - 1 36% 49% 16% 109 - 0
1983 - - 1 34% 50% 15% 119 - 0
1984 - - 1 33% 46% 21% 130 - 7
1985 - - 2 32% 49% 19% 175 - 14
1986 - - 3 33% 42% 25% 233 - 15
1987 - - 3 31% 42% 27% 268 - 21
1988 - - 5 27% 48% 25% 318 - 64
1989 - - 5 27% 43% 30% 349 - 84
1990 1.3 1.8 6 23% 47% 30% 568 514 100
1991 1.3 2.0 7 20% 50% 30% 1,652 1,523 147
1992 1.4 2.3 8 19% 50% 30% 2,603 2,487 329
1993 1.4 2.6 11 14% 53% 32% 3,211 3,545 792
1994 1.4 3.0 15 13% 53% 34% 4,294 4,536 779
1995 1.4 3.4 21 12% 55% 33% 7,800 7,592 672
1996 1.5 3.8 25 12% 53% 35% 9,187 8,655 695
1997 1.5 4.4 29 10% 53% 37% 11,368 9,931 880
1998 1.5 5.0 36 9% 54% 37% 13,034 10,213 930
1999 1.5 5.7 41 7% 54% 38% 15,133 13,309 971
2000 1.5 6.4 49 6% 55% 39% 17,142 14,882 1,087
2001 1.5 6.5 58 5% 54% 40% 18,988 15,464 1,147
2002 1.6 6.5 67 5% 55% 41% 23,733 20,508 1,459
2003 1.6 6.6 95 3% 54% 43% 27,908 24,104 1,754
2004 1.6 6.6 116 2% 55% 42% 35,191 29,321 2,139
2005 1.7 6.6 218 1% 57% 43% 40,929 33,439 2,821
2006 1.7 6.9 263 0.4% 58% 41% 47,376 36,845 3,352
2007 1.7 7.2 316 0.4% 57% 43% 60,201 46,604 4,100
2008 1.7 7.5 370 0.3% 53% 48% 65,642 47,782 2,447
2009 1.8 7.9 376 0.4% 48% 51% 55,167 38,970 2,594
2010 1.8 8.2 425 0.4% 51% 49% 69,603 51,963 2,732
2011 1.8 8.3 474 0.4% 50% 50% 78,326 56,907 3,051
2012 1.9 8.3 501 0.4% 47% 52% 85,053 59,464 3,369
2013 1.9 8.3 549 0.4% 46% 54% 90,861 62,209 3,938
2014 1.9 8.3 588 0.3% 48% 52% 97,067 65,430 4,529
2015 2.0 8.3 628 0.3% 47% 53% 103,610 63,933 5,320
2016 2.0 8.3 683 0.4% 46% 53% 99,014 73,482 3,926
Sources: Dongguan Statistical Yearbook, various years.
GBA Background Document
© Copyright 2022 Foundation, 2019. 160
Foshan
Foshan, located just to the West of Guangzhou in the Central portion of the PRD, is a major national
manufacturing base, a regional producer services center, a regional market for specific products, and
a regional logistics center. It is the key hub connecting the PRD and Southwest China. In the newly
published Comprehensive Development Plan for Guangdong Coastal Economic Belt (2017-2030),
Foshan is designated as the innovation engine of the Advanced Equipment Manufacturing Industry
Belt on the West Bank of the Pearl River and South China’s fintech innovation center.
Foshan’s GDP ranks fourth in the GBA after Hong Kong, Guangzhou, and Shenzhen. Foshan has a
largely industrial economy, with ceramics, housewares, building materials, home appliances,
garments, and electrical and electronic goods of particular note. Foshan is distinctive in the PRD as
having indigenous companies dominant in the local economy. Foshan has the highest proportion of
GDP in the secondary industry and the second lowest proportion of GDP in tertiary sector among
cities in the GBA. Foshan has some leading wholesale and retail markets, and in recent years Foshan
has developed as a back-office service center for financial institutions and a data center for other
businesses, but the service sector remains relatively underdeveloped.
Foshan’s leading industrial sectors by value added are electric and electronic equipment, mineral
and metal, and machinery and equipment, respectively accounting for 33 percent, 16 percent, and
13 percent of the value added of Foshan’s industrial enterprises above designated size. A number of
locations within Foshan are known for particular industries. Shunde is a major hub for household
appliances, including refrigerators, microwave ovens, electric fans, and air-conditioners. Daliang is
well known for plastics, Leliu for bicycles, Chencun for flowers and horticultural products, Lecong for
furniture distribution, Lunjiao for woodworking machinery, Gaoming for garments and textiles,
Yanbu for underwear, Jun’an for jeans, and Shiwan for ceramics. Some of Foshan’s traditional
industries date back hundreds of years. In services, Foshan’s leading sector is real estate, accounting
for 21 percent of Foshan’s tertiary GDP in 2016, following by wholesale and retail trade (19 percent)
and financial intermediate (11 percent).
Development Plans
Foshan has set its annual average GDP growth target at over 7.5 percent and per capita GDP growth
rate at over 7 percent during the 13th Five-Year Program Period. In 2020, Foshan aims to have GDP
reach RMB 1.15 trillion, service value added over 40 percent of GDP, advanced manufacturing 40
percent of the VAI of industrial enterprises above designated size, high-tech manufacturing
industries 46 percent of the GIO of industrial enterprises above designated size, and R&D investment
2.9 percent of GDP.
Foshan plans to use smart manufacturing, robotics and automation, and an “internet+” strategy to
upgrade its manufacturing industries. Foshan plans to build an equipment manufacturing industrial
base, including intelligent manufacturing equipment, Automotive manufacturing, and New energy
equipment. The gross output of the equipment manufacturing industry is planned to reach RMB 1
trillion in 2020 and Foshan plans to be the leading city in advanced equipment manufacturing
industries on the West Bank of the Pearl River. Foshan focuses on developing its producer services.
Key producer services are related to Innovation and entrepreneurship, Industrial finance, Express
GBA Background Document
© Copyright 2022 Foundation, 2019. 161
delivery and logistics, Trade fairs and exhibition, Science and technology, E-commerce, Industrial
design, and Service outsourcing.
Plan for Cooperation with Hong Kong and Macao
In its 13th Five-year Program, Foshan calls for deepening cooperation with Hong Kong and Macao in
the modern service industry. It will support the development of Foshan into a financial service
outsourcing base for Hong Kong, advance the development of Foshan-Hong Kong cooperation in the
logistics industry, and accelerate the development of Foshan-Hong Kong cooperation in the
exhibition industry; encourage the development of Foshan-Hong Kong cooperation in science and
technology creative industries; and speed up the construction of the LED-FPD Engineering
Technology Research and Development Centre of Foshan Hong Kong University of Science and
Technology. The construction of the provincial level Nanhai High-end Service Demonstration Zone
for the Liberalization of Trade in Services between Guangdong, Hong Kong, and Macao will be
accelerated, to attract financial institutions and service agencies from Hong Kong and Macao to set
up offices, and build an international financial backroom center and support platform for high-end
service industries based in Hong Kong and Macao and covering the entire Asia-Pacific region.
Foshan plans to make full use of the advanced experience of Hong Kong and Macao in urban and
social management to enhance the standard of public services in Foshan; promote cooperation
between Foshan, Hong Kong, and Macao in education, health care, hygiene and food and drug
safety, and encourage Hong Kong and Macao institutions to participate in developing Foshan's social
undertakings. Foshan is aiming for innovation in talent service system and mechanisms, to redouble
efforts in talent training and exchanges with Hong Kong and Macao, and to attract high-end talent
and entrepreneurial teams from Hong Kong and Macao to Foshan for innovation and business start-
up.
Positioning
Foshan aims to position itself as a national-level first-tier manufacturing city, the leading city in the
advanced equipment manufacturing industry on the West bank of the Pearl River, a pioneer city for
innovation-driven development, and a demonstration city for traditional industry transformation
and upgrading.123 Its innovation role in the PRD is to leverage administrative integration between
Guangzhou and Foshan to advance Foshan as the national pilot comprehensive supporting reform
area for the transformation and upgrading of the manufacturing sector. It aims to build the
innovation engine for the advanced equipment manufacturing industrial belt along the West Bank of
the Pearl River; the South China technology and finance industry integration innovation center; and
the bridgehead of the industry cooperation between Guangdong, Guangxi, and Guizhou. In the
construction of the GBA, Foshan will leverage its integration with Guangzhou, its central location
that connects east and west of the PRD, and its manufacturing strength to become a hub city for the
GBA.
123 The 13th Five-year Program of Guangdong Province.

GBA Background Document
© Copyright 2022 Foundation, 2019. 162
Exhibit 8.13. Foshan in Figures, 2016
Area (square kilometers) 807
Registered population (million persons) 4.0
Permanent Population at the Year-end (million persons) 7.5
Employment (million persons) 4.4
Gross Domestic Product (RMB billion) 863
Primary Sector 2%
Secondary Sector 60%
Tertiary Sector 39%
Real GDP growth 8.3%
Official Per Capita Gross Domestic Product (RMB) 115,891
Value-added of Industry (Above Scale) (RMB bn) 467
Fixed Assets Investment (RMB bn) 351
Imports (Customs stats) (USD billion) 15.2
Exports (Customs stats) (USD billion) 47.0
Foreign Direct Investment Actually Utilized (USD billion) 1.5
Total Retail Sales of Consumer Goods (RMB bn) 302
Per Capita Disposable Income of Permanent Residents (RMB) 41,941
Source: Guangdong Statistical Yearbook 2017.
Exhibit 8.14. Foshan’s GDP by Detailed Sector, RMB billion
2000 2005 2010 2013 2014 2015 2016
Gross Domestic Product 96 238 565 701 744 800 863
Primary Industry 7 8 11 14 13 14 15
Secondary Industry 51 144 354 434 460 484 515
Tertiary Industry 39 87 200 253 271 303 334
Farming, Forestry, Animal Husbandry and Fishery 0 - - - 14 14 15
Industry 48 137 342 420 444 468 497
Construction 3 6 12 14 16 17 18
Real Estate 4 9 32 45 53 63 71
Wholesale & Retail Trades 10 21 44 57 51 57 62
Financial Intermediation 3 5 19 27 34 34 38
Transport, Storage & Post 11 14 16 15 25 27 29
Hotels and Catering Services - 6 11 11 7 7 8
Note: Only major service sectors are listed in Guangdong Statistical Yearbooks, so the service sectors sum up
does not equal to the tertiary total.
Source: Guangdong Statistical Yearbook, various years.
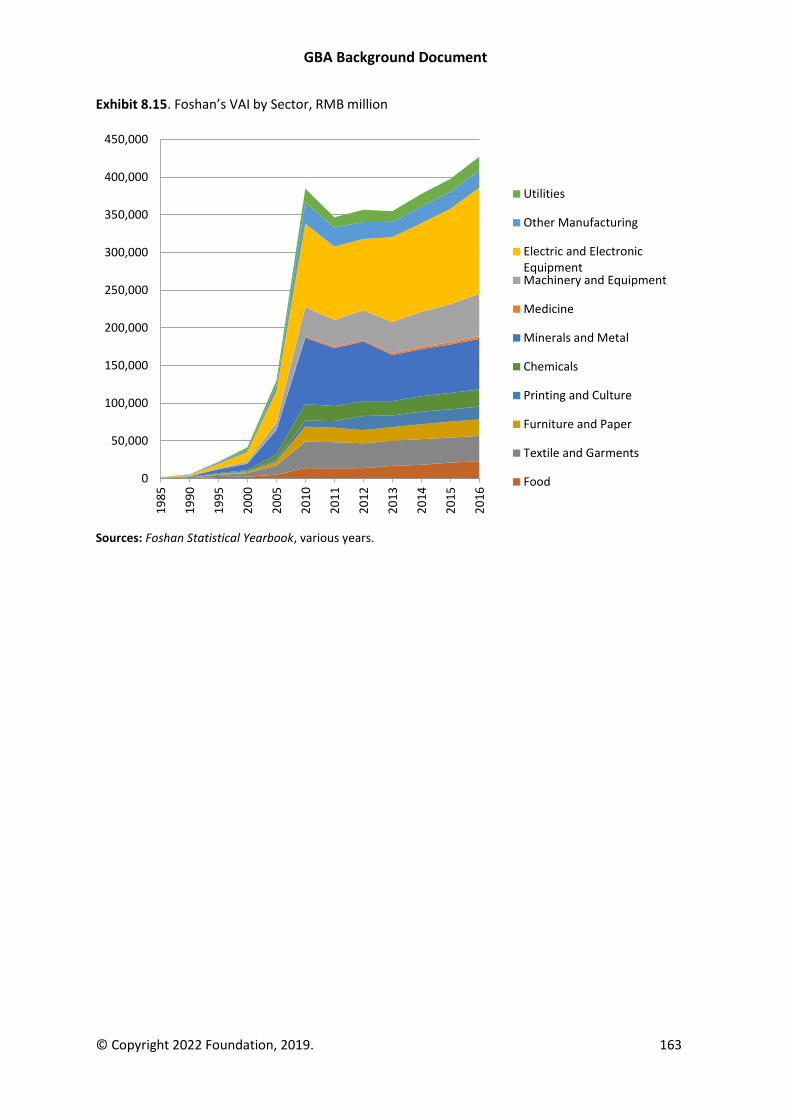
GBA Background Document
© Copyright 2022 Foundation, 2019. 163
Exhibit 8.15. Foshan’s VAI by Sector, RMB million
Sources: Foshan Statistical Yearbook, various years.
0
50,000
100,000
150,000
200,000
250,000
300,000
350,000
400,000
450,000
19
85
19
90
19
95
20
00
20
05
20
10
20
11
20
12
20
13
20
14
20
15
20
16
Utilities
Other Manufacturing
Electric and ElectronicEquipmentMachinery and Equipment
Medicine
Minerals and Metal
Chemicals
Printing and Culture
Furniture and Paper
Textile and Garments
Food
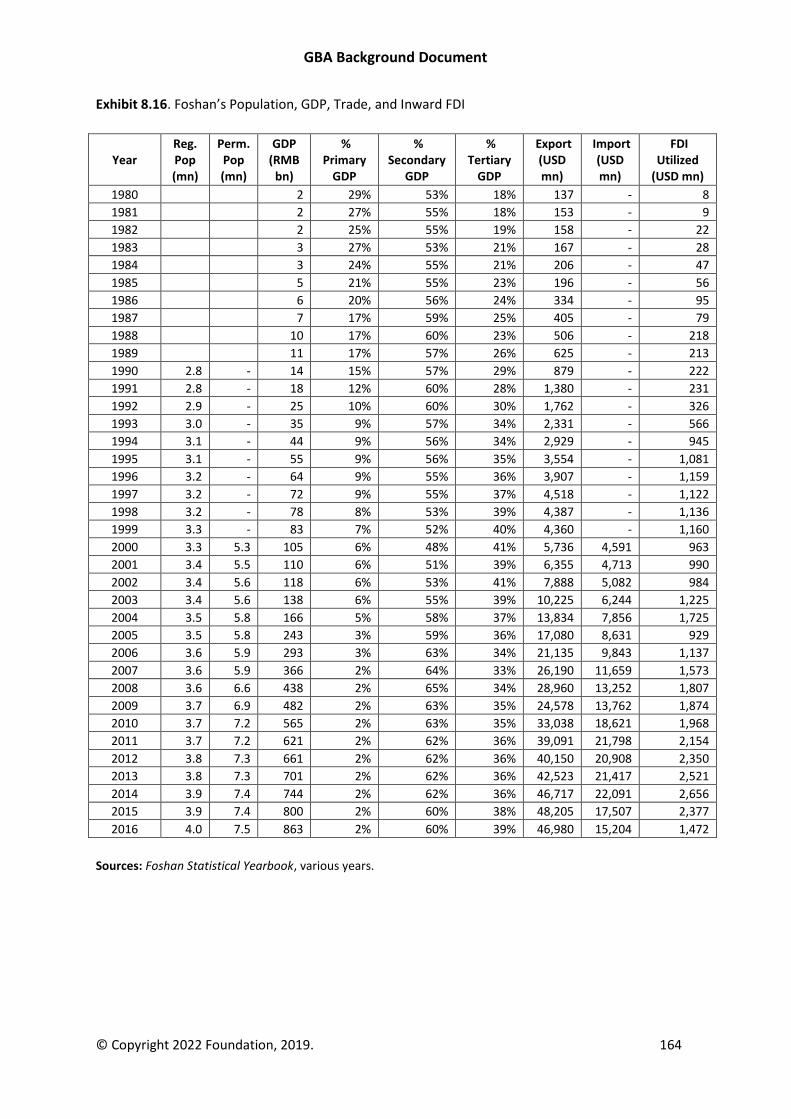
GBA Background Document
© Copyright 2022 Foundation, 2019. 164
Exhibit 8.16. Foshan’s Population, GDP, Trade, and Inward FDI
Year Reg. Pop (mn)
Perm. Pop (mn)
GDP (RMB
bn)
% Primary
GDP
% Secondary
GDP
% Tertiary
GDP
Export (USD mn)
Import (USD mn)
FDI Utilized
(USD mn)
1980 2 29% 53% 18% 137 - 8
1981 2 27% 55% 18% 153 - 9
1982 2 25% 55% 19% 158 - 22
1983 3 27% 53% 21% 167 - 28
1984 3 24% 55% 21% 206 - 47
1985 5 21% 55% 23% 196 - 56
1986 6 20% 56% 24% 334 - 95
1987 7 17% 59% 25% 405 - 79
1988 10 17% 60% 23% 506 - 218
1989 11 17% 57% 26% 625 - 213
1990 2.8 - 14 15% 57% 29% 879 - 222
1991 2.8 - 18 12% 60% 28% 1,380 - 231
1992 2.9 - 25 10% 60% 30% 1,762 - 326
1993 3.0 - 35 9% 57% 34% 2,331 - 566
1994 3.1 - 44 9% 56% 34% 2,929 - 945
1995 3.1 - 55 9% 56% 35% 3,554 - 1,081
1996 3.2 - 64 9% 55% 36% 3,907 - 1,159
1997 3.2 - 72 9% 55% 37% 4,518 - 1,122
1998 3.2 - 78 8% 53% 39% 4,387 - 1,136
1999 3.3 - 83 7% 52% 40% 4,360 - 1,160
2000 3.3 5.3 105 6% 48% 41% 5,736 4,591 963
2001 3.4 5.5 110 6% 51% 39% 6,355 4,713 990
2002 3.4 5.6 118 6% 53% 41% 7,888 5,082 984
2003 3.4 5.6 138 6% 55% 39% 10,225 6,244 1,225
2004 3.5 5.8 166 5% 58% 37% 13,834 7,856 1,725
2005 3.5 5.8 243 3% 59% 36% 17,080 8,631 929
2006 3.6 5.9 293 3% 63% 34% 21,135 9,843 1,137
2007 3.6 5.9 366 2% 64% 33% 26,190 11,659 1,573
2008 3.6 6.6 438 2% 65% 34% 28,960 13,252 1,807
2009 3.7 6.9 482 2% 63% 35% 24,578 13,762 1,874
2010 3.7 7.2 565 2% 63% 35% 33,038 18,621 1,968
2011 3.7 7.2 621 2% 62% 36% 39,091 21,798 2,154
2012 3.8 7.3 661 2% 62% 36% 40,150 20,908 2,350
2013 3.8 7.3 701 2% 62% 36% 42,523 21,417 2,521
2014 3.9 7.4 744 2% 62% 36% 46,717 22,091 2,656
2015 3.9 7.4 800 2% 60% 38% 48,205 17,507 2,377
2016 4.0 7.5 863 2% 60% 39% 46,980 15,204 1,472
Sources: Foshan Statistical Yearbook, various years.
GBA Background Document
© Copyright 2022 Foundation, 2019. 165
Zhuhai
Situated on the West Bank of the Pearl River Delta adjacent to Macao, Zhuhai became a Special
Economic Zone in 1980. Zhuhai is known for its pleasant living environment and its focus on
technology-based business as well as sporting events and recreation. Zhuhai’s economy is well
positioned to benefit from proximity to Macao, with its fast-growing gaming and hospitality sector,
and the soon to open bridge to Hong Kong.
In 2016, Zhuhai ranked the third in per capita GDP in the Pearl River Delta region. Zhuhai’s leading
industrial sector by value added is electric and electronic equipment, accounting for 50 percent of
the value added of Zhuhai’s industrial enterprises above designated size; machinery and equipment
accounted for another 11 percent. Already established as a high-tech area and tourist center, Zhuhai
is starting to push ahead with the development of heavy industries, especially in the vicinity of its
port. Zhuhai also provides flowers, fruit, vegetables, and seafood for regional markets. Wholesale
and retail trade topped Zhuhai’s service sector in 2016, accounting for 21 percent of Zhuhai’s
tertiary GDP, followed by real estate (18 percent) and financial intermediation (15 percent).
Zhuhai’s biennial international air show, the city’s main trade show, has become a venue for sealing
major aviation-related deals. The area is also cultivating its tourist attractions, as well as promoting
specialized real estate developments, such as retirement communities and sports facilities.
Development Plans
Zhuhai has targeted annual average GDP growth of 9 percent during the 13th Five-Year Program
Period. In 2020, Zhuhai’s aims to have GDP reach RMB 300 billion, per capita GDP USD 30,000 (about
RMB 195,000); service value added not less than 48.1 percent of GDP, advanced manufacturing 48.8
percent of the VAI of industrial enterprises above designated size, high-tech industries 60 percent of
the GIO of industrial enterprises above designated size, and R&D investment over 4 percent of GDP.
The key manufacturing industries Zhuhai is focused on are Advanced manufacturing industries,
including Marine engineering equipment, Aviation and aerospace, Rail transportation equipment,
New energy vehicles, Electrical and electronic equipment, Intelligent manufacturing, Petrochemical,
3D printers, Medical equipment, Yachts, Fine chemicals, and Working machines; High- and new-tech
industries, including Software, Integrated circuit design, Mobile internet, Smart grid, Internet of
things, Biomedicine, New materials, Smart robots, Desalination equipment, and Wearable devices;
High-end service industries, including Finance, Business and exhibition, Headquarters economy,
Leisure tourism, High-end logistics, Cultural creativity, and Technology services; as well as the
Marine economy and Ecological agriculture.
Plan for Cooperation with Hong Kong and Macao
In its the 13th Five-year Program, Zhuhai has pledged to engage actively in the construction of the
GBA, building the quality living area in Zhuhai, Hong Kong, and Macao and gradually achieving
integrated development of service industries and the integration of service markets in Zhuhai, Hong
Kong, and Macao. Zhuhai plans to build an important hub for the Guangdong-Hong Kong-Macao
Greater Bay Area by leveraging the "Multiplier Effect" of the Hong Kong-Zhuhai-Macao Bridge and
the Hengqin Free Trade Zone. Zhuhai hopes to connect with Hong Kong and Macao in social
GBA Background Document
© Copyright 2022 Foundation, 2019. 166
management and public services and to build a demonstration area of close cooperation between
Guangdong, Hong Kong, and Macao. Zhuhai plans to implement more convenient customs clearance
policies to promote "Seamless Transfer and Connectivity" with Hong Kong and Macao and the other
jurisdictions of the Pearl River Delta.
Zhuhai plans to promote the integration of industrial and urban development of Zhuhai with Hong
Kong and Macao by enhancing communication and cooperation among the three governments,
interconnection of development plans, overall coordination of infrastructure facilities, and through
the industrial layout in the three places. Zhuhai will focus on attracting the financial, trade, logistics,
and professional services of Hong Kong and Macao. Zhuhai hopes to use the advantages of Hong
Kong and Macao in capital, professional services, and science and technology to promote innovation
cooperation in information, new energy, new materials, biomedicine, energy conservation and
environmental protection, marine, and other emerging industries. Zhuhai also plans to cooperate
with Hong Kong and Macao to build a world-class tourism and leisure center and build a national
marine ecological park around Hong Kong and Macao based on Wanshan District. It will upgrade of
Zhuhai-Macao Cross Border Industrial Zone. Cooperation in people's livelihoods will focus on
educational and cultural exchanges; traditional Chinese medicine technology and industry; and
exploring the connectivity in elderly service, healthcare, and other social services.
Zhuhai will support the construction of "One Centre, One Platform" in Macao, accelerate the
construction of the Guangdong-Macao Cooperation Industrial Park, the Guangdong-Macao
Traditional Chinese Medicine Industrial Park, and promote the moderate diversification and long-
term prosperity and stability of Macao's economy. It plans to proactively engage in cooperation with
Macao in environmental protection, public health and social services, and traffic guidance.
Positioning
The positioning of Zhuhai is as a transport hub and the core city on the West Bank of the Pearl River
Estuary and a modern regional central city. The innovation function of Zhuhai in the PRD is to
leverage the features of the special economic zone and Zhuhai’s ecological advantages to build an
innovative economic system and a new mode of innovation and development; create a modern
industrial system of "Three Highs and One Special" (high-end service, high-end manufacturing, high
and new technology industry; and special marine economy and eco-agriculture) led by intelligent
manufacturing; create a development environment that is market oriented, internationalized, and
based on law, so as to take an important position in the innovation-driven development of the West
Bank of the Pearl River; and develop into the regional innovation center, an important pilot area for
innovation and cooperation between Guangdong, Hong Kong, and Macao, and an international high-
end talent gathering area along the West Bank of the Pearl River. In the GBA, Zhuhai will strengthen
its function as a transport hub, make full use of the development potential of Hengqin and the West
Ecology New District, and continue to upgrade the quality of its economy and city.
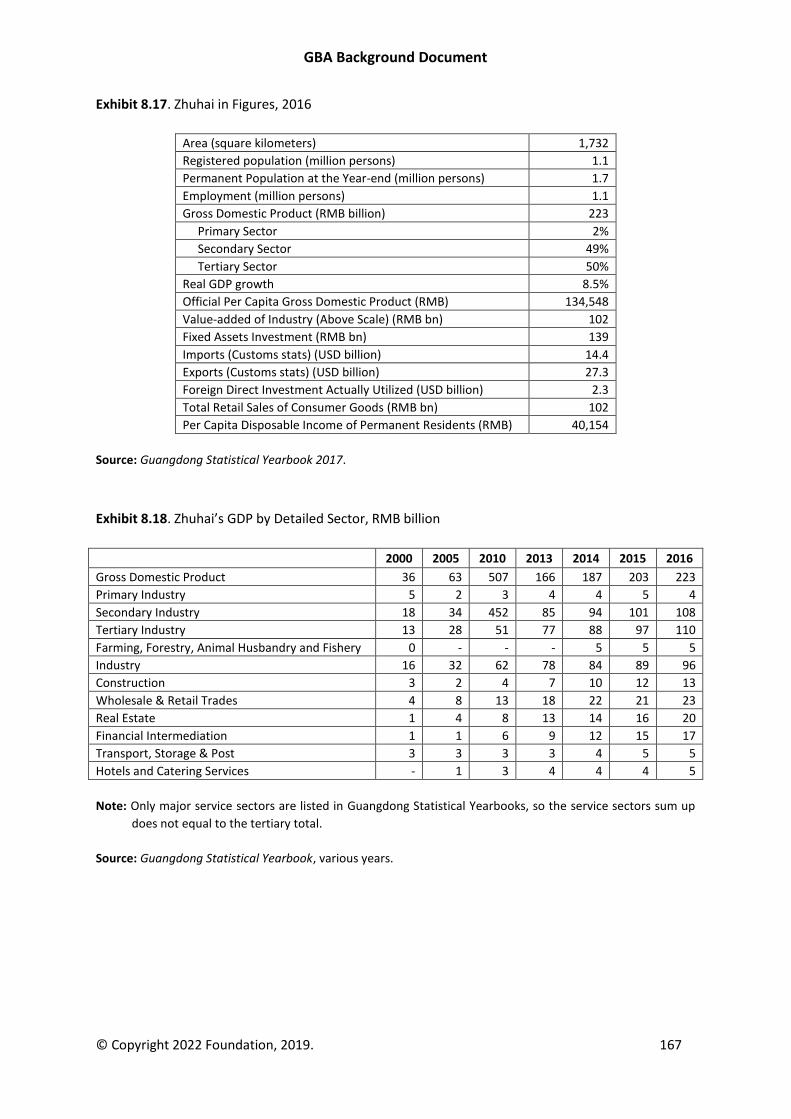
GBA Background Document
© Copyright 2022 Foundation, 2019. 167
Exhibit 8.17. Zhuhai in Figures, 2016
Area (square kilometers) 1,732
Registered population (million persons) 1.1
Permanent Population at the Year-end (million persons) 1.7
Employment (million persons) 1.1
Gross Domestic Product (RMB billion) 223
Primary Sector 2%
Secondary Sector 49%
Tertiary Sector 50%
Real GDP growth 8.5%
Official Per Capita Gross Domestic Product (RMB) 134,548
Value-added of Industry (Above Scale) (RMB bn) 102
Fixed Assets Investment (RMB bn) 139
Imports (Customs stats) (USD billion) 14.4
Exports (Customs stats) (USD billion) 27.3
Foreign Direct Investment Actually Utilized (USD billion) 2.3
Total Retail Sales of Consumer Goods (RMB bn) 102
Per Capita Disposable Income of Permanent Residents (RMB) 40,154
Source: Guangdong Statistical Yearbook 2017.
Exhibit 8.18. Zhuhai’s GDP by Detailed Sector, RMB billion
2000 2005 2010 2013 2014 2015 2016
Gross Domestic Product 36 63 507 166 187 203 223
Primary Industry 5 2 3 4 4 5 4
Secondary Industry 18 34 452 85 94 101 108
Tertiary Industry 13 28 51 77 88 97 110
Farming, Forestry, Animal Husbandry and Fishery 0 - - - 5 5 5
Industry 16 32 62 78 84 89 96
Construction 3 2 4 7 10 12 13
Wholesale & Retail Trades 4 8 13 18 22 21 23
Real Estate 1 4 8 13 14 16 20
Financial Intermediation 1 1 6 9 12 15 17
Transport, Storage & Post 3 3 3 3 4 5 5
Hotels and Catering Services - 1 3 4 4 4 5
Note: Only major service sectors are listed in Guangdong Statistical Yearbooks, so the service sectors sum up
does not equal to the tertiary total.
Source: Guangdong Statistical Yearbook, various years.
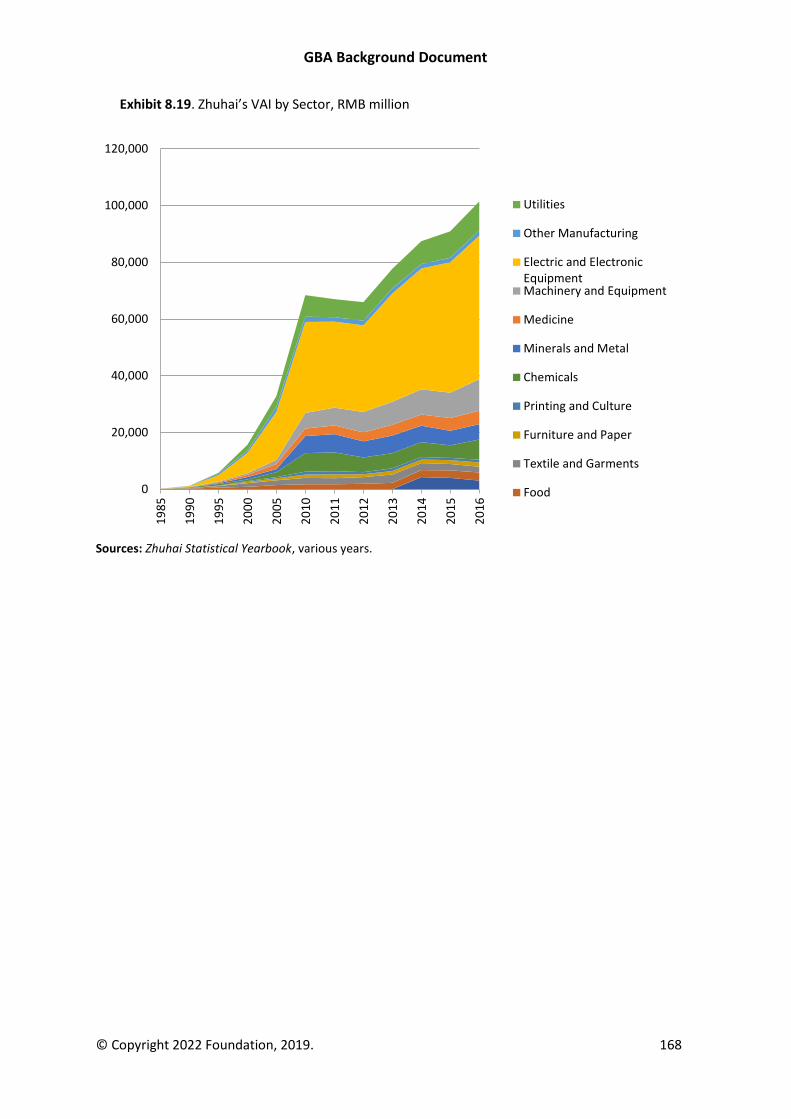
GBA Background Document
© Copyright 2022 Foundation, 2019. 168
Exhibit 8.19. Zhuhai’s VAI by Sector, RMB million
Sources: Zhuhai Statistical Yearbook, various years.
0
20,000
40,000
60,000
80,000
100,000
120,0001
98
5
19
90
19
95
20
00
20
05
20
10
20
11
20
12
20
13
20
14
20
15
20
16
Utilities
Other Manufacturing
Electric and ElectronicEquipmentMachinery and Equipment
Medicine
Minerals and Metal
Chemicals
Printing and Culture
Furniture and Paper
Textile and Garments
Food
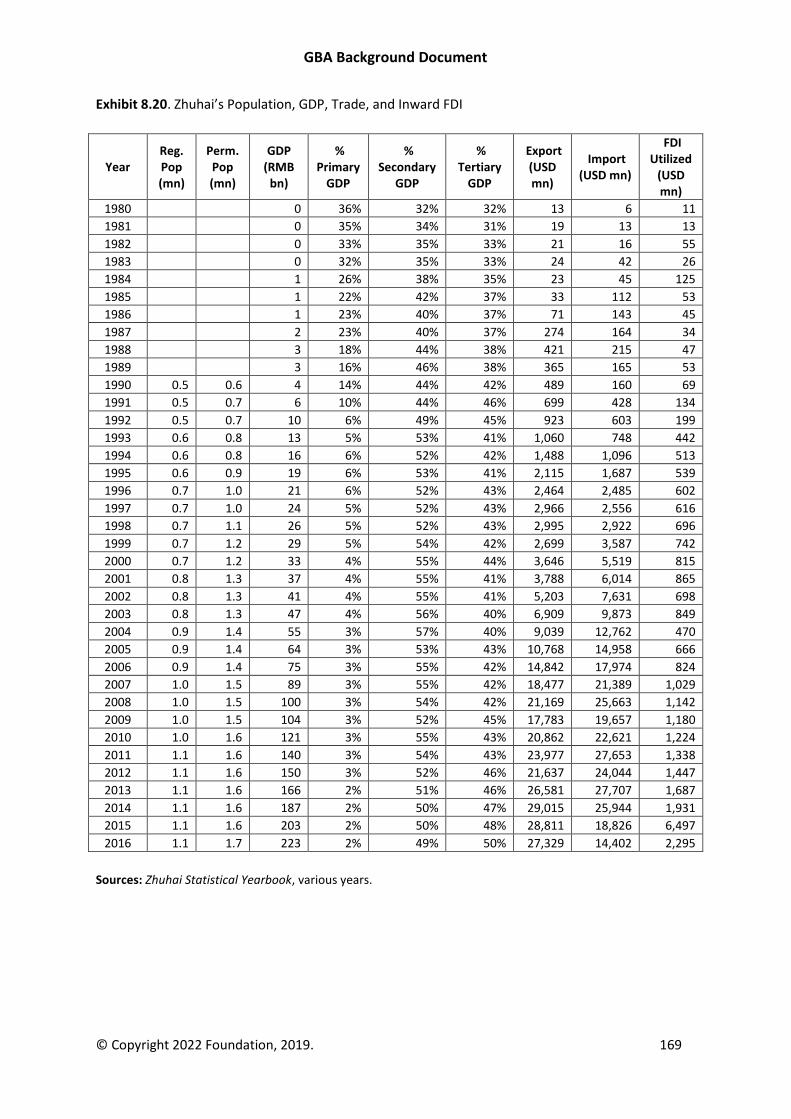
GBA Background Document
© Copyright 2022 Foundation, 2019. 169
Exhibit 8.20. Zhuhai’s Population, GDP, Trade, and Inward FDI
Year Reg. Pop (mn)
Perm. Pop (mn)
GDP (RMB
bn)
% Primary
GDP
% Secondary
GDP
% Tertiary
GDP
Export (USD mn)
Import (USD mn)
FDI Utilized
(USD mn)
1980 0 36% 32% 32% 13 6 11
1981 0 35% 34% 31% 19 13 13
1982 0 33% 35% 33% 21 16 55
1983 0 32% 35% 33% 24 42 26
1984 1 26% 38% 35% 23 45 125
1985 1 22% 42% 37% 33 112 53
1986 1 23% 40% 37% 71 143 45
1987 2 23% 40% 37% 274 164 34
1988 3 18% 44% 38% 421 215 47
1989 3 16% 46% 38% 365 165 53
1990 0.5 0.6 4 14% 44% 42% 489 160 69
1991 0.5 0.7 6 10% 44% 46% 699 428 134
1992 0.5 0.7 10 6% 49% 45% 923 603 199
1993 0.6 0.8 13 5% 53% 41% 1,060 748 442
1994 0.6 0.8 16 6% 52% 42% 1,488 1,096 513
1995 0.6 0.9 19 6% 53% 41% 2,115 1,687 539
1996 0.7 1.0 21 6% 52% 43% 2,464 2,485 602
1997 0.7 1.0 24 5% 52% 43% 2,966 2,556 616
1998 0.7 1.1 26 5% 52% 43% 2,995 2,922 696
1999 0.7 1.2 29 5% 54% 42% 2,699 3,587 742
2000 0.7 1.2 33 4% 55% 44% 3,646 5,519 815
2001 0.8 1.3 37 4% 55% 41% 3,788 6,014 865
2002 0.8 1.3 41 4% 55% 41% 5,203 7,631 698
2003 0.8 1.3 47 4% 56% 40% 6,909 9,873 849
2004 0.9 1.4 55 3% 57% 40% 9,039 12,762 470
2005 0.9 1.4 64 3% 53% 43% 10,768 14,958 666
2006 0.9 1.4 75 3% 55% 42% 14,842 17,974 824
2007 1.0 1.5 89 3% 55% 42% 18,477 21,389 1,029
2008 1.0 1.5 100 3% 54% 42% 21,169 25,663 1,142
2009 1.0 1.5 104 3% 52% 45% 17,783 19,657 1,180
2010 1.0 1.6 121 3% 55% 43% 20,862 22,621 1,224
2011 1.1 1.6 140 3% 54% 43% 23,977 27,653 1,338
2012 1.1 1.6 150 3% 52% 46% 21,637 24,044 1,447
2013 1.1 1.6 166 2% 51% 46% 26,581 27,707 1,687
2014 1.1 1.6 187 2% 50% 47% 29,015 25,944 1,931
2015 1.1 1.6 203 2% 50% 48% 28,811 18,826 6,497
2016 1.1 1.7 223 2% 49% 50% 27,329 14,402 2,295
Sources: Zhuhai Statistical Yearbook, various years.
GBA Background Document
© Copyright 2022 Foundation, 2019. 170
Zhongshan
Zhongshan is located in the western part of the Pearl River Delta, north of Zhuhai and south of
Foshan. The city has a number of distinctive towns under its jurisdiction that have well-established
manufacturing bases. In addition to its export-oriented facilities, Zhongshan also is home to a large
number of factories that supply the Chinese domestic market. Zhongshan’s leading industrial sectors
by value added are electric and electronic equipment, machinery and equipment, and textile and
garments, respectively accounting for 30 percent, 12 percent, and 10 percent of value added of
Zhongshan’s industrial enterprises above designated size. Zhongshan’s leading service sectors are
wholesale and retail trade, real estate trade, and financial intermediation, respectively accounting
for 20 percent, 15 percent, and 12 percent of Zhongshan’s tertiary GDP.
Development Plans
Zhongshan has targeted annual average GDP growth of 8.5 percent and per capita GDP growth of
7.5 percent during the 13th Five-Year Program Period. In 2020, Zhongshan’s plans to have GDP reach
RMB 500 billion, per capita GDP RMB 130,000, service sector value added 48 percent of GDP,
advanced manufacturing 50 percent of the VAI of industrial enterprises above designated size,
strategic emerging industry value added 20 percent of GDP, and R&D investment 2.9 percent of GDP.
In the program period, Zhongshan plans to build industrial agglomerations with revenues exceeding
RMB 100 billion in Advanced manufacturing, Household appliance, Electronics and information
products, and Health and medicine. In advanced manufacturing, Zhongshan focuses on Intelligent
manufacturing, Ships and marine engineering equipment, New energy equipment, Automotive
manufacturing, Energy conservation and environmental protection equipment, and Satellites and
applications. In services, Zhongshan focuses on New-types of Financing, Cultural creativity, Logistics,
R&D services, Professional services, Information technology services, E-commerce, and Healthcare.
Plan for Cooperation with Hong Kong and Macao
In its 13th Five-year Program, Zhongshan plans to strengthen its cooperation and exchanges with
Hong Kong and Macao in the fields of talent, innovation, industry, people's livelihood, and tourism. It
will promote the seamless integration of the three places in the exhibition industry and encourage
enterprises to list or conduct other forms of financing activities in Hong Kong. It aims to support
cooperation between Guangdong and Macao in payment and settlement, attract management
talent from Hong Kong and Macao, and encourage innovation teams and individuals from Hong Kong
and Macao to start businesses in Zhongshan. It plans to advocate the Zhongshan, Hong Kong, and
Macao free sailing program. Zhuhai also plans to build the Guangdong and Macao Business Start-up
and Innovation Cooperation Zone in Cuiheng New District, using high standards to make it a quality
living area.
Positioning
Zhongshan is positioning itself as a modern equipment manufacturing base, a regional
comprehensive transport hub on the West Bank of the Pearl River, a regional science and technology
innovation and R&D center, and a boutique livable city of the PRD. To support innovation in the PRD,
Zhongshan to leverage its brand image as the hometown of well-known large companies and its high
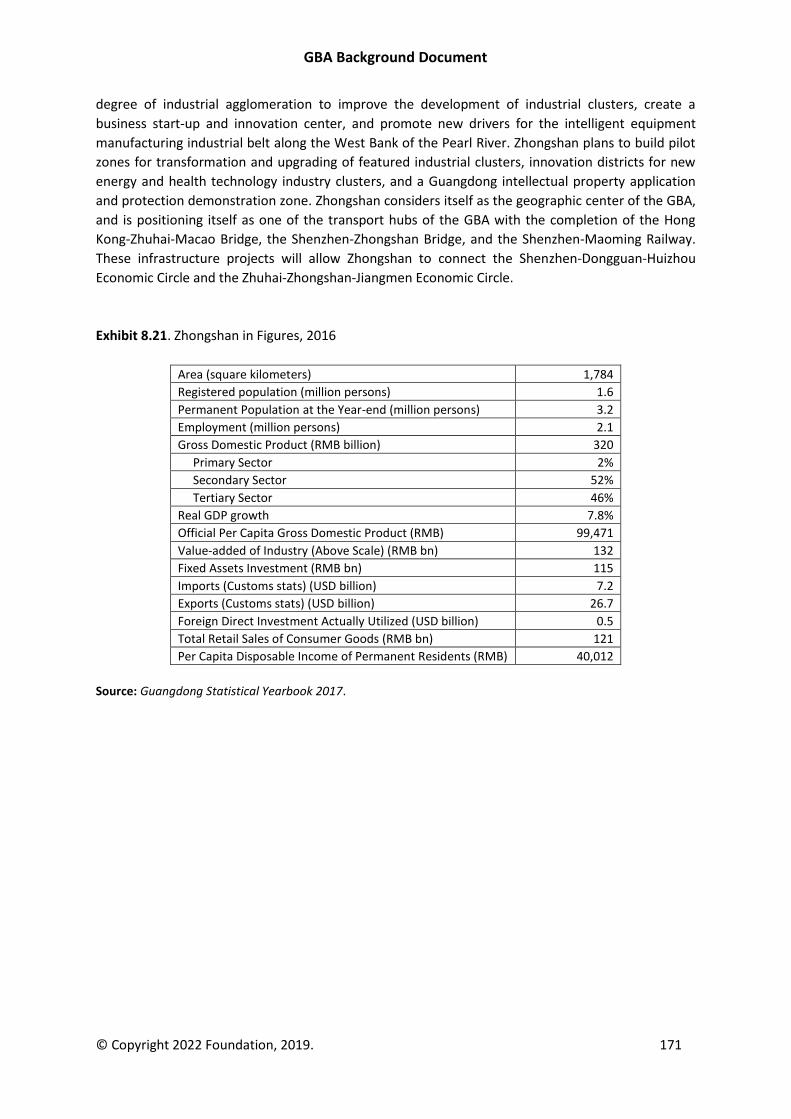
GBA Background Document
© Copyright 2022 Foundation, 2019. 171
degree of industrial agglomeration to improve the development of industrial clusters, create a
business start-up and innovation center, and promote new drivers for the intelligent equipment
manufacturing industrial belt along the West Bank of the Pearl River. Zhongshan plans to build pilot
zones for transformation and upgrading of featured industrial clusters, innovation districts for new
energy and health technology industry clusters, and a Guangdong intellectual property application
and protection demonstration zone. Zhongshan considers itself as the geographic center of the GBA,
and is positioning itself as one of the transport hubs of the GBA with the completion of the Hong
Kong-Zhuhai-Macao Bridge, the Shenzhen-Zhongshan Bridge, and the Shenzhen-Maoming Railway.
These infrastructure projects will allow Zhongshan to connect the Shenzhen-Dongguan-Huizhou
Economic Circle and the Zhuhai-Zhongshan-Jiangmen Economic Circle.
Exhibit 8.21. Zhongshan in Figures, 2016
Area (square kilometers) 1,784
Registered population (million persons) 1.6
Permanent Population at the Year-end (million persons) 3.2
Employment (million persons) 2.1
Gross Domestic Product (RMB billion) 320
Primary Sector 2%
Secondary Sector 52%
Tertiary Sector 46%
Real GDP growth 7.8%
Official Per Capita Gross Domestic Product (RMB) 99,471
Value-added of Industry (Above Scale) (RMB bn) 132
Fixed Assets Investment (RMB bn) 115
Imports (Customs stats) (USD billion) 7.2
Exports (Customs stats) (USD billion) 26.7
Foreign Direct Investment Actually Utilized (USD billion) 0.5
Total Retail Sales of Consumer Goods (RMB bn) 121
Per Capita Disposable Income of Permanent Residents (RMB) 40,012
Source: Guangdong Statistical Yearbook 2017.
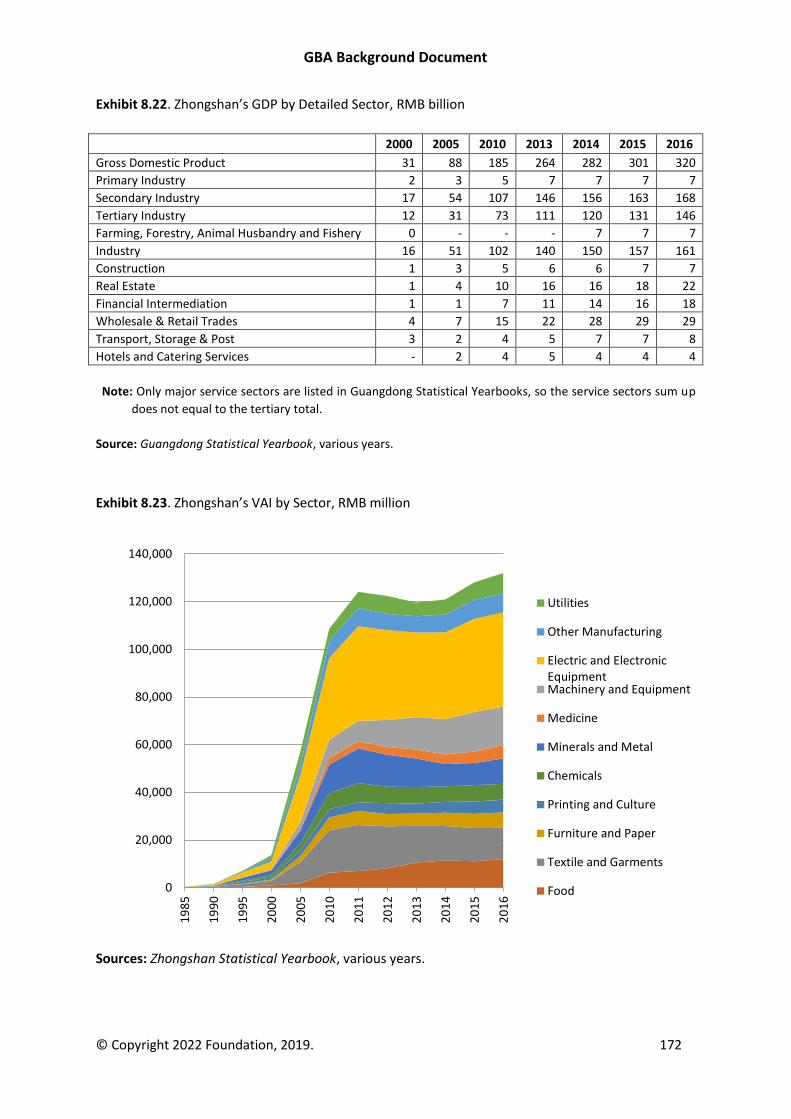
GBA Background Document
© Copyright 2022 Foundation, 2019. 172
Exhibit 8.22. Zhongshan’s GDP by Detailed Sector, RMB billion
2000 2005 2010 2013 2014 2015 2016
Gross Domestic Product 31 88 185 264 282 301 320
Primary Industry 2 3 5 7 7 7 7
Secondary Industry 17 54 107 146 156 163 168
Tertiary Industry 12 31 73 111 120 131 146
Farming, Forestry, Animal Husbandry and Fishery 0 - - - 7 7 7
Industry 16 51 102 140 150 157 161
Construction 1 3 5 6 6 7 7
Real Estate 1 4 10 16 16 18 22
Financial Intermediation 1 1 7 11 14 16 18
Wholesale & Retail Trades 4 7 15 22 28 29 29
Transport, Storage & Post 3 2 4 5 7 7 8
Hotels and Catering Services - 2 4 5 4 4 4
Note: Only major service sectors are listed in Guangdong Statistical Yearbooks, so the service sectors sum up
does not equal to the tertiary total.
Source: Guangdong Statistical Yearbook, various years.
Exhibit 8.23. Zhongshan’s VAI by Sector, RMB million
Sources: Zhongshan Statistical Yearbook, various years.
0
20,000
40,000
60,000
80,000
100,000
120,000
140,000
19
85
19
90
19
95
20
00
20
05
20
10
20
11
20
12
20
13
20
14
20
15
20
16
Utilities
Other Manufacturing
Electric and ElectronicEquipmentMachinery and Equipment
Medicine
Minerals and Metal
Chemicals
Printing and Culture
Furniture and Paper
Textile and Garments
Food
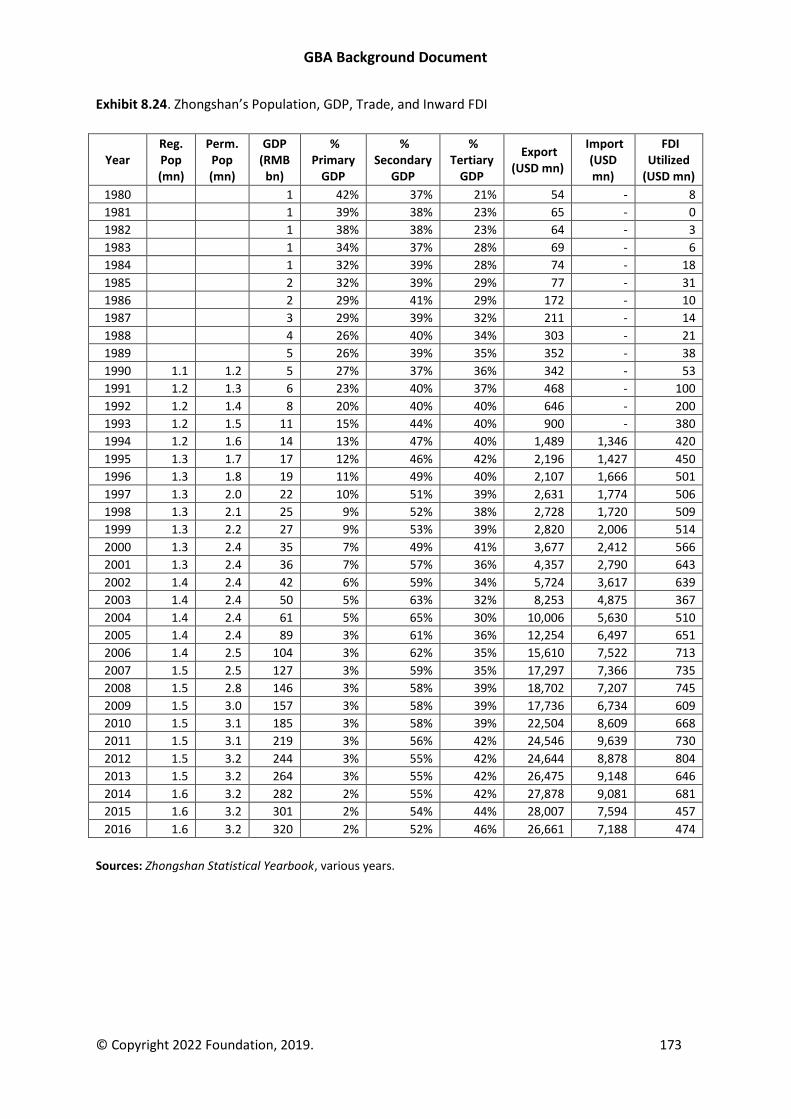
GBA Background Document
© Copyright 2022 Foundation, 2019. 173
Exhibit 8.24. Zhongshan’s Population, GDP, Trade, and Inward FDI
Year Reg. Pop (mn)
Perm. Pop (mn)
GDP (RMB
bn)
% Primary
GDP
% Secondary
GDP
% Tertiary
GDP
Export (USD mn)
Import (USD mn)
FDI Utilized
(USD mn)
1980 1 42% 37% 21% 54 - 8
1981 1 39% 38% 23% 65 - 0
1982 1 38% 38% 23% 64 - 3
1983 1 34% 37% 28% 69 - 6
1984 1 32% 39% 28% 74 - 18
1985 2 32% 39% 29% 77 - 31
1986 2 29% 41% 29% 172 - 10
1987 3 29% 39% 32% 211 - 14
1988 4 26% 40% 34% 303 - 21
1989 5 26% 39% 35% 352 - 38
1990 1.1 1.2 5 27% 37% 36% 342 - 53
1991 1.2 1.3 6 23% 40% 37% 468 - 100
1992 1.2 1.4 8 20% 40% 40% 646 - 200
1993 1.2 1.5 11 15% 44% 40% 900 - 380
1994 1.2 1.6 14 13% 47% 40% 1,489 1,346 420
1995 1.3 1.7 17 12% 46% 42% 2,196 1,427 450
1996 1.3 1.8 19 11% 49% 40% 2,107 1,666 501
1997 1.3 2.0 22 10% 51% 39% 2,631 1,774 506
1998 1.3 2.1 25 9% 52% 38% 2,728 1,720 509
1999 1.3 2.2 27 9% 53% 39% 2,820 2,006 514
2000 1.3 2.4 35 7% 49% 41% 3,677 2,412 566
2001 1.3 2.4 36 7% 57% 36% 4,357 2,790 643
2002 1.4 2.4 42 6% 59% 34% 5,724 3,617 639
2003 1.4 2.4 50 5% 63% 32% 8,253 4,875 367
2004 1.4 2.4 61 5% 65% 30% 10,006 5,630 510
2005 1.4 2.4 89 3% 61% 36% 12,254 6,497 651
2006 1.4 2.5 104 3% 62% 35% 15,610 7,522 713
2007 1.5 2.5 127 3% 59% 35% 17,297 7,366 735
2008 1.5 2.8 146 3% 58% 39% 18,702 7,207 745
2009 1.5 3.0 157 3% 58% 39% 17,736 6,734 609
2010 1.5 3.1 185 3% 58% 39% 22,504 8,609 668
2011 1.5 3.1 219 3% 56% 42% 24,546 9,639 730
2012 1.5 3.2 244 3% 55% 42% 24,644 8,878 804
2013 1.5 3.2 264 3% 55% 42% 26,475 9,148 646
2014 1.6 3.2 282 2% 55% 42% 27,878 9,081 681
2015 1.6 3.2 301 2% 54% 44% 28,007 7,594 457
2016 1.6 3.2 320 2% 52% 46% 26,661 7,188 474
Sources: Zhongshan Statistical Yearbook, various years.
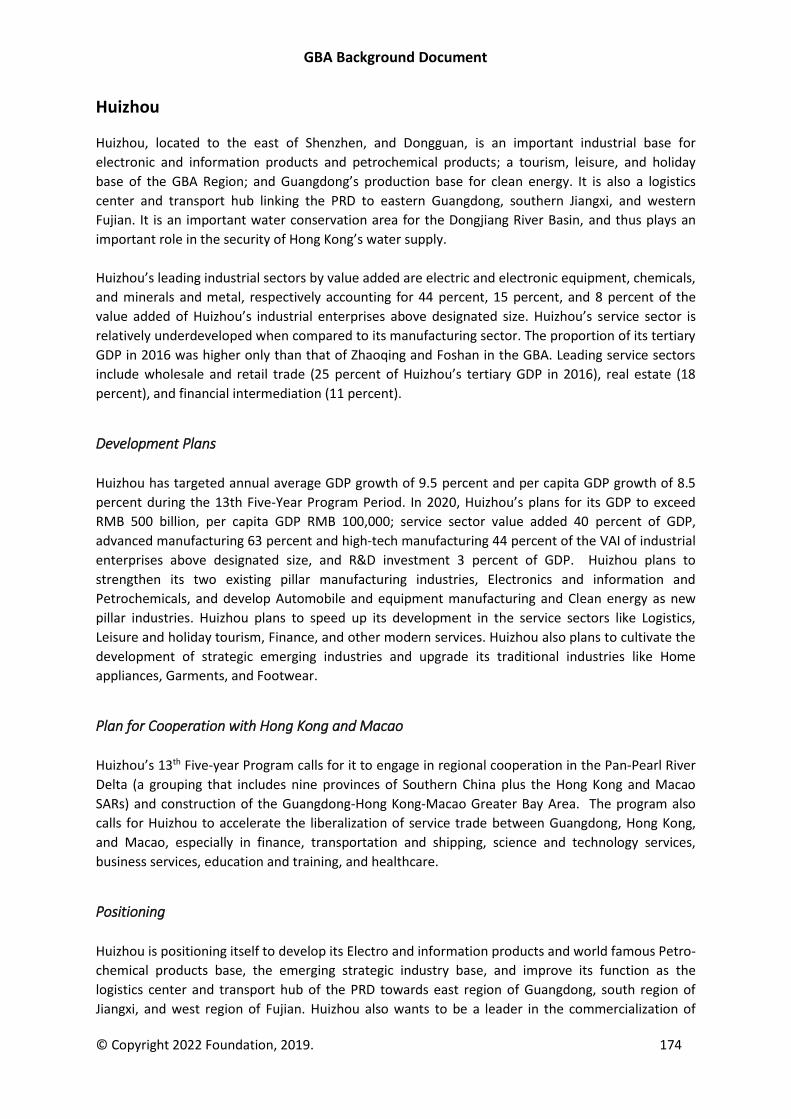
GBA Background Document
© Copyright 2022 Foundation, 2019. 174
Huizhou
Huizhou, located to the east of Shenzhen, and Dongguan, is an important industrial base for
electronic and information products and petrochemical products; a tourism, leisure, and holiday
base of the GBA Region; and Guangdong’s production base for clean energy. It is also a logistics
center and transport hub linking the PRD to eastern Guangdong, southern Jiangxi, and western
Fujian. It is an important water conservation area for the Dongjiang River Basin, and thus plays an
important role in the security of Hong Kong’s water supply.
Huizhou’s leading industrial sectors by value added are electric and electronic equipment, chemicals,
and minerals and metal, respectively accounting for 44 percent, 15 percent, and 8 percent of the
value added of Huizhou’s industrial enterprises above designated size. Huizhou’s service sector is
relatively underdeveloped when compared to its manufacturing sector. The proportion of its tertiary
GDP in 2016 was higher only than that of Zhaoqing and Foshan in the GBA. Leading service sectors
include wholesale and retail trade (25 percent of Huizhou’s tertiary GDP in 2016), real estate (18
percent), and financial intermediation (11 percent).
Development Plans
Huizhou has targeted annual average GDP growth of 9.5 percent and per capita GDP growth of 8.5
percent during the 13th Five-Year Program Period. In 2020, Huizhou’s plans for its GDP to exceed
RMB 500 billion, per capita GDP RMB 100,000; service sector value added 40 percent of GDP,
advanced manufacturing 63 percent and high-tech manufacturing 44 percent of the VAI of industrial
enterprises above designated size, and R&D investment 3 percent of GDP. Huizhou plans to
strengthen its two existing pillar manufacturing industries, Electronics and information and
Petrochemicals, and develop Automobile and equipment manufacturing and Clean energy as new
pillar industries. Huizhou plans to speed up its development in the service sectors like Logistics,
Leisure and holiday tourism, Finance, and other modern services. Huizhou also plans to cultivate the
development of strategic emerging industries and upgrade its traditional industries like Home
appliances, Garments, and Footwear.
Plan for Cooperation with Hong Kong and Macao
Huizhou’s 13th Five-year Program calls for it to engage in regional cooperation in the Pan-Pearl River
Delta (a grouping that includes nine provinces of Southern China plus the Hong Kong and Macao
SARs) and construction of the Guangdong-Hong Kong-Macao Greater Bay Area. The program also
calls for Huizhou to accelerate the liberalization of service trade between Guangdong, Hong Kong,
and Macao, especially in finance, transportation and shipping, science and technology services,
business services, education and training, and healthcare.
Positioning
Huizhou is positioning itself to develop its Electro and information products and world famous Petro-
chemical products base, the emerging strategic industry base, and improve its function as the
logistics center and transport hub of the PRD towards east region of Guangdong, south region of
Jiangxi, and west region of Fujian. Huizhou also wants to be a leader in the commercialization of
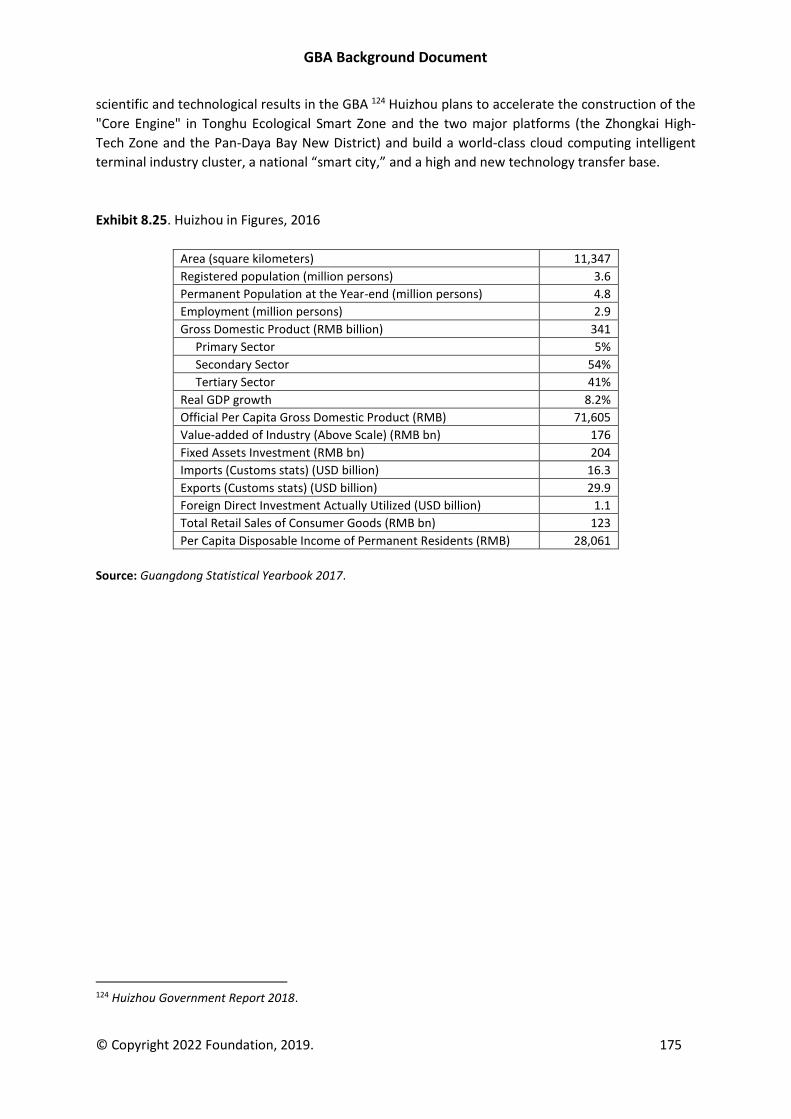
GBA Background Document
© Copyright 2022 Foundation, 2019. 175
scientific and technological results in the GBA 124 Huizhou plans to accelerate the construction of the
"Core Engine" in Tonghu Ecological Smart Zone and the two major platforms (the Zhongkai High-
Tech Zone and the Pan-Daya Bay New District) and build a world-class cloud computing intelligent
terminal industry cluster, a national “smart city,” and a high and new technology transfer base.
Exhibit 8.25. Huizhou in Figures, 2016
Area (square kilometers) 11,347
Registered population (million persons) 3.6
Permanent Population at the Year-end (million persons) 4.8
Employment (million persons) 2.9
Gross Domestic Product (RMB billion) 341
Primary Sector 5%
Secondary Sector 54%
Tertiary Sector 41%
Real GDP growth 8.2%
Official Per Capita Gross Domestic Product (RMB) 71,605
Value-added of Industry (Above Scale) (RMB bn) 176
Fixed Assets Investment (RMB bn) 204
Imports (Customs stats) (USD billion) 16.3
Exports (Customs stats) (USD billion) 29.9
Foreign Direct Investment Actually Utilized (USD billion) 1.1
Total Retail Sales of Consumer Goods (RMB bn) 123
Per Capita Disposable Income of Permanent Residents (RMB) 28,061
Source: Guangdong Statistical Yearbook 2017.
124 Huizhou Government Report 2018.
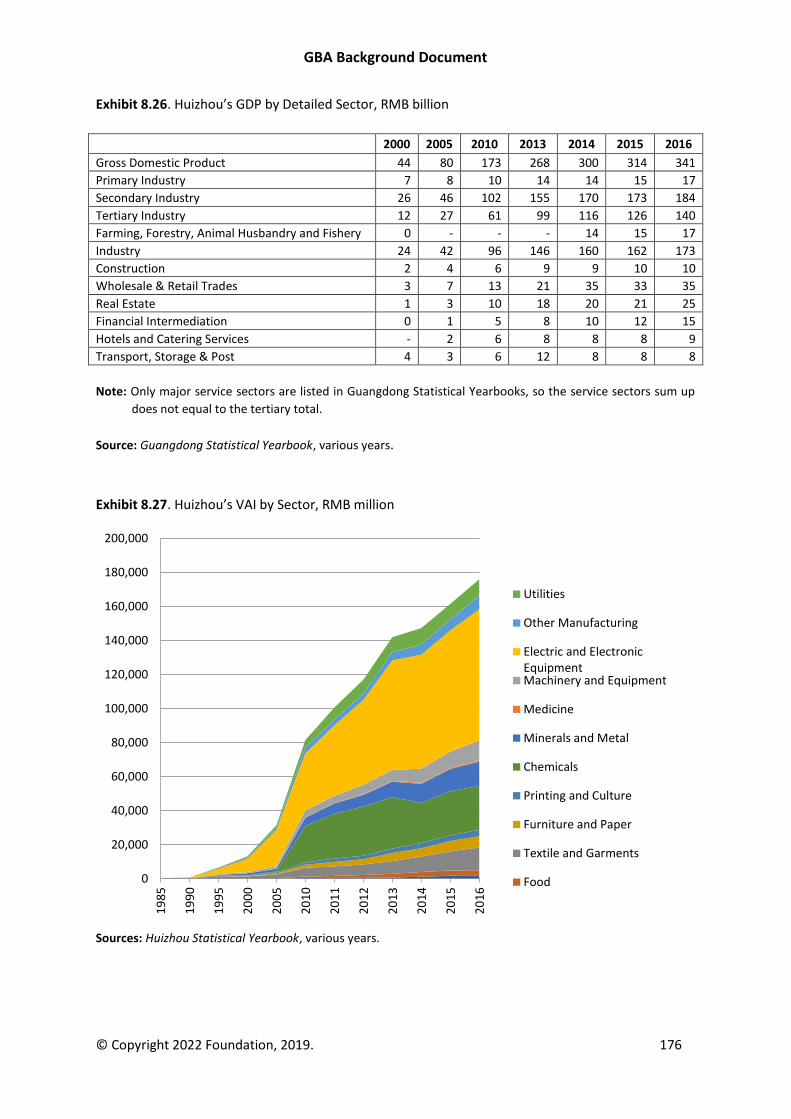
GBA Background Document
© Copyright 2022 Foundation, 2019. 176
Exhibit 8.26. Huizhou’s GDP by Detailed Sector, RMB billion
2000 2005 2010 2013 2014 2015 2016
Gross Domestic Product 44 80 173 268 300 314 341
Primary Industry 7 8 10 14 14 15 17
Secondary Industry 26 46 102 155 170 173 184
Tertiary Industry 12 27 61 99 116 126 140
Farming, Forestry, Animal Husbandry and Fishery 0 - - - 14 15 17
Industry 24 42 96 146 160 162 173
Construction 2 4 6 9 9 10 10
Wholesale & Retail Trades 3 7 13 21 35 33 35
Real Estate 1 3 10 18 20 21 25
Financial Intermediation 0 1 5 8 10 12 15
Hotels and Catering Services - 2 6 8 8 8 9
Transport, Storage & Post 4 3 6 12 8 8 8
Note: Only major service sectors are listed in Guangdong Statistical Yearbooks, so the service sectors sum up
does not equal to the tertiary total.
Source: Guangdong Statistical Yearbook, various years.
Exhibit 8.27. Huizhou’s VAI by Sector, RMB million
Sources: Huizhou Statistical Yearbook, various years.
0
20,000
40,000
60,000
80,000
100,000
120,000
140,000
160,000
180,000
200,000
19
85
19
90
19
95
20
00
20
05
20
10
20
11
20
12
20
13
20
14
20
15
20
16
Utilities
Other Manufacturing
Electric and ElectronicEquipmentMachinery and Equipment
Medicine
Minerals and Metal
Chemicals
Printing and Culture
Furniture and Paper
Textile and Garments
Food
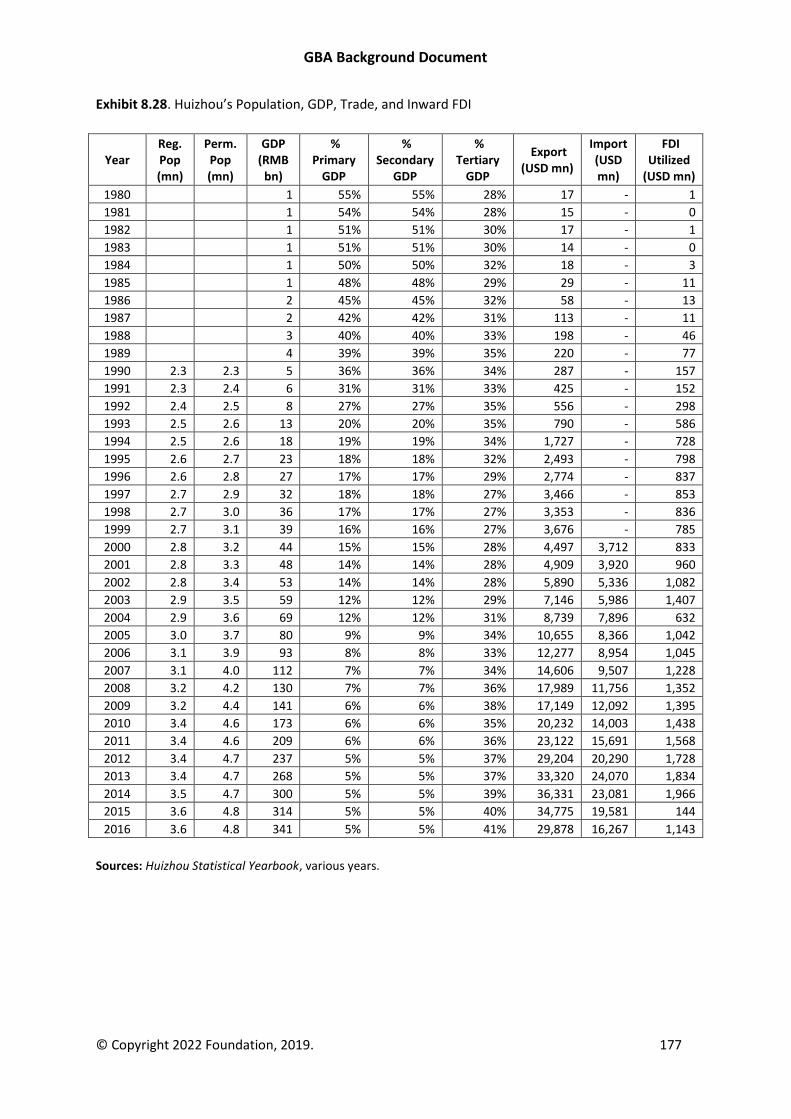
GBA Background Document
© Copyright 2022 Foundation, 2019. 177
Exhibit 8.28. Huizhou’s Population, GDP, Trade, and Inward FDI
Year Reg. Pop (mn)
Perm. Pop (mn)
GDP (RMB
bn)
% Primary
GDP
% Secondary
GDP
% Tertiary
GDP
Export (USD mn)
Import (USD mn)
FDI Utilized
(USD mn)
1980 1 55% 55% 28% 17 - 1
1981 1 54% 54% 28% 15 - 0
1982 1 51% 51% 30% 17 - 1
1983 1 51% 51% 30% 14 - 0
1984 1 50% 50% 32% 18 - 3
1985 1 48% 48% 29% 29 - 11
1986 2 45% 45% 32% 58 - 13
1987 2 42% 42% 31% 113 - 11
1988 3 40% 40% 33% 198 - 46
1989 4 39% 39% 35% 220 - 77
1990 2.3 2.3 5 36% 36% 34% 287 - 157
1991 2.3 2.4 6 31% 31% 33% 425 - 152
1992 2.4 2.5 8 27% 27% 35% 556 - 298
1993 2.5 2.6 13 20% 20% 35% 790 - 586
1994 2.5 2.6 18 19% 19% 34% 1,727 - 728
1995 2.6 2.7 23 18% 18% 32% 2,493 - 798
1996 2.6 2.8 27 17% 17% 29% 2,774 - 837
1997 2.7 2.9 32 18% 18% 27% 3,466 - 853
1998 2.7 3.0 36 17% 17% 27% 3,353 - 836
1999 2.7 3.1 39 16% 16% 27% 3,676 - 785
2000 2.8 3.2 44 15% 15% 28% 4,497 3,712 833
2001 2.8 3.3 48 14% 14% 28% 4,909 3,920 960
2002 2.8 3.4 53 14% 14% 28% 5,890 5,336 1,082
2003 2.9 3.5 59 12% 12% 29% 7,146 5,986 1,407
2004 2.9 3.6 69 12% 12% 31% 8,739 7,896 632
2005 3.0 3.7 80 9% 9% 34% 10,655 8,366 1,042
2006 3.1 3.9 93 8% 8% 33% 12,277 8,954 1,045
2007 3.1 4.0 112 7% 7% 34% 14,606 9,507 1,228
2008 3.2 4.2 130 7% 7% 36% 17,989 11,756 1,352
2009 3.2 4.4 141 6% 6% 38% 17,149 12,092 1,395
2010 3.4 4.6 173 6% 6% 35% 20,232 14,003 1,438
2011 3.4 4.6 209 6% 6% 36% 23,122 15,691 1,568
2012 3.4 4.7 237 5% 5% 37% 29,204 20,290 1,728
2013 3.4 4.7 268 5% 5% 37% 33,320 24,070 1,834
2014 3.5 4.7 300 5% 5% 39% 36,331 23,081 1,966
2015 3.6 4.8 314 5% 5% 40% 34,775 19,581 144
2016 3.6 4.8 341 5% 5% 41% 29,878 16,267 1,143
Sources: Huizhou Statistical Yearbook, various years.
GBA Background Document
© Copyright 2022 Foundation, 2019. 178
Jiangmen
Located to the west of Zhongshan and Zhuhai in the Pearl River Delta region, Jiangmen covers nearly
one-sixth of the land area of the GBA. Jiangmen was a center for international commerce in the early
1900s and has developed a manufacturing base that serves both local and international markets. As
costs have risen in other parts of the PRD, some companies have found Jiangmen to be an attractive
alternative. Jiangmen is expected to be a major beneficiary of the expansion of the road and rail
networks planned for the GBA.
Jiangmen’s leading industrial sectors by value added are minerals and metal products, electric and
electronic equipment, chemicals, and machinery and equipment, respectively accounting for 19
percent, 15 percent, 15 percent, and 12 percent of value added of Jiangmen’s industrial enterprises
above designated size. Textile and garments, furniture and paper, and food products are also
important to Jiangmen. In 2016, Jiangmen’s largest service sector was wholesale and retail trade (18
percent of Jiangmen’s tertiary GDP); followed by real estate (14 percent); financial intermediation
(12 percent); and transport, storage and post (9 percent).
Development Plans
Jiangmen has targeted annual average GDP growth of 9 percent and per capita GDP growth of 8.5
percent during the 13th Five-Year Program Period. By 2020, Jiangmen plans to have GDP and per
capita GDP double those of 2010; service sector value added of over 46 percent of GDP, high-tech
manufacturing 10 percent of industrial value added, and R&D investment 3 percent of GDP.
Jiangmen also plans to promote the agglomeration of the Rail transit, Heavy truck and commercial
vehicle, New materials and new energy and equipment, Educational equipment, and Healthy food
industries. It plans to upgrade its traditional manufacturing industries and develop Commerce and
trade, Logistics, Tourism, Agriculture, and Ocean economy industries.
Plan for Cooperation with Hong Kong and Macao
Jiangmen’s 13th Five-year Program calls for the city to connect to the major channels and routes to
Hong Kong and Macao, especially via the Hong Kong-Zhuhai-Macao Bridge, and strengthen
cooperation and links among the seaports and airports in the three places. Jiangmen will support the
building of the provincial demonstration base of the liberalization in service trade between
Guangdong, Hong Kong, and Macao and the Demonstration Park of Guangdong-Hong Kong-Macao
Cooperation in the Upgrading of Electroplating Industry. It plans to deepen cooperation with Hong
Kong and Macao in healthcare, education, and elderly services and to encourage Hong Kong and
Macao service providers to set up private social service institutions in Jiangmen. In the tourism
sector, the three places will promote the construction of the "Jiangmen Diaolou-Macao Historic City"
heritage tourism route, facilitate the entry and exit of yachts, and build a special cultural tourism
zone. It plans to attract innovation talent and resources of Hong Kong and Macao to help build
exchange and cooperation platforms and business start-up and innovation bases.
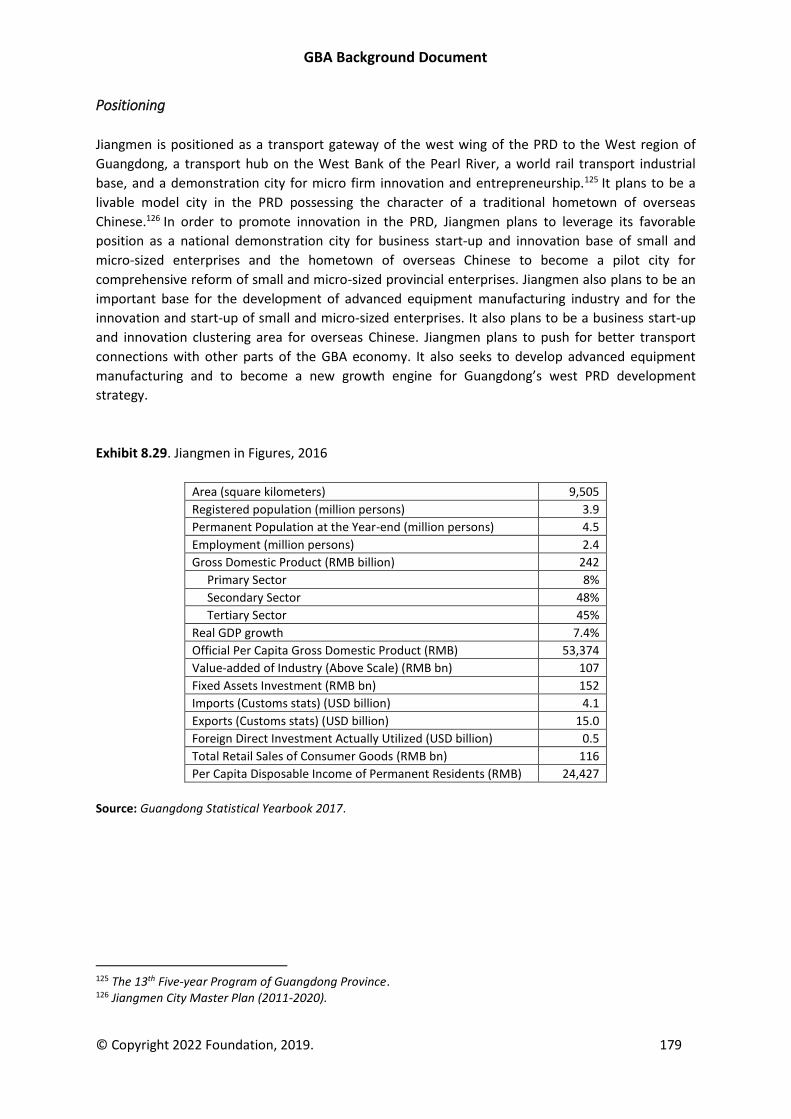
GBA Background Document
© Copyright 2022 Foundation, 2019. 179
Positioning
Jiangmen is positioned as a transport gateway of the west wing of the PRD to the West region of
Guangdong, a transport hub on the West Bank of the Pearl River, a world rail transport industrial
base, and a demonstration city for micro firm innovation and entrepreneurship.125 It plans to be a
livable model city in the PRD possessing the character of a traditional hometown of overseas
Chinese.126 In order to promote innovation in the PRD, Jiangmen plans to leverage its favorable
position as a national demonstration city for business start-up and innovation base of small and
micro-sized enterprises and the hometown of overseas Chinese to become a pilot city for
comprehensive reform of small and micro-sized provincial enterprises. Jiangmen also plans to be an
important base for the development of advanced equipment manufacturing industry and for the
innovation and start-up of small and micro-sized enterprises. It also plans to be a business start-up
and innovation clustering area for overseas Chinese. Jiangmen plans to push for better transport
connections with other parts of the GBA economy. It also seeks to develop advanced equipment
manufacturing and to become a new growth engine for Guangdong’s west PRD development
strategy.
Exhibit 8.29. Jiangmen in Figures, 2016
Area (square kilometers) 9,505
Registered population (million persons) 3.9
Permanent Population at the Year-end (million persons) 4.5
Employment (million persons) 2.4
Gross Domestic Product (RMB billion) 242
Primary Sector 8%
Secondary Sector 48%
Tertiary Sector 45%
Real GDP growth 7.4%
Official Per Capita Gross Domestic Product (RMB) 53,374
Value-added of Industry (Above Scale) (RMB bn) 107
Fixed Assets Investment (RMB bn) 152
Imports (Customs stats) (USD billion) 4.1
Exports (Customs stats) (USD billion) 15.0
Foreign Direct Investment Actually Utilized (USD billion) 0.5
Total Retail Sales of Consumer Goods (RMB bn) 116
Per Capita Disposable Income of Permanent Residents (RMB) 24,427
Source: Guangdong Statistical Yearbook 2017.
125 The 13th Five-year Program of Guangdong Province. 126 Jiangmen City Master Plan (2011-2020).
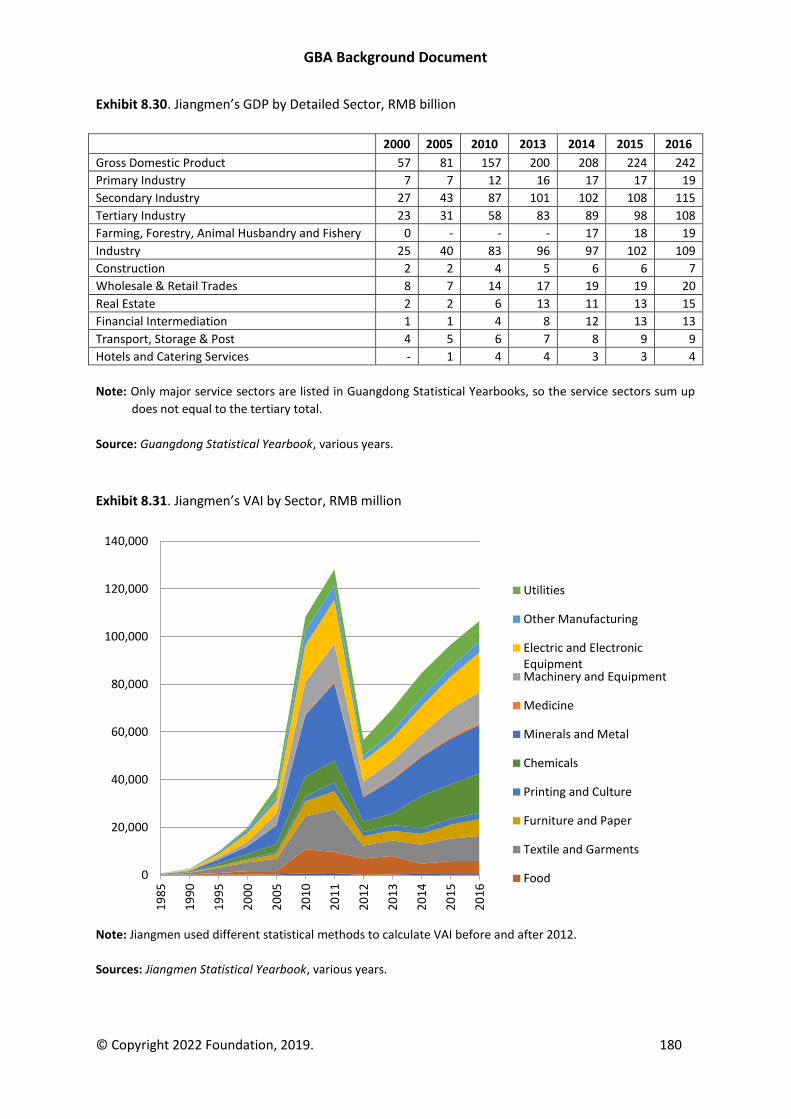
GBA Background Document
© Copyright 2022 Foundation, 2019. 180
Exhibit 8.30. Jiangmen’s GDP by Detailed Sector, RMB billion
2000 2005 2010 2013 2014 2015 2016
Gross Domestic Product 57 81 157 200 208 224 242
Primary Industry 7 7 12 16 17 17 19
Secondary Industry 27 43 87 101 102 108 115
Tertiary Industry 23 31 58 83 89 98 108
Farming, Forestry, Animal Husbandry and Fishery 0 - - - 17 18 19
Industry 25 40 83 96 97 102 109
Construction 2 2 4 5 6 6 7
Wholesale & Retail Trades 8 7 14 17 19 19 20
Real Estate 2 2 6 13 11 13 15
Financial Intermediation 1 1 4 8 12 13 13
Transport, Storage & Post 4 5 6 7 8 9 9
Hotels and Catering Services - 1 4 4 3 3 4
Note: Only major service sectors are listed in Guangdong Statistical Yearbooks, so the service sectors sum up
does not equal to the tertiary total.
Source: Guangdong Statistical Yearbook, various years.
Exhibit 8.31. Jiangmen’s VAI by Sector, RMB million
Note: Jiangmen used different statistical methods to calculate VAI before and after 2012.
Sources: Jiangmen Statistical Yearbook, various years.
0
20,000
40,000
60,000
80,000
100,000
120,000
140,000
19
85
19
90
19
95
20
00
20
05
20
10
20
11
20
12
20
13
20
14
20
15
20
16
Utilities
Other Manufacturing
Electric and ElectronicEquipmentMachinery and Equipment
Medicine
Minerals and Metal
Chemicals
Printing and Culture
Furniture and Paper
Textile and Garments
Food
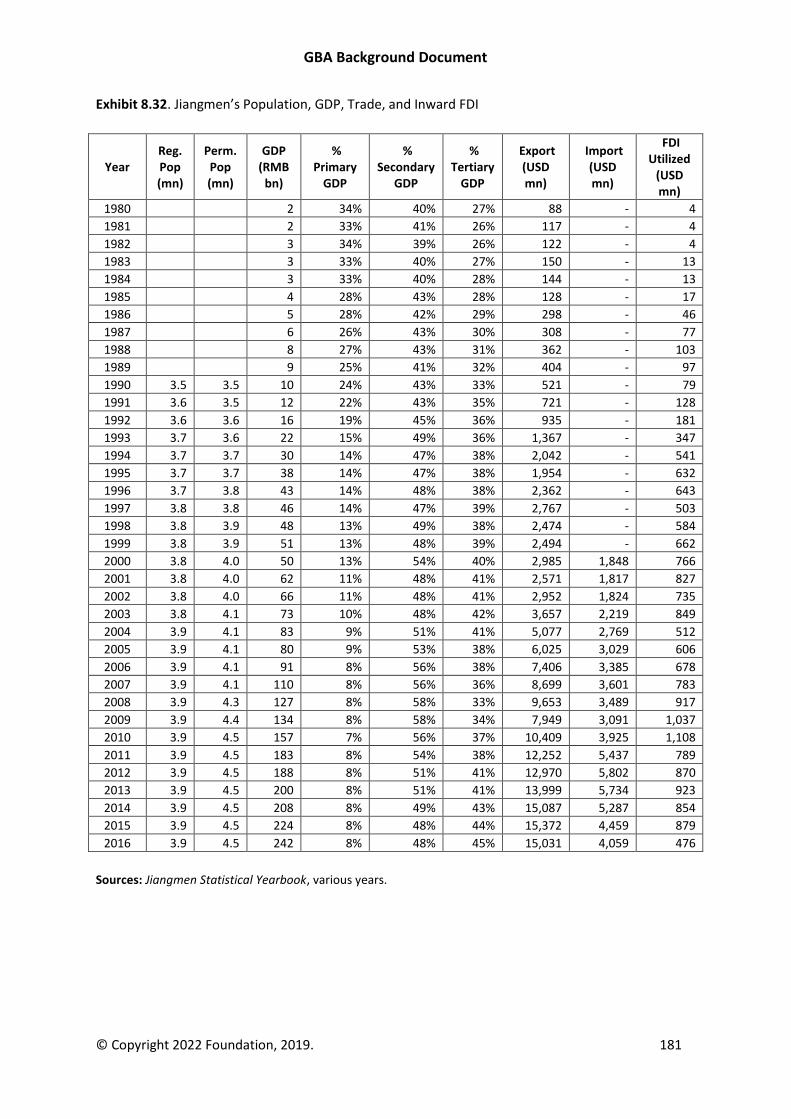
GBA Background Document
© Copyright 2022 Foundation, 2019. 181
Exhibit 8.32. Jiangmen’s Population, GDP, Trade, and Inward FDI
Year Reg. Pop (mn)
Perm. Pop (mn)
GDP (RMB
bn)
% Primary
GDP
% Secondary
GDP
% Tertiary
GDP
Export (USD mn)
Import (USD mn)
FDI Utilized
(USD mn)
1980 2 34% 40% 27% 88 - 4
1981 2 33% 41% 26% 117 - 4
1982 3 34% 39% 26% 122 - 4
1983 3 33% 40% 27% 150 - 13
1984 3 33% 40% 28% 144 - 13
1985 4 28% 43% 28% 128 - 17
1986 5 28% 42% 29% 298 - 46
1987 6 26% 43% 30% 308 - 77
1988 8 27% 43% 31% 362 - 103
1989 9 25% 41% 32% 404 - 97
1990 3.5 3.5 10 24% 43% 33% 521 - 79
1991 3.6 3.5 12 22% 43% 35% 721 - 128
1992 3.6 3.6 16 19% 45% 36% 935 - 181
1993 3.7 3.6 22 15% 49% 36% 1,367 - 347
1994 3.7 3.7 30 14% 47% 38% 2,042 - 541
1995 3.7 3.7 38 14% 47% 38% 1,954 - 632
1996 3.7 3.8 43 14% 48% 38% 2,362 - 643
1997 3.8 3.8 46 14% 47% 39% 2,767 - 503
1998 3.8 3.9 48 13% 49% 38% 2,474 - 584
1999 3.8 3.9 51 13% 48% 39% 2,494 - 662
2000 3.8 4.0 50 13% 54% 40% 2,985 1,848 766
2001 3.8 4.0 62 11% 48% 41% 2,571 1,817 827
2002 3.8 4.0 66 11% 48% 41% 2,952 1,824 735
2003 3.8 4.1 73 10% 48% 42% 3,657 2,219 849
2004 3.9 4.1 83 9% 51% 41% 5,077 2,769 512
2005 3.9 4.1 80 9% 53% 38% 6,025 3,029 606
2006 3.9 4.1 91 8% 56% 38% 7,406 3,385 678
2007 3.9 4.1 110 8% 56% 36% 8,699 3,601 783
2008 3.9 4.3 127 8% 58% 33% 9,653 3,489 917
2009 3.9 4.4 134 8% 58% 34% 7,949 3,091 1,037
2010 3.9 4.5 157 7% 56% 37% 10,409 3,925 1,108
2011 3.9 4.5 183 8% 54% 38% 12,252 5,437 789
2012 3.9 4.5 188 8% 51% 41% 12,970 5,802 870
2013 3.9 4.5 200 8% 51% 41% 13,999 5,734 923
2014 3.9 4.5 208 8% 49% 43% 15,087 5,287 854
2015 3.9 4.5 224 8% 48% 44% 15,372 4,459 879
2016 3.9 4.5 242 8% 48% 45% 15,031 4,059 476
Sources: Jiangmen Statistical Yearbook, various years.
GBA Background Document
© Copyright 2022 Foundation, 2019. 182
Zhaoqing
Zhaoqing is located in the mountains about 100 km west of Guangzhou. It is a historical, cultural,
and tourism city of China. It is a key corridor between the PRD and the Southwest China and a
regional logistics center for the western part of Guangdong and eastern part of Guangxi. It is
Guangdong’s commodity grain, agricultural product, and agricultural byproduct processing and
manufacturing base.
Improved highway and railway connections have made it possible for Zhaoqing to pursue urban
growth and industrialization. In particular, Zhaoqing is integrating economically with Guangzhou and
Foshan. Through the Guangzhou-Foshan-Zhaoqing Economic Circle, cooperation has been
strengthened in fields such as transportation, industry, and tourism. Since 2008, when the
Guangdong Government decided to relocate labor and resource-intensive industries out of the
central Pearl River Delta region, Zhaoqing has established industrial transfer parks and accepted
industrial transfer especially from Guangzhou and Foshan. In addition, the area’s limestone
mountains, hot springs, and golf courses provide a strong base for tourism and related services.
Zhaoqing’s agricultural sector still accounted for 15 percent of GDP in 2016. Zhaoqing’s leading
industries by value added include minerals and metals, chemicals, electric and electronic equipment,
textile and garments, and furniture and paper. Zhaoqing also has an active gold mining industry, and
holds over 80 percent of Guangdong’s gold reserves, with the Zhaoqing Hetai Gold mine having one
of the highest outputs in China.
Wholesale and retail trade topped Zhaoqing’s service sector in 2016, followed by transport, storage,
and post, real estate, financial intermediate, and hotels and catering services.
Development Plans
Zhaoqing aims to achieve annual average GDP growth of 9 percent and a per capita GDP growth of 8
percent during the 13th Five-Year Program Period. By 2020, Zhaoqing hopes to have its GDP reach
RMB 300 billion, per capita GDP exceed RMB 71,500, service sector value added 38 percent of GDP,
advanced manufacturing 37 percent and high-tech manufacturing 11 percent of the VAI of industrial
enterprises above designated size, and R&D investment 3 percent of GDP.
In manufacturing, Zhaoqing plans to focus on New energy vehicles, Automobile and parts, Smart
equipment manufacturing, Transformer and other power transmission equipment, High-end new
electronic information products, New materials, Biomedicine, and energy conservation and
environmental protection products. Zhaoqing plans to continue to develop its producer services and
consumer services and cultivate its Health and recreation and Sports industries and to explore
emerging industries like E-commerce, IOT, Big data, Cultural creativity, and Internet finance.
Plan for Cooperation with Hong Kong and Macao
Zhaoqing’s 13th Five-year Program calls for it to strengthen cooperation with Hong Kong and Macao
in finance, trade, tourism, and education; attract service-oriented enterprises of Hong Kong and
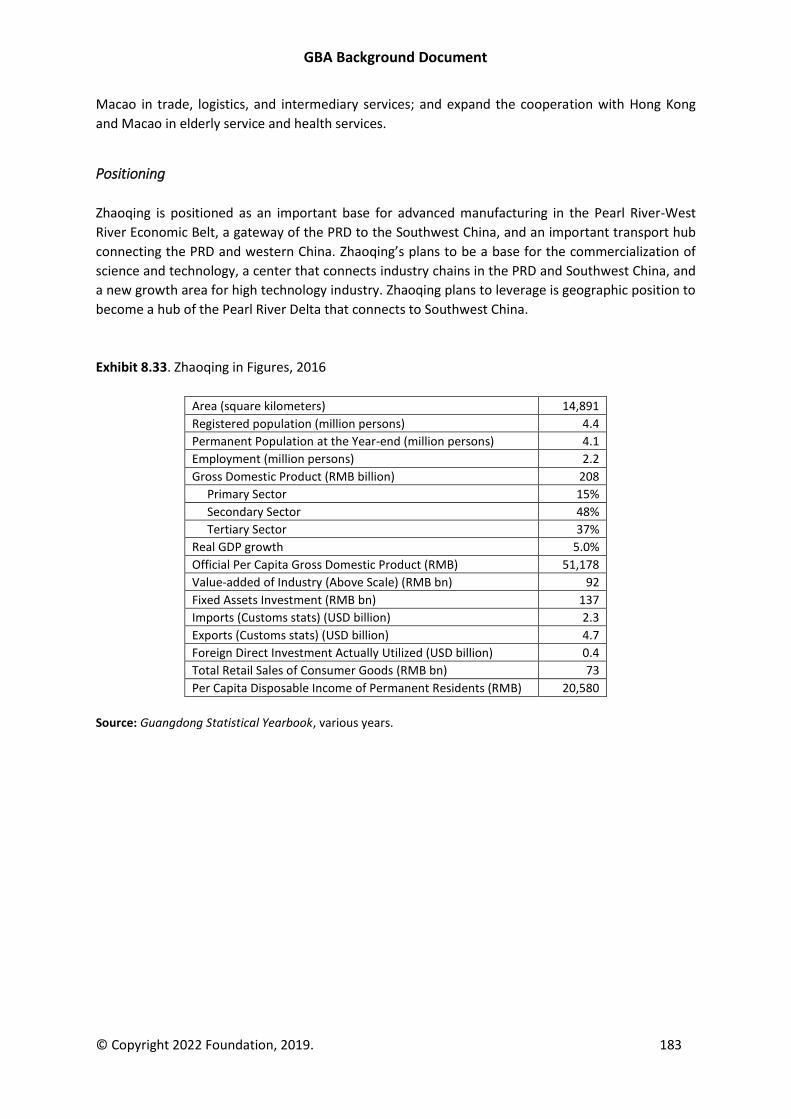
GBA Background Document
© Copyright 2022 Foundation, 2019. 183
Macao in trade, logistics, and intermediary services; and expand the cooperation with Hong Kong
and Macao in elderly service and health services.
Positioning
Zhaoqing is positioned as an important base for advanced manufacturing in the Pearl River-West
River Economic Belt, a gateway of the PRD to the Southwest China, and an important transport hub
connecting the PRD and western China. Zhaoqing’s plans to be a base for the commercialization of
science and technology, a center that connects industry chains in the PRD and Southwest China, and
a new growth area for high technology industry. Zhaoqing plans to leverage is geographic position to
become a hub of the Pearl River Delta that connects to Southwest China.
Exhibit 8.33. Zhaoqing in Figures, 2016
Area (square kilometers) 14,891
Registered population (million persons) 4.4
Permanent Population at the Year-end (million persons) 4.1
Employment (million persons) 2.2
Gross Domestic Product (RMB billion) 208
Primary Sector 15%
Secondary Sector 48%
Tertiary Sector 37%
Real GDP growth 5.0%
Official Per Capita Gross Domestic Product (RMB) 51,178
Value-added of Industry (Above Scale) (RMB bn) 92
Fixed Assets Investment (RMB bn) 137
Imports (Customs stats) (USD billion) 2.3
Exports (Customs stats) (USD billion) 4.7
Foreign Direct Investment Actually Utilized (USD billion) 0.4
Total Retail Sales of Consumer Goods (RMB bn) 73
Per Capita Disposable Income of Permanent Residents (RMB) 20,580
Source: Guangdong Statistical Yearbook, various years.
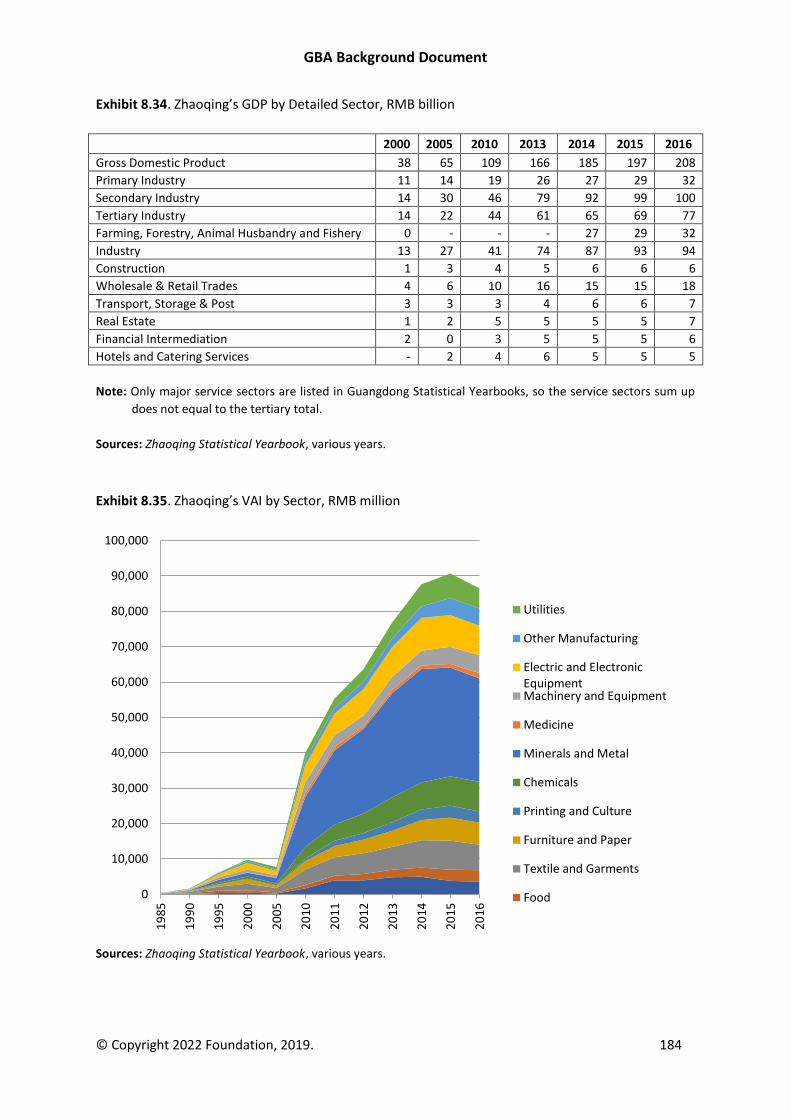
GBA Background Document
© Copyright 2022 Foundation, 2019. 184
Exhibit 8.34. Zhaoqing’s GDP by Detailed Sector, RMB billion
2000 2005 2010 2013 2014 2015 2016
Gross Domestic Product 38 65 109 166 185 197 208
Primary Industry 11 14 19 26 27 29 32
Secondary Industry 14 30 46 79 92 99 100
Tertiary Industry 14 22 44 61 65 69 77
Farming, Forestry, Animal Husbandry and Fishery 0 - - - 27 29 32
Industry 13 27 41 74 87 93 94
Construction 1 3 4 5 6 6 6
Wholesale & Retail Trades 4 6 10 16 15 15 18
Transport, Storage & Post 3 3 3 4 6 6 7
Real Estate 1 2 5 5 5 5 7
Financial Intermediation 2 0 3 5 5 5 6
Hotels and Catering Services - 2 4 6 5 5 5
Note: Only major service sectors are listed in Guangdong Statistical Yearbooks, so the service sectors sum up
does not equal to the tertiary total.
Sources: Zhaoqing Statistical Yearbook, various years.
Exhibit 8.35. Zhaoqing’s VAI by Sector, RMB million
Sources: Zhaoqing Statistical Yearbook, various years.
0
10,000
20,000
30,000
40,000
50,000
60,000
70,000
80,000
90,000
100,000
19
85
19
90
19
95
20
00
20
05
20
10
20
11
20
12
20
13
20
14
20
15
20
16
Utilities
Other Manufacturing
Electric and ElectronicEquipmentMachinery and Equipment
Medicine
Minerals and Metal
Chemicals
Printing and Culture
Furniture and Paper
Textile and Garments
Food
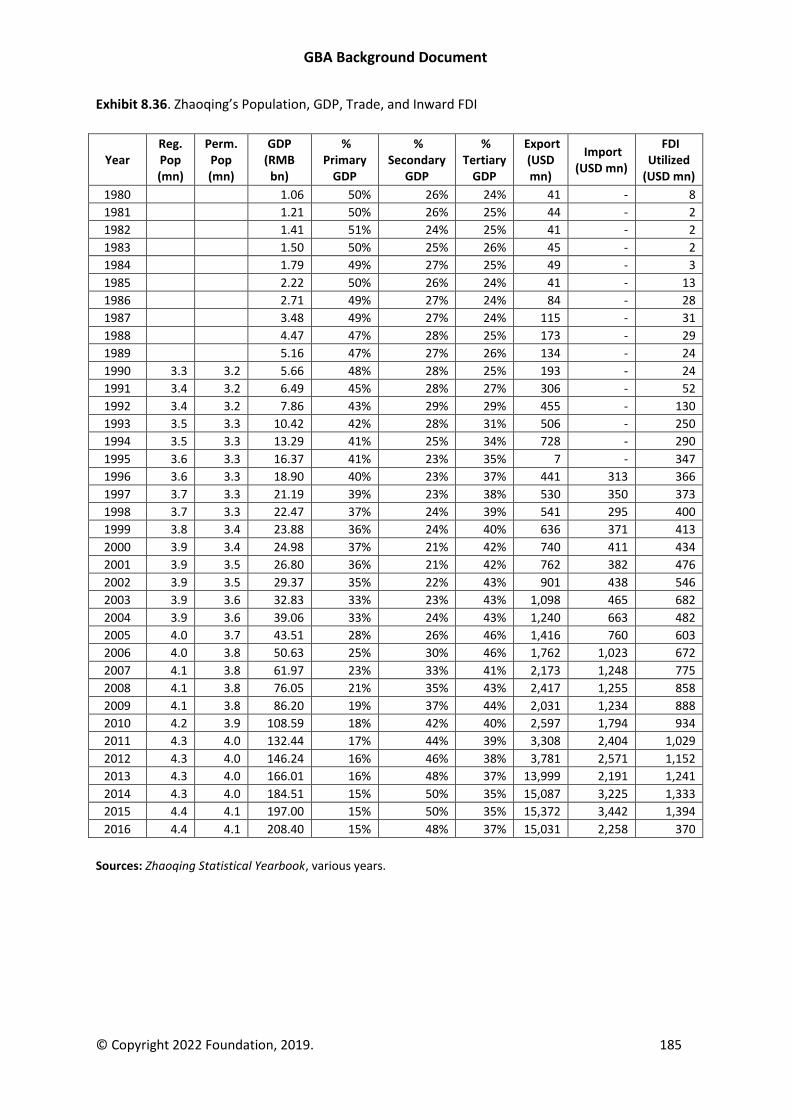
GBA Background Document
© Copyright 2022 Foundation, 2019. 185
Exhibit 8.36. Zhaoqing’s Population, GDP, Trade, and Inward FDI
Year Reg. Pop (mn)
Perm. Pop (mn)
GDP (RMB
bn)
% Primary
GDP
% Secondary
GDP
% Tertiary
GDP
Export (USD mn)
Import (USD mn)
FDI Utilized
(USD mn)
1980 1.06 50% 26% 24% 41 - 8
1981 1.21 50% 26% 25% 44 - 2
1982 1.41 51% 24% 25% 41 - 2
1983 1.50 50% 25% 26% 45 - 2
1984 1.79 49% 27% 25% 49 - 3
1985 2.22 50% 26% 24% 41 - 13
1986 2.71 49% 27% 24% 84 - 28
1987 3.48 49% 27% 24% 115 - 31
1988 4.47 47% 28% 25% 173 - 29
1989 5.16 47% 27% 26% 134 - 24
1990 3.3 3.2 5.66 48% 28% 25% 193 - 24
1991 3.4 3.2 6.49 45% 28% 27% 306 - 52
1992 3.4 3.2 7.86 43% 29% 29% 455 - 130
1993 3.5 3.3 10.42 42% 28% 31% 506 - 250
1994 3.5 3.3 13.29 41% 25% 34% 728 - 290
1995 3.6 3.3 16.37 41% 23% 35% 7 - 347
1996 3.6 3.3 18.90 40% 23% 37% 441 313 366
1997 3.7 3.3 21.19 39% 23% 38% 530 350 373
1998 3.7 3.3 22.47 37% 24% 39% 541 295 400
1999 3.8 3.4 23.88 36% 24% 40% 636 371 413
2000 3.9 3.4 24.98 37% 21% 42% 740 411 434
2001 3.9 3.5 26.80 36% 21% 42% 762 382 476
2002 3.9 3.5 29.37 35% 22% 43% 901 438 546
2003 3.9 3.6 32.83 33% 23% 43% 1,098 465 682
2004 3.9 3.6 39.06 33% 24% 43% 1,240 663 482
2005 4.0 3.7 43.51 28% 26% 46% 1,416 760 603
2006 4.0 3.8 50.63 25% 30% 46% 1,762 1,023 672
2007 4.1 3.8 61.97 23% 33% 41% 2,173 1,248 775
2008 4.1 3.8 76.05 21% 35% 43% 2,417 1,255 858
2009 4.1 3.8 86.20 19% 37% 44% 2,031 1,234 888
2010 4.2 3.9 108.59 18% 42% 40% 2,597 1,794 934
2011 4.3 4.0 132.44 17% 44% 39% 3,308 2,404 1,029
2012 4.3 4.0 146.24 16% 46% 38% 3,781 2,571 1,152
2013 4.3 4.0 166.01 16% 48% 37% 13,999 2,191 1,241
2014 4.3 4.0 184.51 15% 50% 35% 15,087 3,225 1,333
2015 4.4 4.1 197.00 15% 50% 35% 15,372 3,442 1,394
2016 4.4 4.1 208.40 15% 48% 37% 15,031 2,258 370
Sources: Zhaoqing Statistical Yearbook, various years.
GBA Background Document
© Copyright 2022 Foundation, 2019. 186
Hong Kong
Hong Kong is a Special Administrative Region of China located south of Shenzhen. Hong Kong has a
total area of 1,104 square kilometers and a population of 7.4 million. Hong Kong returned from
British to Chinese administration in 1997. Hong Kong is an autonomous territory and has a separate
economic and legal system to that of the Chinese Mainland.
Hong Kong’s proximity and close historical relationship to the Pearl River Delta have seen it evolve
from being a light manufacturing center to being one of the most service driven metropolitan
economies of the world, with a tertiary sector that went from 67 percent of total GDP in 1980 to 92
percent in 2016. This was the result of the migration of Hong Kong’ manufacturing base to
Guangdong, coupled with improvements in education and skill sets of Hong Kong’s population. Hong
Kong is a leading center for management, information, coordination, finance, and professional
services in Asia. Hong Kong is the leading location in Asia Pacific for regional headquarters of
multinational firms with 1,413 overseas and Mainland China firms having their regional
headquarters in Hong Kong.127
Hong Kong’s GDP is the largest among GBA cities, just ahead of Shenzhen and Guangzhou as of 2017,
and its per capita GDP is second in the GBA to Macao. Its leading service sectors are Public
Administration, Social, and Personal Services (18 percent of total GDP in 2016); Financing and
Insurance (18 percent); Import and Export Trade (18 percent), Ownership of premises (11 percent),
and Professional and Business Services (6 percent). The two fastest growing industries were
Financing and Insurance (Annual growth rate 2000 to 2016: 6.2 percent) and Professional and
Business Services (6.3 percent). Hong Kong’s leading secondary sector industries are Construction (5
percent of total GDP), Electricity, gas and water supply and waste management (1 percent), and
Manufacturing (1 percent). Hong Kong is an important trans-shipment port, with 88 percent of the
HKD 4,008 billion in imports subsequently re-exported from the territory. It is also an important FDI
destination (Inward Direct Investment HKD 911 billion in 2016) and source (Outward Direct
Investment HKID 463 billion in 2016).
Hong Kong has a market-oriented economy (repeatedly called the world’s freest in international
comparisons), has a relatively narrow tax base, and has an exchange rate system that pegs the Hong
Kong dollar to the United States dollar. Hong Kong is a major financial center, ranking only behind
London and New York on some measures. The UNCTAD World Investment Report 2018 records
global FDI flows to Hong Kong of USD 104 billion in 2017 (third globally) and FDI outflows of USD 83
billion (also third globally). Hong Kong International Airport has been the world’s busiest airport for
international cargo since 2011, and in 2017 Hong Kong’s port ranked fifth globally in terms of
container throughput.
The Hong Kong SAR Government has identified financial services, trading and logistics, tourism, and
professional services as the four key industries, or pillar industries, of Hong Kong’s economy.
Combined, these industries employed 1,775,300 people and generated value added of HKD 1,367.5
billion in 2016. The Hong Kong Government has identified cultural and creative industries, medical
127 According to a survey undertaken jointly by Invest Hong Kong and the Census and Statistics Department, HKSAR.
GBA Background Document
© Copyright 2022 Foundation, 2019. 187
services, education services, innovation and technology, testing and certification services, and
environmental industries for further development.
Development Plans
The development of the Greater Bay Area is starting to figure prominently in Hong Kong’s
development plans. In addition, Hong Kong plans to enhance its hard and soft infrastructure, explore
more free trade and double tax agreements, and support the development of key economic areas in
order to deliver greater prosperity and a higher standard of living to Hong Kong, and to boosting
Hong Kong’s competitiveness.
In terms of hard infrastructure, the soon to be opened Hong Kong-Zhuhai-Macao Bridge and Hong
Kong sections of the Guangzhou-Shenzhen-Hong Kong Express Rail Link, are major developments
that will greatly enhance connectivity between Hong Kong and other locations in the Greater Bay
Area. In terms of soft infrastructure, Hong Kong’s 2018 budget allocates significant funds to
developing innovation, technology, and financial talent; continuing education and youth
development; to supporting creative industries; enhancing the network of Economic Trade Offices in
ASEAN; promoting tourism; advancing the development of the financial services industry; and
supporting various other education initiatives.
Hong Kong plans to enter into more Free Trade Agreements (FTAs), Investment Promotion and
Protection Agreements (IPPA), and to sign further Comprehensive Avoidance of Double Taxation
Agreements (CDTA) with other economies, with those along the “Belt and Road” being of particular
interest.
Innovation and technology is a focus for Hong Kong SAR Government as it ties into plans for
developing the Greater Bay Area and fits the vision of establishing Hong Kong as a globally significant
hub for innovation, technology, and information. In support of this, the Innovation and Technology
Bureau (ITB) was established in 2015 to help promote scientific research and the development of
innovation and technology in Hong Kong. Hong Kong SAR Government has set a goal of doubling
expenditure on R&D (as a percentage of GDP) within five years. The Innovation and Technology
Commission has established a HKD 2 billion Innovation and Technology Venture Fund Scheme to co-
invest with venture capital funds in local technology start-ups. Also, the ITB is launching a HKD 500
million “Technology Talent Scheme” to provide support in recruiting postdoctoral talent for scientific
research and development. Supporting the development of innovation and technology further in
Hong Kong is the Hong Kong Science and Technology Park, established in 2001, and Hong Kong
Cyberport, established in 2007, and, announced in the 2018-2019 Budget, a 300 percent tax
deduction to companies for R&D expenditures up to HKD 2 million with a 200 percent deduction for
R&D spend exceeding that amount.
Positioning
Hong Kong has been ranked as the world’s freest economy by the Heritage Foundation128 for 24
consecutive years. The International Institute for Management Development ranked Hong Kong as
128 See Heritage Foundation, 2018 Index of Economic Freedom, 2018.
GBA Background Document
© Copyright 2022 Foundation, 2019. 188
the second most competitive economy in the world in 2018, behind the United States in first place,
but Hong Kong held the top spot in the previous two years. Hong Kong aims to improve further on
its traditional advantages while developing new areas of economic growth. Hong Kong’s autonomy
and the “One Country- Two Systems” arrangement that Hong Kong operates under position it as a
possible super-connector between Mainland China and the rest of the world, and there is the
potential for this to create opportunities for Hong Kong under Mainland China’s Belt and Road
Initiative.
Hong Kong’s Chief Executive has said that Hong Kong will continue to promote free trade, will aim to
ensure that Hong Kong remains competitive by focusing on supporting talent, having a business-
friendly environment and taxation, and supporting innovation and government-to-government
business, all with a focus on greater cooperation, especially in the Greater Bay Area. Specifically, the
Hong Kong SAR Government aims to develop the Greater Bay Area to help diversify Hong Kong’s
industries and to promote innovation and technology development. Further, it is hoped that Hong
Kong people will be able to live and retire in other locations in the Greater Bay Area should they
wish, and that Hong Kong will facilitate in the flow of people, goods, capital, and information
between Hong Kong and other cities in the Greater Bay Area.
To position Hong Kong competitively, Hong Kong SAR Government is seeking to strengthen Hong
Kong’s status as an off-shore Renminbi center, an international asset management center, and a
service center. The government is promoting Fintech development, promoting the development of
the bond market and of green finance with plans to issue a “green bond.” The Hong Kong SAR
Government has committed to financially supporting its traditional pillar industries while
encouraging growth in small and medium enterprises (SMEs), new industry in E-sports and major
sports events, and education to advance Hong Kong as a knowledge economy.
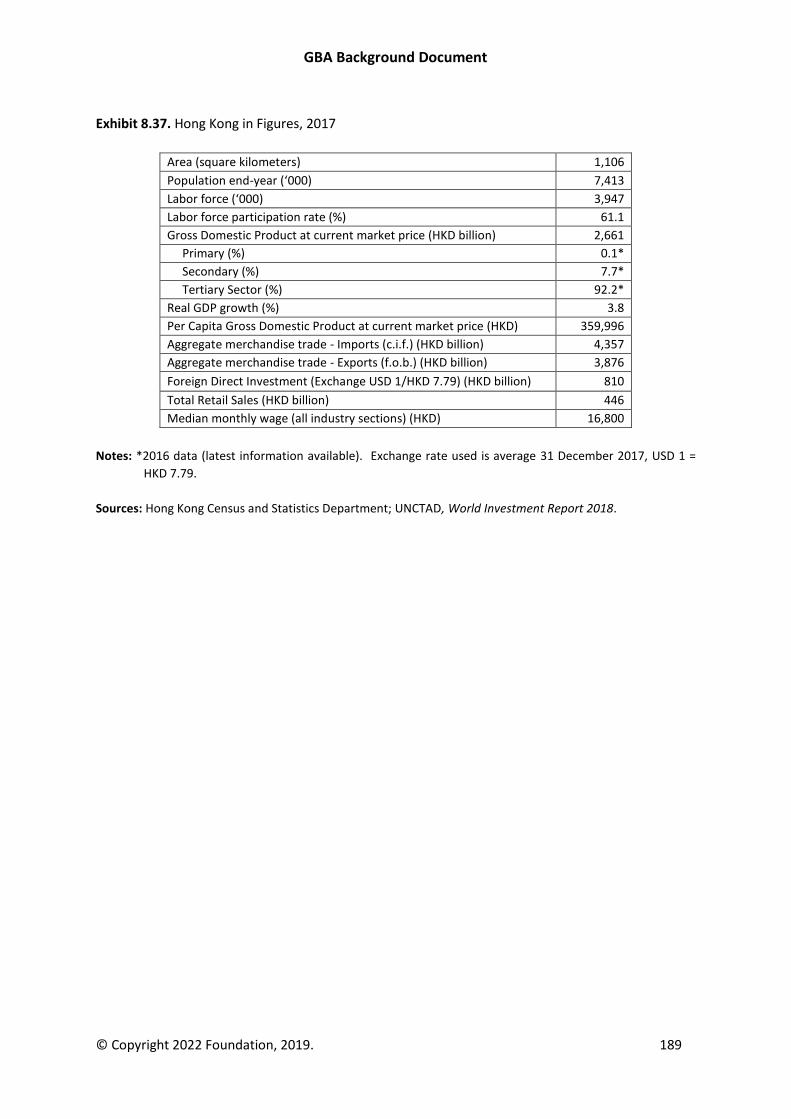
GBA Background Document
© Copyright 2022 Foundation, 2019. 189
Exhibit 8.37. Hong Kong in Figures, 2017
Area (square kilometers) 1,106
Population end-year (‘000) 7,413
Labor force (‘000) 3,947
Labor force participation rate (%) 61.1
Gross Domestic Product at current market price (HKD billion) 2,661
Primary (%) 0.1*
Secondary (%) 7.7*
Tertiary Sector (%) 92.2*
Real GDP growth (%) 3.8
Per Capita Gross Domestic Product at current market price (HKD) 359,996
Aggregate merchandise trade - Imports (c.i.f.) (HKD billion) 4,357
Aggregate merchandise trade - Exports (f.o.b.) (HKD billion) 3,876
Foreign Direct Investment (Exchange USD 1/HKD 7.79) (HKD billion) 810
Total Retail Sales (HKD billion) 446
Median monthly wage (all industry sections) (HKD) 16,800
Notes: *2016 data (latest information available). Exchange rate used is average 31 December 2017, USD 1 =
HKD 7.79.
Sources: Hong Kong Census and Statistics Department; UNCTAD, World Investment Report 2018.
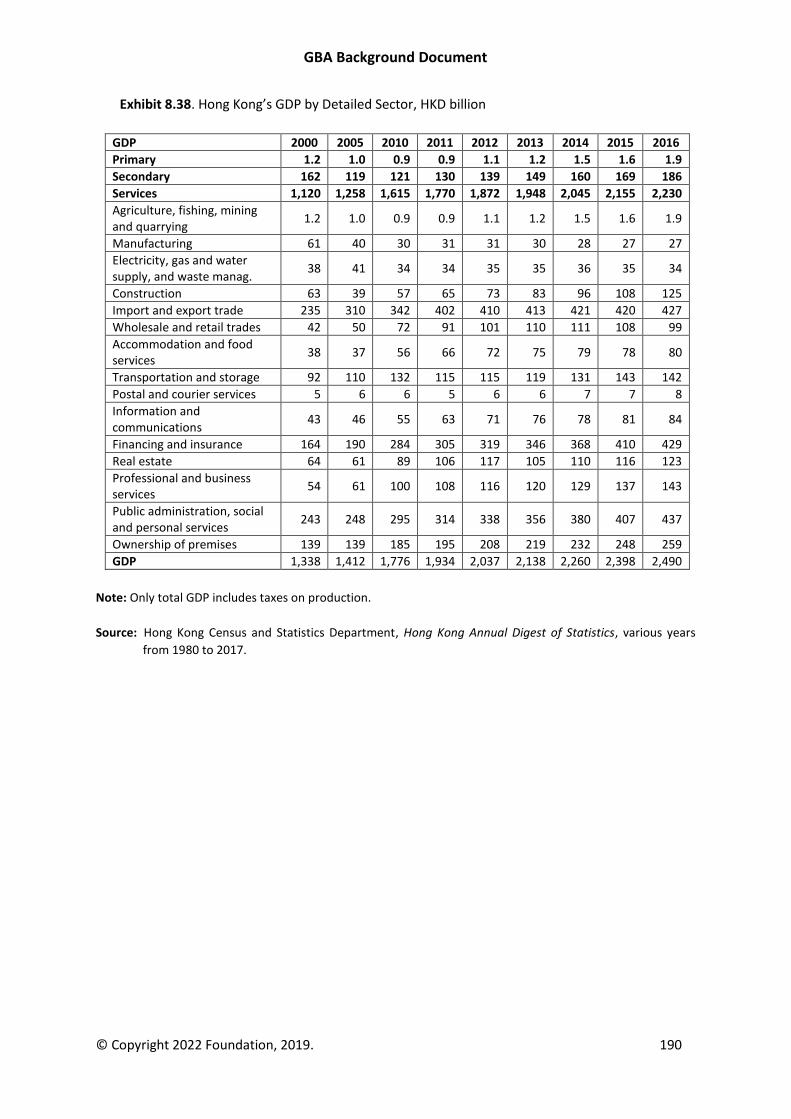
GBA Background Document
© Copyright 2022 Foundation, 2019. 190
Exhibit 8.38. Hong Kong’s GDP by Detailed Sector, HKD billion
GDP 2000 2005 2010 2011 2012 2013 2014 2015 2016
Primary 1.2 1.0 0.9 0.9 1.1 1.2 1.5 1.6 1.9
Secondary 162 119 121 130 139 149 160 169 186
Services 1,120 1,258 1,615 1,770 1,872 1,948 2,045 2,155 2,230
Agriculture, fishing, mining and quarrying
1.2 1.0 0.9 0.9 1.1 1.2 1.5 1.6 1.9
Manufacturing 61 40 30 31 31 30 28 27 27
Electricity, gas and water supply, and waste manag.
38 41 34 34 35 35 36 35 34
Construction 63 39 57 65 73 83 96 108 125
Import and export trade 235 310 342 402 410 413 421 420 427
Wholesale and retail trades 42 50 72 91 101 110 111 108 99
Accommodation and food services
38 37 56 66 72 75 79 78 80
Transportation and storage 92 110 132 115 115 119 131 143 142
Postal and courier services 5 6 6 5 6 6 7 7 8
Information and communications
43 46 55 63 71 76 78 81 84
Financing and insurance 164 190 284 305 319 346 368 410 429
Real estate 64 61 89 106 117 105 110 116 123
Professional and business services
54 61 100 108 116 120 129 137 143
Public administration, social and personal services
243 248 295 314 338 356 380 407 437
Ownership of premises 139 139 185 195 208 219 232 248 259
GDP 1,338 1,412 1,776 1,934 2,037 2,138 2,260 2,398 2,490
Note: Only total GDP includes taxes on production.
Source: Hong Kong Census and Statistics Department, Hong Kong Annual Digest of Statistics, various years
from 1980 to 2017.
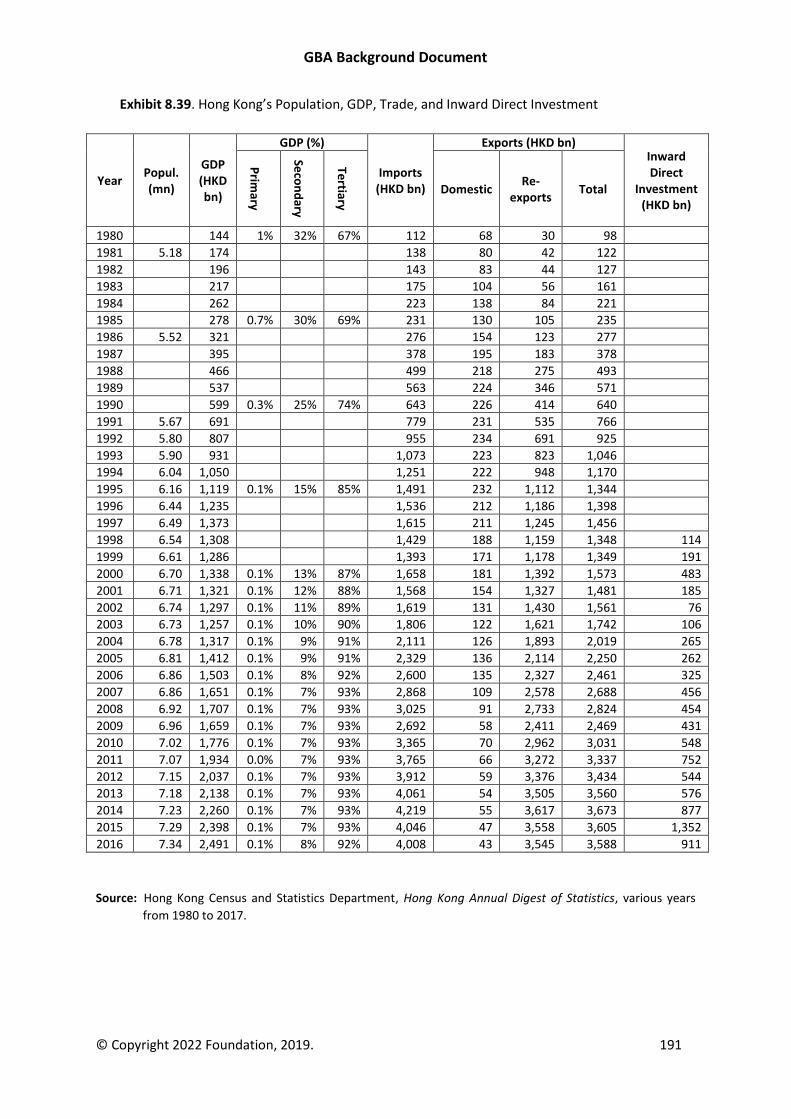
GBA Background Document
© Copyright 2022 Foundation, 2019. 191
Exhibit 8.39. Hong Kong’s Population, GDP, Trade, and Inward Direct Investment
Year Popul. (mn)
GDP (HKD bn)
GDP (%)
Imports (HKD bn)
Exports (HKD bn) Inward Direct
Investment (HKD bn)
Prim
ary
Seco
nd
ary
Tertiary
Domestic Re-
exports Total
1980 144 1% 32% 67% 112 68 30 98
1981 5.18 174 138 80 42 122
1982 196 143 83 44 127
1983 217 175 104 56 161
1984 262 223 138 84 221
1985 278 0.7% 30% 69% 231 130 105 235
1986 5.52 321 276 154 123 277
1987 395 378 195 183 378
1988 466 499 218 275 493
1989 537 563 224 346 571
1990 599 0.3% 25% 74% 643 226 414 640
1991 5.67 691 779 231 535 766
1992 5.80 807 955 234 691 925
1993 5.90 931 1,073 223 823 1,046
1994 6.04 1,050 1,251 222 948 1,170
1995 6.16 1,119 0.1% 15% 85% 1,491 232 1,112 1,344
1996 6.44 1,235 1,536 212 1,186 1,398
1997 6.49 1,373 1,615 211 1,245 1,456
1998 6.54 1,308 1,429 188 1,159 1,348 114
1999 6.61 1,286 1,393 171 1,178 1,349 191
2000 6.70 1,338 0.1% 13% 87% 1,658 181 1,392 1,573 483
2001 6.71 1,321 0.1% 12% 88% 1,568 154 1,327 1,481 185
2002 6.74 1,297 0.1% 11% 89% 1,619 131 1,430 1,561 76
2003 6.73 1,257 0.1% 10% 90% 1,806 122 1,621 1,742 106
2004 6.78 1,317 0.1% 9% 91% 2,111 126 1,893 2,019 265
2005 6.81 1,412 0.1% 9% 91% 2,329 136 2,114 2,250 262
2006 6.86 1,503 0.1% 8% 92% 2,600 135 2,327 2,461 325
2007 6.86 1,651 0.1% 7% 93% 2,868 109 2,578 2,688 456
2008 6.92 1,707 0.1% 7% 93% 3,025 91 2,733 2,824 454
2009 6.96 1,659 0.1% 7% 93% 2,692 58 2,411 2,469 431
2010 7.02 1,776 0.1% 7% 93% 3,365 70 2,962 3,031 548
2011 7.07 1,934 0.0% 7% 93% 3,765 66 3,272 3,337 752
2012 7.15 2,037 0.1% 7% 93% 3,912 59 3,376 3,434 544
2013 7.18 2,138 0.1% 7% 93% 4,061 54 3,505 3,560 576
2014 7.23 2,260 0.1% 7% 93% 4,219 55 3,617 3,673 877
2015 7.29 2,398 0.1% 7% 93% 4,046 47 3,558 3,605 1,352
2016 7.34 2,491 0.1% 8% 92% 4,008 43 3,545 3,588 911
Source: Hong Kong Census and Statistics Department, Hong Kong Annual Digest of Statistics, various years
from 1980 to 2017.
GBA Background Document
© Copyright 2022 Foundation, 2019. 192
Macao
Macao is a Special Administrative Region of the People’s Republic of China located south of Zhuhai
on the western shore of the mouth of the Pearl River. Macao has a total area of 30.8 square
kilometers and a population of 653,000. Formerly a Portuguese colony, Macao returned to Chinese
administration in 1999. Macao is an autonomous territory and has a separate economic and legal
system to the Chinese Mainland.
Macao’s 2016 GDP was MOP 362 billion. From 1991 to 1999, GDP grew at an annual rate of 7
percent, increasing to 13 percent from 2000 to 2016. The bulk of the increase in GDP occurred after
mid 2000s mainly due the expansion in the gaming industry and related construction in Macao.
Tertiary Industry accounts for 93 percent of total GDP. The five top service industries in Macao are
Gaming and Junket Activities (47 percent of total GDP), Real estate (11 percent of GDP), Banking (5
percent of GDP), Wholesale & retail (5 percent of GDP), and Public administration (4 percent of GDP).
GDP per capita in Macao is the highest in the GBA at MOP 560,913; this high figure is driven by the
high volume and profitability of the Gaming industry.
Development Plans
The Macao SAR Government is three years into its first Five-Year Development Plan. The major
development strategies of the Five-year Development Plan center on enhancing the city’s
competitiveness and raising Macao’s influence regionally and internationally. The government plans
to leverage Macao’s existing transportation infrastructure to integrate land, sea, and air transport
and to enhance Macao’s regional and international connectivity. There are plans to develop a
logistics center at the Macao border crossing area of the Hong Kong-Zhuhai-Macao Bridge to grow
the logistics industry and to further economic diversification. Border-crossing facilities will be
improved to achieve efficient regional commuting, and the border crossing area of the Hong Kong-
Zhuhai-Macao Bridge will be completed at the same time as the main structure of the bridge. The
Macao SAR Government has stated that it will work closely with Guangdong Province and Hong Kong
to ensure that the bridge successfully improves connectivity and regional integration.
In innovation and technology, investments in research and development will be increased and the
framework agreement on the development of the Guangdong-Hong Kong-Macao Greater Bay Area
will be implemented to enhance cooperation and promote technological innovation. Efforts to
develop Macao into a “smart city” continue with the formulation of a long-term development plan
for the telecommunications industry to ensure network quality and expand the coverage of wireless
networks, by supporting development of a third-party electronic payment platform, and by
encouraging development of “smart city” mobile apps. The Government has launched an action plan
to support SMEs in adopting new business models, developing online and e-commerce markets, and
upgrading their technology and equipment. Finally, the Guangdong-Macao Traditional Chinese
Medicine Technology Industrial Park, located in the Guangdong-Macao Cooperation Industrial Zone
in Hengqin New Area, aims to attract more Chinese medicine companies to join the park with a view
to creating further opportunities in Mainland China for Macao companies, and with the goal of
diversifying Macao’s economy.
In the financial sector, the Government will support the development of specialized financial
businesses in financial leasing and wealth management, will further strengthen Macao’s financial
GBA Background Document
© Copyright 2022 Foundation, 2019. 193
infrastructure, and will facilitate the establishment of a central credit information database.
Government also will provide financial services for projects related to the “Belt and Road” initiative
and establish an Investment Development Fund in 2019 to better manage and coordinate the
investment of public funds in line with Macao’s strategic growth and investment imperatives.
To support tourism, the Macao Government Tourism Office will follow a 15-year plan to further
develop Macao as a World Centre of Tourism and Leisure, and it will continue to support growth of
the convention and exhibition industry, and support the development of associated industries and
related SMEs.
Positioning
Macao is the world’s largest gaming center and one of the world’s premier gaming and resort
destinations. It is one of the most service driven economies in the world with the tertiary sector
exceeding 93 percent of total GDP. Connectivity between Macao, Hong Kong and Mainland China
will be substantially improved by the opening of the Hong Kong-Zhuhai-Macao Bridge. Tourism and
investment from overseas are expected to grow further with the opening of the bridge. Macao is
ranked 34th by the Heritage Foundation in its 2018 Index of Economic Freedom. It continues to have
an open approach to planning and economic policy and the economy is market driven within the
legal and political systems of Macao.
To position Macao competitively, the Macao SAR Government is seeking to strengthen Macao’s
status as a center for gaming, MICE, and tourism by improving infrastructure and urban
development; by turning Macao into a “smart city;” by making Macao more accessible by road, air,
and sea; by encouraging gaming companies to continue developing non-gaming businesses; and by
promoting economic stability through enhanced regional cooperation, prudent fiscal management,
the development of public housing, and by encouraging new industry.
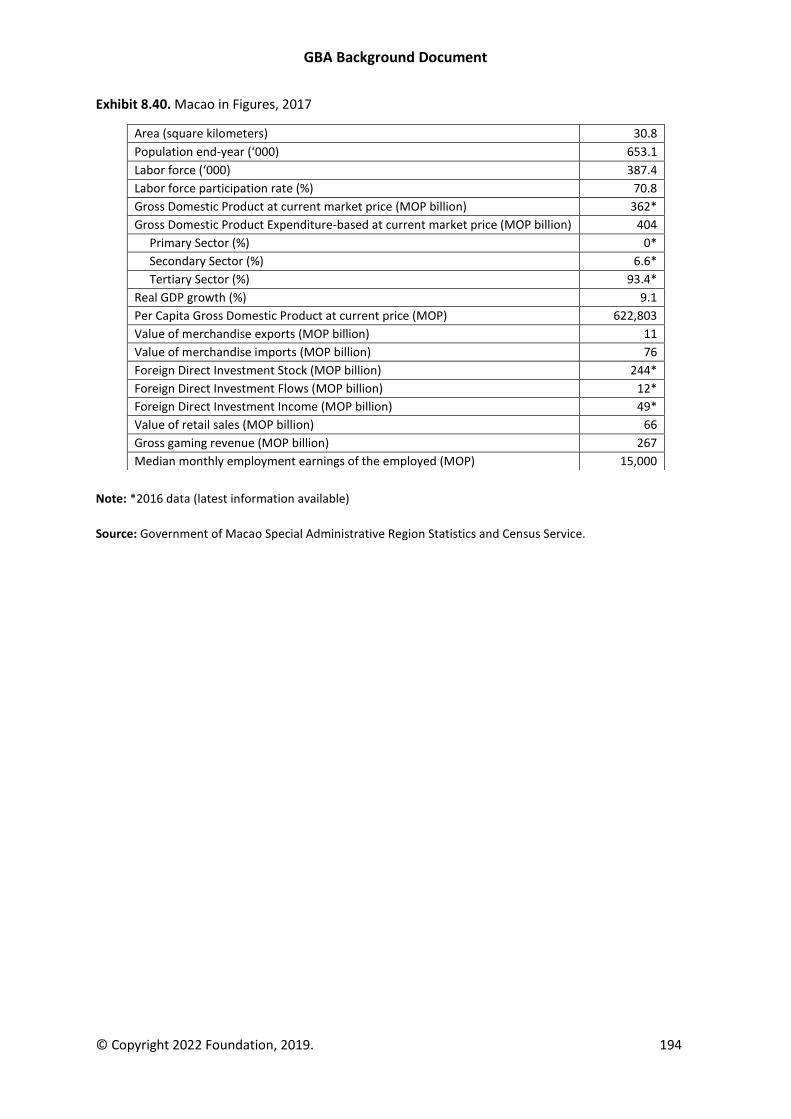
GBA Background Document
© Copyright 2022 Foundation, 2019. 194
Exhibit 8.40. Macao in Figures, 2017
Note: *2016 data (latest information available)
Source: Government of Macao Special Administrative Region Statistics and Census Service.
Area (square kilometers) 30.8
Population end-year (‘000) 653.1
Labor force (‘000) 387.4
Labor force participation rate (%) 70.8
Gross Domestic Product at current market price (MOP billion) 362*
Gross Domestic Product Expenditure-based at current market price (MOP billion) 404
Primary Sector (%) 0*
Secondary Sector (%) 6.6*
Tertiary Sector (%) 93.4*
Real GDP growth (%) 9.1
Per Capita Gross Domestic Product at current price (MOP) 622,803
Value of merchandise exports (MOP billion) 11
Value of merchandise imports (MOP billion) 76
Foreign Direct Investment Stock (MOP billion) 244*
Foreign Direct Investment Flows (MOP billion) 12*
Foreign Direct Investment Income (MOP billion) 49*
Value of retail sales (MOP billion) 66
Gross gaming revenue (MOP billion) 267
Median monthly employment earnings of the employed (MOP) 15,000
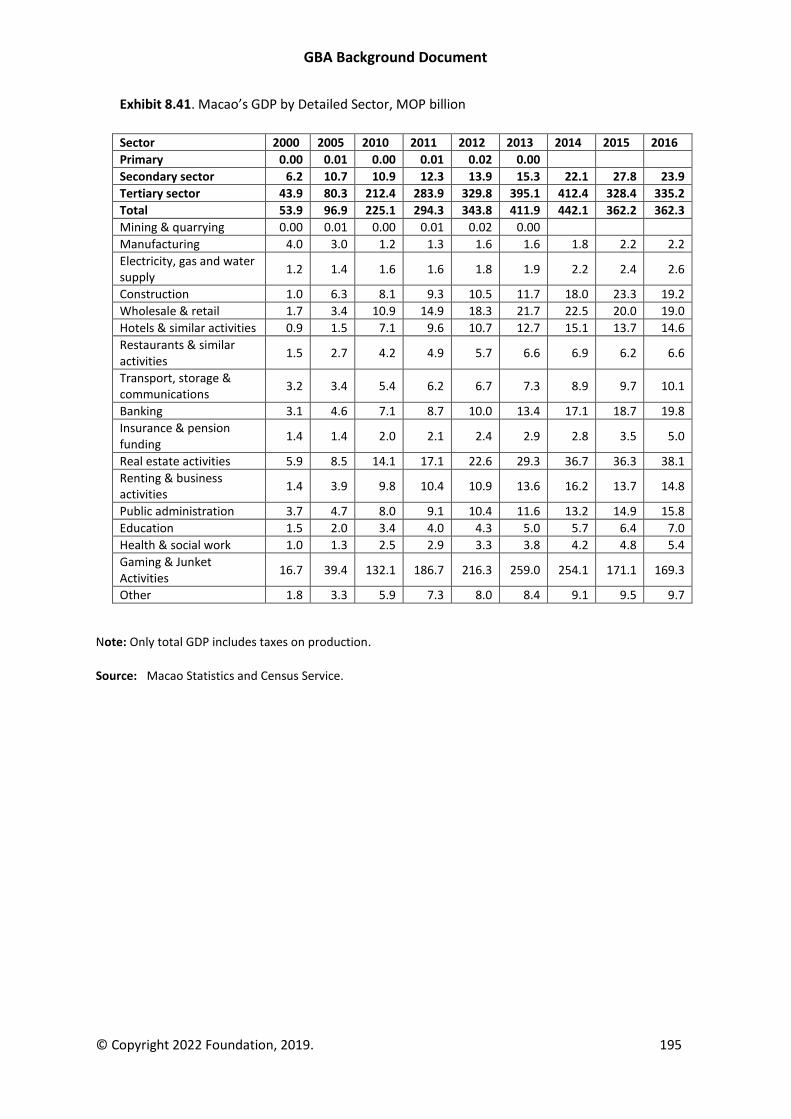
GBA Background Document
© Copyright 2022 Foundation, 2019. 195
Exhibit 8.41. Macao’s GDP by Detailed Sector, MOP billion
Sector 2000 2005 2010 2011 2012 2013 2014 2015 2016
Primary 0.00 0.01 0.00 0.01 0.02 0.00
Secondary sector 6.2 10.7 10.9 12.3 13.9 15.3 22.1 27.8 23.9
Tertiary sector 43.9 80.3 212.4 283.9 329.8 395.1 412.4 328.4 335.2
Total 53.9 96.9 225.1 294.3 343.8 411.9 442.1 362.2 362.3
Mining & quarrying 0.00 0.01 0.00 0.01 0.02 0.00
Manufacturing 4.0 3.0 1.2 1.3 1.6 1.6 1.8 2.2 2.2
Electricity, gas and water supply
1.2 1.4 1.6 1.6 1.8 1.9 2.2 2.4 2.6
Construction 1.0 6.3 8.1 9.3 10.5 11.7 18.0 23.3 19.2
Wholesale & retail 1.7 3.4 10.9 14.9 18.3 21.7 22.5 20.0 19.0
Hotels & similar activities 0.9 1.5 7.1 9.6 10.7 12.7 15.1 13.7 14.6
Restaurants & similar activities
1.5 2.7 4.2 4.9 5.7 6.6 6.9 6.2 6.6
Transport, storage & communications
3.2 3.4 5.4 6.2 6.7 7.3 8.9 9.7 10.1
Banking 3.1 4.6 7.1 8.7 10.0 13.4 17.1 18.7 19.8
Insurance & pension funding
1.4 1.4 2.0 2.1 2.4 2.9 2.8 3.5 5.0
Real estate activities 5.9 8.5 14.1 17.1 22.6 29.3 36.7 36.3 38.1
Renting & business activities
1.4 3.9 9.8 10.4 10.9 13.6 16.2 13.7 14.8
Public administration 3.7 4.7 8.0 9.1 10.4 11.6 13.2 14.9 15.8
Education 1.5 2.0 3.4 4.0 4.3 5.0 5.7 6.4 7.0
Health & social work 1.0 1.3 2.5 2.9 3.3 3.8 4.2 4.8 5.4
Gaming & Junket Activities
16.7 39.4 132.1 186.7 216.3 259.0 254.1 171.1 169.3
Other 1.8 3.3 5.9 7.3 8.0 8.4 9.1 9.5 9.7
Note: Only total GDP includes taxes on production.
Source: Macao Statistics and Census Service.
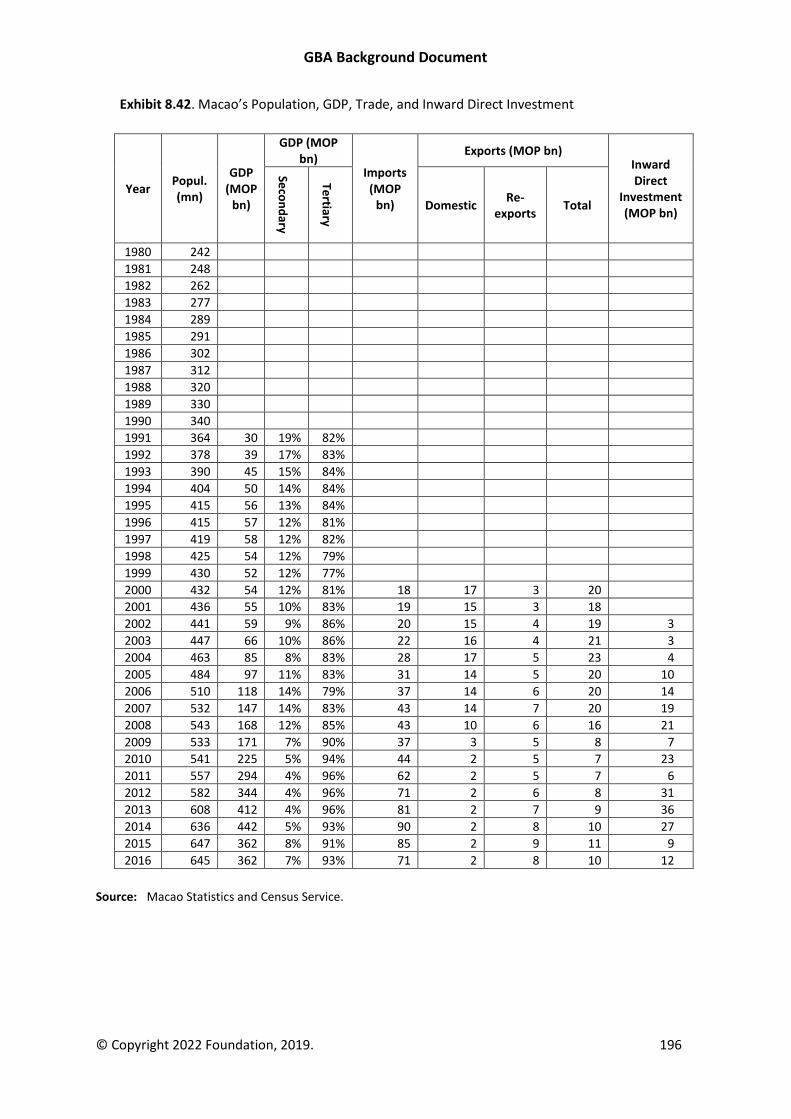
GBA Background Document
© Copyright 2022 Foundation, 2019. 196
Exhibit 8.42. Macao’s Population, GDP, Trade, and Inward Direct Investment
Year Popul. (mn)
GDP (MOP
bn)
GDP (MOP bn)
Imports (MOP
bn)
Exports (MOP bn) Inward Direct
Investment (MOP bn)
Seco
nd
ary
Tertiary
Domestic Re-
exports Total
1980 242
1981 248
1982 262
1983 277
1984 289
1985 291
1986 302
1987 312
1988 320
1989 330
1990 340
1991 364 30 19% 82%
1992 378 39 17% 83%
1993 390 45 15% 84%
1994 404 50 14% 84%
1995 415 56 13% 84%
1996 415 57 12% 81%
1997 419 58 12% 82%
1998 425 54 12% 79%
1999 430 52 12% 77%
2000 432 54 12% 81% 18 17 3 20
2001 436 55 10% 83% 19 15 3 18
2002 441 59 9% 86% 20 15 4 19 3
2003 447 66 10% 86% 22 16 4 21 3
2004 463 85 8% 83% 28 17 5 23 4
2005 484 97 11% 83% 31 14 5 20 10
2006 510 118 14% 79% 37 14 6 20 14
2007 532 147 14% 83% 43 14 7 20 19
2008 543 168 12% 85% 43 10 6 16 21
2009 533 171 7% 90% 37 3 5 8 7
2010 541 225 5% 94% 44 2 5 7 23
2011 557 294 4% 96% 62 2 5 7 6
2012 582 344 4% 96% 71 2 6 8 31
2013 608 412 4% 96% 81 2 7 9 36
2014 636 442 5% 93% 90 2 8 10 27
2015 647 362 8% 91% 85 2 9 11 9
2016 645 362 7% 93% 71 2 8 10 12
Source: Macao Statistics and Census Service.
GBA Background Document
© Copyright 2022 Foundation, 2019. 197
9. 9. A Selection of Reports and Surveys on the GBA
There have been numerous reports and surveys on the GBA before and after the signing of the The
Framework Agreement on Deepening Guangdong-Hong Kong-Macao Cooperation in the
Development of the Bay Area (The Agreement) on 1 July 2017. This section highlights a few of these
reports and surveys.
The Hong Kong Trade Development Council (HKTDC) notes that the GBA is included in China’s
national strategies, including in its 13th Five-Year Plan, and claims that Hong Kong’s development will
benefit from new opportunities that are created. HKTDC encourages action “as soon as possible to
map out plans taking advantage of Hong Kong’s strengths in financial services, professional services
and international ties in order to enhance co-operation with Guangdong as well as to explore new
horizons and add new vitality to the sustainable growth and prosperity of Hong Kong.” HKTDC goes
on to say that “Hong Kong’s strengths … can also contribute to the transformation and upgrading of
industries in the Guangdong-Hong Kong-Macao Bay Area, building the Bay Area into a world-class
city cluster with international competitiveness.” Citing a survey conducted by HKTDC Research,
HKTDC observes that “70% of the surveyed manufacturers and traders still see the PRD as the most
important production or sourcing base, with 81% sourcing raw materials and semi-manufactures in
the PRD for production activities.” Noting that there are different political, administrative and
economic systems in Hong Kong, Guangdong, and Macao that present challenges, the HKTDC
recommends that “Guangdong and Hong Kong should strengthen co-operation in areas such as
increasing market attraction, optimizing business environment, and nurturing and attracting talent …
[because this will] … attract more domestic and foreign investors and commercial activities to
establish a presence in the Bay Area.”129
In May 2018, AmCham Hong Kong and Ipsos Business Consulting produced a report based on 230
survey responses by AmCham Hong Kong members. The report claims that seventy percent of
respondents are positive that operating in the GBA will increase their revenue. Just over half of the
respondents already have an office presence in the GBA. The top reasons given for expanding in the
GBA were “access to consumer market of about 67 million people,” “to leverage benefits from the
close connection between Hong Kong and the GBA,” and as a “launchpad into the rest of China /
new export markets.” Respondents identified the biggest hurdles to GBA expansion as being the
Chinese authorities’ lack of transparency, weak rule of law, and policy uncertainty, with other
hurdles including China’s taxes and “complexity” in terms of red tape, rivalry between GBA cities,
talent shortages and high operating costs, and the divide between Hong Kong and Guangdong’s
cultures and operating environments. Hong Kong’s close proximity to the Mainland and to other
Asian markets was cited as the main reason for being in Hong Kong, and eighty-seven percent of
survey respondents felt that Hong Kong was strongly competitive or fairly competitive versus other
Asian world cities and many respondents noted that Hong Kong’s attractive lifestyle made it a
preferred location in the GBA. 130
129 Hong Kong Trade and Development Council, Development Prospects for Guangdong-Hong Kong-Macao Bay Area and the Role of Hong Kong, July 2017. 130 AmCham Hong Kong and Ipsos Business Consulting, AmCham Hong Kong 2018 Business Sentiment Survey, May 2018.
GBA Background Document
© Copyright 2022 Foundation, 2019. 198
The American Chamber of Commerce in South China its annual survey of companies found in 2018
that for the first time Guangzhou ranked as the most popular city for investment followed by
Shenzhen and then Shanghai and Beijing. This is the first time since the annual study commenced in
2003 that Guangzhou and Shenzhen took the top two spots. More than half of the 215 companies
responding to the survey chose South China mainly because of the potential for market growth, and
most were confident that this growth would continue. Over eighty percent of respondents
considered the business environment in South China to be “good” or “very good.” The top three
challenges identified by respondents were “fierce local competition,” “increasing human resource
costs,” and “shortage of qualified talent.” Further, although the survey results indicate that there is a
human resources advantage to being in South China relative to other parts of China, many
respondents claimed that the quality of personnel in South China is not high enough, suggesting that
the quality of human resources in South China needs to improve. These challenges will need to be
addressed for GBA to continue to realize its potential. Many respondents expressed an interest in
establishing a presence in the Free Trade Zone (FTZ) areas in South China with more than half of the
respondents favoring the Guangdong Nansha FTZ, followed by those in Qianhai and Hengqin. In a
reminder that development in the GBA needs to be carefully managed, the survey report flagged
some concerns by respondents including that “a couple of cities located in the area, however, have
sunk to the bottom of the list because they are focused on taking land that rightfully belongs to
foreign-invested enterprises. These cities are attempting to make quick profits from real estate
development rather than focusing on the future by keeping those enterprises and their newly
developed technologies.”131
KPMG China and The Australian Chamber of Commerce Hong Kong (AustCham) interviewed 30
business leaders and entrepreneurs to produce a report on GBA. The report states that Hong Kong
has significant opportunity to benefit from the GBA initiative, and to participate in creating a globally
competitive business region. The report calls for Hong Kong “to be at the forefront of the
development of the GBA as a technology and innovation hub by helping to create the funding
ecosystem that is essential to fostering innovation and entrepreneurship, as well as greater
business-to-business engagement and collaboration.” For this to happen, KPMG China and
AustCham recommend that: Hong Kong’s universities align with those in Shenzhen; a “GBA
Innovation Commercial Planning Office” be established in Hong Kong to assist businesses with
innovation-related opportunities in the GBA; a GBA data privacy standard be defined; Hong Kong’s
supply chain management capabilities be leveraged; there be common standards for Know Your
Customer (KYC) and Anti-money laundering (AML) across the GBA, and that it be made easier to
open bank accounts in the GBA; the ability to use payment systems including Alipay and WeChat Pay
be extended across borders; Hong Kong’s role as the arbitration center for the GBA be maintained; a
mutual tax exemption for researchers and academics be provided as a first step towards establishing
closer tax regimes; a study on the implementation of the frontier workers mutual tax exemption
clause should be undertaken; there should be closer alignment between the Mainland and Hong
Kong on standards regarding customs, trade and compliance within the GBA; InvestHK be replicated
with a focus on providing SMEs with clarity around regulations, market entry and advice; cross-
border commuter belts and the creation of a “quality living circle” should be promoted in the region;
there should be increased co-ordination on tourism policy, infrastructure planning and marketing
through establishment of the Greater Bay Tourism Promotion Office, drawing on Hong Kong’s
131 The American Chamber of Commerce in South China, 2018 Special Report on the State of Business in South China, February 2018.
GBA Background Document
© Copyright 2022 Foundation, 2019. 199
tourism marketing expertise; and, “Insurance Connect” should be introduced similar to the Stock
Connect scheme, to enable Hong Kong insurers to offer health and medical insurance to GBA
residents.132
A report by CPA Australia on a member survey with 351 responses concluded that Hong Kong needs
to be, and can be, much more than the financial hub of the GBA, that policy initiatives should be
considered to transform Hong Kong into the global intellectual property center for the GBA, that
creating a GBA-wide standard for blockchain will assist the technology to reach its full potential, that
both the people and businesses of Hong Kong should endeavor to learn more about the GBA and the
opportunities that it will likely bring, and that while the GBA is likely to create significant
opportunities, these opportunities must be seized by Hong Kong people and businesses for Hong
Kong to realize the full potential of the GBA. In identifying the factors important to the success of
the GBA, sixty-one percent of respondents view “making payment transfers across the borders of
the GBA easier” as being critically important. Other critically important factors to the success of the
GBA are “making it easier for people to move throughout the GBA,” ensuring “business access to
talent,” “simpler and unambiguous regulation to facilitate doing business across borders,”
“infrastructure,” and “making the movement of goods across the borders of the GBA easier.” Nearly
half of the respondents intend to expand their business or career into the rest of the GBA in the next
five years. The skills that respondents deemed most in need of improvement in the Hong Kong
workforce to best allow Hong Kong companies to take advantage of the GBA are “creativity and
innovation,” “critical thinking,” and “expanding understanding of the world in general.” Other ideas
suggested by respondents to the survey include having the Hong Kong Government provide
additional funding to promote greater research collaboration between Hong Kong universities and
other universities in the GBA, additional funding to support more academic and student exchanges
with universities across the GBA, and a recommendation that Hong Kong Government consider the
benefits of attracting top foreign universities and research institutes to establish campuses in Hong
Kong.133
A report by ACCA Hong Kong on a member survey with 216 responses conducted in January 2018
came up with four recommendations that could, ACCA Hong Kong believes, empower Hong Kong to
leverage its participation in the GBA into greater and more sustainable growth while driving the
overall development of the GBA. The first recommendation is to “conduct thorough researches and
studies on the strengths and needs of each city, enabling member cities to understand what they
can offer and to whom they can offer.” The second recommendation is to “take actions to attract,
retain and develop talent capable of meeting the growing workforce demands in the GBA.” The third
recommendation is to “set up a GBA committee to facilitate Hong Kong as the Super Connector
between the Mainland and the international community,” The fourth recommendation is to “offer
the right tax incentives to increase the city’s competitiveness and spark new growth momentum.”
Taken together, ACCA Hong Kong believes that the recommendations would help Hong Kong realize
the growth potential of the GBA, but it cautions that Hong Kong and the other GBA cities will need to
132 KPMG China and The Australian Chamber of Commerce Hong Kong, Connecting opportunities in the Greater Bay Area, November 2018. 133 CPA Australia, Greater Bay Area Initiative: Factors Important to its Success: Report on CPA Australia’s Greater Bay Area Member Survey, 2018.
GBA Background Document
© Copyright 2022 Foundation, 2019. 200
work cooperatively and complement each other instead of competing if the opportunities arising
from the GBA are to be fully capitalized on.134
In November 2017, the Hong Kong Institute of Certified Public Accountants (HKICPA) interviewed
various senior members and published their views in its official member magazine. Overall the
conclusion is that Hong Kong can leverage its status as a global financial center, and offshore RMB
hub, and an international asset management center to capitalize on opportunities in the GBA. The
views expressed supported the idea that “GBA has the potential to be game-changing on a national
level” and noted that some big accounting firms, including Deloitte, were already managing their
resources from a “southern China regional perspective” with a view to better coordinate their Hong
Kong and Guangdong operations. Suggestions made by interviewees include that Qianhai be the
focus for HKICPA members because of its focus on financial services, that Hong Kong companies be
allowed to set up branches in the Mainland side of the GBA to reduce their financing costs and tax
burden in the Mainland, that the individual tax burden of Hong Kong residents who work in
Guangdong be reduced, and that corporate tax for Hong Kong companies with permanent
establishments in Guangdong be reduced. Hurdles to Hong Kong accountants in the GBA that were
identified by interviewees included inadequate mutual recognition of professional qualifications,
with the aim being for full recognition for HKICPA members to be able to work in the Mainland
without requiring Mainland qualifications. Tying in the idea that Qianhai could be a focal starting
point, it is suggested that one positive step would be to allow HKICPA members to become partners
at Qianhai’s accounting firms as this would encourage more Hong Kong qualified accountants and
more Hong Kong firms to develop and invest in the GBA. 135
In 2017, PwC China produced a report to identify new opportunities for the GBA. The report
recommends that governments in the GBA can jointly formulate policies to improve air and water
quality and then develop “unique ecotourism” to further develop joint tourism. The report notes
that it is vital to encourage international high-end talents to settle in the GBA and to be able to work
in the GBA “without restraint.” To achieve this, it is suggested that government in Guangdong, Hong
Kong and Macao look to jointly develop preferential tax policies to encourage more companies and
talents to the GBA. The report further suggests that Guangdong, Hong Kong and Macao look to
jointly build “smart cities” to help support the development of other industries. It is suggested that
cross-region elderly care can be a focus, and that cities such as Zhaoqing, Zhongshan, and Zhuhai
that have a relatively low cost of living and an “ideal living environment” can attract retirees from
around the GBA, and possibly other parts of the Mainland, to live there. Finally, the report
recommends the GBA as a place to combine Chinese and Western medicine by promoting
internationally-recognized standards for traditional Chinese medicine. It is suggested the medical
industry can coordinate with tourism and elderly care industries to promote the development of
multiple service industries in the GBA.136
In September 2017, KPMG China and the Hong Kong General Chamber of Commerce (HKGC)
published a report based on a survey of 614 business executives from companies operating in the
GBA. The report notes that the GBA will be an important growth engine for the Mainland, with
ninety percent of survey respondents indicating that the GBA is likely to have a positive impact on 134 ACCA Hong Kong, Greater Bay Area Opportunities – Capitalising on Hong Kong’s Unique Edge: ACCA Hong Kong’s Recommendations for the HKSAR Government, 2018. 135 Hong Kong Institute of Certified Public Accountants, Bay of Plenty, A Plus Magazine, November 2017. 136 PwC China, New Opportunities for the Guangdong-Hong Kong-Macao Greater Bay Area, 2017.
GBA Background Document
© Copyright 2022 Foundation, 2019. 201
China’s economy, and that being part of the GBA will be good for Hong Kong, but it makes the point
that success for the GBA will depend on mutual collaboration and cooperation. Respondents to the
survey identified the most important factors for the GBA’s success as being “government support,”
“consistency of laws and regulations,” “infrastructural support,” and “tax benefits.” Fifty-nine
percent of respondents view the GBA cities as being complementary to one another. A majority of
respondents indicated that trade and logistics, financial services, research and development in
innovative technologies, and professional services, will be the sectors that benefit most from the
development of the GBA. In terms of how the GBA will benefit businesses the most, the top three
factors identified are “closer and more harmonious development between Hong Kong/ Macao and
China,” “free flow of talent,” and “better access to different markets/ improved market
penetration.” The greatest challenges to the development of the GBA are seen as being
“protectionism within the region,” “silos between and within governments,” and “overdependence
on government’s foresight and planning capabilities.”137
In 2018, KPMG China and the HKGC joined with HSBC to again published a report based on a similar
survey to the one run in 2017. In 2018, more than 700 business executives from companies
operating in the GBA responded. Seventy-seven percent of respondents expect the GBA’s economic
growth to exceed that of the rest of China over the next three years. Fifty-seven percent of
respondents said that their company has a strategic plan for the GBA. The industries that are viewed
as likely to benefit most from the development of the GBA are technology and innovation, trade and
logistics, and financial services. The top three risks impacting GBA business plans were identified as
“policy/regulatory ambiguity, uncertainty and familiarity,” “coordination among Greater Bay Area
cities,” and “cross-border movement of capital.” The most decisive factors for the successful
development of the GBA were identified as “regulatory harmonization,” “free movement of capital,”
“access to the entire Greater Bay Area market,” and “tax incentives.” The most important factors to
facilitate the free movement of people within the GBA were identified as “tax incentives,”
“affordable accommodation and transportation,” and “visa-free entry.” The most important factors
to facilitate the free movement of goods within the GBA were identified as “integrated customs
administration, processes and standards,” “alignment of regulatory and legal environment,” and
“enhancing logistics infrastructure.”138
137 KPMG China and the Hong Kong General Chamber of Commerce, The Greater Bay Area: A survey on key drivers for Success, September 2017. 138 KPMG China, HSBC and the Hong Kong General Chamber of Commerce, Navigating the Greater Bay Area: Second annual survey on key drivers for success, 2018.
GBA Background Document
© Copyright 2022 Foundation, 2019. 202
10. Background on the European Union
The European Union or EU provides an interesting benchmark for the GBA. The EU consists of 28
sovereign states which have joined together to form the world’s largest supranational economic bloc
in the world. In the process, the EU has pushed the limits of cross-national interaction and
integration farther than any other grouping in the world. This section looks at the evolution of the
EU, organization and decision making in the EU, the areas in which the EU, national states, or a
combination have jurisdiction and competence. The idea is to try to provide background on the
programs, policies, initiatives, and institutions that have fostered interaction and integration in the
EU as a first step toward drawing lessons from the EU for the GBA.
The EU Integration Process: Milestones
Following the signing of the European Coal and Steel Community (ECSC) in 1951, the sole purpose of
which was to place the main instruments of was – coal and steel – under supranational authority in
order to avert WWIII, the Treaty on the European Economic Community (EEC) was signed in 1957.
This treaty epitomizes the European functionalist approach towards integration. The idea was not to
create a federal state right away. The idea was to establish a common market, where all production
factors would move freely. If this proved to be a success, then integration would move to other
areas as well, such as economic, monetary and political integration.
To achieve the common market, the treaty provided for:
• Free movement of goods;
• Free movement of services;
• Free movement of workforce;
• Free movement of capital;
• Common competition law (including prohibition to subsidize at the member-state level).
Common competition law was the only tangible element of positive integration, as all member
states had to abide by the same rules that pre-established the intended degree of integration.
Free movement of goods, services and the workforce were initially based on the principle of non-
discrimination. Every member state had to treat goods/services/the workforce from other member
states in the same manner it treated its own. The limits of this approach were felt early on, and the
integration process changed course, albeit not at the same pace in the realm of each of the four
freedoms. This is why it is sensible to differentiate in what follows.
Free Movement of Goods
In 1979, the famous Cassis de Dijon case was the vehicle through which the Court of Justice of the
European Union (CJEU) opened the door to mutual recognition of standards. The German authorities
decided that French Cassis de Dijon could not be imported into Germany as a liqueur because it had
GBA Background Document
© Copyright 2022 Foundation, 2019. 203
an average alcoholic content of 15°-20°,139 whereas German regulations required a minimum
alcoholic content of 25°. Applying the principle of non-discrimination, France demanded that
German producers market their cassis under a different name. Germany complied and saw its sales
of cassis plummet in the French market. It then took the case to the CJEU. The CJEU established the
principle that all member states had to accept in their market products from other member states
unless “overriding reasons of public interest” (ORPIs) provided grounds for doing otherwise.
Considerations enumerated at the time of the decision were those “necessary in order to satisfy
mandatory requirements relating in particular to the effectiveness of fiscal supervision, the
protection of public health, the fairness of commercial transactions, and the defence of the
consumer.” The list of OPRIs has been further elaborated since that time. The main point, however,
is that this case paved the way for the doctrine of mutual recognition of regulation – a powerful
instrument of market integration.
In a little noticed communication in 1980, and then subsequently through important legislative
initiatives in 1986 and 1992, the European authorities endorsed this principle (acceptance of goods
from other member states) and transformed it into a regulatory principle. Over this period, and in
parallel, a number of initiatives were undertaken to harmonize production processes across Member
States. These proved ineffectual, basically on two grounds: 1) Voting procedures were cumbersome,
as unanimity was required for harmonization proposals to be formally adopted, and 2) The
instrument used when proposals were successful was the “regulation,” which binds discretion of
addressees (member states) both with respect to ends as well as means.
With the landmark single market project (1992), an important shift took place. Recognition became
the mode of integration (as per Cassis de Dijon). To avoid a regulatory “race to the bottom” this was
accompanied by a harmonization of minimum standards. That is, common minimum standards are
established that all products must respect in order to circulate freely in the common market. How
they respect the common minimum standard is left to the discretion of member states. There was a
shift from “regulations” to “directives” as the instruments that bind discretion as to the ends but not
the means. As a result of this last initiative benefits from innovation can also be reaped, while fully
respecting legal certainty and avoiding the race to the bottom.
Free Movement of Services
Integration in services followed a similar pattern, albeit at a substantially slower pace. Following a
series of decisions by the CJEU, Europeans became aware of the limits of non-discrimination in
ensuring integration. For example, in Klopp – a notorious legal decision later ruled out of order – the
French had allowed Klopp, a German lawyer, to practice in France only under the condition that he
would be removed from the German Bar. The justification was that, under French laws, French
attorneys could only be members in one French Bar.
The decision was taken to proceed on a sectoral basis in service integration. Directives would be
adopted, which would be sector-specific, aiming to integrate liberal professions. The starting point is
recognition, but there are adjustments, which might differ from one profession to the other. For
example, lawyers can freely establish themselves in another member state and use their national
139 ° refers to “proof” a measure of alcoholic content.
GBA Background Document
© Copyright 2022 Foundation, 2019. 204
title. For example, a German working in Belgium would be called “Anwalt” and not “Avocat,” and
could lawfully practice German, EU, and international law. Three years after establishment in
Belgium, the authorities would have the right to subject the German lawyer to an exam. If he/she
passed, then he/she could switch to the Belgian title, and practice Belgian law as well. From the
1980s onwards, sector-specific directives have been negotiated sequentially. Various reports amply
show that the services market in the EU is far less integrated than the goods market. This is not an
uncommon phenomenon in numerous jurisdictions globally with respect to professional services in
particular and presents an interesting, if politically complicated, opportunity for the GBA.
Free Movement of the Workforce
Under EU law, a worker is someone who cannot sell his/her labor independently. Workers must be
hired by someone. The overwhelming majority of jobs sought by workers are unregulated. It is the
principle of non-discrimination that is used as benchmark to integrate workers in foreign markets.
Nevertheless, to the extent that specific skills are concerned (e.g., bus drivers in Sweden must speak
Swedish), non-discrimination continues to apply but advantages may de facto be conferred upon
domestic workforce through legislation. A Swedish statutory request that bus drivers must speak
Swedish, for example, will benefit Swedish bus drivers.
A substantial body of case law has struck down unreasonable legislation (unrelated to the work for
which someone is hired) in the EU, and there is substantial EU legislation (from the mid-1980s
onwards) facilitating free movement. This has been accomplished by addressing issues such as the
right of families to reside where workers are employed, the payment of insurance/social security in
different countries, etc. It should be noted, however, that certain restrictions can be applied to free
movement. Entry can be denied for public policy, public security, and public health reasons. EU
citizens do not have a right to jobs in the host Member State’s public service, but this restriction is
narrowly interpreted. Free movement applies to individuals working in their own right, not those on
employment contracts. Finally, although ill-defined and subject to different interpretations among
Member States, European legislation does include safeguards to prevent inactive citizens from
becoming burdensome on social support systems.
Free Movement of Capital
When it comes to movement of capital, it is necessary to distinguish between the EU internal market
and its external relations, and between foreign direct investment (FDI) and portfolio investment.140
Within the EU market, there are practically no frontiers when it comes to FDI as a result of various
initiatives (regulations and directives) that have been adopted from 1992 onwards (some even
before, but of rather peripheral nature). Non-discrimination is the guiding principle. In addition, it is
140 FDI is defined as “that category of investment that reflects the objective of obtaining a lasting
Interest by an investor in one economy in an enterprise resident in another economy...[S]uch an interest is
formally deemed to exist when a direct investor owns 10% or more of the voting power on the board of
directors (for an incorporated enterprise) or the equivalent (for an unincorporated enterprise).” Eurostat
definition.
GBA Background Document
© Copyright 2022 Foundation, 2019. 205
the EU that retains competence to sign agreements with rest of the world on FDI. It is member
states that retain competence to do the same with respect to portfolio investment.
When it comes to inward investment, before the end of 2018, it is expected that the Commission
will have tabled its proposal to move towards establishing an EU entity to review proposed
investments from an EU security perspective (Similar to the US Committee on Foreign Investment in
the United States – CFIUS). At the moment of writing, there have already been cases where identical
foreign investments have been treated in different ways in two-member states. For example,
Chinese investment in ports has been welcomed in Greece, but prohibited in Germany.
Common Competition Law (including prohibition to subsidize at the member-state level)
The EU has a common competition law and is considered essential to support the four freedoms. EU
competition laws cover cartels and control of collusion, market dominance, mergers, acquisitions
and joint ventures and state aids (subsidies). The competition rules are administered by the
Commission and possess a wide remit, able to generate its own investigations and take cases from
Member States, and any juridical or natural persons with a legitimate interest in the matter. The
competition authority has the authority to levy fines like the CJEU does. Competition enforcement
might entail cooperation with national authorities, when, for example, the Commission deals with
issues of a local nature, and/or is deprived of information that national competition authorities
possess.
As with competition policy, the control of state aids of subsidies is also regarded as essential to
protect the four freedoms. Members States are not permitted to aid or subsidize private parties in a
manner that distorts free competition. Exemptions may be made for natural disasters and regional
development. In general, sate aids are illegal unless permitted under an exemption or notified.
The Legislative Process in the EU
There are three main institutions of the EU:
• The Commission is the independent 30,000-strong executive arm of the EU responsible for
administering EU policy. It also has the unique authority to propose legislation. It is led by
Commissioners, of which there is one form each Member State. Each Commissioner will be
given a portfolio and there is also the Commission President, selected by Member States.
• The Council is comprised of government ministers from each member state. It is empowered
to make laws and shape policy and directs the Commission accordingly.
• The European Parliament represents the citizens of the EU through a direct electoral
process. It is sometimes required to give consent, so sharing the claim to democratic
legitimacy with the Council by directly representing citizens while that latter represents the
national governments that those citizens have elected. The Parliament’s authority and range
of powers has been growing over the years and it is particularly active regarding budgetary
and financial matters.
In short, the Commission proposes, the Council decides, European Parliament is consulted, and
sometimes (for the most part when there are financial implications) has to give its consent.
GBA Background Document
© Copyright 2022 Foundation, 2019. 206
Why does it work this way? EU legislation must promote EU welfare. Among the EU bodies, it is the
EU Commission that is mandated to think in terms of EU-wide welfare. The decision-making powers
of the Council convey democratic legitimacy, since it is composed of member states’ delegates.
Thus, acceptance of a Commission proposal by the Council guarantees that the bureaucratic
initiative also enjoys democratic legitimacy. Finally, the democratic legitimacy of the EU is further
reinforced by the directly elected European Parliament.
How does the Commission exercise its right of initiative? First, the Commission is lobbied, like the US
administration is, by the dozens of lobbies that have their headquarters in Brussels. Informally, it is
also lobbied by the Member States who have a particular interest they wish to defend. Finally, the
Commission knows that by aligning its initiatives with priorities articulated by the European Council,
the chances of seeing them adopted is substantially increased, even though European Council
statements and declarations are non-binding.141
How does the Council decide? The EU statutes provide for two modes of decision-making: unanimity,
reserved for areas of shared interest and qualified majority, for areas of exclusive competence of the
EU. There are of course, ongoing battles between the Commission and the Council, the first arguing
for expansion of the domain of the latter, whereas the second seeing almost everything as “shared
competence.” Their disputes routinely find their way to the CJEU, which is the ultimate arbiter.
Who else is implicated in the legislative/decision-making process? There is a long list of committees
that can be involved in these processes. It largely depends on the subject matter. Committees are
usually staffed by delegates from Member States experts in particular areas under consideration. It
is this type of involvement that has given rise to discussions and literature on “comitology” in the
EU. Occasionally, outside experts are also invited to provide expertise on relevant issues. And,
depending on the existence of international commitments, joint committees with delegations from
foreign countries are involved (the Comprehensive Economic and Trade Agreements (CETA)
between the EU and Canada, for example, provides for extensive cooperation on various regulatory
issues).
EU Competences and Relations with Member States
One of the key features of the EU is that jurisdiction, or competence, over some matters lies with
the EU, some with Member States, and some have shared jurisdiction or competence.
The Source and Distribution of Competences in the European Union
All competences enjoyed by the EU stem from Member States and are conferred upon the EU by the
Member States through the Treaties. Competences not explicitly conferred upon the EU remain with
the individual Member States. In addition to national competences that reside exclusively with
141 Note that the ‘European Council’ is not to be confused with the ‘Council’ referred to previously. The European Council is the body comprised of heads of state and government, and provides non-binding, strategic thinking about the future of the EU. The Council, on the other hand, meets in various formations – Ministers of Foreign Affairs, Economics, Agriculture etc. – and is the decisive organ of the EU.
GBA Background Document
© Copyright 2022 Foundation, 2019. 207
individual Member States, EU competences can be divided into three categories – exclusive
competences, shared competences, and supporting competences.
These categorizations are relatively recent, dating back to a consolidation exercise undertaken in the
Lisbon Treaty in 2009. Prior to that, understanding the disposition of competences necessitated a
laborious trawl through multiple treaties and legal precedents. It remains the case, however, that
the distribution of competences is a shifting panorama, affected by determinations of EU decision-
making authorities, including both the Council and the CJEU. This is so because the EU is an ever-
evolving integration process. For example, there was no mention of monetary union in the original
treaties. With the 1993 Maastricht Treaty though, the EU member states felt that the time was ripe
to add European Monetary Union and eventually introduce the Euro.
It is worth drawing attention to the unifying (and potentially divisive as we have seen from Brexit)
theme of the single market that underlies much EU thinking. The four freedoms – freedom of
movement of capital, labor, goods, and services – were articulated at the outset, in the Treaty of
Rome in 1957. They became associated, if not synonymous, with the single market as that took
shape of over the years, representing the core economic aspiration of the EU. The competences are
designed to serve that end.
Exclusive Competence
Exclusive competence (defined in Article 3 of the Treaty on the functioning of the European Union –
TFEU) entails that only the EU can decide on an issue.
The areas where the EU has exclusive competence include:
• Establishment of competition rules (including state aids) for the internal market;
• Monetary policy, but only in the Eurozone;
• Common fisheries policy;
• Common commercial policy (essentially elements of trade policy, including the customs
union)
In all areas where the EU has exclusive competence, it can also sign international agreements under
its name.
Shared Competence
Shared competence (Article 4, TFEU) is the most complicated case because it has to deal with the
division of responsibility between the EU and its Members. Both the EU and Member States can in
principle intervene. But EU intervention pre-empts that of Member States. Member States can
exercise competence where the EU decides not to. Article 3.2 TFEU States that the EU shall have
exclusive competence for completing an international agreement when this is provided for
legislatively, or when it is necessary to for the Union to exercise its internal competence, or when
Member State action could affect common rules or alter their scope. Whereas the first category of
cases is clearly stipulated in law, the other two are essentially a judgment call. Litigation between
GBA Background Document
© Copyright 2022 Foundation, 2019. 208
the EU institutions (typically, the Commission arguing for EU competence, and the Council opposing
it) is possible, and has happened a few times.
This EU right of pre-emption must, however, satisfy the principle of subsidiarity (Article 5 of the
Treaty of the European Union – TEU). To satisfy this principle, the EU must show that pre-emption is
necessary, because an objective cannot be satisfactorily achieved by a Member State on account of
the scale and effect of the measure. Subsidiarity is considered desirable in bringing regulatory
actions as close as practicable to the citizens. Thus, the default presumption is that action should
take place at the lowest possible level (Member States). Only if similar action is deemed inefficient
or counter-productive, will the Commission have the right to intervene and propose action at the
EU-level.
A relevant additional principle spelled out in Article 5 TEU is that of proportionality. This requires
that the scope and content of EU action should not exceed what is necessary to achieve Treaty
objectives.
The major areas of shared competence include:
• Internal market;
• Social policy where so defined in the Treaty;
• Economic, social and territorial cohesion;
• Agriculture and fisheries (excluding the common fisheries policy);
• Environment;
• Consumer protection;
• Trans-European networks;
• Energy;
• Freedom, security and justice;
• Common safety matters in public health, as defined in the Treaty.
Supporting Competence
The Union is empowered to carry out actions to support, coordinate, or supplement actions of the
Member States. EU laws and regulations must not require harmonization in the areas concerned.
The policy domains implicated include:
• Protection and improvement of human health;
• Industry (R&D);
• Culture;
• Tourism;
• Education, vocational training, youth and sport;
• Civil protection;
• Administrative cooperation.
GBA Background Document
© Copyright 2022 Foundation, 2019. 209
Decision-making in the EU
As indicated above, there are three core players across all areas of EU decision-making: The
Commission, The Council, and The European Parliament. Decisions are also taken (and influenced)
by the CJEU when its rulings arising from disputes modify the status quo. No action by the EU
institutions is deemed, in principle, non-justiciable. The CJEU has exercised a deferential standard of
review in cases where the “EU interest” has been evaluated by an EU institution. For the EU to be
able to enforce integration measures, substantial authority had to be vested in the CJEU, which was
a major step for sovereign nations to agree to be bound by the decisions of an EU-level court.
Without a powerful CJEU, the EU would not have been able to achieve its current level of
integration.
The Council is the true power house of the EU, since it is where its individual constituent members
meet and take decisions. It has two identities – the European Council, convenes at Head of
Government of Head of State level (typically, an entity deciding on strategy), and the various
Councils, which comprise ministers from the Member States who have functional competence for
the matters before the Council at any given time (e.g., Foreign Affairs; Public Health etc.). It is this
latter Council that is a deciding organ, in the sense that it adopts legally binding decisions.
For matters falling under shared competence, Member States convening at the Council must
unanimously approve suggestions by the Commission. For matters coming under exclusive EU
competence, the Council, following a proposal by the Commission to this effect, will decide by
qualified majority voting (QMV): a vote can be carried with a minimum of 55 percent of Members
States (i.e. 16/28) representing 65 percent of the population. These numbers were selected to
ensure that the large countries could not carry the day without some support from smaller Member
States. The Lisbon Treaty of 2009 was instrumental in introducing QMV in many areas where the
previous rule had been unanimity. It is noteworthy, however, that often in practice there tends to be
a preference for avoiding votes and using the mechanism as an instrument of negotiation rather
than an implicit expression of disagreement.
Behind the three leading decision-making authorities – Commission, Council, and European
Parliament – various committees intervene in the law-making process, depending on the subject-
matter. For example, a regulation about food safety in the EU will definitely involve the EFSA (the
European Food Safety Authority), and most likely a few standard-setting institutions, since the EU is
bound by the WTO’s Sanitary and Phytosanitary Measures Agreement. The WTO Agreement
mandates international standards in this area whenever relevant and appropriate.
What we can extrapolate from the hundreds of committees is that before actual decisions are taken
by the core EU institutions, the subject-matter is determinant as to who else is involved. Committees
(usually “mixed,” so that both EU (Commission) and Member State officials participate) will be
involved in an advisory capacity. They have to be consulted (otherwise, procedural defects could be
fatal for the end product of the legislative process), but their opinion can be disregarded.
GBA Background Document
© Copyright 2022 Foundation, 2019. 210
Competence by Topic: the EU “Competence Matrix”
For purposes of this project, we have developed a matrix that describes where competence lies in a
series of policy areas:
a. Goods: trade, product / safety standards, mutual recognition. Licensing, food
safety;
b. Services: trade, standards, mutual recognition, licensing;
c. Financial services: trade, financial flows, currency (including single currency),
licensing;
d. Capital: FDI, portfolio investment, intra-EU investment;
e. Labor: flow of labor (worker migration), business visas, labor standards;
f. Migration: ability to move between countries, ability to buy property in other EU
countries;
g. Culture: cooperation, safeguarding, joint investment if any;
h. Environment: standards, cooperation, adjudication;
i. Infrastructure / transportation: cooperation, standards, joint planning;
j. Information society: cooperation, regulation, privacy;
k. Research and innovation: cooperation, funding;
l. Public health: cooperation, sharing of information;
m. Competition policy;
n. State aid (in general and as it pertains to competition policy in particular);
o. Others that we have identified for the Guangdong and HK teams (?).
These have been addressed as clearly as possible in the matrix below. One constraint is that the
categories above do not coincide precisely in every case with the policy structure and design
employed in the EU treaties. We have nevertheless done what we can in matching them up. This will
cease to be a problem when we can identify more precisely which policy areas are going to be of
primary interest in the GBA and more importantly what the parameters are for feasible action on
particular issues in the local context. That will allow us to enter the specific areas in more depth.
On the basis of the above discussion, we can classify headings (a), (b), (c), (e), (h), (i) and (n) as
internal market policies in respect of which there is shared competence. The same applies to (d),
with the exception of portfolio investment.
Item (f) concerns migration and is also shared competence, but partly an exclusive EU competence
as well. The latter applies to EU citizens, who enjoy the freedom of movement of persons, as one of
the four freedoms embedded in the single market regime. The EU Member States are, in principle,
permitted to manage non-EU citizen migration as they deem appropriate. There is, however, a
parallel EU regime to deal with certain non-EU migrants. If it is “refugees,” as the term is understood
in public international law, there are international conventions binding EU Member States, which
require them to adopt a very precise course of action. If not, if for example, we are dealing with
economic migrants, it is for each Member State to individually decide on their fate, unless there is an
EU commitment under the General Agreement on Trade in Services (GATS) on the movement of
natural persons.
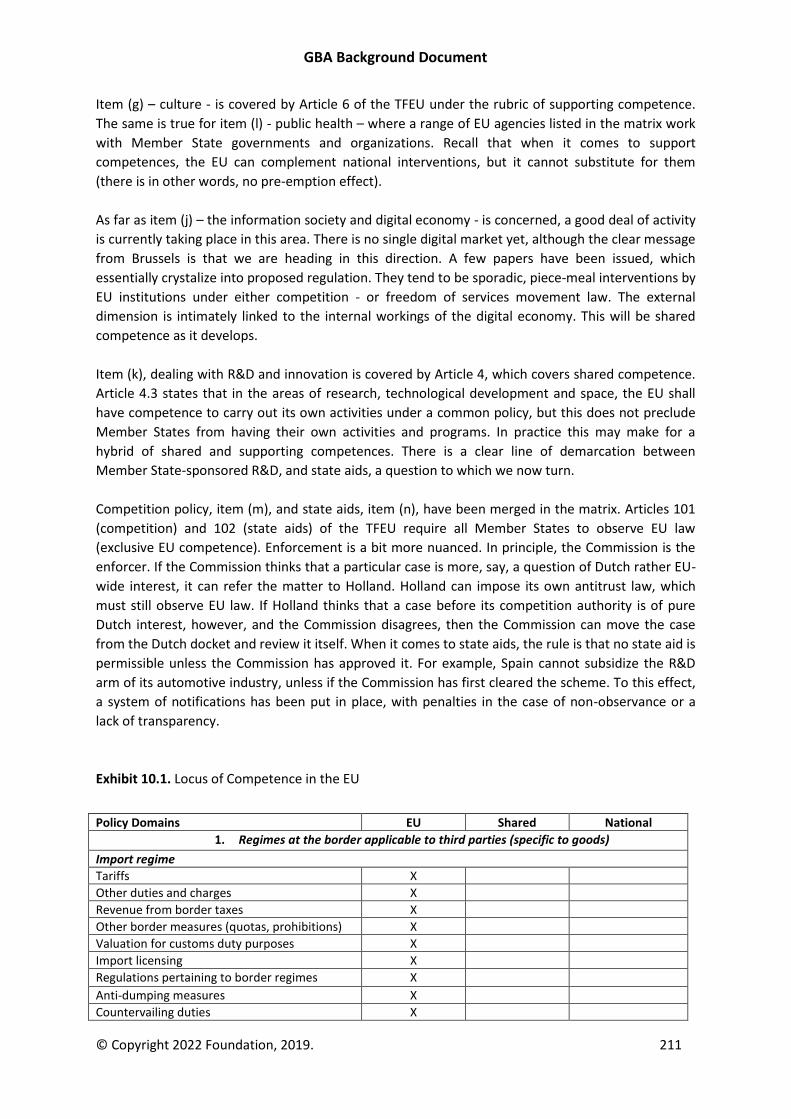
GBA Background Document
© Copyright 2022 Foundation, 2019. 211
Item (g) – culture - is covered by Article 6 of the TFEU under the rubric of supporting competence.
The same is true for item (l) - public health – where a range of EU agencies listed in the matrix work
with Member State governments and organizations. Recall that when it comes to support
competences, the EU can complement national interventions, but it cannot substitute for them
(there is in other words, no pre-emption effect).
As far as item (j) – the information society and digital economy - is concerned, a good deal of activity
is currently taking place in this area. There is no single digital market yet, although the clear message
from Brussels is that we are heading in this direction. A few papers have been issued, which
essentially crystalize into proposed regulation. They tend to be sporadic, piece-meal interventions by
EU institutions under either competition - or freedom of services movement law. The external
dimension is intimately linked to the internal workings of the digital economy. This will be shared
competence as it develops.
Item (k), dealing with R&D and innovation is covered by Article 4, which covers shared competence.
Article 4.3 states that in the areas of research, technological development and space, the EU shall
have competence to carry out its own activities under a common policy, but this does not preclude
Member States from having their own activities and programs. In practice this may make for a
hybrid of shared and supporting competences. There is a clear line of demarcation between
Member State-sponsored R&D, and state aids, a question to which we now turn.
Competition policy, item (m), and state aids, item (n), have been merged in the matrix. Articles 101
(competition) and 102 (state aids) of the TFEU require all Member States to observe EU law
(exclusive EU competence). Enforcement is a bit more nuanced. In principle, the Commission is the
enforcer. If the Commission thinks that a particular case is more, say, a question of Dutch rather EU-
wide interest, it can refer the matter to Holland. Holland can impose its own antitrust law, which
must still observe EU law. If Holland thinks that a case before its competition authority is of pure
Dutch interest, however, and the Commission disagrees, then the Commission can move the case
from the Dutch docket and review it itself. When it comes to state aids, the rule is that no state aid is
permissible unless the Commission has approved it. For example, Spain cannot subsidize the R&D
arm of its automotive industry, unless if the Commission has first cleared the scheme. To this effect,
a system of notifications has been put in place, with penalties in the case of non-observance or a
lack of transparency.
Exhibit 10.1. Locus of Competence in the EU
Policy Domains EU Shared National
1. Regimes at the border applicable to third parties (specific to goods)
Import regime
Tariffs X
Other duties and charges X
Revenue from border taxes X
Other border measures (quotas, prohibitions) X
Valuation for customs duty purposes X
Import licensing X
Regulations pertaining to border regimes X
Anti-dumping measures X
Countervailing duties X
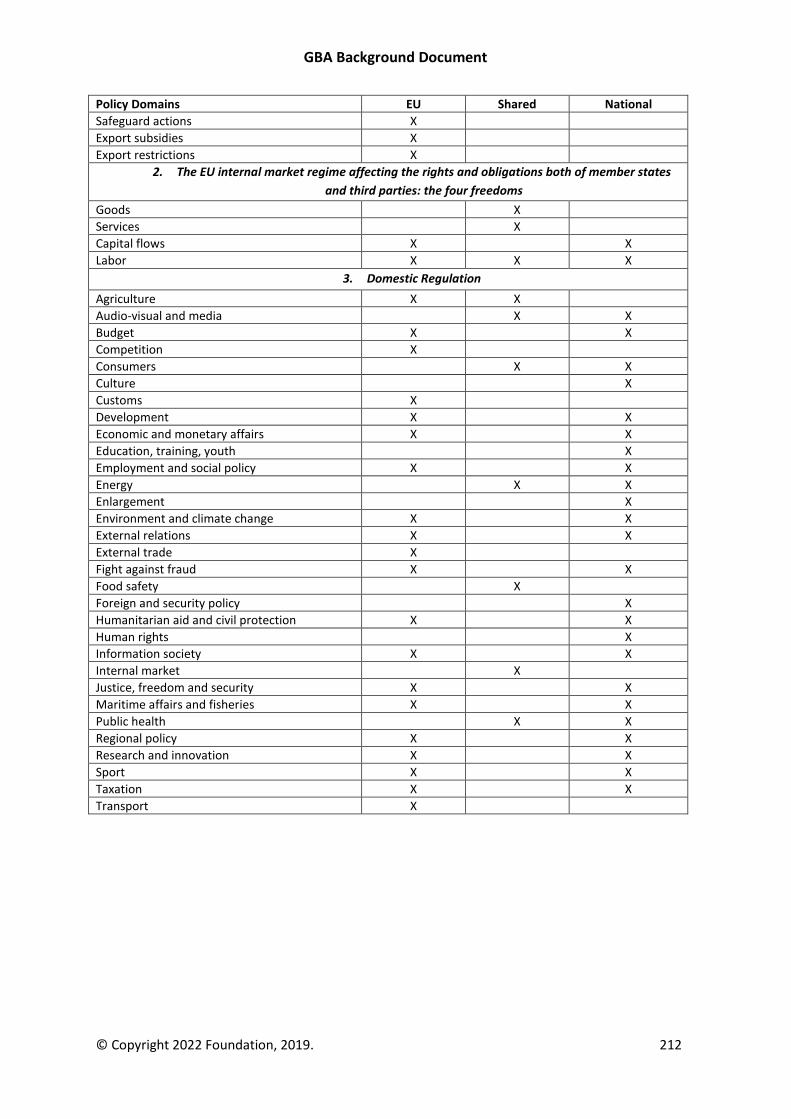
GBA Background Document
© Copyright 2022 Foundation, 2019. 212
Policy Domains EU Shared National
Safeguard actions X
Export subsidies X
Export restrictions X
2. The EU internal market regime affecting the rights and obligations both of member states
and third parties: the four freedoms
Goods X
Services X
Capital flows X X
Labor X X X
3. Domestic Regulation
Agriculture X X
Audio-visual and media X X
Budget X X
Competition X
Consumers X X
Culture X
Customs X
Development X X
Economic and monetary affairs X X
Education, training, youth X
Employment and social policy X X
Energy X X
Enlargement X
Environment and climate change X X
External relations X X
External trade X
Fight against fraud X X
Food safety X
Foreign and security policy X
Humanitarian aid and civil protection X X
Human rights X
Information society X X
Internal market X
Justice, freedom and security X X
Maritime affairs and fisheries X X
Public health X X
Regional policy X X
Research and innovation X X
Sport X X
Taxation X X
Transport X
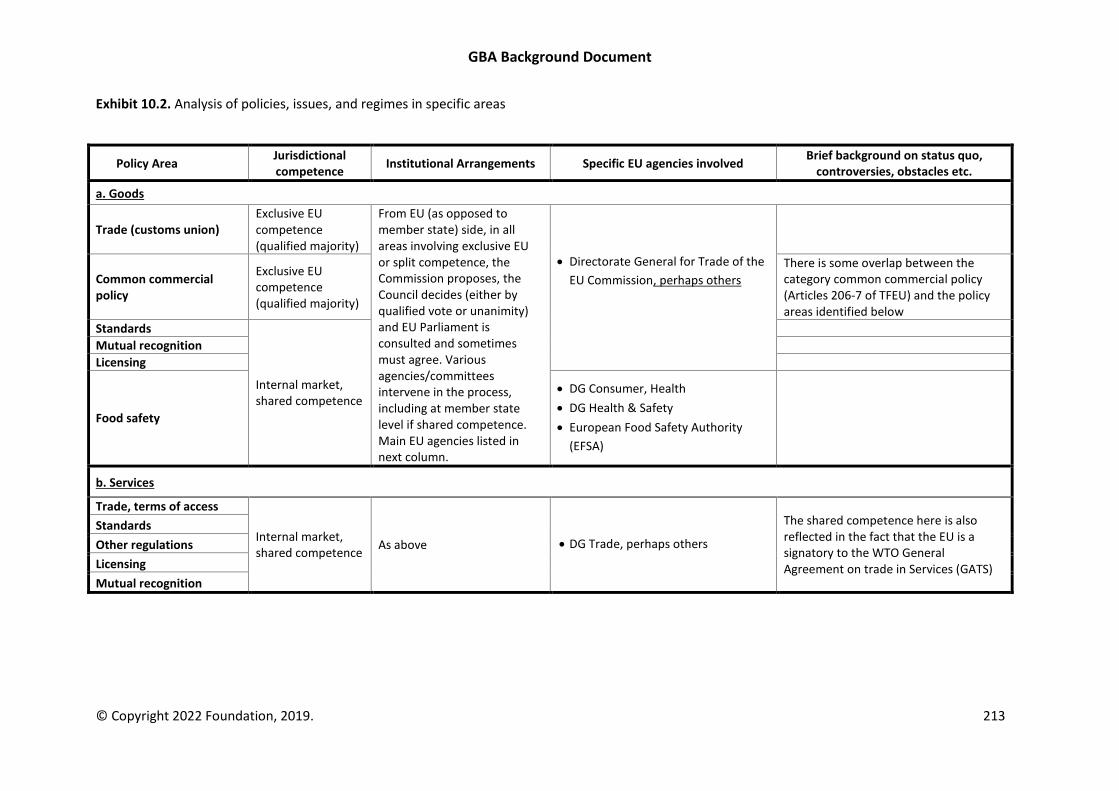
GBA Background Document
© Copyright 2022 Foundation, 2019. 213
Exhibit 10.2. Analysis of policies, issues, and regimes in specific areas
Policy Area Jurisdictional competence
Institutional Arrangements Specific EU agencies involved Brief background on status quo,
controversies, obstacles etc.
a. Goods
Trade (customs union) Exclusive EU competence (qualified majority)
From EU (as opposed to member state) side, in all areas involving exclusive EU or split competence, the Commission proposes, the Council decides (either by qualified vote or unanimity) and EU Parliament is consulted and sometimes must agree. Various agencies/committees intervene in the process, including at member state level if shared competence. Main EU agencies listed in next column.
• Directorate General for Trade of the
EU Commission, perhaps others
Common commercial policy
Exclusive EU competence (qualified majority)
There is some overlap between the category common commercial policy (Articles 206-7 of TFEU) and the policy areas identified below
Standards
Internal market, shared competence
Mutual recognition
Licensing
Food safety
• DG Consumer, Health
• DG Health & Safety
• European Food Safety Authority
(EFSA)
b. Services
Trade, terms of access
Internal market, shared competence
As above • DG Trade, perhaps others
The shared competence here is also reflected in the fact that the EU is a signatory to the WTO General Agreement on trade in Services (GATS)
Standards
Other regulations
Licensing
Mutual recognition
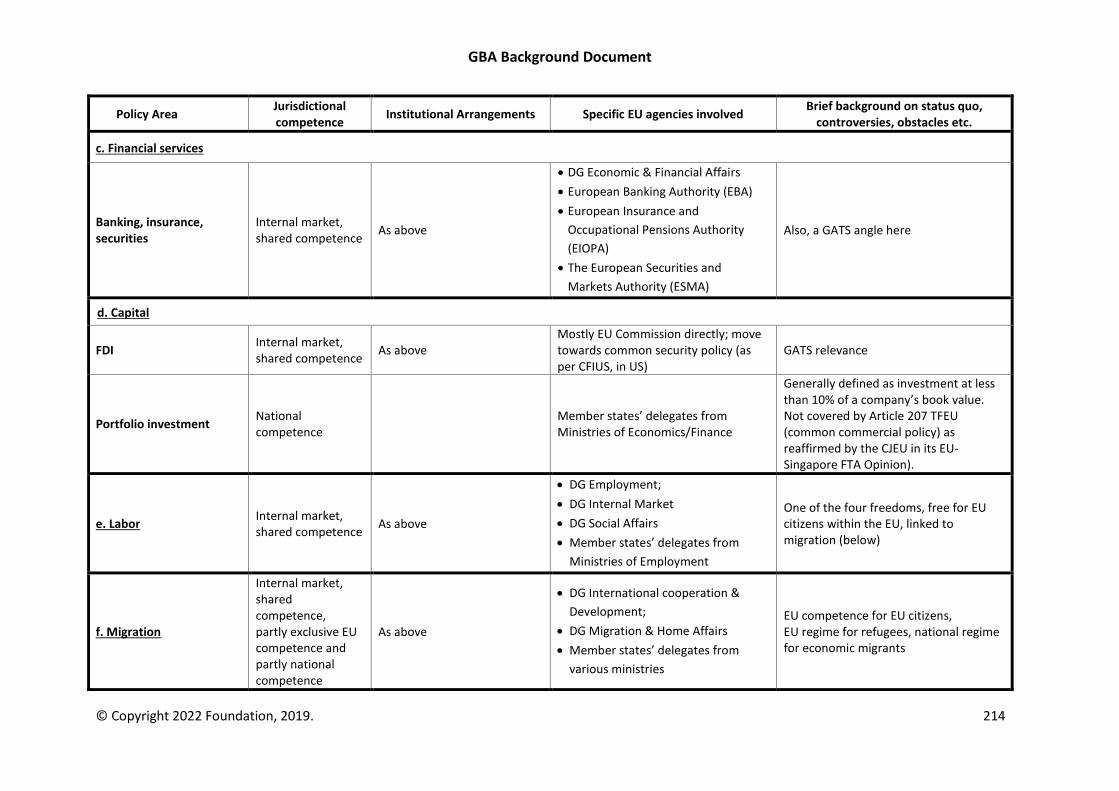
GBA Background Document
© Copyright 2022 Foundation, 2019. 214
Policy Area Jurisdictional competence
Institutional Arrangements Specific EU agencies involved Brief background on status quo,
controversies, obstacles etc.
c. Financial services
Banking, insurance, securities
Internal market, shared competence
As above
• DG Economic & Financial Affairs
• European Banking Authority (EBA)
• European Insurance and
Occupational Pensions Authority
(EIOPA)
• The European Securities and
Markets Authority (ESMA)
Also, a GATS angle here
d. Capital
FDI Internal market, shared competence
As above Mostly EU Commission directly; move towards common security policy (as per CFIUS, in US)
GATS relevance
Portfolio investment National competence
Member states’ delegates from Ministries of Economics/Finance
Generally defined as investment at less than 10% of a company’s book value. Not covered by Article 207 TFEU (common commercial policy) as reaffirmed by the CJEU in its EU-Singapore FTA Opinion).
e. Labor Internal market, shared competence
As above
• DG Employment;
• DG Internal Market
• DG Social Affairs
• Member states’ delegates from
Ministries of Employment
One of the four freedoms, free for EU citizens within the EU, linked to migration (below)
f. Migration
Internal market, shared competence, partly exclusive EU competence and partly national competence
As above
• DG International cooperation &
Development;
• DG Migration & Home Affairs
• Member states’ delegates from
various ministries
EU competence for EU citizens, EU regime for refugees, national regime for economic migrants
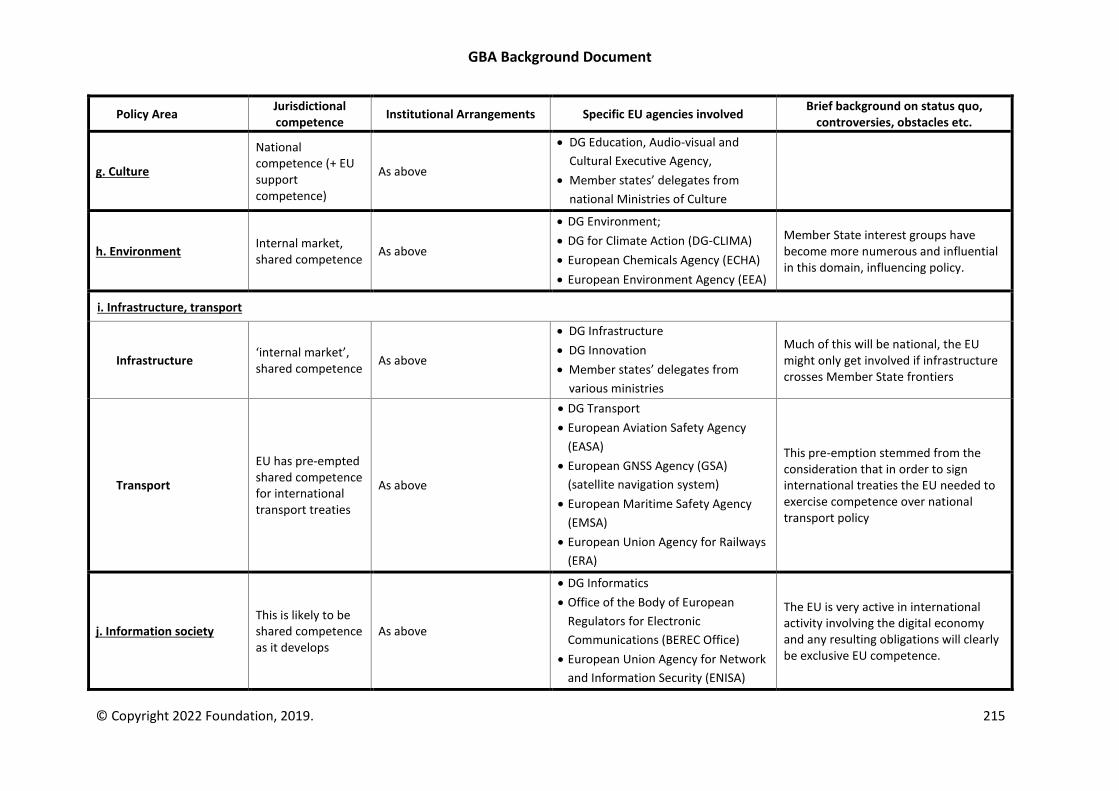
GBA Background Document
© Copyright 2022 Foundation, 2019. 215
Policy Area Jurisdictional competence
Institutional Arrangements Specific EU agencies involved Brief background on status quo,
controversies, obstacles etc.
g. Culture
National competence (+ EU support competence)
As above
• DG Education, Audio-visual and
Cultural Executive Agency,
• Member states’ delegates from
national Ministries of Culture
h. Environment Internal market, shared competence
As above
• DG Environment;
• DG for Climate Action (DG-CLIMA)
• European Chemicals Agency (ECHA)
• European Environment Agency (EEA)
Member State interest groups have become more numerous and influential in this domain, influencing policy.
i. Infrastructure, transport
Infrastructure ‘internal market’, shared competence
As above
• DG Infrastructure
• DG Innovation
• Member states’ delegates from
various ministries
Much of this will be national, the EU might only get involved if infrastructure crosses Member State frontiers
Transport
EU has pre-empted shared competence for international transport treaties
As above
• DG Transport
• European Aviation Safety Agency
(EASA)
• European GNSS Agency (GSA)
(satellite navigation system)
• European Maritime Safety Agency
(EMSA)
• European Union Agency for Railways
(ERA)
This pre-emption stemmed from the consideration that in order to sign international treaties the EU needed to exercise competence over national transport policy
j. Information society This is likely to be shared competence as it develops
As above
• DG Informatics
• Office of the Body of European
Regulators for Electronic
Communications (BEREC Office)
• European Union Agency for Network
and Information Security (ENISA)
The EU is very active in international activity involving the digital economy and any resulting obligations will clearly be exclusive EU competence.
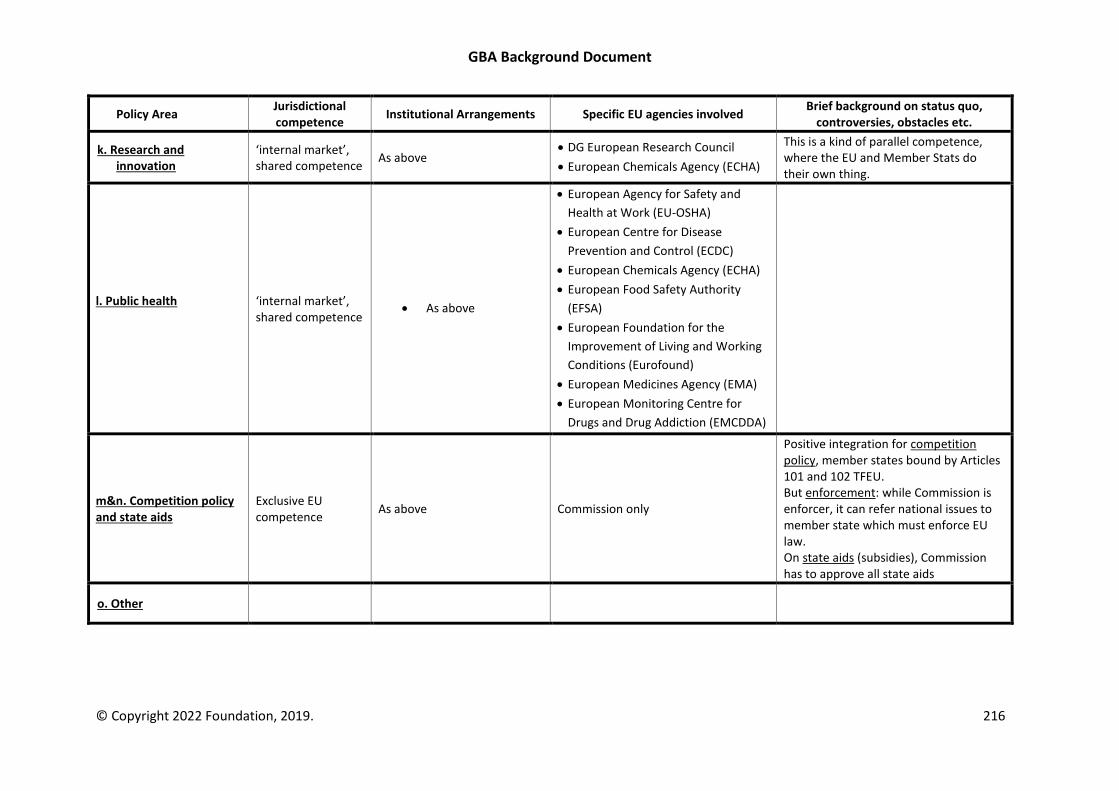
GBA Background Document
© Copyright 2022 Foundation, 2019. 216
Policy Area Jurisdictional competence
Institutional Arrangements Specific EU agencies involved Brief background on status quo,
controversies, obstacles etc.
k. Research and innovation
‘internal market’, shared competence
As above • DG European Research Council
• European Chemicals Agency (ECHA)
This is a kind of parallel competence, where the EU and Member Stats do their own thing.
l. Public health
‘internal market’, shared competence
• As above
• European Agency for Safety and
Health at Work (EU-OSHA)
• European Centre for Disease
Prevention and Control (ECDC)
• European Chemicals Agency (ECHA)
• European Food Safety Authority
(EFSA)
• European Foundation for the
Improvement of Living and Working
Conditions (Eurofound)
• European Medicines Agency (EMA)
• European Monitoring Centre for
Drugs and Drug Addiction (EMCDDA)
m&n. Competition policy and state aids
Exclusive EU competence
As above Commission only
Positive integration for competition policy, member states bound by Articles 101 and 102 TFEU. But enforcement: while Commission is enforcer, it can refer national issues to member state which must enforce EU law. On state aids (subsidies), Commission has to approve all state aids
o. Other
GBA Background Document
© Copyright 2022 Foundation, 2019. 217
EU Organization
As indicated above, the three main institutions of the EU are the Council of the European Union,
which represents the governments of the individual member countries (the Presidency of the
Council is shared by the member states on a rotating basis); the European Commission, which
represents the interests of the Union as a whole; and the European Parliament, which represents
the EU’s citizens and is directly elected by them. In addition, the Court of Justice of the EU upholds
the rule of European law and the Court of Auditors checks the financing of the EU's activities.
Specialized institutions include the European Central Bank, the European External Action Service, the
European Economic and Social Committee, the European Committee of the Regions, the European
Investment Bank, the European Ombudsman, the European Data Protection Supervisor, the
Publications Office, the European Personnel Selection Office, the European School of Administration,
and numerous agencies that handle technical, scientific, and management tasks.142
As of 2018, the EU Commission had 53 Directorates, Executive Agencies, and Service Departments.
The Directorates (or Directorates General) were responsible for developing, implementing, and
managing EU policy, law, and funding programs. The Executive Agencies were responsible for
managing programs setup by the Commission. The Service Departments provided supporting
services to the Directorates General. A listing can be found in Exhibit 10.3. The breakdown of the EU
Commission’s 32,196 employees in 2018 can be found in Exhibit 10.4. The breakdown of its €160
billion budget can be found in Exhibit 10.5.
142 European Union, “Institutions and bodies,” 22 May 2018.
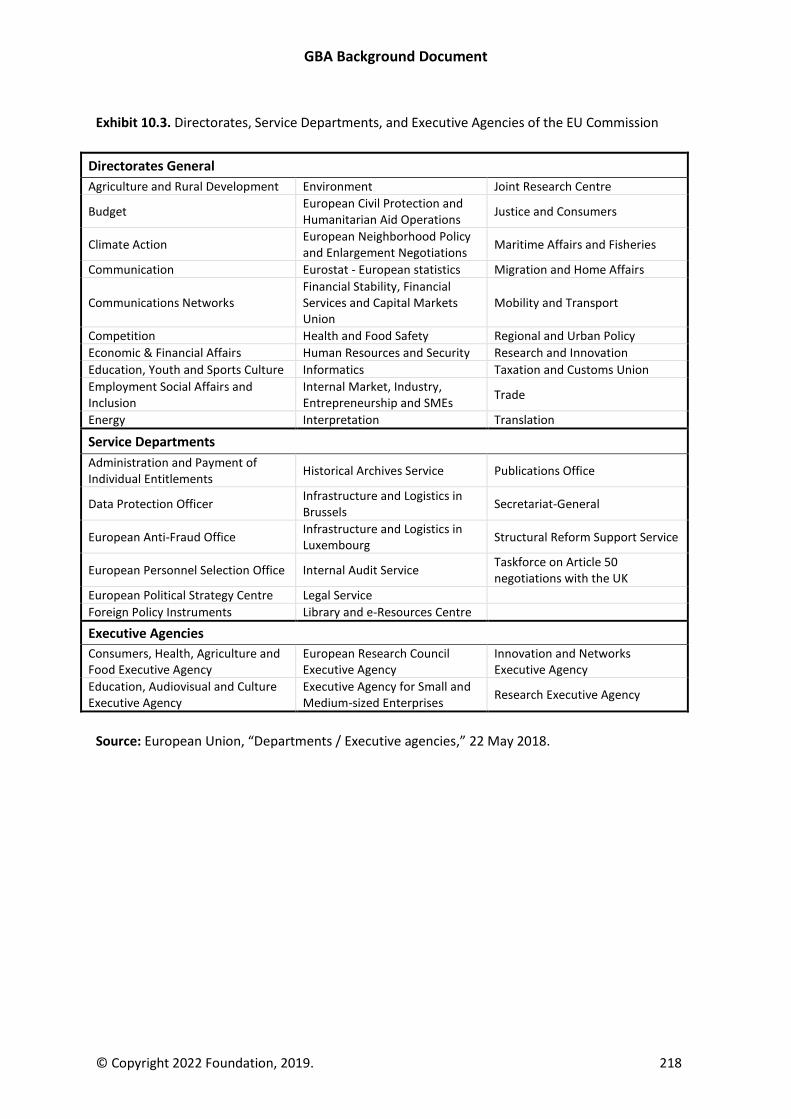
GBA Background Document
© Copyright 2022 Foundation, 2019. 218
Exhibit 10.3. Directorates, Service Departments, and Executive Agencies of the EU Commission
Directorates General
Agriculture and Rural Development Environment Joint Research Centre
Budget European Civil Protection and Humanitarian Aid Operations
Justice and Consumers
Climate Action European Neighborhood Policy and Enlargement Negotiations
Maritime Affairs and Fisheries
Communication Eurostat - European statistics Migration and Home Affairs
Communications Networks Financial Stability, Financial Services and Capital Markets Union
Mobility and Transport
Competition Health and Food Safety Regional and Urban Policy
Economic & Financial Affairs Human Resources and Security Research and Innovation
Education, Youth and Sports Culture Informatics Taxation and Customs Union
Employment Social Affairs and Inclusion
Internal Market, Industry, Entrepreneurship and SMEs
Trade
Energy Interpretation Translation
Service Departments
Administration and Payment of Individual Entitlements
Historical Archives Service Publications Office
Data Protection Officer Infrastructure and Logistics in Brussels
Secretariat-General
European Anti-Fraud Office Infrastructure and Logistics in Luxembourg
Structural Reform Support Service
European Personnel Selection Office Internal Audit Service Taskforce on Article 50 negotiations with the UK
European Political Strategy Centre Legal Service
Foreign Policy Instruments Library and e-Resources Centre
Executive Agencies
Consumers, Health, Agriculture and Food Executive Agency
European Research Council Executive Agency
Innovation and Networks Executive Agency
Education, Audiovisual and Culture Executive Agency
Executive Agency for Small and Medium-sized Enterprises
Research Executive Agency
Source: European Union, “Departments / Executive agencies,” 22 May 2018.
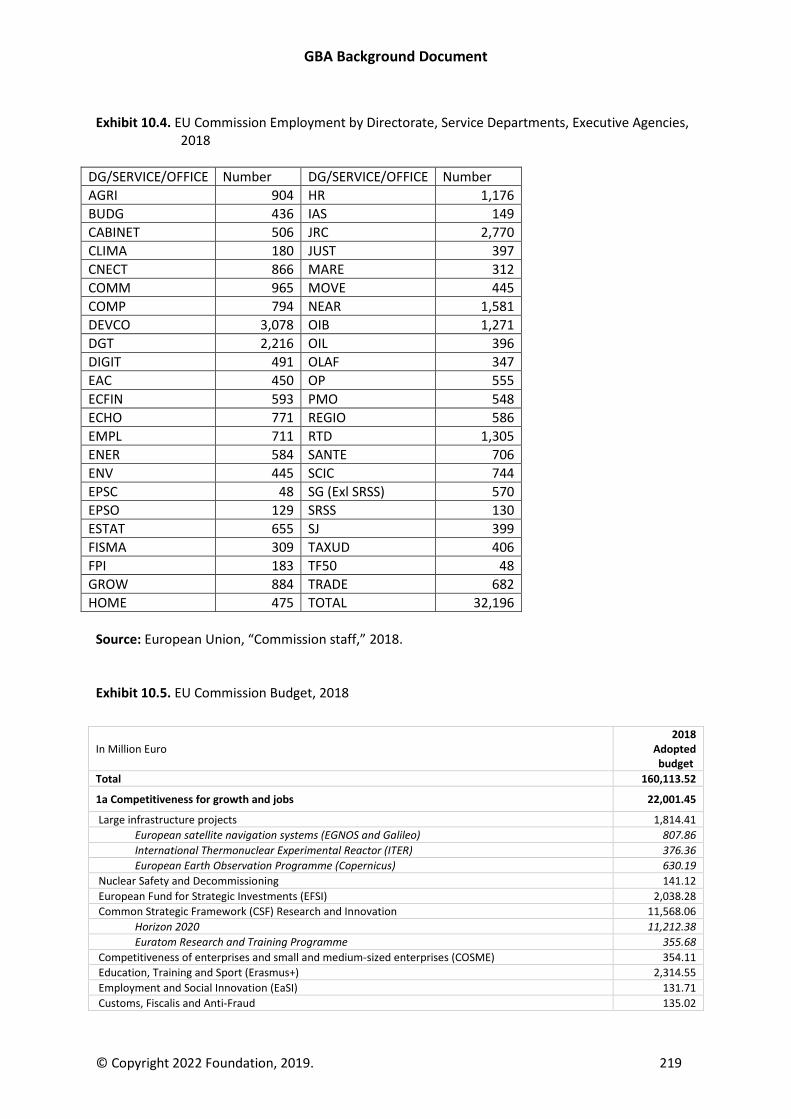
GBA Background Document
© Copyright 2022 Foundation, 2019. 219
Exhibit 10.4. EU Commission Employment by Directorate, Service Departments, Executive Agencies, 2018
DG/SERVICE/OFFICE Number DG/SERVICE/OFFICE Number
AGRI 904 HR 1,176
BUDG 436 IAS 149
CABINET 506 JRC 2,770
CLIMA 180 JUST 397
CNECT 866 MARE 312
COMM 965 MOVE 445
COMP 794 NEAR 1,581
DEVCO 3,078 OIB 1,271
DGT 2,216 OIL 396
DIGIT 491 OLAF 347
EAC 450 OP 555
ECFIN 593 PMO 548
ECHO 771 REGIO 586
EMPL 711 RTD 1,305
ENER 584 SANTE 706
ENV 445 SCIC 744
EPSC 48 SG (Exl SRSS) 570
EPSO 129 SRSS 130
ESTAT 655 SJ 399
FISMA 309 TAXUD 406
FPI 183 TF50 48
GROW 884 TRADE 682
HOME 475 TOTAL 32,196
Source: European Union, “Commission staff,” 2018. Exhibit 10.5. EU Commission Budget, 2018
In Million Euro 2018
Adopted budget
Total 160,113.52
1a Competitiveness for growth and jobs 22,001.45
Large infrastructure projects 1,814.41
European satellite navigation systems (EGNOS and Galileo) 807.86
International Thermonuclear Experimental Reactor (ITER) 376.36
European Earth Observation Programme (Copernicus) 630.19
Nuclear Safety and Decommissioning 141.12
European Fund for Strategic Investments (EFSI) 2,038.28
Common Strategic Framework (CSF) Research and Innovation 11,568.06
Horizon 2020 11,212.38
Euratom Research and Training Programme 355.68
Competitiveness of enterprises and small and medium-sized enterprises (COSME) 354.11
Education, Training and Sport (Erasmus+) 2,314.55
Employment and Social Innovation (EaSI) 131.71
Customs, Fiscalis and Anti-Fraud 135.02
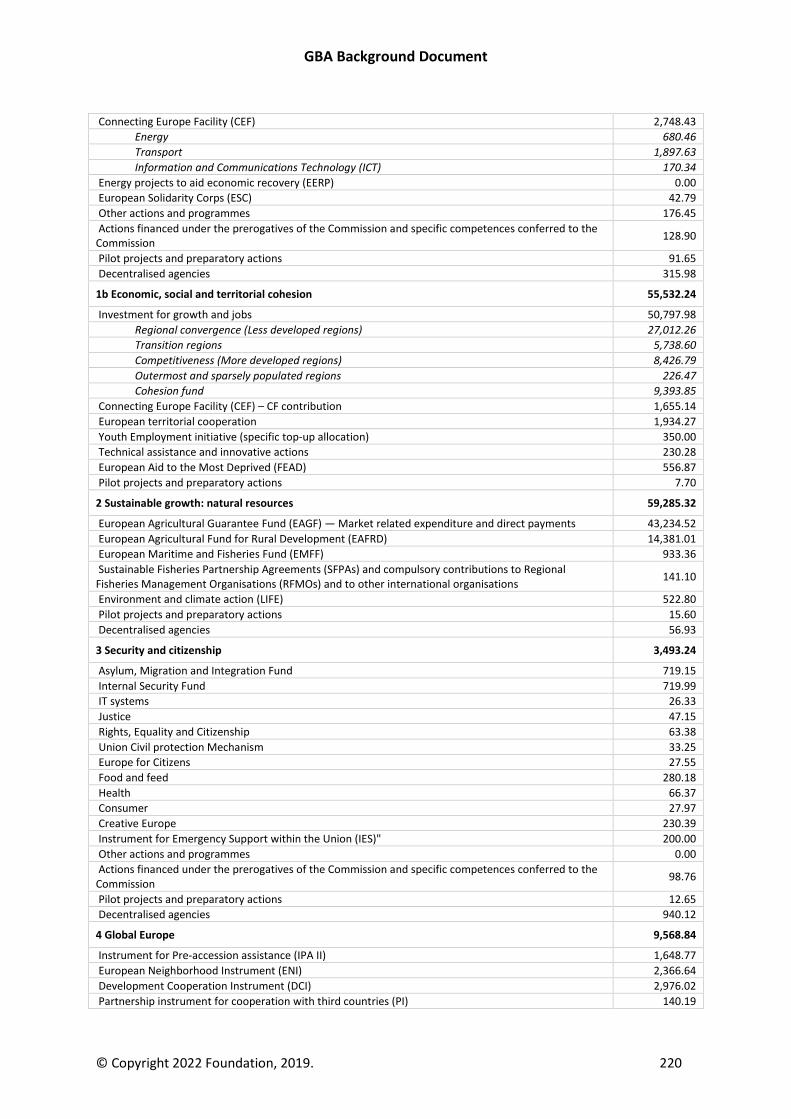
GBA Background Document
© Copyright 2022 Foundation, 2019. 220
Connecting Europe Facility (CEF) 2,748.43
Energy 680.46
Transport 1,897.63
Information and Communications Technology (ICT) 170.34
Energy projects to aid economic recovery (EERP) 0.00
European Solidarity Corps (ESC) 42.79
Other actions and programmes 176.45
Actions financed under the prerogatives of the Commission and specific competences conferred to the Commission
128.90
Pilot projects and preparatory actions 91.65
Decentralised agencies 315.98
1b Economic, social and territorial cohesion 55,532.24
Investment for growth and jobs 50,797.98
Regional convergence (Less developed regions) 27,012.26
Transition regions 5,738.60
Competitiveness (More developed regions) 8,426.79
Outermost and sparsely populated regions 226.47
Cohesion fund 9,393.85
Connecting Europe Facility (CEF) – CF contribution 1,655.14
European territorial cooperation 1,934.27
Youth Employment initiative (specific top-up allocation) 350.00
Technical assistance and innovative actions 230.28
European Aid to the Most Deprived (FEAD) 556.87
Pilot projects and preparatory actions 7.70
2 Sustainable growth: natural resources 59,285.32
European Agricultural Guarantee Fund (EAGF) — Market related expenditure and direct payments 43,234.52
European Agricultural Fund for Rural Development (EAFRD) 14,381.01
European Maritime and Fisheries Fund (EMFF) 933.36
Sustainable Fisheries Partnership Agreements (SFPAs) and compulsory contributions to Regional Fisheries Management Organisations (RFMOs) and to other international organisations
141.10
Environment and climate action (LIFE) 522.80
Pilot projects and preparatory actions 15.60
Decentralised agencies 56.93
3 Security and citizenship 3,493.24
Asylum, Migration and Integration Fund 719.15
Internal Security Fund 719.99
IT systems 26.33
Justice 47.15
Rights, Equality and Citizenship 63.38
Union Civil protection Mechanism 33.25
Europe for Citizens 27.55
Food and feed 280.18
Health 66.37
Consumer 27.97
Creative Europe 230.39
Instrument for Emergency Support within the Union (IES)" 200.00
Other actions and programmes 0.00
Actions financed under the prerogatives of the Commission and specific competences conferred to the Commission
98.76
Pilot projects and preparatory actions 12.65
Decentralised agencies 940.12
4 Global Europe 9,568.84
Instrument for Pre-accession assistance (IPA II) 1,648.77
European Neighborhood Instrument (ENI) 2,366.64
Development Cooperation Instrument (DCI) 2,976.02
Partnership instrument for cooperation with third countries (PI) 140.19
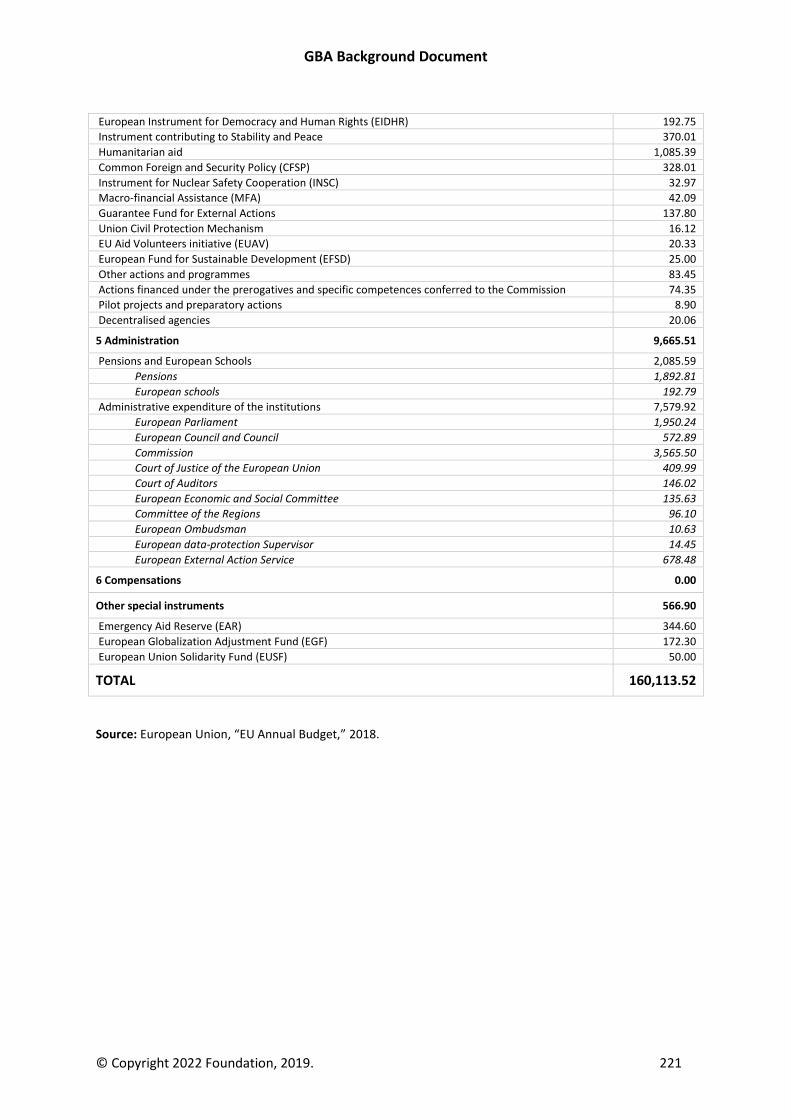
GBA Background Document
© Copyright 2022 Foundation, 2019. 221
European Instrument for Democracy and Human Rights (EIDHR) 192.75
Instrument contributing to Stability and Peace 370.01
Humanitarian aid 1,085.39
Common Foreign and Security Policy (CFSP) 328.01
Instrument for Nuclear Safety Cooperation (INSC) 32.97
Macro-financial Assistance (MFA) 42.09
Guarantee Fund for External Actions 137.80
Union Civil Protection Mechanism 16.12
EU Aid Volunteers initiative (EUAV) 20.33
European Fund for Sustainable Development (EFSD) 25.00
Other actions and programmes 83.45
Actions financed under the prerogatives and specific competences conferred to the Commission 74.35
Pilot projects and preparatory actions 8.90
Decentralised agencies 20.06
5 Administration 9,665.51
Pensions and European Schools 2,085.59
Pensions 1,892.81
European schools 192.79
Administrative expenditure of the institutions 7,579.92
European Parliament 1,950.24
European Council and Council 572.89
Commission 3,565.50
Court of Justice of the European Union 409.99
Court of Auditors 146.02
European Economic and Social Committee 135.63
Committee of the Regions 96.10
European Ombudsman 10.63
European data-protection Supervisor 14.45
European External Action Service 678.48
6 Compensations 0.00
Other special instruments 566.90
Emergency Aid Reserve (EAR) 344.60
European Globalization Adjustment Fund (EGF) 172.30
European Union Solidarity Fund (EUSF) 50.00
TOTAL 160,113.52
Source: European Union, “EU Annual Budget,” 2018.