the french automotive industry - ccfa
TRANSCRIPT
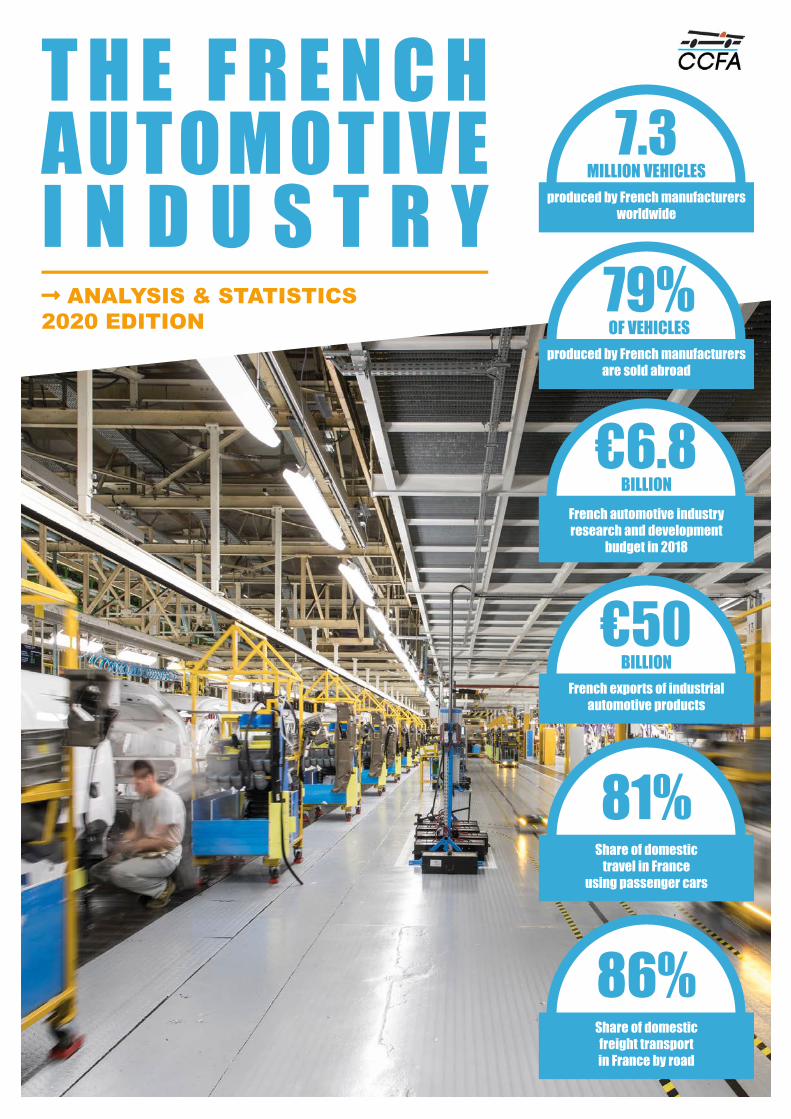
T H E F R E N C H AUTOMOTIVE I N D U S T R YLong-arrow-alt-right ANALYSIS & STATISTICS2020 EDITION
7.3MILLION VEHICLES
79%OF VEHICLES
€50BILLION
81%
86%
€6.8BILLION
produced by French manufacturers worldwide
produced by French manufacturers are sold abroad
French exports of industrial automotive products
Share of domestictravel in France
using passenger cars
Share of domesticfreight transportin France by road
French automotive industry research and development
budget in 2018
TABLE OF CONTENTS
This brochure was produced by CCFA, 2, rue de Presbourg, 75008 Paris • Telephone: +33 1 49 52 51 00 • Fax: +33 1 47 23 74 73 • Website: www.ccfa.fr • E-mail: [email protected] • Design, production: In Kom Veritas • Photo credits: PSA Group, Renault Group, Renault Trucks
WorldProduction ..................................................................................................................................................................... 6
Markets & vehicles in use ................................................................................................................................................. 10
Trade ................................................................................................................................................................................... 12
EuropeMarkets & vehicles in use ................................................................................................................................................. 14
Data on the automobile industry ...................................................................................................................................... 23
FranceFrench groups .................................................................................................................................................................... 24
Data on the automobile industry ...................................................................................................................................... 28
Competitiveness ................................................................................................................................................................. 30
Sector ................................................................................................................................................................................. 32
Research & development .................................................................................................................................................. 34
Trade ................................................................................................................................................................................... 36
Markets & vehicles in use ................................................................................................................................................. 38
Transport: passengers & goods ................................................................................................................................................... 46
Car purchases ..................................................................................................................................................................... 60
Environment ....................................................................................................................................................................... 64
Economic impact & employment ............................................................................................................................. 66
StatisticsWorld ................................................................................................................................................................................... 70
Europe ................................................................................................................................................................................ 73
France ................................................................................................................................................................................. 82
Useful addresses ................................................................................................................................................................ 96
comité des constructeurs français d’automobiles • ANALYSIS & STATISTICS. 2020 EDITION 1
editorial
A WORD FROM THE PRESIDENT
2019, 2020, 2021: not an easy editorial...
Writing an editorial in 2021 for the year 2019 shows just how crazy 2020 was! We were unable to publish our Analysis and Statistics brochure in the first half of the year, since a lot of the data were not available. We really hope 2021 will be different.
In 2019, the world automotive markets contracted to 91 million vehicles, a drop of 4.5%, after eight consecutive years of growth. This decline is explained by sales slowing in Asia, which began in 2018 (-1.4%) and accelerated in 2019 (-7.6%). And even though sales held up in Europe (+0.4%), particularly in Western Europe (+1.0%), it was not enough to offset the fall in the American and Asian markets.
The French groups, with 28% of the European light vehicle market, have a solid anchorage to cope with fluctuations in emerging markets. Nevertheless, the slowdown in global automotive markets is affecting the production of French groups compared with the record level reached in 2018. French manufacturers produced 7.3 million cars in 2019, or more than 8% of world car production.
For 2020, the Covid-19 crisis is having a profound effect on the world market, which is expected to fall by 15%, with the European market suffering a 25% drop, more marked than in North America or Asia, helped by the more limited downturn in China. Like the European market, the French market, the leading outlet for French groups, is also falling.
In this context, French groups’ worldwide sales will fall very significantly, despite the specific strategies deployed by manufacturers to deal with this situation, adjusting, for example, the pace of previous plans linked to the three expected disruptions:
• The energy transition has accelerated, with the development of sales of electric and rechargeable hybrid vehicles, which, thanks to a broader range of products, made strong inroads in 2020. However, they need to keep pace with that industry
and customers; the market level must remain high to ensure decent fleet renewal.
• The digital transition continues to rely on connectivity, now a basic requirement in almost all manufacturers’ new models. Autonomous vehicle projects have taken on a different pace, with R&D budget moderation due to the crisis.
• The service transition has been even more deeply affected by the health crisis. Carpooling and car-sharing are directly affected, presaging slower emergence. More than ever, we are in a period of major investments. Manufacturers have to invest, not only to satisfy customers and comply with environmental and other regulatory standards, but also to cope with digital and service-sector transitions. Between 2015 and 2018, total R&D spending increased by 25% to almost €7 billion.
The challenge can be met if French groups’ competitiveness is not too seriously affected by their national roots. Importantly, despite the government’s efforts with the CICE benefit and production taxation assistance, competitiveness has continued to deteriorate. In this context, the threats to the research tax credit (CIR) are to be taken seriously, because dropping it would inevitably lead to a significant contraction in the R&D ecosystem of France’s automotive industry.
2019, 2020… and what does 2021 have in store for us? French manufacturers are equipped to take their place in the market for passenger cars, light commercial vehicles and industrial vehicles. The formidable technical and environmental challenges are difficult but not unattainable, provided that the public authorities tread carefully around the issues of ecological transition and loosen the fiscal straitjacket that is so detrimental to French industry’s competitiveness.
Enjoy the read!Thierry COGNET
comité des constructeurs français d’automobiles • ANALYSIS & STATISTICS. 2020 EDITION2
organisation
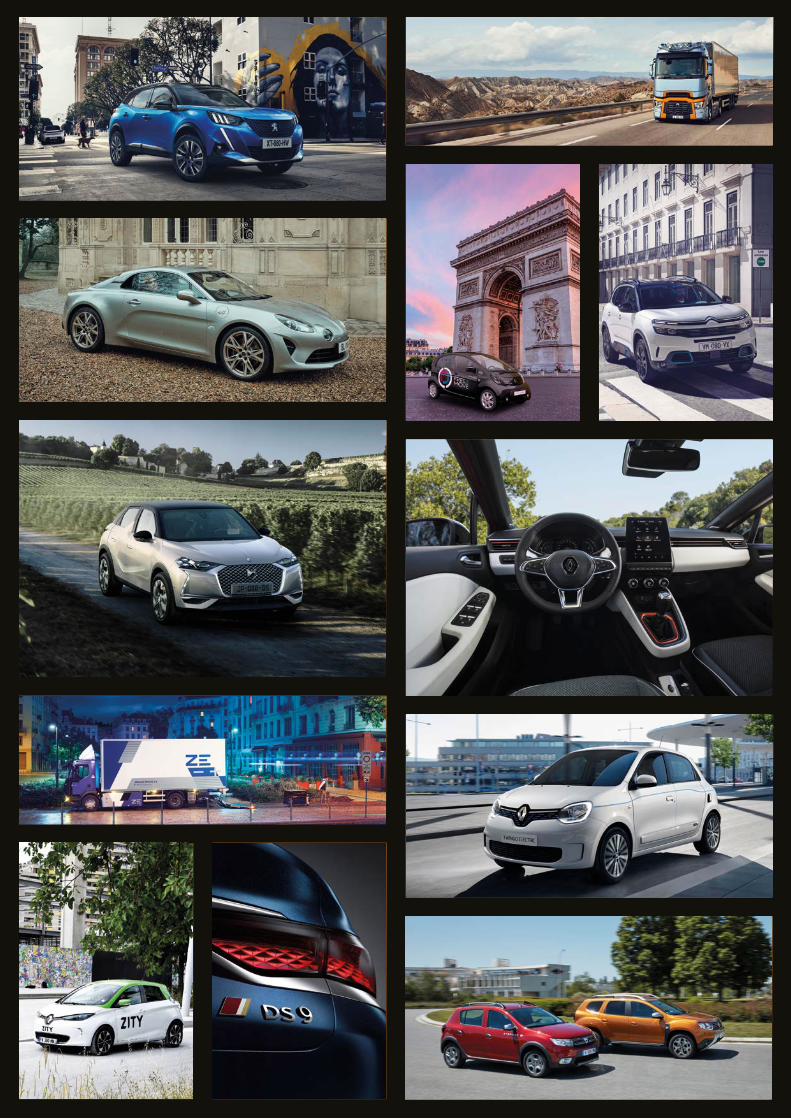
THE FRENCH AUTOMOBILE MANUFACTURERS’ ASSOCIATIONThe "Comité des Constructeurs Français d’Automobiles" (CCFA) is the French automobile manufacturers’ trade association. Its members are: Alpine, PSA (Automobiles Citroën – Automobiles Peugeot), Renault and Renault Trucks. Its mission is to study and defend the business and industrial interests of all French automobile manufacturers on both national and international levels (excluding labor issues which are the remit of the UIMM – the union of specialties and metallurgical industries). It has a subsidiary AAA DATA.
CCFA’s activities include information, analysis and communication for its members as well as for government agencies, public officials, members of parliament, the manufacturing sector, the automotive and road industry, research bodies, the media and the general public.
Other sectors of the automotive sector (parts and equipment manufacturers, dealers, body manufacturers) have their own trade associations (FIEV, Fédération des Industries des Équipements pour Véhicules - French Automotive Equipment Industries Association, CNPA, Conseil National des Professions de l’Automobile - National Council of Automotive Professions, FFC, Fédération Française de Carrosserie, Industries et Services - French Bodybuilding, Industry and Services Federation, FIEEC, Fédération des Industries Electriques, Electroniques et Communication -
Electrical, Electronic and Communications Industry Federation, FIM, Fédération des Industries Mécaniques - Mechanical Industry Federation, GPA, Groupement Plasturgie Automobile - Automotive Plastics Group, SNCP, Syndicat National du Caoutchouc et des Polymères - National Union of Polymers and Rubber Industries, etc.). In 2009, during the crisis, French automobile manufacturers and their suppliers established the PFA, Automotive Industry and Mobilities, which has the task of contributing to reinforcing the French automotive sector. In 2012, the Automotive Technical Committee (CTA - Comité Technique Automobile) with its two boards, the Automotive Technical Standardisation Council (CSTA - Conseil de Standardisation Technique Automobile) and the Automotive Research Council (CRA - Conseil de Recherche Automobile), which role is to guide research and development, were created. At the end of 2017, PFA entered into a new phase with the following missions: boosting the innovation dynamic, competitiveness initiatives right through the sector, planning ahead for employment and skill requirements, expressing joint positions for the sector, coordination and organisation of professional shows and communications throughout the sector.
Foreign brands are represented by the International Association of the Automobile and the Motorcycle (CSIAM – Chambre Syndicale
Internationale de l’Automobile et du Motocycle).
CCFA is associated with Brussels-based ACEA (Association des Constructeurs Européens d’Automobiles), the European Automobile Manufacturers’ Association.
CCFA is also a member of the International Organisation of Motor Vehicle Manufacturers (OICA – Organisation Internationale des Constructeurs de l’Automobile), which brings together national associations representing the sector from around the world.
PHONE: 33 1 49 52 51 00 - FAX: 33 1 47 23 74 73 - WEBSITE: www.ccfa.fr - E-MAIL: [email protected]
1909The "chambre syndicale des constructeurs d’automobile"
was founded
CHAIRMANTHIERRY COGNET
comité des constructeurs français d’automobiles • ANALYSIS & STATISTICS. 2020 EDITION 3
partners
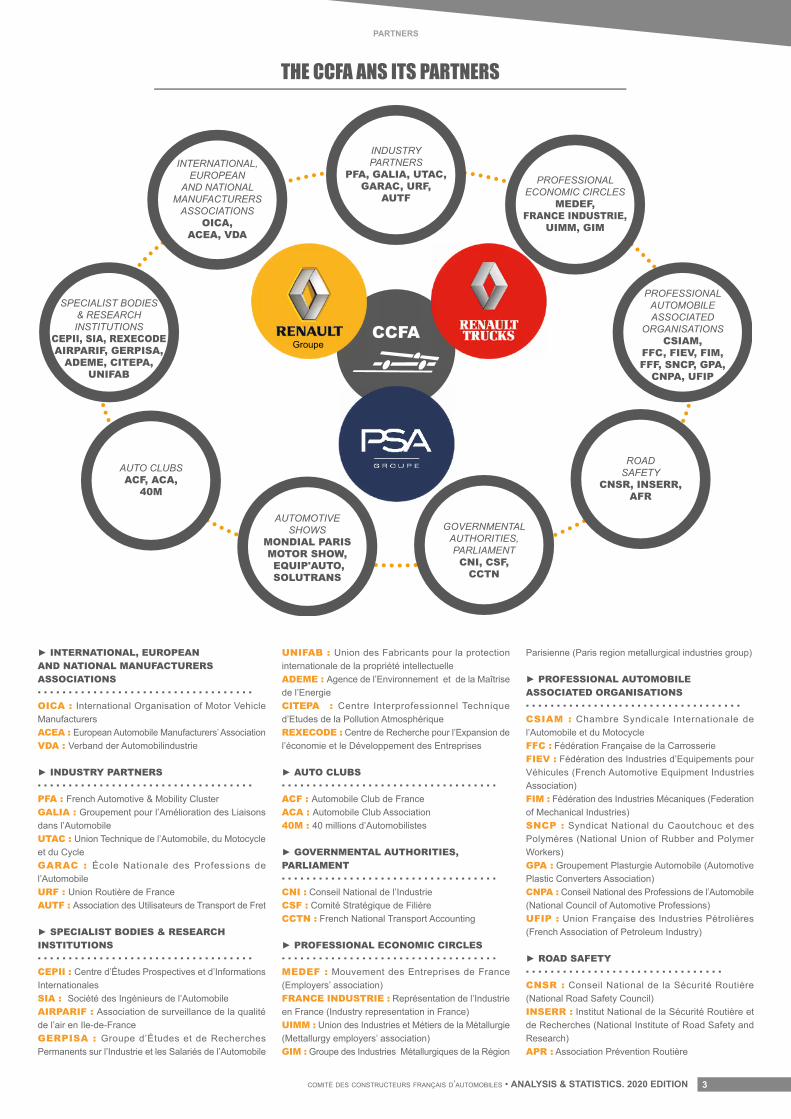
THE CCFA ANS ITS PARTNERS
CCFA
INDUSTRYPARTNERS
PFA, GALIA, UTAC,GARAC, URF,
AUTF
PROFESSIONALECONOMIC CIRCLES
MEDEF,FRANCE INDUSTRIE,
UIMM, GIM
PROFESSIONALAUTOMOBILEASSOCIATED
ORGANISATIONSCSIAM,
FFC, FIEV, FIM,FFF, SNCP, GPA,
CNPA, UFIP
ROADSAFETY
CNSR, INSERR,AFR
GOVERNMENTALAUTHORITIES,PARLIAMENTCNI, CSF,
CCTN
AUTOMOTIVESHOWS
MONDIAL PARISMOTOR SHOW, EQUIP'AUTO,SOLUTRANS
AUTO CLUBSACF, ACA,
40M
SPECIALIST BODIES& RESEARCHINSTITUTIONS
CEPII, SIA, REXECODEAIRPARIF, GERPISA,
ADEME, CITEPA,UNIFAB
INTERNATIONAL,EUROPEAN
AND NATIONALMANUFACTURERS
ASSOCIATIONSOICA,
ACEA, VDA
Groupe
► INTERNATIONAL, EUROPEAN AND NATIONAL MANUFACTURERS ASSOCIATIONS∙ ∙ ∙ ∙ ∙ ∙ ∙ ∙ ∙ ∙ ∙ ∙ ∙ ∙ ∙ ∙ ∙ ∙ ∙ ∙ ∙ ∙ ∙ ∙ ∙ ∙ ∙ ∙ ∙ ∙ ∙ ∙ ∙ ∙ ∙ OICA : International Organisation of Motor Vehicle ManufacturersACEA : European Automobile Manufacturers’ AssociationVDA : Verband der Automobilindustrie
► INDUSTRY PARTNERS∙ ∙ ∙ ∙ ∙ ∙ ∙ ∙ ∙ ∙ ∙ ∙ ∙ ∙ ∙ ∙ ∙ ∙ ∙ ∙ ∙ ∙ ∙ ∙ ∙ ∙ ∙ ∙ ∙ ∙ ∙ ∙ ∙ ∙ ∙ PFA : French Automotive & Mobility ClusterGALIA : Groupement pour l’Amélioration des Liaisons dans l’AutomobileUTAC : Union Technique de l’Automobile, du Motocycle et du CycleGARAC : École Nationale des Professions de l’AutomobileURF : Union Routière de FranceAUTF : Association des Utilisateurs de Transport de Fret
► SPECIALIST BODIES & RESEARCH INSTITUTIONS∙ ∙ ∙ ∙ ∙ ∙ ∙ ∙ ∙ ∙ ∙ ∙ ∙ ∙ ∙ ∙ ∙ ∙ ∙ ∙ ∙ ∙ ∙ ∙ ∙ ∙ ∙ ∙ ∙ ∙ ∙ ∙ ∙ ∙ ∙ CEPII : Centre d’Études Prospectives et d’Informations InternationalesSIA : Société des Ingénieurs de l’Automobile AIRPARIF : Association de surveillance de la qualité de l’air en Ile-de-FranceGERPISA : Groupe d’Études et de Recherches Permanents sur l’Industrie et les Salariés de l’Automobile
UNIFAB : Union des Fabricants pour la protection internationale de la propriété intellectuelleADEME : Agence de l’Environnement et de la Maîtrise de l’EnergieCITEPA : Centre Interprofessionnel Technique d’Etudes de la Pollution AtmosphériqueREXECODE : Centre de Recherche pour l’Expansion de l’économie et le Développement des Entreprises
► AUTO CLUBS∙ ∙ ∙ ∙ ∙ ∙ ∙ ∙ ∙ ∙ ∙ ∙ ∙ ∙ ∙ ∙ ∙ ∙ ∙ ∙ ∙ ∙ ∙ ∙ ∙ ∙ ∙ ∙ ∙ ∙ ∙ ∙ ∙ ∙ ∙ ACF : Automobile Club de FranceACA : Automobile Club Association40M : 40 millions d’Automobilistes
► GOVERNMENTAL AUTHORITIES, PARLIAMENT ∙ ∙ ∙ ∙ ∙ ∙ ∙ ∙ ∙ ∙ ∙ ∙ ∙ ∙ ∙ ∙ ∙ ∙ ∙ ∙ ∙ ∙ ∙ ∙ ∙ ∙ ∙ ∙ ∙ ∙ ∙ ∙ ∙ ∙ ∙ CNI : Conseil National de l’IndustrieCSF : Comité Stratégique de FilièreCCTN : French National Transport Accounting
► PROFESSIONAL ECONOMIC CIRCLES∙ ∙ ∙ ∙ ∙ ∙ ∙ ∙ ∙ ∙ ∙ ∙ ∙ ∙ ∙ ∙ ∙ ∙ ∙ ∙ ∙ ∙ ∙ ∙ ∙ ∙ ∙ ∙ ∙ ∙ ∙ ∙ ∙ ∙ ∙ MEDEF : Mouvement des Entreprises de France (Employers’ association)FRANCE INDUSTRIE : Représentation de l’Industrie en France (Industry representation in France)UIMM : Union des Industries et Métiers de la Métallurgie (Mettallurgy employers’ association)GIM : Groupe des Industries Métallurgiques de la Région
Parisienne (Paris region metallurgical industries group)
► PROFESSIONAL AUTOMOBILE ASSOCIATED ORGANISATIONS∙ ∙ ∙ ∙ ∙ ∙ ∙ ∙ ∙ ∙ ∙ ∙ ∙ ∙ ∙ ∙ ∙ ∙ ∙ ∙ ∙ ∙ ∙ ∙ ∙ ∙ ∙ ∙ ∙ ∙ ∙ ∙ ∙ ∙ ∙CSIAM : Chambre Syndicale Internationale de l’Automobile et du MotocycleFFC : Fédération Française de la CarrosserieFIEV : Fédération des Industries d’Equipements pour Véhicules (French Automotive Equipment Industries Association)FIM : Fédération des Industries Mécaniques (Federation of Mechanical Industries)SNCP : Syndicat National du Caoutchouc et des Polymères (National Union of Rubber and Polymer Workers)GPA : Groupement Plasturgie Automobile (Automotive Plastic Converters Association)CNPA : Conseil National des Professions de l’Automobile (National Council of Automotive Professions)UFIP : Union Française des Industries Pétrolières (French Association of Petroleum Industry)
► ROAD SAFETY∙ ∙ ∙ ∙ ∙ ∙ ∙ ∙ ∙ ∙ ∙ ∙ ∙ ∙ ∙ ∙ ∙ ∙ ∙ ∙ ∙ ∙ ∙ ∙ ∙ ∙ ∙ ∙ ∙ ∙ ∙ ∙CNSR : Conseil National de la Sécurité Routière (National Road Safety Council)INSERR : Institut National de la Sécurité Routière et de Recherches (National Institute of Road Safety and Research)APR : Association Prévention Routière
comité des constructeurs français d’automobiles • ANALYSIS & STATISTICS. 2020 EDITIONcomité des constructeurs français d’automobiles • ANALYSIS & STATISTICS. 2020 EDITION4
world • highlights
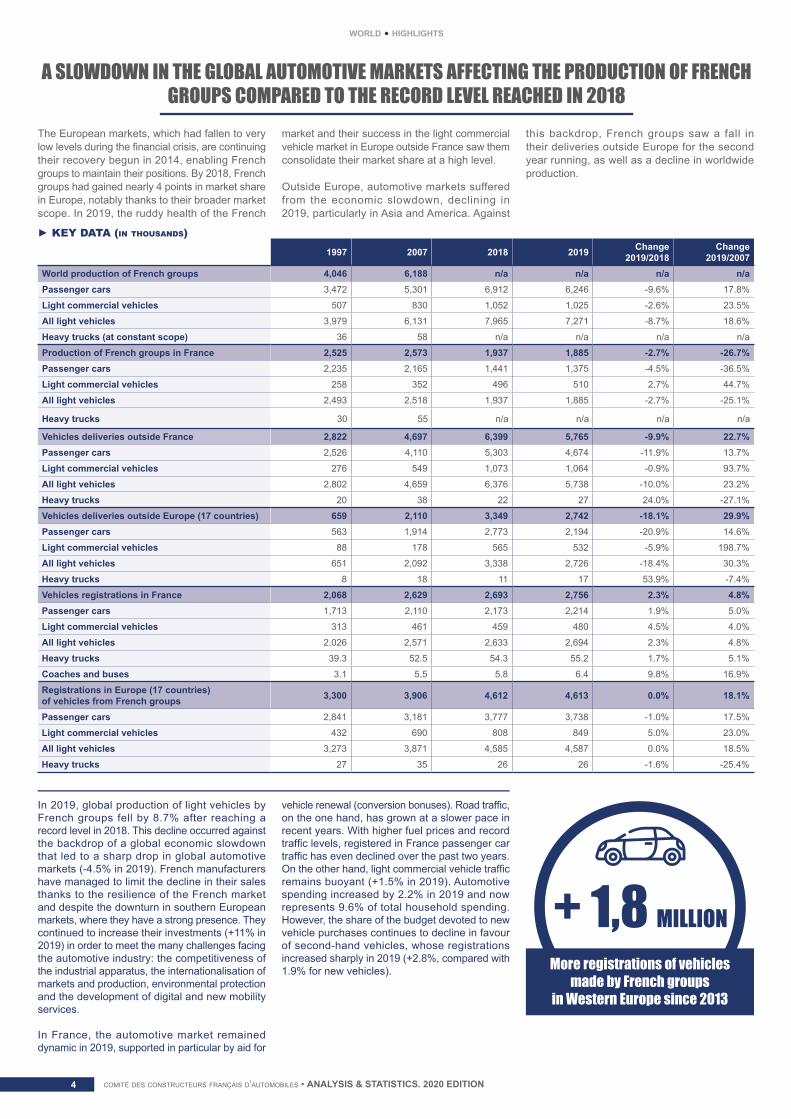
A SLOWDOWN IN THE GLOBAL AUTOMOTIVE MARKETS AFFECTING THE PRODUCTION OF FRENCH GROUPS COMPARED TO THE RECORD LEVEL REACHED IN 2018
The European markets, which had fallen to very low levels during the financial crisis, are continuing their recovery begun in 2014, enabling French groups to maintain their positions. By 2018, French groups had gained nearly 4 points in market share in Europe, notably thanks to their broader market scope. In 2019, the ruddy health of the French
market and their success in the light commercial vehicle market in Europe outside France saw them consolidate their market share at a high level.
Outside Europe, automotive markets suffered from the economic slowdown, declining in 2019, particularly in Asia and America. Against
this backdrop, French groups saw a fall in their deliveries outside Europe for the second year running, as well as a decline in worldwide production.
In 2019, global production of light vehicles by French groups fell by 8.7% after reaching a record level in 2018. This decline occurred against the backdrop of a global economic slowdown that led to a sharp drop in global automotive markets (-4.5% in 2019). French manufacturers have managed to limit the decline in their sales thanks to the resilience of the French market and despite the downturn in southern European markets, where they have a strong presence. They continued to increase their investments (+11% in 2019) in order to meet the many challenges facing the automotive industry: the competitiveness of the industrial apparatus, the internationalisation of markets and production, environmental protection and the development of digital and new mobility services.
In France, the automotive market remained dynamic in 2019, supported in particular by aid for
vehicle renewal (conversion bonuses). Road traffic, on the one hand, has grown at a slower pace in recent years. With higher fuel prices and record traffic levels, registered in France passenger car traffic has even declined over the past two years. On the other hand, light commercial vehicle traffic remains buoyant (+1.5% in 2019). Automotive spending increased by 2.2% in 2019 and now represents 9.6% of total household spending. However, the share of the budget devoted to new vehicle purchases continues to decline in favour of second-hand vehicles, whose registrations increased sharply in 2019 (+2.8%, compared with 1.9% for new vehicles).
+ 1,8 MILLIONMore registrations of vehicles
made by French groupsin Western Europe since 2013
Rang 1997 2007 2018 2019 Change 2019/2018
Change 2019/2007
World production of French groups 4,046 6,188 n/a n/a n/a n/aPassenger cars 3,472 5,301 6,912 6,246 -9.6% 17.8%
Light commercial vehicles 507 830 1,052 1,025 -2.6% 23.5%
All light vehicles 3,979 6,131 7,965 7,271 -8.7% 18.6%
Heavy trucks (at constant scope) 36 58 n/a n/a n/a n/a
Production of French groups in France 2,525 2,573 1,937 1,885 -2.7% -26.7%Passenger cars 2,235 2,165 1,441 1,375 -4.5% -36.5%
Light commercial vehicles 258 352 496 510 2.7% 44.7%
All light vehicles 2,493 2,518 1,937 1,885 -2.7% -25.1%
Heavy trucks 30 55 n/a n/a n/a n/a
Vehicles deliveries outside France 2,822 4,697 6,399 5,765 -9.9% 22.7%Passenger cars 2,526 4,110 5,303 4,674 -11.9% 13.7%
Light commercial vehicles 276 549 1,073 1,064 -0.9% 93.7%
All light vehicles 2,802 4,659 6,376 5,738 -10.0% 23.2%
Heavy trucks 20 38 22 27 24.0% -27.1%
Vehicles deliveries outside Europe (17 countries) 659 2,110 3,349 2,742 -18.1% 29.9%Passenger cars 563 1,914 2,773 2,194 -20.9% 14.6%
Light commercial vehicles 88 178 565 532 -5.9% 198.7%
All light vehicles 651 2,092 3,338 2,726 -18.4% 30.3%
Heavy trucks 8 18 11 17 53.9% -7.4%
Vehicles registrations in France 2,068 2,629 2,693 2,756 2.3% 4.8%Passenger cars 1,713 2,110 2,173 2,214 1.9% 5.0%
Light commercial vehicles 313 461 459 480 4.5% 4.0%
All light vehicles 2,026 2,571 2,633 2,694 2.3% 4.8%
Heavy trucks 39.3 52.5 54.3 55.2 1.7% 5.1%
Coaches and buses 3.1 5.5 5.8 6.4 9.8% 16.9%
Registrations in Europe (17 countries) of vehicles from French groups 3,300 3,906 4,612 4,613 0.0% 18.1%
Passenger cars 2,841 3,181 3,777 3,738 -1.0% 17.5%
Light commercial vehicles 432 690 808 849 5.0% 23.0%
All light vehicles 3,273 3,871 4,585 4,587 0.0% 18.5%
Heavy trucks 27 35 26 26 -1.6% -25.4%
► KEY DATA (in thousands)
comité des constructeurs français d’automobiles • ANALYSIS & STATISTICS. 2020 EDITION 5
world • highlights
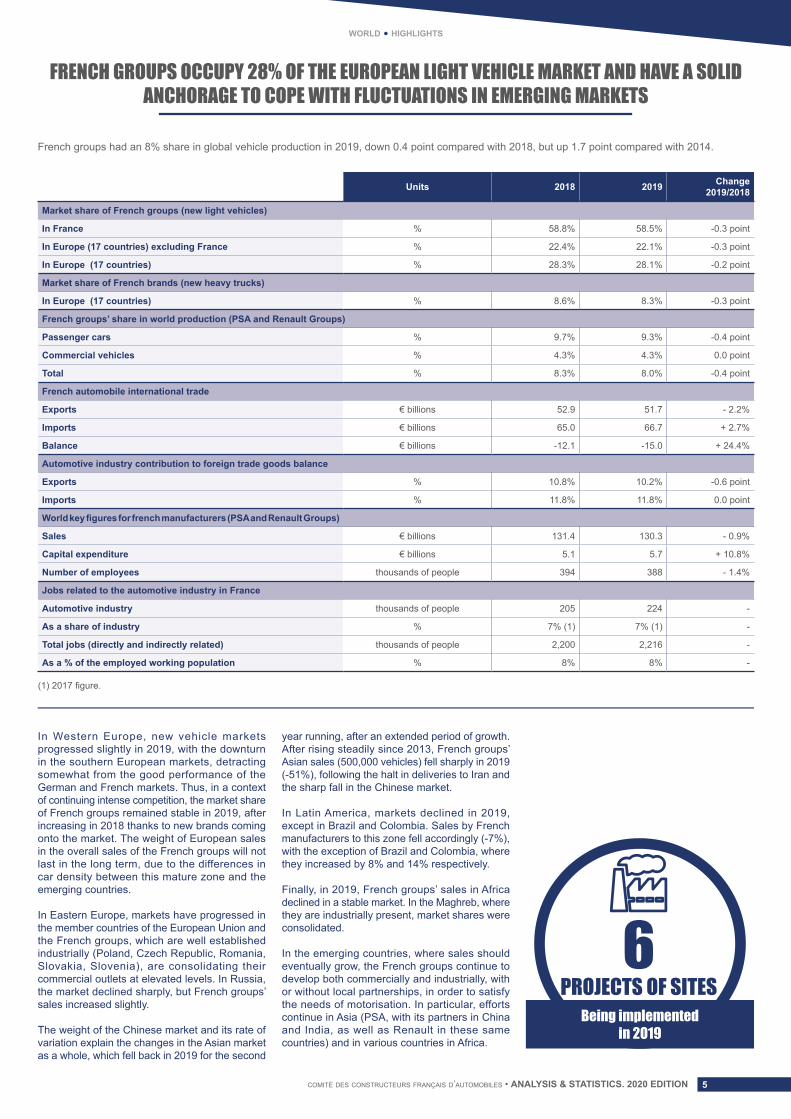
FRENCH GROUPS OCCUPY 28% OF THE EUROPEAN LIGHT VEHICLE MARKET AND HAVE A SOLID ANCHORAGE TO COPE WITH FLUCTUATIONS IN EMERGING MARKETS
In Western Europe, new vehicle markets progressed slightly in 2019, with the downturn in the southern European markets, detracting somewhat from the good performance of the German and French markets. Thus, in a context of continuing intense competition, the market share of French groups remained stable in 2019, after increasing in 2018 thanks to new brands coming onto the market. The weight of European sales in the overall sales of the French groups will not last in the long term, due to the differences in car density between this mature zone and the emerging countries.
In Eastern Europe, markets have progressed in the member countries of the European Union and the French groups, which are well established industrially (Poland, Czech Republic, Romania, Slovakia, Slovenia), are consolidating their commercial outlets at elevated levels. In Russia, the market declined sharply, but French groups’ sales increased slightly.
The weight of the Chinese market and its rate of variation explain the changes in the Asian market as a whole, which fell back in 2019 for the second
year running, after an extended period of growth. After rising steadily since 2013, French groups’ Asian sales (500,000 vehicles) fell sharply in 2019 (-51%), following the halt in deliveries to Iran and the sharp fall in the Chinese market.
In Latin America, markets declined in 2019, except in Brazil and Colombia. Sales by French manufacturers to this zone fell accordingly (-7%), with the exception of Brazil and Colombia, where they increased by 8% and 14% respectively.
Finally, in 2019, French groups’ sales in Africa declined in a stable market. In the Maghreb, where they are industrially present, market shares were consolidated.
In the emerging countries, where sales should eventually grow, the French groups continue to develop both commercially and industrially, with or without local partnerships, in order to satisfy the needs of motorisation. In particular, efforts continue in Asia (PSA, with its partners in China and India, as well as Renault in these same countries) and in various countries in Africa.
French groups had an 8% share in global vehicle production in 2019, down 0.4 point compared with 2018, but up 1.7 point compared with 2014.
6PROJECTS OF SITES
Being implementedin 2019
Rang Units 2018 2019 Change 2019/2018
Market share of French groups (new light vehicles)
In France % 58.8% 58.5% -0.3 point
In Europe (17 countries) excluding France % 22.4% 22.1% -0.3 point
In Europe (17 countries) % 28.3% 28.1% -0.2 point
Market share of French brands (new heavy trucks)
In Europe (17 countries) % 8.6% 8.3% -0.3 point
French groups’ share in world production (PSA and Renault Groups)
Passenger cars % 9.7% 9.3% -0.4 point
Commercial vehicles % 4.3% 4.3% 0.0 point
Total % 8.3% 8.0% -0.4 point
French automobile international trade
Exports € billions 52.9 51.7 - 2.2%
Imports € billions 65.0 66.7 + 2.7%
Balance € billions -12.1 -15.0 + 24.4%
Automotive industry contribution to foreign trade goods balance
Exports % 10.8% 10.2% -0.6 point
Imports % 11.8% 11.8% 0.0 point
World key figures for french manufacturers (PSA and Renault Groups)
Sales € billions 131.4 130.3 - 0.9%
Capital expenditure € billions 5.1 5.7 + 10.8%
Number of employees thousands of people 394 388 - 1.4%
Jobs related to the automotive industry in France
Automotive industry thousands of people 205 224 -
As a share of industry % 7% (1) 7% (1) -
Total jobs (directly and indirectly related) thousands of people 2,200 2,216 -
As a % of the employed working population % 8% 8% -
(1) 2017 figure.
comité des constructeurs français d’automobiles • ANALYSIS & STATISTICS. 2020 EDITIONcomité des constructeurs français d’automobiles • ANALYSIS & STATISTICS. 2020 EDITION6
world • production
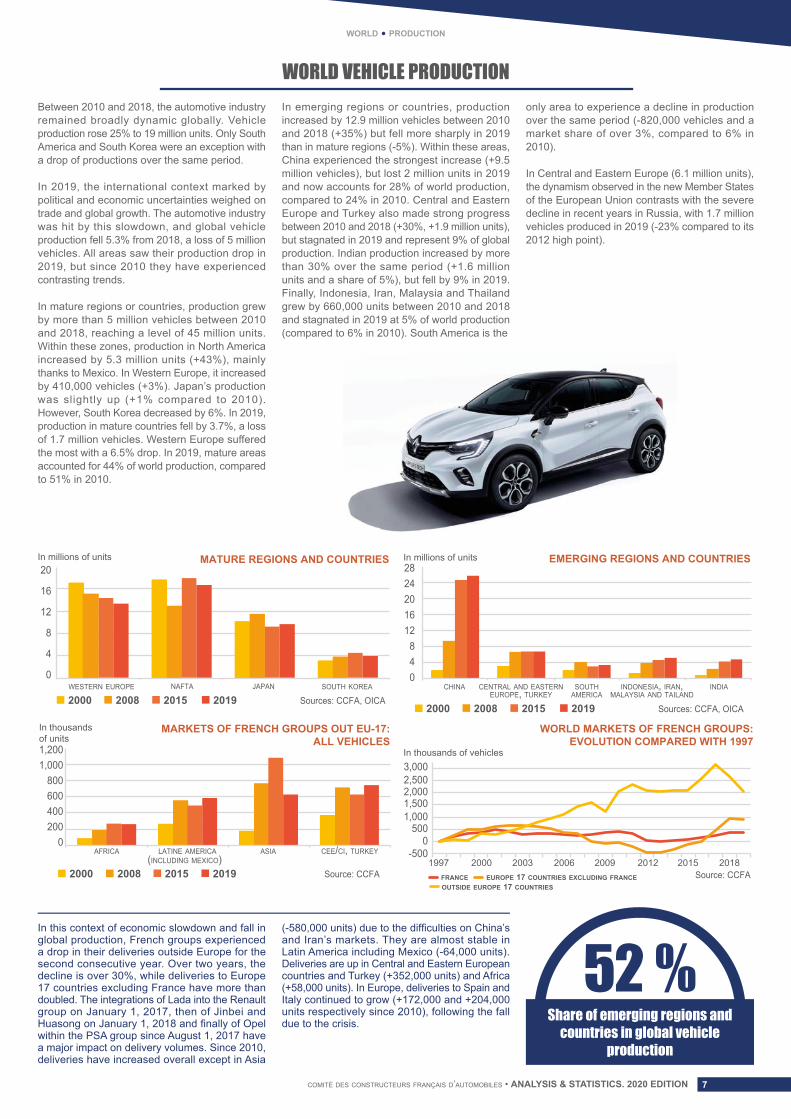
WORLD VEHICLE PRODUCTIONIn 2019, global vehicle production fell 5.3% to a little bit more than 5 million vehicles. It fell in Europe (-4.4%), America (-3.6%) and Asia (-6.4%). It was growing continuously after the fall of 2009 until 2017, then returned in 2019 to the level close to that observed in 2015, to a little bit more than 91 million units.
Global production of vehicles amounted to approximately 50 million units in 1990, then to nearly 60 million in 2000. It exceeded the threshold of 70 million vehicles before the crisis, before falling in 2009. It increased again until 2017 when production peaked at 97.1 million units. Between 2000 and 2017, the annual growth rate averaged +3%.
In mature areas, the level of production observed in 2019 compared to the pre-crisis period (2007) is mixed, with similar levels in Western Europe, North America and Japan, and even South Korea.
Nevertheless, in emerging zones and countries, including Asia, which is the current automotive expansion pole, production remains much higher than in the pre-crisis period. In 2019 it was up 137% compared to 2017 in Asia excluding Japan-South Korea, up 30% in Central and Eastern Europe, up 25% in South America and Mexico. -5%
Decrease of the number of vehicles produced in the world in 2019
compared to 2018
In Western Europe, production fell 6.5% in 2019 compared to the previous year, with significant declines in the major countries: Germany (-9% after three consecutive years of decline), United Kingdom (-14%), Italy (-14%). It fell more moderately in France (-4%) and remained stable at high level in Spain and Eastern Europe.
In America, production is falling by more than 3%, whether in North America or South America. It also fell in Mexico (-3%), which was the dynamic zone of North America.
As for Asia-Oceania, which accounts for more than half of world production, production trends are more mixed. The decline is more moderate in
mature countries (Japan and South Korea) than in new areas (ASEAN, Iran, India, etc.). In China, which constitutes half of the region’s production, it fell for the second year in a row. After declining 4% in 2018, vehicle production in China is down 7.5% in 2019.
In thousands 2018 2019 Change %
EUROPE 22,264 21,285 -4.4
Western Europe 14,261 13,337 -6.5
Germany 5,120 4,661 -9.0
Belgium 308 286 -7.4
Spain 2,820 2,822 0.1
France 2,270 2,175 -4.2
Italy 1,062 915 -13.8
The Netherlands 214 176 -17.7
United Kingdom 1,604 1,381 -13.9
Sweden 291 279 -4.1
Central and Eastern Europe 5,237 5,223 -0.3
Russia 1,769 1,720 -2.8
Turkey 1,550 1,461 -5.7
America 20,848 20,103 -3.6
NAFTA (1) 17,424 16,783 -3.7
South America 3,423 3,319 -3.0
Asia-Oceania 52,657 49,267 -6.4
ASEAN (2) 4,575 4,382 -4.2
China 27,809 25,721 -7.5
South Korea 4,029 3,951 -1.9
India 5,143 4,516 -12.2
Japan 9,729 9,684 -0.5
AFRICA 1,102 1,105 0.3
TOTAL 96,871 91,760 -5.3
(1) NAFTA: Canada, USA, Mexico. (2) ASEAN: Brunei, Cambodia, Indonesia, Laos, Malaysia, Myanmar, Philippines, Singapore, Thailand, Vietnam. Sources: OICA - CCFA estimates March 2020
50,000
60,000
70,000
80,000
90,000
100,000
CHANGES IN WORLD VEHICLE PRODUCTIONSINCE 2000
In thousands of units
2000 2002 2004 2006 2008 2010 2012 2014 2016 2018 2020
comité des constructeurs français d’automobiles • ANALYSIS & STATISTICS. 2020 EDITION 7
world • production
WORLD VEHICLE PRODUCTIONBetween 2010 and 2018, the automotive industry remained broadly dynamic globally. Vehicle production rose 25% to 19 million units. Only South America and South Korea were an exception with a drop of productions over the same period.
In 2019, the international context marked by political and economic uncertainties weighed on trade and global growth. The automotive industry was hit by this slowdown, and global vehicle production fell 5.3% from 2018, a loss of 5 million vehicles. All areas saw their production drop in 2019, but since 2010 they have experienced contrasting trends.
In mature regions or countries, production grew by more than 5 million vehicles between 2010 and 2018, reaching a level of 45 million units. Within these zones, production in North America increased by 5.3 million units (+43%), mainly thanks to Mexico. In Western Europe, it increased by 410,000 vehicles (+3%). Japan’s production was slightly up (+1% compared to 2010). However, South Korea decreased by 6%. In 2019, production in mature countries fell by 3.7%, a loss of 1.7 million vehicles. Western Europe suffered the most with a 6.5% drop. In 2019, mature areas accounted for 44% of world production, compared to 51% in 2010.
In emerging regions or countries, production increased by 12.9 million vehicles between 2010 and 2018 (+35%) but fell more sharply in 2019 than in mature regions (-5%). Within these areas, China experienced the strongest increase (+9.5 million vehicles), but lost 2 million units in 2019 and now accounts for 28% of world production, compared to 24% in 2010. Central and Eastern Europe and Turkey also made strong progress between 2010 and 2018 (+30%, +1.9 million units), but stagnated in 2019 and represent 9% of global production. Indian production increased by more than 30% over the same period (+1.6 million units and a share of 5%), but fell by 9% in 2019. Finally, Indonesia, Iran, Malaysia and Thailand grew by 660,000 units between 2010 and 2018 and stagnated in 2019 at 5% of world production (compared to 6% in 2010). South America is the
only area to experience a decline in production over the same period (-820,000 vehicles and a market share of over 3%, compared to 6% in 2010).
In Central and Eastern Europe (6.1 million units), the dynamism observed in the new Member States of the European Union contrasts with the severe decline in recent years in Russia, with 1.7 million vehicles produced in 2019 (-23% compared to its 2012 high point).
In this context of economic slowdown and fall in global production, French groups experienced a drop in their deliveries outside Europe for the second consecutive year. Over two years, the decline is over 30%, while deliveries to Europe 17 countries excluding France have more than doubled. The integrations of Lada into the Renault group on January 1, 2017, then of Jinbei and Huasong on January 1, 2018 and finally of Opel within the PSA group since August 1, 2017 have a major impact on delivery volumes. Since 2010, deliveries have increased overall except in Asia
(-580,000 units) due to the difficulties on China’s and Iran’s markets. They are almost stable in Latin America including Mexico (-64,000 units). Deliveries are up in Central and Eastern European countries and Turkey (+352,000 units) and Africa (+58,000 units). In Europe, deliveries to Spain and Italy continued to grow (+172,000 and +204,000 units respectively since 2010), following the fall due to the crisis.
52 %Share of emerging regions and
countries in global vehicle production
0
4
8
12
16
20
WESTERN EUROPE NAFTA JAPAN SOUTH KOREA
MATURE REGIONS AND COUNTRIES
WORLD MARKETS OF FRENCH GROUPS: EVOLUTION COMPARED WITH 1997
In millions of units
In thousands of vehicles
Sources: CCFA, OICA 2000 2008 2015 2019
Source: CCFA
EMERGING REGIONS AND COUNTRIESIn millions of units
2000 2008 2015 2019 Sources: CCFA, OICA
CHINA CENTRAL AND EASTERNEUROPE, TURKEY
SOUTHAMERICA
INDONESIA, IRAN,MALAYSIA AND TAILAND
INDIA0 4
8 12 16 20 24 28
MARKETS OF FRENCH GROUPS OUT EU-17:ALL VEHICLES
In thousandsof units
Source: CCFA20082000 2015 2019
0 200 400 600 800
1,000 1,200
AFRICA LATINE AMERICA(INCLUDING MEXICO)
ASIA CEE/CI, TURKEY -500 0
500 1,000 1,500 2,000 2,500 3,000
1997 2000 2003 2006 2009 2012 2015 2018FRANCE EUROPE 17 COUNTRIES EXCLUDING FRANCEOUTSIDE EUROPE 17 COUNTRIES
comité des constructeurs français d’automobiles • ANALYSIS & STATISTICS. 2020 EDITIONcomité des constructeurs français d’automobiles • ANALYSIS & STATISTICS. 2020 EDITION8
world • production
WORLD RANKING OF AUTOMOBILE MANUFACTURERSThe top 10 manufacturers, including the French groups Renault and PSA, accounted for 70% of world production. The French manufacturers together produced a little bit more than 7 million vehicles and respectively occupy the ninth and tenth ranks.
In 2019, French groups maintained their position in a global slowdown context. They took advantage of the pursuit of the European market growth and their external growth marked in 2018 by the integration of Jinbei/Huasong into the Renault Group on January 1, 2018 and Opel in the PSA Group in full year. The output of French manufacturers accounted for 8.3% of world production, 9.3% for passenger cars, a level well above that observed in 2013 and 2014 (6%).
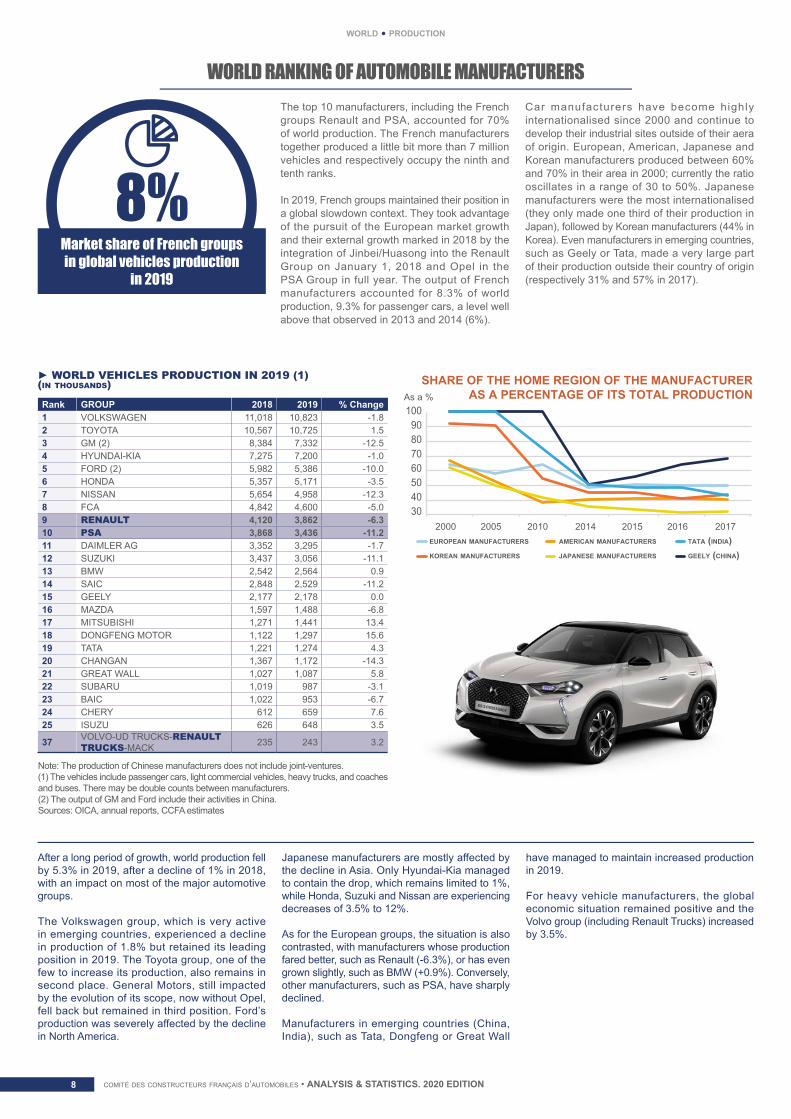
Car manufacturers have become highly internationalised since 2000 and continue to develop their industrial sites outside of their aera of origin. European, American, Japanese and Korean manufacturers produced between 60% and 70% in their area in 2000; currently the ratio oscillates in a range of 30 to 50%. Japanese manufacturers were the most internationalised (they only made one third of their production in Japan), followed by Korean manufacturers (44% in Korea). Even manufacturers in emerging countries, such as Geely or Tata, made a very large part of their production outside their country of origin (respectively 31% and 57% in 2017).
8%Market share of French groupsin global vehicles production
in 2019
After a long period of growth, world production fell by 5.3% in 2019, after a decline of 1% in 2018, with an impact on most of the major automotive groups.
The Volkswagen group, which is very active in emerging countries, experienced a decline in production of 1.8% but retained its leading position in 2019. The Toyota group, one of the few to increase its production, also remains in second place. General Motors, still impacted by the evolution of its scope, now without Opel, fell back but remained in third position. Ford’s production was severely affected by the decline in North America.
Japanese manufacturers are mostly affected by the decline in Asia. Only Hyundai-Kia managed to contain the drop, which remains limited to 1%, while Honda, Suzuki and Nissan are experiencing decreases of 3.5% to 12%.
As for the European groups, the situation is also contrasted, with manufacturers whose production fared better, such as Renault (-6.3%), or has even grown slightly, such as BMW (+0.9%). Conversely, other manufacturers, such as PSA, have sharply declined.
Manufacturers in emerging countries (China, India), such as Tata, Dongfeng or Great Wall
have managed to maintain increased production in 2019.
For heavy vehicle manufacturers, the global economic situation remained positive and the Volvo group (including Renault Trucks) increased by 3.5%.
Note: The production of Chinese manufacturers does not include joint-ventures.(1) The vehicles include passenger cars, light commercial vehicles, heavy trucks, and coaches and buses. There may be double counts between manufacturers.(2) The output of GM and Ford include their activities in China.Sources: OICA, annual reports, CCFA estimates
SHARE OF THE HOME REGION OF THE MANUFACTURERAS A PERCENTAGE OF ITS TOTAL PRODUCTIONAs a %
30405060708090
100
2000 2005 2010 2014 2015 2016 2017EUROPEAN MANUFACTURERS
KOREAN MANUFACTURERS GEELY (CHINA)TATA (INDIA)AMERICAN MANUFACTURERS
JAPANESE MANUFACTURERS
Rank GROUP 2018 2019 % Change1 VOLKSWAGEN 11,018 10,823 -1.82 TOYOTA 10,567 10,725 1.53 GM (2) 8,384 7,332 -12.54 HYUNDAI-KIA 7,275 7,200 -1.05 FORD (2) 5,982 5,386 -10.06 HONDA 5,357 5,171 -3.57 NISSAN 5,654 4,958 -12.38 FCA 4,842 4,600 -5.09 RENAULT 4,120 3,862 -6.310 PSA 3,868 3,436 -11.211 DAIMLER AG 3,352 3,295 -1.712 SUZUKI 3,437 3,056 -11.113 BMW 2,542 2,564 0.914 SAIC 2,848 2,529 -11.215 GEELY 2,177 2,178 0.016 MAZDA 1,597 1,488 -6.817 MITSUBISHI 1,271 1,441 13.418 DONGFENG MOTOR 1,122 1,297 15.619 TATA 1,221 1,274 4.320 CHANGAN 1,367 1,172 -14.321 GREAT WALL 1,027 1,087 5.822 SUBARU 1,019 987 -3.123 BAIC 1,022 953 -6.724 CHERY 612 659 7.625 ISUZU 626 648 3.5
37 VOLVO-UD TRUCKS-RENAULT TRUCKS-MACK 235 243 3.2
► WORLD VEHICLES PRODUCTION IN 2019 (1)(in thousands)
comité des constructeurs français d’automobiles • ANALYSIS & STATISTICS. 2020 EDITION 9
world • production
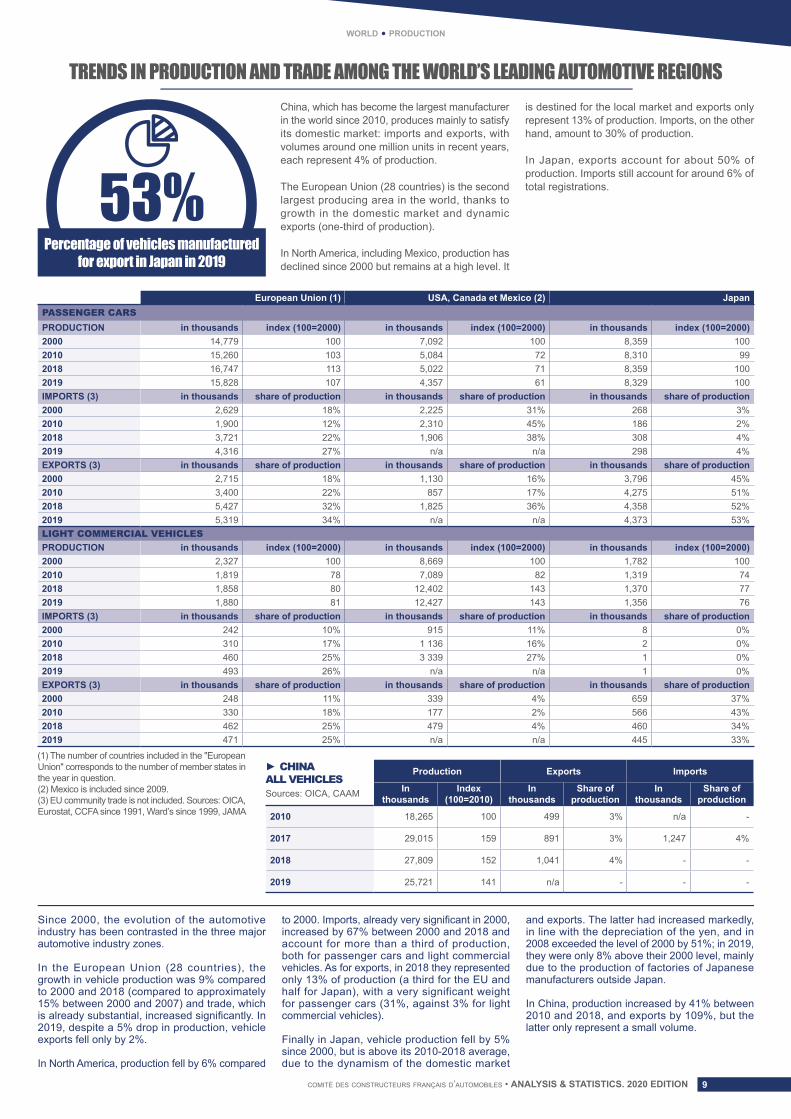
TRENDS IN PRODUCTION AND TRADE AMONG THE WORLD’S LEADING AUTOMOTIVE REGIONSChina, which has become the largest manufacturer in the world since 2010, produces mainly to satisfy its domestic market: imports and exports, with volumes around one million units in recent years, each represent 4% of production.
The European Union (28 countries) is the second largest producing area in the world, thanks to growth in the domestic market and dynamic exports (one-third of production).
In North America, including Mexico, production has declined since 2000 but remains at a high level. It
is destined for the local market and exports only represent 13% of production. Imports, on the other hand, amount to 30% of production.
In Japan, exports account for about 50% of production. Imports still account for around 6% of total registrations.53%
Percentage of vehicles manufactured for export in Japan in 2019
Since 2000, the evolution of the automotive industry has been contrasted in the three major automotive industry zones.
In the European Union (28 countries), the growth in vehicle production was 9% compared to 2000 and 2018 (compared to approximately 15% between 2000 and 2007) and trade, which is already substantial, increased significantly. In 2019, despite a 5% drop in production, vehicle exports fell only by 2%.
In North America, production fell by 6% compared
to 2000. Imports, already very significant in 2000, increased by 67% between 2000 and 2018 and account for more than a third of production, both for passenger cars and light commercial vehicles. As for exports, in 2018 they represented only 13% of production (a third for the EU and half for Japan), with a very significant weight for passenger cars (31%, against 3% for light commercial vehicles).
Finally in Japan, vehicle production fell by 5% since 2000, but is above its 2010-2018 average, due to the dynamism of the domestic market
and exports. The latter had increased markedly, in line with the depreciation of the yen, and in 2008 exceeded the level of 2000 by 51%; in 2019, they were only 8% above their 2000 level, mainly due to the production of factories of Japanese manufacturers outside Japan.
In China, production increased by 41% between 2010 and 2018, and exports by 109%, but the latter only represent a small volume.
European Union (1) USA, Canada et Mexico (2) JapanPASSENGER CARSPRODUCTION in thousands index (100=2000) in thousands index (100=2000) in thousands index (100=2000)2000 14,779 100 7,092 100 8,359 100 2010 15,260 103 5,084 72 8,310 99 2018 16,747 113 5,022 71 8,359 100 2019 15,828 107 4,357 61 8,329 100 IMPORTS (3) in thousands share of production in thousands share of production in thousands share of production2000 2,629 18% 2,225 31% 268 3%2010 1,900 12% 2,310 45% 186 2%2018 3,721 22% 1,906 38% 308 4%2019 4,316 27% n/a n/a 298 4%EXPORTS (3) in thousands share of production in thousands share of production in thousands share of production2000 2,715 18% 1,130 16% 3,796 45%2010 3,400 22% 857 17% 4,275 51%2018 5,427 32% 1,825 36% 4,358 52%2019 5,319 34% n/a n/a 4,373 53%LIGHT COMMERCIAL VEHICLESPRODUCTION in thousands index (100=2000) in thousands index (100=2000) in thousands index (100=2000)2000 2,327 100 8,669 100 1,782 100 2010 1,819 78 7,089 82 1,319 74 2018 1,858 80 12,402 143 1,370 77 2019 1,880 81 12,427 143 1,356 76 IMPORTS (3) in thousands share of production in thousands share of production in thousands share of production2000 242 10% 915 11% 8 0%2010 310 17% 1 136 16% 2 0%2018 460 25% 3 339 27% 1 0%2019 493 26% n/a n/a 1 0%EXPORTS (3) in thousands share of production in thousands share of production in thousands share of production2000 248 11% 339 4% 659 37%2010 330 18% 177 2% 566 43%2018 462 25% 479 4% 460 34%2019 471 25% n/a n/a 445 33%
(1) The number of countries included in the "European Union" corresponds to the number of member states in the year in question.(2) Mexico is included since 2009. (3) EU community trade is not included. Sources: OICA, Eurostat, CCFA since 1991, Ward’s since 1999, JAMA
Sources: OICA, CAAM
► CHINAALL VEHICLES
Production Exports Imports
Inthousands
Index (100=2010)
In thousands
Share of production
In thousands
Share of production
2010 18,265 100 499 3% n/a -
2017 29,015 159 891 3% 1,247 4%
2018 27,809 152 1,041 4% - -
2019 25,721 141 n/a - - -
comité des constructeurs français d’automobiles • ANALYSIS & STATISTICS. 2020 EDITIONcomité des constructeurs français d’automobiles • ANALYSIS & STATISTICS. 2020 EDITION10
world • markets & vehicles in use
WORLD VEHICLE MARKETS
Global automotive sales were strongly impacted in 2019 by the slowdown in growth in emerging countries and in particular in China and India. The Chinese market, which is the world’s largest market with 28% of sales, fell for the second year in a row, after several years of strong growth. The market lost more than 2 million vehicles in 2019 and now stands at 26 million vehicles, down 8.2% from 2018. India has seen its automotive sales fell by more than 10% in 2019, which now places it in fifth place in the world behind Germany. In Japan and South Korea, the market fell by 1.5% and 1.8% respectively after a first decline observed in 2018.
In the United States, the market fell 1.3% to 17.5 million vehicles. This remains a high cycle level, 7 million units higher than that observed during the crisis in 2009 (10.6 million). The Mexican market continued to contract (-7.2%).
In Central and South America, only the Brazilian market, which continues to recover, is growing
(+8.6%) with 2.8 million units.
In Western Europe, the market, which has been growing since 2014, grew 1% in 2019 to 16.7 million vehicles. This level is high compared to the period after the crisis of 2008 or the bottom of the cycle in 2013, when sales were around 13 million. The situations are contrasted with increases in Germany (+5.1%), France (+2.3%) and Italy (+0.5%), and decreases in the United Kingdom (-2.4%) and Spain (-4%).
Central and Eastern Europe, which represents 4.5% of the global market, experienced a decline in 2019 (-2.1%), after a first decline in 2018 (-0.5%). The growth rate of the new Member States of the European Union continues to slow (+5%), after five years of strong growth. The Turkish market fell again sharply (-23%), after three years of decline. The Russian market is also declining, after rising 10% in 2018, and stands at 1.8 million units, far from its pre-crisis level (3.2 million vehicles).
In the Asia-Oceania zone, the market, excluding China, India and South Korea, has fluctuated around 12 million vehicles since 2012. Developments in 2019 were very mixed, with increases as in Vietnam (+13.9%) and decreases as in Thailand (-3.3%).
In South America, the market continued to recover (+5.3%) in 2018, supported by the dynamism of the Brazilian market (+13.6%) and other countries except Argentina (-10%).
In Africa, after a rebound in sales in 2018, the market contracted in 2019 (-4.2%) including Algeria (-1.8%), Morocco (-6.5%), Egypt (- 7.8%) and South Africa (-2.8%), countries which had seen an increase in sales the previous year. Africa’s market share in the world market remains extremely low at just 1.3%.
Passenger cars Commercial vehicles Total Change 2019/20182018 2019 2018 2019 2018 2019
thousands thousands % thousands thousands % thousands thousands % %EUROPE 17,910 17,973 27.9 2,715 2,733 10.2 20,625 20,706 22.7 +0.4Western Europe 14,210 14,308 22.2 2,326 2,399 8.9 16,536 16,707 18.3 +1.0
Central and Eastern Europe 3,700 3,665 5.7 617 563 2.1 4,317 4,227 4.6 -2.1
AMERICA 10,563 9,540 14.8 15,397 15,769 58.7 25,960 25,309 27.8 -2.5NAFTA (1) 6,752 5,973 9.3 14,455 14,842 55.3 21,207 20,816 22.8 -1.8
USA 5,304 4,715 7.3 12,398 12,765 47.5 17,701 17,480 19.2 -1.3
Central and South America 3,811 3,567 5.5 942 927 3.5 4,753 4,494 4.9 -5.5
ASIA-OCEANIA 39,284 35,960 55.9 8,363 8,043 30.0 47,647 44,003 48.3 -7.6China 23,710 21,444 33.3 4,371 4,324 16.1 28,081 25,769 28.3 -8.2
South Korea 1,525 1,539 2.4 302 256 1.0 1,827 1,795 2.0 -1.8
India 3,395 2,962 4.6 1,005 855 3.2 4,400 3,817 4.2 -13.3
Japan 4,391 4,301 6.7 881 894 3.3 5,272 5,195 5.7 -1.5
ASEAN (2) 2,447 2,424 3.8 1,130 1,067 4.0 3,577 3,491 3.8 -2.4
Other Asia-Oceania 3,816 3,290 5.1 674 647 2.4 4,490 3,937 4.3 -12.3
AFRICA 921 869 1.4 307 308 1.1 1,229 1,177 1.3 -4.2TOTAL 68,678 64,342 100.0 26,783 26,854 100.0 95,461 91,196 100.0 -4.5
CHANGE 2019/2018 -6.3% 0.3% -4.5%
(1) NAFTA: Canada, USA and Mexico. (2) ASEAN: Brunei, Cambodia, Indonesia, Laos, Malaysia, Myanmar, Philippines, Singapore, Thailand, Vietnam. Source: OICA
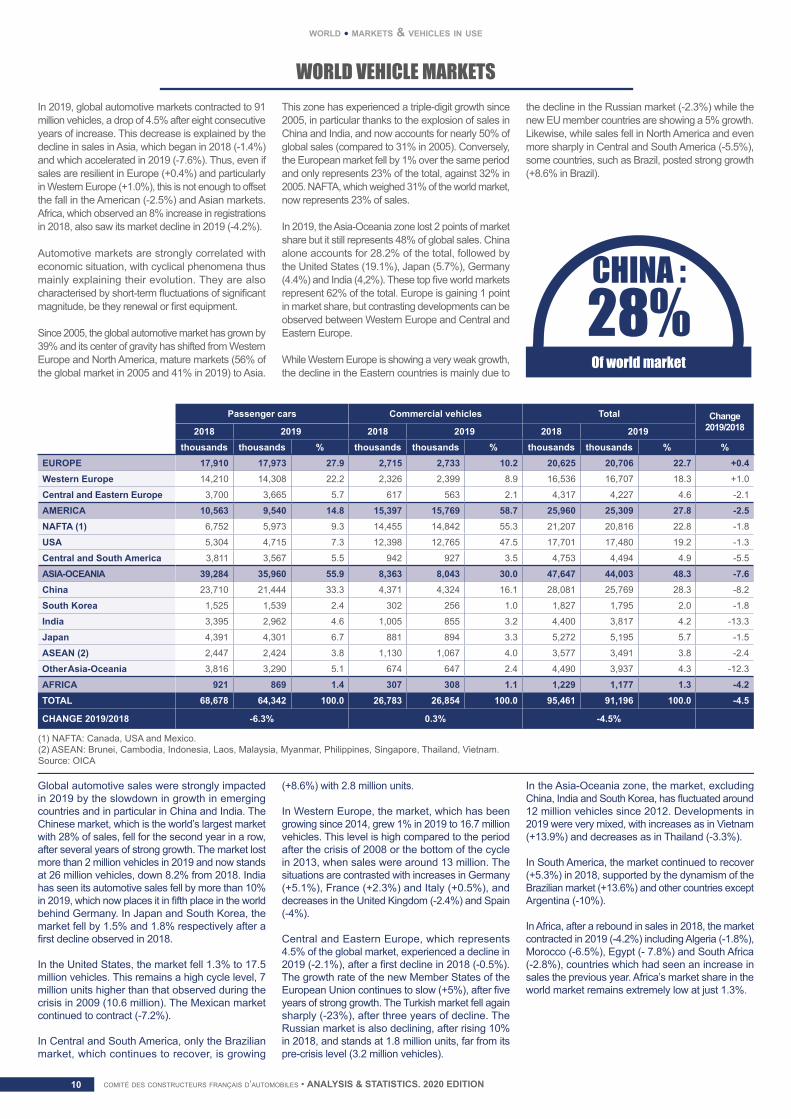
CHINA :28%Of world market
In 2019, global automotive markets contracted to 91 million vehicles, a drop of 4.5% after eight consecutive years of increase. This decrease is explained by the decline in sales in Asia, which began in 2018 (-1.4%) and which accelerated in 2019 (-7.6%). Thus, even if sales are resilient in Europe (+0.4%) and particularly in Western Europe (+1.0%), this is not enough to offset the fall in the American (-2.5%) and Asian markets. Africa, which observed an 8% increase in registrations in 2018, also saw its market decline in 2019 (-4.2%).
Automotive markets are strongly correlated with economic situation, with cyclical phenomena thus mainly explaining their evolution. They are also characterised by short-term fluctuations of significant magnitude, be they renewal or first equipment.
Since 2005, the global automotive market has grown by 39% and its center of gravity has shifted from Western Europe and North America, mature markets (56% of the global market in 2005 and 41% in 2019) to Asia.
This zone has experienced a triple-digit growth since 2005, in particular thanks to the explosion of sales in China and India, and now accounts for nearly 50% of global sales (compared to 31% in 2005). Conversely, the European market fell by 1% over the same period and only represents 23% of the total, against 32% in 2005. NAFTA, which weighed 31% of the world market, now represents 23% of sales.
In 2019, the Asia-Oceania zone lost 2 points of market share but it still represents 48% of global sales. China alone accounts for 28.2% of the total, followed by the United States (19.1%), Japan (5.7%), Germany (4.4%) and India (4,2%). These top five world markets represent 62% of the total. Europe is gaining 1 point in market share, but contrasting developments can be observed between Western Europe and Central and Eastern Europe.
While Western Europe is showing a very weak growth, the decline in the Eastern countries is mainly due to
the decline in the Russian market (-2.3%) while the new EU member countries are showing a 5% growth. Likewise, while sales fell in North America and even more sharply in Central and South America (-5.5%), some countries, such as Brazil, posted strong growth (+8.6% in Brazil).
comité des constructeurs français d’automobiles • ANALYSIS & STATISTICS. 2020 EDITION 11
world • markets & vehicles in use
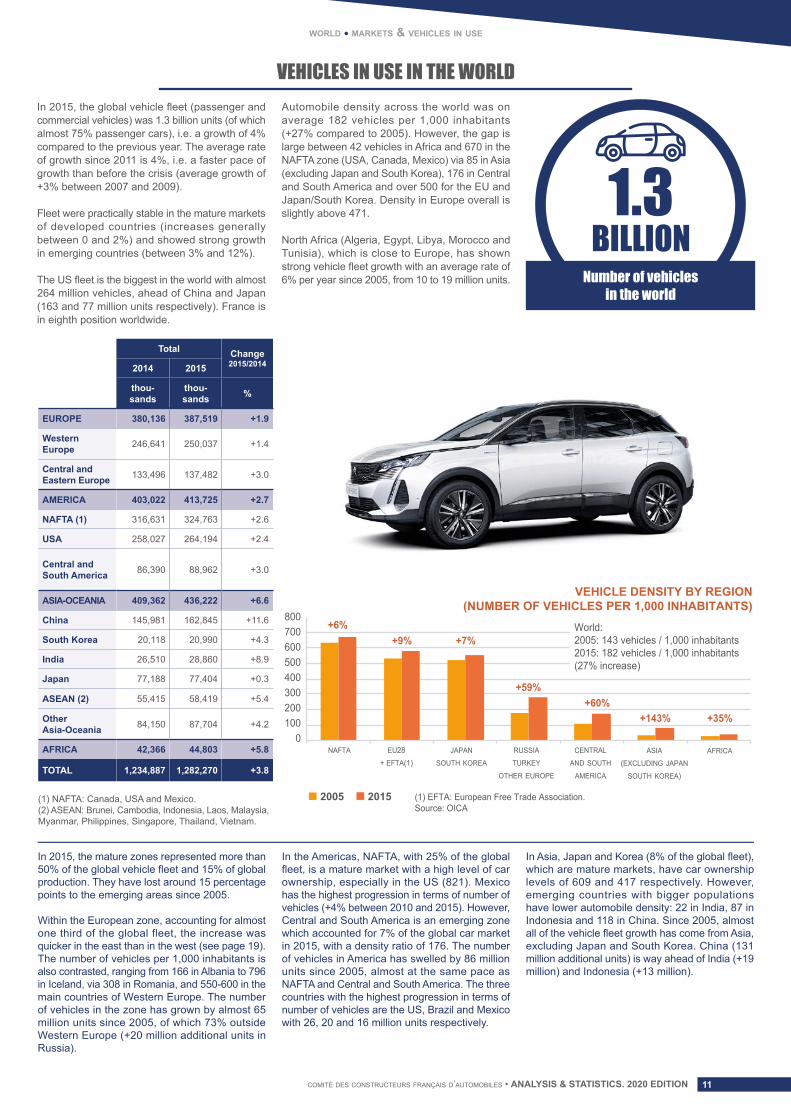
VEHICLES IN USE IN THE WORLDIn 2015, the global vehicle fleet (passenger and commercial vehicles) was 1.3 billion units (of which almost 75% passenger cars), i.e. a growth of 4% compared to the previous year. The average rate of growth since 2011 is 4%, i.e. a faster pace of growth than before the crisis (average growth of +3% between 2007 and 2009).
Fleet were practically stable in the mature markets of developed countries (increases generally between 0 and 2%) and showed strong growth in emerging countries (between 3% and 12%).
The US fleet is the biggest in the world with almost 264 million vehicles, ahead of China and Japan (163 and 77 million units respectively). France is in eighth position worldwide.
Automobile density across the world was on average 182 vehicles per 1,000 inhabitants (+27% compared to 2005). However, the gap is large between 42 vehicles in Africa and 670 in the NAFTA zone (USA, Canada, Mexico) via 85 in Asia (excluding Japan and South Korea), 176 in Central and South America and over 500 for the EU and Japan/South Korea. Density in Europe overall is slightly above 471.
North Africa (Algeria, Egypt, Libya, Morocco and Tunisia), which is close to Europe, has shown strong vehicle fleet growth with an average rate of 6% per year since 2005, from 10 to 19 million units.
1.3BILLION
Number of vehiclesin the world
In 2015, the mature zones represented more than 50% of the global vehicle fleet and 15% of global production. They have lost around 15 percentage points to the emerging areas since 2005.
Within the European zone, accounting for almost one third of the global fleet, the increase was quicker in the east than in the west (see page 19). The number of vehicles per 1,000 inhabitants is also contrasted, ranging from 166 in Albania to 796 in Iceland, via 308 in Romania, and 550-600 in the main countries of Western Europe. The number of vehicles in the zone has grown by almost 65 million units since 2005, of which 73% outside Western Europe (+20 million additional units in Russia).
In the Americas, NAFTA, with 25% of the global fleet, is a mature market with a high level of car ownership, especially in the US (821). Mexico has the highest progression in terms of number of vehicles (+4% between 2010 and 2015). However, Central and South America is an emerging zone which accounted for 7% of the global car market in 2015, with a density ratio of 176. The number of vehicles in America has swelled by 86 million units since 2005, almost at the same pace as NAFTA and Central and South America. The three countries with the highest progression in terms of number of vehicles are the US, Brazil and Mexico with 26, 20 and 16 million units respectively.
In Asia, Japan and Korea (8% of the global fleet), which are mature markets, have car ownership levels of 609 and 417 respectively. However, emerging countries with bigger populations have lower automobile density: 22 in India, 87 in Indonesia and 118 in China. Since 2005, almost all of the vehicle fleet growth has come from Asia, excluding Japan and South Korea. China (131 million additional units) is way ahead of India (+19 million) and Indonesia (+13 million).
Total Change2015/20142014 2015
thou-sands
thou-sands %
EUROPE 380,136 387,519 +1.9
WesternEurope 246,641 250,037 +1.4
Central and Eastern Europe 133,496 137,482 +3.0
AMERICA 403,022 413,725 +2.7
NAFTA (1) 316,631 324,763 +2.6
USA 258,027 264,194 +2.4
Central and South America 86,390 88,962 +3.0
ASIA-OCEANIA 409,362 436,222 +6.6
China 145,981 162,845 +11.6
South Korea 20,118 20,990 +4.3
IndiaIndia 26,510 28,860 +8.9
Japan 77,188 77,404 +0.3
ASEAN (2) 55,415 58,419 +5.4
Other Asia-Oceania 84,150 87,704 +4.2
AFRICA 42,366 44,803 +5.8
TOTAL 1,234,887 1,282,270 +3.8
(1) NAFTA: Canada, USA and Mexico.(2) ASEAN: Brunei, Cambodia, Indonesia, Laos, Malaysia, Myanmar, Philippines, Singapore, Thailand, Vietnam.
VEHICLE DENSITY BY REGION(NUMBER OF VEHICLES PER 1,000 INHABITANTS)
0 NAFTA
(1) EFTA: European Free Trade Association.Source: OICA
EU28+ EFTA(1)
JAPAN
SOUTH KOREA
RUSSIA
TURKEY
OTHER EUROPE
CENTRAL
AND SOUTH
AMERICA
ASIA
(EXCLUDING JAPAN
SOUTH KOREA)
AFRICA
100200300400500600700800
+6%+9% +7%
+59%+60%
+143% +35%
2005 2015
World:2005: 143 vehicles / 1,000 inhabitants2015: 182 vehicles / 1,000 inhabitants(27% increase)
comité des constructeurs français d’automobiles • ANALYSIS & STATISTICS. 2020 EDITIONcomité des constructeurs français d’automobiles • ANALYSIS & STATISTICS. 2020 EDITION12
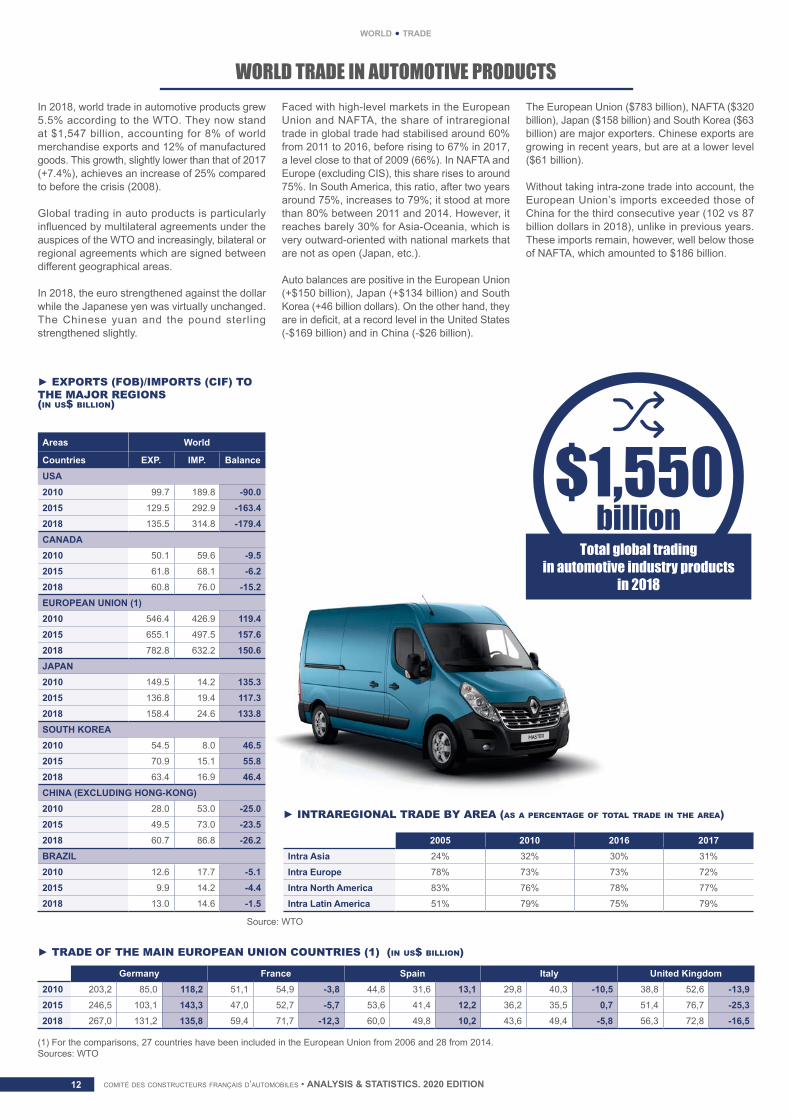
WORLD TRADE IN AUTOMOTIVE PRODUCTSIn 2018, world trade in automotive products grew 5.5% according to the WTO. They now stand at $1,547 billion, accounting for 8% of world merchandise exports and 12% of manufactured goods. This growth, slightly lower than that of 2017 (+7.4%), achieves an increase of 25% compared to before the crisis (2008).
Global trading in auto products is particularly influenced by multilateral agreements under the auspices of the WTO and increasingly, bilateral or regional agreements which are signed between different geographical areas.
In 2018, the euro strengthened against the dollar while the Japanese yen was virtually unchanged. The Chinese yuan and the pound sterling strengthened slightly.
Faced with high-level markets in the European Union and NAFTA, the share of intraregional trade in global trade had stabilised around 60% from 2011 to 2016, before rising to 67% in 2017, a level close to that of 2009 (66%). In NAFTA and Europe (excluding CIS), this share rises to around 75%. In South America, this ratio, after two years around 75%, increases to 79%; it stood at more than 80% between 2011 and 2014. However, it reaches barely 30% for Asia-Oceania, which is very outward-oriented with national markets that are not as open (Japan, etc.).
Auto balances are positive in the European Union (+$150 billion), Japan (+$134 billion) and South Korea (+46 billion dollars). On the other hand, they are in deficit, at a record level in the United States (-$169 billion) and in China (-$26 billion).
The European Union ($783 billion), NAFTA ($320 billion), Japan ($158 billion) and South Korea ($63 billion) are major exporters. Chinese exports are growing in recent years, but are at a lower level ($61 billion).
Without taking intra-zone trade into account, the European Union’s imports exceeded those of China for the third consecutive year (102 vs 87 billion dollars in 2018), unlike in previous years. These imports remain, however, well below those of NAFTA, which amounted to $186 billion.
Areas World
Countries EXP. IMP. BalanceUSA2010 99.7 189.8 -90.0 2015 129.5 292.9 -163.4 2018 135.5 314.8 -179.4 CANADA2010 50.1 59.6 -9.5 2015 61.8 68.1 -6.2 2018 60.8 76.0 -15.2 EUROPEAN UNION (1)2010 546.4 426.9 119.4 2015 655.1 497.5 157.6 2018 782.8 632.2 150.6 JAPAN2010 149.5 14.2 135.3 2015 136.8 19.4 117.3 2018 158.4 24.6 133.8 SOUTH KOREA2010 54.5 8.0 46.5 2015 70.9 15.1 55.8 2018 63.4 16.9 46.4 CHINA (EXCLUDING HONG-KONG)2010 28.0 53.0 -25.0 2015 49.5 73.0 -23.5 2018 60.7 86.8 -26.2 BRAZIL2010 12.6 17.7 -5.1 2015 9.9 14.2 -4.4 2018 13.0 14.6 -1.5
Germany France Spain Italy United Kingdom2010 203,2 85,0 118,2 51,1 54,9 -3,8 44,8 31,6 13,1 29,8 40,3 -10,5 38,8 52,6 -13,92015 246,5 103,1 143,3 47,0 52,7 -5,7 53,6 41,4 12,2 36,2 35,5 0,7 51,4 76,7 -25,32018 267,0 131,2 135,8 59,4 71,7 -12,3 60,0 49,8 10,2 43,6 49,4 -5,8 56,3 72,8 -16,5
2005 2010 2016 2017 Intra Asia 24% 32% 30% 31%
Intra Europe 78% 73% 73% 72%
Intra North America 83% 76% 78% 77%
Intra Latin America 51% 79% 75% 79%
► EXPORTS (FOB)/IMPORTS (CIF) TO THE MAJOR REGIONS(in us$ billion)
► TRADE OF THE MAIN EUROPEAN UNION COUNTRIES (1) (in us$ billion)
► INTRAREGIONAL TRADE BY AREA (as a percentage of total trade in the area)
(1) For the comparisons, 27 countries have been included in the European Union from 2006 and 28 from 2014.Sources: WTO
Source: WTO
Total global tradingin automotive industry products
in 2018
$1,550
world • trade
billion
comité des constructeurs français d’automobiles • ANALYSIS & STATISTICS. 2020 EDITION 13
► INTRAREGIONAL TRADE BY AREA (as a percentage of total trade in the area)
world • trade
WORLD TRADE IN AUTOMOTIVE PRODUCTS
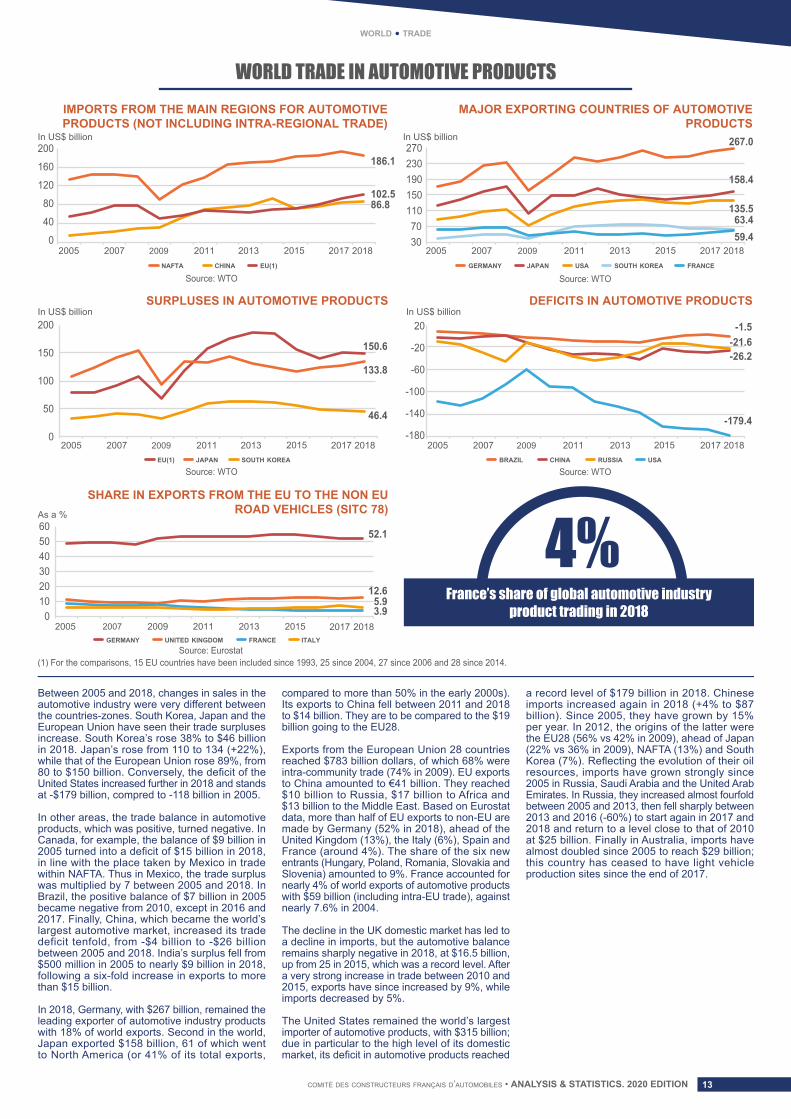
Between 2005 and 2018, changes in sales in the automotive industry were very different between the countries-zones. South Korea, Japan and the European Union have seen their trade surpluses increase. South Korea’s rose 38% to $46 billion in 2018. Japan’s rose from 110 to 134 (+22%), while that of the European Union rose 89%, from 80 to $150 billion. Conversely, the deficit of the United States increased further in 2018 and stands at -$179 billion, compred to -118 billion in 2005.
In other areas, the trade balance in automotive products, which was positive, turned negative. In Canada, for example, the balance of $9 billion in 2005 turned into a deficit of $15 billion in 2018, in line with the place taken by Mexico in trade within NAFTA. Thus in Mexico, the trade surplus was multiplied by 7 between 2005 and 2018. In Brazil, the positive balance of $7 billion in 2005 became negative from 2010, except in 2016 and 2017. Finally, China, which became the world’s largest automotive market, increased its trade deficit tenfold, from -$4 billion to -$26 billion between 2005 and 2018. India’s surplus fell from $500 million in 2005 to nearly $9 billion in 2018, following a six-fold increase in exports to more than $15 billion.
In 2018, Germany, with $267 billion, remained the leading exporter of automotive industry products with 18% of world exports. Second in the world, Japan exported $158 billion, 61 of which went to North America (or 41% of its total exports,
compared to more than 50% in the early 2000s). Its exports to China fell between 2011 and 2018 to $14 billion. They are to be compared to the $19 billion going to the EU28.
Exports from the European Union 28 countries reached $783 billion dollars, of which 68% were intra-community trade (74% in 2009). EU exports to China amounted to €41 billion. They reached $10 billion to Russia, $17 billion to Africa and $13 billion to the Middle East. Based on Eurostat data, more than half of EU exports to non-EU are made by Germany (52% in 2018), ahead of the United Kingdom (13%), the Italy (6%), Spain and France (around 4%). The share of the six new entrants (Hungary, Poland, Romania, Slovakia and Slovenia) amounted to 9%. France accounted for nearly 4% of world exports of automotive products with $59 billion (including intra-EU trade), against nearly 7.6% in 2004.
The decline in the UK domestic market has led to a decline in imports, but the automotive balance remains sharply negative in 2018, at $16.5 billion, up from 25 in 2015, which was a record level. After a very strong increase in trade between 2010 and 2015, exports have since increased by 9%, while imports decreased by 5%.
The United States remained the world’s largest importer of automotive products, with $315 billion; due in particular to the high level of its domestic market, its deficit in automotive products reached
a record level of $179 billion in 2018. Chinese imports increased again in 2018 (+4% to $87 billion). Since 2005, they have grown by 15% per year. In 2012, the origins of the latter were the EU28 (56% vs 42% in 2009), ahead of Japan (22% vs 36% in 2009), NAFTA (13%) and South Korea (7%). Reflecting the evolution of their oil resources, imports have grown strongly since 2005 in Russia, Saudi Arabia and the United Arab Emirates. In Russia, they increased almost fourfold between 2005 and 2013, then fell sharply between 2013 and 2016 (-60%) to start again in 2017 and 2018 and return to a level close to that of 2010 at $25 billion. Finally in Australia, imports have almost doubled since 2005 to reach $29 billion; this country has ceased to have light vehicle production sites since the end of 2017.
France’s share of global automotive industryproduct trading in 2018
IMPORTS FROM THE MAIN REGIONS FOR AUTOMOTIVEPRODUCTS (NOT INCLUDING INTRA-REGIONAL TRADE)
MAJOR EXPORTING COUNTRIES OF AUTOMOTIVEPRODUCTS
DEFICITS IN AUTOMOTIVE PRODUCTSSURPLUSES IN AUTOMOTIVE PRODUCTS
SHARE IN EXPORTS FROM THE EU TO THE NON EUROAD VEHICLES (SITC 78)
In US$ billion
In US$ billion
As a %
In US$ billion
In US$ billion
Source: WTO
Source: WTO
(1) For the comparisons, 15 EU countries have been included since 1993, 25 since 2004, 27 since 2006 and 28 since 2014.Source: Eurostat
Source: WTO
Source: WTO
0
40
80
120
160
200
0
50
100
150
200
20100
30405060
110
230190150
270
3070
-60
-20
-140
-180
-100
20
20072005 2009 2011 2015 2013 2018 2017 20072005 2009 2011 2015 2013 2018 2017 NAFTA CHINA EU(1)
EU(1) JAPAN SOUTH KOREA
GERMANY JAPAN USA SOUTH KOREA FRANCE
BRAZIL CHINA RUSSIA USA
GERMANY UNITED KINGDOM FRANCE ITALY
2005 2007 2009 2013 2011 2015 2017 2018
150.6
133.8
46.4
52.1
5.93.9
186.1
102.5
-1.5
-179.4
-26.2-21.6
12.6
20072005 2009 2011 2015 2013 2018 2017 20072005 2009 2011 2015 2013 2018 2017
86.8
267.0
158.4
135.563.459.4
4%
comité des constructeurs français d’automobiles • ANALYSIS & STATISTICS. 2020 EDITIONcomité des constructeurs français d’automobiles • ANALYSIS & STATISTICS. 2020 EDITION14
► NEW PASSENGER CARS REGISTRATIONS IN EUROPE
europe • market & vehicles in use
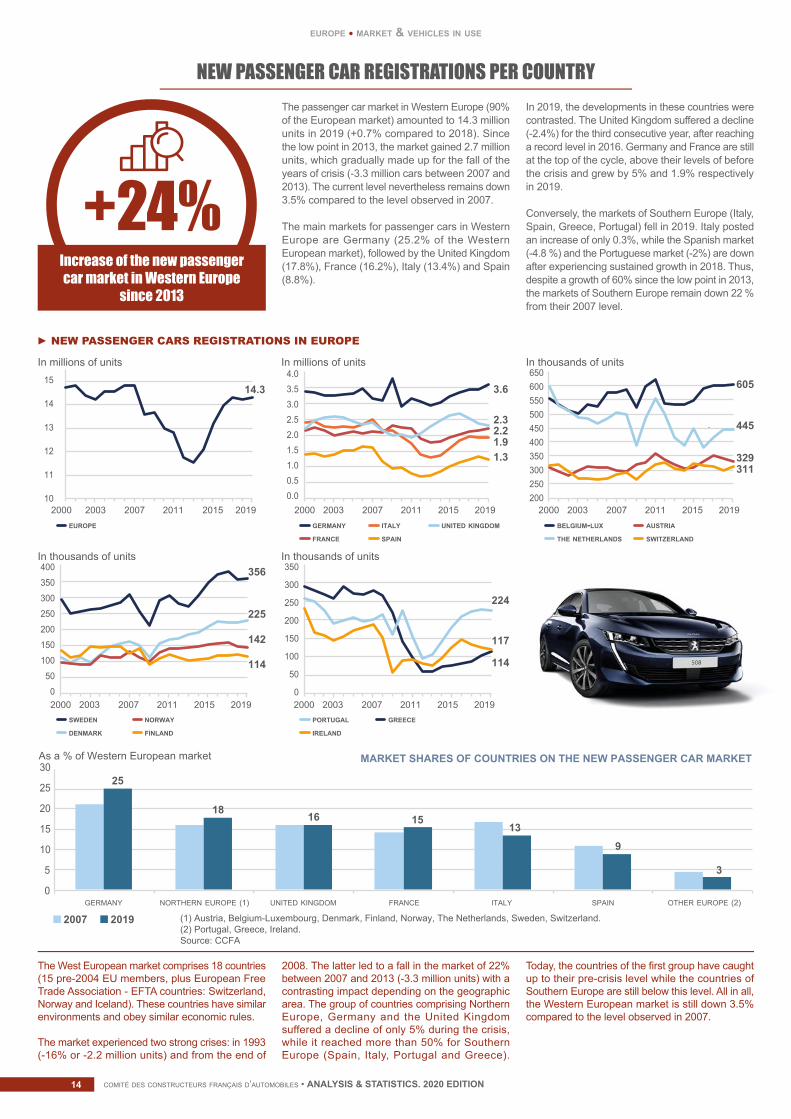
NEW PASSENGER CAR REGISTRATIONS PER COUNTRYThe passenger car market in Western Europe (90% of the European market) amounted to 14.3 million units in 2019 (+0.7% compared to 2018). Since the low point in 2013, the market gained 2.7 million units, which gradually made up for the fall of the years of crisis (-3.3 million cars between 2007 and 2013). The current level nevertheless remains down 3.5% compared to the level observed in 2007.
The main markets for passenger cars in Western Europe are Germany (25.2% of the Western European market), followed by the United Kingdom (17.8%), France (16.2%), Italy (13.4%) and Spain (8.8%).
In 2019, the developments in these countries were contrasted. The United Kingdom suffered a decline (-2.4%) for the third consecutive year, after reaching a record level in 2016. Germany and France are still at the top of the cycle, above their levels of before the crisis and grew by 5% and 1.9% respectively in 2019.
Conversely, the markets of Southern Europe (Italy, Spain, Greece, Portugal) fell in 2019. Italy posted an increase of only 0.3%, while the Spanish market (-4.8 %) and the Portuguese market (-2%) are down after experiencing sustained growth in 2018. Thus, despite a growth of 60% since the low point in 2013, the markets of Southern Europe remain down 22 % from their 2007 level.
The West European market comprises 18 countries (15 pre-2004 EU members, plus European Free Trade Association - EFTA countries: Switzerland, Norway and Iceland). These countries have similar environments and obey similar economic rules.
The market experienced two strong crises: in 1993 (-16% or -2.2 million units) and from the end of
2008. The latter led to a fall in the market of 22% between 2007 and 2013 (-3.3 million units) with a contrasting impact depending on the geographic area. The group of countries comprising Northern Europe, Germany and the United Kingdom suffered a decline of only 5% during the crisis, while it reached more than 50% for Southern Europe (Spain, Italy, Portugal and Greece).
Today, the countries of the first group have caught up to their pre-crisis level while the countries of Southern Europe are still below this level. All in all, the Western European market is still down 3.5% compared to the level observed in 2007.
+24%Increase of the new passengercar market in Western Europe
since 2013
20032000 2007 2011 2015 2019 10
11
14.3
12
13
14
15
In millions of units
EUROPE
0.00.5
3.6
2.32.2 1.91.3
1.01.52.02.53.03.54.0
In millions of units
GERMANY ITALY
FRANCE SPAIN
UNITED KINGDOM
605
445
329311
In thousands of units
BELGIUM-LUX AUSTRIA
THE NETHERLANDS SWITZERLAND
200 250 300 350 400 450 500 550 600 650
356
225
142
114
In thousands of units
SWEDEN NORWAY
DENMARK FINLAND
0
50
100
150
200
250
300
350
400
224
117
114
In thousands of units
PORTUGAL GREECE
IRELAND
0
50
100
150
200
250
300
350
0
5
10
15
20
25
30As a % of Western European market
GERMANY
(1) Austria, Belgium-Luxembourg, Denmark, Finland, Norway, The Netherlands, Sweden, Switzerland.(2) Portugal, Greece, Ireland.Source: CCFA
SPAINNORTHERN EUROPE (1) OTHER EUROPE (2)FRANCE ITALYUNITED KINGDOM
2007 2019
MARKET SHARES OF COUNTRIES ON THE NEW PASSENGER CAR MARKET
-
25
18 16 1513
9
3
20032000 2007 2011 2015 2019
20032000 2007 2011 2015 2019 20032000 2007 2011 2015 2019
20032000 2007 2011 2015 2019
comité des constructeurs français d’automobiles • ANALYSIS & STATISTICS. 2020 EDITION 15
europe • market & vehicles in use
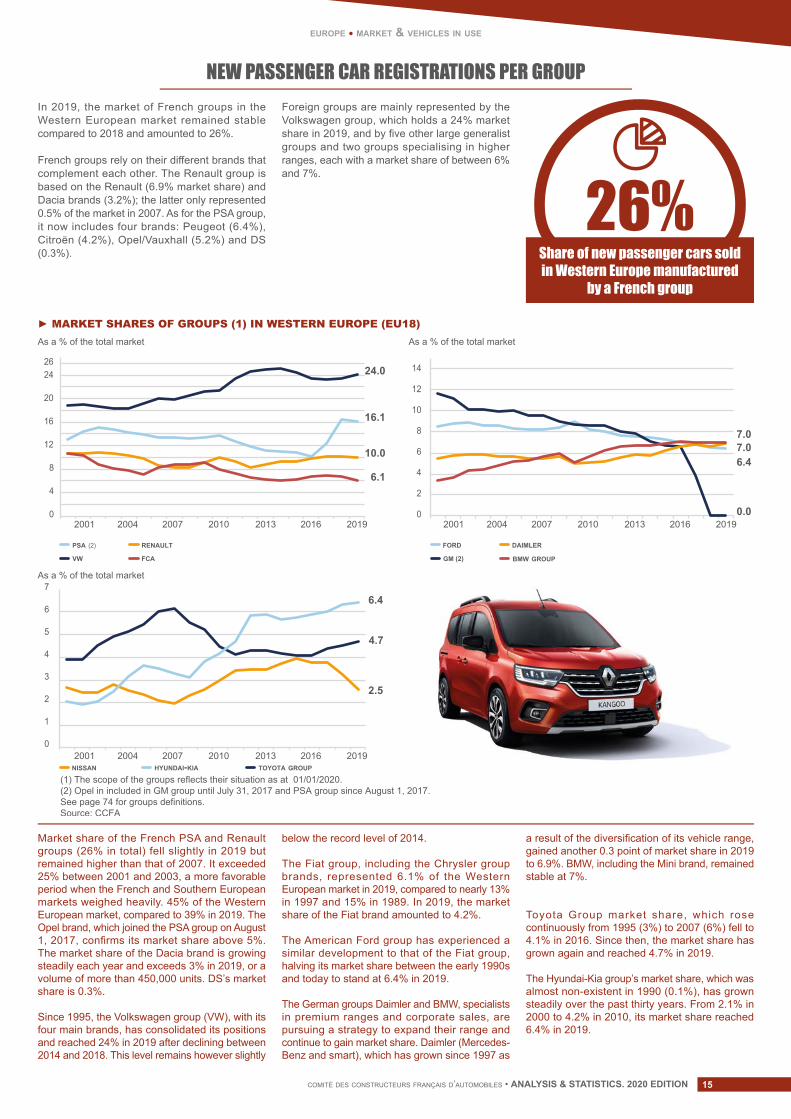
NEW PASSENGER CAR REGISTRATIONS PER GROUPIn 2019, the market of French groups in the Western European market remained stable compared to 2018 and amounted to 26%.
French groups rely on their different brands that complement each other. The Renault group is based on the Renault (6.9% market share) and Dacia brands (3.2%); the latter only represented 0.5% of the market in 2007. As for the PSA group, it now includes four brands: Peugeot (6.4%), Citroën (4.2%), Opel/Vauxhall (5.2%) and DS (0.3%).
Foreign groups are mainly represented by the Volkswagen group, which holds a 24% market share in 2019, and by five other large generalist groups and two groups specialising in higher ranges, each with a market share of between 6% and 7%.
Market share of the French PSA and Renault groups (26% in total) fell slightly in 2019 but remained higher than that of 2007. It exceeded 25% between 2001 and 2003, a more favorable period when the French and Southern European markets weighed heavily. 45% of the Western European market, compared to 39% in 2019. The Opel brand, which joined the PSA group on August 1, 2017, confirms its market share above 5%. The market share of the Dacia brand is growing steadily each year and exceeds 3% in 2019, or a volume of more than 450,000 units. DS’s market share is 0.3%.
Since 1995, the Volkswagen group (VW), with its four main brands, has consolidated its positions and reached 24% in 2019 after declining between 2014 and 2018. This level remains however slightly
below the record level of 2014.
The Fiat group, including the Chrysler group brands, represented 6.1% of the Western European market in 2019, compared to nearly 13% in 1997 and 15% in 1989. In 2019, the market share of the Fiat brand amounted to 4.2%.
The American Ford group has experienced a similar development to that of the Fiat group, halving its market share between the early 1990s and today to stand at 6.4% in 2019.
The German groups Daimler and BMW, specialists in premium ranges and corporate sales, are pursuing a strategy to expand their range and continue to gain market share. Daimler (Mercedes-Benz and smart), which has grown since 1997 as
a result of the diversification of its vehicle range, gained another 0.3 point of market share in 2019 to 6.9%. BMW, including the Mini brand, remained stable at 7%.
Toyota Group market share, which rose continuously from 1995 (3%) to 2007 (6%) fell to 4.1% in 2016. Since then, the market share has grown again and reached 4.7% in 2019.
The Hyundai-Kia group’s market share, which was almost non-existent in 1990 (0.1%), has grown steadily over the past thirty years. From 2.1% in 2000 to 4.2% in 2010, its market share reached 6.4% in 2019.
Share of new passenger cars soldin Western Europe manufactured
by a French group
► MARKET SHARES OF GROUPS (1) IN WESTERN EUROPE (EU18)
As a % of the total market
0
1
2
3
4
5
6
7
4.7
2.5
6.4
NISSAN TOYOTA GROUPHYUNDAI-KIA
(1) The scope of the groups reflects their situation as at 01/01/2020.(2) Opel in included in GM group until July 31, 2017 and PSA group since August 1, 2017. See page 74 for groups definitions. Source: CCFA
As a % of the total market
PSA (2) RENAULT
VW FCA
16.1
10.0
24.0
6.1
0
4
8
12
16
20
2426
As a % of the total market
0
4
2
6
8
10
12
14
6.4
0.0
7.07.0
FORD GM (2)
DAIMLER BMW GROUP
2019201620132010200720042001
2019201620132010200720042001
2019201620132010200720042001
26%
comité des constructeurs français d’automobiles • ANALYSIS & STATISTICS. 2020 EDITIONcomité des constructeurs français d’automobiles • ANALYSIS & STATISTICS. 2020 EDITION16
europe • market & vehicles in use
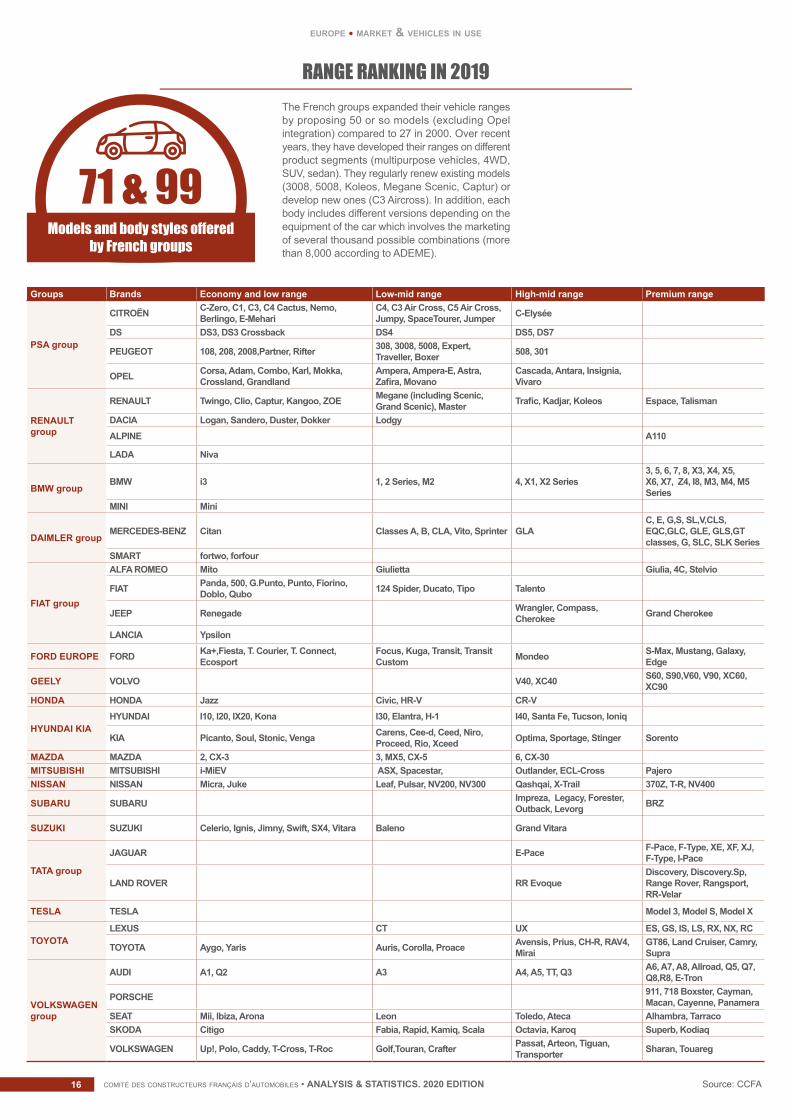
RANGE RANKING IN 2019
Groups Brands Economy and low range Low-mid range High-mid range Premium range
PSA group
CITROËN C-Zero, C1, C3, C4 Cactus, Nemo, Berlingo, E-Mehari
C4, C3 Air Cross, C5 Air Cross, Jumpy, SpaceTourer, Jumper C-Elysée
DS DS3, DS3 Crossback DS4 DS5, DS7
PEUGEOT 108, 208, 2008,Partner, Rifter 308, 3008, 5008, Expert, Traveller, Boxer 508, 301
OPEL Corsa, Adam, Combo, Karl, Mokka, Crossland, Grandland
Ampera, Ampera-E, Astra, Zafira, Movano
Cascada, Antara, Insignia, Vivaro
RENAULT group
RENAULT Twingo, Clio, Captur, Kangoo, ZOE Megane (including Scenic, Grand Scenic), Master Trafic, Kadjar, Koleos Espace, Talisman
DACIA Logan, Sandero, Duster, Dokker LodgyALPINE A110
LADA Niva
BMW groupBMW i3 1, 2 Series, M2 4, X1, X2 Series
3, 5, 6, 7, 8, X3, X4, X5, X6, X7, Z4, I8, M3, M4, M5 Series
MINI Mini
DAIMLER groupMERCEDES-BENZ Citan Classes A, B, CLA, Vito, Sprinter GLA
C, E, G,S, SL,V,CLS,EQC,GLC, GLE, GLS,GT classes, G, SLC, SLK Series
SMART fortwo, forfour
FIAT group
ALFA ROMEO Mito Giulietta Giulia, 4C, Stelvio
FIAT Panda, 500, G.Punto, Punto, Fiorino, Doblo, Qubo 124 Spider, Ducato, Tipo Talento
JEEP Renegade Wrangler, Compass, Cherokee Grand Cherokee
LANCIA Ypsilon
FORD EUROPE FORD Ka+,Fiesta, T. Courier, T. Connect, Ecosport
Focus, Kuga, Transit, Transit Custom Mondeo S-Max, Mustang, Galaxy,
Edge
GEELY VOLVO V40, XC40 S60, S90,V60, V90, XC60, XC90
HONDA HONDA Jazz Civic, HR-V CR-V
HYUNDAI KIAHYUNDAI I10, I20, IX20, Kona I30, Elantra, H-1 I40, Santa Fe, Tucson, Ioniq
KIA Picanto, Soul, Stonic, Venga Carens, Cee-d, Ceed, Niro, Proceed, Rio, Xceed Optima, Sportage, Stinger Sorento
MAZDA MAZDA 2, CX-3 3, MX5, CX-5 6, CX-30MITSUBISHI MITSUBISHI i-MiEV ASX, Spacestar, Outlander, ECL-Cross PajeroNISSAN NISSAN Micra, Juke Leaf, Pulsar, NV200, NV300 Qashqai, X-Trail 370Z, T-R, NV400
SUBARU SUBARU Impreza, Legacy, Forester, Outback, Levorg BRZ
SUZUKI SUZUKI Celerio, Ignis, Jimny, Swift, SX4, Vitara Baleno Grand Vitara
TATA group
JAGUAR E-Pace F-Pace, F-Type, XE, XF, XJ, F-Type, I-Pace
LAND ROVER RR EvoqueDiscovery, Discovery.Sp, Range Rover, Rangsport, RR-Velar
TESLA TESLA Model 3, Model S, Model X
TOYOTALEXUS CT UX ES, GS, IS, LS, RX, NX, RC
TOYOTA Aygo, Yaris Auris, Corolla, Proace Avensis, Prius, CH-R, RAV4, Mirai
GT86, Land Cruiser, Camry, Supra
VOLKSWAGEN group
AUDI A1, Q2 A3 A4, A5, TT, Q3 A6, A7, A8, Allroad, Q5, Q7, Q8,R8, E-Tron
PORSCHE 911, 718 Boxster, Cayman, Macan, Cayenne, Panamera
SEAT Mii, Ibiza, Arona Leon Toledo, Ateca Alhambra, TarracoSKODA Citigo Fabia, Rapid, Kamiq, Scala Octavia, Karoq Superb, Kodiaq
VOLKSWAGEN Up!, Polo, Caddy, T-Cross, T-Roc Golf,Touran, Crafter Passat, Arteon, Tiguan, Transporter Sharan, Touareg
Source: CCFA
71 & 99Models and body styles offered
by French groups
The French groups expanded their vehicle ranges by proposing 50 or so models (excluding Opel integration) compared to 27 in 2000. Over recent years, they have developed their ranges on different product segments (multipurpose vehicles, 4WD, SUV, sedan). They regularly renew existing models (3008, 5008, Koleos, Megane Scenic, Captur) or develop new ones (C3 Aircross). In addition, each body includes different versions depending on the equipment of the car which involves the marketing of several thousand possible combinations (more than 8,000 according to ADEME).
comité des constructeurs français d’automobiles • ANALYSIS & STATISTICS. 2020 EDITION 17
europe • market & vehicles in use
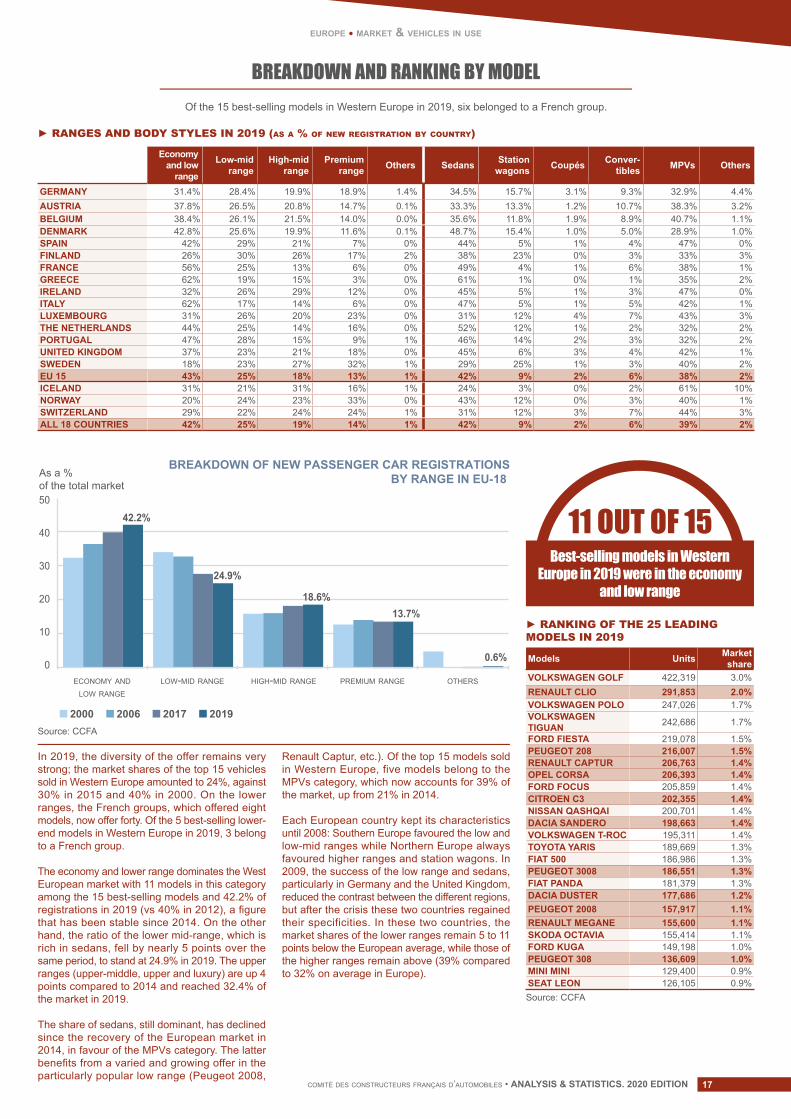
BREAKDOWN AND RANKING BY MODEL Of the 15 best-selling models in Western Europe in 2019, six belonged to a French group.
11 OUT OF 15Best-selling models in Western
Europe in 2019 were in the economy and low range
► RANGES AND BODY STYLES IN 2019 (as a % of new registration by country)
► RANKING OF THE 25 LEADING MODELS IN 2019
Economy and low
range
Low-mid range
High-mid range
Premium range Others Sedans Station
wagons Coupés Conver-tibles MPVs Others
GERMANY 31.4% 28.4% 19.9% 18.9% 1.4% 34.5% 15.7% 3.1% 9.3% 32.9% 4.4%AUSTRIA 37.8% 26.5% 20.8% 14.7% 0.1% 33.3% 13.3% 1.2% 10.7% 38.3% 3.2%BELGIUM 38.4% 26.1% 21.5% 14.0% 0.0% 35.6% 11.8% 1.9% 8.9% 40.7% 1.1%DENMARK 42.8% 25.6% 19.9% 11.6% 0.1% 48.7% 15.4% 1.0% 5.0% 28.9% 1.0%SPAIN 42% 29% 21% 7% 0% 44% 5% 1% 4% 47% 0%FINLAND 26% 30% 26% 17% 2% 38% 23% 0% 3% 33% 3%FRANCE 56% 25% 13% 6% 0% 49% 4% 1% 6% 38% 1%GREECE 62% 19% 15% 3% 0% 61% 1% 0% 1% 35% 2%IRELAND 32% 26% 29% 12% 0% 45% 5% 1% 3% 47% 0%ITALY 62% 17% 14% 6% 0% 47% 5% 1% 5% 42% 1%LUXEMBOURG 31% 26% 20% 23% 0% 31% 12% 4% 7% 43% 3%THE NETHERLANDS 44% 25% 14% 16% 0% 52% 12% 1% 2% 32% 2%PORTUGAL 47% 28% 15% 9% 1% 46% 14% 2% 3% 32% 2%UNITED KINGDOM 37% 23% 21% 18% 0% 45% 6% 3% 4% 42% 1%SWEDEN 18% 23% 27% 32% 1% 29% 25% 1% 3% 40% 2%EU 15 43% 25% 18% 13% 1% 42% 9% 2% 6% 38% 2%ICELAND 31% 21% 31% 16% 1% 24% 3% 0% 2% 61% 10%NORWAY 20% 24% 23% 33% 0% 43% 12% 0% 3% 40% 1%SWITZERLAND 29% 22% 24% 24% 1% 31% 12% 3% 7% 44% 3%ALL 18 COUNTRIES 42% 25% 19% 14% 1% 42% 9% 2% 6% 39% 2%
Models Units Market share
VOLKSWAGEN GOLF 422,319 3.0%RENAULT CLIO 291,853 2.0%VOLKSWAGEN POLO 247,026 1.7%VOLKSWAGEN TIGUAN 242,686 1.7%
FORD FIESTA 219,078 1.5%PEUGEOT 208 216,007 1.5%RENAULT CAPTUR 206,763 1.4%OPEL CORSA 206,393 1.4%FORD FOCUS 205,859 1.4%CITROEN C3 202,355 1.4%NISSAN QASHQAI 200,701 1.4%DACIA SANDERO 198,663 1.4%VOLKSWAGEN T-ROC 195,311 1.4%TOYOTA YARIS 189,669 1.3%FIAT 500 186,986 1.3%PEUGEOT 3008 186,551 1.3%FIAT PANDA 181,379 1.3%DACIA DUSTER 177,686 1.2%PEUGEOT 2008 157,917 1.1%RENAULT MEGANE 155,600 1.1%SKODA OCTAVIA 155,414 1.1%FORD KUGA 149,198 1.0%PEUGEOT 308 136,609 1.0%MINI MINI 129,400 0.9%SEAT LEON 126,105 0.9%
Source: CCFA
2000 2006 2017 2019
BREAKDOWN OF NEW PASSENGER CAR REGISTRATIONSBY RANGE IN EU-18
0
10
20
40
50
30
As a %of the total market
ECONOMY AND
LOW RANGE
LOW-MID RANGE HIGH-MID RANGE PREMIUM RANGE OTHERS
42.2%
24.9%
13.7%
0.6%
18.6%
In 2019, the diversity of the offer remains very strong; the market shares of the top 15 vehicles sold in Western Europe amounted to 24%, against 30% in 2015 and 40% in 2000. On the lower ranges, the French groups, which offered eight models, now offer forty. Of the 5 best-selling lower-end models in Western Europe in 2019, 3 belong to a French group.
The economy and lower range dominates the West European market with 11 models in this category among the 15 best-selling models and 42.2% of registrations in 2019 (vs 40% in 2012), a figure that has been stable since 2014. On the other hand, the ratio of the lower mid-range, which is rich in sedans, fell by nearly 5 points over the same period, to stand at 24.9% in 2019. The upper ranges (upper-middle, upper and luxury) are up 4 points compared to 2014 and reached 32.4% of the market in 2019.
The share of sedans, still dominant, has declined since the recovery of the European market in 2014, in favour of the MPVs category. The latter benefits from a varied and growing offer in the particularly popular low range (Peugeot 2008,
Renault Captur, etc.). Of the top 15 models sold in Western Europe, five models belong to the MPVs category, which now accounts for 39% of the market, up from 21% in 2014.
Each European country kept its characteristics until 2008: Southern Europe favoured the low and low-mid ranges while Northern Europe always favoured higher ranges and station wagons. In 2009, the success of the low range and sedans, particularly in Germany and the United Kingdom, reduced the contrast between the different regions, but after the crisis these two countries regained their specificities. In these two countries, the market shares of the lower ranges remain 5 to 11 points below the European average, while those of the higher ranges remain above (39% compared to 32% on average in Europe).
Source: CCFA
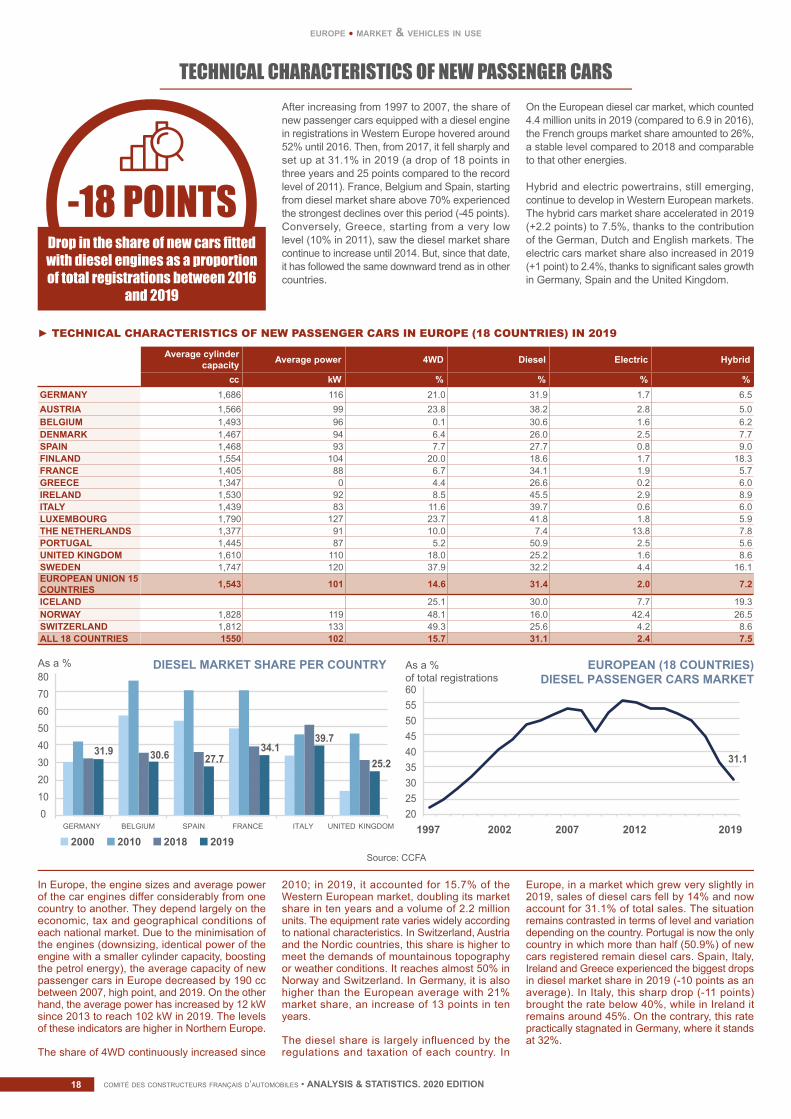
comité des constructeurs français d’automobiles • ANALYSIS & STATISTICS. 2020 EDITIONcomité des constructeurs français d’automobiles • ANALYSIS & STATISTICS. 2020 EDITION18
europe • market & vehicles in use
TECHNICAL CHARACTERISTICS OF NEW PASSENGER CARSAfter increasing from 1997 to 2007, the share of new passenger cars equipped with a diesel engine in registrations in Western Europe hovered around 52% until 2016. Then, from 2017, it fell sharply and set up at 31.1% in 2019 (a drop of 18 points in three years and 25 points compared to the record level of 2011). France, Belgium and Spain, starting from diesel market share above 70% experienced the strongest declines over this period (-45 points). Conversely, Greece, starting from a very low level (10% in 2011), saw the diesel market share continue to increase until 2014. But, since that date, it has followed the same downward trend as in other countries.
On the European diesel car market, which counted 4.4 million units in 2019 (compared to 6.9 in 2016), the French groups market share amounted to 26%, a stable level compared to 2018 and comparable to that other energies.
Hybrid and electric powertrains, still emerging, continue to develop in Western European markets. The hybrid cars market share accelerated in 2019 (+2.2 points) to 7.5%, thanks to the contribution of the German, Dutch and English markets. The electric cars market share also increased in 2019 (+1 point) to 2.4%, thanks to significant sales growth in Germany, Spain and the United Kingdom.
-18 POINTSDrop in the share of new cars fitted with diesel engines as a proportion of total registrations between 2016
and 2019
In Europe, the engine sizes and average power of the car engines differ considerably from one country to another. They depend largely on the economic, tax and geographical conditions of each national market. Due to the minimisation of the engines (downsizing, identical power of the engine with a smaller cylinder capacity, boosting the petrol energy), the average capacity of new passenger cars in Europe decreased by 190 cc between 2007, high point, and 2019. On the other hand, the average power has increased by 12 kW since 2013 to reach 102 kW in 2019. The levels of these indicators are higher in Northern Europe.
The share of 4WD continuously increased since
2010; in 2019, it accounted for 15.7% of the Western European market, doubling its market share in ten years and a volume of 2.2 million units. The equipment rate varies widely according to national characteristics. In Switzerland, Austria and the Nordic countries, this share is higher to meet the demands of mountainous topography or weather conditions. It reaches almost 50% in Norway and Switzerland. In Germany, it is also higher than the European average with 21% market share, an increase of 13 points in ten years.
The diesel share is largely influenced by the regulations and taxation of each country. In
Europe, in a market which grew very slightly in 2019, sales of diesel cars fell by 14% and now account for 31.1% of total sales. The situation remains contrasted in terms of level and variation depending on the country. Portugal is now the only country in which more than half (50.9%) of new cars registered remain diesel cars. Spain, Italy, Ireland and Greece experienced the biggest drops in diesel market share in 2019 (-10 points as an average). In Italy, this sharp drop (-11 points) brought the rate below 40%, while in Ireland it remains around 45%. On the contrary, this rate practically stagnated in Germany, where it stands at 32%.
► TECHNICAL CHARACTERISTICS OF NEW PASSENGER CARS IN EUROPE (18 COUNTRIES) IN 2019
Average cylinder capacity Average power 4WD Diesel Electric Hybrid
cc kW % % % %GERMANY 1,686 116 21.0 31.9 1.7 6.5AUSTRIA 1,566 99 23.8 38.2 2.8 5.0BELGIUM 1,493 96 0.1 30.6 1.6 6.2DENMARK 1,467 94 6.4 26.0 2.5 7.7SPAIN 1,468 93 7.7 27.7 0.8 9.0FINLAND 1,554 104 20.0 18.6 1.7 18.3FRANCE 1,405 88 6.7 34.1 1.9 5.7GREECE 1,347 0 4.4 26.6 0.2 6.0IRELAND 1,530 92 8.5 45.5 2.9 8.9ITALY 1,439 83 11.6 39.7 0.6 6.0LUXEMBOURG 1,790 127 23.7 41.8 1.8 5.9THE NETHERLANDS 1,377 91 10.0 7.4 13.8 7.8PORTUGAL 1,445 87 5.2 50.9 2.5 5.6UNITED KINGDOM 1,610 110 18.0 25.2 1.6 8.6SWEDEN 1,747 120 37.9 32.2 4.4 16.1EUROPEAN UNION 15 COUNTRIES 1,543 101 14.6 31.4 2.0 7.2
ICELAND 25.1 30.0 7.7 19.3NORWAY 1,828 119 48.1 16.0 42.4 26.5SWITZERLAND 1,812 133 49.3 25.6 4.2 8.6ALL 18 COUNTRIES 1550 102 15.7 31.1 2.4 7.5
Source: CCFA
EUROPEAN (18 COUNTRIES)DIESEL PASSENGER CARS MARKET
2520
45505560
303540
As a %of total registrations
20192012200720021997
DIESEL MARKET SHARE PER COUNTRY
01020
4050607080
30
As a %
UNITED KINGDOMGERMANY BELGIUM SPAIN FRANCE ITALY 2000 2010 2018 2019
31.9 34.139.7
25.227.730.6 31.1
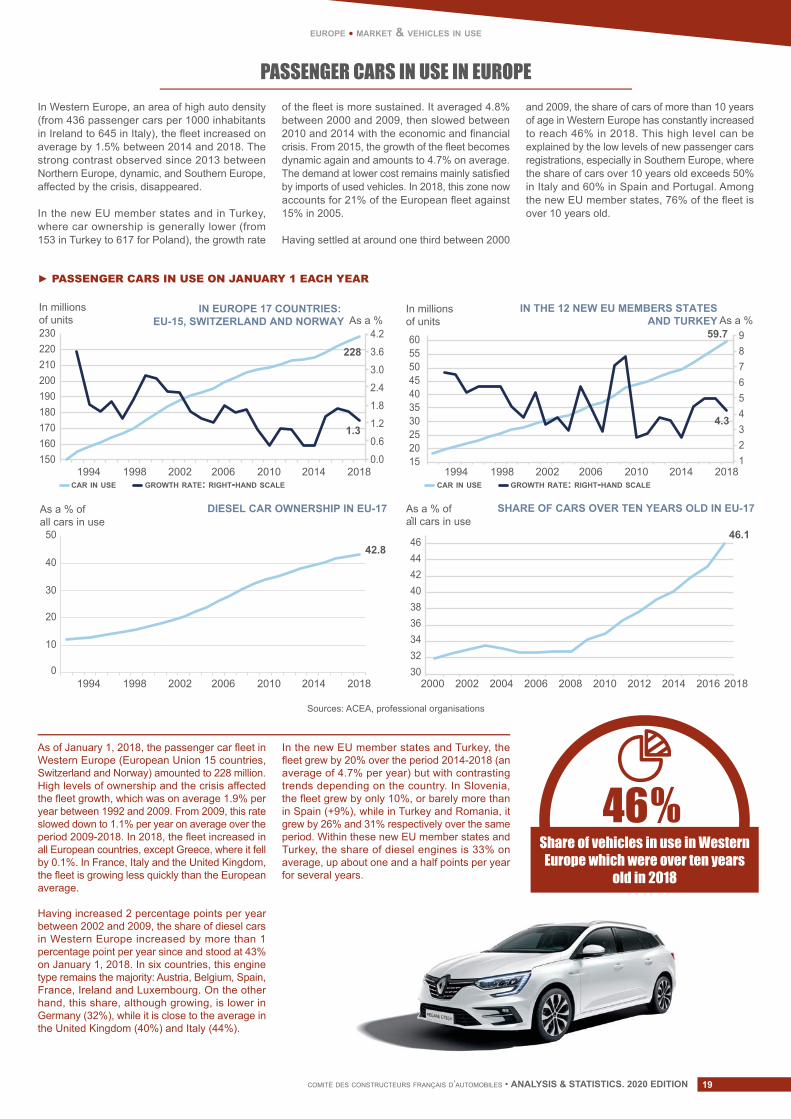
comité des constructeurs français d’automobiles • ANALYSIS & STATISTICS. 2020 EDITION 19
Sources: ACEA, professional organisations
europe • market & vehicles in use
PASSENGER CARS IN USE IN EUROPEIn Western Europe, an area of high auto density (from 436 passenger cars per 1000 inhabitants in Ireland to 645 in Italy), the fleet increased on average by 1.5% between 2014 and 2018. The strong contrast observed since 2013 between Northern Europe, dynamic, and Southern Europe, affected by the crisis, disappeared.
In the new EU member states and in Turkey, where car ownership is generally lower (from 153 in Turkey to 617 for Poland), the growth rate
of the fleet is more sustained. It averaged 4.8% between 2000 and 2009, then slowed between 2010 and 2014 with the economic and financial crisis. From 2015, the growth of the fleet becomes dynamic again and amounts to 4.7% on average. The demand at lower cost remains mainly satisfied by imports of used vehicles. In 2018, this zone now accounts for 21% of the European fleet against 15% in 2005.
Having settled at around one third between 2000
and 2009, the share of cars of more than 10 years of age in Western Europe has constantly increased to reach 46% in 2018. This high level can be explained by the low levels of new passenger cars registrations, especially in Southern Europe, where the share of cars over 10 years old exceeds 50% in Italy and 60% in Spain and Portugal. Among the new EU member states, 76% of the fleet is over 10 years old.
As of January 1, 2018, the passenger car fleet in Western Europe (European Union 15 countries, Switzerland and Norway) amounted to 228 million. High levels of ownership and the crisis affected the fleet growth, which was on average 1.9% per year between 1992 and 2009. From 2009, this rate slowed down to 1.1% per year on average over the period 2009-2018. In 2018, the fleet increased in all European countries, except Greece, where it fell by 0.1%. In France, Italy and the United Kingdom, the fleet is growing less quickly than the European average.
Having increased 2 percentage points per year between 2002 and 2009, the share of diesel cars in Western Europe increased by more than 1 percentage point per year since and stood at 43% on January 1, 2018. In six countries, this engine type remains the majority: Austria, Belgium, Spain, France, Ireland and Luxembourg. On the other hand, this share, although growing, is lower in Germany (32%), while it is close to the average in the United Kingdom (40%) and Italy (44%).
In the new EU member states and Turkey, the fleet grew by 20% over the period 2014-2018 (an average of 4.7% per year) but with contrasting trends depending on the country. In Slovenia, the fleet grew by only 10%, or barely more than in Spain (+9%), while in Turkey and Romania, it grew by 26% and 31% respectively over the same period. Within these new EU member states and Turkey, the share of diesel engines is 33% on average, up about one and a half points per year for several years.
► PASSENGER CARS IN USE ON JANUARY 1 EACH YEAR
Share of vehicles in use in Western Europe which were over ten years
old in 2018
In millionsof units As a % As a %
2018201420102006200219981994
2018201420102006200219981994 2012 2014 2016 2018201020082006200420022000
20182014201020062002199819940.0
0.6
1.2
1.8
2.4
3.0
3.6
4.2
150 160 170 180 190 200 210 220 230
IN EUROPE 17 COUNTRIES: EU-15, SWITZERLAND AND NORWAY
GROWTH RATE: RIGHT-HAND SCALECAR IN USE GROWTH RATE: RIGHT-HAND SCALECAR IN USE
In millionsof units
123456789
15202530354045505560
IN THE 12 NEW EU MEMBERS STATESAND TURKEY
As a % ofall cars in use
0
10
20
30
40
50
DIESEL CAR OWNERSHIP IN EU-17
42.8
As a % ofall cars in use
303234363840424446
SHARE OF CARS OVER TEN YEARS OLD IN EU-17
1.3
59.7
4.3
228
46.1
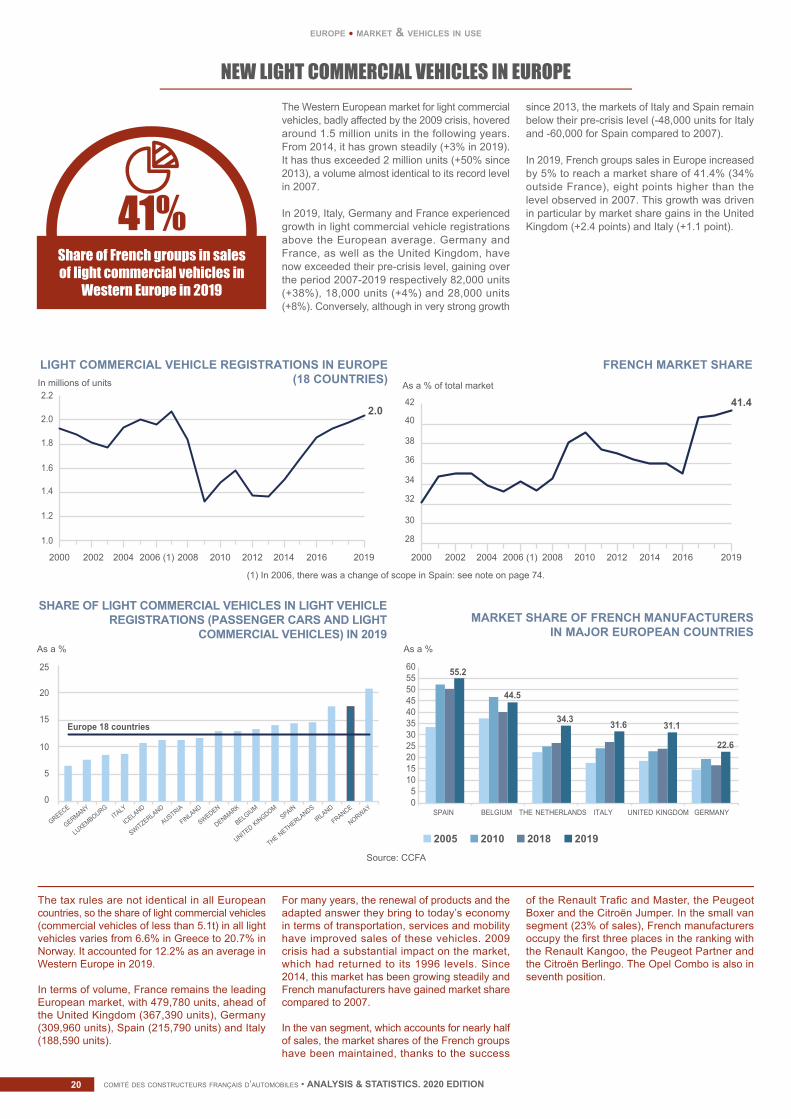
comité des constructeurs français d’automobiles • ANALYSIS & STATISTICS. 2020 EDITIONcomité des constructeurs français d’automobiles • ANALYSIS & STATISTICS. 2020 EDITION20
NEW LIGHT COMMERCIAL VEHICLES IN EUROPEThe Western European market for light commercial vehicles, badly affected by the 2009 crisis, hovered around 1.5 million units in the following years. From 2014, it has grown steadily (+3% in 2019). It has thus exceeded 2 million units (+50% since 2013), a volume almost identical to its record level in 2007.
In 2019, Italy, Germany and France experienced growth in light commercial vehicle registrations above the European average. Germany and France, as well as the United Kingdom, have now exceeded their pre-crisis level, gaining over the period 2007-2019 respectively 82,000 units (+38%), 18,000 units (+4%) and 28,000 units (+8%). Conversely, although in very strong growth
since 2013, the markets of Italy and Spain remain below their pre-crisis level (-48,000 units for Italy and -60,000 for Spain compared to 2007).
In 2019, French groups sales in Europe increased by 5% to reach a market share of 41.4% (34% outside France), eight points higher than the level observed in 2007. This growth was driven in particular by market share gains in the United Kingdom (+2.4 points) and Italy (+1.1 point).41%
Share of French groups in sales of light commercial vehicles in
Western Europe in 2019
The tax rules are not identical in all European countries, so the share of light commercial vehicles (commercial vehicles of less than 5.1t) in all light vehicles varies from 6.6% in Greece to 20.7% in Norway. It accounted for 12.2% as an average in Western Europe in 2019.
In terms of volume, France remains the leading European market, with 479,780 units, ahead of the United Kingdom (367,390 units), Germany (309,960 units), Spain (215,790 units) and Italy (188,590 units).
For many years, the renewal of products and the adapted answer they bring to today’s economy in terms of transportation, services and mobility have improved sales of these vehicles. 2009 crisis had a substantial impact on the market, which had returned to its 1996 levels. Since 2014, this market has been growing steadily and French manufacturers have gained market share compared to 2007.
In the van segment, which accounts for nearly half of sales, the market shares of the French groups have been maintained, thanks to the success
of the Renault Trafic and Master, the Peugeot Boxer and the Citroën Jumper. In the small van segment (23% of sales), French manufacturers occupy the first three places in the ranking with the Renault Kangoo, the Peugeot Partner and the Citroën Berlingo. The Opel Combo is also in seventh position.
2.0
1.0
1.2
1.4
1.6
1.8
2.0
2.2
LIGHT COMMERCIAL VEHICLE REGISTRATIONS IN EUROPE(18 COUNTRIES)In millions of units
2019201620142012201020082006 (1)2002 20042000 2019201620142012201020082006 (1)2002 20042000
FRENCH MARKET SHAREAs a % of total market
(1) In 2006, there was a change of scope in Spain: see note on page 74.
41.4
0
5
10
15
20
25
As a %
SHARE OF LIGHT COMMERCIAL VEHICLES IN LIGHT VEHICLEREGISTRATIONS (PASSENGER CARS AND LIGHT
COMMERCIAL VEHICLES) IN 2019
05
1015202530354045505560
As a %
MARKET SHARE OF FRENCH MANUFACTURERS IN MAJOR EUROPEAN COUNTRIES
2005 2010 2018 2019
28
30
32
34
36
38
40
42
Europe 18 countries
55.2
GERMANY
GREECE
LUXEMBOURG
AUSTRIA
ICELANDITALY
FINLAND
SWITZERLAND
BELGIUM
DENMARK
SWEDEN
UNITED KINGDOM
SPAIN
THE NETHERLANDS
IRLAND
FRANCE
NORWAY BELGIUM THE NETHERLANDS GERMANYSPAIN ITALY UNITED KINGDOM
44.5
34.3 31.6 31.1
22.6
Source: CCFA
europe • market & vehicles in use
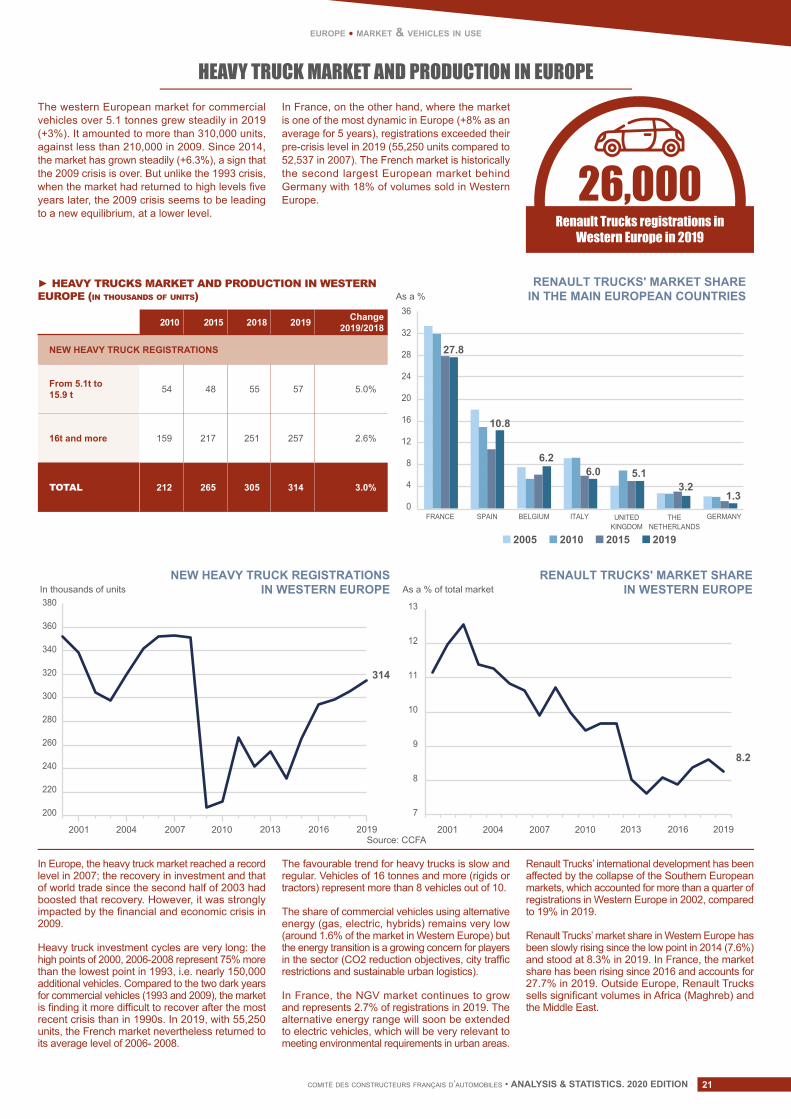
comité des constructeurs français d’automobiles • ANALYSIS & STATISTICS. 2020 EDITION 21
europe • market & vehicles in use
HEAVY TRUCK MARKET AND PRODUCTION IN EUROPEThe western European market for commercial vehicles over 5.1 tonnes grew steadily in 2019 (+3%). It amounted to more than 310,000 units, against less than 210,000 in 2009. Since 2014, the market has grown steadily (+6.3%), a sign that the 2009 crisis is over. But unlike the 1993 crisis, when the market had returned to high levels five years later, the 2009 crisis seems to be leading to a new equilibrium, at a lower level.
In France, on the other hand, where the market is one of the most dynamic in Europe (+8% as an average for 5 years), registrations exceeded their pre-crisis level in 2019 (55,250 units compared to 52,537 in 2007). The French market is historically the second largest European market behind Germany with 18% of volumes sold in Western Europe.
Renault Trucks registrations in Western Europe in 2019
In Europe, the heavy truck market reached a record level in 2007; the recovery in investment and that of world trade since the second half of 2003 had boosted that recovery. However, it was strongly impacted by the financial and economic crisis in 2009.
Heavy truck investment cycles are very long: the high points of 2000, 2006-2008 represent 75% more than the lowest point in 1993, i.e. nearly 150,000 additional vehicles. Compared to the two dark years for commercial vehicles (1993 and 2009), the market is finding it more difficult to recover after the most recent crisis than in 1990s. In 2019, with 55,250 units, the French market nevertheless returned to its average level of 2006- 2008.
The favourable trend for heavy trucks is slow and regular. Vehicles of 16 tonnes and more (rigids or tractors) represent more than 8 vehicles out of 10.
The share of commercial vehicles using alternative energy (gas, electric, hybrids) remains very low (around 1.6% of the market in Western Europe) but the energy transition is a growing concern for players in the sector (CO2 reduction objectives, city traffic restrictions and sustainable urban logistics).
In France, the NGV market continues to grow and represents 2.7% of registrations in 2019. The alternative energy range will soon be extended to electric vehicles, which will be very relevant to meeting environmental requirements in urban areas.
Renault Trucks’ international development has been affected by the collapse of the Southern European markets, which accounted for more than a quarter of registrations in Western Europe in 2002, compared to 19% in 2019.
Renault Trucks’ market share in Western Europe has been slowly rising since the low point in 2014 (7.6%) and stood at 8.3% in 2019. In France, the market share has been rising since 2016 and accounts for 27.7% in 2019. Outside Europe, Renault Trucks sells significant volumes in Africa (Maghreb) and the Middle East.
► HEAVY TRUCKS MARKET AND PRODUCTION IN WESTERN EUROPE (in thousands of units)
2010 2015 2018 2019 Change 2019/2018
NEW HEAVY TRUCK REGISTRATIONS
From 5.1t to 15.9 t 54 48 55 57 5.0%
16t and more 159 217 251 257 2.6%
TOTAL 212 265 305 314 3.0%
As a %
0
4
8
12
16
20
24
32
28
36
RENAULT TRUCKS' MARKET SHAREIN THE MAIN EUROPEAN COUNTRIES
NEW HEAVY TRUCK REGISTRATIONSIN WESTERN EUROPEIn thousands of units
314
27.8
200
220
240
260
280
300
320
340
360
380
RENAULT TRUCKS' MARKET SHAREIN WESTERN EUROPEAs a % of total market
8.2
7
8
9
10
11
12
13
2016 2019201320102007200420012016 20192013201020072001 2004
2005 2010 2015 2019
FRANCE BELGIUM THENETHERLANDS
GERMANYSPAIN ITALY UNITEDKINGDOM
10.8
6.26.0 5.1
3.21.3
Source: CCFA
26,000
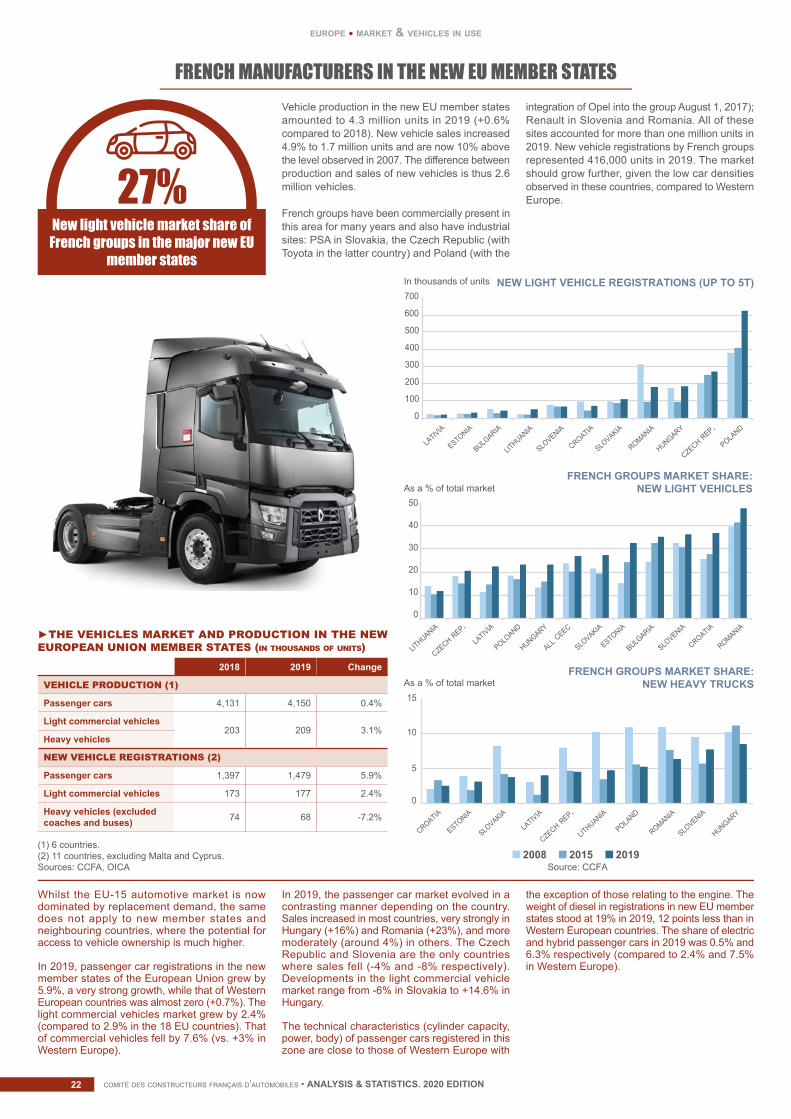
comité des constructeurs français d’automobiles • ANALYSIS & STATISTICS. 2020 EDITIONcomité des constructeurs français d’automobiles • ANALYSIS & STATISTICS. 2020 EDITION22
FRENCH MANUFACTURERS IN THE NEW EU MEMBER STATESVehicle production in the new EU member states amounted to 4.3 million units in 2019 (+0.6% compared to 2018). New vehicle sales increased 4.9% to 1.7 million units and are now 10% above the level observed in 2007. The difference between production and sales of new vehicles is thus 2.6 million vehicles.
French groups have been commercially present in this area for many years and also have industrial sites: PSA in Slovakia, the Czech Republic (with Toyota in the latter country) and Poland (with the
integration of Opel into the group August 1, 2017); Renault in Slovenia and Romania. All of these sites accounted for more than one million units in 2019. New vehicle registrations by French groups represented 416,000 units in 2019. The market should grow further, given the low car densities observed in these countries, compared to Western Europe.
Whilst the EU-15 automotive market is now dominated by replacement demand, the same does not apply to new member states and neighbouring countries, where the potential for access to vehicle ownership is much higher.
In 2019, passenger car registrations in the new member states of the European Union grew by 5.9%, a very strong growth, while that of Western European countries was almost zero (+0.7%). The light commercial vehicles market grew by 2.4% (compared to 2.9% in the 18 EU countries). That of commercial vehicles fell by 7.6% (vs. +3% in Western Europe).
In 2019, the passenger car market evolved in a contrasting manner depending on the country. Sales increased in most countries, very strongly in Hungary (+16%) and Romania (+23%), and more moderately (around 4%) in others. The Czech Republic and Slovenia are the only countries where sales fell (-4% and -8% respectively). Developments in the light commercial vehicle market range from -6% in Slovakia to +14.6% in Hungary.
The technical characteristics (cylinder capacity, power, body) of passenger cars registered in this zone are close to those of Western Europe with
the exception of those relating to the engine. The weight of diesel in registrations in new EU member states stood at 19% in 2019, 12 points less than in Western European countries. The share of electric and hybrid passenger cars in 2019 was 0.5% and 6.3% respectively (compared to 2.4% and 7.5% in Western Europe).
2018 2019 Change
VEHICLE PRODUCTION (1)
Passenger cars 4,131 4,150 0.4%
Light commercial vehicles203 209 3.1%
Heavy vehicles
NEW VEHICLE REGISTRATIONS (2)
Passenger cars 1,397 1,479 5.9%
Light commercial vehicles 173 177 2.4%
Heavy vehicles (excluded coaches and buses) 74 68 -7.2%
►THE VEHICLES MARKET AND PRODUCTION IN THE NEW EUROPEAN UNION MEMBER STATES (in thousands of units)
(1) 6 countries. (2) 11 countries, excluding Malta and Cyprus. Sources: CCFA, OICA
27%New light vehicle market share of
French groups in the major new EU member states
europe • market & vehicles in use
LATIVIA
LITHUANIA
ESTONIA
BULGARIA
CROATIA
SLOVENIA
SLOVAKIA
ROMANIA
HUNGARY
CZECH REP.
POLAND
LITHUANIA
LATIVIA
CZECH REP.
HUNGARY
POLOAND
ALL CEEC
ESTONIA
SLOVAKIA
CROATIA
SLOVENIA
BULGARIA
ROMANIA
LATIVIA
ESTONIA
CROATIA
LITHUANIA
SLOVAKIA
CZECH REP.
POLAND
SLOVENIA
ROMANIA
HUNGARY
0
100
200
300
0
10
20
30
40
50
0
5
10
15
400
500
600
700NEW LIGHT VEHICLE REGISTRATIONS (UP TO 5T)In thousands of units
As a % of total market
As a % of total market
FRENCH GROUPS MARKET SHARE:NEW LIGHT VEHICLES
FRENCH GROUPS MARKET SHARE:NEW HEAVY TRUCKS
2008 2015 2019Source: CCFA
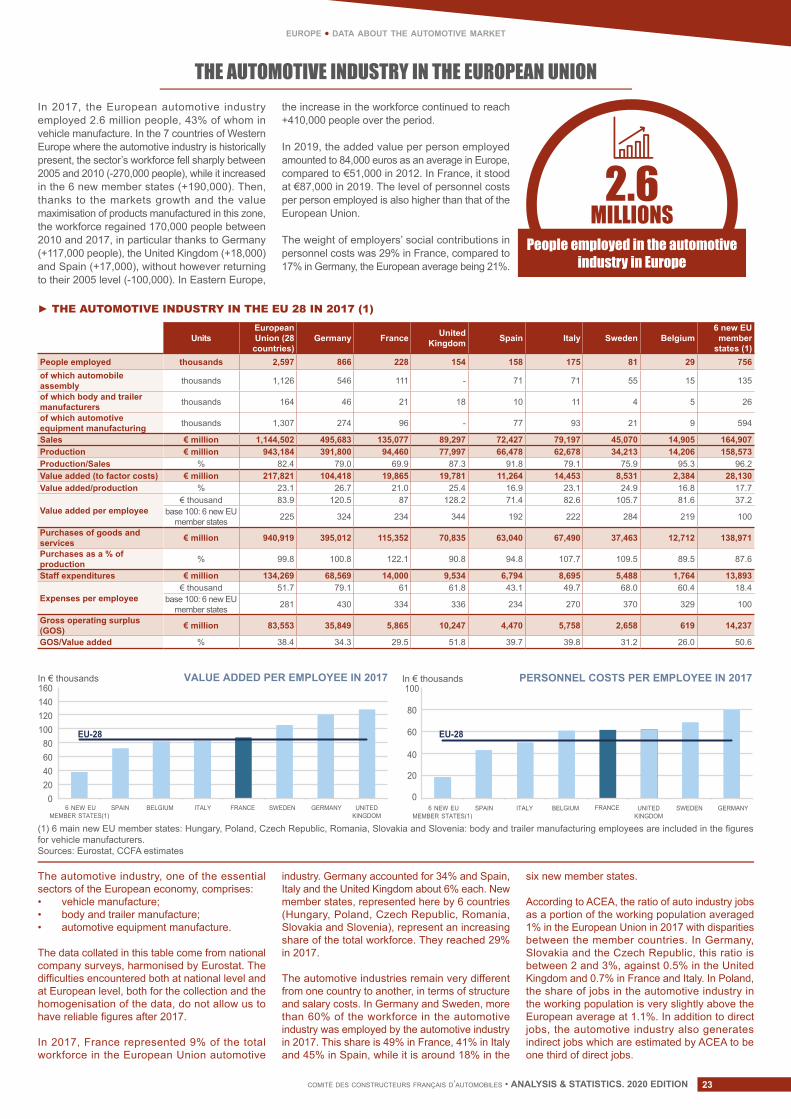
comité des constructeurs français d’automobiles • ANALYSIS & STATISTICS. 2020 EDITION 23
europe • data about the automotive market
THE AUTOMOTIVE INDUSTRY IN THE EUROPEAN UNIONIn 2017, the European automotive industry employed 2.6 million people, 43% of whom in vehicle manufacture. In the 7 countries of Western Europe where the automotive industry is historically present, the sector’s workforce fell sharply between 2005 and 2010 (-270,000 people), while it increased in the 6 new member states (+190,000). Then, thanks to the markets growth and the value maximisation of products manufactured in this zone, the workforce regained 170,000 people between 2010 and 2017, in particular thanks to Germany (+117,000 people), the United Kingdom (+18,000) and Spain (+17,000), without however returning to their 2005 level (-100,000). In Eastern Europe,
the increase in the workforce continued to reach +410,000 people over the period.
In 2019, the added value per person employed amounted to 84,000 euros as an average in Europe, compared to €51,000 in 2012. In France, it stood at €87,000 in 2019. The level of personnel costs per person employed is also higher than that of the European Union.
The weight of employers’ social contributions in personnel costs was 29% in France, compared to 17% in Germany, the European average being 21%.
2.6MILLIONS
People employed in the automotive industry in Europe
The automotive industry, one of the essential sectors of the European economy, comprises:• vehicle manufacture;• body and trailer manufacture;• automotive equipment manufacture.
The data collated in this table come from national company surveys, harmonised by Eurostat. The difficulties encountered both at national level and at European level, both for the collection and the homogenisation of the data, do not allow us to have reliable figures after 2017.
In 2017, France represented 9% of the total workforce in the European Union automotive
industry. Germany accounted for 34% and Spain, Italy and the United Kingdom about 6% each. New member states, represented here by 6 countries (Hungary, Poland, Czech Republic, Romania, Slovakia and Slovenia), represent an increasing share of the total workforce. They reached 29% in 2017.
The automotive industries remain very different from one country to another, in terms of structure and salary costs. In Germany and Sweden, more than 60% of the workforce in the automotive industry was employed by the automotive industry in 2017. This share is 49% in France, 41% in Italy and 45% in Spain, while it is around 18% in the
six new member states.
According to ACEA, the ratio of auto industry jobs as a portion of the working population averaged 1% in the European Union in 2017 with disparities between the member countries. In Germany, Slovakia and the Czech Republic, this ratio is between 2 and 3%, against 0.5% in the United Kingdom and 0.7% in France and Italy. In Poland, the share of jobs in the automotive industry in the working population is very slightly above the European average at 1.1%. In addition to direct jobs, the automotive industry also generates indirect jobs which are estimated by ACEA to be one third of direct jobs.
UnitsEuropean Union (28
countries)Germany France United
Kingdom Spain Italy Sweden Belgium6 new EU member
states (1)People employed thousands 2,597 866 228 154 158 175 81 29 756of which automobile assembly thousands 1,126 546 111 - 71 71 55 15 135
of which body and trailer manufacturers thousands 164 46 21 18 10 11 4 5 26
of which automotive equipment manufacturing thousands 1,307 274 96 - 77 93 21 9 594
Sales € million 1,144,502 495,683 135,077 89,297 72,427 79,197 45,070 14,905 164,907Production € million 943,184 391,800 94,460 77,997 66,478 62,678 34,213 14,206 158,573Production/Sales % 82.4 79.0 69.9 87.3 91.8 79.1 75.9 95.3 96.2Value added (to factor costs) € million 217,821 104,418 19,865 19,781 11,264 14,453 8,531 2,384 28,130Value added/production % 23.1 26.7 21.0 25.4 16.9 23.1 24.9 16.8 17.7
Value added per employee€ thousand 83.9 120.5 87 128.2 71.4 82.6 105.7 81.6 37.2
base 100: 6 new EU member states 225 324 234 344 192 222 284 219 100
Purchases of goods and services € million 940,919 395,012 115,352 70,835 63,040 67,490 37,463 12,712 138,971
Purchases as a % ofproduction % 99.8 100.8 122.1 90.8 94.8 107.7 109.5 89.5 87.6
Staff expenditures € million 134,269 68,569 14,000 9,534 6,794 8,695 5,488 1,764 13,893
Expenses per employee€ thousand 51.7 79.1 61 61.8 43.1 49.7 68.0 60.4 18.4
base 100: 6 new EU member states 281 430 334 336 234 270 370 329 100
Gross operating surplus (GOS) € million 83,553 35,849 5,865 10,247 4,470 5,758 2,658 619 14,237
GOS/Value added % 38.4 34.3 29.5 51.8 39.7 39.8 31.2 26.0 50.6
► THE AUTOMOTIVE INDUSTRY IN THE EU 28 IN 2017 (1)
(1) 6 main new EU member states: Hungary, Poland, Czech Republic, Romania, Slovakia and Slovenia: body and trailer manufacturing employees are included in the figures for vehicle manufacturers. Sources: Eurostat, CCFA estimates
In € thousands VALUE ADDED PER EMPLOYEE IN 2017
0 20 40 60 80
100 120 140 160
6 NEW EUMEMBER STATES(1)
ITALY FRANCE SPAIN SWEDEN BELGIUM GERMANY UNITEDKINGDOM
In € thousands PERSONNEL COSTS PER EMPLOYEE IN 2017
0
20
40
60
80
100
6 NEW EUMEMBER STATES(1)
FRANCESPAIN ITALY SWEDENBELGIUM GERMANYUNITEDKINGDOM
EU-28 EU-28
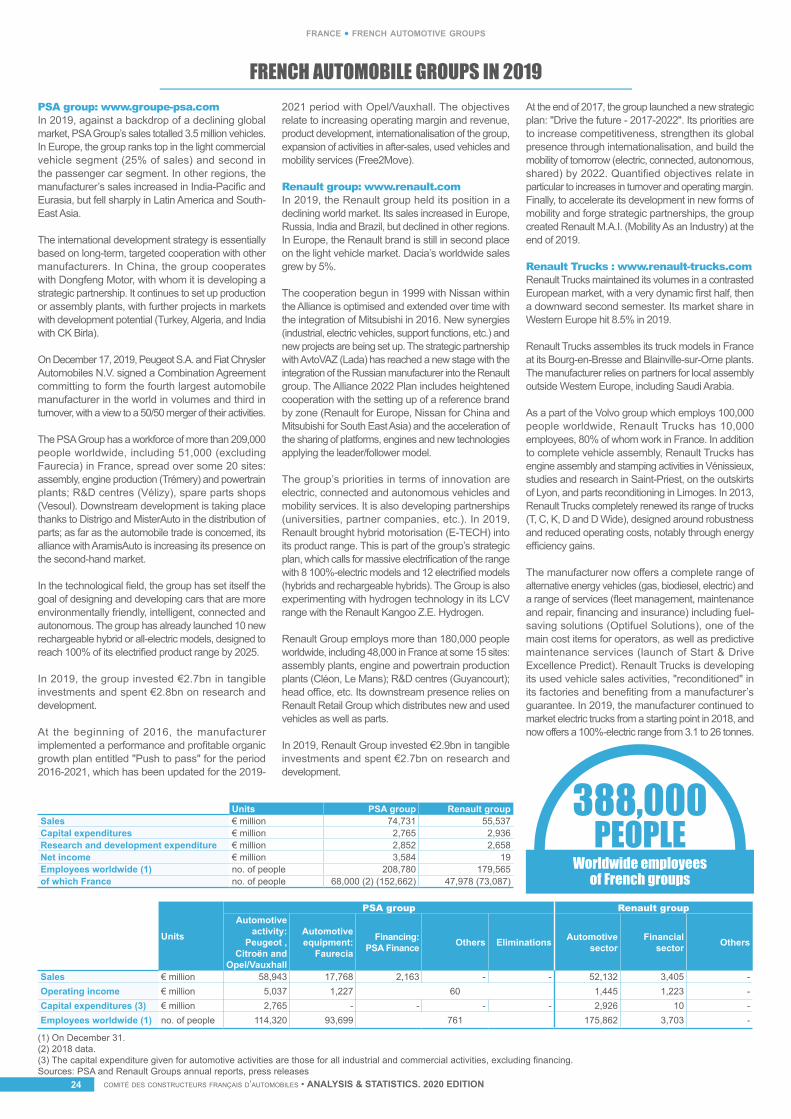
comité des constructeurs français d’automobiles • ANALYSIS & STATISTICS. 2020 EDITIONcomité des constructeurs français d’automobiles • ANALYSIS & STATISTICS. 2020 EDITION24
france • french automotive groups
FRENCH AUTOMOBILE GROUPS IN 2019
Groupe Units PSA group Renault groupSales € million 74,731 55,537Capital expenditures € million 2,765 2,936Research and development expenditure € million 2,852 2,658Net income € million 3,584 19Employees worldwide (1) no. of people 208,780 179,565of which France no. of people 68,000 (2) (152,662) 47,978 (73,087)
GroupeGroupe Units
PSA group Renault groupAutomotive
activity: Peugeot ,
Citroën and Opel/Vauxhall
Automotive equipment:
Faurecia
Financing: PSA Finance Others Eliminations Automotive
sectorFinancial
sector Others
Sales € million 58,943 17,768 2,163 - - 52,132 3,405 -Operating income € million 5,037 1,227 60 1,445 1,223 -Capital expenditures (3) € million 2,765 - - - - 2,926 10 -Employees worldwide (1) no. of people 114,320 93,699 761 175,862 3,703 -
(1) On December 31. (2) 2018 data. (3) The capital expenditure given for automotive activities are those for all industrial and commercial activities, excluding financing.Sources: PSA and Renault Groups annual reports, press releases
Worldwide employeesof French groups
388,000
PSA group: www.groupe-psa.comIn 2019, against a backdrop of a declining global market, PSA Group’s sales totalled 3.5 million vehicles. In Europe, the group ranks top in the light commercial vehicle segment (25% of sales) and second in the passenger car segment. In other regions, the manufacturer’s sales increased in India-Pacific and Eurasia, but fell sharply in Latin America and South-East Asia.
The international development strategy is essentially based on long-term, targeted cooperation with other manufacturers. In China, the group cooperates with Dongfeng Motor, with whom it is developing a strategic partnership. It continues to set up production or assembly plants, with further projects in markets with development potential (Turkey, Algeria, and India with CK Birla).
On December 17, 2019, Peugeot S.A. and Fiat Chrysler Automobiles N.V. signed a Combination Agreement committing to form the fourth largest automobile manufacturer in the world in volumes and third in turnover, with a view to a 50/50 merger of their activities.
The PSA Group has a workforce of more than 209,000 people worldwide, including 51,000 (excluding Faurecia) in France, spread over some 20 sites: assembly, engine production (Trémery) and powertrain plants; R&D centres (Vélizy), spare parts shops (Vesoul). Downstream development is taking place thanks to Distrigo and MisterAuto in the distribution of parts; as far as the automobile trade is concerned, its alliance with AramisAuto is increasing its presence on the second-hand market.
In the technological field, the group has set itself the goal of designing and developing cars that are more environmentally friendly, intelligent, connected and autonomous. The group has already launched 10 new rechargeable hybrid or all-electric models, designed to reach 100% of its electrified product range by 2025.
In 2019, the group invested €2.7bn in tangible investments and spent €2.8bn on research and development.
At the beginning of 2016, the manufacturer implemented a performance and profitable organic growth plan entitled "Push to pass" for the period 2016-2021, which has been updated for the 2019-
2021 period with Opel/Vauxhall. The objectives relate to increasing operating margin and revenue, product development, internationalisation of the group, expansion of activities in after-sales, used vehicles and mobility services (Free2Move).
Renault group: www.renault.comIn 2019, the Renault group held its position in a declining world market. Its sales increased in Europe, Russia, India and Brazil, but declined in other regions. In Europe, the Renault brand is still in second place on the light vehicle market. Dacia’s worldwide sales grew by 5%.
The cooperation begun in 1999 with Nissan within the Alliance is optimised and extended over time with the integration of Mitsubishi in 2016. New synergies (industrial, electric vehicles, support functions, etc.) and new projects are being set up. The strategic partnership with AvtoVAZ (Lada) has reached a new stage with the integration of the Russian manufacturer into the Renault group. The Alliance 2022 Plan includes heightened cooperation with the setting up of a reference brand by zone (Renault for Europe, Nissan for China and Mitsubishi for South East Asia) and the acceleration of the sharing of platforms, engines and new technologies applying the leader/follower model.
The group’s priorities in terms of innovation are electric, connected and autonomous vehicles and mobility services. It is also developing partnerships (universities, partner companies, etc.). In 2019, Renault brought hybrid motorisation (E-TECH) into its product range. This is part of the group’s strategic plan, which calls for massive electrification of the range with 8 100%-electric models and 12 electrified models (hybrids and rechargeable hybrids). The Group is also experimenting with hydrogen technology in its LCV range with the Renault Kangoo Z.E. Hydrogen.
Renault Group employs more than 180,000 people worldwide, including 48,000 in France at some 15 sites: assembly plants, engine and powertrain production plants (Cléon, Le Mans); R&D centres (Guyancourt); head office, etc. Its downstream presence relies on Renault Retail Group which distributes new and used vehicles as well as parts.
In 2019, Renault Group invested €2.9bn in tangible investments and spent €2.7bn on research and development.
At the end of 2017, the group launched a new strategic plan: "Drive the future - 2017-2022". Its priorities are to increase competitiveness, strengthen its global presence through internationalisation, and build the mobility of tomorrow (electric, connected, autonomous, shared) by 2022. Quantified objectives relate in particular to increases in turnover and operating margin. Finally, to accelerate its development in new forms of mobility and forge strategic partnerships, the group created Renault M.A.I. (Mobility As an Industry) at the end of 2019. Renault Trucks : www.renault-trucks.comRenault Trucks maintained its volumes in a contrasted European market, with a very dynamic first half, then a downward second semester. Its market share in Western Europe hit 8.5% in 2019.
Renault Trucks assembles its truck models in France at its Bourg-en-Bresse and Blainville-sur-Orne plants. The manufacturer relies on partners for local assembly outside Western Europe, including Saudi Arabia.
As a part of the Volvo group which employs 100,000 people worldwide, Renault Trucks has 10,000 employees, 80% of whom work in France. In addition to complete vehicle assembly, Renault Trucks has engine assembly and stamping activities in Vénissieux, studies and research in Saint-Priest, on the outskirts of Lyon, and parts reconditioning in Limoges. In 2013, Renault Trucks completely renewed its range of trucks (T, C, K, D and D Wide), designed around robustness and reduced operating costs, notably through energy efficiency gains. The manufacturer now offers a complete range of alternative energy vehicles (gas, biodiesel, electric) and a range of services (fleet management, maintenance and repair, financing and insurance) including fuel-saving solutions (Optifuel Solutions), one of the main cost items for operators, as well as predictive maintenance services (launch of Start & Drive Excellence Predict). Renault Trucks is developing its used vehicle sales activities, "reconditioned" in its factories and benefiting from a manufacturer’s guarantee. In 2019, the manufacturer continued to market electric trucks from a starting point in 2018, and now offers a 100%-electric range from 3.1 to 26 tonnes.
PEOPLE
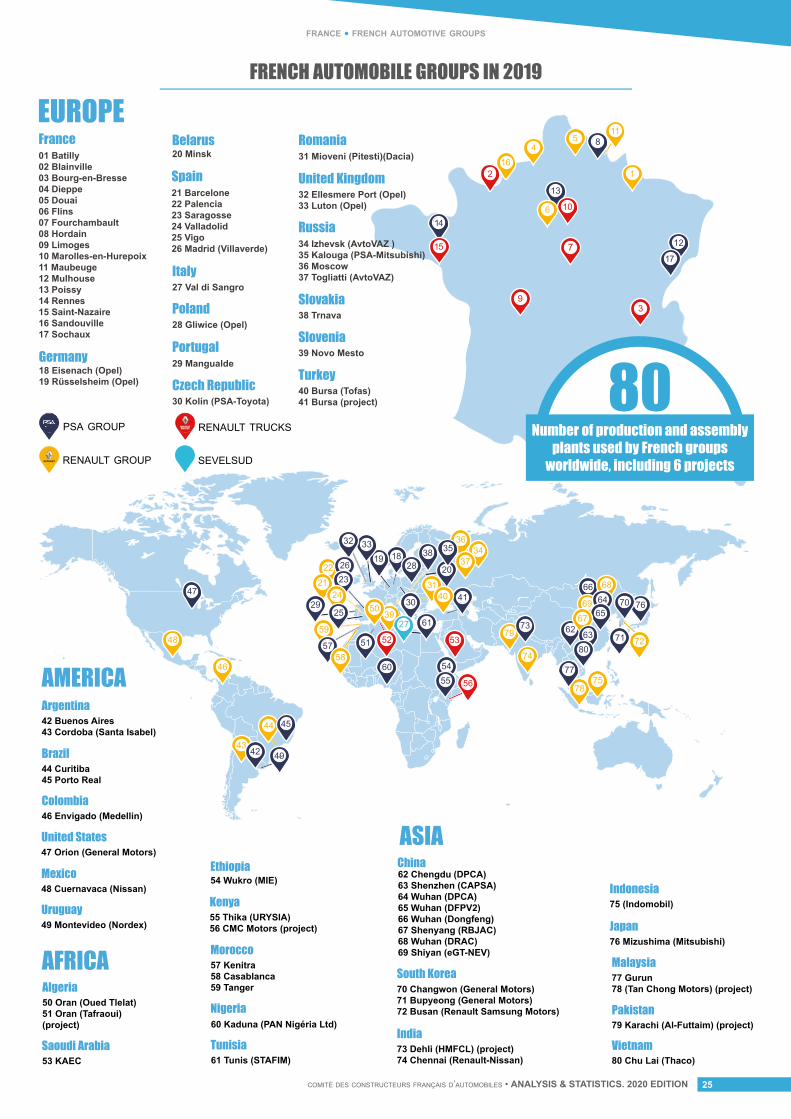
comité des constructeurs français d’automobiles • ANALYSIS & STATISTICS. 2020 EDITION 25
france • french automotive groups
FRENCH AUTOMOBILE GROUPS IN 2019
AMERICA42 Buenos Aires43 Cordoba (Santa Isabel)
Argentina
44 Curitiba45 Porto Real
Brazil
46 Envigado (Medellin)Colombia
47 Orion (General Motors)United States
48 Cuernavaca (Nissan)Mexico
49 Montevideo (Nordex)Uruguay
54 Wukro (MIE)Ethiopia
55 Thika (URYSIA) 56 CMC Motors (project)
Kenya
60 Kaduna (PAN Nigéria Ltd)Nigeria
61 Tunis (STAFIM)Tunisia
53 KAEC Saoudi Arabia
57 Kenitra58 Casablanca59 Tanger
MoroccoAFRICA50 Oran (Oued Tlelat)51 Oran (Tafraoui) (project)
Algeria77 Gurun78 (Tan Chong Motors) (project)
Malaysia
80 Chu Lai (Thaco) Vietnam79 Karachi (Al-Futtaim) (project) Pakistan
ASIA62 Chengdu (DPCA)63 Shenzhen (CAPSA)64 Wuhan (DPCA)65 Wuhan (DFPV2)66 Wuhan (Dongfeng)67 Shenyang (RBJAC)68 Wuhan (DRAC)69 Shiyan (eGT-NEV)
China
70 Changwon (General Motors)71 Bupyeong (General Motors)72 Busan (Renault Samsung Motors)
South Korea
76 Mizushima (Mitsubishi)Japan
73 Dehli (HMFCL) (project)74 Chennai (Renault-Nissan)
India
75 (Indomobil)Indonesia
PSA GROUP
RENAULT GROUP
RENAULT TRUCKS
SEVELSUD
EUROPE01 Batilly02 Blainville03 Bourg-en-Bresse04 Dieppe05 Douai06 Flins07 Fourchambault08 Hordain09 Limoges10 Marolles-en-Hurepoix11 Maubeuge12 Mulhouse13 Poissy14 Rennes15 Saint-Nazaire16 Sandouville17 Sochaux
France
21 Barcelone22 Palencia23 Saragosse24 Valladolid25 Vigo26 Madrid (Villaverde)
Spain
27 Val di SangroItaly
28 Gliwice (Opel)Poland
29 MangualdePortugal
30 Kolín (PSA-Toyota)Czech Republic
31 Mioveni (Pitesti)(Dacia)Romania
20 MinskBelarus
18 Eisenach (Opel)19 Rüsselsheim (Opel)
Germany
38 TrnavaSlovakia
39 Novo MestoSlovenia
40 Bursa (Tofas)41 Bursa (project)
Turkey
32 Ellesmere Port (Opel)33 Luton (Opel)
United Kingdom
34 Izhevsk (AvtoVAZ )35 Kalouga (PSA-Mitsubishi)36 Moscow37 Togliatti (AvtoVAZ)
Russia
52
80Number of production and assembly
plants used by French groups worldwide, including 6 projects
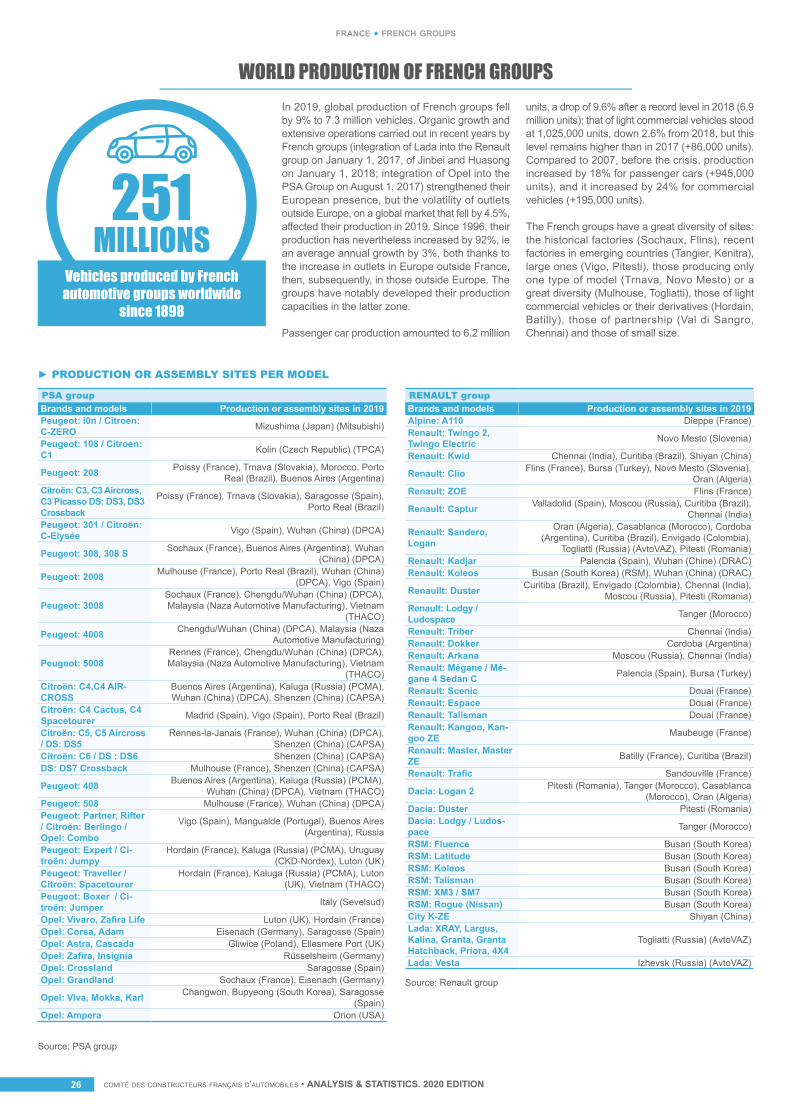
comité des constructeurs français d’automobiles • ANALYSIS & STATISTICS. 2020 EDITIONcomité des constructeurs français d’automobiles • ANALYSIS & STATISTICS. 2020 EDITION26
france • french groups
WORLD PRODUCTION OF FRENCH GROUPSIn 2019, global production of French groups fell by 9% to 7.3 million vehicles. Organic growth and extensive operations carried out in recent years by French groups (integration of Lada into the Renault group on January 1, 2017, of Jinbei and Huasong on January 1, 2018; integration of Opel into the PSA Group on August 1, 2017) strengthened their European presence, but the volatility of outlets outside Europe, on a global market that fell by 4.5%, affected their production in 2019. Since 1996, their production has nevertheless increased by 92%, ie an average annual growth by 3%, both thanks to the increase in outlets in Europe outside France, then, subsequently, in those outside Europe. The groups have notably developed their production capacities in the latter zone.
Passenger car production amounted to 6.2 million
units, a drop of 9.6% after a record level in 2018 (6.9 million units); that of light commercial vehicles stood at 1,025,000 units, down 2.6% from 2018, but this level remains higher than in 2017 (+86,000 units). Compared to 2007, before the crisis, production increased by 18% for passenger cars (+945,000 units), and it increased by 24% for commercial vehicles (+195,000 units).
The French groups have a great diversity of sites: the historical factories (Sochaux, Flins), recent factories in emerging countries (Tangier, Kenitra), large ones (Vigo, Pitesti), those producing only one type of model (Trnava, Novo Mesto) or a great diversity (Mulhouse, Togliatti), those of light commercial vehicles or their derivatives (Hordain, Batilly), those of partnership (Val di Sangro, Chennai) and those of small size.
Vehicles produced by French automotive groups worldwide
since 1898
PSA group Brands and models Production or assembly sites in 2019Peugeot: i0n / Citroen: C-ZERO Mizushima (Japan) (Mitsubishi)
Peugeot: 108 / Citroen: C1 Kolin (Czech Republic) (TPCA)
Peugeot: 208 Poissy (France), Trnava (Slovakia), Morocco, Porto Real (Brazil), Buenos Aires (Argentina)
Citroën: C3, C3 Aircross, C3 Picasso DS: DS3, DS3 Crossback
Poissy (France), Trnava (Slovakia), Saragosse (Spain), Porto Real (Brazil)
Peugeot: 301 / Citroën: C-Elysée Vigo (Spain), Wuhan (China) (DPCA)
Peugeot: 308, 308 S Sochaux (France), Buenos Aires (Argentina), Wuhan (China) (DPCA)
Peugeot: 2008 Mulhouse (France), Porto Real (Brazil), Wuhan (China) (DPCA), Vigo (Spain)
Peugeot: 3008 Sochaux (France), Chengdu/Wuhan (China) (DPCA), Malaysia (Naza Automotive Manufacturing), Vietnam
(THACO)
Peugeot: 4008 Chengdu/Wuhan (China) (DPCA), Malaysia (Naza Automotive Manufacturing)
Peugeot: 5008Rennes (France), Chengdu/Wuhan (China) (DPCA), Malaysia (Naza Automotive Manufacturing), Vietnam
(THACO)Citroën: C4,C4 AIR-CROSS
Buenos Aires (Argentina), Kaluga (Russia) (PCMA), Wuhan (China) (DPCA), Shenzen (China) (CAPSA)
Citroën: C4 Cactus, C4 Spacetourer Madrid (Spain), Vigo (Spain), Porto Real (Brazil)
Citroën: C5, C5 Aircross / DS: DS5
Rennes-la-Janais (France), Wuhan (China) (DPCA), Shenzen (China) (CAPSA)
Citroën: C6 / DS : DS6 Shenzen (China) (CAPSA)DS: DS7 Crossback Mulhouse (France), Shenzen (China) (CAPSA)
Peugeot: 408 Buenos Aires (Argentina), Kaluga (Russia) (PCMA), Wuhan (China) (DPCA), Vietnam (THACO)
Peugeot: 508 Mulhouse (France), Wuhan (China) (DPCA)Peugeot: Partner, Rifter / Citroën: Berlingo / Opel: Combo
Vigo (Spain), Mangualde (Portugal), Buenos Aires (Argentina), Russia
Peugeot: Expert / Ci-troën: Jumpy
Hordain (France), Kaluga (Russia) (PCMA), Uruguay (CKD-Nordex), Luton (UK)
Peugeot: Traveller / Citroën: Spacetourer
Hordain (France), Kaluga (Russia) (PCMA), Luton (UK), Vietnam (THACO)
Peugeot: Boxer / Ci-troën: Jumper Italy (Sevelsud)
Opel: Vivaro, Zafira Life Luton (UK), Hordain (France)Opel: Corsa, Adam Eisenach (Germany), Saragosse (Spain)Opel: Astra, Cascada Gliwice (Poland), Ellesmere Port (UK)Opel: Zafira, Insignia Rüsselsheim (Germany)Opel: Crossland Saragosse (Spain)Opel: Grandland Sochaux (France), Eisenach (Germany)
Opel: Viva, Mokka, Karl Changwon, Bupyeong (South Korea), Saragosse (Spain)
Opel: Ampera Orion (USA)
RENAULT group Brands and models Production or assembly sites in 2019Alpine: A110 Dieppe (France)Renault: Twingo 2, Twingo Electric Novo Mesto (Slovenia)
Renault: Kwid Chennai (India), Curitiba (Brazil), Shiyan (China)
Renault: Clio Flins (France), Bursa (Turkey), Novo Mesto (Slovenia), Oran (Algeria)
Renault: ZOE Flins (France)
Renault: Captur Valladolid (Spain), Moscou (Russia), Curitiba (Brazil), Chennai (India)
Renault: Sandero, Logan
Oran (Algeria), Casablanca (Morocco), Cordoba (Argentina), Curitiba (Brazil), Envigado (Colombia),
Togliatti (Russia) (AvtoVAZ), Pitesti (Romania)Renault: Kadjar Palencia (Spain), Wuhan (Chine) (DRAC)Renault: Koleos Busan (South Korea) (RSM), Wuhan (China) (DRAC)
Renaullt: Duster Curitiba (Brazil), Envigado (Colombia), Chennai (India), Moscou (Russia), Pitesti (Romania)
Renault: Lodgy / Ludospace Tanger (Morocco)
Renault: Triber Chennai (India)Renault: Dokker Cordoba (Argentina)Renault: Arkana Moscou (Russia), Chennai (India)Renault: Mégane / Mé-gane 4 Sedan C Palencia (Spain), Bursa (Turkey)
Renault: Scenic Douai (France)Renault: Espace Douai (France)Renault: Talisman Douai (France)Renault: Kangoo, Kan-goo ZE Maubeuge (France)
Renault: Master, Master ZE Batilly (France), Curitiba (Brazil)
Renault: Trafic Sandouville (France)
Dacia: Logan 2 Pitesti (Romania), Tanger (Morocco), Casablanca (Morocco), Oran (Algeria)
Dacia: Duster Pitesti (Romania)Dacia: Lodgy / Ludos-pace Tanger (Morocco)
RSM: Fluence Busan (South Korea)RSM: Latitude Busan (South Korea)RSM: Koleos Busan (South Korea)RSM: Talisman Busan (South Korea)RSM: XM3 / SM7 Busan (South Korea)RSM: Rogue (Nissan) Busan (South Korea)City K-ZE Shiyan (China)Lada: XRAY, Largus, Kalina, Granta, Granta Hatchback, Priora, 4X4
Togliatti (Russia) (AvtoVAZ)
Lada: Vesta Izhevsk (Russia) (AvtoVAZ)
► PRODUCTION OR ASSEMBLY SITES PER MODEL
Source: PSA group
Source: Renault group
251
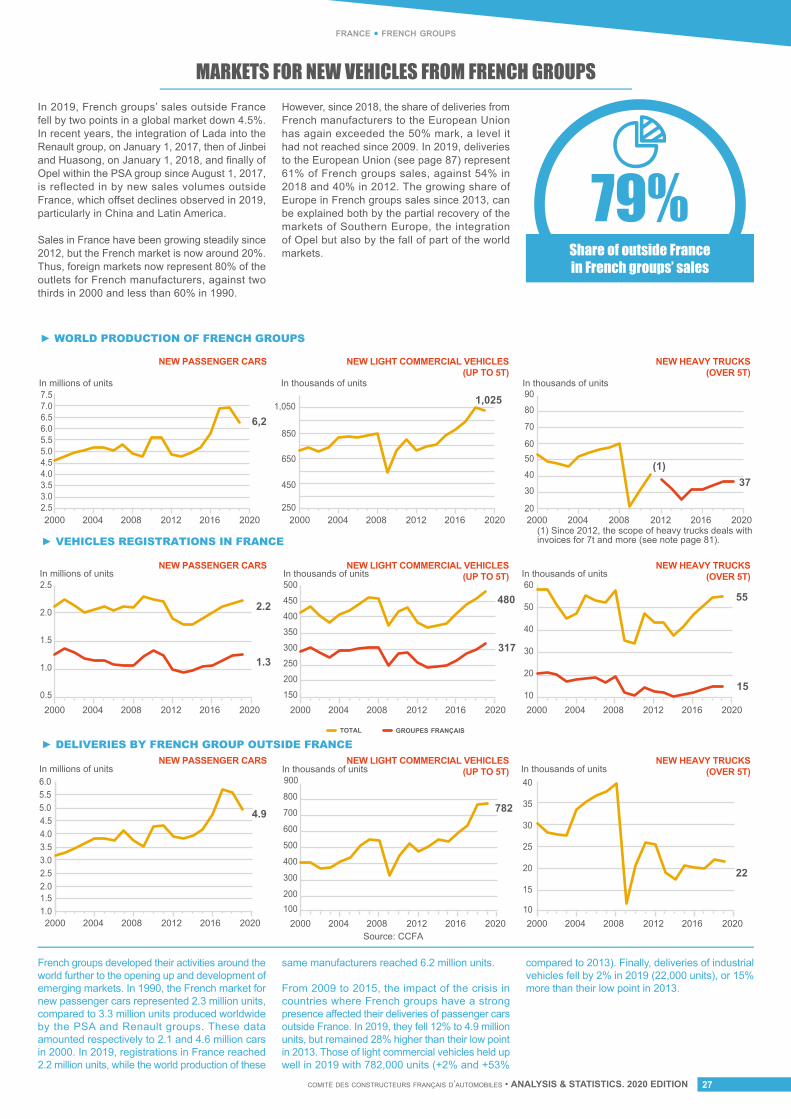
comité des constructeurs français d’automobiles • ANALYSIS & STATISTICS. 2020 EDITION 27
france • french groups
MARKETS FOR NEW VEHICLES FROM FRENCH GROUPS In 2019, French groups’ sales outside France fell by two points in a global market down 4.5%. In recent years, the integration of Lada into the Renault group, on January 1, 2017, then of Jinbei and Huasong, on January 1, 2018, and finally of Opel within the PSA group since August 1, 2017, is reflected in by new sales volumes outside France, which offset declines observed in 2019, particularly in China and Latin America.
Sales in France have been growing steadily since 2012, but the French market is now around 20%. Thus, foreign markets now represent 80% of the outlets for French manufacturers, against two thirds in 2000 and less than 60% in 1990.
However, since 2018, the share of deliveries from French manufacturers to the European Union has again exceeded the 50% mark, a level it had not reached since 2009. In 2019, deliveries to the European Union (see page 87) represent 61% of French groups sales, against 54% in 2018 and 40% in 2012. The growing share of Europe in French groups sales since 2013, can be explained both by the partial recovery of the markets of Southern Europe, the integration of Opel but also by the fall of part of the world markets.
79%Share of outside Francein French groups’ sales
French groups developed their activities around the world further to the opening up and development of emerging markets. In 1990, the French market for new passenger cars represented 2.3 million units, compared to 3.3 million units produced worldwide by the PSA and Renault groups. These data amounted respectively to 2.1 and 4.6 million cars in 2000. In 2019, registrations in France reached 2.2 million units, while the world production of these
same manufacturers reached 6.2 million units.
From 2009 to 2015, the impact of the crisis in countries where French groups have a strong presence affected their deliveries of passenger cars outside France. In 2019, they fell 12% to 4.9 million units, but remained 28% higher than their low point in 2013. Those of light commercial vehicles held up well in 2019 with 782,000 units (+2% and +53%
compared to 2013). Finally, deliveries of industrial vehicles fell by 2% in 2019 (22,000 units), or 15% more than their low point in 2013.
In millions of units
NEW PASSENGER CARS
6,2
2.5 3.0 3.5 4.0 4.5 5.0 5.5 6.0 6.5 7.0 7.5
20202016201220082000 2004 20202016201220082000 2004 20202016201220082000 2004
► WORLD PRODUCTION OF FRENCH GROUPS
► VEHICLES REGISTRATIONS IN FRANCE
► DELIVERIES BY FRENCH GROUP OUTSIDE FRANCE
In thousands of units
NEW LIGHT COMMERCIAL VEHICLES(UP TO 5T)
1,025
(1)
250
450
650
850
1,050
In thousands of units
NEW HEAVY TRUCKS(OVER 5T)
NEW PASSENGER CARS NEW LIGHT COMMERCIAL VEHICLES(UP TO 5T)
NEW HEAVY TRUCKS(OVER 5T)
NEW PASSENGER CARS NEW LIGHT COMMERCIAL VEHICLES(UP TO 5T)
NEW HEAVY TRUCKS(OVER 5T)
20
30
40
50 60
70
80
90
(1) Since 2012, the scope of heavy trucks deals withinvoices for 7t and more (see note page 81).
In millions of units
2.2
1.3
0.5
1.0
1.5
2.0
2.5 In thousands of units
480
317
150
200
250
300
350
400
450
500 In thousands of units
55
1510
20
30
40
50
60
TOTAL GROUPES FRANÇAIS
In millions of units
4.9
1.0 1.5 2.0 2.5 3.0 3.5 4.0 4.5 5.0 5.5 6.0
In thousands of units
782
100 200
300
400
500
600
700
800
900 In thousands of units
15
10
20
25
30
35
40
22
37
20202016201220082000 2004
20202016201220082000 2004
20202016201220082000 2004
20202016201220082000 2004
20202016201220082000 2004
20202016201220082000 2004Source: CCFA
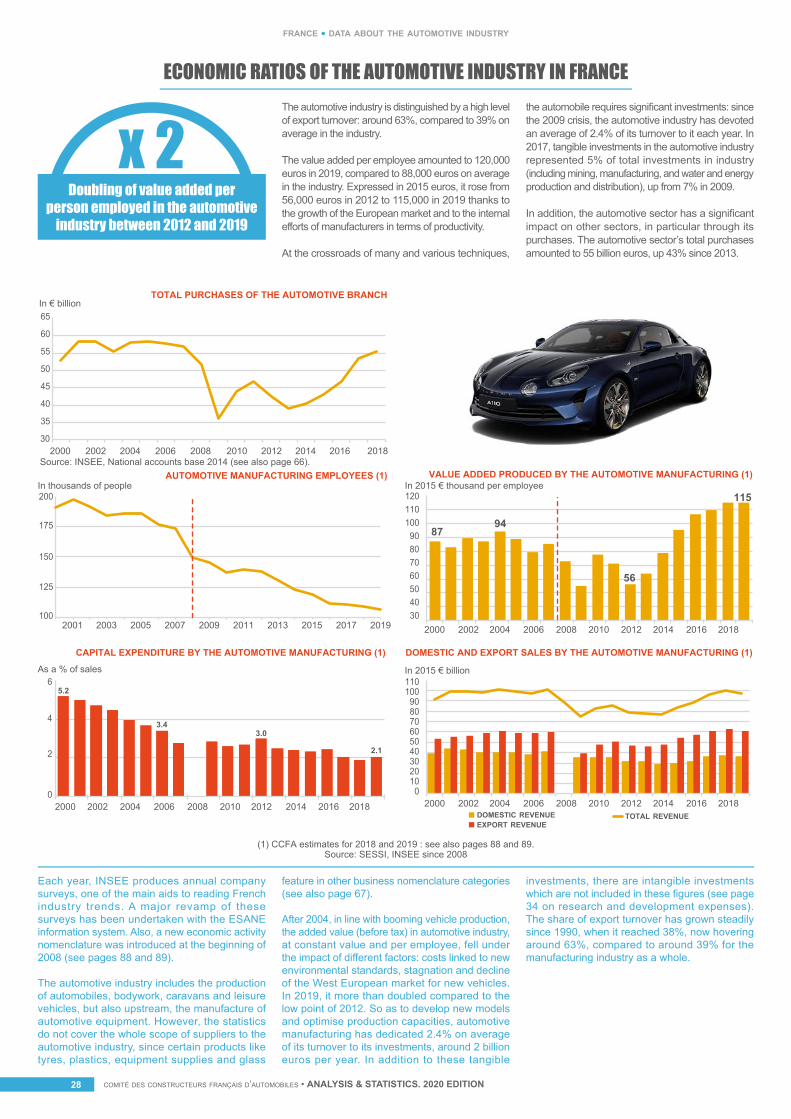
comité des constructeurs français d’automobiles • ANALYSIS & STATISTICS. 2020 EDITIONcomité des constructeurs français d’automobiles • ANALYSIS & STATISTICS. 2020 EDITION28
france • data about the automotive industry
ECONOMIC RATIOS OF THE AUTOMOTIVE INDUSTRY IN FRANCE
Each year, INSEE produces annual company surveys, one of the main aids to reading French industry trends. A major revamp of these surveys has been undertaken with the ESANE information system. Also, a new economic activity nomenclature was introduced at the beginning of 2008 (see pages 88 and 89).
The automotive industry includes the production of automobiles, bodywork, caravans and leisure vehicles, but also upstream, the manufacture of automotive equipment. However, the statistics do not cover the whole scope of suppliers to the automotive industry, since certain products like tyres, plastics, equipment supplies and glass
feature in other business nomenclature categories (see also page 67).
After 2004, in line with booming vehicle production, the added value (before tax) in automotive industry, at constant value and per employee, fell under the impact of different factors: costs linked to new environmental standards, stagnation and decline of the West European market for new vehicles. In 2019, it more than doubled compared to the low point of 2012. So as to develop new models and optimise production capacities, automotive manufacturing has dedicated 2.4% on average of its turnover to its investments, around 2 billion euros per year. In addition to these tangible
investments, there are intangible investments which are not included in these figures (see page 34 on research and development expenses). The share of export turnover has grown steadily since 1990, when it reached 38%, now hovering around 63%, compared to around 39% for the manufacturing industry as a whole.
The automotive industry is distinguished by a high level of export turnover: around 63%, compared to 39% on average in the industry.
The value added per employee amounted to 120,000 euros in 2019, compared to 88,000 euros on average in the industry. Expressed in 2015 euros, it rose from 56,000 euros in 2012 to 115,000 in 2019 thanks to the growth of the European market and to the internal efforts of manufacturers in terms of productivity.
At the crossroads of many and various techniques,
the automobile requires significant investments: since the 2009 crisis, the automotive industry has devoted an average of 2.4% of its turnover to it each year. In 2017, tangible investments in the automotive industry represented 5% of total investments in industry (including mining, manufacturing, and water and energy production and distribution), up from 7% in 2009.
In addition, the automotive sector has a significant impact on other sectors, in particular through its purchases. The automotive sector’s total purchases amounted to 55 billion euros, up 43% since 2013.
x 2Doubling of value added per
person employed in the automotive industry between 2012 and 2019
In € billion
2016 201820142012201020082006200420022000
2016 201820142012201020082006200420022000
2016 201820142012201020082006200420022000
2017 201920152013201120092007200520032001
2014 2016 20182012201020082006200420022000
35
40
45
50
55
60
65
30
TOTAL PURCHASES OF THE AUTOMOTIVE BRANCH
AUTOMOTIVE MANUFACTURING EMPLOYEES (1)
(1) CCFA estimates for 2018 and 2019 : see also pages 88 and 89.Source: SESSI, INSEE since 2008
Source: INSEE, National accounts base 2014 (see also page 66).
100
125
150
200
175
110120
10090807060504030
In thousands of peopleVALUE ADDED PRODUCED BY THE AUTOMOTIVE MANUFACTURING (1)
In 2015 € thousand per employee
6
4
2
0
CAPITAL EXPENDITURE BY THE AUTOMOTIVE MANUFACTURING (1)
As a % of sales
5.2
3.43.0
2.1
110100
908070605040302010
0
DOMESTIC AND EXPORT SALES BY THE AUTOMOTIVE MANUFACTURING (1)
In 2015 € billion
TOTAL REVENUEDOMESTIC REVENUEEXPORT REVENUE
8794
56
115
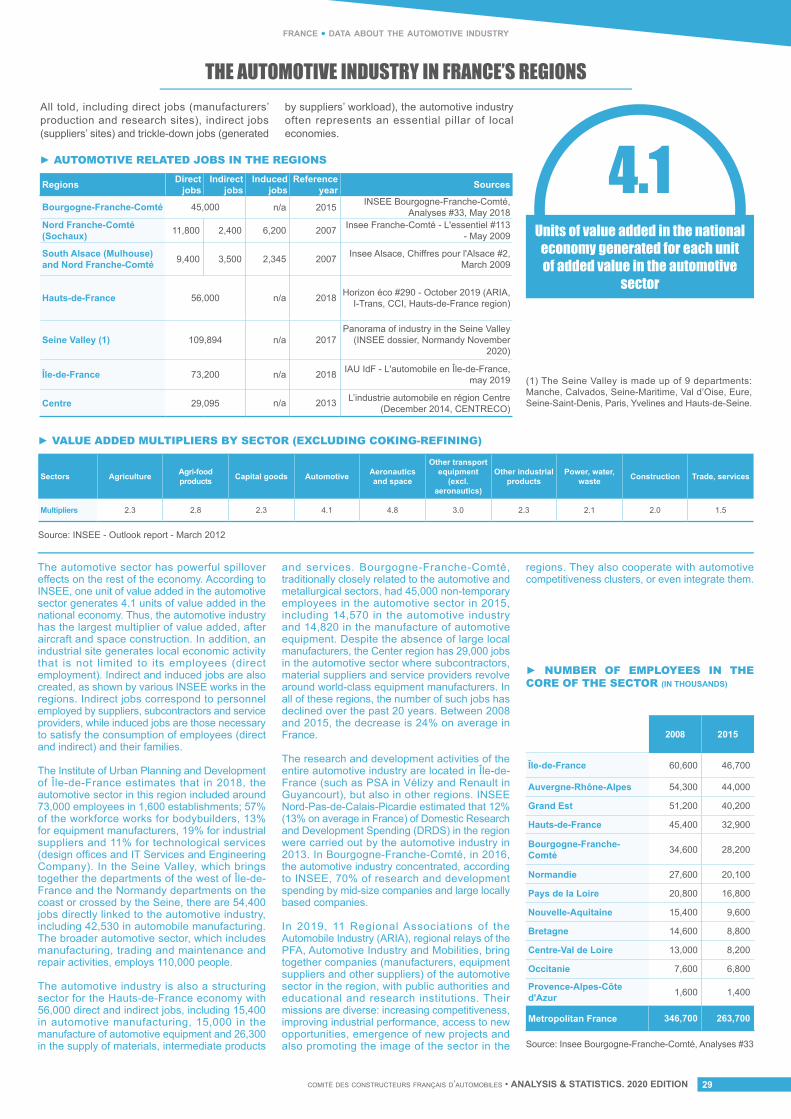
comité des constructeurs français d’automobiles • ANALYSIS & STATISTICS. 2020 EDITION 29
france • data about the automotive industry
THE AUTOMOTIVE INDUSTRY IN FRANCE’S REGIONS
4.1Units of value added in the national
economy generated for each unit of added value in the automotive
sector
The automotive sector has powerful spillover effects on the rest of the economy. According to INSEE, one unit of value added in the automotive sector generates 4.1 units of value added in the national economy. Thus, the automotive industry has the largest multiplier of value added, after aircraft and space construction. In addition, an industrial site generates local economic activity that is not limited to its employees (direct employment). Indirect and induced jobs are also created, as shown by various INSEE works in the regions. Indirect jobs correspond to personnel employed by suppliers, subcontractors and service providers, while induced jobs are those necessary to satisfy the consumption of employees (direct and indirect) and their families.
The Institute of Urban Planning and Development of Île-de-France estimates that in 2018, the automotive sector in this region included around 73,000 employees in 1,600 establishments; 57% of the workforce works for bodybuilders, 13% for equipment manufacturers, 19% for industrial suppliers and 11% for technological services (design offices and IT Services and Engineering Company). In the Seine Valley, which brings together the departments of the west of Île-de-France and the Normandy departments on the coast or crossed by the Seine, there are 54,400 jobs directly linked to the automotive industry, including 42,530 in automobile manufacturing. The broader automotive sector, which includes manufacturing, trading and maintenance and repair activities, employs 110,000 people.
The automotive industry is also a structuring sector for the Hauts-de-France economy with 56,000 direct and indirect jobs, including 15,400 in automotive manufacturing, 15,000 in the manufacture of automotive equipment and 26,300 in the supply of materials, intermediate products
and services. Bourgogne-Franche-Comté, traditionally closely related to the automotive and metallurgical sectors, had 45,000 non-temporary employees in the automotive sector in 2015, including 14,570 in the automotive industry and 14,820 in the manufacture of automotive equipment. Despite the absence of large local manufacturers, the Center region has 29,000 jobs in the automotive sector where subcontractors, material suppliers and service providers revolve around world-class equipment manufacturers. In all of these regions, the number of such jobs has declined over the past 20 years. Between 2008 and 2015, the decrease is 24% on average in France.
The research and development activities of the entire automotive industry are located in Île-de-France (such as PSA in Vélizy and Renault in Guyancourt), but also in other regions. INSEE Nord-Pas-de-Calais-Picardie estimated that 12% (13% on average in France) of Domestic Research and Development Spending (DRDS) in the region were carried out by the automotive industry in 2013. In Bourgogne-Franche-Comté, in 2016, the automotive industry concentrated, according to INSEE, 70% of research and development spending by mid-size companies and large locally based companies.
In 2019, 11 Regional Associations of the Automobile Industry (ARIA), regional relays of the PFA, Automotive Industry and Mobilities, bring together companies (manufacturers, equipment suppliers and other suppliers) of the automotive sector in the region, with public authorities and educational and research institutions. Their missions are diverse: increasing competitiveness, improving industrial performance, access to new opportunities, emergence of new projects and also promoting the image of the sector in the
regions. They also cooperate with automotive competitiveness clusters, or even integrate them.
► AUTOMOTIVE RELATED JOBS IN THE REGIONS
► VALUE ADDED MULTIPLIERS BY SECTOR (EXCLUDING COKING-REFINING)
► NUMBER OF EMPLOYEES IN THE CORE OF THE SECTOR (IN THOUSANDS)
Regions Direct jobs
Indirect jobs
Induced jobs
Reference year Sources
Bourgogne-Franche-Comté 45,000 n/a 2015 INSEE Bourgogne-Franche-Comté, Analyses #33, May 2018
Nord Franche-Comté (Sochaux) 11,800 2,400 6,200 2007 Insee Franche-Comté - L'essentiel #113
- May 2009
South Alsace (Mulhouse) and Nord Franche-Comté 9,400 3,500 2,345 2007 Insee Alsace, Chiffres pour l'Alsace #2,
March 2009
Hauts-de-France 56,000 n/a 2018 Horizon éco #290 - October 2019 (ARIA, I-Trans, CCI, Hauts-de-France region)
Seine Valley (1) 109,894 n/a 2017Panorama of industry in the Seine Valley
(INSEE dossier, Normandy November 2020)
Île-de-France 73,200 n/a 2018 IAU IdF - L'automobile en Île-de-France, may 2019
Centre 29,095 n/a 2013 L’industrie automobile en région Centre (December 2014, CENTRECO)
Sectors Agriculture Agri-food products Capital goods Automotive Aeronautics
and space
Other transport equipment
(excl. aeronautics)
Other industrial products
Power, water, waste Construction Trade, services
Multipliers 2.3 2.8 2.3 4.1 4.8 3.0 2.3 2.1 2.0 1.5
2008 2015
Île-de-France 60,600 46,700
Auvergne-Rhône-Alpes 54,300 44,000
Grand Est 51,200 40,200
Hauts-de-France 45,400 32,900
Bourgogne-Franche-Comté 34,600 28,200
Normandie 27,600 20,100
Pays de la Loire 20,800 16,800
Nouvelle-Aquitaine 15,400 9,600
Bretagne 14,600 8,800
Centre-Val de Loire 13,000 8,200
Occitanie 7,600 6,800
Provence-Alpes-Côte d'Azur 1,600 1,400
Metropolitan France 346,700 263,700
Source: Insee Bourgogne-Franche-Comté, Analyses #33
Source: INSEE - Outlook report - March 2012
(1) The Seine Valley is made up of 9 departments: Manche, Calvados, Seine-Maritime, Val d’Oise, Eure, Seine-Saint-Denis, Paris, Yvelines and Hauts-de-Seine.
All told, including direct jobs (manufacturers’ production and research sites), indirect jobs (suppliers’ sites) and trickle-down jobs (generated
by suppliers’ workload), the automotive industry often represents an essential pillar of local economies.
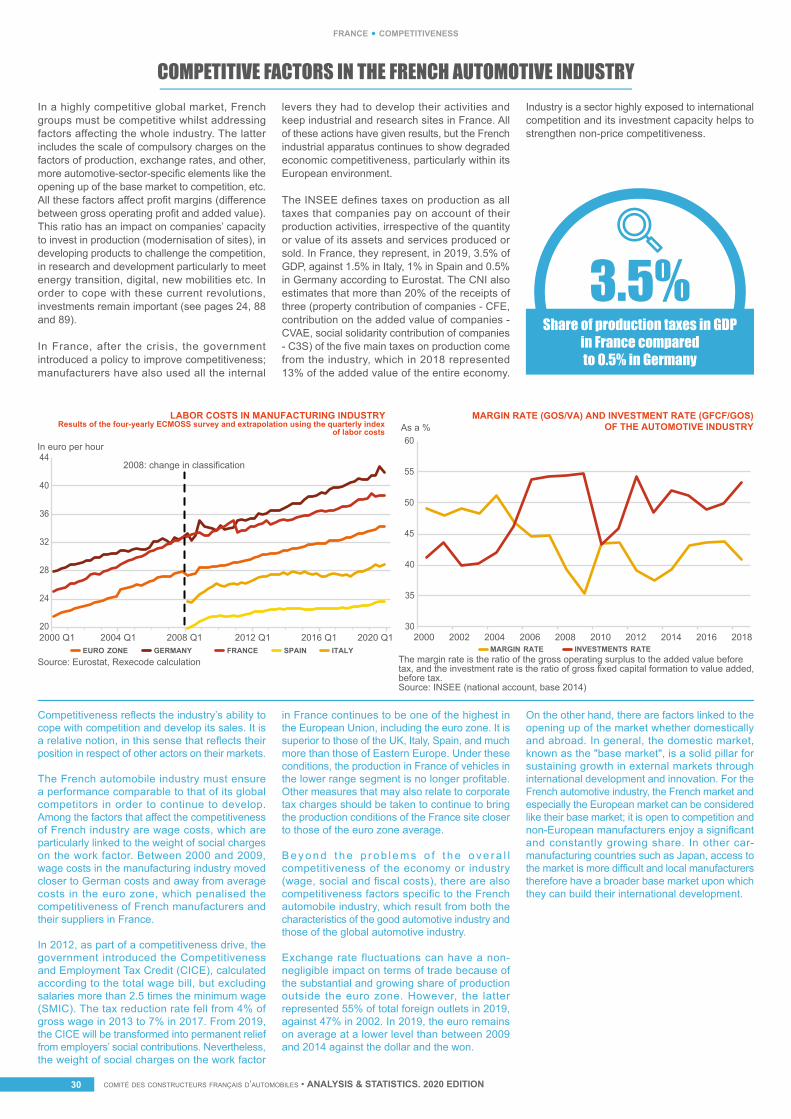
comité des constructeurs français d’automobiles • ANALYSIS & STATISTICS. 2020 EDITIONcomité des constructeurs français d’automobiles • ANALYSIS & STATISTICS. 2020 EDITION30
france • competitiveness
COMPETITIVE FACTORS IN THE FRENCH AUTOMOTIVE INDUSTRYIn a highly competitive global market, French groups must be competitive whilst addressing factors affecting the whole industry. The latter includes the scale of compulsory charges on the factors of production, exchange rates, and other, more automotive-sector-specific elements like the opening up of the base market to competition, etc. All these factors affect profit margins (difference between gross operating profit and added value). This ratio has an impact on companies’ capacity to invest in production (modernisation of sites), in developing products to challenge the competition, in research and development particularly to meet energy transition, digital, new mobilities etc. In order to cope with these current revolutions, investments remain important (see pages 24, 88 and 89).
In France, after the crisis, the government introduced a policy to improve competitiveness; manufacturers have also used all the internal
levers they had to develop their activities and keep industrial and research sites in France. All of these actions have given results, but the French industrial apparatus continues to show degraded economic competitiveness, particularly within its European environment.
The INSEE defines taxes on production as all taxes that companies pay on account of their production activities, irrespective of the quantity or value of its assets and services produced or sold. In France, they represent, in 2019, 3.5% of GDP, against 1.5% in Italy, 1% in Spain and 0.5% in Germany according to Eurostat. The CNI also estimates that more than 20% of the receipts of three (property contribution of companies - CFE, contribution on the added value of companies - CVAE, social solidarity contribution of companies - C3S) of the five main taxes on production come from the industry, which in 2018 represented 13% of the added value of the entire economy.
Industry is a sector highly exposed to international competition and its investment capacity helps to strengthen non-price competitiveness.
Share of production taxes in GDPin France comparedto 0.5% in Germany
3.5%
Competitiveness reflects the industry’s ability to cope with competition and develop its sales. It is a relative notion, in this sense that reflects their position in respect of other actors on their markets.
The French automobile industry must ensure a performance comparable to that of its global competitors in order to continue to develop. Among the factors that affect the competitiveness of French industry are wage costs, which are particularly linked to the weight of social charges on the work factor. Between 2000 and 2009, wage costs in the manufacturing industry moved closer to German costs and away from average costs in the euro zone, which penalised the competitiveness of French manufacturers and their suppliers in France.
In 2012, as part of a competitiveness drive, the government introduced the Competitiveness and Employment Tax Credit (CICE), calculated according to the total wage bill, but excluding salaries more than 2.5 times the minimum wage (SMIC). The tax reduction rate fell from 4% of gross wage in 2013 to 7% in 2017. From 2019, the CICE will be transformed into permanent relief from employers’ social contributions. Nevertheless, the weight of social charges on the work factor
in France continues to be one of the highest in the European Union, including the euro zone. It is superior to those of the UK, Italy, Spain, and much more than those of Eastern Europe. Under these conditions, the production in France of vehicles in the lower range segment is no longer profitable. Other measures that may also relate to corporate tax charges should be taken to continue to bring the production conditions of the France site closer to those of the euro zone average.
B e y o n d t h e p r o b l e m s o f t h e o v e r a l l competitiveness of the economy or industry (wage, social and fiscal costs), there are also competitiveness factors specific to the French automobile industry, which result from both the characteristics of the good automotive industry and those of the global automotive industry.
Exchange rate fluctuations can have a non-negligible impact on terms of trade because of the substantial and growing share of production outside the euro zone. However, the latter represented 55% of total foreign outlets in 2019, against 47% in 2002. In 2019, the euro remains on average at a lower level than between 2009 and 2014 against the dollar and the won.
On the other hand, there are factors linked to the opening up of the market whether domestically and abroad. In general, the domestic market, known as the "base market", is a solid pillar for sustaining growth in external markets through international development and innovation. For the French automotive industry, the French market and especially the European market can be considered like their base market; it is open to competition and non-European manufacturers enjoy a significant and constantly growing share. In other car-manufacturing countries such as Japan, access to the market is more difficult and local manufacturers therefore have a broader base market upon which they can build their international development.
In euro per hour
As a %
2020 Q12016 Q12012 Q12008 Q12004 Q12000 Q1 2000 20042002 201020082006 20142012 2016 201820
24
28
32
36
40
44
LABOR COSTS IN MANUFACTURING INDUSTRY Results of the four-yearly ECMOSS survey and extrapolation using the quarterly index
of labor costs
2008: change in classification
GERMANY FRANCE SPAIN ITALYEURO ZONE INVESTMENTS RATEMARGIN RATE
MARGIN RATE (GOS/VA) AND INVESTMENT RATE (GFCF/GOS)OF THE AUTOMOTIVE INDUSTRY
60
55
50
45
40
35
30
The margin rate is the ratio of the gross operating surplus to the added value beforetax, and the investment rate is the ratio of gross fixed capital formation to value added,before tax.Source: INSEE (national account, base 2014)
Source: Eurostat, Rexecode calculation
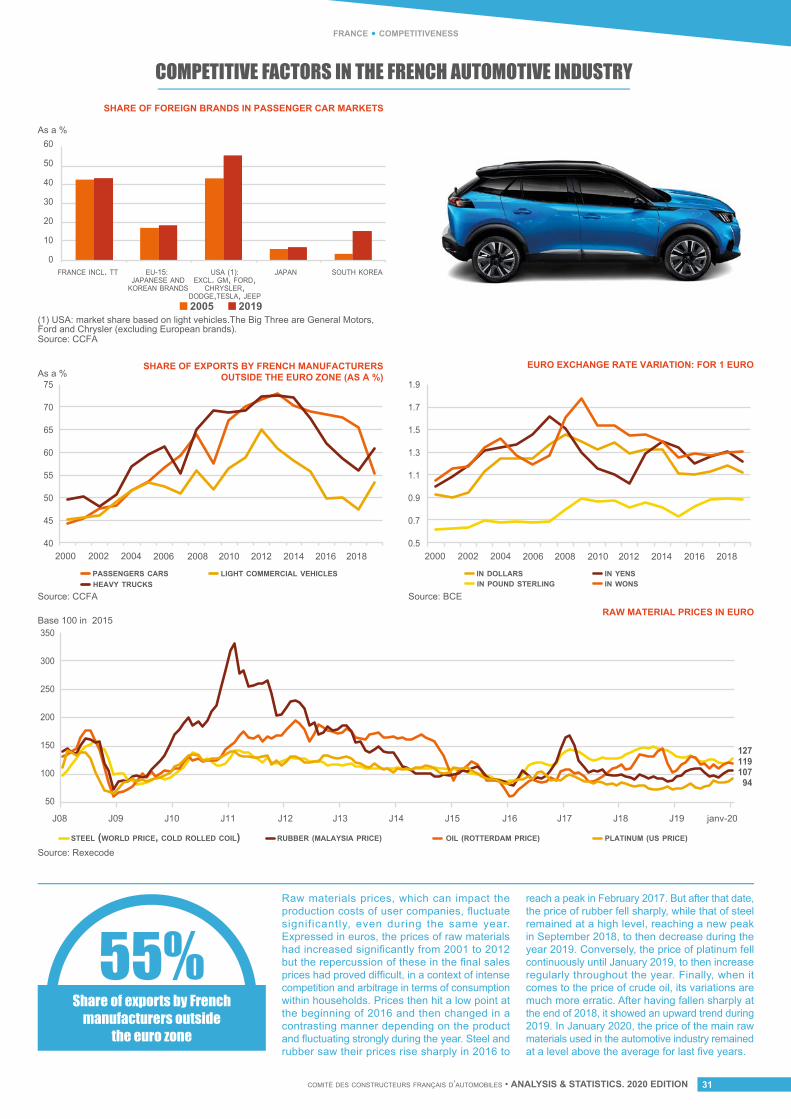
comité des constructeurs français d’automobiles • ANALYSIS & STATISTICS. 2020 EDITION 31
france • competitiveness
55%Share of exports by French
manufacturers outside the euro zone
COMPETITIVE FACTORS IN THE FRENCH AUTOMOTIVE INDUSTRY
As a %
As a %
2018201620142012201020082006200420022000 2018201620142012201020082006200420022000
10
0
20
30
40
50
60
50
45
40
55
60
65
70
75
0.9
0.7
0.5
1.1
1.3
1.5
1.7
1.9
SHARE OF FOREIGN BRANDS IN PASSENGER CAR MARKETS
LIGHT COMMERCIAL VEHICLESHEAVY TRUCKSPASSENGERS CARS
FRANCE INCL. TT EU-15: JAPANESE AND
KOREAN BRANDS
USA (1):EXCL. GM, FORD,
CHRYSLER,DODGE,TESLA, JEEP
JAPAN SOUTH KOREA
2005 2019(1) USA: market share based on light vehicles.The Big Three are General Motors,Ford and Chrysler (excluding European brands).
Source: CCFA
Source: Rexecode
Source: CCFA
IN YENSIN WONSIN POUND STERLING
IN DOLLARS
Source: BCE
SHARE OF EXPORTS BY FRENCH MANUFACTURERSOUTSIDE THE EURO ZONE (AS A %)
EURO EXCHANGE RATE VARIATION: FOR 1 EURO
50
100
150
200
250
300
350
J16J15 J13 J14 J12J11 J10 J09 J08 J18 J17 J19 janv-20
RAW MATERIAL PRICES IN EUROBase 100 in 2015
STEEL (WORLD PRICE, COLD ROLLED COIL) RUBBER (MALAYSIA PRICE) OIL (ROTTERDAM PRICE) PLATINUM (US PRICE)
127119107
94
Raw materials prices, which can impact the production costs of user companies, fluctuate significantly, even during the same year. Expressed in euros, the prices of raw materials had increased significantly from 2001 to 2012 but the repercussion of these in the final sales prices had proved difficult, in a context of intense competition and arbitrage in terms of consumption within households. Prices then hit a low point at the beginning of 2016 and then changed in a contrasting manner depending on the product and fluctuating strongly during the year. Steel and rubber saw their prices rise sharply in 2016 to
reach a peak in February 2017. But after that date, the price of rubber fell sharply, while that of steel remained at a high level, reaching a new peak in September 2018, to then decrease during the year 2019. Conversely, the price of platinum fell continuously until January 2019, to then increase regularly throughout the year. Finally, when it comes to the price of crude oil, its variations are much more erratic. After having fallen sharply at the end of 2018, it showed an upward trend during 2019. In January 2020, the price of the main raw materials used in the automotive industry remained at a level above the average for last five years.
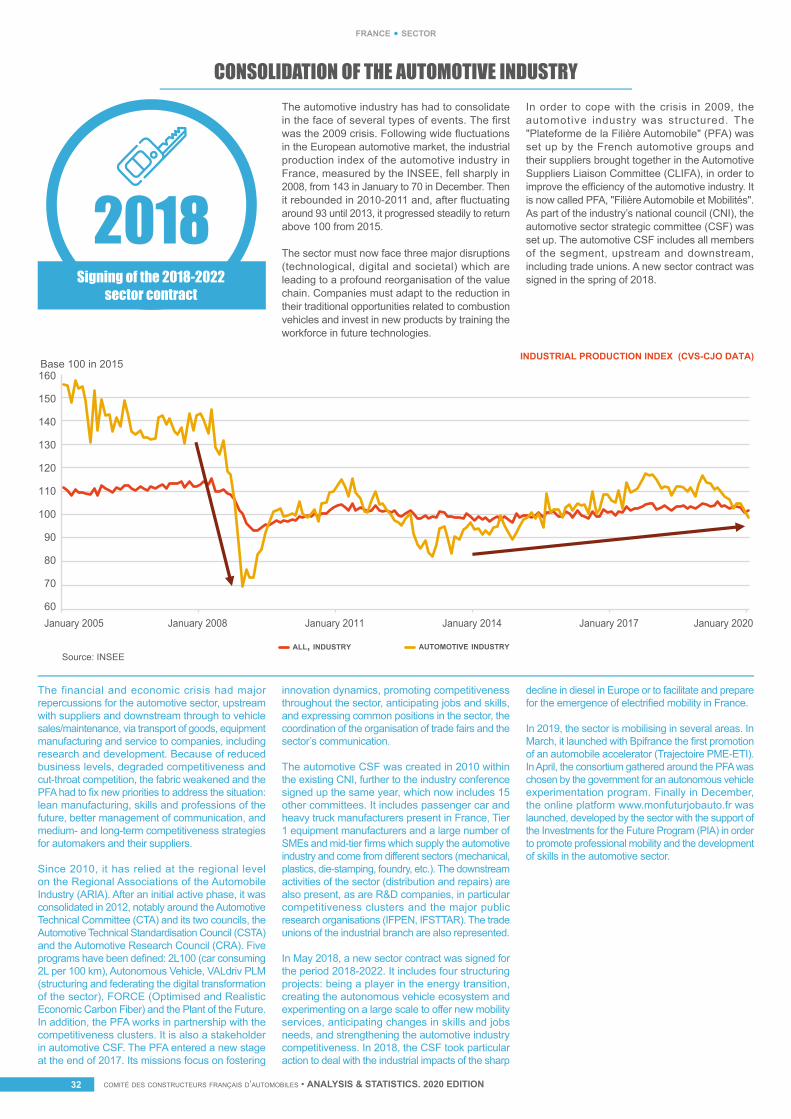
comité des constructeurs français d’automobiles • ANALYSIS & STATISTICS. 2020 EDITIONcomité des constructeurs français d’automobiles • ANALYSIS & STATISTICS. 2020 EDITION32
france • sector
CONSOLIDATION OF THE AUTOMOTIVE INDUSTRYThe automotive industry has had to consolidate in the face of several types of events. The first was the 2009 crisis. Following wide fluctuations in the European automotive market, the industrial production index of the automotive industry in France, measured by the INSEE, fell sharply in 2008, from 143 in January to 70 in December. Then it rebounded in 2010-2011 and, after fluctuating around 93 until 2013, it progressed steadily to return above 100 from 2015.
The sector must now face three major disruptions (technological, digital and societal) which are leading to a profound reorganisation of the value chain. Companies must adapt to the reduction in their traditional opportunities related to combustion vehicles and invest in new products by training the workforce in future technologies.
In order to cope with the crisis in 2009, the automotive industry was structured. The "Plateforme de la Filière Automobile" (PFA) was set up by the French automotive groups and their suppliers brought together in the Automotive Suppliers Liaison Committee (CLIFA), in order to improve the efficiency of the automotive industry. It is now called PFA, "Filière Automobile et Mobilités". As part of the industry’s national council (CNI), the automotive sector strategic committee (CSF) was set up. The automotive CSF includes all members of the segment, upstream and downstream, including trade unions. A new sector contract was signed in the spring of 2018.
2018Signing of the 2018-2022
sector contract
The financial and economic crisis had major repercussions for the automotive sector, upstream with suppliers and downstream through to vehicle sales/maintenance, via transport of goods, equipment manufacturing and service to companies, including research and development. Because of reduced business levels, degraded competitiveness and cut-throat competition, the fabric weakened and the PFA had to fix new priorities to address the situation: lean manufacturing, skills and professions of the future, better management of communication, and medium- and long-term competitiveness strategies for automakers and their suppliers.
Since 2010, it has relied at the regional level on the Regional Associations of the Automobile Industry (ARIA). After an initial active phase, it was consolidated in 2012, notably around the Automotive Technical Committee (CTA) and its two councils, the Automotive Technical Standardisation Council (CSTA) and the Automotive Research Council (CRA). Five programs have been defined: 2L100 (car consuming 2L per 100 km), Autonomous Vehicle, VALdriv PLM (structuring and federating the digital transformation of the sector), FORCE (Optimised and Realistic Economic Carbon Fiber) and the Plant of the Future. In addition, the PFA works in partnership with the competitiveness clusters. It is also a stakeholder in automotive CSF. The PFA entered a new stage at the end of 2017. Its missions focus on fostering
innovation dynamics, promoting competitiveness throughout the sector, anticipating jobs and skills, and expressing common positions in the sector, the coordination of the organisation of trade fairs and the sector’s communication.
The automotive CSF was created in 2010 within the existing CNI, further to the industry conference signed up the same year, which now includes 15 other committees. It includes passenger car and heavy truck manufacturers present in France, Tier 1 equipment manufacturers and a large number of SMEs and mid-tier firms which supply the automotive industry and come from different sectors (mechanical, plastics, die-stamping, foundry, etc.). The downstream activities of the sector (distribution and repairs) are also present, as are R&D companies, in particular competitiveness clusters and the major public research organisations (IFPEN, IFSTTAR). The trade unions of the industrial branch are also represented.
In May 2018, a new sector contract was signed for the period 2018-2022. It includes four structuring projects: being a player in the energy transition, creating the autonomous vehicle ecosystem and experimenting on a large scale to offer new mobility services, anticipating changes in skills and jobs needs, and strengthening the automotive industry competitiveness. In 2018, the CSF took particular action to deal with the industrial impacts of the sharp
decline in diesel in Europe or to facilitate and prepare for the emergence of electrified mobility in France.
In 2019, the sector is mobilising in several areas. In March, it launched with Bpifrance the first promotion of an automobile accelerator (Trajectoire PME-ETI). In April, the consortium gathered around the PFA was chosen by the government for an autonomous vehicle experimentation program. Finally in December, the online platform www.monfuturjobauto.fr was launched, developed by the sector with the support of the Investments for the Future Program (PIA) in order to promote professional mobility and the development of skills in the automotive sector.
January 2020January 2017January 2014January 2011January 2005 January 2008
Base 100 in 2015
60
70
90
110
130
150
80
100
120
140
160
ALL, INDUSTRY AUTOMOTIVE INDUSTRY
INDUSTRIAL PRODUCTION INDEX (CVS-CJO DATA)
Source: INSEE
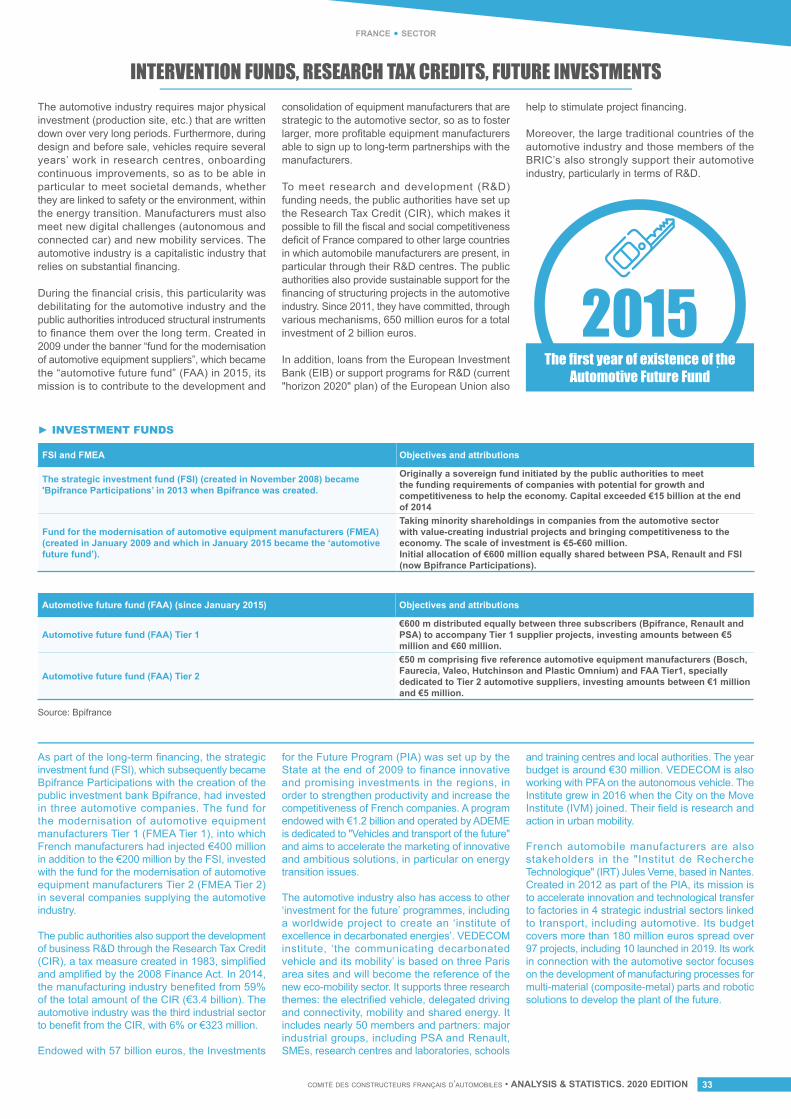
comité des constructeurs français d’automobiles • ANALYSIS & STATISTICS. 2020 EDITION 33
france • sector
INTERVENTION FUNDS, RESEARCH TAX CREDITS, FUTURE INVESTMENTS
2015The first year of existence of the
Automotive Future Fund
As part of the long-term financing, the strategic investment fund (FSI), which subsequently became Bpifrance Participations with the creation of the public investment bank Bpifrance, had invested in three automotive companies. The fund for the modernisation of automotive equipment manufacturers Tier 1 (FMEA Tier 1), into which French manufacturers had injected €400 million in addition to the €200 million by the FSI, invested with the fund for the modernisation of automotive equipment manufacturers Tier 2 (FMEA Tier 2) in several companies supplying the automotive industry.
The public authorities also support the development of business R&D through the Research Tax Credit (CIR), a tax measure created in 1983, simplified and amplified by the 2008 Finance Act. In 2014, the manufacturing industry benefited from 59% of the total amount of the CIR (€3.4 billion). The automotive industry was the third industrial sector to benefit from the CIR, with 6% or €323 million.
Endowed with 57 billion euros, the Investments
for the Future Program (PIA) was set up by the State at the end of 2009 to finance innovative and promising investments in the regions, in order to strengthen productivity and increase the competitiveness of French companies. A program endowed with €1.2 billion and operated by ADEME is dedicated to "Vehicles and transport of the future" and aims to accelerate the marketing of innovative and ambitious solutions, in particular on energy transition issues.
The automotive industry also has access to other ‘investment for the future’ programmes, including a worldwide project to create an ‘institute of excellence in decarbonated energies’. VEDECOM institute, ‘the communicating decarbonated vehicle and its mobility’ is based on three Paris area sites and will become the reference of the new eco-mobility sector. It supports three research themes: the electrified vehicle, delegated driving and connectivity, mobility and shared energy. It includes nearly 50 members and partners: major industrial groups, including PSA and Renault, SMEs, research centres and laboratories, schools
and training centres and local authorities. The year budget is around €30 million. VEDECOM is also working with PFA on the autonomous vehicle. The Institute grew in 2016 when the City on the Move Institute (IVM) joined. Their field is research and action in urban mobility.
French automobile manufacturers are also stakeholders in the "Institut de Recherche Technologique" (IRT) Jules Verne, based in Nantes. Created in 2012 as part of the PIA, its mission is to accelerate innovation and technological transfer to factories in 4 strategic industrial sectors linked to transport, including automotive. Its budget covers more than 180 million euros spread over 97 projects, including 10 launched in 2019. Its work in connection with the automotive sector focuses on the development of manufacturing processes for multi-material (composite-metal) parts and robotic solutions to develop the plant of the future.
► INVESTMENT FUNDS
FSI and FMEA Objectives and attributions
The strategic investment fund (FSI) (created in November 2008) became 'Bpifrance Participations’ in 2013 when Bpifrance was created.
Originally a sovereign fund initiated by the public authorities to meet the funding requirements of companies with potential for growth and competitiveness to help the economy. Capital exceeded €15 billion at the end of 2014
Fund for the modernisation of automotive equipment manufacturers (FMEA) (created in January 2009 and which in January 2015 became the ‘automotive future fund’).
Taking minority shareholdings in companies from the automotive sector with value-creating industrial projects and bringing competitiveness to the economy. The scale of investment is €5-€60 million. Initial allocation of €600 million equally shared between PSA, Renault and FSI (now Bpifrance Participations).
Automotive future fund (FAA) (since January 2015) Objectives and attributions
Automotive future fund (FAA) Tier 1 €600 m distributed equally between three subscribers (Bpifrance, Renault and PSA) to accompany Tier 1 supplier projects, investing amounts between €5 million and €60 million.
Automotive future fund (FAA) Tier 2
€50 m comprising five reference automotive equipment manufacturers (Bosch, Faurecia, Valeo, Hutchinson and Plastic Omnium) and FAA Tier1, specially dedicated to Tier 2 automotive suppliers, investing amounts between €1 million and €5 million.
Source: Bpifrance
The automotive industry requires major physical investment (production site, etc.) that are written down over very long periods. Furthermore, during design and before sale, vehicles require several years’ work in research centres, onboarding continuous improvements, so as to be able in particular to meet societal demands, whether they are linked to safety or the environment, within the energy transition. Manufacturers must also meet new digital challenges (autonomous and connected car) and new mobility services. The automotive industry is a capitalistic industry that relies on substantial financing.
During the financial crisis, this particularity was debilitating for the automotive industry and the public authorities introduced structural instruments to finance them over the long term. Created in 2009 under the banner “fund for the modernisation of automotive equipment suppliers”, which became the “automotive future fund” (FAA) in 2015, its mission is to contribute to the development and
consolidation of equipment manufacturers that are strategic to the automotive sector, so as to foster larger, more profitable equipment manufacturers able to sign up to long-term partnerships with the manufacturers.
To meet research and development (R&D) funding needs, the public authorities have set up the Research Tax Credit (CIR), which makes it possible to fill the fiscal and social competitiveness deficit of France compared to other large countries in which automobile manufacturers are present, in particular through their R&D centres. The public authorities also provide sustainable support for the financing of structuring projects in the automotive industry. Since 2011, they have committed, through various mechanisms, 650 million euros for a total investment of 2 billion euros.
In addition, loans from the European Investment Bank (EIB) or support programs for R&D (current "horizon 2020" plan) of the European Union also
help to stimulate project financing.
Moreover, the large traditional countries of the automotive industry and those members of the BRIC’s also strongly support their automotive industry, particularly in terms of R&D.
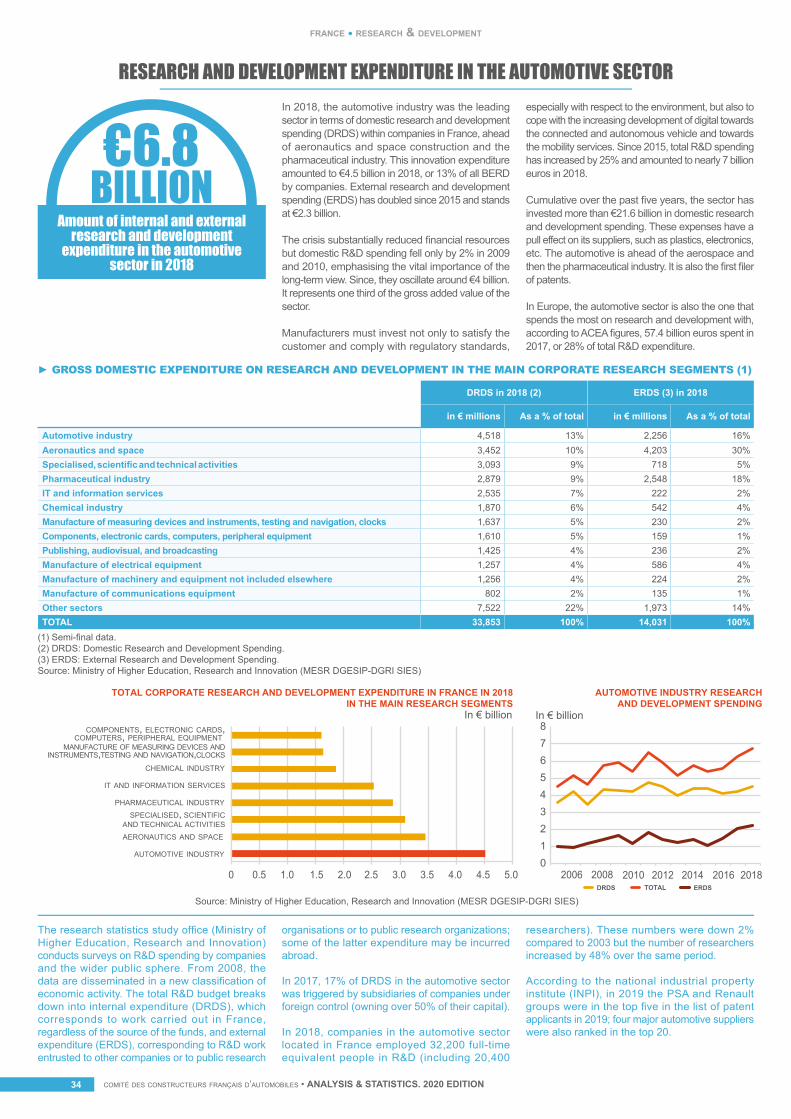
comité des constructeurs français d’automobiles • ANALYSIS & STATISTICS. 2020 EDITIONcomité des constructeurs français d’automobiles • ANALYSIS & STATISTICS. 2020 EDITION34
france • research & development
RESEARCH AND DEVELOPMENT EXPENDITURE IN THE AUTOMOTIVE SECTOR
► GROSS DOMESTIC EXPENDITURE ON RESEARCH AND DEVELOPMENT IN THE MAIN CORPORATE RESEARCH SEGMENTS (1)
DRDS in 2018 (2) ERDS (3) in 2018
in € millions As a % of total in € millions As a % of total
Automotive industry 4,518 13% 2,256 16%Aeronautics and space 3,452 10% 4,203 30%Specialised, scientific and technical activities 3,093 9% 718 5%Pharmaceutical industry 2,879 9% 2,548 18%IT and information services 2,535 7% 222 2%Chemical industry 1,870 6% 542 4%Manufacture of measuring devices and instruments, testing and navigation, clocks 1,637 5% 230 2%Components, electronic cards, computers, peripheral equipment 1,610 5% 159 1%Publishing, audiovisual, and broadcasting 1,425 4% 236 2%Manufacture of electrical equipment 1,257 4% 586 4%Manufacture of machinery and equipment not included elsewhere 1,256 4% 224 2%Manufacture of communications equipment 802 2% 135 1%Other sectors 7,522 22% 1,973 14%TOTAL 33,853 100% 14,031 100%
Amount of internal and external research and development
expenditure in the automotive sector in 2018
The research statistics study office (Ministry of Higher Education, Research and Innovation) conducts surveys on R&D spending by companies and the wider public sphere. From 2008, the data are disseminated in a new classification of economic activity. The total R&D budget breaks down into internal expenditure (DRDS), which corresponds to work carried out in France, regardless of the source of the funds, and external expenditure (ERDS), corresponding to R&D work entrusted to other companies or to public research
organisations or to public research organizations; some of the latter expenditure may be incurred abroad.
In 2017, 17% of DRDS in the automotive sector was triggered by subsidiaries of companies under foreign control (owning over 50% of their capital).
In 2018, companies in the automotive sector located in France employed 32,200 full-time equivalent people in R&D (including 20,400
researchers). These numbers were down 2% compared to 2003 but the number of researchers increased by 48% over the same period.
According to the national industrial property institute (INPI), in 2019 the PSA and Renault groups were in the top five in the list of patent applicants in 2019; four major automotive suppliers were also ranked in the top 20.
(1) Semi-final data.(2) DRDS: Domestic Research and Development Spending.(3) ERDS: External Research and Development Spending.Source: Ministry of Higher Education, Research and Innovation (MESR DGESIP-DGRI SIES)
Source: Ministry of Higher Education, Research and Innovation (MESR DGESIP-DGRI SIES)
0 0.5 1.0 1.5 2.0 2.5 3.0 3.5 4.0 4.5 5.0
AERONAUTICS AND SPACE
AUTOMOTIVE INDUSTRY
PHARMACEUTICAL INDUSTRY
SPECIALISED, SCIENTIFICAND TECHNICAL ACTIVITIES
IT AND INFORMATION SERVICES
CHEMICAL INDUSTRY
MANUFACTURE OF MEASURING DEVICES ANDINSTRUMENTS,TESTING AND NAVIGATION,CLOCKS
COMPONENTS, ELECTRONIC CARDS,COMPUTERS, PERIPHERAL EQUIPMENT
TOTAL CORPORATE RESEARCH AND DEVELOPMENT EXPENDITURE IN FRANCE IN 2018IN THE MAIN RESEARCH SEGMENTS
2012 2014 2016 201820102006 2008
In € billion
AUTOMOTIVE INDUSTRY RESEARCHAND DEVELOPMENT SPENDING
012345678
DRDS ERDSTOTAL
In € billion
€6.8BILLION
In 2018, the automotive industry was the leading sector in terms of domestic research and development spending (DRDS) within companies in France, ahead of aeronautics and space construction and the pharmaceutical industry. This innovation expenditure amounted to €4.5 billion in 2018, or 13% of all BERD by companies. External research and development spending (ERDS) has doubled since 2015 and stands at €2.3 billion.
The crisis substantially reduced financial resources but domestic R&D spending fell only by 2% in 2009 and 2010, emphasising the vital importance of the long-term view. Since, they oscillate around €4 billion. It represents one third of the gross added value of the sector.
Manufacturers must invest not only to satisfy the customer and comply with regulatory standards,
especially with respect to the environment, but also to cope with the increasing development of digital towards the connected and autonomous vehicle and towards the mobility services. Since 2015, total R&D spending has increased by 25% and amounted to nearly 7 billion euros in 2018.
Cumulative over the past five years, the sector has invested more than €21.6 billion in domestic research and development spending. These expenses have a pull effect on its suppliers, such as plastics, electronics, etc. The automotive is ahead of the aerospace and then the pharmaceutical industry. It is also the first filer of patents.
In Europe, the automotive sector is also the one that spends the most on research and development with, according to ACEA figures, 57.4 billion euros spent in 2017, or 28% of total R&D expenditure.
comité des constructeurs français d’automobiles • ANALYSIS & STATISTICS. 2020 EDITION 35
france • research & development
AUTOMOTIVE COMPETITIVENESS CLUSTERS IN FRANCE Initiated by the State and local authorities in 2005, the competitiveness clusters federate companies (large groups and SMEs/mid-cap companies), research units and training centres in collaborative project mode. Companies can belong to several poles with different specialties in order to obtain know-how (example: software skills for autonomous vehicles). The clusters also offer many services: economic intelligence, help with patenting, networking, etc.
Their role is to be a lever for the competitiveness of the French economy by emphasising its capacity for innovation and by encouraging anchoring and structuring in their territories. Several studies have shown their impact on companies’ R&D spending: one euro of public subsidy received under this policy would have generated an average of 2.5 euros of additional R&D spending by beneficiary SMEs.
Phase IV of the poles policy was launched in 2019, with a requirement for excellence and a reinforced European ambition. The objectives of phase III are maintained (action focused on the products and services to be industrialised, taking into account economic opportunities and employment) but from now on, they must be more integrated into European innovation networks. Thus their size and their interest in merging and getting closer to other structures is important.
There are four automotive competitiveness clusters. They have developed their lines of work around innovation, skills, networking and bringing new solutions to market. They are associate members of the structure of the automotive industry: the PFA, Automotive Industry and Mobilities. In 2019, they joined forces to form the "auto and mobility" inter-hubs, a benchmark in Europe and internationally.
► AUTOMOTIVE COMPETITIVENESS CLUSTERS IN FRANCE
Mov'eo Vehicle of the Future CARA iD4CAR
Number of companies with a business unit in a competitiveness cluster 201 204 128 87
of which SMEs 149 135 71 57
of which intermediate-sized enterprises 25 47 34 22
Employees of business units involved in the cluster (number of people) (1) 28,028 47,686 20,355 18,375
Number of members (2019) 380 500 210 319
Number of labeled projects since their creation (2019) 405 469 270 278
Number of projects funded since their creation (2019) 230 227 159 -
In 2019, the automotive industry continued its research and development efforts through those clusters. Their action is transversal and includes car manufacturers, equipment manufacturers, innovative SMEs/intermediate-sized companies, research laboratories and training organisations, including universities.
The Mov’eo hub extends over the Île-de-France and Normandy regions. It is dedicated to the mobility of the future. The areas of research and development are: safety of road users, intelligent mobility solutions, innovative vehicles and energy storage, materials and systems, powertrains and energy management. In 2019, the cluster merged with the Normandy ARIA and the Automobility & Vehicles Network in Île-de-France (RAVI) to create Mobility Valley, a territory of European excellence where solutions are invented, developed, tested and industrialised to meet the challenges of future mobility.
The Vehicle of the Future cluster mobilises the historic automobile basins of Alsace and Franche-Comté. Its mission revolves around three themes: innovation, industrial excellence in the service of businesses and support for business growth. The cluster, in terms of innovation, is focused on automotive components, electric vehicles, hydrogen vehicles with the DINAMHySE plan in 2019 as part of the Grand Investment Plan,
recycling and mobility services. In June 2020, the Vehicle of the Future Pole completed the merger-absorption of the Champagne-Ardenne and Lorraine ARIA, PerfoEST (historically Alsace & Franche-Comté) ARIA having already joined the Pole in 2008. The objective of this merger is to consolidate the Automobile & Mobility sector over the entire territory of the Grand Est and Bourgogne-Franche-Comté Pole.
The ambition of the CARA cluster is to support changes in urban mobility and to represent and animate the automotive and industrial vehicles sector in the Auvergne-Rhône-Alpes region. At the end of 2017, the LUTB Transport & Mobility Systems competitiveness cluster and the Automotive Cluster of the Auvergne-Rhône-Alpes Region took the name of CARA. The latter coordinates structuring activities for the region: manufacturers, transport operators, research centres. The activity revolves around five research programs: motorisation and driveline, safety and security, vehicle architecture, intelligent transport system, modelling and management of mobility. In this new phase, CARA aims to focus on experimentation, in real conditions, of innovation projects with the territories, and to accelerate support for European projects.
Located in the west of France (Brittany, Pays de la Loire), the iD4CAR cluster is focused on specific vehicles and sustainable mobility. The four
strategic areas of activity are: vehicle materials and architecture, embedded systems intelligence, innovative vehicles and uses, and digital mobility services and infrastructure. The cluster has also played the role of an ARIA on its geographical perimeter since the start of 2017. As part of phase IV of the competitiveness clusters, ID4CAR is extending by developing in New Aquitaine, in order to strengthen the hub territorial Great West.
Other clusters, not specifically dedicated to the automotive industry, have applications which are of interest to the sector. These clusters work on materials, rubber, plastic, mechanics or mobility. Elastopole, a national cluster, including the regions of Val de Loire, Auvergne-Rhône-Alpes, Pays de la Loire and Île-de-France, is dedicated to rubber and polymers, and three quarters of its applications concern the automotive sector. It also works in collaboration with the automotive clusters. I-Trans, a global cluster in Hauts-de-France which specialises in sustainable terrestrial transport solutions, with five target sectors, including automotive equipment. In 2015, 13% of the employees of the member establishments of this cluster worked for the automobile industry.
1,500Member establishments of
automotive competitiveness clusters in 2019
(1) Information concerning employees is calculated on the basis of 2014 data.Sources: DGE (annual survey with the clusters in 2015), Mov’eo, Vehicle of the Future, CARA, ID4CAR
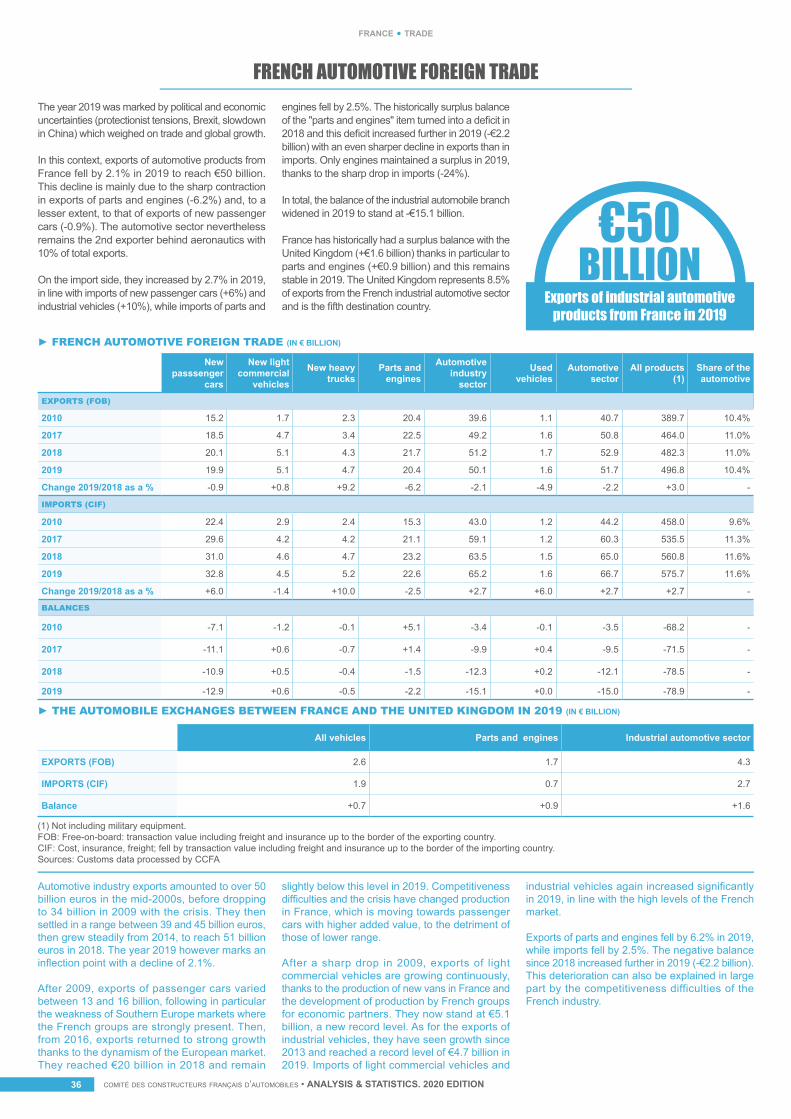
comité des constructeurs français d’automobiles • ANALYSIS & STATISTICS. 2020 EDITIONcomité des constructeurs français d’automobiles • ANALYSIS & STATISTICS. 2020 EDITION36
france • trade
FRENCH AUTOMOTIVE FOREIGN TRADEThe year 2019 was marked by political and economic uncertainties (protectionist tensions, Brexit, slowdown in China) which weighed on trade and global growth.
In this context, exports of automotive products from France fell by 2.1% in 2019 to reach €50 billion. This decline is mainly due to the sharp contraction in exports of parts and engines (-6.2%) and, to a lesser extent, to that of exports of new passenger cars (-0.9%). The automotive sector nevertheless remains the 2nd exporter behind aeronautics with 10% of total exports.
On the import side, they increased by 2.7% in 2019, in line with imports of new passenger cars (+6%) and industrial vehicles (+10%), while imports of parts and
engines fell by 2.5%. The historically surplus balance of the "parts and engines" item turned into a deficit in 2018 and this deficit increased further in 2019 (-€2.2 billion) with an even sharper decline in exports than in imports. Only engines maintained a surplus in 2019, thanks to the sharp drop in imports (-24%).
In total, the balance of the industrial automobile branch widened in 2019 to stand at -€15.1 billion.
France has historically had a surplus balance with the United Kingdom (+€1.6 billion) thanks in particular to parts and engines (+€0.9 billion) and this remains stable in 2019. The United Kingdom represents 8.5% of exports from the French industrial automotive sector and is the fifth destination country.
Automotive industry exports amounted to over 50 billion euros in the mid-2000s, before dropping to 34 billion in 2009 with the crisis. They then settled in a range between 39 and 45 billion euros, then grew steadily from 2014, to reach 51 billion euros in 2018. The year 2019 however marks an inflection point with a decline of 2.1%.
After 2009, exports of passenger cars varied between 13 and 16 billion, following in particular the weakness of Southern Europe markets where the French groups are strongly present. Then, from 2016, exports returned to strong growth thanks to the dynamism of the European market. They reached €20 billion in 2018 and remain
slightly below this level in 2019. Competitiveness difficulties and the crisis have changed production in France, which is moving towards passenger cars with higher added value, to the detriment of those of lower range.
After a sharp drop in 2009, exports of light commercial vehicles are growing continuously, thanks to the production of new vans in France and the development of production by French groups for economic partners. They now stand at €5.1 billion, a new record level. As for the exports of industrial vehicles, they have seen growth since 2013 and reached a record level of €4.7 billion in 2019. Imports of light commercial vehicles and
industrial vehicles again increased significantly in 2019, in line with the high levels of the French market.
Exports of parts and engines fell by 6.2% in 2019, while imports fell by 2.5%. The negative balance since 2018 increased further in 2019 (-€2.2 billion). This deterioration can also be explained in large part by the competitiveness difficulties of the French industry.
► FRENCH AUTOMOTIVE FOREIGN TRADE (IN € BILLION)
► THE AUTOMOBILE EXCHANGES BETWEEN FRANCE AND THE UNITED KINGDOM IN 2019 (IN € BILLION)
New passsenger
cars
New light commercial
vehicles
New heavy trucks
Parts and engines
Automotive industry
sector
Used vehicles
Automotive sector
All products (1)
Share of the automotive
EXPORTS (FOB)
2010 15.2 1.7 2.3 20.4 39.6 1.1 40.7 389.7 10.4%
2017 18.5 4.7 3.4 22.5 49.2 1.6 50.8 464.0 11.0%
2018 20.1 5.1 4.3 21.7 51.2 1.7 52.9 482.3 11.0%
2019 19.9 5.1 4.7 20.4 50.1 1.6 51.7 496.8 10.4%
Change 2019/2018 as a % -0.9 +0.8 +9.2 -6.2 -2.1 -4.9 -2.2 +3.0 -
IMPORTS (CIF)
2010 22.4 2.9 2.4 15.3 43.0 1.2 44.2 458.0 9.6%
2017 29.6 4.2 4.2 21.1 59.1 1.2 60.3 535.5 11.3%
2018 31.0 4.6 4.7 23.2 63.5 1.5 65.0 560.8 11.6%
2019 32.8 4.5 5.2 22.6 65.2 1.6 66.7 575.7 11.6%
Change 2019/2018 as a % +6.0 -1.4 +10.0 -2.5 +2.7 +6.0 +2.7 +2.7 -
BALANCES
2010 -7.1 -1.2 -0.1 +5.1 -3.4 -0.1 -3.5 -68.2 -
2017 -11.1 +0.6 -0.7 +1.4 -9.9 +0.4 -9.5 -71.5 -
2018 -10.9 +0.5 -0.4 -1.5 -12.3 +0.2 -12.1 -78.5 -
2019 -12.9 +0.6 -0.5 -2.2 -15.1 +0.0 -15.0 -78.9 -
All vehicles Parts and engines Industrial automotive sector
EXPORTS (FOB) 2.6 1.7 4.3
IMPORTS (CIF) 1.9 0.7 2.7
Balance +0.7 +0.9 +1.6
(1) Not including military equipment. FOB: Free-on-board: transaction value including freight and insurance up to the border of the exporting country.CIF: Cost, insurance, freight; fell by transaction value including freight and insurance up to the border of the importing country.Sources: Customs data processed by CCFA
Exports of industrial automotive products from France in 2019
€50BILLION
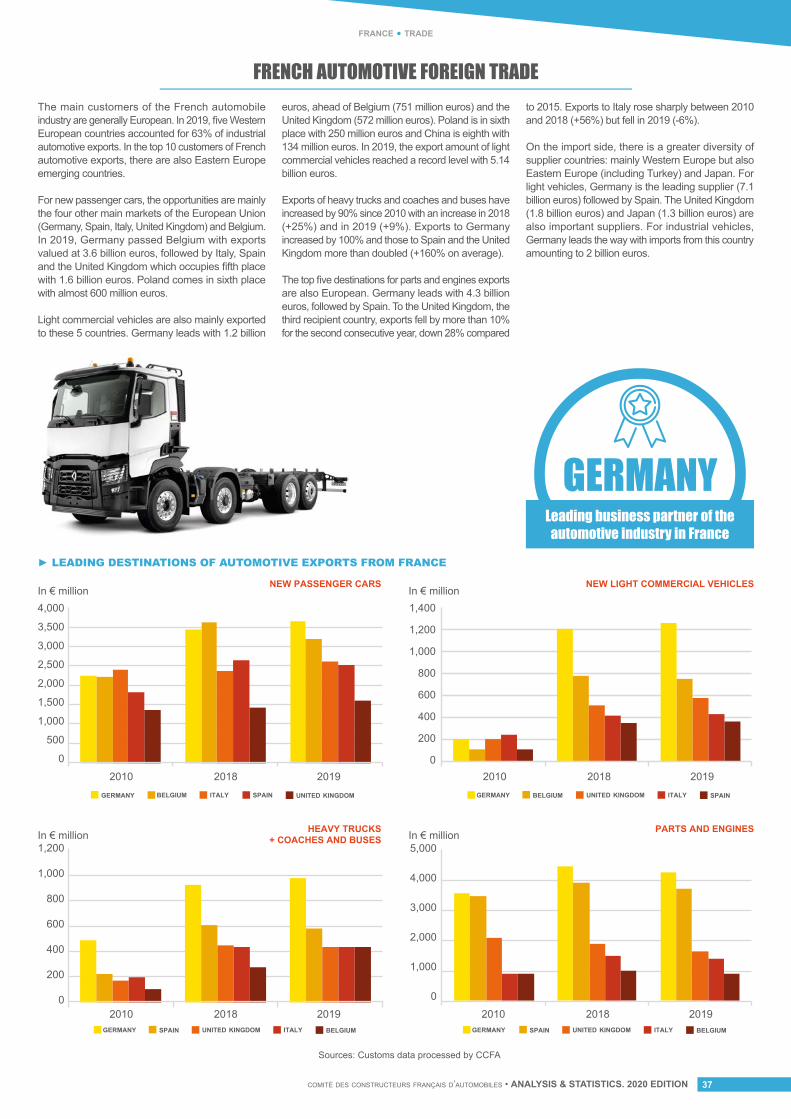
comité des constructeurs français d’automobiles • ANALYSIS & STATISTICS. 2020 EDITION 37
france • trade
FRENCH AUTOMOTIVE FOREIGN TRADEThe main customers of the French automobile industry are generally European. In 2019, five Western European countries accounted for 63% of industrial automotive exports. In the top 10 customers of French automotive exports, there are also Eastern Europe emerging countries.
For new passenger cars, the opportunities are mainly the four other main markets of the European Union (Germany, Spain, Italy, United Kingdom) and Belgium. In 2019, Germany passed Belgium with exports valued at 3.6 billion euros, followed by Italy, Spain and the United Kingdom which occupies fifth place with 1.6 billion euros. Poland comes in sixth place with almost 600 million euros.
Light commercial vehicles are also mainly exported to these 5 countries. Germany leads with 1.2 billion
euros, ahead of Belgium (751 million euros) and the United Kingdom (572 million euros). Poland is in sixth place with 250 million euros and China is eighth with 134 million euros. In 2019, the export amount of light commercial vehicles reached a record level with 5.14 billion euros.
Exports of heavy trucks and coaches and buses have increased by 90% since 2010 with an increase in 2018 (+25%) and in 2019 (+9%). Exports to Germany increased by 100% and those to Spain and the United Kingdom more than doubled (+160% on average).
The top five destinations for parts and engines exports are also European. Germany leads with 4.3 billion euros, followed by Spain. To the United Kingdom, the third recipient country, exports fell by more than 10% for the second consecutive year, down 28% compared
to 2015. Exports to Italy rose sharply between 2010 and 2018 (+56%) but fell in 2019 (-6%).
On the import side, there is a greater diversity of supplier countries: mainly Western Europe but also Eastern Europe (including Turkey) and Japan. For light vehicles, Germany is the leading supplier (7.1 billion euros) followed by Spain. The United Kingdom (1.8 billion euros) and Japan (1.3 billion euros) are also important suppliers. For industrial vehicles, Germany leads the way with imports from this country amounting to 2 billion euros.
► LEADING DESTINATIONS OF AUTOMOTIVE EXPORTS FROM FRANCE
Leading business partner of the automotive industry in France
NEW PASSENGER CARS NEW LIGHT COMMERCIAL VEHICLES
HEAVY TRUCKS+ COACHES AND BUSES
PARTS AND ENGINES
0
500
1,000
1,500
2,000
2,500
3,000
3,500
4,000
0
200
400
600
1,200
1,000
800
0
200
1,200
1,000
800
600
400
1,400
0
1,000
2,000
3,000
4,000
5,000
In € millionIn € million
In € millionIn € million
2010 2018 2019
2010 2018 2019 2010 2018 2019
2010 2018 2019BELGIUMGERMANY SPAINITALY UNITED KINGDOM GERMANY BELGIUM UNITED KINGDOM ITALY SPAIN
Sources: Customs data processed by CCFA
GERMANY SPAIN UNITED KINGDOM ITALY BELGIUM GERMANY SPAIN UNITED KINGDOM ITALY BELGIUM
GERMANY
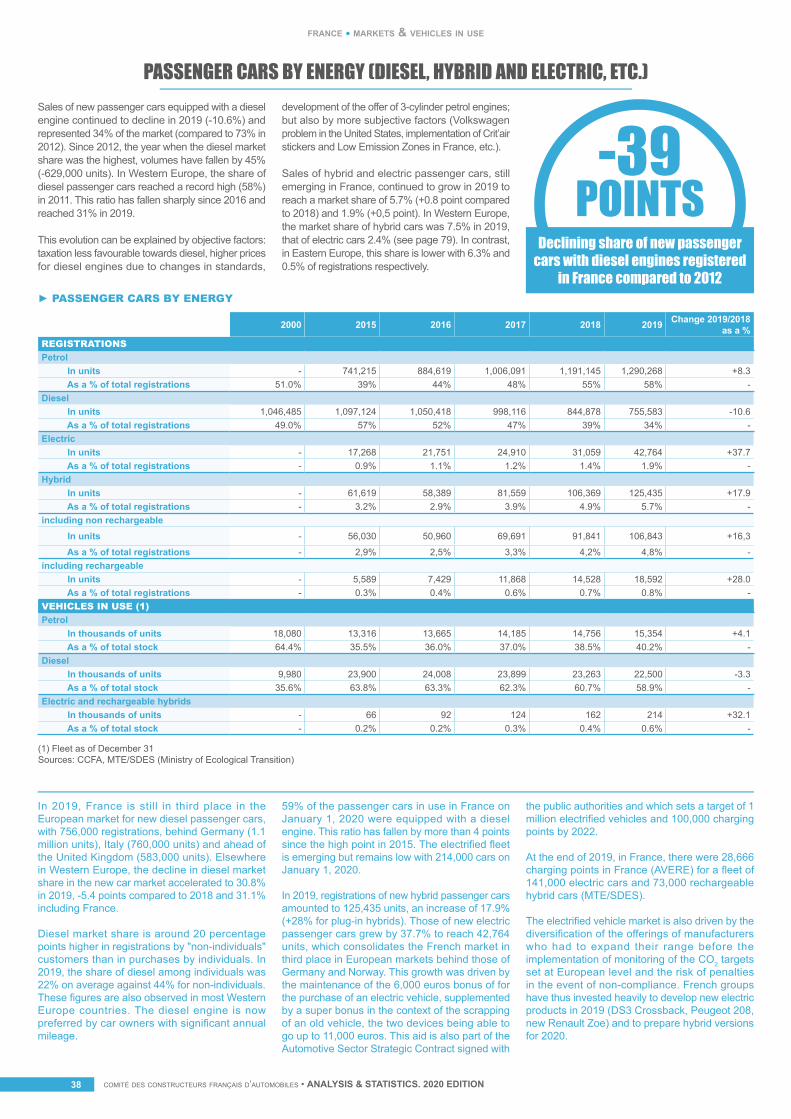
comité des constructeurs français d’automobiles • ANALYSIS & STATISTICS. 2020 EDITIONcomité des constructeurs français d’automobiles • ANALYSIS & STATISTICS. 2020 EDITION38
france • markets & vehicles in use
PASSENGER CARS BY ENERGY (DIESEL, HYBRID AND ELECTRIC, ETC.)Sales of new passenger cars equipped with a diesel engine continued to decline in 2019 (-10.6%) and represented 34% of the market (compared to 73% in 2012). Since 2012, the year when the diesel market share was the highest, volumes have fallen by 45% (-629,000 units). In Western Europe, the share of diesel passenger cars reached a record high (58%) in 2011. This ratio has fallen sharply since 2016 and reached 31% in 2019.
This evolution can be explained by objective factors: taxation less favourable towards diesel, higher prices for diesel engines due to changes in standards,
development of the offer of 3-cylinder petrol engines; but also by more subjective factors (Volkswagen problem in the United States, implementation of Crit’air stickers and Low Emission Zones in France, etc.).
Sales of hybrid and electric passenger cars, still emerging in France, continued to grow in 2019 to reach a market share of 5.7% (+0.8 point compared to 2018) and 1.9% (+0,5 point). In Western Europe, the market share of hybrid cars was 7.5% in 2019, that of electric cars 2.4% (see page 79). In contrast, in Eastern Europe, this share is lower with 6.3% and 0.5% of registrations respectively.
Declining share of new passenger cars with diesel engines registered
in France compared to 2012► PASSENGER CARS BY ENERGY
2000 2015 2016 2017 2018 2019 Change 2019/2018 as a %
REGISTRATIONSPetrol In units - 741,215 884,619 1,006,091 1,191,145 1,290,268 +8.3 As a % of total registrations 51.0% 39% 44% 48% 55% 58% -Diesel In units 1,046,485 1,097,124 1,050,418 998,116 844,878 755,583 -10.6 As a % of total registrations 49.0% 57% 52% 47% 39% 34% -Electric In units - 17,268 21,751 24,910 31,059 42,764 +37.7 As a % of total registrations - 0.9% 1.1% 1.2% 1.4% 1.9% -Hybrid In units - 61,619 58,389 81,559 106,369 125,435 +17.9 As a % of total registrations - 3.2% 2.9% 3.9% 4.9% 5.7% -including non rechargeable In units - 56,030 50,960 69,691 91,841 106,843 +16,3
As a % of total registrations - 2,9% 2,5% 3,3% 4,2% 4,8% -including rechargeable In units - 5,589 7,429 11,868 14,528 18,592 +28.0 As a % of total registrations - 0.3% 0.4% 0.6% 0.7% 0.8% -VEHICLES IN USE (1)Petrol In thousands of units 18,080 13,316 13,665 14,185 14,756 15,354 +4.1 As a % of total stock 64.4% 35.5% 36.0% 37.0% 38.5% 40.2% -Diesel In thousands of units 9,980 23,900 24,008 23,899 23,263 22,500 -3.3 As a % of total stock 35.6% 63.8% 63.3% 62.3% 60.7% 58.9% -Electric and rechargeable hybrids In thousands of units - 66 92 124 162 214 +32.1 As a % of total stock - 0.2% 0.2% 0.3% 0.4% 0.6% -
In 2019, France is still in third place in the European market for new diesel passenger cars, with 756,000 registrations, behind Germany (1.1 million units), Italy (760,000 units) and ahead of the United Kingdom (583,000 units). Elsewhere in Western Europe, the decline in diesel market share in the new car market accelerated to 30.8% in 2019, -5.4 points compared to 2018 and 31.1% including France.
Diesel market share is around 20 percentage points higher in registrations by "non-individuals" customers than in purchases by individuals. In 2019, the share of diesel among individuals was 22% on average against 44% for non-individuals. These figures are also observed in most Western Europe countries. The diesel engine is now preferred by car owners with significant annual mileage.
59% of the passenger cars in use in France on January 1, 2020 were equipped with a diesel engine. This ratio has fallen by more than 4 points since the high point in 2015. The electrified fleet is emerging but remains low with 214,000 cars on January 1, 2020.
In 2019, registrations of new hybrid passenger cars amounted to 125,435 units, an increase of 17.9% (+28% for plug-in hybrids). Those of new electric passenger cars grew by 37.7% to reach 42,764 units, which consolidates the French market in third place in European markets behind those of Germany and Norway. This growth was driven by the maintenance of the 6,000 euros bonus of for the purchase of an electric vehicle, supplemented by a super bonus in the context of the scrapping of an old vehicle, the two devices being able to go up to 11,000 euros. This aid is also part of the Automotive Sector Strategic Contract signed with
the public authorities and which sets a target of 1 million electrified vehicles and 100,000 charging points by 2022.
At the end of 2019, in France, there were 28,666 charging points in France (AVERE) for a fleet of 141,000 electric cars and 73,000 rechargeable hybrid cars (MTE/SDES).
The electrified vehicle market is also driven by the diversification of the offerings of manufacturers who had to expand their range before the implementation of monitoring of the CO2 targets set at European level and the risk of penalties in the event of non-compliance. French groups have thus invested heavily to develop new electric products in 2019 (DS3 Crossback, Peugeot 208, new Renault Zoe) and to prepare hybrid versions for 2020.
(1) Fleet as of December 31Sources: CCFA, MTE/SDES (Ministry of Ecological Transition)
-39POINTS
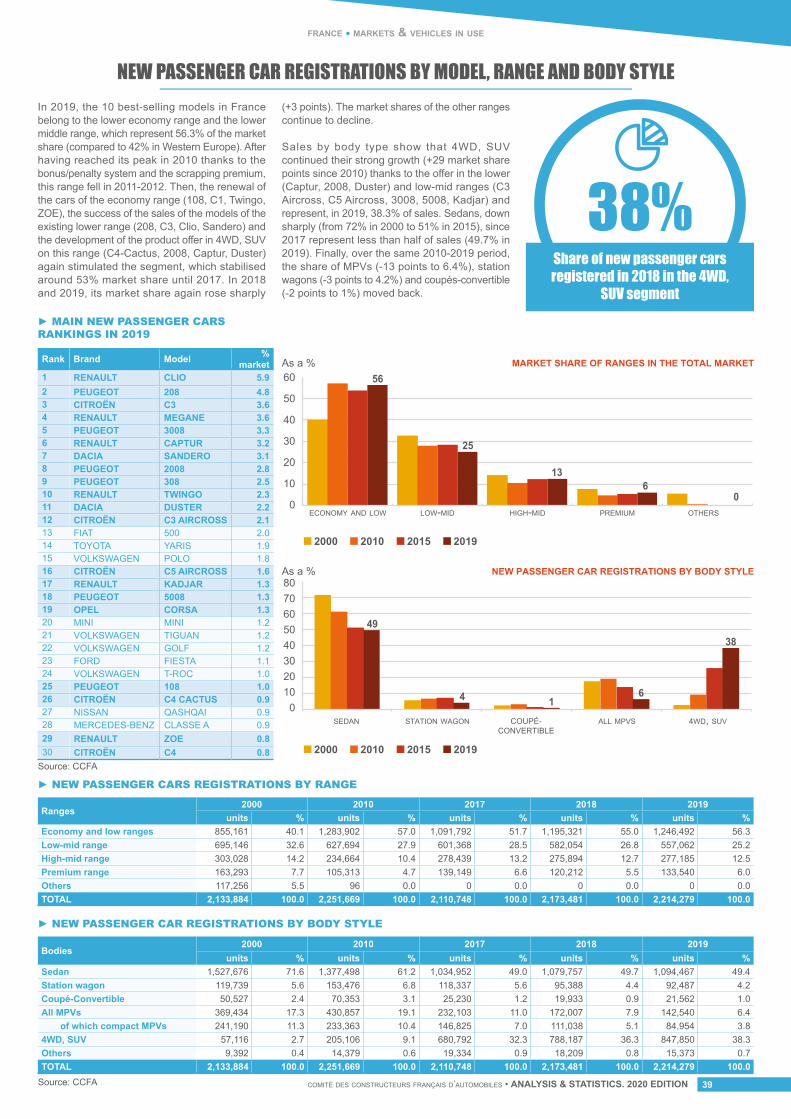
comité des constructeurs français d’automobiles • ANALYSIS & STATISTICS. 2020 EDITION 39
france • markets & vehicles in use
NEW PASSENGER CAR REGISTRATIONS BY MODEL, RANGE AND BODY STYLEIn 2019, the 10 best-selling models in France belong to the lower economy range and the lower middle range, which represent 56.3% of the market share (compared to 42% in Western Europe). After having reached its peak in 2010 thanks to the bonus/penalty system and the scrapping premium, this range fell in 2011-2012. Then, the renewal of the cars of the economy range (108, C1, Twingo, ZOE), the success of the sales of the models of the existing lower range (208, C3, Clio, Sandero) and the development of the product offer in 4WD, SUV on this range (C4-Cactus, 2008, Captur, Duster) again stimulated the segment, which stabilised around 53% market share until 2017. In 2018 and 2019, its market share again rose sharply
(+3 points). The market shares of the other ranges continue to decline.
Sales by body type show that 4WD, SUV continued their strong growth (+29 market share points since 2010) thanks to the offer in the lower (Captur, 2008, Duster) and low-mid ranges (C3 Aircross, C5 Aircross, 3008, 5008, Kadjar) and represent, in 2019, 38.3% of sales. Sedans, down sharply (from 72% in 2000 to 51% in 2015), since 2017 represent less than half of sales (49.7% in 2019). Finally, over the same 2010-2019 period, the share of MPVs (-13 points to 6.4%), station wagons (-3 points to 4.2%) and coupés-convertible (-2 points to 1%) moved back.
38%Share of new passenger cars registered in 2018 in the 4WD,
SUV segment► MAIN NEW PASSENGER CARS RANKINGS IN 2019
► NEW PASSENGER CARS REGISTRATIONS BY RANGE
► NEW PASSENGER CAR REGISTRATIONS BY BODY STYLE
Rank Brand Model %market
1 RENAULT CLIO 5.92 PEUGEOT 208 4.83 CITROËN C3 3.64 RENAULT MEGANE 3.65 PEUGEOT 3008 3.36 RENAULT CAPTUR 3.27 DACIA SANDERO 3.18 PEUGEOT 2008 2.89 PEUGEOT 308 2.510 RENAULT TWINGO 2.311 DACIA DUSTER 2.212 CITROËN C3 AIRCROSS 2.113 FIAT 500 2.014 TOYOTA YARIS 1.915 VOLKSWAGEN POLO 1.816 CITROËN C5 AIRCROSS 1.617 RENAULT KADJAR 1.318 PEUGEOT 5008 1.319 OPEL CORSA 1.320 MINI MINI 1.221 VOLKSWAGEN TIGUAN 1.222 VOLKSWAGEN GOLF 1.223 FORD FIESTA 1.124 VOLKSWAGEN T-ROC 1.025 PEUGEOT 108 1.026 CITROËN C4 CACTUS 0.927 NISSAN QASHQAI 0.928 MERCEDES-BENZ CLASSE A 0.929 RENAULT ZOE 0.830 CITROËN C4 0.8
Ranges2000 2010 2017 2018 2019
units % units % units % units % units %Economy and low ranges 855,161 40.1 1,283,902 57.0 1,091,792 51.7 1,195,321 55.0 1,246,492 56.3Low-mid range 695,146 32.6 627,694 27.9 601,368 28.5 582,054 26.8 557,062 25.2High-mid range 303,028 14.2 234,664 10.4 278,439 13.2 275,894 12.7 277,185 12.5Premium range 163,293 7.7 105,313 4.7 139,149 6.6 120,212 5.5 133,540 6.0Others 117,256 5.5 96 0.0 0 0.0 0 0.0 0 0.0TOTAL 2,133,884 100.0 2,251,669 100.0 2,110,748 100.0 2,173,481 100.0 2,214,279 100.0
Bodies2000 2010 2017 2018 2019
units % units % units % units % units %Sedan 1,527,676 71.6 1,377,498 61.2 1,034,952 49.0 1,079,757 49.7 1,094,467 49.4Station wagon 119,739 5.6 153,476 6.8 118,337 5.6 95,388 4.4 92,487 4.2Coupé-Convertible 50,527 2.4 70,353 3.1 25,230 1.2 19,933 0.9 21,562 1.0All MPVs 369,434 17.3 430,857 19.1 232,103 11.0 172,007 7.9 142,540 6.4
of which compact MPVs 241,190 11.3 233,363 10.4 146,825 7.0 111,038 5.1 84,954 3.84WD, SUV 57,116 2.7 205,106 9.1 680,792 32.3 788,187 36.3 847,850 38.3Others 9,392 0.4 14,379 0.6 19,334 0.9 18,209 0.8 15,373 0.7TOTAL 2,133,884 100.0 2,251,669 100.0 2,110,748 100.0 2,173,481 100.0 2,214,279 100.0
Source: CCFA
Source: CCFA
MARKET SHARE OF RANGES IN THE TOTAL MARKET
0
10
20
30
40
50
60As a %
ECONOMY AND LOW LOW-MID HIGH-MID PREMIUM OTHERS
2000 2010 2015 2019
2000 2010 2015 2019
NEW PASSENGER CAR REGISTRATIONS BY BODY STYLE
01020304050607080As a %
SEDAN STATION WAGON COUPÉ-CONVERTIBLE
ALL MPVS 4WD, SUV
56
25
136
0
49
4 16
38
units
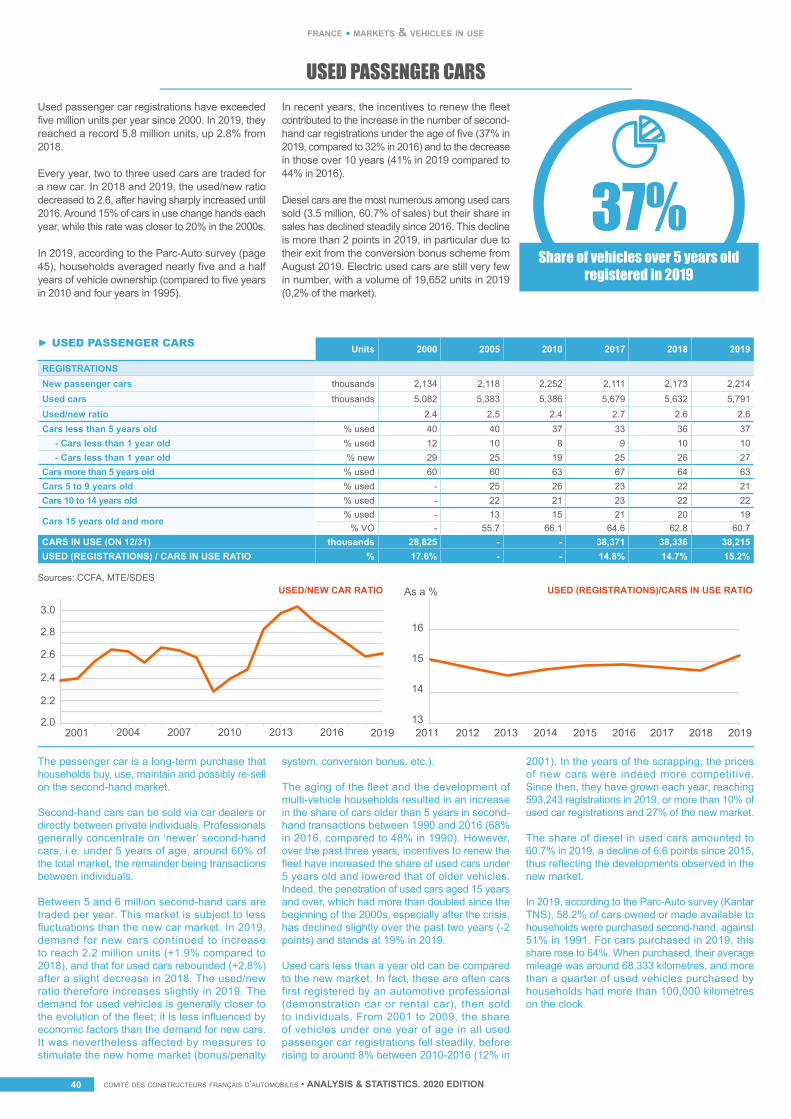
comité des constructeurs français d’automobiles • ANALYSIS & STATISTICS. 2020 EDITIONcomité des constructeurs français d’automobiles • ANALYSIS & STATISTICS. 2020 EDITION40
france • markets & vehicles in use
USED PASSENGER CARSUsed passenger car registrations have exceeded five million units per year since 2000. In 2019, they reached a record 5.8 million units, up 2.8% from 2018.
Every year, two to three used cars are traded for a new car. In 2018 and 2019, the used/new ratio decreased to 2.6, after having sharply increased until 2016. Around 15% of cars in use change hands each year, while this rate was closer to 20% in the 2000s.
In 2019, according to the Parc-Auto survey (page 45), households averaged nearly five and a half years of vehicle ownership (compared to five years in 2010 and four years in 1995).
In recent years, the incentives to renew the fleet contributed to the increase in the number of second-hand car registrations under the age of five (37% in 2019, compared to 32% in 2016) and to the decrease in those over 10 years (41% in 2019 compared to 44% in 2016).
Diesel cars are the most numerous among used cars sold (3.5 million, 60.7% of sales) but their share in sales has declined steadily since 2016. This decline is more than 2 points in 2019, in particular due to their exit from the conversion bonus scheme from August 2019. Electric used cars are still very few in number, with a volume of 19,652 units in 2019 (0,2% of the market).
Source : CCFA
37%Share of vehicles over 5 years old
registered in 2019
The passenger car is a long-term purchase that households buy, use, maintain and possibly re-sell on the second-hand market.
Second-hand cars can be sold via car dealers or directly between private individuals. Professionals generally concentrate on ‘newer’ second-hand cars, i.e. under 5 years of age, around 60% of the total market, the remainder being transactions between individuals.
Between 5 and 6 million second-hand cars are traded per year. This market is subject to less fluctuations than the new car market. In 2019, demand for new cars continued to increase to reach 2.2 million units (+1.9% compared to 2018), and that for used cars rebounded (+2.8%) after a slight decrease in 2018. The used/new ratio therefore increases slightly in 2019. The demand for used vehicles is generally closer to the evolution of the fleet; it is less influenced by economic factors than the demand for new cars. It was nevertheless affected by measures to stimulate the new home market (bonus/penalty
system, conversion bonus, etc.).
The aging of the fleet and the development of multi-vehicle households resulted in an increase in the share of cars older than 5 years in second-hand transactions between 1990 and 2016 (68% in 2016, compared to 48% in 1990). However, over the past three years, incentives to renew the fleet have increased the share of used cars under 5 years old and lowered that of older vehicles. Indeed, the penetration of used cars aged 15 years and over, which had more than doubled since the beginning of the 2000s, especially after the crisis, has declined slightly over the past two years (-2 points) and stands at 19% in 2019.
Used cars less than a year old can be compared to the new market. In fact, these are often cars first registered by an automotive professional (demonstration car or rental car), then sold to individuals. From 2001 to 2009, the share of vehicles under one year of age in all used passenger car registrations fell steadily, before rising to around 8% between 2010-2016 (12% in
2001). In the years of the scrapping, the prices of new cars were indeed more competitive. Since then, they have grown each year, reaching 593,243 registrations in 2019, or more than 10% of used car registrations and 27% of the new market.
The share of diesel in used cars amounted to 60.7% in 2019, a decline of 6.6 points since 2015, thus reflecting the developments observed in the new market.
In 2019, according to the Parc-Auto survey (Kantar TNS), 58.2% of cars owned or made available to households were purchased second-hand, against 51% in 1991. For cars purchased in 2019, this share rose to 64%. When purchased, their average mileage was around 68,333 kilometres, and more than a quarter of used vehicles purchased by households had more than 100,000 kilometres on the clock.
Units 2000 2005 2010 2017 2018 2019
REGISTRATIONSNew passenger cars thousands 2,134 2,118 2,252 2,111 2,173 2,214Used cars thousands 5,082 5,383 5,386 5,679 5,632 5,791Used/new ratio 2.4 2.5 2.4 2.7 2.6 2.6Cars less than 5 years old % used 40 40 37 33 36 37 - Cars less than 1 year old % used 12 10 8 9 10 10 - Cars less than 1 year old % new 29 25 19 25 26 27Cars more than 5 years old % used 60 60 63 67 64 63Cars 5 to 9 years old % used - 25 26 23 22 21Cars 10 to 14 years old % used - 22 21 23 22 22
Cars 15 years old and more% used - 13 15 21 20 19
% VO - 55.7 66.1 64.6 62.8 60.7CARS IN USE (ON 12/31) thousands 28,825 - - 38,371 38,336 38,215USED (REGISTRATIONS) / CARS IN USE RATIO % 17.6% - - 14.8% 14.7% 15.2%
► USED PASSENGER CARS
USED/NEW CAR RATIO
2001 20162013201020072004 2019 2015 2016 201720122011 2013 2014 2018 20192.0
2.2
2.4
2.6
2.8
3.0
USED (REGISTRATIONS)/CARS IN USE RATIO
13
14
15
16
As a %Sources: CCFA, MTE/SDES
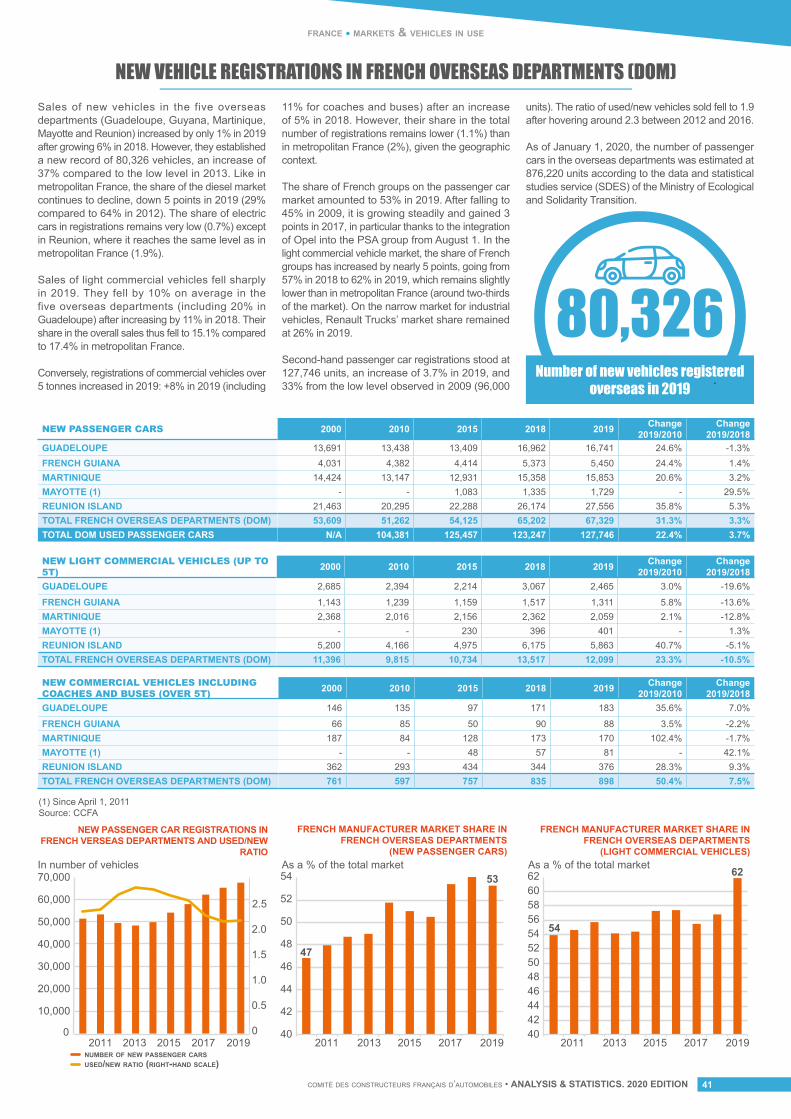
comité des constructeurs français d’automobiles • ANALYSIS & STATISTICS. 2020 EDITION 41
france • markets & vehicles in use
NEW VEHICLE REGISTRATIONS IN FRENCH OVERSEAS DEPARTMENTS (DOM)
(1) Since April 1, 2011Source: CCFA
NEW PASSENGER CARS 2000 2010 2015 2018 2019 Change 2019/2010
Change 2019/2018
GUADELOUPE 13,691 13,438 13,409 16,962 16,741 24.6% -1.3%FRENCH GUIANA 4,031 4,382 4,414 5,373 5,450 24.4% 1.4%MARTINIQUE 14,424 13,147 12,931 15,358 15,853 20.6% 3.2%MAYOTTE (1) - - 1,083 1,335 1,729 - 29.5%REUNION ISLAND 21,463 20,295 22,288 26,174 27,556 35.8% 5.3%TOTAL FRENCH OVERSEAS DEPARTMENTS (DOM) 53,609 51,262 54,125 65,202 67,329 31.3% 3.3%TOTAL DOM USED PASSENGER CARS N/A 104,381 125,457 123,247 127,746 22.4% 3.7%
NEW LIGHT COMMERCIAL VEHICLES (UP TO 5T) 2000 2010 2015 2018 2019 Change
2019/2010Change
2019/2018GUADELOUPE 2,685 2,394 2,214 3,067 2,465 3.0% -19.6%
FRENCH GUIANA 1,143 1,239 1,159 1,517 1,311 5.8% -13.6%MARTINIQUE 2,368 2,016 2,156 2,362 2,059 2.1% -12.8%MAYOTTE (1) - - 230 396 401 - 1.3%REUNION ISLAND 5,200 4,166 4,975 6,175 5,863 40.7% -5.1%TOTAL FRENCH OVERSEAS DEPARTMENTS (DOM) 11,396 9,815 10,734 13,517 12,099 23.3% -10.5%
NEW COMMERCIAL VEHICLES INCLUDING COACHES AND BUSES (OVER 5T) 2000 2010 2015 2018 2019 Change
2019/2010Change
2019/2018GUADELOUPE 146 135 97 171 183 35.6% 7.0%
FRENCH GUIANA 66 85 50 90 88 3.5% -2.2%MARTINIQUE 187 84 128 173 170 102.4% -1.7%MAYOTTE (1) - - 48 57 81 - 42.1%REUNION ISLAND 362 293 434 344 376 28.3% 9.3%TOTAL FRENCH OVERSEAS DEPARTMENTS (DOM) 761 597 757 835 898 50.4% 7.5%
80,326Number of new vehicles registered
overseas in 2019
NEW PASSENGER CAR REGISTRATIONS INFRENCH VERSEAS DEPARTMENTS AND USED/NEW
RATIO
0
10,000
20,000
30,000
40,000
50,000
60,000
70,000
2011 2013 2015 2017 2019 2011 2013 2015 2017 2019 2011 2013 2015 2017 2019
In number of vehicles
FRENCH MANUFACTURER MARKET SHARE INFRENCH OVERSEAS DEPARTMENTS
(NEW PASSENGER CARS)As a % of the total market As a % of the total market
42
40
44
46
48
50
52
54
4240
44464850525456586062
FRENCH MANUFACTURER MARKET SHARE INFRENCH OVERSEAS DEPARTMENTS
(LIGHT COMMERCIAL VEHICLES)
NUMBER OF NEW PASSENGER CARSUSED/NEW RATIO (RIGHT-HAND SCALE)
0
0.5
1.0
1.5
2.0
2.5
53
54
62
47
Sales of new vehicles in the five overseas departments (Guadeloupe, Guyana, Martinique, Mayotte and Reunion) increased by only 1% in 2019 after growing 6% in 2018. However, they established a new record of 80,326 vehicles, an increase of 37% compared to the low level in 2013. Like in metropolitan France, the share of the diesel market continues to decline, down 5 points in 2019 (29% compared to 64% in 2012). The share of electric cars in registrations remains very low (0.7%) except in Reunion, where it reaches the same level as in metropolitan France (1.9%).
Sales of light commercial vehicles fell sharply in 2019. They fell by 10% on average in the five overseas departments (including 20% in Guadeloupe) after increasing by 11% in 2018. Their share in the overall sales thus fell to 15.1% compared to 17.4% in metropolitan France.
Conversely, registrations of commercial vehicles over 5 tonnes increased in 2019: +8% in 2019 (including
11% for coaches and buses) after an increase of 5% in 2018. However, their share in the total number of registrations remains lower (1.1%) than in metropolitan France (2%), given the geographic context.
The share of French groups on the passenger car market amounted to 53% in 2019. After falling to 45% in 2009, it is growing steadily and gained 3 points in 2017, in particular thanks to the integration of Opel into the PSA group from August 1. In the light commercial vehicle market, the share of French groups has increased by nearly 5 points, going from 57% in 2018 to 62% in 2019, which remains slightly lower than in metropolitan France (around two-thirds of the market). On the narrow market for industrial vehicles, Renault Trucks’ market share remained at 26% in 2019.
Second-hand passenger car registrations stood at 127,746 units, an increase of 3.7% in 2019, and 33% from the low level observed in 2009 (96,000
units). The ratio of used/new vehicles sold fell to 1.9 after hovering around 2.3 between 2012 and 2016.
As of January 1, 2020, the number of passenger cars in the overseas departments was estimated at 876,220 units according to the data and statistical studies service (SDES) of the Ministry of Ecological and Solidarity Transition.
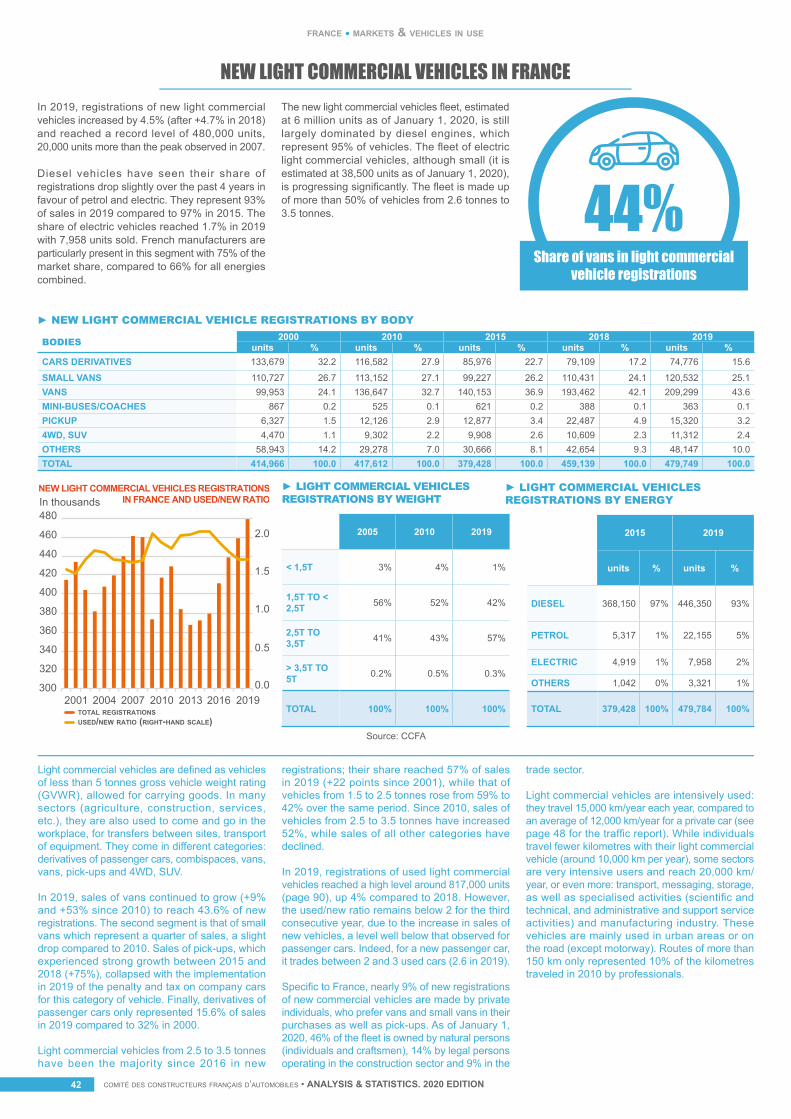
comité des constructeurs français d’automobiles • ANALYSIS & STATISTICS. 2020 EDITIONcomité des constructeurs français d’automobiles • ANALYSIS & STATISTICS. 2020 EDITION42
france • markets & vehicles in use
NEW LIGHT COMMERCIAL VEHICLES IN FRANCEIn 2019, registrations of new light commercial vehicles increased by 4.5% (after +4.7% in 2018) and reached a record level of 480,000 units, 20,000 units more than the peak observed in 2007.
Diesel vehicles have seen their share of registrations drop slightly over the past 4 years in favour of petrol and electric. They represent 93% of sales in 2019 compared to 97% in 2015. The share of electric vehicles reached 1.7% in 2019 with 7,958 units sold. French manufacturers are particularly present in this segment with 75% of the market share, compared to 66% for all energies combined.
The new light commercial vehicles fleet, estimated at 6 million units as of January 1, 2020, is still largely dominated by diesel engines, which represent 95% of vehicles. The fleet of electric light commercial vehicles, although small (it is estimated at 38,500 units as of January 1, 2020), is progressing significantly. The fleet is made up of more than 50% of vehicles from 2.6 tonnes to 3.5 tonnes.
Share of vans in light commercial vehicle registrations
Light commercial vehicles are defined as vehicles of less than 5 tonnes gross vehicle weight rating (GVWR), allowed for carrying goods. In many sectors (agriculture, construction, services, etc.), they are also used to come and go in the workplace, for transfers between sites, transport of equipment. They come in different categories: derivatives of passenger cars, combispaces, vans, vans, pick-ups and 4WD, SUV.
In 2019, sales of vans continued to grow (+9% and +53% since 2010) to reach 43.6% of new registrations. The second segment is that of small vans which represent a quarter of sales, a slight drop compared to 2010. Sales of pick-ups, which experienced strong growth between 2015 and 2018 (+75%), collapsed with the implementation in 2019 of the penalty and tax on company cars for this category of vehicle. Finally, derivatives of passenger cars only represented 15.6% of sales in 2019 compared to 32% in 2000.
Light commercial vehicles from 2.5 to 3.5 tonnes have been the majority since 2016 in new
registrations; their share reached 57% of sales in 2019 (+22 points since 2001), while that of vehicles from 1.5 to 2.5 tonnes rose from 59% to 42% over the same period. Since 2010, sales of vehicles from 2.5 to 3.5 tonnes have increased 52%, while sales of all other categories have declined.
In 2019, registrations of used light commercial vehicles reached a high level around 817,000 units (page 90), up 4% compared to 2018. However, the used/new ratio remains below 2 for the third consecutive year, due to the increase in sales of new vehicles, a level well below that observed for passenger cars. Indeed, for a new passenger car, it trades between 2 and 3 used cars (2.6 in 2019).
Specific to France, nearly 9% of new registrations of new commercial vehicles are made by private individuals, who prefer vans and small vans in their purchases as well as pick-ups. As of January 1, 2020, 46% of the fleet is owned by natural persons (individuals and craftsmen), 14% by legal persons operating in the construction sector and 9% in the
trade sector.
Light commercial vehicles are intensively used: they travel 15,000 km/year each year, compared to an average of 12,000 km/year for a private car (see page 48 for the traffic report). While individuals travel fewer kilometres with their light commercial vehicle (around 10,000 km per year), some sectors are very intensive users and reach 20,000 km/year, or even more: transport, messaging, storage, as well as specialised activities (scientific and technical, and administrative and support service activities) and manufacturing industry. These vehicles are mainly used in urban areas or on the road (except motorway). Routes of more than 150 km only represented 10% of the kilometres traveled in 2010 by professionals.
44%
BODIES 2000 2010 2015 2018 2019units % units % units % units % units %
CARS DERIVATIVES 133,679 32.2 116,582 27.9 85,976 22.7 79,109 17.2 74,776 15.6
SMALL VANS 110,727 26.7 113,152 27.1 99,227 26.2 110,431 24.1 120,532 25.1VANS 99,953 24.1 136,647 32.7 140,153 36.9 193,462 42.1 209,299 43.6MINI-BUSES/COACHES 867 0.2 525 0.1 621 0.2 388 0.1 363 0.1PICKUP 6,327 1.5 12,126 2.9 12,877 3.4 22,487 4.9 15,320 3.24WD, SUV 4,470 1.1 9,302 2.2 9,908 2.6 10,609 2.3 11,312 2.4OTHERS 58,943 14.2 29,278 7.0 30,666 8.1 42,654 9.3 48,147 10.0TOTAL 414,966 100.0 417,612 100.0 379,428 100.0 459,139 100.0 479,749 100.0
2015 2019
units % units %
DIESEL 368,150 97% 446,350 93%
PETROL 5,317 1% 22,155 5%
ELECTRIC 4,919 1% 7,958 2%
OTHERS 1,042 0% 3,321 1%
TOTAL 379,428 100% 479,784 100%
2005 2010 2019
< 1,5T 3% 4% 1%
1,5T TO < 2,5T 56% 52% 42%
2,5T TO 3,5T 41% 43% 57%
> 3,5T TO 5T 0.2% 0.5% 0.3%
TOTAL 100% 100% 100%
► NEW LIGHT COMMERCIAL VEHICLE REGISTRATIONS BY BODY
► LIGHT COMMERCIAL VEHICLES REGISTRATIONS BY ENERGY
► LIGHT COMMERCIAL VEHICLES REGISTRATIONS BY WEIGHT
Source: CCFA
NEW LIGHT COMMERCIAL VEHICLES REGISTRATIONSIN FRANCE AND USED/NEW RATIOIn thousands
340
320
300
360
380
400
420
440
460
480
0.0
0.5
1.0
1.5
2.0
2019201620132010200720042001TOTAL REGISTRATIONSUSED/NEW RATIO (RIGHT-HAND SCALE)
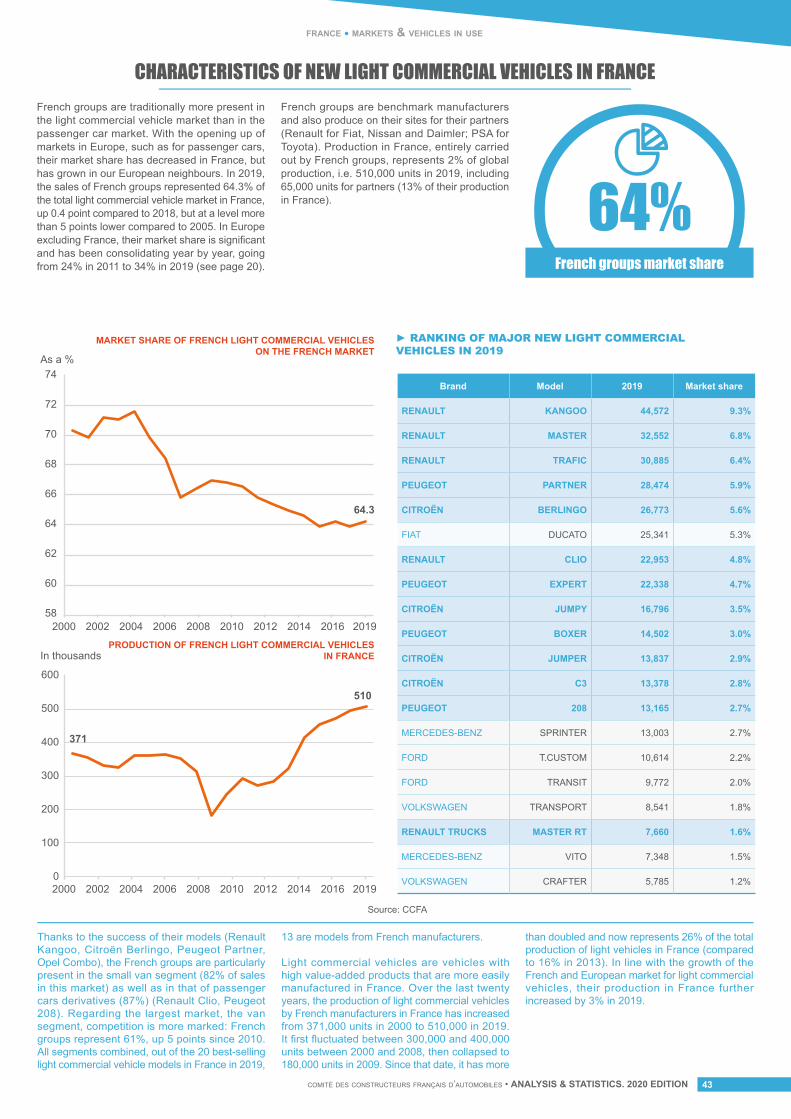
comité des constructeurs français d’automobiles • ANALYSIS & STATISTICS. 2020 EDITION 43
Brand Model 2019 Market share
RENAULT KANGOO 44,572 9.3%
RENAULT MASTER 32,552 6.8%
RENAULT TRAFIC 30,885 6.4%
PEUGEOT PARTNER 28,474 5.9%
CITROËN BERLINGO 26,773 5.6%
FIAT DUCATO 25,341 5.3%
RENAULT CLIO 22,953 4.8%
PEUGEOT EXPERT 22,338 4.7%
CITROËN JUMPY 16,796 3.5%
PEUGEOT BOXER 14,502 3.0%
CITROËN JUMPER 13,837 2.9%
CITROËN C3 13,378 2.8%
PEUGEOT 208 13,165 2.7%
MERCEDES-BENZ SPRINTER 13,003 2.7%
FORD T.CUSTOM 10,614 2.2%
FORD TRANSIT 9,772 2.0%
VOLKSWAGEN TRANSPORT 8,541 1.8%
RENAULT TRUCKS MASTER RT 7,660 1.6%
MERCEDES-BENZ VITO 7,348 1.5%
VOLKSWAGEN CRAFTER 5,785 1.2%
► RANKING OF MAJOR NEW LIGHT COMMERCIAL VEHICLES IN 2019
CHARACTERISTICS OF NEW LIGHT COMMERCIAL VEHICLES IN FRANCEFrench groups are traditionally more present in the light commercial vehicle market than in the passenger car market. With the opening up of markets in Europe, such as for passenger cars, their market share has decreased in France, but has grown in our European neighbours. In 2019, the sales of French groups represented 64.3% of the total light commercial vehicle market in France, up 0.4 point compared to 2018, but at a level more than 5 points lower compared to 2005. In Europe excluding France, their market share is significant and has been consolidating year by year, going from 24% in 2011 to 34% in 2019 (see page 20).
French groups are benchmark manufacturers and also produce on their sites for their partners (Renault for Fiat, Nissan and Daimler; PSA for Toyota). Production in France, entirely carried out by French groups, represents 2% of global production, i.e. 510,000 units in 2019, including 65,000 units for partners (13% of their production in France).
Thanks to the success of their models (Renault Kangoo, Citroën Berlingo, Peugeot Partner, Opel Combo), the French groups are particularly present in the small van segment (82% of sales in this market) as well as in that of passenger cars derivatives (87%) (Renault Clio, Peugeot 208). Regarding the largest market, the van segment, competition is more marked: French groups represent 61%, up 5 points since 2010. All segments combined, out of the 20 best-selling light commercial vehicle models in France in 2019,
13 are models from French manufacturers.
Light commercial vehicles are vehicles with high value-added products that are more easily manufactured in France. Over the last twenty years, the production of light commercial vehicles by French manufacturers in France has increased from 371,000 units in 2000 to 510,000 in 2019. It first fluctuated between 300,000 and 400,000 units between 2000 and 2008, then collapsed to 180,000 units in 2009. Since that date, it has more
than doubled and now represents 26% of the total production of light vehicles in France (compared to 16% in 2013). In line with the growth of the French and European market for light commercial vehicles, their production in France further increased by 3% in 2019.
64%French groups market share
france • markets & vehicles in use
Source: CCFA
MARKET SHARE OF FRENCH LIGHT COMMERCIAL VEHICLESON THE FRENCH MARKET
PRODUCTION OF FRENCH LIGHT COMMERCIAL VEHICLESIN FRANCE
2006200420022000 2008 2010 2012 2014 2016 2019
2006200420022000 2008 2010 2012 2014 2016 2019
58
60
62
64.3
510
66
68
64
0
100
200
300
400
500
600
70
72
74 As a %
In thousands
Source: CCFA
371
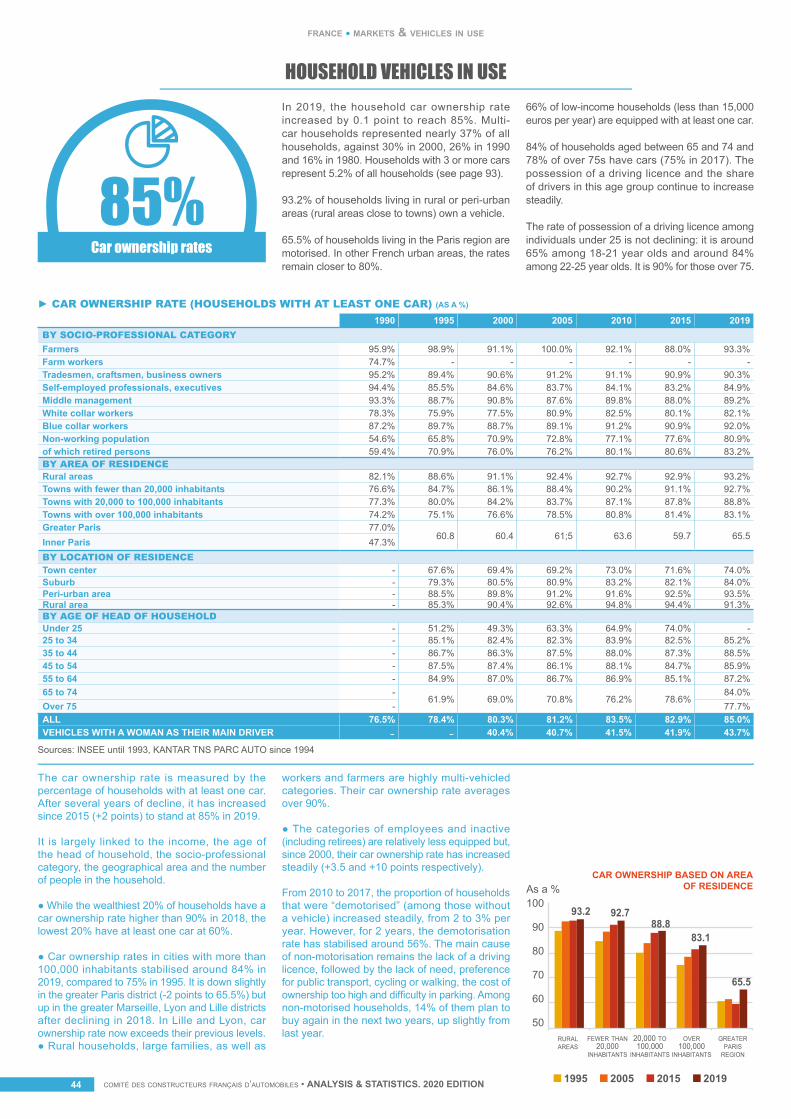
comité des constructeurs français d’automobiles • ANALYSIS & STATISTICS. 2020 EDITIONcomité des constructeurs français d’automobiles • ANALYSIS & STATISTICS. 2020 EDITION44
france • markets & vehicles in use
HOUSEHOLD VEHICLES IN USEIn 2019, the household car ownership rate increased by 0.1 point to reach 85%. Multi-car households represented nearly 37% of all households, against 30% in 2000, 26% in 1990 and 16% in 1980. Households with 3 or more cars represent 5.2% of all households (see page 93).
93.2% of households living in rural or peri-urban areas (rural areas close to towns) own a vehicle.
65.5% of households living in the Paris region are motorised. In other French urban areas, the rates remain closer to 80%.
66% of low-income households (less than 15,000 euros per year) are equipped with at least one car.
84% of households aged between 65 and 74 and 78% of over 75s have cars (75% in 2017). The possession of a driving licence and the share of drivers in this age group continue to increase steadily.
The rate of possession of a driving licence among individuals under 25 is not declining: it is around 65% among 18-21 year olds and around 84% among 22-25 year olds. It is 90% for those over 75.
Car ownership rates
The car ownership rate is measured by the percentage of households with at least one car. After several years of decline, it has increased since 2015 (+2 points) to stand at 85% in 2019.
It is largely linked to the income, the age of the head of household, the socio-professional category, the geographical area and the number of people in the household.
● While the wealthiest 20% of households have a car ownership rate higher than 90% in 2018, the lowest 20% have at least one car at 60%.
● Car ownership rates in cities with more than 100,000 inhabitants stabilised around 84% in 2019, compared to 75% in 1995. It is down slightly in the greater Paris district (-2 points to 65.5%) but up in the greater Marseille, Lyon and Lille districts after declining in 2018. In Lille and Lyon, car ownership rate now exceeds their previous levels. ● Rural households, large families, as well as
workers and farmers are highly multi-vehicled categories. Their car ownership rate averages over 90%.
● The categories of employees and inactive (including retirees) are relatively less equipped but, since 2000, their car ownership rate has increased steadily (+3.5 and +10 points respectively).
From 2010 to 2017, the proportion of households that were “demotorised” (among those without a vehicle) increased steadily, from 2 to 3% per year. However, for 2 years, the demotorisation rate has stabilised around 56%. The main cause of non-motorisation remains the lack of a driving licence, followed by the lack of need, preference for public transport, cycling or walking, the cost of ownership too high and difficulty in parking. Among non-motorised households, 14% of them plan to buy again in the next two years, up slightly from last year.
1990 1995 2000 2005 2010 2015 2019BY SOCIO-PROFESSIONAL CATEGORYFarmers 95.9% 98.9% 91.1% 100.0% 92.1% 88.0% 93.3%Farm workers 74.7% - - - - - -Tradesmen, craftsmen, business owners 95.2% 89.4% 90.6% 91.2% 91.1% 90.9% 90.3%Self-employed professionals, executives 94.4% 85.5% 84.6% 83.7% 84.1% 83.2% 84.9%Middle management 93.3% 88.7% 90.8% 87.6% 89.8% 88.0% 89.2%White collar workers 78.3% 75.9% 77.5% 80.9% 82.5% 80.1% 82.1%Blue collar workers 87.2% 89.7% 88.7% 89.1% 91.2% 90.9% 92.0%Non-working population 54.6% 65.8% 70.9% 72.8% 77.1% 77.6% 80.9%of which retired persons 59.4% 70.9% 76.0% 76.2% 80.1% 80.6% 83.2%BY AREA OF RESIDENCERural areas 82.1% 88.6% 91.1% 92.4% 92.7% 92.9% 93.2%Towns with fewer than 20,000 inhabitants 76.6% 84.7% 86.1% 88.4% 90.2% 91.1% 92.7%Towns with 20,000 to 100,000 inhabitants 77.3% 80.0% 84.2% 83.7% 87.1% 87.8% 88.8%Towns with over 100,000 inhabitants 74.2% 75.1% 76.6% 78.5% 80.8% 81.4% 83.1%Greater Paris 77.0%
60.8 60.4 61;5 63.6 59.7 65.5Inner Paris 47.3%BY LOCATION OF RESIDENCETown center - 67.6% 69.4% 69.2% 73.0% 71.6% 74.0%Suburb - 79.3% 80.5% 80.9% 83.2% 82.1% 84.0%Peri-urban area - 88.5% 89.8% 91.2% 91.6% 92.5% 93.5%Rural area - 85.3% 90.4% 92.6% 94.8% 94.4% 91.3%BY AGE OF HEAD OF HOUSEHOLDUnder 25 - 51.2% 49.3% 63.3% 64.9% 74.0% -25 to 34 - 85.1% 82.4% 82.3% 83.9% 82.5% 85.2%35 to 44 - 86.7% 86.3% 87.5% 88.0% 87.3% 88.5%45 to 54 - 87.5% 87.4% 86.1% 88.1% 84.7% 85.9%55 to 64 - 84.9% 87.0% 86.7% 86.9% 85.1% 87.2%65 to 74 -
61.9% 69.0% 70.8% 76.2% 78.6%84.0%
Over 75 - 77.7%ALL 76.5% 78.4% 80.3% 81.2% 83.5% 82.9% 85.0%VEHICLES WITH A WOMAN AS THEIR MAIN DRIVER - - 40.4% 40.7% 41.5% 41.9% 43.7%
► CAR OWNERSHIP RATE (HOUSEHOLDS WITH AT LEAST ONE CAR) (AS A %)
Sources: INSEE until 1993, KANTAR TNS PARC AUTO since 1994
CAR OWNERSHIP BASED ON AREAOF RESIDENCEAs a %
50
60
70
80
90
100
RURALAREAS
FEWER THAN20,000
INHABITANTS
20,000 TO100,000
INHABITANTS
OVER100,000
INHABITANTS
GREATERPARIS
REGION
93.2 92.788.8
83.1
65.5
1995 2005 2015 2019
85%
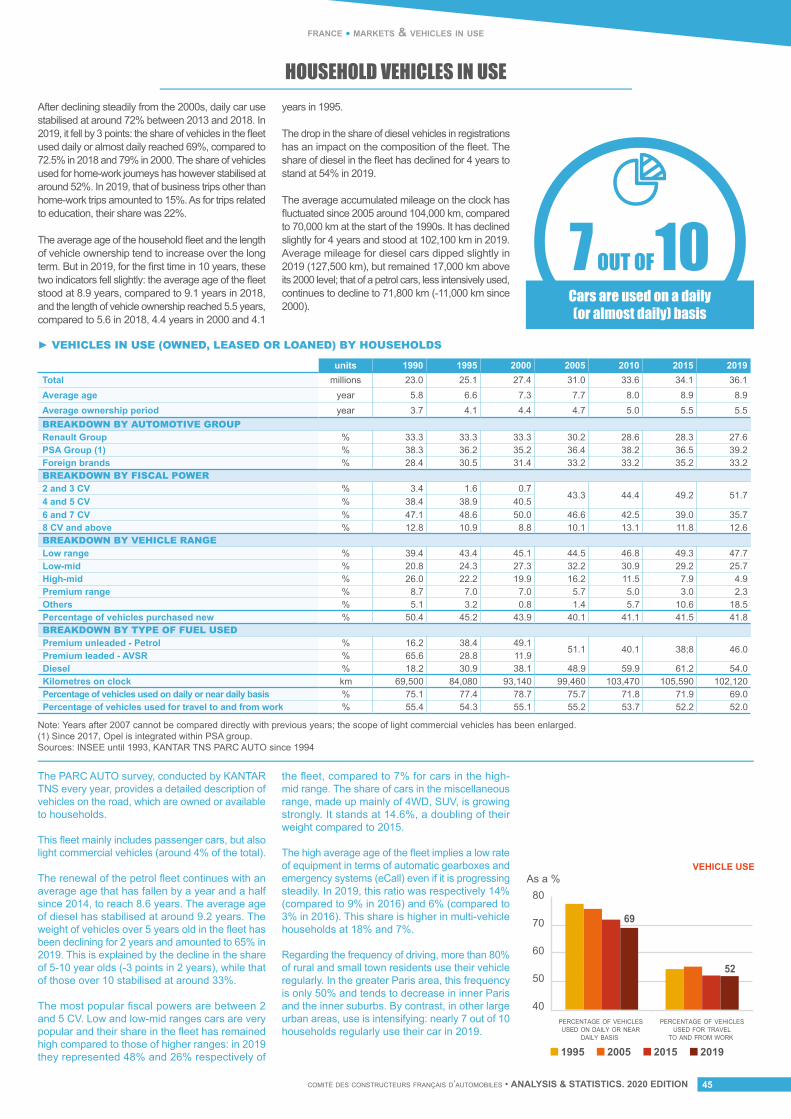
comité des constructeurs français d’automobiles • ANALYSIS & STATISTICS. 2020 EDITION 45
france • markets & vehicles in use
HOUSEHOLD VEHICLES IN USE
The PARC AUTO survey, conducted by KANTAR TNS every year, provides a detailed description of vehicles on the road, which are owned or available to households.
This fleet mainly includes passenger cars, but also light commercial vehicles (around 4% of the total).
The renewal of the petrol fleet continues with an average age that has fallen by a year and a half since 2014, to reach 8.6 years. The average age of diesel has stabilised at around 9.2 years. The weight of vehicles over 5 years old in the fleet has been declining for 2 years and amounted to 65% in 2019. This is explained by the decline in the share of 5-10 year olds (-3 points in 2 years), while that of those over 10 stabilised at around 33%.
The most popular fiscal powers are between 2 and 5 CV. Low and low-mid ranges cars are very popular and their share in the fleet has remained high compared to those of higher ranges: in 2019 they represented 48% and 26% respectively of
the fleet, compared to 7% for cars in the high-mid range. The share of cars in the miscellaneous range, made up mainly of 4WD, SUV, is growing strongly. It stands at 14.6%, a doubling of their weight compared to 2015.
The high average age of the fleet implies a low rate of equipment in terms of automatic gearboxes and emergency systems (eCall) even if it is progressing steadily. In 2019, this ratio was respectively 14% (compared to 9% in 2016) and 6% (compared to 3% in 2016). This share is higher in multi-vehicle households at 18% and 7%.
Regarding the frequency of driving, more than 80% of rural and small town residents use their vehicle regularly. In the greater Paris area, this frequency is only 50% and tends to decrease in inner Paris and the inner suburbs. By contrast, in other large urban areas, use is intensifying: nearly 7 out of 10 households regularly use their car in 2019.
units 1990 1995 2000 2005 2010 2015 2019Total millions 23.0 25.1 27.4 31.0 33.6 34.1 36.1Average age year 5.8 6.6 7.3 7.7 8.0 8.9 8.9Average ownership period year 3.7 4.1 4.4 4.7 5.0 5.5 5.5BREAKDOWN BY AUTOMOTIVE GROUPRenault Group % 33.3 33.3 33.3 30.2 28.6 28.3 27.6PSA Group (1) % 38.3 36.2 35.2 36.4 38.2 36.5 39.2Foreign brands % 28.4 30.5 31.4 33.2 33.2 35.2 33.2BREAKDOWN BY FISCAL POWER2 and 3 CV % 3.4 1.6 0.7
43.3 44.4 49.2 51.74 and 5 CV % 38.4 38.9 40.56 and 7 CV % 47.1 48.6 50.0 46.6 42.5 39.0 35.78 CV and above % 12.8 10.9 8.8 10.1 13.1 11.8 12.6BREAKDOWN BY VEHICLE RANGELow range % 39.4 43.4 45.1 44.5 46.8 49.3 47.7Low-mid % 20.8 24.3 27.3 32.2 30.9 29.2 25.7High-mid % 26.0 22.2 19.9 16.2 11.5 7.9 4.9Premium range % 8.7 7.0 7.0 5.7 5.0 3.0 2.3Others % 5.1 3.2 0.8 1.4 5.7 10.6 18.5Percentage of vehicles purchased new % 50.4 45.2 43.9 40.1 41.1 41.5 41.8BREAKDOWN BY TYPE OF FUEL USEDPremium unleaded - Petrol % 16.2 38.4 49.1
51.1 40.1 38;8 46.0Premium leaded - AVSR % 65.6 28.8 11.9Diesel % 18.2 30.9 38.1 48.9 59.9 61.2 54.0Kilometres on clock km 69,500 84,080 93,140 99,460 103,470 105,590 102,120Percentage of vehicles used on daily or near daily basis % 75.1 77.4 78.7 75.7 71.8 71.9 69.0Percentage of vehicles used for travel to and from work % 55.4 54.3 55.1 55.2 53.7 52.2 52.0
► VEHICLES IN USE (OWNED, LEASED OR LOANED) BY HOUSEHOLDS
Note: Years after 2007 cannot be compared directly with previous years; the scope of light commercial vehicles has been enlarged.(1) Since 2017, Opel is integrated within PSA group.Sources: INSEE until 1993, KANTAR TNS PARC AUTO since 1994
7 10OUT OFCars are used on a daily (or almost daily) basis
As a %
40
50
60
70
80
PERCENTAGE OF VEHICLESUSED ON DAILY OR NEAR
DAILY BASIS
PERCENTAGE OF VEHICLESUSED FOR TRAVEL
TO AND FROM WORK
VEHICLE USE
69
52
1995 2005 2015 2019
After declining steadily from the 2000s, daily car use stabilised at around 72% between 2013 and 2018. In 2019, it fell by 3 points: the share of vehicles in the fleet used daily or almost daily reached 69%, compared to 72.5% in 2018 and 79% in 2000. The share of vehicles used for home-work journeys has however stabilised at around 52%. In 2019, that of business trips other than home-work trips amounted to 15%. As for trips related to education, their share was 22%.
The average age of the household fleet and the length of vehicle ownership tend to increase over the long term. But in 2019, for the first time in 10 years, these two indicators fell slightly: the average age of the fleet stood at 8.9 years, compared to 9.1 years in 2018, and the length of vehicle ownership reached 5.5 years, compared to 5.6 in 2018, 4.4 years in 2000 and 4.1
years in 1995.
The drop in the share of diesel vehicles in registrations has an impact on the composition of the fleet. The share of diesel in the fleet has declined for 4 years to stand at 54% in 2019.
The average accumulated mileage on the clock has fluctuated since 2005 around 104,000 km, compared to 70,000 km at the start of the 1990s. It has declined slightly for 4 years and stood at 102,100 km in 2019. Average mileage for diesel cars dipped slightly in 2019 (127,500 km), but remained 17,000 km above its 2000 level; that of a petrol cars, less intensively used, continues to decline to 71,800 km (-11,000 km since 2000).
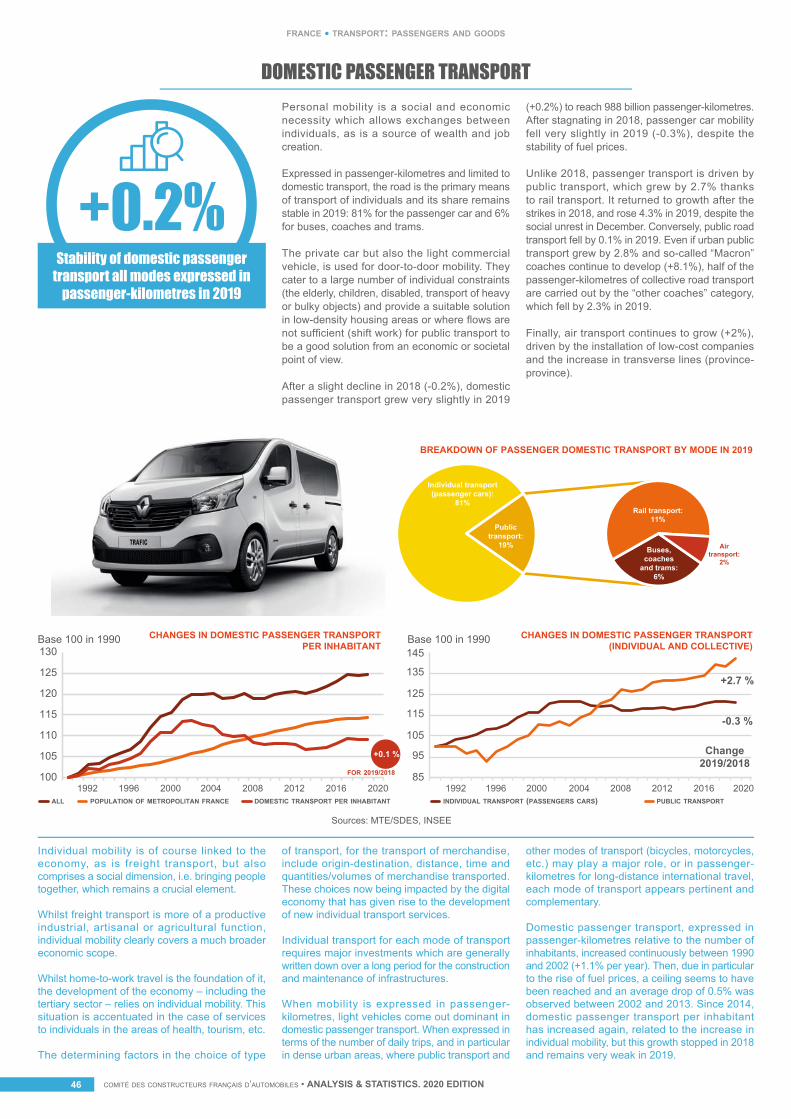
comité des constructeurs français d’automobiles • ANALYSIS & STATISTICS. 2020 EDITIONcomité des constructeurs français d’automobiles • ANALYSIS & STATISTICS. 2020 EDITION46
france • transport: passengers and goods
DOMESTIC PASSENGER TRANSPORTPersonal mobility is a social and economic necessity which allows exchanges between individuals, as is a source of wealth and job creation.
Expressed in passenger-kilometres and limited to domestic transport, the road is the primary means of transport of individuals and its share remains stable in 2019: 81% for the passenger car and 6% for buses, coaches and trams.
The private car but also the light commercial vehicle, is used for door-to-door mobility. They cater to a large number of individual constraints (the elderly, children, disabled, transport of heavy or bulky objects) and provide a suitable solution in low-density housing areas or where flows are not sufficient (shift work) for public transport to be a good solution from an economic or societal point of view.
After a slight decline in 2018 (-0.2%), domestic passenger transport grew very slightly in 2019
(+0.2%) to reach 988 billion passenger-kilometres. After stagnating in 2018, passenger car mobility fell very slightly in 2019 (-0.3%), despite the stability of fuel prices.
Unlike 2018, passenger transport is driven by public transport, which grew by 2.7% thanks to rail transport. It returned to growth after the strikes in 2018, and rose 4.3% in 2019, despite the social unrest in December. Conversely, public road transport fell by 0.1% in 2019. Even if urban public transport grew by 2.8% and so-called “Macron” coaches continue to develop (+8.1%), half of the passenger-kilometres of collective road transport are carried out by the “other coaches” category, which fell by 2.3% in 2019.
Finally, air transport continues to grow (+2%), driven by the installation of low-cost companies and the increase in transverse lines (province-province).
+0.2%Stability of domestic passenger
transport all modes expressed in passenger-kilometres in 2019
Individual mobility is of course linked to the economy, as is freight transport, but also comprises a social dimension, i.e. bringing people together, which remains a crucial element.
Whilst freight transport is more of a productive industrial, artisanal or agricultural function, individual mobility clearly covers a much broader economic scope.
Whilst home-to-work travel is the foundation of it, the development of the economy – including the tertiary sector – relies on individual mobility. This situation is accentuated in the case of services to individuals in the areas of health, tourism, etc.
The determining factors in the choice of type
of transport, for the transport of merchandise, include origin-destination, distance, time and quantities/volumes of merchandise transported. These choices now being impacted by the digital economy that has given rise to the development of new individual transport services.
Individual transport for each mode of transport requires major investments which are generally written down over a long period for the construction and maintenance of infrastructures.
When mobility is expressed in passenger-kilometres, light vehicles come out dominant in domestic passenger transport. When expressed in terms of the number of daily trips, and in particular in dense urban areas, where public transport and
other modes of transport (bicycles, motorcycles, etc.) may play a major role, or in passenger-kilometres for long-distance international travel, each mode of transport appears pertinent and complementary.
Domestic passenger transport, expressed in passenger-kilometres relative to the number of inhabitants, increased continuously between 1990 and 2002 (+1.1% per year). Then, due in particular to the rise of fuel prices, a ceiling seems to have been reached and an average drop of 0.5% was observed between 2002 and 2013. Since 2014, domestic passenger transport per inhabitant has increased again, related to the increase in individual mobility, but this growth stopped in 2018 and remains very weak in 2019.
Sources: MTE/SDES, INSEE
CHANGES IN DOMESTIC PASSENGER TRANSPORTPER INHABITANT
CHANGES IN DOMESTIC PASSENGER TRANSPORT(INDIVIDUAL AND COLLECTIVE)
BREAKDOWN OF PASSENGER DOMESTIC TRANSPORT BY MODE IN 2019
100
105
110
115
125
120
130 Base 100 in 1990 Base 100 in 1990
1996 1992 20042000 2008 2012 2016 2020 1996 1992 20042000 2008 2012 2016 2020ALL POPULATION OF METROPOLITAN FRANCE DOMESTIC TRANSPORT PER INHABITANT INDIVIDUAL TRANSPORT (PASSENGERS CARS) PUBLIC TRANSPORT
85
95
105
115
125
135
145
-0.3 %
Change2019/2018
+2.7 %
+0.1 %
FOR 2019/2018
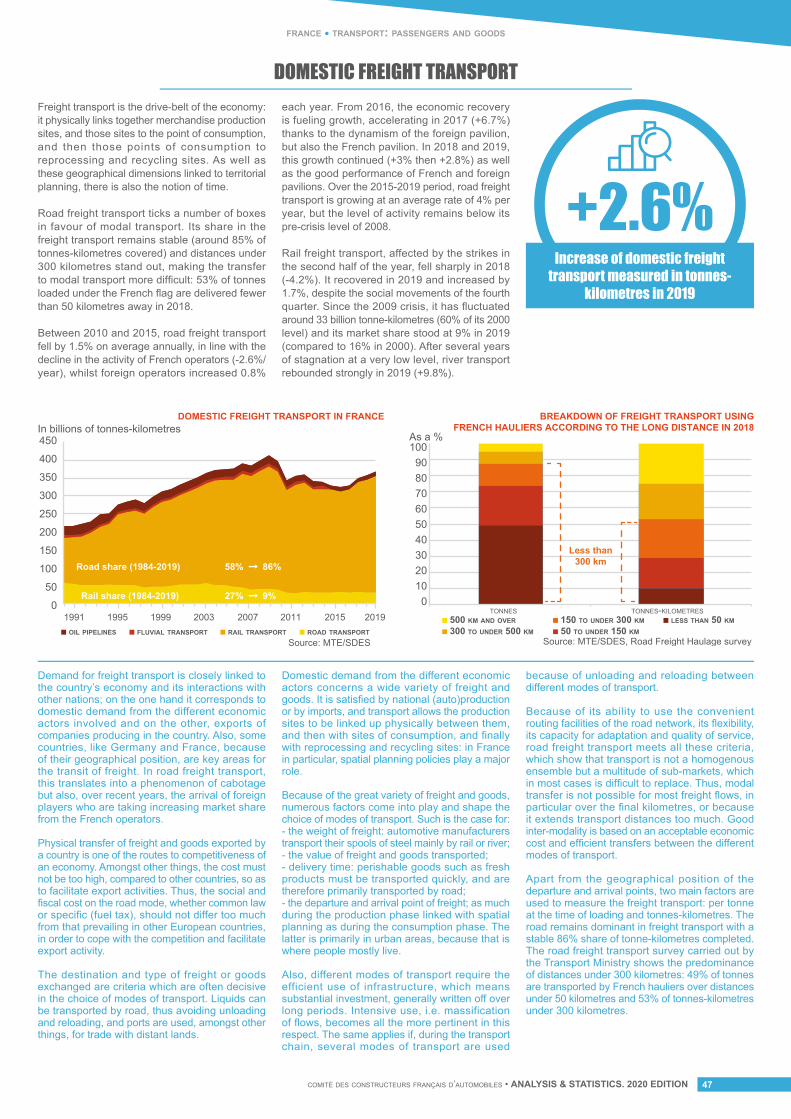
comité des constructeurs français d’automobiles • ANALYSIS & STATISTICS. 2020 EDITION 47
france • transport: passengers and goods
DOMESTIC FREIGHT TRANSPORTFreight transport is the drive-belt of the economy: it physically links together merchandise production sites, and those sites to the point of consumption, and then those points of consumption to reprocessing and recycling sites. As well as these geographical dimensions linked to territorial planning, there is also the notion of time.
Road freight transport ticks a number of boxes in favour of modal transport. Its share in the freight transport remains stable (around 85% of tonnes-kilometres covered) and distances under 300 kilometres stand out, making the transfer to modal transport more difficult: 53% of tonnes loaded under the French flag are delivered fewer than 50 kilometres away in 2018.
Between 2010 and 2015, road freight transport fell by 1.5% on average annually, in line with the decline in the activity of French operators (-2.6%/year), whilst foreign operators increased 0.8%
each year. From 2016, the economic recovery is fueling growth, accelerating in 2017 (+6.7%) thanks to the dynamism of the foreign pavilion, but also the French pavilion. In 2018 and 2019, this growth continued (+3% then +2.8%) as well as the good performance of French and foreign pavilions. Over the 2015-2019 period, road freight transport is growing at an average rate of 4% per year, but the level of activity remains below its pre-crisis level of 2008.
Rail freight transport, affected by the strikes in the second half of the year, fell sharply in 2018 (-4.2%). It recovered in 2019 and increased by 1.7%, despite the social movements of the fourth quarter. Since the 2009 crisis, it has fluctuated around 33 billion tonne-kilometres (60% of its 2000 level) and its market share stood at 9% in 2019 (compared to 16% in 2000). After several years of stagnation at a very low level, river transport rebounded strongly in 2019 (+9.8%).
+2.6%Increase of domestic freight
transport measured in tonnes-kilometres in 2019
Demand for freight transport is closely linked to the country’s economy and its interactions with other nations; on the one hand it corresponds to domestic demand from the different economic actors involved and on the other, exports of companies producing in the country. Also, some countries, like Germany and France, because of their geographical position, are key areas for the transit of freight. In road freight transport, this translates into a phenomenon of cabotage but also, over recent years, the arrival of foreign players who are taking increasing market share from the French operators.
Physical transfer of freight and goods exported by a country is one of the routes to competitiveness of an economy. Amongst other things, the cost must not be too high, compared to other countries, so as to facilitate export activities. Thus, the social and fiscal cost on the road mode, whether common law or specific (fuel tax), should not differ too much from that prevailing in other European countries, in order to cope with the competition and facilitate export activity.
The destination and type of freight or goods exchanged are criteria which are often decisive in the choice of modes of transport. Liquids can be transported by road, thus avoiding unloading and reloading, and ports are used, amongst other things, for trade with distant lands.
Domestic demand from the different economic actors concerns a wide variety of freight and goods. It is satisfied by national (auto)production or by imports, and transport allows the production sites to be linked up physically between them, and then with sites of consumption, and finally with reprocessing and recycling sites: in France in particular, spatial planning policies play a major role.
Because of the great variety of freight and goods, numerous factors come into play and shape the choice of modes of transport. Such is the case for:- the weight of freight: automotive manufacturers transport their spools of steel mainly by rail or river;- the value of freight and goods transported;- delivery time: perishable goods such as fresh products must be transported quickly, and are therefore primarily transported by road;- the departure and arrival point of freight; as much during the production phase linked with spatial planning as during the consumption phase. The latter is primarily in urban areas, because that is where people mostly live.
Also, different modes of transport require the efficient use of infrastructure, which means substantial investment, generally written off over long periods. Intensive use, i.e. massification of flows, becomes all the more pertinent in this respect. The same applies if, during the transport chain, several modes of transport are used
because of unloading and reloading between different modes of transport.
Because of its ability to use the convenient routing facilities of the road network, its flexibility, its capacity for adaptation and quality of service, road freight transport meets all these criteria, which show that transport is not a homogenous ensemble but a multitude of sub-markets, which in most cases is difficult to replace. Thus, modal transfer is not possible for most freight flows, in particular over the final kilometres, or because it extends transport distances too much. Good inter-modality is based on an acceptable economic cost and efficient transfers between the different modes of transport.
Apart from the geographical position of the departure and arrival points, two main factors are used to measure the freight transport: per tonne at the time of loading and tonnes-kilometres. The road remains dominant in freight transport with a stable 86% share of tonne-kilometres completed. The road freight transport survey carried out by the Transport Ministry shows the predominance of distances under 300 kilometres: 49% of tonnes are transported by French hauliers over distances under 50 kilometres and 53% of tonnes-kilometres under 300 kilometres.
Source: MTE/SDES Source: MTE/SDES, Road Freight Haulage surveyFLUVIAL TRANSPORT OIL PIPELINES RAIL TRANSPORT ROAD TRANSPORT 300 TO UNDER 500 KM
500 KM AND OVER 150 TO UNDER 300 KM
50 TO UNDER 150 KM
LESS THAN 50 KM2019TONNES TONNES-KILOMETRES
20152011200720031999199519910
50
100
150
200
250
300
350
400
450
0102030405060708090
100
In billions of tonnes-kilometresAs a %
DOMESTIC FREIGHT TRANSPORT IN FRANCE BREAKDOWN OF FREIGHT TRANSPORT USINGFRENCH HAULIERS ACCORDING TO THE LONG DISTANCE IN 2018
Less than 300 kmRoad share (1984-2019) 58% � 86%
27% � 9%Rail share (1984-2019)
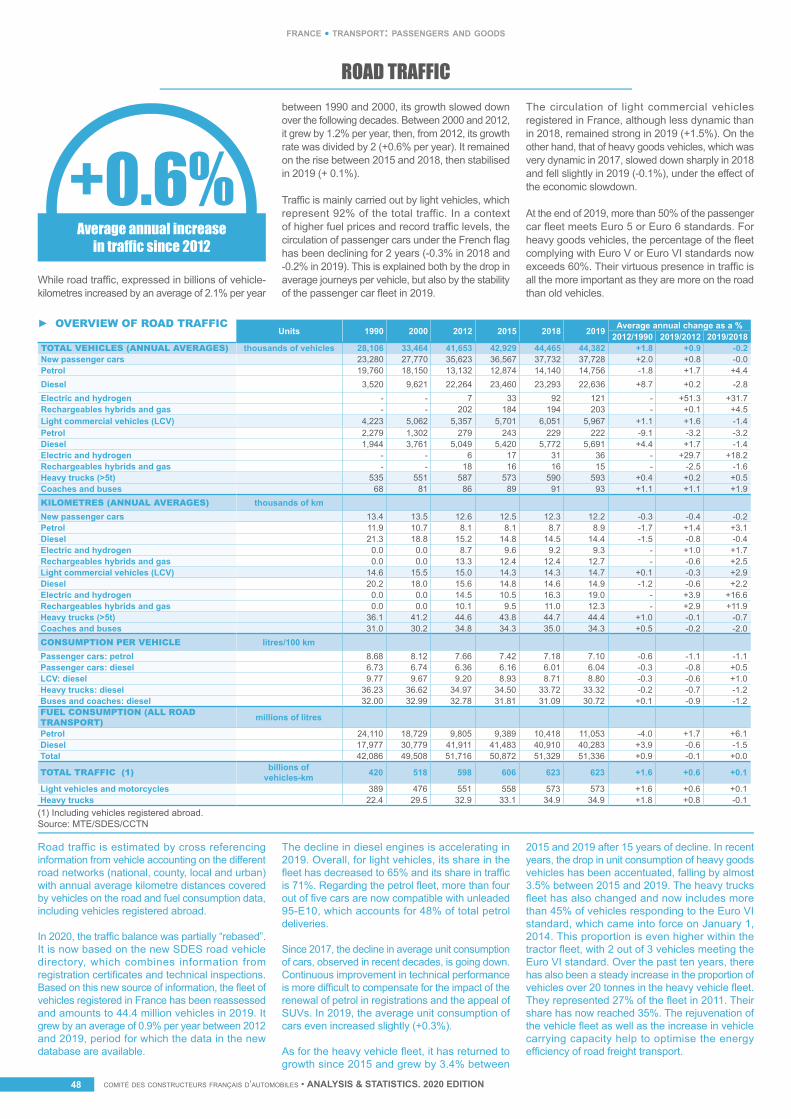
comité des constructeurs français d’automobiles • ANALYSIS & STATISTICS. 2020 EDITIONcomité des constructeurs français d’automobiles • ANALYSIS & STATISTICS. 2020 EDITION48
france • transport: passengers and goods
ROAD TRAFFIC
While road traffic, expressed in billions of vehicle-kilometres increased by an average of 2.1% per year
between 1990 and 2000, its growth slowed down over the following decades. Between 2000 and 2012, it grew by 1.2% per year, then, from 2012, its growth rate was divided by 2 (+0.6% per year). It remained on the rise between 2015 and 2018, then stabilised in 2019 (+ 0.1%).
Traffic is mainly carried out by light vehicles, which represent 92% of the total traffic. In a context of higher fuel prices and record traffic levels, the circulation of passenger cars under the French flag has been declining for 2 years (-0.3% in 2018 and -0.2% in 2019). This is explained both by the drop in average journeys per vehicle, but also by the stability of the passenger car fleet in 2019.
The circulation of light commercial vehicles registered in France, although less dynamic than in 2018, remained strong in 2019 (+1.5%). On the other hand, that of heavy goods vehicles, which was very dynamic in 2017, slowed down sharply in 2018 and fell slightly in 2019 (-0.1%), under the effect of the economic slowdown.
At the end of 2019, more than 50% of the passenger car fleet meets Euro 5 or Euro 6 standards. For heavy goods vehicles, the percentage of the fleet complying with Euro V or Euro VI standards now exceeds 60%. Their virtuous presence in traffic is all the more important as they are more on the road than old vehicles.
Road traffic is estimated by cross referencing information from vehicle accounting on the different road networks (national, county, local and urban) with annual average kilometre distances covered by vehicles on the road and fuel consumption data, including vehicles registered abroad.
In 2020, the traffic balance was partially “rebased”. It is now based on the new SDES road vehicle directory, which combines information from registration certificates and technical inspections. Based on this new source of information, the fleet of vehicles registered in France has been reassessed and amounts to 44.4 million vehicles in 2019. It grew by an average of 0.9% per year between 2012 and 2019, period for which the data in the new database are available.
The decline in diesel engines is accelerating in 2019. Overall, for light vehicles, its share in the fleet has decreased to 65% and its share in traffic is 71%. Regarding the petrol fleet, more than four out of five cars are now compatible with unleaded 95-E10, which accounts for 48% of total petrol deliveries.
Since 2017, the decline in average unit consumption of cars, observed in recent decades, is going down. Continuous improvement in technical performance is more difficult to compensate for the impact of the renewal of petrol in registrations and the appeal of SUVs. In 2019, the average unit consumption of cars even increased slightly (+0.3%).
As for the heavy vehicle fleet, it has returned to growth since 2015 and grew by 3.4% between
2015 and 2019 after 15 years of decline. In recent years, the drop in unit consumption of heavy goods vehicles has been accentuated, falling by almost 3.5% between 2015 and 2019. The heavy trucks fleet has also changed and now includes more than 45% of vehicles responding to the Euro VI standard, which came into force on January 1, 2014. This proportion is even higher within the tractor fleet, with 2 out of 3 vehicles meeting the Euro VI standard. Over the past ten years, there has also been a steady increase in the proportion of vehicles over 20 tonnes in the heavy vehicle fleet. They represented 27% of the fleet in 2011. Their share has now reached 35%. The rejuvenation of the vehicle fleet as well as the increase in vehicle carrying capacity help to optimise the energy efficiency of road freight transport.
Units 1990 2000 2012 2015 2018 2019 Average annual change as a %2012/1990 2019/2012 2019/2018
TOTAL VEHICLES (ANNUAL AVERAGES) thousands of vehicles 28,106 33,464 41,653 42,929 44,465 44,382 +1.8 +0.9 -0.2New passenger cars 23,280 27,770 35,623 36,567 37,732 37,728 +2.0 +0.8 -0.0Petrol 19,760 18,150 13,132 12,874 14,140 14,756 -1.8 +1.7 +4.4Diesel 3,520 9,621 22,264 23,460 23,293 22,636 +8.7 +0.2 -2.8Electric and hydrogen - - 7 33 92 121 - +51.3 +31.7Rechargeables hybrids and gas - - 202 184 194 203 - +0.1 +4.5Light commercial vehicles (LCV) 4,223 5,062 5,357 5,701 6,051 5,967 +1.1 +1.6 -1.4Petrol 2,279 1,302 279 243 229 222 -9.1 -3.2 -3.2Diesel 1,944 3,761 5,049 5,420 5,772 5,691 +4.4 +1.7 -1.4Electric and hydrogen - - 6 17 31 36 - +29.7 +18.2Rechargeables hybrids and gas - - 18 16 16 15 - -2.5 -1.6Heavy trucks (>5t) 535 551 587 573 590 593 +0.4 +0.2 +0.5Coaches and buses 68 81 86 89 91 93 +1.1 +1.1 +1.9KILOMETRES (ANNUAL AVERAGES) thousands of kmNew passenger cars 13.4 13.5 12.6 12.5 12.3 12.2 -0.3 -0.4 -0.2Petrol 11.9 10.7 8.1 8.1 8.7 8.9 -1.7 +1.4 +3.1Diesel 21.3 18.8 15.2 14.8 14.5 14.4 -1.5 -0.8 -0.4Electric and hydrogen 0.0 0.0 8.7 9.6 9.2 9.3 - +1.0 +1.7Rechargeables hybrids and gas 0.0 0.0 13.3 12.4 12.4 12.7 - -0.6 +2.5Light commercial vehicles (LCV) 14.6 15.5 15.0 14.3 14.3 14.7 +0.1 -0.3 +2.9Diesel 20.2 18.0 15.6 14.8 14.6 14.9 -1.2 -0.6 +2.2Electric and hydrogen 0.0 0.0 14.5 10.5 16.3 19.0 - +3.9 +16.6Rechargeables hybrids and gas 0.0 0.0 10.1 9.5 11.0 12.3 - +2.9 +11.9Heavy trucks (>5t) 36.1 41.2 44.6 43.8 44.7 44.4 +1.0 -0.1 -0.7Coaches and buses 31.0 30.2 34.8 34.3 35.0 34.3 +0.5 -0.2 -2.0CONSUMPTION PER VEHICLE litres/100 kmPassenger cars: petrol 8.68 8.12 7.66 7.42 7.18 7.10 -0.6 -1.1 -1.1Passenger cars: diesel 6.73 6.74 6.36 6.16 6.01 6.04 -0.3 -0.8 +0.5LCV: diesel 9.77 9.67 9.20 8.93 8.71 8.80 -0.3 -0.6 +1.0Heavy trucks: diesel 36.23 36.62 34.97 34.50 33.72 33.32 -0.2 -0.7 -1.2Buses and coaches: diesel 32.00 32.99 32.78 31.81 31.09 30.72 +0.1 -0.9 -1.2FUEL CONSUMPTION (ALL ROAD TRANSPORT) millions of litres
Petrol 24,110 18,729 9,805 9,389 10,418 11,053 -4.0 +1.7 +6.1Diesel 17,977 30,779 41,911 41,483 40,910 40,283 +3.9 -0.6 -1.5Total 42,086 49,508 51,716 50,872 51,329 51,336 +0.9 -0.1 +0.0
TOTAL TRAFFIC (1) billions of vehicles-km 420 518 598 606 623 623 +1.6 +0.6 +0.1
Light vehicles and motorcycles 389 476 551 558 573 573 +1.6 +0.6 +0.1Heavy trucks 22.4 29.5 32.9 33.1 34.9 34.9 +1.8 +0.8 -0.1
► OVERVIEW OF ROAD TRAFFIC
(1) Including vehicles registered abroad.Source: MTE/SDES/CCTN
Average annual increasein traffic since 2012
+0.6%
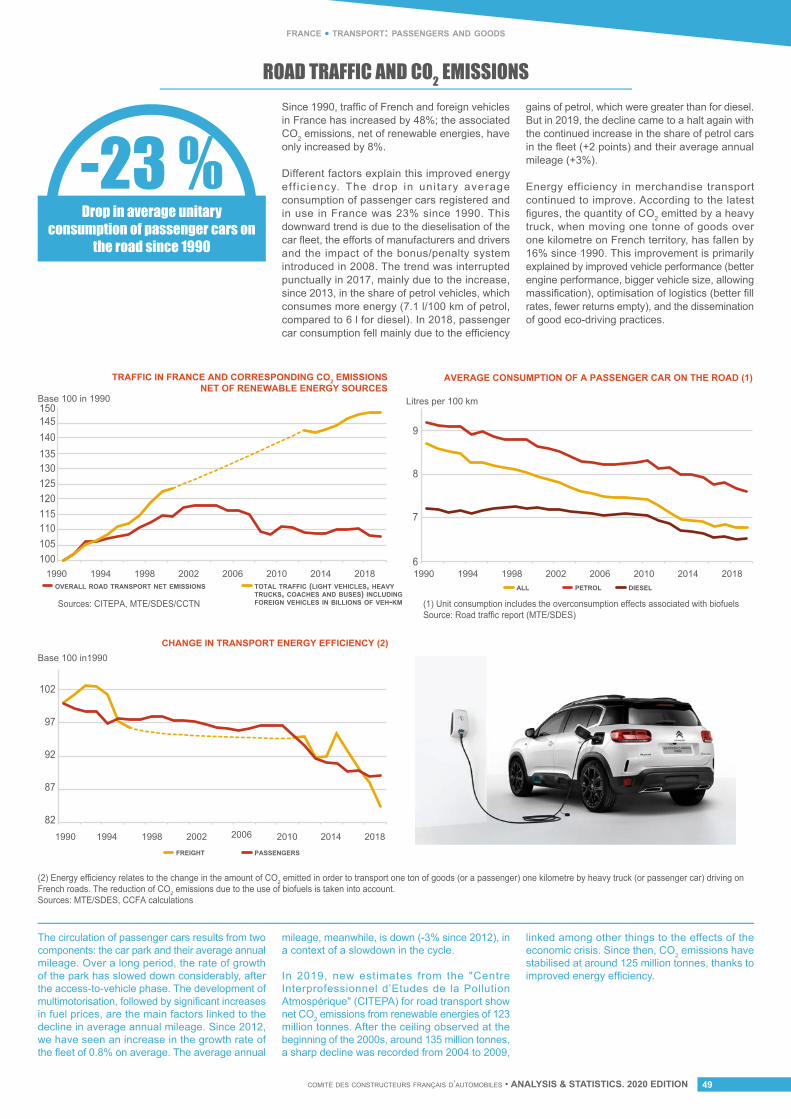
comité des constructeurs français d’automobiles • ANALYSIS & STATISTICS. 2020 EDITION 49
france • transport: passengers and goods
ROAD TRAFFIC AND CO2 EMISSIONS
The circulation of passenger cars results from two components: the car park and their average annual mileage. Over a long period, the rate of growth of the park has slowed down considerably, after the access-to-vehicle phase. The development of multimotorisation, followed by significant increases in fuel prices, are the main factors linked to the decline in average annual mileage. Since 2012, we have seen an increase in the growth rate of the fleet of 0.8% on average. The average annual
mileage, meanwhile, is down (-3% since 2012), in a context of a slowdown in the cycle.
In 2019, new estimates from the "Centre Interprofessionnel d’Etudes de la Pollution Atmospérique" (CITEPA) for road transport show net CO2 emissions from renewable energies of 123 million tonnes. After the ceiling observed at the beginning of the 2000s, around 135 million tonnes, a sharp decline was recorded from 2004 to 2009,
linked among other things to the effects of the economic crisis. Since then, CO2 emissions have stabilised at around 125 million tonnes, thanks to improved energy efficiency.
Drop in average unitary consumption of passenger cars on
the road since 1990
TRAFFIC IN FRANCE AND CORRESPONDING CO2 EMISSIONSNET OF RENEWABLE ENERGY SOURCES
AVERAGE CONSUMPTION OF A PASSENGER CAR ON THE ROAD (1)
CHANGE IN TRANSPORT ENERGY EFFICIENCY (2)
Base 100 in 1990
Base 100 in1990
Litres per 100 km
Sources: CITEPA, MTE/SDES/CCTN
(2) Energy efficiency relates to the change in the amount of CO2 emitted in order to transport one ton of goods (or a passenger) one kilometre by heavy truck (or passenger car) driving on French roads. The reduction of CO2 emissions due to the use of biofuels is taken into account.Sources: MTE/SDES, CCFA calculations
(1) Unit consumption includes the overconsumption effects associated with biofuelsSource: Road traffic report (MTE/SDES)
1990 1994 1998 2002 2006 2010 2014 2018 1990 1994 1998 2002 2006 2010 2014 2018
1990 1994 1998 2002 2006 2010 2014 2018
OVERALL ROAD TRANSPORT NET EMISSIONS TOTAL TRAFFIC (LIGHT VEHICLES, HEAVY TRUCKS, COACHES AND BUSES) INCLUDINGFOREIGN VEHICLES IN BILLIONS OF VEH-KM
ALL PETROL DIESEL
145150
140135130125120115
6
7
8
9
110105100
102
97
92
87
82
FREIGHT PASSENGERS
Since 1990, traffic of French and foreign vehicles in France has increased by 48%; the associated CO2 emissions, net of renewable energies, have only increased by 8%.
Different factors explain this improved energy eff ic iency. The drop in uni tary average consumption of passenger cars registered and in use in France was 23% since 1990. This downward trend is due to the dieselisation of the car fleet, the efforts of manufacturers and drivers and the impact of the bonus/penalty system introduced in 2008. The trend was interrupted punctually in 2017, mainly due to the increase, since 2013, in the share of petrol vehicles, which consumes more energy (7.1 l/100 km of petrol, compared to 6 l for diesel). In 2018, passenger car consumption fell mainly due to the efficiency
gains of petrol, which were greater than for diesel. But in 2019, the decline came to a halt again with the continued increase in the share of petrol cars in the fleet (+2 points) and their average annual mileage (+3%).
Energy efficiency in merchandise transport continued to improve. According to the latest figures, the quantity of CO2 emitted by a heavy truck, when moving one tonne of goods over one kilometre on French territory, has fallen by 16% since 1990. This improvement is primarily explained by improved vehicle performance (better engine performance, bigger vehicle size, allowing massification), optimisation of logistics (better fill rates, fewer returns empty), and the dissemination of good eco-driving practices.
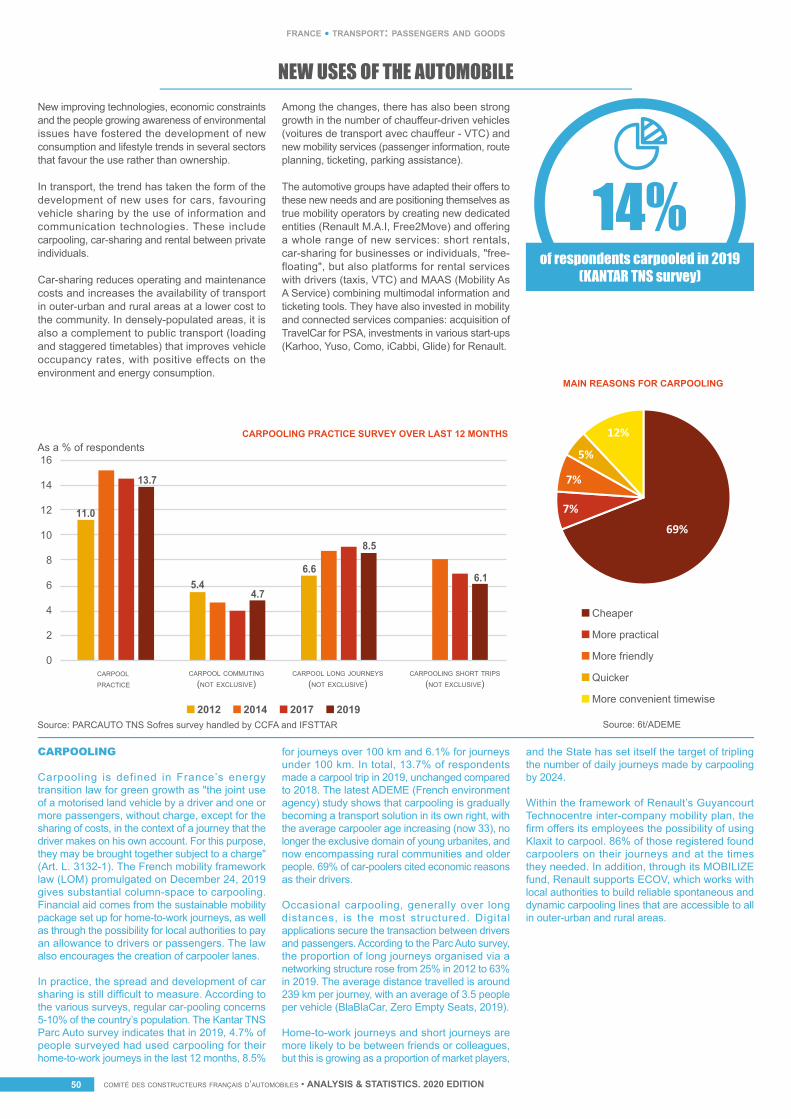
comité des constructeurs français d’automobiles • ANALYSIS & STATISTICS. 2020 EDITIONcomité des constructeurs français d’automobiles • ANALYSIS & STATISTICS. 2020 EDITION50
france • transport: passengers and goods
NEW USES OF THE AUTOMOBILENew improving technologies, economic constraints and the people growing awareness of environmental issues have fostered the development of new consumption and lifestyle trends in several sectors that favour the use rather than ownership.
In transport, the trend has taken the form of the development of new uses for cars, favouring vehicle sharing by the use of information and communication technologies. These include carpooling, car-sharing and rental between private individuals.
Car-sharing reduces operating and maintenance costs and increases the availability of transport in outer-urban and rural areas at a lower cost to the community. In densely-populated areas, it is also a complement to public transport (loading and staggered timetables) that improves vehicle occupancy rates, with positive effects on the environment and energy consumption.
Among the changes, there has also been strong growth in the number of chauffeur-driven vehicles (voitures de transport avec chauffeur - VTC) and new mobility services (passenger information, route planning, ticketing, parking assistance).
The automotive groups have adapted their offers to these new needs and are positioning themselves as true mobility operators by creating new dedicated entities (Renault M.A.I, Free2Move) and offering a whole range of new services: short rentals, car-sharing for businesses or individuals, "free-floating", but also platforms for rental services with drivers (taxis, VTC) and MAAS (Mobility As A Service) combining multimodal information and ticketing tools. They have also invested in mobility and connected services companies: acquisition of TravelCar for PSA, investments in various start-ups (Karhoo, Yuso, Como, iCabbi, Glide) for Renault.
14%of respondents carpooled in 2019
(KANTAR TNS survey)
CARPOOLING
Carpooling is defined in France’s energy transition law for green growth as "the joint use of a motorised land vehicle by a driver and one or more passengers, without charge, except for the sharing of costs, in the context of a journey that the driver makes on his own account. For this purpose, they may be brought together subject to a charge" (Art. L. 3132-1). The French mobility framework law (LOM) promulgated on December 24, 2019 gives substantial column-space to carpooling. Financial aid comes from the sustainable mobility package set up for home-to-work journeys, as well as through the possibility for local authorities to pay an allowance to drivers or passengers. The law also encourages the creation of carpooler lanes.
In practice, the spread and development of car sharing is still difficult to measure. According to the various surveys, regular car-pooling concerns 5-10% of the country’s population. The Kantar TNS Parc Auto survey indicates that in 2019, 4.7% of people surveyed had used carpooling for their home-to-work journeys in the last 12 months, 8.5%
for journeys over 100 km and 6.1% for journeys under 100 km. In total, 13.7% of respondents made a carpool trip in 2019, unchanged compared to 2018. The latest ADEME (French environment agency) study shows that carpooling is gradually becoming a transport solution in its own right, with the average carpooler age increasing (now 33), no longer the exclusive domain of young urbanites, and now encompassing rural communities and older people. 69% of car-poolers cited economic reasons as their drivers.
Occasional carpooling, generally over long distances, is the most structured. Digital applications secure the transaction between drivers and passengers. According to the Parc Auto survey, the proportion of long journeys organised via a networking structure rose from 25% in 2012 to 63% in 2019. The average distance travelled is around 239 km per journey, with an average of 3.5 people per vehicle (BlaBlaCar, Zero Empty Seats, 2019).
Home-to-work journeys and short journeys are more likely to be between friends or colleagues, but this is growing as a proportion of market players,
and the State has set itself the target of tripling the number of daily journeys made by carpooling by 2024.
Within the framework of Renault’s Guyancourt Technocentre inter-company mobility plan, the firm offers its employees the possibility of using Klaxit to carpool. 86% of those registered found carpoolers on their journeys and at the times they needed. In addition, through its MOBILIZE fund, Renault supports ECOV, which works with local authorities to build reliable spontaneous and dynamic carpooling lines that are accessible to all in outer-urban and rural areas.
CARPOOLING PRACTICE SURVEY OVER LAST 12 MONTHS
Source: PARCAUTO TNS Sofres survey handled by CCFA and IFSTTAR
CARPOOL PRACTICE
CARPOOL COMMUTING
(NOT EXCLUSIVE)CARPOOL LONG JOURNEYS
(NOT EXCLUSIVE)CARPOOLING SHORT TRIPS
(NOT EXCLUSIVE)
As a % of respondents
14
16
6
12
10
8
4
2
0
2012 2014 2017 2019
11.0
13.7
5.44.7
6.6
8.5
6.1
MAIN REASONS FOR CARPOOLING
69%
7%
7%
5%
12%
Cheaper
More practical
More friendly
Quicker
More convenient timewise
Source: 6t/ADEME
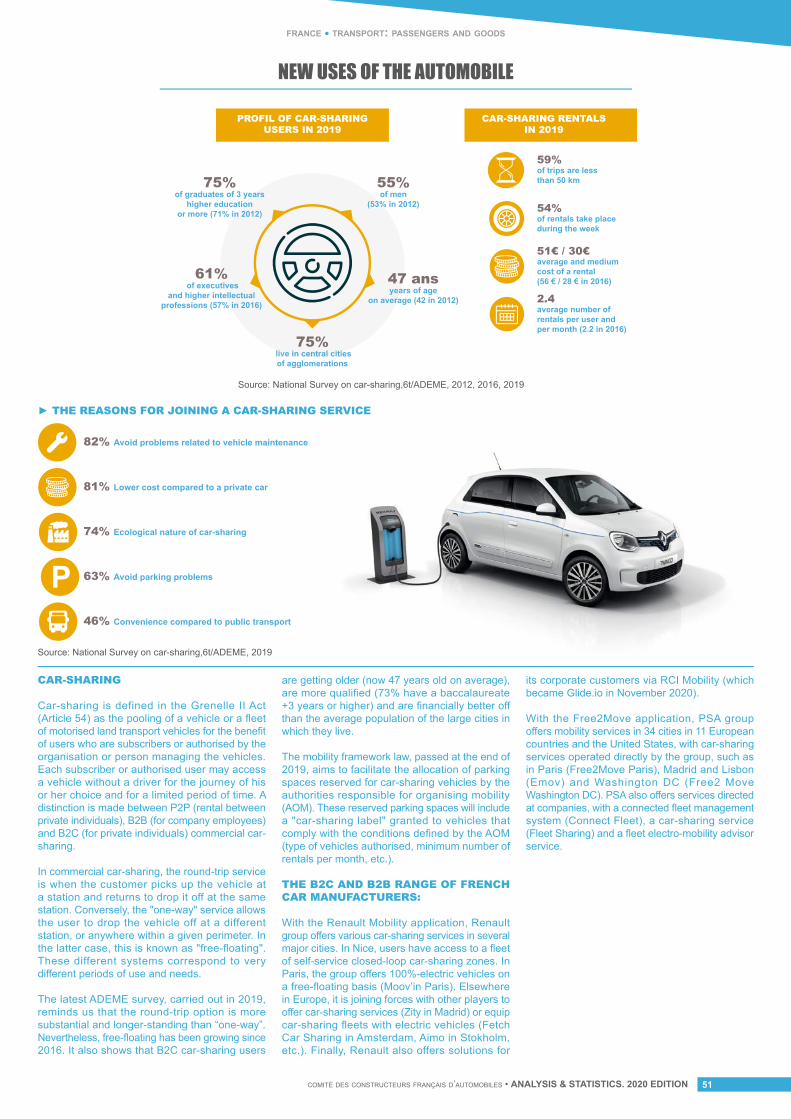
comité des constructeurs français d’automobiles • ANALYSIS & STATISTICS. 2020 EDITION 51
france • transport: passengers and goods
NEW USES OF THE AUTOMOBILE
CAR-SHARING
Car-sharing is defined in the Grenelle II Act (Article 54) as the pooling of a vehicle or a fleet of motorised land transport vehicles for the benefit of users who are subscribers or authorised by the organisation or person managing the vehicles. Each subscriber or authorised user may access a vehicle without a driver for the journey of his or her choice and for a limited period of time. A distinction is made between P2P (rental between private individuals), B2B (for company employees) and B2C (for private individuals) commercial car-sharing.
In commercial car-sharing, the round-trip service is when the customer picks up the vehicle at a station and returns to drop it off at the same station. Conversely, the "one-way" service allows the user to drop the vehicle off at a different station, or anywhere within a given perimeter. In the latter case, this is known as "free-floating". These different systems correspond to very different periods of use and needs.
The latest ADEME survey, carried out in 2019, reminds us that the round-trip option is more substantial and longer-standing than “one-way”. Nevertheless, free-floating has been growing since 2016. It also shows that B2C car-sharing users
are getting older (now 47 years old on average), are more qualified (73% have a baccalaureate +3 years or higher) and are financially better off than the average population of the large cities in which they live.
The mobility framework law, passed at the end of 2019, aims to facilitate the allocation of parking spaces reserved for car-sharing vehicles by the authorities responsible for organising mobility (AOM). These reserved parking spaces will include a "car-sharing label" granted to vehicles that comply with the conditions defined by the AOM (type of vehicles authorised, minimum number of rentals per month, etc.).
THE B2C AND B2B RANGE OF FRENCH CAR MANUFACTURERS:
With the Renault Mobility application, Renault group offers various car-sharing services in several major cities. In Nice, users have access to a fleet of self-service closed-loop car-sharing zones. In Paris, the group offers 100%-electric vehicles on a free-floating basis (Moov’in Paris). Elsewhere in Europe, it is joining forces with other players to offer car-sharing services (Zity in Madrid) or equip car-sharing fleets with electric vehicles (Fetch Car Sharing in Amsterdam, Aimo in Stokholm, etc.). Finally, Renault also offers solutions for
its corporate customers via RCI Mobility (which became Glide.io in November 2020).
With the Free2Move application, PSA group offers mobility services in 34 cities in 11 European countries and the United States, with car-sharing services operated directly by the group, such as in Paris (Free2Move Paris), Madrid and Lisbon (Emov) and Washington DC (Free2 Move Washington DC). PSA also offers services directed at companies, with a connected fleet management system (Connect Fleet), a car-sharing service (Fleet Sharing) and a fleet electro-mobility advisor service.
► THE REASONS FOR JOINING A CAR-SHARING SERVICE
Source: National Survey on car-sharing,6t/ADEME, 2019
82% Avoid problems related to vehicle maintenance
81% Lower cost compared to a private car
74% Ecological nature of car-sharing
63% Avoid parking problems
46% Convenience compared to public transport
CAR-SHARING RENTALSIN 2019
PROFIL OF CAR-SHARINGUSERS IN 2019
75%of graduates of 3 years
higher educationor more (71% in 2012)
55%of men
(53% in 2012)
47 ansyears of age
on average (42 in 2012)
75% live in central citiesof agglomerations
61% of executives
and higher intellectualprofessions (57% in 2016)
54%of rentals take placeduring the week
59%of trips are lessthan 50 km
51€ / 30€average and mediumcost of a rental (56 € / 28 € in 2016)
2.4average number of rentals per user and per month (2.2 in 2016)
Source: National Survey on car-sharing,6t/ADEME, 2012, 2016, 2019
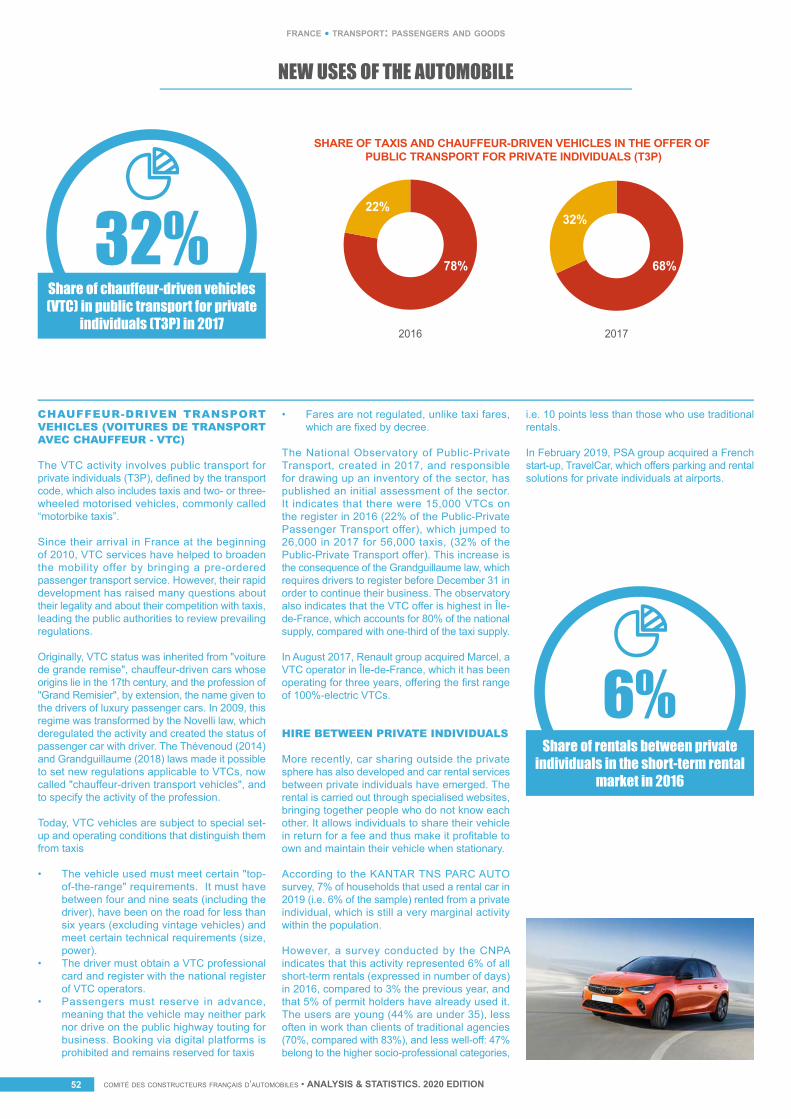
comité des constructeurs français d’automobiles • ANALYSIS & STATISTICS. 2020 EDITIONcomité des constructeurs français d’automobiles • ANALYSIS & STATISTICS. 2020 EDITION52
NEW USES OF THE AUTOMOBILE
CHAUFFEUR-DRIVEN TRANSPORT VEHICLES (VOITURES DE TRANSPORT AVEC CHAUFFEUR - VTC)
The VTC activity involves public transport for private individuals (T3P), defined by the transport code, which also includes taxis and two- or three-wheeled motorised vehicles, commonly called “motorbike taxis”.
Since their arrival in France at the beginning of 2010, VTC services have helped to broaden the mobility offer by bringing a pre-ordered passenger transport service. However, their rapid development has raised many questions about their legality and about their competition with taxis, leading the public authorities to review prevailing regulations. Originally, VTC status was inherited from "voiture de grande remise", chauffeur-driven cars whose origins lie in the 17th century, and the profession of "Grand Remisier", by extension, the name given to the drivers of luxury passenger cars. In 2009, this regime was transformed by the Novelli law, which deregulated the activity and created the status of passenger car with driver. The Thévenoud (2014) and Grandguillaume (2018) laws made it possible to set new regulations applicable to VTCs, now called "chauffeur-driven transport vehicles", and to specify the activity of the profession.
Today, VTC vehicles are subject to special set-up and operating conditions that distinguish them from taxis
• The vehicle used must meet certain "top-of-the-range" requirements. It must have between four and nine seats (including the driver), have been on the road for less than six years (excluding vintage vehicles) and meet certain technical requirements (size, power).
• The driver must obtain a VTC professional card and register with the national register of VTC operators.
• Passengers must reserve in advance, meaning that the vehicle may neither park nor drive on the public highway touting for business. Booking via digital platforms is prohibited and remains reserved for taxis
• Fares are not regulated, unlike taxi fares, which are fixed by decree.
The National Observatory of Public-Private Transport, created in 2017, and responsible for drawing up an inventory of the sector, has published an initial assessment of the sector. It indicates that there were 15,000 VTCs on the register in 2016 (22% of the Public-Private Passenger Transport offer), which jumped to 26,000 in 2017 for 56,000 taxis, (32% of the Public-Private Transport offer). This increase is the consequence of the Grandguillaume law, which requires drivers to register before December 31 in order to continue their business. The observatory also indicates that the VTC offer is highest in Île-de-France, which accounts for 80% of the national supply, compared with one-third of the taxi supply.
In August 2017, Renault group acquired Marcel, a VTC operator in Île-de-France, which it has been operating for three years, offering the first range of 100%-electric VTCs.
HIRE BETWEEN PRIVATE INDIVIDUALS
More recently, car sharing outside the private sphere has also developed and car rental services between private individuals have emerged. The rental is carried out through specialised websites, bringing together people who do not know each other. It allows individuals to share their vehicle in return for a fee and thus make it profitable to own and maintain their vehicle when stationary.
According to the KANTAR TNS PARC AUTO survey, 7% of households that used a rental car in 2019 (i.e. 6% of the sample) rented from a private individual, which is still a very marginal activity within the population.
However, a survey conducted by the CNPA indicates that this activity represented 6% of all short-term rentals (expressed in number of days) in 2016, compared to 3% the previous year, and that 5% of permit holders have already used it. The users are young (44% are under 35), less often in work than clients of traditional agencies (70%, compared with 83%), and less well-off: 47% belong to the higher socio-professional categories,
i.e. 10 points less than those who use traditional rentals.
In February 2019, PSA group acquired a French start-up, TravelCar, which offers parking and rental solutions for private individuals at airports.
Share of rentals between private individuals in the short-term rental
market in 2016
SHARE OF TAXIS AND CHAUFFEUR-DRIVEN VEHICLES IN THE OFFER OF PUBLIC TRANSPORT FOR PRIVATE INDIVIDUALS (T3P)
Taxis Chauffeur-driven vehicles
2016 2017
Source: National Observatory of Special Public Transport of People, CGDD, July 2018
68%
32%22%
78%
Share of chauffeur-driven vehicles (VTC) in public transport for private
individuals (T3P) in 2017
france • transport: passengers and goods
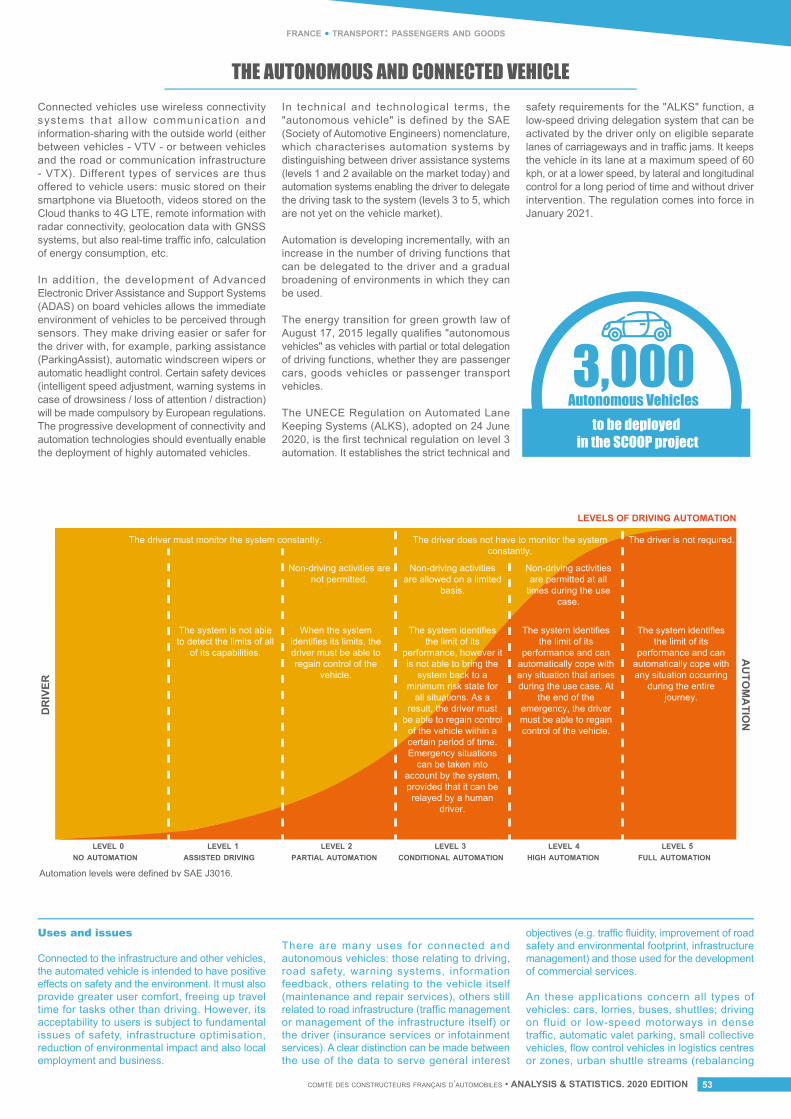
comité des constructeurs français d’automobiles • ANALYSIS & STATISTICS. 2020 EDITION 53
THE AUTONOMOUS AND CONNECTED VEHICLE
Uses and issues
Connected to the infrastructure and other vehicles, the automated vehicle is intended to have positive effects on safety and the environment. It must also provide greater user comfort, freeing up travel time for tasks other than driving. However, its acceptability to users is subject to fundamental issues of safety, infrastructure optimisation, reduction of environmental impact and also local employment and business.
There are many uses for connected and autonomous vehicles: those relating to driving, road safety, warning systems, information feedback, others relating to the vehicle itself (maintenance and repair services), others still related to road infrastructure (traffic management or management of the infrastructure itself) or the driver (insurance services or infotainment services). A clear distinction can be made between the use of the data to serve general interest
objectives (e.g. traffic fluidity, improvement of road safety and environmental footprint, infrastructure management) and those used for the development of commercial services.
An these applications concern all types of vehicles: cars, lorries, buses, shuttles; driving on fluid or low-speed motorways in dense traffic, automatic valet parking, small collective vehicles, flow control vehicles in logistics centres or zones, urban shuttle streams (rebalancing
france • transport: passengers and goods
to be deployed in the SCOOP project
Autonomous Vehicles3,000
Connected vehicles use wireless connectivity systems that al low communicat ion and information-sharing with the outside world (either between vehicles - VTV - or between vehicles and the road or communication infrastructure - VTX). Different types of services are thus offered to vehicle users: music stored on their smartphone via Bluetooth, videos stored on the Cloud thanks to 4G LTE, remote information with radar connectivity, geolocation data with GNSS systems, but also real-time traffic info, calculation of energy consumption, etc.
In addition, the development of Advanced Electronic Driver Assistance and Support Systems (ADAS) on board vehicles allows the immediate environment of vehicles to be perceived through sensors. They make driving easier or safer for the driver with, for example, parking assistance (ParkingAssist), automatic windscreen wipers or automatic headlight control. Certain safety devices (intelligent speed adjustment, warning systems in case of drowsiness / loss of attention / distraction) will be made compulsory by European regulations. The progressive development of connectivity and automation technologies should eventually enable the deployment of highly automated vehicles.
In technical and technological terms, the "autonomous vehicle" is defined by the SAE (Society of Automotive Engineers) nomenclature, which characterises automation systems by distinguishing between driver assistance systems (levels 1 and 2 available on the market today) and automation systems enabling the driver to delegate the driving task to the system (levels 3 to 5, which are not yet on the vehicle market).
Automation is developing incrementally, with an increase in the number of driving functions that can be delegated to the driver and a gradual broadening of environments in which they can be used.
The energy transition for green growth law of August 17, 2015 legally qualifies "autonomous vehicles" as vehicles with partial or total delegation of driving functions, whether they are passenger cars, goods vehicles or passenger transport vehicles.
The UNECE Regulation on Automated Lane Keeping Systems (ALKS), adopted on 24 June 2020, is the first technical regulation on level 3 automation. It establishes the strict technical and
safety requirements for the "ALKS" function, a low-speed driving delegation system that can be activated by the driver only on eligible separate lanes of carriageways and in traffic jams. It keeps the vehicle in its lane at a maximum speed of 60 kph, or at a lower speed, by lateral and longitudinal control for a long period of time and without driver intervention. The regulation comes into force in January 2021.
LEVELS OF DRIVING AUTOMATION
FULL AUTOMATIONASSISTED DRIVING
DR
IVER
AU
TOM
ATIO
N
NO AUTOMATION HIGH AUTOMATIONCONDITIONAL AUTOMATIONPARTIAL AUTOMATIONLEVEL 0 LEVEL 1 LEVEL 2 LEVEL 3 LEVEL 4 LEVEL 5
Automation levels were defined by SAE J3016.
The driver must monitor the system constantly. The driver does not have to monitor the system constantly.
The driver is not required.
The system identifies the limit of its
performance, however it is not able to bring the
system back to a minimum risk state for
all situations. As a result, the driver must
be able to regain control of the vehicle within a certain period of time. Emergency situations
can be taken into account by the system, provided that it can be relayed by a human
driver.
The system identifies the limit of its
performance and can automatically cope with any situation that arises during the use case. At
the end of the emergency, the driver must be able to regain control of the vehicle.
The system identifies the limit of its
performance and can automatically cope with any situation occurring
during the entire journey.
The system is not able to detect the limits of all
of its capabilities.
When the system identifies its limits, the driver must be able to regain control of the
vehicle.
Non-driving activities are not permitted.
Non-driving activities are allowed on a limited
basis.
Non-driving activities are permitted at all
times during the use case.
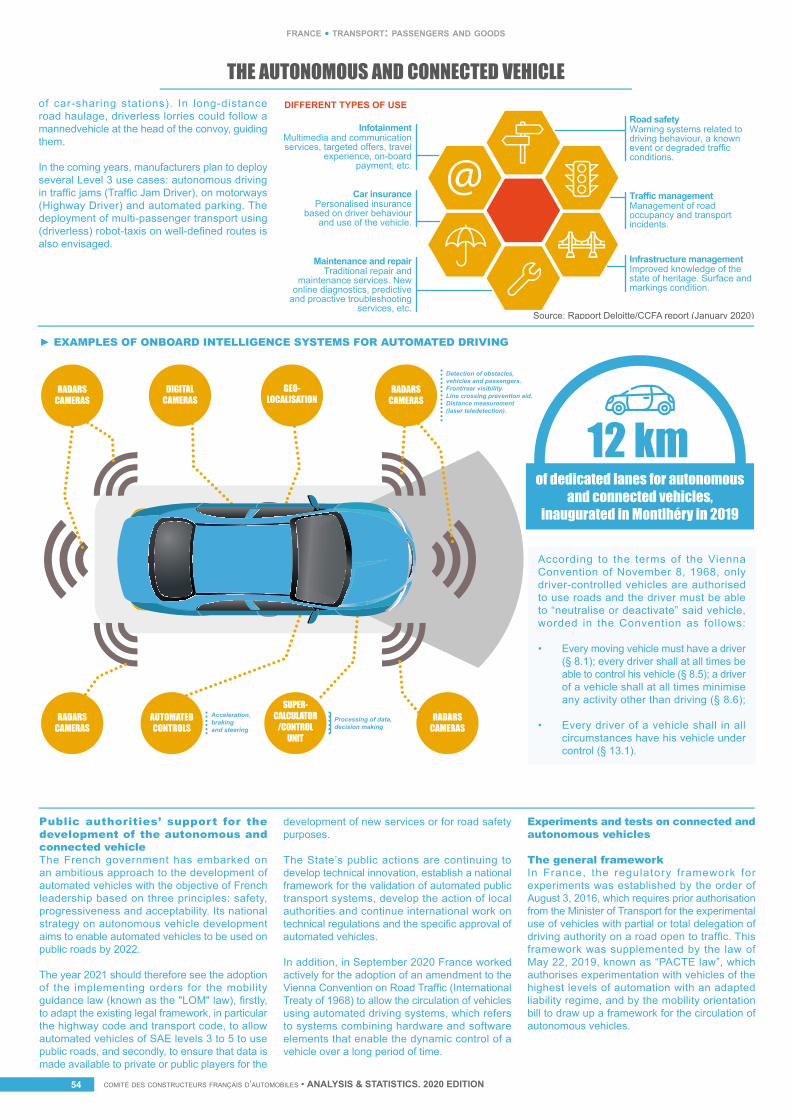
comité des constructeurs français d’automobiles • ANALYSIS & STATISTICS. 2020 EDITIONcomité des constructeurs français d’automobiles • ANALYSIS & STATISTICS. 2020 EDITION54
THE AUTONOMOUS AND CONNECTED VEHICLE
Public authorities’ support for the development of the autonomous and connected vehicleThe French government has embarked on an ambitious approach to the development of automated vehicles with the objective of French leadership based on three principles: safety, progressiveness and acceptability. Its national strategy on autonomous vehicle development aims to enable automated vehicles to be used on public roads by 2022.
The year 2021 should therefore see the adoption of the implementing orders for the mobility guidance law (known as the "LOM" law), firstly, to adapt the existing legal framework, in particular the highway code and transport code, to allow automated vehicles of SAE levels 3 to 5 to use public roads, and secondly, to ensure that data is made available to private or public players for the
development of new services or for road safety purposes.
The State’s public actions are continuing to develop technical innovation, establish a national framework for the validation of automated public transport systems, develop the action of local authorities and continue international work on technical regulations and the specific approval of automated vehicles.
In addition, in September 2020 France worked actively for the adoption of an amendment to the Vienna Convention on Road Traffic (International Treaty of 1968) to allow the circulation of vehicles using automated driving systems, which refers to systems combining hardware and software elements that enable the dynamic control of a vehicle over a long period of time.
Experiments and tests on connected and autonomous vehicles
The general frameworkIn France, the regulatory framework for experiments was established by the order of August 3, 2016, which requires prior authorisation from the Minister of Transport for the experimental use of vehicles with partial or total delegation of driving authority on a road open to traffic. This framework was supplemented by the law of May 22, 2019, known as “PACTE law”, which authorises experimentation with vehicles of the highest levels of automation with an adapted liability regime, and by the mobility orientation bill to draw up a framework for the circulation of autonomous vehicles.
france • transport: passengers and goods
Detection of obstacles,vehicles and passengers.Front/rear visibility.Line crossing prevention aid.Distance measurement(laser teledetection).
GEO-LOCALISATION
DIGITALCAMERAS
RADARSCAMERAS
RADARSCAMERAS
RADARSCAMERAS
RADARSCAMERAS
Acceleration,brakingand steering
Processing of data,decision making
AUTOMATEDCONTROLS
SUPER-CALCULATOR
/CONTROLUNIT
► EXAMPLES OF ONBOARD INTELLIGENCE SYSTEMS FOR AUTOMATED DRIVING
According to the terms of the Vienna Convention of November 8, 1968, only driver-controlled vehicles are authorised to use roads and the driver must be able to “neutralise or deactivate” said vehicle, worded in the Convention as follows:
• Every moving vehicle must have a driver (§ 8.1); every driver shall at all times be able to control his vehicle (§ 8.5); a driver of a vehicle shall at all times minimise any activity other than driving (§ 8.6);
• Every driver of a vehicle shall in all circumstances have his vehicle under control (§ 13.1).
of dedicated lanes for autonomous and connected vehicles,
inaugurated in Montlhéry in 2019
12 km
of car-sharing stations). In long-distance road haulage, driverless lorries could follow a mannedvehicle at the head of the convoy, guiding them.
In the coming years, manufacturers plan to deploy several Level 3 use cases: autonomous driving in traffic jams (Traffic Jam Driver), on motorways (Highway Driver) and automated parking. The deployment of multi-passenger transport using (driverless) robot-taxis on well-defined routes is also envisaged.
DIFFERENT TYPES OF USERoad safetyWarning systems related to driving behaviour, a knownevent or degraded traffic conditions.
InfotainmentMultimedia and communication services, targeted offers, travel
experience, on-board payment, etc.
Car insurancePersonalised insurance
based on driver behaviour and use of the vehicle.
Traffic managementManagement of road occupancy and transport incidents.
Infrastructure managementImproved knowledge of the state of heritage. Surface and markings condition.
Maintenance and repairTraditional repair and
maintenance services. New online diagnostics, predictive
and proactive troubleshooting services, etc.
Source: Rapport Deloitte/CCFA report (January 2020)
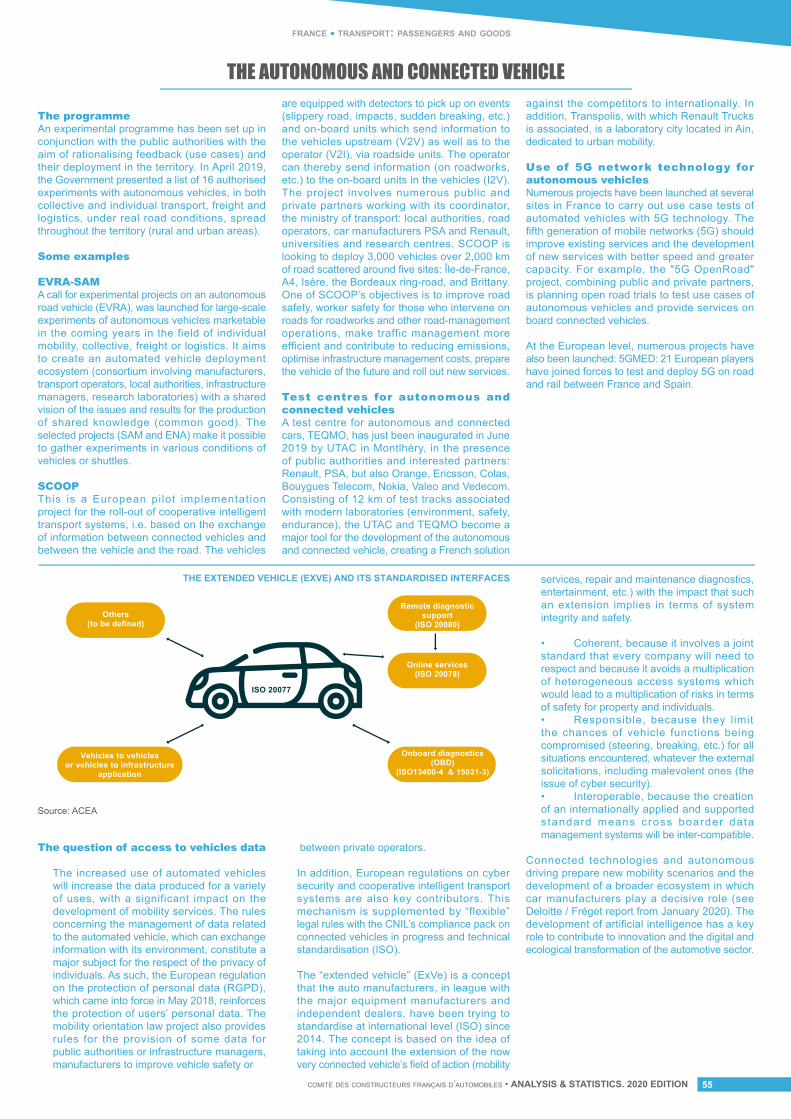
comité des constructeurs français d’automobiles • ANALYSIS & STATISTICS. 2020 EDITION 55
THE AUTONOMOUS AND CONNECTED VEHICLE
The question of access to vehicles data
The increased use of automated vehicles will increase the data produced for a variety of uses, with a significant impact on the development of mobility services. The rules concerning the management of data related to the automated vehicle, which can exchange information with its environment, constitute a major subject for the respect of the privacy of individuals. As such, the European regulation on the protection of personal data (RGPD), which came into force in May 2018, reinforces the protection of users’ personal data. The mobility orientation law project also provides rules for the provision of some data for public authorities or infrastructure managers, manufacturers to improve vehicle safety or
between private operators.
In addition, European regulations on cyber security and cooperative intelligent transport systems are also key contributors. This mechanism is supplemented by “flexible” legal rules with the CNIL’s compliance pack on connected vehicles in progress and technical standardisation (ISO).
The “extended vehicle” (ExVe) is a concept that the auto manufacturers, in league with the major equipment manufacturers and independent dealers, have been trying to standardise at international level (ISO) since 2014. The concept is based on the idea of taking into account the extension of the now very connected vehicle’s field of action (mobility
services, repair and maintenance diagnostics, entertainment, etc.) with the impact that such an extension implies in terms of system integrity and safety.
• Coherent, because it involves a joint standard that every company will need to respect and because it avoids a multiplication of heterogeneous access systems which would lead to a multiplication of risks in terms of safety for property and individuals. • Responsible, because they limit the chances of vehicle functions being compromised (steering, breaking, etc.) for all situations encountered, whatever the external solicitations, including malevolent ones (the issue of cyber security).• Interoperable, because the creation of an internationally applied and supported standard means cross boarder data management systems will be inter-compatible.
Connected technologies and autonomous driving prepare new mobility scenarios and the development of a broader ecosystem in which car manufacturers play a decisive role (see Deloitte / Fréget report from January 2020). The development of artificial intelligence has a key role to contribute to innovation and the digital and ecological transformation of the automotive sector.
The programmeAn experimental programme has been set up in conjunction with the public authorities with the aim of rationalising feedback (use cases) and their deployment in the territory. In April 2019, the Government presented a list of 16 authorised experiments with autonomous vehicles, in both collective and individual transport, freight and logistics, under real road conditions, spread throughout the territory (rural and urban areas).
Some examples
EVRA-SAM A call for experimental projects on an autonomous road vehicle (EVRA), was launched for large-scale experiments of autonomous vehicles marketable in the coming years in the field of individual mobility, collective, freight or logistics. It aims to create an automated vehicle deployment ecosystem (consortium involving manufacturers, transport operators, local authorities, infrastructure managers, research laboratories) with a shared vision of the issues and results for the production of shared knowledge (common good). The selected projects (SAM and ENA) make it possible to gather experiments in various conditions of vehicles or shuttles. SCOOP This is a European pilot implementation project for the roll-out of cooperative intelligent transport systems, i.e. based on the exchange of information between connected vehicles and between the vehicle and the road. The vehicles
are equipped with detectors to pick up on events (slippery road, impacts, sudden breaking, etc.) and on-board units which send information to the vehicles upstream (V2V) as well as to the operator (V2I), via roadside units. The operator can thereby send information (on roadworks, etc.) to the on-board units in the vehicles (I2V). The project involves numerous public and private partners working with its coordinator, the ministry of transport: local authorities, road operators, car manufacturers PSA and Renault, universities and research centres. SCOOP is looking to deploy 3,000 vehicles over 2,000 km of road scattered around five sites: Île-de-France, A4, Isère, the Bordeaux ring-road, and Brittany. One of SCOOP’s objectives is to improve road safety, worker safety for those who intervene on roads for roadworks and other road-management operations, make traffic management more efficient and contribute to reducing emissions, optimise infrastructure management costs, prepare the vehicle of the future and roll out new services.
Test centres for autonomous and connected vehiclesA test centre for autonomous and connected cars, TEQMO, has just been inaugurated in June 2019 by UTAC in Montlhéry, in the presence of public authorities and interested partners: Renault, PSA, but also Orange, Ericsson, Colas, Bouygues Telecom, Nokia, Valeo and Vedecom. Consisting of 12 km of test tracks associated with modern laboratories (environment, safety, endurance), the UTAC and TEQMO become a major tool for the development of the autonomous and connected vehicle, creating a French solution
against the competitors to internationally. In addition, Transpolis, with which Renault Trucks is associated, is a laboratory city located in Ain, dedicated to urban mobility.
Use of 5G network technology for autonomous vehicles Numerous projects have been launched at several sites in France to carry out use case tests of automated vehicles with 5G technology. The fifth generation of mobile networks (5G) should improve existing services and the development of new services with better speed and greater capacity. For example, the "5G OpenRoad" project, combining public and private partners, is planning open road trials to test use cases of autonomous vehicles and provide services on board connected vehicles.
At the European level, numerous projects have also been launched: 5GMED: 21 European players have joined forces to test and deploy 5G on road and rail between France and Spain.
THE EXTENDED VEHICLE (EXVE) AND ITS STANDARDISED INTERFACES
Others(to be defined)
Online services(ISO 20078)
Remote diagnosticsupport
(ISO 20080)
Onboard diagnostics(OBD)
(ISO13400-4 & 15031-3)
Vehicles to vehiclesor vehicles to infrastructure
application
ISO 20077
Source: ACEA
france • transport: passengers and goods
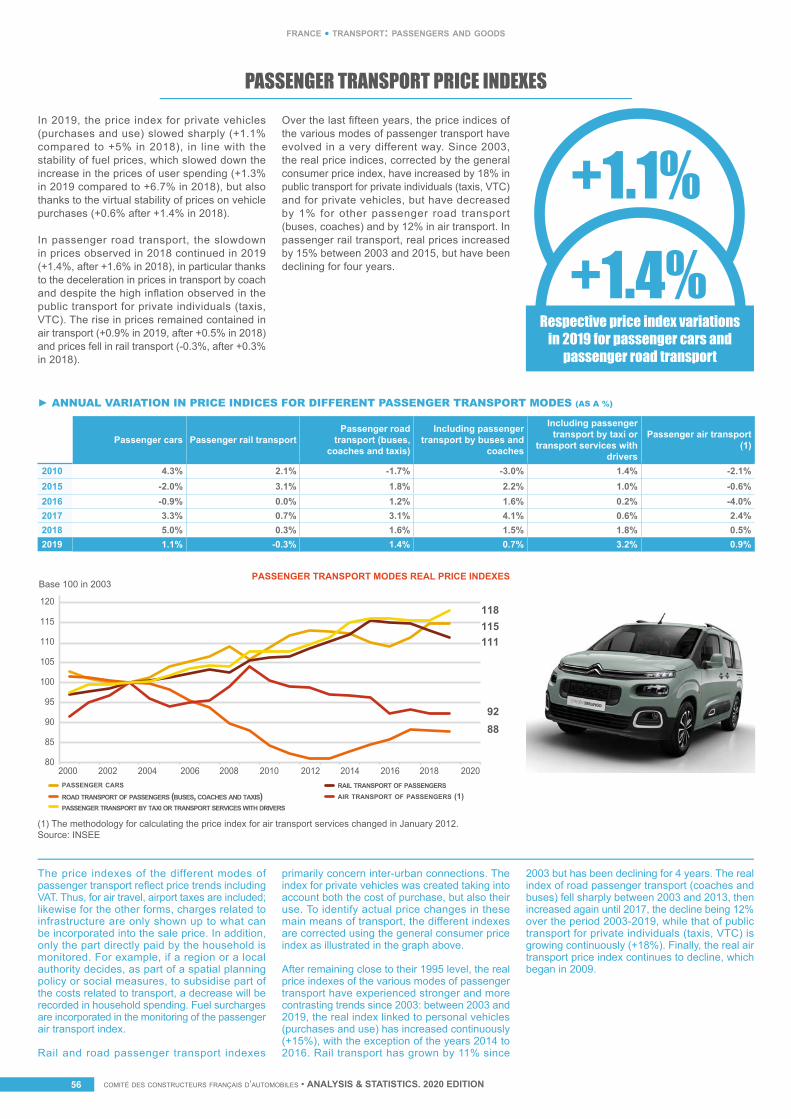
comité des constructeurs français d’automobiles • ANALYSIS & STATISTICS. 2020 EDITIONcomité des constructeurs français d’automobiles • ANALYSIS & STATISTICS. 2020 EDITION56
france • transport: passengers and goods
PASSENGER TRANSPORT PRICE INDEXESIn 2019, the price index for private vehicles (purchases and use) slowed sharply (+1.1% compared to +5% in 2018), in line with the stability of fuel prices, which slowed down the increase in the prices of user spending (+1.3% in 2019 compared to +6.7% in 2018), but also thanks to the virtual stability of prices on vehicle purchases (+0.6% after +1.4% in 2018).
In passenger road transport, the slowdown in prices observed in 2018 continued in 2019 (+1.4%, after +1.6% in 2018), in particular thanks to the deceleration in prices in transport by coach and despite the high inflation observed in the public transport for private individuals (taxis, VTC). The rise in prices remained contained in air transport (+0.9% in 2019, after +0.5% in 2018) and prices fell in rail transport (-0.3%, after +0.3% in 2018).
Over the last fifteen years, the price indices of the various modes of passenger transport have evolved in a very different way. Since 2003, the real price indices, corrected by the general consumer price index, have increased by 18% in public transport for private individuals (taxis, VTC) and for private vehicles, but have decreased by 1% for other passenger road transport (buses, coaches) and by 12% in air transport. In passenger rail transport, real prices increased by 15% between 2003 and 2015, but have been declining for four years.
Respective price index variations in 2019 for passenger cars and
passenger road transport
The price indexes of the different modes of passenger transport reflect price trends including VAT. Thus, for air travel, airport taxes are included; likewise for the other forms, charges related to infrastructure are only shown up to what can be incorporated into the sale price. In addition, only the part directly paid by the household is monitored. For example, if a region or a local authority decides, as part of a spatial planning policy or social measures, to subsidise part of the costs related to transport, a decrease will be recorded in household spending. Fuel surcharges are incorporated in the monitoring of the passenger air transport index.
Rail and road passenger transport indexes
primarily concern inter-urban connections. The index for private vehicles was created taking into account both the cost of purchase, but also their use. To identify actual price changes in these main means of transport, the different indexes are corrected using the general consumer price index as illustrated in the graph above.
After remaining close to their 1995 level, the real price indexes of the various modes of passenger transport have experienced stronger and more contrasting trends since 2003: between 2003 and 2019, the real index linked to personal vehicles (purchases and use) has increased continuously (+15%), with the exception of the years 2014 to 2016. Rail transport has grown by 11% since
2003 but has been declining for 4 years. The real index of road passenger transport (coaches and buses) fell sharply between 2003 and 2013, then increased again until 2017, the decline being 12% over the period 2003-2019, while that of public transport for private individuals (taxis, VTC) is growing continuously (+18%). Finally, the real air transport price index continues to decline, which began in 2009.
► ANNUAL VARIATION IN PRICE INDICES FOR DIFFERENT PASSENGER TRANSPORT MODES (AS A %)
Passenger cars Passenger rail transportPassenger road
transport (buses, coaches and taxis)
Including passenger transport by buses and
coaches
Including passenger transport by taxi or
transport services with drivers
Passenger air transport (1)
2010 4.3% 2.1% -1.7% -3.0% 1.4% -2.1%2015 -2.0% 3.1% 1.8% 2.2% 1.0% -0.6%2016 -0.9% 0.0% 1.2% 1.6% 0.2% -4.0%2017 3.3% 0.7% 3.1% 4.1% 0.6% 2.4%2018 5.0% 0.3% 1.6% 1.5% 1.8% 0.5%2019 1.1% -0.3% 1.4% 0.7% 3.2% 0.9%
(1) The methodology for calculating the price index for air transport services changed in January 2012.Source: INSEE
Base 100 in 2003PASSENGER TRANSPORT MODES REAL PRICE INDEXES
80
85
90
95
100
105
110
115
120
2010 2012 2014 2016 2018 202020022000 2004 2006 2008
115118
111
8892
PASSENGER CARS
ROAD TRANSPORT OF PASSENGERS (BUSES, COACHES AND TAXIS)PASSENGER TRANSPORT BY TAXI OR TRANSPORT SERVICES WITH DRIVERS
RAIL TRANSPORT OF PASSENGERSAIR TRANSPORT OF PASSENGERS (1)
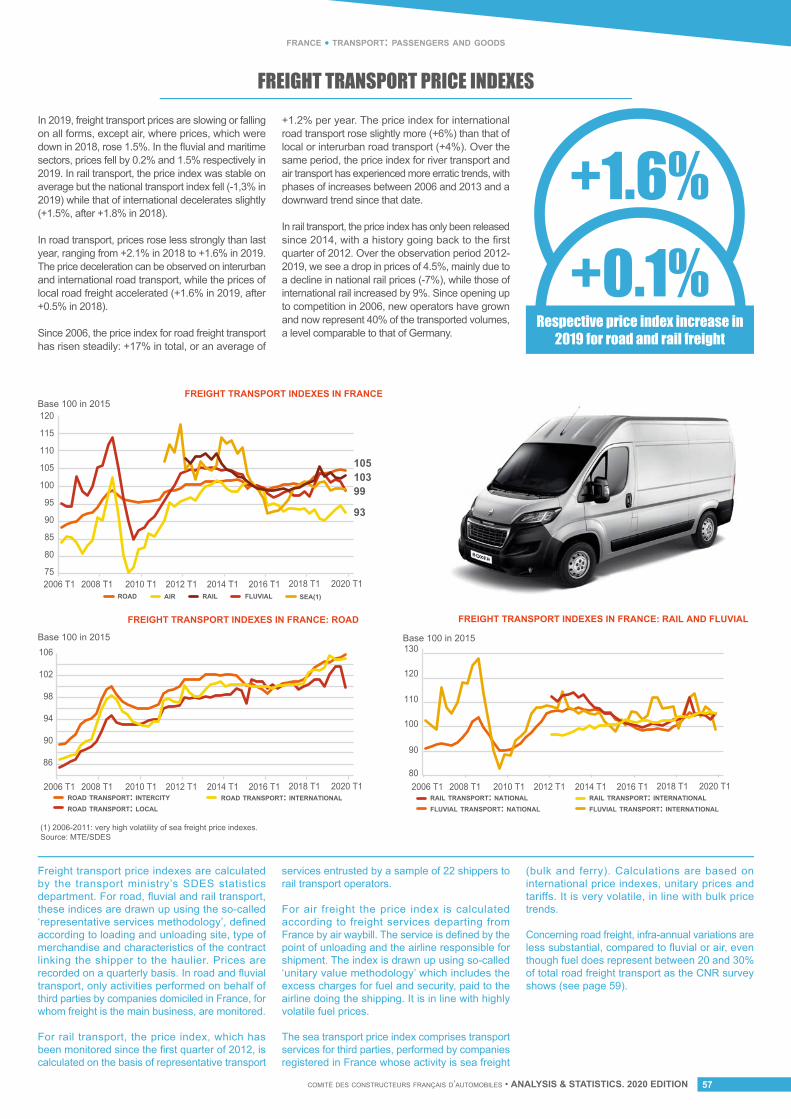
comité des constructeurs français d’automobiles • ANALYSIS & STATISTICS. 2020 EDITION 57
FREIGHT TRANSPORT PRICE INDEXESIn 2019, freight transport prices are slowing or falling on all forms, except air, where prices, which were down in 2018, rose 1.5%. In the fluvial and maritime sectors, prices fell by 0.2% and 1.5% respectively in 2019. In rail transport, the price index was stable on average but the national transport index fell (-1,3% in 2019) while that of international decelerates slightly (+1.5%, after +1.8% in 2018).
In road transport, prices rose less strongly than last year, ranging from +2.1% in 2018 to +1.6% in 2019. The price deceleration can be observed on interurban and international road transport, while the prices of local road freight accelerated (+1.6% in 2019, after +0.5% in 2018).
Since 2006, the price index for road freight transport has risen steadily: +17% in total, or an average of
+1.2% per year. The price index for international road transport rose slightly more (+6%) than that of local or interurban road transport (+4%). Over the same period, the price index for river transport and air transport has experienced more erratic trends, with phases of increases between 2006 and 2013 and a downward trend since that date.
In rail transport, the price index has only been released since 2014, with a history going back to the first quarter of 2012. Over the observation period 2012-2019, we see a drop in prices of 4.5%, mainly due to a decline in national rail prices (-7%), while those of international rail increased by 9%. Since opening up to competition in 2006, new operators have grown and now represent 40% of the transported volumes, a level comparable to that of Germany.
Respective price index increase in 2019 for road and rail freight
Freight transport price indexes are calculated by the transport ministry’s SDES statistics department. For road, fluvial and rail transport, these indices are drawn up using the so-called ‘representative services methodology’, defined according to loading and unloading site, type of merchandise and characteristics of the contract linking the shipper to the haulier. Prices are recorded on a quarterly basis. In road and fluvial transport, only activities performed on behalf of third parties by companies domiciled in France, for whom freight is the main business, are monitored.
For rail transport, the price index, which has been monitored since the first quarter of 2012, is calculated on the basis of representative transport
services entrusted by a sample of 22 shippers to rail transport operators.
For air freight the price index is calculated according to freight services departing from France by air waybill. The service is defined by the point of unloading and the airline responsible for shipment. The index is drawn up using so-called ‘unitary value methodology’ which includes the excess charges for fuel and security, paid to the airline doing the shipping. It is in line with highly volatile fuel prices.
The sea transport price index comprises transport services for third parties, performed by companies registered in France whose activity is sea freight
(bulk and ferry). Calculations are based on international price indexes, unitary prices and tariffs. It is very volatile, in line with bulk price trends.
Concerning road freight, infra-annual variations are less substantial, compared to fluvial or air, even though fuel does represent between 20 and 30% of total road freight transport as the CNR survey shows (see page 59).
10510399
93
ROAD FLUVIALAIR SEA(1)RAIL
75
85
80
90
95
100
105
115
110
120
2006 T1 2010 T1 2008 T1 2014 T1 2012 T1 2016 T1 2020 T1 2018 T1
2006 T1 2010 T1 2008 T1 2014 T1 2012 T1 2016 T1 2020 T1 2018 T1 2006 T1 2010 T1 2008 T1 2014 T1 2012 T1 2016 T1 2020 T1 2018 T1
FREIGHT TRANSPORT INDEXES IN FRANCE Base 100 in 2015
ROAD TRANSPORT: INTERCITYROAD TRANSPORT: LOCAL
ROAD TRANSPORT: INTERNATIONAL
FREIGHT TRANSPORT INDEXES IN FRANCE: ROAD
Base 100 in 2015
90
86
94
98
102
106
RAIL TRANSPORT: NATIONALFLUVIAL TRANSPORT: NATIONAL
RAIL TRANSPORT: INTERNATIONALFLUVIAL TRANSPORT: INTERNATIONAL
FREIGHT TRANSPORT INDEXES IN FRANCE: RAIL AND FLUVIAL
Base 100 in 2015
80
90
100
110
120
130
(1) 2006-2011: very high volatility of sea freight price indexes.Source: MTE/SDES
france • transport: passengers and goods
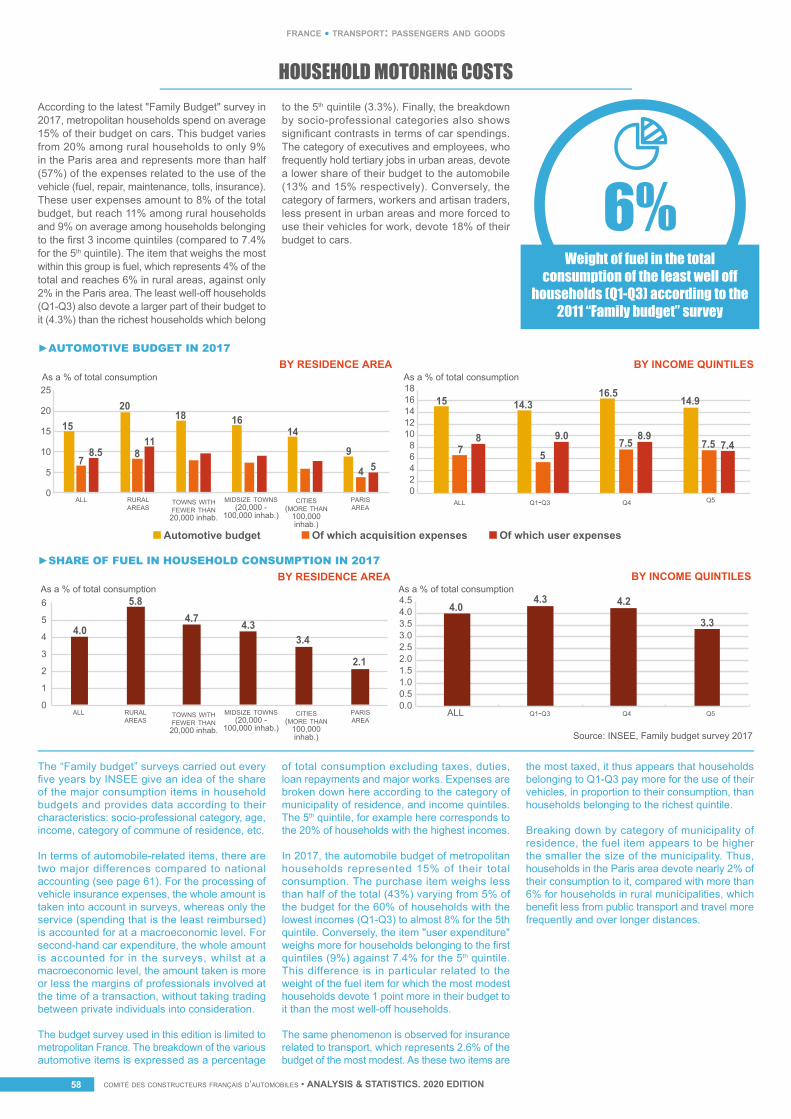
comité des constructeurs français d’automobiles • ANALYSIS & STATISTICS. 2020 EDITIONcomité des constructeurs français d’automobiles • ANALYSIS & STATISTICS. 2020 EDITION58
france • transport: passengers and goods
HOUSEHOLD MOTORING COSTSAccording to the latest "Family Budget" survey in 2017, metropolitan households spend on average 15% of their budget on cars. This budget varies from 20% among rural households to only 9% in the Paris area and represents more than half (57%) of the expenses related to the use of the vehicle (fuel, repair, maintenance, tolls, insurance). These user expenses amount to 8% of the total budget, but reach 11% among rural households and 9% on average among households belonging to the first 3 income quintiles (compared to 7.4% for the 5th quintile). The item that weighs the most within this group is fuel, which represents 4% of the total and reaches 6% in rural areas, against only 2% in the Paris area. The least well-off households (Q1-Q3) also devote a larger part of their budget to it (4.3%) than the richest households which belong
to the 5th quintile (3.3%). Finally, the breakdown by socio-professional categories also shows significant contrasts in terms of car spendings. The category of executives and employees, who frequently hold tertiary jobs in urban areas, devote a lower share of their budget to the automobile (13% and 15% respectively). Conversely, the category of farmers, workers and artisan traders, less present in urban areas and more forced to use their vehicles for work, devote 18% of their budget to cars.
6%Weight of fuel in the total
consumption of the least well off households (Q1-Q3) according to the
2011 “Family budget” survey
The “Family budget” surveys carried out every five years by INSEE give an idea of the share of the major consumption items in household budgets and provides data according to their characteristics: socio-professional category, age, income, category of commune of residence, etc.
In terms of automobile-related items, there are two major differences compared to national accounting (see page 61). For the processing of vehicle insurance expenses, the whole amount is taken into account in surveys, whereas only the service (spending that is the least reimbursed) is accounted for at a macroeconomic level. For second-hand car expenditure, the whole amount is accounted for in the surveys, whilst at a macroeconomic level, the amount taken is more or less the margins of professionals involved at the time of a transaction, without taking trading between private individuals into consideration.
The budget survey used in this edition is limited to metropolitan France. The breakdown of the various automotive items is expressed as a percentage
of total consumption excluding taxes, duties, loan repayments and major works. Expenses are broken down here according to the category of municipality of residence, and income quintiles. The 5th quintile, for example here corresponds to the 20% of households with the highest incomes.
In 2017, the automobile budget of metropolitan households represented 15% of their total consumption. The purchase item weighs less than half of the total (43%) varying from 5% of the budget for the 60% of households with the lowest incomes (Q1-Q3) to almost 8% for the 5th quintile. Conversely, the item "user expenditure" weighs more for households belonging to the first quintiles (9%) against 7.4% for the 5th quintile. This difference is in particular related to the weight of the fuel item for which the most modest households devote 1 point more in their budget to it than the most well-off households.
The same phenomenon is observed for insurance related to transport, which represents 2.6% of the budget of the most modest. As these two items are
the most taxed, it thus appears that households belonging to Q1-Q3 pay more for the use of their vehicles, in proportion to their consumption, than households belonging to the richest quintile.
Breaking down by category of municipality of residence, the fuel item appears to be higher the smaller the size of the municipality. Thus, households in the Paris area devote nearly 2% of their consumption to it, compared with more than 6% for households in rural municipalities, which benefit less from public transport and travel more frequently and over longer distances.
BY INCOME QUINTILES
0.00.51.01.52.02.53.03.54.04.5
Source: INSEE, Family budget survey 2017
BY RESIDENCE AREA
0
1
2
3
4
5
6
BY RESIDENCE AREA
0
5
10
15
20
25
02
64
81012141618
As a % of total consumption
As a % of total consumption As a % of total consumption
BY INCOME QUINTILESAs a % of total consumption
Q1-Q3 Q4 Q5ALL
Q1-Q3 Q4 Q5ALL
Automotive budget Of which acquisition expenses Of which user expenses
CITIES(MORE THAN
100,000inhab.)
PARISAREA
MIDSIZE TOWNS(20,000 -
100,000 inhab.)
TOWNS WITHFEWER THAN
20,000 inhab.
RURALAREAS
ALL
CITIES(MORE THAN
100,000inhab.)
PARISAREA
MIDSIZE TOWNS(20,000 -
100,000 inhab.)
TOWNS WITHFEWER THAN
20,000 inhab.
RURALAREAS
ALL
►AUTOMOTIVE BUDGET IN 2017
►SHARE OF FUEL IN HOUSEHOLD CONSUMPTION IN 2017
4.0
5.84.7 4.3
3.4
2.1
4.0
15
54
9
141618
118
20
15
78.5 7
8
14.3
5
9.0
16.5
7.58.9
14.9
7.5 7.4
4.3 4.2
3.3
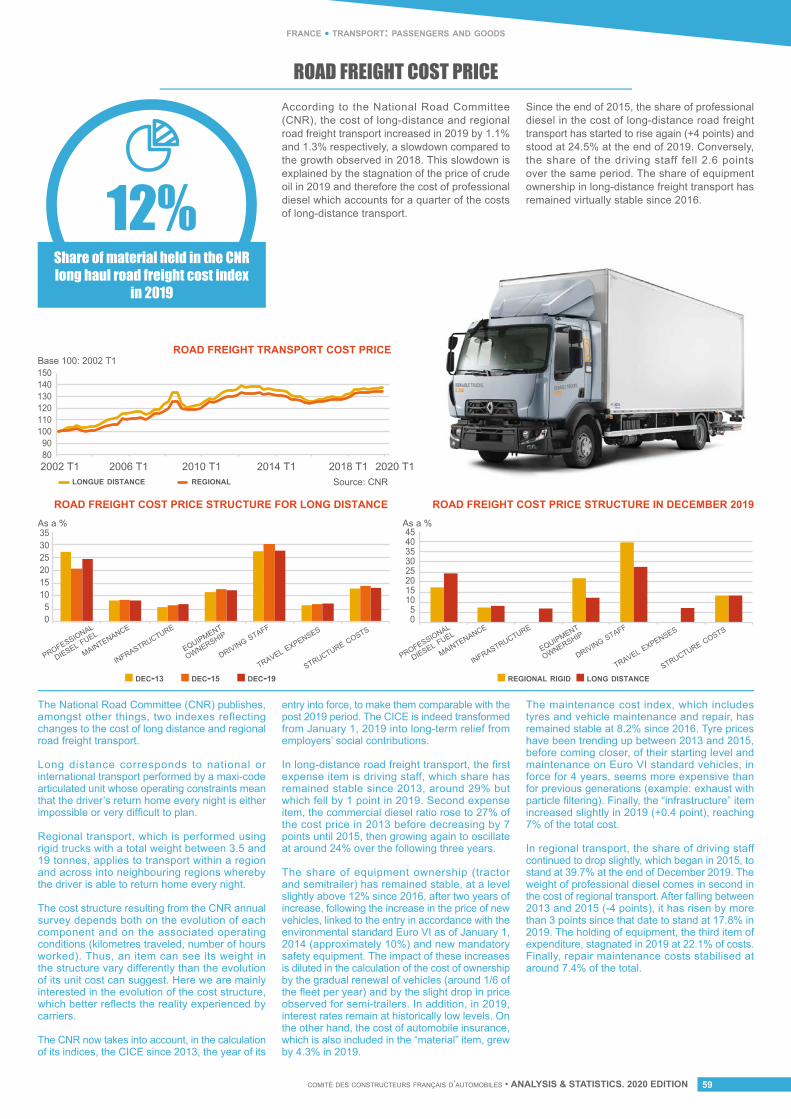
comité des constructeurs français d’automobiles • ANALYSIS & STATISTICS. 2020 EDITION 59
france • transport: passengers and goods
ROAD FREIGHT COST PRICEAccording to the National Road Committee (CNR), the cost of long-distance and regional road freight transport increased in 2019 by 1.1% and 1.3% respectively, a slowdown compared to the growth observed in 2018. This slowdown is explained by the stagnation of the price of crude oil in 2019 and therefore the cost of professional diesel which accounts for a quarter of the costs of long-distance transport.
Since the end of 2015, the share of professional diesel in the cost of long-distance road freight transport has started to rise again (+4 points) and stood at 24.5% at the end of 2019. Conversely, the share of the driving staff fell 2.6 points over the same period. The share of equipment ownership in long-distance freight transport has remained virtually stable since 2016.
Share of material held in the CNR long haul road freight cost index
in 2019
The National Road Committee (CNR) publishes, amongst other things, two indexes reflecting changes to the cost of long distance and regional road freight transport.
Long distance corresponds to national or international transport performed by a maxi-code articulated unit whose operating constraints mean that the driver’s return home every night is either impossible or very difficult to plan.
Regional transport, which is performed using rigid trucks with a total weight between 3.5 and 19 tonnes, applies to transport within a region and across into neighbouring regions whereby the driver is able to return home every night.
The cost structure resulting from the CNR annual survey depends both on the evolution of each component and on the associated operating conditions (kilometres traveled, number of hours worked). Thus, an item can see its weight in the structure vary differently than the evolution of its unit cost can suggest. Here we are mainly interested in the evolution of the cost structure, which better reflects the reality experienced by carriers.
The CNR now takes into account, in the calculation of its indices, the CICE since 2013, the year of its
entry into force, to make them comparable with the post 2019 period. The CICE is indeed transformed from January 1, 2019 into long-term relief from employers’ social contributions.
In long-distance road freight transport, the first expense item is driving staff, which share has remained stable since 2013, around 29% but which fell by 1 point in 2019. Second expense item, the commercial diesel ratio rose to 27% of the cost price in 2013 before decreasing by 7 points until 2015, then growing again to oscillate at around 24% over the following three years.
The share of equipment ownership (tractor and semitrailer) has remained stable, at a level slightly above 12% since 2016, after two years of increase, following the increase in the price of new vehicles, linked to the entry in accordance with the environmental standard Euro VI as of January 1, 2014 (approximately 10%) and new mandatory safety equipment. The impact of these increases is diluted in the calculation of the cost of ownership by the gradual renewal of vehicles (around 1/6 of the fleet per year) and by the slight drop in price observed for semi-trailers. In addition, in 2019, interest rates remain at historically low levels. On the other hand, the cost of automobile insurance, which is also included in the “material” item, grew by 4.3% in 2019.
The maintenance cost index, which includes tyres and vehicle maintenance and repair, has remained stable at 8.2% since 2016. Tyre prices have been trending up between 2013 and 2015, before coming closer, of their starting level and maintenance on Euro VI standard vehicles, in force for 4 years, seems more expensive than for previous generations (example: exhaust with particle filtering). Finally, the “infrastructure” item increased slightly in 2019 (+0.4 point), reaching 7% of the total cost.
In regional transport, the share of driving staff continued to drop slightly, which began in 2015, to stand at 39.7% at the end of December 2019. The weight of professional diesel comes in second in the cost of regional transport. After falling between 2013 and 2015 (-4 points), it has risen by more than 3 points since that date to stand at 17.8% in 2019. The holding of equipment, the third item of expenditure, stagnated in 2019 at 22.1% of costs. Finally, repair maintenance costs stabilised at around 7.4% of the total.
12%
As a % As a %
05
101520253035
0
10
20
3025
15
5
454035
ROAD FREIGHT COST PRICE STRUCTURE IN DECEMBER 2019ROAD FREIGHT COST PRICE STRUCTURE FOR LONG DISTANCE
PROFESSIONAL
DIESEL FUEL
MAINTENANCE
INFRASTRUCTURE
EQUIPMENT
OWNERSHIP
DRIVING STAFF
TRAVEL EXPENSES
STRUCTURE COSTS
PROFESSIONAL
DIESEL FUEL
MAINTENANCE
INFRASTRUCTURE
EQUIPMENT
OWNERSHIP
DRIVING STAFF
TRAVEL EXPENSES
STRUCTURE COSTS
DEC-13 DEC-15 DEC-19 REGIONAL RIGID LONG DISTANCE
80 90
100 110 120 130 140 150 Base 100: 2002 T1
ROAD FREIGHT TRANSPORT COST PRICE
2018 T1 2020 T12014 T12010 T12006 T12002 T1LONGUE DISTANCE REGIONAL Source: CNR
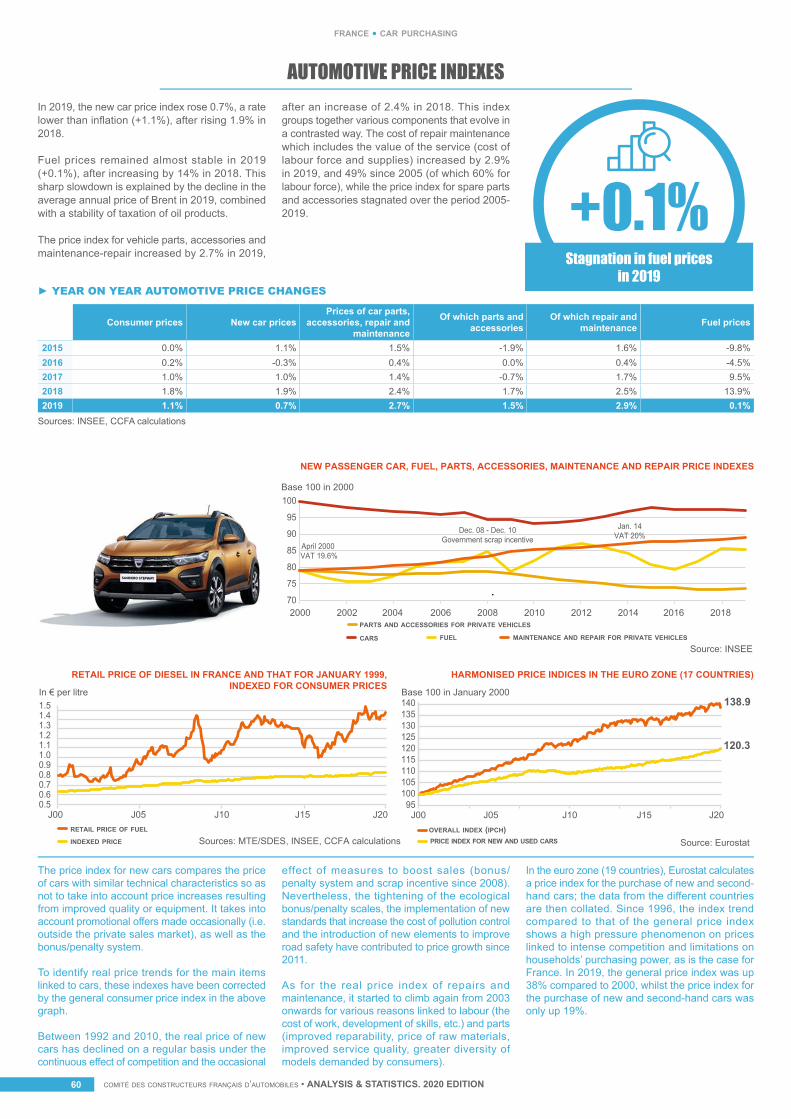
comité des constructeurs français d’automobiles • ANALYSIS & STATISTICS. 2020 EDITIONcomité des constructeurs français d’automobiles • ANALYSIS & STATISTICS. 2020 EDITION60
france • car purchasing
AUTOMOTIVE PRICE INDEXES In 2019, the new car price index rose 0.7%, a rate lower than inflation (+1.1%), after rising 1.9% in 2018.
Fuel prices remained almost stable in 2019 (+0.1%), after increasing by 14% in 2018. This sharp slowdown is explained by the decline in the average annual price of Brent in 2019, combined with a stability of taxation of oil products.
The price index for vehicle parts, accessories and maintenance-repair increased by 2.7% in 2019,
after an increase of 2.4% in 2018. This index groups together various components that evolve in a contrasted way. The cost of repair maintenance which includes the value of the service (cost of labour force and supplies) increased by 2.9% in 2019, and 49% since 2005 (of which 60% for labour force), while the price index for spare parts and accessories stagnated over the period 2005-2019. +0.1%
Stagnation in fuel pricesin 2019
The price index for new cars compares the price of cars with similar technical characteristics so as not to take into account price increases resulting from improved quality or equipment. It takes into account promotional offers made occasionally (i.e. outside the private sales market), as well as the bonus/penalty system.
To identify real price trends for the main items linked to cars, these indexes have been corrected by the general consumer price index in the above graph.
Between 1992 and 2010, the real price of new cars has declined on a regular basis under the continuous effect of competition and the occasional
effect of measures to boost sales (bonus/penalty system and scrap incentive since 2008). Nevertheless, the tightening of the ecological bonus/penalty scales, the implementation of new standards that increase the cost of pollution control and the introduction of new elements to improve road safety have contributed to price growth since 2011.
As for the real price index of repairs and maintenance, it started to climb again from 2003 onwards for various reasons linked to labour (the cost of work, development of skills, etc.) and parts (improved reparability, price of raw materials, improved service quality, greater diversity of models demanded by consumers).
In the euro zone (19 countries), Eurostat calculates a price index for the purchase of new and second-hand cars; the data from the different countries are then collated. Since 1996, the index trend compared to that of the general price index shows a high pressure phenomenon on prices linked to intense competition and limitations on households’ purchasing power, as is the case for France. In 2019, the general price index was up 38% compared to 2000, whilst the price index for the purchase of new and second-hand cars was only up 19%.
► YEAR ON YEAR AUTOMOTIVE PRICE CHANGES
Consumer prices New car pricesPrices of car parts,
accessories, repair and maintenance
Of which parts and accessories
Of which repair and maintenance Fuel prices
2015 0.0% 1.1% 1.5% -1.9% 1.6% -9.8%2016 0.2% -0.3% 0.4% 0.0% 0.4% -4.5%2017 1.0% 1.0% 1.4% -0.7% 1.7% 9.5%2018 1.8% 1.9% 2.4% 1.7% 2.5% 13.9%2019 1.1% 0.7% 2.7% 1.5% 2.9% 0.1%
Sources: INSEE, CCFA calculations
Base 100 in 2000
Source: INSEE
70
75
80
85
90
95
100
20022000 2004 2006 2008 2010 2012 2014 2016 2018
NEW PASSENGER CAR, FUEL, PARTS, ACCESSORIES, MAINTENANCE AND REPAIR PRICE INDEXES
CARS
PARTS AND ACCESSORIES FOR PRIVATE VEHICLES
FUEL MAINTENANCE AND REPAIR FOR PRIVATE VEHICLES
In € per litre
RETAIL PRICE OF FUEL
INDEXED PRICE
RETAIL PRICE OF DIESEL IN FRANCE AND THAT FOR JANUARY 1999,INDEXED FOR CONSUMER PRICES
Sources: MTE/SDES, INSEE, CCFA calculations
0.5 0.6 0.7 0.8 0.9 1.0 1.1 1.2 1.3 1.4 1.5
J00 J15 J20 J05 J10
Base 100 in January 2000
Source: Eurostat
J00 J10 J15J05 J20
138.9
120.3 115 110 105 100
95
120 125 130 135 140
HARMONISED PRICE INDICES IN THE EURO ZONE (17 COUNTRIES)
OVERALL INDEX (IPCH) PRICE INDEX FOR NEW AND USED CARS
E@42*%""*2.*[email protected]>*&"""
April 2000 VAT 19.6%
Jan. 14 VAT 20%
Dec. 08 - Dec. 10 Government scrap incentive
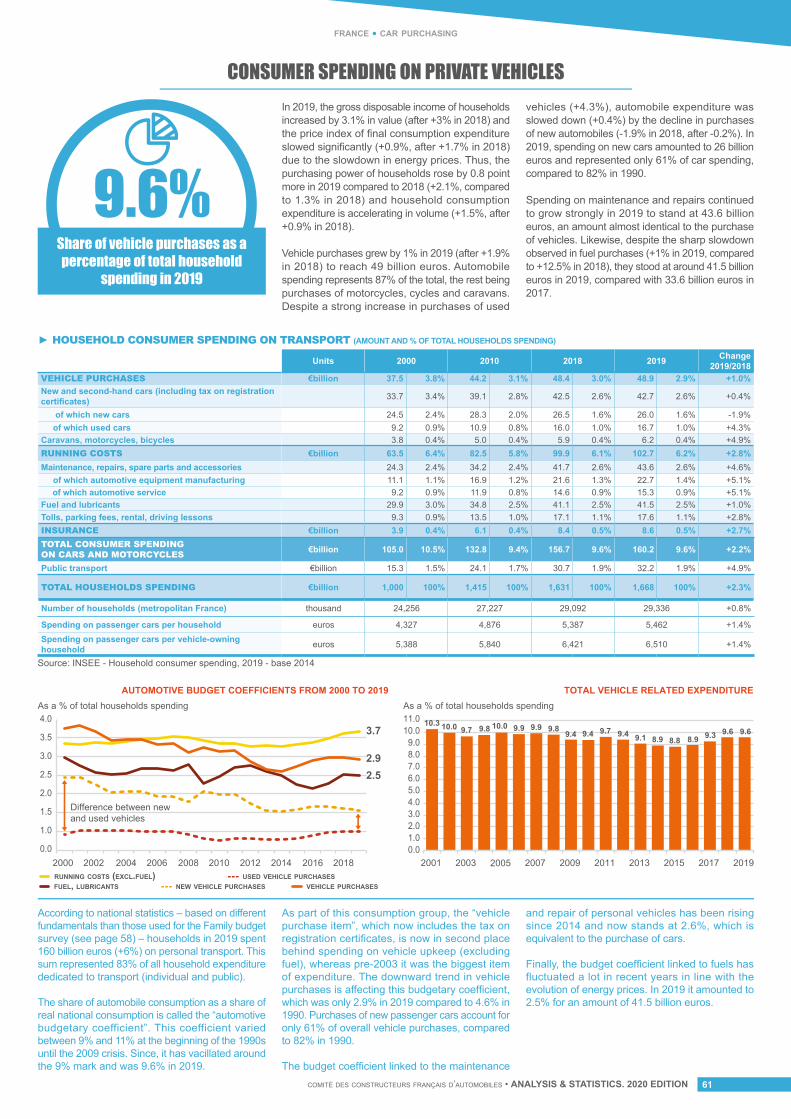
comité des constructeurs français d’automobiles • ANALYSIS & STATISTICS. 2020 EDITION 61
france • car purchasing
CONSUMER SPENDING ON PRIVATE VEHICLESIn 2019, the gross disposable income of households increased by 3.1% in value (after +3% in 2018) and the price index of final consumption expenditure slowed significantly (+0.9%, after +1.7% in 2018) due to the slowdown in energy prices. Thus, the purchasing power of households rose by 0.8 point more in 2019 compared to 2018 (+2.1%, compared to 1.3% in 2018) and household consumption expenditure is accelerating in volume (+1.5%, after +0.9% in 2018).
Vehicle purchases grew by 1% in 2019 (after +1.9% in 2018) to reach 49 billion euros. Automobile spending represents 87% of the total, the rest being purchases of motorcycles, cycles and caravans. Despite a strong increase in purchases of used
vehicles (+4.3%), automobile expenditure was slowed down (+0.4%) by the decline in purchases of new automobiles (-1.9% in 2018, after -0.2%). In 2019, spending on new cars amounted to 26 billion euros and represented only 61% of car spending, compared to 82% in 1990.
Spending on maintenance and repairs continued to grow strongly in 2019 to stand at 43.6 billion euros, an amount almost identical to the purchase of vehicles. Likewise, despite the sharp slowdown observed in fuel purchases (+1% in 2019, compared to +12.5% in 2018), they stood at around 41.5 billion euros in 2019, compared with 33.6 billion euros in 2017.
9.6%Share of vehicle purchases as a percentage of total household
spending in 2019
According to national statistics – based on different fundamentals than those used for the Family budget survey (see page 58) – households in 2019 spent 160 billion euros (+6%) on personal transport. This sum represented 83% of all household expenditure dedicated to transport (individual and public).
The share of automobile consumption as a share of real national consumption is called the “automotive budgetary coefficient”. This coefficient varied between 9% and 11% at the beginning of the 1990s until the 2009 crisis. Since, it has vacillated around the 9% mark and was 9.6% in 2019.
As part of this consumption group, the “vehicle purchase item”, which now includes the tax on registration certificates, is now in second place behind spending on vehicle upkeep (excluding fuel), whereas pre-2003 it was the biggest item of expenditure. The downward trend in vehicle purchases is affecting this budgetary coefficient, which was only 2.9% in 2019 compared to 4.6% in 1990. Purchases of new passenger cars account for only 61% of overall vehicle purchases, compared to 82% in 1990.
The budget coefficient linked to the maintenance
and repair of personal vehicles has been rising since 2014 and now stands at 2.6%, which is equivalent to the purchase of cars.
Finally, the budget coefficient linked to fuels has fluctuated a lot in recent years in line with the evolution of energy prices. In 2019 it amounted to 2.5% for an amount of 41.5 billion euros.
► HOUSEHOLD CONSUMER SPENDING ON TRANSPORT (AMOUNT AND % OF TOTAL HOUSEHOLDS SPENDING)
Units 2000 2010 2018 2019 Change 2019/2018
VEHICLE PURCHASES €billion 37.5 3.8% 44.2 3.1% 48.4 3.0% 48.9 2.9% +1.0%New and second-hand cars (including tax on registration certificates) 33.7 3.4% 39.1 2.8% 42.5 2.6% 42.7 2.6% +0.4%
of which new cars 24.5 2.4% 28.3 2.0% 26.5 1.6% 26.0 1.6% -1.9% of which used cars 9.2 0.9% 10.9 0.8% 16.0 1.0% 16.7 1.0% +4.3%Caravans, motorcycles, bicycles 3.8 0.4% 5.0 0.4% 5.9 0.4% 6.2 0.4% +4.9%RUNNING COSTS €billion 63.5 6.4% 82.5 5.8% 99.9 6.1% 102.7 6.2% +2.8%Maintenance, repairs, spare parts and accessories 24.3 2.4% 34.2 2.4% 41.7 2.6% 43.6 2.6% +4.6% of which automotive equipment manufacturing 11.1 1.1% 16.9 1.2% 21.6 1.3% 22.7 1.4% +5.1% of which automotive service 9.2 0.9% 11.9 0.8% 14.6 0.9% 15.3 0.9% +5.1%Fuel and lubricants 29.9 3.0% 34.8 2.5% 41.1 2.5% 41.5 2.5% +1.0%Tolls, parking fees, rental, driving lessons 9.3 0.9% 13.5 1.0% 17.1 1.1% 17.6 1.1% +2.8%INSURANCE €billion 3.9 0.4% 6.1 0.4% 8.4 0.5% 8.6 0.5% +2.7%TOTAL CONSUMER SPENDING ON CARS AND MOTORCYCLES €billion 105.0 10.5% 132.8 9.4% 156.7 9.6% 160.2 9.6% +2.2%
Public transport €billion 15.3 1.5% 24.1 1.7% 30.7 1.9% 32.2 1.9% +4.9%
TOTAL HOUSEHOLDS SPENDING €billion 1,000 100% 1,415 100% 1,631 100% 1,668 100% +2.3%
Number of households (metropolitan France) thousand 24,256 27,227 29,092 29,336 +0.8%
Spending on passenger cars per household euros 4,327 4,876 5,387 5,462 +1.4%Spending on passenger cars per vehicle-owning household euros 5,388 5,840 6,421 6,510 +1.4%
2018201620142012201020082006200420022000 2017 201920152013201120092007200520032001
AUTOMOTIVE BUDGET COEFFICIENTS FROM 2000 TO 2019As a % of total households spending
VEHICLE PURCHASESFUEL, LUBRICANTS NEW VEHICLE PURCHASESUSED VEHICLE PURCHASESRUNNING COSTS (EXCL.FUEL)
2.92.5
3.7
0.0
1.0
2.5
2.0
1.5
3.0
3.5
4.0
TOTAL VEHICLE RELATED EXPENDITUREAs a % of total households spending
0.0
2.01.0
4.03.0
6.05.0
8.07.0
10.011.0
9.0
10.3 10.0 9.7 9.8 10.0 9.9 9.9 9.8 9.4 9.4 9.7 9.4 9.1 8.9 8.8 8.9 9.3 9.6 9.6
Difference between newand used vehicles
Source: INSEE - Household consumer spending, 2019 - base 2014
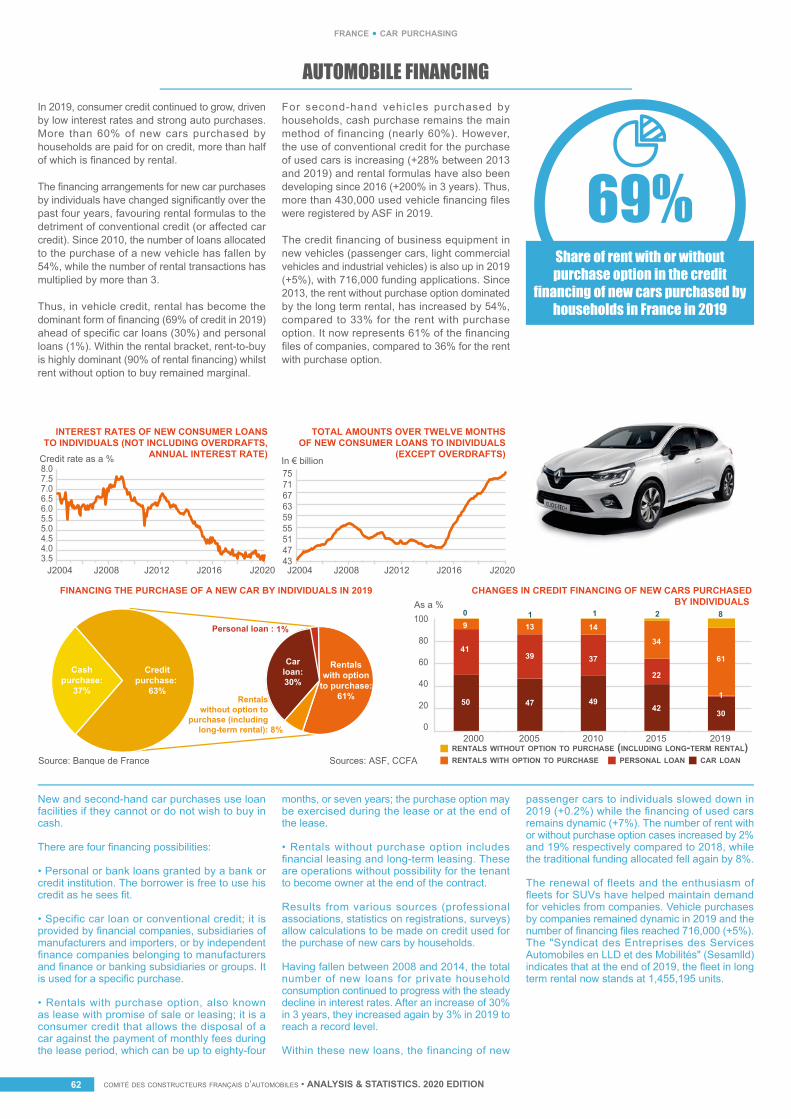
comité des constructeurs français d’automobiles • ANALYSIS & STATISTICS. 2020 EDITIONcomité des constructeurs français d’automobiles • ANALYSIS & STATISTICS. 2020 EDITION62
france • car purchasing
AUTOMOBILE FINANCINGIn 2019, consumer credit continued to grow, driven by low interest rates and strong auto purchases. More than 60% of new cars purchased by households are paid for on credit, more than half of which is financed by rental.
The financing arrangements for new car purchases by individuals have changed significantly over the past four years, favouring rental formulas to the detriment of conventional credit (or affected car credit). Since 2010, the number of loans allocated to the purchase of a new vehicle has fallen by 54%, while the number of rental transactions has multiplied by more than 3.
Thus, in vehicle credit, rental has become the dominant form of financing (69% of credit in 2019) ahead of specific car loans (30%) and personal loans (1%). Within the rental bracket, rent-to-buy is highly dominant (90% of rental financing) whilst rent without option to buy remained marginal.
For second-hand vehicles purchased by households, cash purchase remains the main method of financing (nearly 60%). However, the use of conventional credit for the purchase of used cars is increasing (+28% between 2013 and 2019) and rental formulas have also been developing since 2016 (+200% in 3 years). Thus, more than 430,000 used vehicle financing files were registered by ASF in 2019.
The credit financing of business equipment in new vehicles (passenger cars, light commercial vehicles and industrial vehicles) is also up in 2019 (+5%), with 716,000 funding applications. Since 2013, the rent without purchase option dominated by the long term rental, has increased by 54%, compared to 33% for the rent with purchase option. It now represents 61% of the financing files of companies, compared to 36% for the rent with purchase option.
69%Share of rent with or without purchase option in the credit
financing of new cars purchased by households in France in 2019
New and second-hand car purchases use loan facilities if they cannot or do not wish to buy in cash.
There are four financing possibilities:
• Personal or bank loans granted by a bank or credit institution. The borrower is free to use his credit as he sees fit.
• Specific car loan or conventional credit; it is provided by financial companies, subsidiaries of manufacturers and importers, or by independent finance companies belonging to manufacturers and finance or banking subsidiaries or groups. It is used for a specific purchase.
• Rentals with purchase option, also known as lease with promise of sale or leasing; it is a consumer credit that allows the disposal of a car against the payment of monthly fees during the lease period, which can be up to eighty-four
months, or seven years; the purchase option may be exercised during the lease or at the end of the lease.
• Rentals without purchase option includes financial leasing and long-term leasing. These are operations without possibility for the tenant to become owner at the end of the contract. Results from various sources (professional associations, statistics on registrations, surveys) allow calculations to be made on credit used for the purchase of new cars by households.
Having fallen between 2008 and 2014, the total number of new loans for private household consumption continued to progress with the steady decline in interest rates. After an increase of 30% in 3 years, they increased again by 3% in 2019 to reach a record level.
Within these new loans, the financing of new
passenger cars to individuals slowed down in 2019 (+0.2%) while the financing of used cars remains dynamic (+7%). The number of rent with or without purchase option cases increased by 2% and 19% respectively compared to 2018, while the traditional funding allocated fell again by 8%.
The renewal of fleets and the enthusiasm of fleets for SUVs have helped maintain demand for vehicles from companies. Vehicle purchases by companies remained dynamic in 2019 and the number of financing files reached 716,000 (+5%). The "Syndicat des Entreprises des Services Automobiles en LLD et des Mobilités" (Sesamlld) indicates that at the end of 2019, the fleet in long term rental now stands at 1,455,195 units.
As a %
0
20
40
60
80
100
20052000 2010 2015 2019
FINANCING THE PURCHASE OF A NEW CAR BY INDIVIDUALS IN 2019 CHANGES IN CREDIT FINANCING OF NEW CARS PURCHASEDBY INDIVIDUALS
RENTALS WITH OPTION TO PURCHASERENTALS WITHOUT OPTION TO PURCHASE (INCLUDING LONG-TERM RENTAL)
PERSONAL LOAN CAR LOANSources: ASF, CCFASource: Banque de France
Credit rate as a %
3.5 4.0 4.5 5.0 5.5 6.0 6.5 7.0 7.5 8.0
J2004 J2008 J2012 J2016 J2020
INTEREST RATES OF NEW CONSUMER LOANSTO INDIVIDUALS (NOT INCLUDING OVERDRAFTS,
ANNUAL INTEREST RATE)In € billion
43 47 51 55 5963
757167
TOTAL AMOUNTS OVER TWELVE MONTHSOF NEW CONSUMER LOANS TO INDIVIDUALS
(EXCEPT OVERDRAFTS)
39
50
41
90
47
131
39
1
49
14
37
42
22
34
2
30
1
61
8
J2004 J2008 J2012 J2016 J2020
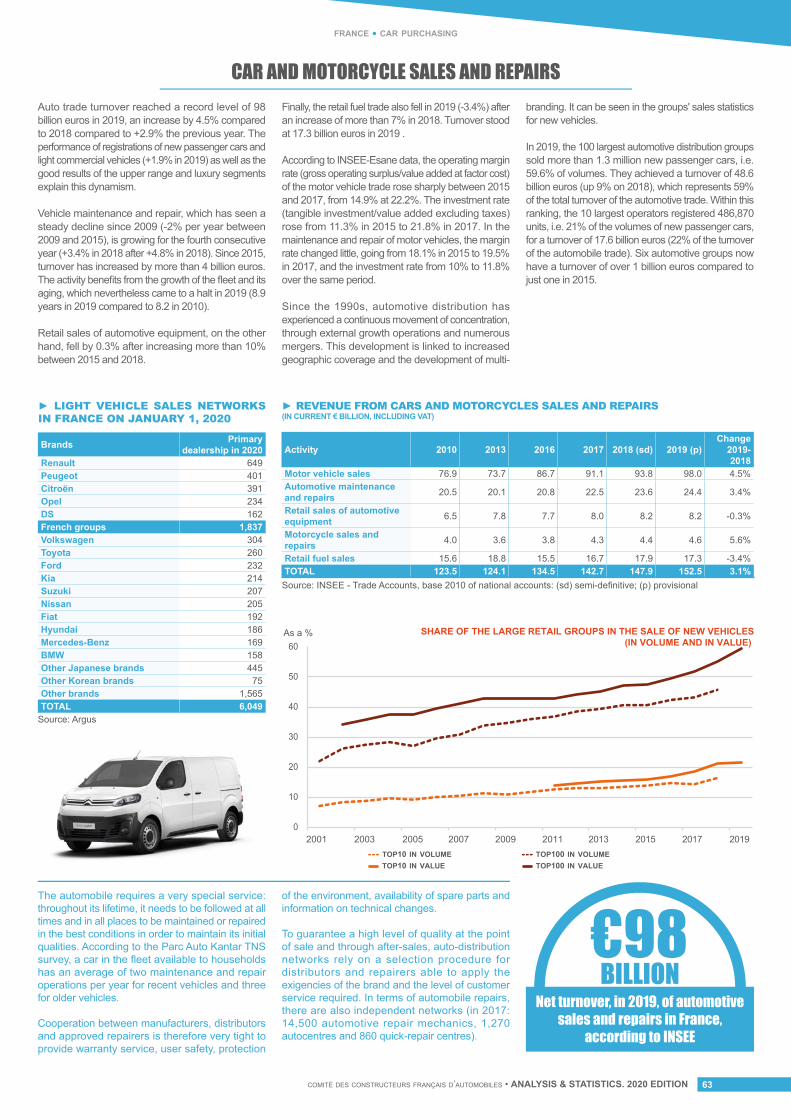
comité des constructeurs français d’automobiles • ANALYSIS & STATISTICS. 2020 EDITION 63
france • car purchasing
CAR AND MOTORCYCLE SALES AND REPAIRSAuto trade turnover reached a record level of 98 billion euros in 2019, an increase by 4.5% compared to 2018 compared to +2.9% the previous year. The performance of registrations of new passenger cars and light commercial vehicles (+1.9% in 2019) as well as the good results of the upper range and luxury segments explain this dynamism.
Vehicle maintenance and repair, which has seen a steady decline since 2009 (-2% per year between 2009 and 2015), is growing for the fourth consecutive year (+3.4% in 2018 after +4.8% in 2018). Since 2015, turnover has increased by more than 4 billion euros. The activity benefits from the growth of the fleet and its aging, which nevertheless came to a halt in 2019 (8.9 years in 2019 compared to 8.2 in 2010).
Retail sales of automotive equipment, on the other hand, fell by 0.3% after increasing more than 10% between 2015 and 2018.
Finally, the retail fuel trade also fell in 2019 (-3.4%) after an increase of more than 7% in 2018. Turnover stood at 17.3 billion euros in 2019 .
According to INSEE-Esane data, the operating margin rate (gross operating surplus/value added at factor cost) of the motor vehicle trade rose sharply between 2015 and 2017, from 14.9% at 22.2%. The investment rate (tangible investment/value added excluding taxes) rose from 11.3% in 2015 to 21.8% in 2017. In the maintenance and repair of motor vehicles, the margin rate changed little, going from 18.1% in 2015 to 19.5% in 2017, and the investment rate from 10% to 11.8% over the same period.
Since the 1990s, automotive distribution has experienced a continuous movement of concentration, through external growth operations and numerous mergers. This development is linked to increased geographic coverage and the development of multi-
branding. It can be seen in the groups' sales statistics for new vehicles.
In 2019, the 100 largest automotive distribution groups sold more than 1.3 million new passenger cars, i.e. 59.6% of volumes. They achieved a turnover of 48.6 billion euros (up 9% on 2018), which represents 59% of the total turnover of the automotive trade. Within this ranking, the 10 largest operators registered 486,870 units, i.e. 21% of the volumes of new passenger cars, for a turnover of 17.6 billion euros (22% of the turnover of the automobile trade). Six automotive groups now have a turnover of over 1 billion euros compared to just one in 2015.
Net turnover, in 2019, of automotive sales and repairs in France,
according to INSEE
The automobile requires a very special service: throughout its lifetime, it needs to be followed at all times and in all places to be maintained or repaired in the best conditions in order to maintain its initial qualities. According to the Parc Auto Kantar TNS survey, a car in the fleet available to households has an average of two maintenance and repair operations per year for recent vehicles and three for older vehicles.
Cooperation between manufacturers, distributors and approved repairers is therefore very tight to provide warranty service, user safety, protection
of the environment, availability of spare parts and information on technical changes.
To guarantee a high level of quality at the point of sale and through after-sales, auto-distribution networks rely on a selection procedure for distributors and repairers able to apply the exigencies of the brand and the level of customer service required. In terms of automobile repairs, there are also independent networks (in 2017: 14,500 automotive repair mechanics, 1,270 autocentres and 860 quick-repair centres).
► LIGHT VEHICLE SALES NETWORKS IN FRANCE ON JANUARY 1, 2020
► REVENUE FROM CARS AND MOTORCYCLES SALES AND REPAIRS(IN CURRENT € BILLION, INCLUDING VAT)
Brands Primary dealership in 2020
Renault 649Peugeot 401Citroën 391Opel 234DS 162French groups 1,837Volkswagen 304Toyota 260Ford 232Kia 214Suzuki 207Nissan 205Fiat 192Hyundai 186Mercedes-Benz 169BMW 158Other Japanese brands 445Other Korean brands 75Other brands 1,565TOTAL 6,049
Activity 2010 2013 2016 2017 2018 (sd) 2019 (p)Change
2019-2018
Motor vehicle sales 76.9 73.7 86.7 91.1 93.8 98.0 4.5%Automotive maintenance and repairs 20.5 20.1 20.8 22.5 23.6 24.4 3.4%
Retail sales of automotive equipment 6.5 7.8 7.7 8.0 8.2 8.2 -0.3%
Motorcycle sales and repairs 4.0 3.6 3.8 4.3 4.4 4.6 5.6%
Retail fuel sales 15.6 18.8 15.5 16.7 17.9 17.3 -3.4%TOTAL 123.5 124.1 134.5 142.7 147.9 152.5 3.1%
Source: Argus
Source: INSEE - Trade Accounts, base 2010 of national accounts: (sd) semi-definitive; (p) provisional
€98BILLION
As a %
2001 2003 2005 2007 2009 2011 2013 2015 2017 20190
10
20
30
40
50
60
TOP10 IN VOLUME TOP100 IN VOLUMETOP10 IN VALUE TOP100 IN VALUE
SHARE OF THE LARGE RETAIL GROUPS IN THE SALE OF NEW VEHICLES (IN VOLUME AND IN VALUE)
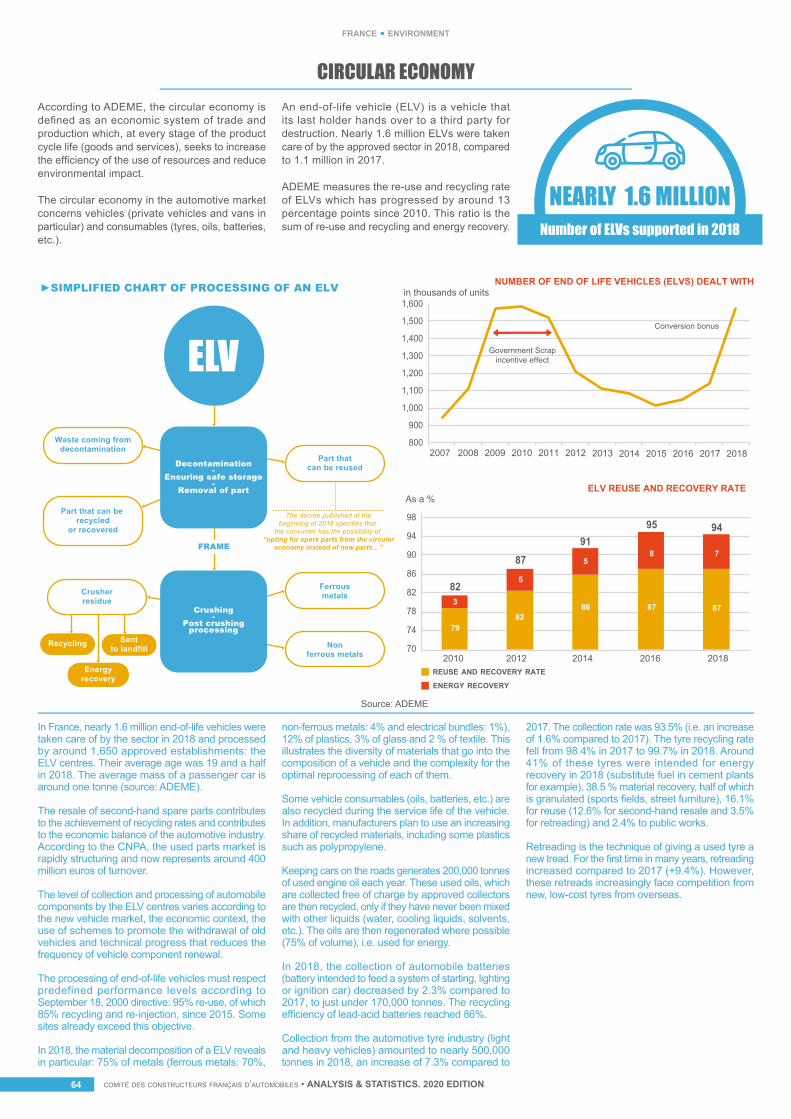
comité des constructeurs français d’automobiles • ANALYSIS & STATISTICS. 2020 EDITIONcomité des constructeurs français d’automobiles • ANALYSIS & STATISTICS. 2020 EDITION64
france • environment
CIRCULAR ECONOMYAccording to ADEME, the circular economy is defined as an economic system of trade and production which, at every stage of the product cycle life (goods and services), seeks to increase the efficiency of the use of resources and reduce environmental impact.
The circular economy in the automotive market concerns vehicles (private vehicles and vans in particular) and consumables (tyres, oils, batteries, etc.).
An end-of-life vehicle (ELV) is a vehicle that its last holder hands over to a third party for destruction. Nearly 1.6 million ELVs were taken care of by the approved sector in 2018, compared to 1.1 million in 2017.
ADEME measures the re-use and recycling rate of ELVs which has progressed by around 13 percentage points since 2010. This ratio is the sum of re-use and recycling and energy recovery.
NEARLY 1.6 MILLIONNumber of ELVs supported in 2018
Source: ADEME
In France, nearly 1.6 million end-of-life vehicles were taken care of by the sector in 2018 and processed by around 1,650 approved establishments: the ELV centres. Their average age was 19 and a half in 2018. The average mass of a passenger car is around one tonne (source: ADEME).
The resale of second-hand spare parts contributes to the achievement of recycling rates and contributes to the economic balance of the automotive industry. According to the CNPA, the used parts market is rapidly structuring and now represents around 400 million euros of turnover.
The level of collection and processing of automobile components by the ELV centres varies according to the new vehicle market, the economic context, the use of schemes to promote the withdrawal of old vehicles and technical progress that reduces the frequency of vehicle component renewal.
The processing of end-of-life vehicles must respect predefined performance levels according to September 18, 2000 directive: 95% re-use, of which 85% recycling and re-injection, since 2015. Some sites already exceed this objective.
In 2018, the material decomposition of a ELV reveals in particular: 75% of metals (ferrous metals: 70%,
non-ferrous metals: 4% and electrical bundles: 1%), 12% of plastics, 3% of glass and 2 % of textile. This illustrates the diversity of materials that go into the composition of a vehicle and the complexity for the optimal reprocessing of each of them.
Some vehicle consumables (oils, batteries, etc.) are also recycled during the service life of the vehicle. In addition, manufacturers plan to use an increasing share of recycled materials, including some plastics such as polypropylene.
Keeping cars on the roads generates 200,000 tonnes of used engine oil each year. These used oils, which are collected free of charge by approved collectors are then recycled, only if they have never been mixed with other liquids (water, cooling liquids, solvents, etc.). The oils are then regenerated where possible (75% of volume), i.e. used for energy.
In 2018, the collection of automobile batteries (battery intended to feed a system of starting, lighting or ignition car) decreased by 2.3% compared to 2017, to just under 170,000 tonnes. The recycling efficiency of lead-acid batteries reached 86%.
Collection from the automotive tyre industry (light and heavy vehicles) amounted to nearly 500,000 tonnes in 2018, an increase of 7.3% compared to
2017. The collection rate was 93.5% (i.e. an increase of 1.6% compared to 2017). The tyre recycling rate fell from 98.4% in 2017 to 99.7% in 2018. Around 41% of these tyres were intended for energy recovery in 2018 (substitute fuel in cement plants for example), 38.5 % material recovery, half of which is granulated (sports fields, street furniture), 16.1% for reuse (12.6% for second-hand resale and 3.5% for retreading) and 2.4% to public works.
Retreading is the technique of giving a used tyre a new tread. For the first time in many years, retreading increased compared to 2017 (+9.4%). However, these retreads increasingly face competition from new, low-cost tyres from overseas.
►SIMPLIFIED CHART OF PROCESSING OF AN ELV
Waste coming fromdecontamination
Part that can be recycled
or recovered
Part thatcan be reused
Ferrousmetals
Nonferrous metals
Crusherresidue
Recycling Sentto landfill
Energyrecovery
As a %
in thousands of units
70
74
78
82
86
90
94
98
800
900
1,000
1,100
1,200
1,300
1,400
1,500
1,600
ENERGY RECOVERY
REUSE AND RECOVERY RATE
ELV REUSE AND RECOVERY RATE
NUMBER OF END OF LIFE VEHICLES (ELVS) DEALT WITH
2010 2012 2014 2016 2018
2007 2008 2009 2010 2011 2012 2013 2014 2015 2017 20182016
Crushing-
Post crushingprocessing
FRAME
Decontamination-
Ensuring safe storage-
Removal of part
Government Scrapincentive e�ect
Conversion bonus
3
5
58 7
7982
86 87 87
82
87
9195 94
The decree published at thebeginning of 2016 specifies that
the consumer has the possibility of “opting for spare parts from the circular
economy instead of new parts…”
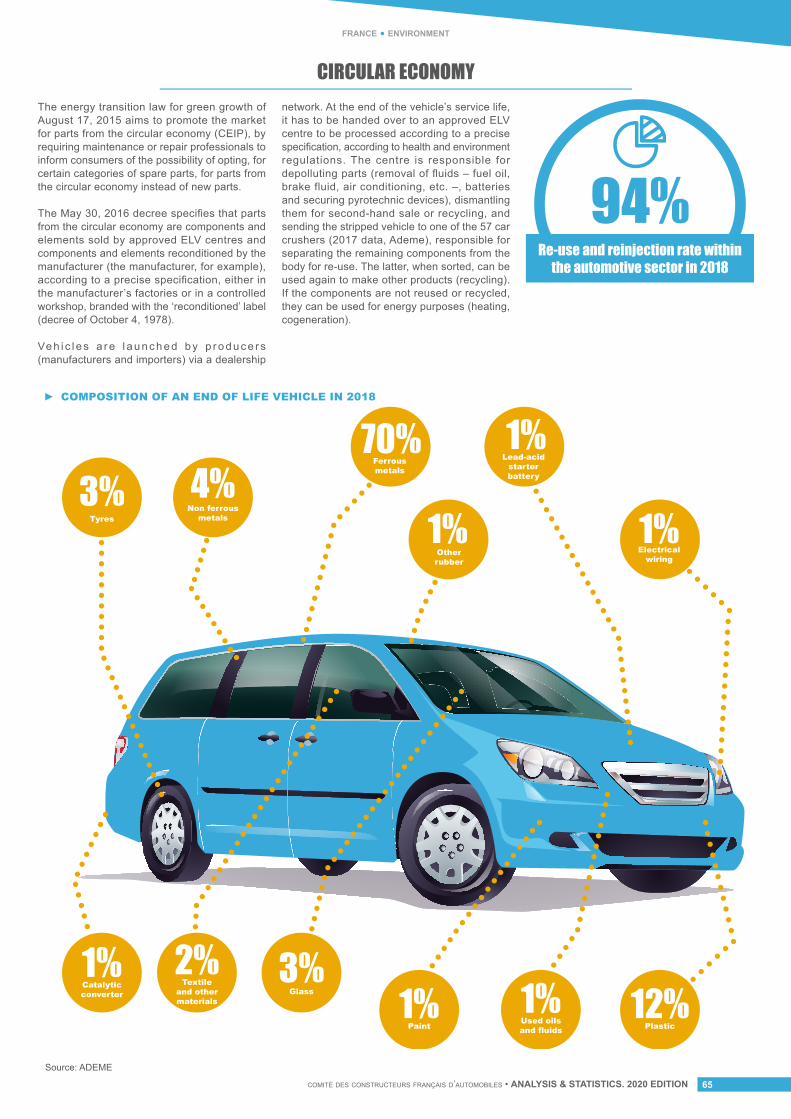
comité des constructeurs français d’automobiles • ANALYSIS & STATISTICS. 2020 EDITION 65
france • environment
CIRCULAR ECONOMYThe energy transition law for green growth of August 17, 2015 aims to promote the market for parts from the circular economy (CEIP), by requiring maintenance or repair professionals to inform consumers of the possibility of opting, for certain categories of spare parts, for parts from the circular economy instead of new parts.
The May 30, 2016 decree specifies that parts from the circular economy are components and elements sold by approved ELV centres and components and elements reconditioned by the manufacturer (the manufacturer, for example), according to a precise specification, either in the manufacturer’s factories or in a controlled workshop, branded with the ‘reconditioned’ label (decree of October 4, 1978).
Ve h i c l e s a r e l a u n c h e d b y p r o d u c e r s (manufacturers and importers) via a dealership
network. At the end of the vehicle’s service life, it has to be handed over to an approved ELV centre to be processed according to a precise specification, according to health and environment regulations. The centre is responsible for depolluting parts (removal of fluids – fuel oil, brake fluid, air conditioning, etc. –, batteries and securing pyrotechnic devices), dismantling them for second-hand sale or recycling, and sending the stripped vehicle to one of the 57 car crushers (2017 data, Ademe), responsible for separating the remaining components from the body for re-use. The latter, when sorted, can be used again to make other products (recycling). If the components are not reused or recycled, they can be used for energy purposes (heating, cogeneration).
94%Re-use and reinjection rate within
the automotive sector in 2018
Source: ADEME
► COMPOSITION OF AN END OF LIFE VEHICLE IN 2018
Lead-acidstarterbattery
1%
Otherrubber
1%Electrical
wiring
1%4%
Non ferrousmetals
3%Tyres
1%Catalyticconverter 12%
Plastic1%
Paint
1%Used oilsand fluids
3%Glass
2%Textile
and othermaterials
70%Ferrousmetals
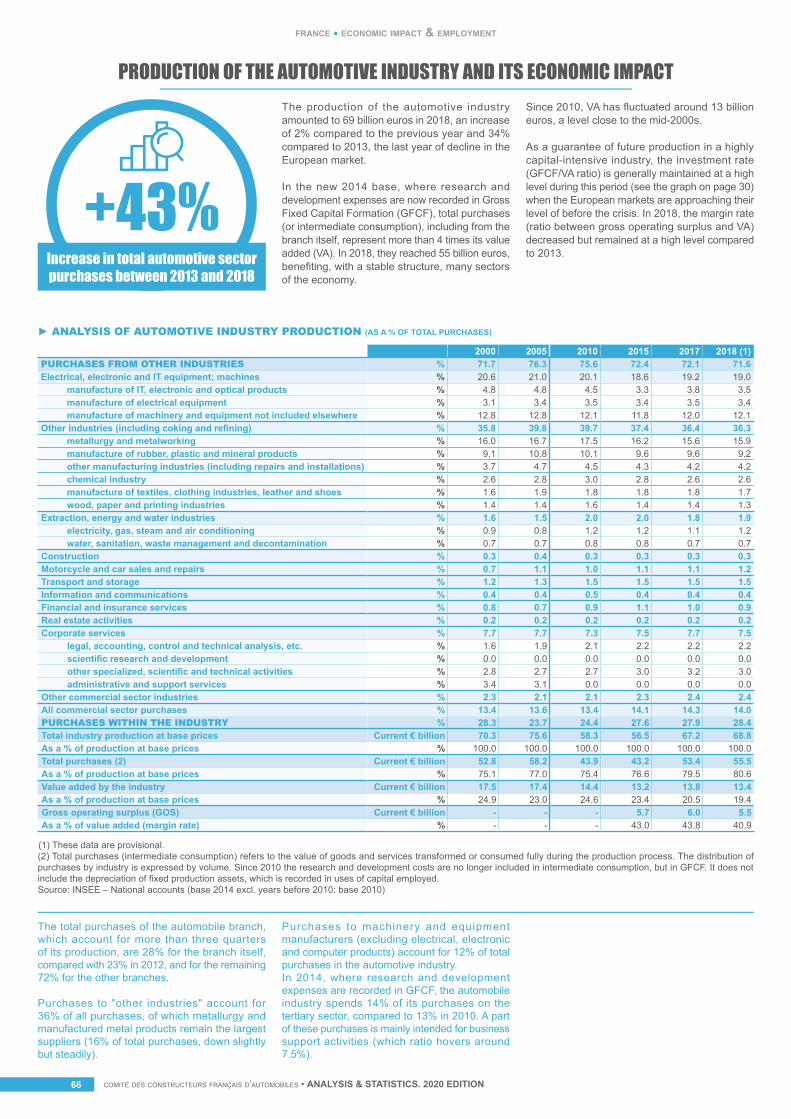
comité des constructeurs français d’automobiles • ANALYSIS & STATISTICS. 2020 EDITIONcomité des constructeurs français d’automobiles • ANALYSIS & STATISTICS. 2020 EDITION66
france • economic impact & employment
PRODUCTION OF THE AUTOMOTIVE INDUSTRY AND ITS ECONOMIC IMPACTThe production of the automotive industry amounted to 69 billion euros in 2018, an increase of 2% compared to the previous year and 34% compared to 2013, the last year of decline in the European market.
In the new 2014 base, where research and development expenses are now recorded in Gross Fixed Capital Formation (GFCF), total purchases (or intermediate consumption), including from the branch itself, represent more than 4 times its value added (VA). In 2018, they reached 55 billion euros, benefiting, with a stable structure, many sectors of the economy.
Since 2010, VA has fluctuated around 13 billion euros, a level close to the mid-2000s.
As a guarantee of future production in a highly capital-intensive industry, the investment rate (GFCF/VA ratio) is generally maintained at a high level during this period (see the graph on page 30) when the European markets are approaching their level of before the crisis. In 2018, the margin rate (ratio between gross operating surplus and VA) decreased but remained at a high level compared to 2013.
+43%Increase in total automotive sector purchases between 2013 and 2018
The total purchases of the automobile branch, which account for more than three quarters of its production, are 28% for the branch itself, compared with 23% in 2012, and for the remaining 72% for the other branches.
Purchases to "other industries" account for 36% of all purchases, of which metallurgy and manufactured metal products remain the largest suppliers (16% of total purchases, down slightly but steadily).
Purchases to machinery and equipment manufacturers (excluding electrical, electronic and computer products) account for 12% of total purchases in the automotive industry.In 2014, where research and development expenses are recorded in GFCF, the automobile industry spends 14% of its purchases on the tertiary sector, compared to 13% in 2010. A part of these purchases is mainly intended for business support activities (which ratio hovers around 7.5%).
► ANALYSIS OF AUTOMOTIVE INDUSTRY PRODUCTION (AS A % OF TOTAL PURCHASES)
2000 2005 2010 2015 2017 2018 (1)PURCHASES FROM OTHER INDUSTRIES % 71.7 76.3 75.6 72.4 72.1 71.6Electrical, electronic and IT equipment; machines % 20.6 21.0 20.1 18.6 19.2 19.0 manufacture of IT, electronic and optical products % 4.8 4.8 4.5 3.3 3.8 3.5 manufacture of electrical equipment % 3.1 3.4 3.5 3.4 3.5 3.4 manufacture of machinery and equipment not included elsewhere % 12.8 12.8 12.1 11.8 12.0 12.1Other industries (including coking and refining) % 35.8 39.8 39.7 37.4 36.4 36.3 metallurgy and metalworking % 16.0 16.7 17.5 16.2 15.6 15.9 manufacture of rubber, plastic and mineral products % 9.1 10.8 10.1 9.6 9.6 9.2 other manufacturing industries (including repairs and installations) % 3.7 4.7 4.5 4.3 4.2 4.2 chemical industry % 2.6 2.8 3.0 2.8 2.6 2.6 manufacture of textiles, clothing industries, leather and shoes % 1.6 1.9 1.8 1.8 1.8 1.7 wood, paper and printing industries % 1.4 1.4 1.6 1.4 1.4 1.3Extraction, energy and water industries % 1.6 1.5 2.0 2.0 1.8 1.9 electricity, gas, steam and air conditioning % 0.9 0.8 1.2 1.2 1.1 1.2 water, sanitation, waste management and decontamination % 0.7 0.7 0.8 0.8 0.7 0.7Construction % 0.3 0.4 0.3 0.3 0.3 0.3Motorcycle and car sales and repairs % 0.7 1.1 1.0 1.1 1.1 1.2Transport and storage % 1.2 1.3 1.5 1.5 1.5 1.5Information and communications % 0.4 0.4 0.5 0.4 0.4 0.4Financial and insurance services % 0.8 0.7 0.9 1.1 1.0 0.9Real estate activities % 0.2 0.2 0.2 0.2 0.2 0.2Corporate services % 7.7 7.7 7.3 7.5 7.7 7.5 legal, accounting, control and technical analysis, etc. % 1.6 1.9 2.1 2.2 2.2 2.2 scientific research and development % 0.0 0.0 0.0 0.0 0.0 0.0 other specialized, scientific and technical activities % 2.8 2.7 2.7 3.0 3.2 3.0 administrative and support services % 3.4 3.1 0.0 0.0 0.0 0.0Other commercial sector industries % 2.3 2.1 2.1 2.3 2.4 2.4All commercial sector purchases % 13.4 13.6 13.4 14.1 14.3 14.0PURCHASES WITHIN THE INDUSTRY % 28.3 23.7 24.4 27.6 27.9 28.4Total industry production at base prices Current € billion 70.3 75.6 58.3 56.5 67.2 68.8As a % of production at base prices % 100.0 100.0 100.0 100.0 100.0 100.0Total purchases (2) Current € billion 52.8 58.2 43.9 43.2 53.4 55.5As a % of production at base prices % 75.1 77.0 75.4 76.6 79.5 80.6Value added by the industry Current € billion 17.5 17.4 14.4 13.2 13.8 13.4As a % of production at base prices % 24.9 23.0 24.6 23.4 20.5 19.4Gross operating surplus (GOS) Current € billion - - - 5.7 6.0 5.5As a % of value added (margin rate) % - - - 43.0 43.8 40.9
(1) These data are provisional.(2) Total purchases (intermediate consumption) refers to the value of goods and services transformed or consumed fully during the production process. The distribution of purchases by industry is expressed by volume. Since 2010 the research and development costs are no longer included in intermediate consumption, but in GFCF. It does not include the depreciation of fixed production assets, which is recorded in uses of capital employed.Source: INSEE – National accounts (base 2014 excl. years before 2010: base 2010)
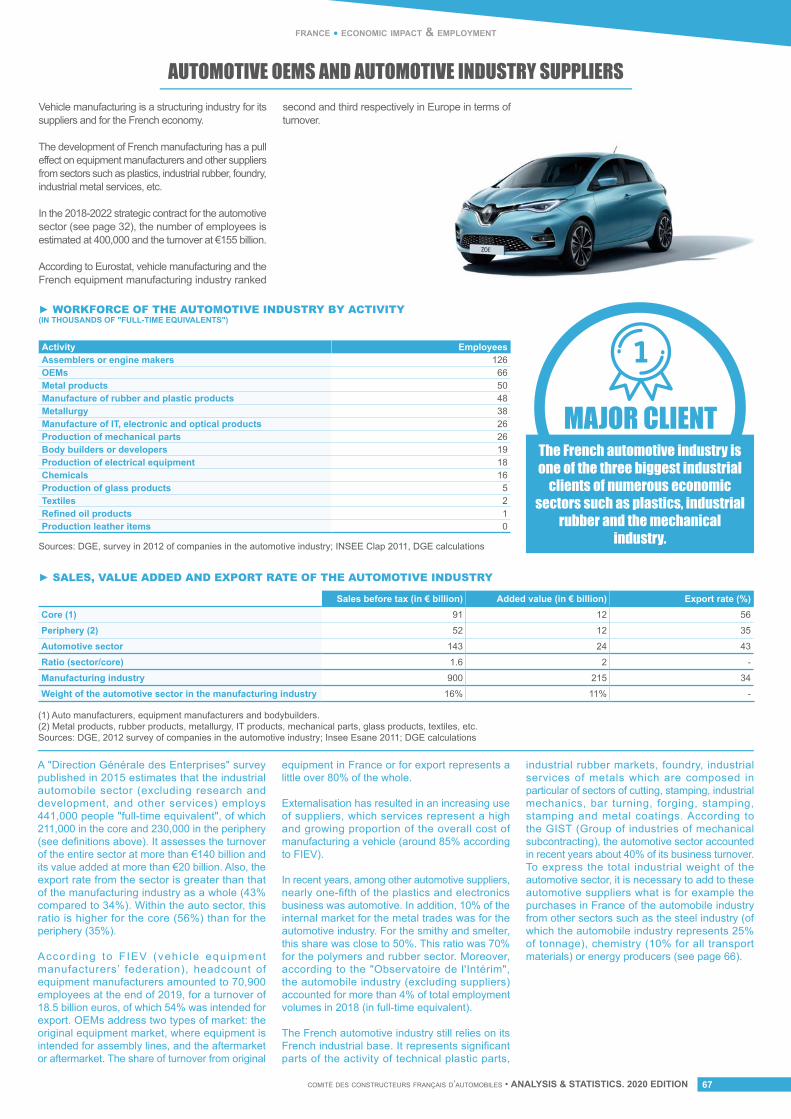
comité des constructeurs français d’automobiles • ANALYSIS & STATISTICS. 2020 EDITION 67comité des constructeurs français d’automobiles • ANALYSIS & STATISTICS. 2020 EDITION
france • economic impact & employment
AUTOMOTIVE OEMS AND AUTOMOTIVE INDUSTRY SUPPLIERSVehicle manufacturing is a structuring industry for its suppliers and for the French economy.
The development of French manufacturing has a pull effect on equipment manufacturers and other suppliers from sectors such as plastics, industrial rubber, foundry, industrial metal services, etc.
In the 2018-2022 strategic contract for the automotive sector (see page 32), the number of employees is estimated at 400,000 and the turnover at €155 billion.
According to Eurostat, vehicle manufacturing and the French equipment manufacturing industry ranked
second and third respectively in Europe in terms of turnover.
A "Direction Générale des Enterprises" survey published in 2015 estimates that the industrial automobile sector (excluding research and development, and other services) employs 441,000 people "full-time equivalent", of which 211,000 in the core and 230,000 in the periphery (see definitions above). It assesses the turnover of the entire sector at more than €140 billion and its value added at more than €20 billion. Also, the export rate from the sector is greater than that of the manufacturing industry as a whole (43% compared to 34%). Within the auto sector, this ratio is higher for the core (56%) than for the periphery (35%).
Accord ing to FIEV (vehic le equipment manufacturers’ federation), headcount of equipment manufacturers amounted to 70,900 employees at the end of 2019, for a turnover of 18.5 billion euros, of which 54% was intended for export. OEMs address two types of market: the original equipment market, where equipment is intended for assembly lines, and the aftermarket or aftermarket. The share of turnover from original
equipment in France or for export represents a little over 80% of the whole.
Externalisation has resulted in an increasing use of suppliers, which services represent a high and growing proportion of the overall cost of manufacturing a vehicle (around 85% according to FIEV).
In recent years, among other automotive suppliers, nearly one-fifth of the plastics and electronics business was automotive. In addition, 10% of the internal market for the metal trades was for the automotive industry. For the smithy and smelter, this share was close to 50%. This ratio was 70% for the polymers and rubber sector. Moreover, according to the "Observatoire de l'Intérim", the automobile industry (excluding suppliers) accounted for more than 4% of total employment volumes in 2018 (in full-time equivalent).
The French automotive industry still relies on its French industrial base. It represents significant parts of the activity of technical plastic parts,
industrial rubber markets, foundry, industrial services of metals which are composed in particular of sectors of cutting, stamping, industrial mechanics, bar turning, forging, stamping, stamping and metal coatings. According to the GIST (Group of industries of mechanical subcontracting), the automotive sector accounted in recent years about 40% of its business turnover. To express the total industrial weight of the automotive sector, it is necessary to add to these automotive suppliers what is for example the purchases in France of the automobile industry from other sectors such as the steel industry (of which the automobile industry represents 25% of tonnage), chemistry (10% for all transport materials) or energy producers (see page 66).
► WORKFORCE OF THE AUTOMOTIVE INDUSTRY BY ACTIVITY(IN THOUSANDS OF "FULL-TIME EQUIVALENTS")
► SALES, VALUE ADDED AND EXPORT RATE OF THE AUTOMOTIVE INDUSTRY
Activity EmployeesAssemblers or engine makers 126 OEMs 66 Metal products 50 Manufacture of rubber and plastic products 48 Metallurgy 38 Manufacture of IT, electronic and optical products 26 Production of mechanical parts 26 Body builders or developers 19 Production of electrical equipment 18 Chemicals 16 Production of glass products 5 Textiles 2 Refined oil products 1 Production leather items 0
Sales before tax (in € billion) Added value (in € billion) Export rate (%)Core (1) 91 12 56
Periphery (2) 52 12 35
Automotive sector 143 24 43
Ratio (sector/core) 1.6 2 -
Manufacturing industry 900 215 34
Weight of the automotive sector in the manufacturing industry 16% 11% -
Sources: DGE, survey in 2012 of companies in the automotive industry; INSEE Clap 2011, DGE calculations
(1) Auto manufacturers, equipment manufacturers and bodybuilders.(2) Metal products, rubber products, metallurgy, IT products, mechanical parts, glass products, textiles, etc.Sources: DGE, 2012 survey of companies in the automotive industry; Insee Esane 2011; DGE calculations
The French automotive industry is one of the three biggest industrial
clients of numerous economic sectors such as plastics, industrial
rubber and the mechanical industry.
MAJOR CLIENT
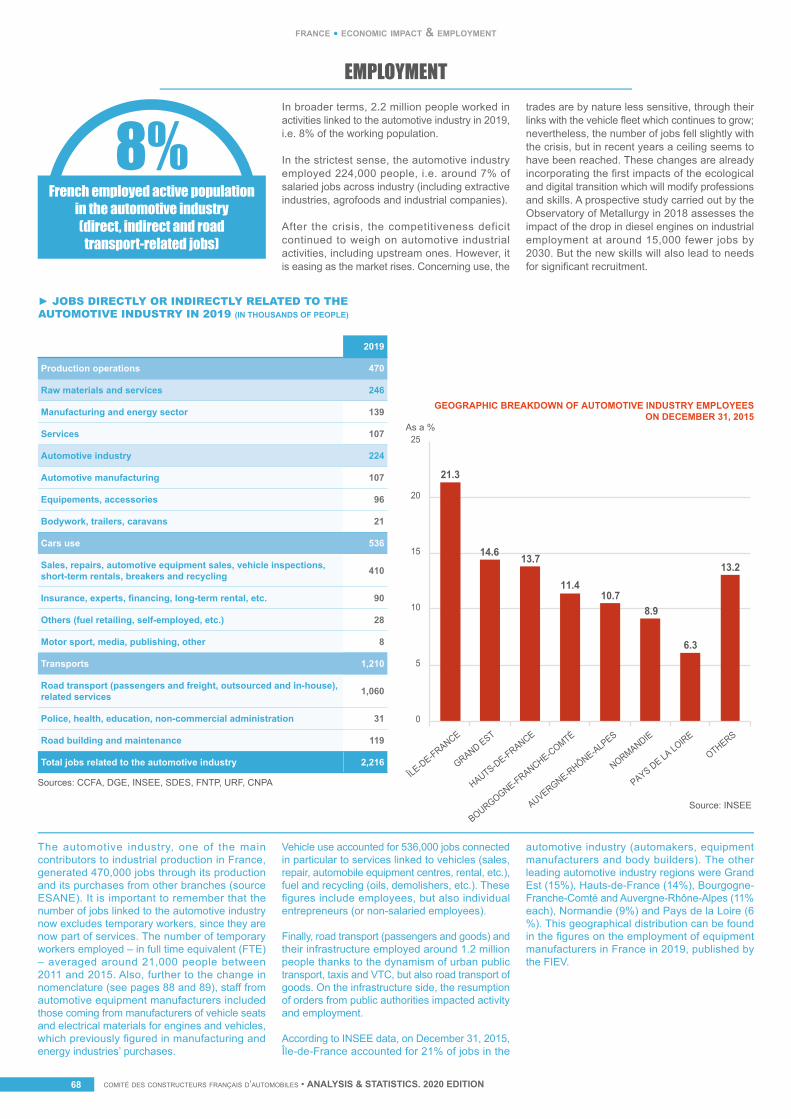
comité des constructeurs français d’automobiles • ANALYSIS & STATISTICS. 2020 EDITIONcomité des constructeurs français d’automobiles • ANALYSIS & STATISTICS. 2020 EDITIONcomité des constructeurs français d’automobiles • ANALYSIS & STATISTICS. 2020 EDITION68
france • economic impact & employment
EMPLOYMENTIn broader terms, 2.2 million people worked in activities linked to the automotive industry in 2019, i.e. 8% of the working population.
In the strictest sense, the automotive industry employed 224,000 people, i.e. around 7% of salaried jobs across industry (including extractive industries, agrofoods and industrial companies).
After the crisis, the competitiveness deficit continued to weigh on automotive industrial activities, including upstream ones. However, it is easing as the market rises. Concerning use, the
trades are by nature less sensitive, through their links with the vehicle fleet which continues to grow; nevertheless, the number of jobs fell slightly with the crisis, but in recent years a ceiling seems to have been reached. These changes are already incorporating the first impacts of the ecological and digital transition which will modify professions and skills. A prospective study carried out by the Observatory of Metallurgy in 2018 assesses the impact of the drop in diesel engines on industrial employment at around 15,000 fewer jobs by 2030. But the new skills will also lead to needs for significant recruitment.
8%French employed active population
in the automotive industry (direct, indirect and road
transport-related jobs)
The automotive industry, one of the main contributors to industrial production in France, generated 470,000 jobs through its production and its purchases from other branches (source ESANE). It is important to remember that the number of jobs linked to the automotive industry now excludes temporary workers, since they are now part of services. The number of temporary workers employed – in full time equivalent (FTE) – averaged around 21,000 people between 2011 and 2015. Also, further to the change in nomenclature (see pages 88 and 89), staff from automotive equipment manufacturers included those coming from manufacturers of vehicle seats and electrical materials for engines and vehicles, which previously figured in manufacturing and energy industries’ purchases.
Vehicle use accounted for 536,000 jobs connected in particular to services linked to vehicles (sales, repair, automobile equipment centres, rental, etc.), fuel and recycling (oils, demolishers, etc.). These figures include employees, but also individual entrepreneurs (or non-salaried employees).
Finally, road transport (passengers and goods) and their infrastructure employed around 1.2 million people thanks to the dynamism of urban public transport, taxis and VTC, but also road transport of goods. On the infrastructure side, the resumption of orders from public authorities impacted activity and employment.
According to INSEE data, on December 31, 2015, Île-de-France accounted for 21% of jobs in the
automotive industry (automakers, equipment manufacturers and body builders). The other leading automotive industry regions were Grand Est (15%), Hauts-de-France (14%), Bourgogne-Franche-Comté and Auvergne-Rhône-Alpes (11% each), Normandie (9%) and Pays de la Loire (6 %). This geographical distribution can be found in the figures on the employment of equipment manufacturers in France in 2019, published by the FIEV.
► JOBS DIRECTLY OR INDIRECTLY RELATED TO THE AUTOMOTIVE INDUSTRY IN 2019 (IN THOUSANDS OF PEOPLE)
2019
Production operations 470
Raw materials and services 246
Manufacturing and energy sector 139
Services 107
Automotive industry 224
Automotive manufacturing 107
Equipements, accessories 96
Bodywork, trailers, caravans 21
Cars use 536
Sales, repairs, automotive equipment sales, vehicle inspections, short-term rentals, breakers and recycling 410
Insurance, experts, financing, long-term rental, etc. 90
Others (fuel retailing, self-employed, etc.) 28
Motor sport, media, publishing, other 8
Transports 1,210
Road transport (passengers and freight, outsourced and in-house), related services 1,060
Police, health, education, non-commercial administration 31
Road building and maintenance 119
Total jobs related to the automotive industry 2,216
Sources: CCFA, DGE, INSEE, SDES, FNTP, URF, CNPA
As a %
0
5
10
15
20
25
Source: INSEE
21.3
13.7
11.410.7
GEOGRAPHIC BREAKDOWN OF AUTOMOTIVE INDUSTRY EMPLOYEESON DECEMBER 31, 2015
14.6
8.9
6.3
13.2
ÎLE-DE-FRANCE
GRAND EST
HAUTS-DE-FRANCE
BOURGOGNE-FRANCHE-COMTÉ
AUVERGNE-RHÔNE-ALPES
NORMANDIE
PAYS DE LA LOIRE
OTHERS
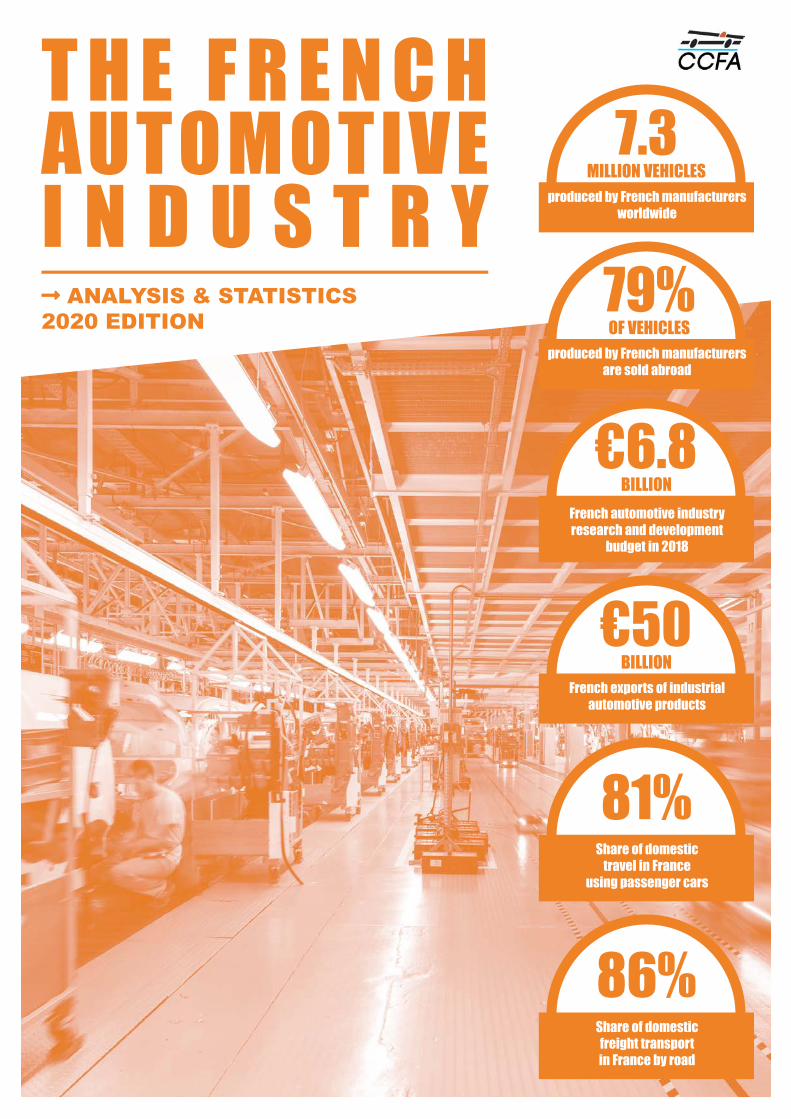
comité des constructeurs français d’automobiles • ANALYSIS & STATISTICS. 2020 EDITION 69comité des constructeurs français d’automobiles • ANALYSIS & STATISTICS. 2020 EDITION
T H E F R E N C H AUTOMOTIVE I N D U S T R Y
7.3MILLION VEHICLES
79%OF VEHICLES
€50BILLION
81%
86%
€6.8BILLION
Long-arrow-alt-right ANALYSIS & STATISTICS2020 EDITION
produced by French manufacturers worldwide
produced by French manufacturers are sold abroad
French exports of industrial automotive products
Share of domestictravel in France
using passenger cars
Share of domesticfreight transportin France by road
French automotive industry research and development
budget in 2018

comité des constructeurs français d’automobiles • ANALYSIS & STATISTICS. 2020 EDITIONcomité des constructeurs français d’automobiles • ANALYSIS & STATISTICS. 2020 EDITION70
(1) As of 2010, Brazilian production does not include CKDs.(2) Production in the Netherlands does not include DAF since 2012 and does not include Ginaf and Scania since 2014. Sources: OICA, CCFA
2000 2005 2010 2015 2016 2017 2018 2019 EUROPE 17,407,047 17,585,503 17,330,380 18,545,798 19,054,909 19,457,054 19,662,030 18,713,116WESTERN EUROPE 14,778,879 14,217,571 12,110,446 12,636,580 13,058,080 13,132,328 12,615,798 11,677,736Germany 5,131,918 5,350,187 5,552,409 5,708,138 5,746,808 5,645,584 5,120,409 4,661,328Belgium 912,233 895,109 528,996 369,172 354,003 332,979 265,958 247,020Spain 2,366,359 2,098,168 1,913,513 2,218,980 2,354,117 2,291,492 2,267,396 2,248,019FRANCE 2,879,810 3,112,961 1,924,171 1,555,000 1,636,000 1,754,200 1,773,748 1,665,787Italy 1,422,284 725,528 573,169 663,139 712,971 742,642 670,932 542,007The Netherlands 215,085 115,121 48,025 57,019 87,609 155,000 214,000 176,113Portugal 178,509 137,602 114,563 115,468 99,200 126,426 234,151 282,142United Kingdom 1,641,452 1,596,356 1,270,444 1,587,677 1,722,698 1,671,166 1,519,440 1,303,135Sweden 259,959 288,659 177,084 188,987 205,374 226,000 291,000 279,000CENTRAL AND EASTERN EUROPE 2,330,692 2,914,269 4,616,540 5,118,191 5,045,941 5,181,820 4,803,177 4,788,248
TURKEY 297,476 453,663 603,394 791,027 950,888 1,142,906 1,026,461 982,642AMERICA 10,022,089 8,795,982 8,228,067 9,394,539 8,778,776 8,236,350 7,690,288 6,973,304NAFTA 8,371,806 6,523,591 5,084,330 7,019,427 6,712,992 5,691,163 5,022,072 4,356,864Canada 1,550,500 1,356,271 967,077 888,565 803,230 751,048 655,896 461,370USA 5,542,217 4,321,272 2,731,105 4,162,808 3,916,584 3,033,216 1,581,012 1,382,714Mexico 1,279,089 846,048 1,386,148 1,968,054 1,993,178 1,906,899 2,785,164 2,512,780SOUTH AMERICA 1,650,283 2,272,391 3,143,737 2,375,112 2,065,784 2,545,187 2,668,216 2,616,440Argentina 238,921 182,761 508,401 308,756 241,315 203,694 208,573 108,364Brazil (1) 1,351,998 2,011,817 2,584,690 2,017,639 1,778,464 2,307,443 2,387,967 2,448,490ASIA-OCEANIA 13,573,073 20,249,215 32,408,358 40,125,960 43,884,300 44,937,856 43,622,768 40,666,078China 605,000 3,941,767 13,897,083 21,143,351 24,420,744 24,806,687 23,529,423 21,360,193South Korea 2,602,008 3,357,094 3,866,206 4,135,108 3,859,991 3,735,399 3,661,730 3,612,587India 517,957 1,264,111 2,831,542 3,408,849 3,707,348 3,961,327 4,032,481 3,623,335Japan 8,359,434 9,016,735 8,310,362 7,830,722 7,873,886 8,347,836 8,359,286 8,328,756AFRICA 213,444 319,598 356,872 604,130 673,685 671,782 776,967 787,287South Africa 230,577 324,875 295,394 341,025 335,539 321,358 321,097 348,665 TOTAL 41,215,653 46,950,298 58,323,677 68,670,427 72,391,670 73,303,042 71,752,053 67,139,785
2000 2005 2010 2015 2016 2017 2018 2019 EUROPE 2,783,468 3,132,236 2,529,925 2,672,648 2,434,598 2,563,228 2,602,435 2,571,856WESTERN EUROPE 2,326,653 2,246,450 1,686,875 1,794,888 1,571,867 1,608,788 1,645,308 1,658,806Germany 394,697 407,523 353,576 325,226 nd nd nd ndBelgium 121,061 31,406 26,306 40,081 45,424 44,023 42,535 38,777Spain 666,515 654,332 474,387 514,221 531,805 556,843 552,169 574,336FRANCE 468,551 436,047 305,250 417,000 454,279 471,500 495,941 509,563Italy 316,031 312,824 265,017 351,084 390,334 399,568 389,136 373,298The Netherlands (2) 52,234 65,627 46,107 2,252 2,280 n/a n/a n/aPortugal 68,215 83,458 44,166 41,158 43,896 49,118 60,215 63,562United Kingdom 172,442 206,753 123,019 94,479 93,924 78,219 84,888 78,270Sweden 41,384 50,570 40,000 n/a n/a n/a n/a n/aCENTRAL ANDEASTERN EUROPE 323,203 459,997 351,887 309,991 327,692 401,615 433,438 434,448
TURKEY 133,471 425,789 491,163 567,769 535,039 552,825 523,689 478,602AMERICA 9,761,798 10,488,678 8,119,880 11,567,600 12,042,894 12,478,652 13,157,330 13,129,455NAFTA 9,325,214 9,795,192 7,069,234 10,935,086 11,438,330 11,787,657 12,402,403 12,426,534Canada 1,411,136 1,331,621 1,101,112 1,394,742 1,567,426 1,442,955 1,369,898 1,455,215USA 7,257,640 7,625,381 5,011,988 7,943,180 8,263,717 8,156,769 2,519,758 2,604,080Mexico 656,438 838,190 956,134 1,597,164 1,607,187 2,187,933 8,512,747 8,367,239SOUTH AMERICA 436,584 693,486 1,050,646 632,514 604,564 690,995 754,927 702,921Argentina 100,711 136,994 208,139 217,901 231,461 269,714 258,076 206,423Brazil (1) 329,519 519,023 797,038 411,782 377,892 429,359 493,051 496,498ASIA-OCEANIA 4,497,938 5,878,721 8,600,629 7,863,313 7,962,121 8,528,632 9,034,058 8,600,795China 1,464,000 1,775,852 4,367,678 3,423,899 3,698,050 4,208,747 4,279,773 4,360,472South Korea 512,990 342,256 405,535 420,849 368,518 394,276 367,104 338,030India 283,403 374,563 725,531 751,736 811,993 830,904 1,110,328 892,682Japan 1,781,362 1,782,924 1,318,558 1,447,516 1,330,927 1,342,838 1,370,308 1,355,542AFRICA 115,305 199,195 158,204 232,291 229,883 224,777 325,069 317,860South Africa 126,787 200,352 176,655 274,633 263,465 268,593 289,757 283,318TOTAL 17,158,509 19,698,830 19,408,638 22,335,852 22,669,496 23,795,289 25,118,892 24,619,966
► PASSENGERS CARS (IN UNITS)
► COMMERCIAL VEHICLES (IN UNITS)
world • production
WORLD PRODUCTIONThe production of each country corresponds to national declarations. Double counts are eliminated in the totals of the geographical areas.
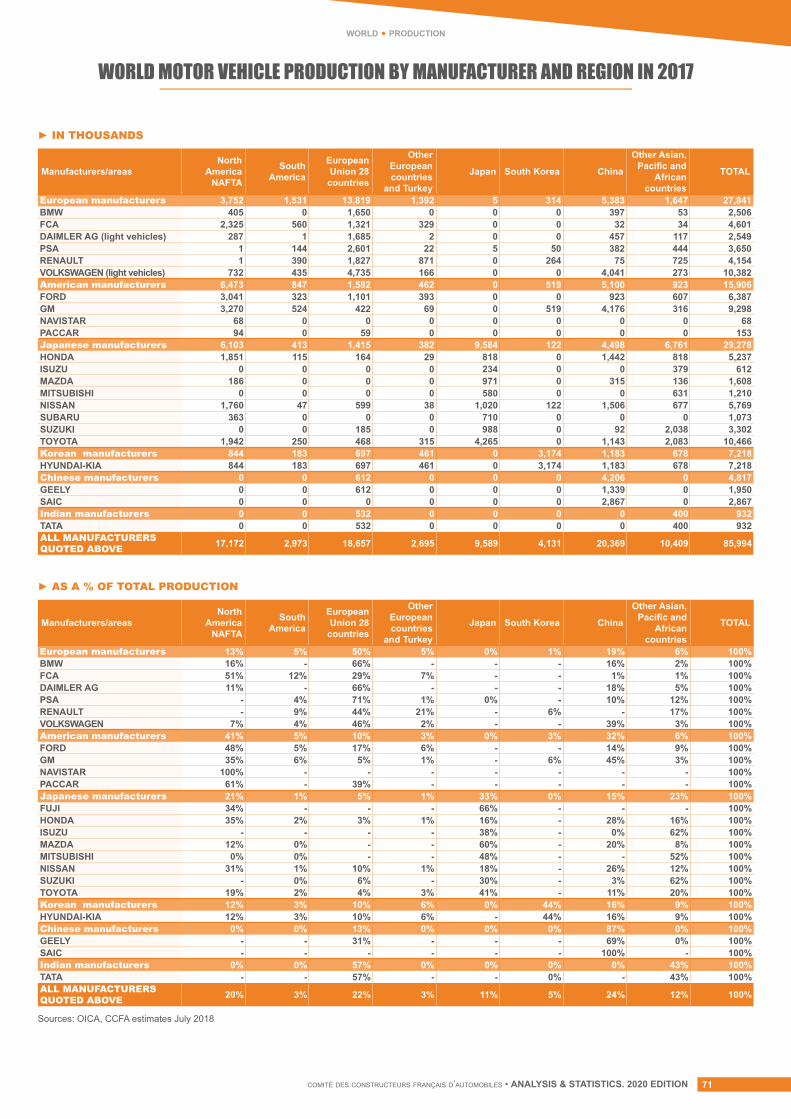
comité des constructeurs français d’automobiles • ANALYSIS & STATISTICS. 2020 EDITION 71
Sources: OICA, CCFA estimates July 2018
► IN THOUSANDS
► AS A % OF TOTAL PRODUCTION
world • production
WORLD MOTOR VEHICLE PRODUCTION BY MANUFACTURER AND REGION IN 2017
Manufacturers/areasNorth
America NAFTA
South America
European Union 28 countries
Other European countries
and Turkey
Japan South Korea China
Other Asian, Pacific and
African countries
TOTAL
European manufacturers 3,752 1,531 13,819 1,392 5 314 5,383 1,647 27,841BMW 405 0 1,650 0 0 0 397 53 2,506FCA 2,325 560 1,321 329 0 0 32 34 4,601DAIMLER AG (light vehicles) 287 1 1,685 2 0 0 457 117 2,549PSA 1 144 2,601 22 5 50 382 444 3,650RENAULT 1 390 1,827 871 0 264 75 725 4,154VOLKSWAGEN (light vehicles) 732 435 4,735 166 0 0 4,041 273 10,382American manufacturers 6,473 847 1,582 462 0 519 5,100 923 15,906FORD 3,041 323 1,101 393 0 0 923 607 6,387GM 3,270 524 422 69 0 519 4,176 316 9,298NAVISTAR 68 0 0 0 0 0 0 0 68PACCAR 94 0 59 0 0 0 0 0 153Japanese manufacturers 6,103 413 1,415 382 9,584 122 4,498 6,761 29,278HONDA 1,851 115 164 29 818 0 1,442 818 5,237ISUZU 0 0 0 0 234 0 0 379 612MAZDA 186 0 0 0 971 0 315 136 1,608MITSUBISHI 0 0 0 0 580 0 0 631 1,210NISSAN 1,760 47 599 38 1,020 122 1,506 677 5,769SUBARU 363 0 0 0 710 0 0 0 1,073SUZUKI 0 0 185 0 988 0 92 2,038 3,302TOYOTA 1,942 250 468 315 4,265 0 1,143 2,083 10,466Korean manufacturers 844 183 697 461 0 3,174 1,183 678 7,218HYUNDAI-KIA 844 183 697 461 0 3,174 1,183 678 7,218Chinese manufacturers 0 0 612 0 0 0 4,206 0 4,817GEELY 0 0 612 0 0 0 1,339 0 1,950SAIC 0 0 0 0 0 0 2,867 0 2,867Indian manufacturers 0 0 532 0 0 0 0 400 932TATA 0 0 532 0 0 0 0 400 932ALL MANUFACTURERS QUOTED ABOVE 17,172 2,973 18,657 2,695 9,589 4,131 20,369 10,409 85,994
Manufacturers/areasNorth
America NAFTA
South America
European Union 28 countries
Other European countries
and Turkey
Japan South Korea China
Other Asian, Pacific and
African countries
TOTAL
European manufacturers 13% 5% 50% 5% 0% 1% 19% 6% 100%BMW 16% - 66% - - - 16% 2% 100%FCA 51% 12% 29% 7% - - 1% 1% 100%DAIMLER AG 11% - 66% - - - 18% 5% 100%PSA - 4% 71% 1% 0% - 10% 12% 100%RENAULT - 9% 44% 21% - 6% - 17% 100%VOLKSWAGEN 7% 4% 46% 2% - - 39% 3% 100%American manufacturers 41% 5% 10% 3% 0% 3% 32% 6% 100%FORD 48% 5% 17% 6% - - 14% 9% 100%GM 35% 6% 5% 1% - 6% 45% 3% 100%NAVISTAR 100% - - - - - - - 100%PACCAR 61% - 39% - - - - - 100%Japanese manufacturers 21% 1% 5% 1% 33% 0% 15% 23% 100%FUJI 34% - - - 66% - - - 100%HONDA 35% 2% 3% 1% 16% - 28% 16% 100%ISUZU - - - - 38% - 0% 62% 100%MAZDA 12% 0% - - 60% - 20% 8% 100%MITSUBISHI 0% 0% - - 48% - - 52% 100%NISSAN 31% 1% 10% 1% 18% - 26% 12% 100%SUZUKI - 0% 6% - 30% - 3% 62% 100%TOYOTA 19% 2% 4% 3% 41% - 11% 20% 100%Korean manufacturers 12% 3% 10% 6% 0% 44% 16% 9% 100%HYUNDAI-KIA 12% 3% 10% 6% - 44% 16% 9% 100%Chinese manufacturers 0% 0% 13% 0% 0% 0% 87% 0% 100%GEELY - - 31% - - - 69% 0% 100%SAIC - - - - - - 100% - 100%Indian manufacturers 0% 0% 57% 0% 0% 0% 0% 43% 100%TATA - - 57% - - 0% - 43% 100%ALL MANUFACTURERS QUOTED ABOVE 20% 3% 22% 3% 11% 5% 24% 12% 100%
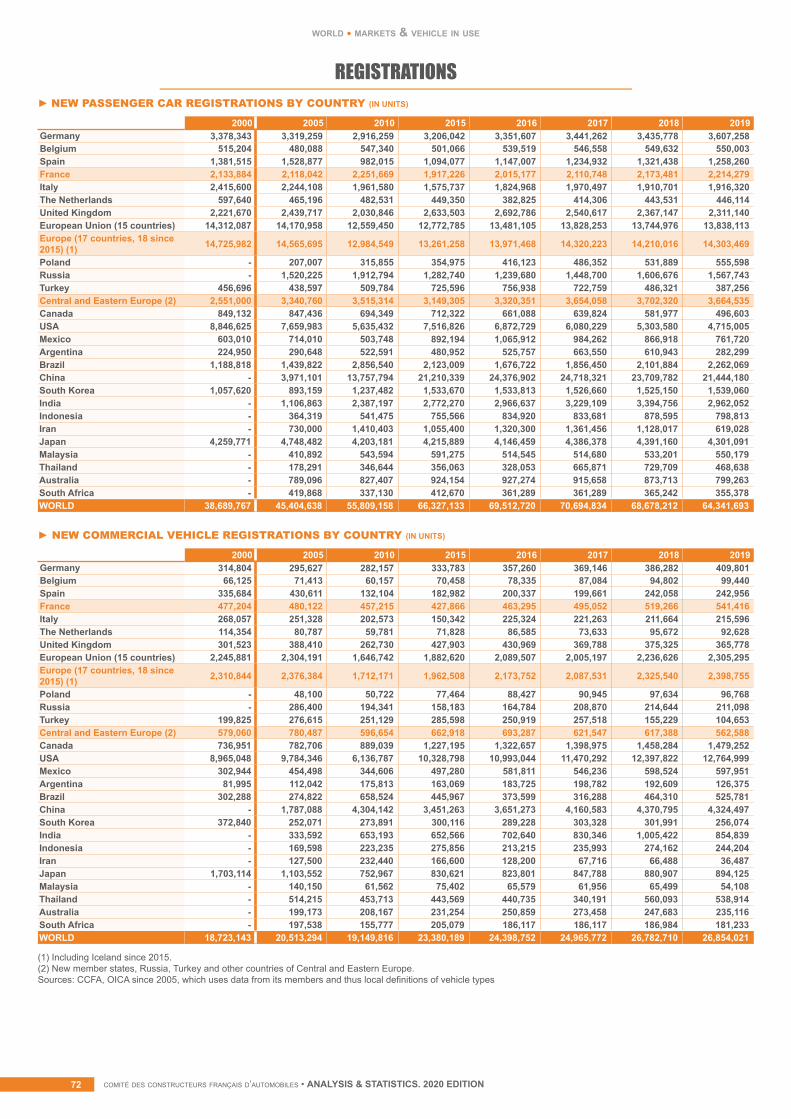
comité des constructeurs français d’automobiles • ANALYSIS & STATISTICS. 2020 EDITIONcomité des constructeurs français d’automobiles • ANALYSIS & STATISTICS. 2020 EDITION72
2000 2005 2010 2015 2016 2017 2018 2019 Germany 314,804 295,627 282,157 333,783 357,260 369,146 386,282 409,801Belgium 66,125 71,413 60,157 70,458 78,335 87,084 94,802 99,440Spain 335,684 430,611 132,104 182,982 200,337 199,661 242,058 242,956France 477,204 480,122 457,215 427,866 463,295 495,052 519,266 541,416Italy 268,057 251,328 202,573 150,342 225,324 221,263 211,664 215,596The Netherlands 114,354 80,787 59,781 71,828 86,585 73,633 95,672 92,628United Kingdom 301,523 388,410 262,730 427,903 430,969 369,788 375,325 365,778European Union (15 countries) 2,245,881 2,304,191 1,646,742 1,882,620 2,089,507 2,005,197 2,236,626 2,305,295Europe (17 countries, 18 since 2015) (1) 2,310,844 2,376,384 1,712,171 1,962,508 2,173,752 2,087,531 2,325,540 2,398,755
Poland - 48,100 50,722 77,464 88,427 90,945 97,634 96,768Russia - 286,400 194,341 158,183 164,784 208,870 214,644 211,098Turkey 199,825 276,615 251,129 285,598 250,919 257,518 155,229 104,653Central and Eastern Europe (2) 579,060 780,487 596,654 662,918 693,287 621,547 617,388 562,588Canada 736,951 782,706 889,039 1,227,195 1,322,657 1,398,975 1,458,284 1,479,252USA 8,965,048 9,784,346 6,136,787 10,328,798 10,993,044 11,470,292 12,397,822 12,764,999Mexico 302,944 454,498 344,606 497,280 581,811 546,236 598,524 597,951Argentina 81,995 112,042 175,813 163,069 183,725 198,782 192,609 126,375Brazil 302,288 274,822 658,524 445,967 373,599 316,288 464,310 525,781China - 1,787,088 4,304,142 3,451,263 3,651,273 4,160,583 4,370,795 4,324,497South Korea 372,840 252,071 273,891 300,116 289,228 303,328 301,991 256,074India - 333,592 653,193 652,566 702,640 830,346 1,005,422 854,839Indonesia - 169,598 223,235 275,856 213,215 235,993 274,162 244,204Iran - 127,500 232,440 166,600 128,200 67,716 66,488 36,487Japan 1,703,114 1,103,552 752,967 830,621 823,801 847,788 880,907 894,125Malaysia - 140,150 61,562 75,402 65,579 61,956 65,499 54,108Thailand - 514,215 453,713 443,569 440,735 340,191 560,093 538,914Australia - 199,173 208,167 231,254 250,859 273,458 247,683 235,116South Africa - 197,538 155,777 205,079 186,117 186,117 186,984 181,233WORLD 18,723,143 20,513,294 19,149,816 23,380,189 24,398,752 24,965,772 26,782,710 26,854,021
► NEW COMMERCIAL VEHICLE REGISTRATIONS BY COUNTRY (IN UNITS)
world • markets & vehicle in use
REGISTRATIONS
(1) Including Iceland since 2015.(2) New member states, Russia, Turkey and other countries of Central and Eastern Europe.Sources: CCFA, OICA since 2005, which uses data from its members and thus local definitions of vehicle types
2000 2005 2010 2015 2016 2017 2018 2019 Germany 3,378,343 3,319,259 2,916,259 3,206,042 3,351,607 3,441,262 3,435,778 3,607,258Belgium 515,204 480,088 547,340 501,066 539,519 546,558 549,632 550,003Spain 1,381,515 1,528,877 982,015 1,094,077 1,147,007 1,234,932 1,321,438 1,258,260France 2,133,884 2,118,042 2,251,669 1,917,226 2,015,177 2,110,748 2,173,481 2,214,279Italy 2,415,600 2,244,108 1,961,580 1,575,737 1,824,968 1,970,497 1,910,701 1,916,320The Netherlands 597,640 465,196 482,531 449,350 382,825 414,306 443,531 446,114United Kingdom 2,221,670 2,439,717 2,030,846 2,633,503 2,692,786 2,540,617 2,367,147 2,311,140European Union (15 countries) 14,312,087 14,170,958 12,559,450 12,772,785 13,481,105 13,828,253 13,744,976 13,838,113Europe (17 countries, 18 since 2015) (1) 14,725,982 14,565,695 12,984,549 13,261,258 13,971,468 14,320,223 14,210,016 14,303,469
Poland - 207,007 315,855 354,975 416,123 486,352 531,889 555,598Russia - 1,520,225 1,912,794 1,282,740 1,239,680 1,448,700 1,606,676 1,567,743Turkey 456,696 438,597 509,784 725,596 756,938 722,759 486,321 387,256Central and Eastern Europe (2) 2,551,000 3,340,760 3,515,314 3,149,305 3,320,351 3,654,058 3,702,320 3,664,535Canada 849,132 847,436 694,349 712,322 661,088 639,824 581,977 496,603USA 8,846,625 7,659,983 5,635,432 7,516,826 6,872,729 6,080,229 5,303,580 4,715,005Mexico 603,010 714,010 503,748 892,194 1,065,912 984,262 866,918 761,720Argentina 224,950 290,648 522,591 480,952 525,757 663,550 610,943 282,299Brazil 1,188,818 1,439,822 2,856,540 2,123,009 1,676,722 1,856,450 2,101,884 2,262,069China - 3,971,101 13,757,794 21,210,339 24,376,902 24,718,321 23,709,782 21,444,180South Korea 1,057,620 893,159 1,237,482 1,533,670 1,533,813 1,526,660 1,525,150 1,539,060India - 1,106,863 2,387,197 2,772,270 2,966,637 3,229,109 3,394,756 2,962,052Indonesia - 364,319 541,475 755,566 834,920 833,681 878,595 798,813Iran - 730,000 1,410,403 1,055,400 1,320,300 1,361,456 1,128,017 619,028Japan 4,259,771 4,748,482 4,203,181 4,215,889 4,146,459 4,386,378 4,391,160 4,301,091Malaysia - 410,892 543,594 591,275 514,545 514,680 533,201 550,179Thailand - 178,291 346,644 356,063 328,053 665,871 729,709 468,638Australia - 789,096 827,407 924,154 927,274 915,658 873,713 799,263South Africa - 419,868 337,130 412,670 361,289 361,289 365,242 355,378WORLD 38,689,767 45,404,638 55,809,158 66,327,133 69,512,720 70,694,834 68,678,212 64,341,693
► NEW PASSENGER CAR REGISTRATIONS BY COUNTRY (IN UNITS)
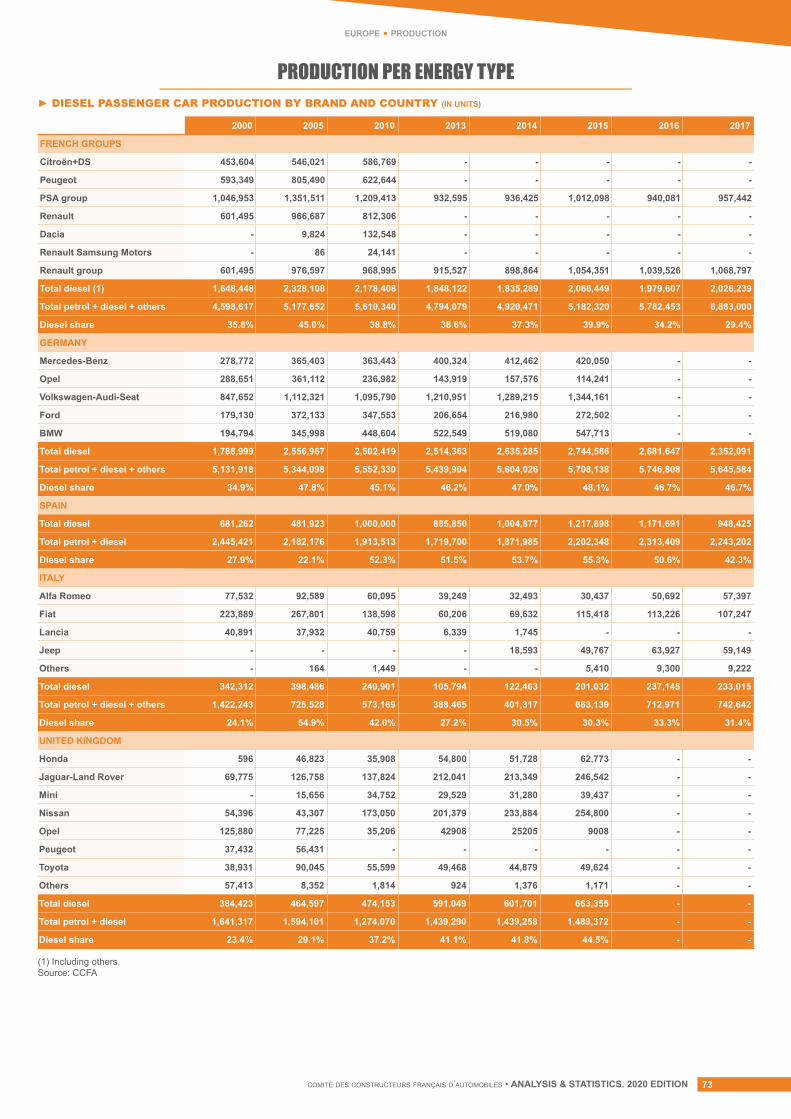
comité des constructeurs français d’automobiles • ANALYSIS & STATISTICS. 2020 EDITION 73
2000 2005 2010 2013 2014 2015 2016 2017
FRENCH GROUPS
Citroën+DS 453,604 546,021 586,769 - - - - -
Peugeot 593,349 805,490 622,644 - - - - -
PSA group 1,046,953 1,351,511 1,209,413 932,595 936,425 1,012,098 940,081 957,442
Renault 601,495 966,687 812,306 - - - - -
Dacia - 9,824 132,548 - - - - -
Renault Samsung Motors - 86 24,141 - - - - -
Renault group 601,495 976,597 968,995 915,527 898,864 1,054,351 1,039,526 1,068,797
Total diesel (1) 1,648,448 2,328,108 2,178,408 1,848,122 1,835,289 2,066,449 1,979,607 2,026,239
Total petrol + diesel + others 4,598,617 5,177,852 5,610,340 4,794,079 4,920,471 5,182,320 5,782,453 6,883,000
Diesel share 35.8% 45.0% 38.8% 38.6% 37.3% 39.9% 34.2% 29.4%
GERMANY
Mercedes-Benz 278,772 365,403 363,443 400,324 412,462 420,050 - -
Opel 288,651 361,112 236,982 143,919 157,576 114,241 - -
Volkswagen-Audi-Seat 847,652 1,112,321 1,095,790 1,210,951 1,289,215 1,344,161 - -
Ford 179,130 372,133 347,553 206,654 216,980 272,502 - -
BMW 194,794 345,998 448,604 522,549 519,080 547,713 - -
Total diesel 1,788,999 2,556,967 2,502,419 2,514,363 2,635,285 2,744,586 2,681,647 2,352,091
Total petrol + diesel + others 5,131,918 5,344,098 5,552,330 5,439,904 5,604,026 5,708,138 5,746,808 5,645,584
Diesel share 34.9% 47.8% 45.1% 46.2% 47.0% 48.1% 46.7% 46.7%
SPAIN
Total diesel 681,262 481,923 1,000,000 885,850 1,004,877 1,217,898 1,171,691 948,425
Total petrol + diesel 2,445,421 2,182,176 1,913,513 1,719,700 1,871,985 2,202,348 2,313,409 2,243,202
Diesel share 27.9% 22.1% 52.3% 51.5% 53.7% 55.3% 50.6% 42.3%
ITALY
Alfa Romeo 77,532 92,589 60,095 39,249 32,493 30,437 50,692 57,397
Fiat 223,889 267,801 138,598 60,206 69,632 115,418 113,226 107,247
Lancia 40,891 37,932 40,759 6,339 1,745 - - -
Jeep - - - - 18,593 49,767 63,927 59,149
Others - 164 1,449 - - 5,410 9,300 9,222
Total diesel 342,312 398,486 240,901 105,794 122,463 201,032 237,145 233,015
Total petrol + diesel + others 1,422,243 725,528 573,169 388,465 401,317 663,139 712,971 742,642
Diesel share 24.1% 54.9% 42.0% 27.2% 30.5% 30.3% 33.3% 31.4%
UNITED KINGDOM
Honda 596 46,823 35,908 54,800 51,728 62,773 - -
Jaguar-Land Rover 69,775 126,758 137,824 212,041 213,349 246,542 - -
Mini - 15,656 34,752 29,529 31,280 39,437 - -
Nissan 54,396 43,307 173,050 201,379 233,884 254,800 - -
Opel 125,880 77,225 35,206 42908 25205 9008 - -
Peugeot 37,432 56,431 - - - - - -
Toyota 38,931 90,045 55,599 49,468 44,879 49,624 - -
Others 57,413 8,352 1,814 924 1,376 1,171 - -
Total diesel 384,423 464,597 474,153 591,049 601,701 663,355 - -
Total petrol + diesel 1,641,317 1,594,101 1,274,070 1,439,290 1,439,258 1,489,372 - -
Diesel share 23.4% 29.1% 37.2% 41.1% 41.8% 44.5% - -
► DIESEL PASSENGER CAR PRODUCTION BY BRAND AND COUNTRY (IN UNITS)
PRODUCTION PER ENERGY TYPE
(1) Including others.Source: CCFA
europe • production
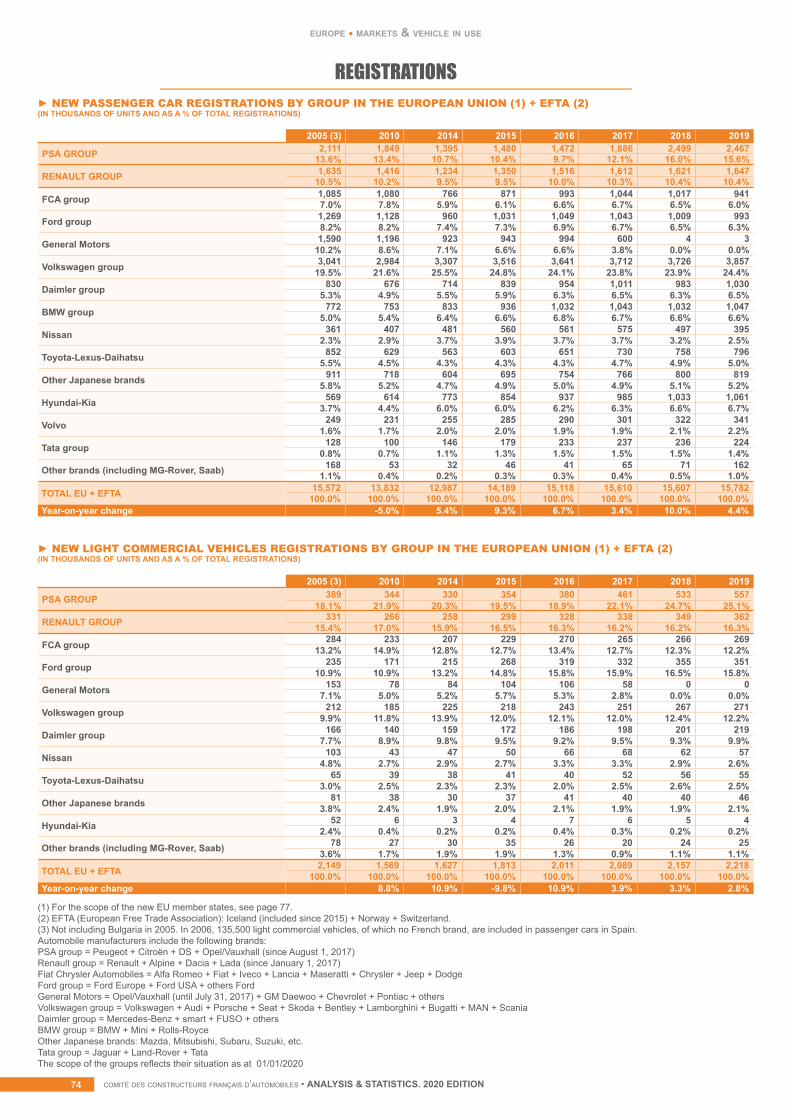
comité des constructeurs français d’automobiles • ANALYSIS & STATISTICS. 2020 EDITIONcomité des constructeurs français d’automobiles • ANALYSIS & STATISTICS. 2020 EDITION74
REGISTRATIONS
(1) For the scope of the new EU member states, see page 77.(2) EFTA (European Free Trade Association): Iceland (included since 2015) + Norway + Switzerland.(3) Not including Bulgaria in 2005. In 2006, 135,500 light commercial vehicles, of which no French brand, are included in passenger cars in Spain.Automobile manufacturers include the following brands: PSA group = Peugeot + Citroën + DS + Opel/Vauxhall (since August 1, 2017)Renault group = Renault + Alpine + Dacia + Lada (since January 1, 2017)Fiat Chrysler Automobiles = Alfa Romeo + Fiat + Iveco + Lancia + Maseratti + Chrysler + Jeep + DodgeFord group = Ford Europe + Ford USA + others FordGeneral Motors = Opel/Vauxhall (until July 31, 2017) + GM Daewoo + Chevrolet + Pontiac + othersVolkswagen group = Volkswagen + Audi + Porsche + Seat + Skoda + Bentley + Lamborghini + Bugatti + MAN + ScaniaDaimler group = Mercedes-Benz + smart + FUSO + othersBMW group = BMW + Mini + Rolls-RoyceOther Japanese brands: Mazda, Mitsubishi, Subaru, Suzuki, etc.Tata group = Jaguar + Land-Rover + TataThe scope of the groups reflects their situation as at 01/01/2020
2005 (3) 2010 2014 2015 2016 2017 2018 2019
PSA GROUP 2,111 1,849 1,395 1,480 1,472 1,886 2,499 2,46713.6% 13.4% 10.7% 10.4% 9.7% 12.1% 16.0% 15.6%
RENAULT GROUP 1,635 1,416 1,234 1,350 1,516 1,612 1,621 1,64710.5% 10.2% 9.5% 9.5% 10.0% 10.3% 10.4% 10.4%
FCA group 1,085 1,080 766 871 993 1,044 1,017 9417.0% 7.8% 5.9% 6.1% 6.6% 6.7% 6.5% 6.0%
Ford group 1,269 1,128 960 1,031 1,049 1,043 1,009 9938.2% 8.2% 7.4% 7.3% 6.9% 6.7% 6.5% 6.3%
General Motors 1,590 1,196 923 943 994 600 4 310.2% 8.6% 7.1% 6.6% 6.6% 3.8% 0.0% 0.0%
Volkswagen group 3,041 2,984 3,307 3,516 3,641 3,712 3,726 3,85719.5% 21.6% 25.5% 24.8% 24.1% 23.8% 23.9% 24.4%
Daimler group 830 676 714 839 954 1,011 983 1,0305.3% 4.9% 5.5% 5.9% 6.3% 6.5% 6.3% 6.5%
BMW group 772 753 833 936 1,032 1,043 1,032 1,0475.0% 5.4% 6.4% 6.6% 6.8% 6.7% 6.6% 6.6%
Nissan 361 407 481 560 561 575 497 3952.3% 2.9% 3.7% 3.9% 3.7% 3.7% 3.2% 2.5%
Toyota-Lexus-Daihatsu 852 629 563 603 651 730 758 7965.5% 4.5% 4.3% 4.3% 4.3% 4.7% 4.9% 5.0%
Other Japanese brands 911 718 604 695 754 766 800 8195.8% 5.2% 4.7% 4.9% 5.0% 4.9% 5.1% 5.2%
Hyundai-Kia 569 614 773 854 937 985 1,033 1,0613.7% 4.4% 6.0% 6.0% 6.2% 6.3% 6.6% 6.7%
Volvo 249 231 255 285 290 301 322 3411.6% 1.7% 2.0% 2.0% 1.9% 1.9% 2.1% 2.2%
Tata group 128 100 146 179 233 237 236 2240.8% 0.7% 1.1% 1.3% 1.5% 1.5% 1.5% 1.4%
Other brands (including MG-Rover, Saab) 168 53 32 46 41 65 71 1621.1% 0.4% 0.2% 0.3% 0.3% 0.4% 0.5% 1.0%
TOTAL EU + EFTA 15,572 13,832 12,987 14,189 15,118 15,610 15,607 15,782100.0% 100.0% 100.0% 100.0% 100.0% 100.0% 100.0% 100.0%
Year-on-year change -5.0% 5.4% 9.3% 6.7% 3.4% 10.0% 4.4%
2005 (3) 2010 2014 2015 2016 2017 2018 2019
PSA GROUP 389 344 330 354 380 461 533 55718.1% 21.9% 20.3% 19.5% 18.9% 22.1% 24.7% 25.1%
RENAULT GROUP 331 266 258 299 328 338 349 36215.4% 17.0% 15.9% 16.5% 16.3% 16.2% 16.2% 16.3%
FCA group 284 233 207 229 270 265 266 26913.2% 14.9% 12.8% 12.7% 13.4% 12.7% 12.3% 12.2%
Ford group 235 171 215 268 319 332 355 35110.9% 10.9% 13.2% 14.8% 15.8% 15.9% 16.5% 15.8%
General Motors 153 78 84 104 106 58 0 07.1% 5.0% 5.2% 5.7% 5.3% 2.8% 0.0% 0.0%
Volkswagen group 212 185 225 218 243 251 267 2719.9% 11.8% 13.9% 12.0% 12.1% 12.0% 12.4% 12.2%
Daimler group 166 140 159 172 186 198 201 2197.7% 8.9% 9.8% 9.5% 9.2% 9.5% 9.3% 9.9%
Nissan 103 43 47 50 66 68 62 574.8% 2.7% 2.9% 2.7% 3.3% 3.3% 2.9% 2.6%
Toyota-Lexus-Daihatsu 65 39 38 41 40 52 56 553.0% 2.5% 2.3% 2.3% 2.0% 2.5% 2.6% 2.5%
Other Japanese brands 81 38 30 37 41 40 40 463.8% 2.4% 1.9% 2.0% 2.1% 1.9% 1.9% 2.1%
Hyundai-Kia 52 6 3 4 7 6 5 42.4% 0.4% 0.2% 0.2% 0.4% 0.3% 0.2% 0.2%
Other brands (including MG-Rover, Saab) 78 27 30 35 26 20 24 253.6% 1.7% 1.9% 1.9% 1.3% 0.9% 1.1% 1.1%
TOTAL EU + EFTA 2,149 1,569 1,627 1,813 2,011 2,089 2,157 2,218100.0% 100.0% 100.0% 100.0% 100.0% 100.0% 100.0% 100.0%
Year-on-year change 8.8% 10.9% -9.8% 10.9% 3.9% 3.3% 2.8%
► NEW PASSENGER CAR REGISTRATIONS BY GROUP IN THE EUROPEAN UNION (1) + EFTA (2)(IN THOUSANDS OF UNITS AND AS A % OF TOTAL REGISTRATIONS)
► NEW LIGHT COMMERCIAL VEHICLES REGISTRATIONS BY GROUP IN THE EUROPEAN UNION (1) + EFTA (2)(IN THOUSANDS OF UNITS AND AS A % OF TOTAL REGISTRATIONS)
europe • markets & vehicle in use
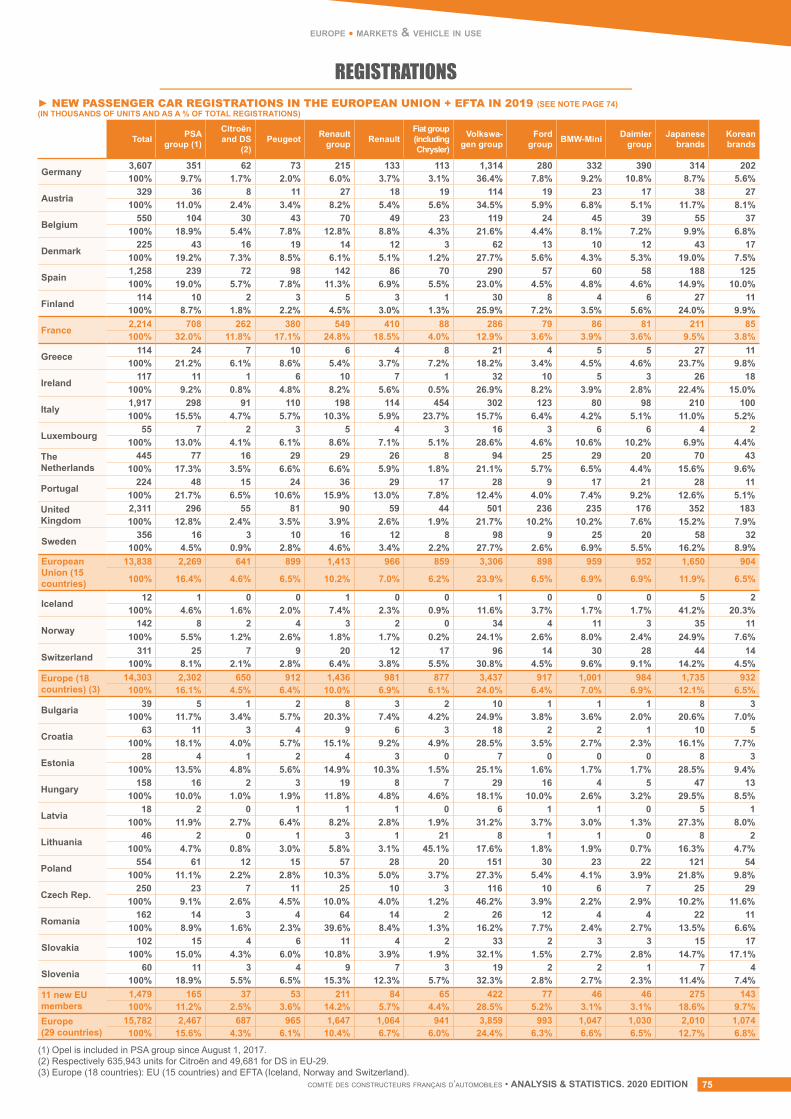
comité des constructeurs français d’automobiles • ANALYSIS & STATISTICS. 2020 EDITION 75
europe • markets & vehicle in use
REGISTRATIONS
(1) Opel is included in PSA group since August 1, 2017. (2) Respectively 635,943 units for Citroën and 49,681 for DS in EU-29.(3) Europe (18 countries): EU (15 countries) and EFTA (Iceland, Norway and Switzerland).
Total PSA group (1)
Citroën and DS
(2)Peugeot Renault
group RenaultFiat group (including Chrysler)
Volkswa-gen group
Ford group BMW-Mini Daimler
groupJapanese
brandsKorean brands
Germany 3,607 351 62 73 215 133 113 1,314 280 332 390 314 202100% 9.7% 1.7% 2.0% 6.0% 3.7% 3.1% 36.4% 7.8% 9.2% 10.8% 8.7% 5.6%
Austria329 36 8 11 27 18 19 114 19 23 17 38 27
100% 11.0% 2.4% 3.4% 8.2% 5.4% 5.6% 34.5% 5.9% 6.8% 5.1% 11.7% 8.1%
Belgium550 104 30 43 70 49 23 119 24 45 39 55 37
100% 18.9% 5.4% 7.8% 12.8% 8.8% 4.3% 21.6% 4.4% 8.1% 7.2% 9.9% 6.8%
Denmark225 43 16 19 14 12 3 62 13 10 12 43 17
100% 19.2% 7.3% 8.5% 6.1% 5.1% 1.2% 27.7% 5.6% 4.3% 5.3% 19.0% 7.5%
Spain1,258 239 72 98 142 86 70 290 57 60 58 188 125100% 19.0% 5.7% 7.8% 11.3% 6.9% 5.5% 23.0% 4.5% 4.8% 4.6% 14.9% 10.0%
Finland114 10 2 3 5 3 1 30 8 4 6 27 11
100% 8.7% 1.8% 2.2% 4.5% 3.0% 1.3% 25.9% 7.2% 3.5% 5.6% 24.0% 9.9%
France 2,214 708 262 380 549 410 88 286 79 86 81 211 85100% 32.0% 11.8% 17.1% 24.8% 18.5% 4.0% 12.9% 3.6% 3.9% 3.6% 9.5% 3.8%
Greece 114 24 7 10 6 4 8 21 4 5 5 27 11100% 21.2% 6.1% 8.6% 5.4% 3.7% 7.2% 18.2% 3.4% 4.5% 4.6% 23.7% 9.8%
Ireland117 11 1 6 10 7 1 32 10 5 3 26 18
100% 9.2% 0.8% 4.8% 8.2% 5.6% 0.5% 26.9% 8.2% 3.9% 2.8% 22.4% 15.0%
Italy1,917 298 91 110 198 114 454 302 123 80 98 210 100100% 15.5% 4.7% 5.7% 10.3% 5.9% 23.7% 15.7% 6.4% 4.2% 5.1% 11.0% 5.2%
Luxembourg55 7 2 3 5 4 3 16 3 6 6 4 2
100% 13.0% 4.1% 6.1% 8.6% 7.1% 5.1% 28.6% 4.6% 10.6% 10.2% 6.9% 4.4%TheNetherlands
445 77 16 29 29 26 8 94 25 29 20 70 43100% 17.3% 3.5% 6.6% 6.6% 5.9% 1.8% 21.1% 5.7% 6.5% 4.4% 15.6% 9.6%
Portugal224 48 15 24 36 29 17 28 9 17 21 28 11
100% 21.7% 6.5% 10.6% 15.9% 13.0% 7.8% 12.4% 4.0% 7.4% 9.2% 12.6% 5.1%UnitedKingdom
2,311 296 55 81 90 59 44 501 236 235 176 352 183100% 12.8% 2.4% 3.5% 3.9% 2.6% 1.9% 21.7% 10.2% 10.2% 7.6% 15.2% 7.9%
Sweden356 16 3 10 16 12 8 98 9 25 20 58 32
100% 4.5% 0.9% 2.8% 4.6% 3.4% 2.2% 27.7% 2.6% 6.9% 5.5% 16.2% 8.9%European Union (15 countries)
13,838 2,269 641 899 1,413 966 859 3,306 898 959 952 1,650 904
100% 16.4% 4.6% 6.5% 10.2% 7.0% 6.2% 23.9% 6.5% 6.9% 6.9% 11.9% 6.5%
Iceland 12 1 0 0 1 0 0 1 0 0 0 5 2100% 4.6% 1.6% 2.0% 7.4% 2.3% 0.9% 11.6% 3.7% 1.7% 1.7% 41.2% 20.3%
Norway142 8 2 4 3 2 0 34 4 11 3 35 11
100% 5.5% 1.2% 2.6% 1.8% 1.7% 0.2% 24.1% 2.6% 8.0% 2.4% 24.9% 7.6%
Switzerland311 25 7 9 20 12 17 96 14 30 28 44 14
100% 8.1% 2.1% 2.8% 6.4% 3.8% 5.5% 30.8% 4.5% 9.6% 9.1% 14.2% 4.5%Europe (18 countries) (3)
14,303 2,302 650 912 1,436 981 877 3,437 917 1,001 984 1,735 932100% 16.1% 4.5% 6.4% 10.0% 6.9% 6.1% 24.0% 6.4% 7.0% 6.9% 12.1% 6.5%
Bulgaria 39 5 1 2 8 3 2 10 1 1 1 8 3100% 11.7% 3.4% 5.7% 20.3% 7.4% 4.2% 24.9% 3.8% 3.6% 2.0% 20.6% 7.0%
Croatia63 11 3 4 9 6 3 18 2 2 1 10 5
100% 18.1% 4.0% 5.7% 15.1% 9.2% 4.9% 28.5% 3.5% 2.7% 2.3% 16.1% 7.7%
Estonia28 4 1 2 4 3 0 7 0 0 0 8 3
100% 13.5% 4.8% 5.6% 14.9% 10.3% 1.5% 25.1% 1.6% 1.7% 1.7% 28.5% 9.4%
Hungary158 16 2 3 19 8 7 29 16 4 5 47 13
100% 10.0% 1.0% 1.9% 11.8% 4.8% 4.6% 18.1% 10.0% 2.6% 3.2% 29.5% 8.5%
Latvia18 2 0 1 1 1 0 6 1 1 0 5 1
100% 11.9% 2.7% 6.4% 8.2% 2.8% 1.9% 31.2% 3.7% 3.0% 1.3% 27.3% 8.0%
Lithuania46 2 0 1 3 1 21 8 1 1 0 8 2
100% 4.7% 0.8% 3.0% 5.8% 3.1% 45.1% 17.6% 1.8% 1.9% 0.7% 16.3% 4.7%
Poland554 61 12 15 57 28 20 151 30 23 22 121 54
100% 11.1% 2.2% 2.8% 10.3% 5.0% 3.7% 27.3% 5.4% 4.1% 3.9% 21.8% 9.8%
Czech Rep.250 23 7 11 25 10 3 116 10 6 7 25 29
100% 9.1% 2.6% 4.5% 10.0% 4.0% 1.2% 46.2% 3.9% 2.2% 2.9% 10.2% 11.6%
Romania162 14 3 4 64 14 2 26 12 4 4 22 11
100% 8.9% 1.6% 2.3% 39.6% 8.4% 1.3% 16.2% 7.7% 2.4% 2.7% 13.5% 6.6%
Slovakia102 15 4 6 11 4 2 33 2 3 3 15 17
100% 15.0% 4.3% 6.0% 10.8% 3.9% 1.9% 32.1% 1.5% 2.7% 2.8% 14.7% 17.1%
Slovenia60 11 3 4 9 7 3 19 2 2 1 7 4
100% 18.9% 5.5% 6.5% 15.3% 12.3% 5.7% 32.3% 2.8% 2.7% 2.3% 11.4% 7.4%11 new EU members
1,479 165 37 53 211 84 65 422 77 46 46 275 143100% 11.2% 2.5% 3.6% 14.2% 5.7% 4.4% 28.5% 5.2% 3.1% 3.1% 18.6% 9.7%
Europe(29 countries)
15,782 2,467 687 965 1,647 1,064 941 3,859 993 1,047 1,030 2,010 1,074100% 15.6% 4.3% 6.1% 10.4% 6.7% 6.0% 24.4% 6.3% 6.6% 6.5% 12.7% 6.8%
► NEW PASSENGER CAR REGISTRATIONS IN THE EUROPEAN UNION + EFTA IN 2019 (SEE NOTE PAGE 74)(IN THOUSANDS OF UNITS AND AS A % OF TOTAL REGISTRATIONS)
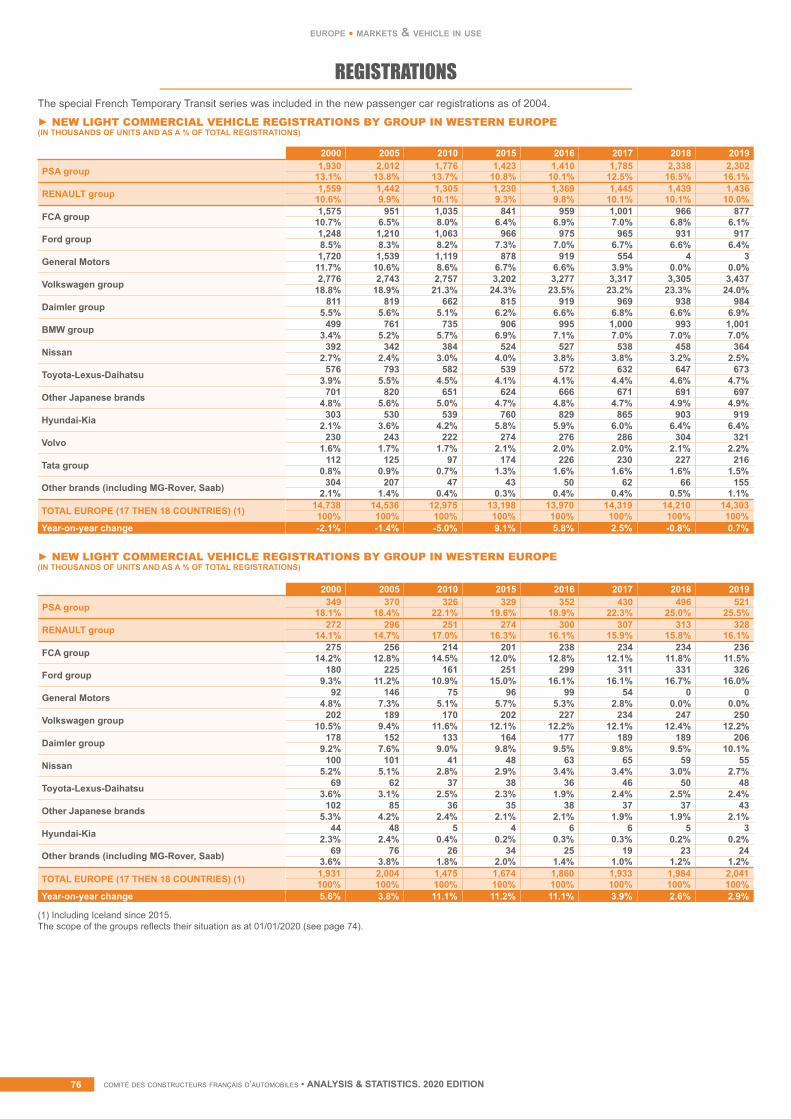
comité des constructeurs français d’automobiles • ANALYSIS & STATISTICS. 2020 EDITIONcomité des constructeurs français d’automobiles • ANALYSIS & STATISTICS. 2020 EDITION76
REGISTRATIONS
2000 2005 2010 2015 2016 2017 2018 2019
PSA group 1,930 2,012 1,776 1,423 1,410 1,785 2,338 2,30213.1% 13.8% 13.7% 10.8% 10.1% 12.5% 16.5% 16.1%
RENAULT group 1,559 1,442 1,305 1,230 1,369 1,445 1,439 1,43610.6% 9.9% 10.1% 9.3% 9.8% 10.1% 10.1% 10.0%
FCA group 1,575 951 1,035 841 959 1,001 966 87710.7% 6.5% 8.0% 6.4% 6.9% 7.0% 6.8% 6.1%
Ford group 1,248 1,210 1,063 966 975 965 931 9178.5% 8.3% 8.2% 7.3% 7.0% 6.7% 6.6% 6.4%
General Motors 1,720 1,539 1,119 878 919 554 4 311.7% 10.6% 8.6% 6.7% 6.6% 3.9% 0.0% 0.0%
Volkswagen group 2,776 2,743 2,757 3,202 3,277 3,317 3,305 3,43718.8% 18.9% 21.3% 24.3% 23.5% 23.2% 23.3% 24.0%
Daimler group 811 819 662 815 919 969 938 9845.5% 5.6% 5.1% 6.2% 6.6% 6.8% 6.6% 6.9%
BMW group 499 761 735 906 995 1,000 993 1,0013.4% 5.2% 5.7% 6.9% 7.1% 7.0% 7.0% 7.0%
Nissan 392 342 384 524 527 538 458 3642.7% 2.4% 3.0% 4.0% 3.8% 3.8% 3.2% 2.5%
Toyota-Lexus-Daihatsu 576 793 582 539 572 632 647 6733.9% 5.5% 4.5% 4.1% 4.1% 4.4% 4.6% 4.7%
Other Japanese brands 701 820 651 624 666 671 691 6974.8% 5.6% 5.0% 4.7% 4.8% 4.7% 4.9% 4.9%
Hyundai-Kia 303 530 539 760 829 865 903 9192.1% 3.6% 4.2% 5.8% 5.9% 6.0% 6.4% 6.4%
Volvo 230 243 222 274 276 286 304 3211.6% 1.7% 1.7% 2.1% 2.0% 2.0% 2.1% 2.2%
Tata group 112 125 97 174 226 230 227 2160.8% 0.9% 0.7% 1.3% 1.6% 1.6% 1.6% 1.5%
Other brands (including MG-Rover, Saab) 304 207 47 43 50 62 66 1552.1% 1.4% 0.4% 0.3% 0.4% 0.4% 0.5% 1.1%
TOTAL EUROPE (17 THEN 18 COUNTRIES) (1) 14,738 14,536 12,975 13,198 13,970 14,319 14,210 14,303100% 100% 100% 100% 100% 100% 100% 100%
Year-on-year change -2.1% -1.4% -5.0% 9.1% 5.8% 2.5% -0.8% 0.7%
► NEW LIGHT COMMERCIAL VEHICLE REGISTRATIONS BY GROUP IN WESTERN EUROPE(IN THOUSANDS OF UNITS AND AS A % OF TOTAL REGISTRATIONS)
europe • markets & vehicle in use
2000 2005 2010 2015 2016 2017 2018 2019
PSA group 349 370 326 329 352 430 496 52118.1% 18.4% 22.1% 19.6% 18.9% 22.3% 25.0% 25.5%
RENAULT group 272 296 251 274 300 307 313 32814.1% 14.7% 17.0% 16.3% 16.1% 15.9% 15.8% 16.1%
FCA group 275 256 214 201 238 234 234 23614.2% 12.8% 14.5% 12.0% 12.8% 12.1% 11.8% 11.5%
Ford group 180 225 161 251 299 311 331 3269.3% 11.2% 10.9% 15.0% 16.1% 16.1% 16.7% 16.0%
General Motors 92 146 75 96 99 54 0 04.8% 7.3% 5.1% 5.7% 5.3% 2.8% 0.0% 0.0%
Volkswagen group 202 189 170 202 227 234 247 25010.5% 9.4% 11.6% 12.1% 12.2% 12.1% 12.4% 12.2%
Daimler group 178 152 133 164 177 189 189 2069.2% 7.6% 9.0% 9.8% 9.5% 9.8% 9.5% 10.1%
Nissan 100 101 41 48 63 65 59 555.2% 5.1% 2.8% 2.9% 3.4% 3.4% 3.0% 2.7%
Toyota-Lexus-Daihatsu 69 62 37 38 36 46 50 483.6% 3.1% 2.5% 2.3% 1.9% 2.4% 2.5% 2.4%
Other Japanese brands 102 85 36 35 38 37 37 435.3% 4.2% 2.4% 2.1% 2.1% 1.9% 1.9% 2.1%
Hyundai-Kia 44 48 5 4 6 6 5 32.3% 2.4% 0.4% 0.2% 0.3% 0.3% 0.2% 0.2%
Other brands (including MG-Rover, Saab) 69 76 26 34 25 19 23 243.6% 3.8% 1.8% 2.0% 1.4% 1.0% 1.2% 1.2%
TOTAL EUROPE (17 THEN 18 COUNTRIES) (1) 1,931 2,004 1,475 1,674 1,860 1,933 1,984 2,041100% 100% 100% 100% 100% 100% 100% 100%
Year-on-year change 5.6% 3.8% 11.1% 11.2% 11.1% 3.9% 2.6% 2.9%
► NEW LIGHT COMMERCIAL VEHICLE REGISTRATIONS BY GROUP IN WESTERN EUROPE(IN THOUSANDS OF UNITS AND AS A % OF TOTAL REGISTRATIONS)
(1) Including Iceland since 2015.The scope of the groups reflects their situation as at 01/01/2020 (see page 74).
The special French Temporary Transit series was included in the new passenger car registrations as of 2004.
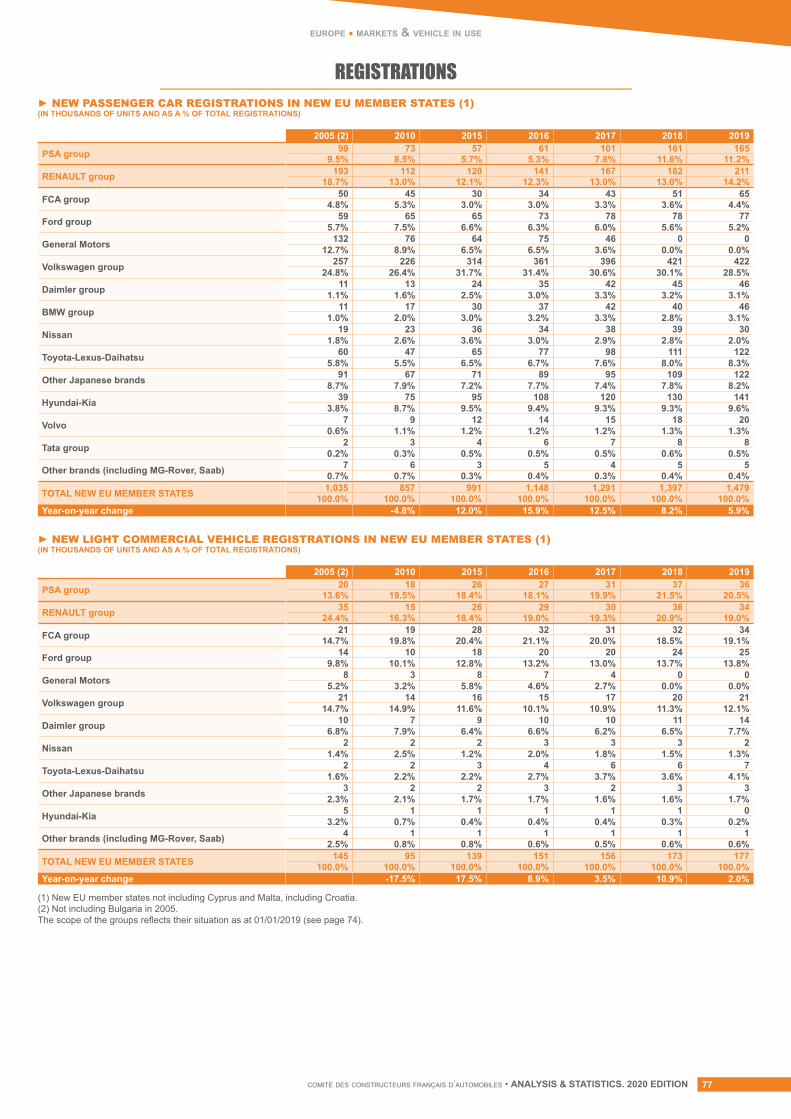
comité des constructeurs français d’automobiles • ANALYSIS & STATISTICS. 2020 EDITION 77
europe • markets & vehicle in use
REGISTRATIONS
2005 (2) 2010 2015 2016 2017 2018 2019
PSA group 99 73 57 61 101 161 1659.5% 8.5% 5.7% 5.3% 7.8% 11.6% 11.2%
RENAULT group 193 112 120 141 167 182 21118.7% 13.0% 12.1% 12.3% 13.0% 13.0% 14.2%
FCA group 50 45 30 34 43 51 654.8% 5.3% 3.0% 3.0% 3.3% 3.6% 4.4%
Ford group 59 65 65 73 78 78 775.7% 7.5% 6.6% 6.3% 6.0% 5.6% 5.2%
General Motors 132 76 64 75 46 0 012.7% 8.9% 6.5% 6.5% 3.6% 0.0% 0.0%
Volkswagen group 257 226 314 361 396 421 42224.8% 26.4% 31.7% 31.4% 30.6% 30.1% 28.5%
Daimler group 11 13 24 35 42 45 461.1% 1.6% 2.5% 3.0% 3.3% 3.2% 3.1%
BMW group 11 17 30 37 42 40 461.0% 2.0% 3.0% 3.2% 3.3% 2.8% 3.1%
Nissan 19 23 36 34 38 39 301.8% 2.6% 3.6% 3.0% 2.9% 2.8% 2.0%
Toyota-Lexus-Daihatsu 60 47 65 77 98 111 1225.8% 5.5% 6.5% 6.7% 7.6% 8.0% 8.3%
Other Japanese brands 91 67 71 89 95 109 1228.7% 7.9% 7.2% 7.7% 7.4% 7.8% 8.2%
Hyundai-Kia 39 75 95 108 120 130 1413.8% 8.7% 9.5% 9.4% 9.3% 9.3% 9.6%
Volvo 7 9 12 14 15 18 200.6% 1.1% 1.2% 1.2% 1.2% 1.3% 1.3%
Tata group 2 3 4 6 7 8 80.2% 0.3% 0.5% 0.5% 0.5% 0.6% 0.5%
Other brands (including MG-Rover, Saab) 7 6 3 5 4 5 50.7% 0.7% 0.3% 0.4% 0.3% 0.4% 0.4%
TOTAL NEW EU MEMBER STATES 1,035 857 991 1,148 1,291 1,397 1,479100.0% 100.0% 100.0% 100.0% 100.0% 100.0% 100.0%
Year-on-year change -4.8% 12.0% 15.9% 12.5% 8.2% 5.9%
2005 (2) 2010 2015 2016 2017 2018 2019
PSA group 20 18 26 27 31 37 3613.6% 19.5% 18.4% 18.1% 19.9% 21.5% 20.5%
RENAULT group 35 15 26 29 30 36 3424.4% 16.3% 18.4% 19.0% 19.3% 20.9% 19.0%
FCA group 21 19 28 32 31 32 3414.7% 19.8% 20.4% 21.1% 20.0% 18.5% 19.1%
Ford group 14 10 18 20 20 24 259.8% 10.1% 12.8% 13.2% 13.0% 13.7% 13.8%
General Motors 8 3 8 7 4 0 05.2% 3.2% 5.8% 4.6% 2.7% 0.0% 0.0%
Volkswagen group 21 14 16 15 17 20 2114.7% 14.9% 11.6% 10.1% 10.9% 11.3% 12.1%
Daimler group 10 7 9 10 10 11 146.8% 7.9% 6.4% 6.6% 6.2% 6.5% 7.7%
Nissan 2 2 2 3 3 3 21.4% 2.5% 1.2% 2.0% 1.8% 1.5% 1.3%
Toyota-Lexus-Daihatsu 2 2 3 4 6 6 71.6% 2.2% 2.2% 2.7% 3.7% 3.6% 4.1%
Other Japanese brands 3 2 2 3 2 3 32.3% 2.1% 1.7% 1.7% 1.6% 1.6% 1.7%
Hyundai-Kia 5 1 1 1 1 1 03.2% 0.7% 0.4% 0.4% 0.4% 0.3% 0.2%
Other brands (including MG-Rover, Saab) 4 1 1 1 1 1 12.5% 0.8% 0.8% 0.6% 0.5% 0.6% 0.6%
TOTAL NEW EU MEMBER STATES 145 95 139 151 156 173 177100.0% 100.0% 100.0% 100.0% 100.0% 100.0% 100.0%
Year-on-year change -17.5% 17.5% 8.9% 3.5% 10.9% 2.0%
► NEW PASSENGER CAR REGISTRATIONS IN NEW EU MEMBER STATES (1)(IN THOUSANDS OF UNITS AND AS A % OF TOTAL REGISTRATIONS)
► NEW LIGHT COMMERCIAL VEHICLE REGISTRATIONS IN NEW EU MEMBER STATES (1)(IN THOUSANDS OF UNITS AND AS A % OF TOTAL REGISTRATIONS)
(1) New EU member states not including Cyprus and Malta, including Croatia.(2) Not including Bulgaria in 2005.The scope of the groups reflects their situation as at 01/01/2019 (see page 74).
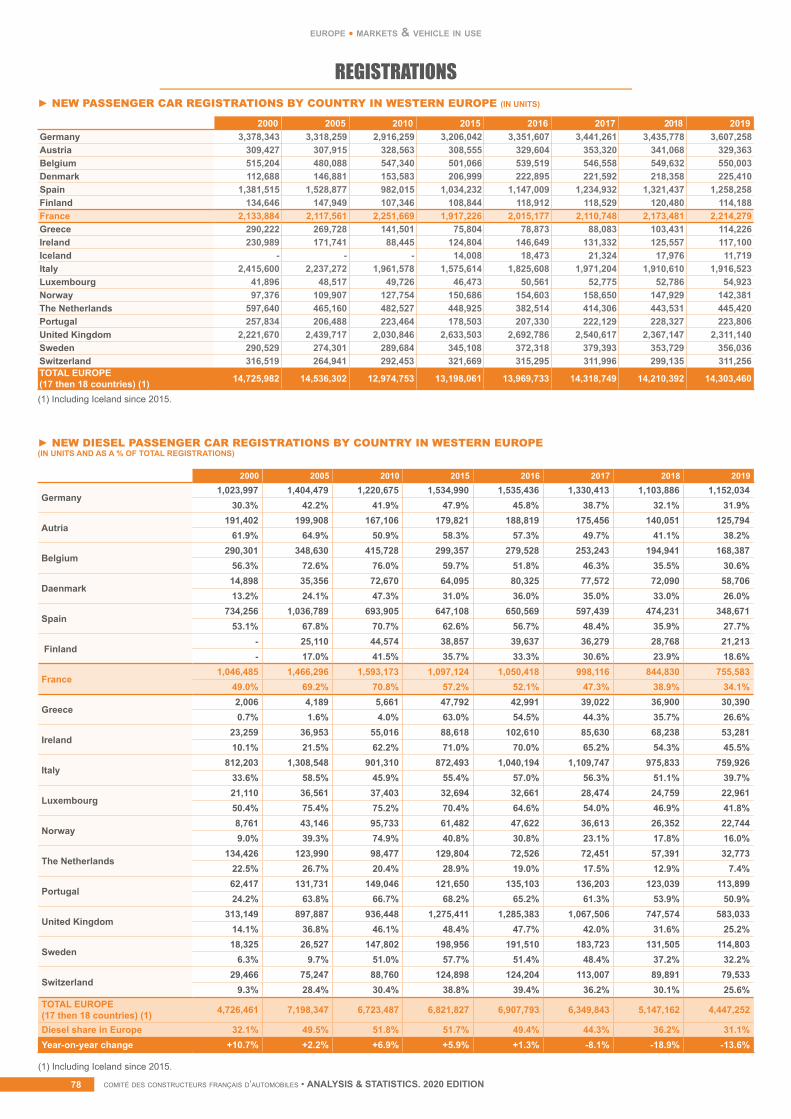
comité des constructeurs français d’automobiles • ANALYSIS & STATISTICS. 2020 EDITIONcomité des constructeurs français d’automobiles • ANALYSIS & STATISTICS. 2020 EDITION78
europe • markets & vehicle in use
REGISTRATIONS
► NEW DIESEL PASSENGER CAR REGISTRATIONS BY COUNTRY IN WESTERN EUROPE(IN UNITS AND AS A % OF TOTAL REGISTRATIONS)
2000 2005 2010 2015 2016 2017 2018 2019
Germany1,023,997 1,404,479 1,220,675 1,534,990 1,535,436 1,330,413 1,103,886 1,152,034
30.3% 42.2% 41.9% 47.9% 45.8% 38.7% 32.1% 31.9%
Autria191,402 199,908 167,106 179,821 188,819 175,456 140,051 125,794
61.9% 64.9% 50.9% 58.3% 57.3% 49.7% 41.1% 38.2%
Belgium290,301 348,630 415,728 299,357 279,528 253,243 194,941 168,387
56.3% 72.6% 76.0% 59.7% 51.8% 46.3% 35.5% 30.6%
Daenmark14,898 35,356 72,670 64,095 80,325 77,572 72,090 58,70613.2% 24.1% 47.3% 31.0% 36.0% 35.0% 33.0% 26.0%
Spain734,256 1,036,789 693,905 647,108 650,569 597,439 474,231 348,671
53.1% 67.8% 70.7% 62.6% 56.7% 48.4% 35.9% 27.7%
Finland- 25,110 44,574 38,857 39,637 36,279 28,768 21,213- 17.0% 41.5% 35.7% 33.3% 30.6% 23.9% 18.6%
France1,046,485 1,466,296 1,593,173 1,097,124 1,050,418 998,116 844,830 755,583
49.0% 69.2% 70.8% 57.2% 52.1% 47.3% 38.9% 34.1%
Greece2,006 4,189 5,661 47,792 42,991 39,022 36,900 30,3900.7% 1.6% 4.0% 63.0% 54.5% 44.3% 35.7% 26.6%
Ireland23,259 36,953 55,016 88,618 102,610 85,630 68,238 53,28110.1% 21.5% 62.2% 71.0% 70.0% 65.2% 54.3% 45.5%
Italy812,203 1,308,548 901,310 872,493 1,040,194 1,109,747 975,833 759,926
33.6% 58.5% 45.9% 55.4% 57.0% 56.3% 51.1% 39.7%
Luxembourg21,110 36,561 37,403 32,694 32,661 28,474 24,759 22,96150.4% 75.4% 75.2% 70.4% 64.6% 54.0% 46.9% 41.8%
Norway8,761 43,146 95,733 61,482 47,622 36,613 26,352 22,7449.0% 39.3% 74.9% 40.8% 30.8% 23.1% 17.8% 16.0%
The Netherlands134,426 123,990 98,477 129,804 72,526 72,451 57,391 32,773
22.5% 26.7% 20.4% 28.9% 19.0% 17.5% 12.9% 7.4%
Portugal62,417 131,731 149,046 121,650 135,103 136,203 123,039 113,89924.2% 63.8% 66.7% 68.2% 65.2% 61.3% 53.9% 50.9%
United Kingdom313,149 897,887 936,448 1,275,411 1,285,383 1,067,506 747,574 583,033
14.1% 36.8% 46.1% 48.4% 47.7% 42.0% 31.6% 25.2%
Sweden18,325 26,527 147,802 198,956 191,510 183,723 131,505 114,803
6.3% 9.7% 51.0% 57.7% 51.4% 48.4% 37.2% 32.2%
Switzerland29,466 75,247 88,760 124,898 124,204 113,007 89,891 79,533
9.3% 28.4% 30.4% 38.8% 39.4% 36.2% 30.1% 25.6%TOTAL EUROPE(17 then 18 countries) (1) 4,726,461 7,198,347 6,723,487 6,821,827 6,907,793 6,349,843 5,147,162 4,447,252
Diesel share in Europe 32.1% 49.5% 51.8% 51.7% 49.4% 44.3% 36.2% 31.1%Year-on-year change +10.7% +2.2% +6.9% +5.9% +1.3% -8.1% -18.9% -13.6%
(1) Including Iceland since 2015.
2000 2005 2010 2015 2016 2017 2018 2019Germany 3,378,343 3,318,259 2,916,259 3,206,042 3,351,607 3,441,261 3,435,778 3,607,258Austria 309,427 307,915 328,563 308,555 329,604 353,320 341,068 329,363Belgium 515,204 480,088 547,340 501,066 539,519 546,558 549,632 550,003Denmark 112,688 146,881 153,583 206,999 222,895 221,592 218,358 225,410Spain 1,381,515 1,528,877 982,015 1,034,232 1,147,009 1,234,932 1,321,437 1,258,258Finland 134,646 147,949 107,346 108,844 118,912 118,529 120,480 114,188France 2,133,884 2,117,561 2,251,669 1,917,226 2,015,177 2,110,748 2,173,481 2,214,279Greece 290,222 269,728 141,501 75,804 78,873 88,083 103,431 114,226Ireland 230,989 171,741 88,445 124,804 146,649 131,332 125,557 117,100Iceland - - - 14,008 18,473 21,324 17,976 11,719Italy 2,415,600 2,237,272 1,961,578 1,575,614 1,825,608 1,971,204 1,910,610 1,916,523Luxembourg 41,896 48,517 49,726 46,473 50,561 52,775 52,786 54,923Norway 97,376 109,907 127,754 150,686 154,603 158,650 147,929 142,381The Netherlands 597,640 465,160 482,527 448,925 382,514 414,306 443,531 445,420Portugal 257,834 206,488 223,464 178,503 207,330 222,129 228,327 223,806United Kingdom 2,221,670 2,439,717 2,030,846 2,633,503 2,692,786 2,540,617 2,367,147 2,311,140Sweden 290,529 274,301 289,684 345,108 372,318 379,393 353,729 356,036Switzerland 316,519 264,941 292,453 321,669 315,295 311,996 299,135 311,256TOTAL EUROPE(17 then 18 countries) (1) 14,725,982 14,536,302 12,974,753 13,198,061 13,969,733 14,318,749 14,210,392 14,303,460
► NEW PASSENGER CAR REGISTRATIONS BY COUNTRY IN WESTERN EUROPE (IN UNITS)
(1) Including Iceland since 2015.
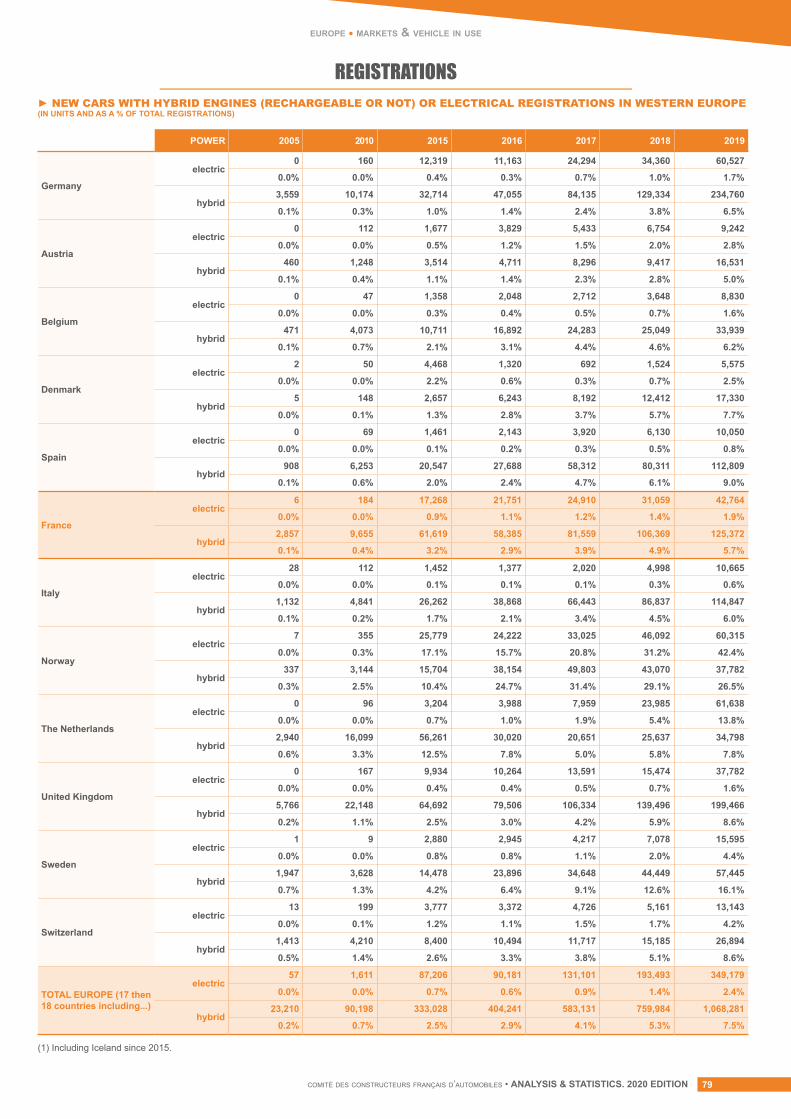
comité des constructeurs français d’automobiles • ANALYSIS & STATISTICS. 2020 EDITION 79
(1) Including Iceland since 2015.
europe • markets & vehicle in use
REGISTRATIONS
POWER 2005 2010 2015 2016 2017 2018 2019
Germany
electric0 160 12,319 11,163 24,294 34,360 60,527
0.0% 0.0% 0.4% 0.3% 0.7% 1.0% 1.7%
hybrid3,559 10,174 32,714 47,055 84,135 129,334 234,760
0.1% 0.3% 1.0% 1.4% 2.4% 3.8% 6.5%
Austria
electric0 112 1,677 3,829 5,433 6,754 9,242
0.0% 0.0% 0.5% 1.2% 1.5% 2.0% 2.8%
hybrid460 1,248 3,514 4,711 8,296 9,417 16,531
0.1% 0.4% 1.1% 1.4% 2.3% 2.8% 5.0%
Belgium
electric0 47 1,358 2,048 2,712 3,648 8,830
0.0% 0.0% 0.3% 0.4% 0.5% 0.7% 1.6%
hybrid471 4,073 10,711 16,892 24,283 25,049 33,939
0.1% 0.7% 2.1% 3.1% 4.4% 4.6% 6.2%
Denmark
electric2 50 4,468 1,320 692 1,524 5,575
0.0% 0.0% 2.2% 0.6% 0.3% 0.7% 2.5%
hybrid5 148 2,657 6,243 8,192 12,412 17,330
0.0% 0.1% 1.3% 2.8% 3.7% 5.7% 7.7%
Spain
electric0 69 1,461 2,143 3,920 6,130 10,050
0.0% 0.0% 0.1% 0.2% 0.3% 0.5% 0.8%
hybrid908 6,253 20,547 27,688 58,312 80,311 112,809
0.1% 0.6% 2.0% 2.4% 4.7% 6.1% 9.0%
France
electric6 184 17,268 21,751 24,910 31,059 42,764
0.0% 0.0% 0.9% 1.1% 1.2% 1.4% 1.9%
hybrid2,857 9,655 61,619 58,385 81,559 106,369 125,372
0.1% 0.4% 3.2% 2.9% 3.9% 4.9% 5.7%
Italy
electric28 112 1,452 1,377 2,020 4,998 10,665
0.0% 0.0% 0.1% 0.1% 0.1% 0.3% 0.6%
hybrid1,132 4,841 26,262 38,868 66,443 86,837 114,847
0.1% 0.2% 1.7% 2.1% 3.4% 4.5% 6.0%
Norway
electric7 355 25,779 24,222 33,025 46,092 60,315
0.0% 0.3% 17.1% 15.7% 20.8% 31.2% 42.4%
hybrid337 3,144 15,704 38,154 49,803 43,070 37,782
0.3% 2.5% 10.4% 24.7% 31.4% 29.1% 26.5%
The Netherlands
electric0 96 3,204 3,988 7,959 23,985 61,638
0.0% 0.0% 0.7% 1.0% 1.9% 5.4% 13.8%
hybrid2,940 16,099 56,261 30,020 20,651 25,637 34,798
0.6% 3.3% 12.5% 7.8% 5.0% 5.8% 7.8%
United Kingdom
electric0 167 9,934 10,264 13,591 15,474 37,782
0.0% 0.0% 0.4% 0.4% 0.5% 0.7% 1.6%
hybrid5,766 22,148 64,692 79,506 106,334 139,496 199,466
0.2% 1.1% 2.5% 3.0% 4.2% 5.9% 8.6%
Sweden
electric1 9 2,880 2,945 4,217 7,078 15,595
0.0% 0.0% 0.8% 0.8% 1.1% 2.0% 4.4%
hybrid1,947 3,628 14,478 23,896 34,648 44,449 57,445
0.7% 1.3% 4.2% 6.4% 9.1% 12.6% 16.1%
Switzerland
electric13 199 3,777 3,372 4,726 5,161 13,143
0.0% 0.1% 1.2% 1.1% 1.5% 1.7% 4.2%
hybrid1,413 4,210 8,400 10,494 11,717 15,185 26,894
0.5% 1.4% 2.6% 3.3% 3.8% 5.1% 8.6%
TOTAL EUROPE (17 then 18 countries including...)
electric57 1,611 87,206 90,181 131,101 193,493 349,179
0.0% 0.0% 0.7% 0.6% 0.9% 1.4% 2.4%
hybrid23,210 90,198 333,028 404,241 583,131 759,984 1,068,281
0.2% 0.7% 2.5% 2.9% 4.1% 5.3% 7.5%
► NEW CARS WITH HYBRID ENGINES (RECHARGEABLE OR NOT) OR ELECTRICAL REGISTRATIONS IN WESTERN EUROPE (IN UNITS AND AS A % OF TOTAL REGISTRATIONS)
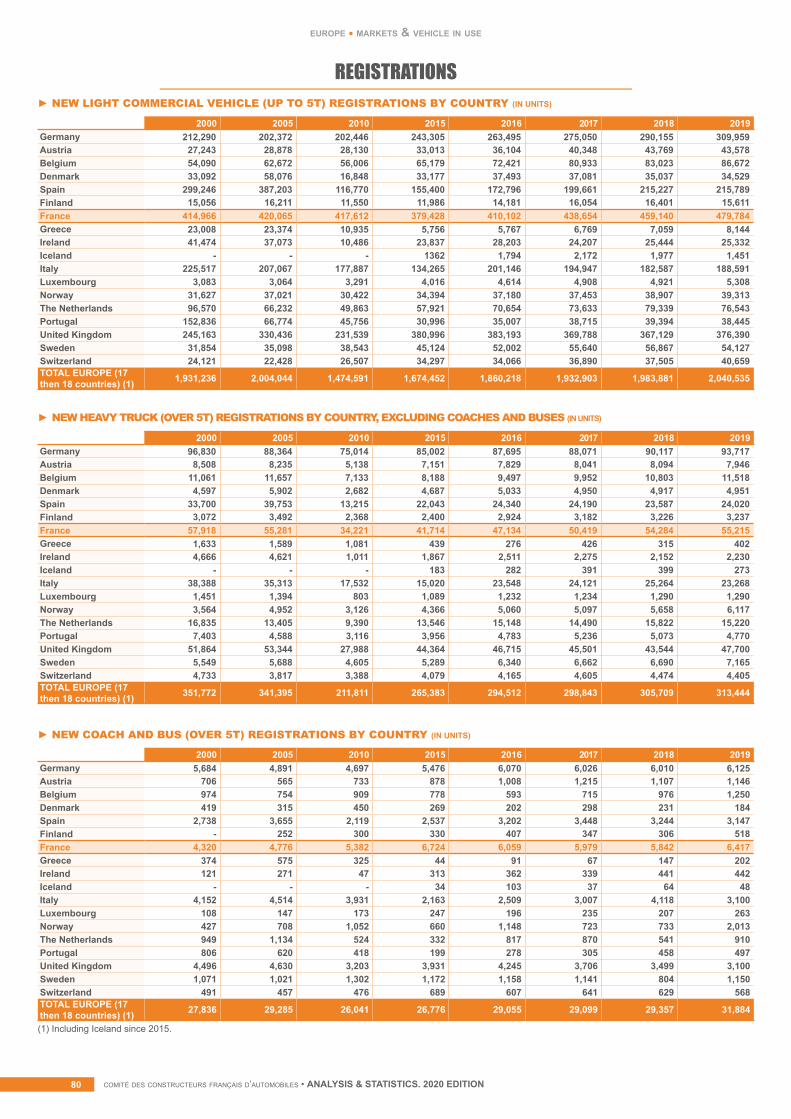
comité des constructeurs français d’automobiles • ANALYSIS & STATISTICS. 2020 EDITIONcomité des constructeurs français d’automobiles • ANALYSIS & STATISTICS. 2020 EDITION80
europe • markets & vehicle in use
REGISTRATIONS
2000 2005 2010 2015 2016 2017 2018 2019Germany 212,290 202,372 202,446 243,305 263,495 275,050 290,155 309,959Austria 27,243 28,878 28,130 33,013 36,104 40,348 43,769 43,578Belgium 54,090 62,672 56,006 65,179 72,421 80,933 83,023 86,672Denmark 33,092 58,076 16,848 33,177 37,493 37,081 35,037 34,529Spain 299,246 387,203 116,770 155,400 172,796 199,661 215,227 215,789Finland 15,056 16,211 11,550 11,986 14,181 16,054 16,401 15,611France 414,966 420,065 417,612 379,428 410,102 438,654 459,140 479,784Greece 23,008 23,374 10,935 5,756 5,767 6,769 7,059 8,144Ireland 41,474 37,073 10,486 23,837 28,203 24,207 25,444 25,332Iceland - - - 1362 1,794 2,172 1,977 1,451Italy 225,517 207,067 177,887 134,265 201,146 194,947 182,587 188,591Luxembourg 3,083 3,064 3,291 4,016 4,614 4,908 4,921 5,308Norway 31,627 37,021 30,422 34,394 37,180 37,453 38,907 39,313The Netherlands 96,570 66,232 49,863 57,921 70,654 73,633 79,339 76,543Portugal 152,836 66,774 45,756 30,996 35,007 38,715 39,394 38,445United Kingdom 245,163 330,436 231,539 380,996 383,193 369,788 367,129 376,390Sweden 31,854 35,098 38,543 45,124 52,002 55,640 56,867 54,127Switzerland 24,121 22,428 26,507 34,297 34,066 36,890 37,505 40,659TOTAL EUROPE (17 then 18 countries) (1) 1,931,236 2,004,044 1,474,591 1,674,452 1,860,218 1,932,903 1,983,881 2,040,535
2000 2005 2010 2015 2016 2017 2018 2019Germany 96,830 88,364 75,014 85,002 87,695 88,071 90,117 93,717Austria 8,508 8,235 5,138 7,151 7,829 8,041 8,094 7,946Belgium 11,061 11,657 7,133 8,188 9,497 9,952 10,803 11,518Denmark 4,597 5,902 2,682 4,687 5,033 4,950 4,917 4,951Spain 33,700 39,753 13,215 22,043 24,340 24,190 23,587 24,020Finland 3,072 3,492 2,368 2,400 2,924 3,182 3,226 3,237France 57,918 55,281 34,221 41,714 47,134 50,419 54,284 55,215Greece 1,633 1,589 1,081 439 276 426 315 402Ireland 4,666 4,621 1,011 1,867 2,511 2,275 2,152 2,230Iceland - - - 183 282 391 399 273Italy 38,388 35,313 17,532 15,020 23,548 24,121 25,264 23,268Luxembourg 1,451 1,394 803 1,089 1,232 1,234 1,290 1,290Norway 3,564 4,952 3,126 4,366 5,060 5,097 5,658 6,117The Netherlands 16,835 13,405 9,390 13,546 15,148 14,490 15,822 15,220Portugal 7,403 4,588 3,116 3,956 4,783 5,236 5,073 4,770United Kingdom 51,864 53,344 27,988 44,364 46,715 45,501 43,544 47,700Sweden 5,549 5,688 4,605 5,289 6,340 6,662 6,690 7,165Switzerland 4,733 3,817 3,388 4,079 4,165 4,605 4,474 4,405TOTAL EUROPE (17 then 18 countries) (1) 351,772 341,395 211,811 265,383 294,512 298,843 305,709 313,444
2000 2005 2010 2015 2016 2017 2018 2019Germany 5,684 4,891 4,697 5,476 6,070 6,026 6,010 6,125Austria 706 565 733 878 1,008 1,215 1,107 1,146Belgium 974 754 909 778 593 715 976 1,250Denmark 419 315 450 269 202 298 231 184Spain 2,738 3,655 2,119 2,537 3,202 3,448 3,244 3,147Finland - 252 300 330 407 347 306 518France 4,320 4,776 5,382 6,724 6,059 5,979 5,842 6,417Greece 374 575 325 44 91 67 147 202Ireland 121 271 47 313 362 339 441 442Iceland - - - 34 103 37 64 48Italy 4,152 4,514 3,931 2,163 2,509 3,007 4,118 3,100Luxembourg 108 147 173 247 196 235 207 263Norway 427 708 1,052 660 1,148 723 733 2,013The Netherlands 949 1,134 524 332 817 870 541 910Portugal 806 620 418 199 278 305 458 497United Kingdom 4,496 4,630 3,203 3,931 4,245 3,706 3,499 3,100Sweden 1,071 1,021 1,302 1,172 1,158 1,141 804 1,150Switzerland 491 457 476 689 607 641 629 568TOTAL EUROPE (17 then 18 countries) (1) 27,836 29,285 26,041 26,776 29,055 29,099 29,357 31,884
► NEW LIGHT COMMERCIAL VEHICLE (UP TO 5T) REGISTRATIONS BY COUNTRY (IN UNITS)
► NEW COACH AND BUS (OVER 5T) REGISTRATIONS BY COUNTRY (IN UNITS)
► NEW HEAVY TRUCK (OVER 5T) REGISTRATIONS BY COUNTRY, EXCLUDING COACHES AND BUSES (IN UNITS)
(1) Including Iceland since 2015.
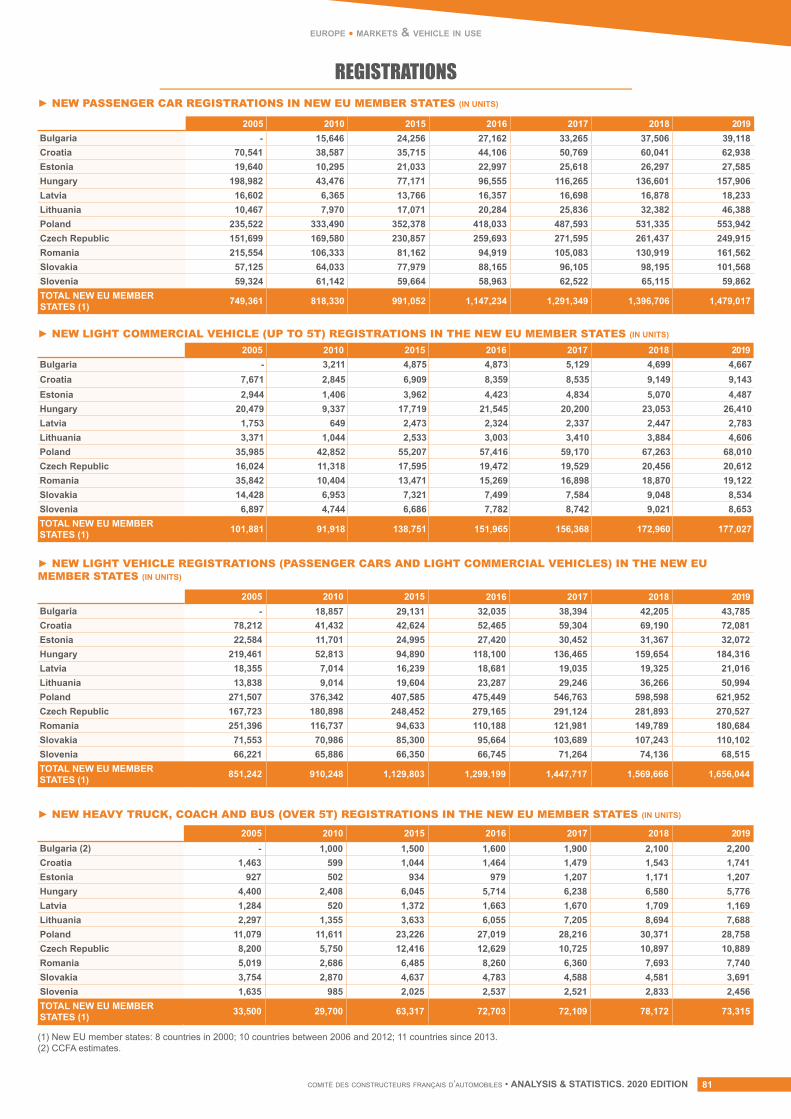
comité des constructeurs français d’automobiles • ANALYSIS & STATISTICS. 2020 EDITION 81
europe • markets & vehicle in use
REGISTRATIONS
(1) New EU member states: 8 countries in 2000; 10 countries between 2006 and 2012; 11 countries since 2013.(2) CCFA estimates.
2005 2010 2015 2016 2017 2018 2019Bulgaria - 15,646 24,256 27,162 33,265 37,506 39,118Croatia 70,541 38,587 35,715 44,106 50,769 60,041 62,938Estonia 19,640 10,295 21,033 22,997 25,618 26,297 27,585Hungary 198,982 43,476 77,171 96,555 116,265 136,601 157,906Latvia 16,602 6,365 13,766 16,357 16,698 16,878 18,233Lithuania 10,467 7,970 17,071 20,284 25,836 32,382 46,388Poland 235,522 333,490 352,378 418,033 487,593 531,335 553,942Czech Republic 151,699 169,580 230,857 259,693 271,595 261,437 249,915Romania 215,554 106,333 81,162 94,919 105,083 130,919 161,562Slovakia 57,125 64,033 77,979 88,165 96,105 98,195 101,568Slovenia 59,324 61,142 59,664 58,963 62,522 65,115 59,862TOTAL NEW EU MEMBER STATES (1) 749,361 818,330 991,052 1,147,234 1,291,349 1,396,706 1,479,017
2005 2010 2015 2016 2017 2018 2019Bulgaria - 3,211 4,875 4,873 5,129 4,699 4,667Croatia 7,671 2,845 6,909 8,359 8,535 9,149 9,143Estonia 2,944 1,406 3,962 4,423 4,834 5,070 4,487Hungary 20,479 9,337 17,719 21,545 20,200 23,053 26,410Latvia 1,753 649 2,473 2,324 2,337 2,447 2,783Lithuania 3,371 1,044 2,533 3,003 3,410 3,884 4,606Poland 35,985 42,852 55,207 57,416 59,170 67,263 68,010Czech Republic 16,024 11,318 17,595 19,472 19,529 20,456 20,612Romania 35,842 10,404 13,471 15,269 16,898 18,870 19,122Slovakia 14,428 6,953 7,321 7,499 7,584 9,048 8,534Slovenia 6,897 4,744 6,686 7,782 8,742 9,021 8,653TOTAL NEW EU MEMBER STATES (1) 101,881 91,918 138,751 151,965 156,368 172,960 177,027
2005 2010 2015 2016 2017 2018 2019Bulgaria - 18,857 29,131 32,035 38,394 42,205 43,785Croatia 78,212 41,432 42,624 52,465 59,304 69,190 72,081Estonia 22,584 11,701 24,995 27,420 30,452 31,367 32,072Hungary 219,461 52,813 94,890 118,100 136,465 159,654 184,316Latvia 18,355 7,014 16,239 18,681 19,035 19,325 21,016Lithuania 13,838 9,014 19,604 23,287 29,246 36,266 50,994Poland 271,507 376,342 407,585 475,449 546,763 598,598 621,952Czech Republic 167,723 180,898 248,452 279,165 291,124 281,893 270,527Romania 251,396 116,737 94,633 110,188 121,981 149,789 180,684Slovakia 71,553 70,986 85,300 95,664 103,689 107,243 110,102Slovenia 66,221 65,886 66,350 66,745 71,264 74,136 68,515TOTAL NEW EU MEMBER STATES (1) 851,242 910,248 1,129,803 1,299,199 1,447,717 1,569,666 1,656,044
2005 2010 2015 2016 2017 2018 2019Bulgaria (2) - 1,000 1,500 1,600 1,900 2,100 2,200Croatia 1,463 599 1,044 1,464 1,479 1,543 1,741Estonia 927 502 934 979 1,207 1,171 1,207Hungary 4,400 2,408 6,045 5,714 6,238 6,580 5,776Latvia 1,284 520 1,372 1,663 1,670 1,709 1,169Lithuania 2,297 1,355 3,633 6,055 7,205 8,694 7,688Poland 11,079 11,611 23,226 27,019 28,216 30,371 28,758Czech Republic 8,200 5,750 12,416 12,629 10,725 10,897 10,889Romania 5,019 2,686 6,485 8,260 6,360 7,693 7,740Slovakia 3,754 2,870 4,637 4,783 4,588 4,581 3,691Slovenia 1,635 985 2,025 2,537 2,521 2,833 2,456TOTAL NEW EU MEMBER STATES (1) 33,500 29,700 63,317 72,703 72,109 78,172 73,315
► NEW PASSENGER CAR REGISTRATIONS IN NEW EU MEMBER STATES (IN UNITS)
► NEW LIGHT COMMERCIAL VEHICLE (UP TO 5T) REGISTRATIONS IN THE NEW EU MEMBER STATES (IN UNITS)
► NEW LIGHT VEHICLE REGISTRATIONS (PASSENGER CARS AND LIGHT COMMERCIAL VEHICLES) IN THE NEW EU MEMBER STATES (IN UNITS)
► NEW HEAVY TRUCK, COACH AND BUS (OVER 5T) REGISTRATIONS IN THE NEW EU MEMBER STATES (IN UNITS)
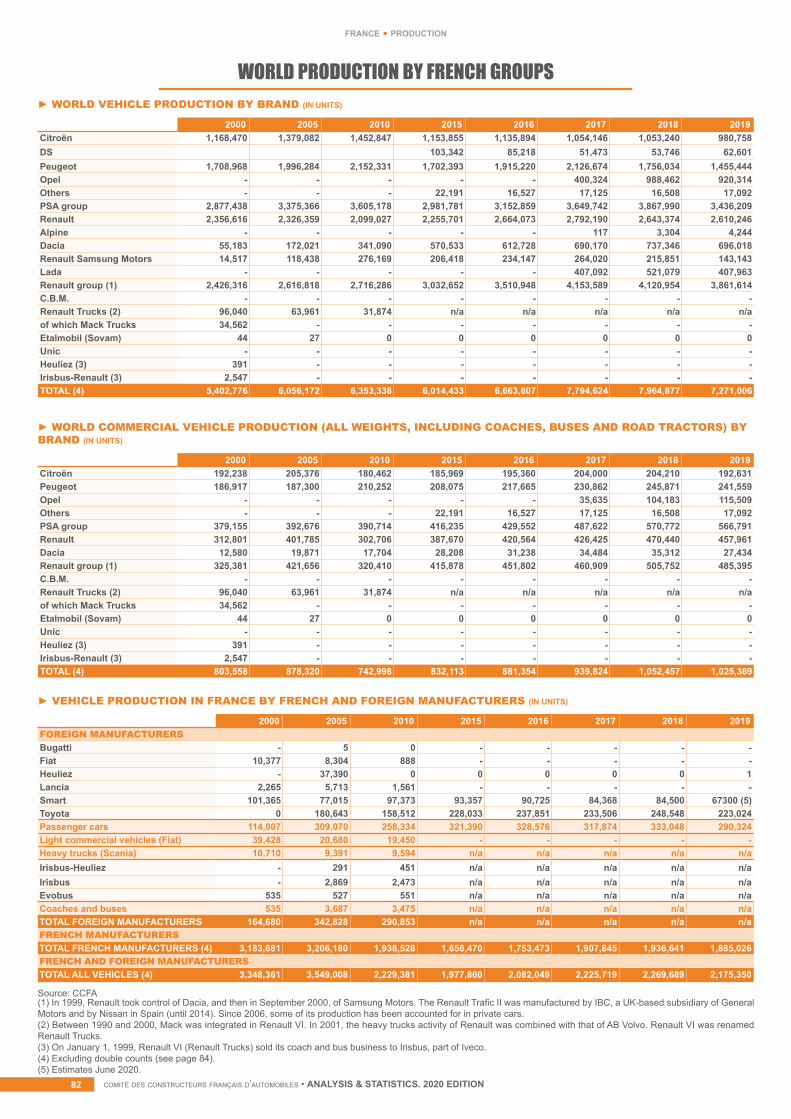
comité des constructeurs français d’automobiles • ANALYSIS & STATISTICS. 2020 EDITIONcomité des constructeurs français d’automobiles • ANALYSIS & STATISTICS. 2020 EDITION82
WORLD PRODUCTION BY FRENCH GROUPS
2000 2005 2010 2015 2016 2017 2018 2019Citroën 1,168,470 1,379,082 1,452,847 1,153,855 1,135,894 1,054,146 1,053,240 980,758DS 103,342 85,218 51,473 53,746 62,601Peugeot 1,708,968 1,996,284 2,152,331 1,702,393 1,915,220 2,126,674 1,756,034 1,455,444Opel - - - - - 400,324 988,462 920,314Others - - - 22,191 16,527 17,125 16,508 17,092PSA group 2,877,438 3,375,366 3,605,178 2,981,781 3,152,859 3,649,742 3,867,990 3,436,209Renault 2,356,616 2,326,359 2,099,027 2,255,701 2,664,073 2,792,190 2,643,374 2,610,246Alpine - - - - - 117 3,304 4,244Dacia 55,183 172,021 341,090 570,533 612,728 690,170 737,346 696,018Renault Samsung Motors 14,517 118,438 276,169 206,418 234,147 264,020 215,851 143,143Lada - - - - - 407,092 521,079 407,963Renault group (1) 2,426,316 2,616,818 2,716,286 3,032,652 3,510,948 4,153,589 4,120,954 3,861,614C.B.M. - - - - - - - -Renault Trucks (2) 96,040 63,961 31,874 n/a n/a n/a n/a n/aof which Mack Trucks 34,562 - - - - - - -Etalmobil (Sovam) 44 27 0 0 0 0 0 0Unic - - - - - - - -Heuliez (3) 391 - - - - - - -Irisbus-Renault (3) 2,547 - - - - - - -TOTAL (4) 5,402,776 6,056,172 6,353,338 6,014,433 6,663,807 7,794,624 7,964,877 7,271,006
2000 2005 2010 2015 2016 2017 2018 2019Citroën 192,238 205,376 180,462 185,969 195,360 204,000 204,210 192,631Peugeot 186,917 187,300 210,252 208,075 217,665 230,862 245,871 241,559Opel - - - - - 35,635 104,183 115,509Others - - - 22,191 16,527 17,125 16,508 17,092PSA group 379,155 392,676 390,714 416,235 429,552 487,622 570,772 566,791Renault 312,801 401,785 302,706 387,670 420,564 426,425 470,440 457,961Dacia 12,580 19,871 17,704 28,208 31,238 34,484 35,312 27,434Renault group (1) 325,381 421,656 320,410 415,878 451,802 460,909 505,752 485,395C.B.M. - - - - - - - -Renault Trucks (2) 96,040 63,961 31,874 n/a n/a n/a n/a n/aof which Mack Trucks 34,562 - - - - - - -Etalmobil (Sovam) 44 27 0 0 0 0 0 0Unic - - - - - - - -Heuliez (3) 391 - - - - - - -Irisbus-Renault (3) 2,547 - - - - - - -TOTAL (4) 803,558 878,320 742,998 832,113 881,354 939,824 1,052,457 1,025,369
2000 2005 2010 2015 2016 2017 2018 2019FOREIGN MANUFACTURERSBugatti - 5 0 - - - - -Fiat 10,377 8,304 888 - - - - -Heuliez - 37,390 0 0 0 0 0 1Lancia 2,265 5,713 1,561 - - - - -Smart 101,365 77,015 97,373 93,357 90,725 84,368 84,500 67300 (5)Toyota 0 180,643 158,512 228,033 237,851 233,506 248,548 223,024Passenger cars 114,007 309,070 258,334 321,390 328,576 317,874 333,048 290,324Light commercial vehicles (Fiat) 39,428 20,680 19,450 - - - - -Heavy trucks (Scania) 10,710 9,391 9,594 n/a n/a n/a n/a n/aIrisbus-Heuliez - 291 451 n/a n/a n/a n/a n/aIrisbus - 2,869 2,473 n/a n/a n/a n/a n/aEvobus 535 527 551 n/a n/a n/a n/a n/aCoaches and buses 535 3,687 3,475 n/a n/a n/a n/a n/aTOTAL FOREIGN MANUFACTURERS 164,680 342,828 290,853 n/a n/a n/a n/a n/aFRENCH MANUFACTURERSTOTAL FRENCH MANUFACTURERS (4) 3,183,681 3,206,180 1,938,528 1,656,470 1,753,473 1,907,845 1,936,641 1,885,026FRENCH AND FOREIGN MANUFACTURERSTOTAL ALL VEHICLES (4) 3,348,361 3,549,008 2,229,381 1,977,860 2,082,049 2,225,719 2,269,689 2,175,350
► WORLD VEHICLE PRODUCTION BY BRAND (IN UNITS)
► WORLD COMMERCIAL VEHICLE PRODUCTION (ALL WEIGHTS, INCLUDING COACHES, BUSES AND ROAD TRACTORS) BY BRAND (IN UNITS)
► VEHICLE PRODUCTION IN FRANCE BY FRENCH AND FOREIGN MANUFACTURERS (IN UNITS)
(1) In 1999, Renault took control of Dacia, and then in September 2000, of Samsung Motors. The Renault Trafic II was manufactured by IBC, a UK-based subsidiary of General Motors and by Nissan in Spain (until 2014). Since 2006, some of its production has been accounted for in private cars.(2) Between 1990 and 2000, Mack was integrated in Renault VI. In 2001, the heavy trucks activity of Renault was combined with that of AB Volvo. Renault VI was renamed Renault Trucks.(3) On January 1, 1999, Renault VI (Renault Trucks) sold its coach and bus business to Irisbus, part of Iveco.(4) Excluding double counts (see page 84).(5) Estimates June 2020.
Source: CCFA
france • production
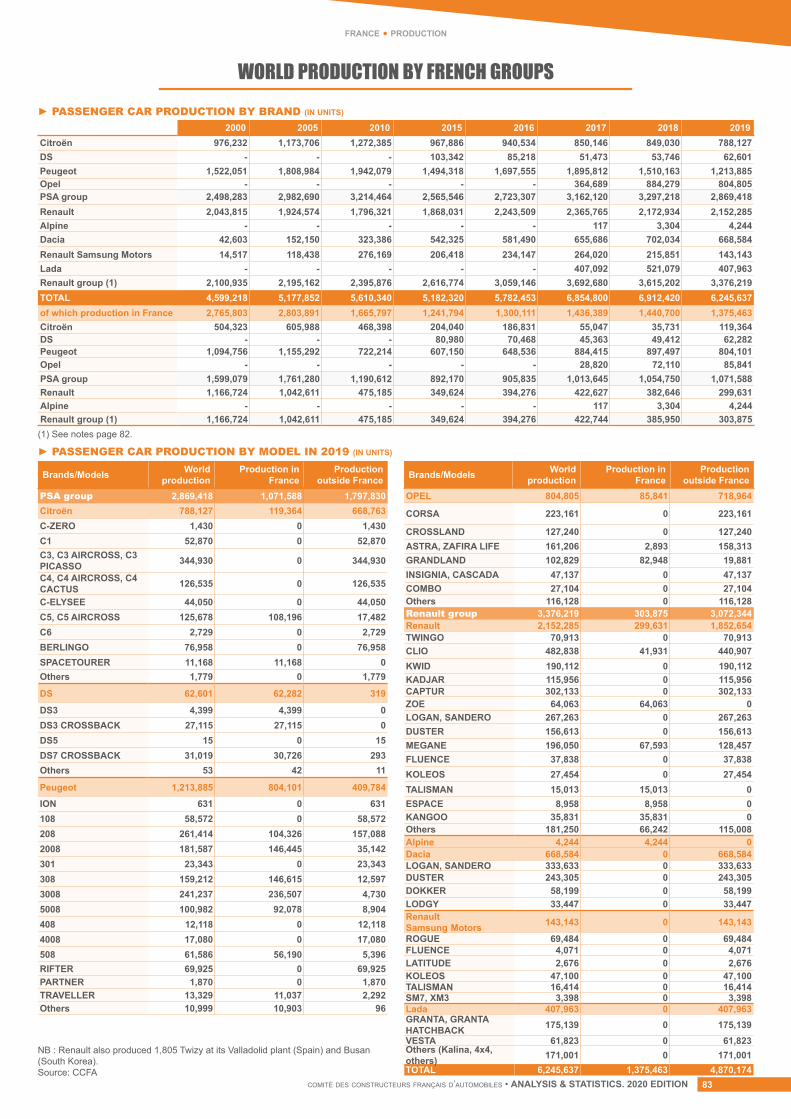
comité des constructeurs français d’automobiles • ANALYSIS & STATISTICS. 2020 EDITION 83
WORLD PRODUCTION BY FRENCH GROUPS
2000 2005 2010 2015 2016 2017 2018 2019Citroën 976,232 1,173,706 1,272,385 967,886 940,534 850,146 849,030 788,127DS - - - 103,342 85,218 51,473 53,746 62,601Peugeot 1,522,051 1,808,984 1,942,079 1,494,318 1,697,555 1,895,812 1,510,163 1,213,885Opel - - - - - 364,689 884,279 804,805PSA group 2,498,283 2,982,690 3,214,464 2,565,546 2,723,307 3,162,120 3,297,218 2,869,418Renault 2,043,815 1,924,574 1,796,321 1,868,031 2,243,509 2,365,765 2,172,934 2,152,285Alpine - - - - - 117 3,304 4,244Dacia 42,603 152,150 323,386 542,325 581,490 655,686 702,034 668,584Renault Samsung Motors 14,517 118,438 276,169 206,418 234,147 264,020 215,851 143,143Lada - - - - - 407,092 521,079 407,963Renault group (1) 2,100,935 2,195,162 2,395,876 2,616,774 3,059,146 3,692,680 3,615,202 3,376,219TOTAL 4,599,218 5,177,852 5,610,340 5,182,320 5,782,453 6,854,800 6,912,420 6,245,637of which production in France 2,765,803 2,803,891 1,665,797 1,241,794 1,300,111 1,436,389 1,440,700 1,375,463Citroën 504,323 605,988 468,398 204,040 186,831 55,047 35,731 119,364DS - - - 80,980 70,468 45,363 49,412 62,282Peugeot 1,094,756 1,155,292 722,214 607,150 648,536 884,415 897,497 804,101Opel - - - - - 28,820 72,110 85,841PSA group 1,599,079 1,761,280 1,190,612 892,170 905,835 1,013,645 1,054,750 1,071,588Renault 1,166,724 1,042,611 475,185 349,624 394,276 422,627 382,646 299,631Alpine - - - - - 117 3,304 4,244Renault group (1) 1,166,724 1,042,611 475,185 349,624 394,276 422,744 385,950 303,875
► PASSENGER CAR PRODUCTION BY BRAND (IN UNITS)
► PASSENGER CAR PRODUCTION BY MODEL IN 2019 (IN UNITS)
(1) See notes page 82.
NB : Renault also produced 1,805 Twizy at its Valladolid plant (Spain) and Busan(South Korea). Source: CCFA
Brands/Models World production
Production in France
Productionoutside France
PSA group 2,869,418 1,071,588 1,797,830Citroën 788,127 119,364 668,763C-ZERO 1,430 0 1,430C1 52,870 0 52,870C3, C3 AIRCROSS, C3 PICASSO 344,930 0 344,930
C4, C4 AIRCROSS, C4 CACTUS 126,535 0 126,535
C-ELYSEE 44,050 0 44,050C5, C5 AIRCROSS 125,678 108,196 17,482C6 2,729 0 2,729BERLINGO 76,958 0 76,958SPACETOURER 11,168 11,168 0Others 1,779 0 1,779
DS 62,601 62,282 319
DS3 4,399 4,399 0DS3 CROSSBACK 27,115 27,115 0DS5 15 0 15DS7 CROSSBACK 31,019 30,726 293Others 53 42 11
Peugeot 1,213,885 804,101 409,784
ION 631 0 631108 58,572 0 58,572208 261,414 104,326 157,0882008 181,587 146,445 35,142301 23,343 0 23,343308 159,212 146,615 12,5973008 241,237 236,507 4,7305008 100,982 92,078 8,904408 12,118 0 12,1184008 17,080 0 17,080508 61,586 56,190 5,396RIFTER 69,925 0 69,925PARTNER 1,870 0 1,870TRAVELLER 13,329 11,037 2,292Others 10,999 10,903 96
Brands/Models World production
Production in France
Productionoutside France
OPEL 804,805 85,841 718,964
CORSA 223,161 0 223,161
CROSSLAND 127,240 0 127,240 ASTRA, ZAFIRA LIFE 161,206 2,893 158,313 GRANDLAND 102,829 82,948 19,881 INSIGNIA, CASCADA 47,137 0 47,137 COMBO 27,104 0 27,104 Others 116,128 0 116,128 Renault group 3,376,219 303,875 3,072,344Renault 2,152,285 299,631 1,852,654TWINGO 70,913 0 70,913 CLIO 482,838 41,931 440,907 KWID 190,112 0 190,112 KADJAR 115,956 0 115,956 CAPTUR 302,133 0 302,133 ZOE 64,063 64,063 0 LOGAN, SANDERO 267,263 0 267,263 DUSTER 156,613 0 156,613 MEGANE 196,050 67,593 128,457 FLUENCE 37,838 0 37,838 KOLEOS 27,454 0 27,454 TALISMAN 15,013 15,013 0 ESPACE 8,958 8,958 0 KANGOO 35,831 35,831 0 Others 181,250 66,242 115,008 Alpine 4,244 4,244 0Dacia 668,584 0 668,584LOGAN, SANDERO 333,633 0 333,633DUSTER 243,305 0 243,305DOKKER 58,199 0 58,199LODGY 33,447 0 33,447RenaultSamsung Motors 143,143 0 143,143
ROGUE 69,484 0 69,484FLUENCE 4,071 0 4,071LATITUDE 2,676 0 2,676KOLEOS 47,100 0 47,100TALISMAN 16,414 0 16,414SM7, XM3 3,398 0 3,398Lada 407,963 0 407,963GRANTA, GRANTA HATCHBACK 175,139 0 175,139VESTA 61,823 0 61,823Others (Kalina, 4x4, others) 171,001 0 171,001TOTAL 6,245,637 1,375,463 4,870,174
france • production
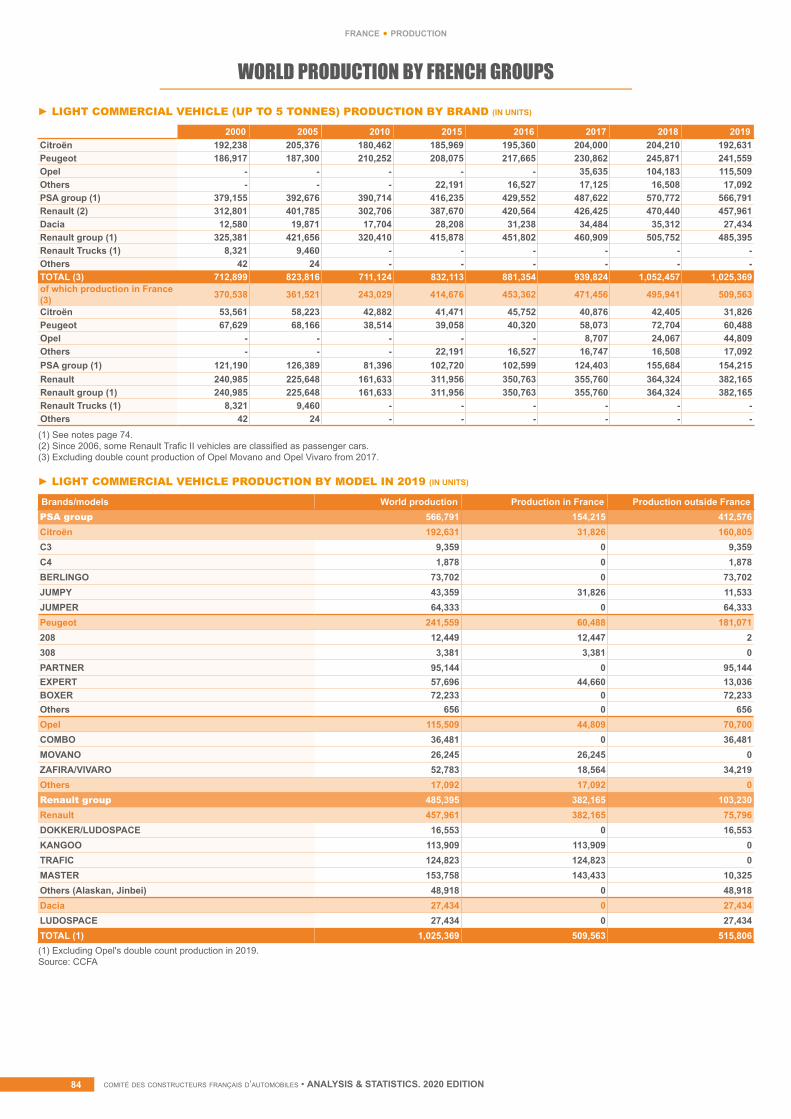
comité des constructeurs français d’automobiles • ANALYSIS & STATISTICS. 2020 EDITIONcomité des constructeurs français d’automobiles • ANALYSIS & STATISTICS. 2020 EDITION84
france • production
WORLD PRODUCTION BY FRENCH GROUPS► LIGHT COMMERCIAL VEHICLE (UP TO 5 TONNES) PRODUCTION BY BRAND (IN UNITS)
2000 2005 2010 2015 2016 2017 2018 2019Citroën 192,238 205,376 180,462 185,969 195,360 204,000 204,210 192,631Peugeot 186,917 187,300 210,252 208,075 217,665 230,862 245,871 241,559Opel - - - - - 35,635 104,183 115,509Others - - - 22,191 16,527 17,125 16,508 17,092PSA group (1) 379,155 392,676 390,714 416,235 429,552 487,622 570,772 566,791Renault (2) 312,801 401,785 302,706 387,670 420,564 426,425 470,440 457,961Dacia 12,580 19,871 17,704 28,208 31,238 34,484 35,312 27,434Renault group (1) 325,381 421,656 320,410 415,878 451,802 460,909 505,752 485,395Renault Trucks (1) 8,321 9,460 - - - - - -Others 42 24 - - - - - -TOTAL (3) 712,899 823,816 711,124 832,113 881,354 939,824 1,052,457 1,025,369of which production in France (3) 370,538 361,521 243,029 414,676 453,362 471,456 495,941 509,563
Citroën 53,561 58,223 42,882 41,471 45,752 40,876 42,405 31,826Peugeot 67,629 68,166 38,514 39,058 40,320 58,073 72,704 60,488Opel - - - - - 8,707 24,067 44,809Others - - - 22,191 16,527 16,747 16,508 17,092PSA group (1) 121,190 126,389 81,396 102,720 102,599 124,403 155,684 154,215Renault 240,985 225,648 161,633 311,956 350,763 355,760 364,324 382,165Renault group (1) 240,985 225,648 161,633 311,956 350,763 355,760 364,324 382,165Renault Trucks (1) 8,321 9,460 - - - - - -Others 42 24 - - - - - -
(1) Excluding Opel's double count production in 2019.Source: CCFA
(1) See notes page 74.(2) Since 2006, some Renault Trafic II vehicles are classified as passenger cars.(3) Excluding double count production of Opel Movano and Opel Vivaro from 2017.
Brands/models World production Production in France Production outside FrancePSA group 566,791 154,215 412,576Citroën 192,631 31,826 160,805C3 9,359 0 9,359C4 1,878 0 1,878BERLINGO 73,702 0 73,702JUMPY 43,359 31,826 11,533JUMPER 64,333 0 64,333Peugeot 241,559 60,488 181,071208 12,449 12,447 2308 3,381 3,381 0PARTNER 95,144 0 95,144EXPERT 57,696 44,660 13,036BOXER 72,233 0 72,233Others 656 0 656Opel 115,509 44,809 70,700COMBO 36,481 0 36,481MOVANO 26,245 26,245 0ZAFIRA/VIVARO 52,783 18,564 34,219Others 17,092 17,092 0Renault group 485,395 382,165 103,230Renault 457,961 382,165 75,796DOKKER/LUDOSPACE 16,553 0 16,553KANGOO 113,909 113,909 0TRAFIC 124,823 124,823 0MASTER 153,758 143,433 10,325Others (Alaskan, Jinbei) 48,918 0 48,918Dacia 27,434 0 27,434LUDOSPACE 27,434 0 27,434TOTAL (1) 1,025,369 509,563 515,806
► LIGHT COMMERCIAL VEHICLE PRODUCTION BY MODEL IN 2019 (IN UNITS)
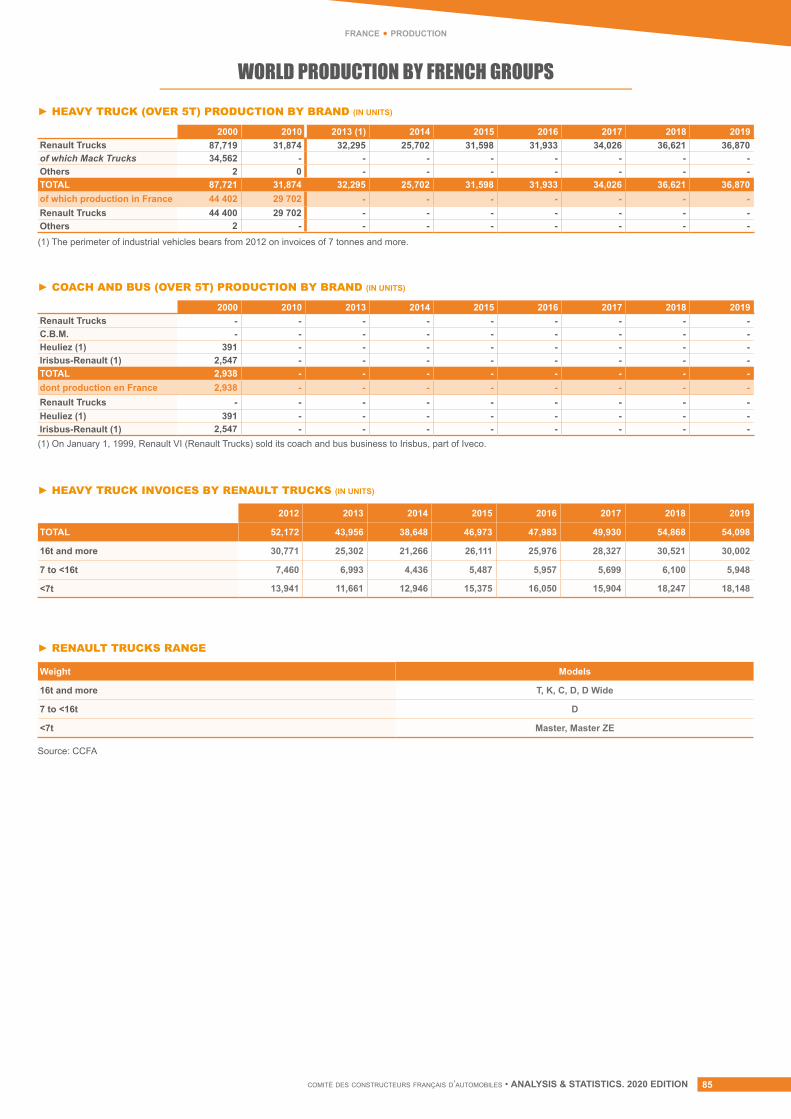
comité des constructeurs français d’automobiles • ANALYSIS & STATISTICS. 2020 EDITION 85
france • production
WORLD PRODUCTION BY FRENCH GROUPS► HEAVY TRUCK (OVER 5T) PRODUCTION BY BRAND (IN UNITS)
► COACH AND BUS (OVER 5T) PRODUCTION BY BRAND (IN UNITS)
► HEAVY TRUCK INVOICES BY RENAULT TRUCKS (IN UNITS)
► RENAULT TRUCKS RANGE
2000 2010 2013 (1) 2014 2015 2016 2017 2018 2019Renault Trucks 87,719 31,874 32,295 25,702 31,598 31,933 34,026 36,621 36,870of which Mack Trucks 34,562 - - - - - - - -Others 2 0 - - - - - - -TOTAL 87,721 31,874 32,295 25,702 31,598 31,933 34,026 36,621 36,870of which production in France 44 402 29 702 - - - - - - -Renault Trucks 44 400 29 702 - - - - - - -Others 2 - - - - - - - -
2000 2010 2013 2014 2015 2016 2017 2018 2019Renault Trucks - - - - - - - - -C.B.M. - - - - - - - - -Heuliez (1) 391 - - - - - - - -Irisbus-Renault (1) 2,547 - - - - - - - -TOTAL 2,938 - - - - - - - -dont production en France 2,938 - - - - - - - -Renault Trucks - - - - - - - - -Heuliez (1) 391 - - - - - - - -Irisbus-Renault (1) 2,547 - - - - - - - -
2012 2013 2014 2015 2016 2017 2018 2019
TOTAL 52,172 43,956 38,648 46,973 47,983 49,930 54,868 54,098
16t and more 30,771 25,302 21,266 26,111 25,976 28,327 30,521 30,002
7 to <16t 7,460 6,993 4,436 5,487 5,957 5,699 6,100 5,948
<7t 13,941 11,661 12,946 15,375 16,050 15,904 18,247 18,148
Weight Models
16t and more T, K, C, D, D Wide
7 to <16t D
<7t Master, Master ZE
(1) On January 1, 1999, Renault VI (Renault Trucks) sold its coach and bus business to Irisbus, part of Iveco.
(1) The perimeter of industrial vehicles bears from 2012 on invoices of 7 tonnes and more.
Source: CCFA
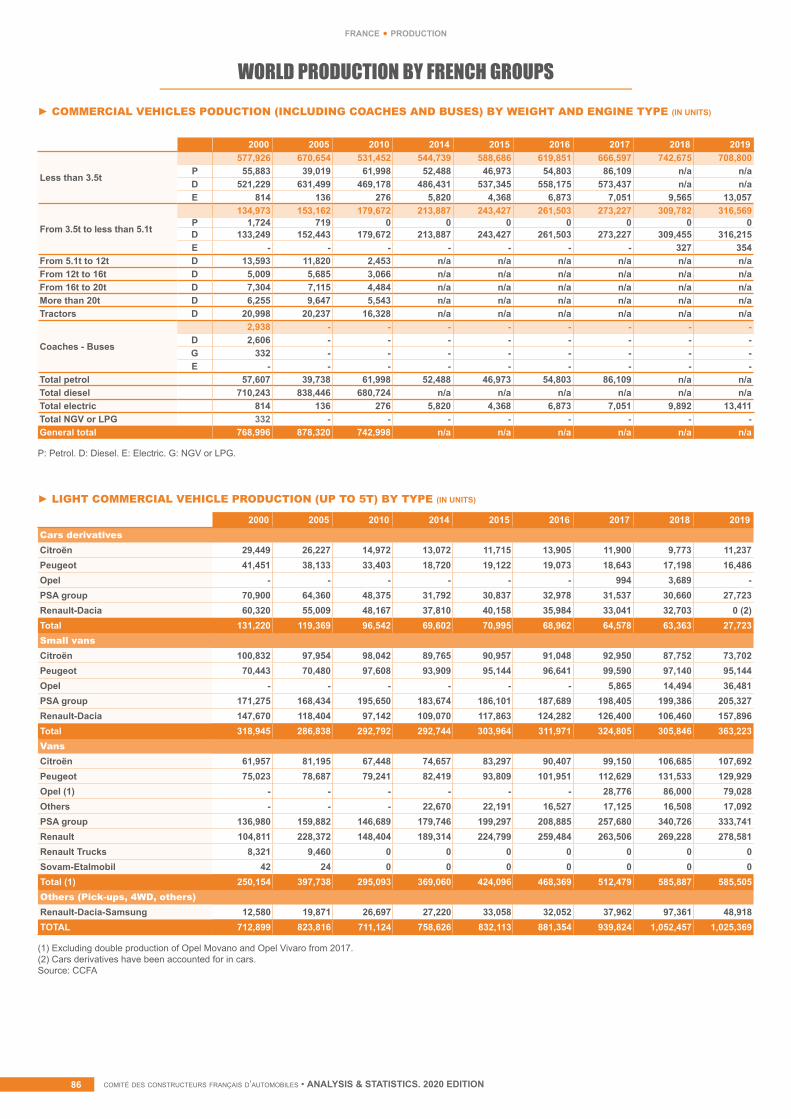
comité des constructeurs français d’automobiles • ANALYSIS & STATISTICS. 2020 EDITIONcomité des constructeurs français d’automobiles • ANALYSIS & STATISTICS. 2020 EDITION86
france • production
WORLD PRODUCTION BY FRENCH GROUPS► COMMERCIAL VEHICLES PODUCTION (INCLUDING COACHES AND BUSES) BY WEIGHT AND ENGINE TYPE (IN UNITS)
► LIGHT COMMERCIAL VEHICLE PRODUCTION (UP TO 5T) BY TYPE (IN UNITS)
P: Petrol. D: Diesel. E: Electric. G: NGV or LPG.
(1) Excluding double production of Opel Movano and Opel Vivaro from 2017.(2) Cars derivatives have been accounted for in cars. Source: CCFA
2000 2005 2010 2014 2015 2016 2017 2018 2019Cars derivativesCitroën 29,449 26,227 14,972 13,072 11,715 13,905 11,900 9,773 11,237Peugeot 41,451 38,133 33,403 18,720 19,122 19,073 18,643 17,198 16,486Opel - - - - - - 994 3,689 -PSA group 70,900 64,360 48,375 31,792 30,837 32,978 31,537 30,660 27,723Renault-Dacia 60,320 55,009 48,167 37,810 40,158 35,984 33,041 32,703 0 (2)Total 131,220 119,369 96,542 69,602 70,995 68,962 64,578 63,363 27,723Small vansCitroën 100,832 97,954 98,042 89,765 90,957 91,048 92,950 87,752 73,702Peugeot 70,443 70,480 97,608 93,909 95,144 96,641 99,590 97,140 95,144Opel - - - - - - 5,865 14,494 36,481PSA group 171,275 168,434 195,650 183,674 186,101 187,689 198,405 199,386 205,327Renault-Dacia 147,670 118,404 97,142 109,070 117,863 124,282 126,400 106,460 157,896Total 318,945 286,838 292,792 292,744 303,964 311,971 324,805 305,846 363,223VansCitroën 61,957 81,195 67,448 74,657 83,297 90,407 99,150 106,685 107,692Peugeot 75,023 78,687 79,241 82,419 93,809 101,951 112,629 131,533 129,929Opel (1) - - - - - - 28,776 86,000 79,028Others - - - 22,670 22,191 16,527 17,125 16,508 17,092PSA group 136,980 159,882 146,689 179,746 199,297 208,885 257,680 340,726 333,741Renault 104,811 228,372 148,404 189,314 224,799 259,484 263,506 269,228 278,581Renault Trucks 8,321 9,460 0 0 0 0 0 0 0Sovam-Etalmobil 42 24 0 0 0 0 0 0 0Total (1) 250,154 397,738 295,093 369,060 424,096 468,369 512,479 585,887 585,505Others (Pick-ups, 4WD, others)Renault-Dacia-Samsung 12,580 19,871 26,697 27,220 33,058 32,052 37,962 97,361 48,918TOTAL 712,899 823,816 711,124 758,626 832,113 881,354 939,824 1,052,457 1,025,369
2000 2005 2010 2014 2015 2016 2017 2018 2019
Less than 3.5t
577,926 670,654 531,452 544,739 588,686 619,851 666,597 742,675 708,800P 55,883 39,019 61,998 52,488 46,973 54,803 86,109 n/a n/aD 521,229 631,499 469,178 486,431 537,345 558,175 573,437 n/a n/aE 814 136 276 5,820 4,368 6,873 7,051 9,565 13,057
From 3.5t to less than 5.1t
134,973 153,162 179,672 213,887 243,427 261,503 273,227 309,782 316,569P 1,724 719 0 0 0 0 0 0 0D 133,249 152,443 179,672 213,887 243,427 261,503 273,227 309,455 316,215E - - - - - - - 327 354
From 5.1t to 12t D 13,593 11,820 2,453 n/a n/a n/a n/a n/a n/aFrom 12t to 16t D 5,009 5,685 3,066 n/a n/a n/a n/a n/a n/aFrom 16t to 20t D 7,304 7,115 4,484 n/a n/a n/a n/a n/a n/aMore than 20t D 6,255 9,647 5,543 n/a n/a n/a n/a n/a n/aTractors D 20,998 20,237 16,328 n/a n/a n/a n/a n/a n/a
Coaches - Buses
2,938 - - - - - - - -D 2,606 - - - - - - - -G 332 - - - - - - - -E - - - - - - - - -
Total petrol 57,607 39,738 61,998 52,488 46,973 54,803 86,109 n/a n/aTotal diesel 710,243 838,446 680,724 n/a n/a n/a n/a n/a n/aTotal electric 814 136 276 5,820 4,368 6,873 7,051 9,892 13,411Total NGV or LPG 332 - - - - - - - -General total 768,996 878,320 742,998 n/a n/a n/a n/a n/a n/a
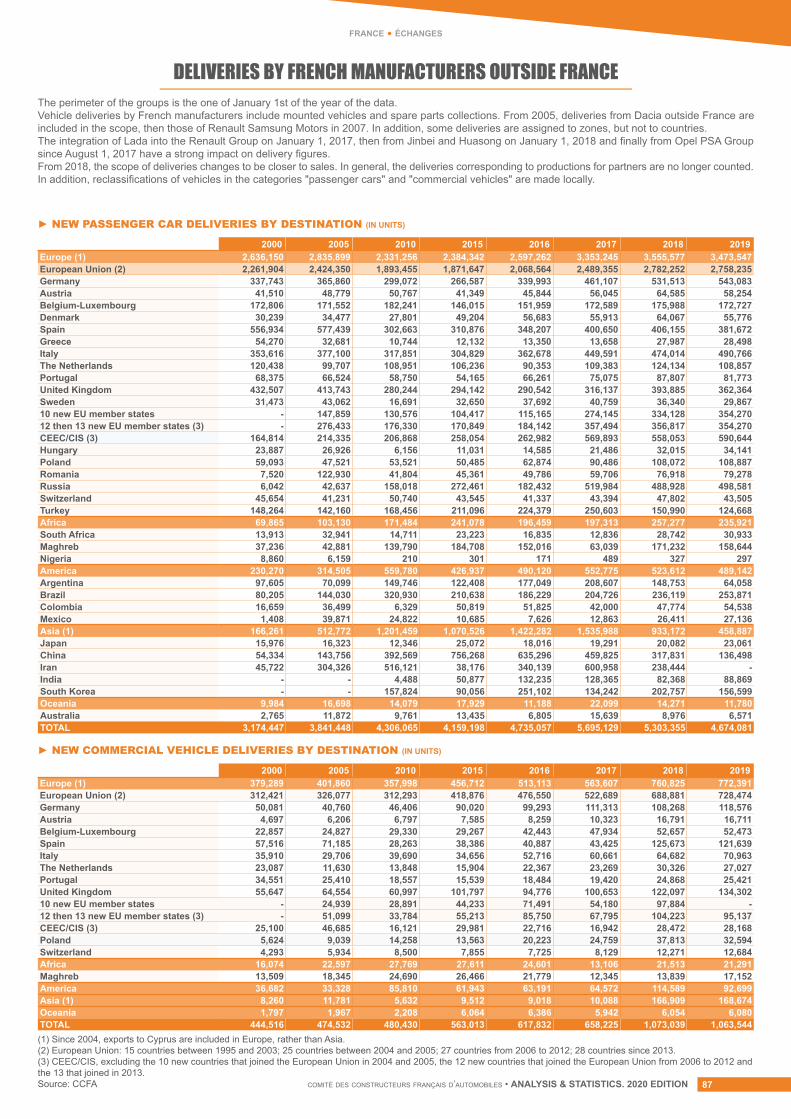
comité des constructeurs français d’automobiles • ANALYSIS & STATISTICS. 2020 EDITION 87
(1) Since 2004, exports to Cyprus are included in Europe, rather than Asia.(2) European Union: 15 countries between 1995 and 2003; 25 countries between 2004 and 2005; 27 countries from 2006 to 2012; 28 countries since 2013.(3) CEEC/CIS, excluding the 10 new countries that joined the European Union in 2004 and 2005, the 12 new countries that joined the European Union from 2006 to 2012 and the 13 that joined in 2013.Source: CCFA
france • échanges
DELIVERIES BY FRENCH MANUFACTURERS OUTSIDE FRANCE
2000 2005 2010 2015 2016 2017 2018 2019Europe (1) 2,636,150 2,835,899 2,331,256 2,384,342 2,597,262 3,353,245 3,555,577 3,473,547European Union (2) 2,261,904 2,424,350 1,893,455 1,871,647 2,068,564 2,489,355 2,782,252 2,758,235Germany 337,743 365,860 299,072 266,587 339,993 461,107 531,513 543,083Austria 41,510 48,779 50,767 41,349 45,844 56,045 64,585 58,254Belgium-Luxembourg 172,806 171,552 182,241 146,015 151,959 172,589 175,988 172,727Denmark 30,239 34,477 27,801 49,204 56,683 55,913 64,067 55,776Spain 556,934 577,439 302,663 310,876 348,207 400,650 406,155 381,672Greece 54,270 32,681 10,744 12,132 13,350 13,658 27,987 28,498Italy 353,616 377,100 317,851 304,829 362,678 449,591 474,014 490,766The Netherlands 120,438 99,707 108,951 106,236 90,353 109,383 124,134 108,857Portugal 68,375 66,524 58,750 54,165 66,261 75,075 87,807 81,773United Kingdom 432,507 413,743 280,244 294,142 290,542 316,137 393,885 362,364Sweden 31,473 43,062 16,691 32,650 37,692 40,759 36,340 29,86710 new EU member states - 147,859 130,576 104,417 115,165 274,145 334,128 354,27012 then 13 new EU member states (3) - 276,433 176,330 170,849 184,142 357,494 356,817 354,270CEEC/CIS (3) 164,814 214,335 206,868 258,054 262,982 569,893 558,053 590,644Hungary 23,887 26,926 6,156 11,031 14,585 21,486 32,015 34,141Poland 59,093 47,521 53,521 50,485 62,874 90,486 108,072 108,887Romania 7,520 122,930 41,804 45,361 49,786 59,706 76,918 79,278Russia 6,042 42,637 158,018 272,461 182,432 519,984 488,928 498,581Switzerland 45,654 41,231 50,740 43,545 41,337 43,394 47,802 43,505Turkey 148,264 142,160 168,456 211,096 224,379 250,603 150,990 124,668Africa 69,865 103,130 171,484 241,078 196,459 197,313 257,277 235,921South Africa 13,913 32,941 14,711 23,223 16,835 12,836 28,742 30,933Maghreb 37,236 42,881 139,790 184,708 152,016 63,039 171,232 158,644Nigeria 8,860 6,159 210 301 171 489 327 297America 230,270 314,505 559,780 426,937 490,120 552,775 523,612 489,142Argentina 97,605 70,099 149,746 122,408 177,049 208,607 148,753 64,058Brazil 80,205 144,030 320,930 210,638 186,229 204,726 236,119 253,871Colombia 16,659 36,499 6,329 50,819 51,825 42,000 47,774 54,538Mexico 1,408 39,871 24,822 10,685 7,626 12,863 26,411 27,136Asia (1) 166,261 512,772 1,201,459 1,070,526 1,422,282 1,535,988 933,172 458,887Japan 15,976 16,323 12,346 25,072 18,016 19,291 20,082 23,061China 54,334 143,756 392,569 756,268 635,296 459,825 317,831 136,498Iran 45,722 304,326 516,121 38,176 340,139 600,958 238,444 -India - - 4,488 50,877 132,235 128,365 82,368 88,869South Korea - - 157,824 90,056 251,102 134,242 202,757 156,599Oceania 9,984 16,698 14,079 17,929 11,188 22,099 14,271 11,780Australia 2,765 11,872 9,761 13,435 6,805 15,639 8,976 6,571TOTAL 3,174,447 3,841,448 4,306,065 4,159,198 4,735,057 5,695,129 5,303,355 4,674,081
2000 2005 2010 2015 2016 2017 2018 2019Europe (1) 379,289 401,860 357,998 456,712 513,113 563,607 760,825 772,391European Union (2) 312,421 326,077 312,293 418,876 476,550 522,689 688,881 728,474Germany 50,081 40,760 46,406 90,020 99,293 111,313 108,268 118,576Austria 4,697 6,206 6,797 7,585 8,259 10,323 16,791 16,711Belgium-Luxembourg 22,857 24,827 29,330 29,267 42,443 47,934 52,657 52,473Spain 57,516 71,185 28,263 38,386 40,887 43,425 125,673 121,639Italy 35,910 29,706 39,690 34,656 52,716 60,661 64,682 70,963The Netherlands 23,087 11,630 13,848 15,904 22,367 23,269 30,326 27,027Portugal 34,551 25,410 18,557 15,539 18,484 19,420 24,868 25,421United Kingdom 55,647 64,554 60,997 101,797 94,776 100,653 122,097 134,30210 new EU member states - 24,939 28,891 44,233 71,491 54,180 97,884 -12 then 13 new EU member states (3) - 51,099 33,784 55,213 85,750 67,795 104,223 95,137CEEC/CIS (3) 25,100 46,685 16,121 29,981 22,716 16,942 28,472 28,168Poland 5,624 9,039 14,258 13,563 20,223 24,759 37,813 32,594Switzerland 4,293 5,934 8,500 7,855 7,725 8,129 12,271 12,684Africa 16,074 22,597 27,769 27,611 24,601 13,106 21,513 21,291Maghreb 13,509 18,345 24,690 26,466 21,779 12,345 13,839 17,152America 36,682 33,328 85,810 61,943 63,191 64,572 114,589 92,699Asia (1) 8,260 11,781 5,632 9,512 9,018 10,088 166,909 168,674Oceania 1,797 1,967 2,208 6,064 6,386 5,942 6,054 6,080TOTAL 444,516 474,532 480,430 563,013 617,832 658,225 1,073,039 1,063,544
► NEW PASSENGER CAR DELIVERIES BY DESTINATION (IN UNITS)
► NEW COMMERCIAL VEHICLE DELIVERIES BY DESTINATION (IN UNITS)
The perimeter of the groups is the one of January 1st of the year of the data.Vehicle deliveries by French manufacturers include mounted vehicles and spare parts collections. From 2005, deliveries from Dacia outside France are included in the scope, then those of Renault Samsung Motors in 2007. In addition, some deliveries are assigned to zones, but not to countries.The integration of Lada into the Renault Group on January 1, 2017, then from Jinbei and Huasong on January 1, 2018 and finally from Opel PSA Group since August 1, 2017 have a strong impact on delivery figures.From 2018, the scope of deliveries changes to be closer to sales. In general, the deliveries corresponding to productions for partners are no longer counted. In addition, reclassifications of vehicles in the categories "passenger cars" and "commercial vehicles" are made locally.
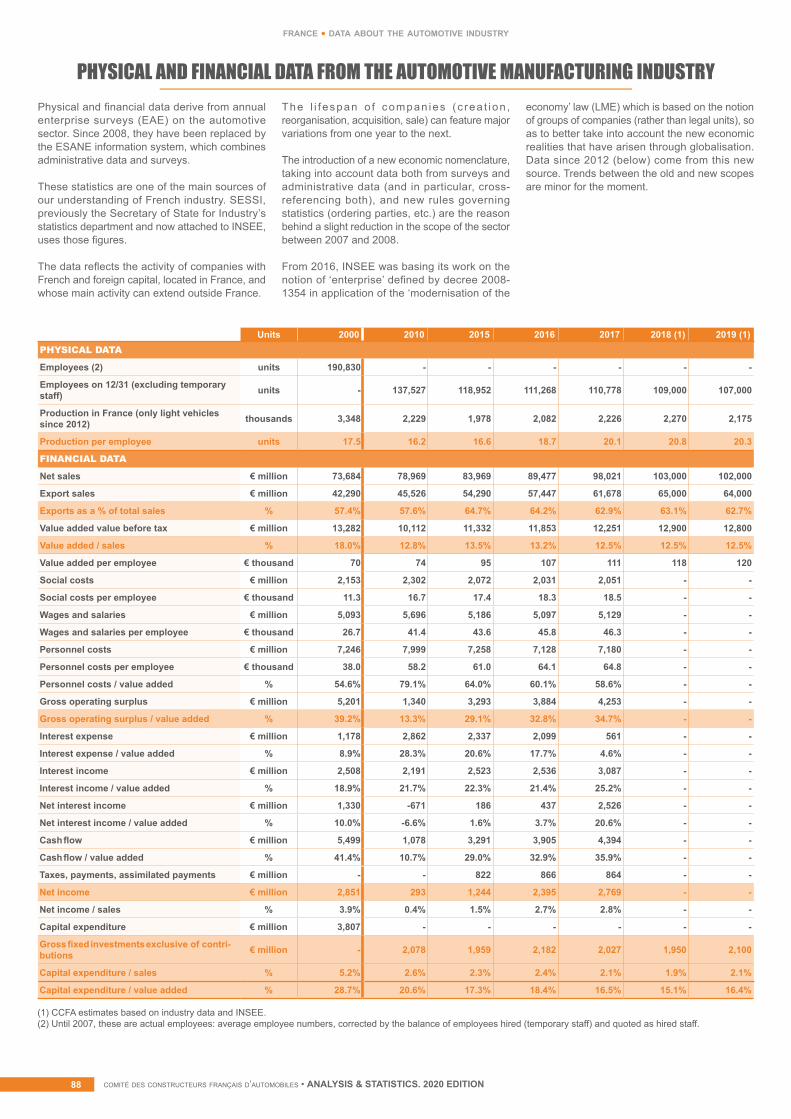
comité des constructeurs français d’automobiles • ANALYSIS & STATISTICS. 2020 EDITIONcomité des constructeurs français d’automobiles • ANALYSIS & STATISTICS. 2020 EDITION88
france • data about the automotive industry
PHYSICAL AND FINANCIAL DATA FROM THE AUTOMOTIVE MANUFACTURING INDUSTRYPhysical and financial data derive from annual enterprise surveys (EAE) on the automotive sector. Since 2008, they have been replaced by the ESANE information system, which combines administrative data and surveys.
These statistics are one of the main sources of our understanding of French industry. SESSI, previously the Secretary of State for Industry’s statistics department and now attached to INSEE, uses those figures.
The data reflects the activity of companies with French and foreign capital, located in France, and whose main activity can extend outside France.
The l i f espan o f compan ies (c rea t ion , reorganisation, acquisition, sale) can feature major variations from one year to the next.
The introduction of a new economic nomenclature, taking into account data both from surveys and administrative data (and in particular, cross-referencing both), and new rules governing statistics (ordering parties, etc.) are the reason behind a slight reduction in the scope of the sector between 2007 and 2008.
From 2016, INSEE was basing its work on the notion of ‘enterprise’ defined by decree 2008-1354 in application of the ‘modernisation of the
economy’ law (LME) which is based on the notion of groups of companies (rather than legal units), so as to better take into account the new economic realities that have arisen through globalisation. Data since 2012 (below) come from this new source. Trends between the old and new scopes are minor for the moment.
Units 2000 2010 2015 2016 2017 2018 (1) 2019 (1)PHYSICAL DATA
Employees (2) units 190,830 - - - - - -
Employees on 12/31 (excluding temporary staff) units - 137,527 118,952 111,268 110,778 109,000 107,000
Production in France (only light vehicles since 2012) thousands 3,348 2,229 1,978 2,082 2,226 2,270 2,175
Production per employee units 17.5 16.2 16.6 18.7 20.1 20.8 20.3
FINANCIAL DATA
Net sales € million 73,684 78,969 83,969 89,477 98,021 103,000 102,000
Export sales € million 42,290 45,526 54,290 57,447 61,678 65,000 64,000
Exports as a % of total sales % 57.4% 57.6% 64.7% 64.2% 62.9% 63.1% 62.7%
Value added value before tax € million 13,282 10,112 11,332 11,853 12,251 12,900 12,800
Value added / sales % 18.0% 12.8% 13.5% 13.2% 12.5% 12.5% 12.5%
Value added per employee € thousand 70 74 95 107 111 118 120
Social costs € million 2,153 2,302 2,072 2,031 2,051 - -
Social costs per employee € thousand 11.3 16.7 17.4 18.3 18.5 - -
Wages and salaries € million 5,093 5,696 5,186 5,097 5,129 - -
Wages and salaries per employee € thousand 26.7 41.4 43.6 45.8 46.3 - -
Personnel costs € million 7,246 7,999 7,258 7,128 7,180 - -
Personnel costs per employee € thousand 38.0 58.2 61.0 64.1 64.8 - -
Personnel costs / value added % 54.6% 79.1% 64.0% 60.1% 58.6% - -
Gross operating surplus € million 5,201 1,340 3,293 3,884 4,253 - -
Gross operating surplus / value added % 39.2% 13.3% 29.1% 32.8% 34.7% - -
Interest expense € million 1,178 2,862 2,337 2,099 561 - -
Interest expense / value added % 8.9% 28.3% 20.6% 17.7% 4.6% - -
Interest income € million 2,508 2,191 2,523 2,536 3,087 - -
Interest income / value added % 18.9% 21.7% 22.3% 21.4% 25.2% - -
Net interest income € million 1,330 -671 186 437 2,526 - -
Net interest income / value added % 10.0% -6.6% 1.6% 3.7% 20.6% - -
Cash flow € million 5,499 1,078 3,291 3,905 4,394 - -
Cash flow / value added % 41.4% 10.7% 29.0% 32.9% 35.9% - -
Taxes, payments, assimilated payments € million - - 822 866 864 - -
Net income € million 2,851 293 1,244 2,395 2,769 - -
Net income / sales % 3.9% 0.4% 1.5% 2.7% 2.8% - -
Capital expenditure € million 3,807 - - - - - -
Gross fixed investments exclusive of contri-butions € million - 2,078 1,959 2,182 2,027 1,950 2,100
Capital expenditure / sales % 5.2% 2.6% 2.3% 2.4% 2.1% 1.9% 2.1%
Capital expenditure / value added % 28.7% 20.6% 17.3% 18.4% 16.5% 15.1% 16.4%
(1) CCFA estimates based on industry data and INSEE.(2) Until 2007, these are actual employees: average employee numbers, corrected by the balance of employees hired (temporary staff) and quoted as hired staff.
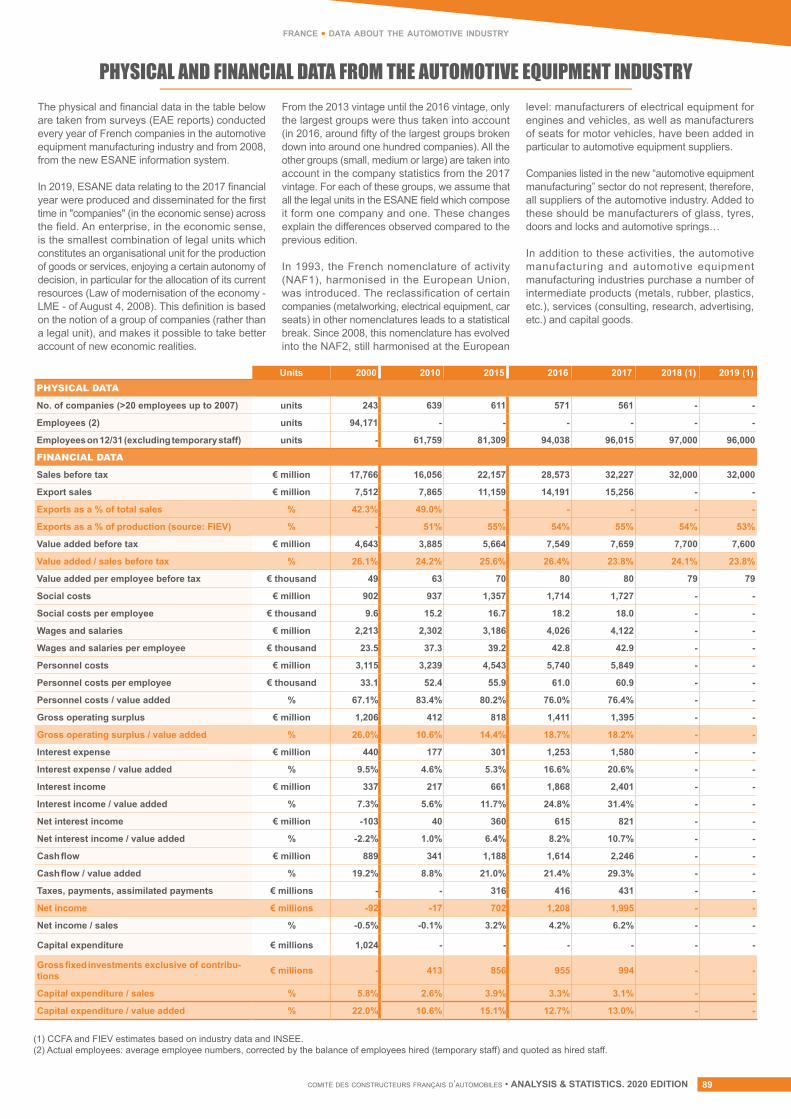
comité des constructeurs français d’automobiles • ANALYSIS & STATISTICS. 2020 EDITION 89
france • data about the automotive industry
PHYSICAL AND FINANCIAL DATA FROM THE AUTOMOTIVE EQUIPMENT INDUSTRYThe physical and financial data in the table below are taken from surveys (EAE reports) conducted every year of French companies in the automotive equipment manufacturing industry and from 2008, from the new ESANE information system.
In 2019, ESANE data relating to the 2017 financial year were produced and disseminated for the first time in "companies" (in the economic sense) across the field. An enterprise, in the economic sense, is the smallest combination of legal units which constitutes an organisational unit for the production of goods or services, enjoying a certain autonomy of decision, in particular for the allocation of its current resources (Law of modernisation of the economy - LME - of August 4, 2008). This definition is based on the notion of a group of companies (rather than a legal unit), and makes it possible to take better account of new economic realities.
From the 2013 vintage until the 2016 vintage, only the largest groups were thus taken into account (in 2016, around fifty of the largest groups broken down into around one hundred companies). All the other groups (small, medium or large) are taken into account in the company statistics from the 2017 vintage. For each of these groups, we assume that all the legal units in the ESANE field which compose it form one company and one. These changes explain the differences observed compared to the previous edition.
In 1993, the French nomenclature of activity (NAF1), harmonised in the European Union, was introduced. The reclassification of certain companies (metalworking, electrical equipment, car seats) in other nomenclatures leads to a statistical break. Since 2008, this nomenclature has evolved into the NAF2, still harmonised at the European
level: manufacturers of electrical equipment for engines and vehicles, as well as manufacturers of seats for motor vehicles, have been added in particular to automotive equipment suppliers.
Companies listed in the new “automotive equipment manufacturing” sector do not represent, therefore, all suppliers of the automotive industry. Added to these should be manufacturers of glass, tyres, doors and locks and automotive springs…
In addition to these activities, the automotive manufacturing and automotive equipment manufacturing industries purchase a number of intermediate products (metals, rubber, plastics, etc.), services (consulting, research, advertising, etc.) and capital goods.
Units 2000 2010 2015 2016 2017 2018 (1) 2019 (1)PHYSICAL DATA
No. of companies (>20 employees up to 2007) units 243 639 611 571 561 - -
Employees (2) units 94,171 - - - - - -
Employees on 12/31 (excluding temporary staff) units - 61,759 81,309 94,038 96,015 97,000 96,000
FINANCIAL DATA
Sales before tax € million 17,766 16,056 22,157 28,573 32,227 32,000 32,000
Export sales € million 7,512 7,865 11,159 14,191 15,256 - -
Exports as a % of total sales % 42.3% 49.0% - - - - -
Exports as a % of production (source: FIEV) % - 51% 55% 54% 55% 54% 53%
Value added before tax € million 4,643 3,885 5,664 7,549 7,659 7,700 7,600
Value added / sales before tax % 26.1% 24.2% 25.6% 26.4% 23.8% 24.1% 23.8%
Value added per employee before tax € thousand 49 63 70 80 80 79 79
Social costs € million 902 937 1,357 1,714 1,727 - -
Social costs per employee € thousand 9.6 15.2 16.7 18.2 18.0 - -
Wages and salaries € million 2,213 2,302 3,186 4,026 4,122 - -
Wages and salaries per employee € thousand 23.5 37.3 39.2 42.8 42.9 - -
Personnel costs € million 3,115 3,239 4,543 5,740 5,849 - -
Personnel costs per employee € thousand 33.1 52.4 55.9 61.0 60.9 - -
Personnel costs / value added % 67.1% 83.4% 80.2% 76.0% 76.4% - -
Gross operating surplus € million 1,206 412 818 1,411 1,395 - -
Gross operating surplus / value added % 26.0% 10.6% 14.4% 18.7% 18.2% - -
Interest expense € million 440 177 301 1,253 1,580 - -
Interest expense / value added % 9.5% 4.6% 5.3% 16.6% 20.6% - -
Interest income € million 337 217 661 1,868 2,401 - -
Interest income / value added % 7.3% 5.6% 11.7% 24.8% 31.4% - -
Net interest income € million -103 40 360 615 821 - -
Net interest income / value added % -2.2% 1.0% 6.4% 8.2% 10.7% - -
Cash flow € million 889 341 1,188 1,614 2,246 - -
Cash flow / value added % 19.2% 8.8% 21.0% 21.4% 29.3% - -
Taxes, payments, assimilated payments € millions - - 316 416 431 - -
Net income € millions -92 -17 702 1,208 1,995 - -
Net income / sales % -0.5% -0.1% 3.2% 4.2% 6.2% - -
Capital expenditure € millions 1,024 - - - - - -
Gross fixed investments exclusive of contribu-tions € millions - 413 856 955 994 - -
Capital expenditure / sales % 5.8% 2.6% 3.9% 3.3% 3.1% - -
Capital expenditure / value added % 22.0% 10.6% 15.1% 12.7% 13.0% - -
(1) CCFA and FIEV estimates based on industry data and INSEE.(2) Actual employees: average employee numbers, corrected by the balance of employees hired (temporary staff) and quoted as hired staff.
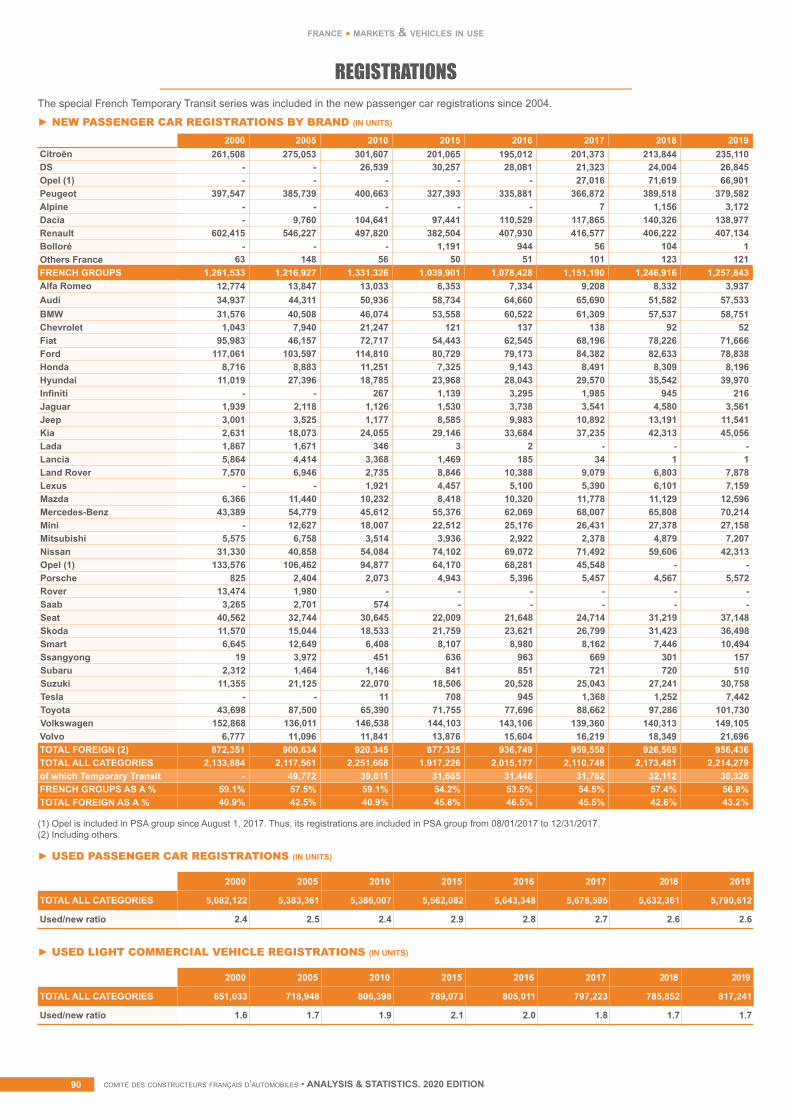
comité des constructeurs français d’automobiles • ANALYSIS & STATISTICS. 2020 EDITIONcomité des constructeurs français d’automobiles • ANALYSIS & STATISTICS. 2020 EDITION90
france • markets & vehicles in use
REGISTRATIONS
2000 2005 2010 2015 2016 2017 2018 2019Citroën 261,508 275,053 301,607 201,065 195,012 201,373 213,844 235,110DS - - 26,539 30,257 28,081 21,323 24,004 26,845Opel (1) - - - - - 27,016 71,619 66,901Peugeot 397,547 385,739 400,663 327,393 335,881 366,872 389,518 379,582Alpine - - - - - 7 1,156 3,172Dacia - 9,760 104,641 97,441 110,529 117,865 140,326 138,977Renault 602,415 546,227 497,820 382,504 407,930 416,577 406,222 407,134Bolloré - - - 1,191 944 56 104 1Others France 63 148 56 50 51 101 123 121FRENCH GROUPS 1,261,533 1,216,927 1,331,326 1,039,901 1,078,428 1,151,190 1,246,916 1,257,843Alfa Romeo 12,774 13,847 13,033 6,353 7,334 9,208 8,332 3,937Audi 34,937 44,311 50,936 58,734 64,660 65,690 51,582 57,533BMW 31,576 40,508 46,074 53,558 60,522 61,309 57,537 58,751Chevrolet 1,043 7,940 21,247 121 137 138 92 52Fiat 95,983 46,157 72,717 54,443 62,545 68,196 78,226 71,666Ford 117,061 103,597 114,810 80,729 79,173 84,382 82,633 78,838Honda 8,716 8,883 11,251 7,325 9,143 8,491 8,309 8,196Hyundai 11,019 27,396 18,785 23,968 28,043 29,570 35,542 39,970Infiniti - - 267 1,139 3,295 1,985 945 216Jaguar 1,939 2,118 1,126 1,530 3,738 3,541 4,580 3,561Jeep 3,001 3,525 1,177 8,585 9,983 10,892 13,191 11,541Kia 2,631 18,073 24,055 29,146 33,684 37,235 42,313 45,056Lada 1,867 1,671 346 3 2 - - -Lancia 5,864 4,414 3,368 1,469 185 34 1 1Land Rover 7,570 6,946 2,735 8,846 10,388 9,079 6,803 7,878Lexus - - 1,921 4,457 5,100 5,390 6,101 7,159Mazda 6,366 11,440 10,232 8,418 10,320 11,778 11,129 12,596Mercedes-Benz 43,389 54,779 45,612 55,376 62,069 68,007 65,808 70,214Mini - 12,627 18,007 22,512 25,176 26,431 27,378 27,158Mitsubishi 5,575 6,758 3,514 3,936 2,922 2,378 4,879 7,207Nissan 31,330 40,858 54,084 74,102 69,072 71,492 59,606 42,313Opel (1) 133,576 106,462 94,877 64,170 68,281 45,548 - -Porsche 825 2,404 2,073 4,943 5,396 5,457 4,567 5,572Rover 13,474 1,980 - - - - - -Saab 3,265 2,701 574 - - - - -Seat 40,562 32,744 30,645 22,009 21,648 24,714 31,219 37,148Skoda 11,570 15,044 18,533 21,759 23,621 26,799 31,423 36,498Smart 6,645 12,649 6,408 8,107 8,980 8,162 7,446 10,494Ssangyong 19 3,972 451 636 963 669 301 157Subaru 2,312 1,464 1,146 841 851 721 720 510Suzuki 11,355 21,125 22,070 18,506 20,528 25,043 27,241 30,758Tesla - - 11 708 945 1,368 1,252 7,442Toyota 43,698 87,500 65,390 71,755 77,696 88,662 97,286 101,730Volkswagen 152,868 136,011 146,538 144,103 143,106 139,360 140,313 149,105Volvo 6,777 11,096 11,841 13,876 15,604 16,219 18,349 21,696TOTAL FOREIGN (2) 872,351 900,634 920,345 877,325 936,749 959,558 926,565 956,436TOTAL ALL CATEGORIES 2,133,884 2,117,561 2,251,668 1,917,226 2,015,177 2,110,748 2,173,481 2,214,279of which Temporary Transit - 49,772 39,011 31,665 31,448 31,762 32,112 30,326FRENCH GROUPS AS A % 59.1% 57.5% 59.1% 54.2% 53.5% 54.5% 57.4% 56.8%TOTAL FOREIGN AS A % 40.9% 42.5% 40.9% 45.8% 46.5% 45.5% 42.6% 43.2%
2000 2005 2010 2015 2016 2017 2018 2019
TOTAL ALL CATEGORIES 5,082,122 5,383,361 5,386,007 5,562,082 5,643,348 5,678,595 5,632,361 5,790,612
Used/new ratio 2.4 2.5 2.4 2.9 2.8 2.7 2.6 2.6
2000 2005 2010 2015 2016 2017 2018 2019
TOTAL ALL CATEGORIES 651,033 718,948 806,398 789,073 805,011 797,223 785,852 817,241
Used/new ratio 1.6 1.7 1.9 2.1 2.0 1.8 1.7 1.7
► NEW PASSENGER CAR REGISTRATIONS BY BRAND (IN UNITS)
The special French Temporary Transit series was included in the new passenger car registrations since 2004.
(1) Opel is included in PSA group since August 1, 2017. Thus, its registrations are included in PSA group from 08/01/2017 to 12/31/2017.(2) Including others.
► USED PASSENGER CAR REGISTRATIONS (IN UNITS)
► USED LIGHT COMMERCIAL VEHICLE REGISTRATIONS (IN UNITS)
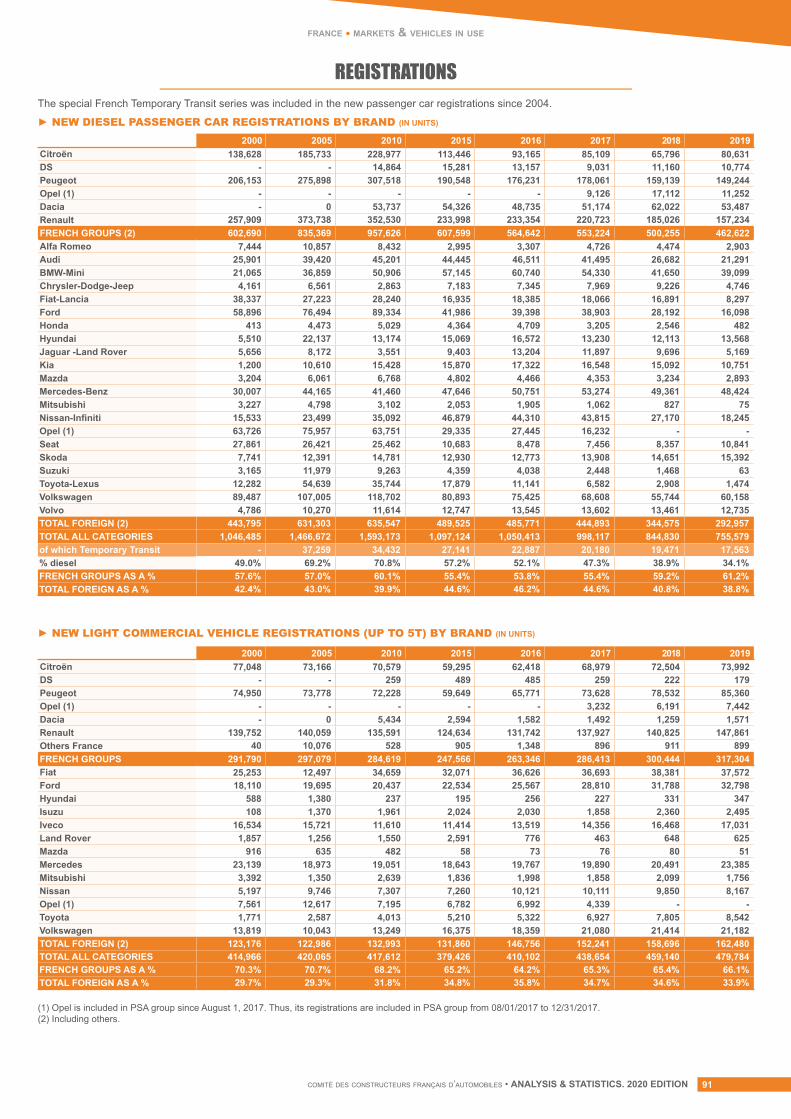
comité des constructeurs français d’automobiles • ANALYSIS & STATISTICS. 2020 EDITION 91
france • markets & vehicles in use
REGISTRATIONS
2000 2005 2010 2015 2016 2017 2018 2019Citroën 138,628 185,733 228,977 113,446 93,165 85,109 65,796 80,631DS - - 14,864 15,281 13,157 9,031 11,160 10,774Peugeot 206,153 275,898 307,518 190,548 176,231 178,061 159,139 149,244Opel (1) - - - - - 9,126 17,112 11,252Dacia - 0 53,737 54,326 48,735 51,174 62,022 53,487Renault 257,909 373,738 352,530 233,998 233,354 220,723 185,026 157,234FRENCH GROUPS (2) 602,690 835,369 957,626 607,599 564,642 553,224 500,255 462,622Alfa Romeo 7,444 10,857 8,432 2,995 3,307 4,726 4,474 2,903Audi 25,901 39,420 45,201 44,445 46,511 41,495 26,682 21,291BMW-Mini 21,065 36,859 50,906 57,145 60,740 54,330 41,650 39,099Chrysler-Dodge-Jeep 4,161 6,561 2,863 7,183 7,345 7,969 9,226 4,746Fiat-Lancia 38,337 27,223 28,240 16,935 18,385 18,066 16,891 8,297Ford 58,896 76,494 89,334 41,986 39,398 38,903 28,192 16,098Honda 413 4,473 5,029 4,364 4,709 3,205 2,546 482Hyundai 5,510 22,137 13,174 15,069 16,572 13,230 12,113 13,568Jaguar -Land Rover 5,656 8,172 3,551 9,403 13,204 11,897 9,696 5,169Kia 1,200 10,610 15,428 15,870 17,322 16,548 15,092 10,751Mazda 3,204 6,061 6,768 4,802 4,466 4,353 3,234 2,893Mercedes-Benz 30,007 44,165 41,460 47,646 50,751 53,274 49,361 48,424Mitsubishi 3,227 4,798 3,102 2,053 1,905 1,062 827 75Nissan-Infiniti 15,533 23,499 35,092 46,879 44,310 43,815 27,170 18,245Opel (1) 63,726 75,957 63,751 29,335 27,445 16,232 - -Seat 27,861 26,421 25,462 10,683 8,478 7,456 8,357 10,841Skoda 7,741 12,391 14,781 12,930 12,773 13,908 14,651 15,392Suzuki 3,165 11,979 9,263 4,359 4,038 2,448 1,468 63Toyota-Lexus 12,282 54,639 35,744 17,879 11,141 6,582 2,908 1,474Volkswagen 89,487 107,005 118,702 80,893 75,425 68,608 55,744 60,158Volvo 4,786 10,270 11,614 12,747 13,545 13,602 13,461 12,735TOTAL FOREIGN (2) 443,795 631,303 635,547 489,525 485,771 444,893 344,575 292,957TOTAL ALL CATEGORIES 1,046,485 1,466,672 1,593,173 1,097,124 1,050,413 998,117 844,830 755,579of which Temporary Transit - 37,259 34,432 27,141 22,887 20,180 19,471 17,563% diesel 49.0% 69.2% 70.8% 57.2% 52.1% 47.3% 38.9% 34.1%FRENCH GROUPS AS A % 57.6% 57.0% 60.1% 55.4% 53.8% 55.4% 59.2% 61.2%TOTAL FOREIGN AS A % 42.4% 43.0% 39.9% 44.6% 46.2% 44.6% 40.8% 38.8%
2000 2005 2010 2015 2016 2017 2018 2019Citroën 77,048 73,166 70,579 59,295 62,418 68,979 72,504 73,992DS - - 259 489 485 259 222 179Peugeot 74,950 73,778 72,228 59,649 65,771 73,628 78,532 85,360Opel (1) - - - - - 3,232 6,191 7,442Dacia - 0 5,434 2,594 1,582 1,492 1,259 1,571Renault 139,752 140,059 135,591 124,634 131,742 137,927 140,825 147,861Others France 40 10,076 528 905 1,348 896 911 899FRENCH GROUPS 291,790 297,079 284,619 247,566 263,346 286,413 300,444 317,304Fiat 25,253 12,497 34,659 32,071 36,626 36,693 38,381 37,572Ford 18,110 19,695 20,437 22,534 25,567 28,810 31,788 32,798Hyundai 588 1,380 237 195 256 227 331 347Isuzu 108 1,370 1,961 2,024 2,030 1,858 2,360 2,495Iveco 16,534 15,721 11,610 11,414 13,519 14,356 16,468 17,031Land Rover 1,857 1,256 1,550 2,591 776 463 648 625Mazda 916 635 482 58 73 76 80 51Mercedes 23,139 18,973 19,051 18,643 19,767 19,890 20,491 23,385Mitsubishi 3,392 1,350 2,639 1,836 1,998 1,858 2,099 1,756Nissan 5,197 9,746 7,307 7,260 10,121 10,111 9,850 8,167Opel (1) 7,561 12,617 7,195 6,782 6,992 4,339 - -Toyota 1,771 2,587 4,013 5,210 5,322 6,927 7,805 8,542Volkswagen 13,819 10,043 13,249 16,375 18,359 21,080 21,414 21,182TOTAL FOREIGN (2) 123,176 122,986 132,993 131,860 146,756 152,241 158,696 162,480TOTAL ALL CATEGORIES 414,966 420,065 417,612 379,426 410,102 438,654 459,140 479,784FRENCH GROUPS AS A % 70.3% 70.7% 68.2% 65.2% 64.2% 65.3% 65.4% 66.1%TOTAL FOREIGN AS A % 29.7% 29.3% 31.8% 34.8% 35.8% 34.7% 34.6% 33.9%
► NEW DIESEL PASSENGER CAR REGISTRATIONS BY BRAND (IN UNITS)
► NEW LIGHT COMMERCIAL VEHICLE REGISTRATIONS (UP TO 5T) BY BRAND (IN UNITS)
The special French Temporary Transit series was included in the new passenger car registrations since 2004.
(1) Opel is included in PSA group since August 1, 2017. Thus, its registrations are included in PSA group from 08/01/2017 to 12/31/2017.(2) Including others.
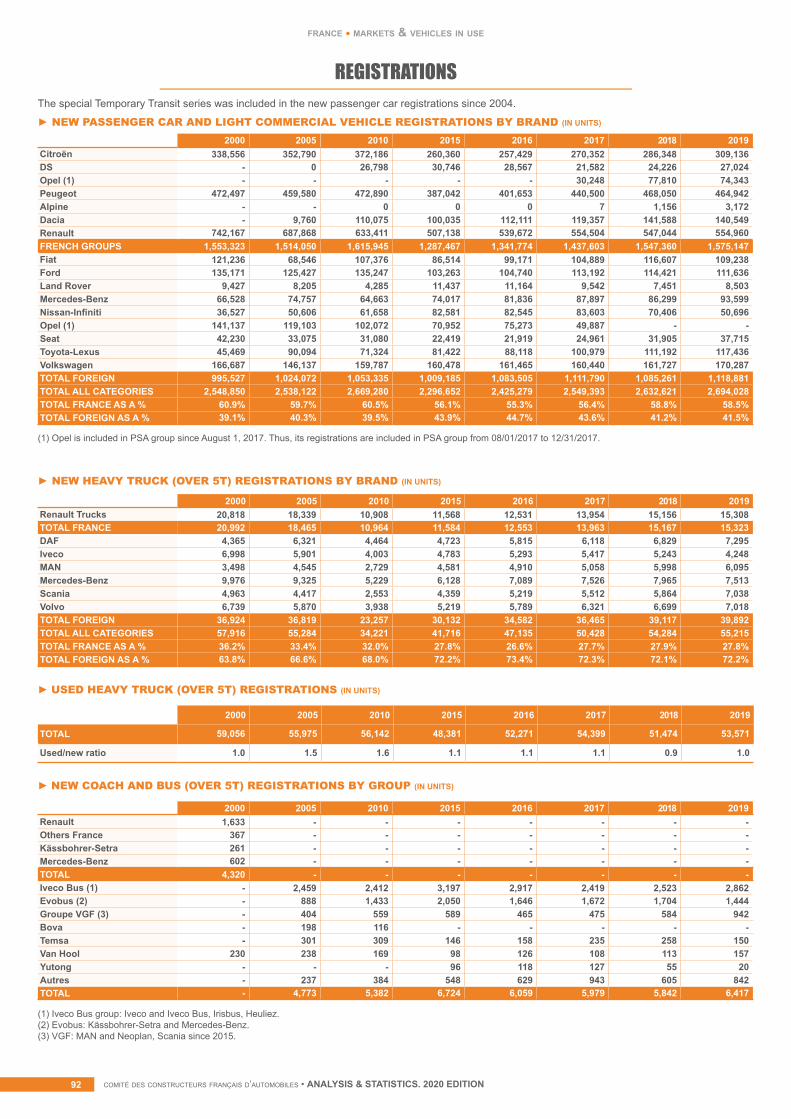
comité des constructeurs français d’automobiles • ANALYSIS & STATISTICS. 2020 EDITIONcomité des constructeurs français d’automobiles • ANALYSIS & STATISTICS. 2020 EDITION92
france • markets & vehicles in use
REGISTRATIONS
2000 2005 2010 2015 2016 2017 2018 2019 Citroën 338,556 352,790 372,186 260,360 257,429 270,352 286,348 309,136DS - 0 26,798 30,746 28,567 21,582 24,226 27,024Opel (1) - - - - - 30,248 77,810 74,343Peugeot 472,497 459,580 472,890 387,042 401,653 440,500 468,050 464,942Alpine - - 0 0 0 7 1,156 3,172Dacia - 9,760 110,075 100,035 112,111 119,357 141,588 140,549Renault 742,167 687,868 633,411 507,138 539,672 554,504 547,044 554,960FRENCH GROUPS 1,553,323 1,514,050 1,615,945 1,287,467 1,341,774 1,437,603 1,547,360 1,575,147Fiat 121,236 68,546 107,376 86,514 99,171 104,889 116,607 109,238Ford 135,171 125,427 135,247 103,263 104,740 113,192 114,421 111,636Land Rover 9,427 8,205 4,285 11,437 11,164 9,542 7,451 8,503Mercedes-Benz 66,528 74,757 64,663 74,017 81,836 87,897 86,299 93,599Nissan-Infiniti 36,527 50,606 61,658 82,581 82,545 83,603 70,406 50,696Opel (1) 141,137 119,103 102,072 70,952 75,273 49,887 - -Seat 42,230 33,075 31,080 22,419 21,919 24,961 31,905 37,715Toyota-Lexus 45,469 90,094 71,324 81,422 88,118 100,979 111,192 117,436Volkswagen 166,687 146,137 159,787 160,478 161,465 160,440 161,727 170,287TOTAL FOREIGN 995,527 1,024,072 1,053,335 1,009,185 1,083,505 1,111,790 1,085,261 1,118,881TOTAL ALL CATEGORIES 2,548,850 2,538,122 2,669,280 2,296,652 2,425,279 2,549,393 2,632,621 2,694,028TOTAL FRANCE AS A % 60.9% 59.7% 60.5% 56.1% 55.3% 56.4% 58.8% 58.5%TOTAL FOREIGN AS A % 39.1% 40.3% 39.5% 43.9% 44.7% 43.6% 41.2% 41.5%
2000 2005 2010 2015 2016 2017 2018 2019 Renault 1,633 - - - - - - -Others France 367 - - - - - - -Kässbohrer-Setra 261 - - - - - - -Mercedes-Benz 602 - - - - - - -TOTAL 4,320 - - - - - - -Iveco Bus (1) - 2,459 2,412 3,197 2,917 2,419 2,523 2,862Evobus (2) - 888 1,433 2,050 1,646 1,672 1,704 1,444Groupe VGF (3) - 404 559 589 465 475 584 942Bova - 198 116 - - - - -Temsa - 301 309 146 158 235 258 150Van Hool 230 238 169 98 126 108 113 157Yutong - - - 96 118 127 55 20Autres - 237 384 548 629 943 605 842TOTAL - 4,773 5,382 6,724 6,059 5,979 5,842 6,417
2000 2005 2010 2015 2016 2017 2018 2019 Renault Trucks 20,818 18,339 10,908 11,568 12,531 13,954 15,156 15,308TOTAL FRANCE 20,992 18,465 10,964 11,584 12,553 13,963 15,167 15,323DAF 4,365 6,321 4,464 4,723 5,815 6,118 6,829 7,295Iveco 6,998 5,901 4,003 4,783 5,293 5,417 5,243 4,248MAN 3,498 4,545 2,729 4,581 4,910 5,058 5,998 6,095Mercedes-Benz 9,976 9,325 5,229 6,128 7,089 7,526 7,965 7,513Scania 4,963 4,417 2,553 4,359 5,219 5,512 5,864 7,038Volvo 6,739 5,870 3,938 5,219 5,789 6,321 6,699 7,018TOTAL FOREIGN 36,924 36,819 23,257 30,132 34,582 36,465 39,117 39,892TOTAL ALL CATEGORIES 57,916 55,284 34,221 41,716 47,135 50,428 54,284 55,215TOTAL FRANCE AS A % 36.2% 33.4% 32.0% 27.8% 26.6% 27.7% 27.9% 27.8%TOTAL FOREIGN AS A % 63.8% 66.6% 68.0% 72.2% 73.4% 72.3% 72.1% 72.2%
► NEW PASSENGER CAR AND LIGHT COMMERCIAL VEHICLE REGISTRATIONS BY BRAND (IN UNITS)
► NEW HEAVY TRUCK (OVER 5T) REGISTRATIONS BY BRAND (IN UNITS)
The special Temporary Transit series was included in the new passenger car registrations since 2004.
(1) Iveco Bus group: Iveco and Iveco Bus, Irisbus, Heuliez.(2) Evobus: Kässbohrer-Setra and Mercedes-Benz.(3) VGF: MAN and Neoplan, Scania since 2015.
(1) Opel is included in PSA group since August 1, 2017. Thus, its registrations are included in PSA group from 08/01/2017 to 12/31/2017.
2000 2005 2010 2015 2016 2017 2018 2019
TOTAL 59,056 55,975 56,142 48,381 52,271 54,399 51,474 53,571
Used/new ratio 1.0 1.5 1.6 1.1 1.1 1.1 0.9 1.0
► USED HEAVY TRUCK (OVER 5T) REGISTRATIONS (IN UNITS)
► NEW COACH AND BUS (OVER 5T) REGISTRATIONS BY GROUP (IN UNITS)
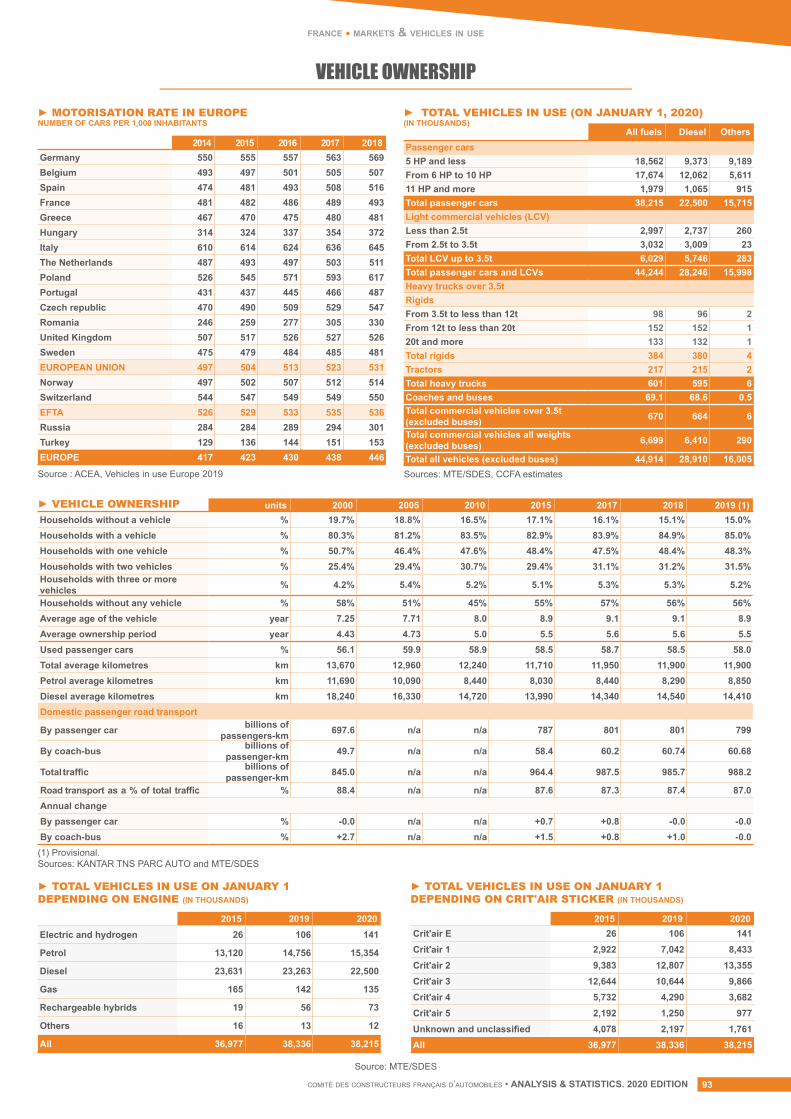
comité des constructeurs français d’automobiles • ANALYSIS & STATISTICS. 2020 EDITION 93
france • markets & vehicles in use
VEHICLE OWNERSHIP
units 2000 2005 2010 2015 2017 2018 2019 (1)Households without a vehicle % 19.7% 18.8% 16.5% 17.1% 16.1% 15.1% 15.0%Households with a vehicle % 80.3% 81.2% 83.5% 82.9% 83.9% 84.9% 85.0%Households with one vehicle % 50.7% 46.4% 47.6% 48.4% 47.5% 48.4% 48.3%Households with two vehicles % 25.4% 29.4% 30.7% 29.4% 31.1% 31.2% 31.5%Households with three or more vehicles % 4.2% 5.4% 5.2% 5.1% 5.3% 5.3% 5.2%
Households without any vehicle % 58% 51% 45% 55% 57% 56% 56%Average age of the vehicle year 7.25 7.71 8.0 8.9 9.1 9.1 8.9Average ownership period year 4.43 4.73 5.0 5.5 5.6 5.6 5.5Used passenger cars % 56.1 59.9 58.9 58.5 58.7 58.5 58.0Total average kilometres km 13,670 12,960 12,240 11,710 11,950 11,900 11,900Petrol average kilometres km 11,690 10,090 8,440 8,030 8,440 8,290 8,850Diesel average kilometres km 18,240 16,330 14,720 13,990 14,340 14,540 14,410Domestic passenger road transport
By passenger car billions of passengers-km 697.6 n/a n/a 787 801 801 799
By coach-bus billions of passenger-km 49.7 n/a n/a 58.4 60.2 60.74 60.68
Total traffic billions of passenger-km 845.0 n/a n/a 964.4 987.5 985.7 988.2
Road transport as a % of total traffic % 88.4 n/a n/a 87.6 87.3 87.4 87.0Annual changeBy passenger car % -0.0 n/a n/a +0.7 +0.8 -0.0 -0.0By coach-bus % +2.7 n/a n/a +1.5 +0.8 +1.0 -0.0
2014 2015 2016 2017 2018Germany 550 555 557 563 569Belgium 493 497 501 505 507Spain 474 481 493 508 516France 481 482 486 489 493Greece 467 470 475 480 481Hungary 314 324 337 354 372Italy 610 614 624 636 645The Netherlands 487 493 497 503 511Poland 526 545 571 593 617Portugal 431 437 445 466 487Czech republic 470 490 509 529 547Romania 246 259 277 305 330United Kingdom 507 517 526 527 526Sweden 475 479 484 485 481EUROPEAN UNION 497 504 513 523 531Norway 497 502 507 512 514Switzerland 544 547 549 549 550EFTA 526 529 533 535 536Russia 284 284 289 294 301Turkey 129 136 144 151 153EUROPE 417 423 430 438 446
All fuels Diesel OthersPassenger cars5 HP and less 18,562 9,373 9,189From 6 HP to 10 HP 17,674 12,062 5,61111 HP and more 1,979 1,065 915Total passenger cars 38,215 22,500 15,715Light commercial vehicles (LCV)Less than 2.5t 2,997 2,737 260From 2.5t to 3.5t 3,032 3,009 23Total LCV up to 3.5t 6,029 5,746 283Total passenger cars and LCVs 44,244 28,246 15,998Heavy trucks over 3.5tRigidsFrom 3.5t to less than 12t 98 96 2From 12t to less than 20t 152 152 120t and more 133 132 1Total rigids 384 380 4Tractors 217 215 2Total heavy trucks 601 595 6Coaches and buses 69.1 68.6 0.5Total commercial vehicles over 3.5t (excluded buses) 670 664 6
Total commercial vehicles all weights (excluded buses) 6,699 6,410 290
Total all vehicles (excluded buses) 44,914 28,910 16,005
2015 2019 2020Electric and hydrogen 26 106 141
Petrol 13,120 14,756 15,354
Diesel 23,631 23,263 22,500
Gas 165 142 135
Rechargeable hybrids 19 56 73
Others 16 13 12
All 36,977 38,336 38,215
2015 2019 2020Crit'air E 26 106 141Crit'air 1 2,922 7,042 8,433Crit'air 2 9,383 12,807 13,355Crit'air 3 12,644 10,644 9,866Crit'air 4 5,732 4,290 3,682Crit'air 5 2,192 1,250 977Unknown and unclassified 4,078 2,197 1,761All 36,977 38,336 38,215
► MOTORISATION RATE IN EUROPE NUMBER OF CARS PER 1,000 INHABITANTS
► TOTAL VEHICLES IN USE (ON JANUARY 1, 2020) (IN THOUSANDS)
► VEHICLE OWNERSHIP
► TOTAL VEHICLES IN USE ON JANUARY 1 DEPENDING ON ENGINE (IN THOUSANDS)
► TOTAL VEHICLES IN USE ON JANUARY 1 DEPENDING ON CRIT'AIR STICKER (IN THOUSANDS)
Source : ACEA, Vehicles in use Europe 2019
(1) Provisional.Sources: KANTAR TNS PARC AUTO and MTE/SDES
Source: MTE/SDES
Sources: MTE/SDES, CCFA estimates
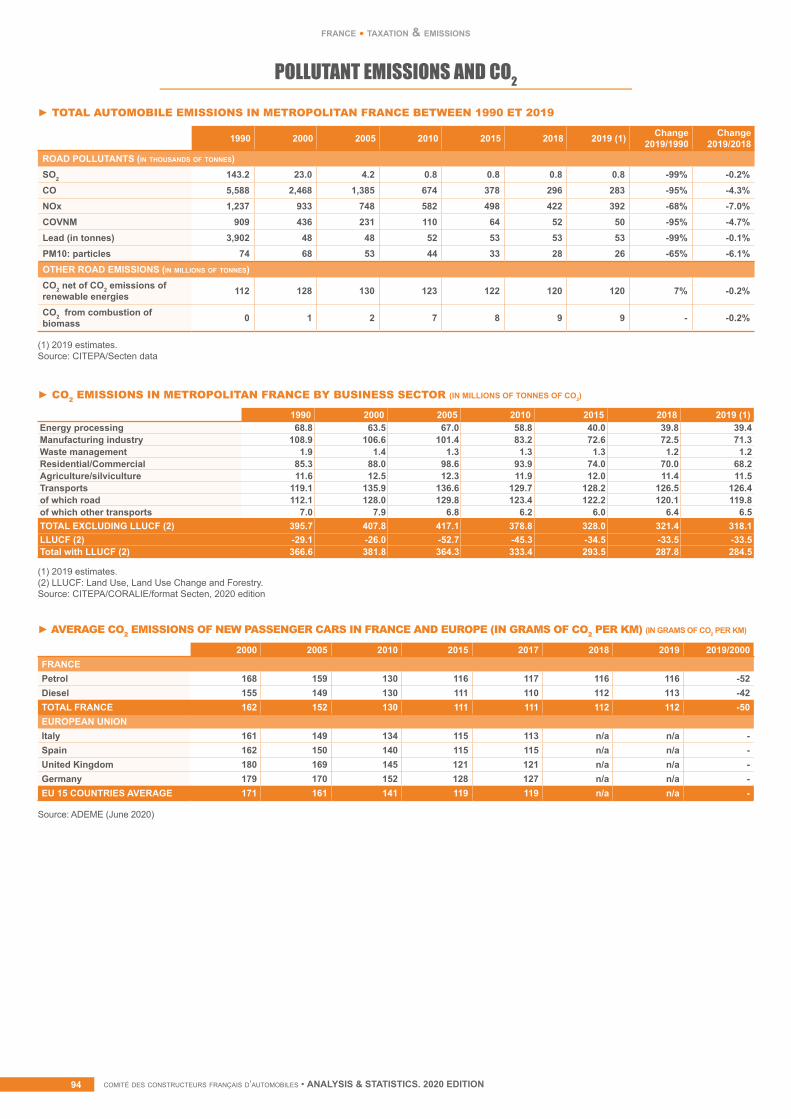
comité des constructeurs français d’automobiles • ANALYSIS & STATISTICS. 2020 EDITIONcomité des constructeurs français d’automobiles • ANALYSIS & STATISTICS. 2020 EDITION94
france • taxation & emissions
POLLUTANT EMISSIONS AND CO2
1990 2000 2005 2010 2015 2018 2019 (1) Change 2019/1990
Change 2019/2018
ROAD POLLUTANTS (in thousands of tonnes)SO2 143.2 23.0 4.2 0.8 0.8 0.8 0.8 -99% -0.2%CO 5,588 2,468 1,385 674 378 296 283 -95% -4.3%NOx 1,237 933 748 582 498 422 392 -68% -7.0%COVNM 909 436 231 110 64 52 50 -95% -4.7%Lead (in tonnes) 3,902 48 48 52 53 53 53 -99% -0.1%PM10: particles 74 68 53 44 33 28 26 -65% -6.1%OTHER ROAD EMISSIONS (in millions of tonnes)CO2 net of CO2 emissions of renewable energies 112 128 130 123 122 120 120 7% -0.2%
CO2 from combustion of biomass 0 1 2 7 8 9 9 - -0.2%
► TOTAL AUTOMOBILE EMISSIONS IN METROPOLITAN FRANCE BETWEEN 1990 ET 2019
(1) 2019 estimates. Source: CITEPA/Secten data
1990 2000 2005 2010 2015 2018 2019 (1)Energy processing 68.8 63.5 67.0 58.8 40.0 39.8 39.4Manufacturing industry 108.9 106.6 101.4 83.2 72.6 72.5 71.3Waste management 1.9 1.4 1.3 1.3 1.3 1.2 1.2Residential/Commercial 85.3 88.0 98.6 93.9 74.0 70.0 68.2Agriculture/silviculture 11.6 12.5 12.3 11.9 12.0 11.4 11.5Transports 119.1 135.9 136.6 129.7 128.2 126.5 126.4of which road 112.1 128.0 129.8 123.4 122.2 120.1 119.8of which other transports 7.0 7.9 6.8 6.2 6.0 6.4 6.5TOTAL EXCLUDING LLUCF (2) 395.7 407.8 417.1 378.8 328.0 321.4 318.1LLUCF (2) -29.1 -26.0 -52.7 -45.3 -34.5 -33.5 -33.5Total with LLUCF (2) 366.6 381.8 364.3 333.4 293.5 287.8 284.5
► CO2 EMISSIONS IN METROPOLITAN FRANCE BY BUSINESS SECTOR (IN MILLIONS OF TONNES OF CO2)
(1) 2019 estimates.(2) LLUCF: Land Use, Land Use Change and Forestry.Source: CITEPA/CORALIE/format Secten, 2020 edition
2000 2005 2010 2015 2017 2018 2019 2019/2000FRANCEPetrol 168 159 130 116 117 116 116 -52Diesel 155 149 130 111 110 112 113 -42TOTAL FRANCE 162 152 130 111 111 112 112 -50EUROPEAN UNIONItaly 161 149 134 115 113 n/a n/a -Spain 162 150 140 115 115 n/a n/a -United Kingdom 180 169 145 121 121 n/a n/a -Germany 179 170 152 128 127 n/a n/a -EU 15 COUNTRIES AVERAGE 171 161 141 119 119 n/a n/a -
► AVERAGE CO2 EMISSIONS OF NEW PASSENGER CARS IN FRANCE AND EUROPE (IN GRAMS OF CO2 PER KM) (IN GRAMS OF CO2 PER KM)
Source: ADEME (June 2020)
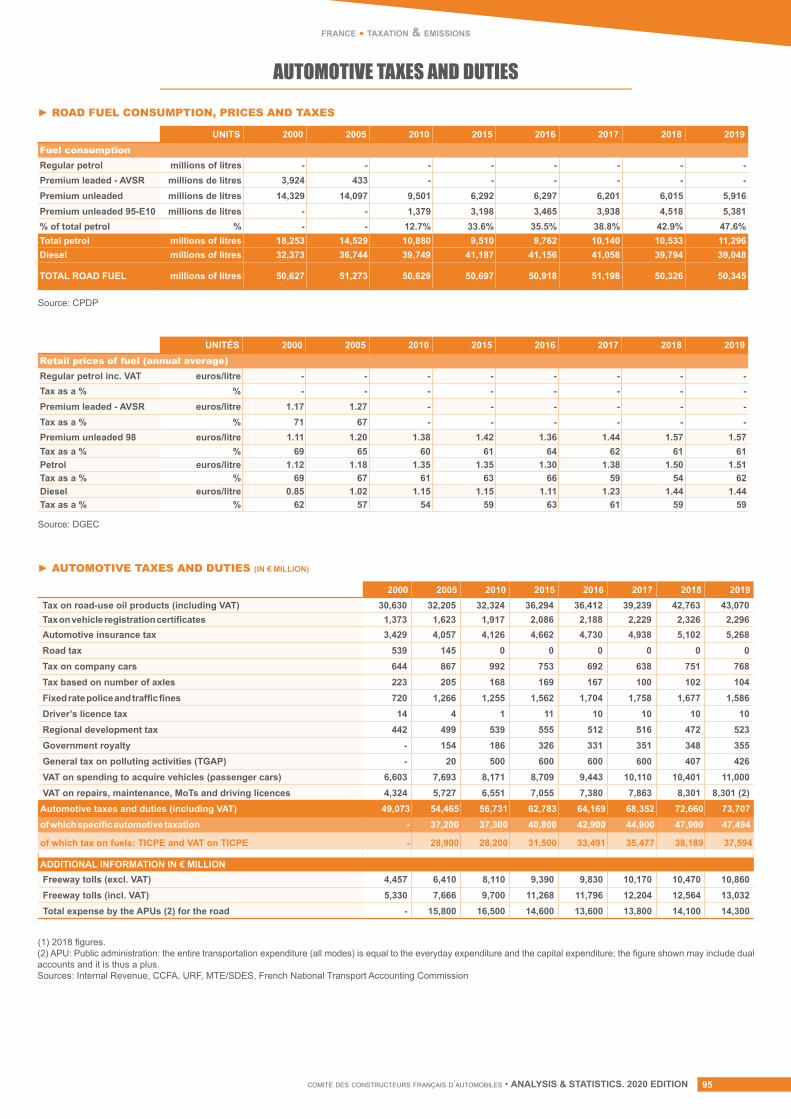
comité des constructeurs français d’automobiles • ANALYSIS & STATISTICS. 2020 EDITION 95
france • taxation & emissions
AUTOMOTIVE TAXES AND DUTIES
2000 2005 2010 2015 2016 2017 2018 2019Tax on road-use oil products (including VAT) 30,630 32,205 32,324 36,294 36,412 39,239 42,763 43,070Tax on vehicle registration certificates 1,373 1,623 1,917 2,086 2,188 2,229 2,326 2,296Automotive insurance tax 3,429 4,057 4,126 4,662 4,730 4,938 5,102 5,268Road tax 539 145 0 0 0 0 0 0Tax on company cars 644 867 992 753 692 638 751 768Tax based on number of axles 223 205 168 169 167 100 102 104Fixed rate police and traffic fines 720 1,266 1,255 1,562 1,704 1,758 1,677 1,586Driver’s licence tax 14 4 1 11 10 10 10 10Regional development tax 442 499 539 555 512 516 472 523Government royalty - 154 186 326 331 351 348 355General tax on polluting activities (TGAP) - 20 500 600 600 600 407 426VAT on spending to acquire vehicles (passenger cars) 6,603 7,693 8,171 8,709 9,443 10,110 10,401 11,000VAT on repairs, maintenance, MoTs and driving licences 4,324 5,727 6,551 7,055 7,380 7,863 8,301 8,301 (2)
Automotive taxes and duties (including VAT) 49,073 54,465 56,731 62,783 64,169 68,352 72,660 73,707of which specific automotive taxation - 37,200 37,300 40,800 42,900 44,900 47,900 47,494
of which tax on fuels: TICPE and VAT on TICPE - 28,900 28,200 31,500 33,491 35,477 38,189 37,594
ADDITIONAL INFORMATION IN € MILLIONFreeway tolls (excl. VAT) 4,457 6,410 8,110 9,390 9,830 10,170 10,470 10,860Freeway tolls (incl. VAT) 5,330 7,666 9,700 11,268 11,796 12,204 12,564 13,032Total expense by the APUs (2) for the road - 15,800 16,500 14,600 13,600 13,800 14,100 14,300
Source: CPDP
Source: DGEC
(1) 2018 figures. (2) APU: Public administration: the entire transportation expenditure (all modes) is equal to the everyday expenditure and the capital expenditure; the figure shown may include dual accounts and it is thus a plus. Sources: Internal Revenue, CCFA, URF, MTE/SDES, French National Transport Accounting Commission
► ROAD FUEL CONSUMPTION, PRICES AND TAXES
► AUTOMOTIVE TAXES AND DUTIES (IN € MILLION)
UNITS 2000 2005 2010 2015 2016 2017 2018 2019Fuel consumptionRegular petrol millions of litres - - - - - - - -Premium leaded - AVSR millions de litres 3,924 433 - - - - - -Premium unleaded millions de litres 14,329 14,097 9,501 6,292 6,297 6,201 6,015 5,916Premium unleaded 95-E10 millions de litres - - 1,379 3,198 3,465 3,938 4,518 5,381% of total petrol % - - 12.7% 33.6% 35.5% 38.8% 42.9% 47.6%Total petrol millions of litres 18,253 14,529 10,880 9,510 9,762 10,140 10,533 11,296Diesel millions of litres 32,373 36,744 39,749 41,187 41,156 41,058 39,794 39,048
TOTAL ROAD FUEL millions of litres 50,627 51,273 50,629 50,697 50,918 51,198 50,326 50,345
UNITÉS 2000 2005 2010 2015 2016 2017 2018 2019Retail prices of fuel (annual average)Regular petrol inc. VAT euros/litre - - - - - - - -Tax as a % % - - - - - - - -Premium leaded - AVSR euros/litre 1.17 1.27 - - - - - -Tax as a % % 71 67 - - - - - -Premium unleaded 98 euros/litre 1.11 1.20 1.38 1.42 1.36 1.44 1.57 1.57Tax as a % % 69 65 60 61 64 62 61 61Petrol euros/litre 1.12 1.18 1.35 1.35 1.30 1.38 1.50 1.51Tax as a % % 69 67 61 63 66 59 54 62Diesel euros/litre 0.85 1.02 1.15 1.15 1.11 1.23 1.44 1.44Tax as a % % 62 57 54 59 63 61 59 59
comité des constructeurs français d’automobiles • ANALYSIS & STATISTICS. 2020 EDITION96
useful addresses
USEFUL ADDRESSES► F R E N C H A U T O M O T I V E MANUFACTURERS∙ ∙ ∙ ∙ ∙ ∙ ∙ ∙ ∙ ∙ ∙ ∙ ∙ ∙ ∙ ∙ ∙ ∙ ∙ ∙ ∙ ∙ ∙ ∙ ∙ ∙ ∙ ∙ ∙ ∙ ∙ ∙
PSA group Route de Gisy78140 Vélizy-VillacoublayTel: 01 55 94 81 00www.groupe-psa.com
Renault group13-15, quai Le Gallo92153 Boulogne Billancourt cedexTel: 01 76 84 50 50 www.renault.com
Renault Trucks99, route de Lyon69800 St PriestTel: 04 69 09 60 00www.renault-trucks.fr
Alpine-RenaultAvenue de Bréauté76885 Dieppe cedexTel: 01 76 86 31 50www.alpinecars.com/fr
►AUTOMOTIVE PROFESSIONAL ORGANISATIONS IN FRANCE∙ ∙ ∙ ∙ ∙ ∙ ∙ ∙ ∙ ∙ ∙ ∙ ∙ ∙ ∙ ∙ ∙ ∙ ∙ ∙ ∙ ∙ ∙ ∙ ∙ ∙ ∙ ∙ ∙ ∙ ∙ ∙
Association Française du Gaz Naturel pour Véhicules (AFGNV)8, rue de l’Hôtel de Ville92200 Neuilly-sur-SeineTel: 01 80 21 08 00 www.afgnv.org
Fédération Française de Carrosserie Industries et Services (FFC)Immeuble Le Cardinet8, rue Bernard Buffet75017 PARISTel: 01 44 29 71 00www.ffc-carrosserie.org
Chambre Syndicale Internationale de l’Automobile et du Motocycle (CSIAM)5, square de l’Avenue du Bois75016 ParisTel: 01 53 64 50 30www.csiam-fr.org
Conseil National des Professions de l’Automobile (CNPA)43 bis, route de Vaugirard CS 8001692197 MeudonTel: 01 40 99 55 00www.cnpa.fr
Fédération des Industries d’Équipements pour Véhicules (FIEV)79, rue Jean-Jacques Rousseau92158 Suresnes cedexTel: 01 46 25 02 30www.fiev.fr
Groupement pour l’Amélioration des Liaisons dans l’Automobile (GALIA)20, rue Barthélémy Danjou92100 Boulogne-BillancourtTel: 01 41 31 68 68www.galia.com
Groupement Plasturgie Automobile (GPA)125, rue Aristide Briand92300 LevalloisTel: 01 44 01 16 38www.autoplasticgate.com
PFA, Filière automobile et mobilités2, rue de Presbourg75008 ParisTel: 01 41 44 94 30www.pfa-auto.fr
SNLVLD/SESAMlld (Syndicat des Entreprises des Services Automobiles en LLD et des Mobilités)Immeuble Arc en Ciel17, rue de la Vanne 92120 MontrougeTel: 01 85 65 11 25www.sesamlld.com
Syndicat des Véhicules de Loisirs (UNI VDL)3, rue des Cordelières75013 ParisTel: 01 43 37 86 61www.univdl.org
Industries et Métiers de la Métallurgie (UIMM)56, avenue de Wagram75017 ParisTel: 01 40 54 20 20www.uimm.fr
Union Routière de France (URF)9, rue de Berri75008 Paris Tel: 01 44 13 37 17www.unionroutiere.fr
Union Technique de l’Automobile, du Motocycle et du Cycle (UTAC)Autodrome de Linas-Monthléry91311 Montlhéry cedexTel: 01 69 80 17 00www.utacceram.com
► INTERNATIONAL AUTOMOTIVE ASSOCIATIONS∙ ∙ ∙ ∙ ∙ ∙ ∙ ∙ ∙ ∙ ∙ ∙ ∙ ∙ ∙ ∙ ∙ ∙ ∙ ∙ ∙ ∙ ∙ ∙ ∙ ∙ ∙ ∙ ∙ ∙ ∙ ∙
Associat ion des Constr ucteurs Européens d’Automobiles (ACEA)85, avenue des Nerviens1040 Bruxelles (Belgique)Tel: 00 32 2 732 55 50www.acea.be
Organisation Internationale des Constructeurs d’Automobiles (OICA)4, rue de Berri - 75008 ParisTel: 01 43 59 00 13www.oica.net
► AUTOMOTIVE ASSOCIATIONS IN FRANCE∙ ∙ ∙ ∙ ∙ ∙ ∙ ∙ ∙ ∙ ∙ ∙ ∙ ∙ ∙ ∙ ∙ ∙ ∙ ∙ ∙ ∙ ∙ ∙ ∙ ∙ ∙ ∙ ∙ ∙ ∙ ∙
40 millions d’automobilistes75 boulevard Marie et Alexandre Oyon72100 Le MansTel: 02 43 50 06 30 www.40millionsdautomobilistes.com
ACA - Automobile Club AssociationHead office: 38, avenue du Rhin67027 Strasbourg Cedex Tel: 09 70 40 11 11Paris office: 9 rue d’Artois75008 ParisTel: 01 40 55 43 00www.automobileclub.org
Fédérat ion Française du Spor t Automobile (FFSA)32, avenue de New-York75781 Paris Cedex 16Tel: 01 44 30 24 00www.ffsa.org
Association Prévention Routière33, rue de Mogador75009 ParisTel: 01 44 15 27 00www.preventionroutiere.asso.fr
Société des Ingénieurs de l’Automobile (SIA)79, rue Jean-Jacques Rousseau92158 Suresnes cedexTel: 01 41 44 93 70www.sia.fr
comité des constructeurs français d’automobiles • ANALYSIS & STATISTICS. 2020 EDITION 97
useful addresses
AUTOMOTIVE INDUSTRY RESEARCH ORGANISATIONS IN FRANCEAssociation pour le développementdu transport et de la mobilité électriques France (AVERE France)22, avenue Jean Aicard 75011 ParisTel: 01 53 25 00 60www.avere-france.org
Groupe d’Etudes et de Recherches Permanent sur l’Industrie et les Salariés de l’Automobile (GERPISA)4, avenue des Sciences,91190 Gif-sur-YvetteTel: 01 47 40 59 50 www.gerpisa.org
ID4CARTechnocampus CompositesChemin du Chaffault - ZI du Chaffault 44340 BouguenaisTel: 02 28 44 36 50www.id4car.org
IFP Énergies nouvelles (IFPEN)1 & 4, avenue de Bois Préau92852 Rueil Malmaison CedexTel: 01 47 52 60 00www.ifpenergiesnouvelles.fr
Institut Français des Sciences et Technologies des Transports, de l’Aménagement et des Réseaux (IFSTTAR)IFSTTAR head office 14-20, boulevard NewtonCité Descartes, Champs sur Marne77447 Marne la vallée Cedex 2Tel: 01 81 66 80 00www.ifsttar.fr
CARA1, boulevard Edmond Michelet69372 Lyon Cedex 08Tel: 04 51 08 40 20 www.cara.eu
Pôle Mov’eoHaute-Normandie head officeTechnopôle du MadrilletAvenue Galilée BP 2006076801 Saint Etienne du Rouvray CedexTel: 02 32 91 54 50 www.pole-moveo.org
Pôle Véhicule du FuturHead office: Centre d’affaires Technoland15, rue Armand Japy 25461 Etupes CedexGeneral secretary: Technopole de Mulhouse 40, rue Marc Seguin 68060 Mulhouse CedexTel: 03 89 32 76 44 www.vehiculedufutur.com
THE CCFA PROVIDES INFORMATION ON THE AUTOMOTIVE WORLDAND SUPPORTS THE SECTOR IN ITS MAJOR EVENTS
WWW.CCFA.FRCONTACT: [email protected]
comité des constructeurs français d’automobiles • analysis & statistics. 2020 edition98
EVENTS AT THE SERVICEOF THE SECTOR
SUPPORT THE SECTORON KEY SUBJECTS
DAILY INFORMATION ONTHE FRENCH AUTOMOTIVE INDUSTRY
FIND US ON SOCIAL MEDIA:
comité des constructeurs français d’automobiles • analysis & statistics. 2020 edition 99