the fight on the flights emergency evacuations
TRANSCRIPT
LUND UNIVERSITY
PO Box 117221 00 Lund+46 46-222 00 00
The Fight on the Flights
Emergency evacuations – human physiological performance, leg muscle activity and gaitbiomechanics during exhaustive stair and slope ascentHalder, Amitava
2020
Link to publication
Citation for published version (APA):Halder, A. (2020). The Fight on the Flights: Emergency evacuations – human physiological performance, legmuscle activity and gait biomechanics during exhaustive stair and slope ascent. Ergonomics and AerosolTechnology, Department of Design Sciences, Lund University.
Total number of authors:1
General rightsUnless other specific re-use rights are stated the following general rights apply:Copyright and moral rights for the publications made accessible in the public portal are retained by the authorsand/or other copyright owners and it is a condition of accessing publications that users recognise and abide by thelegal requirements associated with these rights. • Users may download and print one copy of any publication from the public portal for the purpose of private studyor research. • You may not further distribute the material or use it for any profit-making activity or commercial gain • You may freely distribute the URL identifying the publication in the public portal
Read more about Creative commons licenses: https://creativecommons.org/licenses/Take down policyIf you believe that this document breaches copyright please contact us providing details, and we will removeaccess to the work immediately and investigate your claim.
The Fight on the FlightsEmergency evacuations – human physiological performance, leg muscle activity and gait biomechanics during exhaustive stair and slope ascent
AMITAVA HALDER | DIVISION OF ERGONOMICS AND AEROSOL TECHNOLOGY
DEPARTMENT OF DESIGN SCIENCES | FACULTY OF ENGINEERING | LUND UNIVERSITY
The Fight on the Flights Emergency evacuations – human physiological
performance, leg muscle activity and gait biomechanics during exhaustive stair and slope ascent
Amitava Halder
DOCTORAL DISSERTATION
by due permission of the Faculty of Engineering, Lund University, Sweden. To be defended at Stora Hörsalen, 2nd floor, Ingvar Kamprad Design Centre,
Sölvegatan 26, Lund, Sweden. Friday May 8, 2020, at 09:00 a.m.
Faculty opponent Assistant Professor Denise McGrath, Ph.D.
School of Public Health, Physiotherapy and Sports Science, University College Dublin, Ireland
LUND UNIVERSITY Faculty of Engineering, Department of Design Sciences Division of Ergonomics and Aerosol Technology
Doctoral Dissertation 2020
Author: Amitava Halder Date of issue 2020-04-04
Title and subtitle: The Fight on the Flights: Emergency evacuations – human physiological performance, leg muscle activity and gait biomechanics during exhaustive stair and slope ascent Abstract Physical exhaustion can constrain stair ascending capacity during emergency evacuation. The overall aim of this research was to explore and compare stair ascending capacities and physiological limitations when using two different modes: 1) self-preferred pace on three different public stairways, and 2) four machine-controlled paces on a stair machine corresponding to different percentages of maximal aerobic capacity (V̇O2max). After the exhaustive stair ascent, gait biomechanics were also studied when walking on an inclined metal walkway in the laboratory. Participants of different ages, genders and body sizes were recruited from social media. The specific objective was to determine, through the combined analysis of oxygen uptake (V̇O2) and electromyography (EMG), how cardiorespiratory capacity and local muscle fatigue (LMF) in the leg constrain the ascending capacity and affect walking gait kinetics and kinematics.
The results showed that the average relative maximum oxygen uptake during stair ascent (V̇O2highest) reached 39-41 mL·min-1·kg-1 at the self-preferred pace in the field, and 44-45 mL·min-1·kg-1 at the controlled step rate (SR) corresponding to 90-100% V̇O2max in the laboratory. During ascent at the self-preferred pace, both V̇O2highest and heart rate (HRhighest) reached about 83-95% level of average human capacity reported in literature. During ascent at 90-100% V̇O2max SRs, the V̇O2highest reached about 92-94% of V̇O2max, while HRhighest peaked between 91 and 97% of HRmax. The SR was sustained at 92-95 steps·min-1 at the self-preferred pace on the stairs to complete the ascents in a 13-floor and 31-floor building. The average ascending durations of 4.3 and 3.5 minutes were recorded at an average SR of 109 and 122 steps·min-1 corresponding to 90 and 100% V̇O2max, on the stair machine. A physiological evacuation model was developed based on individual V̇O2max. The model proved to be useful in estimating step rate and vertical displacement, thus it is recommended for calculating the performance as such speed, height during stair ascent evacuation.
The EMG amplitudes (AMPs) were different between the self-paced and controlled ascending speeds. During self-preferred ascent, the leg muscle AMPs showed a decreasing trend and the median frequencies (MDFs) were unchanged or slightly decreased indicating reductions of muscle power production and possible fatigue compensation by speed reduction. This allowed recovery to complete the ascents. In contrast, a significant increase of AMPs and decrease of MDFs were observed in the controlled paces evidencing the leg LMF. A muscle activity interpretation squares (MAIS) model was developed by plotting the muscle activity rate change (MARC) percentile points to interpret dynamic muscle activity changes and fatigue over time. At the self-preferred paces, the MARC points in the MAIS reflected recovery from muscle fatigue through power decrease and pace reduction. At the controlled paces, in contrast, the MARC points reflected muscle fatigue. Thus, MARC and MAIS are useful for observing muscle activity changes during repetitive tasks.
Constant ascents at maximal intensity (90-100% V̇O2max) resulted in high lactate production and leg LMF due to high demand and insufficient recovery. This forced the subjects to stop within 5-min. The results infer that the combined effect of cardiorespiratory capacity exaggerated by leg LMF constrained stair ascending capacities, durations and vertical distances, thus restricting the V̇O2 uptake from reaching the V̇O2max, while any recovery can extend the tolerance. Finally, when walking up a 10° inclined surface after exhaustive stair ascent, the peak gait ground reaction forces, peak and minimum foot absolute angles, peak foot angular velocity and acceleration all significantly decreased with an increased required coefficient of friction. The altered gait biomechanics on inclines can affect the human locomotion and impede the evacuation process during emergencies.
Key words: Stair climbing evacuation, Physical work capacity, Physiological constraints, Endurance, Energy expenditure, Oxygen consumption, Electromyography, Muscle fatigue, Incline gait biomechanics, Ground reaction forces, Required coefficient of friction
Supplementary bibliographical information Language English
ISSN 1650-9773 Publication 66 ISBN 978-91-7895-466-7 (Print) ISBN 978-91-7895-467-4 (Digital)
Number of pages:107 Price
I, the undersigned, being the copyright owner of the abstract of the above-mentioned dissertation, hereby grant to all reference sources permission to publish and disseminate the abstract of the above-mentioned dissertation.
Signature Date 2020-04-04
The Fight on the Flights Emergency evacuations – human physiological
performance, leg muscle activity and gait biomechanics during exhaustive stair and slope ascent
Amitava Halder
Faculty examiners Professor Ola Eiken, PhD, and Head of the Department of Environmental
Physiology, KTH Royal Institute of Technology, Sweden. Professor Christer Malm, PhD, Department of Community Medicine and
Rehabilitation, Sports Medicine Unit, Umeå University, Sweden. Senior Scientist Hilde Faerevik, PhD, Health Research, SINTEF Digital, Norway.
Deputy examiner Associate Professor Stefan Svensson, PhD, Advanced Training Section,
MSB College Revinge, The Swedish Civil Contingencies Agency, Sweden.
Supervisors Associate Professor Chuansi Gao, PhD, Division of Ergonomics and Aerosol
Technology, Department of Design Sciences, Faculty of Engineering, Lund University, Sweden.
Associate Professor Kalev Kuklane, PhD, Expert in Occupational Health and Safety, Institute for Safety (IFV), Zoetermeer, The Netherlands.
Senior Lecturer Michael Miller, PhD, Department of Health Sciences, Faculty of Medicine, Lund University, Sweden.
Cover photo © by Johan Norén and Tobias Lindman
Copyright (Excluding published papers) © Amitava Halder and Division of Ergonomics and Aerosol Technology, Lund University, Sweden
Paper I & III © Elsevier
Paper II © Taylor & Francis, Open Access
Paper IV © The authors (Springer Nature, Under review)
Paper V © The authors (Elsevier, Under review)
Division of Ergonomics and Aerosol Technology Department of Design Sciences Faculty of Engineering, Lund University SE- 223 62 Sweden
ISBN 978-91-7895-466-7 (Print) ISBN 978-91-7895-467-4 (Digital) ISSN 1650-9773 Publication 66
Printed in Sweden by Media-Tryck, Lund University, Lund 2020
“Physical performance is infinite and interminable, if it comes from an invincible psychological will”
- Myself, inspired by Mahatma Gandhi
Dedicated to my family
Table of Contents
Abstract ................................................................................................................. 09 Popular science summary .................................................................................... 11 Populärvetenskaplig sammanfattning ................................................................ 13
Appended peer-reviewed journal papers ................................................. 15 The author's contributions to the papers ................................................. 15 Overview of the appended journal papers .............................................. 16 Relevant publications ................................................................................. 17
Peer-reviewed journal papers as the main author .................................... 17 Peer-reviewed journal papers as a co-author ........................................... 17 Conference contributions as the main author .......................................... 17 Conference contributions as a co-author ................................................. 18
List of author's other publications ............................................................ 19 Peer-reviewed journal papers as a co-author ........................................... 19 Project reports ......................................................................................... 19 Conference contributions as the main author .......................................... 20 Conference contributions as a co-author ................................................. 20
List of figures .............................................................................................. 22 List of tables ................................................................................................ 22 Abbreviations and acronyms..................................................................... 23 Schematic flow chart of the studies in the research ................................ 25 Highlights of the findings ........................................................................... 26
1 Introduction ....................................................................................................... 27 1.1 Physiological capacities and limitations ............................................. 28
1.1.1 Aerobic (endurance) and anaerobic (fast) capacity ........................ 28 1.1.2 Maximal oxygen uptake: V̇O2max and V̇O2highest ............................. 29 1.1.3 Heart rate (HR) relationship to workload and energy demand ..... .31 1.1.4 Oxygen uptake (V̇O2) relationship to muscle activities at various workloads ............................................................................................... 31 1.1.5 Cardiac output and stroke volume .................................................. 33 1.1.6 Muscle activity and electromyography (EMG) ............................. 34
1.2 Current knowledge on stair ascending capacity and EMG .............. 35
1.3 Inclined walking gait biomechanics and fatigue ................................ 36 1.4 Rationale of the studies ........................................................................ 37
1.4.1 Evacuation in ascending stairways ................................................. 37 1.4.2 Self-preferred versus machine-controlled mode of stair ascents .... 38 1.4.3 Inclined walking gait biomechanics ............................................... 39
1.5 Aims, research questions, hypotheses and objectives ....................... 41 1.5.1 Overall aim ..................................................................................... 41 1.5.1 Hypotheses ..................................................................................... 42 1.5.1 Specific objectives ......................................................................... 42
2 Study design and methods ................................................................................ 43 2.1 Ethical considerations .......................................................................... 43 2.2 Participants ........................................................................................... 43
2.2.1 Field studies at the self-preferred pace.. ......................................... 44 2.2.2 Laboratory studies at the machine-controlled pace.... .................... 45
2.3 Instrumentations and subject preparation ........................................ 45 2.3.1 Heart rate (HR) and oxygen uptake (V̇O2) .. ................................. .45 2.3.2 Electromyography (EMG) ............................................................ .46 2.3.3 Buildings and characteristics of stairways ..................................... 48 2.3.4 Stair machine characteristics .......................................................... 50 2.3.5 Walkway and force plate ................................................................ 50 2.3.6 Motion capture (MoCap) system and markers ............................... 50 2.3.7 Other instruments for measurements.............................................. 51
2.4 Study procedures .................................................................................. 51 2.4.1 Self-preferred pace ascents in the field .......................................... 51 2.4.2 Machine-controlled pace ascents in the laboratory.... .................... 52 2.4.3 Physiological evacuation model ..................................................... 54 2.4.4 Walking gait trials up a 10° inclined walkway .............................. 54
2.5 Data analysis ......................................................................................... 55 2.5.1 EMG data processing and normalization ....................................... 55 2.5.2 Calculations and statistics .............................................................. 56
2.6 Muscle activity interpretation model .................................................. 57 2.6.1 Muscle activity rate change (MARC) ........................................... 57 2.6.2 Muscle activity interpretation squares (MAIS) model .................. 58
3 Results ................................................................................................................ 60 3.1 Maximum oxygen uptake (V̇O2max) and heart rate (HRmax) ............. 60 3.2 Stair ascending cardiorespiratory capacities at self-preferred versus machine-controlled pace mode .................................................................. 60 3.3 Oxygen uptake (V̇O2) during stair ascent .......................................... 62 3.4 Leg muscles electromyography (EMG) during stair ascent ............. 64
3.4.1 EMG amplitudes (AMPs) and ascending speeds ........................... 64 3.4.2 EMG median frequencies (MDFs) and ascending speeds.............. 65 3.4.3 Leg muscle activity rate change (MARC) in muscle activity interpretation squares (MAIS)................................................................. 67
3.5 Post-exhaustion walking gait biomechanics up a 10° incline ........... 72 3.5.1. Leg muscles EMG amplitudes (AMPs) and median frequencies (MDFs) .................................................................................................... 72 3.5.2. Stance phase (SP) duration, ground reaction forces (GRFs) and required co-efficient of friction (RCOF) ................................................. 72 3.5.3. Leg joint angles, angular velocities and accelerations .................. 73
4 Discussion .......................................................................................................... 75 4.1 Stair ascending duration (AD), vertical height and step rate (SR) .. 75 4.2 Cardiorespiratory capacities and limitations during stair ascent ... 77
4.2.1. Oxygen uptake (V̇O2) and heart rate (HR) .................................... 77 4.2.2. Metabolic rate (M) ........................................................................ 79
4.3 Performance and limitations of leg muscles during stair ascent ...... 79 4.3.1. EMG amplitudes (AMPs) and median frequencies (MDFs) ......... 79 4.3.2. Muscle activity rate change (MARC) in muscle activity interpretation squares (MAIS)................................................................. 81
4.4 Oxygen uptake (V̇O2) and leg muscles activity during stair ascent at self-preferred and controlled pace modes ................................................ 82 4.5 Overall comparisons between self-preferred and machine-controlled ascents.......................................................................................................... 83 4.6 Post-exhaustion walking gait biomechanics up a 10° incline ........... 86
4.6.1 Effects of exhaustion on leg muscles amplitudes (AMPs) and median frequencies (MDFs) .................................................................... 86 4.6.2 Effects of exhaustion on stance phase (SP) duration, ground reaction forces (GRFs) and required co-efficient of friction (RCOF) ..... 87 4.6.3 Effects of exhaustion on leg joint angles, angular velocities and accelerations ............................................................................................ 88
4.7 Study limitations and future perspectives .......................................... 89
5 Conclusions ........................................................................................................ 91 Practical implications and societal relevance ..................................................... 93 Acknowledgements ............................................................................................... 95 References ............................................................................................................. 97
Appendices: Papers I - V ................................................................................... 109
9
Abstract
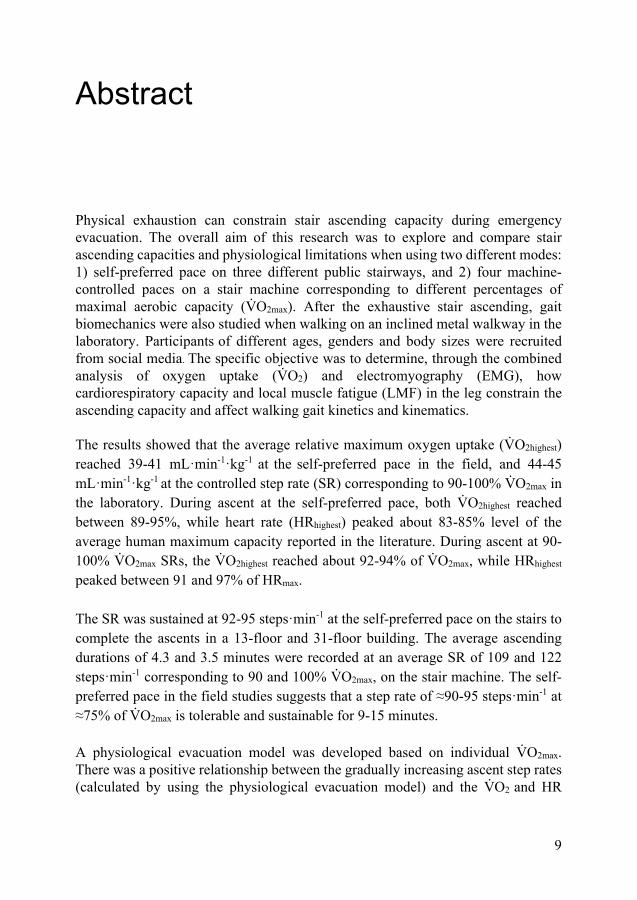
Physical exhaustion can constrain stair ascending capacity during emergency evacuation. The overall aim of this research was to explore and compare stair ascending capacities and physiological limitations when using two different modes: 1) self-preferred pace on three different public stairways, and 2) four machine-controlled paces on a stair machine corresponding to different percentages ofmaximal aerobic capacity (V̇O2max). After the exhaustive stair ascending, gaitbiomechanics were also studied when walking on an inclined metal walkway in thelaboratory. Participants of different ages, genders and body sizes were recruitedfrom social media. The specific objective was to determine, through the combinedanalysis of oxygen uptake (V̇O2) and electromyography (EMG), howcardiorespiratory capacity and local muscle fatigue (LMF) in the leg constrain theascending capacity and affect walking gait kinetics and kinematics.
The results showed that the average relative maximum oxygen uptake (V̇O2highest) reached 39-41 mL·min-1·kg-1 at the self-preferred pace in the field, and 44-45 mL·min-1·kg-1 at the controlled step rate (SR) corresponding to 90-100% V̇O2max in the laboratory. During ascent at the self-preferred pace, both V̇O2highest reached between 89-95%, while heart rate (HRhighest) peaked about 83-85% level of the average human maximum capacity reported in the literature. During ascent at 90-100% V̇O2max SRs, the V̇O2highest reached about 92-94% of V̇O2max, while HRhighest peaked between 91 and 97% of HRmax.
The SR was sustained at 92-95 steps·min-1 at the self-preferred pace on the stairs to complete the ascents in a 13-floor and 31-floor building. The average ascending durations of 4.3 and 3.5 minutes were recorded at an average SR of 109 and 122 steps·min-1 corresponding to 90 and 100% V̇O2max, on the stair machine. The self-preferred pace in the field studies suggests that a step rate of ≈90-95 steps·min-1 at ≈75% of V̇O2max is tolerable and sustainable for 9-15 minutes.
A physiological evacuation model was developed based on individual V̇O2max. There was a positive relationship between the gradually increasing ascent step rates (calculated by using the physiological evacuation model) and the V̇O2 and HR
10
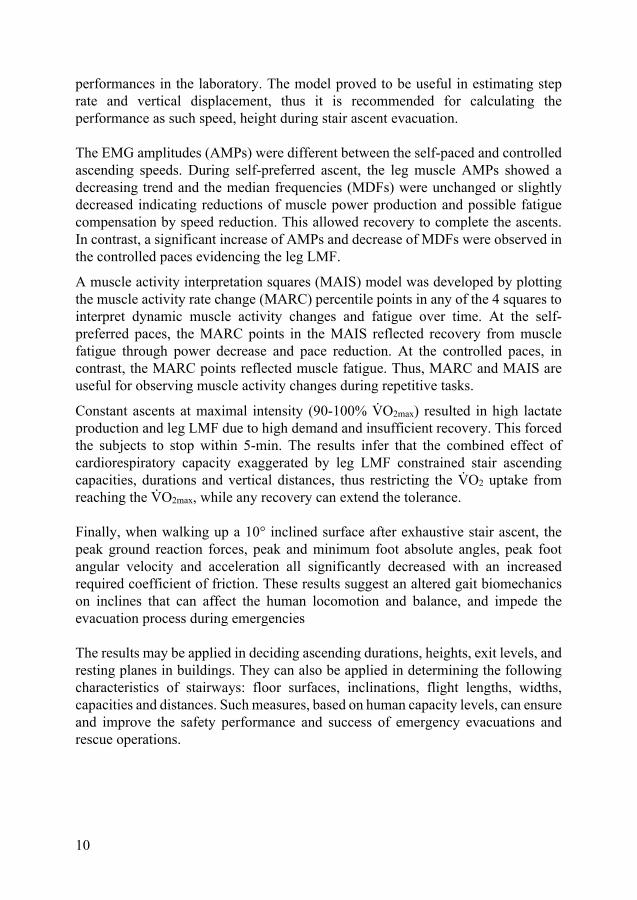
performances in the laboratory. The model proved to be useful in estimating step rate and vertical displacement, thus it is recommended for calculating the performance as such speed, height during stair ascent evacuation. The EMG amplitudes (AMPs) were different between the self-paced and controlled ascending speeds. During self-preferred ascent, the leg muscle AMPs showed a decreasing trend and the median frequencies (MDFs) were unchanged or slightly decreased indicating reductions of muscle power production and possible fatigue compensation by speed reduction. This allowed recovery to complete the ascents. In contrast, a significant increase of AMPs and decrease of MDFs were observed in the controlled paces evidencing the leg LMF.
A muscle activity interpretation squares (MAIS) model was developed by plotting the muscle activity rate change (MARC) percentile points in any of the 4 squares to interpret dynamic muscle activity changes and fatigue over time. At the self-preferred paces, the MARC points in the MAIS reflected recovery from muscle fatigue through power decrease and pace reduction. At the controlled paces, in contrast, the MARC points reflected muscle fatigue. Thus, MARC and MAIS are useful for observing muscle activity changes during repetitive tasks.
Constant ascents at maximal intensity (90-100% V̇O2max) resulted in high lactate production and leg LMF due to high demand and insufficient recovery. This forced the subjects to stop within 5-min. The results infer that the combined effect of cardiorespiratory capacity exaggerated by leg LMF constrained stair ascending capacities, durations and vertical distances, thus restricting the V̇O2 uptake from reaching the V̇O2max, while any recovery can extend the tolerance. Finally, when walking up a 10° inclined surface after exhaustive stair ascent, the peak ground reaction forces, peak and minimum foot absolute angles, peak foot angular velocity and acceleration all significantly decreased with an increased required coefficient of friction. These results suggest an altered gait biomechanics on inclines that can affect the human locomotion and balance, and impede the evacuation process during emergencies The results may be applied in deciding ascending durations, heights, exit levels, and resting planes in buildings. They can also be applied in determining the following characteristics of stairways: floor surfaces, inclinations, flight lengths, widths, capacities and distances. Such measures, based on human capacity levels, can ensure and improve the safety performance and success of emergency evacuations and rescue operations.
11
Popular science summary
You may have heard of the 2017 terror attack at a St. Petersburg subway station in Russia that killed 14 people and injured 51. Can you imagine and how would you act in such a situation? Stair climbing upwards is the only means of evacuation in cases of restricted access to the lower levels of different structures. Following the current trend of building deep structures for mass transportation, Sweden is in the process of building one of the deepest, a 100 meter deep subway station in Stockholm. Are we physically and mentally prepared, and fit to climb a long flight of stairs in the case of a rapid evacuation during a fire or terror attack? Have you ever considered that physical exhaustion can constrain your climbing duration and distance during such emergencies? Do you usually take the stairs in your daily life? The answers to these questions are mostly “no”. The pounding heartbeat we feel after ascending just a few flights of stairs indicates that this is a highly demanding activity against gravity and can cause fatigue very quickly.
A unique research project was started in 2014 at Lund University. The project has been funded by the Swedish Fire Research Board (Brandforsk) and the Swedish Transport Administration (Trafikverket). It has examined stair climbing energy expenditure, endurance, behavior and physical limitations, as well as the capacities required during evacuation simulations in buildings of different heights and in laboratory experiments. The field studies were performed on three different public stairways: a 13-floor and a 31-floor building, and a 33 meter deep subway escalator. The participants were able to control their climbing by using their own self-preferred pace. In the laboratory, the test persons climbed on a stair machine at four different step rates corresponding to 60, 75, 90 and 100% of their maximal physical capacity.
The higher oxygen consumption (V̇O2) was required during stair climbing on a machine in the laboratory at 90-100% maximum step rates (44-45 mL·min-1·kg-1) compare to the climbing at self-preferred pace (39-41 mL·min-1·kg-1) in the buildings. The highest heart rate (HR) reached 174-185 b·min-1 during climbing at maximum pace and 162-174 b·min-1 at the buildings’ self-preferred pace. These oxygen consumption and HR results showed a difference between the field and laboratory studies regarding an all-out related maximum effort required during emergencies. These recorded climbing capacities in the field reached 89 to 95% of humans’ maximal physical capacity level, while HR peaked at 83 to 89% of maximal capacity. The participants’ pace decreased over time in the buildings. This
12
was necessary to achieve a tolerable step rate that prevented leg fatigue and delayed exhaustion. The step rate was about 92-103 steps·min-1 when all the participants reached the top of the buildings and subway escalator. In contrast, the participants’ V̇O2 in the laboratory reached on average 92 and 94% of their maximum capacities, and the HR reached 91 and 97% of their maximum HR levels at fixed maximum paces on the stair machine. The participants’ mean step rate was 109 and 122 steps·min-1, and they could reach a vertical height of about 86-95 m, which is equivalent to a 30-floor long building.
The leg muscle electrical activity results showed that fatigue developed in the legs within 1-2 minutes. This significantly contributed to exhaustion and the participants stopped climbing within 4.3 minutes at 90% of their individual capacity speed and 3.5 minutes at 100%. The durations were shorter than the time expected by the subjects. Leg muscle fatigue constrained the subjects’ cardiorespiratory capacity. Walking locomotion and balance can be hampered due to leg fatigue. Higher friction is required to reduce the risks of fall accidents on inclines after exhaustive stair ascents. This can impair evacuation performance. A high step rate is expected during panic, fight-or-flight response situations. One’s ability to sustain a maximum climbing pace is limited between 2 and 6 minutes even in the self-paced condition. However, a step rate of ≈90-95 steps·min-1 at ≈75% of maximal physical capacity can be maintained for 9-15 minutes to reach a 100 meter height.
Awareness and preparedness: These stairclimbing capacity results give us information about the mass fitness level that is necessary to manage sudden and unexpected physically challenging and survival situations. This knowledge contributes to society’s preparedness and can increases the awareness of people to exercise regularly in order to have the physical fitness necessary to avoid fatal accidents. Local authorities, first responders and fire fighters can be prepared well in advance to meet the demands of their occupations. Fire engineers, designers and architects can reorganize building plans, design better evacuation facilities including number of exit routes, levels, friction requirements, landings, length of flights, inclinations for accident free walking.
Better than nothing: Short and intermittent bouts of exercise that are beneficial to health and fitness throughout the day have not been identified. Energy burns at a very high rate of 0.72-0.86 calorie·min-1·cm-2 within 5-12 minutes of stair climbing. Taking the stairs regularly instead of the elevator is cost effective and is the least amount of exercise we need to stay fit in everyday life. A climbing dose of 18-20 (5x4) floors or more would be good daily exercise for office workers to maintain fitness, prevent obesity and reduce sedentary work-related problems in modern societies. In conclusion, the habit of stair climbing can be a remedy for reducing age related work inefficiencies and maintaining cardiovascular fitness, thus ensuring a long healthy life with smooth performance of activities of daily living.
13
Populärvetenskaplig sammanfattning
Du kanske har hört talas om terrorattacken 2017 på en tunnelbanestation i S:t Petersburg i Ryssland som dödade 14 personer och skadade 51. Kan du föreställa dig och hur skulle du agera i en sådan situation? Trappklättring uppåt är det enda sättet att evakuera när det är begränsad tillgång till de lägre nivåerna i till exempel tunnelbanestrukturer. Efter den nuvarande trenden med att bygga djupa strukturer för masstransporter håller Sverige på att bygga en av de djupaste, en 100 meter djup tunnelbanestation i Stockholm. Är vi fysiskt och mentalt förberedda att klättra i en lång trappa i de händelser där vi behöver göra en snabb evakuering, som vid en brand eller terrorattack? Har du någonsin tänkt på att fysisk utmattning kan försvåra klättringen under sådana nödsituationer? Tar du vanligtvis trapporna i ditt dagliga liv? Svaren på dessa frågor är oftast "nej". De dunkande hjärtslagen vi känner efter att vi klättrat upp i några trappor indikerar att det är en mycket krävande aktivitet mot tyngdkraften och kan orsaka utmattning och trötthet mycket snabbt.
Ett unikt forskningsprojekt påbörjades 2014 vid Lunds universitet med finansiering från Brandforsk och Trafikverket. Projektet har undersökt trappklättring kopplat till energiförbrukning, uthållighet, beteende och fysiska begränsningar, samt kapaciteten som krävs under evakueringssimuleringar i byggnader med olika höjder och i laboratorieexperiment. Fältstudierna utfördes på tre olika offentliga trappor: i en byggnad med 13, en med 31 våningar och en 33 meter djup rulltrappa. Deltagarna styrde sin egen klättring genom att använda sin egen valda takt. I laboratoriet klättrade testpersonerna på en trappmaskin med fyra olika steghastigheter motsvarande 60, 75, 90 och 100% av deras maximala fysiska kapacitet.
Den högre syreförbrukningen (V̇O2) nådde under trappklättring på en maskin i laboratoriet i 90-100% maximala steghastigheter (44-45 ml·min-1·kg-1) jämfört med klättringen i den självvalda takten (39-41 ml·min-1·kg-1) i byggnaderna. Den högsta hjärtfrekvensen (HR) nådde 174-185 b·min-1 under klättring i maximal takt på stegmaskinen och 162-174 b·min-1 i byggnaderna med självvald takt. Syreförbrukning och HR-resultat visade en skillnad mellan fält- och laboratoriestudier angående en ”all-out” relaterad maximalansträngning som krävs under nödsituationer. Dessa registrerade klättringskapaciteter i fältstudierna nådde 89 till 95% av de medverkande människornas maximala fysiska kapacitetsnivå, medan HR toppade på 83 till 89% av den maximala kapaciteten. Deltagarnas takt
14
minskade med tiden i byggnaderna. Detta var nödvändigt för att uppnå en acceptabel stegfrekvens som förhindrade bentrötthet och försenad utmattning. Stegfrekvensen var cirka 92-103 steg·min-1 när alla deltagare nådde toppen av byggnaderna och tunnelbanetrappan. Däremot nådde deltagarnas V̇O2 i laboratoriet i genomsnitt 92 och 94% av sin maximala kapacitet, och HR uppnådde 91 och 97% av sina maximala HR-nivåer vid fasta maximala steghastigheter på trappmaskinen. Deltagarnas medelsteghastighet var 109 och 122 steg·min-1, och de kunde nå en vertikal höjd på cirka 86-95 m, vilket motsvarar en byggnad på 30 våningar.
Resultaten av den elektriska aktiviteten i benmusklerna visade att trötthet utvecklades i benen inom 1-2 minuter. Detta bidrog avsevärt till utmattning och deltagarna slutade klättra inom 4,3 minuter med 90% av sin individuella kapacitetshastighet och 3,5 minuter vid 100%. Klättringstiderna var kortare än den tid som försökspersonerna förväntade sig. Benmuskeltrötthet begränsade försökspersonernas kardiorespiratoriska förmåga. Gång, rörelse och balans kan hämmas på grund av trötthet i benen. Högre friktion krävs för att minska risken för fallolyckor efter utmattande trappstigningar i lutning. Detta kan försämra evakueringsprestandan. En hög stegfrekvens förväntas under panik-, kamp- eller försvars situationer. Förmågan att upprätthålla en maximal klättringstakt är begränsad till mellan 2 och 6 minuter även i självvald hastighet. Emellertid kan en stegfrekvens av ≈90-95 steg·min-1 på ≈75% av maximal fysisk kapacitet bibehållas under 9-15 minuter för att nå en 100 meter höjd.
Medvetenhet och beredskap: Dessa trappklättringskapacitetsresultat ger oss information om den konditionsnivå som är nödvändig för att hantera plötsliga och oväntade fysiskt utmanande överlevnadssituationer. Denna kunskap bidrar till samhällets beredskap och kan öka medvetenheten hos människor att träna regelbundet för att ha den fysiska konditionen som krävs för att undvika dödsolyckor. Lokala myndigheter, blåljuspersonal och brandmän kan vara förberedda i god tid för att möta deras yrkeskrav. Brandtekniker, designers och arkitekter kan omorganisera byggnadsplaner, designa bättre evakueringsanläggningar inklusive antal utgångsvägar, nivåer, friktionskrav, landningar samt längd och lutning på trappor för att undvika gång- och halkolyckor.
Bättre än ingenting: Korta och intermittenta träningspass som är gynnsamma för hälsa och kondition under dagen har inte identifierats. Energi bränns med en mycket hög hastighet på 0,72-0,86 kalori · min-1·cm-2 inom 5-12 minuter efter trappklättring. Att ta trapporna regelbundet istället för hissen är kostnadseffektivt och är den minsta mängden träning vi behöver för att hålla oss i form i vardagen. En klättringsdos på 18-20 (5x4) våningar eller mer skulle vara bra daglig träning för kontorsarbetare att upprätthålla konditionen, förhindra fetma och minska stillasittande arbetsrelaterade problem i moderna samhällen. Sammanfattningsvis kan trappklättring vara ett botemedel för att minska åldersrelaterade problem och upprätthålla kondition i hjärt- och kärlsystemet, och därmed säkerställa ett långt hälsosamt liv.
15
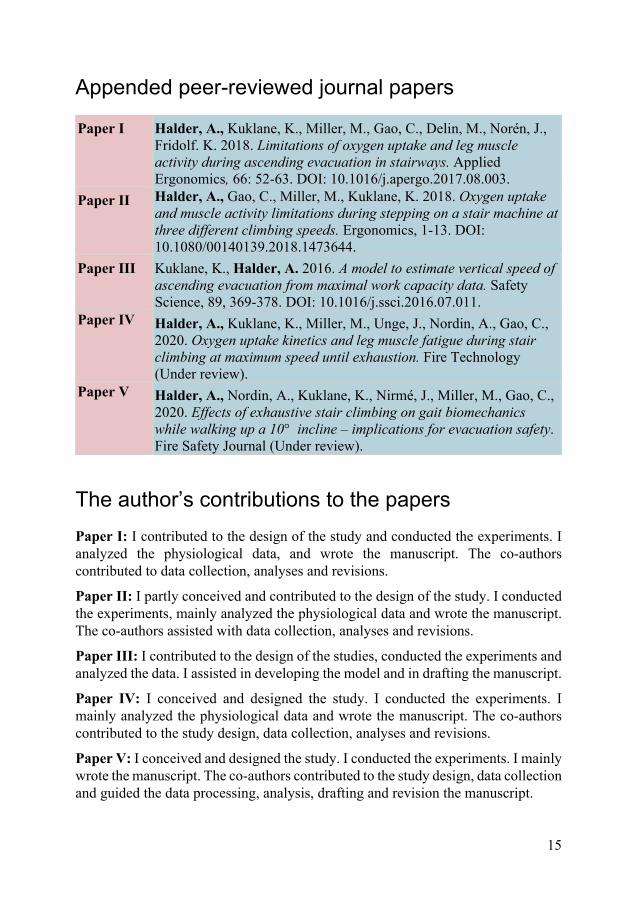
Appended peer-reviewed journal papers
Paper I Halder, A., Kuklane, K., Miller, M., Gao, C., Delin, M., Norén, J., Fridolf. K. 2018. Limitations of oxygen uptake and leg muscle activity during ascending evacuation in stairways. Applied Ergonomics, 66: 52-63. DOI: 10.1016/j.apergo.2017.08.003.
Paper II Halder, A., Gao, C., Miller, M., Kuklane, K. 2018. Oxygen uptake and muscle activity limitations during stepping on a stair machine at three different climbing speeds. Ergonomics, 1-13. DOI: 10.1080/00140139.2018.1473644.
Paper III Kuklane, K., Halder, A. 2016. A model to estimate vertical speed of ascending evacuation from maximal work capacity data. Safety Science, 89, 369-378. DOI: 10.1016/j.ssci.2016.07.011.
Paper IV
Halder, A., Kuklane, K., Miller, M., Unge, J., Nordin, A., Gao, C., 2020. Oxygen uptake kinetics and leg muscle fatigue during stair climbing at maximum speed until exhaustion. Fire Technology (Under review).
Paper V
Halder, A., Nordin, A., Kuklane, K., Nirmé, J., Miller, M., Gao, C., 2020. Effects of exhaustive stair climbing on gait biomechanics while walking up a 10° incline – implications for evacuation safety. Fire Safety Journal (Under review).
The author’s contributions to the papers Paper I: I contributed to the design of the study and conducted the experiments. I analyzed the physiological data, and wrote the manuscript. The co-authors contributed to data collection, analyses and revisions.
Paper II: I partly conceived and contributed to the design of the study. I conducted the experiments, mainly analyzed the physiological data and wrote the manuscript. The co-authors assisted with data collection, analyses and revisions.
Paper III: I contributed to the design of the studies, conducted the experiments and analyzed the data. I assisted in developing the model and in drafting the manuscript.
Paper IV: I conceived and designed the study. I conducted the experiments. I mainly analyzed the physiological data and wrote the manuscript. The co-authors contributed to the study design, data collection, analyses and revisions.
Paper V: I conceived and designed the study. I conducted the experiments. I mainly wrote the manuscript. The co-authors contributed to the study design, data collection and guided the data processing, analysis, drafting and revision the manuscript.
16
Overview of the appended journal papers
This thesis is part of the project “Ascending evacuation in long stairways: Physical exertion, walking speed and behaviour” related to fire engineering and human evacuation behaviour (Ronchi et al., 2015). The thesis focuses on stair ascending capacity and limitations by measuring and analyzing physiological parameters especially oxygen uptake (V̇O2), heart rate (HR), and the major leg muscles’ electromyographic (EMG) activities. This was done in order to determine and compare human stair ascending capacities and physiological constraints between self-paced ascents in the field and machine-controlled ascents in the laboratory.
This thesis contains five peer-reviewed papers. Three of them are published and other two are currently under review in international journals (Appendices).
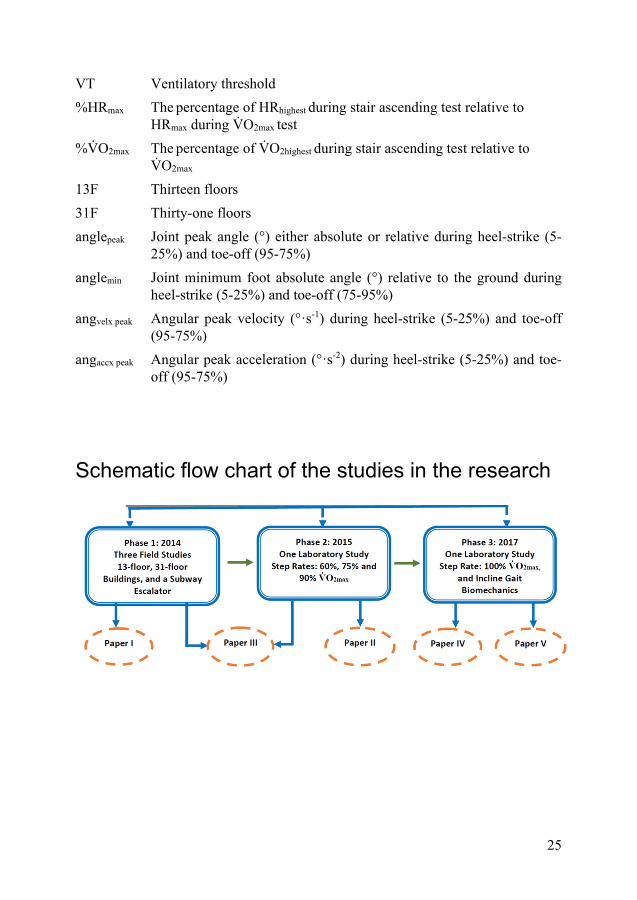
Paper I describes the human stair ascending physiological capacities, including cardiorespiratory and leg muscle performance, and their limitations from three field studies on a 13-floor (13F) building, a 31-floor (13F) building, and one stationary subway escalator (SE). The results of human ascending endurance and cardiorespiratory performance from three field tests, and the use of a database with wide range of participants (Loe et al., 2013) with human physiological capacity information enabled the development of a model of stair ascending evacuation in Paper III. The physiological evacuation model is related to the maximal physical capacity of healthy individuals. The step rate (SR) can be predicted based on the “Physiological evacuation model” that is given in Paper III and has been included in Methods section of this thesis. The SR equation was updated after phase 2 in the laboratory study at three different speeds corresponding to 60, 75 and 90% of maximal aerobic capacity (V̇O2max) on the stair machine in Paper II. Thus, the new equation was used for SR determination in the phase 3 of the research in the laboratory for predicting the SR corresponding to 100% of V̇O2max in Paper IV.
Paper IV investigated the stair ascending physiological capacities and limitations at the individual maximum speed corresponding to 100% V̇O2max until exhaustion.
A novel muscle activity interpretation squares (MAIS) model was developed during the phase 1 of the research in the field to evaluate muscle activity and the onset of leg fatigue over time (Paper I). This model has been also used during the research phases 2 and 3 in the laboratory studies for validation (Papers II and IV).
Finally, Paper V explored the stance phase leg muscle activity and walking gait biomechanics including kinetics and kinematics on a 10° inclined walkway in order to identify any possible risks of walking balance and related accidents due to exhaustion and fatigue.
17
Relevant publications
Peer-reviewed journal papers as the main author
Halder, A., Nordin, A., Kuklane, K., Nirmé, J., Miller, M., Gao, C., 2020. Effects of exhaustion and fatigue on gait biomechanics while walking down a 10° incline – implications for accidents during evacuation. (To be submitted).
Halder, A., Gao C., Miller M., 2014. Effects of cooling on ankle muscle strength, gait ground reaction forces and electromyography. Journal of Sports Medicine, DOI:10.1155/2014/520124.
Halder, A., Gao, C., 2014. Muscle cooling and performance: A review. European Journal of Sport Medicine, 2(1), 39-48.
Peer-reviewed journal papers as a co-author
Delin, M., Norén, J., Ronchi, E., Kuklane, K., Halder, A., Fridolf, K., 2016. Ascending stair evacuation: walking speed as a function of height. Fire and Materials, DOI: 10.1002/fam.2410. Velasco, A., Halder, A., Kuklane, K., Ronchi, E., 2020. The impact of carrying load on physical performance during ascending movement. Fire and Materials (In press). Svensson, I., Gao, C., Halder, A., Gard, G., Magnusson, M., 2018. Standing balance on inclined surfaces with different friction. Industrial Health. doi: 10.2486/indhealth.2018-0005.
Conference contributions as the main author
Halder, A., Nordin, A., Miller, M., Kuklane, K., Nirme, J., Gao, C., 2020. Effects of stair climbing until exhaustion on gait kinetics, kinematics and leg muscle activity on a 10° gradient upward slope. The 23rd Congress of the International Society of Electrophysiological Kinesiology (ISEK), Nagoya, Japan.
Halder, A., Swärd, J., Kuklane, K., Jakobsson A., Miller, M., Unge, j., Kim, S., Gao, C., 2018. Muscle electrical activity changes over time during stair ascending until exhaustion. The 22nd Congress of the International Society of Electrophysiological Kinesiology (ISEK), Dublin, Ireland.
18
Halder, A., Miller, M., Gao, C., Kuklane, K., 2017. Dynamic work induced muscle activity rate change (MARC) and fatigue evaluation in muscle activity interpretation squares (MAIS). Annual conference of Nordic Ergonomic Society (NES), Lund, Sweden, 77-78.
Halder, A., Kuklane, K., 2016. Estimation of vertical displacement during ascending evacuation. Proceedings of the Pedestrian and Evacuation Dynamics (PED), Hefei, China, 145-150.
Halder, A., Kuklane, K., Miller, M., Gao, C., Noren, J., Delin, M., Kownacki, K-L., Fridolf, K., 2015. Energy costs and leg muscle activities in ascending stairs. The 20th Annual European Congress of Sports Science, Malmö, Sweden.
Halder, A., Gao C., Miller M., 2015. Effects of cooling on muscle function and duration of stance phase during gait. The 16th International Conference on Environmental Ergonomics (ICEE). Portsmouth, United Kingdom, 4(Suppl 1):A47. DOI: 10.1186/2046-7648-4-S1-A47.
Conference contributions as a co-author
Arias, S., Ronchi, E., Norén, J., Delin, M., Kuklane, K., Halder, A., Fridolf, K., 2016. An experiment on ascending evacuation on a long, stationary escalator. The 14th International Conference and Exhibition on Fire Science and Engineering (Interflam), Windsor, United Kingdom.
Gao, C., Halder, A., Svensson, I., Gard, G., Nikoleris, G., Andersson, P-E., Magnusson, M., 2014. Using a walkway with adjustable inclination to measure and assess slip and fall risks. International Conference on Achieving Sustainable Construction Health and Safety (CIB W099), Lund, Sweden, 118-124.
Delin, M., Norén, J., Fridolf, K., Kuklane, K., Halder, A., Kownacki, K-L., Månsson, S., 2015. Ascending evacuation – Walking speed in stairs as a function of height. The 6th International Human Behaviour in Fire Symposium, Interscience Communications, Cambridge, United Kingdom, 155-160.
Norén, J., Delin, M., Fridolf, K., Kuklane, K., Kownacki, K-L., Ronchi, E., Arias, S., Halder. A., 2015. Ascending stair evacuation – effects of fatigue, walking speed & human behavior. The 6th International Human Behaviour in Fire Symposium, Interscience Communications, Cambridge, United Kingdom, 161-172.
Velasco, A., Halder, A., Kuklane, K., Ronchi, E., 2019. Physical Exertion during Ascending Evacuation: The Impact of Carrying Load. The 15th International Conference and Exhibition on Fire Science and Engineering (Interflam), Windsor, United Kingdom.
19
List of author’s other publications
Peer-reviewed journal papers as a co-author Alametsä, J., Kuklane K., Smolander, J., Vanggaard, L., Halder, A., Kownacki, K-L., Gao, C., Viik, J., 2015. Age‐related circulatory responses to whole body cooling: observations by heart rate variability. Finnish Journal of eHealth and eWelfare, 7(2-3):57-64.
Gao, C., Lin Li-Yen, Halder, A., Kuklane, K., Holmér, I., 2015. Validation of ASTM F2732 and comparison with ISO 11079 with respect to comfort temperature ratings for cold protective clothing. Applied Ergonomics, DOI: 10.1016/j.apergo.2014.07.002.
Smallcombe, J., Hodder, S., Loveday, D., Kuklane, K., Halder, A., Petersson, J., Młynarczyk, M., Kozłowska, M., Havenith, G., 2020. Updated Database of Clothing Thermal Insulation and Vapor Permeability Values of Western Ensembles for Use in ASHRAE Standard 55, ISO 7730 and ISO 9920; ASHRAE RP-1760. ASHRAE Transactions. (Submitted).
Kownacki, K-L., Gao, C., Halder, A., Petersson, J., Pedersen, E., 2019. Indoor thermal comfort evaluation before and after a renovation. (To be submitted).
Project reports Ronchi, E., Norén, J., Delin, M., Kuklane, K., Halder, A., Arias, S., Fridolf, K., 2015. Ascending evacuation in long stairways: Physical exertion, walking speed and behaviour (TVBB-3192; Vol. 3192). Department of Fire Safety Engineering and Systems Safety, Lund University.
Gao C., Svensson I., Gard G., Halder A., and Magnusson M., 2013. Halk- och fallolyckor, friktionskrav och balansförmåga. Final Project Report to AFA Försäkring.
Kuklane, K., Gao, C., Kownacki, K L., Halder, A., Östberg, M., Skintemo, L., Åström, M., 2015. Evaluation of BARRIER® EasyWarm on Healthy Volunteers in Three Different Climates and Verification of the Degree of Correlation Between Tests Performed on Healthy Volunteers and in a standardized bench test. Clinical Investigation Report; Vol. PD-478190 Rev: 00). Mölnlycke Health Care, Gothenburg, Sweden.
Smallcombe, J., Hodder, S., Loveday, D., Kuklane, K., Halder, A., Petersson, J., Młynarczyk, M., Kozłowska, M., Havenith, G., 2019. Update of clothing database for existing and new Western clothing ensembles, including effects of posture, body and air movement. Report on manikin measurements for ASHRAE 1760-TRP.
20
Conference contributions as the main author
Halder, A., Kuklane, K., Petersson, J., Sajatovic, HA., Gao, C., 2019. Predicted Heat Strain (PHS) model predicts the evaporative water loss well in an extremely hot climate. The 19th International Conference on Environmental Ergonomics (ICEE), Amsterdam, The Netherlands.
Halder, A., Kuklane, K., Petersson, J., Gao, C., Havenith, G., 2019. Comparison of different clothing area factor (Fcl) calculations based on picture analysis in Adobe Photoshop. The 19th International Conference on Environmental Ergonomics (ICEE), Amsterdam, The Netherlands.
Halder, A., Gao C., Miller M., 2013. Effects of cooling on ankle muscle maximum performances, gait ground reaction forces and electromyography (EMG). The 15th International Conference on Environmental Ergonomics (ICEE), Queensland, New Zealand, 188-191.
Conference contributions as a co-author
Alametsä, J., Kuklane K., Smolander, J., Vanggaard, L., Halder, A., Kownacki, K-L., Gao, C., Viik, J., 2014. Age‐related circulatory responses to whole body cooling: observations by heart rate variability. Tampere University of Technology, Tampere, Finland.
Gao, C., Lin, L-Y., Halder, A., Kuklane, K., Jou, G-T., 2017. Thermophysiological responses of exercising in body mapping T-shirts in a warm and humid environment: subject test and predicted heat strain. The 17th International Conference on Environmental Ergonomics (ICEE). Kobe, Japan, 182.
Gao, C., Halder, A., Kuklane, K., Lin, L-Y., 2016. Whole body heat balance and local insulation required to prevent extremity cooling in extremely cold environments. The 6th International Conference on the Physiology and Pharmacology of Temperature Regulation, Slovenia, 165.
Gao, C., Lin, L-Y., Halder, A., Kuklane, K., 2015. Cold-induced vasodilation during continuous exercise in the extreme cold air (-30.6 °c). The 16th International Conference on Environmental Ergonomics (ICEE). Portsmouth, United Kingdom, 4(Suppl 1):A58. DOI:10.1186/2046-7648-4-S1-A58.
Kownacki, K-L., Halder, A., Kuklane K., Petersson, J., Wierzbicka A., Pedersen E., Gao, C., 2019. Does a building renovation improve the indoor thermal comfort? – A thermal environment evaluation before and after renovation. ISES-ISIAQmeeting, Lithuania.
21
Kownacki, K-L., Kuklane K., Jakobsson, K., Gao, C., Dal, M., Granér, S., Linninge, C., Dahlqvist, C., Halder, A., 2015. What is the role of traditional fermented foods to prevent heat stress at work? The 31st International Conference on Occupational Health (ICOH), Seoul, Korea.
Kuklane, K., Vanggaard, L., Smolander, J., Halder, A., Kownacki, K-L., Gao, C., Viik, J., Alametsä, J., 2015. Response patterns in finger and central body skin temperatures under mild whole body cooling in an elderly and in a young male - a pre-study. The 16th International Conference on Environmental Ergonomics (ICEE). Portsmouth, United Kingdom, 4(Suppl 1):A32. DOI:10.1186/2046-7648-4-S1-A32.
Kuklane, K., Butt, M.S., Halder, A., Gao, C., 2015. The colder is warmer? A pre-study for wear trials of a reference clothing ensemble for EN 342 and EN 14058 for thermal manikin calibration. The 16th International Conference on Environmental Ergonomics (ICEE). Portsmouth, United Kingdom, 4(Suppl 1): A161. DOI:10.1186/2046-7648-4-S1-A161.
Kuklane K., Halder, A., Kownacki, K-L., Gao, C., Östberg, M., Skintemo, L., Grou, A., Törnqvist, J., Ganlöv, K., Åström, M. 2016. Evaluation of BARRIER® EasyWarm on healthy volunteers in three different climates. The 7th European Conference on Protective Clothing (ECPC) and NOKOBETEF 12, Izmir, Turkey, 53-55.
Kuklane, K., Dahlqvist, C., Kownacki, K-L., Lucas, R., Halder, A., Gao, C., Hansson, G-Å. 2015. Assessment of workload in heat: an approach with accelerometers. The 31st International Conference on Occupational Health (ICOH), Seoul National University, Seoul, Korea, 62-67.
Lin, L-Y., Gao, C., Halder, A., Kuklane, K., Holmér, I. 2013. Validation of ASTM standard F2732 and comparison with ISO 11079 with respect to temperature ratings for cold weather protective clothing. The 15th International Conference on Environmental Ergonomics (ICEE), Queenstown, New Zealand, 219-220.
Petersson, J., Halder, A., Kownacki, K-L., Kuklane, K., Gao, C., 2019. Required clothing insulation (IREQ - ISO 11079) and difference of thermal sensations between genders. The 19th International Conference on Environmental Ergonomics (ICEE), Amsterdam, The Netherlands.
Vanggaard, L., Halder, A., Kuklane, K., 2015. The "AVA – organ". The 16th International Conference on Environmental Ergonomics (ICEE). Portsmouth, United Kingdom, 4(Suppl 1):A95. DOI:10.1186/2046-7648-4-S1-A95.
22
List of figures
Figure 1: Human lower limb musculature .............................................................. 47
Figure 2: Three field study settings and the components of stairways ................... 48
Figure 3: Stair ascents in five settings and one walking test on an inclined walkway ............................................................... 53
Figure 4: The Model of Muscle Activity Interpretation Squares (MAIS) .............. 58
Figure 5: Oxygen uptake (V̇O2) patterns over time .......................................... 62-63
Figure 6: Leg muscle EMG amplitude (AMP) changes over time ................... 64-65
Figure 7: Leg muscle EMG median frequency (MDF) changes over time ............ 66
Figure 8: Leg muscle activity interpretation in the MAIS model during stair ascent ................................................................. 68-71
Figure 9: Walking uphill gait GRFs, RCOF and foot absolute angle during stance phase (SP) on an incline ....................................................................................... ..74
List of tables
Table 1: Study participants ..................................................................................... 44
Table 2: Field studies in three buildings and the characteristics of stairways ........ 49
Table 3: Laboratory studies at four ascending intensities on the stair machine ..... 53
Table 4: Stair ascending capacity comparisons ...................................................... 61
Table 5: Walking uphill gait biomechanics during stance phase (SP) on an incline ................................................................... 73
23
Abbreviations and acronyms
AD Ascending duration AMP Electromyography amplitude, μV (% MVC) ATP Adenosine tri-phosphate BLa− Blood lactate (mmol·l-1) BSADu Body surface area (m-2), CP Critical power CPET Cardiopulmonary exercise testing EMG Electromyography FI Fatigue index GL Gastrocnemius lateralis GM Gastrocnemius medialis GRF Ground reaction force (N·kg-1) GRFzpeak Vertical peak force (N·kg-1) during heel-strike and toe-off of the time-
normalized stance phase period GRFypeak Longitudinal or antero-posterior shear peak force (N·kg-1) during heel-
strike and toe-off of the time-normalized stance phase period GTX Graded exercise testing HR Heart rate (b·min-1) HRmax Maximum heart rate reached during maximal aerobic capacity test
(b·min-1) HRhighest Maximum heart rate during stair ascending test (b·min-1) HRmean stable Average heart rate that had reached relatively stable state after the
initial growth (b·min-1) HS Heel-strike LMF Local muscle fatigue LT Lactate threshold M Metabolic rate MAIS Muscle activity interpretation squares MARC Muscle activity rate change MDF Electromyography median frequency (Hz)
24
MNF Electromyography mean frequency (Hz) MoCap Motion capture system MSD Musculoskeletal disorders MUAP Motor unit actions potentials MVC Maximum voluntary contractions Mmean Average metabolic rate (W·m-2) Mmean stable Average metabolic rate that had reached relatively stable state after
the initial growth (W·m-2) Mhighest Maximum metabolic rate during stair ascending test (W·m-2) RCOFpeak Peak required coefficient of friction during heel-strike (5-25%) and
toe-off (75-95%) of the time-normalized stance phase period RER Respiratory exchange ratio RF Rectus femoris RMS Root mean square RPE Rating of perceived exertion RQ Research question SE Stationary subway escalator SP Stance phase SR Step rate (steps·min-1) TO Toe-off V̇E Respiratory minute ventilation Vdisp Vertical displacement (m·min-1) Vheight reached Calculated vertical height reached (m) VL Vastus lateralis VM Vastus medialis V̇O2 Oxygen uptake (L·min-1, mL·min-1·kg-1) V̇O2highest Maximum oxygen uptake during stair ascending test (L·min-1,
mL·min-1·kg-1) V̇O2max Maximum oxygen uptake during maximal aerobic capacity test
(L·min-1, mL·min-1·kg-1) V̇O2mean stable Average of oxygen uptakes that has been reached relatively a stable
state after the initial increase (L·min-1, mL·min-1·kg-1)
25
VT Ventilatory threshold %HRmax The percentage of HRhighest during stair ascending test relative to
HRmax during V̇O2max test %V̇O2max The percentage of V̇O2highest during stair ascending test relative to
V̇O2max 13F Thirteen floors 31F Thirty-one floors anglepeak Joint peak angle (°) either absolute or relative during heel-strike (5-
25%) and toe-off (95-75%) anglemin Joint minimum foot absolute angle (°) relative to the ground during
heel-strike (5-25%) and toe-off (75-95%) angvelx peak Angular peak velocity (°·s-1) during heel-strike (5-25%) and toe-off
(95-75%) angaccx peak Angular peak acceleration (°·s-2) during heel-strike (5-25%) and toe-
off (95-75%)
Schematic flow chart of the studies in the research
26
Highlights of the findings
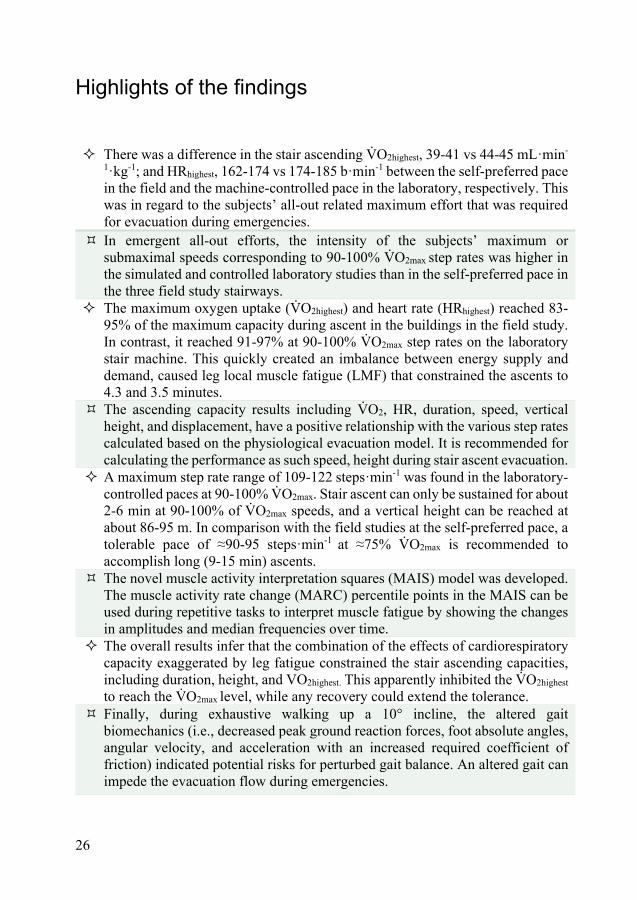
There was a difference in the stair ascending V̇O2highest, 39-41 vs 44-45 mL·min-
1·kg-1; and HRhighest, 162-174 vs 174-185 b·min-1 between the self-preferred pacein the field and the machine-controlled pace in the laboratory, respectively. Thiswas in regard to the subjects’ all-out related maximum effort that was requiredfor evacuation during emergencies.
In emergent all-out efforts, the intensity of the subjects’ maximum or submaximal speeds corresponding to 90-100% V̇O2max step rates was higher in the simulated and controlled laboratory studies than in the self-preferred pace in the three field study stairways.
The maximum oxygen uptake (V̇O2highest) and heart rate (HRhighest) reached 83-95% of the maximum capacity during ascent in the buildings in the field study.In contrast, it reached 91-97% at 90-100% V̇O2max step rates on the laboratorystair machine. This quickly created an imbalance between energy supply anddemand, caused leg local muscle fatigue (LMF) that constrained the ascents to4.3 and 3.5 minutes.
The ascending capacity results including V̇O2, HR, duration, speed, vertical height, and displacement, have a positive relationship with the various step rates calculated based on the physiological evacuation model. It is recommended for calculating the performance as such speed, height during stair ascent evacuation.
A maximum step rate range of 109-122 steps·min-1 was found in the laboratory-controlled paces at 90-100% V̇O2max. Stair ascent can only be sustained for about2-6 min at 90-100% of V̇O2max speeds, and a vertical height can be reached atabout 86-95 m. In comparison with the field studies at the self-preferred pace, atolerable pace of ≈90-95 steps·min-1 at ≈75% V̇O2max is recommended toaccomplish long (9-15 min) ascents.
The novel muscle activity interpretation squares (MAIS) model was developed. The muscle activity rate change (MARC) percentile points in the MAIS can be used during repetitive tasks to interpret muscle fatigue by showing the changes in amplitudes and median frequencies over time.
The overall results infer that the combination of the effects of cardiorespiratorycapacity exaggerated by leg fatigue constrained the stair ascending capacities,including duration, height, and VO2highest. This apparently inhibited the V̇O2highest to reach the V̇O2max level, while any recovery could extend the tolerance.
Finally, during exhaustive walking up a 10° incline, the altered gait biomechanics (i.e., decreased peak ground reaction forces, foot absolute angles, angular velocity, and acceleration with an increased required coefficient of friction) indicated potential risks for perturbed gait balance. An altered gait can impede the evacuation flow during emergencies.
27
1 Introduction
Physiological performance constraints are one of the most serious concerns in our daily lives, particularly in challenging situations. Most of us want to perform activities and overcome challenging daily life conditions smoothly. Stair ascent, particularly at a high speed, is one of the most strenuous and challenging activities for everybody (Johnson et al., 1977; Nightingale et al., 2014), and is one of the most frequently encountered obstacles in daily living. The International Organization of Standardization (ISO) has also classified the stair climbing as a very demanding activity in terms of its metabolic rate of about 290 W·m-2 (ISO, 2004). Naturally, physical challenges increase with age due to the gradual deterioration of body functions such as neurological and musculoskeletal capacities. However, human physical work capacity and fitness can be maintained to a certain extent by regular training or exercising (Macdonald et al., 2007). On the other hand, high demands and situations influence the work rate and patterns of our muscles and joints, thus affecting the balance and coordination of activities.
Stair ascending requires a high range of joint motion and muscle strength even for healthy people (Rantanen et al., 1994; Riener et al., 2002). Our musculoskeletal systems involve different larger leg muscles and joints, which in turn require the cardiorespiratory system to work at a higher intensity during stair ascent than during level walking (Nadeau et al., 2003; Shiomi, 1994). This dynamic movement requires more energy from the knee extensors to complete an ascending task in order to bear the weight of the body against gravity in vertical planes during pull-up movements (Andriacchi et al., 1980; Costigan et al., 2002). Stair descent, on the other hand, is remarkably different (McFadyen & Winter, 1988). Thus, the ability to manage high demanding stair ascents can be included in an evaluation of our work capacity, and in our functional capacity in real life situations. Few studies have explored our stair ascending capacities in respect to critical life-saving situations, such as power failures, fire incidents or terror attacks, where emergency evacuation is required and people have to utilize all their physiological resources in order to ascend stairs. Hence, a long-duration stair ascent causes fatigue and leaves little reserve capacity in the body. This can put us in a dangerous situation, resulting in accidents or injuries (Samuel et al., 2011).
28
1.1 Physiological capacities and limitations
We are humans, not machines. There are limitations as to how long our skeletal muscles can maintain force production during continuous cyclic activities. Our cardiac functions are unable to meet the oxygen demands for long durations in high aerobic activities that involve larger muscles. Sustaining high energy production for long periods depends on several factors including individual physical fitness, oxygen uptake (V̇O2) capacity, genetic and modified muscular type, lactate tolerance, as well as the economy and pattern of the activity (Åstrand et al., 2003; McArdle et al., 2015).
1.1.1 Aerobic (endurance) and anaerobic (fast) capacity
The endurance of a physical activity defines the ability to perform any activity using the cardiovascular resources for an extended duration. A prolonged activity, such as ascending stairs requires sustained and repeated muscle contractions. In order to maintain these muscular contractions during a continuous ascent, our bodies need to provide sustained energy. Adequate energy provision means supplying enough oxygen (O2) for the muscular work. This is accomplished by adenosine tri-phosphate (ATP) production through metabolic pathways, which include the phosphagen system (production of ATP from creatine phosphate), glycolysis (glucose breakdown), and mitochondrial respiration for aerobic metabolism (McArdle et al., 2015).
The phosphagen and glycolysis pathways are only capable of anaerobic energy production that lasts for a short duration (from seconds to a few minutes). When a muscle has used up its ATP and creatine phosphate stocks in forced situations, the energy it requires can no longer be met anaerobically. Consequently, ATP regeneration for longer durations can only be accomplished through aerobic processes or mitochondrial respiration. Mitochondrial respiration means that there is continuous oxygen availability to the active muscle cells for proper functioning. Proper functioning refers to an activity that is below or equal to the threshold for longer duration in an individual self-preferred situation. Aerobic energy production requires the transportation of O2 from ambient air. The O2 is extracted from the inhaled air and binds haemoglobin in the red blood cells through pulmonary diffusion in the alveolar capillaries of the lungs. Then oxygenated blood is transported to the target tissues or muscle mitochondria via systemic circulation (Costill et al., 2012 ).
29
1.1.2 Maximal oxygen uptake: V̇O2max versus V̇O2highest
An indication of work capacity and an estimation of energy expenditure can be achieved by measuring V̇O2 values during work at different maximal and near maximal intensities (Dorman & Havenith, 2009). The development of rapid-response gas analyzers has enabled the measurement of breath-by-breath respiratory gas exchange. The analyzers’ rapidly incremented or ramp testing protocols have facilitated the analyses of complicated tasks and progressive maximal exercise tests. The maximal aerobic capacity is the maximal amount of oxygen uptake (V̇O2max), which is a measure of cardiorespiratory fitness that is widely used in exercise physiology as a gold standard graded exercise testing (GTX) of integrated cardiopulmonary-muscle oxidative function (Bassett & Howley, 2000; Poole & Jones, 2017). GTX produces an unambiguous V̇O2-work rate plateau, which is definitive for V̇O2max. V̇O2max refers to the upper limit (highest plateau) of the V̇O2 attained physiologically involving large muscle mass. GTX increases the exercise intensity systematically and linearly as do the V̇O2 values (e.g., power output, speed) until the individual is unable to tolerate the workload within the nature of human exercise physiology (Keir et al., 2018). The foundational premise of V̇O2max is that a speed of locomotion or rate of work exists above which V̇O2 fails to further increase (Poole & Jones, 2017). This shows the correlation between exercise workloads and the human integrated functioning of the respiratory, cardiovascular, and musculoskeletal systems in O2 uptake (diffusive O2 transport between the lungs and muscle microvasculature), in transport (conductive O2 transport), and in utilizing O2 predominantly in the contracting muscle mitochondria.
The terms V̇O2highest (in some literature referred to as V̇O2peak) is used to describe the maximum amount of O2 that can be consumed by the body during a specific intensive exercise or work task. It is not always the real maximal level, which is obtained during the gold standard GTX. In order to increase the reliability and validity of the intensity of a task, an undefined combination of standardized criteria must be met including the following: V̇O2 plateau, estimated maximum heart rate (HRmax), respiratory exchange ratio (RER), blood lactate (BLa−), and rating of perceived exertion (RPE) (Beltz et al., 2016; Howley et al., 1995; Poole et al., 2008). The V̇O2 plateau observed after the initial rapid increase and steady state is the main criterion to validate either V̇O2max or V̇O2highest. When VO2 was measured breath-by-breath, the plateau was observed in 81% of the subjects; when measured for 15 s, 91%; when measured for 30 s, 89%; and when measured for 60 s, 59% (Astorino, 2009). Attaining V̇O2 plateau is not always mandatory and is not always possible to reach or unable to observe in one’s V̇O2 kinetics in the recording. In instances where a plateau is not attained as definitive evidence of V̇O2max, investigators commonly elect to substantiate that by utilization of so-called secondary but contradictory
30
criterion (Poole & Jones, 2017; Poole et al., 2008) to validate the V̇O2max or V̇O2highest, as follows:
a) HR: The HRmax is much more dependent on a person’s age; it decreases as oneincreases in age, thus decreasing fitness, but it is quite stable and remains unchangedwith regular endurance training. A high variability in the estimated HRmax is oftenused as a secondary criterion to V̇O2max, ≤ 10 b·min-1 or ≤ 5% of the age-predictedmaximum HR from 220-age (Robergs & Landwehr, 2002), or with a less erroneous(±7-11 b·min-1) formula 208-0.7 × age (Tanaka et al., 2001).
b) BLa−: A high concentration value is ≥ 8.0-10.0 mmol·l-1. A BLa− value between15-25 mmol·l-1 was also observed in 3-8 minutes post exercise (Goodwin et al.,2007). The BLa−concentration did not increase significantly at the end of all fourbouts of the 3-min long isometric effort during a rowing simulating task (Vogiatziset al., 1996), nor during a 40 m high building stair ascent (Johnson et al., 1977). Thissuggests that BLa− is not important in predicting performances for short durations(2-3 min).
c) RER: Different values (≥1.00, 1.10, 1.15) are used as a secondary criterion forattaining V̇O2max (Beltz et al., 2016; Howley et al., 1995; Poole & Jones, 2017). TheRER is the outcome of the CO2 produced during metabolism divided by the O2
consumed. It reflects the balance between bicarbonate buffering and hydrogen ionaccumulation (Howley et al., 1995). It is an indicator of the muscle’s oxidativecapacity to get energy (Ramos-Jiménez et al., 2008). A range between 0.7 and 1.0is an indicator of metabolic fuel or substrate use in tissues (Issekutz & Rodahl,1961); it usually appears during resting and steady-state exercise conditions. A ratioof 0.7 is indicative of mixed fat use, whereas a ratio of 1.0 indicates the exclusiveuse of carbohydrates. Thus, during low-intensity, steady-state exercise, the RERsare typically between 0.80 and 0.88, when fatty acids are the primary fuel. As theintensity of the exercise increases and carbohydrates become the dominant fuel, theRER increases to a level between 0.9 and 1.0.
d) RPE: A value of ≥17 or 18 on the Borg’s scale between 6 and 20 is commonlyused to assume the attainment of V̇O2max (Beltz et al., 2016).
The ability of the cardiorespiratory system to transport O2 to the working muscles is the central component of V̇O2max. In contrast, the ability of the working muscles to utilize O2 is the peripheral component of V̇O2max (Robergs & Roberts, 1997). The central component is the main limitation of high intensity exercise. However, the physiological limitations are different between the intensities of work below and above the threshold for a prolonged activity. The threshold is defined as where an activity can be managed for about 8 hours (Stegemann, 1981). A European reference database mainly based on the Norwegian population (Loe et al., 2013) reported the key human physiological factors for people of both genders between 20 and 90 years
31
of age. The reported V̇O2max values for healthy men and women between 20-29 years of age were 54.4 (8.4) and 43.0 (7.7) mL·min-1·kg-1; respectively, and the corresponding HRmax values were 196 (10) and 194 (9) b·min-1, respectively, with a subsequent reduction of approximately 3.5 mL·min-1·kg-1 and 6 b·min-1 per ten years older. Sex difference for V̇O2max was significant at p<0.001 and for HRmax was p<0.05. An average V̇O2max of about 40 mL·min-1·kg-1 is considered as a limit to avoid a life threating situation for fit people involved in firefighting tasks (Ben-Ezra & Verstraete, 1988). Moreover, the required V̇O2max for the firefighters’ relative fitness is reported to be about 49 mL·min-1·kg-1 (Davis et al., 1982). An energy expenditure of about 475 W·m-2 (≈70% of V̇O2max) at work can be maintained for about 15-20 min at 600 W·m-2 (≈90% of V̇O2max) for about 5 min (Holmer & Gavhed, 2007).
1.1.3 Heart rate (HR) relationship to workload and energy demand
Energy metabolism is needed for work. Workload is the determining factor for the adjustment of HR and the threshold for prolonged work. An unlimited amount of aerobic work can be done under certain workloads. If the same amount of high intensity work is managed by involving a lower amount of muscle mass, the HR will rise continuously and the work will sooner be interrupted by exhaustion. The increase of HR is proportional to the O2 uptake. If the workload increases gradually, a definite severe workload will be reached and the person will be unable to maintain the corresponding high HR for long. Oxygen debt is created during both a constantly high and a progressivly increasing workload, and the person must stop his or her activities due to fatigue and exhaustion (Stegemann, 1981). The HR during aerobic and partially anaerobic work differs above the threshold for prolonged activity. During light physical work or below the threshold for prolonged activity, one’s HR raises sharply to a certain level after which it stabilizes (Stegemann, 1981). At that point, HR reaches a workload where the demand can be maintained for a subsequent amount of time (2-3 min). Very high activity levels for a short time (a few minutes) engage the limited anaerobic energy yielding processes.
1.1.4 Oxygen uptake (V̇O2) relationship to muscle activities at various workloads
The ventilatory threshold (VT) during short-term exercise is defined as the work rate immediately below the level of V̇O2 at which the respiratory minute ventilation (V̇E) increases disproportionally relative to V̇O2. The VT is reached at exercise intensities between 50 and 75% of V̇O2max, but this depends on individual
32
anaerobiosis and lactate tolerance (Roston et al., 1987; Whipp & Wasserman, 1972). V̇E is the volume of gas inhaled or exhaled from the lungs in one minute. The VT for long-term exercise is defined as the work rate or immediately below the V̇O2 level at which the V̇E continues to increase over time rather than attaining a steady state (Reybrouck et al., 1986). The dynamics of the V̇O2 response to muscular exercise are a crucial determinant of exercise tolerance (Rossiter et al., 2001) and of severe-intensity exercise performance above the critical power (CP) (Burnley et al., 2011). CP is defined as the maximal exercise intensity that is possible for a person to sustain for an extended duration (Duffield et al., 2007). CP represents the highest rate of energy transduction (oxidative ATP production, V̇O2) (Jones et al., 2010), and thus separates the power outputs that can be sustained with stable values of muscle phosphocreatine, BLa−, and pulmonary V̇O2 uptake (Jones & Vanhatalo, 2017).
High intensity leg muscle work in particular is associated with the slow component of the V̇O2 uptake. This component is an exponential or slowly developing increase in V̇O2 during constant work-rate exercise that is performed above the lactate threshold (LT). The LT is an abrupt change in an intense level of work due to increased lactate levels in the blood. It represents a progressive loss of skeletal muscle contractile efficiency and is associated with the fatigue process (Jones et al., 2011; Poole et al., 1994; Zoladz et al., 1995). This is due to an increase in hydrogen ions, leading to an increased acidity of the inter-cellular environment. It is often expressed as 65-85% of HRmax or around 75% of V̇O2max. The development of muscle fatigue results from the production of lactic acid from pyruvate during glycolysis depending on the work intensity (McArdle et al., 2015). The lactate inflection point (another term for LT) is the level of work intensity at which the lactic acid concentration in the blood starts to accumulate and increase gradually instead of being removed by the body (Goodwin et al., 2007). With this workload, the oxygen transporting system cannot meet the V̇O2 demand – a maximal level is attained, and the person’s maximal V̇O2 uptake is reached. At this level, anaerobic energy is also delivered to compensate for the O2 deficiency. This can be measured by an increase in lactic acid in the blood. These high workload levels are very exhausting and can only be maintained for a few minutes. The tolerance of lactic acid is limited in the body. When a period of exercise is over, lactic acid is taken to the liver by the blood either oxidized to carbon dioxide (CO2) and water, or converted to glucose, then the glycogen levels in the liver and muscles can be restored. These processes require O2. This is why, when the period of activity is over, a person’s respiratory rate and HR do not return to normal straightaway. The amount of O2 required to remove the lactic acid, and replace the body's reserves of O2, is called the oxygen debt.
During a constant and high work rate, the greater use of fast-twitch (type II) motor units increases the energy demand, which provokes the production of lactate and
33
causes a concomitant progressive increase in V̇O2 to steady state (Roston et al., 1987; Saunders et al., 2000; Whipp & Wasserman, 1972). The O2 transporting process is relatively slow at the onset and it takes a couple of minutes before the rate of O2 uptake matches the demand (Costill et al., 2012 ; Whipp & Wasserman, 1972). V̇O2 usually rises linearly with exercise intensity (e.g., power output, speed) and reaches a steady state within a few (2 to 3) minutes before reaching its maximum level (V̇O2highest). This also persists during a constant rate of moderate exercise below the LT (Keir et al., 2018). If the work rate is above the LT, the attainment of a steady state is delayed but continues to rise slowly. When the work rate is above the CP, no steady state is reached, the exercise terminates at V̇O2max or highest and eventually fatigue and exhaustion occur (Barstow, 1994; Jones et al., 2011; Whipp & Wasserman, 1972). There is a speed of movement above, which V̇O2 fails to increase further. However, the V̇O2max will be achieved for any supra-CP work rate, but this constant work rate range is very small (Poole & Jones, 2017).
Studies have indicated a strong positive relationship between the V̇O2 slow component (Borrani et al., 2001; Shinohara & Moritani, 1992) and motor unit recruitments (Sabapathy et al., 2005). The development of V̇O2 is associated with the gradual recruitment of additional muscle fibers that are presumed to have lower efficiencies. The recruitment of additional fibers is not always necessary during high-intensity exercises, and a progressive loss of muscle contractile efficiency is associated with the fatigue process resulting in the equivalent durational V̇O2 slow component and exercise tolerance (Cannon et al., 2011; Jones et al., 2007; Vanhatalo et al., 2011; Zoladz et al., 2008). Moreover, there are work rate changes within the severe intensity domain that increase the amount of work and tolerance (Dekerle et al., 2015). Work intensity reduction is obvious after a certain level, if it takes place in a self-controlled situation. Work pace reduction is crucial for fatigue recovery and for reducing the energy demand that decreases the load on the cardiorespiratory system.
1.1.5 Cardiac output and stroke volume
Cardiac output is defined as the product of heart rate and stroke volume, namely the amount of blood pumped by the heart per minute. In fact, some researchers have concluded that 70-85% of the limitation in V̇O2max can be attributed to maximal cardiac output (Cerretelli & DiPrampero, 1987). Stroke volume is the amount of blood pumped per heart beat, which increases substantially as a result of endurance training. Cardiac output has been identified as one of the main limiting factors for O2 supply and V̇O2max (Bassett & Howley, 2000). Activity above the threshold for long duration work and high HR creates a constant peripheral resistance and low cardiac output. High intensity activity reduces the stroke volume and the ongoing work will be terminated due to severe exhaustion (Stegemann, 1981).
34
1.1.6 Muscle activity and electromyography (EMG)
Muscle power is considered to be an important physical capability that involves both strength and weakness of movements (Kraemer & Newton, 1994). Stair ascending places a high demand on the thigh muscles (Samuel et al., 2011). Repetitive exertions performed over a sustained period of time lead to fatigue, which is believed to be the precursor of musculoskeletal disorders (MSDs). The identification of fatigue is crucial for ergonomists in order to prevent workplace injuries, illnesses and MSDs. MSDs are widespread throughout the world and are the second greatest cause of global disability. They are associated with enormous financial and societal costs (Horton, 2012). Evidence suggests that musculoskeletal disorders can result from fatigue failure processes (Gallagher & Schall, 2017). It is essential that accurate assessment methods for muscle fatigue are available.
Surface EMG is a preferred and frequently used method to assess muscle activity. Even though it has several limitations, it is commonly used because of non-invasiveness (Chowdhury & Nimbarte, 2015). It registers the motor unit action potentials (MUAPs) that are delivered from the anterior horn cells of the spinal cord. EMG can be an important physiological indicator of neuromuscular fatigue in the evaluation of performance (Hanon et al., 1998). EMG provides an estimation of forces by observing the amplitude (AMP) and examines the source spectrum to assess the signals’ frequency ranges and density. The relationship between the EMG AMP (e.g., root mean square, RMS) and muscle force production is often linear but not always. It is linear only when the muscle is activated isometrically at the same muscular length across different intensities, and it is non-linear under isotonic conditions (Weir et al., 1992). There is often a curvilinear component to the relationship (Christensen et al., 1995; Zoladz et al., 1995).
Muscle fatigue is the decrease of muscular force production or the inability to maintain an expected force according to one’s wish. If the ascending intensity is equal to or above the threshold for a prolonged activity, it could constrain the duration earlier than expecting. Muscle fatigue analysis is complicated during dynamic exertions compared to static muscular exertions. During dynamic exertion, the continuous change in body posture changes the joint range of motion, length of muscle fibers, and the number of active motor units. Therefore, the magnitude and direction of muscular force application changes together with nerve conduction velocity (Merletti et al., 1990). Muscle fatigue can be analyzed using conduction velocity as well (Farina, 2006). The study of neuromuscular fatigue is carried out by determining the EMG mean frequency (MNF) and EMG median frequency (MDF), by analyzing the spectrum power using the Fast Fourier Transform (FFT). A change or shift in the MNF or MDF of a surface EMG power spectrum toward lower values (Allison & Fujiwara, 2002; Lowery et al., 2002), or an increase in the power of the low frequency and a decrease in the power of the high frequency
35
components have been identified as indicators of muscle fatigue (Eberstein & Beattie, 1985). Exhaustion and fatigue can be referred to as a high level of tiredness that affects the performance of people when engaged in physical activities. However, it is mostly related to local muscle fatigue (LMF) caused by repetitive activities that can further reduce work capacity (Cheng & Rice, 2013). A fatigue index (FI) has also been used to define the level of fatigue during repetitive task. FI consists of the ratio between muscle activity changes during isometric maximum voluntary contractions (MVC) and AMP at the beginning and end of work (Oksa et al., 2002).
1.2 Current knowledge on stair ascending capacity and EMG
Few studies have measured both V̇O2 and EMG to observe exhaustion and muscle fatigue during ascent on regular stairs. Stair ascension metabolic costs measured on a motorized escalator (Bassett et al., 1997) and Stair Machine ergometer were used during simulated firefighting activities (O'Connell et al., 1986). The relative V̇O2 values observed were 26, 32, 38 and 46 mL·min-1·kg-1 during a 5-minute ascent at controlled speeds of 60, 77, 95, and 112 steps·min-1, respectively (Butts et al., 1993). Another study increased the SR every two minutes on a step ergometer and found a lower V̇O2max response of about 40.1 mL·min-1·kg-1 compared to 43.1 mL·min-1·kg-
1 when running on a treadmill. This study claimed that lower V̇O2max values might contribute to leg LMF. The onset of fatigue may have constrained the ascending capacity and kept the V̇O2 from reaching the maximal level, thus indicating another possible limiting factor (Ben-Ezra & Verstraete, 1988).
The EMG registration of stair ascending leg muscles was acquired in some controlled studies in laboratory settings. Double-step strategy (skipping every other step) stair climbing resulted in greater ankle and knee extensor activity including 15 to 20% higher metabolic costs for propulsion compared to the single-step (taking every step) on an inclined treadmill (Gottschall et al., 2010). Another EMG study on regular stairs reported that ascending calf muscle activity was significantly higher than descending, whereas the calf muscles worked proportionately higher than the tibialis anterior leg muscle (Eteraf Oskouei et al., 2014). Very little information has been found about muscle fatigue as an associated physiological factor that could contribute to limiting a person’s stair ascending capacity. It is important to note that none of the studies above examined leg muscle LMF as a physiologically limiting factor during intensive stair ascent, especially for evacuation.
36
1.3 Inclined walking gait biomechanics and fatigue
The pattern of fatigued walking either uphill or downhill on a sloping surface is quite undocumented, especially immediately after an exhaustive stair ascent at maximum speed or other activities. Some studies have reported on altered gait walking biomechanics on different inclinations (Cham & Redfern, 2002; McIntosh et al., 2006). These studies have restrained from reporting time-synchronized gait muscle activities. Studies of spatio-temporal and joint kinematics have been reported with increased inclinations when walking uphill. The walking speed and stride length increase, while the cadence decreases; on the contrary, the stride length decreases and the cadence increases when walking down (Kawamura et al., 1991; Sun et al., 1996). Nadeau et al. (2003) compared the kinematic pattern of cadence, stance phase (SP) and gait cycle duration between stair ascent and level walking. They found a longer gait cycle duration and a shorter SP in stair ascending compared to level walking (Nadeau et al., 2003).
A slip occurs when the friction utilized by the person during walking (known as the required friction) exceeds the available friction at the shoe-floor interface (Leamon & Li, 1991). The required coefficient of friction (RCOF) is typically determined from a gait without slipping events. A higher RCOF indicates higher potential for slip risks or loss of balance. Over the period from heel-strike (HS) to toe-off (TO), most of the body’s weight is supported by one foot. During this stance phase, there are normal (vertical) and shear (horizontal) components of the ground reaction forces (GRFs) acting on the person’s foot by the floor. These vertical and shear forces are measured and used to determine the peak RCOF during walking (Pollard et al., 2015). The gait characteristics and frictional requirements to maintain balance are different between walking uphill and downhill. Important factors for safe gait locomotion after fatigue are the inclination of the walkway, frictional requirements and walking directions. When walking downward, the very first step is always crucial on a descending surface (Redfern & DiPasquale, 1997), and even more important if it happens after exhaustion and leg fatigue. When walking downhill, the shear force at HS period increases with ramp angle and decreases at TO. In contrast, shear force increases at TO and decreases at HS when walking uphill (Mcvay & Redfern, 1994).
When walking downhill, there is an increase in longitudinal or antero-posterior shear force (GRFy), thereby increasing the RCOF necessary for safe walking. By taking shorter strides, presumably to reduce the frictional demands, people attempt to compensate for this increased requirement. The RCOF increases with an increase of inclination when walking downwards (Cham & Redfern, 2002; Mcvay & Redfern, 1994), and generally higher RCOF values are obtained when walking uphill than downhill (Pollard et al., 2015). Most injuries from falls occur when
37
walking downhill and are likely attributable to the momentum of the body in addition to the properties of the walkway. However, an increasingly flexed posture of the hip, knee and ankle at initial foot contact was found when the inclination of the treadmill was graded from 0 to 10%, and the opposite phenomenon was observed with no inclination (Leroux et al., 2002). The mean step length, cadence and velocity significantly decreased in a study that compared walking on a 10° slope with a level surface (Ferraro et al., 2013). Additionally, stride length, velocity, acceleration, cadence (Ferraro et al., 2013) and center of mass kinematics on an incline (Kawamura et al., 1991; Sun et al., 1996) can change after fatigue, which can lead to slip and fall related accidents (Chang et al., 2013; Parijat & Lockhart, 2008) and can block the flow of evacuation.
1.4 Rationale of the studies
1.4.1 Evacuation in ascending stairways
Modern cities and high-rise structures are being built with underground facilities for global corporations and increasing transportation demands. Stairs are often used as the only means of urgent egress during evacuation from these structures. Generally, descending stairs are the main form of evacuation in high-rise buildings (Peacock et al., 2010). However, a long duration and non-stop ascent may be required in vertical distances in the case of evacuation restrictions at lower levels, for example, during fires, in subway emergencies and other accidents. Long stairway ascents to reach a safe refuge location from deep underground are physically challenging (Lam et al., 2014; Ronchi et al., 2015). The major concerns in the field of evacuation research are physiological limitations, maximum ascending capacities and durations.
Physical exhaustion can constrain human stair ascending capacity and performance during evacuation in emergencies. Sufficient cardiorespiratory capacity and repetitive movements of limb muscles are required for continuous stair ascension (Xu et al., 2015). The workload on the cardiorespiratory system is prominent in order to meet the increasing demands of the working muscles. Generally, cardiorespiratory capacity is believed to be the main indicator of human physiological limitations; limits that constrain a person’s capacity in terms of maximum speed to a given height and in terms of duration. The concept of fatigue and its effects on evacuation performance have been identified and discussed in fire safety engineering without a complete understanding of what this means or the physical implications. The fire research community has addressed this necessity to include fatigue and exhaustion measures in evacuation modeling (Pelechano &
38
Malkawi, 2008). There is a considerable amount of research on LMF, but no studies have examined the consequences or the effects of exhaustion and LMF on stair ascending capacity by evaluating the cardiorespiratory parameters and leg muscle EMG. This highly energetic and demanding task involves muscular load and cardiorespiratory response, which can be measured through oxygen consumption, and the monitoring of muscle fatigue by using EMG measurements, a complementary approach to evaluating stair ascending physiological capacities.
1.4.2 Self-preferred versus machine-controlled mode of stair ascents
Ronchi et al. presented a conceptual model of the impact of fatigue on pedestrian movement during stair ascending evacuations (Ronchi et al., 2016). Moreover, different models have been used to estimate the evacuation capacities, including travel time and the walking facilities of subway stations (Chen et al., 2017; Wu et al., 2018). However, neither the different speeds nor modes of the essential, physiological exhaustion-related ascending parameters have been assessed or integrated into these models. I thought it would be interesting to study the differences between the fundamental tenets of self-preferred and constant load exercises in ascending work physiology. There is also evidence that energy transformations and oxygen uptake (V̇O2) are different for tasks at a constant mode compared to exercising under self-controlled situations (Marino, 2012). An assumption of the research presented in this thesis is that energy transformations between these two modes of stair ascending would be different as well. It is intriguing to explore the performance and challenges of demanding stair ascending tasks in the two different modes:
• Self-preferred pace ascent: Individuals choose their own ascending steprates (SRs) and strategies.
• Machine-controlled pace ascent: Ascent strategies are pre-defined. Theascending SRs are constant, pre-determined and controlled by a stairmachine.
Self-preferred pace ascent Regular stairs allow subjects to change their ascending strategies and control their pace. As the effort increases, physical exhaustion affects stair ascending speed and style during long evacuations. It appears to be impossible for a person to continue an ascent with his/her preferred speed for a long duration. Previous research suggests that more investigations are required to consider the important role of physical exhaustion during longer evacuation performance (Pelechano & Malkawi, 2008; Ronchi & Nilsson, 2013). Physical work capacities and limitations have been
39
explored to some extent in both ascending and descending in several field studies using various designs and protocols on public stairways. These studies have measured HR, blood pressure and V̇O2, and have estimated the energy expenditure at the subjects’ preferred speeds (Aziz & Teh, 2005; Chen et al., 2016; Halsey et al., 2012; Lam et al., 2014; Teh & Aziz, 2002). There is a scarcity of studies that examine cardiorespiratory responses and muscle fatigue during ascending activities on regular stairways.
Machine-controlled pace ascent Several laboratory studies have measured physiological parameters including HR and V̇O2 to determine the energy costs of using stair machines (Bassett et al., 1997; Butts et al., 1993; O'Connell et al., 1986). It is important to examine the occurrence of fatigue resulting from one’s maximal efforts during stair ascent from both performance and evacuation perspectives. In an emergency evacuation situation, it is assumed that humans will ascend the stairs at their maximum levels as long as possible. It is supposed to be an all-out effort while keeping the ascending speed as constant as possible to reach the refuge level. The 90-100% V̇O2max corresponding speeds are assumed to be an all-out effort. In addition to V̇O2, one can elucidate stair ascension by using EMG to measure muscle fatigue. This is done in order to explore the limiting factors when carrying out an ascent during a rapid evacuation simulation on a stair machine. Thus, the machine-controlled pace ascents investigate how the physical exhaustion and leg local muscle fatigue (LMF) during an all-out effort constrain the evacuation performance.
1.4.3 Inclined walking gait biomechanics
The walking pattern and consequences immediately after an exhaustive stair ascending are of interest but are relatively unexplored. Studies have shown that the fatigue in knee extensor and hip flexor muscles reduces proprioceptive function and balance due to heavy and repetitive activities as well as prolonged standing. All of these may be risk factors for slip-induced falls (Lattanzio et al., 1997; Miller & Bird, 1976; Svensson et al., 2018). Previous studies have used various devices. An isotonic fatigue protocol, Biodex dynamometer, has been used to induce leg fatigue by repetitive movements to determine the effect of impaired muscle function on biomechanics and neuromuscular function during gait (Murdock & Hubley-Kozey, 2012; Parijat & Lockhart, 2008). Another study on leg neuromuscular fatigue showed that it decreased the gait peak isometric torque and the peak knee extension moment, but not the knee adduction moment, knee flexion angles, dynamic knee stiffness, or muscle co-activation (Longpre et al., 2013). Hip flexor fatigue decreased the velocity of hip flexors when walking, and the walking duration was greatly reduced as a result in order to compensate for distal weakness. This suggests
40
that fatigue in the hip flexors can limit walking or ascending duration (Ramdharry et al. 2009). Therefore, it is important to consider fatigued gait biomechanics. Any slip and fall related accidents maybe caused by fatigue and decreased balance (Nazifi et al., 2019).
Identifying the unstable gait biomechanical risk factors and muscle activity patterns that cause slip-induced falls is the key to preventing accidents on inclines (Gao et al., 2008). Predicting the risk for accidents when walking after fatigue on an inclined surface and based on frictional measurements is an area of occupational safety that has received poor attention. The study of incline is necessary because there are different walkways during evacuation. In emergency evacuations, a continuation of walking uphill may be required on a sloped surface following an exhaustive stair ascent at maximum ability to reach a safe refuge at higher levels for evacuation. The effects of whole-body exhaustion and fatigue after stair ascending on gait kinetics, kinematics and major leg muscles have been rarely reported in previous studies. It is worthwhile to carry out evacuation research that simulates an emergency in order to identify any altered gait biomechanics (Ronchi et al., 2019) that can negatively affect gait stability and result in an accident or other hinders to the process of evacuation.
41
1.5 Aims, research questions, hypotheses and objectives
1.5.1 Overall aim
The overall research aim was two-fold. First, to explore and compare the individual physiological constraints and capacities required during stair ascent in two different modes: self-preferred pace in the field, and controlled pace on a stair machine in the laboratory. Second, to explore and compare the gait changes that occur after ascent in terms of the post-exhaustion walking gait biomechanics on a slope.
The research questions (RQs) are as follows:
RQ 1. What are the required cardiorespiratory capacities and limitations during stair ascent at a self-preferred pace (Paper I) and different machine-controlled constant paces on a stair machine (Papers II and IV)?
RQ 2. How do the leg muscles perform and what are the limitations during stair ascent at a self-preferred pace (Paper I) and different machine-controlled constant paces on a stair machine (Papers II and IV)?
RQ 3. How can the different step rates be estimated based on individual physiological capacity, and how can the ascending duration and height be predicted by the physiological evacuation model (Paper III)?
RQ 4. How can leg muscle activity and fatigue be interpreted by a model using electromyography (EMG) during stair ascent in two different modes: self-preferred pace (Paper I) and machine-controlled constant paces (Papers II and IV)?
RQ 5. Are physical exhaustion and LMF of the legs potential risks when walking up an inclined surface that can alter the gait biomechanics and hinder the flow of evacuation (Paper V)?
42
1.5.2 Hypotheses
1. During stair ascending evacuation, V̇O2 stays at steady state, especially atsubmaximal self-preferred pace, in order to ensure a continuous ascent. V̇O2
does not reach a stable state, and the ascent is terminated with a lower V̇O2
level (V̇O2highest) than V̇O2max.2. LMF contributes to cardiorespiratory constraints to limit the ascending
endurance and speed.3. Stair ascent evacuation can only be sustained around 5 min at an all-out effort
speed corresponding to 90-100% V̇O2max. The vertical distance is limited to 100meters.
4. Leg muscle activity and fatigue can be described in the muscle activityinterpretation squares (MAIS).
5. Gait kinetics and kinematics on a 10° incline surface are affected by physicalexhaustion and leg muscle fatigue after stair ascending.
1.5.3 Specific objectives
The research evaluated human stair ascending capacities using the combined measurements of cardiorespiratory parameters and leg muscle electromyography (EMG). Moreover, the research explored the effects of exhaustion and leg LMF on walking gait up an inclined surface during the process of loading in the stance phase (SP).
The specific objectives were:
1. To determine the physiological capacities and limitations by measuringV̇O2 uptake, HR in two stair ascending modes: self-preferred pace andmachine-controlled pace.
2. To investigate the role of leg LMF in constraining the ascending endurancein two different modes.
3. To model and predict ascent step rate, duration and height during stairascent at maximum speed by the physiological evacuation model.
4. To develop the muscle activity interpretation squares (MAIS) model and toapply muscle activity rate change (MARC) over time during stair ascents inthe two stair ascending modes to observe fatigue.
5. To examine the effects of exhaustion and leg LMF on the changes in gaitbiomechanics when walking uphill on an inclined walkway.
43
2 Study design and methods
2.1 Ethical considerations
The studies were designed to ensure the safety of the subjects, to show respect and to follow the established ethical standards. The researchers involved were aware of protecting the health, dignity, integrity, privacy and confidentiality of the human test subjects. All the non-invasive methods and procedures used in the study were in compliance with the World Medical Association Declaration of Helsinki: Ethical Principles for Medical Research Involving Human Subjects (World Medical, 2013). The experimental principles of the studies in the project (Ronchi et al., 2015) were approved by the Regional Ethical Review Authority in Lund, Sweden (Dnr. 2014/54: phases 1 and 2 of the research), and (Dnr. 2016/1061: phase 3 of the research). The subjects were ensured that they had the right to terminate the tests at any time without stating any reason.
2.2 Participants
The ascending tests were carried out to simulate emergency evacuation situations involving both genders and a wide range of age and body sizes in three different public stairways and at four different controlled speeds on a stair machine in a laboratory. The number of subjects differed between the phase 1 among the three field studies that were carried out at different locations and the laboratory studies in 2 different phases. These three phases of the research took place between 2014 and 2017 (Table 1).
The subjects were recruited from announcements on notice boards at Lund University and on social media. During both the initial communication and confirmation of subject participation, a description of the tests was provided orally and in writing. It included the necessary safety information, test procedures and apparatus to be used. Healthy subjects were selected who had no current musculoskeletal or neurological complaints, or cardiovascular dysfunction.
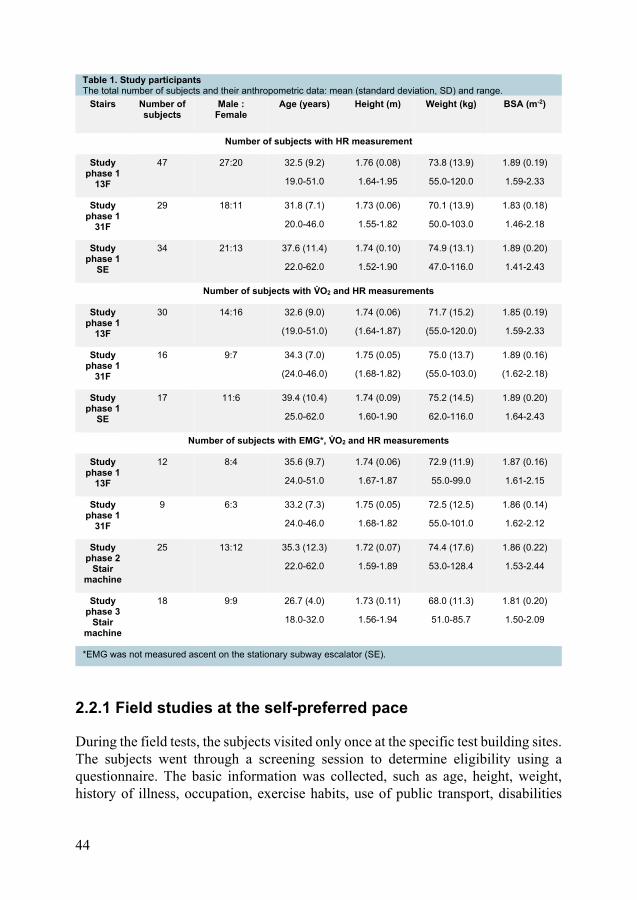
44
Table 1. Study participants The total number of subjects and their anthropometric data: mean (standard deviation, SD) and range.
Stairs Number of subjects
Male : Female
Age (years) Height (m) Weight (kg) BSA (m-2)
Number of subjects with HR measurement
Study phase 1
13F
47 27:20 32.5 (9.2)
19.0-51.0
1.76 (0.08)
1.64-1.95
73.8 (13.9)
55.0-120.0
1.89 (0.19)
1.59-2.33
Study phase 1
31F
29 18:11 31.8 (7.1)
20.0-46.0
1.73 (0.06)
1.55-1.82
70.1 (13.9)
50.0-103.0
1.83 (0.18)
1.46-2.18
Study phase 1
SE
34 21:13 37.6 (11.4)
22.0-62.0
1.74 (0.10)
1.52-1.90
74.9 (13.1)
47.0-116.0
1.89 (0.20)
1.41-2.43
Number of subjects with V̇O2 and HR measurements
Study phase 1
13F
30 14:16 32.6 (9.0)
(19.0-51.0)
1.74 (0.06)
(1.64-1.87)
71.7 (15.2)
(55.0-120.0)
1.85 (0.19)
1.59-2.33
Study phase 1
31F
16 9:7 34.3 (7.0)
(24.0-46.0)
1.75 (0.05)
(1.68-1.82)
75.0 (13.7)
(55.0-103.0)
1.89 (0.16)
(1.62-2.18)
Study phase 1
SE
17 11:6 39.4 (10.4)
25.0-62.0
1.74 (0.09)
1.60-1.90
75.2 (14.5)
62.0-116.0
1.89 (0.20)
1.64-2.43
Number of subjects with EMG*, V̇O2 and HR measurements
Study phase 1
13F
12 8:4 35.6 (9.7)
24.0-51.0
1.74 (0.06)
1.67-1.87
72.9 (11.9)
55.0-99.0
1.87 (0.16)
1.61-2.15
Study phase 1
31F
9 6:3 33.2 (7.3)
24.0-46.0
1.75 (0.05)
1.68-1.82
72.5 (12.5)
55.0-101.0
1.86 (0.14)
1.62-2.12
Study phase 2
Stair machine
25 13:12 35.3 (12.3)
22.0-62.0
1.72 (0.07)
1.59-1.89
74.4 (17.6)
53.0-128.4
1.86 (0.22)
1.53-2.44
Study phase 3
Stair machine
18 9:9 26.7 (4.0)
18.0-32.0
1.73 (0.11)
1.56-1.94
68.0 (11.3)
51.0-85.7
1.81 (0.20)
1.50-2.09
*EMG was not measured ascent on the stationary subway escalator (SE).
2.2.1 Field studies at the self-preferred pace
During the field tests, the subjects visited only once at the specific test building sites. The subjects went through a screening session to determine eligibility using a questionnaire. The basic information was collected, such as age, height, weight, history of illness, occupation, exercise habits, use of public transport, disabilities
45
and medications. The written informed consent was obtained prior to the stair ascent. The subjects were asked to abstain from any vigorous exercise or sport activity prior to the test.
2.2.2 Laboratory studies at the machine-controlled pace
The participant recruitment procedure and instructions prior to the laboratory experiments were the same as for the field study. Participants visited the Gait and Motion (GAM) laboratory on two occasions. During the first visit, the test subjects performed the maximal aerobic capacity (V̇O2max) test. They were asked to complete and sign a health declaration questionnaire before the test. The questionnaire covered basic information on disease history, major illnesses, disabilities and medications in order for them to be able to participate in the experiment. The participants performed the ascension tests on a stair machine (phases 2-3 of the research) during visit 2 after a recovery period of at least 24 hours following their V̇O2max test at visit 1. Two separate written informed consents were also obtained.
At the beginning of each visit, the participants were able to acquaint themselves with the treadmill by walking on it at visit 1 and the stair machine by ascending on it at visit 2. The subjects were asked to refrain from drinking alcohol and strenuous exercise for at least 24 hours before the tests. They were also requested not to have a heavy meal, or drink coffee or tea for at least two hours before the visits. For safety reasons, there were always two researchers available nearby the test subject in the laboratory.
2.3 Instrumentations and subject preparations
2.3.1 Heart rate (HR) and oxygen uptake (V̇O2)
HR was measured with the Polar pulse monitor (RS400) and the H7 sensor (Polar Electronics, Finland). V̇O2 was measured with a portable cardiopulmonary exercise testing (CPET) systems: Metamax II (phases 1-2) (Papers I and II), and Metamax 3B-R2 (Cortex Biophysik GmbH, Germany) (phase 3) (Paper IV). The systems consist of a facemask fastened to the subject with a comfortable snip-snap head harness and straps. A volume transducer and sampling tubes were connected to the facemask in order to measure the minute V̇E and exhaled air O2, CO2 concentrations in 10 s interval by Metamax II in the first and second phases of the research during the field studies and first laboratory study. In these two phases, the measured V̇O2
was stored in the CPET data logger and retrieved into the computer after completion
46
of the measurements. The HR data were recorded with a sampling interval of 5 s. In the third phase, laboratory study, the V̇O2 and HR were measured in breath-by-breath mode by Metamax 3B-R2. All cardiorespiratory data were analyzed as 10 s averages.
Both the Metamax CPET systems were calibrated according to the manufacturers’ recommendations before testing. The instruments were started early in the beginning of each test day to warm up and to measure the atmospheric gas concentrations (20.93% O2 and 0.03% CO2). The volume calibration was made using a 3-liter calibration syringe (Cortex Biophysik GmbH; Leipzig, Germany Model: M9474-C, Medikro Oy, Kuopio, Finland). Before the test of each subject, the CPET device was prepared by measuring the ambient air for reference.
2.3.2 Electromyography (EMG)
A portable surface EMG system, Megawin Biomonitor (ME6000-T16 Mega Electronics, Kuopio, Finland), was used to record raw muscle electrical signals at a sampling rate of 1024 Hz during phases 1 and 2 of the research. The Qualisys Track Manager (QTM) Software, version 2.17 was used in phase 3 (Papers IV and V) to record the raw EMG. The QTM was coupled to a synchronized system of the motion capture cameras, a force plate and the EMG device. The EMG biomonitor and cables weighed in total 550 g and were strapped securely to the test subject’s lower back. The EMG signals of four muscles were measured unilaterally in the dominant lower limb in each phase of the research. This included two superficial thigh muscles: vastus lateralis (VL) and vastus medialis (VM), knee extensor; and two calf muscles: gastrocnemius medialis (GM) and gastrocnemius lateralis (GL), plantar flexor. All four of these muscles were measured at the thirteen-floor (13F) building site. At the thirty-one floor (31F) building site and in the laboratory experiments, however, the hip flexor, rectus femoris (RF) two-joint thigh muscle was measured replacing the VM. In the laboratory study of phase 3, the dorsi flexor muscle, tibialis anterior (TA) was considered instead of GM (Figure 1) (Papers IV and V) for fatigue analysis. The thigh and anterior leg muscles fiber directions and orientations are parallel compared to the calf muscles, which are bipennate relative to the positions of their tendons (Hamill et al., 2015).
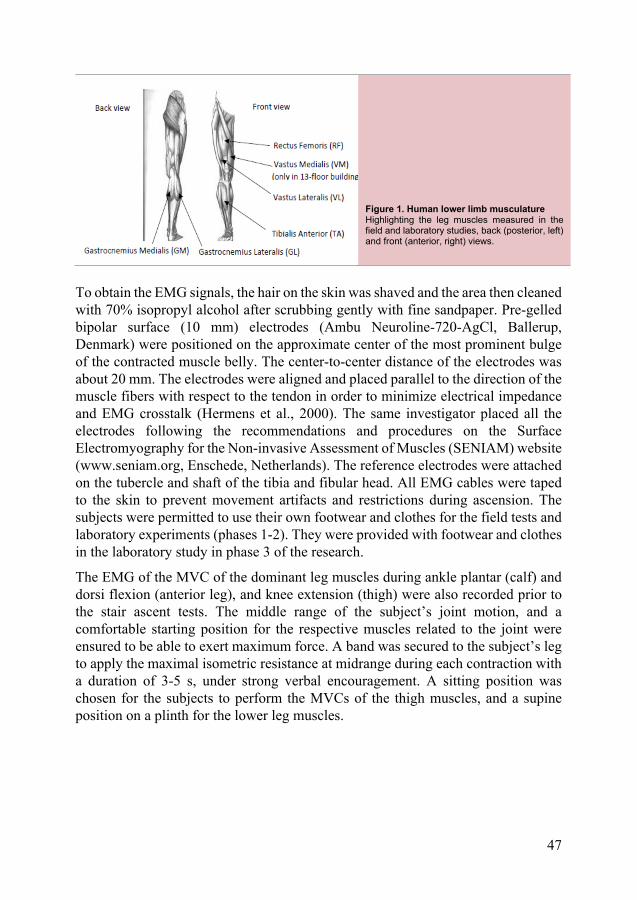
47
Figure 1. Human lower limb musculature Highlighting the leg muscles measured in the field and laboratory studies, back (posterior, left) and front (anterior, right) views.
To obtain the EMG signals, the hair on the skin was shaved and the area then cleaned with 70% isopropyl alcohol after scrubbing gently with fine sandpaper. Pre-gelled bipolar surface (10 mm) electrodes (Ambu Neuroline-720-AgCl, Ballerup, Denmark) were positioned on the approximate center of the most prominent bulge of the contracted muscle belly. The center-to-center distance of the electrodes was about 20 mm. The electrodes were aligned and placed parallel to the direction of the muscle fibers with respect to the tendon in order to minimize electrical impedance and EMG crosstalk (Hermens et al., 2000). The same investigator placed all the electrodes following the recommendations and procedures on the Surface Electromyography for the Non-invasive Assessment of Muscles (SENIAM) website (www.seniam.org, Enschede, Netherlands). The reference electrodes were attached on the tubercle and shaft of the tibia and fibular head. All EMG cables were taped to the skin to prevent movement artifacts and restrictions during ascension. The subjects were permitted to use their own footwear and clothes for the field tests and laboratory experiments (phases 1-2). They were provided with footwear and clothes in the laboratory study in phase 3 of the research.
The EMG of the MVC of the dominant leg muscles during ankle plantar (calf) and dorsi flexion (anterior leg), and knee extension (thigh) were also recorded prior to the stair ascent tests. The middle range of the subject’s joint motion, and a comfortable starting position for the respective muscles related to the joint were ensured to be able to exert maximum force. A band was secured to the subject’s leg to apply the maximal isometric resistance at midrange during each contraction with a duration of 3-5 s, under strong verbal encouragement. A sitting position was chosen for the subjects to perform the MVCs of the thigh muscles, and a supine position on a plinth for the lower leg muscles.
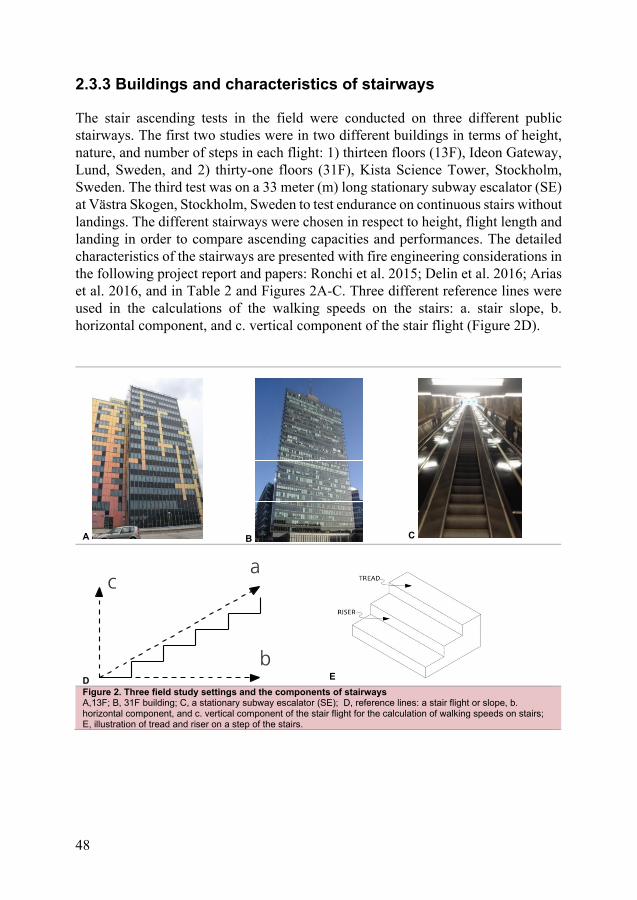
48
2.3.3 Buildings and characteristics of stairways
The stair ascending tests in the field were conducted on three different public stairways. The first two studies were in two different buildings in terms of height, nature, and number of steps in each flight: 1) thirteen floors (13F), Ideon Gateway, Lund, Sweden, and 2) thirty-one floors (31F), Kista Science Tower, Stockholm, Sweden. The third test was on a 33 meter (m) long stationary subway escalator (SE) at Västra Skogen, Stockholm, Sweden to test endurance on continuous stairs without landings. The different stairways were chosen in respect to height, flight length and landing in order to compare ascending capacities and performances. The detailed characteristics of the stairways are presented with fire engineering considerations in the following project report and papers: Ronchi et al. 2015; Delin et al. 2016; Arias et al. 2016, and in Table 2 and Figures 2A-C. Three different reference lines were used in the calculations of the walking speeds on the stairs: a. stair slope, b. horizontal component, and c. vertical component of the stair flight (Figure 2D).
A
B
C
D
E Figure 2. Three field study settings and the components of stairways A,13F; B, 31F building; C, a stationary subway escalator (SE); D, reference lines: a stair flight or slope, b. horizontal component, and c. vertical component of the stair flight for the calculation of walking speeds on stairs; E, illustration of tread and riser on a step of the stairs.
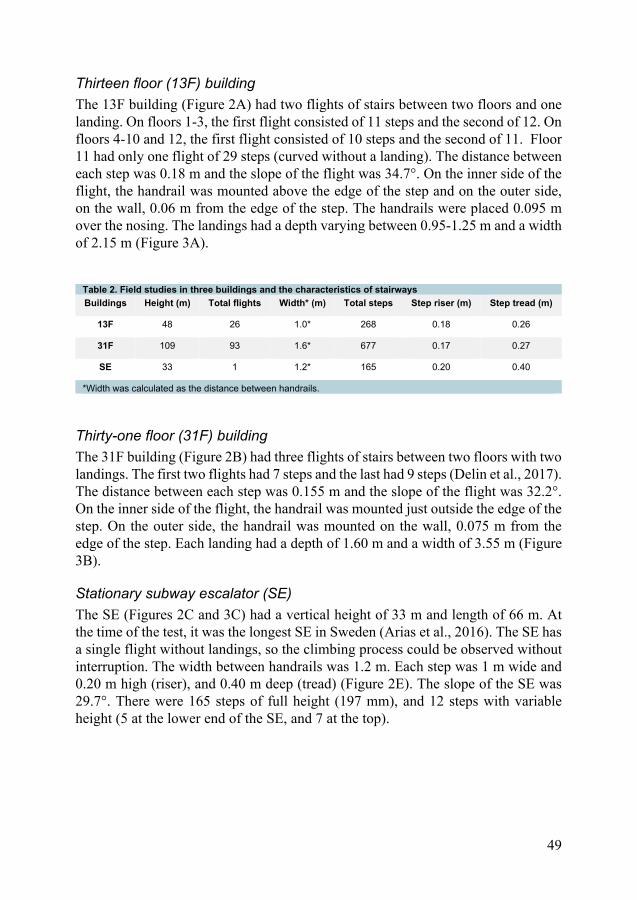
49
Thirteen floor (13F) building The 13F building (Figure 2A) had two flights of stairs between two floors and one landing. On floors 1-3, the first flight consisted of 11 steps and the second of 12. On floors 4-10 and 12, the first flight consisted of 10 steps and the second of 11. Floor 11 had only one flight of 29 steps (curved without a landing). The distance between each step was 0.18 m and the slope of the flight was 34.7°. On the inner side of the flight, the handrail was mounted above the edge of the step and on the outer side, on the wall, 0.06 m from the edge of the step. The handrails were placed 0.095 m over the nosing. The landings had a depth varying between 0.95-1.25 m and a width of 2.15 m (Figure 3A).
Table 2. Field studies in three buildings and the characteristics of stairways Buildings Height (m) Total flights Width* (m) Total steps Step riser (m) Step tread (m)
13F 48 26 1.0* 268 0.18 0.26
31F 109 93 1.6* 677 0.17 0.27
SE 33 1 1.2* 165 0.20 0.40
*Width was calculated as the distance between handrails.
Thirty-one floor (31F) building The 31F building (Figure 2B) had three flights of stairs between two floors with two landings. The first two flights had 7 steps and the last had 9 steps (Delin et al., 2017). The distance between each step was 0.155 m and the slope of the flight was 32.2°. On the inner side of the flight, the handrail was mounted just outside the edge of the step. On the outer side, the handrail was mounted on the wall, 0.075 m from the edge of the step. Each landing had a depth of 1.60 m and a width of 3.55 m (Figure 3B).
Stationary subway escalator (SE) The SE (Figures 2C and 3C) had a vertical height of 33 m and length of 66 m. At the time of the test, it was the longest SE in Sweden (Arias et al., 2016). The SE has a single flight without landings, so the climbing process could be observed without interruption. The width between handrails was 1.2 m. Each step was 1 m wide and 0.20 m high (riser), and 0.40 m deep (tread) (Figure 2E). The slope of the SE was 29.7°. There were 165 steps of full height (197 mm), and 12 steps with variable height (5 at the lower end of the SE, and 7 at the top).
50
2.3.4 Stair machine characteristics
Subjects performed the ascent on a stair machine with a step riser of 20.5 cm and tread depth of 25.0 cm (StairMaster, SM5, Vancouver, WA, U.S.A.). This machine was considered to simulate the stair ascending best in order to determine the ascending endurance on the escalator at a fixed SR. The stair machine allowed SR adjustments at 20 different levels from 24 to 162 steps·min-1 (Figures 3D and 3E a).
2.3.5 Walkway and force plate
The walking trials were conducted on a linear, 10° inclined walkway with a total length of 5.0 m and width of 1.0 m (Figures 3E b and c). The walkway has a built-in three-dimensional force plate (Kistler 9281B, Switzerland) to record GRFs (Gao et al., 2014). The force plate was positioned at 3.5 and 1.5 m on the walkway walking downward and upward, respectively. This allowed enough space for natural walking patterns. The surface of the walkway was made of a plain metal plate. The DAQ (data acquisition) system 5695A1 with an amplifier type 9865A was connected to the force plate. The participants wore a similar model (Nike Air Relentless 6, Vietnam) of sports shoes for the stair ascent and walking tests in phase 3 (Papers IV-V). Before the walking trials, the subjects walked up and down in order to familiarize themselves with the walkway and identify a comfortable, self-selected pace when the dominant foot struck on the force plate (Figures 3E b and c).
2.3.6 Motion capture (MoCap) system and markers
The reflective motion of the markers during stair ascent at 100% V̇O2max and in the walking trials was traced using an eight-camera Pro-Reflex MoCap system (Qualisys, Gothenburg, Sweden). The MoCap system, the force plate and the EMG were synchronized during data collection. All three types of data were collected in the MoCap system. The MoCap system and cameras were calibrated before each test using the calibration kit with the L shape bar in order to be aligned with the force plate and the areas of stair ascending and walking. The inclined force plate on the walkway was identified by putting four markers on its four corners, following the manual instructions in order to have the right walking direction and coordinating system. Thirty-two (12 mm) reflective passive markers were placed bilaterally (otherwise single positions were specified) over various bony landmarks on the subject’s skin (Figure 3E d). The markers’ positions on the human body were combined with both running and gait standards (Gullstrand et al., 2009; Longpre et al., 2013; Parijat & Lockhart, 2008). The MoCap kinematic data were sampled and recorded at 200 Hz. The MoCap data were processed in the QTM (Paper V).
51
2.3.7 Other instruments for measurements
In the field A video camera (HDR AS30V, Sony Corporation, Japan) was belted to the subject’s waist to record the ascending duration (AD) and speed. The AD in the field studies at phase 1 was defined as the moment between when a participant trod on the first stair step and off the last stair step recorded by the camera. The recorded ascending speeds were converted into 10 s intervals to fit with other physiological measurements. The total weight of all the instruments on the subjects was about 2.5 kg. Additionally, a number of fixed cameras (Drift Innovation, X170, Stockholm, Sweden) were mounted on the walls of every floor in the building stairways, and every three-meters on the escalator to capture human movements (Delin et al., 2017).
In the laboratory In the research phase 3, the fingertip blood sample was also obtained using a hand-held analyzer, Lactate Scout+ (EKF diagnostics, Penarth, Cardiff, U.K.), to measure the BLa− levels on both visits, immediately after the V̇O2max and stair ascending tests.
2.4 Study procedures
2.4.1 Self-preferred pace ascents in the field
The individual subjects were equipped with instruments to measure the V̇O2, HR, speed, and EMG of the dominant lower limb muscles. Due to the aims of the main project and the limited time for the use of the SE, the EMG measurement requiring a relatively long preparation of the subjects was skipped for the short SE. The subjects were informed that the test was about the measurement of physiological parameters during emergency evacuation. They were asked to select their own self-preferred pace that would allow them to continue the ascent on the number of floors in each building with which they were unacquainted. All kinds of ascent strategies were acceptable, such as single or double steps and using the handrails. The subjects were allowed to take a break during ascent. A research team member waited at the defined floor indicating the end of the ascent. The test participants were requested to rate their perceived exertion (RPE) on the scale between 6 and 20 (Borg, 1990) by reporting the corresponding number at the defined floors and when they met the researcher at the end of their ascent (Delin et al., 2017).
52
2.4.2 Machine-controlled pace ascents in the laboratory
Individual step rates (SRs) were pre-determined for each subject at four different intensities: 60%, 75%, 90% (Paper II), and 100% of maximal aerobic capacity (V̇O2max) including the MoCap system (Paper IV) based on the SRs predicted by the physiological evacuation model (Paper III) (RQ 3). The pre-determined SRs and test durations are given in Table 3.
Maximal aerobic capacity (V̇O2max) test The V̇O2max test was carried out on a treadmill (Exercise™, x-track elite, Norway) during phases 2 and 3 of the research. The test started with a 5 min rest followed by walking at 4 km·h-1 for 3 min and jogging at 8 km·h-1 for 2 min. The test continued with running at an incremental speed of about 2 or 1 km·h-1 for each 2 min interval. The speed increment continued until the individual indicated with a hand sign that he or she had reached a suitable speed at which to continue running. The inclination was then set on the treadmill with increments of 3% after each 2 min running interval until exhaustion (ACSM, 2010). The maximum V̇O2 in mL·min-1·kg-1 and the HR values in the 10 s averages obtained during the V̇O2max test period were designated as the individual’s V̇O2max and HRmax, respectively.
Stair ascent on the stair machine The subjects were briefed on the safety information about the experiment and were asked to sign a separate informed consent form for the ascending test. They were equipped with instruments to measure the V̇O2, HR and EMG of the dominant lower limb muscles in the laboratory study of phase 2 of this research. In the phase 3 laboratory study, reflective markers were attached additionally to capture motions (Paper V). A three-minute resting period was allowed before starting each of the first two ascents at 60 and 75% V̇O2max SR, and there was a five-minute resting period just before 90 and 100% V̇O2max intensities. The subjects were instructed to ascend until exhaustion or at least 5 minutes at 90% V̇O2max, and until exhaustion at 100% V̇O2max (Figures 3D and 3E a, respectively) (Table 3). These 90 and 100% V̇O2max intensities were assumed to correspond to the subjects’ all-out effort speeds, which they would aim for during an emergency evacuation situation.
The subjects were encouraged by cheering to achieve their maximum ascending performance. They were allowed to hold on to the handrails. The subjects carried out a rating of perceived exertion (RPE) at the end of the stair ascent. Fingertip BLa− was also measured in order to confirm the level of exhaustion and fatigue by comparing the values with the post-V̇O2max tests (Paper IV).
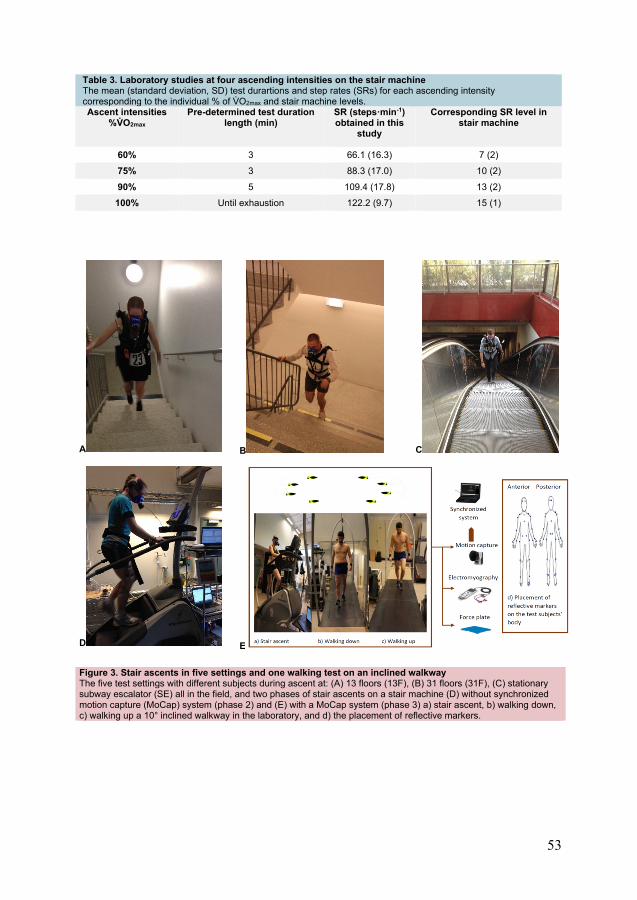
53
Table 3. Laboratory studies at four ascending intensities on the stair machine The mean (standard deviation, SD) test durartions and step rates (SRs) for each ascending intensity corresponding to the individual % of V̇O2max and stair machine levels. Ascent intensities
%V̇O2max Pre-determined test duration
length (min) SR (steps·min-1) obtained in this
study
Corresponding SR level in stair machine
60% 3 66.1 (16.3) 7 (2)
75% 3 88.3 (17.0) 10 (2)
90% 5 109.4 (17.8) 13 (2)
100% Until exhaustion 122.2 (9.7) 15 (1)
A B C
D E
Figure 3. Stair ascents in five settings and one walking test on an inclined walkway The five test settings with different subjects during ascent at: (A) 13 floors (13F), (B) 31 floors (31F), (C) stationary subway escalator (SE) all in the field, and two phases of stair ascents on a stair machine (D) without synchronized motion capture (MoCap) system (phase 2) and (E) with a MoCap system (phase 3) a) stair ascent, b) walking down, c) walking up a 10° inclined walkway in the laboratory, and d) the placement of reflective markers.
54
2.4.3 Physiological evacuation model (RQ 3)
The individual subject’s V̇O2max relative value in mL·min-1·kg-1 is the core of this model. This was the basis on which to calculate the SR to be used by the subject on the stair machine. The human ascending endurance and cardiorespiratory performance data reported in Paper I from the phase 1 three field studies and the European database with wide range of participants (Loe et al., 2013) with human physiological capacity data were used to develop this model in Paper III.
In the process of the development of the physiological evacuation model for SR calculation, 13 male and 12 female subjects were involved first. Individual ascending speeds at 50 and 70% of their V̇O2max levels were selected for 3 minutes, and the 90% level was up to 5 minutes or until exhaustion for the model development with the first 19 subjects. The model was then validated on the last 6 subjects with the intended ascending levels at 60, 75 and 90% of their maximal aerobic capacity, corresponding up to 120, 15 and 5 minutes of continuous work, respectively (Papers II and III). The prediction equation of the SR in steps·min-1 was:
SR = −108.8633 + 2.0121 (VO ) + 1.3289 (%VO ) (Paper III)
However, the constant of this equation was updated after phase 2 of the research in the laboratory at three different % of V̇O2max corresponding speeds on the stair machine in Paper II. Thus, the following, new equation was used for the SR prediction for 100% V̇O2max in phase 3 of the research in the laboratory, Paper IV: SR = 24.0267 + 2.0121 (VO ) (Paper IV)
Additionally, the vertical displacement (Vdisp) in m·min-1 was calculated by using the following equation: V = −21.7727 + 0.4024 VO + 0.2658 (%VO ) (Paper III)
2.4.4 Walking gait trials up a 10° inclined walkway
The reflective markers were placed on visit 2 in the laboratory study in phase 3. After the MVC test, the subjects first performed three walking trials down and up the inclined walkway for reference (pre-exhaustion and unfatigued muscles). Then the subjects ascended on the stair machine at their maximum speeds corresponding
55
to 100% V̇O2max until exhaustion. Finally, the subjects were asked to walk again three times (Figures 3E b and c) immediately after ascents on the stair machine and BLa− measurements. This thesis has focused on the walking gait uphill, which is relevant to stair-ascending evacuation (Paper V).
2.5 Data analysis
2.5.1 EMG data processing and normalization
The raw EMG signals were filtered through a band pass filter (20-499 Hz) in order to eliminate low frequency movement and electrocardiographic artifacts in the Megawin software, version 3.1-b10 (phases 1-2 of the research) (Papers I and II) and Matlab R2016a and R2018a (phase 3) (Papers IV and V). The recorded individual AD differed according to the subjects’ own ascending capacities at 90 and 100% V̇O2max SR. Therefore, each subject’s total AD was divided into 10 equal lengths (10%) of the total individual ascending period (100%). The 10% duration dataset was then averaged to yield 10 data points for both MDF in Hz and AMP in µV to evaluate fatigue. This normalization method was applied to compare the dynamic muscle activities per unit time (Dingwell et al., 2008; MacIsaac et al., 2001). The MDF was retrieved from average spectrum analysis using the calculation window. Root mean square (RMS) averaging was also applied to obtain average AMP values from each 10% period. As there is no absolute scale for EMG AMPs, and the AMPs vary between subjects, and direct raw value comparisons between subjects or conditions cannot be made. Thus, each average 10% AMP dataset was normalized by the average AMP of the three MVC tests of the respective muscles for each subject during phase 2 of research (Paper II), and the maximum AMP from the total AD for the field tests (Paper I).
In contrast, the middle 3 seconds’ average AMP of each MVC value was too low for a few subjects in the phase 3 laboratory study ascents at 100% V̇O2max SR (Paper IV) and walking trials (Paper V). Therefore, the individual maximum AMP of each MVC and then the average of three MVCs was used to normalize each AMP data point for each muscle to get the AMPs as the percentage of the MVC.
The normalized AMP and MDF for each 10% period were calculated for all subjects in order to observe related muscle activity changes during the progressive ascension. EMG signals containing excess noise were excluded from the analyses.
56
2.5.2 Calculations and statistics
Stair ascending physiological parameters (Papers I, II and IV) The averages of all individual subject maximums (highest) were calculated. The means of the physiological parameters were calculated including V̇O2, HR and metabolic rate (M) that had reached reasonably stable states (mean stable) after the initial growth in all three field studies and in the laboratory ascending SRs. These values were averaged for all subjects in order to determine the maximum capacities of stair ascents. The continuous increments in the graphs of V̇O2, HR and M were visually inspected by two researchers until the physiological parameters reached a steady level in order to determine their mean stable (mean stable) values (Paper I) and (Halder, 2017). The two researchers scrutinized the graphs together and came to a consensus on the starting point of steady level after the sharp increase. They then calculated an average until the end of graph in the corresponding ascent. The V̇O2, HR, and ascending speed data from the tests were also normalized to 0-100% periods following the same procedure of EMG normalization.
Normality test were performed on the EMG values. Both the Kolmogorov-Smirnov and Shapiro Wilk tests significantly denied normal distribution of the data, which is why the parametric mixed model and analysis of variance (ANOVA) tests were ignored. Thus, for nonparametric related samples, Friedman’s test was performed to determine the statistical significance of how the related muscle activities changed over normalized AD (10-100%) for both the EMG AMPs and MDFs (Papers I, II and IV).
Incline walking gait biomechanics parameters (Paper V) The stance phase (SP) walking gait biomechanics parameters’ peaks – including the two GRFs: vertical (GRFzpeak) and longitudinal or anterior-posterior shear (GRFypeak) – were obtained from the whole heel-strike (HS, 0 to 50%) and toe-off (TO, 50 to 100%) periods of SP (Figure 9A). In order to find out the critical time point for slip risks, the peak of the required co-efficient of friction (RCOFpeak) was calculated for each trial by dividing the longitudinal force by vertical force: (GRFy/GRFz). A combined method was adopted based on the literature to determine the RCOFpeak (Chang et al., 2011, 2012; Chang et al., 2016). The first and last 5% of the time-normalized period values for HS and TO, respectively were truncated to determine the RCOFpeak. Specifically, the RCOFpeak for the HS was calculated between 5 and 25% of the time-normalized periods and the RCOFpeak
during TO was retrieved between the 75 and 95% periods of the SP (Figure 9B).
Similarly, the peak angle (anglepeak), acceleration (angaccx peak), velocity (angvelx peak) for the hip, knee, ankle and foot absolute angle relative to the ground were also determined following the methods of the International Society of Biomechanics (ISB) and Hamill et el. (Hamill et al., 2015) from the motion data using the same
57
synchronized time periods of RCOFpeak for both HS and TO. Additionally, the minimum angle (anglemin) was calculated for the foot absolute angle relative to the ground only (Turner et al., 2006). The mean EMG AMP and MDF were also calculated using the determined RCOFpeak time window (Figure 9B). The mean value of three gait trials was calculated before and after exhaustion for all variables and for all 18 subjects. This mean value was used for a statistical comparison analysis. Paired sample t-tests were performed to determine the statistical significance of the differences before and after fatigue for SP duration, RCOFpeak, GRFzpeak, GRFypeak, anglepeak, anglemin, angvelx peak and angaccx peak (Paper V).
All the calculations and statistical analyses were carried out using Excel 2016 (Microsoft Corporation, U.S.A.), Matlab R2016a and R2018a (The MathWorks Inc, Natick, MA, U.S.A.), and the Statistical Package for the Social Science (SPSS) versions 24.0-26.0 (IBM Corporation, U.S.A.). A probability (p) value of ≤0.05 was considered to be statistically significant.
2.6 Muscle activity interpretation model (RQ 4)
In order to determine local muscle fatigue (LMF), a common and established method is to observe the individual results of increased AMP and decreased or shifted MDF toward lower values (Allison & Fujiwara, 2002; Lowery et al., 2002). However, I was interested in seeing if this method was effective and useful when using both AMP and MDF changes combined in one output to estimate fatigue. The method of plotting the muscle activity rate change (MARC) point in muscle activity interpretation squares (MAIS) is used as a model to interpret muscle fatigue (Papers I, II and IV).
2.6.1 Muscle activity rate change (MARC)
This research introduces the MARC point to interpret and evaluate dynamic tasks based on EMG data. MARC was achieved by dividing the total working period or the AD (100%) EMG data into ten divisions of equal length (10%) for each individual. The EMG data belonging to each 10% are then averaged to yield one data point, for a total of 10 averaged data points for the 100% period. This was done to observe the changes of both the AMP in µV and the MDF in Hz over time. Later, both the EMG AMP and MDF values of each 10% periodical average were combined as one value to represent the MARC point per unit of time, which was plotted in the MAIS.
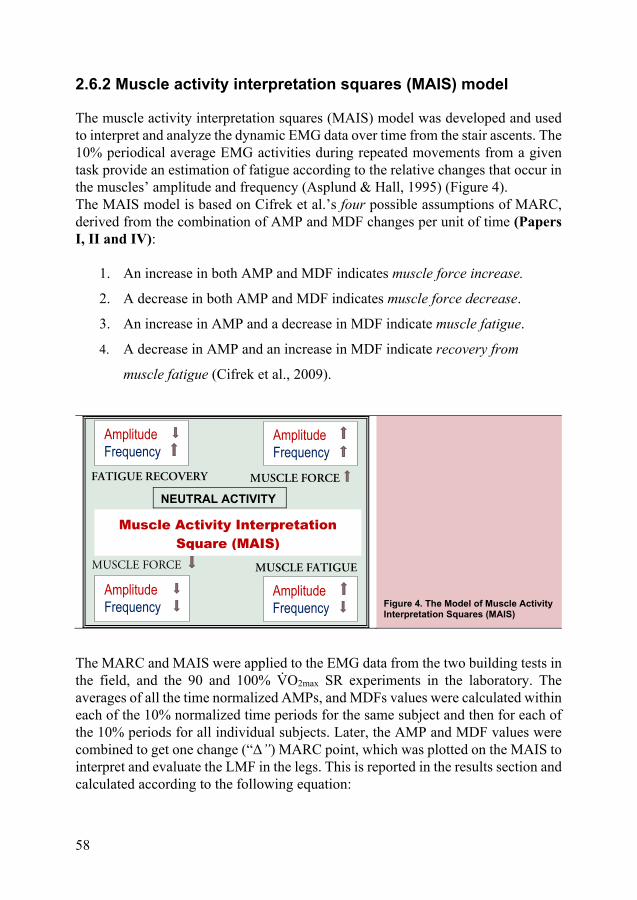
58
2.6.2 Muscle activity interpretation squares (MAIS) model
The muscle activity interpretation squares (MAIS) model was developed and used to interpret and analyze the dynamic EMG data over time from the stair ascents. The 10% periodical average EMG activities during repeated movements from a given task provide an estimation of fatigue according to the relative changes that occur in the muscles’ amplitude and frequency (Asplund & Hall, 1995) (Figure 4). The MAIS model is based on Cifrek et al.’s four possible assumptions of MARC, derived from the combination of AMP and MDF changes per unit of time (Papers I, II and IV):
1. An increase in both AMP and MDF indicates muscle force increase.
2. A decrease in both AMP and MDF indicates muscle force decrease.
3. An increase in AMP and a decrease in MDF indicate muscle fatigue.
4. A decrease in AMP and an increase in MDF indicate recovery from
muscle fatigue (Cifrek et al., 2009).
FATIGUE RECOVERY
Figure 4. The Model of Muscle Activity Interpretation Squares (MAIS)
The MARC and MAIS were applied to the EMG data from the two building tests in the field, and the 90 and 100% V̇O2max SR experiments in the laboratory. The averages of all the time normalized AMPs, and MDFs values were calculated within each of the 10% normalized time periods for the same subject and then for each of the 10% periods for all individual subjects. Later, the AMP and MDF values were combined to get one change (“Δ”) MARC point, which was plotted on the MAIS to interpret and evaluate the LMF in the legs. This is reported in the results section and calculated according to the following equation:
Amplitude Frequency
Amplitude Frequency
MUSCLE FATIGUE
MUSCLE FORCE
Amplitude Frequency
Amplitude Frequency
MUSCLE FORCE
NEUTRAL ACTIVITY
Muscle Activity Interpretation Square (MAIS)
59
Δ 𝑀𝐴𝑅𝐶 = ̅⁄ where,
Δ MARC is the change in a selected parameter for AMP and MDF values over normalized time in µV·s-1 and Hz·s-1; 𝑥 is the value of AMP and MDF at each normalized time point n; 𝑥 is the value of AMP and MDF at a normalized time point n-1; 𝑡̅ is the average duration in seconds for the stair ascending in each of the 13F, 31F buildings, and at SRs corresponding to 90% and 100% V̇O2max on a stair machine in the laboratory; 10 is the selected number of normalized time divisions.
60
3 Results
3.1 Maximum oxygen uptake (V̇O2max) and heart rate (HRmax)
The average V̇O2max and HRmax measured for the subjects on a treadmill in phase 2 of the research in the laboratory were 46.7 (9.2) with a range of 29.7-60.6 mL·min-
1·kg-1, and 190 (14) with a range of 161-212 b·min-1, respectively (Paper II). During phase 3, the V̇O2max and HRmax values obtained were 48.5 (5.4) with a range of 38.1-55.7 mL·min-1·kg-1, and 192 (9) with a range of 176-212 b·min-1, respectively (Paper IV).
3.2 Stair ascending cardiorespiratory capacities at self-preferred versus machine-controlled pace mode (RQ 1)
All the subjects who ascended the buildings stairways in the field at their self-preferred step rates (SRs) managed to reach the top floor with the exception of one female. She withdrew due to pain in her right knee after ascending 21 of the 31 floors. The average ascending durations (ADs) were 2.9, 7.8, and 1.7 minutes to ascend 268 steps (13F), 677 steps (31F), and 165 steps (SE), respectively.
The laboratory participants in the machine-controlled mode managed to easily ascend the first two, 3-min pre-determined fixed durations at 60 and 75% V̇O2max at the machine-controlled SRs. Seventeen of the twenty-five participants managed to sustain the ascents for at least a 5-min duration at 90% V̇O2max. The remaining eight quit before 5 min (range 2-4 min). The stair ascending durations varied at 100% V̇O2max and the subjects perceived the intensity as being extremely hard at both of the highest ascending SRs. The average RPE was ≥18 on the Borg’s scale between 6 and 20, indicating maximal exertion and confirmed exhaustion. The mean post-stair ascending BLa− level at the end of 100% V̇O2max corresponding SRs was slightly higher, 14.4 mmol·l-1 than the mean of the post-V̇O2max test value of 14.2 mmol·l-1 (Paper IV).
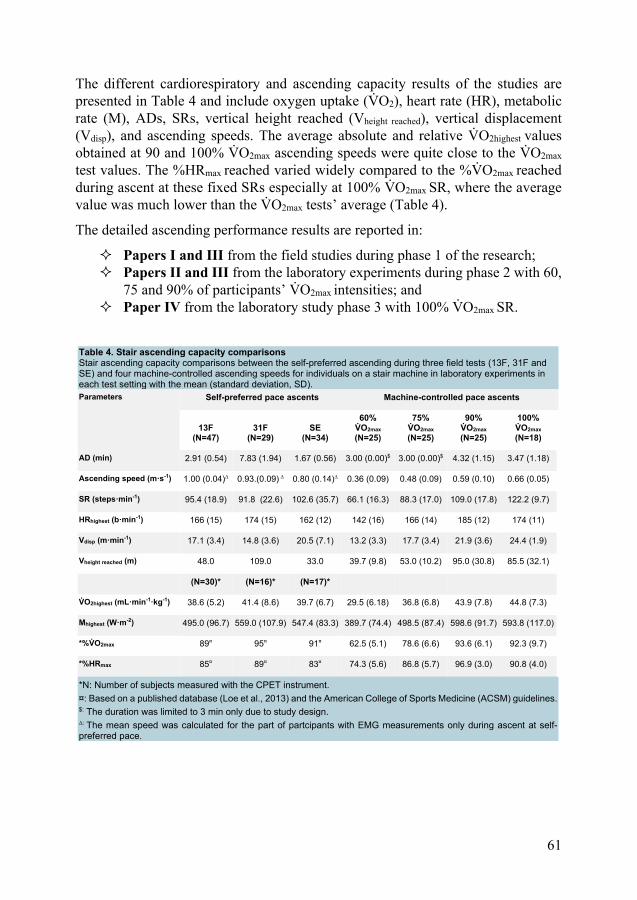
61
The different cardiorespiratory and ascending capacity results of the studies are presented in Table 4 and include oxygen uptake (V̇O2), heart rate (HR), metabolic rate (M), ADs, SRs, vertical height reached (Vheight reached), vertical displacement (Vdisp), and ascending speeds. The average absolute and relative V̇O2highest values obtained at 90 and 100% V̇O2max ascending speeds were quite close to the V̇O2max test values. The %HRmax reached varied widely compared to the %V̇O2max reached during ascent at these fixed SRs especially at 100% V̇O2max SR, where the average value was much lower than the V̇O2max tests’ average (Table 4).
The detailed ascending performance results are reported in:
Papers I and III from the field studies during phase 1 of the research; Papers II and III from the laboratory experiments during phase 2 with 60,
75 and 90% of participants’ V̇O2max intensities; and Paper IV from the laboratory study phase 3 with 100% V̇O2max SR.
Table 4. Stair ascending capacity comparisons Stair ascending capacity comparisons between the self-preferred ascending during three field tests (13F, 31F and SE) and four machine-controlled ascending speeds for individuals on a stair machine in laboratory experiments in each test setting with the mean (standard deviation, SD). Parameters Self-preferred pace ascents Machine-controlled pace ascents
13F (N=47)
31F (N=29)
SE (N=34)
60% V̇O2max (N=25)
75% V̇O2max (N=25)
90% V̇O2max (N=25)
100% V̇O2max (N=18)
AD (min) 2.91 (0.54) 7.83 (1.94) 1.67 (0.56) 3.00 (0.00)$ 3.00 (0.00)$ 4.32 (1.15) 3.47 (1.18)
Ascending speed (m·s-1) 1.00 (0.04)∆ 0.93.(0.09) ∆ 0.80 (0.14)∆ 0.36 (0.09) 0.48 (0.09) 0.59 (0.10) 0.66 (0.05)
SR (steps·min-1) 95.4 (18.9) 91.8 (22.6) 102.6 (35.7) 66.1 (16.3) 88.3 (17.0) 109.0 (17.8) 122.2 (9.7)
HRhighest (b·min-1) 166 (15) 174 (15) 162 (12) 142 (16) 166 (14) 185 (12) 174 (11)
Vdisp (m·min-1) 17.1 (3.4) 14.8 (3.6) 20.5 (7.1) 13.2 (3.3) 17.7 (3.4) 21.9 (3.6) 24.4 (1.9)
Vheight reached (m) 48.0 109.0 33.0 39.7 (9.8) 53.0 (10.2) 95.0 (30.8) 85.5 (32.1)
(N=30)* (N=16)* (N=17)*
V̇O2highest (mL·min-1·kg-1) 38.6 (5.2) 41.4 (8.6) 39.7 (6.7) 29.5 (6.18) 36.8 (6.8) 43.9 (7.8) 44.8 (7.3)
Mhighest (W·m-2) 495.0 (96.7) 559.0 (107.9) 547.4 (83.3) 389.7 (74.4) 498.5 (87.4) 598.6 (91.7) 593.8 (117.0)
*%V̇O2max 89¤ 95¤ 91¤ 62.5 (5.1) 78.6 (6.6) 93.6 (6.1) 92.3 (9.7)
*%HRmax 85¤ 89¤ 83¤ 74.3 (5.6) 86.8 (5.7) 96.9 (3.0) 90.8 (4.0)
*N: Number of subjects measured with the CPET instrument. ¤: Based on a published database (Loe et al., 2013) and the American College of Sports Medicine (ACSM) guidelines. $: The duration was limited to 3 min only due to study design. ∆: The mean speed was calculated for the part of partcipants with EMG measurements only during ascent at self-preferred pace.
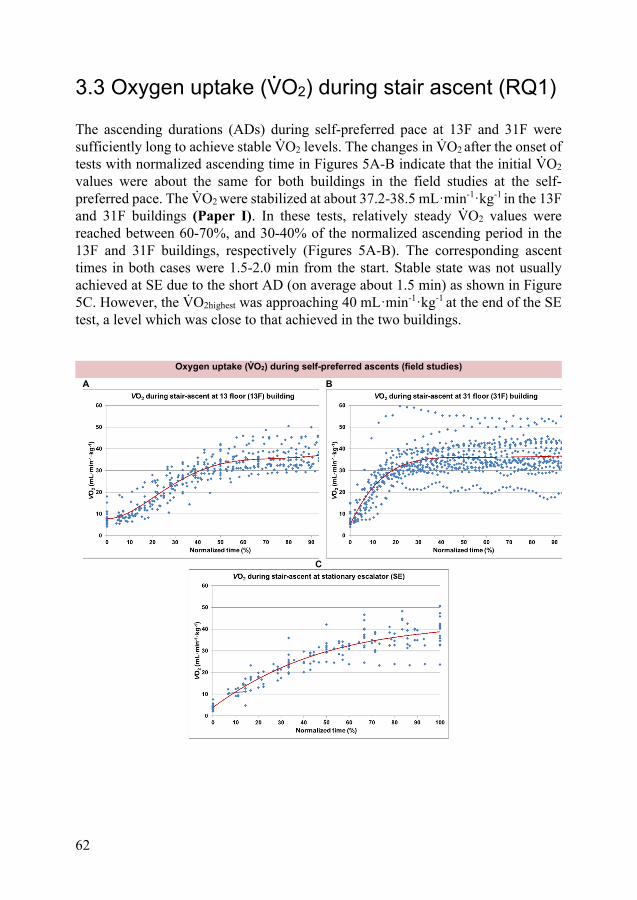
62
3.3 Oxygen uptake (V̇O2) during stair ascent (RQ1)
The ascending durations (ADs) during self-preferred pace at 13F and 31F were sufficiently long to achieve stable V̇O2 levels. The changes in V̇O2 after the onset of tests with normalized ascending time in Figures 5A-B indicate that the initial V̇O2 values were about the same for both buildings in the field studies at the self-preferred pace. The V̇O2 were stabilized at about 37.2-38.5 mL·min-1·kg-1 in the 13F and 31F buildings (Paper I). In these tests, relatively steady V̇O2 values were reached between 60-70%, and 30-40% of the normalized ascending period in the 13F and 31F buildings, respectively (Figures 5A-B). The corresponding ascent times in both cases were 1.5-2.0 min from the start. Stable state was not usually achieved at SE due to the short AD (on average about 1.5 min) as shown in Figure 5C. However, the V̇O2highest was approaching 40 mL·min-1·kg-1 at the end of the SE test, a level which was close to that achieved in the two buildings.
Oxygen uptake (V̇O2) during self-preferred ascents (field studies)
A B
C
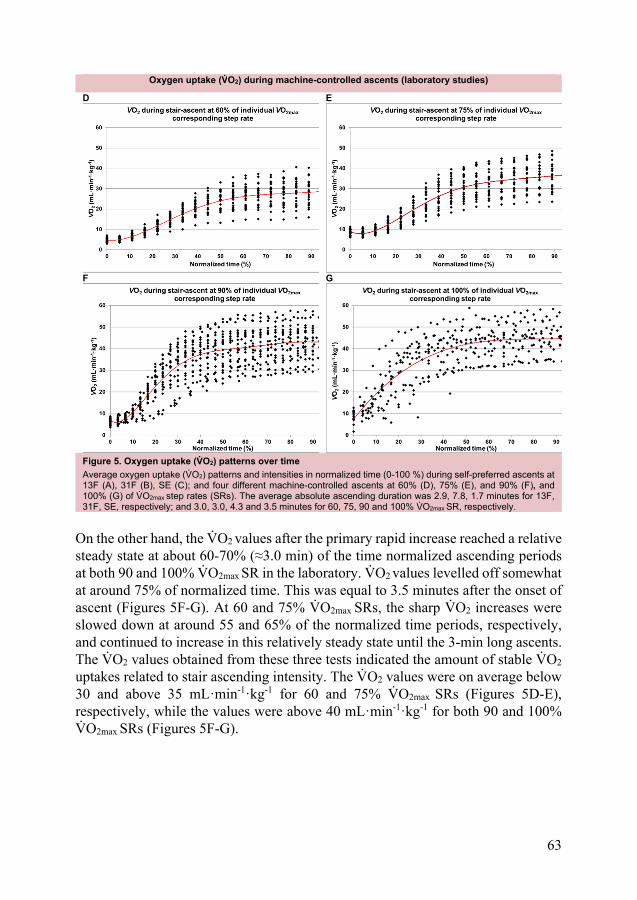
63
Oxygen uptake (V̇O2) during machine-controlled ascents (laboratory studies)
D E
F G
Figure 5. Oxygen uptake (V̇O2) patterns over time Average oxygen uptake (V̇O2) patterns and intensities in normalized time (0-100 %) during self-preferred ascents at 13F (A), 31F (B), SE (C); and four different machine-controlled ascents at 60% (D), 75% (E), and 90% (F), and 100% (G) of V̇O2max step rates (SRs). The average absolute ascending duration was 2.9, 7.8, 1.7 minutes for 13F, 31F, SE, respectively; and 3.0, 3.0, 4.3 and 3.5 minutes for 60, 75, 90 and 100% V̇O2max SR, respectively.
On the other hand, the V̇O2 values after the primary rapid increase reached a relative steady state at about 60-70% (≈3.0 min) of the time normalized ascending periods at both 90 and 100% V̇O2max SR in the laboratory. V̇O2 values levelled off somewhat at around 75% of normalized time. This was equal to 3.5 minutes after the onset of ascent (Figures 5F-G). At 60 and 75% V̇O2max SRs, the sharp V̇O2 increases were slowed down at around 55 and 65% of the normalized time periods, respectively, and continued to increase in this relatively steady state until the 3-min long ascents. The V̇O2 values obtained from these three tests indicated the amount of stable V̇O2 uptakes related to stair ascending intensity. The V̇O2 values were on average below 30 and above 35 mL·min-1·kg-1 for 60 and 75% V̇O2max SRs (Figures 5D-E), respectively, while the values were above 40 mL·min-1·kg-1 for both 90 and 100% V̇O2max SRs (Figures 5F-G).
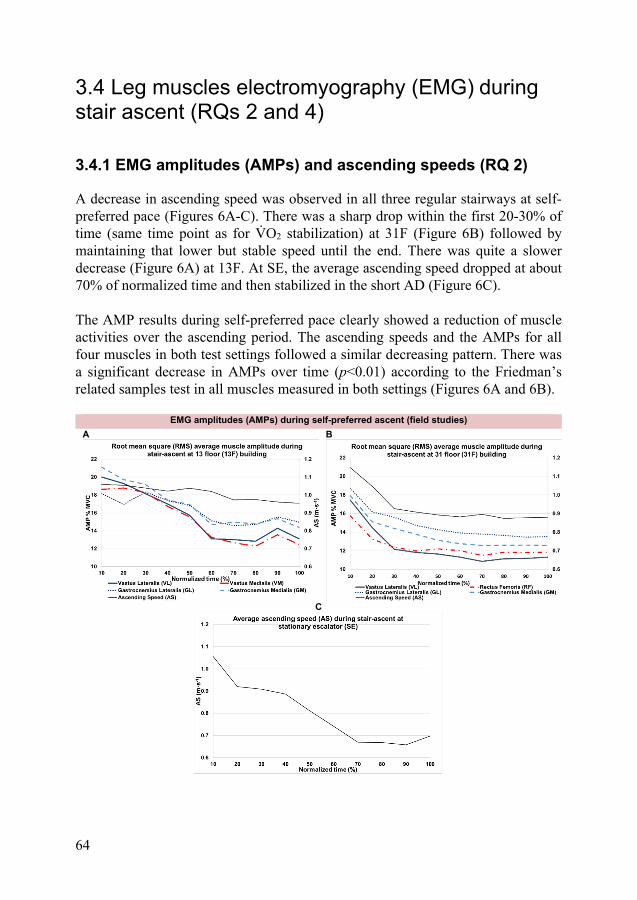
64
3.4 Leg muscles electromyography (EMG) during stair ascent (RQs 2 and 4)
3.4.1 EMG amplitudes (AMPs) and ascending speeds (RQ 2)
A decrease in ascending speed was observed in all three regular stairways at self-preferred pace (Figures 6A-C). There was a sharp drop within the first 20-30% of time (same time point as for V̇O2 stabilization) at 31F (Figure 6B) followed by maintaining that lower but stable speed until the end. There was quite a slower decrease (Figure 6A) at 13F. At SE, the average ascending speed dropped at about 70% of normalized time and then stabilized in the short AD (Figure 6C).
The AMP results during self-preferred pace clearly showed a reduction of muscle activities over the ascending period. The ascending speeds and the AMPs for all four muscles in both test settings followed a similar decreasing pattern. There was a significant decrease in AMPs over time (p<0.01) according to the Friedman’s related samples test in all muscles measured in both settings (Figures 6A and 6B).
EMG amplitudes (AMPs) during self-preferred ascent (field studies) A B
C
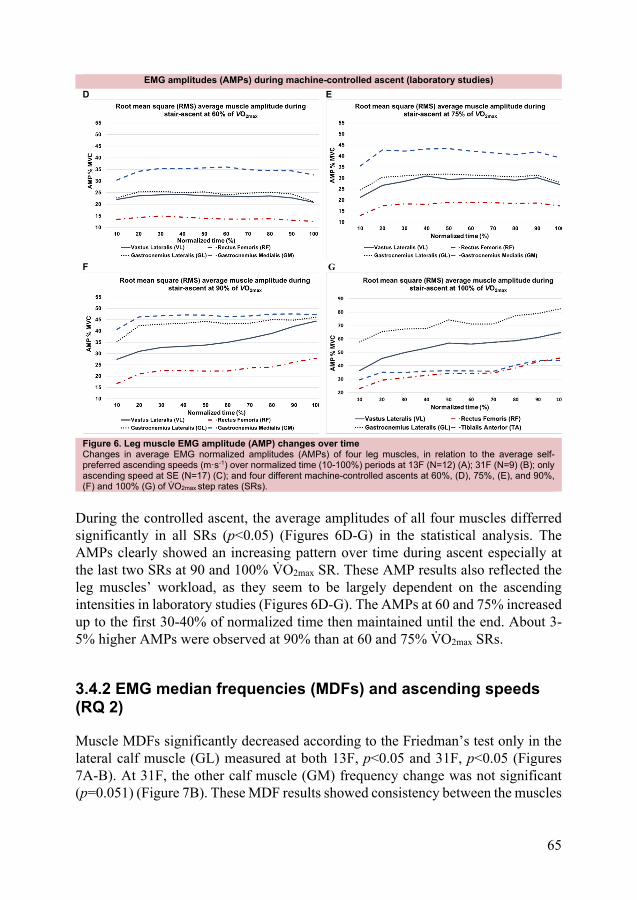
65
EMG amplitudes (AMPs) during machine-controlled ascent (laboratory studies) D E
F G
Figure 6. Leg muscle EMG amplitude (AMP) changes over time Changes in average EMG normalized amplitudes (AMPs) of four leg muscles, in relation to the average self-preferred ascending speeds (m·s-1) over normalized time (10-100%) periods at 13F (N=12) (A); 31F (N=9) (B); only ascending speed at SE (N=17) (C); and four different machine-controlled ascents at 60%, (D), 75%, (E), and 90%, (F) and 100% (G) of V̇O2max step rates (SRs).
During the controlled ascent, the average amplitudes of all four muscles differred significantly in all SRs (p<0.05) (Figures 6D-G) in the statistical analysis. The AMPs clearly showed an increasing pattern over time during ascent especially at the last two SRs at 90 and 100% V̇O2max SR. These AMP results also reflected the leg muscles’ workload, as they seem to be largely dependent on the ascending intensities in laboratory studies (Figures 6D-G). The AMPs at 60 and 75% increased up to the first 30-40% of normalized time then maintained until the end. About 3-5% higher AMPs were observed at 90% than at 60 and 75% V̇O2max SRs.
3.4.2 EMG median frequencies (MDFs) and ascending speeds (RQ 2)
Muscle MDFs significantly decreased according to the Friedman’s test only in the lateral calf muscle (GL) measured at both 13F, p<0.05 and 31F, p<0.05 (Figures 7A-B). At 31F, the other calf muscle (GM) frequency change was not significant (p=0.051) (Figure 7B). These MDF results showed consistency between the muscles
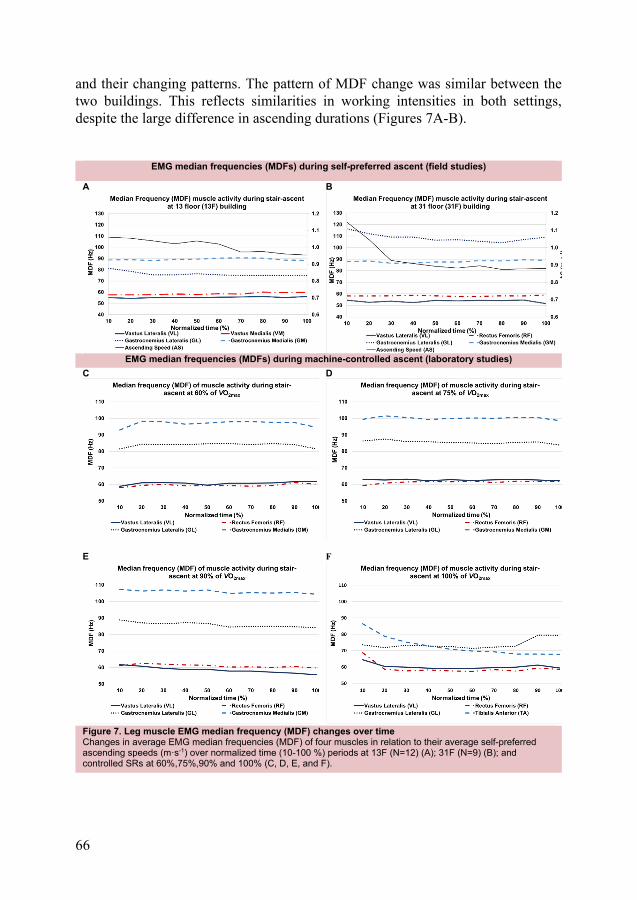
66
and their changing patterns. The pattern of MDF change was similar between the two buildings. This reflects similarities in working intensities in both settings, despite the large difference in ascending durations (Figures 7A-B).
EMG median frequencies (MDFs) during self-preferred ascent (field studies)
A B
EMG median frequencies (MDFs) during machine-controlled ascent (laboratory studies) C
D
E F
Figure 7. Leg muscle EMG median frequency (MDF) changes over time Changes in average EMG median frequencies (MDF) of four muscles in relation to their average self-preferred ascending speeds (m·s-1) over normalized time (10-100 %) periods at 13F (N=12) (A); 31F (N=9) (B); and controlled SRs at 60%,75%,90% and 100% (C, D, E, and F).
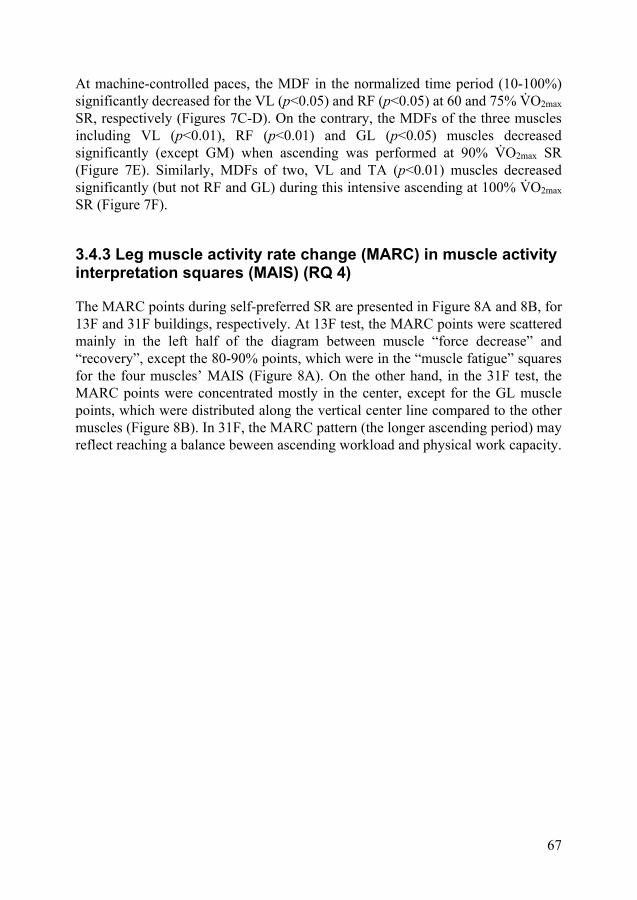
67
At machine-controlled paces, the MDF in the normalized time period (10-100%) significantly decreased for the VL (p<0.05) and RF (p<0.05) at 60 and 75% V̇O2max SR, respectively (Figures 7C-D). On the contrary, the MDFs of the three muscles including VL (p<0.01), RF (p<0.01) and GL (p<0.05) muscles decreased significantly (except GM) when ascending was performed at 90% V̇O2max SR (Figure 7E). Similarly, MDFs of two, VL and TA (p<0.01) muscles decreased significantly (but not RF and GL) during this intensive ascending at 100% V̇O2max SR (Figure 7F).
3.4.3 Leg muscle activity rate change (MARC) in muscle activity interpretation squares (MAIS) (RQ 4)
The MARC points during self-preferred SR are presented in Figure 8A and 8B, for 13F and 31F buildings, respectively. At 13F test, the MARC points were scattered mainly in the left half of the diagram between muscle “force decrease” and “recovery”, except the 80-90% points, which were in the “muscle fatigue” squares for the four muscles’ MAIS (Figure 8A). On the other hand, in the 31F test, the MARC points were concentrated mostly in the center, except for the GL muscle points, which were distributed along the vertical center line compared to the other muscles (Figure 8B). In 31F, the MARC pattern (the longer ascending period) may reflect reaching a balance beween ascending workload and physical work capacity.
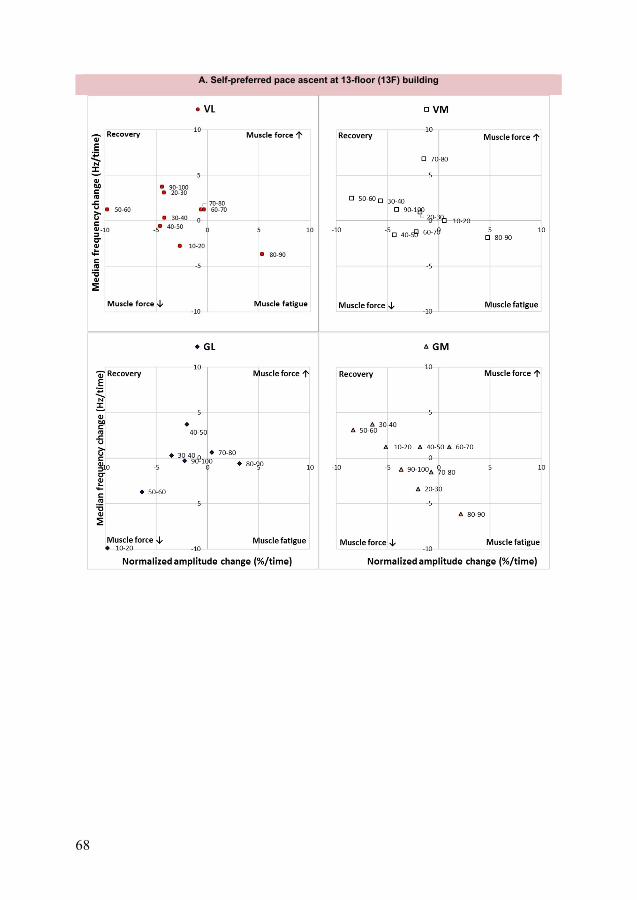
68
A. Self-preferred pace ascent at 13-floor (13F) building
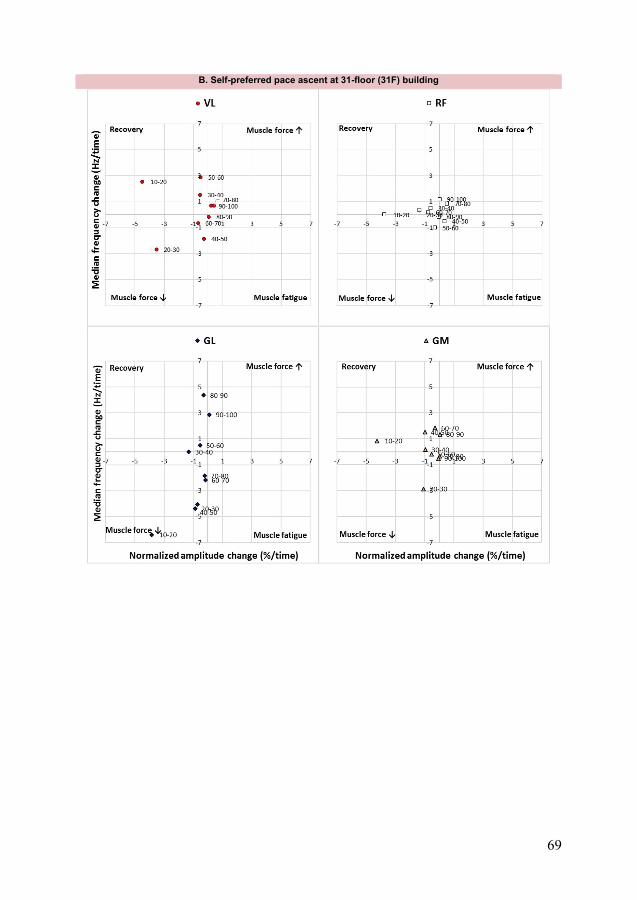
69
B. Self-preferred pace ascent at 31-floor (31F) building
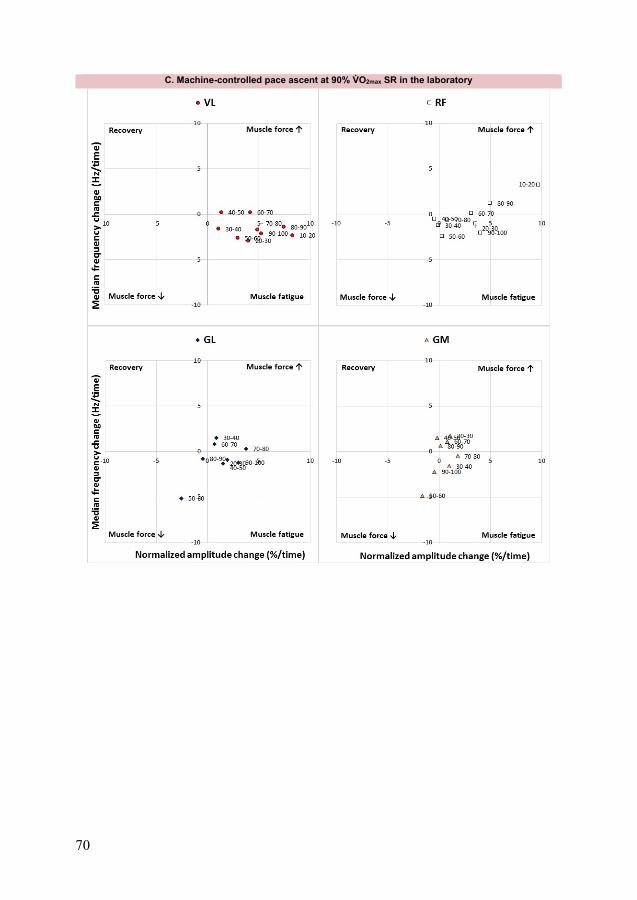
70
C. Machine-controlled pace ascent at 90% V̇O2max SR in the laboratory
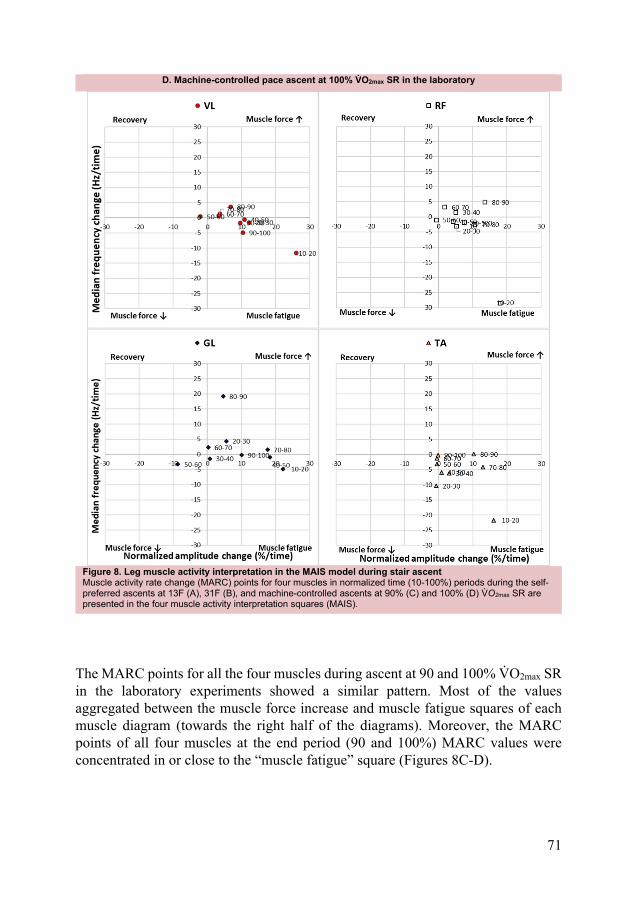
71
D. Machine-controlled pace ascent at 100% V̇O2max SR in the laboratory
Figure 8. Leg muscle activity interpretation in the MAIS model during stair ascent Muscle activity rate change (MARC) points for four muscles in normalized time (10-100%) periods during the self-preferred ascents at 13F (A), 31F (B), and machine-controlled ascents at 90% (C) and 100% (D) V̇O2max SR are presented in the four muscle activity interpretation squares (MAIS).
The MARC points for all the four muscles during ascent at 90 and 100% V̇O2max SR in the laboratory experiments showed a similar pattern. Most of the values aggregated between the muscle force increase and muscle fatigue squares of each muscle diagram (towards the right half of the diagrams). Moreover, the MARC points of all four muscles at the end period (90 and 100%) MARC values were concentrated in or close to the “muscle fatigue” square (Figures 8C-D).
72
3.5 Post-exhaustion walking gait biomechanics up a 10° incline (RQ 5)
The focus of the last part of the research phase 3 (Paper V) was the effects of exhaustion and leg local muscle fatigue (LMF) on the gait ground reaction forces (GRFs), required coefficient of friction (RCOFpeak), joint angle peak (anglepeak), foot angle minimum (anglemin), angular velocity peak (angvelx peak), acceleration peak (angaccx peak), leg muscle EMG amplitudes (AMPs) and median frequencies (MDFs). These measurements were carried out in the stance phase (SP) during the heel-strike (HS) and toe-off (TO) period of walking up a 10° incline following an exhaustive stair ascending.
3.5.1. Leg muscles EMG amplitudes (AMPs) and median frequencies (MDFs)
There were no significant changes observed in either of the muscles’ EMG AMPs between pre-exhaustion and post-exhaustion walking up a 10° inclined walkway. However, the MDFs for the VL and TA at TO were significantly (p<.05) lower during post- exhaustion trials. Additionally, the MDF of the TA was significantly (p<.05) lower during HS post-exhaustion trials, evidencing LMF in the leg (Paper V).
3.5.2. Stance phase (SP) duration, ground reaction forces (GRFs) and required co-efficient of friction (RCOF)
The exhaustion and fatigue significantly (p=.003) affected the mean SP duration, which was shorter during post-exhaustion trials. The post-exhaustion mean vertical ground reaction forces (GRFzpeak) at HS, (p=.028), and longitudinal ground reaction forces (GRFypeak) at TO, (p<.001) were significantly lower, respectively (Figure 9B). Moreover, the RCOFpeak during TO was significantly (p<.001) higher post- exhaustion. Similarly, the RCOFpeak at HS was also high, but not significantly higher (p=.082) (Table 5) (Figure 9B) (Paper V).
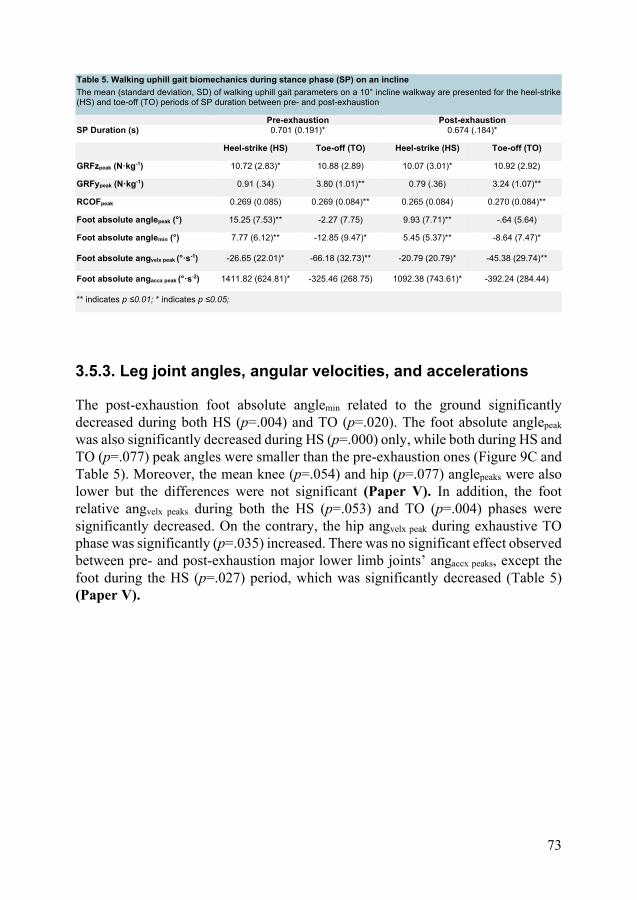
73
Table 5. Walking uphill gait biomechanics during stance phase (SP) on an incline The mean (standard deviation, SD) of walking uphill gait parameters on a 10° incline walkway are presented for the heel-strike (HS) and toe-off (TO) periods of SP duration between pre- and post-exhaustion
Pre-exhaustion Post-exhaustion SP Duration (s) 0.701 (0.191)* 0.674 (.184)*
Heel-strike (HS) Toe-off (TO) Heel-strike (HS) Toe-off (TO)
GRFzpeak (N·kg-1) 10.72 (2.83)* 10.88 (2.89) 10.07 (3.01)* 10.92 (2.92)
GRFypeak (N·kg-1) 0.91 (.34) 3.80 (1.01)** 0.79 (.36) 3.24 (1.07)**
RCOFpeak 0.269 (0.085) 0.269 (0.084)** 0.265 (0.084) 0.270 (0.084)**
Foot absolute anglepeak (°) 15.25 (7.53)** -2.27 (7.75) 9.93 (7.71)** -.64 (5.64)
Foot absolute anglemin (°) 7.77 (6.12)** -12.85 (9.47)* 5.45 (5.37)** -8.64 (7.47)*
Foot absolute angvelx peak (°·s-1) -26.65 (22.01)* -66.18 (32.73)** -20.79 (20.79)* -45.38 (29.74)**
Foot absolute angaccx peak (°·s-2) 1411.82 (624.81)* -325.46 (268.75) 1092.38 (743.61)* -392.24 (284.44)
** indicates p ≤0.01; * indicates p ≤0.05;
3.5.3. Leg joint angles, angular velocities, and accelerations
The post-exhaustion foot absolute anglemin related to the ground significantly decreased during both HS (p=.004) and TO (p=.020). The foot absolute anglepeak was also significantly decreased during HS (p=.000) only, while both during HS and TO (p=.077) peak angles were smaller than the pre-exhaustion ones (Figure 9C and Table 5). Moreover, the mean knee (p=.054) and hip (p=.077) anglepeaks were also lower but the differences were not significant (Paper V). In addition, the foot relative angvelx peaks during both the HS (p=.053) and TO (p=.004) phases were significantly decreased. On the contrary, the hip angvelx peak during exhaustive TO phase was significantly (p=.035) increased. There was no significant effect observed between pre- and post-exhaustion major lower limb joints’ angaccx peaks, except the foot during the HS (p=.027) period, which was significantly decreased (Table 5) (Paper V).
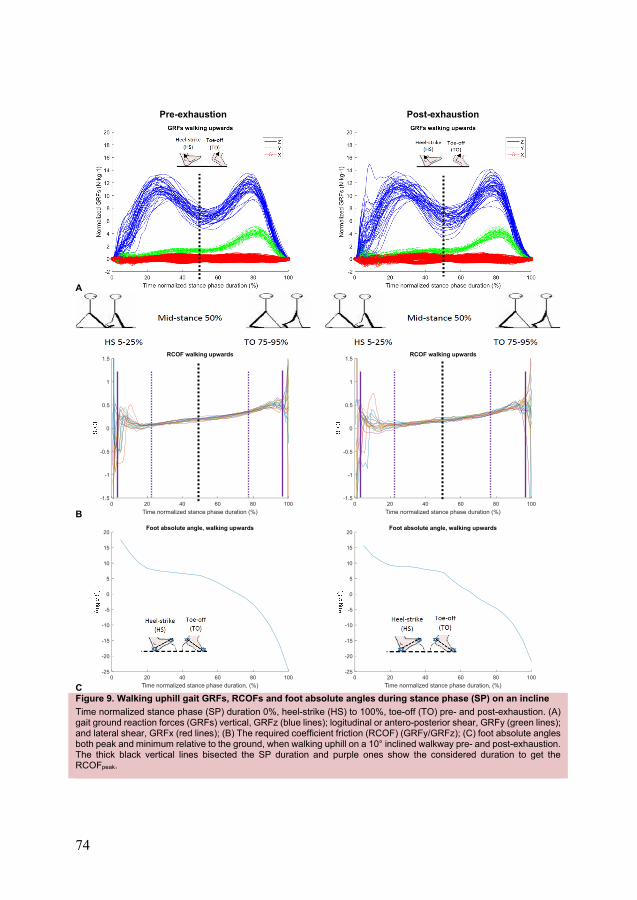
74
Pre-exhaustion Post-exhaustion
A
B
C Figure 9. Walking uphill gait GRFs, RCOFs and foot absolute angles during stance phase (SP) on an incline Time normalized stance phase (SP) duration 0%, heel-strike (HS) to 100%, toe-off (TO) pre- and post-exhaustion. (A) gait ground reaction forces (GRFs) vertical, GRFz (blue lines); logitudinal or antero-posterior shear, GRFy (green lines); and lateral shear, GRFx (red lines); (B) The required coefficient friction (RCOF) (GRFy/GRFz); (C) foot absolute angles both peak and minimum relative to the ground, when walking uphill on a 10° inclined walkway pre- and post-exhaustion. The thick black vertical lines bisected the SP duration and purple ones show the considered duration to get the RCOFpeak.
0 20 40 60 80 100Time normalized stance phase duration (%)
-1.5
-1
-0.5
0
0.5
1
1.5RCOF walking upwards
0 20 40 60 80 100Time normalized stance phase duration (%)
-1.5
-1
-0.5
0
0.5
1
1.5RCOF walking upwards
0 20 40 60 80 100Time normalized stance phase duration, (%)
-25
-20
-15
-10
-5
0
5
10
15
20Foot absolute angle, walking upwards
0 20 40 60 80 100Time normalized stance phase duration, (%)
-25
-20
-15
-10
-5
0
5
10
15
20Foot absolute angle, walking upwards
75
4 Discussion
This section discusses the physiological capacities and limitations, including leg muscle performance, during stair ascent in two different modes: 1) self-preferred pace in the field, and 2) machine-controlled step rates (SRs) corresponding to different percentages of individual maximal physical capacity (V̇O2max) in the laboratory. Moreover, the changes in gait kinetics and kinematics are discussed when walking up a 10° incline due to LMF and exhaustion and how these can affect the flow of evacuation.
4.1 Stair ascending duration (AD), vertical height and step rate (SR) (RQ 1)
In the self-preferred pace at the 13F and 31F buildings, we found that the participants ascended at an average pace of 92 steps·min-1 in order to reach the top of the two different buildings. The mean SR was higher than the SR at 75% of V̇O2max but lower than the SR at 90% V̇O2max in the laboratory studies. At the 31F building, the participants’ AD was less than eight minutes for a height of 109 m and 677 steps (3 landings/floor). In contrast, in the 13F building with 268 steps (2 landings/floor), the average AD was just below three minutes for the 48 m. The participants managed to ascend the 33 m long stationary subway escalator (SE) without landings in less than two min at their self-selected SR. The vertical displacement (Vdisp) was the highest at 20.5 m·min-1 at the 33 m long SE compared to the 13F and 31F (Table 4) buildings due to the time spent on the landings (Delin et al., 2017). Therefore, it took extra times to cover the same vertical distance in high buildings than in the short SE without landings. On the long single-flight SE, the average SR was 103 (range 33-165) steps·min-1, which was higher than the average SRs of the two buildings at the 13F and 31F. The SR ranges at the 13F and 31F buildings were between 60-161, and 54-144 steps·min-1, respectively.
In the 13F and 31F buildings, the ADs were longer than 90 and 100% V̇O2max SRs when the ascending was performed at the subject’s self-preferred pace and the landings allowed micro breaks, thus avoiding exhaustion.These intensities of the self-preferred pace were ≤ ventilatory (VT) or lactate threshold (LT); this could be
76
a possible reason to continue for a long duration. The self-preferred pace involved both anaerobic and aerobic capacities. Both of these capacities seem to have affected the performance, which was reflected in the speed reductions curve. The reduction of ascending speed (Figures 6A-C and 7A-B) was moderate in the 48 m building with one landing per floor (13F) and a short AD (about 3 minutes). Simultaneously, the reduction of ascending speed in the first minute was abrupt in 31F with two landings between floors and a relatively long AD (about 8 minutes). On SE without a landing, there was a short AD (<2 minutes) (Delin et al., 2017) (Table 3). A previous study at a 20-floor building showed that the ascending speeds decreased continuously for the first 13-14 levels (Chen et al., 2016).
In the laboratory studies, the average ADs were 4.3 (1.1) and 3.5 (1.9) min at 90 and 100% V̇O2max corresponding SRs. These were presumably all-out effort relevant speeds. The vertical height (Vheight reached) calculated for the 90 and 100% V̇O2max corresponding SRs were 95.0 (30.8) and 85.5 (32.1) m and the calculated Vdisp were 21.1 and 24.4 m·min-1, respectively (Table 4). The findings are indications of the evacuees’ ascending endurance capacity at constant maximal and near maximal physical capacity levels. If they needed to continue to ascend, they had to stop or slow down. Only two-thirds of the subjects (N=17) managed to sustain ascending for the pre-determined 5-min duration at the 90% V̇O2max SR. There was no pre-determined time limitation for the ascent at 100% V̇O2max SR. Two subjects quit around 1.0 and 1.5 min when they discovered that the SRs they were using were too high to sustain. These highest SRs were both considered to be extremely hard tasks based on the subjects’ average RPE value of 18.4 and 18.2, respectively at 90 and 100% V̇O2max SRs. The SRs for 90% of V̇O2max ranged from 68 to 133 steps·min-1, and at 100% between 104 and 133 steps·min-1. In a previous study, Butts et al. (1993) used a different step machine and the subjects climbed at a similar SR of about 112 steps·min-1 for 5 min. The average V̇O2highest reached 42 mL·min-1·kg-1 and the HRhighest peaked at 175 b·min-1. They also found that at 5-min long ascents with SRs of about 70 and 84 steps·min-1, the V̇O2highest reached about 28 and 35 mL·min-1·kg-1, respectively, while the HRhighest reached 135 and 150 b·min-1, respectively (Butts et al., 1993).
At 60 and 75% V̇O2max SRs, the participants managed to keep ascending for the first two stipulated, 3-min durations without major cardiovascular strain and exertion. The SR ranges at 60 and 75% V̇O2max paces were 31-89 and 53-118 steps·min-1, respectively. However, the average SRs at 60 and 75% V̇O2max were lower than during the two building tests in the field, while the SR at 75% V̇O2max was close to that of the 31-floor building. The mean SR at the SE was the highest among the field tests but lower than that of 90% V̇O2max corresponding SR; however, the SR at 100% V̇O2max with a fit and young group of subjects was the highest among the studies (Table 4).
77
4.2 Cardiorespiratory capacities and limitations during stair ascent (RQs 1 and 3)
4.2.1 Oxygen uptake (V̇O2) and heart rate (HR)
In the field studies at self-preferred pace mode, we found out that the mean relative V̇O2highest values were in between 39.0-41.0 mL·min-1·kg-1 (2.76-3.04 L·min-1), respectively, during ascent at self-preferred pace on all three public stairways. The HRhighest was between 153-168 b·min-1. These HR and V̇O2 results are similar to the previously reported results of 2.08 L·min-1 and HR of 154 b·min-1 when ascending at 100 single steps·min-1 (Aziz & Teh, 2005). The American College of Sports Medicine (ACSM) guidelines (ACSM, 2010) and the largest aerobic capacity database (N=3678) (Loe et al., 2013) present V̇O2max and HRmax for different age groups and genders. The average V̇O2max and HRmax for large populations including both genders is considered to be about 41.0-44.0 mL·min-1·kg-1 and 181-185 b·min-
1, respectively. Based on these two sources, the V̇O2highest from our mixed age group subjects reached 89, 95, and 91% of V̇O2max during their preferred speeds at the stairways of 13F, 31F, and SE, respectively. The HRhighest reached 85, 89, and 83% of HRmax for ascending 13F, 31F buildings, and subway SE, respectively. Our findings in these field studies indicate that during stair ascent evacuation at self-preferred pace, participants reached near maximal cardiorespiratory capacity. The preferred ascending speed was tolerable in terms of cardiorespiratory capacity. In another study that involved rescuing six victims and ascending six flights of stairs for 5 min, the subjects’ V̇O2 rose to 44.0 mL·min-1·kg-1 (83% of their V̇O2max) (von Heimburg et al., 2006). In a study by Teh and Aziz (2002), the intensity of ascending 12 floors (180 steps) reached 83 and 89% of V̇O2max and HRmax, respectively (Teh & Aziz, 2002).
In the laboratory at the 90% V̇O2max corresponding SR, the V̇O2highest and HRhighest means (SDs) reached 43.9 (7.8) mL·min-1·kg-1 and 185 (12) b·min-1, respectively, which reached 94% of the subject’s V̇O2max (46.7 mL·min-1·kg-1) and 97% of HRmax (190 b·min-1) levels, respectively (Table 4) (Paper II). At the 100% V̇O2max SR, the means (SDs) achieved for V̇O2highest and HRhighest were 44.8 (7.3) mL·min-1·kg-1 and 174 (11) b·min-1, respectively, which were also lower, around 92% of V̇O2max (48.5 mL·min-1·kg-1) and 91% of HRmax (212 b·min-1), respectively (Table 4). The V̇O2highest ranged from 34.6- 59.0 mL·min-1·kg-1; these were similar to the 90% V̇O2max range between 30.7 and 58.3 mL·min-1·kg-1. Although, the V̇O2highest values at 100% V̇O2max SR were reasonably higher than the results obtained at 90% of V̇O2max SR, the HRhighest reached lower values, where only fit and young individuals participated (Paper IV). The V̇O2highest values obtained were similar to the reported V̇O2max of previous studies (Loe et al., 2013; von Heimburg et al., 2006), thus these
78
V̇O2 and HR capacity results in the study reached their near maximal capacity. This is one of the reasons that limits further stair ascent. These findings imply the cardiorespiratory limitations for wide population. Other studies also suggest that the human endurance limit regarding maximal V̇O2 is about 41.0 to 45.0 mL·min-1·kg-1
for an average man (80 kg) during heavy work lasting longer than 20 min (Bilzon et al., 2001; Davis et al., 1982; Gledhill & Jamnik, 1992; Lusa et al., 1993; Sothmann et al., 1992).
The ADs at 13F and 31F buildings appeared to have reached cardiorespiratory steady states (Figures 3A-B). The findings are consistent with reported ones in previous studies (Boreham et al., 2000; Teh & Aziz, 2002; Williams-Bell et al., 2010). Usually, a steady state of V̇O2 uptake measurement is achieved within 2.0-3.0 min of any intensive activity unless it exceeds a subject’s physiological limits, that is, his or her LT (Saunders et al., 2000; Whipp & Wasserman, 1972). The V̇O2
values might also have reached a stable state at low SR in the first two laboratory tests, 3-min ADs (60 and 75% V̇O2max) (Figures 5D-E). However, the V̇O2 values were found to be in a relative stable state around 70% of the normalized time (≈3 min) at 90 and 100% V̇O2max (Figure 5F). At 90% V̇O2max SR, the average V̇O2mean
stable and HRmean stable were 42.7 (7.9) mL·min-1·kg-1 and 184 (13) b·min-1, respectively. On the contrary, at 13F and 31F building, the average V̇O2mean stable and HRmean stable reached 37.2-38.5 mL·min-1·kg-1 and 163-168 b·min-1, respectively (≥85% of V̇O2max) (Loe et al., 2013). The stable V̇O2mean stable and HRmean stable values for ascending at 13F and 31F buildings were ≥75% V̇O2max SR in the laboratory study. The intensity of these SRs in the field studies seem equal to or just above the VT. In the beginning of field studies, the subjects may have chosen their maximum speed but the duration was prolonged by slowing the speeds (Figures 6A-C) after a while (~1 min) in order to reduce the continuously increasing energy demand while keeping up the initial pace (Vogiatzis et al., 1996) (Paper I). The subjects were able to maintain their preferred ascending pace between 92 and 95 steps·min-1 to avoid exhaustion. That is why; it was possible to continue ascending until the end. At both the 90 and 100% of V̇O2max constant SR, the ADs were constrained due to the subjects’ inability to meet the energy demand and to leg LMF because of the production and accumulation of blood lactate (BLa−) in the muscles (Deuster & Heled, 2008). The subjects did not have what was needed to sustain the highly and constant repetitive ascents.
There is a positive relationship between the gradually increased ascent intensity and performance in the laboratory studies. The obtained highest V̇O2 , HR, metabolic rate (M) values, ascending speeds, AD, Vheight reached obtained increased from low to high values with the calculated SRs (Table 4) (Figures 5D-G) based on this study’s physiological evacuation model (Paper III). This indicated that the model is valid in terms of estimating ascending capacity: SR, AD, Vheight reached and Vdisp based on maximal V̇O2 uptake. These results recommended that this physiological evacuation
79
model can be used for estimating SR and vertical height (RQ 3) based on V̇O2max. However, it should be further validated. Some factors to consider are, for example, type and pattern of work, load carrying against the gravity as well as demography, anthropometry, settings to improve the prediction by the model. The maximal physical capacity (V̇O2max) data can be useful for calculating the work rate for other activities.
4.2.2 Metabolic rate (M)
The metabolic rate (M) observed in the self-preferred ascending pace ranged from 500-600 W·m-2. Activities that have Mhighest values in this range are classified, according to the International Organization for Standardization (ISO no. 8996), as having the most strenuous workloads for the general population (ISO, 2004). In the laboratory experiments, the average Mhighest was also about 600 W·m-2 (range 412-844 W·m-2) during ascent at 90 and 100% of V̇O2max. The Mhighest values in these two different modes of ascending intensities were almost equal. Another study has shown that a work intensity of about 475 W·m-2 corresponding to ≈70% of V̇O2max can be performed for up to 15-20 minutes (Holmer & Gavhed, 2007), which is similar to the ascents at 75% V̇O2max (Table 4).
4.3 Performance and limitations of leg muscles during stair ascent (RQs 2 and 4)
4.3.1 EMG amplitudes (AMPs) and median frequencies (MDFs) (RQ 2)
The aerobic capacity is not the only physiological component that limits performance in stair ascending evacuation. Muscle activities also play a role in the capacities of the two modes of ascent as evidenced in this research. The EMG muscle activity results clearly distinguished these two ascending modes. The significant decrease in AMPs and the unchanged MDFs in the two buildings (13F, 31F) reflect fatigue avoidance by reducing work intensity. These MDF results are supported by Christensen et al.’s finding that motor control during a slow dynamic contraction at low force level does not influence the frequency-power spectrum (Christensen et al., 1995). A significant EMG AMP decrease during the early phase of ascents with dropped ascending speed (~1 min) can be related to the limitations of oxygen transportation and anaerobic processes (Barstow, 1994). The thesis research results suggest that the subjects counteracted fatigue by reducing their
80
speed and power productions in order to complete the ascent at the self-preferred pace (Figures 6A-B and 7A-B). As I observed, the subjects may have taken the advantage of the handrails by grabbing and pulling on them and thus increasing the contribution of the upper limb muscles when approaching exhaustion in the self-preferred mode in the field studies (Paper I). In the laboratory in the machine-controlled ascending modes (Paper II and IV), pronounced muscle fatigue was not expected in the first two SRs. The AMPs increased significantly at all four controlled ascending speeds (Figures 6D-G). All MDFs, except GM, decreased significantly at 90% V̇O2max SR (Figure 7E), while only the MDFs of VL and RF at 60 and 75% V̇O2max SR (Figure 7C-D), and VL and TA at 100% V̇O2max SR shifted to lower frequencies (Figure 7F), respectively. In the last two high intensity SRs at 90 and 100% V̇O2max, a significant AMP increase and MDF decrease indicated leg LMF, especially in VL and TA. The AMPs increased during the first 30-40% of the time normalized period and then stabilized until the end at the 60 and 75% SRs. This may suggest that the subjects achieved adequate motor recruitments with the aerobic process to continue ascents in these two SRs. LMF may not jeopardize the ascending evacuation at these two low ascending intensities. The EMG MDFs of the calf muscles, GM measured at 90% V̇O2max SR and GL at 100% V̇O2max SR did not significantly differed with physical exhaustion. One of plausible explanations for the non-significant calf (GM and GL) muscles is that the high intensity SR does not allow full functioning of the muscle for pushing downward during the loading phase to propel up and carry the body weight. The high intensity SR transfers the load to the quadriceps (VL) muscle instead. The EMG results indicate that the stair machine-controlled mode of ascent at high intensities mainly required the functioning of the dominant knee extensor during the frequent loading phase; and the anterior leg muscle, which was required to hold the forefoot by continuously making contact steps during speedy acceleration and the swing phase followed by the foot strike. The significant MDF decrease in the laboratory and the non-significant MDF change in the field are consistent with Scheuermann et al.’s findings of a progressively decreasing MDF during fast ramp cycling and a constant MDF during slow ramp cycling exercise (Scheuermann et al., 2002).
Additionally, in the laboratory study, subjects tried to cope with the leg LMF with postural modifications and adaptive strategies. They tried to incline forward and partially transferred their body weight through their forearms on to the handrails to reduce the workload of the leg muscles. An EMG study on cycling showed that MDF changes are related to changes in movement kinematics, and individual postural adaptation (Dingwell et al., 2008). In spite of the contradictory results in the MDF and speed relationship, they still support the interpretation that the AMP reflects speed reduction due to the strong positive correlations between AMP and ascending speed. More about the correlations between the changes in V̇O2 and EMG
81
muscle activities (AMP and MDF) is presented in Paper I and (Halder, 2017). However, a number of factors are involved, such as skin and muscle temperature (Halder et al., 2014; Oksa et al., 2002); muscle fiber orientations; diameters; presence of different motor units and nerve conduction velocities (Eberstein & Beattie, 1985); intramuscular recruitment patterns; and afferent activities (e.g., crosstalk might have influenced the stability of the EMG recordings) (Farina, 2006; Hermens et al., 2000).
4.3.2 Muscle activity rate change (MARC) in muscle activity interpretation squares (MAIS) (RQ 4)
We used the changes of both AMP and MDF per unit time in the muscle activity rate change (MARC) and plotted the percentile points during both self-preferred and machine-controlled ascents in order to observe the muscle activity changes over time, especially the onset of fatigue. Firstly, the MARC points changed at self-preferred ascents in both buildings (Figures 8A-B) showing differences due to the different ADs and building heights. The pattern of the MARC points may have been the reason for the self-preferred ascending speeds, which were kept at unsteady levels depending on fatigue development (Figures 6 or 7A-B).
At 13F, the appearance of the 80-90% normalized period MARC points in the “muscle fatigue” square (right lower sections of Figure 8A diagrams) in MAIS indicated that the subjects reached fatigue after ascending an average 2.5 min. The majority of the MARC points were located in the areas of either muscle force decrease or recovery (Figure 8A). This indicates that the lower muscle power production was related to the decrease in ascending speed, but the ascent continued at a slower rate. In the 31F test, there was a different distribution pattern of the MARC values. They clearly appeared to be more or less centered (Figure 8B). Longer time spans involve many more ascending strategies and events, such as slowing down, accelerating and grabbing the handrails for support, which is why the MARC averages were small and came close to “no-change” in the center point of the MAIS (Paper I). We need to consider that the magnitude and direction of muscular forces continuously vary due to changes in body postures (Farina, 2006; Merletti et al., 1990). “No change” could be interpreted as if the subjects were still able to ascend at lower speeds by reducing muscle power to prevent fatigue. This indicated that they had full controll of their ascending task while it took on average about 7.8 minutes to reach the top. This discussion on MARC was supported by the significantly positive correlations between AMPs and speeds, or in the case of negative correlations, with speed reflecting recovery in the self-preferred situation (Paper I) and (Halder, 2017).
82
An opposite trend of the MARC points was observed during the machine-controlled ascending paces at both 90 and 100% V̇O2max SRs where the most and last MARC percentile points were concentrated in the “muscle fatigue” square (Figures 8C-D). This indicates that the leg muscles were fatigued. A few MARC points in the starting period were found in the “force increase” square suggesting that the subjects were able to exert a high force at the beginning of the ascent in order to comply with the highly repetitive movements. Most of the MARC points appeared in the “muscle fatigue” square because the subjects had to keep ascending at a constant high speeds, which led to exhaustion in the end (Paper II and IV). These interpretations appears to be reliable between the two stair ascending modes based on the muscle activity interpretation model (RQ 4) and the fourth hypothesis. The subjects had to comply with the selected speeds driven by the stair machine and were unable to slow it down except through minor weight shifts to the arms. In these circumstances, cardiorespiratory capacity and LMF combined constrained the person’s ascent and duration, which supports the second hypothesis.
4.4 Oxygen uptake (V̇O2) and leg muscles activity during stair ascent at self-preferred and controlled pace modes (RQs 1 and 2)
Muscular efforts are crucial for V̇O2 and its dynamics, and for exercise tolerance (Rossiter et al., 2001) to perform ascents at different modes and intensities (Burnley et al., 2011). The intense SRs were also reflected by the initial high and progressively increasing AMP values. At the beginning of ascent, we observed an initial rapid V̇O2 increase until 1.5-3.0 min of the time normalized ascending periods. A relative steady state was reached at ≈2.0-3.0 min (Barstow, 1994; Whipp & Wasserman, 1972) and V̇O2 uptake continued with slow growth until the end of the ascent. The V̇O2 kinetics and the highest values depend on the ascending modes: self-preferred or machine-controlled ascents with different intensities and the ascending durations (Figure 5).
In the field studies at self-preferred pace, the higher AMP observed in the beginning was related to the high velocity movement (Figures 6A-B) and primary rapid increase of V̇O2 up to about 2.0 min (Figures 5A-B), which required progressive recruitment of fast twitch, type II fibers (Borrani et al., 2001). During heavy exercise, both type I and II fibers are usually recruited at the very beginning of the exercise. The additional motor units of the type II fibers need to be recruited to maintain power output for sustaining the ascent during the impaired excitation and contraction coupling due to the onset of fatigue (Krustrup et al., 2004; Sabapathy et al., 2005). Thus, the EMG AMP results in the latter period of ascents in the field do
83
not agree with the progressive recruitment of fast-twitch fibers and the simultaneous V̇O2 slow component rise. A steady state was reached at about 2.0 min during ascent at both the 13F and 31F buildings (Figures 5A-B), thus supporting the first hypothesis. This is due to the reduction or controlling of the self-preferred pace by the subjects as the ascent progressed.
In the machine-controlled ascents, the initial stable AMP increase at the start (Figures 6D-G) can be attributed to the accumulation of the motor units required to continue ascending with the given intensity. This indicates a connection to the primary and rapid V̇O2 rise up to 3.0 min (Figures 5D-G) (Scheuermann et al., 2002). During the later phase, the gradually increased slow component of V̇O2
uptake may have been caused by the progressive recruitment of fast-twitch motor units related to the slowly increasing AMPs. This was compensation for the already reduced power output from the fatigued fibers (Shinohara & Moritani, 1992) with an increasing O2 demand (Cannon et al., 2011; Saunders et al., 2000). A high supply of O2 for energy production was required to meet the muscle demands for the faster rate of contractions during stair ascending at the high SRs (Kang et al., 2004), which progressively leads to a relative steady state of V̇O2 uptake. This mechanism provokes the growth of BLa− values to a high level, and eventually the termination of the ascents with a rise in the equivalent durational V̇O2 slow component at the high SRs corresponding to 90 and 100% V̇O2max (Roston et al., 1987; Saunders et al., 2000; Whipp & Wasserman, 1972) (Figures 5F-G). The development of V̇O2 appears to be associated with the gradual recruitment and rate coding of motor units; however, type IIb motor units (Jones et al., 2011), although they have the largest number of fibers, are also metabolically fatigable, and thus less efficient for prolonged exertion. This indicates a relationship between the AMPs’ increase and the V̇O2 slow component rise during the controlled SRs in the late phase among the high ascending intensities (Figures 5 and 6).
4.5 Overall comparisons between self-preferred and machine-controlled ascents (RQs 1, 2, and 4)
The high intensity ascents at 90 and 100% V̇O2max were above the threshold for prolonged activity where the pumping capacity of the heart (HRhighest) reached its upper limit above 92% of HRmax in both experiments. This high HRhighest could not be maintained at these sub-maximal and maximal intensities for a long time and thus constrained the ascending capacity. At the 100% V̇O2max SR, the post stair ascending respiratory rate reached over 51 min-1. This was evidence of breathlessness and hyperventilation (Vogiatzis et al., 1996) when the mean BLa− level and RER reached ˃14 mmol·l-1 and 1.2, respectively, at the end. This high RER, which
84
reflects the high respiratory exchange of CO2 and O2, commonly exceeds 1.0 during strenuous exercise. During non-steady-state strenuous exercise, the volume of CO2 production rises as a result of hyperventilation and the increased buffering of blood lactic acid derived from the skeletal muscles (Deuster & Heled, 2008); thus, the RER no longer reflects substrate usage but rather high ventilation rates and BLa−
levels (Issekutz & Rodahl, 1961; Steiner et al., 2017). This is in agreement with the recorded RPE ˃18 (Paper IV). The above results suggest that the laboratory controlled SRs or ascending intensities at 90 and 100% V̇O2max were above the VT and LT, at which the subjects reached their limits (McArdle et al., 2015). These high BLa−, RER and RPE values also met the required level of the secondary criteria (Poole & Jones, 2017; Poole et al., 2008) of V̇O2max (Beltz et al., 2016; Howley et al., 1995), which indicates that the subjects reached the fatigue threshold.
There was an imbalance between the energy availability and local demand during highly repetitive muscle activities resulting in LMF due to insufficient recovery. Two factors affected the continuation of ascents for long durations above 5 minutes. First, the intensity of the activity needed to be stable at a level no greater than the VT (the SRs ˃ 75% of V̇O2max). Second, the V̇O2 uptake and O2 transportation system needed to meet the demands of the working muscles (Barstow, 1994), otherwise, the anaerobic processes would dominate significantly resulting in leg LMF that would affect the ascending capacity in the late stages due to lack of or mismatching of O2 delivery for the aerobic metabolism (Jeker et al., 2020). When any of these conditions occur, the ascension stops, the evacuation ascent stops and this affects the ascending vertical distance.
The inability of the body to supply adequate energy through the transportation system after using up the stored ATP and glycolysis meant that a reduction in work rate was obviously needed to minimize the energy demands of the high SRs in the controlled ascending mode. The whole body energy system reaches its anaerobic capacity limit within 1-2 min after the onset of ascending, especially at controlled paces (Barstow, 1994; Whipp & Wasserman, 1972). The above discussion suggests that the development of anaerobiosis in the leg muscles constrained the subjects’ ascending performance as well as the V̇O2 capacity, which was supported by the individual EMG amplitude and median frequency results. The interpretation of fatigue over time by the MARC and MAIS model indicated leg LMF too. This indicates the possible pathways of exhaustion due to LMF and cardiorespiratory capacity during high-intensity ascent at a machine-controlled pace. Neuromuscular fatigue interrupted the speed and vertical distance of the ascents (Jeker et al., 2020) before reaching the cardiorespiratory capacity limits. This mechanism brought on exhaustion earlier, which in turn limited the ascending performance and restrained the V̇O2 from reaching the subjects’ V̇O2max (Ben-Ezra & Verstraete, 1988). The results support the second hypothesis that the physical exhaustion exaggerated by the leg LMF takes place very quickly, if the speed is kept at the maximum and all-out effort level at constant speed.
85
This will impair the evacuation performance. Thus, the results of this study infer that the effective evacuation speed duration at an individual maximum and constant mode in panic situations will be approximately 5 min according to the third hypothesis. Based on the previous research and the present analysis, it appears that participants ascending on stairs at a constant with all-out effort at 90-100% V̇O2max SR can do this for about 2-6 min. These results are consistent with the previous studies (Holmer & Gavhed, 2007; Vanhatalo et al., 2011).
In the self-preferred mode in the field, the ascending and leg muscle energy requirements were maintained at a tolerable and stable HR level of 163-168 b·min-1. These requirements are below the VT, which is the threshold for a prolonged ascension in self-controlled situations (Stegemann, 1981). The subjects were only able to continue ascending at a slower speed (Figure 3) with decreased muscular power. The subjects’ continuous postural adaptations and ascending modifications can be due to the declining functional efficiency of the muscles (Cannon et al., 2011; Jones et al., 2007; Vanhatalo et al., 2011). Many flights, and the number of steps in a flight, increase the total energy demand and thus constrain a person’s maximum evacuation speed. The maximum duration of continuous ascent at about ≈75% of maximal physical capacity is expected to last 9-15 minutes before reaching exhaustion (Holmer & Gavhed, 2007). Such efforts still require some periods for recovery in order to delay leg LMF during ascension at a self-preferred pace. A tolerable SR of about 90-95 steps·min-1 extended a person’s ascending endurance at the self-preferred pace when the V̇O2 reached a stable state around 37-38 mL·min-1·kg-1. A stairway with landings increases a person’s duration because he or she can get relief during micro pauses on the landings. All these factors enable longer performance.
In the self-regulated exercise, there was almost an immediate reduction in power output and degree of muscle activation upon commencing the exercise. The power reduction of the muscles is related to the reduction of energy demands of the legs and the whole body, as well as the change of the energy transportation system from anaerobic to aerobic (Costill et al., 2012 ). This observation suggests the existence of neural inhibitory command processes. During constant load exercise, sensory cues cannot be fully integrated to provide a more appropriate response to the given task during emergencies, while it was exactly the opposite during the self-preferred working situations. This evidence from constant load versus self-regulated exercise studies collectively suggests that energy transformations are indeed different (Marino, 2012), so that the inherent physiological capacity and constraint accounts for the different results achieved by these two different stair ascent paradigms.
The current study results suggest that the onset of LMF caused the decrease of work efficiencies in the fatigued fibers and the slow increase of V̇O2 (Jones et al., 2007; Zoladz et al., 2008). According to the literature and based on these studies, a person may only be able to ascend about two or three minutes at the maximum speed, which
86
is related to the primary rapid V̇O2 rise and individual anaerobic capacities (Barstow, 1994; Costill et al., 2012 ). One may need to slow down or select an affordable pace soon after the onset of an activity in order to continue for longer distances to comply with the natural energy transportation of the system to aerobic. Therefore, the research results support the first hypothesis that V̇O2 reached a stable value between 39 and 41 mL·min-1·kg-1 at a self-preferred pace, which extended the ascent until its end at a sub-max level by allowing the required recovery of LMF in the leg. In contrast, V̇O2 reached a relative stable state and near maximal level at an all-out effort controlled maximal SR, which partially rejects the first hypothesis, but the ascent kept the V̇O2highest at a lower level than the V̇O2max.
4.6 Post-exhaustion walking gait biomechanics up a 10° incline (RQ 5)
The purpose of the laboratory study presented in Paper V was to determine the effects of whole body exhaustion and leg LMF on the following parameters when subjects walked uphill on a 10° inclined walkway: changes in the gait GRFs, RCOFpeak, joints peak angles, foot minimum angles, angular velocities, accelerations, and major leg muscles activities during the stance phase (SP).
4.6.1 Effects of exhaustion on leg muscles amplitudes (AMPs) and median frequencies (MDFs)
There was no significant differences observed in either of the leg muscles’ mean EMG AMPs between pre-exhaustion and post-exhaustion walking trials. The post-exhaustion mean AMPs of the VL, RF and TA muscles were higher than the pre-exhaustion walking up a 10° inclined walkway during HS, except for the calf muscle (GL). On the contrary, during the TO period, the post-exhaustion mean AMPs of the same three muscles showed a decrease.
The mean MDFs of the VL and TA muscles were significantly lower during the post-exhaustion TO period. During post-exhaustion HS, the TA MDF was also found to be significantly lower than the pre-exhaustion MDF (Yoshino et al., 2004). These EMG results indicate local muscle fatigue (LMF), especially of the thigh (VL) and anterior lower leg (TA) (Paper V). The TA muscle contains a high proportion of fast fatigable fibers that act as prime movers of foot dorsiflexion. An adequate range of dorsiflexion is crucial during HS for normal gait patterns, especially at TO for maintaining balance on a slope, and foot ground clearance which initiates the swing phase. The evidence of LMF in the TA at TO indicates
87
that inadequate ground clearance and gait balance will increase the risk of tripping on one’s own foot due to foot dragging over the floor and forward falling, leading to injury and hindrance of the evacuation flow.
4.6.2 Effects of exhaustion stance phase (SP) duration, ground reaction forces (GRFs) and required co-efficient of friction (RCOF)
There was a significant difference in SP duration when continuing to walking upward after exhaustion on a 10° inclined metal walkway. It was interesting to see that the mean post-exhaustion SP duration was 0.027 s shorter than the mean pre-exhaustion walking trials (Table 5 and Figure 9A). A plausible explanation is that the step length was shorter due to a shorter reciprocal swing phase as an adjustment for shorter steps in order improve stability and balance during the post-exhaustion trials. This thus resulted in a shorter stance of the measured dominant foot. However, a gradual increase in stride length, but decrease in cadence were observed in previous studies as the uphill slope became steeper; these studies, though, did not involve the effects of leg fatigue (Kawamura et al., 1991; Sun et al., 1996). The subjects in the study presented in Paper V may had been more careful and compensated by walking with shorter stride lengths followed by the exhaustion.
During post-exhaustion walking uphill on a 10° inclined walkway, the mean vertical (GRFzpeak) and longitudinal (GRFypeak) shear forces were significantly reduced during HS and TO, respectively, compared to pre-exhaustion walking (Table 5 and Figure 9A). A study has reported that shear force usually increased at TO and decreased at HS when subjects walked uphill compared to walking on a level surface (Mcvay & Redfern, 1994). Moreover, the whole body exhaustion and LMF resulted in the GRFypeak reaching a lower value during HS than during the pre-exhaustion walking trials. One possible explanation would be that the gait speed was reduced, resulting in lower impact forces at HS and TO.
The whole body exhaustion and leg fatigue also affected the RCOFpeak, especially during the TO phase. The post-exhaustion mean RCOFpeak value was found to be significantly higher than pre-fatigued during the TO phase. This higher RCOFpeak result suggests that higher friction was required to complete the step by maintaining balance without slipping backward and falling forward when walking up a 10° incline. This indicates that exhaustion increases the risks of slip-induced fall accidents. This means that surfaces with higher available friction are required for safe evacuation. No subjects, however, experienced any fall accidents during the study. The RCOF results in this study are considered to be the minimum coefficient of friction (COF) required between the shoe and dry floor interface on an incline to avoid slips and to maintain safe and continuing locomotion (Paper V).
88
4.6.3 Effects of exhaustion on leg joint angles, velocities, and accelerations
In this experiment presented in Paper V, the differences in most of the lower limb joint peak angles (anglepeak), accelerations (angaccx peak), and velocities (angvelx peak) measurements were insignificant. However, it is important to note, the post-exhaustion foot absolute joint anglepeak during HS, and foot minimum absolute angle (anglemin) during both HS and TO were significantly smaller than those in the pre-exhaustion trials (Figure 9C). The post-exhaustion walking EMG results showed that knee extensor, VL muscle, and the primary muscle for dorsiflexion, namely TA had lower MDFs, indicating LMF in the leg. This resulted in an unusual post-fatigue foot position on the incline ground evidenced by the smaller foot absolute angles during HS and TO related to the ground.
Similarly, the significantly decreased angvelx peak of the foot during both HS and TO in the post-exhaustion walking gait trials may be related to leg muscle LMF, which resulted in lower foot absolute angles relative to the ground. Additionally, the significantly decreased foot angaccx peak during HS supported the foot kinematics results (Table 5). It can thus be interpreted that the lack of foot movement and positions on inclines are associated with the reduction of dorsiflexion due to TA and VL muscle fatigue activity during post-exhaustion walking (Granacher et al., 2010; McLoughlin et al., 2016). These are major signs of the perturbed gait and risks for slip and trip related fall accidents during post-exhaustion walking that followed the stair ascent. (Paper V). These overall biomechanics results supported the fifth hypothesis of the study in that neuromuscular fatigue related exhaustion adversely affected the gait pattern and stability by decreasing the GRFzpeak, GRFypeak, both foot anglepeak and anglemin, angvelx peak, and angaccx peak during the stance phase. Thus, these results from post-exhaustion walking up a 10° slope indicated a more cautious and slower gait pattern with an increase of RCOFpeak in order to maintain balance and accident-free human locomotion, which eventually delay the evacuation process.
89
4.7 Study limitations and future perspectives
The ascending speeds recorded in the field studies may not represent a real evacuation situation. Considering the intuitive fight-or-flight response panic situations, human may choose the maximal possible speed to ascend in order to reach a safe refuge level during evacuation; however, the speeds in the laboratory experiments were pre-determined and controlled by the machine to be constant.
Future studies are recommended in the laboratory on a redesigned stair machine with which the participants’ would automatically control the speed preferred pace. In the field, it is necessary to find a way to simulate emergent and maximal evacuation as real as possible. Recovery periods can be introduced in future experiments in order to prolong ascending duration and heights. Additionally, the effects of exhaustion on stair descending speed also need to be evaluated too.
The present research suggests that the study of progressive and gradual increments of step rate starting below the ventilatory threshold (VT) (≈50-65% of V̇O2max step rate, when it is possible to talk) could potentially delay the onset of fatigue, thus increasing the duration as well as the vertical height reached.
More studies on stair ascending evacuation in emergencies until exhaustion are needed for target populations with different demographics, anthropometric characteristics (fitness, age, gender and body weight) at the individual or group level to examine stair ascending duration and vertical height in order to improve the present physiological evacuation model (Paper III). Further studies are needed to consider exit numbers, exit levels, length of flight, inclinations, load carrying, stair tread and riser, and landings to improve the accuracy of the prediction.
BLa− was measured only at the end of the corresponding 100% V̇O2max step rate. More measurements that are frequent would be ideal, either continuously or at predefined time intervals for monitoring BLa− levels when ascending in order to identify the lactate level related to the distance covered. This would allow comparison and would support the EMG results in the laboratory and field tests. Such measurements would strengthen the discussions of muscle activity as well as confirm the onset of leg muscle fatigue and exhaustion, thus determining the levels and number of emergency exits needed in deep underground structures.
90
The current research averaged the EMG AMPs and MDFs for fatigue analysis for each 10th percentile period of the entire duration. This included both muscle activations and deactivations during a gait cycle. It is preferable, however, to analyze EMG data during each step cycle of the movement and then the mean of a few step cycles, for example, from each 10th and 90th period to elucidate the kinematics and EMG. This type of analysis will also allow the detection of the sequential muscle activation from each step, and evaluate the instable stair gait due to leg fatigue.
The development of an application for EMG data based on the muscle activity interpretation squares (MAIS) model would be useful to identify the onset of fatigue. An application based on this method and connected to a wearable EMG can help to prevent fatigue related injuries and accidents during any repetitive task with time-normalized periods by receiving continuous biofeedback.
Kinematics analyses during stair ascent is needed to explore the postural adaptation by investigating the upper limb posture and load transfer with the onset of fatigue and exhaustion on the stair machine using the synchronized EMG with Motion Capture system in the laboratory. This will allow the disclosure of any confounding effects of the upper limb on the lower limb muscles’ activity and the flow of group evacuation.
The MARC and MAIS should be applied to the new data from each 50-90% of the corresponding V̇O2max level step rate until exhaustion for validation in order to further observe its effectiveness. A MAIS analysis of the first 13F and last 13F in the 31F building is suggested using the available data. This would enable a comparison between the two. Moreover, a comparison can be carried out of the data within the same set of subjects in the same 31F building.
The stance phase time-span for analyzing gait biomechanics on an incline maybe short. A second force plate and analyses including gait speed and stride length may allow exploring relevant gait biomechanics changes. Gait analyses on wet, oily, contaminated, icy, slippery surfaces with combination of shoes may be more important. Gait biomechanics change when evacuating downwards and its influence on the flow of group evacuation should be studied.
91
5 Conclusions
This thesis has generated new knowledge and understanding of the physiological capacities and limitations that contribute and restrict to the physical performance required for a successful stair ascending evacuation. These include oxygen uptake (V̇O2), heart rate (HR), and muscular efforts. There was a difference in the cardiorespiratory capacities in V̇O2 and HR results between the self-preferred and the laboratory machine-controlled pace when it came to the all-out maximum effort required during emergencies.
During an all-out effort, in the laboratory, machine-controlled paces at 90-100% maximum step rates (SRs), the highest cardiorespiratory capacity, including V̇O2highest and HRhighest reached 44-45 mL·min-1·kg-1 and 174-185 b·min-1, respectively. The V̇O2 and HR at these sub-maximal and maximal SRs at 90-100% V̇O2max reached 92-94% of the participants’ V̇O2max and 91-97% of HRmax, respectively. In contrast, in the field studies at a self-preferred pace, the highest V̇O2highest and HRhighest reached were 39-41 mL·min-1·kg-1 and 162-174 b·min-1, respectively. The V̇O2highest reached 91-95% and the HRhighest reached 83-89% of human maximum capacity at the self-preferred pace, thus indicating a lower intensity of the SRs at the self-preferred pace in the field compared to the laboratory-controlled SRs at 90-100% V̇O2max (RQ 1).
The duration and vertical distance were shorter at 100% V̇O2max speed, the subject’s stair ascent performance was limited to 3.5 min compared to 4.3 min at 90% V̇O2max. At the self-preferred pace, the average ascending duration of the participants was 7.8 minutes to reach the top of a 109 m long building. These indicate that in a panic situation, sustaining ascent at a maximum and fixed speed level would be shorter. The overall V̇O2 results suggest that when ascending stairs at sub-max and maximum speeds, a person’s maximum duration is limited to 2-6 min and the vertical distance is about 86-95 meters. The difference was in the SRs between the machine-controlled pace (≥110 steps·min-1) in the laboratory and the self-preferred pace in the field (˃90 steps·min-1). This difference shows that an ascent of ≈95 steps·min-1 is tolerable and can be adopted by a person in order to sustain for 9-15 min (RQ 1).
92
The local muscle fatigue (LMF) in the leg was supported by the muscle electromyography (EMG) results. The leg muscle electromyography (EMG) results that showed a significant amplitude (AMP) decrease and an unchanged median frequency (MDF) indicated a reduction of muscle power during ascents in buildings at a self-preferred pace. Fatigue recovery because of the reductions in muscle power and ascending speed was reflected in the muscle activity rate change (MARC) points in the developed muscle activity interpretation squares (MAIS) model. During machine-controlled ascents, the significant EMG AMP increase and MDF decrease confirmed the leg LMF (RQ 2) at the maximum simulated speeds. The MAIS model showed the same result too. These suggest that MARC in MAIS model is suitable for observing muscle activity changes during repetitive tasks over time (RQ 4).
At maximal SRs in the laboratory, the high values of blood lactate (14.4 mmol·l-1), of the respiratory exchange ratio (1.2), and of the perceived exertion (18.2) were evidenced by hyperventilation and physical exhaustion. Leg LMF significantly contributes (RQ 2), along with the cardiorespiratory capacity (V̇O2highest) components, to inducing exhaustion quicker than one would assume, thus constraining the stair ascent durations. Consequently, the V̇O2highest at or over a 90% of maximum physical capacity ascent speeds do not reach the V̇O2max level that is recorded when running on treadmill (RQ 1).
The physiological evacuation model that was developed in this research suggests that the ascending performance, including step rate, duration, height and vertical displacement, are dependent on and can be predicted by the individual maximum oxygen uptake (V̇O2max) (RQ 3).
After an exhausting stair ascent, leg fatigue affects the walking gait kinetics and kinematics. This includes the stance phase (SP) duration, a reduced peak walking gait ground reaction forces, both peak and minimum foot absolute angles, peak velocity and acceleration. We observed a higher required coefficient of friction (RCOF ≥0.330) during heel strike (HS) and toe-off (TO) when the subjects were walking uphill on a 10° inclined surface. This alteration in the post-exhaustion walking gait on an incline suggests that in the planning and designing of inclined exits, higher frictional floor materials should be used in order to prevent perturbed gait balance and falling events (RQ 5).
The results indicate that reaching a safe refuge at the highest levels of buildings may be possible with an all-out effort; however, an alternation of the gait biomechanics due to physical exhaustion and leg fatigue affect the walking pattern and movement. These locomotion changes may hinder the flow of a continued evacuation upwards on inclines in emergencies.
93
Practical implications and societal relevance
The research findings can help to understand, human physiological capacities affect stair ascending performance and walking gait biomechanics uphill on an incline during emergency evacuation.
The field and laboratory studies revealed the physical work capacities required for a successful stair ascending evacuation and the limitations. The stair ascending endurance, maximal aerobic capacity, and muscle activity were evaluated in both self-preferred and controlled pace situations.
Stair ascending capabilities are worth assessing from a health perspective since stairs are part of our daily life. The results provide, in part, up-to-date information about the fitness of the general populations’ ability to carry out ascending evacuations at different building heights and from underground metro stations during an emergency.
The physical work capacity information increases our awareness of our fitness in relation to managing a sudden or unexpected physical challenge in a survival situation in order to avoid a fatal accident. It enables local authorities and first responders for example, rescuers, fire fighters to face the challenges and meet the demands of their occupations. They can physically prepare themselves by keeping fit in order to meet the demands of the evacuation tasks of rescuing others. This would reduce risks and vulnerability during emergencies.
The beneficial effects to health and fitness of short and intermittent bouts of exercise throughout the day have yet to be identified. Stair climbing can be considered as one of the minimum required exercises for sedentary workers in daily life to improve cardiovascular fitness (Boreham et al., 2000; Teh & Aziz, 2002). It can help to prevent obesity, reduce sedentary work-related physical problems globally and in the long run, and delay the process of aging (Boreham et al., 2000; Donath et al., 2014; Ilmarinen et al., 1978).
94
The physiological evacuation model that was developed appears to be useful for estimating step rate, and vertical displacement based on physical capacity data. The findings can be used to validate existing models and to integrate them into the new evacuations models for the success of evacuations and rescue operations.
The combined muscle activity and oxygen uptake analyses that were applied are effective for assessing physical capacities and constraints for stair ascending evacuation. The new muscle activity interpretation (MAIS) model and the combined method of including the wearable EMG can be used as tools to explain physical loads that cause musculoskeletal disorders in our daily lives and workplaces and can play a role in decreasing financial and societal costs (Gallagher & Schall, 2017)
The gait kinetic and kinematic changes on the inclined walkway indicate the need to construct and plan floor surface materials with higher coefficients of frictions for any inclined exits or walkways at the top refuge level. This should be done in order to maintain balance for safe evacuation. Engineers, designers and architects should consider the gait alterations on inclines, redesign and reorganize the plans for evacuations in modern buildings.
The research results can be applied to decisions about: exit levels, resting planes, characteristics of stairways, floor surface, inclinations, flight lengths, widths, capacities and distances related to individual capacity levels. This should be done in order to ensure and improve the safety performance, safety measures, and success of emergency evacuations and rescue operations.
95
Acknowledgements
I generously express my gratitude to everyone including my supervisors, co-authors of the papers, friends, relatives, and colleagues for your encouragements, assistance and immense support throughout this thrilling journey. In particular, I am grateful to …
Chuansi Gao, my main advisor. I admit that this work is the fruit of your significant presence and contributions. You have constructively guided me through the research process as a whole. You have helped me find solutions for most of my problems. Thank you indeed for all the encouragement, supports but principally for understanding me and putting your trust in me.
Kalev Kuklane, my co-advisor, thank you for your research ideas and significant support. They were phenomenal. You have paved the way for this thesis. Thanks for your critical but effective comments, which have kept me on track, and made my feelings rock-hard even after receiving negative comments from the reviewers.
Michael Miller, my co-advisor, thanks so much for your many quality and effective sessions in your office at HSC in Lund to help me understand electromyography (EMG). Your guidance through the realms of EMG and statistics was intriguing. Thanks for your motivational words and shared experiences, which gave me breathing spaces during this roller coaster journey.
Enrico Ronchi and Karl Fridolf (currently working at WSP), the study project leaders from the Department of Fire Safety Engineering. I express my gratitude for involving me into this project.
Mattias Delin (formerly DeBrand Sverige AB and currently Brandforsk) and Johan Norén (Brand & Riskingenjörerna AB), the cooperation partners. I appreciate your valuable supports during the field studies and provision of related data. To Siyeon Kim (Seoul National University, South Korea) and Sofia Månsson, many thanks for your help during data collection in the laboratory and field, respectively.
Karin Lundgren-Kownacki. It has always been great to share the office with you during the first half of my PhD tenure. Thanks for your company, suggestions and instant support with Swedish. Jakob Petersson, I appreciate and thankful for your input to the Swedish popular science summary.
96
I would like also to express my gratitude to all the members of the Department of Design Sciences, Ergonomics and Aerosol Technology Division, especially Gerd Johansson, Mats Bohgard, Anders Gudmundsson, Roland Akselsson.
A million thanks go out to my PhD colleagues for your , talks and heart-warming friendships. I love sharing moments, your company and cheer with you. These have been a source of positive energy for me.
Robert Olsson, Service Group and members in the workshops, I acknowledge your countless and essential technical help with the computer, software and logistics.
Susanne Nordbeck, Hajnalka Bodnar, Ilnaz Golestani, Lena Leeven, Karin Öhrvik, Jessika Lindvall, Rose-Marie Hermansson, Marie Cederblad and Erik Andersson, I really appreciate your invaluable administrative supports on many occasions. Importantly, thanks to Jessica Sellergren for your valuable suggestions and corrections to improve the Swedish popular science summary and cover pages, above all for promoting this research.
I acknowledge the Humanities Lab, Lund University, especially Stefan Lindgren for transferring the motion capture (MoCap) system in the Gait and Motion (GAM) Laboratory at the IKDC, and to Anna-Maria Drake and Åsa Tornberg from the Health Science Center for lending the essential EMG device.
Dear Eileen Deaner, thanks so much, indeed for the editing.
I greatly miss my family, especially my late father, Narayan Chandra Halder in every step of my life, but his valuable advice still resonates, thus inspiring and directing my path. Baba, you set the tone of my higher education. I express a distinctive gratitude to my mother, Reba Rani Kirttania for her sacrifices and support. My sister, Oyendrila, thanks for the best wishes and understanding. You all are the core existence of my life. My youngest uncle, thanks for your inspirations.
Last but not the least, many thanks and love go to my wife, Urmila, your patience to endure and understand all my avoidances and unfulfilled responsibilities during this entire PhD tenure contributed to making this work possible. Hugs and kisses to our loving and dearest son, Auvian Urvil, who came into our lives with tons of joy and brought the energy and motivation for this work to be completed.
Finally, I am thankful to the volunteers for their contribution and commitment. I would like to acknowledge and thank the financiers: The Swedish Fire Research Board (Brandforsk) and the Swedish Transport Administration (Trafikverket) for the entire project. They had no role in the study design, data collection and analysis, decision to publish, or preparation of the thesis.
97
References
ACSM. (2010). American College of Sports Medicine, ACSM's guidelines for exercise testing and prescription (W. R. Thompson, N. F. Gordon, & L. S. Pescatello, Eds. 8 ed.). Wolters Kluwer; Lippincott Williams & Wilkins.
Allison, G. T., & Fujiwara, T. (2002). The relationship between EMG median frequency and low frequency band amplitude changes at different levels of muscle capacity. Clin Biomech (Bristol, Avon), 17(6), 464-469. https://doi.org/10.1016/s0268-0033(02)00033-5
Andriacchi, T. P., Andersson, G. B., Fermier, R. W., Stern, D., & Galante, J. O. (1980). A study of lower-limb mechanics during stair-climbing. J Bone Joint Surg Am, 62(5), 749-757. https://www.ncbi.nlm.nih.gov/pubmed/7391098
Arias, S., Ronchi, E., Norén, J., Delin, M., Kuklane, K., Halder, A., & Fridolf, K. (2016). An experiment on ascending evacuation on a long, stationary escalator 14th International Conference and Exhibition on Fire Science and Engineering (Interflam), 2016, Windsor, United Kingdom
Asplund, D. J., & Hall, S. J. (1995). Kinematics and myoelectric activity during stair-climbing ergometry. J Orthop Sports Phys Ther, 22(6), 247-253. https://doi.org/10.2519/jospt.1995.22.6.247
Astorino, T. A. (2009). Alterations in VO2max and the VO2 plateau with manipulation of sampling interval. Clin Physiol Funct Imaging, 29(1), 60-67. https://doi.org/10.1111/j.1475-097X.2008.00835.x
Åstrand, P.-O., Rodahl, K., Dahl, H. A., & Stromme, S. B. (2003). Textbook of Work Physiology (Fourth ed.). Human Kinetics.
Aziz, A. R., & Teh, K. C. (2005). Physiological responses to single versus double stepping pattern of ascending the stairs. J Physiol Anthropol Appl Human Sci, 24(4), 253-257. https://doi.org/10.2114/jpa.24.253
Barstow, T. J. (1994). Characterization of VO2 kinetics during heavy exercise. Med Sci Sports Exerc, 26(11), 1327-1334. https://doi.org/doi: 10.1249/00005768-199411000-00006
Bassett, D. R., Jr., & Howley, E. T. (2000). Limiting factors for maximum oxygen uptake and determinants of endurance performance. Med Sci Sports Exerc, 32(1), 70-84. https://doi.org/10.1097/00005768-200001000-00012
Bassett, D. R., Vachon, J. A., Kirkland, A. O., Howley, E. T., Duncan, G. E., & Johnson, K. R. (1997). Energy cost of stair climbing and descending on the college alumnus questionnaire. Med Sci Sports Exerc, 29(9), 1250-1254. https://doi.org/10.1097/00005768-199709000-00019
98
Beltz, N. M., Gibson, A. L., Janot, J. M., Kravitz, L., Mermier, C. M., & Dalleck, L. C. (2016). Graded Exercise Testing Protocols for the Determination of VO2max: Historical Perspectives, Progress, and Future Considerations. J Sports Med (Hindawi Publ Corp), 2016. https://doi.org/10.1155/2016/3968393
Ben-Ezra, V., & Verstraete, R. (1988). Stair climbing: an alternative exercise modality for firefighters. J Occup Med, 30(2), 103-105. https://www.ncbi.nlm.nih.gov/pubmed/3351645
Bilzon, J. L., Scarpello, E. G., Smith, C. V., Ravenhill, N. A., & Rayson, M. P. (2001). Characterization of the metabolic demands of simulated shipboard Royal Navy fire-fighting tasks. Ergonomics, 44(8), 766-780. https://doi.org/10.1080/00140130118253
Boreham, C. A., Wallace, W. F., & Nevill, A. (2000). Training effects of accumulated daily stair-climbing exercise in previously sedentary young women. Prev Med, 30(4), 277-281. https://doi.org/10.1006/pmed.2000.0634
Borg, G. (1990). Psychophysical scaling with applications in physical work and the perception of exertion. Scand J Work Environ Health, 16 (Suppl 1), 55-58. https://doi.org/10.5271/sjweh.1815
Borrani, F., Candau, R., Millet, G. Y., Perrey, S., Fuchslocher, J., & Rouillon, J. D. (2001). Is the VO2 slow component dependent on progressive recruitment of fast-twitch fibers in trained runners? J Appl Physiol (1985), 90(6), 2212-2220. https://doi.org/10.1152/jappl.2001.90.6.2212
Burnley, M., Davison, G., & Baker, J. R. (2011). Effects of priming exercise on VO2 kinetics and the power-duration relationship. Med Sci Sports Exerc, 43(11), 2171-2179. https://doi.org/10.1249/MSS.0b013e31821ff26d
Butts, N. K., Dodge, C., & McAlpine, M. (1993). Effect of stepping rate on energy costs during StairMaster exercise. Med Sci Sports Exerc, 25(3), 378-382. https://www.ncbi.nlm.nih.gov/pubmed/8455454
Cannon, D. T., White, A. C., Andriano, M. F., Kolkhorst, F. W., & Rossiter, H. B. (2011). Skeletal muscle fatigue precedes the slow component of oxygen uptake kinetics during exercise in humans. J Physiol, 589(3), 727-739. https://doi.org/10.1113/jphysiol.2010.197723
Cerretelli, P., & DiPrampero, P. E. (1987). Gas exchange in exercise. In: Handbook of Physiology. American Physiological Society.
Cham, R., & Redfern, M. S. (2002). Changes in gait when anticipating slippery floors. Gait Posture, 15(2), 159-171. https://doi.org/10.1016/s0966-6362(01)00150-3
Chang, W.-R., Matz, S., & Chang, C.-C. (2013). The available coefficient of friction associated with different slip probabilities for level straight walking. Safety Science, 58, 49-52. https://doi.org/10.1016/j.ssci.2013.03.014
Chang, W. R., Chang, C. C., & Matz, S. (2011). The effect of transverse shear force on the required coefficient of friction for level walking. Hum Factors, 53(5), 461-473. https://doi.org/10.1177/0018720811414885
Chang, W. R., Chang, C. C., & Matz, S. (2012). Comparison of different methods to extract the required coefficient of friction for level walking. Ergonomics, 55(3), 308-315. https://doi.org/10.1080/00140139.2011.642008
99
Chang, W. R., Leclercq, S., Lockhart, T. E., & Haslam, R. (2016). State of science: occupational slips, trips and falls on the same level. Ergonomics, 59(7), 861-883. https://doi.org/10.1080/00140139.2016.1157214
Chen, J., Wang, J., Wang, J., Liu, X., Li, T., & Lin, P. (2016). An Experimental Study of Individual Ascent Speed on Long Stair. Fire Technology, 53(1), 283-300. https://doi.org/10.1007/s10694-016-0579-1
Chen, S., Di, Y., Liu, S., & Wang, B. (2017). Modelling and Analysis on Emergency Evacuation from Metro Stations. Mathematical Problems in Engineering, 2017, 1-11,. https://doi.org/10.1155/2017/2623684
Cheng, A. J., & Rice, C. L. (2013). Factors contributing to the fatigue-related reduction in active dorsiflexion joint range of motion. Appl Physiol Nutr Metab, 38(5), 490-497. https://doi.org/10.1139/apnm-2012-0357
Chowdhury, S. K., & Nimbarte, A. D. (2015). Comparison of Fourier and wavelet analysis for fatigue assessment during repetitive dynamic exertion. J Electromyogr Kinesiol, 25(2), 205-213. https://doi.org/10.1016/j.jelekin.2014.11.005
Christensen, H., Sogaard, K., Jensen, B. R., Finsen, L., & Sjogaard, G. (1995). Intramuscular and surface EMG power spectrum from dynamic and static contractions. J Electromyogr Kinesiol, 5(1), 27-36. https://doi.org/10.1016/s1050-6411(99)80003-0
Cifrek, M., Medved, V., Tonkovic, S., & Ostojic, S. (2009). Surface EMG based muscle fatigue evaluation in biomechanics. Clin Biomech (Bristol, Avon), 24(4), 327-340. https://doi.org/10.1016/j.clinbiomech.2009.01.010
Costigan, P. A., Deluzio, K. J., & Wyss, U. P. (2002). Knee and hip kinetics during normal stair climbing. Gait Posture, 16(1), 31-37. https://doi.org/10.1016/s0966-6362(01)00201-6
Costill, L. D., Wilmore, H. J., & Kenney, W. L. (2012 ). Physiology of sport and exercise (Fifth ed.). Human Kinetics.
Davis, P. O., Biersner, R. J., Barnard, R. J., & Schamadan, J. (1982). Medical evaluation of fire fighters: How fit are they for duty? Postgrad Med, 72(2), 241-245, 248. https://doi.org/10.1080/00325481.1982.11716169
Dekerle, J., de Souza, K. M., de Lucas, R. D., Guglielmo, L. G., Greco, C. C., & Denadai, B. S. (2015). Exercise Tolerance Can Be Enhanced through a Change in Work Rate within the Severe Intensity Domain: Work above Critical Power Is Not Constant. Plos One, 10(9),. https://doi.org/10.1371/journal.pone.0138428
Delin, M., Norén, J., Ronchi, E., Kuklane, K., Halder, A., & Fridolf, K. (2017). Ascending stair evacuation: walking speed as a function of height. Fire and Materials, 41(5), 514-534. https://doi.org/10.1002/fam.2410
Deuster, P. A., & Heled, Y. (2008). Testing for Maximal Aerobic Power. In P. H. Seidenberg & A. I. Beutler (Eds.), The Sports Medicine Resource Manual (pp. 520-528). W.B. Saunders. https://doi.org/10.1016/b978-141603197-0.10069-2
Dingwell, J. B., Joubert, J. E., Diefenthaeler, F., & Trinity, J. D. (2008). Changes in muscle activity and kinematics of highly trained cyclists during fatigue. IEEE Trans Biomed Eng, 55(11), 2666-2674. https://doi.org/10.1109/TBME.2008.2001130
100
Donath, L., Faude, O., Roth, R., & Zahner, L. (2014). Effects of stair-climbing on balance, gait, strength, resting heart rate, and submaximal endurance in healthy seniors. Scand J Med Sci Sports, 24(2), 93-101. https://doi.org/10.1111/sms.12113
Dorman, L. E., & Havenith, G. (2009). The effects of protective clothing on energy consumption during different activities. European Journal of Applied Physiology, 105(3), 463-470. https://doi.org/10.1007/s00421-008-0924-2
Duffield, R., Edge, J., Bishop, D., & Goodman, C. (2007). The relationship between the VO2 slow component, muscle metabolites and performance during very-heavy exhaustive exercise. J Sci Med Sport, 10(3), 127-134. https://doi.org/10.1016/j.jsams.2006.05.013
Eberstein, A., & Beattie, B. (1985). Simultaneous measurement of muscle conduction velocity and EMG power spectrum changes during fatigue. Muscle Nerve, 8(9), 768-773. https://doi.org/10.1002/mus.880080905
Eteraf Oskouei, A., Ferdosrad, N., Dianat, I., Asghari Jafarabadi, M., & Nazari, J. (2014). Electromyographic Activity of Soleus and Tibialis Anterior Muscles during Ascending and Descending Stairs of Different Heights. Health Promot Perspect, 4(2), 173-179. https://doi.org/10.5681/hpp.2014.023
Farina, D. (2006). Interpretation of the surface electromyogram in dynamic contractions. Exerc Sport Sci Rev, 34(3), 121-127. https://doi.org/10.1249/00003677-200607000-00006
Ferraro, R. A., Pinto-Zipp, G., Simpkins, S., & Clark, M. (2013). Effects of an inclined walking surface and balance abilities on spatiotemporal gait parameters of older adults. J Geriatr Phys Ther, 36(1), 31-38. https://doi.org/10.1519/JPT.0b013e3182510339
Gallagher, S., & Schall, M. C., Jr. (2017). Musculoskeletal disorders as a fatigue failure process: evidence, implications and research needs. Ergonomics, 60(2), 255-269. https://doi.org/10.1080/00140139.2016.1208848
Gao, C., Halder, A., Svensson, I., Gard, G., Nikoleris, G., Andersson, P., & Magnusson, M. (2014). Using a walkway with adjustable inclination to measure and assess slip and fall risks. International Conference on Achieving Sustainable Construction Health and Safety, Lund, Sweden.
Gao, C., Oksa, J., Rintamaki, H., & Holmer, I. (2008). Gait muscle activity during walking on an inclined icy surface. Ind Health, 46(1), 15-22. https://doi.org/10.2486/indhealth.46.15
Gledhill, N., & Jamnik, V. K. (1992). Characterization of the physical demands of firefighting. Can J Sport Sci, 17(3), 207-213. https://www.ncbi.nlm.nih.gov/pubmed/1325260
Goodwin, M. L., Harris, J. E., Hernandez, A., & Gladden, L. B. (2007). Blood lactate measurements and analysis during exercise: a guide for clinicians. J Diabetes Sci Technol, 1(4), 558-569. https://doi.org/10.1177/193229680700100414
Gottschall, J. S., Aghazarian, G. S., & Rohrbach, E. A. (2010). The metabolic and muscular differences between two stair-climbing strategies of young adults. J Strength Cond Res, 24(9), 2558-2563. https://doi.org/10.1519/JSC.0b013e3181e83a6f
101
Granacher, U., Gruber, M., Forderer, D., Strass, D., & Gollhofer, A. (2010). Effects of ankle fatigue on functional reflex activity during gait perturbations in young and elderly men. Gait Posture, 32(1), 107-112. https://doi.org/10.1016/j.gaitpost.2010.03.016
Gullstrand, L., Halvorsen, K., Tinmark, F., Eriksson, M., & Nilsson, J. (2009). Measurements of vertical displacement in running, a methodological comparison. Gait Posture, 30(1), 71-75. https://doi.org/10.1016/j.gaitpost.2009.03.001
Halder, A. (2017). Evaluation of physical work capacity and leg muscle fatigue during exhaustive stair ascending evacuation. Lund University Lund, Sweden. http://portal.research.lu.se/portal/en/publications/evaluation-of-physical-work-capacity-and-leg-muscle-fatigue-during-exhaustive-stair-ascending-evacuation(2e89d58a-1d3e-4e07-b17a-c93a2489e2a9).html
Halder, A., Gao, C., & Miller, M. (2014). Effects of Cooling on Ankle Muscle Strength, Electromyography, and Gait Ground Reaction Forces. J Sports Med, 2014. https://doi.org/10.1155/2014/520124
Halsey, L. G., Watkins, D. A., & Duggan, B. M. (2012). The energy expenditure of stair climbing one step and two steps at a time: estimations from measures of heart rate. Plos One, 7(12). https://doi.org/10.1371/journal.pone.0051213
Hamill, J., Knutzen, K., & Derrick, T. (2015). Biomechanical basis of human movement (Fourth ed.). Wolters Kluwer Health/Lippincott Williams and Wilkins.
Hanon, C., Thepaut-Mathieu, C., Hausswirth, C., & Le Chevalier, J. M. (1998). Electromyogram as an indicator of neuromuscular fatigue during incremental exercise. Eur J Appl Physiol Occup Physiol, 78(4), 315-323. https://doi.org/10.1007/s004210050426
Hermens, H. J., Freriks, B., Disselhorst-Klug, C., & Rau, G. (2000). Development of recommendations for SEMG sensors and sensor placement procedures. J Electromyogr Kinesiol, 10(5), 361-374. https://doi.org/10.1016/s1050-6411(00)00027-4
Holmer, I., & Gavhed, D. (2007). Classification of metabolic and respiratory demands in fire fighting activity with extreme workloads. Appl Ergon, 38(1), 45-52. https://doi.org/10.1016/j.apergo.2006.01.004
Horton, R. (2012). GBD 2010: understanding disease, injury, and risk. Lancet, 380(9859), 2053-2054. https://doi.org/10.1016/S0140-6736(12)62133-3
Howley, E. T., Bassett, D. R., Jr., & Welch, H. G. (1995). Criteria for maximal oxygen uptake: review and commentary. Med Sci Sports Exerc, 27(9), 1292-1301. https://www.ncbi.nlm.nih.gov/pubmed/8531628
Ilmarinen, J., Rutenfranz, J., Knauth, P., Ahrens, M., Kylian, H., Siuda, A., & Korallus, U. (1978). The effect of an on the job training program -- stairclimbing -- on the physical working capacity of employees. Eur J Appl Physiol Occup Physiol, 38(1), 25-40. https://doi.org/10.1007/bf00436750
ISO, I. O. f. S. (2004). ISO 8996 Ergonomics of thermal environment - Determination of metabolic heat production.
Issekutz, B., Jr., & Rodahl, K. (1961). Respiratory quotient during exercise. J Appl Physiol, 16(4), 606-610. https://doi.org/10.1152/jappl.1961.16.4.606
102
Jeker, D., Falbriard, M., Vernillo, G., Meyer, F., Savoldelli, A., Degache, F., Schena, F., Aminian, K., & Millet, G. P. (2020). Changes in spatio-temporal gait parameters and vertical speed during an extreme mountain ultra-marathon. Eur J Sport Sci, 1-7. https://doi.org/10.1080/17461391.2020.1712480
Johnson, A. N., Cooper, D. F., & Edwards, R. H. (1977). Exertion of stairclimbing in normal subjects and in patients with chronic obstructive bronchitis. Thorax, 32(6), 711-716. https://doi.org/10.1136/thx.32.6.711
Jones, A. M., Grassi, B., Christensen, P. M., Krustrup, P., Bangsbo, J., & Poole, D. C. (2011). Slow component of VO2 kinetics: mechanistic bases and practical applications. Med Sci Sports Exerc, 43(11), 2046-2062. https://doi.org/10.1249/MSS.0b013e31821fcfc1
Jones, A. M., & Vanhatalo, A. (2017). The 'Critical Power' Concept: Applications to Sports Performance with a Focus on Intermittent High-Intensity Exercise. Sports Med, 47(Suppl 1), 65-78. https://doi.org/10.1007/s40279-017-0688-0
Jones, A. M., Vanhatalo, A., Burnley, M., Morton, R. H., & Poole, D. C. (2010). Critical power: implications for determination of VO2max and exercise tolerance. Med Sci Sports Exerc, 42(10), 1876-1890. https://doi.org/10.1249/MSS.0b013e3181d9cf7f
Jones, A. M., Wilkerson, D. P., Berger, N. J., & Fulford, J. (2007). Influence of endurance training on muscle [PCr] kinetics during high-intensity exercise. Am J Physiol Regul Integr Comp Physiol, 293(1), R392-401. https://doi.org/10.1152/ajpregu.00056.2007
Kang, J., Walker, H., Hebert, M., Wendell, M., & Hoffman, J. R. (2004). Influence of contraction frequency on cardiovascular responses during the upper and lower body exercise. Research in Sports Medicine, 12(4), 251-264. http://ludwig.lub.lu.se/login?url=http://search.ebscohost.com/login.aspx?direct=true&db=ccm&AN=106597043&site=eds-live&scope=site
Kawamura, K., Tokuhiro, A., & Takechi, H. (1991). Gait analysis of slope walking: a study on step length, stride width, time factors and deviation in the center of pressure. Acta Med Okayama, 45(3), 179-184. https://doi.org/10.18926/AMO/32212
Keir, D. A., Paterson, D. H., Kowalchuk, J. M., & Murias, J. M. (2018). Using ramp-incremental VO2 responses for constant-intensity exercise selection. Appl Physiol Nutr Metab, 43(9), 882-892. https://doi.org/10.1139/apnm-2017-0826
Kraemer, W. J., & Newton, R. U. (1994). Training for improved vertical jump. Sports Science Exchange, 7(6), 1-12
Krustrup, P., Soderlund, K., Mohr, M., & Bangsbo, J. (2004). The slow component of oxygen uptake during intense, sub-maximal exercise in man is associated with additional fibre recruitment. Pflugers Arch, 447(6), 855-866. https://doi.org/10.1007/s00424-003-1203-z
Lam, J. H. T., Yuen, J. K. K., Lee, E. W. M., & Lee, R. Y. Y. (2014). Experimental study on upward movement in a high-rise building. Safety Science, 70(70), 397-405. https://doi.org/10.1016/j.ssci.2014.07.011
Lattanzio, P. J., Petrella, R. J., Sproule, J. R., & Fowler, P. J. (1997). Effects of fatigue on knee proprioception. Clin J Sport Med, 7(1), 22-27. https://doi.org/10.1097/00042752-199701000-00005
103
Leroux, A., Fung, J., & Barbeau, H. (2002). Postural adaptation to walking on inclined surfaces: I. Normal strategies. Gait Posture, 15(1), 64-74. https://doi.org/10.1016/s0966-6362(01)00181-3
Loe, H., Rognmo, O., Saltin, B., & Wisloff, U. (2013). Aerobic capacity reference data in 3816 healthy men and women 20-90 years. Plos One, 8(5), e64319. https://doi.org/10.1371/journal.pone.0064319
Longpre, H. S., Potvin, J. R., & Maly, M. R. (2013). Biomechanical changes at the knee after lower limb fatigue in healthy young women. Clin Biomech, 28(4), 441-447. https://doi.org/10.1016/j.clinbiomech.2013.02.010
Lowery, M., Nolan, P., & O'Malley, M. (2002). Electromyogram median frequency, spectral compression and muscle fibre conduction velocity during sustained sub-maximal contraction of the brachioradialis muscle. J Electromyogr Kinesiol, 12(2), 111-118. https://doi.org/10.1016/s1050-6411(02)00004-4
Lusa, S., Louhevaara, V., Smolander, J., Kivimaki, M., & Korhonen, O. (1993). Physiological responses of firefighting students during simulated smoke-diving in the heat. Am Ind Hyg Assoc J, 54(5), 228-231. https://doi.org/10.1080/15298669391354603
Macdonald, A. S., Loudon, D., Rowe, P. J., Samuel, D., Hood, V., Nicol, A. C., Grealy, M. A., & Conway, B. A. (2007). Towards a design tool for visualizing the functional demand placed on older adults by everyday living tasks. Universal Access in the Information Society, 6(2), 137-144. https://doi.org/10.1007/s10209-007-0078-8
MacIsaac, D., Parker, P. A., & Scott, R. N. (2001). The short-time Fourier transform and muscle fatigue assessment in dynamic contractions. J Electromyogr Kinesiol, 11(6), 439-449. https://doi.org/10.1016/s1050-6411(01)00021-9
Marino, F. E. (2012). The limitations of the constant load and self-paced exercise models of exercise physiology. Comparative Exercise Physiology, 7(04), 173-178. https://doi.org/10.1017/s1755254012000013
McArdle, W. D., Katch, F. I., & Katch, V. L. (2015). Exercise Physiology, Nutrition, Energy, And Human Performance (Eighth ed.). Wolters Kluwer Health
McFadyen, B. J., & Winter, D. A. (1988). An integrated biomechanical analysis of normal stair ascent and descent. J Biomech, 21(9), 733-744. https://doi.org/10.1016/0021-9290(88)90282-5
McIntosh, A. S., Beatty, K. T., Dwan, L. N., & Vickers, D. R. (2006). Gait dynamics on an inclined walkway. J Biomech, 39(13), 2491-2502. https://doi.org/10.1016/j.jbiomech.2005.07.025
McLoughlin, J. V., Barr, C. J., Patritti, B., Crotty, M., Lord, S. R., & Sturnieks, D. L. (2016). Fatigue induced changes to kinematic and kinetic gait parameters following six minutes of walking in people with multiple sclerosis. Disabil Rehabil, 38(6), 535-543. https://doi.org/10.3109/09638288.2015.1047969
McVay, E. J., & Redfern, M. S. (2010). Rampway Safety: Foot Forces as a Function of Rampway Angle. Am Ind Hyg Assoc J, 55(7), 626-634. https://doi.org/10.1080/15428119491018718
Merletti, R., Knaflitz, M., & De Luca, C. J. (1990). Myoelectric manifestations of fatigue in voluntary and electrically elicited contractions. J Appl Physiol (1985), 69(5), 1810-1820. https://doi.org/10.1152/jappl.1990.69.5.1810
104
Miller, P. K., & Bird, A. M. (1976). Localized muscle fatigue and dynamic balance. Percept Mot Skills, 42(1), 135-138. https://doi.org/10.2466/pms.1976.42.1.135
Murdock, G. H., & Hubley-Kozey, C. L. (2012). Effect of a high intensity quadriceps fatigue protocol on knee joint mechanics and muscle activation during gait in young adults. European Journal of Applied Physiology, 112(2), 439-449. https://doi.org/10.1007/s00421-011-1990-4
Nadeau, S., McFadyen, B. J., & Malouin, F. (2003). Frontal and sagittal plane analyses of the stair climbing task in healthy adults aged over 40 years: what are the challenges compared to level walking? Clinical Biomechanics, 18(10), 950-959. https://doi.org/10.1016/s0268-0033(03)00179-7
Nazifi, M. M., Beschorner, K., & Hur, P. (2019). Angular momentum regulation may dictate the slip severity in young adults. https://doi.org/10.1101/785808 %J bioRxiv
Nightingale, E. J., Pourkazemi, F., & Hiller, C. E. (2014). Systematic review of timed stair tests. J Rehabil Res Dev, 51(3), 335-350. https://doi.org/10.1682/JRRD.2013.06.0148
O'Connell, E. R., Thomas, P. C., Cady, L. D., & Karwasky, R. J. (1986). Energy costs of simulated stair climbing as a job-related task in fire fighting. J Occup Med, 28(4), 282-284. https://www.ncbi.nlm.nih.gov/pubmed/3701477
Oksa, J., Ducharme, M. B., & Rintamäki, H. (2002). Combined effect of repetitive work and cold on muscle function and fatigue. Journal of Applied Physiology, 92(1), 354-361. http://jap.physiology.org/content/jap/92/1/354.full.pdf
Parijat, P., & Lockhart, T. E. (2008). Effects of lower extremity muscle fatigue on the outcomes of slip-induced falls. Ergonomics, 51(12), 1873-1884. https://doi.org/10.1080/00140130802567087
Peacock, R. D., Averill, J. D., & Kuligowski, E. D. (2010). Stairwell Evacuation from Buildings: What We Know We Don’t Know. In W. W. F. Klingsch, C. Rogsch, A. Schadschneider, & M. Schreckenberg (Eds.), Pedestrian and Evacuation Dynamics 2008, 55-66. https://doi.org/10.1007/978-3-642-04504-2_4
Pelechano, N., & Malkawi, A. (2008). Evacuation simulation models: Challenges in modeling high rise building evacuation with cellular automata approaches. Automation in Construction, 17(4), 377-385. https://doi.org/10.1016/j.autcon.2007.06.005
Pollard, J. P., Heberger, J. R., & Dempsey, P. G. (2015). Slip Potential for Commonly Used Inclined Grated Metal Walkways. IIE transactions on occupational ergonomics and human factors, 3(2), 115-126. https://doi.org/10.1080/21577323.2014.1001501
Poole, D. C., Barstow, T. J., Gaesser, G. A., Willis, W. T., & Whipp, B. J. (1994). VO2 slow component: physiological and functional significance. Med Sci Sports Exerc, 26(11), 1354-1358. https://www.ncbi.nlm.nih.gov/pubmed/7837956
Poole, D. C., & Jones, A. M. (2017). Measurement of the maximum oxygen uptake VO2max: VO2peak is no longer acceptable. J Appl Physiol (1985), 122(4), 997-1002. https://doi.org/10.1152/japplphysiol.01063.2016
Poole, D. C., Wilkerson, D. P., & Jones, A. M. (2008). Validity of criteria for establishing maximal O2 uptake during ramp exercise tests. European Journal of Applied Physiology, 102(4), 403-410. https://doi.org/10.1007/s00421-007-0596-3
105
Ramos-Jiménez, A., Hernández-Torres, R. P., Torres-Durán, P. V., Romero-Gonzalez, J., Mascher, D., Posadas-Romero, C., & Juárez-Oropeza, M. A. (2008). The Respiratory Exchange Ratio is Associated with Fitness Indicators Both in Trained and Untrained Men: A Possible Application for People with Reduced Exercise Tolerance. Clinical Medicine. Circulatory, Respiratory and Pulmonary Medicine, 2, 1-9. https://www.ncbi.nlm.nih.gov/pmc/articles/PMC2990231/pdf/ccrpm-2008-001.pdf
Rantanen, T., Era, P., Kauppinen, M., & Heikkinen, E. (1994). Maximal Isometric Muscle Strength and Socioeconomic Status, Health, and Physical Activity in 75-Year-Old Persons. Journal of Aging and Physical Activity, 2(3), 206-220. https://doi.org/10.1123/japa.2.3.206
Reybrouck, T., Ghesquiere, J., Weymans, M., & Amery, A. (1986). Ventilatory threshold measurement to evaluate maximal endurance performance. Int J Sports Med, 7(1), 26-29. https://doi.org/10.1055/s-2008-1025730
Riener, R., Rabuffetti, M., & Frigo, C. (2002). Stair ascent and descent at different inclinations. Gait & Posture, 15(1), 32-44. https://doi.org/10.1016/s0966-6362(01)00162-x
Robergs, R. A., & Landwehr, R. (2002). The surprising history of the "HRmax=220-age" equation [Review]. Journal of Exercise Physiology Online, 5(2), 1-10. http://ludwig.lub.lu.se/login?url=http://search.ebscohost.com/login.aspx?direct=true&db=edselc&AN=edselc.2-52.0-3242723231&site=eds-live&scope=site
Robergs, R. A., & Roberts, S. (1997). Exercise Physiology: Exercise, performance, and clinical applications. Mosby.
Ronchi, E., Corbetta, A., Galea, E. R., Kinateder, M., Kuligowski, E., McGrath, D., Pel, A., Shiban, Y., Thompson, P., & Toschi, F. (2019). New approaches to evacuation modelling for fire safety engineering applications. Fire Safety Journal, 106, 197-209. https://doi.org/10.1016/j.firesaf.2019.05.002
Ronchi, E., & Nilsson, D. (2013). Fire evacuation in high-rise buildings: a review of human behaviour and modelling research. Fire Science Reviews, 2(1), 1. http://www.firesciencereviews.com/content/2/1/7
Ronchi, E., Norén, J., Delin, M., Kuklane, K., Halder, A., Arias, S., & Fridolf, K. (2015). Ascending evacuation in long stairways: Physical exertion, walking speed and behaviour. Lund University (Report 3192 ). http://lup.lub.lu.se/record/8232151/file/8232173.pdf
Ronchi, E., Reneke, P. A., & Peacock, R. D. (2016). A conceptual fatigue-motivation model to represent pedestrian movement during stair evacuation. Applied Mathematical Modelling, 40(7-8), 4380-4396. https://doi.org/10.1016/j.apm.2015.11.040
Rossiter, H. B., Ward, S. A., Kowalchuk, J. M., Howe, F. A., Griffiths, J. R., & Whipp, B. J. (2001). Effects of prior exercise on oxygen uptake and phosphocreatine kinetics during high-intensity knee-extension exercise in humans. J Physiol, 537(1), 291-303. https://doi.org/10.1111/j.1469-7793.2001.0291k.x
Roston, W. L., Whipp, B. J., Davis, J. A., Cunningham, D. A., Effros, R. M., & Wasserman, K. (1987). Oxygen uptake kinetics and lactate concentration during exercise in humans. Am Rev Respir Dis, 135(5), 1080-1084. https://doi.org/10.1164/arrd.1987.135.5.1080
106
Redfern, M. S., & DiPasquale, J. (1997). Biomechanics of descending ramps. Gait & Posture, 6(2), 119-125. https://doi.org/10.1016/s0966-6362(97)01117-x
Sabapathy, S., Schneider, D. A., & Morris, N. R. (2005). The VO2 slow component: relationship between plasma ammonia and EMG activity. Med Sci Sports Exerc, 37(9), 1502-1509. https://doi.org/10.1249/01.mss.0000182497.43221.e1
Samuel, D., Rowe, P., Hood, V., & Nicol, A. (2011). The biomechanical functional demand placed on knee and hip muscles of older adults during stair ascent and descent. Gait Posture, 34(2), 239-244. https://doi.org/10.1016/j.gaitpost.2011.05.005
Saunders, M. J., Evans, E. M., Arngrimsson, S. A., Allison, J. D., Warren, G. L., & Cureton, K. J. (2000). Muscle activation and the slow component rise in oxygen uptake during cycling. Med Sci Sports Exerc, 32(12), 2040-2045. https://doi.org/10.1097/00005768-200012000-00012
Scheuermann, B. W., Tripse McConnell, J. H., & Barstow, T. J. (2002). EMG and oxygen uptake responses during slow and fast ramp exercise in humans. Exp Physiol, 87(1), 91-100. https://doi.org/10.1113/eph8702246
Shinohara, M., & Moritani, T. (1992). Increase in neuromuscular activity and oxygen uptake during heavy exercise. Ann Physiol Anthropol, 11(3), 257-262. https://www.ncbi.nlm.nih.gov/pubmed/1642722
Shiomi, T. (1994). Effects of different patterns of stairclimbing on physiological cost and motor efficiency. J Hum Ergol (Tokyo), 23(2), 111-120. https://www.ncbi.nlm.nih.gov/pubmed/7730596
Sothmann, M. S., Saupe, K., Jasenof, D., & Blaney, J. (1992). Heart rate response of firefighters to actual emergencies. Implications for cardiorespiratory fitness. J Occup Med, 34(8), 797-800. https://doi.org/10.1097/00043764-199208000-00014
Stegemann, J. (1981). Exercise Physiology: Physiologic Bases of Work and Sport. Goerg Thieme Verlag/Mosby. https://books.google.se/books?id=8BhtQgAACAAJ
Steiner, A. A., Flatow, E. A., Brito, C. F., Fonseca, M. T., & Komegae, E. N. (2017). Respiratory gas exchange as a new aid to monitor acidosis in endotoxemic rats: relationship to metabolic fuel substrates and thermometabolic responses. Physiol Rep, 5(1). https://doi.org/10.14814/phy2.13100
Sun, J., Walters, M., Svensson, N., & Lloyd, D. (1996). The influence of surface slope on human gait characteristics: a study of urban pedestrians walking on an inclined surface. Ergonomics, 39(4), 677-692. https://doi.org/10.1080/00140139608964489
Svensson, I., Gao, C., Halder, A., Gard, G., & Magnusson, M. (2018). Standing balance on inclined surfaces with different friction. Ind Health, 56(4), 292-299. https://doi.org/10.2486/indhealth.2018-0005
Tanaka, H., Monahan, K. D., & Seals, D. R. (2001). Age-predicted maximal heart rate revisited. J Am Coll Cardiol, 37(1), 153-156. https://doi.org/10.1016/s0735-1097(00)01054-8
Teh, K. C., & Aziz, A. R. (2002). Heart rate, oxygen uptake, and energy cost of ascending and descending the stairs. Med Sci Sports Exerc, 34(4), 695-699. https://doi.org/10.1097/00005768-200204000-00021
107
Turner, D. E., Helliwell, P. S., Emery, P., & Woodburn, J. (2006). The impact of rheumatoid arthritis on foot function in the early stages of disease: a clinical case series. BMC Musculoskelet Disord, 7, 102. https://doi.org/10.1186/1471-2474-7-102
Vanhatalo, A., Poole, D. C., DiMenna, F. J., Bailey, S. J., & Jones, A. M. (2011). Muscle fiber recruitment and the slow component of O2 uptake: constant work rate vs. all-out sprint exercise. Am J Physiol Regul Integr Comp Physiol, 300(3), R700-707. https://doi.org/10.1152/ajpregu.00761.2010
Vogiatzis, I., Spurway, N. C., Jennett, S., Wilson, J., & Sinclair, J. (1996). Changes in ventilation related to changes in electromyograph activity during repetitive bouts of isometric exercise in simulated sailing. Eur J Appl Physiol Occup Physiol, 72(3), 195-203. https://doi.org/10.1007/bf00838638
von Heimburg, E. D., Rasmussen, A. K., & Medbo, J. I. (2006). Physiological responses of firefighters and performance predictors during a simulated rescue of hospital patients. Ergonomics, 49(2), 111-126. https://doi.org/10.1080/00140130500435793
Weir, J. P., Wagner, L. L., & Housh, T. J. (1992). Linearity and reliability of the IEMG v torque relationship for the forearm flexors and leg extensors. Am J Phys Med Rehabil, 71(5), 283-287. https://doi.org/10.1097/00002060-199210000-00006
Whipp, B. J., & Wasserman, K. (1972). Oxygen uptake kinetics for various intensities of constant-load work. J Appl Physiol, 33(3), 351-356. https://doi.org/10.1152/jappl.1972.33.3.351
Williams-Bell, F. M., Boisseau, G., McGill, J., Kostiuk, A., & Hughson, R. L. (2010). Physiological responses and air consumption during simulated firefighting tasks in a subway system. Appl Physiol Nutr Metab, 35(5), 671-678. https://doi.org/10.1139/H10-061
World Medical, A. (2013). World Medical Association Declaration of Helsinki: ethical principles for medical research involving human subjects. Jama, 310(20), 2191-2194. https://doi.org/10.1001/jama.2013.281053
Wu, Y., Xu, J., Jia, L., & Qin, Y. (2018). Estimation of emergency evacuation capacity for subway stations. Journal of Transportation Safety & Security, 10(6), 586-601. https://doi.org/10.1080/19439962.2017.1357059
Xu, C., Yang, G., & Yang, M. (2015). Sample-Based Vegetation Distribution Information Synthesis. Plos One, 10(8). https://doi.org/10.1371/journal.pone.0134009
Yoshino, K., Motoshige, T., Araki, T., & Matsuoka, K. (2004). Effect of prolonged free-walking fatigue on gait and physiological rhythm. J Biomech, 37(8), 1271-1280. https://doi.org/10.1016/j.jbiomech.2003.11.031
Zoladz, J. A., Gladden, L. B., Hogan, M. C., Nieckarz, Z., & Grassi, B. (2008). Progressive recruitment of muscle fibers is not necessary for the slow component of VO2 kinetics. J Appl Physiol (1985), 105(2), 575-580. https://doi.org/10.1152/japplphysiol.01129.2007
Zoladz, J. A., Rademaker, A. C., & Sargeant, A. J. (1995). Non-linear relationship between O2 uptake and power output at high intensities of exercise in humans. J Physiol, 488 (1), 211-217. https://doi.org/10.1113/jphysiol.1995.sp020959

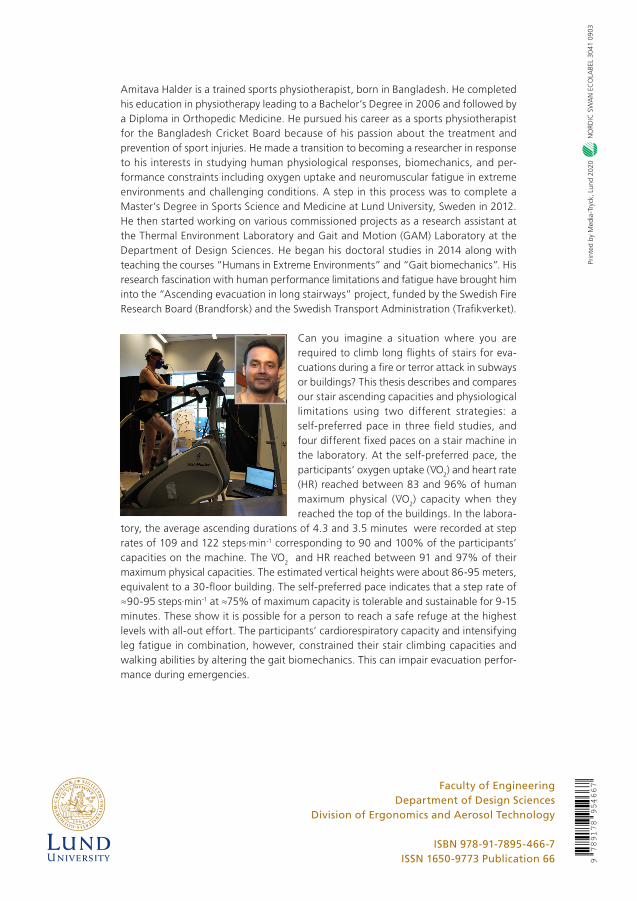
Faculty of EngineeringDepartment of Design Sciences
Division of Ergonomics and Aerosol Technology
ISBN 978-91-7895-466-7 ISSN 1650-9773 Publication 66 9
789178
954667
Amitava Halder is a trained sports physiotherapist, born in Bangladesh. He completed his education in physiotherapy leading to a Bachelor’s Degree in 2006 and followed by a Diploma in Orthopedic Medicine. He pursued his career as a sports physiotherapist for the Bangladesh Cricket Board because of his passion about the treatment and prevention of sport injuries. He made a transition to becoming a researcher in response to his interests in studying human physiological responses, biomechanics, and per-formance constraints including oxygen uptake and neuromuscular fatigue in extreme environments and challenging conditions. A step in this process was to complete a Master’s Degree in Sports Science and Medicine at Lund University, Sweden in 2012. He then started working on various commissioned projects as a research assistant at the Thermal Environment Laboratory and Gait and Motion (GAM) Laboratory at the Department of Design Sciences. He began his doctoral studies in 2014 along with teaching the courses “Humans in Extreme Environments” and “Gait biomechanics”. His research fascination with human performance limitations and fatigue have brought him into the “Ascending evacuation in long stairways” project, funded by the Swedish Fire Research Board (Brandforsk) and the Swedish Transport Administration (Trafikverket).
Can you imagine a situation where you are required to climb long flights of stairs for eva-cuations during a fire or terror attack in subways or buildings? This thesis describes and compares our stair ascending capacities and physiological limitations using two different strategies: a self-preferred pace in three field studies, and four different fixed paces on a stair machine in the laboratory. At the self-preferred pace, the participants’ oxygen uptake (V̇O2) and heart rate (HR) reached between 83 and 96% of human maximum physical (V̇O2) capacity when they reached the top of the buildings. In the labora-
tory, the average ascending durations of 4.3 and 3.5 minutes were recorded at step rates of 109 and 122 steps·min-1 corresponding to 90 and 100% of the participants’ capacities on the machine. The V̇O2 and HR reached between 91 and 97% of their maximum physical capacities. The estimated vertical heights were about 86-95 meters, equivalent to a 30-floor building. The self-preferred pace indicates that a step rate of ≈90-95 steps·min-1 at ≈75% of maximum capacity is tolerable and sustainable for 9-15 minutes. These show it is possible for a person to reach a safe refuge at the highest levels with all-out effort. The participants’ cardiorespiratory capacity and intensifying leg fatigue in combination, however, constrained their stair climbing capacities and walking abilities by altering the gait biomechanics. This can impair evacuation perfor-mance during emergencies.
66