the evolution of internet-based map server applications in the united states department of...
TRANSCRIPT
Veterinaria Italiana, 43 (3), 723-730
© IZS A&M 2007 www.izs.it/vet_italiana Vol. 43 (3), Vet Ital 723
The evolution of internet-based map server
applications in the United States Department of
Agriculture, Veterinary Services
Susan A. Maroney, Mary Jane McCool, Kenneth D. Geter & Angela M. James
Summary The internet is used increasingly as an effective means of disseminating information. For the past five years, the United States Department of Agriculture (USDA) Veterinary Services (VS) has published animal health information in internet-based map server applications, each oriented to a specific surveillance or outbreak response need. Using internet-based technology allows users to create dynamic, customised maps and perform basic spatial analysis without the need to buy or learn desktop geographic information systems (GIS) software. At the same time, access can be restricted to authorised users. The VS internet mapping applications to date are as follows: Equine Infectious Anemia Testing 1972-2005, National Tick Survey tick distribution maps, the Emergency Management Response System-Mapping Module for disease investigations and emergency outbreaks, and the Scrapie mapping module to assist with the control and eradication of this disease. These services were created using Environmental Systems Research Institute (ESRI)’s internet map server technology (ArcIMS™). Other leading technologies for spatial data dissemination are ArcGIS™ Server, ArcEngine™, and ArcWeb™ Services. VS is prototyping applications using these technologies, including the VS Atlas of Animal Health Information using ArcGIS™ Server technology and the Map Kiosk using
ArcEngine™ for automating standard map production in the case of an emergency.
Keywords Animal health, Equine infectious anaemia, Geographic information system, Internet, Mapping, Scrapie, Ticks, United States of America, Veterinary services, Web.
L’evoluzione delle applicazioni map server basati su internet negli Stati Uniti d’America, Servizi Veterinari Riassunto Internet viene sempre più utilizzata quale efficace strumento di disseminazione dell’informazione. Nel corso degli ultimi anni il Dipartimento dell’Agricoltura degli Stati Uniti-Servizi Veterinari ha pubblicato informazioni sulla sanità animale in un’ applicazione map-server basata su internet; tali informazioni sono state utilizzate o in caso di risposta ad un focolaio di malattia o in piani specifici di sorveglianza. L’utilizzo della tecnologia basata su internet permette di creare mappe dinamiche e personalizzate, nonché di eseguire analisi spaziali di base senza la necessità di acquistare o imparare ad utilizzare software GIS. Allo stesso tempo l’accesso a tali map-server può essere ristretto agli utenti abilitati. Le applicazioni da parte dei Servizi Veterinari della tecnologia di mapping basato su internet ad oggi sono le
United States Department of Agriculture, Animal and Plant Health Inspection Service, Veterinary Services, Centers for Epidemiology and Animal Health, 2150 Centre Avenue, Building B, Mail Stop 2W4, Fort Collins, CO 80526, United States of America [email protected]
The evolution of internet-based map server applications Susan A. Maroney, Mary Jane McCool, Kenneth D. Geter in the United States Department of Agriculture, Veterinary Services & Angela M. James
724 Vol. 43 (3), Vet Ital www.izs.it/vet_italiana © IZS A&M 2007
seguenti: risultati dei test per Anemia infettiva equina 1972-2005, mappa di distribuzione della sorveglianza nazionale sulle zecche, Il modulo di mapping del sistema di risposta e gestione delle emergenze nel caso di indagine epidemiologica nei focolai di malattie infettive, il modulo di mapping della Scrapie utilizzabile per il controllo e l’eradicazione di questa malattia. Questi servizi sono stati creati utilizzando la tecnologia dei map-server basati su internet sviluppata da Environmental Systems Research Institute (ESRI)’s (ArcIMS™). Le altre tecnologie principali per la disseminazione dei dati spaziali sono ArcGIS™ Server, ArcEngine™, e ArcWeb™ Services. I Servizi Veterinari stanno creando dei prototipi di utilizzo di queste tecnologie, ivi compreso l’Atlante informatizzato sulla sanità animale basto sull’utilizzo di ArcGIS™ Server e la Map Kiosk basata sull’utilzzo di ArcEngine™ che rendono automatica la produzione di mappe standard in caso di emergenze.
Parole chiave Anemia infettiva equina, Internet, Mappatura, Sanità animale, Scrapie, Servizi Veterinari, Sistema informativo geografico, Stati Uniti d’America, Zecche, Web.
Introduction The mission of the United States Department of Agriculture (USDA) Veterinary Services (VS) to protect and promote animal agriculture requires a broad range of expertise. VS animal health professionals, while specialists in their field, do not usually have training in spatial data and the interpretation of such data. Understanding spatial data and using it to advantage in a desktop geographic information system (GIS) package can be a steep learning curve. While there is usually a small group of sophisticated GIS users, there is a much larger audience interested in including spatial considerations in their work, but who do not want or need to be GIS professionals. An internet-based mapping application allows them to utilise spatial data in their work through a Web interface without any extra GIS training or software. Internet-based or Web-based mapping applications disseminate spatial data on
animal health and populations at variable geographic resolutions to animal health officials nationwide. They facilitate coordination both for day-to-day operations and more frequently during animal disease emergencies. They support decision-making (1). Distribution of spatial data in VS has evolved over the past 15 years. It began with paper maps, followed by a digital map graphic format like jpeg which is portable and can be pasted into a presentation or document, but is as static as the paper map. Eventually, users asked for spatial data to include in their own analyses, so we created CD-ROMs of spatial data pertinent to United States animal agriculture. However, the data needs quickly outgrew the CD medium and updates were only possible by burning and distributing new CDs. Over time, a broad user base interested in spatial data developed. This base was divided between a small group of sophisticated users and a large audience of people who wanted to visualise spatial data as part of their work, but did not have the time to learn and maintain proficiency in GIS desktop software. Then came the rise of the Web as a means of sharing data, information and knowledge. A Web-based application is able to combine or subset data and present it in a coherent picture, allowing users to customise the data displayed and reach conclusions without the need to acquire data, create a project or learn software. This is the true benefit of the internet-based applications.
Materials and methods With a Web-based interactive mapping service, a user can use spatial data through a familiar internet browser, interact with the data and create a customised output, a map or a spreadsheet, or a policy recommendation. The advantage for the user is using the functionality of the application without having to purchase GIS software or learn GIS software. So, for some people in VS, internet-based mapping is all the GIS they will need. Users still need some education on appropriate uses of spatial data for a complete understanding of the Web-GIS outputs.
Susan A. Maroney, Mary Jane McCool, Kenneth D. Geter The evolution of internet-based map server applications & Angela M. James in the United States Department of Agriculture, Veterinary Services
© IZS A&M 2007 www.izs.it/vet_italiana Vol. 43 (3), Vet Ital 725
Web-based mapping involves customising data sets and designing user interfaces so they align with the user’s goals and level of skills. Web-based mapping supports visualisation, analysis and decision-making, just as desktop GIS does. Web-based mapping is interactive, allowing users to explore a dataset, ask questions and create customised output (3). For VS, a crucial impetus in the ascendancy of spatial data was the Enterprise License Agreement between the USDA and the Environmental Systems Research Institute (ESRI). It provides the full suite of vendor products that accomplish GIS data collection, analysis, storage, display and dissemination. It is a rich development environment for Web-based mapping applications. Interest in Web-based mapping applications has accelerated the access to broadband internet connections for rural users in VS. There are significant challenges in developing internet-based mapping applications. Firstly, data quality is the primary component that makes the most significant difference in the usefulness of these applications. Data errors can become very obvious when viewed in a mapping context. So data collection methods and standards, as well as an understanding of all the ‘downstream’ effects of good and bad quality data, are crucial. Secondly, in VS, coordination among many different groups is needed to publish a Web-based mapping application. These include different experts, namely: veterinarians and epidemiologists, database administrators, Arc™ Spatial Database Engine (ArcSDE™) and ArcIMS™ or ArcGIS™ Server experts, programmers to write any customisations, firewall and other security experts, Web standards and publishing architects, and server and operating system experts. Thirdly, the ESRI software can change substantially between versions and there is a need to keep abreast with updates and patches. Finally, the interest in Web-based mapping applications has risen faster than the capability of our development teams to develop and publish these applications. Thus, VS has contracted out the development of some applications or parts of applications, while retaining control of the requirements
analysis process and project management. Once the development is complete and the work of the contractor finalised, the government needs to ensure that it has sufficient time and expertise to maintain and update the application. Web-based mapping services meet two major user needs in VS, namely: emergency preparedness and response surveillance.
Examples of each follow.
Results
Emergency applications The USDA plans extensively for animal health emergencies. The USDA model of emergency response is based on the United States Forest Service’s Incident Command System (ICS) where the definition of roles and responsibilities are clearly stated. The role of GIS for animal health incidents is being revised with broader responsibilities. Part of that GIS role is the development of internet-based mapping capabilities to support emergency management.
Emergency Management Response System-Mapping Module The first example of emergency preparedness and response is the Emergency Management and Response-Mapping Module (EMRS-MM). VS has documented procedures for investigating an animal suspected of having a foreign animal disease. The EMRS is a Lotus Notes-based system of managing the tasks required in an investigation. Latitude and longitude coordinates are part of the required data collected. Lotus Notes, however, is not a relational database. In order to map these investigations, data are sent to an ArcSDE™ structured query language (SQL) Server database in xml format. ArcSDE™ is used to convert coordinates to a spatial object useable by ESRI’s Web mapping software, ArcIMS™. The Web client is an ArcIMS™ Java Custom Viewer. Security is managed by Lotus Notes; an individual is put in a group and a group is given access to an incident and its maps. The EMRS-MM was used extensively during the
The evolution of internet-based map server applications Susan A. Maroney, Mary Jane McCool, Kenneth D. Geter in the United States Department of Agriculture, Veterinary Services & Angela M. James
726 Vol. 43 (3), Vet Ital www.izs.it/vet_italiana © IZS A&M 2007
Newcastle disease outbreak in southern California in 2002-2003. It allowed vets and epidemiologists to posit and test hypotheses of disease spread and to plan control strategies.
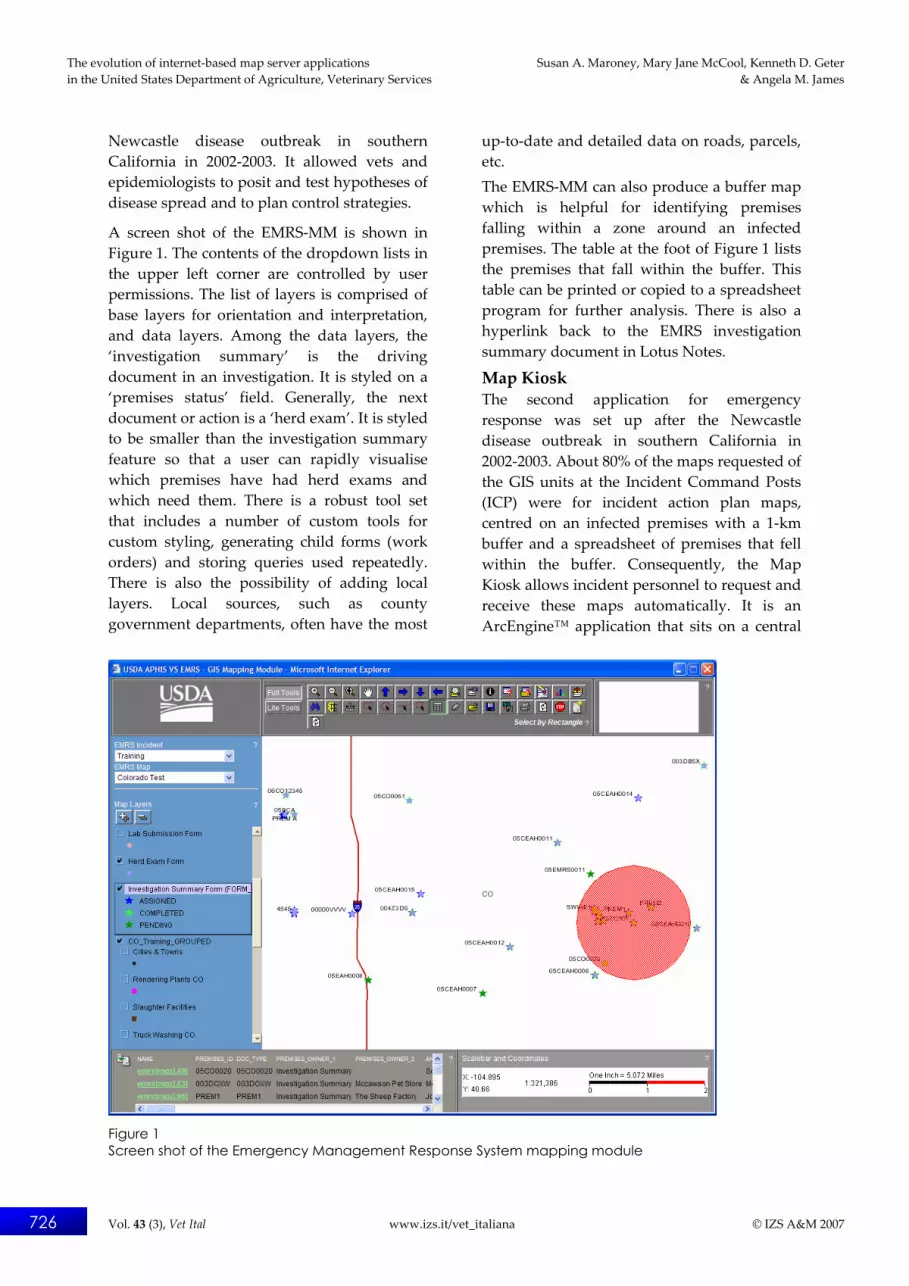
A screen shot of the EMRS-MM is shown in Figure 1. The contents of the dropdown lists in the upper left corner are controlled by user permissions. The list of layers is comprised of base layers for orientation and interpretation, and data layers. Among the data layers, the ‘investigation summary’ is the driving document in an investigation. It is styled on a ‘premises status’ field. Generally, the next document or action is a ‘herd exam’. It is styled to be smaller than the investigation summary feature so that a user can rapidly visualise which premises have had herd exams and which need them. There is a robust tool set that includes a number of custom tools for custom styling, generating child forms (work orders) and storing queries used repeatedly. There is also the possibility of adding local layers. Local sources, such as county government departments, often have the most
up-to-date and detailed data on roads, parcels, etc. The EMRS-MM can also produce a buffer map which is helpful for identifying premises falling within a zone around an infected premises. The table at the foot of Figure 1 lists the premises that fall within the buffer. This table can be printed or copied to a spreadsheet program for further analysis. There is also a hyperlink back to the EMRS investigation summary document in Lotus Notes.
Map Kiosk The second application for emergency response was set up after the Newcastle disease outbreak in southern California in 2002-2003. About 80% of the maps requested of the GIS units at the Incident Command Posts (ICP) were for incident action plan maps, centred on an infected premises with a 1-km buffer and a spreadsheet of premises that fell within the buffer. Consequently, the Map Kiosk allows incident personnel to request and receive these maps automatically. It is an ArcEngine™ application that sits on a central
Figure 1 Screen shot of the Emergency Management Response System mapping module
Susan A. Maroney, Mary Jane McCool, Kenneth D. Geter The evolution of internet-based map server applications & Angela M. James in the United States Department of Agriculture, Veterinary Services
© IZS A&M 2007 www.izs.it/vet_italiana Vol. 43 (3), Vet Ital 727
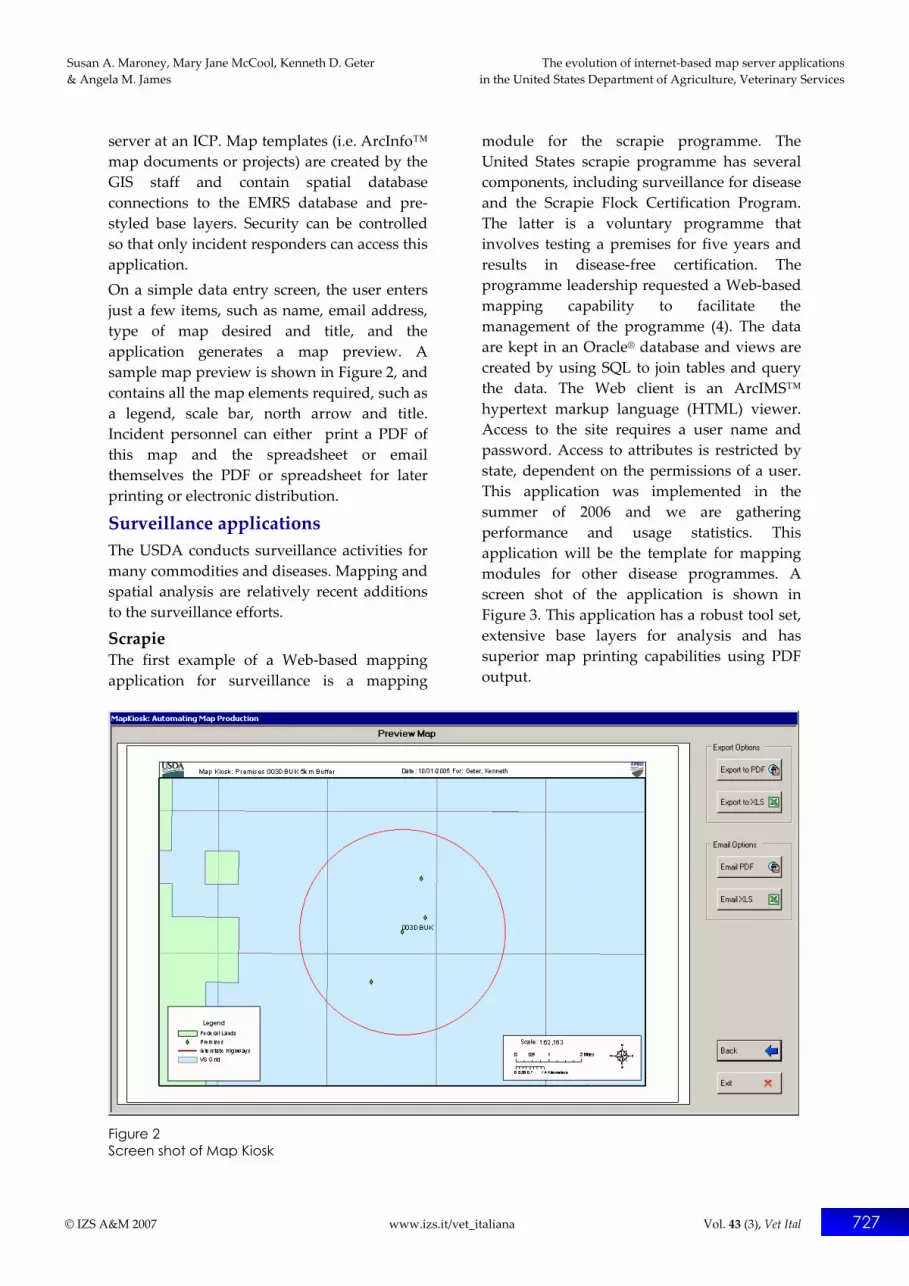
server at an ICP. Map templates (i.e. ArcInfo™ map documents or projects) are created by the GIS staff and contain spatial database connections to the EMRS database and pre-styled base layers. Security can be controlled so that only incident responders can access this application. On a simple data entry screen, the user enters just a few items, such as name, email address, type of map desired and title, and the application generates a map preview. A sample map preview is shown in Figure 2, and contains all the map elements required, such as a legend, scale bar, north arrow and title. Incident personnel can either print a PDF of this map and the spreadsheet or email themselves the PDF or spreadsheet for later printing or electronic distribution.
Surveillance applications The USDA conducts surveillance activities for many commodities and diseases. Mapping and spatial analysis are relatively recent additions to the surveillance efforts.
Scrapie The first example of a Web-based mapping application for surveillance is a mapping
module for the scrapie programme. The United States scrapie programme has several components, including surveillance for disease and the Scrapie Flock Certification Program. The latter is a voluntary programme that involves testing a premises for five years and results in disease-free certification. The programme leadership requested a Web-based mapping capability to facilitate the management of the programme (4). The data are kept in an Oracle® database and views are created by using SQL to join tables and query the data. The Web client is an ArcIMS™ hypertext markup language (HTML) viewer. Access to the site requires a user name and password. Access to attributes is restricted by state, dependent on the permissions of a user. This application was implemented in the summer of 2006 and we are gathering performance and usage statistics. This application will be the template for mapping modules for other disease programmes. A screen shot of the application is shown in Figure 3. This application has a robust tool set, extensive base layers for analysis and has superior map printing capabilities using PDF output.
Figure 2 Screen shot of Map Kiosk

The evolution of internet-based map server applications Susan A. Maroney, Mary Jane McCool, Kenneth D. Geter in the United States Department of Agriculture, Veterinary Services & Angela M. James
728 Vol. 43 (3), Vet Ital www.izs.it/vet_italiana © IZS A&M 2007
Figure 3 Screen shot of the Scrapie mapping module
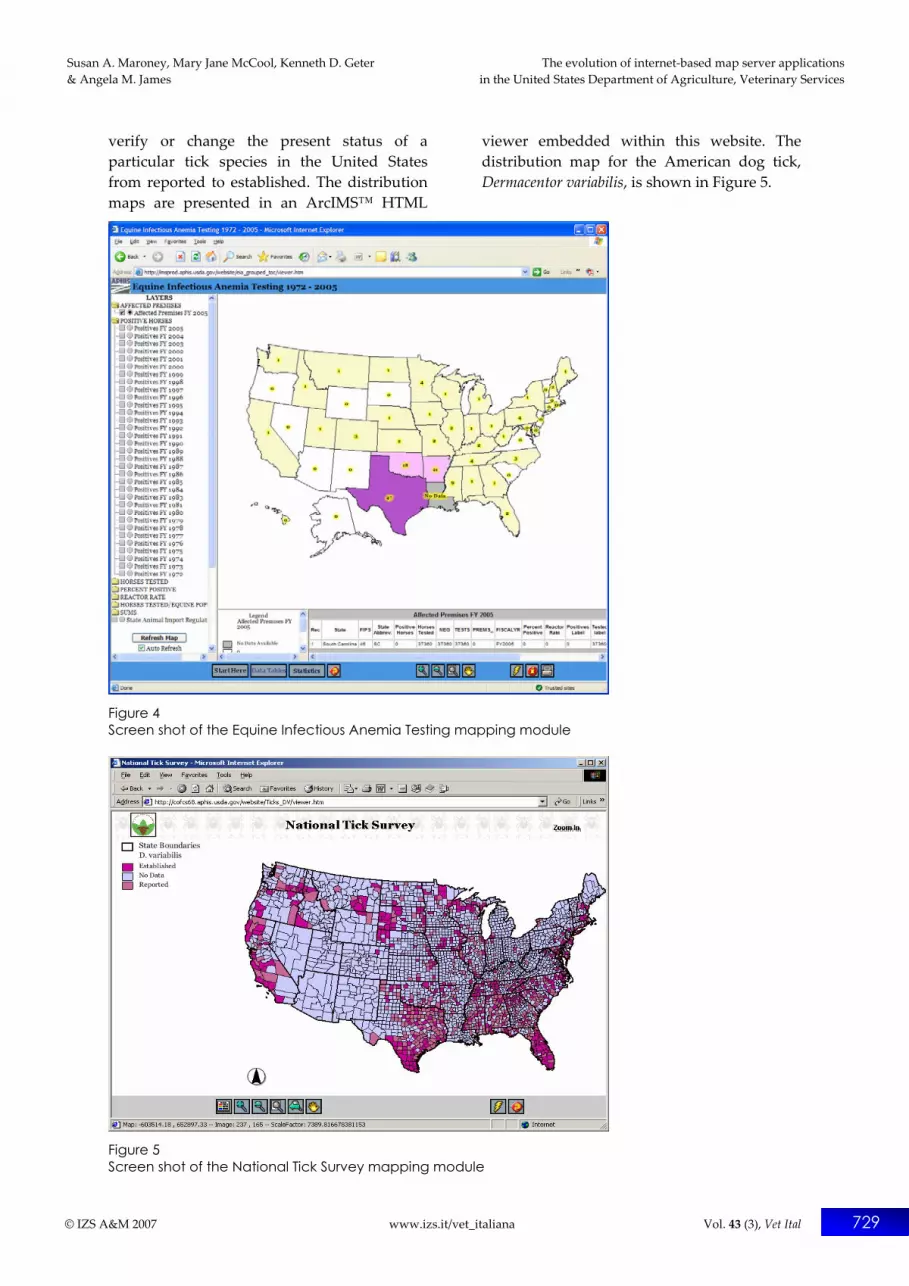
Equine Infectious Anemia Testing The second example for surveillance is Equine Infectious Anemia Testing data. VS has collected reactor data since 1972. The data are reported annually at the state level – coarse geographic and temporal resolution – and are not really indicative of disease patterns. The purpose of this application is to provide a means for people to explore the data and encourage changes to the reporting requirements. This would improve the geographic and temporal resolution of the data and perhaps contribute to disease control plans. This is a public website. A screen shot of this application is shown in Figure 4. Sampling and reactor data are presented as a series of layers. Another layer is a hyperlink to each state’s animal import regulations. In addition to the map, the data are available in both tabular form and descriptive statistics.
National Tick Survey The third example for surveillance is the National Tick Survey. The National Tick Survey was initiated by USDA-Animal and Plant Health Inspection Service (APHIS) to assess the geographic distribution of tick species that are harmful to livestock, equids
and poultry. A geographic database, derived from records from the Smithsonian National Tick Collection and USDA’s National Veterinary Services Laboratories tick identification programme, was established to determine the distribution of 34 economically important tick species. This information is not only used to update the distribution of each tick species in the United States by county, but point locations for certain tick species are also combined with data on climate, vegetation, soil, elevation and land use to identify environmental factors that may characterise present and future tick distributions. Additionally, an interactive website was built to update and disseminate information on the distribution of these 34 economically important tick species (2). This website is currently only available within APHIS. Distribution maps, life-cycle information, host associations and methods of collecting and preserving ticks are included on the website. A tick map questionnaire will be added to the website to assist the acquisition of distribution information regarding the current status of different tick species within each state to supplement our current database as well as
Susan A. Maroney, Mary Jane McCool, Kenneth D. Geter The evolution of internet-based map server applications & Angela M. James in the United States Department of Agriculture, Veterinary Services
© IZS A&M 2007 www.izs.it/vet_italiana Vol. 43 (3), Vet Ital 729
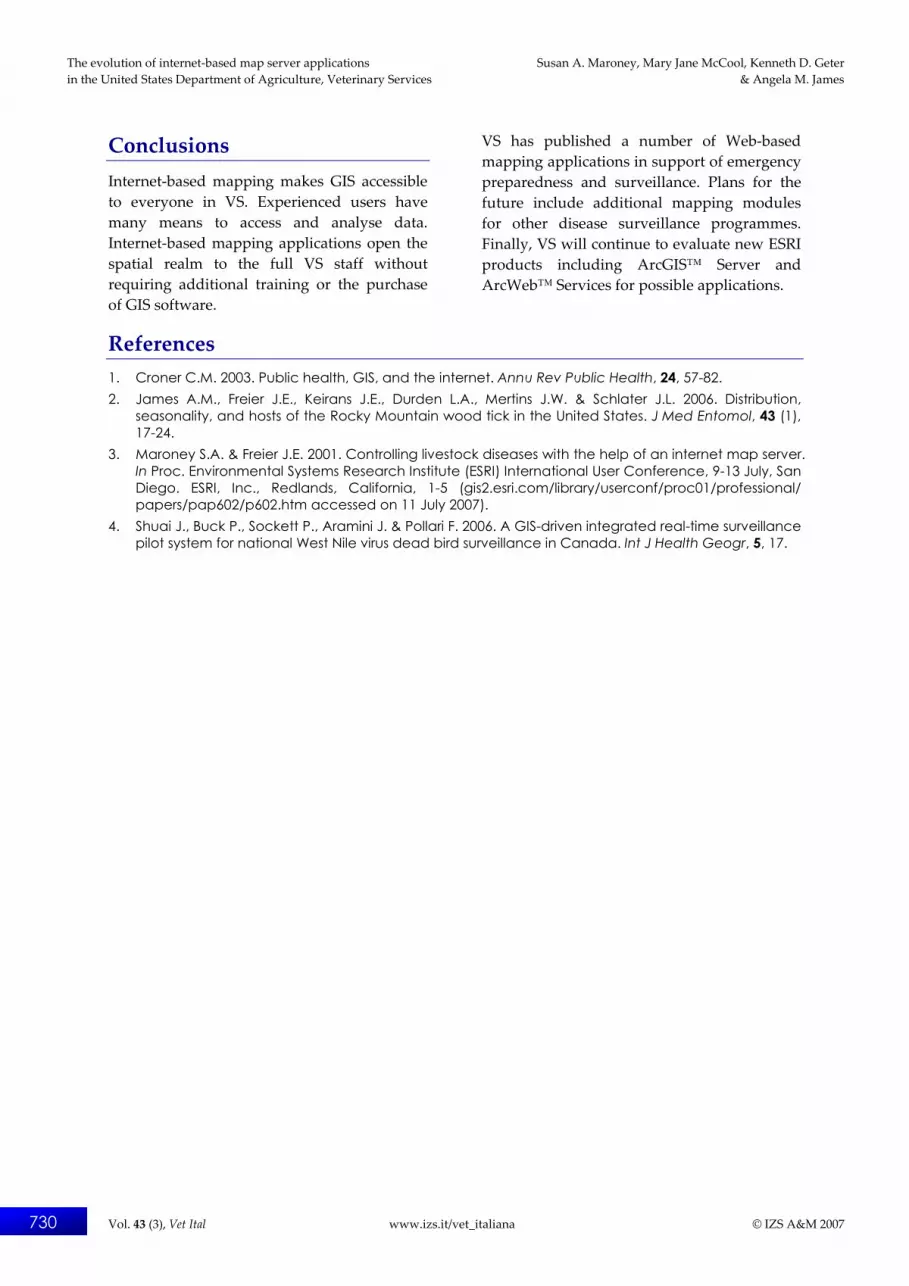
verify or change the present status of a particular tick species in the United States from reported to established. The distribution maps are presented in an ArcIMS™ HTML
viewer embedded within this website. The distribution map for the American dog tick, Dermacentor variabilis, is shown in Figure 5.
Figure 4 Screen shot of the Equine Infectious Anemia Testing mapping module
Figure 5 Screen shot of the National Tick Survey mapping module
The evolution of internet-based map server applications Susan A. Maroney, Mary Jane McCool, Kenneth D. Geter in the United States Department of Agriculture, Veterinary Services & Angela M. James
730 Vol. 43 (3), Vet Ital www.izs.it/vet_italiana © IZS A&M 2007
Conclusions Internet-based mapping makes GIS accessible to everyone in VS. Experienced users have many means to access and analyse data. Internet-based mapping applications open the spatial realm to the full VS staff without requiring additional training or the purchase of GIS software.
VS has published a number of Web-based mapping applications in support of emergency preparedness and surveillance. Plans for the future include additional mapping modules for other disease surveillance programmes. Finally, VS will continue to evaluate new ESRI products including ArcGIS™ Server and ArcWeb™ Services for possible applications.
References 1. Croner C.M. 2003. Public health, GIS, and the internet. Annu Rev Public Health, 24, 57-82. 2. James A.M., Freier J.E., Keirans J.E., Durden L.A., Mertins J.W. & Schlater J.L. 2006. Distribution,
seasonality, and hosts of the Rocky Mountain wood tick in the United States. J Med Entomol, 43 (1), 17-24.
3. Maroney S.A. & Freier J.E. 2001. Controlling livestock diseases with the help of an internet map server. In Proc. Environmental Systems Research Institute (ESRI) International User Conference, 9-13 July, San Diego. ESRI, Inc., Redlands, California, 1-5 (gis2.esri.com/library/userconf/proc01/professional/ papers/pap602/p602.htm accessed on 11 July 2007).
4. Shuai J., Buck P., Sockett P., Aramini J. & Pollari F. 2006. A GIS-driven integrated real-time surveillance pilot system for national West Nile virus dead bird surveillance in Canada. Int J Health Geogr, 5, 17.