the evolution of chloroplast genes and genomes in ferns
TRANSCRIPT

The evolution of chloroplast genes and genomes in ferns
Paul G. Wolf • Joshua P. Der • Aaron M. Duffy •
Jacob B. Davidson • Amanda L. Grusz •
Kathleen M. Pryer
Received: 19 July 2010 / Accepted: 7 October 2010 / Published online: 26 October 2010
� Springer Science+Business Media B.V. 2010
Abstract Most of the publicly available data on chloro-
plast (plastid) genes and genomes come from seed plants,
with relatively little information from their sister group, the
ferns. Here we describe several broad evolutionary patterns
and processes in fern plastid genomes (plastomes), and we
include some new plastome sequence data. We review
what we know about the evolutionary history of plastome
structure across the fern phylogeny and we compare plas-
tome organization and patterns of evolution in ferns to
those in seed plants. A large clade of ferns is characterized
by a plastome that has been reorganized with respect to the
ancestral gene order (a similar order that is ancestral in
seed plants). We review the sequence of inversions that
gave rise to this organization. We also explore global
nucleotide substitution patterns in ferns versus those found
in seed plants across plastid genes, and we review the high
levels of RNA editing observed in fern plastomes.
Keywords Inversion � Phylogeny � Plastid � Plastome �Substitution rates � RNA editing
Introduction
The plastid genome (plastome) comprises a wealth of data
that are valuable for comparative evolutionary studies of
plants. Plastomes contain many essential genes, especially
those required for photosynthesis, and thus they harbour
one of the few suites of characters that transcend the green
plant branch of the tree of life. One apparent feature of
plastome organization (structure) is that it has remained
relatively constant over hundreds of millions of years. For
example, the plastomes of the eusporangiate fern Angiop-
teris (marattioids, see Fig. 1) and the seed plant Nicotiana
(tobacco) are almost (but not quite) identical in gene order
(Karol et al. 2010). Given that these lineages diverged in
the Devonian, over 350 million years ago (Pryer et al.
2004), the selective forces that maintain this type of
structural stability over such a long period surely must be
strong, especially considering the rapid structural evolution
that occurred among the nuclear genomes of seed plant
lineages during much shorter periods (Wei et al. 2009).
Some plastomes, however, appear to have been desta-
bilized (structurally reorganized) relatively recently in a
few clades of angiosperms, including Geraniaceae
(Chumley et al. 2006), Campanulaceae (Haberle et al.
2008), Fabaceae (Cai et al. 2008; Milligan et al. 1989), and
some lineages where photosynthetic function has been lost
(Funk et al. 2007; Wickett et al. 2008; Wolfe et al. 1992).
Plastome structure has also undergone extensive rear-
rangement in a large group that includes about 90% of
extant fern species. Because ferns (including horsetails)
hold a critical phylogenetic position as the extant sister
group to seed plants (Pryer et al. 2001), understanding the
organization and evolution of fern plastomes can provide
useful information for comparative studies across land
plants. In this paper we review our current understanding of
Electronic supplementary material The online version of thisarticle (doi:10.1007/s11103-010-9706-4) contains supplementarymaterial, which is available to authorized users.
P. G. Wolf (&) � J. P. Der � A. M. Duffy � J. B. Davidson
Department of Biology, Utah State University, Logan, UT, USA
e-mail: [email protected]
A. L. Grusz � K. M. Pryer
Department of Biology, Duke University, Durham, NC, USA
123
Plant Mol Biol (2011) 76:251–261
DOI 10.1007/s11103-010-9706-4

fern plastome organization, function, and evolution. We
describe some new strategies for obtaining plastome
sequences, and present new data on several fern plastomes,
as well as new analyses on relative substitution rates of
plastid genes.
Over one hundred complete plastome sequences are
published in GenBank for seed plants, yet only five (at the
time of writing) are available for the sister group to seed
plants: the ferns. In addition to being an important phylo-
genetic contrast for studies of genomics, cell biology,
reproductive biology, and morphology, ferns are also a
major component of the earth’s land flora, with over 11,000
species occurring in varied ecological niches—especially
the tropics (Smith et al. 2006). Thus, a better balance in the
availability of genome-scale data could have wide utility.
Figure 1 depicts our current understanding of vascular
plant relationships, and we emphasize the major groups of
ferns and the relationship of ferns to seed plants.
Methods of plastome sequencing
Early approaches to sequencing complete plastomes
involved the isolation of plastids (followed by DNA
extraction) or the purification of plastid DNA from total
genomic DNA. Plastid DNA could then be digested with
restriction endonucleases, cloned, and sequenced, first with
vector primers then followed by primer walking. These
approaches were slow and expensive, but generally reliable.
Researchers sought more efficient techniques, focusing on
the early stages of separating the plastids or their DNA.
Chloroplasts and mitochondria can be sorted at the cellular
level with Fluorescent Activated Cell Sorting (FACS), an
approach that was used to sequence the plastome of the
lycophyte, Huperzia (Wolf et al. 2005). An alternative
approach is to shotgun-clone genomic DNA into fosmids
and probe for clones containing potential plastid genes
(McNeal et al. 2006; Wickett et al. 2008). Complete plas-
tome sequences have also been obtained from DNA
amplified in long PCR reactions (Goremykin et al. 2003) or
by whole-genome amplifications using Rolling Circle
Amplification (RCA, Jansen et al. 2005). Details of the
aforementioned approaches, and other techniques, are
described extensively by Jansen et al. (2005). We are
exploring a new approach that exploits second-generation
DNA sequencing technology. This approach is technically
the simplest and probably the most widely applicable
because it does not rely on strategies for purifying plastid
DNA or long PCR amplification, which can be taxon-spe-
cific. As a test case, we used the leptosporangiate fern
Cheilanthes lindheimeri Hook., which is native to south-
western United States and Mexico (Grusz et al. 2009). The
plant was collected in Arizona, USA, by E. Schuettpelz
(collection number 450) and a voucher specimen is depos-
ited in the Duke Herbarium (accession number 391417;
http://www.pryerlab.net/DNA_database.shtml). DNA was
extracted with the DNEasy Plant Mini Kit (Qiagen,
Valencia, California, USA). We employed whole-genome
shotgun sequencing using the Roche 454 GS-FLX Titanium
platform to determine the complete plastome sequence of
C. lindheimeri using a combination of de novo and refer-
ence-guided assembly strategies, combined with bioinfor-
matic filtering to remove ‘‘contaminant’’ nuclear and
mitochondrial sequences in silico. Our approach differs
from most studies using second-generation sequencing to
determine complete plastome sequences (Cronn et al. 2008;
Moore et al. 2006) in that we did not first isolate plastid
DNA from nuclear or mitochondrial DNA.
Total genomic DNA was sequenced on 1/4 of a picoT-
iter plate to obtain 234,428 reads averaging 355 bp long,
representing a total of 83.26 Mbp of sequence data. Reads
were assembled de novo using MIRA (Chevreux et al.
1999; Chevreux et al. 2004) and putative plastid-encoded
contigs were identified with NCBI blastn by querying the
assembly with previously published plastome sequences
from GenBank, using an e-value threshold of 1e-4. Addi-
tionally, reference-guided contigs were generated using the
YASRA pipeline (Ratan 2009). Putative plastid-encoded
contigs from both de novo and reference-guided approa-
ches were collected and assembled to generate a draft
gleichenioids
schizaeoids
heterosporous ferns
tree ferns
polypods
osmundaceous ferns
marattioids
ophioglossoids
whisk ferns
seed plants
lycophytes
horsetails
Extant VascularPlants
ferns
lept
ospo
rang
iate
A
B
C
D
eusp
oran
giat
e
Fig. 1 Working phylogeny of relationships among ferns and seed
plants, based on several published analyses (Pryer et al. 2004; Qiu
et al. 2005; Qiu et al. 2007). See text for reference to lettered branches
252 Plant Mol Biol (2011) 76:251–261
123
plastome sequence. This sequence was then used as a
scaffold to identify and correct assembly errors by mapping
454-sequence reads to the draft plastome sequence using
Roche GS Mapper v.2.3 software. The resulting high
quality, read-supported contigs were used to produce the
final complete plastome sequence in the standard circular
orientation typically presented, beginning with the large
single copy region (LSC) followed by the first inverted
repeat (IR), the small single copy region (SSC), and the
second inverted repeat. The complete plastome was
assembled from 6,818 reads (2.91% of the total reads) and
maps to a circle of 155,770 bp with two copies of the IR.
The Mauve v.2.2.0 plugin (Darling et al. 2004) for Gene-
ious Pro v.5.0.1 (Drummond et al. 2007) was used to
generate a whole plastome alignment of Cheilanthes
against three published plastomes: Adiantum, Alsophila,
and Pteridium. This alignment was used to annotate the
Cheilanthes plastome sequence (GenBank # HM778032).
A circular gene map for the annotated sequence (Supple-
mentary Figure 1) was generated in OGDRAW (Lohse
et al. 2007). The gene order of the Cheilanthes plastome is
the same as that of the fern Adiantum, which is not sur-
prising, given that they are in the same family, Pteridaceae.
Our approach allowed us to avoid the difficult and
laborious sample-preparation protocols needed to isolate
pure chloroplast DNA or to PCR-amplify the complete
genome in overlapping fragments. In addition, we obtained
valuable sequence information from the nuclear and
mitochondrial genomes in this previously uncharacterized
lineage. Compared to other approaches (including all those
listed above) bioinformatic extraction of plastome
sequences is fast and simple. Most of the steps are con-
veniently automated. The only steps requiring significant
intervention are locating the IR and setting the sequence to
‘‘start’’ at the beginning of the LSC (a mere convention).
These manual steps are inherent to all approaches to
plastome sequence assembly. Estimating monetary costs is
difficult, but as the prices of standard library preparation
and second-generation DNA sequencing continue to drop,
it is likely that the approach we describe (or similar ones)
will become the most efficient solutions for plastome
sequencing. Indeed, a similar approach has been used to
extract plastid genome sequences from massively parallel
sequencing projects (Nock et al. 2010).
The evolution of plastome organization in ferns
At the nucleotide level, DNA tends to evolve in a clock-
like mode within a limited window of evolutionary time,
although nucleotide substitution rates vary across the
genome and can differ among and within lineages. This
clock-like aspect of nucleotide substitution provides a
powerful tool for model-based analyses to infer phyloge-
netic relationships among sequences. However, over long
periods of time it becomes difficult to infer changes
because multiple substitutions may have occurred at the
same site, resulting in ‘‘saturation’’. Thus, it is often diffi-
cult to infer the order of early-diverging lineages on a
phylogenetic tree. This is where non-clocklike characters
can be useful. It has been suggested that because changes
in plastome structure are so infrequent, rare rearrangements
should be ideal for inferring ancient divergences (Karol
et al. 2010; Raubeson and Jansen 1992). Several such
markers have proven to be useful in this way near the base
of the vascular plant phylogeny (Raubeson and Jansen
1992) and in a large clade of mosses (Goffinet et al. 2007).
In the ferns, we see a similar pattern with five inversions
that can be mapped across the phylogeny. One *3.3 kb
inversion in the LSC is shared among all ferns, supporting
branch A of Fig. 1 (Karol et al. 2010). Two large over-
lapping inversions (18 kb and 21 kb) in the region of the IR
support branch C, and two smaller overlapping inversions
in the LSC region support branch D (Wolf et al. 2010).
These findings are based on recent studies of complete
plastome sequences (Karol et al. 2010) and mapping of
partial plastome regions (Wolf et al. 2009; Wolf et al.
2010). The latter studies will require verification with
complete plastome sequences. The pair of inversions on
branch C resulted in the unusual plastome organization that
is typical for most ferns, with the rRNA genes occurring in
the reverse order compared to all other plants. Branch C
subtends a clade that includes about 90% of fern species
(Pryer et al. 2004), so most ferns have an ‘‘inverted’’ IR. It
is difficult to infer process from such a small sample size,
but the clustering of inversions in the same genomic region
on the same phylogenetic branch suggests that something is
acting to maintain genome organization.
If an inversion occurs at some particular point during
evolution, there could then be selection pressures to revert
to the ancestral structure. What features of the plastome
would operate to maintain such an organization and resist
change? One possibility is that a specific gene order is
essential for gene expression. This could be related to the
complex patterns of RNA processing observed for the
plastome (Stern et al. 2010). Transcription of plastid genes
is neither strictly eukaryotic nor prokaryotic, which is
presumably a function of the plastome’s endosymbiotic
origins. Thus, most primary transcripts consist of several
genes that are sometimes degraded into multiple mature
RNAs (Stern et al. 2010). The positioning of plastid pro-
moters could put constraints on which genes are adjacent
and on the same strand. Consistent with this hypothesis is
the non-random tendency of adjacent genes to be on the
same strand and to be co-transcribed, even in the highly
rearranged plastome of Chlamydomonas reinhardtii (Cui
Plant Mol Biol (2011) 76:251–261 253
123
et al. 2006). Because the inversions in fern plastomes are
paired and partially overlapping, changes in the stranded-
ness of adjacent genes are minimized, as compared to
single inversions. It is possible that paired inversions occur
regularly, but they leave no trace. It is only when the
endpoints of the second inversion are not the same as the
first that we can detect the evidence.
Variation in substitution rates among genes
and lineages
Nucleotide substitution rates vary within genes, among
genes, and across lineages (Drouin et al. 2008; Muse and
Gaut 1997; Muse 2000). Knowledge of the extent of this
variation can aid in choosing among genes, or other geno-
mic regions, for markers that are appropriate for inferring
phylogenetic relationships at different time scales. The
ratios of synonymous to nonsynonymous substitution rates
can also be used to examine signatures of past selection on
protein-coding genes. Here we compile a preliminary
assessment of relative evolutionary rates for ferns and
compare them to their sister group, the seed plants.
In addition to the newly sequenced and assembled
plastomes of Pteridium (HM535629; Der 2010), Equisetum
(Karol et al. 2010), and Cheilanthes (this paper), we
selected plastome records from those available in GenBank
(Supplementary Table 1) to represent major lineages of
ferns (7 taxa), seed plants (9 taxa), and lycophytes (2 taxa—
as an outgroup). Seed plants were selected to represent
major lineages and avoid taxa with unusually elevated
substitution rates, such as Gnetales (McCoy et al. 2008).
There are differences in the timing of diversification of
various seed plant and fern lineages (Bell et al. 2010;
Schneider et al. 2004), but taxa were chosen so that the
estimated divergence times for the seed plants included in
the analysis are as proximate as possible to those for the
ferns. Protein-coding DNA sequences were extracted from
all 18 plastome records. For each gene (excluding pseudo-
genes), either a nucleotide alignment was made using
MUSCLE (Edgar 2004), or a translation alignment was
made using MUSCLE as implemented in Geneious v.5.0.3
(Drummond et al. 2007). Each alignment was inspected and
manually refined, and errors resulting from mis-annotated
features in the GenBank records were corrected. Most genes
were present in all 18 taxa, but in order to include as many
as possible, a gene was only included in the final analysis if
it was present in at least one of the outgroup taxa and several
representatives of both the seed plants and ferns.
We used PAML (Yang 1997) to estimate synonymous
(dS) and nonsynonymous (dN) substitution rates, as well as
the dN/dS ratio, for 79 genes separately using a model that
allows substitution rates to vary among lineages. We used
constraint trees (Supplementary Figure 2, including only
the taxa possessing a particular gene) based on published
phylogenies (Pryer et al. 2004; Qiu et al. 2005; Qiu et al.
2007). Sequences for some taxa included internal stop
codons due to known or suspected RNA editing. PAML
does not accept internal stop codons, therefore these posi-
tions were removed from the alignments. Average synon-
ymous and nonsynonymous substitution rates, as well as
ratios, were calculated for each gene and compared among
seed plants, ferns, and the lycophyte outgroup. Wilcoxon
rank-sum tests were used to determine whether differences
observed between ferns and seed plants were statistically
significant (Table 1).
For nonsynonymous rates, 24 of the 79 genes showed
significant differences between ferns and seed plants, with
ferns faster than seed plants in 23 cases; psbA was the only
gene significantly faster in seed plants (Table 1, Fig. 2).
For synonymous rates, all 79 genes were faster in ferns,
and 61 genes showed significant differences (Table 1,
Fig. 3). Seed plants have higher values of the dN/dS ratio
for each gene because the differences are greater for the
denominator, dS, than for dN.
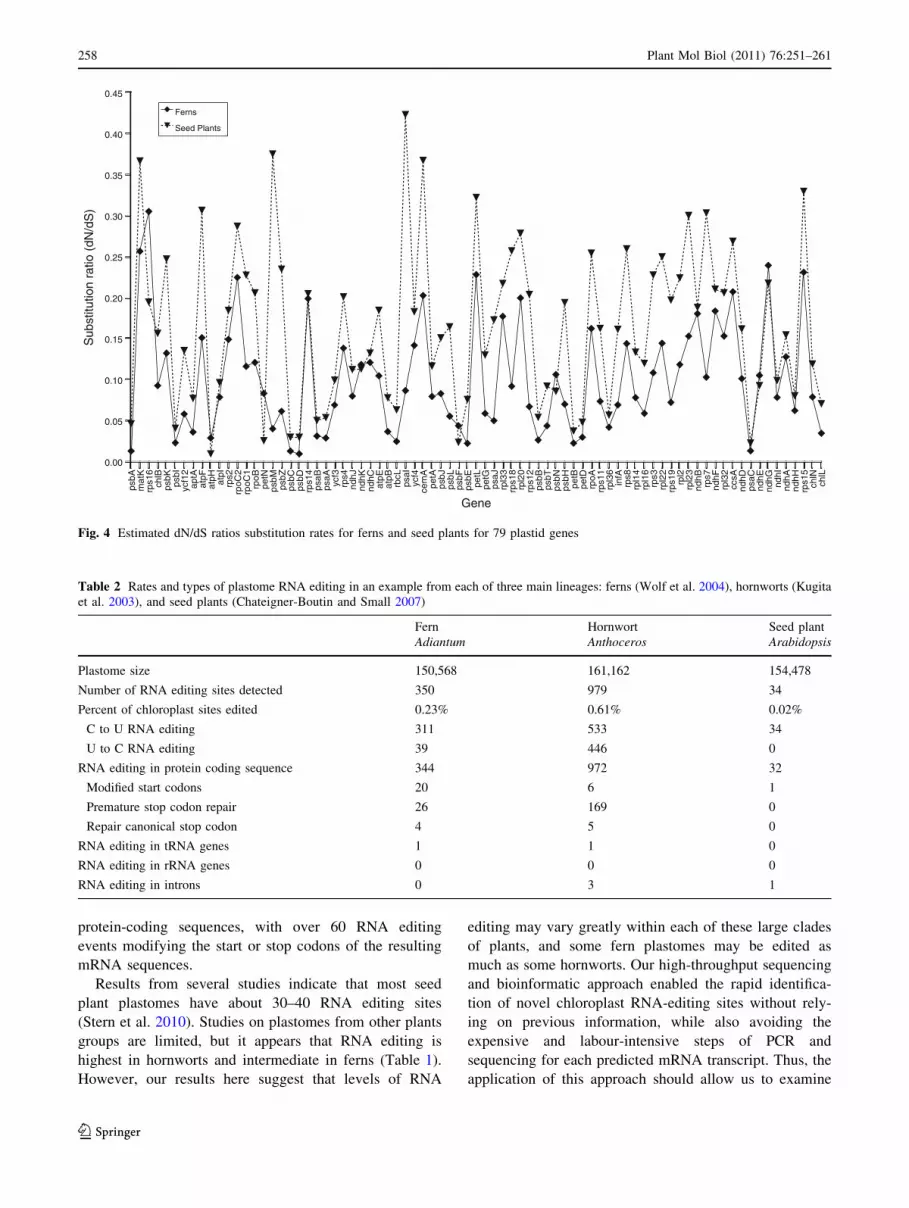
We found that for our sample of taxa, substitution rates
for plastid genes were higher in ferns than in seed plants
(Figs. 2–4), consistent with previous findings observed for
rbcL (Smith et al. 2001; Yatabe et al. 1998) This is a very
general statement that ignores the considerable variation
among lineages that exists within each of these clades.
Such variation has been documented for ferns (Korall et al.
2010; Schuettpelz and Pryer 2006; Schuettpelz and Pryer
2007), and is known to be quite high within some lineages
of seed plants (Guisinger et al. 2010). Analyses such as the
one we present here are very sensitive to taxon sampling.
However, we deliberately excluded seed plant and fern
lineages with known accelerated substitution rates, so we
have no reason to suspect a strong bias in our data set. As
we accumulate more fern plastome sequences we hope to
refine our understanding of the differences between ferns
and seed plant substitution rates.
Analysis of RNA editing
RNA editing is the post-transcriptional modification of RNA
molecules relative to their encoding DNA sequences. RNA
editing in land plant organelles occurs in the form of
pyrimidine exchanges in mitochondrial and plastid tran-
scripts. In general, levels of RNA editing are higher in
mitochondrial genomes than in plastomes (Sugiura 2008;
Takenaka et al. 2008), with some of the highest rates
observed in seed-free vascular plants and hornworts (Kugita
et al. 2003; Tillich et al. 2006). Traditionally, RNA editing in
plastomes has been systematically examined by PCR
254 Plant Mol Biol (2011) 76:251–261
123

Table 1 Rates of synonymous and nonsynonymous substitutions in ferns versus seed plants
Nonsynonymous substitution rate (dN) Synonymous substitution rate (dS)
Gene Ferns Seed plants P value Ferns Seed plants P value
aptA 0.013 0.012 0.842 0.365 0.155 0.021
atpB 0.014 0.010 0.580 0.392 0.129 0.012
atpE 0.042 0.029 0.211 0.401 0.157 0.008
atpF 0.045 0.040 0.556 0.297 0.131 0.009
atpH 0.009 0.001 0.002 0.318 0.144 0.170
atpI 0.027 0.012 0.016 0.344 0.127 0.001
ccsA 0.095 0.044 0.014 0.459 0.165 0.001
cemA 0.067 0.047 0.211 0.331 0.128 0.002
chlB 0.037 0.031 0.768 0.399 0.197 0.129
chlL 0.025 0.017 0.951 0.712 0.238 0.075
chlN 0.040 0.028 0.514 0.506 0.238 0.099
infA 0.027 0.051 0.828 0.393 0.318 0.098
matK 0.158 0.069 0.030 0.614 0.189 0.001
ndhA 0.052 0.023 0.014 0.405 0.151 0.001
ndhB 0.065 0.012 0.000 0.361 0.062 0.000
ndhC 0.043 0.021 0.150 0.355 0.157 0.113
ndhD 0.050 0.027 0.137 0.497 0.168 0.002
ndhE 0.048 0.016 0.007 0.452 0.176 0.012
ndhF 0.091 0.048 0.028 0.497 0.230 0.003
ndhG 0.099 0.035 0.004 0.415 0.161 0.010
ndhH 0.023 0.013 0.213 0.362 0.163 0.032
ndhI 0.037 0.017 0.034 0.473 0.172 0.009
ndhJ 0.034 0.016 0.014 0.429 0.140 0.007
ndhK 0.051 0.017 0.006 0.432 0.153 0.009
petA 0.032 0.017 0.166 0.403 0.143 0.004
petB 0.008 0.004 0.308 0.340 0.119 0.003
petD 0.011 0.005 0.156 0.355 0.108 0.008
petG 0.013 0.011 0.376 0.224 0.086 0.004
petL 0.080 0.041 0.259 0.350 0.128 0.066
petN 0.032 0.003 0.015 0.383 0.113 0.139
psaA 0.009 0.005 0.207 0.310 0.102 0.000
psaB 0.011 0.006 0.121 0.337 0.114 0.004
psaC 0.005 0.004 0.912 0.408 0.158 0.150
psaI 0.030 0.060 0.249 0.349 0.143 0.054
psaJ 0.025 0.029 0.550 0.499 0.166 0.021
psbA 0.002 0.005 0.006 0.138 0.101 0.845
psbB 0.010 0.007 0.452 0.378 0.127 0.003
psbC 0.005 0.004 0.740 0.383 0.123 0.009
psbD 0.003 0.003 0.982 0.272 0.087 0.001
psbE 0.006 0.007 0.376 0.284 0.093 0.063
psbF 0.010 0.002 0.006 0.235 0.091 0.020
psbH 0.032 0.029 0.859 0.454 0.150 0.008
psbI 0.009 0.006 0.381 0.393 0.139 0.062
psbJ 0.022 0.021 0.400 0.268 0.140 0.027
psbK 0.042 0.034 0.535 0.320 0.138 0.044
psbL 0.012 0.010 0.190 0.214 0.063 0.003
psbM 0.019 0.030 0.278 0.478 0.080 0.005
Plant Mol Biol (2011) 76:251–261 255
123

amplification and sequencing of transcripts for individual
genes, and has only been examined genome-wide for two
seed-free plants: a fern, Adiantum capillus-veneris (Wolf
et al. 2004) and a hornwort, Anthoceros formosae (Kugita
et al. 2003). Patterns across these taxa and a seed plant
(Arabidopsis) with typical levels of RNA editing (Chat-
eigner-Boutin and Small 2007) are provided in Table 2. We
have since developed a new, rapid method to identify novel
RNA editing sites using second-generation high-throughput
transcriptome sequencing and bioinformatic analyses (Der
2010).
A normalized transcriptome library of the fern Pteridi-
um aquilinum was prepared and sequenced using the Roche
454 GS-FLX Titanium platform (Der 2010). Transcript
reads were mapped to the complete plastome sequence
(GenBank # HM535629) using Roche’s GS Mapper v.2.3
software. Discrepancies between the genome and transcript
sequences were used to identify putative RNA editing sites
using custom Perl scripts (Der 2010). The location and
consequence of each putative RNA editing site was
examined in the context of gene annotations for the com-
plete plastome. The details of these methods and our results
are being prepared for publication elsewhere, however,
preliminary scans for RNA editing in the plastid tran-
scriptome of P. aquilinum identified over 1,000 putative
RNA editing sites; the highest number yet detected for a
Table 1 continued
Nonsynonymous substitution rate (dN) Synonymous substitution rate (dS)
Gene Ferns Seed plants P value Ferns Seed plants P value
psbN 0.024 0.008 0.069 0.225 0.095 0.132
psbT 0.015 0.012 0.841 0.345 0.125 0.059
psbZ 0.023 0.016 0.690 0.367 0.068 0.009
rbcL 0.007 0.008 0.479 0.295 0.120 0.003
rpl14 0.034 0.020 0.180 0.434 0.147 0.007
rpl16 0.026 0.019 0.658 0.434 0.159 0.001
rpl2 0.060 0.022 0.004 0.510 0.097 0.000
rpl20 0.074 0.038 0.049 0.371 0.137 0.003
rpl22 0.074 0.051 0.586 0.510 0.203 0.003
rpl23 0.099 0.040 0.042 0.644 0.133 0.001
rpl32 0.068 0.041 0.054 0.446 0.200 0.008
rpl33 0.073 0.031 0.097 0.411 0.143 0.024
rpl36 0.018 0.014 0.594 0.418 0.245 0.340
rpoA 0.073 0.044 0.195 0.447 0.171 0.005
rpoB 0.046 0.029 0.180 0.378 0.142 0.004
rpoC1 0.042 0.032 0.445 0.361 0.141 0.006
rpoC2 0.094 0.045 0.027 0.418 0.156 0.003
rps11 0.031 0.027 0.777 0.417 0.165 0.012
rps12 0.017 0.011 0.438 0.256 0.054 0.025
rps14 0.059 0.024 0.007 0.295 0.117 0.007
rps15 0.107 0.058 0.044 0.463 0.175 0.002
rps16 0.083 0.038 0.010 0.271 0.197 0.064
rps18 0.037 0.038 0.308 0.401 0.147 0.005
rps19 0.032 0.029 0.679 0.446 0.146 0.000
rps2 0.049 0.029 0.097 0.329 0.155 0.021
rps3 0.059 0.040 0.341 0.548 0.176 0.003
rps4 0.059 0.034 0.021 0.428 0.171 0.001
rps7 0.034 0.016 0.259 0.328 0.054 0.004
rps8 0.075 0.042 0.066 0.518 0.160 0.000
ycf12 0.046 0.054 0.840 0.795 0.399 0.536
ycf3 0.017 0.012 0.495 0.251 0.118 0.004
ycf4 0.059 0.025 0.009 0.413 0.139 0.001
P values below 0.05 are indicated in bold
256 Plant Mol Biol (2011) 76:251–261
123

plastome. Similar to Anthoceros, a large number of U to C
RNA editing events were detected in addition to the more
abundant C to U RNA editing events. RNA editing occurs
in all types of plastid genes, including protein-coding,
tRNA, and rRNA genes, as well as intergenic and intron
regions. The majority of RNA editing sites occurs in
psbA
mat
Krp
s16
chlB
psbK
psbI
ycf1
2ap
tAat
pFat
pH atpI
rps2
rpoC
2rp
oC1
rpoB
petN
psbM
psbZ
psbC
psbD
rps1
4ps
aBps
aAyc
f3rp
s4nd
hJnd
hKnd
hCat
pEat
pBrb
cLps
aIyc
f4ce
mA
petA
psbJ
psbL
psbF
psbE
petL
petG
psaJ
rpl3
3rp
s18
rpl2
0rp
s12
psbB
psbT
psbN
psbH
petB
petD
rpoA
rps1
1rp
l36
infA
rps8
rpl1
4rp
l16
rps3
rpl2
2rp
s19
rpl2
rpl2
3nd
hBrp
s7nd
hFrp
l32
ccsA
ndhD
psaC
ndhE
ndhG
ndhI
ndhA
ndhH
rps1
5ch
lNch
lL
0.00
0.02
0.04
0.06
0.08
0.10
0.12
0.14
0.16
Ferns
Seedplants
Gene
Non
syno
nym
ous
subs
titut
ion
rate
(dN
)
Fig. 2 Estimated nonsynonymous substitution rates for ferns and seed plants for 79 plastid genes
psbA
mat
Krp
s16
chlB
psbK
psbI
ycf1
2ap
tAat
pFat
pH atpI
rps2
rpoC
2rp
oC1
rpoB
petN
psbM
psbZ
psbC
psbD
rps1
4ps
aBps
aAyc
f3rp
s4nd
hJnd
hKnd
hCat
pEat
pBrb
cLps
aIyc
f4ce
mA
petA
psbJ
psbL
psbF
psbE
petL
petG
psaJ
rpl3
3rp
s18
rpl2
0rp
s12
psbB
psbT
psbN
psbH
petB
petD
rpoA
rps1
1rp
l36
infA
rps8
rpl1
4rp
l16
rps3
rpl2
2rp
s19
rpl2
rpl2
3nd
hBrp
s7nd
hFrp
l32
ccsA
ndhD
psaC
ndhE
ndhG
ndhI
ndhA
ndhH
rps1
5ch
lNch
lL
0.00
0.10
0.20
0.30
0.40
0.50
0.60
0.70
0.80
Ferns
Seedplants
Gene
Syn
onym
ous
subs
titut
ion
rate
(dS
)
Fig. 3 Estimated synonymous substitution rates for ferns and seed plants for 79 plastid genes
Plant Mol Biol (2011) 76:251–261 257
123
protein-coding sequences, with over 60 RNA editing
events modifying the start or stop codons of the resulting
mRNA sequences.
Results from several studies indicate that most seed
plant plastomes have about 30–40 RNA editing sites
(Stern et al. 2010). Studies on plastomes from other plants
groups are limited, but it appears that RNA editing is
highest in hornworts and intermediate in ferns (Table 1).
However, our results here suggest that levels of RNA
editing may vary greatly within each of these large clades
of plants, and some fern plastomes may be edited as
much as some hornworts. Our high-throughput sequencing
and bioinformatic approach enabled the rapid identifica-
tion of novel chloroplast RNA-editing sites without rely-
ing on previous information, while also avoiding the
expensive and labour-intensive steps of PCR and
sequencing for each predicted mRNA transcript. Thus, the
application of this approach should allow us to examine
psbA
mat
Krp
s16
chlB
psbK
psbI
ycf1
2ap
tAat
pFat
pH atpI
rps2
rpoC
2rp
oC1
rpoB
petN
psbM
psbZ
psbC
psbD
rps1
4ps
aBps
aAyc
f3rp
s4nd
hJnd
hKnd
hCat
pEat
pBrb
cLps
aIyc
f4ce
mA
petA
psbJ
psbL
psbF
psbE
petL
petG
psaJ
rpl3
3rp
s18
rpl2
0rp
s12
psbB
psbT
psbN
psbH
petB
petD
rpoA
rps1
1rp
l36
infA
rps8
rpl1
4rp
l16
rps3
rpl2
2rp
s19
rpl2
rpl2
3nd
hBrp
s7nd
hFrp
l32
ccsA
ndhD
psaC
ndhE
ndhG
ndhI
ndhA
ndhH
rps1
5ch
lNch
lL
0.00
0.05
0.10
0.15
0.20
0.25
0.30
0.35
0.40
0.45
Ferns
Seed Plants
Gene
Sub
stitu
tion
ratio
(dN
/dS
)
Fig. 4 Estimated dN/dS ratios substitution rates for ferns and seed plants for 79 plastid genes
Table 2 Rates and types of plastome RNA editing in an example from each of three main lineages: ferns (Wolf et al. 2004), hornworts (Kugita
et al. 2003), and seed plants (Chateigner-Boutin and Small 2007)
Fern Hornwort Seed plant
Adiantum Anthoceros Arabidopsis
Plastome size 150,568 161,162 154,478
Number of RNA editing sites detected 350 979 34
Percent of chloroplast sites edited 0.23% 0.61% 0.02%
C to U RNA editing 311 533 34
U to C RNA editing 39 446 0
RNA editing in protein coding sequence 344 972 32
Modified start codons 20 6 1
Premature stop codon repair 26 169 0
Repair canonical stop codon 4 5 0
RNA editing in tRNA genes 1 1 0
RNA editing in rRNA genes 0 0 0
RNA editing in introns 0 3 1
258 Plant Mol Biol (2011) 76:251–261
123
more details of RNA editing and its variation across
groups of seed-free plants.
Relationship of plastome organization to gene function
Although the gene content of land plant plastomes is lar-
gely conserved, there are some differences among taxa
(Supplementary Table 1), and therefore the absence of
tRNA-Lys-UUU (trnK) and its intron in the ferns Adiantum
(Wolf et al. 2003), Alsophila (Gao et al. 2009), and Chei-
lanthes (this paper) is not particularly surprising. What is
interesting is that matK is still present in these genomes. In
most land plant genomes, matK and the trnK intron are
closely associated and are thought to have co-evolved
(Toor et al. 2001). The maturase K protein is usually
encoded within the trnK intron and is required for splicing
trnK (Vogel et al. 1997; Vogel et al. 1999).
In most fern plastomes (and those of a few other land
plants) that lack trnK, matK is still present (Ems et al.
1995; Funk et al. 2007; Wolf et al. 2003; Wolf et al. 2004;
Wolfe et al. 1992), suggesting a function for matK beyond
merely splicing trnK. A lack of evidence for a shift in
selective constraints on matK in ferns without trnK (Duffy
et al. 2009), and in vitro RNA-binding of matK with other
introns (Liere and Link 1995) suggests that matK serves as
a generalist maturase for several introns in the chloroplast
genome (Zoschke et al. 2010).
MatK and trnK are located near the endpoint of one of
the large inversions that led to the reorganized fern chlo-
roplast gene order (branch C, Fig. 1). This seems to suggest
that trnK was lost when one of the exons was disrupted by
the inversion, as appears to be occurring in Jasminum (Lee
et al. 2007). Furthermore, trnK is not maintained through
trans-splicing in ferns (Duffy et al. 2009; Wolf et al. 2004).
However, recent analyses (Wolf et al. 2010) placing the
inversions and loss of trnK in a phylogenetic context
indicate that trnK was lost on branch B (of Fig. 1) before
the inversion occurred (branch C). Thus, the loss of trnK
cannot have been caused by the inversion. These two
events are therefore probably unrelated.
Summary and prospects
As sister group to seed plants, ferns are an essential point of
reference for comparative analyses in land plants. Fern
plastomes have undergone a series of inversions, each of
which marks an important branch on the fern phylogeny.
Fern plastomes also undergo high levels of RNA editing, a
trait that occurs at a much lower frequency in seed plants.
Based on a small and preliminary sample size, fern plastid
genes appear to evolve at a faster rate than those in seed
plants; however, this will need to be investigated further.
With the application of second-generation DNA sequenc-
ing tools, the rate of discovery in all fields of plant
molecular biology is rapidly increasing. This should enable
plant biologists working on seed-free plant groups to catch-
up with the level of current understanding of plastomes in
seed plants.
Acknowledgments ALG and KMP are grateful to Lisa Bukovnik
for advice on ‘‘second-generation’’ sequencing protocols and to Mo-
hamed Noor for suggesting and facilitating the sequencing of Chei-lanthes lindheimeri at Duke. Thanks to Mark Winston Ellis and
Hardeep Rai for comments on the manuscript. This research was
supported in part by NSF grant DEB-0717398 to KMP and DEB-
0228432 to PGW.
References
Bell CD, Soltis DE, Soltis PS (2010) The age and diversification of
the angiosperms re-revisited. Amer J Bot 97:1296–1303
Cai ZQ, Guisinger M, Kim HG, Ruck E, Blazier JC, McMurtry V,
Kuehl JV, Boore J, Jansen RK (2008) Extensive reorganization
of the plastid genome of Trifolium subterraneum (Fabaceae) is
associated with numerous repeated sequences and novel DNA
insertions. J Mol Evol 67:696–704
Chateigner-Boutin A-L, Small I (2007) A rapid high-throughput
method for the detection and quantification of RNA editing
based on high-resolution melting of amplicons. Nucleic Acids
Res 35:e114
Chevreux B, Wetter T, Suhai S (1999) Genome sequence assembly
using trace signals and additional sequence information Com-
puter Science and Biology: Proceedings of the German Confer-
ence on Bioinformatics (GCB), pp 45–56
Chevreux B, Pfisterer T, Drescher B, Driesel AJ, Muller WEG,
Wetter T, Suhai S (2004) Using the miraEST assembler for
reliable and automated mRNA transcript assembly and SNP
detection in sequenced ESTs. Genome Res 14:1147–1159
Chumley TW, Palmer JD, Mower JP, Fourcade HM, Calie PJ, Boore
JL, Jansen RK (2006) The complete chloroplast genome
sequence of Pelargonium x hortorum: Organization and evolu-
tion of the largest and most highly rearranged chloroplast
genome of land plants. Mol Biol Evol 23:2175–2190
Cronn R, Liston A, Parks M, Gernandt DS, Shen R, Mockler T (2008)
Multiplex sequencing of plant chloroplast genomes using Solexa
sequencing-by-synthesis technology. Nucleic Acids Res 36:e122
Cui LY, Leebens-Mack J, Wang LS, Tang JJ, Rymarquis L, Stern DB,
de Pamphilis CW (2006) Adaptive evolution of chloroplast
genome structure inferred using a parametric bootstrap approach.
BMC Evol Biol 6:13
Darling AC, Mau B, Blattner FR, Perna NT (2004) Mauve: multiple
alignment of conserved genomic sequence with rearrangements.
Genome Res 14:1394–1403
Der JP (2010) Genomic perspectives on evolution in bracken fern.
Dissertation, Utah State University
Drouin G, Daoud H, Xia J (2008) Relative rates of synonymous
substitutions in the mitochondrial, chloroplast and nuclear
genomes of seed plants. Mol Phylogen Evol 49:827–831
Drummond AJ, Ashton B, Cheung M, Heled J, Kearse M, Moir R,
Stones-Havas S, Thierer T, Wilson A (2007) Geneious v3.0.
BioMatters LTD
Plant Mol Biol (2011) 76:251–261 259
123
Duffy AM, Kelchner SA, Wolf PG (2009) Conservation of selection
on matK following an ancient loss of its flanking intron. Gene
438:17–25
Edgar RC (2004) MUSCLE: multiple sequence alignment with high
accuracy and high throughput. Nucleic Acids Res 32:1792–1797
Ems SC, Morden CW, Dixon CK, Wolfe KH, de Pamphilis CW,
Palmer JD (1995) Transcription, splicing and editing of plastid
RNAs in the nonphotosynthetic plant Epifagus virginiana. Plant
Mol Biol 29:721–733
Funk HT, Berg S, Krupinska K, Maier UG, Krause K (2007)
Complete DNA sequences of the plastid genomes of two
parasitic flowering plant species Cuscuta reflexa and Cuscutagronovii. BMC Plant Biol 7:45
Gao L, Yi X, Yang YX, Su YJ, Wang T (2009) Complete chloroplast
genome sequence of a tree fern Alsophila spinulosa: insights into
evolutionary changes in fern chloroplast genomes. BMC Evol
Biol 9:130
Goffinet B, Wickett NJ, Werner O, Ros RM, Shaw AJ, Cox CJ (2007)
Distribution and phylogenetic significance of the 71-kb inversion
in the plastid genome in Funariidae (Bryophyta). Ann Bot
99:747–753
Goremykin VV, Hirsch-Ernst KI, Wolfl S, Hellwig FH (2003)
Analysis of the Amborella trichopoda chloroplast genome
sequence suggests that Amborella is not a basal angiosperm.
Mol Biol Evol 20:1499–1505
Grusz AL, Windham MD, Pryer KM (2009) Deciphering the origins
of apomictic polyploids in the Cheilanthes yavapensis complex
(Pteridaceae). Amer J Bot 96:1636–1645
Guisinger MM, Chumley TW, Kuehl JV, Boore JL, Jansen RK (2010)
Implications of the plastid genome sequence of Typha (Typh-
aceae, Poales) for understanding genome evolution in Poaceae.
J Mol Evol 70:149–166
Haberle RC, Fourcade HM, Boore JL, Jansen RK (2008) Extensive
rearrangements in the chloroplast genome of Trachelium caeru-leum are associated with repeats and tRNA genes. J Mol Evol
66:350–361
Jansen RK, Raubeson LA, Boore JL, de Pamphilis CW, Chumley TW
et al (2005) Methods for obtaining and analyzing whole
chloroplast genome sequences. Methods Enzymol 395:348–384
Karol KG, Arumuganathan K, Boore JL, Duffy AM, Everett KDE,
et al. (2010) Complete plastome sequences of Equisetum arvenseand Isoetes flaccida: implications for phylogeny and plastid
genome evolution of early land plant lineages. BMC Evol Biol
(in press)
Korall P, Schuettpelz E, Pryer KM (2010) Abrupt deceleration of
molecular evolution linked to the origin of arborescence in ferns.
Evolution 64 (in press)
Kugita M, Yamamoto Y, Fujikawa T, Matsumoto T, Yoshinaga K
(2003) RNA editing in hornwort chloroplasts makes more than
half the genes functional. Nucleic Acids Res 31:2417–2423
Lee HL, Jansen RK, Chumley TW, Kim KJ (2007) Gene relocations
within chloroplast genomes of Jasminum and Menodora (Ole-
aceae) are due to multiple, overlapping inversions. Mol Biol
Evol 24:1161–1180
Liere K, Link G (1995) RNA-binding activity of the matK protein
encoded by the chloroplast trnK intron from mustard (Sinapis-
alba L.). Nucleic Acids Res 23:917–921
Lohse M, Drechsel O, Bock R (2007) OrganellarGenomeDRAW
(OGDRAW): a tool for the easy generation of high-quality
custom graphical maps of plastid and mitochondrial genomes.
Curr Genet 52:267–274
McCoy SR, Kuehl JV, Boore JL, Raubeson LA (2008) The complete
plastid genome sequence of Welwitschia mirabilis: an unusually
compact plastome with accelerated divergence rates. BMC Evol
Biol 8
McNeal JR, Leebens-Mack JH, Arumuganathan K, Kuehl JV, Boore
JL, De Pamphilis CW (2006) Using partial genomic fosmid
libraries for sequencing complete organellar genomes. BioTech-
niques 41:69–73
Milligan BG, Hampton JN, Palmer JD (1989) Dispersed repeats and
structural reorganization in subclover chloroplast DNA. Mol
Biol Evol 6:355–368
Moore MJ, Dhingra A, Soltis PS, Shaw R, Farmerie WG, Folta KM,
Soltis DE (2006) Rapid and accurate pyrosequencing of
angiosperm plastid genomes. BMC Plant Biol 6:17
Muse SV (2000) Examining rates and patterns of nucleotide
substitution in plants. Plant Mol Biol 42:25–43
Muse SV, Gaut BS (1997) Comparing patterns of nucleotide
substitution rates among chloroplast loci using the relative ratio
test. Genetics 146:393–399
Nock CJ, Waters DL, Edwards MA, Bowen SG, Rice N, Cordeiro
GM, Henry RJ (2010) Chloroplast genome sequences from total
DNA for plant identification. Plant Biotechnol J DOI:
10.1111/j.1467-7652.2010.00558.x
Pryer KM, Schneider H, Smith AR, Cranfill R, Wolf PG, Hunt JS, Sipes
SD (2001) Horsetails and ferns are a monophyletic group and the
closest living relatives to seed plants. Nature 409:618–622
Pryer KM, Schuettpelz E, Wolf PG, Schneider H, Smith AR, Cranfill
R (2004) Phylogeny and evolution of ferns (monophylytes) with
a focus on the early leptosporangiate divergences. Amer J Bot
91:1582–1598
Qiu YL, Dombrovska O, Lee J, Li LB, Whitlock BA et al (2005)
Phylogenetic analyses of basal angiosperms based on nine
plastid, mitochondrial, and nuclear genes. Int J Plant Sci
166:815–842
Qiu YL, Li LB, Wang B, Chen ZD, Dombrovska O et al (2007) A
nonflowering land plant phylogeny inferred from nucleotide
sequences of seven chloroplast, mitochondrial, and nuclear
genes. Int J Plant Sci 168:691–708
Ratan A (2009) Assembly algorithms for next-generation sequence
data. Dissertation, Pennsylvania State University
Raubeson LA, Jansen RK (1992) Chloroplast DNA evidence on the
ancient evolutionary split in vascular land plants. Science
255:1697–1699
Schneider H, Schuettpelz E, Pryer KM, Cranfill R, Magallion S,
Lupia R (2004) Ferns diversified in the shadow of angiosperms.
Nature 428:553–557
Schuettpelz E, Pryer KM (2006) Reconciling extreme branch length
differences: decoupling time and rate through the evolutionary
history of filmy ferns. Syst Biol 55:485–502
Schuettpelz E, Pryer KM (2007) Fern phylogeny inferred from 400
leptosporangiate species and three plastid genes. Taxon 56:
1037–1050
Smith AR, Tuomisto H, Pryer KM, Hunt JS, Wolf PG (2001) Metaxyalanosa, a second species in the genus and fern family Metaxy-
aceae. Syst Bot (in press)
Smith AR, Pryer KM, Schuettpelz E, Korall P, Schneider H, Wolf PG
(2006) A classification for extant ferns. Taxon 55:705–731
Stern DB, Goldschmidt-Clermont M, Hanson MR (2010) Chloroplast
RNA metabolism. Annu Rev Plant Biol 61:125–155
Sugiura M (2008) RNA editing in chloroplasts. In: Goringer HU (ed)
RNA Editing. Nucleic Acids Mol Biol 20:123–142
Takenaka M, Merwe JA, Verbitskiy D, Neuwirt J, Zehrmann A,
Brennicke A (2008) RNA editing in plant mitochondria. In:
Goringer HU (ed) RNA editing. Nucleic Acids Mol Biol 20:1–18
Tillich M, Lehwark P, Morton BR, Maier UG (2006) The evolution of
chloroplast RNA editing. Mol Biol Evol 23:1912–1921
Toor N, Hausner G, Zimmerly S (2001) Coevolution of group II
intron RNA structures with their intron-encoded reverse tran-
scriptases. RNA 7:1142–1152
260 Plant Mol Biol (2011) 76:251–261
123

Vogel J, Hubschmann T, Borner T, Hess WR (1997) Splicing and
intron-internal RNA editing of trnK-matK transcripts in barley
plastids: support for matK as an essential splice factor. J Mol
Biol 270:179–187
Vogel J, Borner T, Hess WR (1999) Comparative analysis of splicing
of the complete set of chloroplast group II introns in three higher
plant mutants. Nucleic Acids Res 27:3866–3874
Wei FS, Stein JC, Liang CZ, Zhang JW, Fulton RS et al (2009)
Detailed analysis of a contiguous 22-Mb region of the maize
genome. PLoS Genet 5:e1000728
Wickett NJ, Zhang Y, Hansen SK, Roper JM, Kuehl JV et al (2008)
Functional gene losses occur with minimal size reduction in the
plastid genome of the parasitic liverwort Aneura mirabilis. Mol
Biol Evol 25:393–401
Wolf PG, Rowe CA, Sinclair RB, Hasebe M (2003) Complete
nucleotide sequence of the chloroplast genome from a leptosp-
orangiate fern, Adiantum capillus-veneris L. DNA Res 10:59–65
Wolf PG, Rowe CA, Hasebe M (2004) High levels of RNA editing in
a vascular plant chloroplast genome: analysis of transcripts from
the fern Adiantum capillus-veneris. Gene 339:89–97
Wolf PG, Karol KG, Mandoli DF, Kuehl J, Arumuganathan K et al
(2005) The first complete chloroplast genome sequence of a
lycophyte, Huperzia lucidula (Lycopodiaceae). Gene 350:
117–128
Wolf PG, Duffy AM, Roper JM (2009) Phylogenetic use of inversions
in fern chloroplast genomes. Am Fern J 99:132–134
Wolf PG, Roper JM, Duffy AM (2010) The evolution of chloroplast
genome structure in ferns. Genome 53:731–738
Wolfe KH, Morden CW, Palmer JD (1992) Functions and evolution
of a minimal plastid genome from a nonphotosynthetic parasitic
plant. Proc Natl Acad Sci USA 89:10648–10652
Yang ZH (1997) PAML: a program package for phylogenetic analysis
by maximum likelihood. Comput Optim Appl 13:555–556
Yatabe Y, Takamiya M, Murakami N (1998) Variation in the rbcLsequence of Stegnogramma pozoi subsp. mollissima (Thelypte-
ridaceae) in Japan. J Plant Res 111:557–564
Zoschke R, Nakamura M, Liere K, Sugiura M, Borner T, Schmitz-
Linneweber C (2010) An organellar maturase associates with
multiple group II introns. Proc Natl Acad Sci USA 107:3245–3250
Plant Mol Biol (2011) 76:251–261 261
123