the enhanced locomotive engineer alerter: human factors final report
TRANSCRIPT
MILLER ERGONOMICS
THE ENHANCED LOCOMOTIVE ENGINEER ALERTER:HUMAN FACTORS FINAL REPORT
PHASE 1, DOT SBIR 92-FR1
Prepared for
Pulse Electronics, Inc.5706 Frederick Ave.Rockville MD 20852
by
James C. Miller, Ph.D.April 30, 1993
Miller Ergonomics8915 Rocket Ridge Rd.
Lakeside CA 92040-4924
TABLE OF CONTENTS
BACKGROUND..................................................................................................................1
CURRENT STATUS\: THE TRAIN SENTRY III...............................................................2
INITIAL TS3 ENHANCEMENT CONSIDERATIONS.......................................................4
TS3 ENHANCEMENT........................................................................................................5
INTERFERENCE OF THE SECONDARY TASK WITH THE PRIMARY TASK.............6
PERCEIVED WORKLOAD ON THE PART OF THE ENGINEER...................................8
PSYCHOMETRIC ASPECTS OF THE ENHANCEMENT................................................8Selecting from a Menu of Tasks................................................................................9A Candidate Task....................................................................................................11Data from the Candidate Task.................................................................................13Response Time Distributions..................................................................................14Judging Response Speed.........................................................................................15
INTEGRATING THE CANDIDATE TASK WITH THE TS3...........................................16The Pseudo-Random Interstimulus Interval............................................................16
FALSE POSITIVE AND FALSE NEGATIVE DETECTIONS OF DROWSINESS..........20
ALERTING QUALITIES OF THE TS3.............................................................................22
ELECTRICAL AND MECHANICAL DESIGN CONSTRAINTS....................................23
FEEDBACK OF DROWSINESS DETECTIONS..............................................................23
LEARNING THE TASK....................................................................................................24
CONTROLS AND DISPLAYS FOR THE CANDIDATE TASK.......................................24
TIME OF DAY CONCERNS.............................................................................................25
MAJOR MUSCLE GROUP INVOLVEMENT..................................................................26
CONCLUSIONS AND RECOMMENDATIONS..............................................................26
PROPOSED PHASE 2 WORK..........................................................................................28
APPENDIX A\: LIST OF POTENTIAL TS3 MODIFICATIONS.......................................1
APPENDIX B\: REVIEWS OF TASK MOCK-UPS...........................................................1
APPENDIX C\: CANDIDATE TASK SOFTWARE OVERVIEW......................................1
APPENDIX D\: CANDIDATE TASK RESPONSE TIME FILE.........................................1
APPENDIX E\: SUMMARY OF HUMAN FACTORS TASKS COMPLETED.................1
APPENDIX F\: PILOT STUDY OF REACTION TIMES FOR TASK 72..........................1
1
THE ENHANCED LOCOMOTIVE ENGINEER ALERTER:HUMAN FACTORS FINAL REPORT
James C. Miller, Ph.D.Miller Ergonomics
BACKGROUND
There is recognition of the fact that locomotive engineers, because of irregularly-scheduled work and night work, suffer on-the-job fatigue during low work load operations. Hildebrandt et al. (1974) described sleep problems experienced by engineers. SynchroTech published a guide for engineers to help them combat on-the-job fatigue (Klein, 1990).
With fatigue comes the increased likelihood of periods during which we fail to respond to important occurrences in the low work load environment. These periods may be brief "lapses" (e.g., Wilkinson et al., 1982; Williams et al., 1959) or they may be longer "microsleeps" (e.g., O'Hanlon and Kelley, 1977). Locomotive engineers are subject to these same problems (Hildebrandt et al., 1974; Kogi and Ohta, 1975). During a lapse or microsleep, the engineer may miss an important piece of information, with a tragic consequence (Kolstad, 1991; Anderson et al., 1992).
There are two portions of the 24-hour day during which lapses, microsleeps, and errors are most prevalent in many occupations (Bjerner, et al., 1955; Browne, 1949; Mitler, 1989; Prokop and Prokop, 1955), including that of the locomotive engineer (Hildebrandt et al., 1974). These periods include the pre-dawn hours and the mid-afternoon hours.
During a lapse or a microsleep, we are able to successfully carry on highly-learned, automated behaviors in unremarkable environments. Most of us have experienced an occurrence of a lapse while driving. We suddenly realize that we cannot recall any information about the last mile or two driven on the highway. We would like to detect engineer lapses because they probably indicate that microsleeps are soon to follow.
One analogy to the microsleep is the sleep walker. The sleep walker's brain exhibits electrical patterns consistent with nighttime sleep in bed. At the same time, the sleep walker's body moves, physically, through a familiar or uncluttered space. The thinking, or cognitive, portion of the sleep walker's brain is apparently asleep, yet he or she accomplishes familiar actions.
The driver of a vehicle may experience the same situation as the sleep walker. In fact, objective measures of microsleeps were actually captured during open-highway driving during an experiment using drowsy drivers in a van equipped with a recording device for brain electrical and carrying an on-board safety observer with steering and brake controls (O'Hanlon and Kelley, 1977). Drivers' brain waves indicated a sleep state for up to 15 seconds while they continued to drive within their
2
lane on a straight segment of freeway. They tended to weave within the lane, but did not crash. Other laboratory and field investigations suggest that microsleep lengths would have grown longer, due to increasing fatigue. Eventually, the drivers would have drifted off the roadway during longer microsleeps.
There is every reason to expect that locomotive engineers experience lapses and microsleeps in low work load situations. A number of theories for this ubiquitous phenomenon have been proposed. The theories are based upon data linking human performance to psychophysiological arousal and to behavioral inhibition, reinforcement, filtering, expectancy, and signal detection (Miller and Mackie, 1980). The primary factors which affect the performance of humans required to remain vigilant include the absolute and relative rates at which important and unimportant occurrences occur in the environment; the complexity, timing, and conspicuity of the occurrences; the sense involved (vision, hearing); the time of day; the total work load placed on the individual; the work schedule and its interactions with sleep quality and with bimodal circadian rhythms in human performance; the individual's motivation; attention from management; and others (Miller and Mackie, 1980).
CURRENT STATUS: THE TRAIN SENTRY III
The Train Sentry III (TS3; Pulse Electronics, Inc., Rockville MD) may be described as a cued, binary reaction task on a train-speed-dependent interstimulus interval. By cued, we mean that the 10-sec audio and visual ramps which lead up to full audio and visual power serve as a cue to the fact that noxious signals are about to occur. The use of a cue is appropriate: one should not introduce a high probability of suddenly receiving noxious audio-visual stimuli into a work environment, especially a safety-sensitive work environment. Noxious stimuli are distracting and may introduce hearing and other hazards. In the TS3, the ramps allow the user to avoid the noxious stimuli by shutting them off before they become noxious.
However, the ramps may not work well for drowsy engineers. By drowsy, we mean that the person's brain waves exhibit the patterns classified as Stage 1 drowsiness, or deeper sleep (Rechtschaffen and Kales, 1968) . Drowsy engineers use the increasing level of light as a cue to disable the alerter and its safety function, braking. The drowsy engineer is not disturbed much by the low level of red light generated during the early portion of the ramp. Also, the drowsy engineer can press a reset button without much disturbance to drowsiness (Fruhstorfer et al., 1977). Thus, the engineer may remain in a state of drowsiness which is modulated slightly by the appearance of a relatively dim red light and the need to make an automatic response. That automatic response disables the safety backup, braking. The ramps work fine for alert engineers, but not for drowsy engineers.
The audio portion of the cue accompanies the visual portion of the cue. The drowsy engineer is disturbed only slightly by the mild audio cue before making the automatic shut-off response.
Humans may become quite good at interval estimation, especially with months and years of practice. The TS3 operated on a fixed interstimulus interval, subject to train speed (K speed,
3
above speed X, where X may be set from 15 to 60 mph and was usually 30 mph). A drowsy engineer could automatically reset the system on a regular interval without arousing from drowsiness before the cue appears. Thus, at a fixed speed, the drowsy engineer would disable the safety system that was supposed to stop the train if the engineer falls asleep.
An investigation reported by Fruhstorfer et al. (1977) illustrates this point. They examined an engineer alerting device called SIFA (reportedly, described by Barwell, 1962), which required a button or lever response to a visual signal operating on a 30-sec interstimulus interval. Lack of response after 2.5 sec turned on an alerting buzzer. Lack of response after another 2.5 sec activated the brakes. This was somewhat similar to the TS3. They hypothesized that the engineer would spontaneously reset the device at intervals shorter than 30 sec, using a stable rhythm. Consequently, this habitual reset would improve the ability of the engineer to operate the device correctly, "even in states of lowered vigilance when his ability to perform the primary task may have greatly suffered."
They looked at the rhythmic patterns of responses in operational locomotive cabs (4 months, 42,000 km, 200 engineers) and found stable response cycles of 4 to 20 per minute, supporting their hypothesis. They also showed these stable, rhythmic response patterns in the laboratory, where psychophysiological measures of brain and eye activity showed Stage 1 drowsiness patterns, again supporting their hypothesis. They concluded that the engineers learned to use the device with minimal effort. They developed "a spontaneous, self-paced and rhythmic way of handling the system." This allowed "correct operation of the system even at levels of vigilance when the main task [safely operating the train] probably cannot be performed without mistakes." We concluded that we should introduce some unpredictability into the TS3 system: a pseudo-random inter-stimulus interval.
By calling the TS3 a binary reaction task, we mean that no attempt was made to capture an estimate of reaction time. Rather, the system simply notes that a response was made or not made. This structure precludes the possibility of the task being predictive and the possibility of letting the engineer or others know that drowsiness may occur soon. We concluded that reaction times should be captured by the TS3 for potential use in predicting periods of drowsiness.
The TS3 was a secondary task. That is, it was a task required of the engineer which has no direct effect on the operation of the train. The device injected a signal into the work environment of the engineer, calling for a response.
However, secondary tasks are worrisome. The engineer obviously has several primary tasks, including the control of the velocity of the train through the use of the throttle and brakes. A secondary task has the potential for interfering with the engineer's accomplishment of primary tasks (Rolfe, 1971). The TS3 already incorporated primary control monitors and a low-train-speed adjustment to reduce such interference. We proposed to:
Re-examine the relationships of the controls monitored to the engineer's primary tasks;
Re-examine the sensitivity of the control monitors; and
4
Re-examine the low-train-speed operation of the device (presumably, low speed operation reflects a high work load situation for the engineer).
The alerting signals from the TS3 operated in the visual and auditory modes. We did not plan to alter this configuration in Phase 1. However, we did propose to review existing research literature concerning the alerting qualities of the frequencies and amplitudes of the TS3 visual and auditory signals.
INITIAL TS3 ENHANCEMENT CONSIDERATIONS
Signal injection is known to be a valuable tool for estimating the level of alertness of an individual performing a monitoring, or vigilance, task (Miller and Mackie, 1980). We planned to enhance the TS3 by replacing some of the signals it injected into the engineer's environment with other signals which more amenable to monitoring the level of alertness of the engineer. Our objective here was to detect the early onset of drowsiness, before it reached a level hazardous to public safety.
The replacement signals, and the responses to these signals, were to be supported by a new, separate, add-on device connected electrically to the TS3. We proposed to construct a functional prototype of this add-on device during Phase 1, and to test it during Phase 2. To allow maximum flexibility in the mock-up stage, we implemented the mock-up on a PC, using VisualBasic (MicroSoft Corp.) as our software tool. The device was used for a small pilot test and will be available for bench-top pilot tests at the beginning of Phase 2.
Classic vigilance tasks used in laboratories present both meaningful signals and non-meaningful signals at quasi-random intervals, and they allow the investigator to vary signal rate, probability, complexity, and conspicuity. We concluded that, in the locomotive cab, we probably should not vary signal probability. If we used a meaningful-signal probability lower than 1.0, then we would ask the engineer to ignore some signals and to respond to others. While this approach is attractive to the research scientist, it would increase the secondary task workload for the engineer: to acquire the responses we need, we would have to ask the engineer to pay attention to more signals than if we used a probability of 1.0. Thus, we decided to use a signal probability of 1.0. Thus, every stimulus requires a response.
The lowest acceptable signal rate (the highest value allowed for each inter-signal interval) depended upon safety concerns: How far would we allow the train to travel while we wait to detect an engineer lapse or microsleep? The highest acceptable signal rate (the lowest value allowed for each inter-signal interval) depended upon the secondary task workload acceptable in the locomotive cab: How often might the engineer respond without interfering with the primary task? The average signal rates would fall halfway between the lower and upper bounds. We opted to remain with the present, speed-dependent TS3 interstimulus interval schedule as the mean interstimulus interval. We also opted to vary the interstimulus interval around that mean by
5
half the mean. For example, a mean interstimulus interval of 30 sec would represent a flat distribution of pseudo-random intervals ranging from 15 to 45 sec.
Signal complexity was to be great enough to require that the driver demonstrate cognitive competence in attention, visual perception and/or decision-making. These functions closely parallel the cognitive demands placed upon the highly-trained engineer during low work load operations. We concluded that increased task complexity would (1) increase the alerting nature of the task (Miller and Mackie, 1980), and (2) allow detections of lapses.
The simplest cognitive task structure for the enhancement, viewed at the highest level, would be:
Correct +----------> Reward (No noxious ¦ noise/light; performance ¦ feedback)
Stimulus ---> Response +----------> Penalty (Noxious
Incorrect noise/light)or too slowor none
In this model, a stimulus triggers a correct response or an incorrect, slow or missed response. The correct response should provide a reward, such as useful feedback, and the alternative should provide a penalty, such as a noxious stimulus. However, we cannot introduce a relatively high probability of receiving noxious stimuli into a work environment, especially a safety-sensitive work environment. In the existing device, the ramps used for noise and light allow the user to avoid these noxious stimuli by shutting them off before they become noxious. The ramps provide a 10-sec warning period preceding the full force of the noxious stimuli. We elected to retain the warning ramps.
A list of potential TS3 modifications is appended (Appendix A). After a series of considerations, three possibilities, with two versions of two of them, were coded in VisualBasic. The considerations, introduced below, were based upon cognition- and retrofit-related criteria. These criteria are summarized later in this report.
TS3 ENHANCEMENT APPROACH
The enhancement of the TS3 took into consideration several factors. These included:
1. Interference of the secondary task with the primary task.
2. Perceived workload on the part of the engineer.
6
3. The cognitive and psychomotor aspects of the enhancement. This includes the rejection of the automatic behavior described by Kolstad (1991).
4. False positive detections of engineer drowsiness (the alert engineer is thought to be drowsy) and false negative detections of engineer drowsiness (the drowsy engineer is thought to be alert).
5. The alerting qualities of the frequencies and amplitudes of the TS3's visual and auditory signals
6. Electrical and mechanical design constraints.
Each factor is discussed below. Subsequently, the following aspects of the TS3 enhancement are considered:
Feedback of drowsiness detections,Learning the task,Controls and displays for the candidate task,Time of day concerns, andMajor muscle group involvement.
INTERFERENCE OF THE SECONDARY TASK WITH THE PRIMARY TASK
The primary task of the engineer is to operate the train. Any secondary task demand may distract the engineer from the primary task. In the research world, there have been many investigations concerning the use of experimental secondary tasks for estimating the varying levels of demand (work load) of a primary task. In this kind of research, the demands of the primary task are supposed to take precedence over the demands of the secondary task, as one would expect. However, in some cases, the secondary task distracts the operator's attention from the primary task (Rolfe, 1971). The same thing may occur in operational settings.
Fernandez (1984) described one railroad view of this problem as "The balance between the effectiveness of the device in monitoring the engineer and the amount of disturbance the engineer is willing to accept." We amend that statement to refer to the intrusiveness of the device rather than to its effectiveness. An intrusive device will irritate or distract the engineer. However, a device does not have to be intrusive to be effective.
For example, non-intrusive technology exists to monitor eye movements, eye blinks and the electroencephalogram (EEG). The eyes may be monitored remotely, using video, and the eye and the EEG may be monitored by placing an instrumented hat on an individual. While potentially effective, and certainly quite non-intrusive, these approaches are too expensive for widespread use in locomotive cabs. In addition, it is quite possible for human perception to be strongly impaired by fatigue and drowsiness while the eyes are open.
7
A performance-based monitoring system is the primary alternative to a physiological monitor of engineer alertness. However, along with the use of a secondary performance task comes the risk of task intrusiveness. Fernandez (1984) pointed out that the classic dead man pedal was not intrusive or effective. The latter failure was due to "gaming," in this case putting an object on the pedal to hold it down. The "alternating air" approach, requiring repetitive, periodic operation of the pedal, was effective, but too intrusive.
Fernandez (1984) went on to describe the "reset timer," which required repetitive, periodic hand operation. This device demanded less physical work from the engineer than "alternating air." It, too, was effective but intrusive. He also described the "antenna" system, which detected a touch of the seated engineer's hand to the control panel. This was quite non-intrusive, but it was more easily "gamed" by a drowsy engineer than the TS3 ramp system.
The TS3 was moderately intrusive and moderately effective. Its level of intrusiveness seemed to be reasonably acceptable in today's locomotive cab work environment. Thus, we decided to attempt to keep the level of intrusiveness in the enhanced TS3 less than or about equal to the TS3. Too little intrusiveness would probably make the task ineffective. Much higher intrusiveness would probably interfere with the primary task.
To approach this objective, we (1) examined the relationships of the TS3's monitored controls to the engineer's primary tasks and (2) examined the sensitivity of the TS3's control monitors. The TS3 had six electrical reset circuits. The six electrical reset inputs were the dynamic (automatic) braking rheostat, a one-shot, manual reset button for the engineer, and four optional on-off (0 or +74 vdc) events. The optional events were usually the throttle, the throttle's idle notch, the electric horn, and one other, perhaps the reverser. Other electrical circuits allowed the TS3 to determine train speed and whether or not the engine was involved in a low-constant-speed, automatic drag operation. Pneumatic inputs allowed the TS3 to monitor the independent brake "bail-off" and the pneumatic horn and the bell for resets; one recognized that the locomotive was "dormant" (not the lead locomotive).
At present, any control activation of those listed will reset the TS3. With a reset, the timing circuit will begin counting up to a factory-set limit. If it reaches that count before another reset occurs, the audio-visual ramps begin, requiring a response from the engineer to stop them. The engineer may respond through the manual reset button or through one of the monitored controls. The monitored controls were divided into two classes: Safety critical and not safety critical. The one safety critical control monitored was the automatic brake. In an emergency, the brake must be applied immediately. A safety critical control operation should abort the secondary task. Thus, we specified that, if the secondary task has begun and, subsequently, the automatic brake is moved, the task should reset immediately.
Conversely, once the secondary task has been switched on, only a safety-critical control operation, i.e., dynamic braking, should cause the task to reset. If a non-safety-critical control operation is
8
required after the beginning of the secondary task, the engineer may accomplish it before or after responding to the secondary task, as desired.
The sensitivities of the monitoring devices placed on the controls appear to be optimal, adjusted through trial and error (A. Bezos, personal communication, 14 Jan 93). The dynamic brake rheostat was of greatest concern, since it was the only continuous control monitored. The rheostat's position was monitored as its first derivative, volts/sec. In Phase 2, we should determine the velocity (inches/sec) of hand movement, and perhaps the minimum distance of this hand movement, required to reset the TS3. The other electrical and pneumatic reset circuits appear to be discrete, binary switches. For the throttle, the system senses discrete changes in position from notch to notch, including the idle notch.
PERCEIVED WORKLOAD ON THE PART OF THE ENGINEER
The engineer's perception of the amount of work to be done interacts with the intrusion of the secondary task into the primary task. A reduction of the physical work required from the engineer would occur if one shifted from the "alternating air" system, using the foot, to the "reset timer" system, using the hand. However, some engineers might perceive the higher physical work, moving the leg, as being less stressful than the lower physical work, moving the arm. These kinds of perceptions depend on the individual and upon the work environment and are hard to predict.
We were tasked to deal with perceived workload in the cognitive domain. How much more "thinking" should we require of the engineer in the enhanced TS3, and how would the engineer perceive this changed demand? Certainly, we would require more thinking (greater cognitive demand). However, the enhancement should be designed so the real intrusion into the primary task was not much greater than with the TS3. Also, the enhancement should be presented during training to engineers such that they perceive the increase as negligible. A Phase 2 objective should be the quantitative estimation of engineers' subjective work load perceptions for the TS3 and the enhanced device.
These objectives were met, in part, by keeping the cognitive processing time short for the secondary task. Thus, the total reaction time required for the enhanced system should be very little more than for the present TS3. For example, the TS3 was probably characterized by a reaction time of about 1 sec. The enhanced device may require about 1 to 2 sec for the alert engineer.
Engineer "user friendliness" and acceptability. Ramping audio and visual alarms is considered to be user friendly.
PSYCHOMETRIC ASPECTS OF THE ENHANCEMENT
We identified several selection criteria for the cognitive secondary task. These include:
9
1. The probability of random correct responses.
2. Face validity (how well the task matches what the engineer does for a living).
3. Data acquisition qualities. One of the values the modified system should offer is the capability to feed back information concerning engineer performance.
4. Ease of hardware/software implementation.
Selecting from a Menu of TasksSelecting from a Menu of Tasks
There was a long list of psychometric tasks from which we could choose as we tried to meet these four criteria and the intrusiveness criterion mentioned earlier. Work during the previous decade and a half within the Department of Defense (DOD) led to understanding of the implementation of older, paper-and-pencil psychometric tasks on computers. Also, work during that period by Kennedy and Bittner for the U.S. Navy led to greater understanding of the statistical assumptions underlying the repeated measurement of the performance of a single individual.
From the DOD work, we selected from the Army's Walter Reed Performance Assessment Battery (PAB) of 14 tasks (Thorne et al., 1985), and a dual-task, commercial offshoot of the Air Force's work, "NovaScan" (O'Donnell et al.; Nova Technology, Inc., Tarzana CA), and the 23-task, commercial extension of the Navy's work, the Automated Performance Test System (APTS) and "DELTA" (Kennedy et al.; Essex Corp., McLean VA). Also, we examined the Psychomotor Vigilance Task (PVT) used by the NASA-Ames Research Center for the Federal Aviation Administration's cockpit crew fatigue studies (Graeber et al., 1990). There were other task batteries, as well (see Kennedy et al., 1990), but the types of tasks included in the batteries overlapped with the DOD batteries.
We focussed on the APTS-DELTA battery, the PAB and the PVT to guide us. Each instructed us about data manipulation. In addition, the batteries gave us a carefully scrutinized, wide range of task structures from which to select. However, all the classic, psychometric task structures available to us were based upon the assumptions that (1) the experimental task was the person's primary task and (2) the task ran for a brief, finite period, such as three or ten minutes. Thus, we adapted portions of tasks to our need for a continuous monitor of engineer alertness.
The tasks in the cited batteries were categorized initially as follows:
Too intrusive PAB:Two-letter and six-letter searchEncoding/decodingTwo-column additionSerial add/subtract
10
Logical reasoningDigit recallPattern recognition IIVisual scanningTime estimation IAPTS-DELTA:Code Substitution AShort term memory, numbers and lettersLetter matchingContinuous recall, numbersGrammatical reasoning A and BSymbolic reasoningMathematical processingVertical mathematicsComplex countingManikin A and BSpatial processing A and BSuccessive pattern comparisonVisual scanningTapping
Inappropriate PAB:Mood activation scaleMood scale II
Potentially useful PVTPAB:Pattern recognition IFour-choice serial reaction timeAPTS-DELTA:Code Substitution BLetter and type comparisonNumber comparisonSimultaneous pattern comparison A and BAlphanumeric visual vigilanceReaction time A and B
The potentially useful tasks assessed simple cognitive functions which might be called comparison and selection, and they assessed some aspects of neuromuscular speed. They lacked more complex cognitive components such as logical reasoning, arithmetic, memory, visual search, and spatial rotation, which take enough cognitive processing time that the primary task must be ignored for too long.
11
Was this selection of potentially useful tasks appropriate? Since part of our objective was to predict the onset of drowsiness, the answer was yes. Presumably, the simpler cognitive functions are the most resistant to the effects of drowsiness. When these simpler functions begin to fail, then the failure may be due to incipient drowsiness, and our drowsiness detection reliability should be high. Conversely, the simpler cognitive functions are less affected than complex functions by distraction. Thus, engineers' abilities to respond quickly and accurately to a secondary task should be more consistent for a task using simple rather than complex cognitive functions. Again, this enhances our reliability for detecting engineer drowsiness. Perhaps the best time for testing the more complex cognitive functions is before the engineer takes control of the locomotive.
The potentially useful tasks included several which required binary (true-false or yes-no) responses. For a binary task, there are four outcomes: a correct true or yes, an incorrect true or yes, a correct false or no, and an incorrect false or no. Thus, a drowsy engineer could respond repeatedly by pressing just one of the two response keys needed and make an accurate response, at random, 25% of the time. This leniency did not provide an acceptable task in the judgment of safety specialists. Thus, while comparison and selection represented cognitive functions with real-world applications (reading and acting on signs and signals), a more complex response structure than just a binary response was needed to examine this cognitive function.
Faced with this random-correct-response problem, we increased the number of selections per trial available and the number of trials required. For example, if ten selections were available on trial 1 and ten on trial 2, then the probability of a random correct response would be (1 10) x (1 10 =) 0.01, or 1%.
Several of the potential TS3-compatible modifications listed in Appendix A were mocked-up in VisualBasic. The mock-ups were reviewed by the project Human Factors Consultant (Dr. Miller) and the project Rail Operations Consultant (Mr. Yerkes). Their reviews are included as Appendix B.
A Candidate TaskA Candidate Task
A mixture of a code substitution task and a choice reaction time task fitted our criteria well: a digit-key substitution, 2-trial, 4-choice serial reaction time task. A numeric display would show a single digit, 1 through 4. The engineer would respond by pressing the matching key on a 4-key numeric keypad. This would provide "unalerted" reaction time data. Immediately after the first response, a second digit would appear on the numeric display. The engineer would respond again, providing an "alerted" reaction time. The two responses (after detecting the presence of the first digit displayed) should be completed in less than 2 sec by an alert engineer, not involved in another control operation.
Each display was to remain illuminated until the correct response has been made. This provided a simultaneous, rather than a successive signal detection task (Miller and Mackie, 1980). In a simultaneous task, such as that proposed, the response is made while the stimulus is still displayed.
12
The two numbers presented would not be the same. If they were, the engineer might not realize that the number has changed following the correct response to the first number.
This task met our criteria in the following ways:
1. It required only a brief span of attention and response. Thus, it should not intrude into the primary task perceptibly more than the TS3.
2. The probability of correct random responses would be only (1 4) x (1 3 =) 0.0825 (8.25%).
3. The task may resemble other, real, number-reading, button-pressing tasks in the cab.
4. The unalerted and alerted response accuracies and the alerted reaction times would provide useful data.
5. Numeric displays and key pads are available and inexpensive.
What did this task provide us in the way of assessing cognitive functions? First, it required simple numeric processing: recognizing a single digit (twice). Second, it required a simple transformation from reading a display to selecting a response key. Finally, it required some level of neuromuscular response speed.
This set of assessments may seem too simple. However, tragic errors have occurred when system operators have keyed the wrong numbers into a system while reading the numbers from a list. Thus, we judged the candidate task to be adequate for our purposes.
Of course, the candidate task could have been more complex. We could have enhanced the level of arithmetic processing by requiring the engineer to transform the number on the display before making the response. For example, the engineer might have to subtract the value of the digit from 5 to get the number of the key to press. Or, we might have introduced a memory component by not marking the numbers on the response keys. However, engineers would probably mark the numbers on the keys later.
Similarly, we might have introduced a more difficult memory component. Non-numeric patterns could have be shown on the display and the engineer would have to recall the number which matches the pattern. Again, engineers would probably mark the patterns on the keys later. We could have used letters and a QWERTY keyboard instead of numbers and a numeric key pad, reducing the probability of a random correct response to (1/26 x 1/26 =) 0.0015 (0.15%). However, the probability is low enough with numbers, and the response keypad would be smaller with numbers.
13
The candidate task could be performed in the auditory sensory mode. A simple auditory code could represent each digit. However, the ambient noise level in locomotive cabs varies widely. Also, the corrected hearing abilities of engineers may vary more widely than corrected vision. Thus, it seemed less likely that an auditory task would be as successful operationally as a visual task.
We concluded that the candidate task, in its simple, visual form, would introduce an adequate cognitive demand into the drowsiness monitor. On the one hand, it would not be much more intrusive than the existing TS3. On the other hand, it should not allow automatic responding by a drowsy engineer. A software-logic-oriented summary of the task is included in Appendix C.
Data from the Candidate TaskData from the Candidate Task
Our selection of useful data required a lapse identification method. One method of lapse identification was developed by the late R.T. Wilkinson in Great Britain and applied in this country by D.F. Dinges at the University of Pennsylvania and by R.C. Graeber, and now M.R. Rosekind, at NASA-Ames Research Center (e.g., Graeber et al., 1990). The original method was described by Wilkinson and Houghton (1982).
Applications of the original lapse detection task focussed on the distribution of response times for an individual subject (e.g., Dinges and Powell, 1985). The slowest 10% of the subject's response times across many hours or one or two days of a study indicated periods of drowsiness. Working with reciprocally-transformed response time data, and integrating those data with theories and data concerning optimal response times, false positive responses, and omitted responses, Dinges (1991) showed how fatigue due to sleep disruption affected these aspects of responding to a choice reaction time task.
We reviewed work by Dinges and colleagues and from Rosekind and colleagues. We concluded that a response time may be used successfully in the locomotive cab, with an appropriate statistical decision approach. We planned to incorporate information about response time means and variabilities, and about missed responses and false positive responses into the decision approach.
We also planned to collect these data for both response 1 and response 2. In false positive responses, the engineer responds when no number is being presented on the numeric display. The frequency of false positive responding increases with the effects of disrupted sleep (Dinges, 1992). These variables should all be useful in detecting incipient drowsiness, and allowing the device to warn the engineer that alerting behaviors may be called for to prevent overt, dangerous drowsiness.
The identification in the matrix of correct responses which are fast and slow implies the presence of some sort of decision matrix or decision algorithm for classifying responses times. Through pilot testing in Phase 2 of the project, we should establish an expected distribution of response times for response 2. The latter distribution will a much faster mean response time and a smaller variation in response time than response 1, since the engineer would know that the second response is required. A first-draft distribution is included as Appendix D.
14
Response Time DistributionsResponse Time Distributions
Distributions of response times such as these tend to be slightly distorted from the expected Gaussian (bell) curve shape. They are somewhat truncated at the faster end, since nerve transmission from the eye to the hand takes a minimum of about 100 msec. The distributions are also somewhat skewed at the slower end due to occurrences of a phenomenon known as lapses, or failures to respond (Williams et al., 1959). Operationally, a lapse is usually defined as a response time which is more than twice the mean response time. A lapse is characterized by no response or as a response which is remarkably slow when compared to expectations based upon the known distribution of response times. The probability of lapse occurrence rises with progressive sleep disruption (Dinges, 1992).
The truncation and skewness lead to a slight statistical analysis problem: a correlation between shifts in the mean response time and shifts in variance around the mean as fatigue introduces lapses into the response time data set. This problem makes it difficult to determine relationships among mean response time, response time variance, and behavior. Dinges et al. (1987) showed that the (non-linear) reciprocal transform solved this problem adequately, producing relatively normal (Gaussian) distributions. Thus, in data reduction and analysis, we should treat all response time data as their reciprocals. For example, a response time of 0.200 sec (200 msec) would be the handled as the value, 5.00, and a response time of 0.500 sec (500 msec) would be handled as the value, 2.00.
The expected distribution that we will create should reflect the minimum acceptable ranges and means of response times. For the second response, the expected mean may lie around 250 msec (4.00). An unacceptably slow response would be more than 500 msec (2.00).
The distribution should be represented by a set of 25 scores. The reason a set of scores, rather than a cut-off point, should be used is to allow modifications of the set based upon actual performance, discussed below. The size of the set, 25 scores, was selected for three reasons. First, it provided a sample large enough to be respected as representative of behavior. Second, it was an odd number, which allowed the center (13th) score in the rank-order sorted set to represent the mean and median of the underlying distribution. Finally, the number, 25, was a factor of 100, allowing each score in the rank-order sorted set to represent an easily recognized and remembered 4% of the underlying distribution.
The slowest response time in the rank-order sorted set would fall above the 96th percentile of the theoretical underlying distribution (24 scores x 4% = 96%). This, initially, is the score we would use as a fast-slow criterion. A response time slower than this would suggest that the engineer is responding in the slowest 4% of the expected distribution. This should be a cause for worry.
We may wish to shift the criterion to a lower percentile. Depending on the outcome of pilot testing, the initial set of rank-order sorted scores should look something like the values (1/sec) in Figure D-
15
1, column 2, in Appendix D. If we select the 96th percentile as the acceptability criterion, then the criterion index would be the number 1, pointing at the 1st score in the set in Figure D-1.
When the locomotive starts moving, this distribution is the one we would use to make judgments about acceptably fast or unacceptably slow response times for response 2. This set should be loaded into memory each time the locomotive speed falls to zero, and the locomotive stops. With continuous operation of the locomotive, at speeds above zero, selected responses of the engineer would gradually replace all the theoretical, expected scores placed in memory initially. If a response time qualifies for selection, its reciprocal would push up the stack of scores, such that the new reciprocal (1/sec) becomes the score in line 25, and the slowest score, on line 1, would be pushed off the stack. After the first occurrence of a push up, the scores would always require rank-order sorting after each push-up before making subsequent judgments.
As the locomotive continues to operate, all 25 initial scores would be replaced, one by one, pushed up by new engineer-specific scores. This engineer-specific set of scores would allow our judgments about engineer secondary task performance to be much more accurate than judgments based upon the generic, low-performance-expectation, initial scores. The engineer would be judged against his or her own recent performance.
The qualification for entry into the set of scores is simple. The response time should be no shorter than 0.100 sec and no longer than 10 sec. The reason for the lower limit was described earlier. The longer limit is derived from the 10-sec ramp time of the TS3. If a score falls outside these bounds, 0.100 to 10 sec, it should not replace the last score in the set.
Judging Response SpeedJudging Response Speed
Judgments may be made on the basis of the rank-order sorted sets of scores. After rank ordering, the reciprocal of the slowest response time recorded would lie on line 1. If the reciprocal of the newest response time is smaller (longer response time) than line 1 (96th percentile), then the response time was unacceptably long. If the reciprocal of the newest response time is equal to or larger (shorter response time) than line 1, then the response time was acceptably short. However, this simplistic approach to judgment is open to gaming: an engineer may try to keep the response times slow to avoid having to respond too fast. Experience has shown that the judgment criterion value should not be allowed to decline across time.
Thus, the reciprocal (1/sec) of the first slow-fast criterion value is copied from line 1 of the rank-ordered set and stored elsewhere. It is this stored slow-fast criterion value which is used for all judgments. Each time the stack is pushed up and rank-order sorted, a new criterion value would appear on line 1. The criterion value should be copied to the judgment location only if it represents a faster response time than the value stored there already. For example, the first value stored for set 1 would be 0.250 (1/4.00 sec; top line of Figure A-1). After the first push up and sort, the new value on line 1 of the set would replace the 0.250 in storage only if it were larger (shorter response time) than 0.250.
16
INTEGRATING THE CANDIDATE TASK WITH THE TS3
An outline for software to run the candidate task and integrate it with the TS3 is given in Appendix C. There are two aspects discussed here concerning the integration of the candidate task with the TS3: the relative timing between the TS3 ramp and the candidate task, and the interstimulus interval. There are several possibilities for relative timing: the TS3 ramp starts before the candidate task, ending before or during the candidate task; the candidate task starts before the TS3 ramp, ending before or during the TS3; and the two start at the same time.
The TS3 ramp and the candidate task should start around the same time. The rationale for this approach evolves from a consideration of laboratory tasks designed to assess human vigilance performance.
Vigilance may be defined as remaining alert in a boring environment, awaiting a subtle and rare, but important, occurrence (called the signal). The human brain is not configured well for this task. Human vigilance wanes with time, unlike machine vigilance, which never wavers. The key word for us in the definition of vigilance was "subtle." To evoke higher than normal errors in human vigilance performance in the laboratory (for statistical analysis purposes), signals are embedded in background noise. For example, an auditory signal might be partly masked by white noise, or a visual signal might be of low contrast. Through these manipulations, we know that increasing the signal's subtlety reduces human reliability in tasks which require vigilance.
The numeric display we would use would not be mounted in the center of the engineer's field of view. It would not be very bright. Paying attention to the display would not be the engineer's primary task. All of these factors add up to make the display a rather subtle signal. We are not interested in evoking high error rates with this task. Errors should be rare and meaningful: false positive detections of engineer drowsiness would not be appreciated or useful (see discussion, below). Thus, we would probably need to cue the engineer that the numeric display is illuminated.
The 10-sec TS3 ramps would provide cues. At some point in the ramps, the engineer who had not already spotted the illuminated numeric display would become aware of the need to respond to the display to stop the ramps. The question is, when to start the ramps with respect the time at which the numeric display is lit? That lag or lead time should be an external variable which could be manipulated in pilot studies and in Phase 2. Perhaps, the start time for the ramps should lag the numeric display by the mean response time in set 1, described earlier (2.00 sec, initially). This would give an average response time for the engineer to respond solely from detecting the 7-segment display, without being cued by the ramps. Alternatively, the lag might be as long as 5 sec.
The Pseudo-Random Interstimulus IntervalThe Pseudo-Random Interstimulus Interval
17
The constraint of retro-fitting an add-on device to the TS3, to keep costs low, complicates the execution of the desired pseudo-random-interval objective, but does not complicate the randomness specification. First, we will use the existing mathematical relationship between speed and interstimulus interval to calculate the means for our flat distributions of interstimulus intervals. The use of the existing relationships will mean that the total work demand placed upon the engineer by the secondary task will not rise much due to the enhancement of the TS3. Thus our interstimulus interval means will be:
1. 20 sec from 0 to _ mph
2a. 2T sec from _ to 3.5 mph in drag mode
2b. T sec from _ to 3.5 mph when not in drag mode
3. T sec from 3.5 to X mph
4. K speed sec above X mph(K speed lies between 18 and T sec)
where:
T = 50, 60, 90, or 120;
K = 1800, 2100, 2400, or 3000; and
X varies from 15 to 60 mph.
Our approach to the pseudo-randomness issue is to use a flat distribution of intervals from half the desired mean to 1.5 times the desired mean. Thus, the lower and upper bounds of the flat distributions for the respective means described above will be, respectively:
1. 10 sec to 30 sec, mean = 20 sec.
2a. T sec to 3T sec in drag mode, or:50 sec to 150 sec, mean = 100 sec; or60 sec to 180 sec, mean = 120 sec; or90 sec to 270 sec, mean = 180 sec; or120 sec to 360 sec, mean = 240 sec.
2b. 1T sec to 1.5T sec not in drag mode, or:25 sec to 75 sec, mean = 50 sec; or30 sec to 90 sec, mean = 60 sec; or45 sec to 135 sec mean = 90 sec; or60 sec to 180 sec, mean = 120 sec.
18
3. Same as #2.
4. 1(K speed) sec to 1.5(K speed) sec, mean = K speed, ranging between:about 9 sec to 27 sec, mean = about 18 sec
(at high speeds with K = 1800),to about 120 sec to 360 sec, mean = 240 sec
(at low speeds with T =120).
There is a safety concern at high speeds (100 mph). If K = 1800, then the mean interstimulus interval is around 18 sec. Of each average 18-sec period, the engineer will spend about 1 sec, or about 5.5% of the time operating the secondary task. Similarly, if K = 3000, the mean interstimulus interval is around 30 sec, and about 3.3% of the engineer's time will be spent operating the secondary task. Nominally, at 80 mph, the engineer would pay attention to the primary task about 95% of the time. This seems acceptable.
There is also a mental workload concern at high speeds. The engineer would have to respond to the secondary task about three times each minute, or about 180 times each hour. Would this be acceptable? As it stands, the TS3 demand for an action two or three times per minute at higher speeds is probably quite aggravating to engineers. After all, the alert engineer should not fall asleep in less than 5 minutes unless narcolepsy is present.
These two arguments suggested that the response requirement should be modified. We would reward the engineer for fast first responses by lengthening the interstimulus interval, reducing the total work demand from the secondary task. Presumably, a fast first response indicates that the engineer is neither drowsy nor busy. A fast first response might provide a basis for doubling or even tripling the interstimulus interval (i.e., skipping the next one or two signals), thus halving or reducing by two-thirds the work demand from the secondary task. The engineer would be notified of good performance by lighting a green lamp on the control/display unit.
However, this modification would allow the train to travel quite a distance without testing the engineer. For example, at 80 mph with T = 120 and K = 2400, skipping one secondary task signal, the train might travel 2 x (1.5 x 30 sec) x 117.3 ft/sec = 10,560 ft (2 mi) without an alertness test. If we are confident that (1) the rapid first response is meaningful in terms of engineer alertness, (2) the rapid first response is meaningful in terms of low primary task workload, and (3) the alert engineer cannot fall asleep in 1 min, then the modification would be useful. This should be an issue for Phase 2 and beyond.
We mentioned some retrofit complications, above. One hardware integration aspect is obvious. The add-on device should sense train speed and decode it, determine the appropriate interstimulus interval, adjust the speed value to meet the interstimulus interval need, re-encode the speed signal, and transmit the new signal to the TS3.

19
This decoding/encoding process may conflict with the stated project objective to find a low-cost retrofit for the TS3. In Phase 2, we may find that the low cost retrofit will be enhanced only with the cognitive task, and that the introduction of the pseudo-random interstimulus interval will have to occur in an optional, higher-cost retrofit.
20
FALSE POSITIVE AND FALSE NEGATIVE DETECTIONS OF DROWSINESS
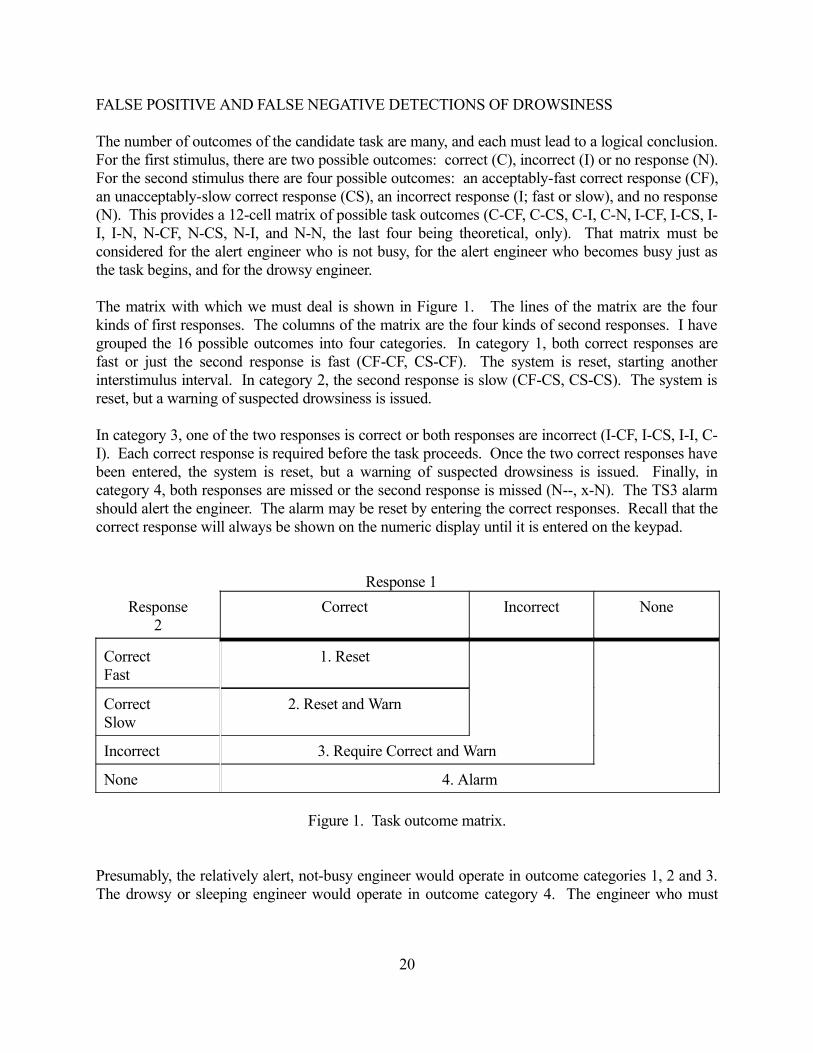
The number of outcomes of the candidate task are many, and each must lead to a logical conclusion. For the first stimulus, there are two possible outcomes: correct (C), incorrect (I) or no response (N). For the second stimulus there are four possible outcomes: an acceptably-fast correct response (CF), an unacceptably-slow correct response (CS), an incorrect response (I; fast or slow), and no response (N). This provides a 12-cell matrix of possible task outcomes (C-CF, C-CS, C-I, C-N, I-CF, I-CS, I-I, I-N, N-CF, N-CS, N-I, and N-N, the last four being theoretical, only). That matrix must be considered for the alert engineer who is not busy, for the alert engineer who becomes busy just as the task begins, and for the drowsy engineer.
The matrix with which we must deal is shown in Figure 1. The lines of the matrix are the four kinds of first responses. The columns of the matrix are the four kinds of second responses. I have grouped the 16 possible outcomes into four categories. In category 1, both correct responses are fast or just the second response is fast (CF-CF, CS-CF). The system is reset, starting another interstimulus interval. In category 2, the second response is slow (CF-CS, CS-CS). The system is reset, but a warning of suspected drowsiness is issued.
In category 3, one of the two responses is correct or both responses are incorrect (I-CF, I-CS, I-I, C-I). Each correct response is required before the task proceeds. Once the two correct responses have been entered, the system is reset, but a warning of suspected drowsiness is issued. Finally, in category 4, both responses are missed or the second response is missed (N--, x-N). The TS3 alarm should alert the engineer. The alarm may be reset by entering the correct responses. Recall that the correct response will always be shown on the numeric display until it is entered on the keypad.
Response 1Response
2Correct Incorrect None
CorrectFast
1. Reset
CorrectSlow
2. Reset and Warn
Incorrect 3. Require Correct and Warn
None 4. Alarm
Figure 1. Task outcome matrix.
Presumably, the relatively alert, not-busy engineer would operate in outcome categories 1, 2 and 3. The drowsy or sleeping engineer would operate in outcome category 4. The engineer who must
21
operate the automatic brake immediately after the secondary task begins will not need to respond to the task: the manipulation of the brake control will reset the device. However, the engineer who must operate the other, non-brake controls immediately after the secondary task begins will need to respond to the task: the manipulation of the other controls would not reset the device. The response data collected from that kind of outcome would be segregated from other data.
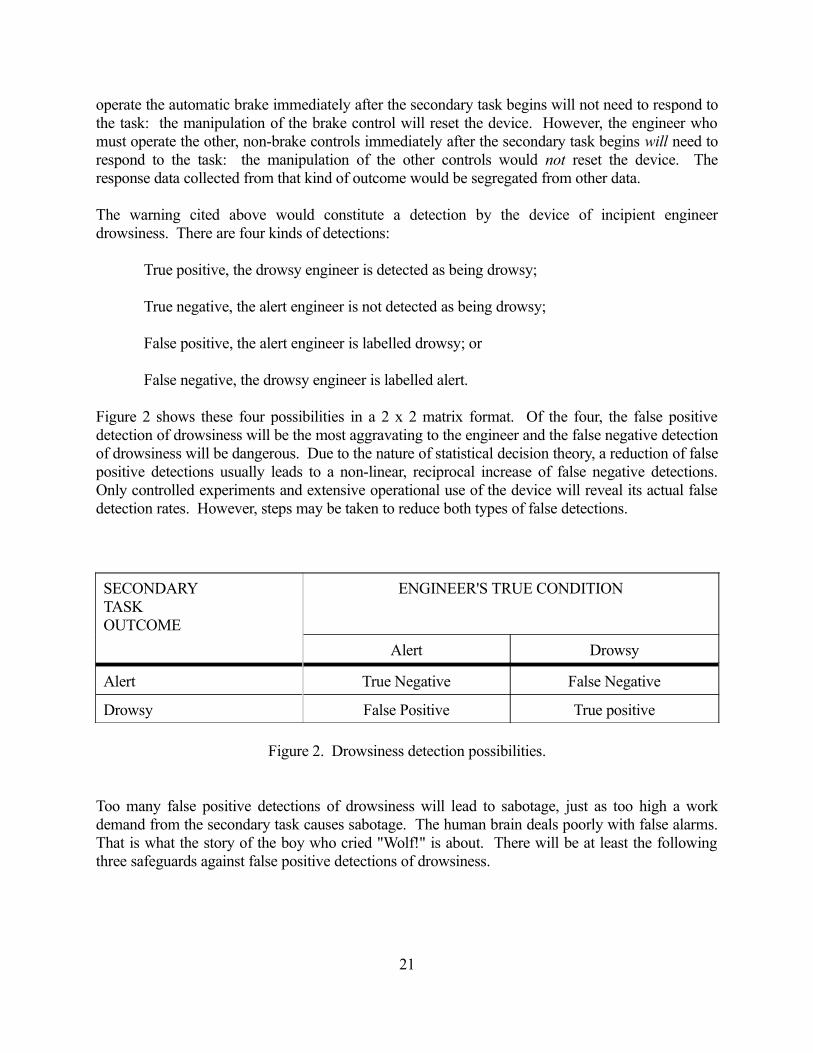
The warning cited above would constitute a detection by the device of incipient engineer drowsiness. There are four kinds of detections:
True positive, the drowsy engineer is detected as being drowsy;
True negative, the alert engineer is not detected as being drowsy;
False positive, the alert engineer is labelled drowsy; or
False negative, the drowsy engineer is labelled alert.
Figure 2 shows these four possibilities in a 2 x 2 matrix format. Of the four, the false positive detection of drowsiness will be the most aggravating to the engineer and the false negative detection of drowsiness will be dangerous. Due to the nature of statistical decision theory, a reduction of false positive detections usually leads to a non-linear, reciprocal increase of false negative detections. Only controlled experiments and extensive operational use of the device will reveal its actual false detection rates. However, steps may be taken to reduce both types of false detections.
SECONDARYTASKOUTCOME
ENGINEER'S TRUE CONDITION
Alert Drowsy
Alert True Negative False Negative
Drowsy False Positive True positive
Figure 2. Drowsiness detection possibilities.
Too many false positive detections of drowsiness will lead to sabotage, just as too high a work demand from the secondary task causes sabotage. The human brain deals poorly with false alarms. That is what the story of the boy who cried "Wolf!" is about. There will be at least the following three safeguards against false positive detections of drowsiness.
22
First, a false positive detection means that the response to the second stimulus was slow, or that one or both responses were incorrect. The second response is an alerted reaction time. The engineer knows that it follows immediately after the response to the first number displayed. The variance of the response time (reciprocal) distribution should be small, providing detection relatively good sensitivity and accuracy: a slow second response time should be easy to detect, should be meaningful with regard to drowsiness or distraction, and should not cause many false positive detections of drowsiness.
Second, the candidate task requires a simultaneous signal detection on the part of the engineer. That is, the proper number for the response will always be shown until the correct response is made. Thus, the task will be relatively accurate: an incorrect response should be meaningful with regard to drowsiness or distraction and should not cause many false positive detections of drowsiness.
Third, the slow first response is purposefully not included as an outcome category which would produce a warning. Distraction by the primary task would cause the response time (reciprocal) distribution for the first response to be highly variable. A slow response time would be difficult to interpret. The exclusion of the first response from the warning categories reduces the possibility of false positive detections of drowsiness.
False negative detections are dangerous. Leaving a drowsy engineer on the job leads to accidents. Our primary protection against false negative detections is the enhancement of the TS3: the introduction of a cognitive task in place of the manual reset button will reduce the number of false negative detections of drowsiness which apparently occur with simpler devices.
The detections which the device will make will not be comprehensive. The candidate task will detect, warn, and alert engineers whose basic level of cognitive functions (number recognition and transformation from visual display to manual response key) and/or neuromuscular response speed is compromised. Presumably, an engineer must be relatively alert to stay on top of even this simple cognitive task, and the task should prove to be relatively accurate and sensitive to impairment. However, there would be no guarantee that other, untested cognitive functions are intact.
For example, it is possible that logical reasoning, visual search and/or memory are impaired though simpler cognitive functions are intact. The problem is that, to test these higher cognitive functions, one must force the engineer to spend too much time at the secondary task, sacrificing attention which should be paid to the primary task. This, too, is dangerous. Perhaps simple cognitive functions represent the limit of performance-based, secondary-task alertness monitoring, due to attention allotment demands. Possibly, false negative detections may only be eliminated through the addition of covert psychophysiological or other sensors and related detection algorithms.
ALERTING QUALITIES OF THE TS3
The actual alerting qualities of the TS3 have not been documented. The sound pressure level (SPL) and transmitted luminance of the device should be measured in the field, mounted in operational
23
locomotives. The ambient SPL and luminance during day and night operations should also be measured. Measurements should be made in a representative sample of cabs. The TS3 and ambient values obtained should be compared to standards for SPL and lighting in an attempt to determine how powerful the alerting properties of the TS3 are. In addition, semi-controlled, quantitative estimates of alerting quality should be obtained from engineers who must use the device in everyday operations.
These efforts should be delayed until Phase 2, when resources are available for field work. However, during Phase 1, the specification sheets for the horns and lights in the TS3 may be acquired and reviewed.
ELECTRICAL AND MECHANICAL DESIGN CONSTRAINTSELECTRICAL AND MECHANICAL DESIGN CONSTRAINTS
The items were identified by Pulse Electronics staff during the course of the project.
1. Retrofittability. How suitable for retrofit is the hardware implementation of the cognitive task?
We must also consider reliability and maintainability.
2. Railroad environment issues. Ability to survive in the railroad environment including tamper resistance. Potential use of gloves would require larger button sizes and larger button separations in multiple button approaches. Night operation may require undesirable (cost, location & space) illumination in some approaches. The locomotive cab has location and space limitations. Visual displays should be at eye level (line of sight) to ease the refocusing required by the engineer when moving his eyes from looking down the track to looking at a visual display.
These are ergonomic, work station design issues. They may be resolved by combining expectations based upon field research with our own field observations in an iterative manner.
3. Low cost.
4. New product potential. How adaptable and/or convenient is the cognitive task to incorporate into a "next generation" type of alertness device?
FEEDBACK OF DROWSINESS DETECTIONS
Humans employed as professionals are inherently self-correcting and self-protecting. Experienced locomotive engineers, as well as experienced commercial truck drivers have learned, through trial
24
and error, their fatigue signs and fatigue limits. They work to combat the onset and the effects of fatigue on their work performance.
In addition, a very large proportion of professionals who operate complex transportation equipment, such as trucks, buses, ships, and aircraft, take pride in performing their tasks efficiently and safely. Locomotive engineers are no different. This very large proportion (90% to 95%) will respond quite favorably to useful, accurate feedback concerning their state of drowsiness. This will be true especially once they are made aware that, like alcohol, drowsiness can impair cognitive functions imperceptibly. One nearly universal experience of this phenomenon is that of realizing suddenly that you have no memory of the last mile or two driven on the freeway. We do not realize our vulnerability until after the fact.
Our enhancement to the alerter feeds back objective data to the engineer concerning his or her abilities to pay attention to the environment, perceive a change, select an appropriate response, and respond quickly. We hypothesize that the feedback will help the engineer recognize and deal effectively with his or her performance impairment.
Experience suggests that most transportation professionals, provided with good feedback about their abilities to perform their tasks, will modify their behaviors somewhat to maintain good performance. For example, they may have one fewer beers after work, or get an extra hour of sleep before work. Thus, the engineer-feedback portion of the enhancement may become its strongest safety feature.
We had proposed to consider extending the feedback concerning engineer performance to other crew members, and examining their abilities to help the engineer counter an impairment. When drowsiness detections are fed back to persons other than the engineer, the engineer may perceive a real or imagined threat of reprisal or job loss. Consideration of this concept will be postponed until Phase 2.
LEARNING THE TASK
The candidate task combines aspects of choice reaction time and digit-symbol substitution tasks. Kennedy et al. (1990) reported that these tasks are learned to stability within three 3-minute trials containing very short, self-paced interstimulus intervals. We hypothesize that engineers will learn the candidate task easily in one or two exposures in the cab. We should characterize the shape of the learning curve in Phase 1 and Phase 2 pilot tests and in locomotive cabs in Phase 2.
CONTROLS AND DISPLAYS FOR THE CANDIDATE TASK
We have discussed the need for and uses of several controls and displays. They are specified more clearly here. First, there is the existing TS3. We will continue to use the TS3's audio and visual
25
ramps and full-power alerting functions. It will still be mounted near the engineer's line of sight. We will replace the manual reset button of the TS3 with the candidate task.
We proposed to specify one level each of signal complexity and signal conspicuity. Signal complexity components include shape and pattern. Signal conspicuity components include luminance, color and position.
The candidate task response buttons will be mounted in a box within easy reach of the seated engineer (15 to 20 in). The box will intercept the four outputs of the air manifold unit and five of the six electrical reset lines (it replaces the sixth, the manual button). The response buttons will be at least 1-in square or 1-in diameter, and the centers of the buttons will be separated by about 1 in.
The candidate task display will contain a blue-green number display, an amber warning light, and, perhaps, a green reward light. The display will be mounted near the locomotive windshield, within the instrument-track eye scan pattern of the engineer. The number symbol in the display will be at least 0.5 in high. The amber warning light and the green light will be about the same brightness as the 7-segment display, and will be at least 0.5 in high (or diameter).
TIME OF DAY CONCERNS
We must consider the effects of time of day upon the engineer's ability to perform the candidate task. Hildebrandt et al. (1974) examined time-of-day patterns in records of 2,238 emergency braking incidents caused by engineers failing to respond to the SIFA alerter mentioned earlier. There were two peaks of high incidence: one at 03:00 and one at 14:00. Kogi and Ohta (1975) found that 34 cases of near-accidents due to drowsiness, reported by engineers, were distributed such that 79% occurred between midnight and 06:00, with the greatest incidence between 04:00 and 06:00. There was a small, secondary peak from 14:00 to 18:00. This bi-modal daily pattern is also seen in automobile accidents (Mitler, 1989) and falling asleep at the wheel in automobiles (Prokop and Prokop, 1955).
The bi-modal pattern stems the effects of pacemakers in the brain which establish circadian (about one day) rhythms in human physiology and performance. The early morning hours before dawn and the early afternoon hours are when humans naturally become sleepy. They are also periods when humans are most likely to make errors at tasks requiring vigilance.
Knowing there will be daily periods during which performance at the candidate task will decline naturally, we considered whether we should compensate by making the task easier during those periods. Our answer was "No." Accident statistics tell us that those are the most dangerous times of the day. The candidate task will remain as stringent in its detection strategy during the two periods of expected drowsiness as during other periods of the day. We will be prepared to deal with higher incidences of drowsiness detections during those periods.
26
MAJOR MUSCLE GROUP INVOLVEMENT
The stretching of major muscle groups is known to stimulate the cortex of the brain. During a long automobile drive, stopping the car to walk around helps to offset drowsiness. Major muscle activity provides mild stimulation to the brain. We wished to consider incorporating at least one occasional response which required the engineer to stretch one or more major muscle groups. For example, the seated engineer would have to leave the seat to reach the response key.
However, the candidate task did not present much of an opportunity to locate a useful response panel distant from the engineer. We concluded that such considerations should be delayed until Phase 2.
CONCLUSIONS AND RECOMMENDATIONS
Engineer alerters have improved over the years. For example, one should not introduce a high probability of suddenly receiving noxious audio-visual stimuli into a work environment, especially a safety-sensitive work environment. Thus, the introduction of a cue such as the TS3 ramp, was appropriate.
However, the observations of Fruhstorfer et al. and the frequency of fatigue-related train accidents suggest that problems still exist. The two primary problems with alerters appear to be the relatively invariant interstimulus interval and the cognitive simplicity of the secondary task required of the engineer.
In response to the first problem, we recommend that unpredictability should be introduced into the TS3 system: a random-appearing inter-stimulus interval. The shape of the interval distribution should be reconsidered in Phase 2. The add-on device should sense train speed and decode it, determine the appropriate interstimulus interval, adjust the speed value to meet the interstimulus interval need, re-encode the speed signal, and transmit the new signal to the TS3.
In response to the second problem, we recommend that a simple, cognitive, secondary task be added to the TS3. It should have the following properties:
Reaction times should be captured for potential use in predicting periods of drowsiness.
Signal probability should not vary. All signals to the engineer should require a response.
Signal complexity should be minimal, though requiring at least some sequential/logical ("left brain") processing.
Signal conspicuity should resemble other engineer instrument displays.
A correct response should provide a reward, such as useful feedback, and an incorrect response should provide a penalty, such as a noxious stimulus.
27
A safety critical control operation should abort the secondary task. Thus, if the secondary task has begun and, subsequently, the automatic brake is moved, the task should reset immediately.
In Phase 2, we should determine the velocity (inches/sec) of hand movement, and perhaps the minimum distance of this hand movement, required to reset the TS3 using the automatic brake.
If a non-safety-critical control operation is required after the beginning of the secondary task, the engineer should accomplish it before or after responding to the secondary task, as desired.
The cognitive task should be designed so the real intrusion into the primary task was not much greater than with the TS3. Thus, the total reaction time required for the enhanced system should be very little more than for the present TS3.
The enhanced TS3 should be presented to engineers during training such that they perceive the increase as negligible. A Phase 2 objective should be the quantitative estimation of engineers' subjective work load perceptions for the TS3 and the enhanced device.
One of the values the modified system should offer is the capability to feed back information concerning engineer performance.
The cognitive task should not allow automatic responding by a drowsy engineer.
After reviewing several retrofittable options for adding a cognitive task to the TS3, we settled on a 2-trial, 4-choice reaction time task. For that candidate task, we recommend the following:
The two responses (after detecting the presence of the first digit displayed) should be completed in less than 2 sec by an alert engineer, not involved in another control operation.
All response times should be transformed to reciprocals prior to statistical processing.
An expected distribution of response times for response 2 should be established.
The expected distribution should reflect the acceptable ranges and means of response times.
The distribution should be represented by a set of 25 scores.
The expected distribution should be loaded into memory each time the locomotive speed falls to zero, and the locomotive stops.
28
The second response time should not be allowed to be shorter than 0.100 sec and no longer than 10 sec.
If a score falls outside these bounds, 0.100 to 10 sec, it should not replace the last score in the set.
The second-response-time criterion value should not be allowed to decline across time. Thus, the criterion value should be stored only if it represents a faster response time than the value stored there already.
The TS3 ramp and the candidate task should start around the same time. The lag or lead time should be an external variable which should be manipulated in pilot studies and in Phase 2.
Drowsiness detection errors should be rare and meaningful: false positive detections of engineer drowsiness will not be appreciated or useful.
The exclusion of the first response from the warning categories should reduce the possibility of false positive detections of drowsiness.
We could reward the engineer for fast first responses by lengthening the interstimulus interval, reducing the total work demand from the secondary task. This should be an issue for Phase 2 and beyond.
PROPOSED PHASE 2 WORK
Tentative objectives for Phase 2 include the following, not in any particular order:1. Fielding of perhaps 10 functional prototypes.2. Final report.3. Demonstrations to FRA and NTSB.4. Demonstrations to potential customers.5. Data acquisition for the Government report.6. Data acquisition for marketing.7. Specifications of low-cost retrofit and higher cost replacement models.8. Brief pilot tests with locomotive engineers at the bench-top, in a simulator and in the
field.
Based upon the Government's estimated contract award date and the expenditure of about two man-years of effort, the Phase 2 effort would run from mid-January 1994 through mid-December 1994.
We proposed to construct a functional prototype of an add-on device during Phase 1, and to test it during Phase 2. Some potential tasks for Phase 2 include the following.

29
Task 1. Bench-top Tests.
Objectives:1. Estimate user acceptance of displays, controls and procedures.2. Estimate sensitivity to fatigue.
Tools:VisualBasic simulation, desktop environment.
Expected results:1. Data from non-engineer and engineer subjects.2. Modifications of software and hardware specifications for functional prototype.
Specific questions:1. What is the shape of the learning curve for locomotive engineers?2. What are engineers initial reactions to the task?
Task 2. Simulation Studies.
Objectives:1. Observe interactions with normal and emergency operations.2. Estimate sensitivity to fatigue in near-operational setting.
Tools:First-cut controls and displays, operated by hidden laptop computer.
Expected results:1. Data from non-engineer and engineer subjects.2. Modifications of software and hardware specifications for functional prototype and
its interactions with locomotive controls.
Specific questions:1. What is the shape of the learning curve?2. Should at least one occasional response which requires the engineer to stretch one or
more major muscle groups be included?3. What do the response times and accuracies look like in a pseudo-operational setting,
with a simulated primary task?4. How sensitive is the task to fatigue? What is its accuracy?5. How acceptable is the task to engineers: procedures, controls, and displays?
Task 3. Development of Functional Prototypes for Field Deployment.

30
Objective: Design, build and modify functional prototype(s) of low-cost, retrofittable add-on to the TS3, with random interstimulus intervals and a cognitive secondary task.
Schedule: Concurrent with benchtop and simulator studies.
Specific questions:1. Will the low-cost retrofit will be enhanced only with the cognitive task, and will the
introduction of the pseudo-random interstimulus interval will have to occur in an optional, higher-cost retrofit?
Task 4. Field Studies.
Objectives:1. Observe interactions with normal and emergency operations.2. Measure user acceptance.
Tools:Functional prototype.
Expected results:Modifications of software and hardware specifications for functional prototype and its interactions with locomotive controls.
Specific questions:1. Determine the velocity (inches/sec) of hand movement, and perhaps the minimum
distance of this hand movement, required to reset the TS3 using the automatic brake. 2. What are the alerting qualities of the TS3?3. Should feedback concerning engineer performance be extended to other crew
members?4. Should at least one occasional response which requires the engineer to stretch one or
more major muscle groups be included?5. What do the response times and accuracies look like in an operational setting, with a
real primary task?6. How acceptable is the task to engineers: procedures, controls, and displays?
General questions for all Phase 2 tasks:
1. What is the shape of the interval distribution?
2. What is the quantitative estimation of engineers' subjective work load perceptions for the TS3 and the enhanced device?
31
3. What is the appropriate lag or lead time for the task and the start of the TS3 ramp?
4. Should we reward the engineer for fast first responses by lengthening the interstimulus interval, reducing the total work demand from the secondary task?
The appendices to this report include:List of possible TS3 enhancements (Appendix A);Reviews by Miller and Yerkes of mocked-up tasks (Appendix B);Draft overview of how the candidate task might be programmed (Appendix C);Draft default response time distribution for the candidate task (Appendix D);Summary of human factors tasks completed for this project (Appendix E); andPilot study data for task 7-2, the mock up of the candidate task (Appendix F).

32
One consultant scheduled to work on this project was Dr. Robert R. Mackie. Dr. Mackie was probably the foremost authority in the world on the maintenance of human vigilance in transportation operations. We were terribly saddened to learn that Dr. Mackie passed away January 31, 1993. Unfortunately, Dr. Mackie was not able to complete any work on the project.
33
REFERENCES
Allen RW, Stein AC, Miller JC. Performance Testing as a Determinant of Fitness for Duty. Technical Paper 901870, Society of Automotive Engineers, Warrendale, PA, 1990.
Anderson JH Jr, Wood RE, Justice DL, Bracey KE, Bolden ED, Krause DG, Lee DK, Zbylski FM. Railroad Safety: Engineer Work Shift Length and Schedule Variability (GAO/RCED-92-133). U.S. General Accounting Office, Washington DC, April 1992.
Barwell FT. Safety and automation on electric and diesel motor power units. Bulletin International Railway Congress Assoc., 39:952-970, 1962.
Bjerner B, Holm A, Swenson A. Diurnal variation in mental performance: A study of three-shift workers, Brit. J. Industrial Medicine 12:103-110, 1955.
Browne RC. The day and night performance of teleprinter switchboard operators, Occupational Psychology 23:1-6, 1949.
Dinges DF. Probing the limits of functional capability: the effects of sleep loss on short-duration tasks. In RJ Broughton, RD Ogilvie (ed.), Sleep, Performance, and Arousal, Boston, Birkhaüser, 1992.
Dinges DF, Graeber RC, Connell LJ, Rosekind MR, and Powell JW. Fatigue-related reaction time performance in long-haul flight crews. Sleep Research 1990; 19:117.
Dinges DF, and Kribbs NB. Performing while sleepy: effects of experimentally-induce sleepiness. Pages 97-127 in TH Monk (ed), Sleep, Sleepiness and Performance, John Wiley and Sons, 1991.
Dinges DF, Orne MT, Whitehouse WG, Orne EC. Temporal placement of a nap for alertness: contributions of circadian phase and prior wakefulness. Sleep, 10(4):313-329, 1987.
Fernandez EA. Evolution of Locomotive Engineer Alertness Devices. Presented at the Air Brake Association Annual Technical Conference, Chicago IL, September 1984.
Fruhstorfer H, Langanke P, Meinzer K, Peter JH. Neurophysiological vigilance indicators and operational analysis of a train vigilance monitoring device: a laboratory and field study. In RR Mackie (ed.), Vigilance: Theory, Operational Performance, and Physiological Correlates, New York, Plenum Press, 1977.
Graeber RC, Rosekind MR, Connell LJ, Dinges DF. Cockpit napping. ICAO Journal, pp. 6-10, October 1990.
Hildebrandt G, Rohmert W, and Rutenfranz J. 12 & 24 H rhythms in error frequency of locomotive drivers and the influence of tiredness. Int. J. Chronobiol. 1974; 2:175-180.
Kennedy RS, Wilkes RL, Baltzley DR, Fowlkes JE. Development of Microcomputer-Based Mental Acuity Tests for Repeated Measures Studies. Final Report, NASA Contract NAS9-17326, 25 January 1990 (NASA-CR-185607).
Klein M. The Railroader's Handbook. Lincoln, NE: SynchroTech (for Union Pacific Railroad), 1990.
Kogi K, and Ohta T. Incidence of near accidental drowsing in locomotive driving during a period of rotation. J. Human Ergology. 1975; 4:65-76.
Kolstad JL. Safety Recommendation (R-91-23 through -26). Letter from JL Kolstad, Chairman, National Transportation Safety Board, to GC Carmichael, Administrator, Federal Railroad Administration, 16 September 1991.
34
Miller JC, and Mackie RR. Vigilance research and nuclear security: critical review and potential applications to security guard performance. Goleta, CA: Human Factors Research, Inc. (HFR-TR-2722), 1980. Also, Gaithersburg MD: National Bureau of Standards (Contract NBR-GCR-80-201), 1980.
Mitler MM. Two-peak patterns in sleep, mortality and error. Proc. Int'l. Sympos. on Sleep and Health Risk, Springer-Verlag, 1989.
O'Hanlon JF, and Kelley GR. Comparison of performance and physiological changes between drivers who perform well and poorly during prolonged vehicular operation. Pages 87-110 in RR Mackie (ed), Vigilance: Theory, Operational Performance, and Physiological Correlates. New York: Plenum Press, 1977.
Prokop O, Prokop L. Ermudung und einschlafen am steuer. Zeitschrift für Gerichtliche Medizin, 44:343-355, 1955.
Rechtschaffen A, Kales A (ed.). A Manual of Standardized Terminology, Techniques and Scoring System for Sleep Stages of Human Subjects. Bethesda MD, U.S. Dept. Health, Education and Welfare, 1968
Rolfe JM. The secondary task as a measure of mental load. In WT Singleton, JG Fox, D Whitfield (ed.), Measurement of Man at Work, London, Taylor & Francis Ltd., 1971.
Thorne DR, Genser SG, Sing HC, Hegge FW. The Walter Reed Performance Assessment Battery. Neurobehavioral Toxicology & Teratology, 7:415-418, 1985.
Wilkinson RT, and Houghton D. Field test of arousal: a portable reaction timer with data storage. Human Factors 1982; 24(4):487-493.
Williams HL, Lubin A, and Goodnow JJ. Impaired performance with acute sleep loss. Psychological Monographs 1959; 73(14, 484):1-26.

A-1
APPENDIX A: LIST OF POTENTIAL TS3 MODIFICATIONS
1. One single digit display, 10 numbered (0-9) push button keypad. A random number would be displayed and the engineer would push the corresponding button. This would provide "unalerted" reaction time data. Immediately, a second random number would be displayed. The engineer would respond again, providing an "alerted" reaction time.
2. TS3 embedded Visual Display (alarm) and normal reset button. Visual display comes "on" at full brightness. Display blinks "off" momentarily and randomly. To reset the system the engineer would have to push the reset button when the display is "off" and release it when the display is "on". The engineer has a time limit in which to get the system reset otherwise a brake application ensues.
3. Single LED and normal reset button. Same as #2, but separate LED is used instead of the embedded Visual Display.
4. Two single digit displays ("target digit" & "match digit") and the normal reset button. The target digit displays a random number and the engineer would have to match the digit by pushing the reset button (either single push or steady).
5. Two single digit displays ("target digit" & "match digit") and three push buttons ("up", "down" & "match"). The target digit displays a random number and the match digit starts by displaying a random number. The engineer would have to push the up and down push buttons until the match digit is the same as the target digit then the engineer would push the match push button.
6. One single digit and the normal reset button. The engineer would have to bring the random digit to zero by keeping the reset button pressed and releasing it within a certain time limit after zero appears. The single digit could also randomly count up or down for farther alertness demand.
7. One single digit display and four numbered (1-4) push buttons. A random number would be displayed and the engineer would push the corresponding button.
8. Three LED's and three push buttons. The engineer would have to match random LED patterns by pushing associated button(s).
9. Four directional arrow indicators and a joystick or set of four directional push buttons. The
engineer would have to point the joystick or press push buttons in the direction indicated by the arrows.
10. One single digit display and the normal reset button. The single digit display would continuously cycle through the possible numbers (0-9) ascending or (9-0) descending order.
A-2
The engineer would have to push the reset button when the display shows (0). The digit scanning stops on the number that was displayed when the reset button was pressed providing performance feedback to the engineer. The closer the digit is to (0) the better the performance.
11. Two single digit displays ("target digit" & "scanning digit") and the normal reset button. The scanning digit display would continuously cycle through the possible numbers (0-9) ascending or (9-0) descending order. The engineer would have to push the reset button when the scanning digit display matches the target digit display. The scanning digit stops on the number that was displayed when the reset button was pressed providing performance feedback to the engineer. The closer the digit is to the target number the better the performance.
12. One two-digit display and the normal reset button. The single digit display would continuously cycle through the possible numbers (0-99) ascending or (99-0) descending order. The engineer would have to push the reset button when the display shows (00). The digit scanning stops on the number that was displayed when the reset button was pressed providing performance feedback to the engineer. The closer the digit is to (00) the better the performance. With two scanning digits the number could be scanned at a faster rate and a higher resolution for performance assessment would be provided.
13. Two 2-digit displays ("target digits" & "scanning digits") and the normal reset button. The scanning digit display would continuously cycle through the possible numbers (0-99) ascending or (99-0) descending order. The engineer would have to push the reset button when the scanning digit display matches the target digit display. The scanning digit stops on the number that was displayed when the reset button was pressed providing performance feedback to the engineer. The closer the digit is to the target number the better the performance. With two scanning digits the number could be scanned at a faster rate and a higher resolution for performance assessment would be provided.
Failure or warning and "good performance" indicators can be added to each of the above tasks to provide performance assessment (visual feedback) to the engineer.
The above tasks are all single-trial tasks. Each task could be repeated a second time to make 2-trial tasks.
B-1
APPENDIX B: REVIEWS OF TASK MOCK-UPS
Assessment by Dr. Miller of Task Simulations
Task 3. Single LED and normal reset button. For Task 3-1, press the reset button when the light is on. For Task 3-2, also the release button when the light is off.
Cognitive aspects: Task 3-1 is a "simple reaction time" test. Psychologists generally think of "simple reaction time" and simple "spatial resolution" tasks as being less-than-cognitive in nature. Thus, it probably would be unresponsive to the NTSB suggestion to FRA to "research the feasibility of a ...system that requires cognitive responses..." (16 Sep 91).
Task 3-2 adds a requirement for some timing abilities, since the LED is flashing on a regular cycle. This is still a less-than-cognitive function.
Secondary task aspects:Task 3-1:
Cue = light is blinking. Stimulus = light on. Button press gives "simple reaction time."
Task 3-2:Cue = light is blinking. Stimulus 1 = light on. Button press gives "simple reaction time."Stimulus 2 = light off. Button release gives a timing-related reaction time.
Note that the "simple reaction time" test which is known to be sensitive to fatigue, the Psychomotor Vigilance Task (PVT), operates as a primary task, not as a secondary task. Acquiring a simple reaction time from a secondary task requires a "cue." The cued (second) reaction time will be brief and will have low variability. The cued reaction time will offer little in the way of predictability of failures in alertness. Primarily, it will give a "mobilized, alerted reaction time".
[A cleaner (psychologically) form of simple reaction time task would be the degradation of task 7-2, removing its numeric content. Thus, an LED would come on, the engineer would hit the normal reset button, then the LED would come on again, and the engineer would hit the normal reset button again. Again, the cued, second reaction time would be quite short and invariant, and thus quite useless for the detection of impending engineer failure.]
Task 7-2. Single digit display and four push buttons. Respond to a random (1-4) number by pushing the appropriate (1 through 4) button.
Cognitive aspects: This is a 4-choice, 2-trial reaction time test. It requires simple numeric processing, a low level form of cognitive demand ("left brain").
B-2
Secondary task aspects:Cue = First number. Correct button press signals "ready."Stimulus = Second number. Button press gives cued reaction time and response
accuracy.
The numeric processing requirement will make the cued, second reaction time longer than a simple reaction time and will increase the variability of reaction times. The increased variability will provide the opportunity to detect impending engineer alertness failures.
The total time devoted to both the first and second responses should be less than one second, providing a small, acceptable level of distraction from the primary task.
The display and buttons should be implemented in a manner similar to other in-cab displays and buttons.
Note that an approach using multiple responses (up to 4) on the normal reset button in place of a single response on one of four individual buttons would be aversive to the user. The 4-individual-button approach (as now in task 7-2) will be acceptable.
Note that the 4-button version, with non-recreated digits, gives 0.25 x 0.33 = 0.0825 (< 10%) probability of a random correct response. A 3-button version would give a 0.33 x 0.50 = 0.165 (> 10%) probability of a random correct response. Four or more buttons are needed to keep the probability of random correct responses acceptably low.
Note that if the cue were to be constant, for example zero, only the second response probability would control the random correct response probability, i.e., the random correct response probability for a 4-choice task would rise to 25%. The "cue" serves more than just one purpose -- it not only attracts the engineer's attention, it also requires a correct numeric cognitive process. If the engineer cannot respond correctly to this initial cue, we may have evidence that the engineer is becoming impaired.
Task 7-1. A single-response version of task 7-2.
Cognitive aspects: This is an uncued, 4-choice reaction time test. It requires simple numeric processing, a low level form of cognitive demand ("left brain").
Secondary task aspects:Stimulus = a number. Correct button press gives uncued reaction time and response accuracy.
The uncued reaction time will vary as a function of fatigue and as a function of distraction by the primary task. We will not know which factor has delayed the engineer's response to the stimulus.
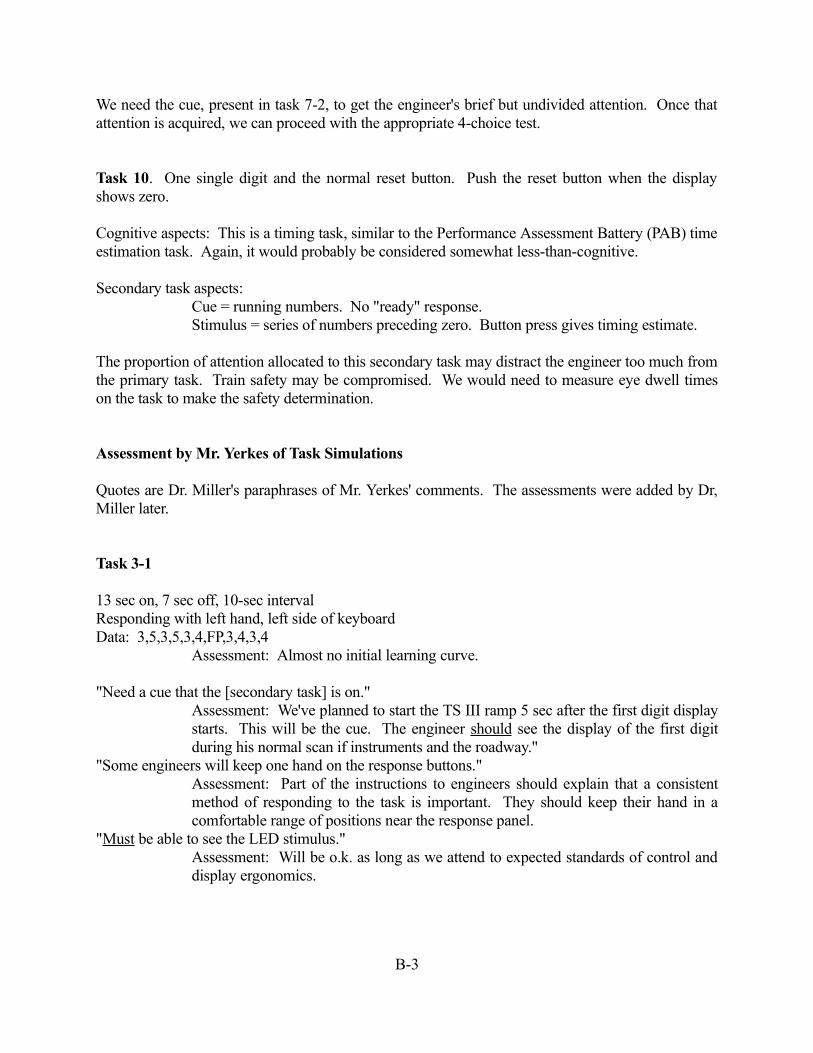
B-3
We need the cue, present in task 7-2, to get the engineer's brief but undivided attention. Once that attention is acquired, we can proceed with the appropriate 4-choice test.
Task 10. One single digit and the normal reset button. Push the reset button when the display shows zero.
Cognitive aspects: This is a timing task, similar to the Performance Assessment Battery (PAB) time estimation task. Again, it would probably be considered somewhat less-than-cognitive.
Secondary task aspects:Cue = running numbers. No "ready" response.Stimulus = series of numbers preceding zero. Button press gives timing estimate.
The proportion of attention allocated to this secondary task may distract the engineer too much from the primary task. Train safety may be compromised. We would need to measure eye dwell times on the task to make the safety determination.
Assessment by Mr. Yerkes of Task Simulations
Quotes are Dr. Miller's paraphrases of Mr. Yerkes' comments. The assessments were added by Dr, Miller later.
Task 3-1
13 sec on, 7 sec off, 10-sec intervalResponding with left hand, left side of keyboardData: 3,5,3,5,3,4,FP,3,4,3,4
Assessment: Almost no initial learning curve.
"Need a cue that the [secondary task] is on."Assessment: We've planned to start the TS III ramp 5 sec after the first digit display starts. This will be the cue. The engineer should see the display of the first digit during his normal scan if instruments and the roadway."
"Some engineers will keep one hand on the response buttons."Assessment: Part of the instructions to engineers should explain that a consistent method of responding to the task is important. They should keep their hand in a comfortable range of positions near the response panel.
"Must be able to see the LED stimulus."Assessment: Will be o.k. as long as we attend to expected standards of control and display ergonomics.
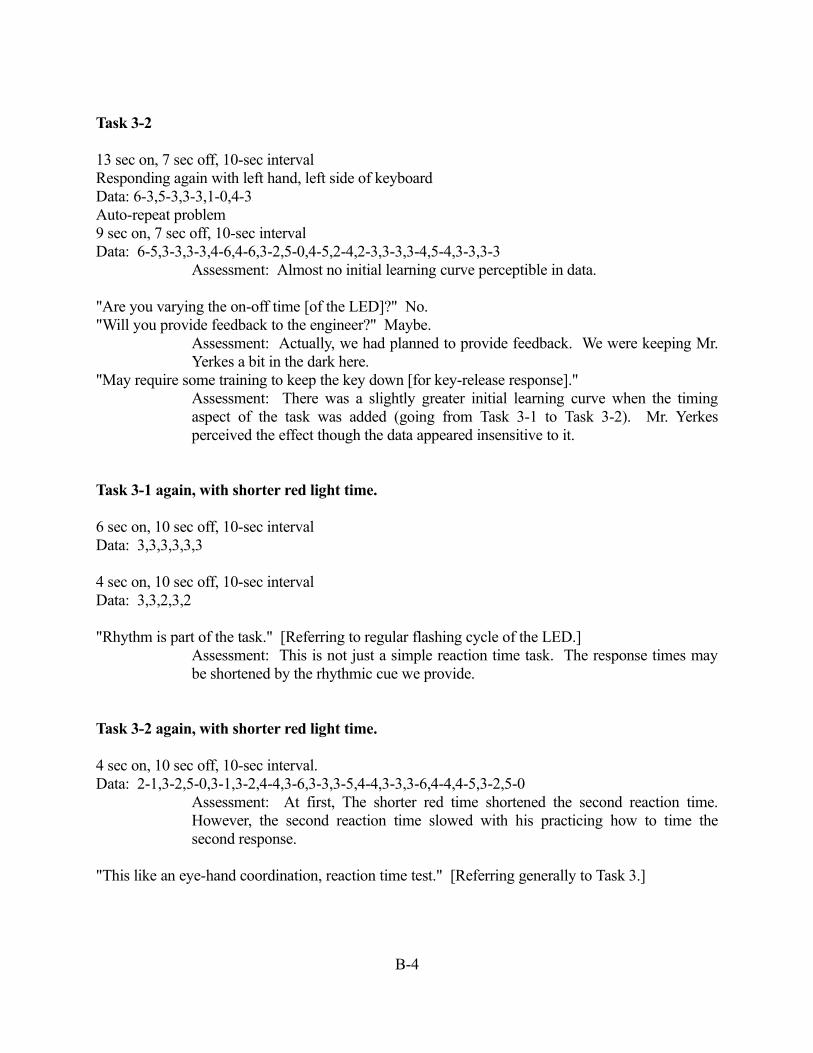
B-4
Task 3-2
13 sec on, 7 sec off, 10-sec intervalResponding again with left hand, left side of keyboardData: 6-3,5-3,3-3,1-0,4-3Auto-repeat problem9 sec on, 7 sec off, 10-sec intervalData: 6-5,3-3,3-3,4-6,4-6,3-2,5-0,4-5,2-4,2-3,3-3,3-4,5-4,3-3,3-3
Assessment: Almost no initial learning curve perceptible in data.
"Are you varying the on-off time [of the LED]?" No."Will you provide feedback to the engineer?" Maybe.
Assessment: Actually, we had planned to provide feedback. We were keeping Mr. Yerkes a bit in the dark here.
"May require some training to keep the key down [for key-release response]."Assessment: There was a slightly greater initial learning curve when the timing aspect of the task was added (going from Task 3-1 to Task 3-2). Mr. Yerkes perceived the effect though the data appeared insensitive to it.
Task 3-1 again, with shorter red light time.
6 sec on, 10 sec off, 10-sec intervalData: 3,3,3,3,3,3
4 sec on, 10 sec off, 10-sec intervalData: 3,3,2,3,2
"Rhythm is part of the task." [Referring to regular flashing cycle of the LED.]Assessment: This is not just a simple reaction time task. The response times may be shortened by the rhythmic cue we provide.
Task 3-2 again, with shorter red light time.
4 sec on, 10 sec off, 10-sec interval.Data: 2-1,3-2,5-0,3-1,3-2,4-4,3-6,3-3,3-5,4-4,3-3,3-6,4-4,4-5,3-2,5-0
Assessment: At first, The shorter red time shortened the second reaction time. However, the second reaction time slowed with his practicing how to time the second response.
"This like an eye-hand coordination, reaction time test." [Referring generally to Task 3.]
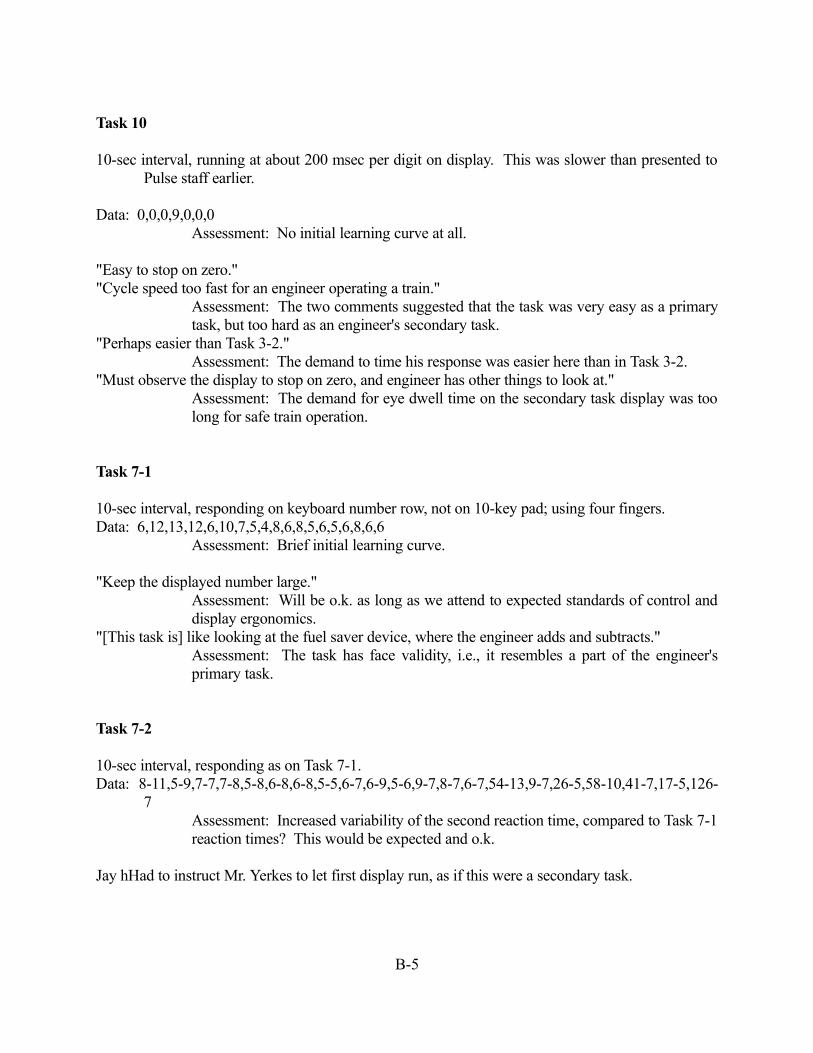
B-5
Task 10
10-sec interval, running at about 200 msec per digit on display. This was slower than presented to Pulse staff earlier.
Data: 0,0,0,9,0,0,0Assessment: No initial learning curve at all.
"Easy to stop on zero.""Cycle speed too fast for an engineer operating a train."
Assessment: The two comments suggested that the task was very easy as a primary task, but too hard as an engineer's secondary task.
"Perhaps easier than Task 3-2." Assessment: The demand to time his response was easier here than in Task 3-2.
"Must observe the display to stop on zero, and engineer has other things to look at."Assessment: The demand for eye dwell time on the secondary task display was too long for safe train operation.
Task 7-1
10-sec interval, responding on keyboard number row, not on 10-key pad; using four fingers.Data: 6,12,13,12,6,10,7,5,4,8,6,8,5,6,5,6,8,6,6
Assessment: Brief initial learning curve.
"Keep the displayed number large."Assessment: Will be o.k. as long as we attend to expected standards of control and display ergonomics.
"[This task is] like looking at the fuel saver device, where the engineer adds and subtracts."Assessment: The task has face validity, i.e., it resembles a part of the engineer's primary task.
Task 7-2
10-sec interval, responding as on Task 7-1.Data: 8-11,5-9,7-7,7-8,5-8,6-8,6-8,5-5,6-7,6-9,5-6,9-7,8-7,6-7,54-13,9-7,26-5,58-10,41-7,17-5,126-
7Assessment: Increased variability of the second reaction time, compared to Task 7-1 reaction times? This would be expected and o.k.
Jay hHad to instruct Mr. Yerkes to let first display run, as if this were a secondary task.
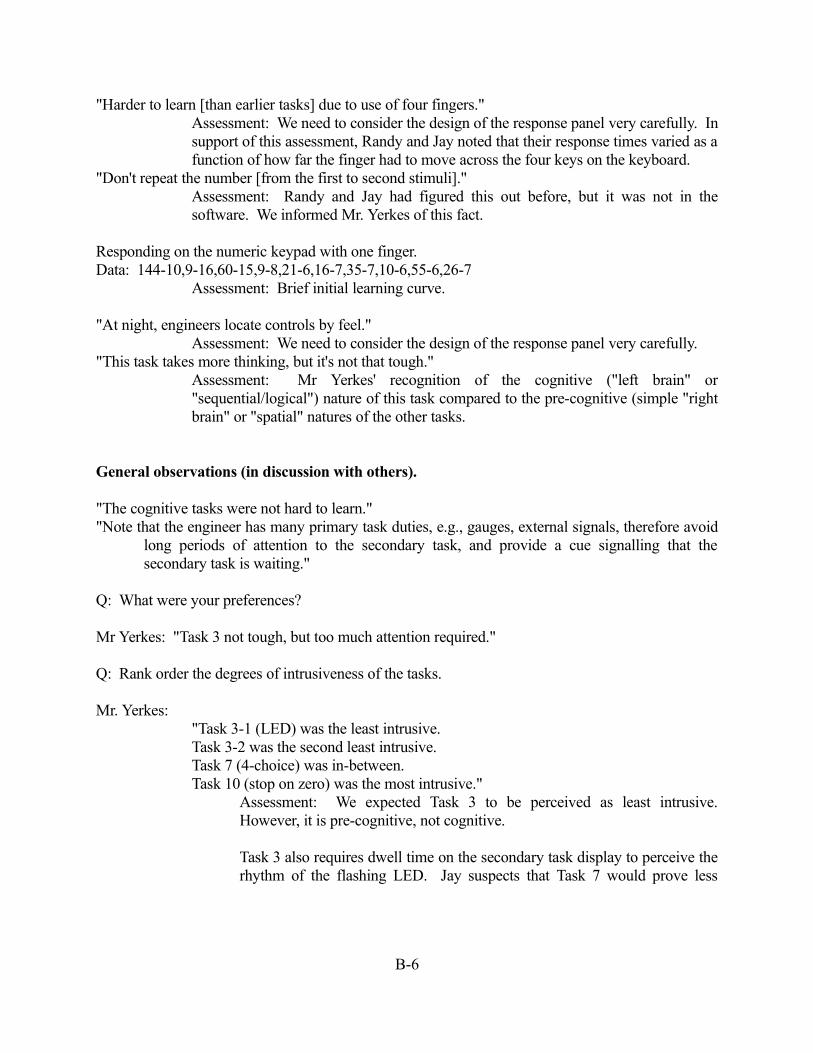
B-6
"Harder to learn [than earlier tasks] due to use of four fingers."Assessment: We need to consider the design of the response panel very carefully. In support of this assessment, Randy and Jay noted that their response times varied as a function of how far the finger had to move across the four keys on the keyboard.
"Don't repeat the number [from the first to second stimuli]."Assessment: Randy and Jay had figured this out before, but it was not in the software. We informed Mr. Yerkes of this fact.
Responding on the numeric keypad with one finger.Data: 144-10,9-16,60-15,9-8,21-6,16-7,35-7,10-6,55-6,26-7
Assessment: Brief initial learning curve.
"At night, engineers locate controls by feel."Assessment: We need to consider the design of the response panel very carefully.
"This task takes more thinking, but it's not that tough."Assessment: Mr Yerkes' recognition of the cognitive ("left brain" or "sequential/logical") nature of this task compared to the pre-cognitive (simple "right brain" or "spatial" natures of the other tasks.
General observations (in discussion with others).
"The cognitive tasks were not hard to learn.""Note that the engineer has many primary task duties, e.g., gauges, external signals, therefore avoid
long periods of attention to the secondary task, and provide a cue signalling that the secondary task is waiting."
Q: What were your preferences?
Mr Yerkes: "Task 3 not tough, but too much attention required."
Q: Rank order the degrees of intrusiveness of the tasks.
Mr. Yerkes:"Task 3-1 (LED) was the least intrusive.Task 3-2 was the second least intrusive.Task 7 (4-choice) was in-between.Task 10 (stop on zero) was the most intrusive."
Assessment: We expected Task 3 to be perceived as least intrusive. However, it is pre-cognitive, not cognitive.
Task 3 also requires dwell time on the secondary task display to perceive the rhythm of the flashing LED. Jay suspects that Task 7 would prove less
B-7
intrusive that Task 3 in a direct comparison during train operations, after both tasks are over-learned.
Q: Rank order the face validities of the tasks.
Mr. Yerkes:"Task 3 had the highest face validity.Tasks 7 and 10 were less valid.Task 7 was more valid than Task 10."
Assessment: While observing the tasks, Mr. Yerkes noted face validity for Task 7 but not for the other tasks. The discrepancy between the rank order here and that earlier remark was not pursued. However, it appears that Task 7 is reasonably valid with respect to engineer primary duties.
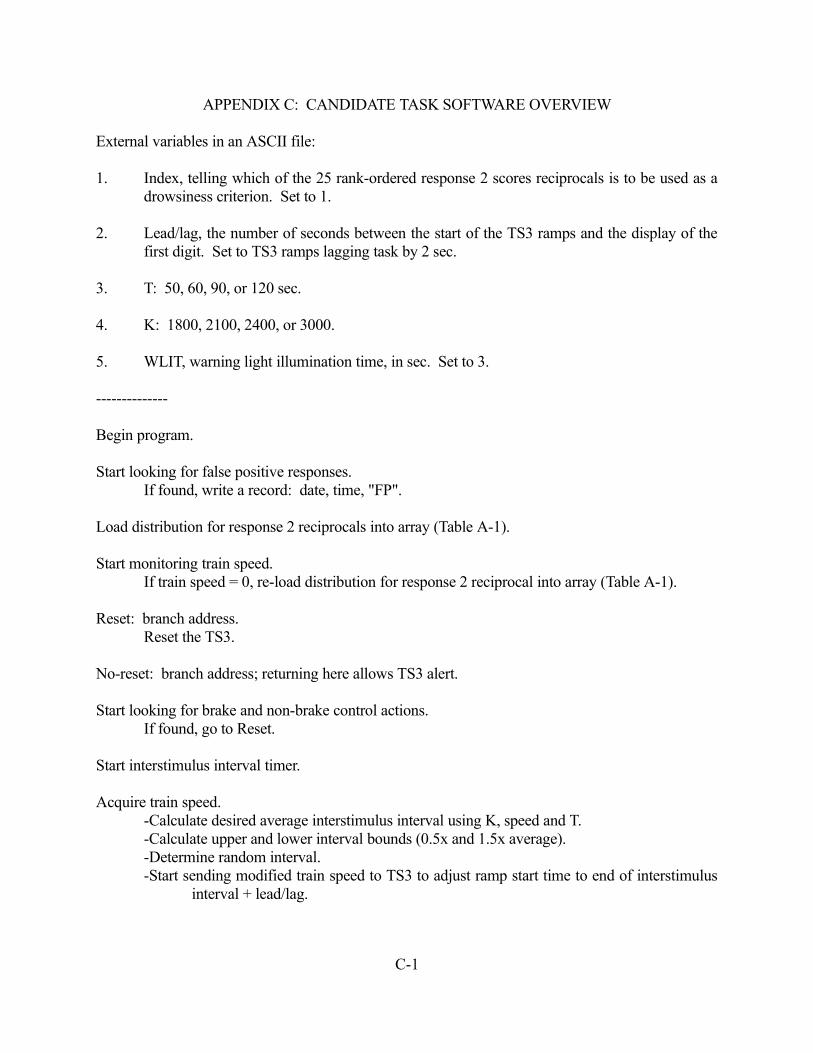
C-1
APPENDIX C: CANDIDATE TASK SOFTWARE OVERVIEW
External variables in an ASCII file:
1. Index, telling which of the 25 rank-ordered response 2 scores reciprocals is to be used as a drowsiness criterion. Set to 1.
2. Lead/lag, the number of seconds between the start of the TS3 ramps and the display of the first digit. Set to TS3 ramps lagging task by 2 sec.
3. T: 50, 60, 90, or 120 sec.
4. K: 1800, 2100, 2400, or 3000.
5. WLIT, warning light illumination time, in sec. Set to 3.
--------------
Begin program.
Start looking for false positive responses.If found, write a record: date, time, "FP".
Load distribution for response 2 reciprocals into array (Table A-1).
Start monitoring train speed.If train speed = 0, re-load distribution for response 2 reciprocal into array (Table A-1).
Reset: branch address.Reset the TS3.
No-reset: branch address; returning here allows TS3 alert.
Start looking for brake and non-brake control actions.If found, go to Reset.
Start interstimulus interval timer.
Acquire train speed.-Calculate desired average interstimulus interval using K, speed and T.-Calculate upper and lower interval bounds (0.5x and 1.5x average).-Determine random interval.-Start sending modified train speed to TS3 to adjust ramp start time to end of interstimulus
interval + lead/lag.
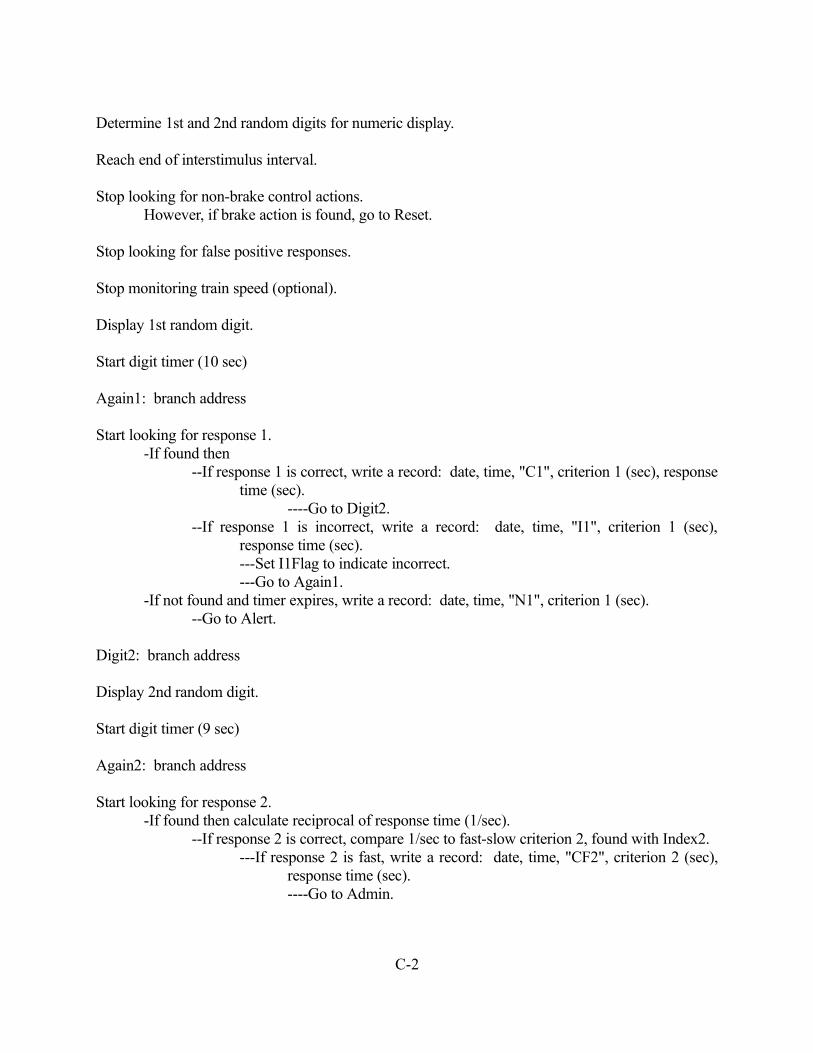
C-2
Determine 1st and 2nd random digits for numeric display.
Reach end of interstimulus interval.
Stop looking for non-brake control actions.However, if brake action is found, go to Reset.
Stop looking for false positive responses.
Stop monitoring train speed (optional).
Display 1st random digit.
Start digit timer (10 sec)
Again1: branch address
Start looking for response 1.-If found then
--If response 1 is correct, write a record: date, time, "C1", criterion 1 (sec), response time (sec).
----Go to Digit2.--If response 1 is incorrect, write a record: date, time, "I1", criterion 1 (sec),
response time (sec).---Set I1Flag to indicate incorrect.---Go to Again1.
-If not found and timer expires, write a record: date, time, "N1", criterion 1 (sec).--Go to Alert.
Digit2: branch address
Display 2nd random digit.
Start digit timer (9 sec)
Again2: branch address
Start looking for response 2.-If found then calculate reciprocal of response time (1/sec).
--If response 2 is correct, compare 1/sec to fast-slow criterion 2, found with Index2.---If response 2 is fast, write a record: date, time, "CF2", criterion 2 (sec),
response time (sec).----Go to Admin.
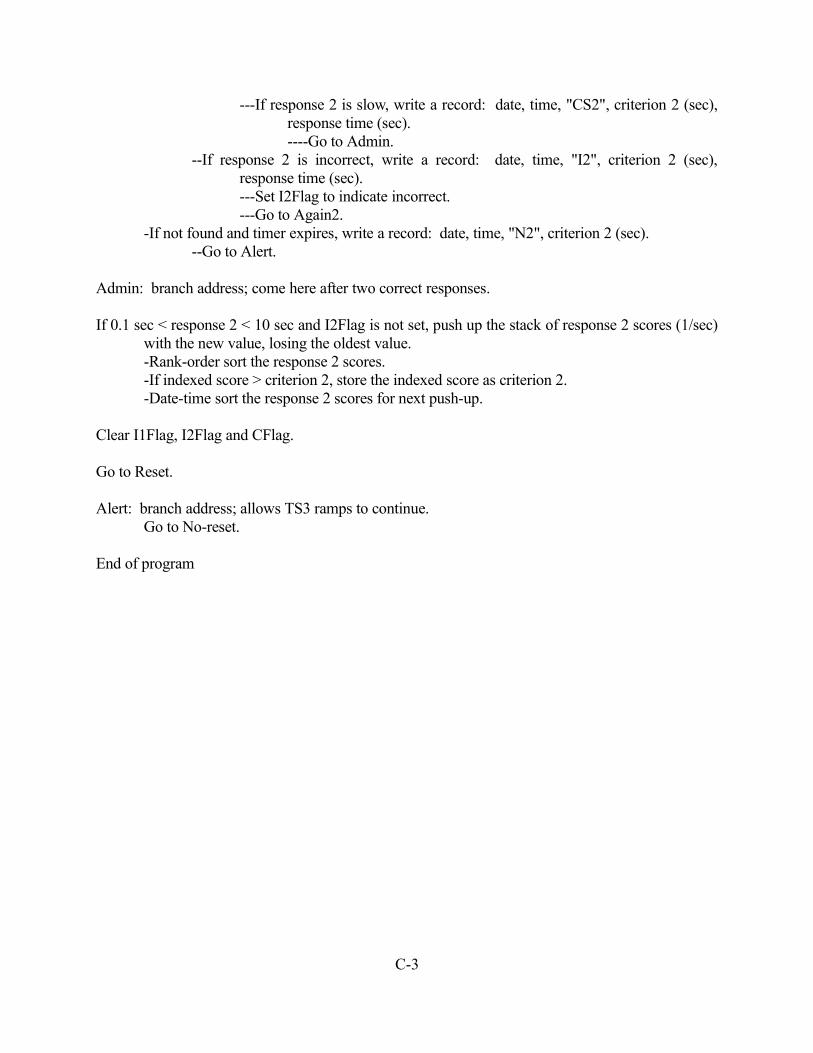
C-3
---If response 2 is slow, write a record: date, time, "CS2", criterion 2 (sec), response time (sec).----Go to Admin.
--If response 2 is incorrect, write a record: date, time, "I2", criterion 2 (sec), response time (sec).---Set I2Flag to indicate incorrect.---Go to Again2.
-If not found and timer expires, write a record: date, time, "N2", criterion 2 (sec).--Go to Alert.
Admin: branch address; come here after two correct responses.
If 0.1 sec < response 2 < 10 sec and I2Flag is not set, push up the stack of response 2 scores (1/sec) with the new value, losing the oldest value.-Rank-order sort the response 2 scores.-If indexed score > criterion 2, store the indexed score as criterion 2.-Date-time sort the response 2 scores for next push-up.
Clear I1Flag, I2Flag and CFlag.
Go to Reset.
Alert: branch address; allows TS3 ramps to continue.Go to No-reset.
End of program

D-1
APPENDIX D: CANDIDATE TASK RESPONSE TIME FILE
The first-draft contents of the file containing the expected distribution of response time reciprocals for response 2 are shown in Figure D-1, column 2. The Table contents were produced by setting the minimum response time at 0.100 sec, the mean response time at 0.500 sec, and the maximum acceptable response time at 1.0 sec. Then, the data for values 2 through 12 and 14 through 24 were filled in as linear interpolations. Finally, the reciprocals were placed in column 2. The file also should hold the last criterion score. The initial criterion value here would be (1 1.000 sec =) 1.0.
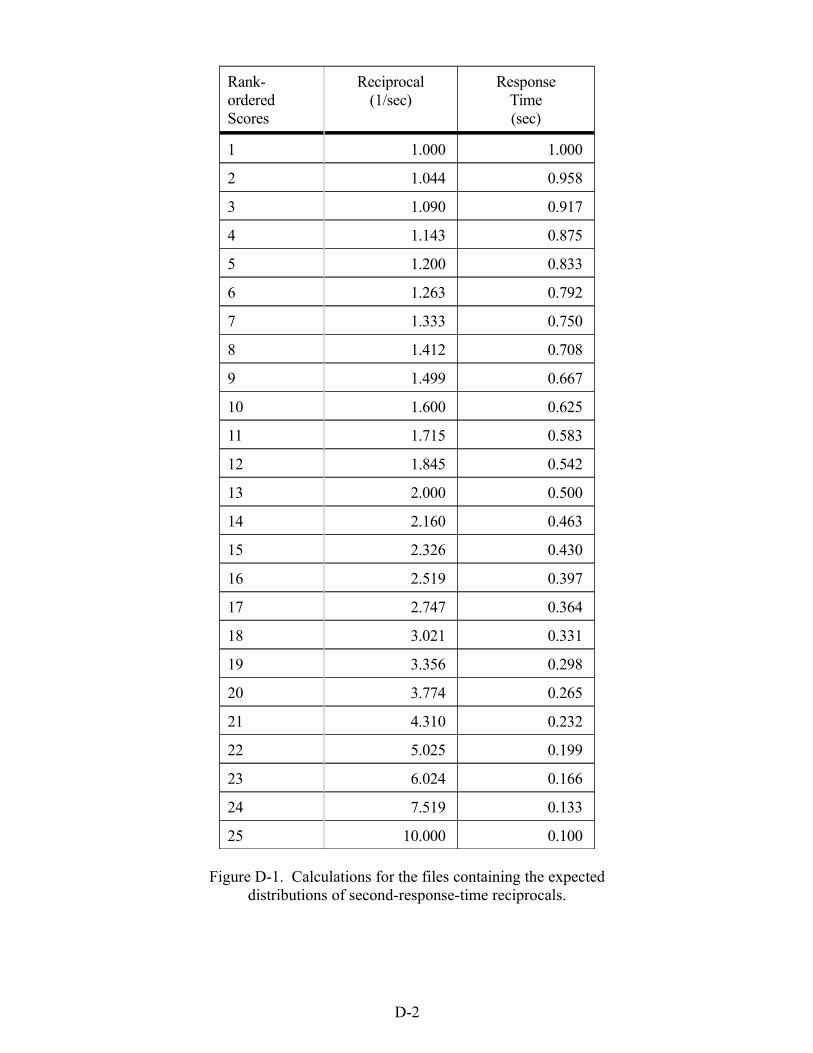
D-2
Rank-orderedScores
Reciprocal(1/sec)
ResponseTime(sec)
1 1.000 1.000
2 1.044 0.958
3 1.090 0.917
4 1.143 0.875
5 1.200 0.833
6 1.263 0.792
7 1.333 0.750
8 1.412 0.708
9 1.499 0.667
10 1.600 0.625
11 1.715 0.583
12 1.845 0.542
13 2.000 0.500
14 2.160 0.463
15 2.326 0.430
16 2.519 0.397
17 2.747 0.364
18 3.021 0.331
19 3.356 0.298
20 3.774 0.265
21 4.310 0.232
22 5.025 0.199
23 6.024 0.166
24 7.519 0.133
25 10.000 0.100
Figure D-1. Calculations for the files containing the expecteddistributions of second-response-time reciprocals.
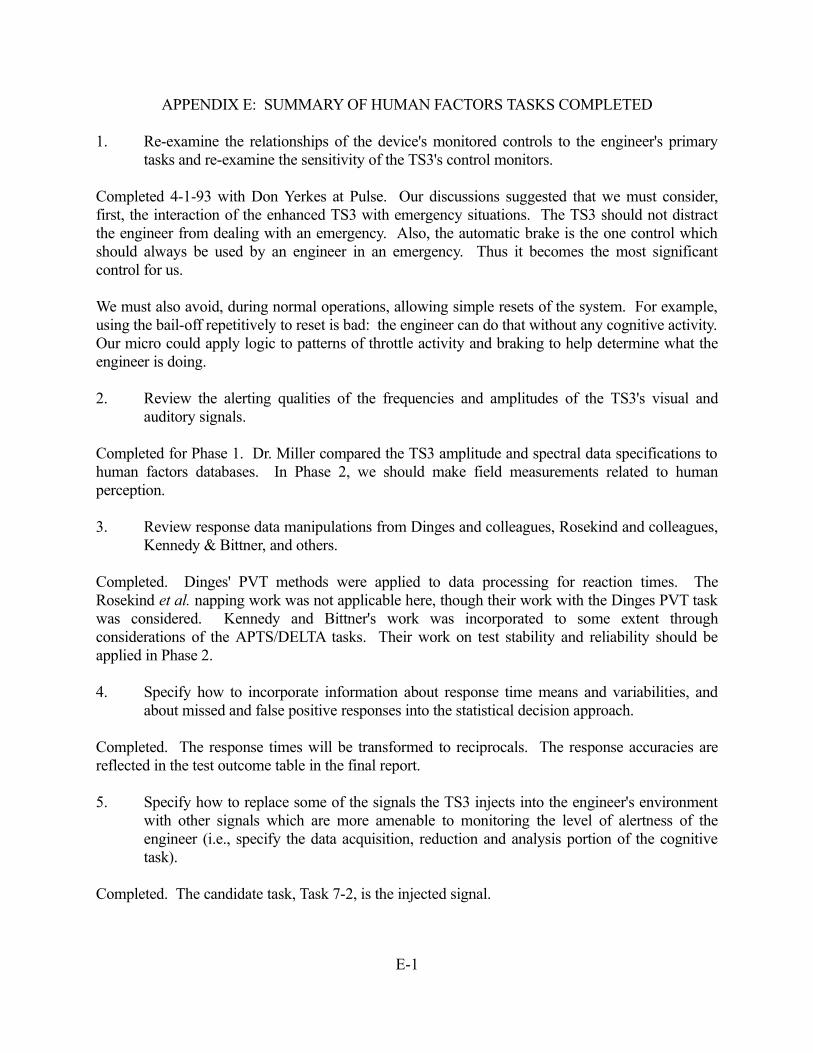
E-1
APPENDIX E: SUMMARY OF HUMAN FACTORS TASKS COMPLETED
1. Re-examine the relationships of the device's monitored controls to the engineer's primary tasks and re-examine the sensitivity of the TS3's control monitors.
Completed 4-1-93 with Don Yerkes at Pulse. Our discussions suggested that we must consider, first, the interaction of the enhanced TS3 with emergency situations. The TS3 should not distract the engineer from dealing with an emergency. Also, the automatic brake is the one control which should always be used by an engineer in an emergency. Thus it becomes the most significant control for us.
We must also avoid, during normal operations, allowing simple resets of the system. For example, using the bail-off repetitively to reset is bad: the engineer can do that without any cognitive activity. Our micro could apply logic to patterns of throttle activity and braking to help determine what the engineer is doing.
2. Review the alerting qualities of the frequencies and amplitudes of the TS3's visual and auditory signals.
Completed for Phase 1. Dr. Miller compared the TS3 amplitude and spectral data specifications to human factors databases. In Phase 2, we should make field measurements related to human perception.
3. Review response data manipulations from Dinges and colleagues, Rosekind and colleagues, Kennedy & Bittner, and others.
Completed. Dinges' PVT methods were applied to data processing for reaction times. The Rosekind et al. napping work was not applicable here, though their work with the Dinges PVT task was considered. Kennedy and Bittner's work was incorporated to some extent through considerations of the APTS/DELTA tasks. Their work on test stability and reliability should be applied in Phase 2.
4. Specify how to incorporate information about response time means and variabilities, and about missed and false positive responses into the statistical decision approach.
Completed. The response times will be transformed to reciprocals. The response accuracies are reflected in the test outcome table in the final report.
5. Specify how to replace some of the signals the TS3 injects into the engineer's environment with other signals which are more amenable to monitoring the level of alertness of the engineer (i.e., specify the data acquisition, reduction and analysis portion of the cognitive task).
Completed. The candidate task, Task 7-2, is the injected signal.
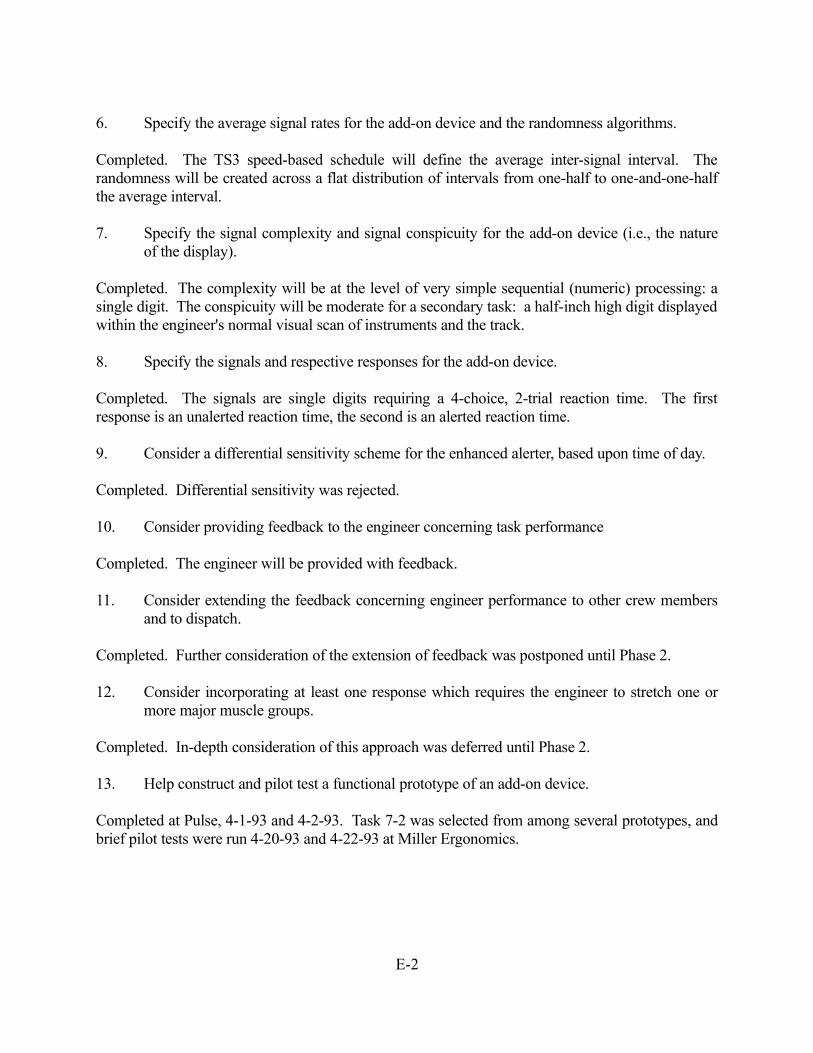
E-2
6. Specify the average signal rates for the add-on device and the randomness algorithms.
Completed. The TS3 speed-based schedule will define the average inter-signal interval. The randomness will be created across a flat distribution of intervals from one-half to one-and-one-half the average interval. 7. Specify the signal complexity and signal conspicuity for the add-on device (i.e., the nature
of the display).
Completed. The complexity will be at the level of very simple sequential (numeric) processing: a single digit. The conspicuity will be moderate for a secondary task: a half-inch high digit displayed within the engineer's normal visual scan of instruments and the track.
8. Specify the signals and respective responses for the add-on device.
Completed. The signals are single digits requiring a 4-choice, 2-trial reaction time. The first response is an unalerted reaction time, the second is an alerted reaction time.
9. Consider a differential sensitivity scheme for the enhanced alerter, based upon time of day.
Completed. Differential sensitivity was rejected.
10. Consider providing feedback to the engineer concerning task performance
Completed. The engineer will be provided with feedback.
11. Consider extending the feedback concerning engineer performance to other crew members and to dispatch.
Completed. Further consideration of the extension of feedback was postponed until Phase 2.
12. Consider incorporating at least one response which requires the engineer to stretch one or more major muscle groups.
Completed. In-depth consideration of this approach was deferred until Phase 2.
13. Help construct and pilot test a functional prototype of an add-on device.
Completed at Pulse, 4-1-93 and 4-2-93. Task 7-2 was selected from among several prototypes, and brief pilot tests were run 4-20-93 and 4-22-93 at Miller Ergonomics.
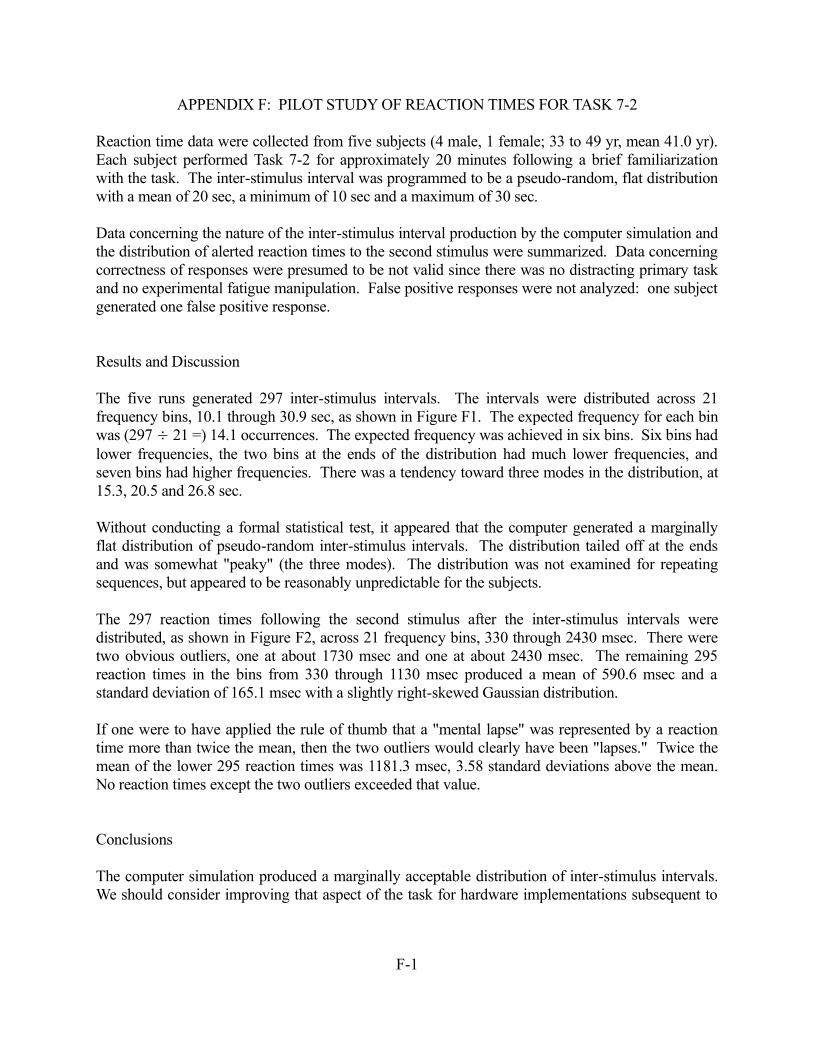
F-1
APPENDIX F: PILOT STUDY OF REACTION TIMES FOR TASK 7-2
Reaction time data were collected from five subjects (4 male, 1 female; 33 to 49 yr, mean 41.0 yr). Each subject performed Task 7-2 for approximately 20 minutes following a brief familiarization with the task. The inter-stimulus interval was programmed to be a pseudo-random, flat distribution with a mean of 20 sec, a minimum of 10 sec and a maximum of 30 sec.
Data concerning the nature of the inter-stimulus interval production by the computer simulation and the distribution of alerted reaction times to the second stimulus were summarized. Data concerning correctness of responses were presumed to be not valid since there was no distracting primary task and no experimental fatigue manipulation. False positive responses were not analyzed: one subject generated one false positive response.
Results and Discussion
The five runs generated 297 inter-stimulus intervals. The intervals were distributed across 21 frequency bins, 10.1 through 30.9 sec, as shown in Figure F1. The expected frequency for each bin was (297 21 =) 14.1 occurrences. The expected frequency was achieved in six bins. Six bins had lower frequencies, the two bins at the ends of the distribution had much lower frequencies, and seven bins had higher frequencies. There was a tendency toward three modes in the distribution, at 15.3, 20.5 and 26.8 sec.
Without conducting a formal statistical test, it appeared that the computer generated a marginally flat distribution of pseudo-random inter-stimulus intervals. The distribution tailed off at the ends and was somewhat "peaky" (the three modes). The distribution was not examined for repeating sequences, but appeared to be reasonably unpredictable for the subjects.
The 297 reaction times following the second stimulus after the inter-stimulus intervals were distributed, as shown in Figure F2, across 21 frequency bins, 330 through 2430 msec. There were two obvious outliers, one at about 1730 msec and one at about 2430 msec. The remaining 295 reaction times in the bins from 330 through 1130 msec produced a mean of 590.6 msec and a standard deviation of 165.1 msec with a slightly right-skewed Gaussian distribution.
If one were to have applied the rule of thumb that a "mental lapse" was represented by a reaction time more than twice the mean, then the two outliers would clearly have been "lapses." Twice the mean of the lower 295 reaction times was 1181.3 msec, 3.58 standard deviations above the mean. No reaction times except the two outliers exceeded that value.
Conclusions
The computer simulation produced a marginally acceptable distribution of inter-stimulus intervals. We should consider improving that aspect of the task for hardware implementations subsequent to
F-2
the computer simulation. However, the computer-produced distribution of inter-stimulus intervals will be adequate for bench-top and train simulator pilot tests.
The reaction time data were about as expected, ranging from about 0.3 sec to about 1.1 sec, with a mean of about 0.6 sec. Nearly all responses (290 of 297, or 97.%) were completed within 1.03 sec. Thus, we may say that, 97% of the time, the subjects operated the task for about 1 sec or less three times a minute, requiring about (100 x 3 sec 60 sec =) 5% of their sequentially-scheduled psychomotor resources. Most of the time, the demand was lower than 5%. This should not be a dangerous distraction from the primary task of operating the train.
Note that the cognitive resources required to interpret the first stimulus may be scheduled easily along with the primary task: the subject makes the first response when it is convenient to do so, within broad limits. Since the human is skilled at this kind of task integration, the mental demand placed on the subject by the first stimulus is quite low. However, the subjects need to be taught that they are allowed to do this kind of scheduling.
The reaction time data, were they an adequate sample, would suggest that we amend the structure of the distribution of response times in Table D-1. The minimum response time would become 0.300 sec, the mean would become 0.600 sec, and the maximum would become 1.200 sec. However, we need a respectable sample of data from train engineers highly skilled at operating the task during train operations before recommending specific changes.
The reaction time data supported the conclusion that Task 7-2 functions about as it was designed to function. Subsequent pilot experiments in Phase 2 should include distraction by a primary task (preferably, simulated and real engine operation), simple experimental manipulations of subject fatigue and of the distribution of the interstimulus interval, and analyses of correctness of responses and false positive responses.