the elusive concept of immigrant quality: evidence from 1970-1990
TRANSCRIPT

IZA DP No. 631
The Elusive Concept of Immigrant Quality:Evidence from 1970-1990
Harriet Orcutt DuleepMark C. Regets
DI
SC
US
SI
ON
PA
PE
R S
ER
IE
S
Forschungsinstitutzur Zukunft der ArbeitInstitute for the Studyof Labor
November 2002
The Elusive Concept of Immigrant Quality: Evidence from 1970-1990
Harriet Orcutt Duleep Urban Institute, Social Security Administration and IZA Bonn
Mark C. Regets National Science Foundation and IZA Bonn
Discussion Paper No. 631 November 2002
IZA
P.O. Box 7240 D-53072 Bonn
Germany
Tel.: +49-228-3894-0 Fax: +49-228-3894-210
Email: [email protected]
This Discussion Paper is issued within the framework of IZA’s research area Mobility and Flexibility of Labor. Any opinions expressed here are those of the author(s) and not those of the institute. Research disseminated by IZA may include views on policy, but the institute itself takes no institutional policy positions. The Institute for the Study of Labor (IZA) in Bonn is a local and virtual international research center and a place of communication between science, politics and business. IZA is an independent, nonprofit limited liability company (Gesellschaft mit beschränkter Haftung) supported by the Deutsche Post AG. The center is associated with the University of Bonn and offers a stimulating research environment through its research networks, research support, and visitors and doctoral programs. IZA engages in (i) original and internationally competitive research in all fields of labor economics, (ii) development of policy concepts, and (iii) dissemination of research results and concepts to the interested public. The current research program deals with (1) mobility and flexibility of labor, (2) internationalization of labor markets, (3) welfare state and labor market, (4) labor markets in transition countries, (5) the future of labor, (6) evaluation of labor market policies and projects and (7) general labor economics. IZA Discussion Papers often represent preliminary work and are circulated to encourage discussion. Citation of such a paper should account for its provisional character. A revised version may be available on the IZA website (www.iza.org) or directly from the author.

IZA Discussion Paper No. 631 November 2002
ABSTRACT
The Elusive Concept of Immigrant Quality: Evidence from 1970-1990�
The labor market "quality" of immigrants is a subject of debate among immigration researchers, and a major public policy concern. However, traditional methods of measuring human capital are particularly difficult to apply to recently arrived immigrants. Many factors that have a negative effect on entry earnings also increase either the incentive or the opportunity for faster human capital investment and earning growth. In addition, many country-of-origin acquired skills that are not immediately valued in the U.S. labor market are useful to the acquisition of U.S. skills. Thus entry earnings are not a good measure of the stock of immigrant human capital. This article presents a model of immigrant human capital investment and, using 1970-1990 census data, presents strong evidence of a systematic and important inverse relationship between initial immigrant earnings and subsequent earnings growth. This result – which persists even after accounting for differences in the immigration flows from different countries, sampling error, and the effects of emigration – is fundamentally different from both earlier cross-sectional estimates and more recent pooled models that constrain cohort growth rates to be equal. Although our model provides theoretical support for an inverse relationship only when source country human capital is held constant, faster earnings growth for low-entry-earnings immigrants is found empirically even when age and education are not controlled for. The immigrant human capital investment model presented here explores general principles that may apply to other labor market transitions that involve skill transferability – including occupational change and labor market reentry. JEL Classification: J61, J24, F22, J1 Keywords: immigration, migration, human capital investment, skill transferability,
assimilation Corresponding author: Mark C. Regets National Science Foundation 4201 Wilson Blvd., Room 965 Arlington, VA 22182 Tel.: +1-703-292-7813 Fax: +1-703-292-9092 Email: [email protected] � We gratefully acknowledge useful comments from George Borjas, Gregory DeFreitas, Gilles Grenier, Morley Gunderson, Guy Orcutt, Cordelia Reimers, Chris Robinson, David Jaeger, seminar participants at the George Washington University Department of Economics, and participants in immigration sessions at the annual meetings of the 1997 American Economic Association, the 1997 Society of Labor Economists, the 1997 and 1995 Population Association of America, the 1996 Society of Government Economists/ASSA, the 1994 Canadian Economics Association, the 1992 North American Economics and Finance Association/American Economics Association, and the 1990 Donner Foundation Conference on Immigration, Language, and Ethnic Issues: Public Policy in Canada and the United States. The views expressed in this paper are those of the authors and do not necessarily reflect the views of the National Science Foundation, the Urban Institute, or any of its sponsors.

1
The "quality" of immigrants to the United States has historically been of great popular and political
concern. A current concern, prompted by a large unexplained decline in the initial earnings of immigrants, is
that recent immigrants may be of lower labor market quality than their predecessors (Borjas, 1985, 1987,
1992, 1994). Yet, if entry earnings are correlated with any factor that increases the return to human capital
investments, then immigrant entry earnings are not a good measure of either human capital or unmeasured
immigrant quality: home-country skills and attributes that do not yield an immediate labor market return may
still represent human capital in a meaningful way if they aid the acquisition of U.S. skills.
Skills transferability provides a plausible explanation for much of the across-group and over-time
variation in the education-adjusted entry earnings of immigrants (Chiswick, 1978, 1979; Duleep and
Regets, 1997c).1 However, initial skill transferability affects more than just entry earnings. If skills
transferability is the dominant source of variation in education-adjusted entry earnings (as opposed to
differences in intrinsic ability) then we would expect an inverse relationship between the education-adjusted
entry earnings and earnings growth of immigrants. This occurs because of higher rates of human capital
investment by immigrants that are directly related to their untransferred human capital. Although formal
education is just one form of human capital investment (and for adults probably much less important than
on-the-job and occupational investments), at every age above 21, recent immigrants report higher school
attendance than their native counterparts (Figure 1).
This paper explores both theoretical and observed patterns of immigrant earnings and investment.
Despite extensive research in this area, three errors are commonly made: a conceptual error of equating
earnings with level of human capital, a statistical design error of assuming in pooled or cross-sectional
models that earnings growth rates are constant across entry cohorts, and an analytical and policy error of
assuming that differences in entry earnings measure differences in immigrant quality. The next section
1The lower entry earnings of recent immigrants may reflect lower skill transferability either because skills acquired in less-developed countries are less useful to American employers, than those acquired in advanced economies (Chiswick, 1979, 1980), or because limited opportunities in less-developed countries make migration worthwhile even with substantial post-migration investment (Duleep and Regets, 1997c). A supplemental explanation is the increase in the U.S. earnings
2
presents a theoretical model that explains why we would expect an inverse relationship between entry
earnings and earnings growth rates. Following this, we examine the association between the entry earnings
of country-of-origin/age/education immigrant cohorts and earnings growth, first across countries of origin
using 1980 and 1990 census data, and then over time for the same source countries using 1970-1990
census data. We find a strong inverse relationship between entry earnings and earnings growth that persists
when we estimate it with a straightforward new methodology that circumvents regression-to-the-mean bias
caused by sampling error. Our result suggests that the current concept of unmeasured immigrant quality
may be cloaked in the emperor’s new clothes, diverting attention away from important behavioral issues
such as differential investments. Methodological, conceptual and policy implications of the inverse
relationship are discussed in the conclusion.
I. Why We Would Expect an Inverse Relationship between Immigrant Entry Earnings and Earnings Growth: Theoretical Development
2
A simple two-period model of human capital investment can be used to describe the human
capital investments of natives as follows: max w H1 (1-θ) + w (H1 + γ f(H1,θ)) 1.1 θ
where w is the market rate of return on a unit of human capital, H1 is the initial stock of human capital, and
θ is the proportion of available time devoted to investment in the first period.3 The optimal investment
decision, θ*, maximizes total earnings over the two periods. The production function of human capital is
denoted γ f(H1,θ) where f is a positive function of θ, H1, and of γ, a human capital productivity coefficient
differential between high- and low-skill workers that has occurred. 2The components of this model have been present in earlier versions (e.g. Duleep and Regets, 1992a and 1994a) with the model’s mathematical formalization first presented in Duleep and Regets (1997a). 3While the proportion of time devoted to investment is a convenient concept of θ for exposition of the model, it could also be usefully thought of as the proportion of the U.S. market value of initial human capital that is foregone as a result of investment. This broader concept would include traditional forms of human capital investment such as apprenticeships or simply taking a job with lower initial pay, but greater opportunity for advancement.
3
that may vary across individuals.4
Even in this simple framework, the human capital investment decision of immigrants is more
complicated. An immigrant's initial stock of human capital, Hs, was produced in their source country, and
may not be fully valued in their destination country. It is necessary to introduce a factor, τM 1, the proportion
of source-country human capital initially valued in the labor market of the destination country. Introducing
this parameter formalizes the discussion of international transferability of skills put forth by Chiswick
(1978a, 1979). An immigrant’s initial stock of human capital may also not fully transfer to the production of
new, destination-country, human capital. To capture this feature, we include a transferability parameter τP 1
in the production function for new human capital. Thus, for immigrants, the two-period model of human
capital investment becomes:
max w τM 1 Hs (1-θ) + w ( τM2 Hs + γ f(Hs, τP 1 , θ)) 1.2 θ
When τM1 <1, the opportunity cost of investment for immigrants is lower than for natives with the
same level of human capital in period 1. Among immigrants with the same level of human capital, the
opportunity cost differential between those with high labor market transferability (τMHT) versus low labor
market transferability (τMLT) is w Hs(τM
HT - τMLT). Yet, despite lower opportunity costs, there would not
necessarily be a greater incentive for immigrants to invest in destination-country human capital than natives,
or for low-skill-transferability immigrants to invest more than high-skill-transferability immigrants; offsetting
the lower opportunity costs associated with low labor market transferability are lower returns to
investment because of less human capital transferring to the production of new human capital. If τM =τP the
lower opportunity cost of investment resulting from low skill transferability will be completely offset by
higher respective production costs.5 We would argue, however, that when τM<1, τM is always less than τP
4As in Ben-Porath (1967), we have made existing human capital a factor in the production of new human capital. However, for purposes of this paper we do not need to provide a specific parametric form for this relationship as is done in Ben-Porath. 5 Whether or not this would occur would depend on other factors such as complementarity between source- and destination-country human capital and whether skill transferability becomes harder to achieve the higher

4
and that as labor market transferability τM falls, the transference of source-country human capital to the
production of new skills, τP , falls less. In other words, when τM<1 source-country human capital is more
valuable in learning than in earning, and this difference increases as labor market skill transferability falls.
Our reasoning follows.
A sound assumption is that whatever portion of source-country human capital transfers to the labor
market is also useful in the production of destination-country human capital. Thus τP is always at least as
large as τM. When τM =1, τP =1 and the investment decisions of immigrants and natives are
indistinguishable. As τM decreases, τP never decreases by more than τM decreases.
Furthermore, source-country human capital that is not valued in the destination country’s labor
market is still useful in producing new human capital. There are several reasons for this.
• Part of the difficulty in transferring human capital between countries is not its innate productivity in the
production of good and services, but a matter of information costs and risks. It can be much harder for
potential employers to evaluate foreign educational credentials and work experience. However, real
abilities are useful in gaining new skills. In addition, individuals’ superior knowledge of their own abilities
will be used in making their investment decisions.
• Learning skills—the set of abilities and experiences that aid in learning new knowledge and skills—
should transfer more readily than skills more specifically related to the business and production practices in
the origin and destination countries. Previously learned work and study habits may greatly facilitate the
learning of destination-country skills.
• Similarity and common elements between old and new skills aid learning. Although the technologies in
producing goods and services differ across countries—particularly between developed and less-developed
countries—the processes, materials, and ultimate aims are analogous. Thus, skills acquired in a less-
developed source country are useful for learning skills in a more-developed destination country: a
the level of skill transferability.

5
Cambodian carpenter’s experience with a hand saw is useful in learning to use an electric saw. More
generally, persons who have learned one set of skills—even if those skills are not valued in the destination-
country labor market—have advantages in learning a new set. Cognitive psychologists refer to this
phenomenon as “transfer” (Mayer and Wittrock, 1996).
These ideas suggest that as labor market skill transferability (τM ) falls, τP falls less, since some of the
source-country human capital that is not valued in the labor market will still be useful in producing new
human capital. Even when τM = 0, that is when source-country skills have zero market value, τP will still
be positive. Since when τM =1, τP =1, and when τM = 0, τP is positive, then (in the absence of any
discontinuity) the difference between τP and τM must grow as labor market skill transferability falls.
Thus, the opportunity cost of source-country human capital applied to human capital investment falls
more than the value of that human capital in producing new, destination-country human capital: as labor
market skill transferability falls, the incentive to invest in destination-country human capital grows; θ*, the
optimal level of investment will be greater for immigrants with low initial skill transferability. The greater
investment means that the initial earnings differential between immigrants will be even greater than reflected
by the difference in their skill transferability.6 In comparing immigrants with the same level of source-country
human capital, but different degrees of transferability of this human capital to the destination-country labor
market, this model implies faster earnings growth for the immigrants with lower transferability. The same
faster earnings growth is implied for any immigrants with imperfect skill transferability relative to natives,
with natives represented as a special case where τM=τP =1.
In addition to faster earnings growth for low skill-transferability migrants, there are several other
empirical predictions that flow from this model of immigrant human capital investment:
6Another model with a similar principal prediction of greater immigrant human capital investment is in Eckstein-Weiss(1998). The Eckstein-Weiss model assumes that source-country transferability (or, in their terms, skill prices) increases with time in the destination country and is unaffected by the rate of investment, as in the immigrant human capital investment model presented in this paper. The incentive for human capital investment increases in the Eckstein-Weiss model through the interaction in an exponential production function of transferable skills with destination-country skills.

6
1. Holding source country human capital constant, there will be an inverse relationship
between initial earnings and earnings growth. If we roughly control for the level of source-country
human capital through age and education variables, this model yields an empirical prediction of an inverse
relationship between initial immigrant earnings and earnings growth. Where earnings differences result from
the degree of transferability of source country human capital, lower initial earnings are associated with both
greater human capital investment and a greater return on that investment.
2. The lower the degree of skill transferability, the greater the likelihood that high skilled
immigrants will invest more than low skill immigrants. As in most human capital models, prior
education or experience has an ambiguous effect upon investment decisions, increasing both the
opportunity cost and the productivity of time spent investing. There is, however, an interactive effect
between education and level of skill transferability. From our discussion of skill transferability in learning
versus earning, it follows that the lower the degree of labor market transferability, the greater the effect of
source-country human capital on the return to investment relative to its effect upon opportunity costs. In the
extreme case, where τM =0, greater education will unambiguously lead to greater investment since an
additional unit of education adds nothing to the opportunity cost of investment while adding τP to its value in
production. The role of prior learning, both in providing learning skills and a base on which to anchor new
knowledge, implies:
∂ (∂ θ*/ ∂ Hs) / ∂ τ1) < 0
Low skill transferability reduces the opportunity cost of human capital investment less than it reduces
its productivity. In terms of the model, the effect of Hs on optimal human capital investment, θ*, moves in a
positive direction as τ1 becomes smaller. Thus we would expect greater relative earnings growth for the
highly educated if they come from a country with less similarity to the United States, and thus lower skill
transferability: (θhigh skill - θlow skill)low τ > (θhigh skill - θlow skill)high τ . To the extent that skill transferability
differences do lead to greater investment and earnings growth by the more educated, we would expect the
inverse relationship observed between entry earnings and earning growth to be greater for the more highly

7
educated7.
3. Holding education constant, there will be a stronger inverse relationship between entry
earnings and earnings growth for younger workers. This results if the two-period model given above is
simply extended to a third period in which only workers that are young in period 1 may have earnings. The
objective function for younger workers becomes:
max w τM1 Hs (1-θ1) + w ( τM2 Hs + γ f(Hs,θ1,τP 1))(1- θ2) + w ( τM3 Hs + γ f(Hs,θ1,θ2,τP 1,τP
2)) θ1
, θ2
where θ1 and θ2 are the first and second period rates of human capital investment.
It is a common result from human capital models and empirical estimates that the young engage in more
human capital investment since they have a longer period over which to receive a return from new human
capital. In this model, youth makes investment more likely, and increases the sensitivity of investment to the
rate of initial skill transferability. In addition, longer time horizons increase the likelihood that the more highly
educated will have greater rates of investment. We have allowed for the possibility that both forms of skill
transferability, τP and τM , can vary overtime in the multiple investment period models, and shifts in these
parameters would have some additional effect upon the optimal timing of investment
II. The Relationship between Entry Earnings and Earnings Growth The relationship between initial earnings and earnings growth can be directly examined by following
various immigrant entry cohorts across decennial censuses.8 We used the 1980 Census 5% Public Use
Micro Sample and a 1990 Census 6% microdata sample to examine the entry earnings and earnings
7If natives are the special case of perfect skill transferability, we would expect education to have a more positive effect on further human capital investment for immigrants than for natives. 8Due to data limitations in the 1970 census and the only indirect identification of wage rates in 1980 and 1990, we focus on annual earnings.
8
growth of adult immigrants who migrated between 1975 and 1980.9 Given the sensitivity of immigrant
earnings growth estimates to slightly different model assumptions (Lalonde and Topel, 1992), we pursued a
simple non-parametric approach that avoids assumptions about the earning profile’s functional form or the
appropriate reference group against which earnings differentials are measured and avoids confounding
effects of age and assimilation (Kossoudji, 1989; Friedberg, 1993).
Median earnings were measured within education and age subsets for 24 countries or regions
of origin.10 Entry earnings were measured by the earnings reported in 1980 by the 1975-1980 entry
cohort.11 The earnings growth rate of each of the country/age/education groups was then measured by the
difference between their 1980 earnings and their respective earnings ten years later, as measured by the
1990 census, dividing the difference by their 1980 earnings. An alternative approach would be to first
estimate a parametric model and then, using the predicted values, estimate the correlation between the
predicted entry earnings and predicted earnings growth. Although our approach ignores information beyond
the median within each age/education/country cell, we can be very certain that our results are not the
product of a particular set of model assumptions.
Consistent with standard professional practice in estimating Mincer earnings functions, immigrant
regression models that pool entry cohorts from two or more censuses typically limit the sample to
employed individuals, and exclude the self-employed.12
These sample limitations may create severe
9The 1990 census sample used in our analyses is a 6 percent microdata sample created by combining and reweighting the 1990 Public Use 5% and 1% samples. The 1980 census sample is the 5 percent "A" Public Use Sample. The 1970 census sample, is the 1% State Public Use Sample (5% questionnaire). 10Median rather than mean earnings were used since the median is a much less volatile measure of central tendency in small samples. The source areas are: Africa, Canada, Jamaica, Britain, Germany, Greece, Italy, Portugal, Other Non-Communist Europe, Poland, Yugoslavia, Other Communist Europe, China/Taiwan, Japan, Korea, India, Islamic Southwest Asia, Philippines, Other Asia, Oceania, Cuba, Mexico, Other Central America, and South America. 11There are concerns about how well the census year-of-immigration variable captures actual U.S. date of entry and thus measures U.S. experience (Massey and Malone, 1998). For purposes of correctly identifying a cohort between censuses, all that is needed is that the Census question be interpreted by the respondents the same way in each census. To the extent a Census-based measure underestimates time in the U.S., estimates of initial earnings growth will be biased downwards (Duleep and Dowhan, 1999a). 12Self-employment earnings usually include some return on financial or physical capital that would bias
9
problems when following a “synthetic” cohort over time: individuals eligible for the sample in the first
census through normal employment may be ineligible for the sample in the second census due to self-
employment; individuals without earnings during the first census, because of low employability or time spent
in school, might be fully employed during the second, biasing the estimated earnings growth of immigrants
downwards. This issue applies to any cohort followed between censuses. But it is particularly important
here as immigrants have high occupational mobility, high in-school rates, and high rates of movement into
self-employment. To avoid these difficulties we place no labor force status restrictions on our census
cohorts.
Sample size concerns led us to group several countries, and to group age and education each into
two categories: the education categories are 1-12 years and 13 or more years; the age categories are 25-
39 and 40-54 on the 1980 sample, and 35-49 and 50-64 on the 1990 sample. All told there were 96
country/age/education cells in our data set for the 1980-1990 comparison.13 The correlation between
the entry earnings of the country/age/education cohorts and their 1980-1990 earnings growth rates is -
.4889 and highly statistically significant. A negative correlation of -.4593 is found when each
country/age/education observation is weighted to reflect its relative importance using the entry cohort
sample size14 The negative correlation suggests that lower initial earnings within education and age
groupings are associated with faster growth. This finding, based on numerous country/age/education
cohorts, agrees with the Lalonde and Topel (1991) comparison of 1970 earnings and 1970-1980 earnings
growth for five ethnic groups, and with the Schoeni et al. (1996) finding of low initial wages but fast wage
regression coefficients of rates of return. For many policy purposes, it is desirable to include these income flows in an assessment of immigrant economic contributions. However, our use of the median rather than the mean of earnings reduces the effect of non-labor income flows from the self employed, and we do interpret changes in earning over time as primarily resulting from human capital investment. 13Our conclusions are robust over numerous alternative approaches used in forming subgroups. 14The argument for weighting is that the larger the sample size underlying a country/age/education group, the more accurate the estimated median for the group. In addition, weighting by the size of a country's contribution to U.S. immigration ensures the policy relevance of a result. The argument against weighting is that the resulting estimated relationship may reflect the dominance of a few country/age/education groups, as opposed to a more general phenomenon.
10
growth for East Asian immigrants and high initial wages but slow wage growth for European immigrants.15
A potential caveat is that sampling error could produce the measured inverse relationship. Any
sample estimate will contain some error. In this case, any error in the estimated first-period earnings
creates an opposite error when calculating the growth rate using the earnings estimates of the first and
second periods: if the estimated entry earnings for a cohort in 1980 are underestimated, then the estimated
earnings growth between 1980 and 1990, calculated using an erroneously low base, will tend to be too
high. Thus even if there is a random relationship between initial earnings and growth rates for different
cohorts in the full population, a correlation between estimates of these two values would be negative.
Although the 1990 earnings estimate has its own error term, this does not affect the false correlation
between initial earnings and earnings growth unless it is correlated with the 1980 error term.16
To solve the bias problem, let yj,k be our entry earnings for a cohort who entered in period k as
measured in year j and yj+10, k - yj,k be the estimated earnings growth for cohort k. The bias problem is
then completely circumvented by splitting the random sample from which yj,k is estimated and using one half
to estimate entry earnings and the other half to estimate the entry earnings used in the earnings growth
computation.17
In other words, relate yj,k,1/2a to yj+10, k - yj,k,1/2b, or yj,k,1/2b to yj+10,k - yj,k,1/2a, where 1/2a
15We also confirm the Schoeni et al. finding of low initial earnings and slow earnings growth for Mexican immigrants during the 1980's. This finding does not hold, however, for all of Latin America or for Mexican immigrants of earlier periods. The 3 million legalizations in the 1980's under the 1986 Immigration Reform and Control Act might have made this a uniquely difficult period in the labor market for Mexican immigrants due to increased competition. Equally plausible is a sample selection bias (Ahmed and Robinson (1994): Mexican immigrants illegal at the time of the 1980 census might have been more likely to be counted in 1990, after legalization. 16The measurement error concern is equally valid whether county-of-origin-specific entry earnings and growth rates are estimated from dummy variables and interaction terms in a regression or more directly using the observations within each sample cell. Estimating directly from sample cells allows us to estimate median rather than mean earnings, thereby reducing the effect of measurement error (the median is a much less volatile measure of central tendency in small samples), and permits eliminating the measurement error bias problem with the split random sample method introduced below. 17In a previous analysis, we tested the sensitivity of our estimates to sampling error bias by re-estimating our earnings estimates and correlations 100 times using separate random 75% samples and 100 times using random 50% samples of the original census data. Although similar to resampling techniques such as bootstrap (Simon and Burstein, 1985 and Efron, 1982), our motivation was to increase the expected variance, and hence the mean absolute value, of the error terms of the estimates of median earnings. Increasing the
11
and 1/2b are the two halves of the random sample for year j. Using the "split random sample method," the
estimated correlations between entry earnings and earnings growth are -.4017 and -.4662, instead of -
.4889 for the unweighted sample, and -.3917 and -.4870, instead of -.4593 for the weighted sample.
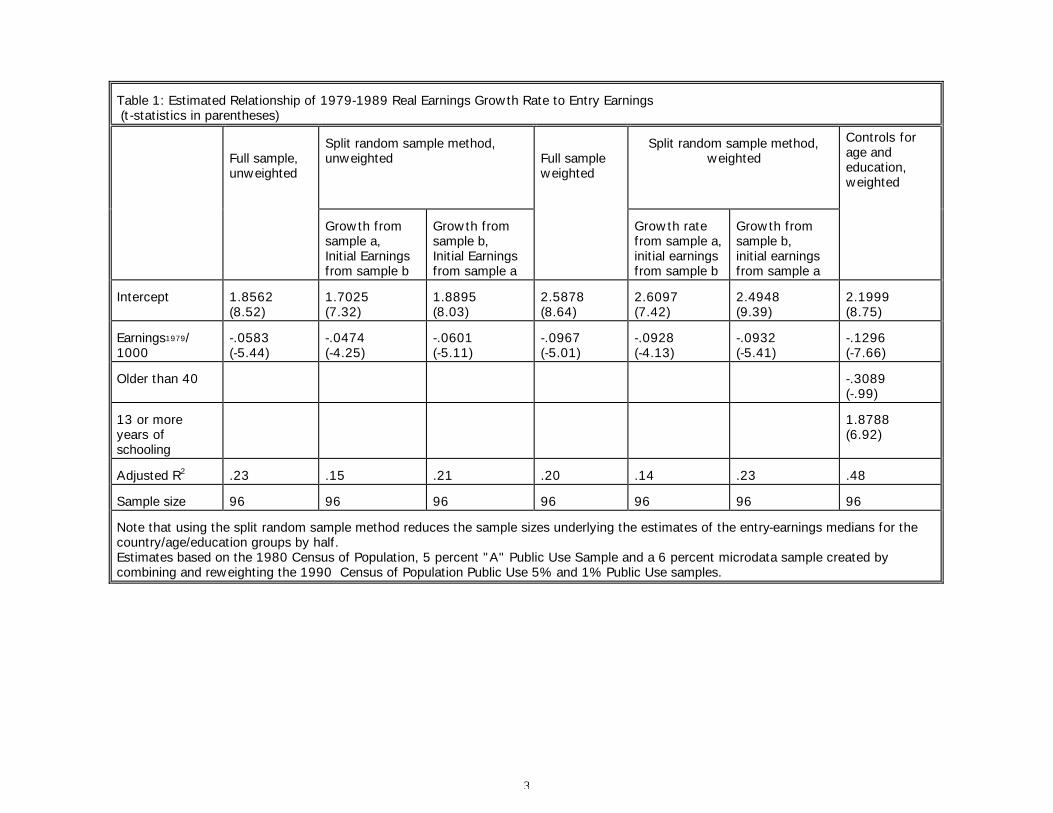
To determine whether the inverse relationship is large enough to be of practical significance, we
regressed the 10-year earnings growth rate on entry earnings (Table 1). According to the unweighted
estimates, shown in the first data column, a 10-year growth rate changes -5.8 percentage points for every
$1,000 change in entry earnings. For the weighted estimate, a $1000 change in earnings is associated with
an opposite 9.7 percentage point change in the 10-year growth rate (column 4).18
Our model predicts an
inverse relationship conditional on human capital. When we control for the age and education strata used
to form our cells (column 7), the negative estimated effect of entry earnings on earnings growth increases to
13.0 percentage points.
To ensure that the estimated negative effect of entry earnings on earnings growth is not the result of
sampling error bias, we re-estimated the simple unweighted regression with the split random sample
method; the results (Table 1, second and third columns) are close to the full-sample estimates. The
weighted data estimates (fourth through sixth columns) reveal an even greater inverse relationship—perhaps
because weighting places greater emphasis on countries where larger sample sizes allow more accurate
estimates of first- and second-period earnings.
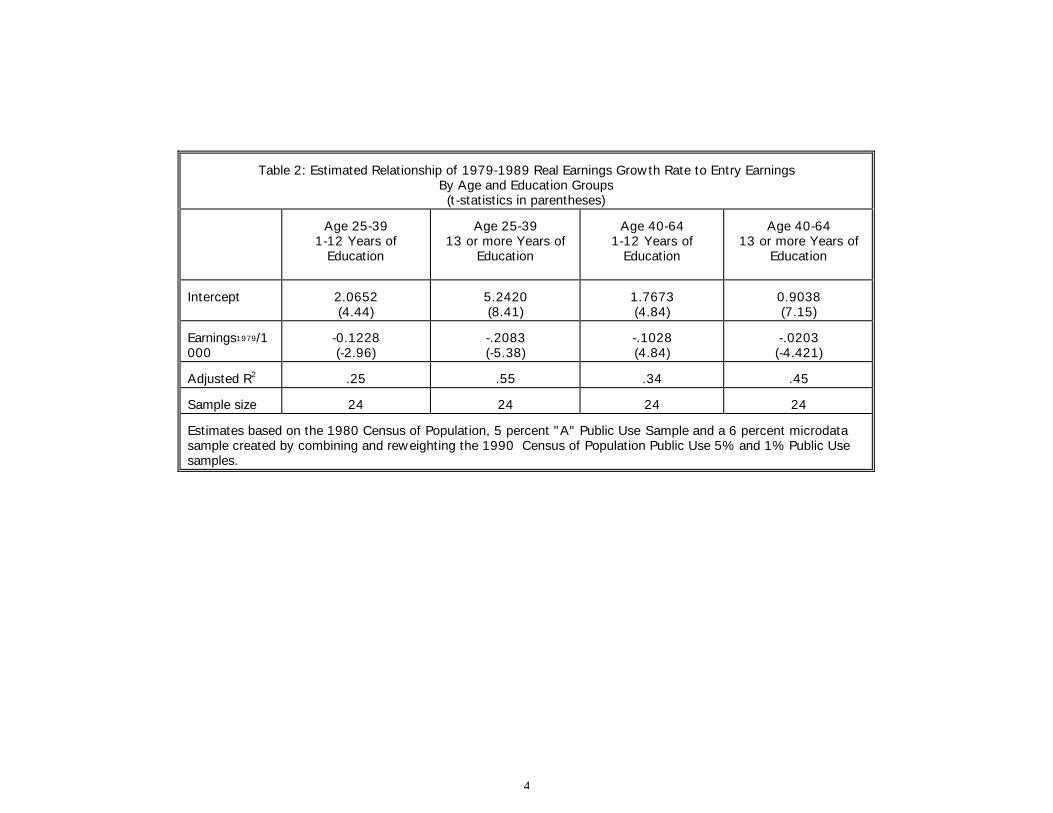
Dividing by education and age (Table 2), we find that the weakest inverse relationship is for older,
more educated immigrants for whom a $1,000 decrease in entry earnings (a decrease of 4.9% of median
earnings) is associated with a 2 percentage point increase in 10-year earnings growth. The strongest
inverse relationship is for the young and more highly educated, for whom a $1,000 entry-earnings decrease
magnitude of the sampling errors provides an indication of the effect measurement error on the correlation between entry earnings and earnings growth. Taking multiple subsamples of the original census data reduces the probability that the change in coefficients we observe is due to chance. 18Using the weighted estimates, this suggests that for immigrants who entered the U.S. between 1975-79, an immigrant cohort with entry earnings that were a $1,000 less than the overall median of $12,130 would catch up to a cohort with median entry earnings in 10 years.

12
(a decrease of 7.2% of median earnings) is associated with a 20.8 percentage point increase in 10-year
earnings growth. Consistent with our model of immigrant human capital investment, the inverse relationship
is greater for the young than for the old at each education level.19
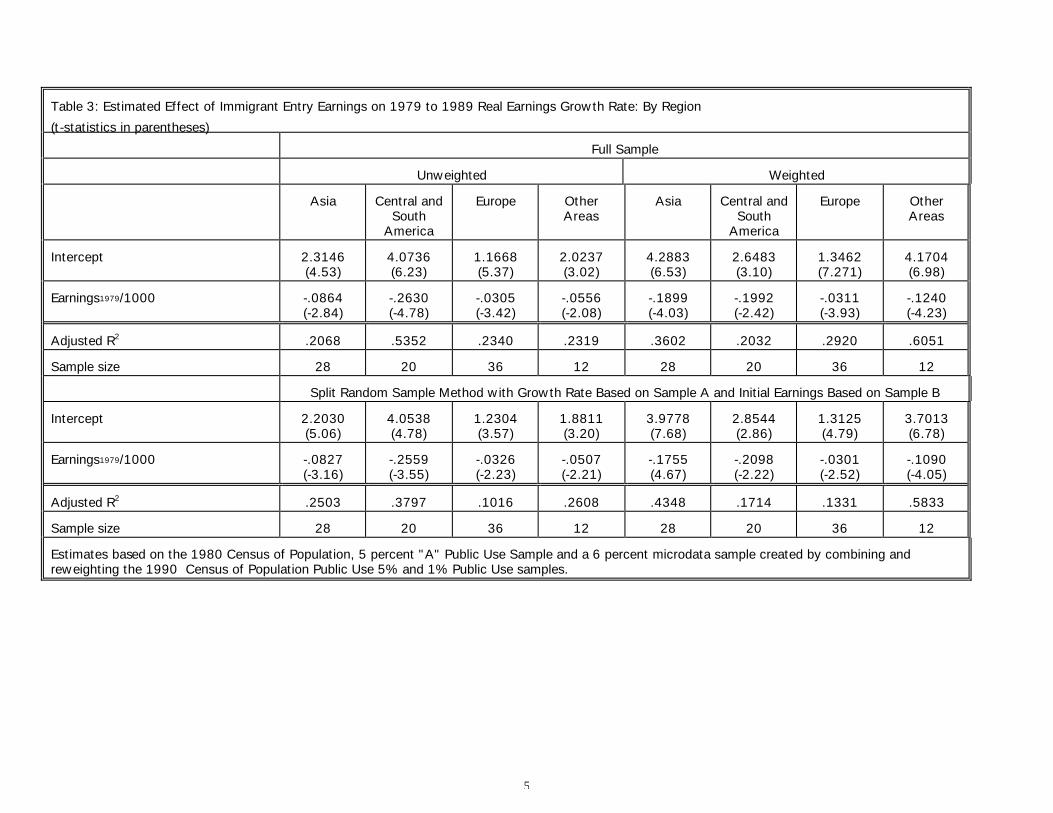
The inverse relationship also emerges in separate regressions for each immigrant origin region (Table
3). But with notable differences: a $1,000 change in entry earnings produces a 3.1 percentage point
opposite change in the 10-year earnings growth rate for European immigrants, a 19.9 percentage point
change for immigrants from Central and South America (including Mexico), and an 18.9 percentage point
change for Asian immigrants. (Similar results are obtained using the split random sample method.) This is
exactly what would be expected if skill transferability is the principle mechanism for the inverse relationship
between entry earnings and growth: Europeans, with a more similar economy to the United States, likely
have fewer problems transferring their country-of-origin human capital to the United States.20
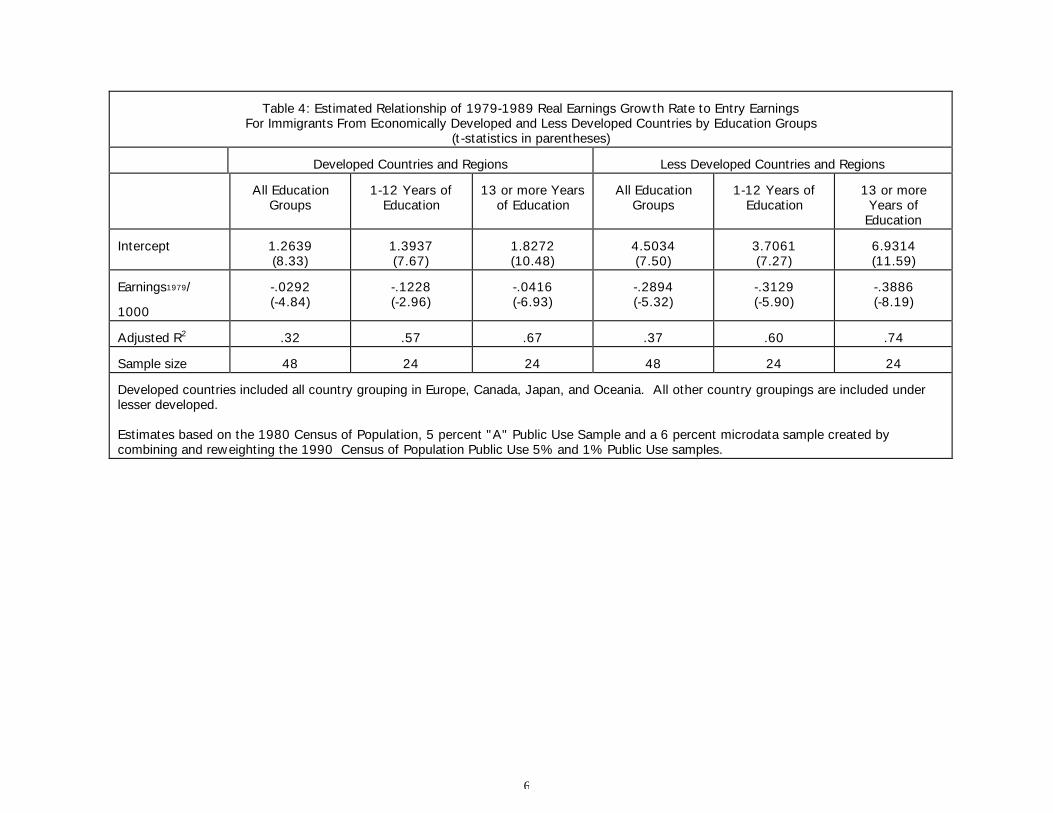
If skill
transferability is greatest between the United States and other developed countries, we should find the
weakest inverse relationship for immigrants from these countries. Separately regressing the 10-year
earnings growth rates on entry earnings across a ”developed-country” group (Europe, Japan, Canada, and
Oceania) and a less developed country group reveals a smaller inverse relationship for the former—a
$1,000 decrease in entry earnings produces a 2.9 percentage point increase in earnings after ten years for
immigrants from developed countries compared to a 28.9 percentage point increase for immigrants from
less developed countries (Table 4).
According to our model of immigrant human capital investment, the lower the degree of skill
transferability, the greater the likelihood that high-skill immigrants will invest more than low-skill immigrants:
19Also consistent with our model of immigrant human capital investment is the finding that the ratio of the inverse relationship for the high educated to the inverse relationship for the low educated is larger among the younger immigrants than among the older immigrants. Intuitively, this is because education increases the opportunity cost of investment for both young and old, but the return to investment is less for the old. 20Asian and Hispanic immigrants may have less transferable skills due to differences between the economic and educational systems of those countries and the U.S. or because the employment opportunities in these countries make it worthwhile for persons to migrate even when it involves substantial investment in new human capital. Rivera-Batiz (1996) shows that the skills acquired at given schooling levels in several

13
the ratio of the inverse relationship for the more educated to the inverse relationship for the less educated
should be larger among immigrants from economically-underdeveloped versus economically-developed
countries. Dividing the more developed/less developed samples by education level (Table 4), we find the
inverse relationship among immigrants from the less developed countries is much greater among the more
educated immigrants than among the less educated; for immigrants from the economically developed
countries, the inverse relationship is slightly greater among the less educated than among the more
educated.
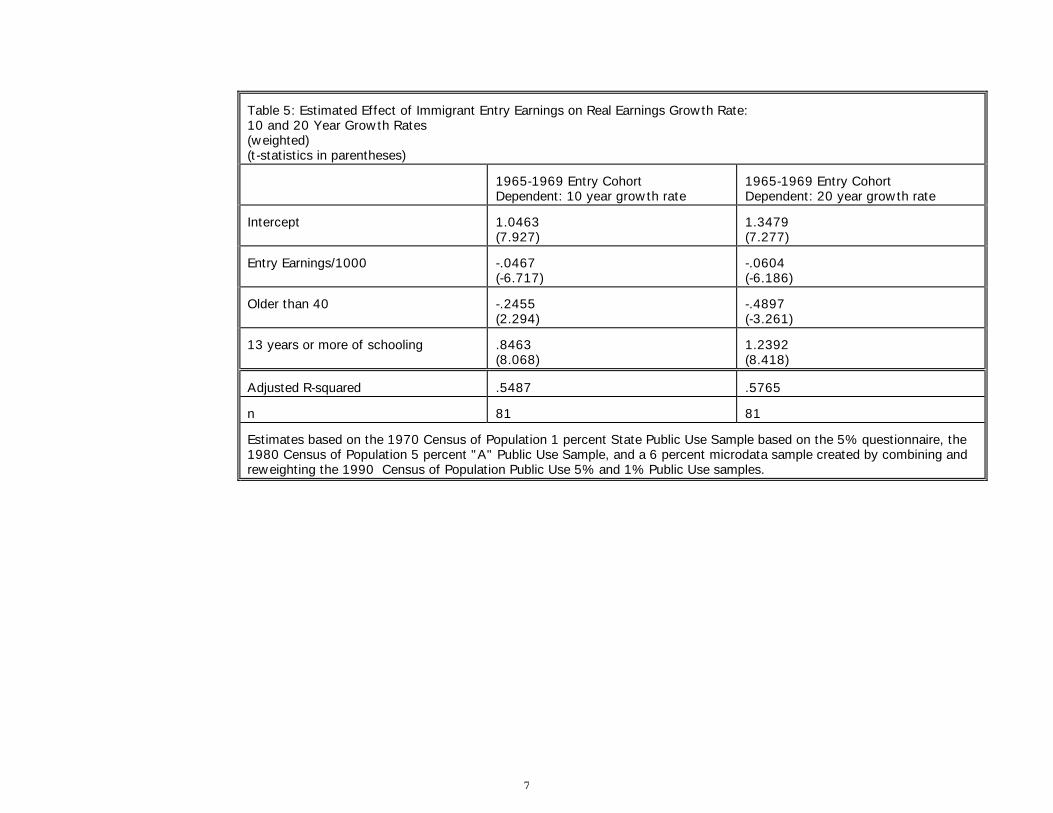
To learn whether entry earnings are inversely related to earnings growth over longer time horizons,
we used the 1970-1990 censuses to follow the 1965-69 cohort for ten- and twenty-year periods (Table
5).21
There is a significant negative relationship between entry earnings and earnings growth for the
1965-1969 entry cohort: a $1,000 decrease in entry earnings is associated with a 4.7% additional increase
in earnings over ten years. The earnings growth increase associated with lower initial earnings also
continues beyond the initial 10-year period—a 6.0 percentage point increase in earnings over 20 years for
each $1,000 decrease in entry earnings, or about one-third more than the 10-year effect. Consistent with
the model, the incentive for human capital investment decreases with age and as source-country human
capital becomes more transferable.
To isolate the inverse relationship from coincidental country-of-origin effects, we used the 1970,
1980, and 1990 censuses to relate changes in entry earnings to changes in earnings growth for the same
country. The change in initial earnings was measured by y1980,75 - y1970,65, where y1980,75 refers to the 1980
earnings of immigrants who entered the U.S. between 1975 and 1980 and y1970,65 refers to the 1970
earnings of immigrants who entered the U.S. between 1965 and 1970. The change in the 10-year growth
rates was measured by [(y1990,75 - y1980,75) / y1980,75] - [(y1980,65 - y1970,65) / y1970,65] where y1990,75 refers to
the 1990 earnings of immigrants who entered the United States between 1975 and 1980 and y1980,65 refers
developing countries are superior to those acquired in U.S. schools. 21The twenty-year comparison also represents an independent observation with a different sampling error.

14
to the 1980 earnings of immigrants who entered the United States between 1965 and 1970.
Correlations were computed between these two measures across country/age/education cohorts
using various indexes to deflate earnings over the three periods. Although it makes little difference to our
results, we prefer on theoretical grounds to deflate using average weekly earnings.22
Since we are using
earnings as an indicator of changes in the unmeasured aspects of human capital of different immigrant
cohorts, the deflator used should ideally reflect not only inflation, but also changes in how the market values
human capital. Average weekly earnings more closely approximate this concept than an index based on
price changes alone—an earnings index helps to control for period effects in labor market demand
conditions between censuses.23
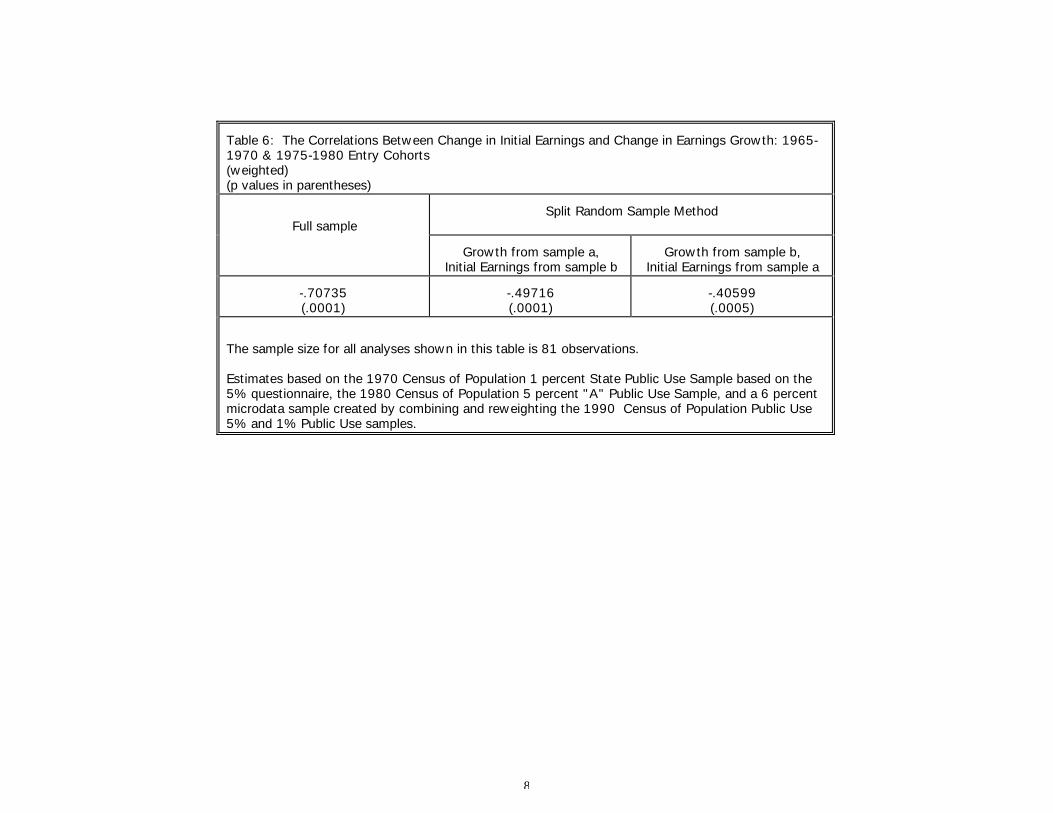
Changes in entry earnings between entry cohorts are negatively associated with changes in earnings
growth rates (Table 6). Since errors in the entry-earnings estimates may produce a negative bias in the
estimated relationship, we repeated the analysis with the split random sample method. Doing so reduces
the estimated negative relationship (Table 6, second and third columns).24
Nevertheless, we still find
decreases in entry earnings to be associated with increases in earnings growth within education/age cohorts,
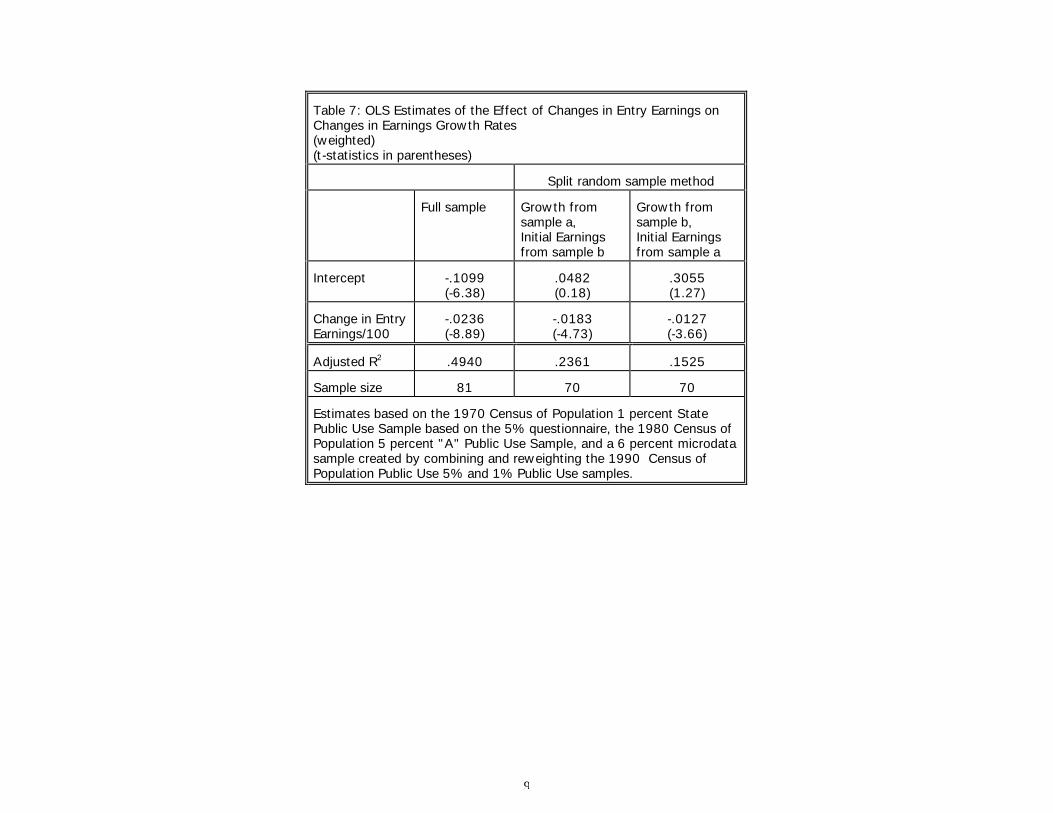
holding country of origin constant. To gauge the magnitude of the estimated association, we regressed the
22The weekly earnings index was derived from the Bureau of Labor Statistics' series on average weekly earnings in private nonagricultural industries. The correlation shown in Table 6 is negative and of similar size regardless of whether the deflator is the Consumer Price Index, the Personal Consumption Expenditure Deflator, or an index based upon average weekly earnings. 23Period effects upon earnings and earnings distributions have been raised as a potential concern for studies that follow cohorts. Differences in demand conditions between census years that affected the entire income distribution would have similar effects upon the earnings of immigrants from each source country, and thus have relatively little effect on our analysis even if we had not deflated by a wage measure. There is a greater potential for changes in the distribution of earnings across skill levels to affect our result. Chiswick (1991) and Lalonde and Topel (1992) argue that the 1970-1980 decline in immigrant entry earnings (adjusted for measured characteristics), interpreted by Borjas as a decline in immigrant quality, is partially due to a general decline in the relative wages of low-skilled workers. 24The greater reduction with the split random sample method in the estimated coefficient for the 1970-1990 analysis than for the 1980-1990 analyses may reflect a greater negative bias in the full-sample estimated relationship due to the smaller sample sizes underlying the 1970 entry-earnings estimates or a greater relative increase in measurement error when the 1970 country/age/education cells are split in half compared with when the 1980 cells are divided; measurement error will tend to diminish the estimated relationship quite apart from the sampling error bias discussed above.
15
change in the 10-year earnings growth rate on the change in entry earnings (Table 7). Estimated with the
split random sample method, the effect of entry-earnings changes on changes in the 10-year earnings
growth rate becomes smaller. Nevertheless, the smallest estimated effect (using growth rates based on
sample b entry earnings of each initial census year) translates into 12.7 extra percentage points of growth
after ten years for a $1,000 change in entry earnings—a larger effect than in single cohort estimates.
To explore the effect of emigration on our estimates, we calculated an emigration rate for each
cohort, using it to categorize the country/age/education cohorts as having high or low emigration rates. The
correlation between changes in entry earnings and changes in earnings growth is similar for high and low
emigration groups. This suggests that any bias of the earnings growth estimates caused by emigration does
not seriously affect our analysis.
III. Conclusion
Even after accounting for differences in the immigration flows from different countries of origin,
sampling error, and emigration effects, we find a strong systematic inverse relationship between immigrant
entry earnings and earnings growth. The inverse relationship has implications for the interpretation of
immigration research, empirical techniques to measure immigrant earnings growth, and philosophical and
policy issues related to immigration.
Absent the inverse relationship, previous empirical studies of immigrant earnings growth present a
puzzling array of seemingly contradictory results.25
Chiswick’s (1978a, 1979) path-breaking analysis,
which used cross-sectional census data to estimate immigrant earnings growth, found that immigrant men
experience high earnings growth, exceeding that of the native born. However, armed with the result that,
controlling for observable characteristics, immigrant entry earnings have fallen over time, Borjas (1985,
1987, 1992, 1994) showed that the cross-sectionally measured high earnings growth was the spurious
25The review of Lalonde and Topel (1997) offers a somewhat different perspective.

16
consequence of pairing the progressively lower entry earnings of recent immigrants with the earnings of
earlier immigrants; he concluded that immigrant earnings growth was in fact quite slow. Yet, several
estimates of immigrant earnings growth based on following individuals or cohorts resemble the cross-
sectional estimates!26
These apparent contradictions are resolved if immigrant entry earnings and earnings growth are
inversely related. With a systematic inverse relationship, when immigrant entry earnings have been
declining, cross-sectional estimates will over-estimate the earnings growth of earlier cohorts and yet
Borjas' (1985) decomposition of cross-sectional estimates, which assumes stationarity in immigrant
earnings growth, will underestimate the earnings growth of newer cohorts.27 Because the change in growth
rates between entry cohorts moves in the same direction as the bias in the cross-sectional estimates of the
growth rate for the earlier cohort, cross-sectional regressions may appear to do deceptively well in
predicting the growth rate of the most recent cohort.28
Since cohorts that vary in their entry-level earnings will also systematically vary in their earnings
growth, the popular approach of controlling for cohort effects by including a dummy variable for each
cohort in analyses that pool more than one cross-section is invalid: earnings growth will be overestimated
for cohorts starting at relatively high levels and underestimated for cohorts starting at relatively low levels.
Predictions of immigrant earnings growth must either take into account directly the inverse relationship
26See, for instance, Chiswick 1980, Bloom and Gunderson 1991, Duleep and Regets 1992a, 1997a, Lalonde and Topel 1992, Duleep and Dowhan, 2002. 27Earnings convergence among immigrants with U.S. time, such as convergence by immigrants separated by admission criteria (e.g. Duleep and Regets 1992b, 1996a, b and DeSilva 1996) and earnings convergence by source country (Duleep and Regets 1994b), is further evidence of the inverse relation. The inverse relationship is also consistent with findings of faster earnings growth for immigrants than for natives (Chiswick, 1977; Duleep and Regets, 1997b; Eckstein and Weiss, 1998; Duleep and Dowhan, 2002). Other corroborating evidence includes Garvey (1996), who finds that the education-adjusted earnings growth of the most recent cohort of immigrants in New Jersey exceeds that of U.S.-born New Jersey residents and also exceeds the earnings growth of the earlier immigrant cohort, and Myers and Park (1997), who find that immigrant groups in Southern California start at much higher levels of poverty than natives, but experience much larger declines in poverty. 28The similarity between cohort- and cross-section-based estimates does not justify the cross-sectional method as its underlying assumption of no unexplained cohort effects is wrong: controlling for commonly

17
between entry earnings and earnings growth or include variables such as immigrant admission criteria, that
may capture the effect of cohort characteristics on entry earnings and earnings growth, and allow the
interaction between the added variables and the entry earnings and earnings growth (Duleep and Regets
1992b, 1996a, 1996b).
The strong inverse relationship between entry earnings and earnings growth when controlling for
source-country human capital suggests that the unexplained decline in immigrant entry earnings reflects
changes in skills transferability29 as opposed to a decline in immigrant innate ability: the latter seems
incompatible with an increase in earnings growth. Although our model predicts an inverse relationship
conditional on level of human capital, the persistence of a somewhat weaker inverse relationship, even
when there are no controls for age and education, further suggests that skill transferability is a more
important reason for the total decline in entry earnings than is any decline in measured or unmeasured skills.
The inverse relationship should affect how we think about immigrant labor market "quality." Several
studies emphasize adjusted differences in entry earnings among country-of-origin groups or between entry
cohorts as signifying differences in immigrant quality. Measures of earnings growth are often ignored or
emphasized separately. The presence of a strong inverse relationship suggests that we need to think about
entry earnings and earnings growth as jointly affected by more than a single dimension of immigrant quality.
Such a perspective illuminates other findings in the immigration literature such as the relative decline in the
propensity of recent immigrants to engage in criminal activity (Butcher and Piehl, 1999) and the decrease in
initial immigrant labor force participation (Fry, 1997). The distribution of life-cycle returns to human capital
is shaped differently for immigrants than for natives. Our model suggests that this is due to a previously
ignored and potentially important attribute of initially unvalued country-of-origin skills—their value in gaining
included variables, immigrant entry earnings, not separating by source country, have declined over time; separating by source country, adjusted entry earnings have increased in some cases while falling in others. 29Regets (2000) found lower initial earnings, but faster earnings growth in a special case where differences in skill transferability are nearly certain—holders of foreign university degrees compared to other migrants with U.S. degrees in the same field of study.

18
U.S. human capital relative to their value in the U.S. labor market.
Although present value calculations have relevance for the evaluation of the net economic
contributions of different immigrant groups, there are important social and economic externalities resulting
from the growth path. Expectations of upward mobility can affect social behavior and the prevalence of
pathologies otherwise associated with low-income individuals. High rates of human capital investment and
occupational change may give immigrants greater ability to adapt to changing skills needs in the economy,
adding significant flexibility to the economy (Green, 1995). There are immigration policy concerns about
human-capital investment and the long-run skill level of the work force, whether more recent immigrants
will form a permanent underclass, and the rate of inter-generational economic assimilation. Even if some
groups do not catch up to the representative native, do they acquire additional human capital after entering
the U.S. work force? The inverse relationship between immigrant entry earnings and earnings growth also
informs other topics such as immigrant welfare use and the labor market impact of immigrants on natives
(i.e. Gang and Rivera-Batiz, 1994; Jaeger, 1996). Even if immigrants and natives were perfect substitutes
within broad skill levels, the inverse relationship suggests that over their life cycle many immigrants will go
from being substitutes for low-skill labor to complements (Lalonde and Topel, 1992).
A decline in entry (and probably life-cycle) earnings is real. Yet much greater rates of human capital
investment and earnings growth greatly ameliorate the importance of this decline. More generally, an
important implication of the strong inverse relationship for across-group and over-time immigrant
comparisons is that the entry earnings of immigrants are a seriously flawed predictor of immigrant economic
success.
19
References
Ahmed, Bashir and Gregory Robinson, "Estimates of Emigration of the Foreign-born Population: 1980-1990", Population Estimates and Projections Technical Working Paper Series, no. 9, Bureau of the Census, December 1994
Bauer, Thomas and Klaus F. Zimmermann, "Occupational Mobility of Ethnic Germans," SELAPO, University of Munich, March 1998.
Ben-Porath, Yoram, "The Production of Human Capital and Life Cycle Earnings," Journal of Political Economy, vol. 75, 1967, pp. 352-65.
Bloom, David E. and Morley Gunderson, "An Analysis of the Earnings of Canadian Immigrants," in John M. Abowd and Richard B. Freeman, Immigration, Trade, and the Labor Market, Chicago: The University of Chicago Press, 1991.
Borjas, George, "Assimilation, Changes in Cohort Quality, and the Earnings of Immigrants", Journal of Labor Economics, vol.3, October, 1985, pp.463-489.
--, "Self Selection and Immigrants", American Economic Review, vol. 77, 1987, pp.531-553. --, "National Origin and the Skills of Immigrants," in George J. Borjas and Richard B. Freeman, eds., Immigration and the Work Force, Chicago: The University of Chicago Press, 1992. Bureau of the Census, Census of Population and Housing 1990: Public Use Microdata Sample, U.S. Technical Documentation, Washington, DC: U.S. Bureau of the Census, 1992. --, Census of Population and Housing, 1980: Public Use Microdata Samples, Technical Documentation, Washington, D.C.: Bureau of the Census, 1983. --, Public Use Samples of Basic Records from the 1970 Census: Description and Technical
Documentation, Washington, D.C.: Bureau of the Census, 1972, reprinted 1977. Butcher, Kristin and Anne Piehl, "Recent Immigrants: Unexpected Implications for Crime and Incarceration," Industrial and Labor Relations Review, July 1998, pp. 654-79. Chiswick, Barry R., "Review of International Differences in the Labor Market Performance of Immigrants," Industrial Labor Relations Review, April 1991, pp. 570-71. --, An Analysis of the Economic Progress and Impact of Immigrants. Department of Labor
monograph, N.T.I.S. No. PB80-200454. Washington, D.C.: 1980. --, "The Economic Progress of Immigrants: Some Apparently Universal Patterns," in William Fellner, ed.,
Contemporary Economic Problems, 1979 Washington, D.C.: American Enterprise Institute, 1979, pp.359-399.
--, "The Effect of Americanization on the Earnings of Foreign-Born Men," Journal of Political Economy, October 1978a, pp. 897-922. --, "A Longitudinal Analysis of Occupational Mobility of Immigrants," in ed. Barbara Dennis, Proceedings
of the 30th Annual Winter Meeting, Industrial Relations Research Association, December, 1977, Madison, Wisconsin, 1978b, pp. 20-27.
DeSilva, Arnold, "Earnings of Immigrant Classes in the Early 1980's in Canada: A Re- examination," Working Paper, Human Resource Development Canada, 1996.
Duleep, Harriet Orcutt and Daniel J. Dowhan, “Insights from Longitudinal Data on the Earnings Growth of U.S. Foreign-born Men,” Demography, August 2002.
Duleep, Harriet Orcutt and Mark C. Regets, "The Elusive Concept of Immigrant Quality: The Borjas/Chiswick Debate Revisited." Presented at ASSA, 1992a.
--, "Some Evidence on the Effect of Admission Criteria on Immigrant Assimilation," in Immigration, Language and Ethnic Issues: Canada and the United States, Barry Chiswick (ed.). Washington, DC: American Enterprise Institute, 1992b.
--, "The Elusive Concept of Immigrant Quality," Discussion Paper PRIP-UI-28, Washington, DC: The
20
Urban Institute, 1994a. --, "Country of Origin and Immigrant Earnings," Discussion Paper PRIP-UI-31, Washington, DC: The Urban Institute, 1994b. --, "Admission Criteria and Immigrant Earnings Profiles," International Migration Review, Summer, vol. 30, no. 2, 1996a, pp. 571-590. --, "Family Unification, Siblings, and Skills," in Immigrants and Immigration Policy: Individual Skills,
Family Ties, and Group Identities, Greenwich, CT: JAI Press, 1996b. --, "Are Lower Immigrant Earnings at Entry Associated with Faster Growth? A Review."
Presented at the 1997 annual meeting of the Society of Labor Economists, 1997 and Discussion Paper PRIP-UI-44, Washington, D.C.: The Urban Institute, 1997a.
--, "Measuring Immigrant Wage Growth Using Matched CPS Files," Demography, May 1997b, pp. 239-249. --, "The Decline in Immigrant Entry Earnings: Less Transferable Skills or Lower Ability?"
Quarterly Review of Economics and Finance, vol. 37, 1997c, pp. 189-208. Eckstein, Zvi and Yoram Weiss, "The Absorption of Highly Skilled Immigrants: Israel, 1990-
1995." Working Paper No. 3-98, Economics Dept., Tel-Aviv University, February 1998. Efron, Bradley, The Jackknife, the Bootstrap and Other Resampling Plans, Philadelphia: Society for
Industrial and Applied Mathematics, 1982 Friedberg, Rachel, "The Labor Market Assimilation of Immigrants in the U.S: The Role of Age at Arrival," Brown University, 1993. Fry, Richard, "The Increase in Idleness of Immigrant Arrivals," Quarterly Review of Economics and
Finance, vol. 37, Special Issue on Immigration, 1997, pp. 209-228. Gang, Ira N. and Francisco L. Rivera-Batiz, "Labor Market Effects of Immigration in the United States and Europe" Journal of Population Economics, Vol. 7, No. 2, June 1994, pp. 157-75. Garvey, Deborah, "Immigrants' Earnings and Labor Market Assimilation: A Case Study of New
Jersey," in Thomas J. Espenshade (editor), Keys to Successful Immigration: Implications of the New Jersey Experience, Washington, D.C.: Urban Institute Press, 1997.
Green, David A., "Immigrant Occupational Attainment: Assimilation and Mobility Over Time," Journal of Labor Economics, vol. 17, no. 1, January 1999, pp. 49-79. Jaeger, David A. "Skill Differentials and the Effect of Immigrants on the Wages of Natives", Bureau of Labor Statistics Working Paper 273, March 1996. Kossoudji, Sherrie A., "Immigrant Worker Assimilation: Is It a Labor Market Phenomenon?," Journal of Human Resources, Vol 24, No.3 Summer 1989, pp 494-527 Lalonde, Robert J. and Robert H. Topel, "Economic Impact of International Migration and the Economic
Performance of Migrants," in Handbook of Population and Family Economics, ed. Mark R. Rosenzweig and Oded Stark, Amsterdam: Elsevier, 1997, pp. 800-850.
--, "The Assimilation of Immigrants in the U.S. Labor Market," in George J. Borjas and Richard B. Freeman, editors, Immigration and the Work Force, Chicago: The University of Chicago Press, 1992, pp. 67-92.
--, "Immigrants in the American Labor Market: Quality, Assimilation, and Distributional Effects," The American Economic Review, May 1991. Massey, Douglas and Nolan Malone, ”Pathways to Legal Immigration”, Working Paper, Population
Studies Center, University of Pennsylvania, April 1994. Mayer, R. E., and Wittrock, M. C., “Problem-Solving Transfer,” in D.C. Berliner and R. C.
Calfee (Eds.), Handbook of Educational Psychology, New York: Simon & Schuster Macmillan, 1996
Mincer, Jacob and Haim Ofek, "Interrupted Work Careers: Depreciation and Restoration of Human Capital," Journal of Human Resources, vol. 17, 1982, pp. 1-23. Myers, Dowell and Julie Park, "Poverty Among Immigrant Cohorts: Improvement or Persistence Over

21
Time?," paper presented at Population Association of America, 1997. Regets, Mark C., “Returns to Foreign University Education in the United States,” presented at Population
Association of America Annual Meeting, May 2000 Rivera-Batiz, Francisco, "English Language Proficiency, Quantitative Skills and the Economic Progress of
Immigrants," in Immigrants and Immigration Policy: Individual Skills, Family Ties, and Group Identities, Greenwich, CT: JAI Press, 1996.
Schoeni, Robert, "New Evidence on the Economic Progress of Foreign-Born Men in the 1970s and 1980s," Journal of Human Resources, vol. 32, Fall 1997, pp. 683-740.
Simon, Julian L., and Paul Burstein, Basic Research Methods in Social Science, Third Edition, New York: McGraw-Hill, 1985. First edition by Julian Simon, 1969.
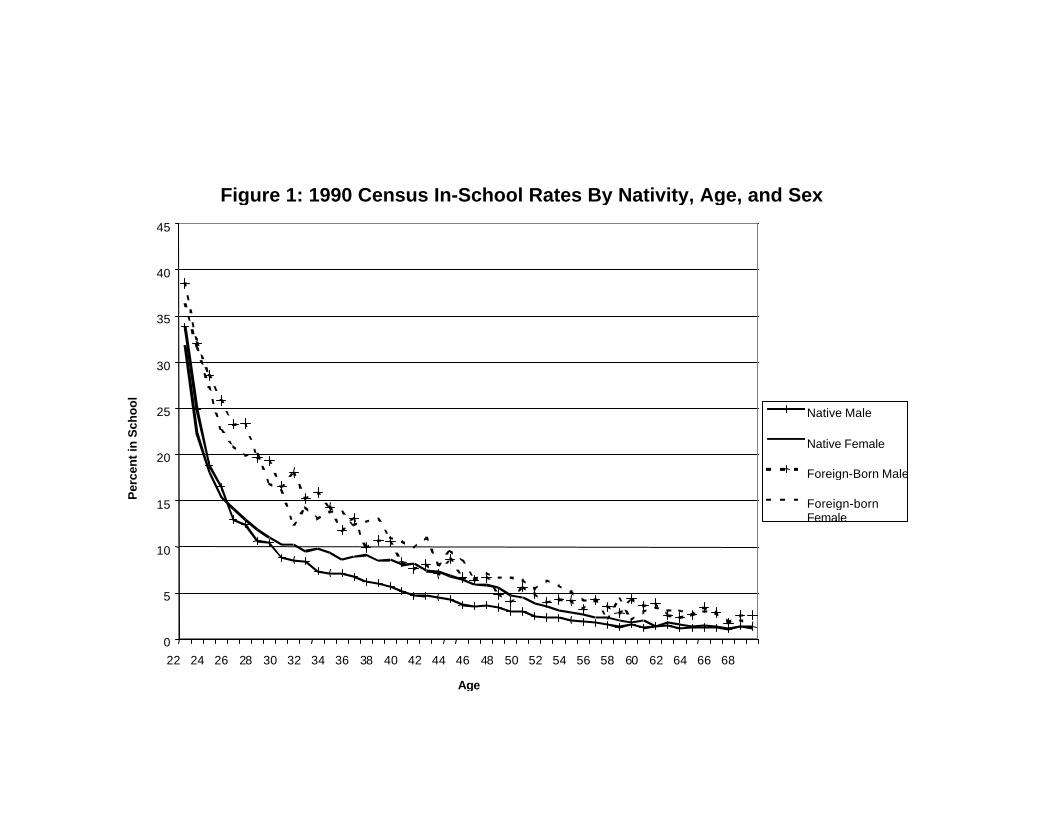
Figure 1: 1990 Census In-School Rates By Nativity, Age, and Sex
0
5
10
15
20
25
30
35
40
45
22 24 26 28 30 32 34 36 38 40 42 44 46 48 50 52 54 56 58 60 62 64 66 68
Age
Per
cen
t in
Sch
oo
l
Native Male
Native Female
Foreign-Born Male
Foreign-bornFemale
3
Table 1: Estimated Relationship of 1979-1989 Real Earnings Growth Rate to Entry Earnings (t-statistics in parentheses)
Full sample, unweighted
Split random sample method, unweighted
Full sample weighted
Split random sample method, weighted
Controls for age and education, weighted
Growth from sample a, Initial Earnings from sample b
Growth from sample b, Initial Earnings from sample a
Growth rate from sample a, initial earnings from sample b
Growth from sample b, initial earnings from sample a
Intercept 1.8562 (8.52)
1.7025 (7.32)
1.8895 (8.03)
2.5878 (8.64)
2.6097 (7.42)
2.4948 (9.39)
2.1999 (8.75)
Earnings1979/ 1000
-.0583 (-5.44)
-.0474 (-4.25)
-.0601 (-5.11)
-.0967 (-5.01)
-.0928 (-4.13)
-.0932 (-5.41)
-.1296 (-7.66)
Older than 40 -.3089 (-.99)
13 or more years of schooling
1.8788 (6.92)
Adjusted R2 .23 .15 .21 .20 .14 .23 .48
Sample size 96 96 96 96 96 96 96
Note that using the split random sample method reduces the sample sizes underlying the estimates of the entry-earnings medians for the country/age/education groups by half. Estimates based on the 1980 Census of Population, 5 percent "A" Public Use Sample and a 6 percent microdata sample created by combining and reweighting the 1990 Census of Population Public Use 5% and 1% Public Use samples.
4
Table 2: Estimated Relationship of 1979-1989 Real Earnings Growth Rate to Entry Earnings By Age and Education Groups (t-statistics in parentheses)
Age 25-39 1-12 Years of
Education
Age 25-39 13 or more Years of
Education
Age 40-64 1-12 Years of
Education
Age 40-64 13 or more Years of
Education
Intercept 2.0652 (4.44)
5.2420 (8.41)
1.7673 (4.84)
0.9038 (7.15)
Earnings1979/1000
-0.1228 (-2.96)
-.2083 (-5.38)
-.1028 (4.84)
-.0203 (-4.421)
Adjusted R2 .25 .55 .34 .45
Sample size 24 24 24 24
Estimates based on the 1980 Census of Population, 5 percent "A" Public Use Sample and a 6 percent microdata sample created by combining and reweighting the 1990 Census of Population Public Use 5% and 1% Public Use samples.
5
Table 3: Estimated Effect of Immigrant Entry Earnings on 1979 to 1989 Real Earnings Growth Rate: By Region
(t-statistics in parentheses)
Full Sample
Unweighted Weighted
Asia Central and South
America
Europe Other Areas
Asia Central and South
America
Europe Other Areas
Intercept 2.3146 (4.53)
4.0736 (6.23)
1.1668 (5.37)
2.0237 (3.02)
4.2883 (6.53)
2.6483 (3.10)
1.3462 (7.271)
4.1704 (6.98)
Earnings1979/1000 -.0864 (-2.84)
-.2630 (-4.78)
-.0305 (-3.42)
-.0556 (-2.08)
-.1899 (-4.03)
-.1992 (-2.42)
-.0311 (-3.93)
-.1240 (-4.23)
Adjusted R2 .2068 .5352 .2340 .2319 .3602 .2032 .2920 .6051
Sample size 28 20 36 12 28 20 36 12
Split Random Sample Method with Growth Rate Based on Sample A and Initial Earnings Based on Sample B
Intercept 2.2030 (5.06)
4.0538 (4.78)
1.2304 (3.57)
1.8811 (3.20)
3.9778 (7.68)
2.8544 (2.86)
1.3125 (4.79)
3.7013 (6.78)
Earnings1979/1000 -.0827 (-3.16)
-.2559 (-3.55)
-.0326 (-2.23)
-.0507 (-2.21)
-.1755 (4.67)
-.2098 (-2.22)
-.0301 (-2.52)
-.1090 (-4.05)
Adjusted R2 .2503 .3797 .1016 .2608 .4348 .1714 .1331 .5833
Sample size 28 20 36 12 28 20 36 12
Estimates based on the 1980 Census of Population, 5 percent "A" Public Use Sample and a 6 percent microdata sample created by combining and reweighting the 1990 Census of Population Public Use 5% and 1% Public Use samples.
6
Table 4: Estimated Relationship of 1979-1989 Real Earnings Growth Rate to Entry Earnings For Immigrants From Economically Developed and Less Developed Countries by Education Groups
(t-statistics in parentheses)
Developed Countries and Regions Less Developed Countries and Regions
All Education Groups
1-12 Years of Education
13 or more Years of Education
All Education Groups
1-12 Years of Education
13 or more Years of Education
Intercept 1.2639 (8.33)
1.3937 (7.67)
1.8272 (10.48)
4.5034 (7.50)
3.7061 (7.27)
6.9314 (11.59)
Earnings1979/
1000
-.0292 (-4.84)
-.1228 (-2.96)
-.0416 (-6.93)
-.2894 (-5.32)
-.3129 (-5.90)
-.3886 (-8.19)
Adjusted R2 .32 .57 .67 .37 .60 .74
Sample size 48 24 24 48 24 24
Developed countries included all country grouping in Europe, Canada, Japan, and Oceania. All other country groupings are included under lesser developed. Estimates based on the 1980 Census of Population, 5 percent "A" Public Use Sample and a 6 percent microdata sample created by combining and reweighting the 1990 Census of Population Public Use 5% and 1% Public Use samples.
7
Table 5: Estimated Effect of Immigrant Entry Earnings on Real Earnings Growth Rate: 10 and 20 Year Growth Rates (weighted) (t-statistics in parentheses)
1965-1969 Entry Cohort Dependent: 10 year growth rate
1965-1969 Entry Cohort Dependent: 20 year growth rate
Intercept 1.0463 (7.927)
1.3479 (7.277)
Entry Earnings/1000 -.0467 (-6.717)
-.0604 (-6.186)
Older than 40 -.2455 (2.294)
-.4897 (-3.261)
13 years or more of schooling .8463 (8.068)
1.2392 (8.418)
Adjusted R-squared .5487 .5765
n 81 81
Estimates based on the 1970 Census of Population 1 percent State Public Use Sample based on the 5% questionnaire, the 1980 Census of Population 5 percent "A" Public Use Sample, and a 6 percent microdata sample created by combining and reweighting the 1990 Census of Population Public Use 5% and 1% Public Use samples.
8
Table 6: The Correlations Between Change in Initial Earnings and Change in Earnings Growth: 1965-1970 & 1975-1980 Entry Cohorts (weighted) (p values in parentheses)
Full sample
Split Random Sample Method
Growth from sample a, Initial Earnings from sample b
Growth from sample b, Initial Earnings from sample a
-.70735 (.0001)
-.49716 (.0001)
-.40599 (.0005)
The sample size for all analyses shown in this table is 81 observations. Estimates based on the 1970 Census of Population 1 percent State Public Use Sample based on the 5% questionnaire, the 1980 Census of Population 5 percent "A" Public Use Sample, and a 6 percent microdata sample created by combining and reweighting the 1990 Census of Population Public Use 5% and 1% Public Use samples.
9
Table 7: OLS Estimates of the Effect of Changes in Entry Earnings on Changes in Earnings Growth Rates (weighted) (t-statistics in parentheses)
Split random sample method
Full sample
Growth from sample a, Initial Earnings from sample b
Growth from sample b, Initial Earnings from sample a
Intercept -.1099 (-6.38)
.0482 (0.18)
.3055 (1.27)
Change in Entry Earnings/100
-.0236 (-8.89)
-.0183 (-4.73)
-.0127 (-3.66)
Adjusted R2 .4940 .2361 .1525
Sample size 81 70 70
Estimates based on the 1970 Census of Population 1 percent State Public Use Sample based on the 5% questionnaire, the 1980 Census of Population 5 percent "A" Public Use Sample, and a 6 percent microdata sample created by combining and reweighting the 1990 Census of Population Public Use 5% and 1% Public Use samples.
10
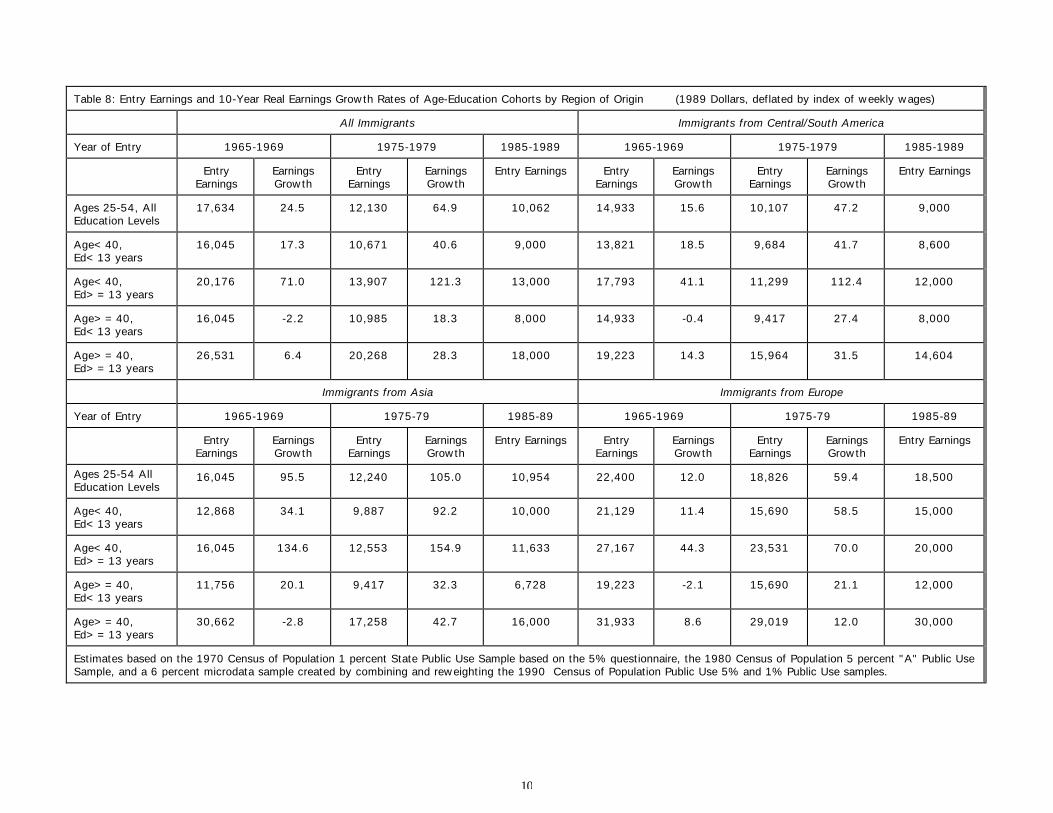
Table 8: Entry Earnings and 10-Year Real Earnings Growth Rates of Age-Education Cohorts by Region of Origin (1989 Dollars, deflated by index of weekly wages)
All Immigrants Immigrants from Central/South America
Year of Entry 1965-1969 1975-1979 1985-1989 1965-1969 1975-1979 1985-1989
Entry Earnings
Earnings Growth
Entry Earnings
Earnings Growth
Entry Earnings Entry Earnings
Earnings Growth
Entry Earnings
Earnings Growth
Entry Earnings
Ages 25-54, All Education Levels
17,634 24.5 12,130 64.9 10,062 14,933 15.6 10,107 47.2 9,000
Age<40, Ed<13 years
16,045 17.3 10,671 40.6 9,000 13,821 18.5 9,684 41.7 8,600
Age<40, Ed>=13 years
20,176 71.0 13,907 121.3 13,000 17,793 41.1 11,299 112.4 12,000
Age>=40, Ed<13 years
16,045 -2.2 10,985 18.3 8,000 14,933 -0.4 9,417 27.4 8,000
Age>=40, Ed>=13 years
26,531 6.4 20,268 28.3 18,000 19,223 14.3 15,964 31.5 14,604
Immigrants from Asia Immigrants from Europe
Year of Entry 1965-1969 1975-79 1985-89 1965-1969 1975-79 1985-89
Entry Earnings
Earnings Growth
Entry Earnings
Earnings Growth
Entry Earnings Entry Earnings
Earnings Growth
Entry Earnings
Earnings Growth
Entry Earnings
Ages 25-54 All Education Levels
16,045 95.5 12,240 105.0 10,954 22,400 12.0 18,826 59.4 18,500
Age<40, Ed<13 years
12,868 34.1 9,887 92.2 10,000 21,129 11.4 15,690 58.5 15,000
Age<40, Ed>=13 years
16,045 134.6 12,553 154.9 11,633 27,167 44.3 23,531 70.0 20,000
Age>=40, Ed<13 years
11,756 20.1 9,417 32.3 6,728 19,223 -2.1 15,690 21.1 12,000
Age>=40, Ed>=13 years
30,662 -2.8 17,258 42.7 16,000 31,933 8.6 29,019 12.0 30,000
Estimates based on the 1970 Census of Population 1 percent State Public Use Sample based on the 5% questionnaire, the 1980 Census of Population 5 percent "A" Public Use Sample, and a 6 percent microdata sample created by combining and reweighting the 1990 Census of Population Public Use 5% and 1% Public Use samples.
11
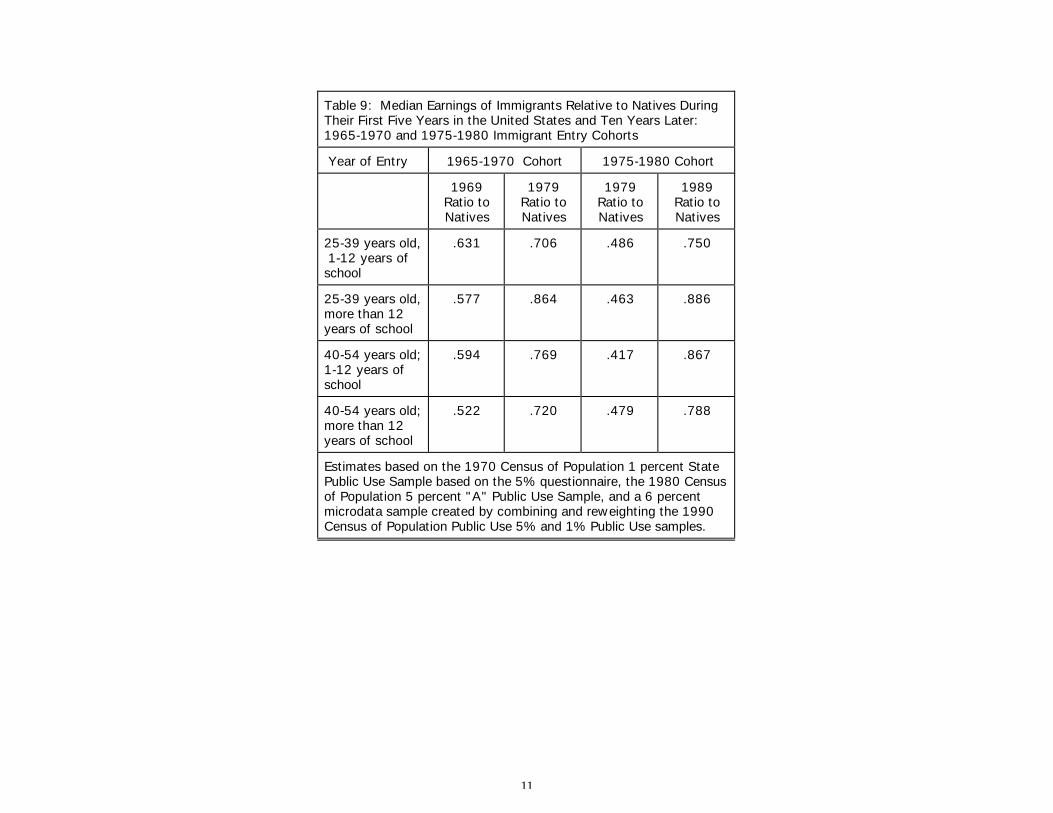
Table 9: Median Earnings of Immigrants Relative to Natives During Their First Five Years in the United States and Ten Years Later: 1965-1970 and 1975-1980 Immigrant Entry Cohorts
Year of Entry 1965-1970 Cohort 1975-1980 Cohort
1969 Ratio to Natives
1979 Ratio to Natives
1979 Ratio to Natives
1989 Ratio to Natives
25-39 years old, 1-12 years of school
.631 .706 .486 .750
25-39 years old, more than 12 years of school
.577 .864 .463 .886
40-54 years old; 1-12 years of school
.594 .769 .417 .867
40-54 years old; more than 12 years of school
.522 .720 .479 .788
Estimates based on the 1970 Census of Population 1 percent State Public Use Sample based on the 5% questionnaire, the 1980 Census of Population 5 percent "A" Public Use Sample, and a 6 percent microdata sample created by combining and reweighting the 1990 Census of Population Public Use 5% and 1% Public Use samples.

IZA Discussion Papers No.
Author(s) Title
Area Date
616 R. Hujer U. Blien M. Caliendo C. Zeiss
Macroeconometric Evaluation of Active Labour Market Policies in Germany – A Dynamic Panel Approach Using Regional Data
6 10/02
617 L. Magee M. R. Veall
Allocating Awards Across Noncomparable Categories
1 10/02
618 A. L. Booth M. Francesconi G. Zoega
Oligopsony, Institutions and the Efficiency of General Training
6 10/02
619 H. Antecol D. A. Cobb-Clark
The Changing Nature of Employment-Related Sexual Harassment: Evidence from the U.S. Federal Government (1978–1994)
5 10/02
620 D. A. Cobb-Clark
Public Policy and the Labor Market Adjustment of New Immigrants to Australia
1 10/02
621 G. Saint-Paul
On Market Forces and Human Evolution
5 11/02
622 J. Hassler J. V. Rodriguez Mora
Should UI Benefits Really Fall Over Time?
3 11/02
623 A. R. Cardoso P. Ferreira
The Dynamics of Job Creation and Destruction for University Graduates: Why a Rising Unemployment Rate Can Be Misleading
1 11/02
624 J. Wagner R. Sternberg
Personal and Regional Determinants of Entrepreneurial Activities: Empirical Evidence from the REM Germany
1 11/02
625 F. Galindo-Rueda Endogenous Wage and Capital Dispersion, On-the-Job Search and the Matching Technology
3 11/02
626 A. Kunze Gender Differences in Entry Wages and Early Career Wages
5 11/02
627 J. Boone J. C. van Ours
Cyclical Fluctuations in Workplace Accidents 5 11/02
628 R. Breunig D. A. Cobb-Clark Y. Dunlop M. Terrill
Assisting the Long-Term Unemployed: Results from a Randomized Trial
6 11/02
629 I. N. Gang K. Sen M.-S. Yun
Caste, Ethnicity and Poverty in Rural India
2 11/02
630 W. Arulampalam State Dependence in Unemployment Incidence: Evidence for British Men Revisited
3 11/02
631 H. O. Duleep M. Regets
The Elusive Concept of Immigrant Quality: Evidence from 1970-1990
1 11/02
An updated list of IZA Discussion Papers is available on the center‘s homepage www.iza.org.