the effects of hypoxia on the distribution, abundance and diversity of benthic macroinvertebrates of...
TRANSCRIPT
Current Advances in Environmental Science CAES
CAES Volume 2, Issue 3 Aug. 2014 PP. 90-100 www.vkingpub.com © American V-King Scientific Publishing 90
The Effects of Hypoxia on the Distribution, Abundance and Diversity of Benthic
Macroinvertebrates of Lagos Lagoon, Nigeria Nkwoji Joseph Ahamefula
Department of Marine Sciences, University of Lagos, Nigeria [email protected]
Abstract-The Lagos lagoon, Nigeria receives lots of organic wastes from anthropogenic sources. The biodegradation of these wastes by aerobic microbes has resulted in the depletion of the dissolved oxygen. Study of this area of the lagoon was conducted for two years to investigate the impact of hypoxia on the distribution, abundance and diversity of benthic macroinvertebrates. Water and benthic samples were collected monthly along the study stretch and analysed in a standard laboratory. Temporal variation in water physico-chemistry was largely controlled by rainfall pattern while the spatial variation was influenced by proximity to the Harbour as well as the pollution sources and types. A total of 3,159 individuals comprising three phyla, five classes, nineteen families and twenty three species were recorded. Iddo I, Iddo II, Ogudu and Agboiyi monitoring stations recorded very low individuals, but, relatively high number of polychaetes. Benthic macroinvertebrate community was dominated by the molluscs. Margalef’s index of species richness ranged from 0.79 to 2.57 while Shannon-Wiener index ranged from 0.40 to 2.19. Species evenness index ranged from 0.29 to 0.80. There was generally low biodiversity indicating the stressed nature of the study area.
Keywords- Hypoxia; Diversity; Benthic; Macroinvertebrates; Lagoon
I. INTRODUCTION
For a very long time now, the discharge of untreated sewage has been a major source of pollution of the Lagos lagoon in Lagos, Nigeria. The microbial degradation of the sewage results in the depletion of the dissolved oxygen in the water and this impacts on the aquatic biota. [1] stated that the healthy nature or pollution level of an aquatic ecosystem can be determined by the success or otherwise of the zoobenthos of that ecosystem. The high biochemical oxygen demand of microbes in this water translates into low dissolved oxygen. This has its major detrimental impacts on the chemistry of the water and sediment and on the respiratory activities of aerobic aquatic biota. The sedentary nature of the macro invertebrates makes them very vulnerable.
Benthic macroinvertebrates which are spineless aquatic fauna inhabiting the bottom, constitute an important part of the aquatic trophic relationship. Many of them feed on algae and bacteria, which are on the lower end of the food chain [2]. Some shred and eat leaves and other organic matter that enters the water. As a result of their abundance and critical
position in the aquatic food chain, the benthic macroinvertebrates plays a major role in the natural flow of energy and nutrients [3. As they die, they decay, releasing nutrients that are reused by aquatic plants and animals in the trophic levels. In view of this, they can be used to evaluate the health of the aquatic ecosystem.
Lagos lagoon has received a remarkable research attention and quite a number of published information are available for different aspects of the hydrobiology and physico-chemical characteristics Early works on the macrobenthic fauna of the Lagos lagoon were on genus Pachymelania [4], Iphigenia truncata [5]. Other works on benthic macroinvertebrates include the reproductive and population dynamics of Capitella capitata [6], and the temporal variability of benthic macrofauna of the Lagoon and Harbour [7]. The environmental consequences of pollution on the Lagos lagoon has also been highlighted [8]. [9] worked on the faecal pollution of the Lagos Lagoon while [10] studied the hydrochemical properties of some benthic diatoms of a sewage disposal site at Iddo along the Lagos lagoon.
[11] investigated the microbial decomposition of faeces in the Lagos lagoon and reiterated that the continuous monitoring of the sewage disposal site was necessary to evaluate any changing environmental condition in the station that may induce bloom of nuisance species. [12] worked on the seasonal and spatial distribution of the population of the polychaete, Capitella capitata in Lagos lagoon and recorded that the abundance of this polychaete was influenced by sediment type, organic content of the sediment and the sediment metals and hydrocarbon content of the sediment. [13] worked on the physico-chemical and macrobenthic invertebrate characteristics of a sewage dumpsite along the bank of Lagos lagoon and recorded a relatively high abundance of the polychaete Nereidae in the station closest to the sewage dump. This present study pays greater attention to the impact of low oxygen on the distribution, abundance and diversity of benthic macroinvertebrates west of Lagos lagoon, Nigeria.
II. MATERIALS AND METHODS
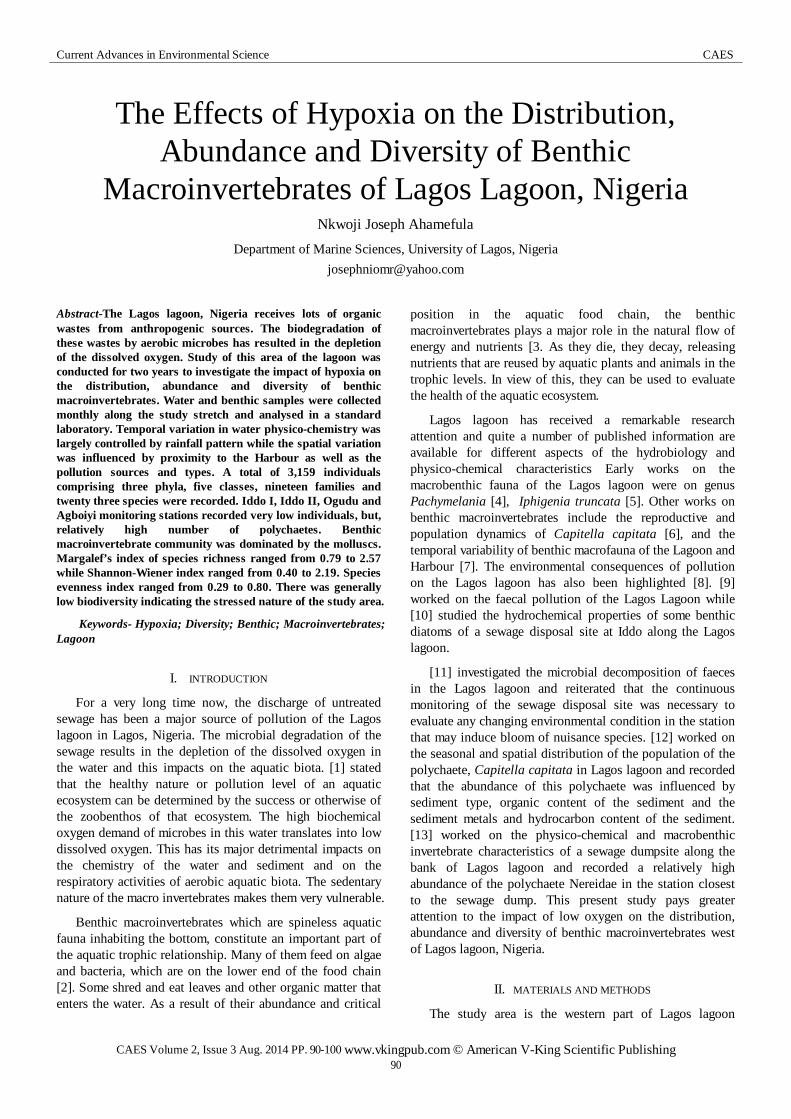
The study area is the western part of Lagos lagoon
Current Advances in Environmental Science CAES
CAES Volume 2, Issue 3 Aug. 2014 PP. 90-100 www.vkingpub.com © American V-King Scientific Publishing 91
(Figure 1). The lagoon is located between latitude 6° 26' and 6°38' N, longitude 3° 23' and 3° 43' E. It extends eastwards for about 200km from the Nigerian-Benin Republic border to the western limit of the transgressive mud coast covering an area of about 208km2 [14]. The lagoon sediments range between mud, sandy mud, muddy sand, and sand [15] and has a defined salinity gradient, linked with the rainfall pattern [16]. Twelve sampling stations selected for this study were based on their importance as sources of different forms
of contaminants into the lagoon. The stations stretch for about 9.5 miles (15.29km) in length between Iddo and Agboiyi axis of the lagoon. The spatial distance between sampling stations is about 0.75 miles (1.2km). Abule-Agege and Mid-lagoon study stations served as control because they are relatively distanced from anthropogenic activities. Locations of the stations were determined with the aid of the Global Positioning System.
Fig. 1 Map of Lagos lagoon showing the study stations
A. Collection of Samples
Monthly sampling for water was conducted for twenty four months (January, 2007 – December, 2008) at the twelve stations (Table I) between the hours of 0800 and 1200. Bottom water samples were collected with 1dm3 Hydrobios bottom water sampler at each study station, with motorized boat, stored in a labeled container and transported to the laboratory where it was stored in the refrigerator at -50C
prior to further analyses. 250ml dissolved oxygen bottles were used to collect water samples for dissolved oxygen estimation using iodometric Winkler’s method (Table II). Benthic samples were collected concurrently using a Van-veen grab. At each study station, two grab hauls were sieved, fixed and labeled for macrobenthic fauna analysis while one grab haul was collected in a polyethene bag, labeled and stored at -50C for sediment analysis.
TABLE I THE STUDY STATIONS, THEIR COORDINATES AND APPROXIMATE DEPTHS
S/no. Study Station Coordinates Approx. Depth (m)
1 Iddo I Latitude 6° 28' 01.9'' N, Longitude 3° 22' 57.9'' E 3.64
2 Iddo II Latitude 6°28' 03.2'' N, Longitude 3°23' 02.4'' E 3.38
3 Carter Bridge Latitude 6° 28' 09.0'' N, Longitude 3° 23' 05.2'' E 1.97
4 Oyingbo Jetty Latitude 6° 28' 29.2'' N, Longitude 3° 23' 13.0'' E 2.16
5 Okobaba Latitudes 6° 29' 25.2''N, Longitude 3°23' 49.2'' E 1.19
6 Makoko Latitude 6° 29' 51.4'' N, Longitude 3° 23' 46.4'' E 1.66
7 Abule-Agege Latitude 6°30' 19.7'' N, Longitude 3° 23' 55.8'' E 0.81
8 Mid-lagoon Latitude 6°31' 23.4'' N, Longitude 3° 24' 33.0'' E 2.20
9 Unilag lagoon front Latitude 6° 31' 08.2 N, Longitude 3° 24' 10.7'' E 1.60
10 Eledu Creek Latitude 6° 31' 24.2'' N, Longitude 3° 23' 57.7'' E 0.90
11 Ogudu Latitude 6° 33' 49.4'' N, Longitude 3° 24' 11.3'' E 0.40
12 Agboiyi Latitude 6°33' 55.6'' N, Longitude 3° 24' 14.5'' E 2.32

Current Advances in Environmental Science CAES
CAES Volume 2, Issue 3 Aug. 2014 PP. 90-100 www.vkingpub.com © American V-King Scientific Publishing 92
B. Measurement of Physico-Chemical Characteristics
TABLE II SUMMARY OF ENVIRONMENTAL FACTORS AND METHOD / DEVICE USED FOR THEIR ESTIMATIONS
Parameter/ Unit Method / Device Ref. Std Limits 1 Air temperature (oC) Mercury – in – glass thermometer 2 Water temperature (oC) Mercury – in – glass thermometer 3 Rainfall (mm) Acquired from NIMET, Oshodi, Lagos 4 Depth (cm) Graduated pole [17] 5 Turbidity (NTU) Horiba water checker (Model U10) [18] ≤ 5 NTU 6 Total Dissolved Solids (mg/L) Hannah pH-EC-TDS meter (Model 9812) [18] ≤ 200 mg/L 7 Total Suspended Solids (mg/L) Gravimetric [18] 8 Salinity (‰) Horiba water checker (Model U10) [18] 9 Dissolved oxygen (mg/L) Titration [18] 5 mg/L 10 Biological oxygen demand (mg/L) Incubation and Titration [18] 11 Chemical oxygen demand (mg/L) Titration [18] 12 pH Hannah pH-EC-TDS meter (Model 9812) [18] 6.5 - 8.5 13 Conductivity (mS/cm) Horiba water checker (Model U10) [18] 14 Nitrate – nitrogen (mg/L) Hach Spectrophotometer (Model DR/2010) [18] 10mg/L 15 Phosphate – phosphorus (mg/L) Hach Spectrophotometer (Model DR/2010) [18] 16 Sulphate (mg/L) Hach Spectrophotometer (Model DR/2010) [18] 17 Oil and Grease (mg/L) Gravimetric [18]
18 Iron (mg/L) Atomic Absorption Spectrophotometer Perkin Elmer 5000 AAS
[18] 300µg/L
19 Copper (mg/L) Atomic Absorption Spectrophotometer Perkin Elmer 5000 AAS
[18]
20 Zinc (mg/L) Atomic Absorption Spectrophotometer Perkin Elmer 5000 AAS
[18]
C. Benthic Macrofauna Analyses
Sieving and fixing for the benthic macroinvertebrates were conducted on the field with 0.55mm mesh size sieve and 10% formalin respectively. Treatment and sorting of pure samples were conducted at the Nigerian Institute for Oceanography and Marind Research, Lagos laboratory. Relevant texts [19], [20], [21] were used for identification. [22], SPSS 11.0 Window application and Microsoft Excel were used for the biostatistical analyses. Data processing involved the calculation of biological indices such as Margalef’s index for species richness, Shannon-Wiener and Simpson’s indices for species diversity, and the Equitability index for evenness of the community:
1) Margalef’s Index: This is a species richness index and was used to measure the diversity in the community structure. The equation below was applied in the calculation:
NSdln
1−=
Where: d = Species richness index
S = Number of species in a population
N = Total number of individuals in S species
2) Shannon-Wiener diversity index: This is a measure of faunal diversity [23]. It usually indicates the degree of uncertainty involved in predicting the species identified of randomly selected individuals. It is calculated using the following equation:
Where: = Shannon and Wiener diversity Index
= Counts denoting the ith species ranging from 1 – R
= Proportion that the ith species represents in terms of numbers of individuals with respect to the total number of individuals in the sampling space as whole.
3) Species Equitability or Evenness index: Species evenness or equitability [23] was used to calculate how evenly the species are distributed in a community. It was determined by the equation:
Where: J = Equitability index H ʹ = Shannon-Weiner index
III. RESULTS
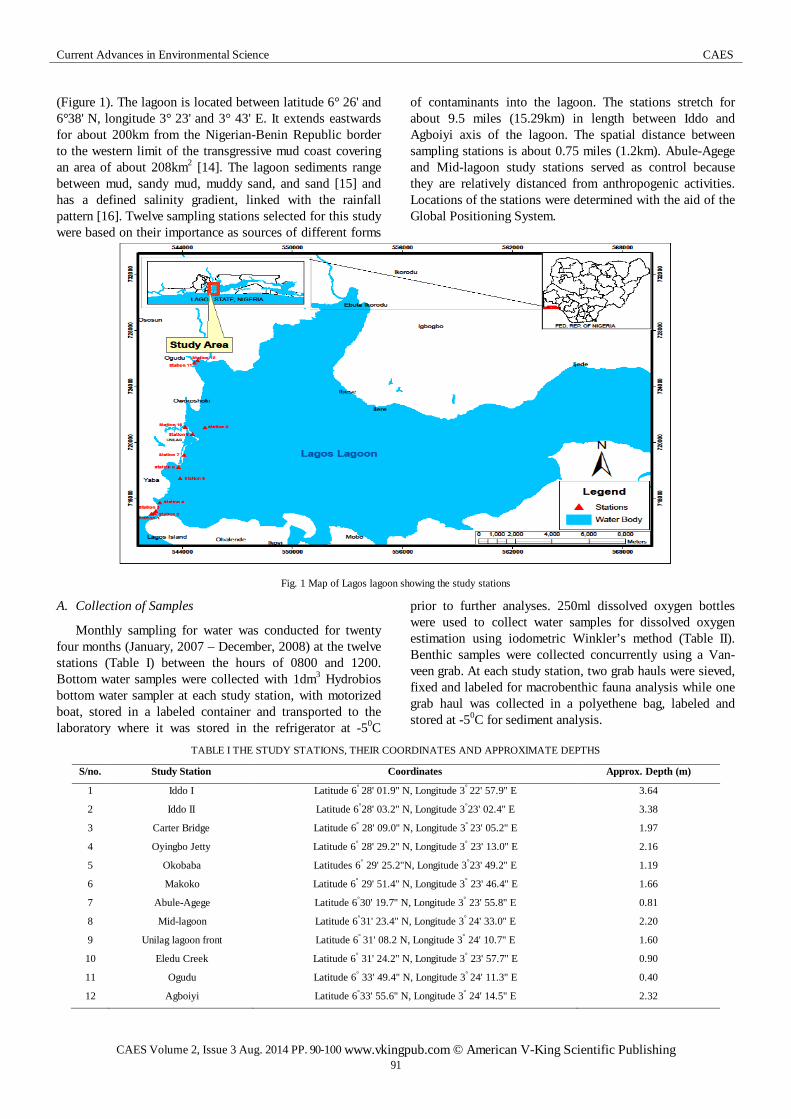
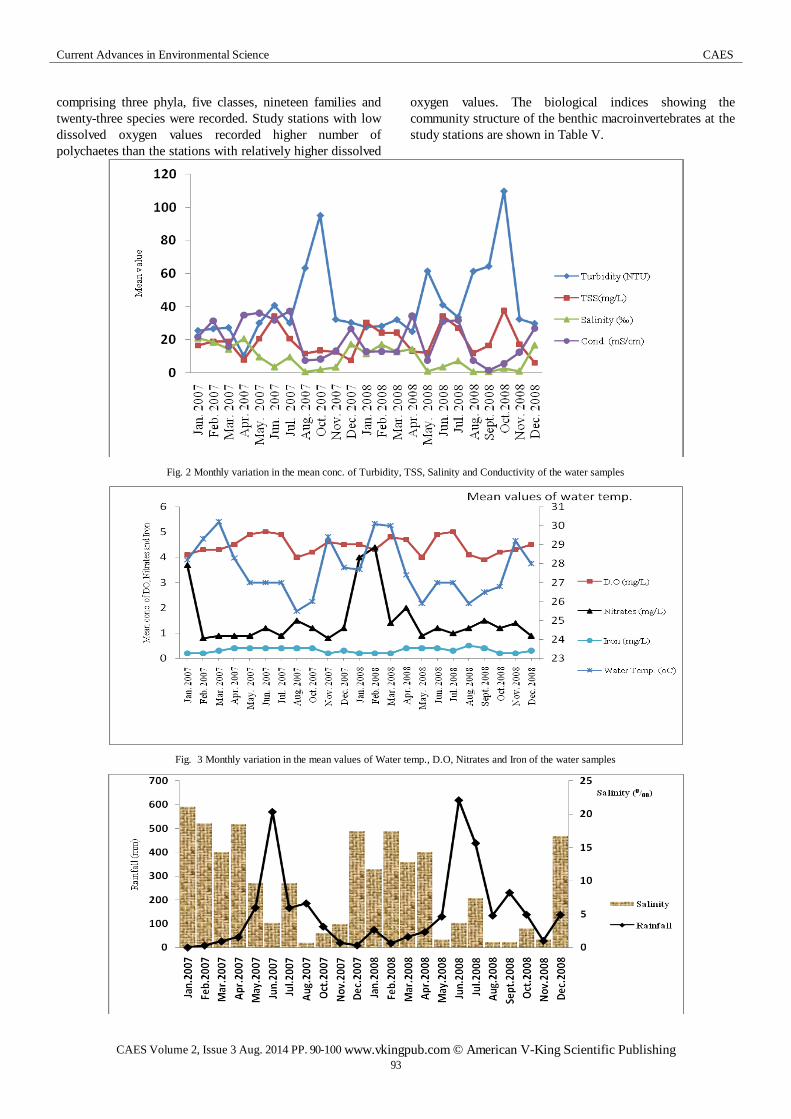
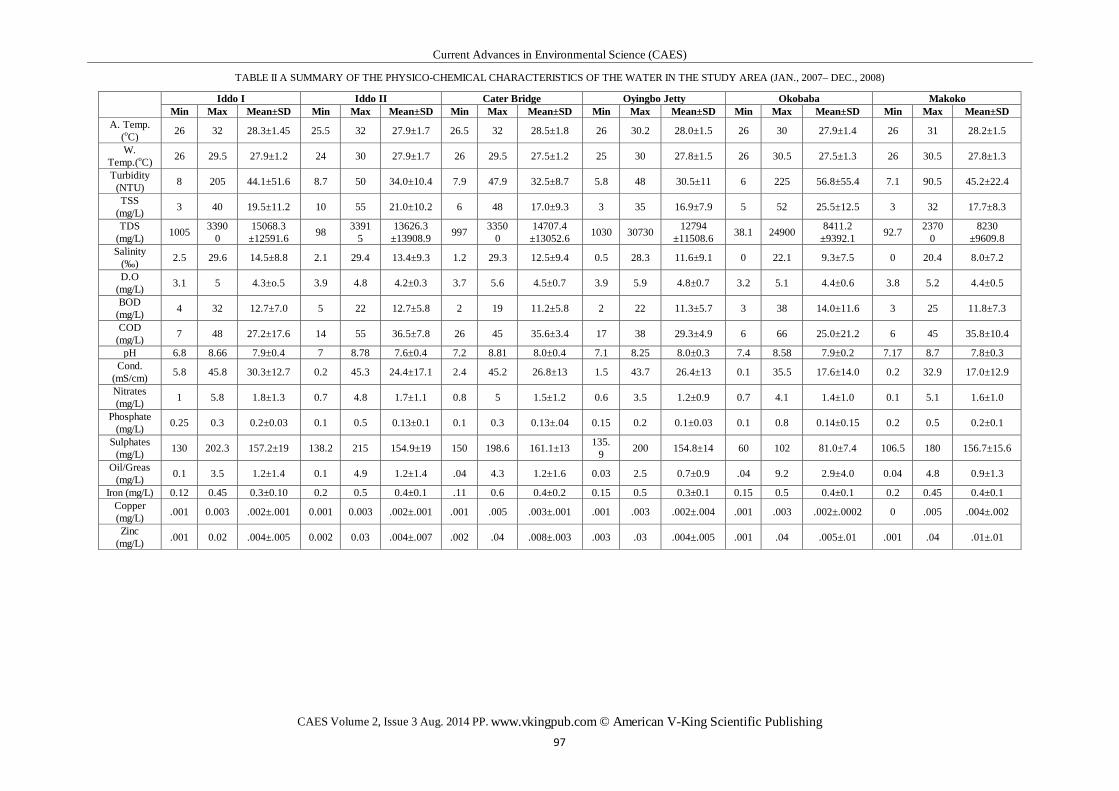
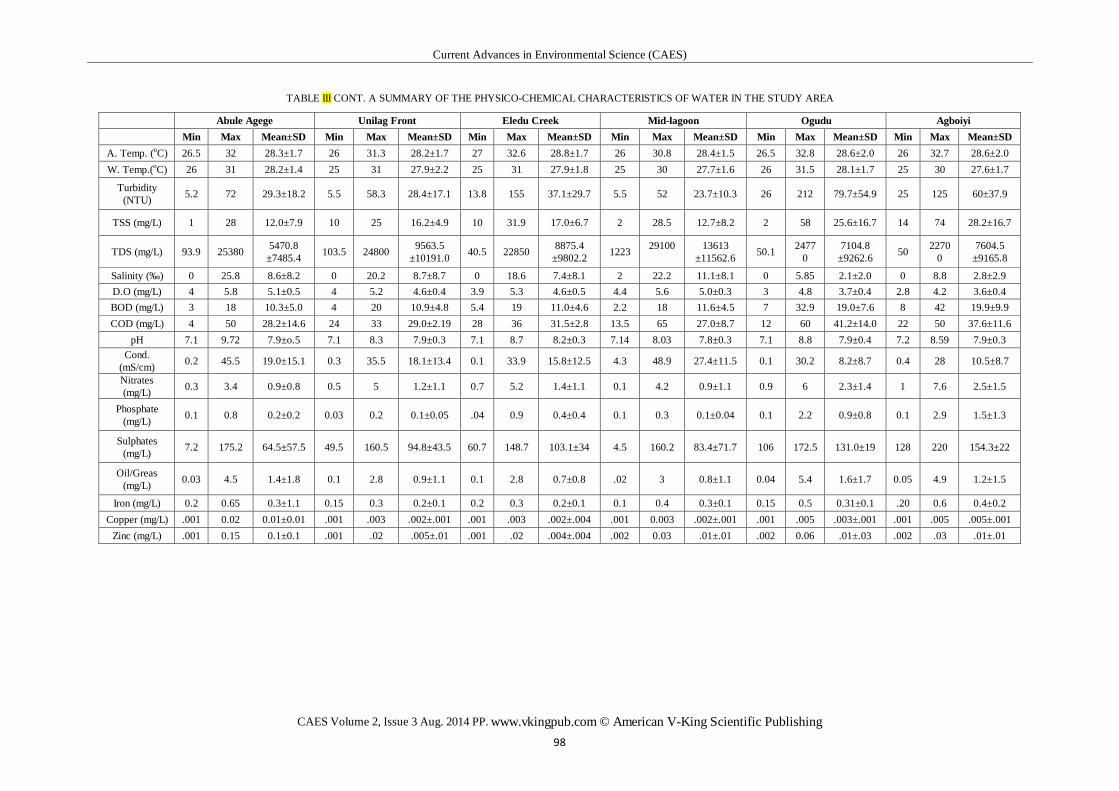
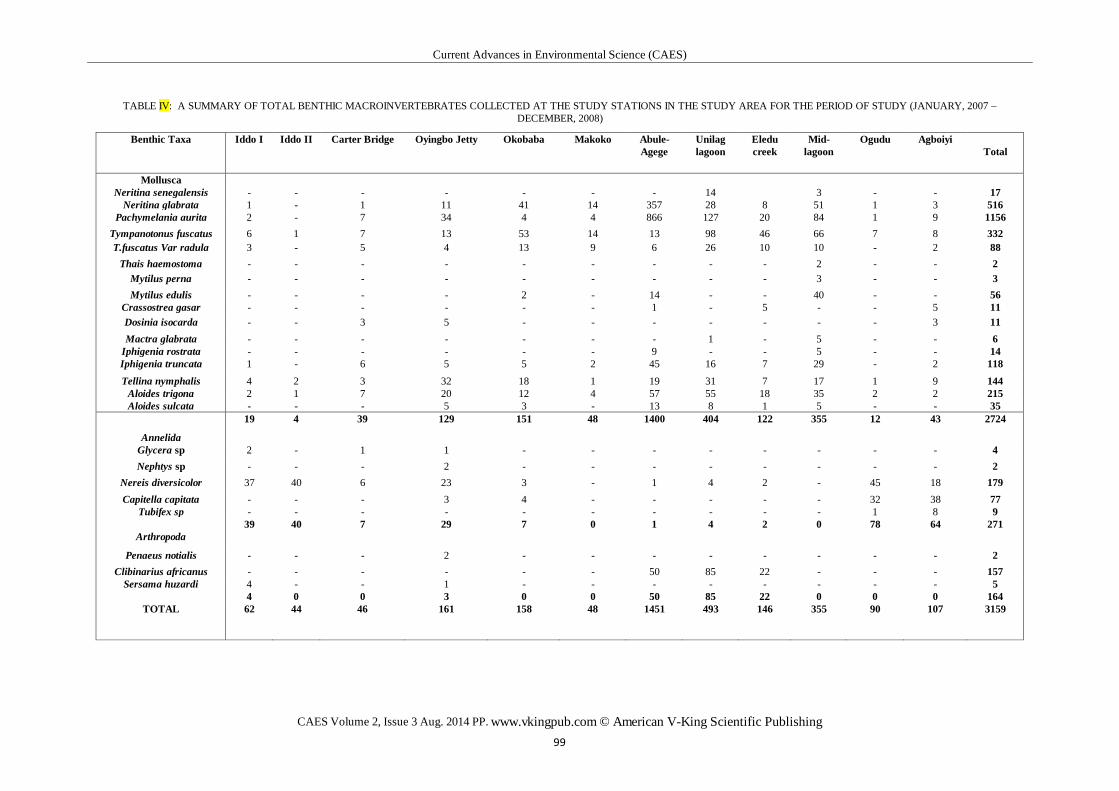
The summary of the physico-chemical characteristics of the water samples in the study stations for the period of study is shown in Table III. The monthly variation in the mean concentration of such parameters as turbidity, TSS, salinity and conductivity in the water samples is shown in Figure 2 while that of the dissolved oxygen, nitrates, iron and water temperature is represented in Figure 3. The relationship between the monthly rainfall distribution and the mean salinity of the water of the study station is shown in Figure 4. The relationship between the abundance of polychaete worms and the values of dissolved oxygen in the water is presented in Figure 5. A summary of the benthic macroinvertebrates collected at the study stations is presented in Table IV. A total of 3,159 individuals
Current Advances in Environmental Science CAES
CAES Volume 2, Issue 3 Aug. 2014 PP. 90-100 www.vkingpub.com © American V-King Scientific Publishing 93
comprising three phyla, five classes, nineteen families and twenty-three species were recorded. Study stations with low dissolved oxygen values recorded higher number of polychaetes than the stations with relatively higher dissolved
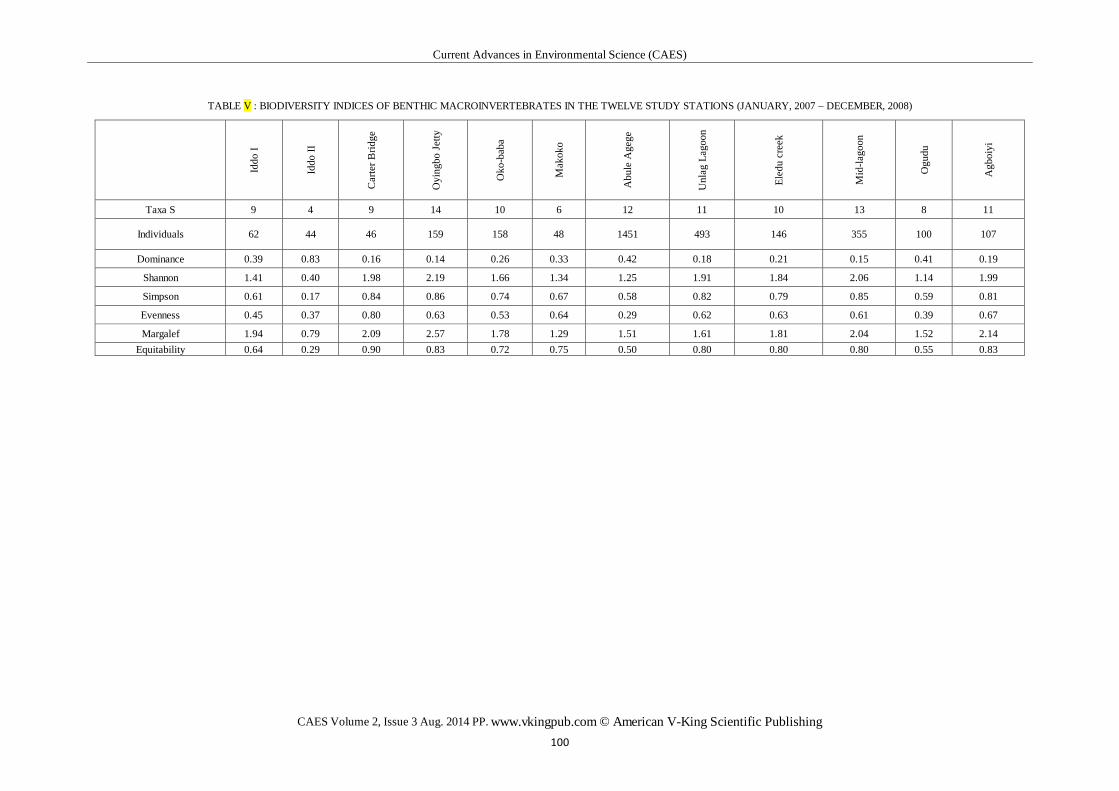
oxygen values. The biological indices showing the community structure of the benthic macroinvertebrates at the study stations are shown in Table V.
Fig. 2 Monthly variation in the mean conc. of Turbidity, TSS, Salinity and Conductivity of the water samples
Fig. 3 Monthly variation in the mean values of Water temp., D.O, Nitrates and Iron of the water samples
Current Advances in Environmental Science CAES
CAES Volume 2, Issue 3 Aug. 2014 PP. 90-100 www.vkingpub.com © American V-King Scientific Publishing 94
Fig. 4 Monthly variation in rainfall distribution and mean salinity in the western part of Lagos lagoon (January, 2007 – December, 2008)
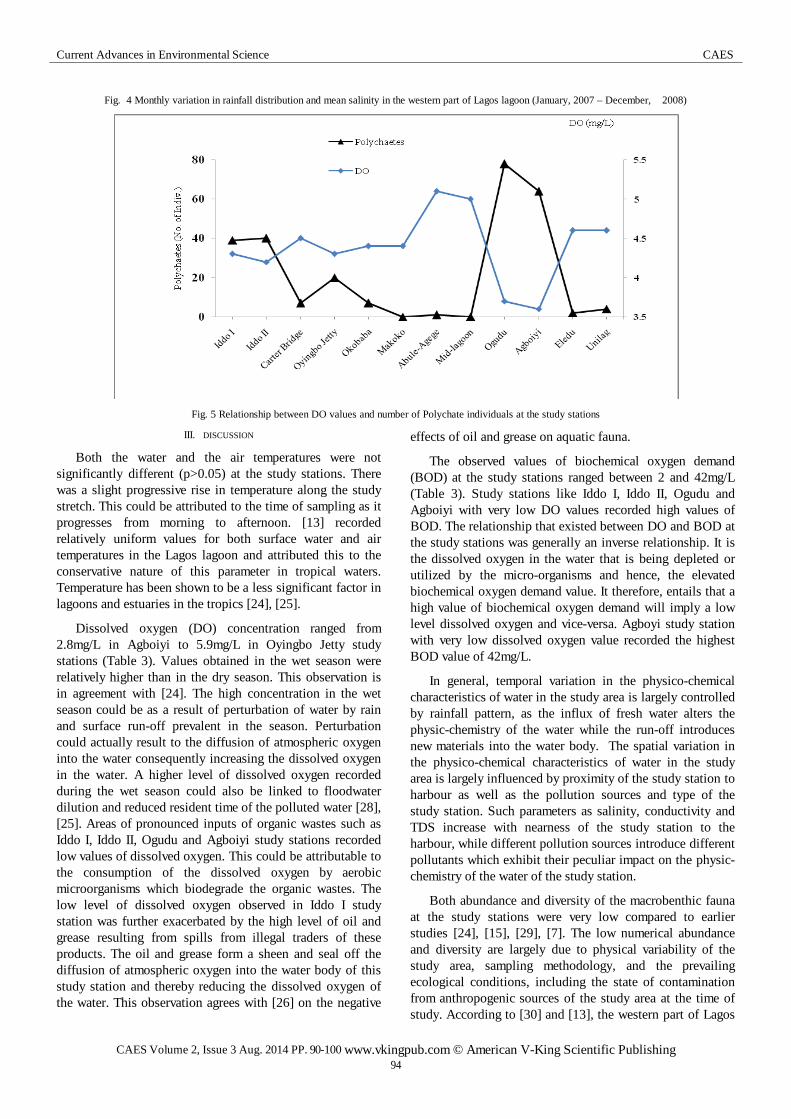
Fig. 5 Relationship between DO values and number of Polychate individuals at the study stations
III. DISCUSSION
Both the water and the air temperatures were not significantly different (p>0.05) at the study stations. There was a slight progressive rise in temperature along the study stretch. This could be attributed to the time of sampling as it progresses from morning to afternoon. [13] recorded relatively uniform values for both surface water and air temperatures in the Lagos lagoon and attributed this to the conservative nature of this parameter in tropical waters. Temperature has been shown to be a less significant factor in lagoons and estuaries in the tropics [24], [25].
Dissolved oxygen (DO) concentration ranged from 2.8mg/L in Agboiyi to 5.9mg/L in Oyingbo Jetty study stations (Table 3). Values obtained in the wet season were relatively higher than in the dry season. This observation is in agreement with [24]. The high concentration in the wet season could be as a result of perturbation of water by rain and surface run-off prevalent in the season. Perturbation could actually result to the diffusion of atmospheric oxygen into the water consequently increasing the dissolved oxygen in the water. A higher level of dissolved oxygen recorded during the wet season could also be linked to floodwater dilution and reduced resident time of the polluted water [28], [25]. Areas of pronounced inputs of organic wastes such as Iddo I, Iddo II, Ogudu and Agboiyi study stations recorded low values of dissolved oxygen. This could be attributable to the consumption of the dissolved oxygen by aerobic microorganisms which biodegrade the organic wastes. The low level of dissolved oxygen observed in Iddo I study station was further exacerbated by the high level of oil and grease resulting from spills from illegal traders of these products. The oil and grease form a sheen and seal off the diffusion of atmospheric oxygen into the water body of this study station and thereby reducing the dissolved oxygen of the water. This observation agrees with [26] on the negative
effects of oil and grease on aquatic fauna.
The observed values of biochemical oxygen demand (BOD) at the study stations ranged between 2 and 42mg/L (Table 3). Study stations like Iddo I, Iddo II, Ogudu and Agboiyi with very low DO values recorded high values of BOD. The relationship that existed between DO and BOD at the study stations was generally an inverse relationship. It is the dissolved oxygen in the water that is being depleted or utilized by the micro-organisms and hence, the elevated biochemical oxygen demand value. It therefore, entails that a high value of biochemical oxygen demand will imply a low level dissolved oxygen and vice-versa. Agboyi study station with very low dissolved oxygen value recorded the highest BOD value of 42mg/L.
In general, temporal variation in the physico-chemical characteristics of water in the study area is largely controlled by rainfall pattern, as the influx of fresh water alters the physic-chemistry of the water while the run-off introduces new materials into the water body. The spatial variation in the physico-chemical characteristics of water in the study area is largely influenced by proximity of the study station to harbour as well as the pollution sources and type of the study station. Such parameters as salinity, conductivity and TDS increase with nearness of the study station to the harbour, while different pollution sources introduce different pollutants which exhibit their peculiar impact on the physic-chemistry of the water of the study station.
Both abundance and diversity of the macrobenthic fauna at the study stations were very low compared to earlier studies [24], [15], [29], [7]. The low numerical abundance and diversity are largely due to physical variability of the study area, sampling methodology, and the prevailing ecological conditions, including the state of contamination from anthropogenic sources of the study area at the time of study. According to [30] and [13], the western part of Lagos

Current Advances in Environmental Science CAES
CAES Volume 2, Issue 3 Aug. 2014 PP. 90-100 www.vkingpub.com © American V-King Scientific Publishing 95
lagoon and its adjacent creeks are under stress resulting from pollution sources from both industrial and anthropogenic sources. The sedentary nature of the benthic macroinvertebrates makes them very vulnerable to the impacts of the pollution [24]. However, some of the species have some adaptive features, both physiological and morphological, to pollution and these have given them some advantages and resulted to their relative abundance.
Margalef’s index of species richness ranged from 0.79 to 2.57 while Shannon-Wiener index ranged from 0.40 to 2.19. Both indices were highest at Oyingbo Jetty monitoring station. The highest number of species was collected at this station. This could have accounted for high Margalef’s and Shannon-Wiener indices, even when the station recorded comparatively low number of individuals. The opportunistic nature of the nereid polychaetes could have attributed to the high dominance index in Iddo 2 monitoring station where these polychaetes were found in abundance.
IV. CONCLUSIONS
Iddo II has the least number of species and individual organisms. This monitoring station shows the highest value of the dominance index. The station was dominated by the polychaetes and this could be attributed to their adaptation to hypoxia. The station is the point source of untreated sewage dump with its attendant low dissolved resulting from the biodegradation of the sewage. Other benthic macroinvertebrates were almost virtually missing at this station and this underscores the impact that hypoxia could have on the community structure of these benthic macroinvertebrates. There was general low biodiversity indicating the stressed nature of the study area.
REFERENCES
J. A. Oyenekan, Benthic macrofauna of Lagos lagoon, Nigeria. Nigeria Journal of Science, vol. 20, pp. 45-51, 1987.
P. Nystrom,, C. Bronmark, and W. Graneli. “Patterns in benthic food webs—a role for omnivorous crayfish,” Freshwater Biology, vol. 36, pp. 631–646, 1996.
R. A. Stockley, G. S. Oxford and R.F.G. Ormond, “Do invertebrates matter? Detrital processing in the River Swale-Ouse,” Science of the Total Environment, vol. 210, pp. 427–435, 1998.
J. A. Oyenekan, “The ecology of the genus Pachymelania in Lagos lagoon,” Archive for Hydrobiology, vol. 8, no. 4, pp. 15-522, 1989.
V. Yoloye, and O. S Adegoke. “A new species of Neritina (Archaeogastroda, Neritidae) from the Lagos lagoon,” Malacologia, vol. 16, no. 1, pp. 303–309, 1977.
J. A. Oyenekan, “Reproduction and population dynamics of Capitella capitata,” Archive for Hydrobiology, vol. 98, no. 1, pp. 115-126, 1983.
C. A. Brown and J. A Oyenekan, “Temporal variability in the structure of benthic macrofauna communities of the Lagos lagoon and harbour, Nigeria,” Polskie Archiwum Hydrobiologii, vol. 45, no. 1, pp. 45-54, 1998.
J. A Ekundayo, “Environmental consequences of pollution of the
Lagos lagoon,” Bulletin of Science Association of Nigeria vol. 3, no. 2, pp. 290-299, 1977.
T.V.I. Akpata and J. A Ekundayo, “Faecal pollution of the Lagos lagoon,” Nigerian Journal of Science, vol. 12, no. 1and2, pp. 39-49, 1978.
D. I Nwankwo, “Hydrochemical properties and bottom-dwelling diatoms of a Lagos lagoon sewage disposal site,” Polskie Archiwum Hydrobiologii, vol. 41, no. 1, pp. 35-47, 1994.
M. T Adeniyi, “Microbial decomposition of faeces in Lagos lagoon,” Ph.D Thesis, University of Lagos. pp. 102, 1980.
E. A. Ajao and S. O Fagade, “The ecology of Capitella capitata in Lagos lagoon, Nigeria,” Archive for Hydrobiolog., vol. 120, no. 2, pp. 229-239, 1990.
C. A Edokpayi and J. A., “Nkwoji. Annual changes in the physico-chemical and macrobenthic invertebrate characteristics of the Lagos lagoon sewage dump site at Iddo, Southern Nigeria,” Ecology, Environment. and Conservation, vol. 13, no. 1, pp. 13-18, 2007.
F.A.O. Fisheries Survey in the Western and mid-Western Regions of Nigeria. FAO/sf.74/NIR6. Pp. 142 1969.
E. A. Ajao and S. O. Fagade, “Study of the sediments and communities in Lagos Lagoon, Nigeria,” Oil and Chemical Pollution, Elsevier Science Publishers Ltd., England. Pp. 75-117, 1991.
D. I. Nwankwo and A. Akisoji, “Epiphyte community on water hyacinth Eichhornia crassipes (Mart.).Solms. in coastal waters of southwestern Nigeria,” Archive for Hydrobiolog, vol. 124, no. 4, pp. 501-511, 1992.
C. A. Brown. The diversity and density of macrobenthic fauna in the western part of the Lagos Lagoon, South-West, Nigeria. Ph.D Thesis, University of Lagos, Lagos, Nigeria. pp. 346, 2000.
APHA (American Public Health Association). Standard Methods for the Examination of Water and Waste Water. 20th ed. APHA New York, pp. 1270, 1998.
C. I. O. Olaniyan. An Introduction to West African Animal Ecology. London & Ibadan: Heinemann. pp. 167, 1968.
J. Edmunds Sea shells and other molluscs foundon West African coasts and estuaries. Accra. Ghana University Press, pp. 146.
K. Yankson. and M. A. Kendall, A student’s guide to the seashore of West Africa: Marine biodiversity capacity building in the West African sub-region. pp. 132, 2001.
J. H. Zar, Biostatistical Analysis, 2nd ed. New Jersey: Prentice-Hall. pp. 718, 1984.
Ogbeibu, A.E. Biostatistics: A practical approach to research and data handling. Mindex Publishing Co. Ltd., Benin, Nigeria. pp. 264, 2005.
E.A Ajao. The influence of domestic and industrial effluents on populations of sessile and benthic organisms in Lagos lagoon. Ph.D Thesis. University of Ibadan, Nigeria. pp. 413, 1990.
J. A Nkwoji, Yakub A., Ajani, G. E., Balogun, K. J., Renner, K.O.,Igbo, J. K., Ariyo, A. A and Bello, B. O, “Seasonal Variations in the Water Chemistry and Benthic Macroinvertebrates of a South Western Lagoon, Lagos, Nigeria,” Journal of American Science, vol. 6, no. 3, pp. 85- 92, 2010.
V. Doherty, U. C. Kanife, B. T. Okeleye, “Toxicological Effects and Histopathology of African Catfish (Clarias gariepinus) Exposed to Water Soluble Fractions of Diesel and Kerosene,” Current Advances in Environmental Science, vol. 1, no. 2, pp. 16-21, 2013.
Current Advances in Environmental Science CAES
CAES Volume 2, Issue 3 Aug. 2014 PP. 90-100 www.vkingpub.com © American V-King Scientific Publishing 96
I .C. Onyema.,J. A. Nkwoji,. and , O.J. Eruteya, “The Water Chemistry and Plankton Dynamics of a Tropical High Energy Erosion Beach in Lagos,” Journal of American Science, vol. 5, no. 8, pp. 13-24, 2009.
C.A., Community structure and secondary production of benthic macrofauna of Lagos lagoon and harbour. M.Phil. Thesis, University of Lagos, Nigeria. pp. 359, 1991.
L. O. Chukwu and D. I. Nwank, “The impact of land based pollution on the hydro-chemistry and macrobenthic community of a tropical West African Creek,” The Ekologia, vol. 2, no. 1-2, pp. 1- 9, 2004.
Current Advances in Environmental Science (CAES)
CAES Volume 2, Issue 3 Aug. 2014 PP. www.vkingpub.com © American V-King Scientific Publishing 97
TABLE II A SUMMARY OF THE PHYSICO-CHEMICAL CHARACTERISTICS OF THE WATER IN THE STUDY AREA (JAN., 2007– DEC., 2008)
Iddo I Iddo II Cater Bridge Oyingbo Jetty Okobaba Makoko Min Max Mean±SD Min Max Mean±SD Min Max Mean±SD Min Max Mean±SD Min Max Mean±SD Min Max Mean±SD
A. Temp. (oC) 26 32 28.3±1.45 25.5 32 27.9±1.7 26.5 32 28.5±1.8 26 30.2 28.0±1.5 26 30 27.9±1.4 26 31 28.2±1.5
W. Temp.(oC) 26 29.5 27.9±1.2 24 30 27.9±1.7 26 29.5 27.5±1.2 25 30 27.8±1.5 26 30.5 27.5±1.3 26 30.5 27.8±1.3
Turbidity (NTU) 8 205 44.1±51.6 8.7 50 34.0±10.4 7.9 47.9 32.5±8.7 5.8 48 30.5±11 6 225 56.8±55.4 7.1 90.5 45.2±22.4
TSS (mg/L) 3 40 19.5±11.2 10 55 21.0±10.2 6 48 17.0±9.3 3 35 16.9±7.9 5 52 25.5±12.5 3 32 17.7±8.3
TDS (mg/L) 1005 3390
0 15068.3
±12591.6 98 33915
13626.3 ±13908.9 997 3350
0 14707.4
±13052.6 1030 30730 12794 ±11508.6 38.1 24900 8411.2
±9392.1 92.7 23700
8230 ±9609.8
Salinity (‰) 2.5 29.6 14.5±8.8 2.1 29.4 13.4±9.3 1.2 29.3 12.5±9.4 0.5 28.3 11.6±9.1 0 22.1 9.3±7.5 0 20.4 8.0±7.2
D.O (mg/L) 3.1 5 4.3±o.5 3.9 4.8 4.2±0.3 3.7 5.6 4.5±0.7 3.9 5.9 4.8±0.7 3.2 5.1 4.4±0.6 3.8 5.2 4.4±0.5
BOD (mg/L) 4 32 12.7±7.0 5 22 12.7±5.8 2 19 11.2±5.8 2 22 11.3±5.7 3 38 14.0±11.6 3 25 11.8±7.3
COD (mg/L) 7 48 27.2±17.6 14 55 36.5±7.8 26 45 35.6±3.4 17 38 29.3±4.9 6 66 25.0±21.2 6 45 35.8±10.4
pH 6.8 8.66 7.9±0.4 7 8.78 7.6±0.4 7.2 8.81 8.0±0.4 7.1 8.25 8.0±0.3 7.4 8.58 7.9±0.2 7.17 8.7 7.8±0.3 Cond.
(mS/cm) 5.8 45.8 30.3±12.7 0.2 45.3 24.4±17.1 2.4 45.2 26.8±13 1.5 43.7 26.4±13 0.1 35.5 17.6±14.0 0.2 32.9 17.0±12.9
Nitrates (mg/L) 1 5.8 1.8±1.3 0.7 4.8 1.7±1.1 0.8 5 1.5±1.2 0.6 3.5 1.2±0.9 0.7 4.1 1.4±1.0 0.1 5.1 1.6±1.0
Phosphate (mg/L) 0.25 0.3 0.2±0.03 0.1 0.5 0.13±0.1 0.1 0.3 0.13±.04 0.15 0.2 0.1±0.03 0.1 0.8 0.14±0.15 0.2 0.5 0.2±0.1
Sulphates (mg/L) 130 202.3 157.2±19 138.2 215 154.9±19 150 198.6 161.1±13 135.
9 200 154.8±14 60 102 81.0±7.4 106.5 180 156.7±15.6
Oil/Greas (mg/L) 0.1 3.5 1.2±1.4 0.1 4.9 1.2±1.4 .04 4.3 1.2±1.6 0.03 2.5 0.7±0.9 .04 9.2 2.9±4.0 0.04 4.8 0.9±1.3
Iron (mg/L) 0.12 0.45 0.3±0.10 0.2 0.5 0.4±0.1 .11 0.6 0.4±0.2 0.15 0.5 0.3±0.1 0.15 0.5 0.4±0.1 0.2 0.45 0.4±0.1 Copper (mg/L) .001 0.003 .002±.001 0.001 0.003 .002±.001 .001 .005 .003±.001 .001 .003 .002±.004 .001 .003 .002±.0002 0 .005 .004±.002
Zinc (mg/L) .001 0.02 .004±.005 0.002 0.03 .004±.007 .002 .04 .008±.003 .003 .03 .004±.005 .001 .04 .005±.01 .001 .04 .01±.01
Current Advances in Environmental Science (CAES)
CAES Volume 2, Issue 3 Aug. 2014 PP. www.vkingpub.com © American V-King Scientific Publishing 98
TABLE III CONT. A SUMMARY OF THE PHYSICO-CHEMICAL CHARACTERISTICS OF WATER IN THE STUDY AREA
Abule Agege Unilag Front Eledu Creek Mid-lagoon Ogudu Agboiyi Min Max Mean±SD Min Max Mean±SD Min Max Mean±SD Min Max Mean±SD Min Max Mean±SD Min Max Mean±SD
A. Temp. (oC) 26.5 32 28.3±1.7 26 31.3 28.2±1.7 27 32.6 28.8±1.7 26 30.8 28.4±1.5 26.5 32.8 28.6±2.0 26 32.7 28.6±2.0 W. Temp.(oC) 26 31 28.2±1.4 25 31 27.9±2.2 25 31 27.9±1.8 25 30 27.7±1.6 26 31.5 28.1±1.7 25 30 27.6±1.7
Turbidity (NTU) 5.2 72 29.3±18.2 5.5 58.3 28.4±17.1 13.8 155 37.1±29.7 5.5 52 23.7±10.3 26 212 79.7±54.9 25 125 60±37.9
TSS (mg/L) 1 28 12.0±7.9 10 25 16.2±4.9 10 31.9 17.0±6.7 2 28.5 12.7±8.2 2 58 25.6±16.7 14 74 28.2±16.7
TDS (mg/L) 93.9 25380 5470.8 ±7485.4 103.5 24800 9563.5
±10191.0 40.5 22850 8875.4 ±9802.2 1223 29100
13613
±11562.6 50.1 24770
7104.8 ±9262.6 50 2270
0 7604.5
±9165.8
Salinity (‰) 0 25.8 8.6±8.2 0 20.2 8.7±8.7 0 18.6 7.4±8.1 2 22.2 11.1±8.1 0 5.85 2.1±2.0 0 8.8 2.8±2.9 D.O (mg/L) 4 5.8 5.1±0.5 4 5.2 4.6±0.4 3.9 5.3 4.6±0.5 4.4 5.6 5.0±0.3 3 4.8 3.7±0.4 2.8 4.2 3.6±0.4 BOD (mg/L) 3 18 10.3±5.0 4 20 10.9±4.8 5.4 19 11.0±4.6 2.2 18 11.6±4.5 7 32.9 19.0±7.6 8 42 19.9±9.9 COD (mg/L) 4 50 28.2±14.6 24 33 29.0±2.19 28 36 31.5±2.8 13.5 65 27.0±8.7 12 60 41.2±14.0 22 50 37.6±11.6
pH 7.1 9.72 7.9±o.5 7.1 8.3 7.9±0.3 7.1 8.7 8.2±0.3 7.14 8.03 7.8±0.3 7.1 8.8 7.9±0.4 7.2 8.59 7.9±0.3 Cond.
(mS/cm) 0.2 45.5 19.0±15.1 0.3 35.5 18.1±13.4 0.1 33.9 15.8±12.5 4.3 48.9 27.4±11.5 0.1 30.2 8.2±8.7 0.4 28 10.5±8.7
Nitrates (mg/L) 0.3 3.4 0.9±0.8 0.5 5 1.2±1.1 0.7 5.2 1.4±1.1 0.1 4.2 0.9±1.1 0.9 6 2.3±1.4 1 7.6 2.5±1.5
Phosphate (mg/L) 0.1 0.8 0.2±0.2 0.03 0.2 0.1±0.05 .04 0.9 0.4±0.4 0.1 0.3 0.1±0.04 0.1 2.2 0.9±0.8 0.1 2.9 1.5±1.3
Sulphates (mg/L) 7.2 175.2 64.5±57.5 49.5 160.5 94.8±43.5 60.7 148.7 103.1±34 4.5 160.2 83.4±71.7 106 172.5 131.0±19 128 220 154.3±22
Oil/Greas (mg/L) 0.03 4.5 1.4±1.8 0.1 2.8 0.9±1.1 0.1 2.8 0.7±0.8 .02 3 0.8±1.1 0.04 5.4 1.6±1.7 0.05 4.9 1.2±1.5
Iron (mg/L) 0.2 0.65 0.3±1.1 0.15 0.3 0.2±0.1 0.2 0.3 0.2±0.1 0.1 0.4 0.3±0.1 0.15 0.5 0.31±0.1 .20 0.6 0.4±0.2 Copper (mg/L) .001 0.02 0.01±0.01 .001 .003 .002±.001 .001 .003 .002±.004 .001 0.003 .002±.001 .001 .005 .003±.001 .001 .005 .005±.001
Zinc (mg/L) .001 0.15 0.1±0.1 .001 .02 .005±.01 .001 .02 .004±.004 .002 0.03 .01±.01 .002 0.06 .01±.03 .002 .03 .01±.01
Current Advances in Environmental Science (CAES)
CAES Volume 2, Issue 3 Aug. 2014 PP. www.vkingpub.com © American V-King Scientific Publishing 99
TABLE IV: A SUMMARY OF TOTAL BENTHIC MACROINVERTEBRATES COLLECTED AT THE STUDY STATIONS IN THE STUDY AREA FOR THE PERIOD OF STUDY (JANUARY, 2007 – DECEMBER, 2008)
Benthic Taxa Iddo I Iddo II Carter Bridge Oyingbo Jetty Okobaba Makoko Abule-Agege
Unilag lagoon
Eledu creek
Mid-lagoon
Ogudu Agboiyi Total
Mollusca Neritina senegalensis - - - - - - - 14 3 - - 17
Neritina glabrata 1 - 1 11 41 14 357 28 8 51 1 3 516 Pachymelania aurita 2 - 7 34 4 4 866 127 20 84 1 9 1156
Tympanotonus fuscatus 6 1 7 13 53 14 13 98 46 66 7 8 332 T.fuscatus Var radula 3 - 5 4 13 9 6 26 10 10 - 2 88
Thais haemostoma - - - - - - - - - 2 - - 2 Mytilus perna - - - - - - - - - 3 - - 3 Mytilus edulis - - - - 2 - 14 - - 40 - - 56
Crassostrea gasar - - - - - - 1 - 5 - - 5 11 Dosinia isocarda - - 3 5 - - - - - - - 3 11 Mactra glabrata - - - - - - - 1 - 5 - - 6
Iphigenia rostrata - - - - - - 9 - - 5 - - 14 Iphigenia truncata 1 - 6 5 5 2 45 16 7 29 - 2 118 Tellina nymphalis 4 2 3 32 18 1 19 31 7 17 1 9 144
Aloides trigona 2 1 7 20 12 4 57 55 18 35 2 2 215 Aloides sulcata - - - 5 3 - 13 8 1 5 - - 35
19 4 39 129 151 48 1400 404 122 355 12 43 2724
Annelida Glycera sp 2 - 1 1 - - - - - - - - 4 Nephtys sp - - - 2 - - - - - - - - 2
Nereis diversicolor 37 40 6 23 3 - 1 4 2 - 45 18 179 Capitella capitata - - - 3 4 - - - - - 32 38 77
Tubifex sp - - - - - - - - - - 1 8 9 39 40 7 29 7 0 1 4 2 0 78 64 271
Arthropoda
Penaeus notialis - - - 2 - - - - - - - - 2 Clibinarius africanus - - - - - - 50 85 22 - - - 157
Sersama huzardi 4 - - 1 - - - - - - - - 5 4 0 0 3 0 0 50 85 22 0 0 0 164
TOTAL 62 44 46 161 158 48 1451 493 146 355 90 107 3159
Current Advances in Environmental Science (CAES)
CAES Volume 2, Issue 3 Aug. 2014 PP. www.vkingpub.com © American V-King Scientific Publishing 100
TABLE V : BIODIVERSITY INDICES OF BENTHIC MACROINVERTEBRATES IN THE TWELVE STUDY STATIONS (JANUARY, 2007 – DECEMBER, 2008)
Iddo
I
Iddo
II
Car
ter B
ridge
Oyi
ngbo
Jet
ty
Oko
-bab
a
Mak
oko
Abu
le A
gege
Unl
ag L
agoo
n
Eled
u cr
eek
Mid
-lago
on
Ogu
du
Agb
oiyi
Taxa S 9 4 9 14 10 6 12 11 10 13 8 11
Individuals 62 44 46 159 158 48 1451 493 146 355 100 107
Dominance 0.39 0.83 0.16 0.14 0.26 0.33 0.42 0.18 0.21 0.15 0.41 0.19
Shannon 1.41 0.40 1.98 2.19 1.66 1.34 1.25 1.91 1.84 2.06 1.14 1.99
Simpson 0.61 0.17 0.84 0.86 0.74 0.67 0.58 0.82 0.79 0.85 0.59 0.81
Evenness 0.45 0.37 0.80 0.63 0.53 0.64 0.29 0.62 0.63 0.61 0.39 0.67
Margalef 1.94 0.79 2.09 2.57 1.78 1.29 1.51 1.61 1.81 2.04 1.52 2.14 Equitability 0.64 0.29 0.90 0.83 0.72 0.75 0.50 0.80 0.80 0.80 0.55 0.83