the effects of dacamentation: the impact of deferred action
TRANSCRIPT
Journal of Public Economics 143 (2016) 98–114
Contents lists available at ScienceDirect
Journal of Public Economics
j ourna l homepage: www.e lsev ie r .com/ locate / jpube
The Effects of DACAmentation: The Impact of Deferred Action forChildhood Arrivals on Unauthorized Immigrants�
Nolan G. PopeThe University of Chicago, 5107 S Blackstone Ave. 1204, Chicago, IL 60615, United States
A R T I C L E I N F O
Article history:Received 15 June 2015Received in revised form 14 May 2016Accepted 30 August 2016Available online 5 September 2016
Keywords:EmploymentImmigrationLabor marketDeferred Action for Childhood ArrivalsDACAUnemploymentLabor forceWork authorizationImmigrantSchoolUnauthorized ImmigrantIllegal Immigrant
A B S T R A C T
As the largest immigration policy in 25 years, Deferred Action for Childhood Arrivals (DACA) made deporta-tion relief and work authorization available to 1.7 million unauthorized immigrants. This paper looks at howDACA affects DACA-eligible immigrants’ labor market outcomes. I use a difference-in-differences design forunauthorized immigrants near the criteria cutoffs for DACA eligibility. I find DACA increases the likelihoodof working by increasing labor force participation and decreasing the unemployment rate for DACA-eligibleimmigrants. I also find DACA increases the income of unauthorized immigrants in the bottom of the incomedistribution. I find little evidence that DACA affects the likelihood of attending school. Using these estimates,DACA moved 50,000 to 75,000 unauthorized immigrants into employment. If the effects of Deferred Actionfor Parents of Americans and Lawful Permanent Residents (DAPA) are similar to DACA, then DAPA couldpotentially move over 250,000 unauthorized immigrants into employment.
© 2016 Elsevier B.V. All rights reserved.
1. Introduction
The United States has the largest immigrant population of anynation in the world. With 40.7 million people,1 the United States hasfour times as many foreign-born residents than any other country.2
However, in the United States, 11.4 million of these individuals,or 3.6% of the entire US population, are unauthorized immigrantsand have no legal status (Baker and Rytina, 2013). These unau-thorized immigrants face a unique set of challenges to their eco-nomic well-being compared to citizens and authorized immigrants.Some of these challenges include the threat of deportation, lack oflegal work authorization, and insufficient documentation for bank-ing, loans, and driver’s licenses. These challenges likely contributeto unauthorized immigrants’ below-average levels of income, edu-cational attainment, and above-average levels of unemployment(Fortuny et al., 2007; Rivera-Batiz, 1999; and Smith, 2006).
� I would like to thank Michael Greenstone, Kareem Haggag, Steven Levitt, MagneMogstad, Derek Neal, and Nathan Petek for helpful comments and discussion.
E-mail address: [email protected] (N. Pope).1 Census Bureau.2 United Nations, Department of Economic and Social Affairs, Population Division
Due to the unique challenges unauthorized immigrants face,extensive political debate has occurred over what immigration poli-cies should be implemented to help improve unauthorized immi-grants’ economic well-being without incentivizing additional illegalimmigration. On June 15, 2012, President Obama used his prosecuto-rial discretion and announced Deferred Action for Childhood Arrivals(DACA). This announcement directed the Department of HomelandSecurity to accept applications for DACA from unauthorized immi-grants who had arrived in the United States as children (under theage of 16) and were under the age of 31 as of June 15, 2012. Individu-als whose applications are accepted receive two years of deportationrelief and work authorization. Continued DACA approval is condi-tional on renewal every two years. With 1.7 million unauthorizedimmigrants potentially eligible (Passel and Lopez, 2012), DACA hasprovided relief from deportation and work authorization to moreunauthorized immigrants than any other immigration policy sincethe 1986 Immigration Reform and Control Act (Baker, 2014).
Without work authorization, documentation for loans and driver’slicenses, and with the possibility of deportation, unauthorized immi-grants have additional labor market frictions than do authorizedimmigrants and citizens. DACA-eligible unauthorized immigrantscould potentially reduce these labor market frictions and improvetheir labor market outcomes by applying for and obtaining DACA.
http://dx.doi.org/10.1016/j.jpubeco.2016.08.0140047-2727/© 2016 Elsevier B.V. All rights reserved.
N. Pope / Journal of Public Economics 143 (2016) 98–114 99
Particularly, I use three different measurements of employment tolook at how the reduction of labor market frictions through DACAhas affected unauthorized immigrants likelihood of working. I esti-mate whether these changes in the likelihood of working stem fromchanges in labor force participation or unemployment. Importantly, Iestimate how these changes in working affect the income of unautho-rized immigrants throughout the income distribution. Lastly, I look atwhether DACA affects schooling decisions through its substitutabilitywith working.
In this paper, I look at how DACA affects DACA-eligible immi-grants’ labor market outcomes through the reduction of labor marketfrictions. To do so, I use American Community Survey (ACS) dataon over 400,000 immigrants and 5 million citizens ages 18–35 from2005 to 2014. I estimate the effect of DACA by using a difference-in-differences empirical design. To enhance validity, I estimate theeffect of DACA by performing the difference-in-differences estima-tion for samples of unauthorized immigrants who are just aboveand below DACA eligibility cutoffs. Specifically, I look at unautho-rized immigrants who were just above and below the age of 16 whenthey entered the United States and those who were just above andbelow the age of 30 on June 15, 2012. In addition, I test for selectioninto the ACS sample of unauthorized immigrants and for differentialpre-trends that may bias the results.
I find DACA has had large effects on DACA-eligible individ-uals’ labor market outcomes, and find suggestive evidence forsome schooling decisions. For DACA-eligible individuals, DACA hasincreased the likelihood of working by 3.7–4.8 percentage pointsand the number of hours worked per week by 0.9–1.7 hours. Theincrease in the likelihood of working and in the number of hoursworked per week comes from both an increase in labor force partic-ipation and a decrease in unemployment. These estimates providea lower bound on the intent-to-treat effect of DACA which may beas much as 1.6 times larger. In addition, the increased likelihood ofworking has increased the income for those in the bottom of theincome distribution. Despite the increased employment, I find littleevidence that DACA has influenced the likelihood of an individualbeing self-employed. Within two years of implementation, DACAmoved 50,000–75,000 unauthorized immigrants into employment.
Since one of the requirements for obtaining DACA is to have ahigh school diploma or a General Educational Development (GED)certificate, I also test whether DACA had affected unauthorizedimmigrants’ educational attainment. I find suggestive evidence thatDACA pushed over 25,000 DACA-eligible individuals into obtainingtheir GED certificate in order to be eligible for DACA. Although work-ing and attending school are likely substitutes, and DACA has had apositive effect on the likelihood of working, I find little evidence thatDACA has affected the likelihood of attending school.
The difference-in-differences results directly answer the policyquestion of how DACA has affected its target population. The resultsalso inform future immigration policies on how a reduction in labormarket frictions through deferred action and work authorizationmight affect the larger unauthorized immigrant population. Particu-larly, the findings shed light on how the Deferred Action for Parentsof Americans and Lawful Permanent Residents (DAPA) policy, whichexpands DACA and gives deferred action and work authorizationsto most unauthorized immigrants who have children that are citi-zens, might affect the 3.7 million eligible unauthorized immigrants.3
If the effects of DAPA are similar to the effects of DACA, then DAPAcould move over 250,000 unauthorized immigrants into employ-ment. However, due to the demographic differences between theDAPA-eligible and DACA-eligible populations, the effects of the twopolicies may not be similar. The results demonstrate that illegal
3 http://migrationpolicy.org/news/mpi-many-37-million-unauthorized-immigrants-could-get-relief-deportation-under-anticipated-new
status hurts young immigrants’ ability to work, by keeping themout of the labor force and unemployed. Even in a short two-yeartime span, deferred action and work authorization helped youngunauthorized immigrants find employment.
Due to the recency of DACA and data limitations, little work haslooked at how DACA affects unauthorized immigrants. A few studiesusing small sets of survey data have provided suggestive evidenceof an increase in job changes, employment, and decreases in schoolattendance (Gonzales et al., 2014; and Kosnac et al., 2014). However,these studies only have a few DACA-eligible individuals in theirsample and are mostly descriptive studies that lack causal identifi-cation. In concurrent work, Amuedo-Dorantes and Antman (2016)use monthly Current Population Survey data along with a difference-in-differences strategy to look at the effect of DACA. Although theyeffectively use their difference-in-differences strategy, their anal-ysis is limited by a small sample size of 11,526 non-citizens ofwhich only a small fraction are eligible for DACA after its availabil-ity (400–450 individuals). They find DACA reduces school enrollmentfor these 450 DACA-eligible individuals, and provide some evidenceof an increase in the likelihood of working for men. The limitedsample size prevents them from looking at labor market outcomeswith enough precision to detect sizable changes. This paper usesover 400,000 non-citizens and over 5 million citizens to estimatethe effect of DACA on labor market and schooling outcomes. Simi-lar to Amuedo-Dorantes and Antman (2016), I find positive effects ofDACA on employment for men. I also find positive effects of DACAon employment for women. In addition, I find beneficial effects ofDACA on labor force participation, unemployment, and number ofhours worked per week. I also find increases in income for thosein the bottom of the income distribution. However, in contrast totheir results, I find no evidence of an effect of DACA on school atten-dance. This difference in the effect on school enrollment may be dueto sampling error from their small sample size or because of strongdifferential pre-trends in school attendance that are observed. Inaddition, this paper provides a detailed analysis of the effect of DACAby income quantile, uses citizens as an additional control group,and provides tests for sample selection that may potentially bias theresults.
This paper is also closely related to work done on the 1986 Immi-gration Reform and Control Act (IRCA). The IRCA granted amnestyand a pathway to citizenship to approximately 2.8 million unautho-rized immigrants (Baker, 2014). Most studies have found the IRCAincreased unauthorized immigrants’ incomes (Bratsberg et al., 2002;Kossoudji and Cobb-Clark, 2002, Orrenius and Zavodny, 2012; andRivera-Batiz, 1999), decreased crime rates (Baker, 2014), increasededucational attainment (Cortes, 2013), and had little effect on long-term patterns of undocumented immigration (Orrenius and Zavodny,2003). However, Amuedo-Dorantes and Bansak (2011) and Amuedo–Dorantes et al. (2007) have also found that unauthorized immigrants’labor force participation decreased and unemployment rates rose. Inaddition to the IRCA, Kaushal (2006) found that the 1997 amnestyprogram, the Nicaraguan Adjustment and Central American ReliefAct (NACARA), increased the real wages of undocumented foreign-born men from affected countries by 3%.
Although both are major immigration policies, the IRCA and DACAdiffer in many ways that may cause them to affect unauthorizedimmigrants differently. The largest difference is that the IRCA gaveamnesty and a pathway to citizenship, whereas DACA gives only twoyears of deportation relief and work authorization. The IRCA wasalso implemented when fewer legal barriers to employing unautho-rized immigrants existed. Lastly, the two policies are more than 25years apart with different labor markets. NACARA was implementedon a much smaller scale than either the IRCA or DACA and wasimplemented over 15 years ago.
The rest of the paper will proceed as follows. Section 2 describesthe timing, benefits, and eligibility criteria of DACA. Section 3
100 N. Pope / Journal of Public Economics 143 (2016) 98–114
describes the ACS data. Section 4 develops a conceptual frameworkfor interpreting the results. Section 5 describes the difference-in-differences methodology and the samples used for the analysis.Section 6 reports the results of how DACA affects eligible unau-thorized immigrants. Section 7 discusses how the results canhelp inform current and future immigration policy. Section 8concludes.
2. Deferred Action for Childhood Arrivals
On June 15, 2012, from the Rose Garden, President Obamaused his prosecutorial discretion and announced Deferred Actionfor Childhood Arrivals (DACA). This announcement directed theDepartment of Homeland Security to accept applications forDACA from qualified unauthorized immigrants. Individuals whoseapplications are accepted receive deferred action, which givesthem two years of relief from deportation and work authorization.Continued DACA eligibility is conditional on renewal every twoyears.
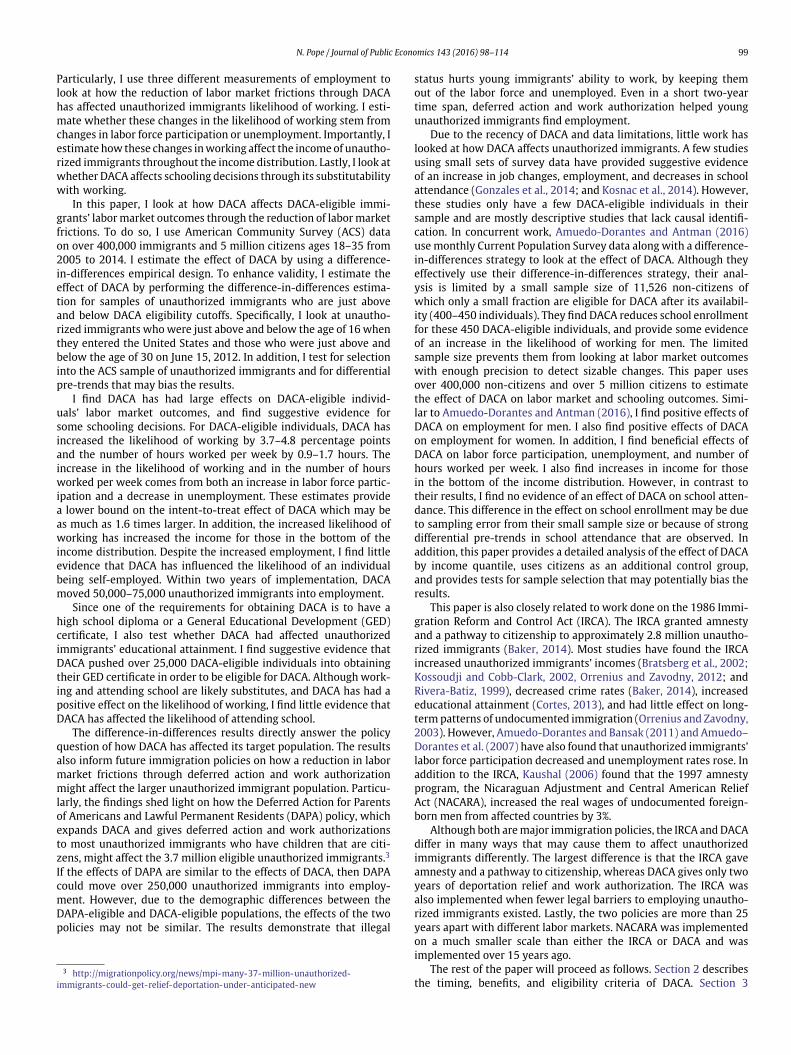
After the announcement of DACA in June 2012, the Departmentof Homeland Security’s Citizenship and Immigration Services (USCIS)started accepting applications for DACA on August 15, 2012. Toapply for DACA, individuals have to fill out three forms, pay a pro-cessing fee of 465 dollars, and provide documentation that theymeet the eligibility criteria. Although many forms and documenta-tion are required, over 90% of processed applications are approved.The USCIS estimated applications would take 4–6 months to beprocessed. By the end of 2012, over 100,000 unauthorized immi-grants’ DACA applications had been approved. By the end of 2013and 2014, over 500,000 and 600,000 DACA applications had beenapproved, respectively. Fig. 1 uses data reported by the USCIS4 andshows the number of DACA applications approved over time. Theblack line represents the number of DACA applications approved ineach quarter of the year. The gray bars represent the cumulativenumber of DACA applications approved. As Fig. 1 shows, very fewDACA applications were approved until the last quarter of 2012, andthe bulk of DACA applications were approved over the span of a year,from October, 2012 to September, 2013.
To qualify for DACA, unauthorized immigrants have to meet sixcriteria5: (1) applicants had no lawful status as of June 15, 2012(i.e., an unauthorized immigrant as of June 15, 2012); (2) applicantscame to the United States before the age of 16; (3) applicants musthave been under the age of 31 as of June 15, 2012; (4) applicantsmust also have continuously resided in the United States since June15, 2007; (5) applicants must be currently in school, have gradu-ated or obtained a certificate of completion from high school, haveobtained a General Education Development (GED) certificate, or bean honorably discharged veteran of the Coast Guard or Armed Forcesof the United States; (6) applicants cannot have been convicted ofa felony, significant misdemeanor, or three or more other misde-meanors. In addition to these DACA qualification criteria, an individ-ual must be 15 years or older to submit the DACA application. Toprove they meet these requirements, individuals must submit doc-umentation from a list of approved sources given by the USCIS. Forexample, passports or birth certificates from an individual’s countryof origin are required to prove an individual’s age, and school or med-ical records are used to prove an individual came to the United Statesbefore the age of 16.
4 http://www.uscis.gov/tools/reports-studies/immigration-forms-data/data-set-deferred-action-childhood-arrivals
5 http://www.uscis.gov/humanitarian/consideration-deferred-action-childhood-arrivals-daca
Fig. 1. Number of approved DACA applications by quarter. Note: The black line repre-sents the number of DACA applications approved in a given quarter. The bars representthe cumulative number of DACA applications approved by a given quarter. The y-axis shows the number of approved applications in thousands. The x-axis shows thequarter and year.
To better understand these criteria, a breakdown of the UnitedStates’ unauthorized immigrant population is helpful. As of January2012, the Department of Homeland Security estimated 11.4 millionunauthorized immigrants were living in the United States (Baker andRytina, 2013). Of these, 80% were from Central and South Amer-ica and 59% were from Mexico. Approximately 4.4 million of the11.4 million unauthorized immigrants were under the age of 31 asof June 15, 2012. Of these 4.4 million, approximately 950,000 wereimmediately eligible for DACA (Passel and Lopez, 2012). In addi-tion, approximately 770,000 were potentially eligible in the future.Of these 770,000 individuals, 450,000 met all the qualification crite-ria but were currently under the age of 15. The other approximately320,000 individuals met all the qualification criteria but had no highschool diploma or GED certificate. Although individuals have to paymoney, they may be wary of future deportation from applying, andmust obtain substantial documentation, by the end of 2014, 67%of the 950,000 individuals immediately eligible for DACA had beenapproved.6 The composition of DACA-approved individuals’ nation-ality was somewhat similar to that of the unauthorized immigrantpopulation as a whole, with 92% from Central and South America and78% from Mexico.
Clearly, the reason for so many individuals willing to take the timeand money to apply for DACA is the perceived benefits from DACAapproval. The two most obvious, and likely the largest, benefits ofDACA approval are relief from deportation and work authorization.Individuals with DACA receive deferred action in which all removalactions are deferred and individuals are authorized to be present inthe United States. Along with this deferred action, DACA recipientsare legally allowed to work in the United States. Many smaller ben-efits accompany these two main benefits. DACA recipients receive aSocial Security Number, which allows them to legally open a bankaccount and build a credit history. In all states, except Arizona andNebraska, DACA recipients can legally obtain a driver’s license.7
However, DACA recipients are not eligible for federal welfare orfederal student aid.
6 http://www.uscis.gov/tools/reports-studies/immigration-forms-data/data-set-deferred-action-childhood-arrivals
7 http://www.nilc.org/dacadriverslicenses2.html

N. Pope / Journal of Public Economics 143 (2016) 98–114 101
3. Data
The main data used to look at the effects of DACA are individual-level data from the American Community Survey (ACS). I use ACSdata from 2005 to 2014. I start with the 2005 ACS sample because itis the first year with a full one-percent sample of the United States.The 2014 ACS sample is the most recent sample available. The ACSdata provide eight years of data prior to DACA and two years after.The collection of ACS data in each year is evenly distributed betweeneach month of the year. The ACS provides many outcomes of interestincluding if individuals are working, in the labor force, unemployed,self-employed, their income, number of hours worked per week,whether they obtained a GED, and whether they are in school. It alsoprovides a rich set of demographic information on individuals to beused as controls.
The ACS includes questions that allow me to focus on the unau-thorized immigrant population and determine if individuals areDACA eligible. The most difficult DACA qualification criteria to iden-tify in the ACS is whether the individual is an unauthorized immi-grant. The ACS asks each individual if they are a US citizen. Noadditional information on legal status is available if the individualis a non-citizen. The Census Bureau and the Department of Home-land Security estimate that nearly 40% of these non-citizens areauthorized immigrants (Acosta et al., 2014, Baker and Rytina, 2013).Although the variable non-citizen includes all unauthorized immi-grants, it also includes many authorized immigrants. In the Empiricalmethod section, I will discuss how this inclusion of authorized immi-grants causes the analysis to underestimate the intent-to-treat effectof DACA.
These ACS data also include questions that allow me to identifyindividuals who meet the other DACA qualification criteria. The ACSquestion on quarter of birth allows me to determine the age of eachindividual as of June 30, 2012, and whether they are under the age of31. Using the question on how long the individual has resided in theUnited States, along with their age, I determine the age at which eachindividual entered the United States. This question also allows me toidentify if the individual has been in the United States for at least fiveyears. Using the ACS question on education, I can determine individ-uals’ educational obtainment. To limit the sample to only individualswho meet DACA’s education requirement, I restrict my sample toonly individuals who have a high school degree. Lastly, whether anindividual has committed a felony or significant misdemeanor is notobserved. I create the variable “eligible” for whether an individualmeets all of the DACA qualifications as of June 15, in the year priorto the individual’s ACS sample year (except for having committed acrime or not).
To better understand how unauthorized immigrants are includedin the ACS data, the sampling process for the ACS is as follows. First,the Census Bureau uses its Master Address File, which is an inventoryof all known housing units and group quarters, as the sample framefrom which the Census Bureau draws its sample for the ACS. The Cen-sus Bureau estimates that from 2005 to 2014, the Master Address Filecovers the housing for 92.5–94.0% of the entire US population. Eachmonth, a systematic sample of addresses is drawn from the MasterAddress File to represent each US county. The ACS survey is thenmailed to the selected sample at the beginning of the month. Non-respondents are then contacted by telephone one month later for acomputer-assisted telephone interview. One third of the nonrespon-dents to the mail or telephone survey are then contacted in person tocomplete the ACS survey one month following the telephone surveyattempt. The Census Bureau reports that from 2005 to 2014, 65.5–68.7% of the addresses selected for the sample completed the survey.Of those contacted in person, 96.7–98.0% completed the survey.
In addition to the details of the ACS sampling procedure, under-standing how the sampling and interview process relate to beingan unauthorized immigrant is important. In regards to the ACS
and unauthorized immigrants, the Census Bureau states, “The ACSinterviews the resident population without regard to legal statusor citizenship.”8 The fact that the ACS conducts interviews with-out regard to legal status can be more easily seen as the samplingand interview process is broken down. First, because the sampleframe is created by using the near universe of US addresses, unau-thorized immigrants are no more or less likely to be selected intothe sample frame than are authorized immigrants or citizens. Sec-ond, because a systematic sample of address are drawn from thesample frame, unauthorized immigrants are no more or less likelyto be selected to be sent the ACS survey. Therefore, the ACS sam-pling does not select a specific type of unauthorized immigrant tobe included in the ACS, but is representative of the unauthorizedimmigrant population in the United States. The ACS sampling pro-cedure supports the assertion that the estimates from this paperare informative about DACA-eligible unauthorized immigrants asa whole. Also, because the sampling procedure did not changebetween 2005 and 2014, and unauthorized immigrants were sam-pled in the same way before and after DACA became available, theselection of unauthorized immigrants into the sample will not affectthe results. Although the ACS did not sample a specific type of unau-thorized immigrant or change its sampling procedure in such a wayto detrimentally affect the results, potential concerns arise regardinghow the survey and item response rates of unauthorized immi-grants may affect the results. I discuss these concerns in the Resultssection along with tests to determine their potential influence on theresults.
Using the ACS data, I analyze four main types of labor mar-ket and schooling outcomes. The first outcome is the likelihood ofan individual to be working. The ACS provided three survey ques-tions that help measure this outcome. They are a binary variable forwhether an individual worked in the last week and in the last year,and a continuous variable for the usual number of hours workedeach week. All three of these outcome variables provide insight intowhether a person is working. The second type of outcome comprisesthree outcome variables that help describe the underlying reasonfor why a person is working or not. These three outcome variablesare a binary variable for whether an individual is in the labor forceor not, whether unemployed or not, and whether self-employed ornot. These three outcome variables help break down how DACA isaffecting the likelihood of working. The third type of outcome isan individual’s income. The ACS income variable measures the totalamount of income an individual receives from all sources in the last12 months. This outcome variable is used to help determine if DACAimproves recipients’ economic well-being and stability. The last typeof outcome comprises two variables that help describe the school-ing choices of individuals. The outcome variables used are whetheran individual is attending school and whether the individual hasobtained a GED. I use the binary outcome variable of whether anindividual is attending school, because working and attending schoolare likely substitutes for each other and DACA may have unattendedeffects on an individual’s likelihood of attending school. I use thebinary outcome variable of having obtained a GED, because a require-ment for obtaining DACA is to have a high school diploma or a GEDcertificate, and DACA may therefore incentivize some unauthorizedimmigrants to obtain their GED. The exact wording from the ACSsurvey for each outcome and control variable is shown in the webappendix.
Table 1 shows the summary statistics for the sample of non-citizens ages 18–35 with at least a high school degree from 2005to 2014. The first two columns show the summary statistics forthe DACA-eligible and DACA-ineligible individuals, respectively. Thethird column shows the difference between the two groups’ means
8 https://www.census.gov/history/pdf/acsdesign-methodology2014.pdf

102 N. Pope / Journal of Public Economics 143 (2016) 98–114
Table 1Summary statistics.
Mean
Variable DACA DACA Difference t-StatisticEligible Ineligible
Working 65.3 66.5 −1.2 −3.3In labor force 73.9 71.9 2.0 6.5Unemployed 11.7 7.5 4.1 16.2Income 15,787 24,358 −8,571 −31.8Hours worked per week 27.1 28.6 −1.5 −9.1Worked in past year 75.1 73.9 1.2 3.5Self-employed 4.7 6.6 −1.9 −14.0Attending school 32.0 21.6 10.4 28.1GED 3.9 2.5 1.4 11.1Years in US 15.5 6.4 9.1 144.4Age entered US 8.4 22.3 −13.8 −287.3Male 52.6 51.9 0.7 3.1White 75.1 59.0 16.1 16.3Black 9.3 9.0 0.2 0.4Asian 14.5 30.7 −16.2 −27.5Hispanic ethnicity 65.4 42.1 23.2 20.8Home language of Spanish 63.6 41.3 22.3 20.3Born in Latin America 72.4 47.4 24.9 30.9Age 23.9 28.6 −4.7 −148.7Married 24.0 51.4 −27.4 −88.6Live in a metro area 92.4 92.9 −0.4 −1.9High school degree 49.8 37.2 12.6 30.3Some college 40.2 25.4 14.7 43.2College degree 10.0 37.3 −27.3 −65.4Observations 99,844 338,866
Note: The sample for the summary statistics includes non-citizens who are ages 18–35 and have at least a high school degree and corresponds to the sample in Panel C ofTable 2. All binary variables are represented in percent terms.
and the fourth columns shows the t-statistic when testing the differ-ence between the two means. The clearest differences between thetwo groups are that the DACA-eligible group tends to have enteredthe United States at a younger age and to be younger. In additionto the difference between the DACA-eligible and DACA-ineligiblegroups that can be seen in Table 1, both groups are more likely tobe Hispanic, speak Spanish at home, live in a metro area, and haveonly a high school degree, compared to citizens of the same age (seeTable A.3). In addition, both groups are about 6 percentage pointsless likely than citizens to be in the labor force or to be working.Although DACA-eligible individuals’ incomes are much lower thancitizens, DACA-ineligible individuals’ incomes are similar to citizens.
4. Conceptual framework
In this section, I will look at the reasons why obtaining DACAmay potentially affect the labor market and schooling outcomes ofunauthorized immigrants and the potential consequences of theseeffects. First, I look at why obtaining DACA potentially affects unau-thorized immigrants’ labor market outcomes. Initially, DACA itselfdid not change the labor demand or the labor supply curves. DACAdid not change employers’ desire to hire a worker at a given wage.In addition, DACA did not change individuals’ (citizens, authorizedimmigrants, and unauthorized immigrants) willingness to work ata given wage. However, DACA did reduce the frictions for DACA-eligible unauthorized immigrants to find employment, by providingwork authorization, legal documentation for banking and driver’slicenses, and removing potential deportation if discovered workingillegally. These attenuations in frictions mainly arose from that factthat unauthorized immigrants who obtained DACA could now obtainemployment from all potential employers instead of just employerswho were willing to overlook individuals’ legal work status. Theseattenuations in frictions allowed those who obtained DACA to havefewer barriers to working and to have more employment options.
As such, one would expect DACA to increase individuals’ likelihoodof working. This increase in the likelihood of working could arisefrom both discouraged workers entering the labor force and unem-ployed unauthorized immigrants finding employment. This increasein working should in turn increase DACA-eligible unauthorizedimmigrants’ income. This increase in income should be particularlypronounced for those in the bottom of the income distribution dueto not being able to previously find steady employment. The resultsof this paper will test if these reductions in labor market frictionsfor DACA-eligible unauthorized immigrants allow them to improvedtheir labor market outcomes by being more likely to work, less likelyto be unemployed, and by increasing their income.
Note that although DACA itself does not change the labor sup-ply curve and instead attenuates labor-market frictions for DACA-eligible individuals, if these frictions are attenuated and those whoobtain DACA increase their likelihood of working, the supply oflabor will in turn increase. This increase in the supply of laborcould potentially have a negative effect on overall wages. The resultsindicate DACA moved approximately 50,000–75,000 unauthorizedimmigrants into employment. This change in the supply of laboraccounts for only 0.94–1.41% of the 5.33 million individuals whogained employment in 2013 and 2014 (Bureau of Labor Statistics).This finding implies that the effect of DACA on overall wages wouldlikely be very small and would be unable to be detected in these data.However, with the much larger population that would be affected byDAPA or a large-scale amnesty program, the increase in the supply oflabor may be a larger concern.
These attenuations of labor market frictions and the subsequentincrease in the supply of labor have potential welfare implications.By reducing labor market frictions for unauthorized immigrantsand therefore increasing their employment options, DACA clearlyincreases the welfare of DACA-eligible individuals. However, theincrease in labor supply and the potential decrease in overall wages,may lead to a decrease in the welfare of citizens and authorizedimmigrants. However, the welfare increases and decreases are notlikely to be symmetric. Because DACA relieves large frictions forDACA-eligible unauthorized immigrants, the resulting increase inemployment is likely for individuals who are not at the margin ofbeing willing to work, but rather are well within the margin of beingwilling to work. Conversely, if the increased supply of labor fromDACA-eligible individuals displaces workers, these displaced work-ers are likely to be just at the margin of being willing to work. Thiswould imply that the overall welfare effect is not a pure transferto DACA-eligible individuals, but would likely enhance efficiency,although it would not be Pareto efficient.
In addition to labor market outcomes, I look at why obtain-ing DACA may potentially affect individuals’ schooling outcomes.First, I look at the potential effect of DACA on attending school, andthen the potential effect on obtaining a GED. The additional optionsfrom obtaining DACA may have a direct positive effect on the likeli-hood of attending schooling through legal documentation that givesimmigrants access to loans to pay for tuition, the ability to obtaina driver’s license so they can attend school while still living withtheir parents, or the ability to work while attending school to covertheir tuition and living expenses. In addition, by obtaining assurancethrough DACA of being able to legally work in the future, DACA-eligible individuals may be more willing to invest in their humancapital. However, besides these potential positive effects of DACA,work authorization has an indirect negative effect on school atten-dance. Working and attending school (particularly attending fulltime) are likely substitutes for each other. Once DACA-eligible indi-viduals obtain DACA and can more easily find employment, they maysubstitute their time away from attending school and toward work-ing. Second, because one of the requirements for obtaining DACA isto have a high school diploma or a GED certificate, DACA may directlyincentivize unauthorized immigrants who do not have a high school
N. Pope / Journal of Public Economics 143 (2016) 98–114 103
diploma or GED, but are otherwise eligible for DACA, to obtain a GEDso they can reap the potential benefits of DACA. The results look atwhether DACA affects both the likelihood of attending school and ofobtaining a GED.
5. Empirical method
To measure the effect of DACA, I use a difference-in-differences(DID) approach. By comparing DACA-eligible individuals with DACA-ineligible individuals before and after the implementation of DACA,I can measure its effect. The simplest approach to test if DACA hasan effect on DACA-eligible individuals is by comparing the outcomemeans of individuals eligible for DACA with those ineligible bothbefore and after DACA became available. Figs. 2 through 5 show thesesimple mean comparisons between non-citizens ages 18–35 with atleast a high school degree from 2005 to 2014. With DACA only beingavailable at the end of 2012, I should only observe its effect for theyears 2013 and 2014, with possibly a small effect in 2012. I discussthe results shown in these figures in detail in the Results section.
As mentioned earlier, one of the limitations with the ACS datais the inability to distinguish between unauthorized and authorizednon-citizens. According to the Census Bureau (Acosta et al., 2014),the ACS estimates that there were 8.3 million non-citizens in the USbetween the ages of 18 and 35 in 2012. The Department of HomelandSecurity (Baker and Rytina, 2013) estimates that of these 8.3 mil-lion non-citizens, 38.9% were authorized immigrants and 61.1% wereunauthorized immigrants. If the sample were restricted to just unau-thorized immigrants, the DID estimates would be the intent-to-treateffect. However, due to this contamination of authorized immigrants
in the non-citizen sample, the DID estimates are not be the intent-to-treat effect. Instead, the DID estimates will be systematically biasedtoward zero and will underestimate the intent-to-treat effect. Withnearly 40% of the non-citizen sample being authorized immigrants,the intent-to-treat effect of DACA will be approximately 1.6 timeslarger than the estimates from the DID estimation. When the esti-mation is performed on subsamples of the data that tend to have ahigher percentage of unauthorized immigrants, such as low-incomeand low-education subsamples (Passel and Cohn, 2009), the DIDestimates are larger. However, these larger estimates may also bebecause unauthorized immigrants in these subsamples benefit morefrom obtaining DACA. Similarly, sampling error that incorrectly spec-ifies the DACA-eligible variable would also bias the estimates towardzero. The DID estimates will provide a lower bound for the intent-to-treat effects of DACA. In addition, because only 67% of DACA-eligibleindividuals obtained approval, the treatment on the treated effectscould potentially be as much as 1.5 times larger than the intent-to-treat effects. However, any treatment on the treated effect derivedfrom the DID estimates could be biased by selection into who appliesfor DACA.
The main analysis for this paper simultaneously uses a DIDapproach along with some regression discontinuity design elements.I will use the DID approach on samples with individuals just aboveand below different DACA qualification criteria. The main model is asfollows:
Yit = b0 + b1Eligibleit ∗ Afterit + b2Eligibleit + b3Afterit
+ b4Xit + b5Wit + ht + cs + cst + eit (1)
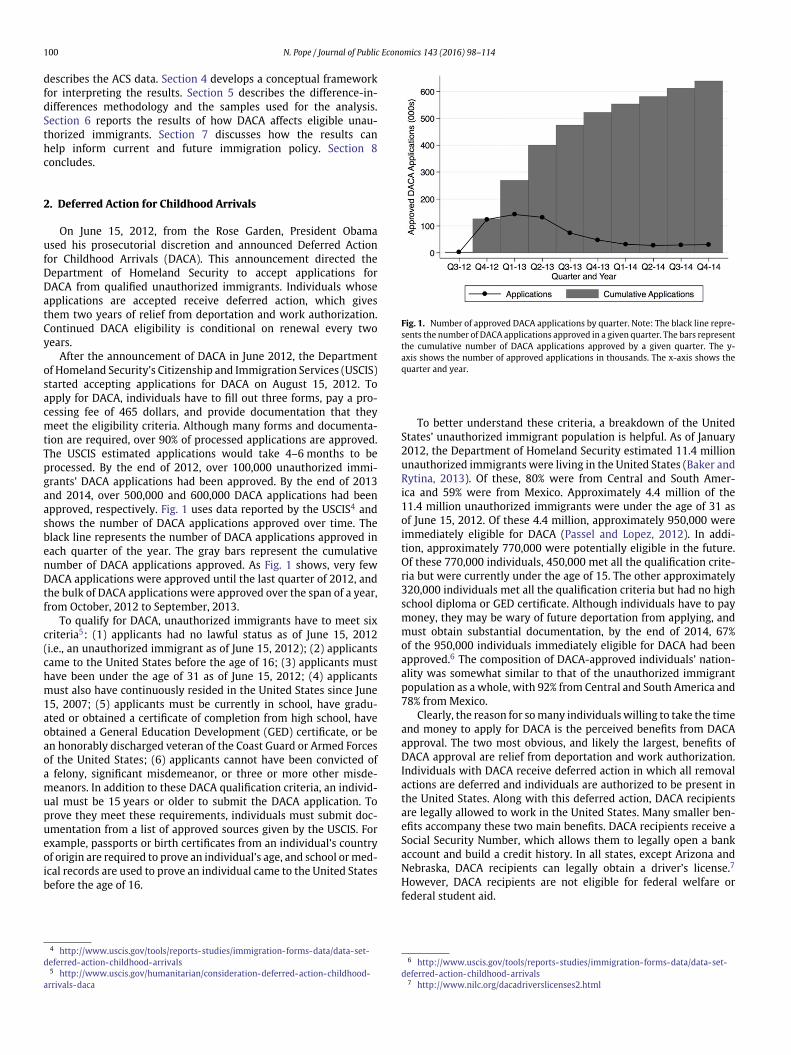
Fig. 2. Difference in working by DACA eligibility. Note: Each figure shows the mean difference of the given variable between DACA-eligible and DACA-ineligible individuals foreach year from 2005 to 2014. The sample is the same as Panel C of Table 2 and includes all non-citizens with at least a high school degree and who are between the ages of 18 and35. DID estimates without controls that account for pre-trends are shown in the box. The shaded area between 2012 and 2013 represents when DACA became available.

104 N. Pope / Journal of Public Economics 143 (2016) 98–114
Fig. 3. Difference in employment status by DACA eligibility. Note: Each figure shows the mean difference of the given variable between DACA-eligible and DACA-ineligibleindividuals for each year from 2005 to 2014. The sample is the same as Panel C of Table 2 and includes all non-citizens with at least a high school degree and who are betweenthe ages of 18 and 35. DID estimates without controls that account for pre-trends are shown in the box. The shaded area between 2012 and 2013 represents when DACA becameavailable.
where Yit is the outcome variable of interest (e.g., working, unem-ployed, in school, etc.) for individual i in year t. The variable Eligibleitis a binary variable equal to one if individual i is eligible for DACA,and zero if ineligible. The creation of this variable was described inthe Data section. The variable Afterit is a binary variable equal to oneif it is after DACA became available, and equal to zero if before. Sincethe ACS only reports the year in which the interview is performed,I use the cutoff between 2012 and 2013 as the threshold for whenDACA became available. Therefore, Afterit is equal to one if the year is2013 or 2014 and zero if the year is from 2005 to 2012. The parame-ter of interest, b1, is the coefficient on the interaction term betweenEligibleit and Afterit. The vector Xit contains demographic controlsincluding years of education, sex, race, ethnicity, marital status, andstate-level unemployment rates. The vector Wit non-parametricallycontrols for the eligibility criteria by including fixed effects for indi-vidual i′s age and age when arrived in the United States. The vectorsht and cs allow for time and state fixed effects, respectively. Lastly,cst allows for state-specific time trends. When estimating Eq. (1),standard errors are clustered at the state-year level.
I estimate this DID model on four different samples. The first sam-ple includes all non-citizens ages 18–30 with at least a high schooldegree who entered the United States between the ages of 12 and 19.The cutoff for DACA eligibility was entering the United States beforethe age of 16. This sample allows a DID estimate to be obtained forindividuals near the DACA age cutoff for entering the United States(four years above and below the cutoff) and therefore uses the vari-ation in eligibility due to when an individual entered the UnitedStates. The second sample includes all non-citizens ages 27–34 with
at least a high school degree who entered the United States beforethe age of 16. Because the cutoff for DACA eligibility was being underthe age of 31, this sample captures the variation in eligibility dueto the age criterion. Third, the DID model is estimated without anyregression discontinuity element. This last sample includes all non-citizens ages 18–35 with at least a high school degree and thereforeuses all sources of variation in DACA eligibility. This sample is moreakin to a typical DID estimation that relies heavily on the pre-trendsof the two groups being similar, although the two groups may notbe similar. The last sample the DID model is estimated on includesall citizens and non-citizens ages 18–35 with at least a high schooldegree.
The parameter of interest in all specifications is the coefficienton the interaction term between Eligibleit and Afterit. This coefficientestimates the change in the outcome variable for individuals eligiblefor DACA after DACA became available compared to those ineligiblefor DACA. The main assumption that must hold in order for the esti-mates to be unbiased is that the DACA-eligible and -ineligible groupshave parallel trends, and the parallel trends would have continued inthe absence of DACA. To support the assumption of parallel trends,I test for pre-existing trends. In addition to the test for pre-existingtrends, the trends can be seen in Figs. 2 through 5. Lastly, using thetwo samples of individuals just above and below the DACA criteriacutoffs, near the age of 30 and near the age of 16 when entering theUnited States, increases the likelihood that the eligible and ineligiblegroups are similar and have parallel trends.
One potential concern for the interpretation of the DID estimatesis that some unauthorized immigrants may not have the required

N. Pope / Journal of Public Economics 143 (2016) 98–114 105
Fig. 4. Difference in income by DACA eligibility. Note: Each figure shows the mean difference of the given variable between DACA-eligible and DACA-ineligible individuals foreach year from 2005 to 2014. The sample is the same as Panel C of Table 2 and includes all non-citizens with at least a high school degree and who are between the ages of 18 and35. The first figure includes all individuals in the sample. The second figure restricts the sample to individuals with income below the 90th percentile. The third figure uses the logof income plus one as the outcome variable instead of linear income. DID estimates without controls that account for pre-trends are shown in the box. The shaded area between2012 and 2013 represents when DACA became available.
money or may worry that obtaining DACA will increase the futurelikelihood of being deported, and therefore unauthorized immigrantswho obtain DACA may be a specifically selected type of unauthorizedimmigrant. Because a large portion (67%) of DACA-eligible individ-uals applied and obtained DACA, this concern is somewhat limited;however, the two thirds who obtain DACA may still be substantiallydifferent from the one third who did not. This concern will not affect
the main policy implications of the results, because this concern doesnot affect the DID estimates. The DID estimates will still estimate theeffect of how DACA affected DACA-eligible unauthorized immigrantsregardless of whether they obtained DACA, and still be a lower boundon the intent-to-treat effect. However, this concern could poten-tially bias any treatment on the treated effects derived from theseDID estimates. If a program with permanent deportation relief and
Fig. 5. Difference in education outcomes by DACA eligibility. Note: Each figure shows the mean difference of the given variable between DACA-eligible and DACA-ineligibleindividuals for each year from 2005 to 2014. The sample is the same as Panel C of Table 2 and includes all non-citizens with at least a high school degree and who are betweenthe ages of 18 and 35. DID estimates without controls that account for pre-trends are shown in the box. The shaded area between 2012 and 2013 represents when DACA becameavailable.
106 N. Pope / Journal of Public Economics 143 (2016) 98–114
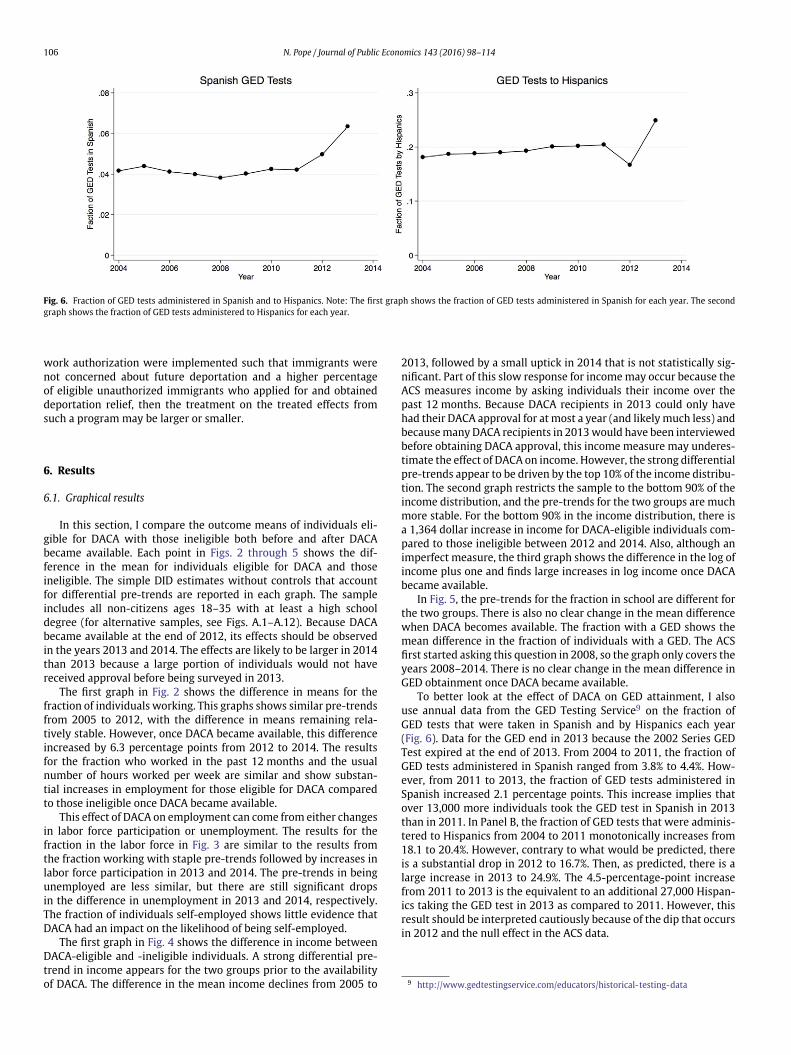
Fig. 6. Fraction of GED tests administered in Spanish and to Hispanics. Note: The first graph shows the fraction of GED tests administered in Spanish for each year. The secondgraph shows the fraction of GED tests administered to Hispanics for each year.
work authorization were implemented such that immigrants werenot concerned about future deportation and a higher percentageof eligible unauthorized immigrants who applied for and obtaineddeportation relief, then the treatment on the treated effects fromsuch a program may be larger or smaller.
6. Results
6.1. Graphical results
In this section, I compare the outcome means of individuals eli-gible for DACA with those ineligible both before and after DACAbecame available. Each point in Figs. 2 through 5 shows the dif-ference in the mean for individuals eligible for DACA and thoseineligible. The simple DID estimates without controls that accountfor differential pre-trends are reported in each graph. The sampleincludes all non-citizens ages 18–35 with at least a high schooldegree (for alternative samples, see Figs. A.1–A.12). Because DACAbecame available at the end of 2012, its effects should be observedin the years 2013 and 2014. The effects are likely to be larger in 2014than 2013 because a large portion of individuals would not havereceived approval before being surveyed in 2013.
The first graph in Fig. 2 shows the difference in means for thefraction of individuals working. This graphs shows similar pre-trendsfrom 2005 to 2012, with the difference in means remaining rela-tively stable. However, once DACA became available, this differenceincreased by 6.3 percentage points from 2012 to 2014. The resultsfor the fraction who worked in the past 12 months and the usualnumber of hours worked per week are similar and show substan-tial increases in employment for those eligible for DACA comparedto those ineligible once DACA became available.
This effect of DACA on employment can come from either changesin labor force participation or unemployment. The results for thefraction in the labor force in Fig. 3 are similar to the results fromthe fraction working with staple pre-trends followed by increases inlabor force participation in 2013 and 2014. The pre-trends in beingunemployed are less similar, but there are still significant dropsin the difference in unemployment in 2013 and 2014, respectively.The fraction of individuals self-employed shows little evidence thatDACA had an impact on the likelihood of being self-employed.
The first graph in Fig. 4 shows the difference in income betweenDACA-eligible and -ineligible individuals. A strong differential pre-trend in income appears for the two groups prior to the availabilityof DACA. The difference in the mean income declines from 2005 to
2013, followed by a small uptick in 2014 that is not statistically sig-nificant. Part of this slow response for income may occur because theACS measures income by asking individuals their income over thepast 12 months. Because DACA recipients in 2013 could only havehad their DACA approval for at most a year (and likely much less) andbecause many DACA recipients in 2013 would have been interviewedbefore obtaining DACA approval, this income measure may underes-timate the effect of DACA on income. However, the strong differentialpre-trends appear to be driven by the top 10% of the income distribu-tion. The second graph restricts the sample to the bottom 90% of theincome distribution, and the pre-trends for the two groups are muchmore stable. For the bottom 90% in the income distribution, there isa 1,364 dollar increase in income for DACA-eligible individuals com-pared to those ineligible between 2012 and 2014. Also, although animperfect measure, the third graph shows the difference in the log ofincome plus one and finds large increases in log income once DACAbecame available.
In Fig. 5, the pre-trends for the fraction in school are different forthe two groups. There is also no clear change in the mean differencewhen DACA becomes available. The fraction with a GED shows themean difference in the fraction of individuals with a GED. The ACSfirst started asking this question in 2008, so the graph only covers theyears 2008–2014. There is no clear change in the mean difference inGED obtainment once DACA became available.
To better look at the effect of DACA on GED attainment, I alsouse annual data from the GED Testing Service9 on the fraction ofGED tests that were taken in Spanish and by Hispanics each year(Fig. 6). Data for the GED end in 2013 because the 2002 Series GEDTest expired at the end of 2013. From 2004 to 2011, the fraction ofGED tests administered in Spanish ranged from 3.8% to 4.4%. How-ever, from 2011 to 2013, the fraction of GED tests administered inSpanish increased 2.1 percentage points. This increase implies thatover 13,000 more individuals took the GED test in Spanish in 2013than in 2011. In Panel B, the fraction of GED tests that were adminis-tered to Hispanics from 2004 to 2011 monotonically increases from18.1 to 20.4%. However, contrary to what would be predicted, thereis a substantial drop in 2012 to 16.7%. Then, as predicted, there is alarge increase in 2013 to 24.9%. The 4.5-percentage-point increasefrom 2011 to 2013 is the equivalent to an additional 27,000 Hispan-ics taking the GED test in 2013 as compared to 2011. However, thisresult should be interpreted cautiously because of the dip that occursin 2012 and the null effect in the ACS data.
9 http://www.gedtestingservice.com/educators/historical-testing-data
N. Pope / Journal of Public Economics 143 (2016) 98–114 107
6.2. Difference-in-differences results
Moving from the simple approach to a more sophisticatedapproach, I estimate Eq. (1). I perform this estimation separatelyfor the four different samples described in the Empirical methodsection. Table 2 reports the estimates from Eq. (1) for each of thefour samples. Panel A of Table 2 reports the estimates from the sam-ple that includes all non-citizens ages 18–30 with at least a highschool degree who entered the United States between the ages of 12and 19. This sample performs a DID estimation on individuals nearthe DACA-criteria cutoff for the age at which individuals entered theUnited States. The column headers indicate the outcome variables ofinterest that were described in the Data section. The first row reportsthe coefficient on the interaction term between Eligibleit and Afterit.The second row reports the coefficient on Eligibleit.
Column 1 indicates that non-citizens eligible for DACA are 4.8percentage points more likely to be working than non-citizens inel-igible for DACA after DACA became available. In other words, DACAincreases the likelihood of working by 4.8 percentage points fornon-citizens who meet the DACA requirements. With a base of 65%of DACA-eligible individuals working, the estimate implies DACAincreases the likelihood of a DACA-eligible individual working by7.3%. Both of these estimates are lower bounds on the intent-to-treat effect. Because approximately 40% of the non-citizen sample areauthorized immigrants, the intent-to-treat effects are likely 1.6 timeslarger than DID estimates. Therefore the intent-to-treat effect ofDACA on the likelihood of working could be as large as 7.7 percentagepoints, or 11.7%.
The increase in the likelihood of working can come from two dif-ferent sources. The first source is individuals entering the labor force.The second is individuals moving from unemployment to employ-ment. Columns 2 and 3 look at these two different sources separately.Column 2 shows DACA increases the likelihood of a DACA-eligibleindividual being in the labor force by 3.7 percentage points. Column3 shows that for DACA-eligible individuals, DACA decreases the like-lihood of being unemployed by 1.9 percentage points. From theseestimates, DACA appears to move eligible individuals into the laborforce and move them from unemployment to employment.
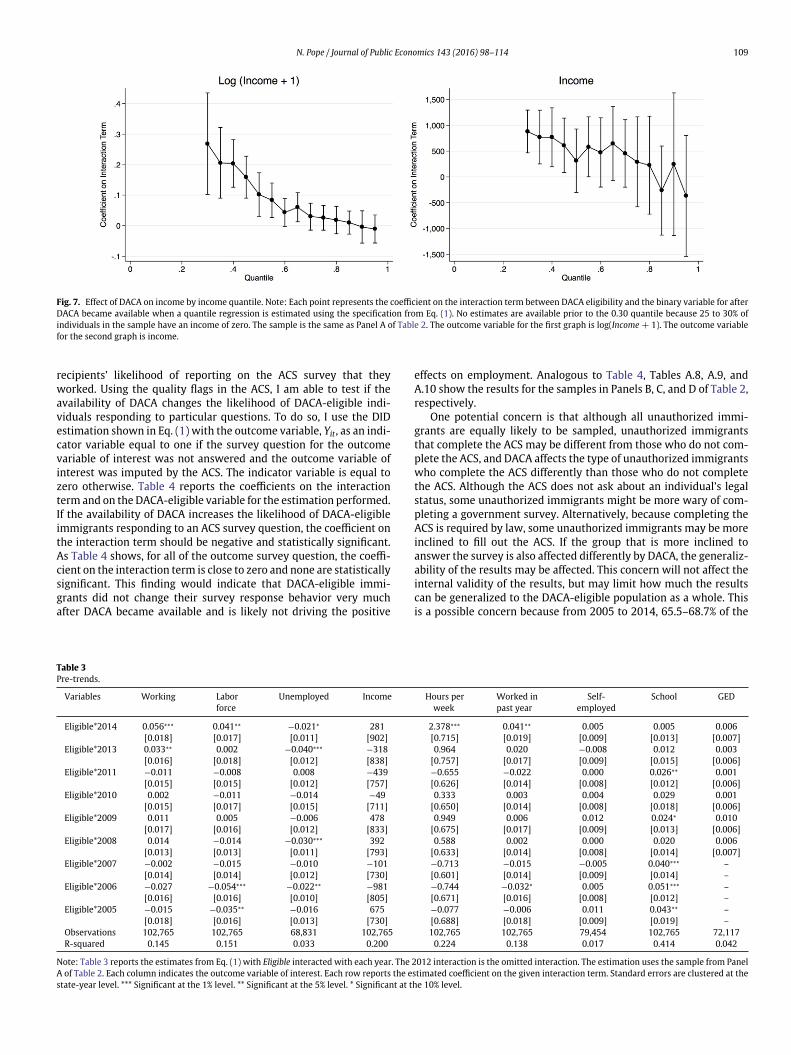
Column 4 shows that although DACA increases the likelihood ofworking, there is little evidence that it had an effect on DACA-eligibleindividuals’ income for the sample as a whole. However, as was seenin Fig. 4, DACA appears to have an effect on income for individuals inthe bottom of the income distribution or when less weight is placedon the upper tail of the income distribution. As such, I estimate theDID estimates using quantile regressions over the income distribu-tion. Fig. 7 shows the results of this quantile regression for bothincome and the log of income plus one. Because just over 25% of indi-viduals have zero income, estimates are not available for the lowerquarter of the income distribution. As can be seen, DACA appears tohave increased the income of those between the 30th and 60th per-centile by 400–800 dollars or about 5–20%. DACA appears to havehad little effect on those in the top of income distribution.
Columns 5 and 6 use two different measures for working. Column5 indicates DACA-eligible individuals work 1.7 hours more per weekthan DACA-ineligible individuals after DACA became available. Thisincrease can also be thought of as one additional full-time job per23 DACA-eligible individuals. Column 6 indicates that DACA-eligibleindividuals are 3.9 percentage points more likely to have worked inthe past 12 months. Column 7 tests whether DACA approval movesindividuals from self-employment to the formal labor market. I findno statistically significant affect of DACA on self-employment.
Columns 8 and 9 look at academic attainment. Column 8 findsDACA decreases the likelihood of attending school for DACA-eligibleindividuals by 2.1 percentage points. This effect is statisticallysignificant; however, the effect is likely biased due to the differentialpre-trends in schooling between the DACA-eligible and -ineligible
groups that can be seen in Fig. 2. Once I test for pre-trends in Table 3,the effect on schooling is indistinguishable from zero. Column 9 looksat the effect of DACA on the likelihood of having attained a GED cer-tificate. DACA does not appear to have an effect on the number ofindividuals that have attained their GED.
Panels B, C, and D of Table 2 show analogous results for threeadditional samples. Panel B shows the results for non-citizens withat least a high school degree who are ages 27–34 and entered theUnited States before the age of 16. This sample includes individu-als who are just above and below the age cutoff for DACA eligibility(must be under 31) but meet all other DACA eligibility requirements.The results for the individuals near the age cutoff are quite similarto the results found in Panel A. The notable difference in Panel B isthat there is no statistically significant effect on schooling. Panel Cincludes all non-citizens with at least a high school degree who areages 18–35. Instead of using variation in DACA eligibility that comesfrom being just above or below a DACA criteria cutoff along withthe DID methodology as does Panels A and B, this sample only usesthe DID methodology. Panel D includes all citizens and non-citizenswith at least a high school degree. The results from this sample arequalitatively the same; however, the estimates tend to be smaller.These smaller estimates are likely due to the stronger differentialpre-trends for this sample. Once these differential pre-trends areaccounted for, the estimates for this sample are similar in magnitudeto those of the first three samples (see Table A.6).
6.3. Potential concerns
A major concern about the empirical method used is the possibil-ity of differential trends in the outcome variables for DACA-eligibleand -ineligible individuals. Fig. 2 looks at this assumption graphi-cally, but further analysis is performed in Table 3. Table 3 estimatesEq. (1) with the variable Eligibleit interacted with a binary variable foreach year. The interaction with the 2012 binary variable is the omit-ted interaction. If differential trends are a problem, the coefficientson the interaction terms leading up to 2013 and 2014 should be sta-tistically significant and in the same direction as the coefficients onthe 2013 and 2014 interaction terms. When testing for pre-trends,statistically significant effects remain for working, labor force, unem-ployment, hours worked per week, and worked in the past year.These point estimates vary in magnitude compared to the estimatesin Table 2 but tend to be qualitatively similar. School attendance isno longer affected, likely due to the clear pre-trends for school atten-dance. However, there does not appear to be clear pre-trends forthe other outcomes. Analogous to Table 3, Tables A.4, A.5, and A.6show the pre-trends results for the samples in Panels B, C, and D ofTable 2, respectively. Because 2012 was an election year in whichimmigration policy was a major topic of conversation, unauthorizedimmigrants may have been concerned about possible future immi-gration policies and therefore underinvested in work and educationin 2012. If this were true, then the effects could be biased whenthey are compared to the omitted 2012 interaction. Tables A.18–A.21show the pre-trends when the 2011 interaction is the omitted inter-action. The effects are very similar regardless of which year is usedas the omitted interaction.
Another potential concern for the identification strategy is thepossibility that individuals change how they respond to the ACS afterthey receive DACA. Unauthorized immigrants may be more willingto answer (or truthfully answer) the citizenship question once theyhave obtained DACA. Also, because working without proper doc-umentation is illegal, undocumented workers may be hesitant torespond to questions about employment. Once they receive legal sta-tus and work authorization through DACA, they may change theirsurvey-response behavior and be more likely to respond to citi-zenship and employment questions. Thus, instead of DACA actuallyincreasing recipients’ likelihood of working, it may just increase
108N
.Pope/JournalofPublic
Economics
143(2016)
98–114
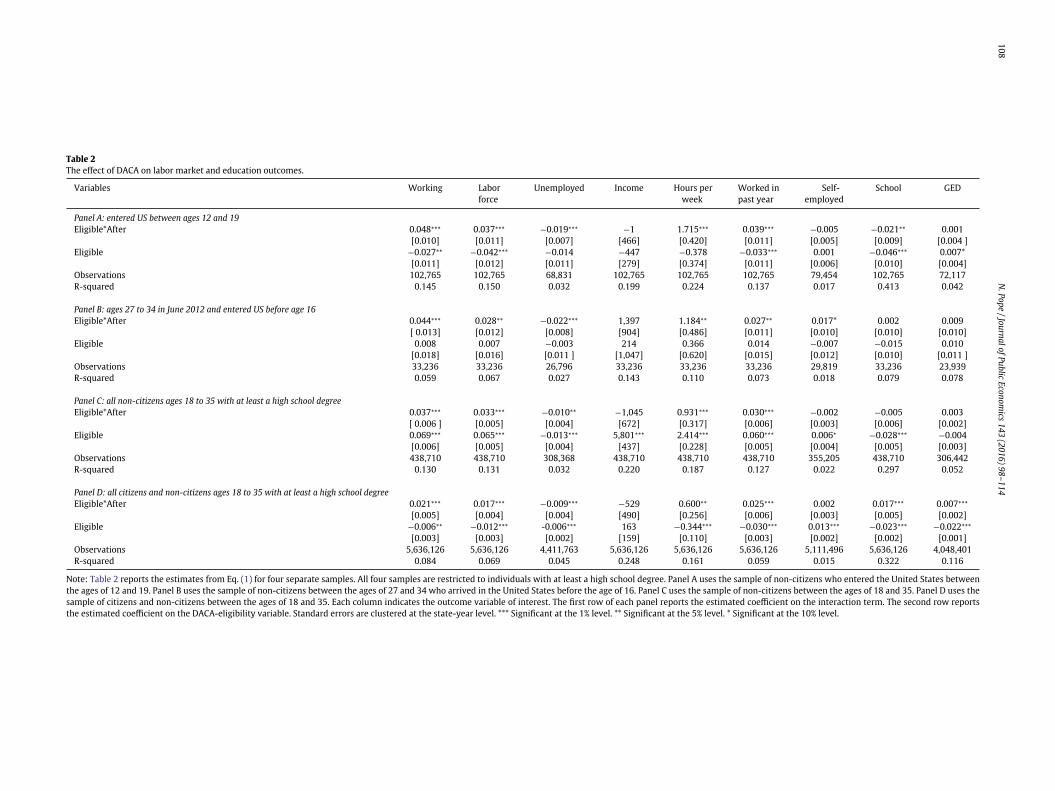
Table 2The effect of DACA on labor market and education outcomes.
Variables Working Laborforce
Unemployed Income Hours perweek
Worked inpast year
Self-employed
School GED
Panel A: entered US between ages 12 and 19Eligible*After 0.048∗∗∗ 0.037∗∗∗ −0.019∗∗∗ −1 1.715∗∗∗ 0.039∗∗∗ −0.005 −0.021∗∗ 0.001
[0.010] [0.011] [0.007] [466] [0.420] [0.011] [0.005] [0.009] [0.004 ]Eligible −0.027∗∗ −0.042∗∗∗ −0.014 −447 −0.378 −0.033∗∗∗ 0.001 −0.046∗∗∗ 0.007*
[0.011] [0.012] [0.011] [279] [0.374] [0.011] [0.006] [0.010] [0.004]Observations 102,765 102,765 68,831 102,765 102,765 102,765 79,454 102,765 72,117R-squared 0.145 0.150 0.032 0.199 0.224 0.137 0.017 0.413 0.042
Panel B: ages 27 to 34 in June 2012 and entered US before age 16Eligible*After 0.044∗∗∗ 0.028∗∗ −0.022∗∗∗ 1,397 1.184∗∗ 0.027∗∗ 0.017* 0.002 0.009
[ 0.013] [0.012] [0.008] [904] [0.486] [0.011] [0.010] [0.010] [0.010]Eligible 0.008 0.007 −0.003 214 0.366 0.014 −0.007 −0.015 0.010
[0.018] [0.016] [0.011 ] [1,047] [0.620] [0.015] [0.012] [0.010] [0.011 ]Observations 33,236 33,236 26,796 33,236 33,236 33,236 29,819 33,236 23,939R-squared 0.059 0.067 0.027 0.143 0.110 0.073 0.018 0.079 0.078
Panel C: all non-citizens ages 18 to 35 with at least a high school degreeEligible*After 0.037∗∗∗ 0.033∗∗∗ −0.010∗∗ −1,045 0.931∗∗∗ 0.030∗∗∗ −0.002 −0.005 0.003
[ 0.006 ] [0.005] [0.004] [672] [0.317] [0.006] [0.003] [0.006] [0.002]Eligible 0.069∗∗∗ 0.065∗∗∗ −0.013∗∗∗ 5,801∗∗∗ 2.414∗∗∗ 0.060∗∗∗ 0.006∗ −0.028∗∗∗ −0.004
[0.006] [0.005] [0.004] [437] [0.228] [0.005] [0.004] [0.005] [0.003]Observations 438,710 438,710 308,368 438,710 438,710 438,710 355,205 438,710 306,442R-squared 0.130 0.131 0.032 0.220 0.187 0.127 0.022 0.297 0.052
Panel D: all citizens and non-citizens ages 18 to 35 with at least a high school degreeEligible*After 0.021∗∗∗ 0.017∗∗∗ −0.009∗∗∗ −529 0.600∗∗ 0.025∗∗∗ 0.002 0.017∗∗∗ 0.007∗∗∗
[0.005] [0.004] [0.004] [490] [0.256] [0.006] [0.003] [0.005] [0.002]Eligible −0.006∗∗ −0.012∗∗∗ -0.006∗∗∗ 163 −0.344∗∗∗ −0.030∗∗∗ 0.013∗∗∗ −0.023∗∗∗ −0.022∗∗∗
[0.003] [0.003] [0.002] [159] [0.110] [0.003] [0.002] [0.002] [0.001]Observations 5,636,126 5,636,126 4,411,763 5,636,126 5,636,126 5,636,126 5,111,496 5,636,126 4,048,401R-squared 0.084 0.069 0.045 0.248 0.161 0.059 0.015 0.322 0.116
Note: Table 2 reports the estimates from Eq. (1) for four separate samples. All four samples are restricted to individuals with at least a high school degree. Panel A uses the sample of non-citizens who entered the United States betweenthe ages of 12 and 19. Panel B uses the sample of non-citizens between the ages of 27 and 34 who arrived in the United States before the age of 16. Panel C uses the sample of non-citizens between the ages of 18 and 35. Panel D uses thesample of citizens and non-citizens between the ages of 18 and 35. Each column indicates the outcome variable of interest. The first row of each panel reports the estimated coefficient on the interaction term. The second row reportsthe estimated coefficient on the DACA-eligibility variable. Standard errors are clustered at the state-year level. *** Significant at the 1% level. ** Significant at the 5% level. * Significant at the 10% level.
N. Pope / Journal of Public Economics 143 (2016) 98–114 109
Fig. 7. Effect of DACA on income by income quantile. Note: Each point represents the coefficient on the interaction term between DACA eligibility and the binary variable for afterDACA became available when a quantile regression is estimated using the specification from Eq. (1). No estimates are available prior to the 0.30 quantile because 25 to 30% ofindividuals in the sample have an income of zero. The sample is the same as Panel A of Table 2. The outcome variable for the first graph is log(Income + 1). The outcome variablefor the second graph is income.
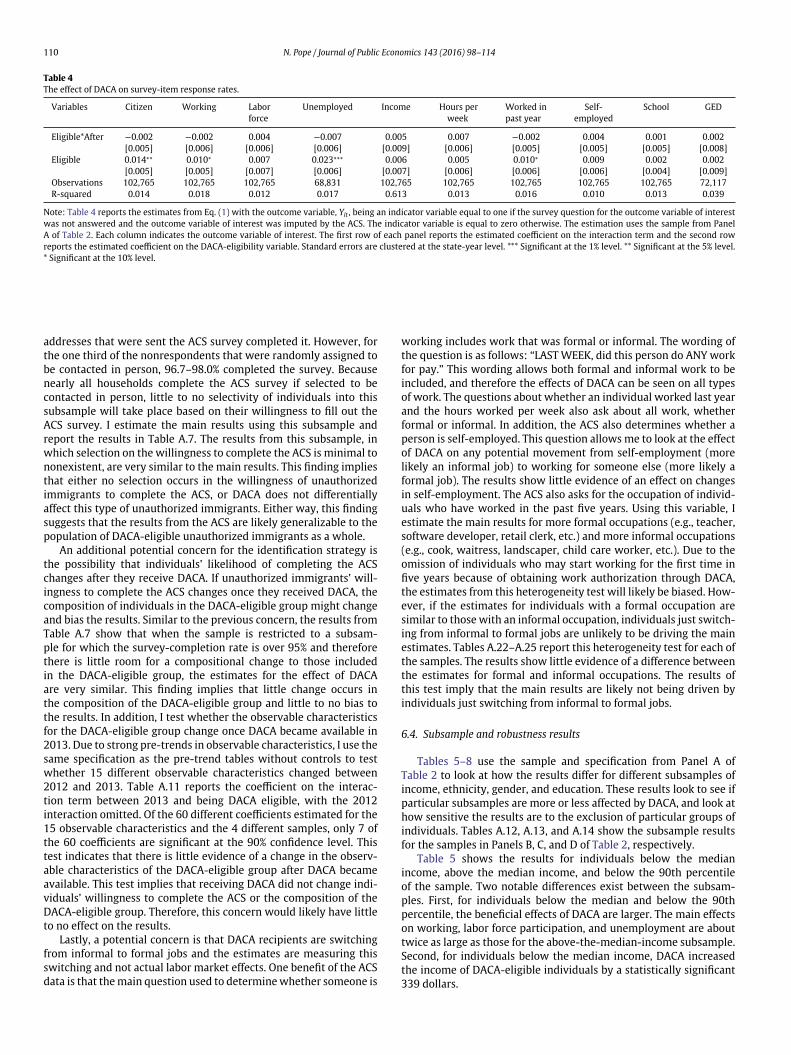
recipients’ likelihood of reporting on the ACS survey that theyworked. Using the quality flags in the ACS, I am able to test if theavailability of DACA changes the likelihood of DACA-eligible indi-viduals responding to particular questions. To do so, I use the DIDestimation shown in Eq. (1) with the outcome variable, Yit, as an indi-cator variable equal to one if the survey question for the outcomevariable of interest was not answered and the outcome variable ofinterest was imputed by the ACS. The indicator variable is equal tozero otherwise. Table 4 reports the coefficients on the interactionterm and on the DACA-eligible variable for the estimation performed.If the availability of DACA increases the likelihood of DACA-eligibleimmigrants responding to an ACS survey question, the coefficient onthe interaction term should be negative and statistically significant.As Table 4 shows, for all of the outcome survey question, the coeffi-cient on the interaction term is close to zero and none are statisticallysignificant. This finding would indicate that DACA-eligible immi-grants did not change their survey response behavior very muchafter DACA became available and is likely not driving the positive
effects on employment. Analogous to Table 4, Tables A.8, A.9, andA.10 show the results for the samples in Panels B, C, and D of Table 2,respectively.
One potential concern is that although all unauthorized immi-grants are equally likely to be sampled, unauthorized immigrantsthat complete the ACS may be different from those who do not com-plete the ACS, and DACA affects the type of unauthorized immigrantswho complete the ACS differently than those who do not completethe ACS. Although the ACS does not ask about an individual’s legalstatus, some unauthorized immigrants might be more wary of com-pleting a government survey. Alternatively, because completing theACS is required by law, some unauthorized immigrants may be moreinclined to fill out the ACS. If the group that is more inclined toanswer the survey is also affected differently by DACA, the generaliz-ability of the results may be affected. This concern will not affect theinternal validity of the results, but may limit how much the resultscan be generalized to the DACA-eligible population as a whole. Thisis a possible concern because from 2005 to 2014, 65.5–68.7% of the
Table 3Pre-trends.
Variables Working Laborforce
Unemployed Income Hours perweek
Worked inpast year
Self-employed
School GED
Eligible*2014 0.056∗∗∗ 0.041∗∗ −0.021∗ 281 2.378∗∗∗ 0.041∗∗ 0.005 0.005 0.006[0.018] [0.017] [0.011] [902] [0.715] [0.019] [0.009] [0.013] [0.007]
Eligible*2013 0.033∗∗ 0.002 −0.040∗∗∗ −318 0.964 0.020 −0.008 0.012 0.003[0.016] [0.018] [0.012] [838] [0.757] [0.017] [0.009] [0.015] [0.006]
Eligible*2011 −0.011 −0.008 0.008 −439 −0.655 −0.022 0.000 0.026∗∗ 0.001[0.015] [0.015] [0.012] [757] [0.626] [0.014] [0.008] [0.012] [0.006]
Eligible*2010 0.002 −0.011 −0.014 −49 0.333 0.003 0.004 0.029 0.001[0.015] [0.017] [0.015] [711] [0.650] [0.014] [0.008] [0.018] [0.006]
Eligible*2009 0.011 0.005 −0.006 478 0.949 0.006 0.012 0.024∗ 0.010[0.017] [0.016] [0.012] [833] [0.675] [0.017] [0.009] [0.013] [0.006]
Eligible*2008 0.014 −0.014 −0.030∗∗∗ 392 0.588 0.002 0.000 0.020 0.006[0.013] [0.013] [0.011] [793] [0.633] [0.014] [0.008] [0.014] [0.007]
Eligible*2007 −0.002 −0.015 −0.010 −101 −0.713 −0.015 −0.005 0.040∗∗∗ –[0.014] [0.014] [0.012] [730] [0.601] [0.014] [0.009] [0.014] –
Eligible*2006 −0.027 −0.054∗∗∗ −0.022∗∗ −981 −0.744 −0.032∗ 0.005 0.051∗∗∗ –[0.016] [0.016] [0.010] [805] [0.671] [0.016] [0.008] [0.012] –
Eligible*2005 −0.015 −0.035∗∗ −0.016 675 −0.077 −0.006 0.011 0.043∗∗ –[0.018] [0.016] [0.013] [730] [0.688] [0.018] [0.009] [0.019] –
Observations 102,765 102,765 68,831 102,765 102,765 102,765 79,454 102,765 72,117R-squared 0.145 0.151 0.033 0.200 0.224 0.138 0.017 0.414 0.042
Note: Table 3 reports the estimates from Eq. (1) with Eligible interacted with each year. The 2012 interaction is the omitted interaction. The estimation uses the sample from PanelA of Table 2. Each column indicates the outcome variable of interest. Each row reports the estimated coefficient on the given interaction term. Standard errors are clustered at thestate-year level. *** Significant at the 1% level. ** Significant at the 5% level. * Significant at the 10% level.
110 N. Pope / Journal of Public Economics 143 (2016) 98–114
Table 4The effect of DACA on survey-item response rates.
Variables Citizen Working Laborforce
Unemployed Income Hours perweek
Worked inpast year
Self-employed
School GED
Eligible*After −0.002 −0.002 0.004 −0.007 0.005 0.007 −0.002 0.004 0.001 0.002[0.005] [0.006] [0.006] [0.006] [0.009] [0.006] [0.005] [0.005] [0.005] [0.008]
Eligible 0.014∗∗ 0.010∗ 0.007 0.023∗∗∗ 0.006 0.005 0.010∗ 0.009 0.002 0.002[0.005] [0.005] [0.007] [0.006] [0.007] [0.006] [0.006] [0.006] [0.004] [0.009]
Observations 102,765 102,765 102,765 68,831 102,765 102,765 102,765 102,765 102,765 72,117R-squared 0.014 0.018 0.012 0.017 0.613 0.013 0.016 0.010 0.013 0.039
Note: Table 4 reports the estimates from Eq. (1) with the outcome variable, Yit , being an indicator variable equal to one if the survey question for the outcome variable of interestwas not answered and the outcome variable of interest was imputed by the ACS. The indicator variable is equal to zero otherwise. The estimation uses the sample from PanelA of Table 2. Each column indicates the outcome variable of interest. The first row of each panel reports the estimated coefficient on the interaction term and the second rowreports the estimated coefficient on the DACA-eligibility variable. Standard errors are clustered at the state-year level. *** Significant at the 1% level. ** Significant at the 5% level.* Significant at the 10% level.
addresses that were sent the ACS survey completed it. However, forthe one third of the nonrespondents that were randomly assigned tobe contacted in person, 96.7–98.0% completed the survey. Becausenearly all households complete the ACS survey if selected to becontacted in person, little to no selectivity of individuals into thissubsample will take place based on their willingness to fill out theACS survey. I estimate the main results using this subsample andreport the results in Table A.7. The results from this subsample, inwhich selection on the willingness to complete the ACS is minimal tononexistent, are very similar to the main results. This finding impliesthat either no selection occurs in the willingness of unauthorizedimmigrants to complete the ACS, or DACA does not differentiallyaffect this type of unauthorized immigrants. Either way, this findingsuggests that the results from the ACS are likely generalizable to thepopulation of DACA-eligible unauthorized immigrants as a whole.
An additional potential concern for the identification strategy isthe possibility that individuals’ likelihood of completing the ACSchanges after they receive DACA. If unauthorized immigrants’ will-ingness to complete the ACS changes once they received DACA, thecomposition of individuals in the DACA-eligible group might changeand bias the results. Similar to the previous concern, the results fromTable A.7 show that when the sample is restricted to a subsam-ple for which the survey-completion rate is over 95% and thereforethere is little room for a compositional change to those includedin the DACA-eligible group, the estimates for the effect of DACAare very similar. This finding implies that little change occurs inthe composition of the DACA-eligible group and little to no bias tothe results. In addition, I test whether the observable characteristicsfor the DACA-eligible group change once DACA became available in2013. Due to strong pre-trends in observable characteristics, I use thesame specification as the pre-trend tables without controls to testwhether 15 different observable characteristics changed between2012 and 2013. Table A.11 reports the coefficient on the interac-tion term between 2013 and being DACA eligible, with the 2012interaction omitted. Of the 60 different coefficients estimated for the15 observable characteristics and the 4 different samples, only 7 ofthe 60 coefficients are significant at the 90% confidence level. Thistest indicates that there is little evidence of a change in the observ-able characteristics of the DACA-eligible group after DACA becameavailable. This test implies that receiving DACA did not change indi-viduals’ willingness to complete the ACS or the composition of theDACA-eligible group. Therefore, this concern would likely have littleto no effect on the results.
Lastly, a potential concern is that DACA recipients are switchingfrom informal to formal jobs and the estimates are measuring thisswitching and not actual labor market effects. One benefit of the ACSdata is that the main question used to determine whether someone is
working includes work that was formal or informal. The wording ofthe question is as follows: “LAST WEEK, did this person do ANY workfor pay.” This wording allows both formal and informal work to beincluded, and therefore the effects of DACA can be seen on all typesof work. The questions about whether an individual worked last yearand the hours worked per week also ask about all work, whetherformal or informal. In addition, the ACS also determines whether aperson is self-employed. This question allows me to look at the effectof DACA on any potential movement from self-employment (morelikely an informal job) to working for someone else (more likely aformal job). The results show little evidence of an effect on changesin self-employment. The ACS also asks for the occupation of individ-uals who have worked in the past five years. Using this variable, Iestimate the main results for more formal occupations (e.g., teacher,software developer, retail clerk, etc.) and more informal occupations(e.g., cook, waitress, landscaper, child care worker, etc.). Due to theomission of individuals who may start working for the first time infive years because of obtaining work authorization through DACA,the estimates from this heterogeneity test will likely be biased. How-ever, if the estimates for individuals with a formal occupation aresimilar to those with an informal occupation, individuals just switch-ing from informal to formal jobs are unlikely to be driving the mainestimates. Tables A.22–A.25 report this heterogeneity test for each ofthe samples. The results show little evidence of a difference betweenthe estimates for formal and informal occupations. The results ofthis test imply that the main results are likely not being driven byindividuals just switching from informal to formal jobs.
6.4. Subsample and robustness results
Tables 5–8 use the sample and specification from Panel A ofTable 2 to look at how the results differ for different subsamples ofincome, ethnicity, gender, and education. These results look to see ifparticular subsamples are more or less affected by DACA, and look athow sensitive the results are to the exclusion of particular groups ofindividuals. Tables A.12, A.13, and A.14 show the subsample resultsfor the samples in Panels B, C, and D of Table 2, respectively.
Table 5 shows the results for individuals below the medianincome, above the median income, and below the 90th percentileof the sample. Two notable differences exist between the subsam-ples. First, for individuals below the median and below the 90thpercentile, the beneficial effects of DACA are larger. The main effectson working, labor force participation, and unemployment are abouttwice as large as those for the above-the-median-income subsample.Second, for individuals below the median income, DACA increasedthe income of DACA-eligible individuals by a statistically significant339 dollars.

N. Pope / Journal of Public Economics 143 (2016) 98–114 111
Table 5The effect of DACA by income level.
Variables Working Laborforce
Unemployed Income Hours perweek
Worked inpast year
Self-employed
School GED
Panel A: below median incomeEligible*After 0.063∗∗∗ 0.050∗∗∗ −0.049∗∗ 339∗∗∗ 1.891∗∗∗ 0.049∗∗∗ −0.022∗∗ −0.036∗∗∗ 0.000
[0.015] [0.017] [0.020] [111] [0.471] [0.017] [0.009] [0.013] [0.005]Eligible −0.024∗ −0.031∗∗ 0.001 −275∗∗∗ −0.190 −0.036∗∗∗ 0.006 −0.067∗∗∗ 0.010∗∗
[0.013] [0.014] [0.019] [76] [0.403] [0.014] [0.009] [0.012] [0.004]Observations 54,417 54,417 23,315 54,417 54,417 54,417 31,892 54,417 39,413R-squared 0.044 0.061 0.035 0.077 0.079 0.058 0.035 0.468 0.047
Panel B: above median incomeEligible*After 0.024∗∗∗ 0.017∗∗ −0.008 −1,086 1.065∗∗ 0.020∗∗∗ 0.004 −0.005 0.002
[0.009] [0.007] [0.005] [850] [0.471] [0.007] [0.007] [0.010] [0.005]Eligible −0.055∗∗∗ −0.076∗∗∗ −0.018∗ −784 −2.006∗∗∗ −0.054∗∗∗ −0.005 0.006 0.002
[0.016] [0.013] [0.011] [654] [0.581] [0.012] [0.009] [0.016] [0.014]Observations 48,348 48,348 45,516 48,348 48,348 48,348 47,562 48,348 32,704R-squared 0.041 0.060 0.010 0.160 0.093 0.074 0.018 0.233 0.043
Panel C: below 90th percentile incomeEligible*After 0.050∗∗∗ 0.038∗∗∗ −0.021∗∗∗ 343 1.777∗∗∗ 0.041∗∗∗ −0.006 −0.025∗∗∗ −0.001
[0.011] [0.011] [0.007] [260] [0.426] [0.012] [0.005] [0.010] [0.004]Eligible −0.024∗∗ −0.039∗∗∗ −0.015 84 −0.266 −0.031∗∗∗ 0.001 −0.050∗∗∗ 0.008∗∗
[0.011] [0.012] [0.011] [185] [0.371] [0.011] [0.006] [0.010] [0.004]Observations 96,111 96,111 62,453 96,111 96,111 96,111 72,898 96,111 67,419R-squared 0.137 0.145 0.031 0.235 0.214 0.131 0.016 0.428 0.041
Note: Table 5 reports the estimates from Eq. (1) for individuals below the median income level (Panel A), above the median income level (Panel B), and below the 90th percentilein income (Panel C). The estimation uses the sample from Panel A of Table 2. Each column indicates the outcome variable of interest. The first row of each panel reports theestimated coefficient on the interaction term and the second row reports the estimated coefficient on the DACA-eligibility variable. Standard errors are clustered at the state-yearlevel. *** Significant at the 1% level. ** Significant at the 5% level. * Significant at the 10% level.
Table 6 shows the results for the subsample of individuals whoidentify as Hispanic and for the subsample of Mexicans. The resultsare fairly similar in both magnitude and sign to the main resultsin Table 2. This similarity is important, because approximately 78%of DACA recipients were Mexican. They indicate a positive effect ofDACA on working, labor force, hours worked per week, and workedin the last year for both Hispanics and Mexicans. The results alsoshow a negative effect on unemployment.
Table 7 shows the results separately by gender. I find no statis-tically significant differences in the coefficients between men andwomen. The coefficients are both of similar magnitude and sign tothe main results in Table 2. Table 8 shows the results separately byeducation level. The results in Panel A are for individuals with a highschool degree or some college, and are similar to the main results
found in Table 2. The results in Panel B are for individuals with a col-lege degree or more, and are similar in sign yet smaller in magnitude.Due to a much smaller sample size and much larger standard errors,these results are at most marginally significant.
In addition to the sensitivity analysis performed by looking atdifferent subsamples, Table 9 looks at the robustness of the resultsto different choices of specification. Each row represents a differentspecification or sample and each cell in the row is the coefficienton the interaction term along with its standard error. Panel A ofTable 9 estimates Eq. (1) with varying levels of controls. Row 1 con-tains no controls and only includes an indicator for DACA eligibility,an indicator for if the year is after DACA was available, and the inter-action of the two. For most of the estimates, the magnitudes areapproximately 50% larger than the baseline results from Table 2.However, for schooling, the magnitude is four times larger. Row
Table 6The effect of DACA by ethnicity.
Variables Working Laborforce
Unemployed Income Hours perweek
Worked inpast year
Self-employed
School GED
Panel A: HispanicEligible*After 0.044∗∗∗ 0.032∗∗∗ −0.020∗∗ 82 1.939∗∗∗ 0.039∗∗∗ −0.008 −0.023∗∗ −0.002
[0.012] [0.010] [0.009] [528] [0.455] [0.010] [0.007] [0.009] [0.005]Eligible −0.010 −0.015 −0.005 −109 −0.113 −0.020 0.002 −0.062∗∗∗ 0.006
[0.017] [0.016] [0.015] [326] [0.550] [0.015] [0.008] [0.015] [0.007]Observations 52,285 52,285 39,065 52,285 52,285 52,285 43,294 52,285 35,296R-squared 0.145 0.149 0.030 0.190 0.209 0.158 0.014 0.271 0.033
Panel B: MexicanEligible*After 0.046∗∗∗ 0.040∗∗∗ −0.012 0 1.785∗∗∗ 0.041∗∗∗ −0.016∗ −0.022∗ −0.001
[0.014] [0.012] [0.009] [501] [0.588] [0.012] [0.009] [0.013] [0.007]Eligible 0.011 0.010 −0.005 −162 0.676 −0.002 0.001 −0.065∗∗∗ 0.007
[0.021] [0.019] [0.018] [476] [0.745] [0.019] [0.010] [0.018] [0.010]Observations 34,072 34,072 25,374 34,072 34,072 34,072 28,174 34,072 22,375R-squared 0.187 0.198 0.033 0.206 0.250 0.208 0.015 0.215 0.033
Note: Table 6 reports the estimates from Eq. (1) for Hispanics (Panel A) and Mexicans (Panel B). The estimation uses the sample from Panel A of Table 2. Each column indicatesthe outcome variable of interest. The first row of each panel reports the estimated coefficient on the interaction term and the second row reports the estimated coefficient on theDACA-eligibility variable. Standard errors are clustered at the state-year level. *** Significant at the 1% level. ** Significant at the 5% level. * Significant at the 10% level.
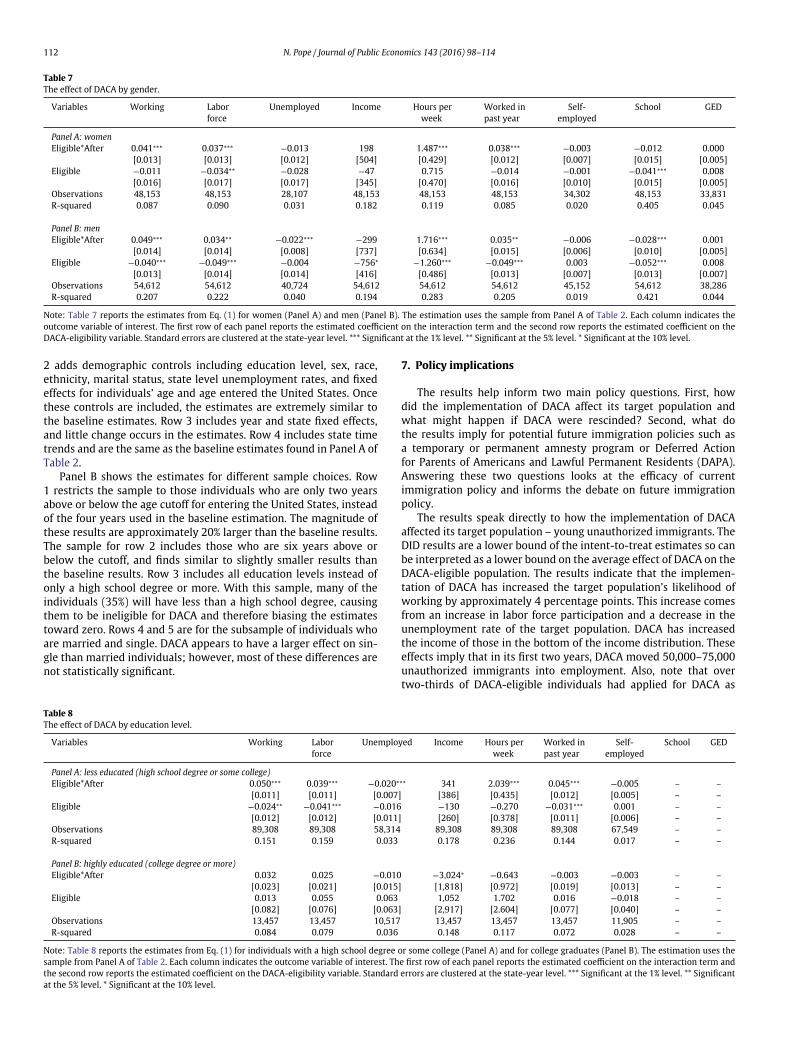
112 N. Pope / Journal of Public Economics 143 (2016) 98–114
Table 7The effect of DACA by gender.
Variables Working Laborforce
Unemployed Income Hours perweek
Worked inpast year
Self-employed
School GED
Panel A: womenEligible*After 0.041∗∗∗ 0.037∗∗∗ −0.013 198 1.487∗∗∗ 0.038∗∗∗ −0.003 −0.012 0.000
[0.013] [0.013] [0.012] [504] [0.429] [0.012] [0.007] [0.015] [0.005]Eligible −0.011 −0.034∗∗ −0.028 −47 0.715 −0.014 −0.001 −0.041∗∗∗ 0.008
[0.016] [0.017] [0.017] [345] [0.470] [0.016] [0.010] [0.015] [0.005]Observations 48,153 48,153 28,107 48,153 48,153 48,153 34,302 48,153 33,831R-squared 0.087 0.090 0.031 0.182 0.119 0.085 0.020 0.405 0.045
Panel B: menEligible*After 0.049∗∗∗ 0.034∗∗ −0.022∗∗∗ −299 1.716∗∗∗ 0.035∗∗ −0.006 −0.028∗∗∗ 0.001
[0.014] [0.014] [0.008] [737] [0.634] [0.015] [0.006] [0.010] [0.005]Eligible −0.040∗∗∗ −0.049∗∗∗ −0.004 −756∗ −1.260∗∗∗ −0.049∗∗∗ 0.003 −0.052∗∗∗ 0.008
[0.013] [0.014] [0.014] [416] [0.486] [0.013] [0.007] [0.013] [0.007]Observations 54,612 54,612 40,724 54,612 54,612 54,612 45,152 54,612 38,286R-squared 0.207 0.222 0.040 0.194 0.283 0.205 0.019 0.421 0.044
Note: Table 7 reports the estimates from Eq. (1) for women (Panel A) and men (Panel B). The estimation uses the sample from Panel A of Table 2. Each column indicates theoutcome variable of interest. The first row of each panel reports the estimated coefficient on the interaction term and the second row reports the estimated coefficient on theDACA-eligibility variable. Standard errors are clustered at the state-year level. *** Significant at the 1% level. ** Significant at the 5% level. * Significant at the 10% level.
2 adds demographic controls including education level, sex, race,ethnicity, marital status, state level unemployment rates, and fixedeffects for individuals’ age and age entered the United States. Oncethese controls are included, the estimates are extremely similar tothe baseline estimates. Row 3 includes year and state fixed effects,and little change occurs in the estimates. Row 4 includes state timetrends and are the same as the baseline estimates found in Panel A ofTable 2.
Panel B shows the estimates for different sample choices. Row1 restricts the sample to those individuals who are only two yearsabove or below the age cutoff for entering the United States, insteadof the four years used in the baseline estimation. The magnitude ofthese results are approximately 20% larger than the baseline results.The sample for row 2 includes those who are six years above orbelow the cutoff, and finds similar to slightly smaller results thanthe baseline results. Row 3 includes all education levels instead ofonly a high school degree or more. With this sample, many of theindividuals (35%) will have less than a high school degree, causingthem to be ineligible for DACA and therefore biasing the estimatestoward zero. Rows 4 and 5 are for the subsample of individuals whoare married and single. DACA appears to have a larger effect on sin-gle than married individuals; however, most of these differences arenot statistically significant.
7. Policy implications
The results help inform two main policy questions. First, howdid the implementation of DACA affect its target population andwhat might happen if DACA were rescinded? Second, what dothe results imply for potential future immigration policies such asa temporary or permanent amnesty program or Deferred Actionfor Parents of Americans and Lawful Permanent Residents (DAPA).Answering these two questions looks at the efficacy of currentimmigration policy and informs the debate on future immigrationpolicy.
The results speak directly to how the implementation of DACAaffected its target population – young unauthorized immigrants. TheDID results are a lower bound of the intent-to-treat estimates so canbe interpreted as a lower bound on the average effect of DACA on theDACA-eligible population. The results indicate that the implemen-tation of DACA has increased the target population’s likelihood ofworking by approximately 4 percentage points. This increase comesfrom an increase in labor force participation and a decrease in theunemployment rate of the target population. DACA has increasedthe income of those in the bottom of the income distribution. Theseeffects imply that in its first two years, DACA moved 50,000–75,000unauthorized immigrants into employment. Also, note that overtwo-thirds of DACA-eligible individuals had applied for DACA as
Table 8The effect of DACA by education level.
Variables Working Laborforce
Unemployed Income Hours perweek
Worked inpast year
Self-employed
School GED
Panel A: less educated (high school degree or some college)Eligible*After 0.050∗∗∗ 0.039∗∗∗ −0.020∗∗∗ 341 2.039∗∗∗ 0.045∗∗∗ −0.005 – –
[0.011] [0.011] [0.007] [386] [0.435] [0.012] [0.005] – –Eligible −0.024∗∗ −0.041∗∗∗ −0.016 −130 −0.270 −0.031∗∗∗ 0.001 – –
[0.012] [0.012] [0.011] [260] [0.378] [0.011] [0.006] – –Observations 89,308 89,308 58,314 89,308 89,308 89,308 67,549 – –R-squared 0.151 0.159 0.033 0.178 0.236 0.144 0.017 – –
Panel B: highly educated (college degree or more)Eligible*After 0.032 0.025 −0.010 −3,024∗ −0.643 −0.003 −0.003 – –
[0.023] [0.021] [0.015] [1,818] [0.972] [0.019] [0.013] – –Eligible 0.013 0.055 0.063 1,052 1.702 0.016 −0.018 – –
[0.082] [0.076] [0.063] [2,917] [2.604] [0.077] [0.040] – –Observations 13,457 13,457 10,517 13,457 13,457 13,457 11,905 – –R-squared 0.084 0.079 0.036 0.148 0.117 0.072 0.028 – –
Note: Table 8 reports the estimates from Eq. (1) for individuals with a high school degree or some college (Panel A) and for college graduates (Panel B). The estimation uses thesample from Panel A of Table 2. Each column indicates the outcome variable of interest. The first row of each panel reports the estimated coefficient on the interaction term andthe second row reports the estimated coefficient on the DACA-eligibility variable. Standard errors are clustered at the state-year level. *** Significant at the 1% level. ** Significantat the 5% level. * Significant at the 10% level.

N. Pope / Journal of Public Economics 143 (2016) 98–114 113
Table 9Robustness checks.
Variables Working Laborforce
Unemployed Income Hours perweek
Worked inpast year
Self-employed
School GED
Panel A: different sets of control variablesNo controls 0.083∗∗∗ 0.072∗∗∗ −0.025∗∗∗ 781 3.411∗∗∗ 0.068∗∗∗ −0.002 −0.092∗∗∗ 0.005
[0.012] [0.013] [0.007] [515] [0.535] [0.013] [0.005] [0.015] [0.004]Demographic controls 0.050∗∗∗ 0.039∗∗∗ −0.020∗∗∗ −43 1.774∗∗∗ 0.040∗∗∗ −0.005 −0.021∗∗ 0.001
[0.010] [0.011] [0.007] [472] [0.420] [0.011] [0.005] [0.010] [0.004]Year and state FE 0.049∗∗∗ 0.038∗∗∗ −0.020∗∗∗ −28 1.739∗∗∗ 0.040∗∗∗ −0.004 −0.021∗∗ 0.001
[0.010] [0.010] [0.007] [469] [0.416] [0.011] [0.005] [0.009] [0.004]State time trends (baseline) 0.048∗∗∗ 0.037∗∗∗ −0.019∗∗∗ −1 1.715∗∗∗ 0.039∗∗∗ −0.005 −0.021∗∗ 0.001
[0.010] [0.011] [0.007] [466] [0.420] [0.011] [0.005] [0.009] [0.004]
Panel B: different samplesEnter US age: 14 to 17 0.059∗∗∗ 0.041∗∗∗ −0.031∗∗∗ 843 2.287∗∗∗ 0.050∗∗∗ −0.003 −0.014 0.002
[0.015] [0.015] [0.010] [629] [0.596] [0.015] [0.007] [0.011] [0.005]Enter US age: 10 to 21 0.041∗∗∗ 0.036∗∗∗ −0.011∗∗ −111 1.403∗∗∗ 0.035∗∗∗ −0.005 −0.019∗∗ 0.004
[0.009] [0.009] [0.005] [439] [0.350] [0.008] [0.004] [0.008] [0.003]All education levels 0.039∗∗∗ 0.036∗∗∗ −0.008 125 1.415∗∗∗ 0.034∗∗∗ −0.009 −0.016∗ 0.003
[0.009] [0.008] [0.006] [367] [0.350] [0.009] [0.005] [0.009] [0.003]Married 0.034∗ 0.006 −0.036∗∗∗ 862 1.188 0.020 −0.004 −0.008 0.000
[0.020] [0.019] [0.012] [1,014] [0.765] [0.019] [0.012] [0.014] [0.008]Single 0.049∗∗∗ 0.044∗∗∗ −0.013 −322 1.771∗∗∗ 0.042∗∗∗ −0.005 −0.023∗∗ 0.000
[0.011] [0.011] [0.008] [453] [0.440] [0.011] [0.005] [0.011] [0.003]
Note: Table 9 reports the estimates from Eq. (1) with varying levels of controls (Panel A) and for different samples (Panel B). The estimation uses the sample from Panel A ofTable 2. Each column indicates the outcome variable of interest. Each row reports the estimated coefficient on the interaction term. Standard errors are clustered at the state-yearlevel. *** Significant at the 1% level. ** Significant at the 5% level. * Significant at the 10% level.
of 2014, which implies these applicants anticipated the benefits ofDACA approval to be greater than the time costs of applying and the465 dollar fee. Because DACA was done through prosecutorial discre-tion, it is more susceptible to being rescinded than a law. The resultsof this paper predict that the elimination of DACA would have similareffect sizes, but in the opposite direction.
Note that the estimates from the DID analysis are partial equilib-rium effects. Therefore, DACA creates potential general equilibriumeffects arising from the increase in the supply of workers. The resultssuggest DACA moved approximately 50,000–75,000 unauthorizedimmigrants into employment in 2013 and 2014. This increase in thesupply of workers only accounts for 0.94–1.41% of the 5.33 millionindividuals who gained employment in 2013 and 2014 (Bureau ofLabor Statistics). This finding suggests that the general equilibriumeffects of DACA on wages is likely to be small. However, the generalequilibrium effects may be more problematic for a future immigra-tion policy that targets a larger population. Also, as discussed in theconceptual framework section, due to breaking large labor marketfrictions for unauthorized immigrants and the minimal general equi-librium effect on wages, the overall welfare effect of DACA is likelynot just a pure transfer to DACA-eligible individuals, but would likelyenhance efficiency, although it would not be Pareto efficient.
The results also help inform future immigration policy. Approx-imately 11.4 million unauthorized immigrants live in the UnitedStates (Baker and Rytina, 2013). However, only 5.4% of unauthorizedimmigrants have obtained deferred action and work authorizationthrough DACA. From the results above, DACA improved the labormarket outcomes for this small portion of unauthorized immigrants.However, the majority of unauthorized immigrants are excludedfrom DACA and do not receive these benefits. A temporary or per-manent amnesty program could expand deferred action and workauthorization to a larger population of unauthorized immigrants.However, because such an expansion to a larger population wouldinclude a different type of unauthorized population, whether thebenefits would be similar to those found for DACA is unclear. Theresults from Panels A and B of Table 2 come from samples that are
close to the DACA cutoff criteria. Therefore, these estimates would beparticularly policy relevant if DACA were expanded by increasing theage requirements. For individuals near these age cutoffs, the benefitsare likely to be very similar.
However, if future temporary or permanent amnesty programsare expanded to include older unauthorized immigrants who likelyentered the United States at older ages and may have restrictedEnglish proficiency, the effects of deferred action and work autho-rization may be quite different from those found for DACA. Inaddition, the effects could vary depending on whether the amnestyprogram was temporary or permanent. The intent-to-treat effectsfor a temporary program are likely smaller than for a permanentprogram, due to lower application rates from unauthorized immi-grants wary of future deportation. Smaller effects for a temporaryprogram may also come from less human capital investment withoutthe assurance of the ability to work in the future.
The biggest potential difference between DACA and a temporaryor permanent amnesty program for a larger unauthorized immigrantpopulation are the potential general equilibrium effects. BecauseDACA has moved only a small number of individuals into employ-ment, the downward pressure on wages from the increased supplyof workers is likely very small. However, a larger temporary orpermanent amnesty program could move many more workers intoemployment and could cause larger deceases in wages, particularlyfor low-skilled jobs. These potential general equilibrium effects makethe welfare consequences unclear. Unauthorized immigrants willclearly be better off, but if the downward pressure on wages is largeenough, they could offset these benefits.
Of particular importance is what these results imply for DAPA.DAPA was announced by President Obama on November 20th, 2014,and would expand eligibility for deferred action and work autho-rization to an additional 3.7 million unauthorized immigrants.10 This
10 http://migrationpolicy.org/news/mpi-many-37-million-unauthorized-immigrants-could-get-relief-deportation-under-anticipated-new
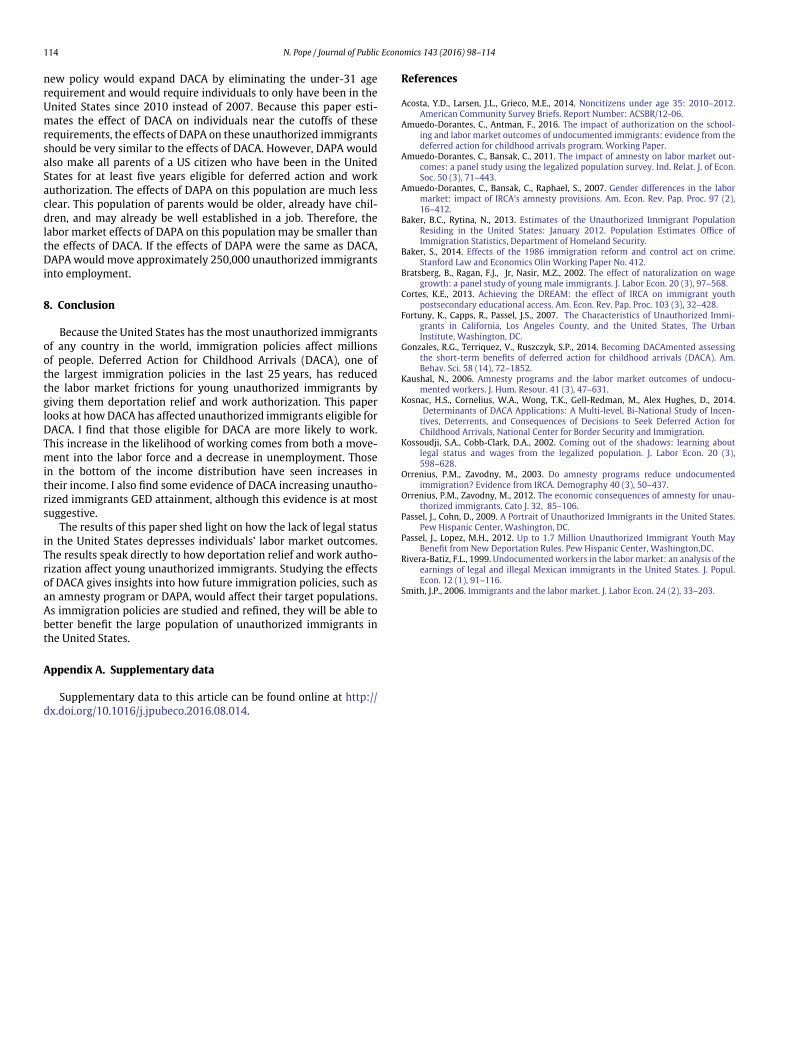
114 N. Pope / Journal of Public Economics 143 (2016) 98–114
new policy would expand DACA by eliminating the under-31 agerequirement and would require individuals to only have been in theUnited States since 2010 instead of 2007. Because this paper esti-mates the effect of DACA on individuals near the cutoffs of theserequirements, the effects of DAPA on these unauthorized immigrantsshould be very similar to the effects of DACA. However, DAPA wouldalso make all parents of a US citizen who have been in the UnitedStates for at least five years eligible for deferred action and workauthorization. The effects of DAPA on this population are much lessclear. This population of parents would be older, already have chil-dren, and may already be well established in a job. Therefore, thelabor market effects of DAPA on this population may be smaller thanthe effects of DACA. If the effects of DAPA were the same as DACA,DAPA would move approximately 250,000 unauthorized immigrantsinto employment.
8. Conclusion
Because the United States has the most unauthorized immigrantsof any country in the world, immigration policies affect millionsof people. Deferred Action for Childhood Arrivals (DACA), one ofthe largest immigration policies in the last 25 years, has reducedthe labor market frictions for young unauthorized immigrants bygiving them deportation relief and work authorization. This paperlooks at how DACA has affected unauthorized immigrants eligible forDACA. I find that those eligible for DACA are more likely to work.This increase in the likelihood of working comes from both a move-ment into the labor force and a decrease in unemployment. Thosein the bottom of the income distribution have seen increases intheir income. I also find some evidence of DACA increasing unautho-rized immigrants GED attainment, although this evidence is at mostsuggestive.
The results of this paper shed light on how the lack of legal statusin the United States depresses individuals’ labor market outcomes.The results speak directly to how deportation relief and work autho-rization affect young unauthorized immigrants. Studying the effectsof DACA gives insights into how future immigration policies, such asan amnesty program or DAPA, would affect their target populations.As immigration policies are studied and refined, they will be able tobetter benefit the large population of unauthorized immigrants inthe United States.
Appendix A. Supplementary data
Supplementary data to this article can be found online at http://dx.doi.org/10.1016/j.jpubeco.2016.08.014.
References
Acosta, Y.D., Larsen, J.L., Grieco, M.E., 2014. Noncitizens under age 35: 2010–2012.American Community Survey Briefs. Report Number: ACSBR/12-06.
Amuedo-Dorantes, C., Antman, F., 2016. The impact of authorization on the school-ing and labor market outcomes of undocumented immigrants: evidence from thedeferred action for childhood arrivals program. Working Paper.
Amuedo-Dorantes, C., Bansak, C., 2011. The impact of amnesty on labor market out-comes: a panel study using the legalized population survey. Ind. Relat. J. of Econ.Soc. 50 (3), 71–443.
Amuedo-Dorantes, C., Bansak, C., Raphael, S., 2007. Gender differences in the labormarket: impact of IRCA’s amnesty provisions. Am. Econ. Rev. Pap. Proc. 97 (2),16–412.
Baker, B.C., Rytina, N., 2013. Estimates of the Unauthorized Immigrant PopulationResiding in the United States: January 2012. Population Estimates Office ofImmigration Statistics, Department of Homeland Security.
Baker, S., 2014. Effects of the 1986 immigration reform and control act on crime.Stanford Law and Economics Olin Working Paper No. 412.
Bratsberg, B., Ragan, F.J., Jr, Nasir, M.Z., 2002. The effect of naturalization on wagegrowth: a panel study of young male immigrants. J. Labor Econ. 20 (3), 97–568.
Cortes, K.E., 2013. Achieving the DREAM: the effect of IRCA on immigrant youthpostsecondary educational access. Am. Econ. Rev. Pap. Proc. 103 (3), 32–428.
Fortuny, K., Capps, R., Passel, J.S., 2007. The Characteristics of Unauthorized Immi-grants in California, Los Angeles County, and the United States, The UrbanInstitute, Washington, DC.
Gonzales, R.G., Terriquez, V., Ruszczyk, S.P., 2014. Becoming DACAmented assessingthe short-term benefits of deferred action for childhood arrivals (DACA). Am.Behav. Sci. 58 (14), 72–1852.
Kaushal, N., 2006. Amnesty programs and the labor market outcomes of undocu-mented workers. J. Hum. Resour. 41 (3), 47–631.
Kosnac, H.S., Cornelius, W.A., Wong, T.K., Gell-Redman, M., Alex Hughes, D., 2014.Determinants of DACA Applications: A Multi-level, Bi-National Study of Incen-
tives, Deterrents, and Consequences of Decisions to Seek Deferred Action forChildhood Arrivals, National Center for Border Security and Immigration.
Kossoudji, S.A., Cobb-Clark, D.A., 2002. Coming out of the shadows: learning aboutlegal status and wages from the legalized population. J. Labor Econ. 20 (3),598–628.
Orrenius, P.M., Zavodny, M., 2003. Do amnesty programs reduce undocumentedimmigration? Evidence from IRCA. Demography 40 (3), 50–437.
Orrenius, P.M., Zavodny, M., 2012. The economic consequences of amnesty for unau-thorized immigrants. Cato J. 32, 85–106.
Passel, J., Cohn, D., 2009. A Portrait of Unauthorized Immigrants in the United States.Pew Hispanic Center, Washington, DC.
Passel, J., Lopez, M.H., 2012. Up to 1.7 Million Unauthorized Immigrant Youth MayBenefit from New Deportation Rules. Pew Hispanic Center, Washington,DC.
Rivera-Batiz, F.L., 1999. Undocumented workers in the labor market: an analysis of theearnings of legal and illegal Mexican immigrants in the United States. J. Popul.Econ. 12 (1), 91–116.
Smith, J.P., 2006. Immigrants and the labor market. J. Labor Econ. 24 (2), 33–203.